UNITED STATES
SECURITIES AND EXCHANGE COMMISSION
Washington, D.C. 20549
FORM N-CSR
CERTIFIED SHAREHOLDER REPORT OF REGISTERED MANAGEMENT INVESTMENT
COMPANIES
Investment Company Act file number 811-5583
Franklin Templeton Variable Insurance Products Trust
(Exact name of registrant as specified in charter)
| | |
| One Franklin Parkway, San Mateo, CA | | 94403-1906 |
| (Address of principal executive offices) | | (Zip code) |
Murray L. Simpson, One Franklin Parkway, San Mateo, CA 94403-1906
(Name and address of agent for service)
Registrant’s telephone number, including area code: (650) 312-2000
Date of fiscal year end: 12/31
Date of reporting period: 12/31/03
| Item 1. | Reports to Stockholders. |
FRANKLIN TEMPLETON VARIABLE INSURANCE PRODUCTS TRUST ANNUAL REPORT
TABLEOF CONTENTS
| | |
A Word About Risk | | i |
Important Notes to Performance Information | | ii |
Regulatory Update | | iii |
Fund Summaries | | |
Franklin Aggressive Growth Securities Fund | | FA-1 |
*Prospectus Supplement | | FA-5 |
Franklin Global Communications Securities Fund | | FGC-1 |
*Prospectus Supplement | | FGC-6 |
Franklin Growth and Income Securities Fund | | FGI-1 |
Franklin High Income Fund | | FH-1 |
Franklin Income Securities Fund | | FI-1 |
Franklin Large Cap Growth Securities Fund | | FL-1 |
Franklin Money Market Fund | | FM-1 |
Franklin Real Estate Fund | | FRE-1 |
*Prospectus Supplement | | FRE-6 |
Franklin Rising Dividends Securities Fund | | FRD-1 |
Franklin Small Cap Fund | | FSC-1 |
Franklin Small Cap Value Securities Fund | | FSV-1 |
Franklin Strategic Income Securities Fund | | FSI-1 |
Franklin U.S. Government Fund | | FUS-1 |
Franklin Zero Coupon Fund 2005 | | FZ5-1 |
Franklin Zero Coupon Fund 2010 | | FZ10-1 |
Mutual Discovery Securities Fund | | MD-1 |
Mutual Shares Securities Fund | | MS-1 |
Templeton Developing Markets Securities Fund | | TD-1 |
Templeton Foreign Securities Fund | | TF-1 |
Templeton Global Asset Allocation Fund | | TGA-1 |
*Prospectus Supplement | | TGA-6 |
Templeton Global Income Securities Fund | | TGI-1 |
*Prospectus Supplement | | TGI-7 |
Templeton Growth Securities Fund | | TG-1 |
*Prospectus Supplement | | TG-5 |
Index Descriptions | | IND-1 |
Board Members and Officers | | BOD-1 |
Proxy Voting Policies and Procedures | | PV-1 |
*Not part of the annual report
| | |
| |
NOT FDIC INSURED | MAY LOSE VALUE | NO BANK GUARANTEE |
| |
MASTER CLASS 2 A03 02-04
A WORDABOUT RISK
All of the funds are subject to certain risks, which will cause investment returns and the value of your principal to increase or decrease. Generally, investments offering the potential for higher returns are accompanied by a higher degree of risk. Stocks and other equities, representing an ownership interest in an individual company, historically have outperformed other asset classes over the long term, but tend to fluctuate more dramatically over the shorter term. Securities of smaller companies, and companies involved in reorganization or bankruptcy, may have greater price swings and greater credit and other risks. By having significant investment in particular sectors from time to time, some funds carry greater risk of adverse developments in those sectors than a fund that always invests in a wider variety of sectors. The technology sector can be among the most volatile market sectors.
Bonds and other debt obligations are affected by the creditworthiness of their issuers, and changes in interest rates, with prices declining as interest rates increase. High yield, lower-rated (“junk”) bonds generally have greater price swings and higher default risks than investment grade bonds.
Foreign investing, especially in emerging market countries, has additional risks such as changes in currency values, market price swings, and economic, political or social instability. These and other risks pertaining to specific funds, such as specialized industry or geographical sectors or use of complex securities, are discussed in the Franklin Templeton Variable Insurance Products Trust prospectus. Your investment representative can help you determine which funds may be right for you.
i
IMPORTANT NOTESTO
PERFORMANCE INFORMATION
Total return of the funds is the percentage change in value of a hypothetical $10,000 investment over the indicated periods and includes reinvestment of dividends and capital gains. Inception dates of the funds may have preceded the effective dates of the subaccounts, contracts, or their availability in all states. Performance data is historical and cannot predict or guarantee future results. Principal value and investment return will fluctuate with market conditions, and you may have a gain or loss when you withdraw your money.
When reviewing the index comparisons, please keep in mind that indexes have a number of inherent performance differentials over the funds. First, unlike the funds, which must hold a minimum amount of cash to maintain liquidity, indexes do not have a cash component. Second, the funds are actively managed and, thus, are subject to management fees to cover salaries of securities analysts or portfolio managers in addition to other expenses. Indexes are unmanaged and do not include any commissions or other expenses typically associated with investing in securities. Third, indexes often contain a different mix of securities than the fund to which they are compared. Additionally, please remember that indexes are simply a measure of performance and cannot be invested in directly.
ii
REGULATORY UPDATE
As of February 12, 2004
To Our Valued Contract Owners:
In our efforts to fulfill our ongoing commitment to providing you with timely and accurate information, we have prepared this statement to give you an overview of current industry issues as they pertain to Franklin Resources, Inc. (Franklin Templeton Investments) and our subsidiary companies (the “Company”). Any further updates on these and other matters will be disclosed on the Company’s website at franklintempleton.com under “Statement on Current Industry Issues.”
On February 4, 2004, the Securities Division of the Office of the Secretary of the Commonwealth of Massachusetts filed an administrative complaint against Franklin Resources, Inc. and certain of its subsidiaries, alleging violations of the Massachusetts Uniform Securities Act. The complaint arises from activity that occurred in 2001 during which time an officer of a Company subsidiary was negotiating an agreement with an investor relating to investments in a mutual fund and a hedge fund.
The Company, in addition to other entities within Franklin Templeton Investments, has been named in shareholder class actions related to the matter described above. The Company believes that the claims made in the lawsuit are without merit and it intends to defend vigorously against the allegations. The Company and the Fund(s) may be named in similar civil actions related to the matter described above.
In addition, as part of ongoing investigations by the U.S. Securities and Exchange Commission (the “SEC”), the U.S. Attorney for the Northern District of California, the New York Attorney General, the California Attorney General, the U.S. Attorney for the District of Massachusetts, the Florida Department of Financial Services, and the Commissioner of Securities and the Attorney General of the State of West Virginia, relating to certain practices in the mutual fund industry, including late trading, market timing and sales compensation arrangements, the Company and its subsidiaries, as well as certain current or former executives and employees of the Company, have received requests for information and/or subpoenas to testify or produce documents. The Company and its current employees are providing documents and information in response to these requests and subpoenas. In addition, the Company has responded to requests for similar kinds of information from regulatory authorities in some of the foreign countries where the Company conducts its global asset management business.
The Staff of the SEC has informed the Company that it intends to recommend that the Commission authorize an action against the Funds’ investment adviser and/or an affiliate adviser and a senior executive officer relating to the frequent trading issues that are the subject of the SEC’s investigation. These issues were previously disclosed as being under investigation by government authorities and the subject of an internal inquiry by the Company in its Annual Report on Form 10-K and on its public website. The Company currently is in discussions with the SEC Staff in an effort to resolve the issues raised in their investigation. Such discussions are preliminary and the Company cannot predict the likelihood of whether those discussions will result in a settlement and, if so, the terms of such settlement. The impact, if any, of these matters on a fund is uncertain at this time. If it is found that the Company bears responsibility for any unlawful or improper conduct, we have committed to making a fund or its shareholders whole, as appropriate.
iii
FRANKLIN AGGRESSIVE GROWTH SECURITIES FUND
Fund Goal and Primary Investments: Franklin Aggressive Growth Securities Fund seeks capital appreciation. The Fund invests mainly in equity securities of companies demonstrating accelerating growth, increasing profitability, or above-average growth or growth potential as compared with the overall economy.
We are pleased to bring you Franklin Aggressive Growth Securities Fund’s annual report for the fiscal year ended December 31, 2003.
Performance Overview
You can find the Fund’s one-year total return in the Performance Summary following this report. The Fund outperformed its benchmarks, the Standard & Poor’s 500 Composite Index (S&P 500) and the Russell 3000® Growth Index, which returned 28.67% and 30.97% for the year under review.1
Economic and Market Overview
During the year ended December 31, 2003, many factors impacted global economies and financial markets. Early in the year, economic uncertainty and geopolitical events, including impending war in Iraq, pushed U.S. interest rates to their lowest level in more than four decades, and the 10-year U.S. Treasury note’s yield fell to 3.13% in mid-June. However, following the end of major conflict in Iraq, many economic indicators turned positive. The U.S. government injected fiscal stimulus into the economy, approving another round of tax cuts and rebates that included dividend and capital gains tax reductions. In June, an accommodative Federal Reserve Board, in an attempt to bolster the economy, cut the federal funds target rate to 1.00%.
During the year, the U.S. trade deficit increased significantly, contributing to the U.S. dollar’s fall to record lows against the euro and other major currencies. However, the weak dollar provided a boost to the U.S. economy and corporate profits as exports became cheaper for foreign buyers. Robust consumer spending, especially for autos and homes, and strong business spending, particularly for equipment and software, contributed to the accelerated economic activity. In addition, U.S. federal spending stayed firm and inflation remained benign. U.S. gross domestic product (GDP) grew an annualized 8.2% in third quarter 2003, its strongest pace in nearly 20 years, and overall, 2003 GDP
1. Source: Standard & Poor’s Micropal. One cannot invest directly in an index, nor is an index representative of the Fund’s portfolio. Please see Index Descriptions following the Fund Summaries.
FA-1
grew an estimated 3.1%. As economic data improved, some interest rates rose from their lows, and the 10-year Treasury note’s yield ended the period at 4.27%.
An equity market rally started in late March 2003 and continued through the end of the year. The rebound began with investors anticipating economic recovery in the second half of 2003, and it continued as data showed robust economic growth. Improved sentiment led many investors to rotate into economically sensitive and financially leveraged companies, specifically cyclical, technology, small-capitalization and emerging market stocks. The S&P 500 rose 28.67% for the 12 months ended December 31, 2003, while the technology-heavy Nasdaq Composite Index increased 50.93%.1
Investment Strategy
We are research driven, fundamental investors, pursuing an aggressive growth strategy. As bottom-up investors focusing primarily on individual securities, we choose companies that we believe are positioned for rapid growth in revenues, earnings or assets. We rely on a team of analysts to provide in-depth industry expertise, and we use qualitative and quantitative analyses to evaluate companies for distinct and sustainable competitive advantages such as a particular marketing niche, proven technology, sound financial records, strong management and industry leadership.
Manager’s Discussion
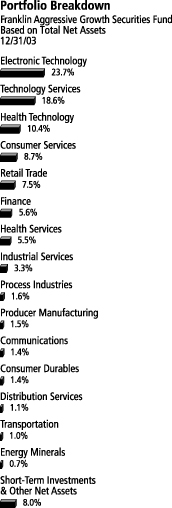
The Fund’s overweighted position relative to the Russell 3000 Growth Index, as well as positive stock selection, in electronic technology helped performance during the year under review. Major contributors to return in this sector were Xicor and Lam Research. Additionally, specific stock selection in technology services contributed to the Fund’s performance. Strong performers in this sector were Yahoo! and Ask Jeeves. Specific stocks also boosted our retail trade allocation as our investments in Cost Plus and Tuesday Morning appreciated during the period. In health technology, some particular holdings that performed well, and an underweighted position in pharmaceuticals benefited Fund performance. Within the sector, our Boston Scientific (sold by year-end) holding increased in value.
Top 10 Holdings
Franklin Aggressive Growth
Securities Fund
12/31/03
| | |
Company
Sector/Industry | | % of Total
Net Assets |
|
| |
| Microsoft Corp. | | 2.7% |
| Technology Services | | |
| |
| Forest Laboratories Inc. | | 2.1% |
| Health Technology | | |
| |
| InterMune Inc. | | 2.0% |
| Health Technology | | |
| |
| Tektronix Inc. | | 2.0% |
| Electronic Technology | | |
| |
| Pfizer Inc. | | 1.9% |
| Health Technology | | |
| |
| Carbo Ceramics Inc. | | 1.9% |
| Industrial Services | | |
| |
| Clear Channel Communications Inc. | | 1.8% |
| Consumer Services | | |
| |
| Verity Inc. | | 1.8% |
| Technology Services | | |
| |
| Lam Research Corp. | | 1.7% |
| Electronic Technology | | |
| |
| Gilead Sciences Inc. | | 1.7% |
| Health Technology | | |
The dollar value, number of shares or principal amount, and complete legal titles of all portfolio holdings are listed in the Fund’s Statement of Investments.
FA-2
Despite the Fund’s strong returns, some factors detracted from Fund performance. Our overweighted position in industrial services constrained Fund returns. Patterson UTI Energy (sold by year-end) was particularly weak in this sector. Stock selection in consumer services, such as Entravision Communications, also hampered the Fund’s performance.
Thank you for your participation in Franklin Aggressive Growth Securities Fund.
On November 18, 2003, the Board of Trustees of Franklin Templeton Variable Insurance Products Trust (the Trust) approved a proposal to merge Franklin Aggressive Growth Securities Fund (Fund) into Franklin Small Cap Fund, another series of the Trust (Reorganization). If approved by Fund shareholders, the Reorganization is expected to be completed around April 30, 2004.
This discussion reflects our analysis, opinions and portfolio holdings as of December 31, 2003, the end of the reporting period. The way we implement our main investment strategies and the resulting portfolio holdings may change depending on factors such as market and economic conditions. These opinions may not be relied upon as investment advice or an offer for a particular security. The information is not a complete analysis of every aspect of any market, country, industry, security or the Fund. Statements of fact are from sources considered reliable, but the advisor makes no representation or warranty as to their completeness or accuracy. Although historical performance is no guarantee of future results, these insights may help you understand our investment management philosophy.
FA-3
PERFORMANCE SUMMARYASOF 12/31/03
Total return of Class 2 shares represents the average annual change in value, assuming reinvestment of dividends and capital gains. Average returns smooth out variations in returns, which can be significant; they are not the same as year-by-year results.
Franklin Aggressive Growth Securities Fund – Class 2*
Periods ended 12/31/03
| | | | |
| | | 1-Year | | Since Inception (5/1/00) |
|
| | |
Average Annual Total Return | | +45.48% | | -15.13% |
*Because Class 2 shares were not offered until 2/12/01, standardized Class 2 Fund performance for prior periods represents the historical results of Class 1 shares. For periods beginning on 2/12/01, Class 2’s results reflect an additional 12b-1 fee expense, which also affects future performance. Since 2/12/01 (commencement of sales), the average annual total return of Class 2 shares was -10.24%.
Ongoing market volatility can significantly affect short-term performance; recent returns may differ.
Total Return Index Comparison
for Hypothetical $10,000 Investment (5/1/00–12/31/03)
The graph compares the performance of Franklin Aggressive Growth Securities Fund – Class 2,* the S&P 500 and the Russell 3000 Growth Index. One cannot invest directly in an index, nor is an index representative of the Fund’s portfolio. Please see Important Notes to Performance Information preceding the Fund Summaries.
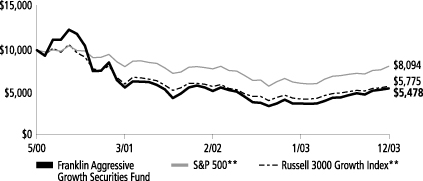
**Source: Standard & Poor’s Micropal. Please see Index Descriptions following the Fund Summaries.
Franklin Aggressive Growth Securities Fund – Class 2
Performance reflects the Fund’s Class 2 operating expenses, but does not include any contract fees, expenses or sales charges. If they had been included, performance would be lower. These charges and deductions, particularly for variable life policies, can have a significant effect on contract values and insurance benefits. See the contract prospectus for a complete description of these expenses, including sales charges.
Since markets can go down as well as up, investment return and the value of your principal will fluctuate with market conditions, and you may have a gain or loss when you sell your shares.
FA-4
Past performance does not guarantee future results.
FRANKLIN AGGRESSIVE GROWTH SECURITIES FUND
(FRANKLIN TEMPLETON VARIABLE INSURANCE PRODUCTS TRUST)
SUPPLEMENT DATED NOVEMBER 18, 2003
TOTHE PROSPECTUS DATED MAY 1, 2003
The prospectus is amended by adding the following language:
On November 18, 2003, the Board of Trustees of Franklin Templeton Variable Insurance Products Trust (the Trust) approved a proposal whereby the assets of Franklin Aggressive Growth Securities Fund (Fund) will be acquired by, and in exchange for, shares of Franklin Small Cap Fund, another series of the Trust (Reorganization). If approved by Fund shareholders, the Reorganization is expected to be completed on or about April 30, 2004. It is anticipated that in January of 2004, Fund contract owners of record on December 29, 2003, will receive a voting instruction card requesting their instructions to the insurance company shareholders on the Reorganization. A proxy statement, which explains the details of the Reorganization, will accompany the voting instruction card. The Fund will close to new investments, including exchanges into the Fund, effective after the close of business on April 23, 2004.
Please keep this supplement for future reference.
FA-5
FRANKLIN TEMPLETON VARIABLE INSURANCE PRODUCTS TRUST
FRANKLIN AGGRESSIVE GROWTH SECURITIES FUND
Financial Highlights
| | | | | | | | | | | | | | | | |
| | | Class 1
| |
| | | Year ended December 31,
| |
| | | 2003 | | | 2002 | | | 2001 | | | 2000c | |
| | |
|
|
|
Per share operating performance | | | | | | | | | | | | | | | | |
(for a share outstanding throughout the year) | | | | | | | | | | | | | | | | |
Net asset value, beginning of year | | $ | 3.77 | | | $ | 5.87 | | | $ | 7.59 | | | $ | 10.00 | |
| | |
|
|
|
Income from investment operations: | | | | | | | | | | | | | | | | |
Net investment income (loss)a | | | (.03 | ) | | | (.03 | ) | | | (.02 | ) | | | .02 | |
Net realized and unrealized gains (losses) | | | 1.78 | | | | (2.07 | ) | | | (1.69 | ) | | | (2.43 | ) |
| | |
|
|
|
Total from investment operations | | | 1.75 | | | | (2.10 | ) | | | (1.71 | ) | | | (2.41 | ) |
| | |
|
|
|
Less distributions from net investment income | | | — | | | | — | | | | (.01 | ) | | | — | |
| | |
|
|
|
Net asset value, end of year | | $ | 5.52 | | | $ | 3.77 | | | $ | 5.87 | | | $ | 7.59 | |
| | |
|
|
|
| | | | |
Total returnb | | | 46.15% | | | | (35.67)% | | | | (22.67)% | | | | (24.10)% | |
Ratios/supplemental data | | | | | | | | | | | | | | | | |
Net assets, end of year (000’s) | | $ | 7,188 | | | $ | 4,801 | | | $ | 8,294 | | | $ | 13,021 | |
Ratios to average net assets: | | | | | | | | | | | | | | | | |
Expenses | | | 1.04% | | | | 1.04% | | | | .85% | | | | .90% | d |
Net investment income (loss) | | | (.64)% | | | | (.75)% | | | | (.38)% | | | | .35% | d |
Portfolio turnover rate | | | 91.51% | | | | 117.74% | | | | 182.27% | | | | 86.65% | |
| a | Based on average daily shares outstanding. |
| b | Total return does not include any fees, charges or expenses imposed by the variable annuity and life insurance contracts for which the Franklin Templeton Variable Insurance Products Trust serves as an underlying investment vehicle. Total return is not annualized for periods less than one year. |
| c | For the period May 1, 2000 (effective date) to December 31, 2000. |
FA-6
FRANKLIN TEMPLETON VARIABLE INSURANCE PRODUCTS TRUST
FRANKLIN AGGRESSIVE GROWTH SECURITIES FUND
Financial Highlights (continued)
| | | | | | | | | | | | |
| | | Class 2
| |
| | | Year ended December 31,
| |
| | | 2003 | | | 2002 | | | 2001c | |
| | |
|
|
|
Per share operating performance | | | | | | | | | | | | |
(for a share outstanding throughout the year) | | | | | | | | | | | | |
Net asset value, beginning of year | | $ | 3.75 | | | $ | 5.86 | | | $ | 7.48 | |
| | |
|
|
|
Income from investment operations: | | | | | | | | | | | | |
Net investment income (loss)a | | | (.06 | ) | | | (.05 | ) | | | (.04 | ) |
Net realized and unrealized gains (losses) | | | 1.78 | | | | (2.06 | ) | | | (1.57 | ) |
| | |
|
|
|
Total from investment operations | | | 1.72 | | | | (2.11 | ) | | | (1.61 | ) |
| | |
|
|
|
Less distributions from net investment income | | | — | | | | — | | | | (.01 | ) |
| | |
|
|
|
Net asset value, end of year | | $ | 5.47 | | | $ | 3.75 | | | $ | 5.86 | |
| | |
|
|
|
| | | |
Total returnb | | | 45.48% | | | | (35.73)% | | | | (22.81)% | |
Ratios/supplemental data | | | | | | | | | | | | |
Net assets, end of year (000’s) | | $ | 2 | | | $ | 2 | | | $ | 2 | |
Ratios to average net assets: | | | | | | | | | | | | |
Expenses | | | 1.29% | | | | 1.29% | | | | 1.10% | d |
Net investment income (loss) | | | (.89)% | | | | (1.00)% | | | | (.75)% | d |
Portfolio turnover rate | | | 91.51% | | | | 117.74% | | | | 182.27% | |
| a | Based on average daily shares outstanding. |
| b | Total return does not include any fees, charges or expenses imposed by the variable annuity and life insurance contracts for which the Franklin Templeton Variable Insurance Products Trust serves as an underlying investment vehicle. Total return is not annualized for periods less than one year. |
| c | For the period February 12, 2001 (effective date) to December 31, 2001. |
See notes to financial statements.
FA-7
FRANKLIN TEMPLETON VARIABLE INSURANCE PRODUCTS TRUST
FRANKLIN AGGRESSIVE GROWTH SECURITIES FUND
Statement of Investments, December 31, 2003
| | | | | | | |
| | | | | SHARES | | VALUE |
|
| | | Common Stocks 92.0% | | | | | |
| | | Communications 1.4% | | | | | |
a | | Nextel Communications Inc., A | | 3,500 | | $ | 98,210 |
| | | | | | |
|
|
| | | Consumer Durables 1.4% | | | | | |
| | | Polaris Industries Inc. | | 1,100 | | | 97,438 |
| | | | | | |
|
|
| | | Consumer Services 8.7% | | | | | |
a | | Citadel Broadcasting Corp. | | 3,800 | | | 85,006 |
| | | Clear Channel Communications Inc. | | 2,800 | | | 131,124 |
a | | Entercom Communications Corp. | | 2,000 | | | 105,920 |
a | | Entravision Communications Corp. | | 8,100 | | | 89,910 |
a | | Univision Communications Inc., A | | 2,300 | | | 91,287 |
| | | Viacom Inc., B | | 2,700 | | | 119,826 |
| | | | | | |
|
|
| | | | | | | | 623,073 |
| | | | | | |
|
|
| | | Distribution Services 1.1% | | | | | |
a | | United Natural Foods Inc. | | 2,300 | | | 82,593 |
| | | | | | |
|
|
| | | Electronic Technology 23.7% | | | | | |
a | | Advanced Semiconductor Engineering Inc., ADR (Taiwan) | | 13,600 | | | 68,680 |
a | | Applied Materials Inc. | | 4,200 | | | 94,290 |
a | | Avaya Inc. | | 8,400 | | | 108,696 |
a | | Avocent Corp. | | 2,600 | | | 94,952 |
a | | Dell Inc. | | 3,000 | | | 101,880 |
a | | F5 Networks Inc. | | 3,300 | | | 82,830 |
a | | Integrated Circuit Systems Inc. | | 2,800 | | | 79,772 |
| | | Intersil Corp. | | 4,400 | | | 109,340 |
a | | L-3 Communications Holdings Inc. | | 2,100 | | | 107,856 |
a | | Lam Research Corp. | | 3,800 | | | 122,740 |
| | | Microchip Technology Inc. | | 2,100 | | | 70,056 |
| | | National Instruments Corp. | | 2,300 | | | 104,581 |
| | | Rockwell Automation Inc. | | 3,100 | | | 110,360 |
a | | Semtech Corp. | | 4,000 | | | 90,920 |
| | | Tektronix Inc. | | 4,500 | | | 142,200 |
a | | Varian Semiconductor Equipment Associates Inc. | | 2,600 | | | 113,594 |
a | | Xicor Inc. | | 9,000 | | | 102,060 |
| | | | | | |
|
|
| | | | | | | | 1,704,807 |
| | | | | | |
|
|
| | | Energy Minerals .7% | | | | | |
a | | Premcor Inc. | | 1,900 | | | 49,400 |
| | | | | | |
|
|
| | | Finance 5.6% | | | | | |
| | | AMBAC Financial Group Inc. | | 1,300 | | | 90,207 |
| | | Investors Financial Services Corp. | | 2,800 | | | 107,548 |
| | | Montpelier Re Holdings Ltd. (Bermuda) | | 3,000 | | | 110,100 |
a | | Texas Capital Bancshares Inc. | | 6,300 | | | 91,111 |
| | | | | | |
|
|
| | | | | | | | 398,966 |
| | | | | | |
|
|
| | | Health Services 5.5% | | | | | |
a | | Accredo Health Inc. | | 3,600 | | | 113,796 |
a | | Anthem Inc. | | 1,400 | | | 105,000 |
a | | Caremark RX Inc. | | 4,200 | | | 106,386 |
| | | Select Medical Corp. | | 4,400 | | | 71,632 |
| | | | | | |
|
|
| | | | | | | | 396,814 |
| | | | | | |
|
|
FA-8
FRANKLIN TEMPLETON VARIABLE INSURANCE PRODUCTS TRUST
FRANKLIN AGGRESSIVE GROWTH SECURITIES FUND
Statement of Investments, December 31, 2003 (cont.)
| | | | | | | |
| | | | | SHARES | | VALUE |
|
| | | Common Stocks (cont.) | | | | | |
| | | Health Technology 10.4% | | | | | |
a | | Adolor Corp. | | 4,700 | | $ | 94,094 |
a | | Angiotech Pharmaceuticals Inc. (Canada) | | 1,800 | | | 82,800 |
a | | Forest Laboratories Inc. | | 2,400 | | | 148,320 |
a | | Gilead Sciences Inc. | | 2,100 | | | 122,094 |
a | | InterMune Inc. | | 6,300 | | | 145,908 |
a | | Myogen Inc. | | 1,500 | | | 21,450 |
| | | Pfizer Inc. | | 3,800 | | | 134,254 |
| | | | | | |
|
|
| | | | | | | | 748,920 |
| | | | | | |
|
|
| | | Industrial Services 3.3% | | | | | |
| | | Carbo Ceramics Inc. | | 2,600 | | | 133,250 |
a | | Weatherford International Ltd. (Bermuda) | | 2,900 | | | 104,400 |
| | | | | | |
|
|
| | | | | | | | 237,650 |
| | | | | | |
|
|
| | | Process Industries 1.6% | | | | | |
| | | Cabot Corp. | | 3,500 | | | 111,440 |
| | | | | | |
|
|
| | | Producer Manufacturing 1.5% | | | | | |
| | | Borg Warner Inc. | | 1,300 | | | 110,591 |
| | | | | | |
|
|
| | | Retail Trade 7.5% | | | | | |
a | | Cost Plus Inc. | | 2,800 | | | 114,800 |
a | | Ctrip.com International Ltd., ADR (China) | | 50 | | | 1,700 |
a | | Gymboree Corp. | | 4,100 | | | 70,643 |
a | | Hot Topic Inc. | | 3,000 | | | 88,380 |
a | | Orbitz Inc. | | 500 | | | 11,600 |
| | | Ross Stores Inc. | | 3,800 | | | 100,434 |
a | | Tuesday Morning Corp. | | 2,600 | | | 78,650 |
a | | Williams-Sonoma Inc. | | 2,200 | | | 76,494 |
| | | | | | |
|
|
| | | | | | | | 542,701 |
| | | | | | |
|
|
| | | Technology Services 18.6% | | | | | |
a | | Accenture Ltd., A (Bermuda) | | 4,300 | | | 113,176 |
a | | Affiliated Computer Services Inc., A | | 2,085 | | | 113,549 |
a | | Ask Jeeves Inc. | | 4,800 | | | 86,976 |
a | | Cognos Inc. (Canada) | | 3,300 | | | 101,046 |
| | | Computer Associates International Inc. | | 3,800 | | | 103,892 |
| | | Fair Isaac Inc. | | 1,500 | | | 73,740 |
a | | Hewitt Associates Inc. | | 3,000 | | | 89,700 |
a | | Intuit Inc. | | 1,900 | | | 100,529 |
| | | Microsoft Corp. | | 7,000 | | | 192,780 |
a | | Network Associates Inc. | | 4,200 | | | 63,168 |
| | | Paychex Inc. | | 2,400 | | | 89,280 |
a | | Verity Inc. | | 7,600 | | | 126,844 |
a | | Yahoo! Inc. | | 1,900 | | | 85,823 |
| | | | | | |
|
|
| | | | | | | | 1,340,503 |
| | | | | | |
|
|
FA-9
FRANKLIN TEMPLETON VARIABLE INSURANCE PRODUCTS TRUST
FRANKLIN AGGRESSIVE GROWTH SECURITIES FUND
Statement of Investments, December 31, 2003 (cont.)
| | | | | | | |
| | | | | SHARES | | VALUE |
|
| | | Common Stocks (cont.) | | | | | |
| | | Transportation 1.0% | | | | | |
a | | Forward Air Corp. | | 2,600 | | $ | 71,500 |
| | | | | | |
|
|
| | | Total Common Stocks (Cost $5,235,146) | | | | | 6,614,606 |
| | | | | | |
|
|
| | | Short Term Investments (Cost $509,043) 7.1% | | | | | |
b | | Franklin Institutional Fiduciary Trust Money Market Portfolio | | 509,043 | | | 509,043 |
| | | | | | |
|
|
| | | Total Investments (Cost $5,744,189) 99.1% | | | | | 7,123,649 |
| | | Other Assets, less Liabilities .9% | | | | | 66,253 |
| | | | | | |
|
|
| | | Net Assets 100.0% | | | | $ | 7,189,902 |
| | | | | | |
|
|
| b | See Note 6 regarding investments in the Franklin Institutional Fiduciary Trust Money Market Portfolio. |
See notes to financial statements.
FA-10
FRANKLIN TEMPLETON VARIABLE INSURANCE PRODUCTS TRUST
FRANKLIN AGGRESSIVE GROWTH SECURITIES FUND
Financial Statements
Statement of Assets and Liabilities
December 31, 2003
| | | | |
Assets: | | | | |
Investments in securities: | | | | |
Cost | | $ | 5,744,189 | |
| | |
|
|
|
Value | | | 7,123,649 | |
Receivables: | | | | |
Investment securities sold | | | 46,544 | |
Capital shares sold | | | 43,211 | |
Dividends | | | 1,713 | |
| | |
|
|
|
Total assets | | | 7,215,117 | |
| | |
|
|
|
Liabilities: | | | | |
Payables: | | | | |
Capital shares redeemed | | | 4,816 | |
Affiliates | | | 4,010 | |
Professional fees | | | 16,001 | |
Other liabilities | | | 388 | |
| | |
|
|
|
Total liabilities | | | 25,215 | |
| | |
|
|
|
Net assets, at value | | $ | 7,189,902 | |
| | |
|
|
|
Net assets consist of: | | | | |
Undistributed net investment income | | $ | — | |
Net unrealized appreciation (depreciation) | | | 1,379,460 | |
Accumulated net realized gain (loss) | | | (9,303,842 | ) |
Capital shares | | | 15,114,284 | |
| | |
|
|
|
Net assets, at value | | $ | 7,189,902 | |
| | |
|
|
|
Class 1: | | | | |
Net assets, at value | | $ | 7,187,578 | |
| | |
|
|
|
Shares outstanding | | | 1,303,206 | |
| | |
|
|
|
Net asset value and offering price per share | | $ | 5.52 | |
| | |
|
|
|
Class 2: | | | | |
Net assets, at value | | $ | 2,324 | |
| | |
|
|
|
Shares outstanding | | | 425 | |
| | |
|
|
|
Net asset value and offering price per share | | $ | 5.47 | |
| | |
|
|
|
See notes to financial statements.
FA-11
FRANKLIN TEMPLETON VARIABLE INSURANCE PRODUCTS TRUST
FRANKLIN AGGRESSIVE GROWTH SECURITIES FUND
Financial Statements (continued)
Statement of Operations
for the year ended December 31, 2003
| | | | |
Investment income: | | | | |
Dividends | | $ | 22,221 | |
| | |
|
|
|
Expenses: | | | | |
Management fees (Note 3) | | | 26,359 | |
Administrative fees (Note 3) | | | 11,191 | |
Distribution fees - Class 2 (Note 3) | | | 5 | |
Transfer agent fees | | | 140 | |
Custodian fees | | | 51 | |
Reports to shareholders | | | 1,718 | |
Professional fees | | | 17,454 | |
Trustees’ fees and expenses | | | 54 | |
Other | | | 1,220 | |
| | |
|
|
|
Total expenses | | | 58,192 | |
| | |
|
|
|
Net investment income (loss) | | | (35,971 | ) |
| | |
|
|
|
Realized and unrealized gains (losses): | | | | |
Net realized gain (loss) from investments | | | 66,291 | |
Net unrealized appreciation (depreciation) on investments | | | 2,094,888 | |
| | |
|
|
|
Net realized and unrealized gain (loss) | | | 2,161,179 | |
| | |
|
|
|
Net increase (decrease) in net assets resulting from operations | | $ | 2,125,208 | |
| | |
|
|
|
See notes to financial statements.
FA-12
FRANKLIN TEMPLETON VARIABLE INSURANCE PRODUCTS TRUST
FRANKLIN AGGRESSIVE GROWTH SECURITIES FUND
Financial Statements (continued)
Statements of Changes in Net Assets
for the years ended December 31, 2003 and 2002
| | | | | | | | |
| | | 2003 | | | 2002 | |
| | |
| |
Increase (decrease) in net assets: | | | | | | | | |
Operations: | | | | | | | | |
Net investment income (loss) | | $ | (35,971 | ) | | $ | (47,012 | ) |
Net realized gain (loss) from investments | | | 66,291 | | | | (1,414,412 | ) |
Net unrealized appreciation (depreciation) on investments | | | 2,094,888 | | | | (1,467,907 | ) |
| | |
| |
Net increase (decrease) in net assets resulting from operations | | | 2,125,208 | | | | (2,929,331 | ) |
Capital share transactions: (Note 2) | | | | | | | | |
Class 1 | | | 261,646 | | | | (563,955 | ) |
Class 2 | | | (73 | ) | | | — | |
| | |
| |
Total capital share transactions | | | 261,573 | | | | (563,955 | ) |
Net increase (decrease) in net assets | | | 2,386,781 | | | | (3,493,286 | ) |
Net assets: | | | | | | | | |
Beginning of year | | | 4,803,121 | | | | 8,296,407 | |
| | |
| |
End of year | | $ | 7,189,902 | | | $ | 4,803,121 | |
| | |
| |
Undistributed net investment income included in net assets: | | | | | | | | |
End of year | | $ | — | | | $ | — | |
| | |
| |
See notes to financial statements.
FA-13
FRANKLIN TEMPLETON VARIABLE INSURANCE PRODUCTS TRUST
FRANKLIN AGGRESSIVE GROWTH SECURITIES FUND
Notes to Financial Statements
1. ORGANIZATION AND SIGNIFICANT ACCOUNTING POLICIES
Franklin Templeton Variable Insurance Products Trust (the Trust) is registered under the Investment Company Act of 1940 as an open-end investment company, consisting of twenty-two separate series (the Funds). Franklin Aggressive Growth Securities Fund (the Fund) included in this report is diversified. Shares of the Fund are sold only to insurance company separate accounts to fund the benefits of variable life insurance policies or variable annuity contracts. The Fund’s investment objective is capital growth.
On November 18, 2003, the Board of Trustees for the Trust approved a proposal to merge the Franklin Aggressive Growth Securities Fund into the Franklin Small Cap Fund, subject to approval by the shareholders of the Franklin Aggressive Growth Securities Fund.
The following summarizes the Fund’s significant accounting policies.
a. Security Valuation
Securities listed or traded on a recognized national exchange or NASDAQ are valued at the last reported sales price. Over-the-counter securities and listed securities for which no sale is reported are valued within the range of the latest quoted bid and asked prices. Investments in open-end mutual funds are valued at the closing net asset value. Foreign securities are valued at the close of trading of the foreign exchange or the NYSE, whichever is earlier. If events occur that materially affect the values of securities after the prices or foreign exchange rates are determined, or if market quotations are not readily available, the securities will be valued at fair value as determined following procedures approved by the Board of Trustees.
b. Foreign Currency Translation
Portfolio securities and other assets and liabilities denominated in foreign currencies are translated into U.S. dollars based on the exchange rate of such currencies against U.S. dollars on the date of valuation. Purchases and sales of securities and income items denominated in foreign currencies are translated into U.S. dollars at the exchange rate in effect on the transaction date.
The Fund does not separately report the effect of changes in foreign exchange rates from changes in market prices on securities held. Such changes are included in net realized and unrealized gain or loss from investments.
Realized foreign exchange gains or losses arise from sales of foreign currencies, currency gains or losses realized between the trade and settlement dates on securities transactions and the difference between the recorded amounts of dividends, interest, and foreign withholding taxes and the U.S. dollar equivalent of the amounts actually received or paid. Net unrealized foreign exchange gains and losses arise from changes in foreign exchange rates on foreign denominated assets and liabilities other than investments in securities held at the end of the reporting period.
c. Income Taxes
No provision has been made for income taxes because the Fund’s policy is to qualify as a regulated investment company under the Internal Revenue Code and to distribute substantially all of its taxable income.
d. Security Transactions, Investment Income, Expenses and Distributions
Security transactions are accounted for on trade date. Realized gains and losses on security transactions are determined on a specific identification basis. Interest income and estimated expenses are accrued daily. Dividend income and distributions to shareholders are recorded on the ex-dividend date.
Common expenses incurred by the Trust are allocated among the Funds based on the ratio of net assets of each fund to the combined net assets. Other expenses are charged to each fund on a specific identification basis.
FA-14
FRANKLIN TEMPLETON VARIABLE INSURANCE PRODUCTS TRUST
FRANKLIN AGGRESSIVE GROWTH SECURITIES FUND
Notes to Financial Statements (continued)
1. ORGANIZATION AND SIGNIFICANT ACCOUNTING POLICIES (cont.)
Realized and unrealized gains and losses and net investment income, other than class specific expenses, are allocated daily to each class of shares based upon the relative proportion of net assets of each class.
e. Accounting Estimates
The preparation of financial statements in accordance with accounting principles generally accepted in the United States of America requires management to make estimates and assumptions that affect the reported amounts of assets and liabilities at the date of the financial statements and the amounts of income and expenses during the reporting period. Actual results could differ from those estimates.
f. Guarantees and Indemnifications
Under the Trust’s organizational documents, its officers and trustees are indemnified against certain liability arising out of the performance of their duties to the Trust. Additionally, in the normal course of business, the Trust enters into contracts with service providers that contain general indemnification clauses. The Trust’s maximum exposure under these arrangements is unknown as this would involve future claims that may be made against the Trust that have not yet occurred. However, based on experience, the Trust expects the risk of loss to be remote.
2. SHARES OF BENEFICIAL INTEREST
The Fund offers two classes of shares: Class 1 and Class 2. Each class of shares differs by its distribution fees, voting rights on matters affecting a single class and its exchange privilege.
At December 31, 2003, there were an unlimited number of shares authorized ($.01 par value). Transactions in the Fund’s shares were as follows:
| | | | | | | | | | | | | | |
| | | Year Ended December 31,
| |
| | | 2003
| | | 2002
| |
| Class 1 Shares: | | Shares
| | | Amount
| | | Shares
| | | Amount
| |
Shares sold | | 678,127 | | | $ | 3,174,361 | | | 312,751 | | | $ | 1,490,797 | |
Shares redeemed | | (647,673 | ) | | | (2,912,715 | ) | | (454,102 | ) | | | (2,054,752 | ) |
| | |
| |
Net increase (decrease) | | 30,454 | | | $ | 261,646 | | | (141,351 | ) | | $ | (563,955 | ) |
| | |
| |
| Class 2 Shares: | | | | | | | | | | | | |
Shares redeemed | | (17 | ) | | $ | (73 | ) | | — | | | | — | |
| | |
| |
Net increase (decrease) | | (17 | ) | | $ | (73 | ) | | — | | | | — | |
| | |
| |
3. TRANSACTIONS WITH AFFILIATES
Certain officers and trustees of the Trust are also officers and/or directors of the following entities:
| | |
| Entity | | Affiliation |
|
Franklin Templeton Services LLC (FT Services) | | Administrative manager |
Franklin Advisers Inc. (Advisers) | | Investment manager |
Franklin/Templeton Distributors Inc. (Distributors) | | Principal underwriter |
Franklin/Templeton Investor Services LLC (Investor Services) | | Transfer agent |
FA-15
FRANKLIN TEMPLETON VARIABLE INSURANCE PRODUCTS TRUST
FRANKLIN AGGRESSIVE GROWTH SECURITIES FUND
Notes to Financial Statements (continued)
3. TRANSACTIONS WITH AFFILIATES (cont.)
The Fund pays an investment management fee to Advisers based on the average daily net assets of the Fund as follows:
| | |
| Annualized Fee Rate | | Net Assets |
|
| .50% | | First $500 million |
| .40% | | Over $500 million, up to and including $1 billion |
| .35% | | Over $1 billion, up to and including $1.5 billion |
Fees are further reduced on net assets over $1.5 billion.
The Fund pays an administrative fee to FT Services of .20% per year of the average daily net assets of the Fund.
The Fund reimburses Distributors up to .25% per year of the average daily net assets of Class 2 for costs incurred in marketing the Fund’s shares.
Investor Services, under terms of an agreement, performs shareholder servicing for the Fund and is not paid by the Fund for the services.
4. INCOME TAXES
At December 31, 2003, the Fund had tax basis capital losses of $9,273,470, which may be carried over to offset future capital gains. Such losses expire as follows:
| | | |
Capital loss carryovers expiring in: | | | |
2008 | | $ | 596,259 |
2009 | | | 7,013,264 |
2010 | | | 1,634,894 |
2011 | | | 29,053 |
| | |
|
| | | $ | 9,273,470 |
| | |
|
At December 31, 2003, the fund had deferred capital losses occurring subsequent to October 31, 2003 of $11,565. For tax purposes, such losses will be reflected in the year ending December 31, 2004.
Net realized gains (losses) differ for financial statement and tax purposes primarily due to the differing treatment of wash sales.
At December 31, 2003, the cost of investments, net unrealized appreciation (depreciation), undistributed ordinary income and undistributed long term capital gains for income tax purposes were as follows:
| | | | |
Cost of investments | | $ | 5,762,996 | |
| | |
| |
Unrealized appreciation | | | 1,404,425 | |
Unrealized depreciation | | | (43,772 | ) |
| | |
| |
Net unrealized appreciation (depreciation) | | $ | 1,360,653 | |
| | |
| |
Undistributed ordinary income | | $ | — | |
Undistributed long term capital gains | | | — | |
| | |
| |
Distributable earnings | | $ | — | |
| | |
| |
FA-16
FRANKLIN TEMPLETON VARIABLE INSURANCE PRODUCTS TRUST
FRANKLIN AGGRESSIVE GROWTH SECURITIES FUND
Notes to Financial Statements (continued)
5. INVESTMENT TRANSACTIONS
Purchases and sales of investments (excluding short-term securities) for the year ended December 31, 2003 aggregated $4,881,889 and $4,749,791, respectively.
6. INVESTMENT IN FRANKLIN INSTITUTIONAL FIDUCIARY TRUST MONEY MARKET PORTFOLIO
The Fund may invest in the Franklin Institutional Fiduciary Trust Money Market Portfolio (the Sweep Money Fund), an open-end investment company managed by Advisers. Management fees paid by the Fund are reduced on assets invested in the Sweep Money Fund, in an amount not to exceed the management fees paid by the Sweep Money Fund. The Fund earned $4,661 of dividend income from investment in the Sweep Money Fund for the year ended December 31, 2003.
7. REGULATORY MATTERS
On February 4, 2004, the Securities Division of the Office of the Secretary of the Commonwealth of Massachusetts filed an administrative complaint against Franklin Resources, Inc. and certain of its subsidiaries (the “Company”), alleging violations of the Massachusetts Uniform Securities Act. The complaint arises from activity that occurred in 2001 during which time an officer of a Company subsidiary was negotiating an agreement with an investor relating to investments in a mutual fund and a hedge fund.
The Company, in addition to other entities within Franklin Templeton Investments, has been named in shareholder class actions related to the matter described above. The Company believes that the claims made in the lawsuit are without merit and it intends to defend vigorously against the allegations. The Company and the Fund may be named in similar civil actions related to the matter described above.
In addition, as part of ongoing investigations by the U.S. Securities and Exchange Commission (the “SEC”), the U.S. Attorney for the Northern District of California, the New York Attorney General, the California Attorney General, the U.S. Attorney for the District of Massachusetts, the Florida Department of Financial Services, and the Commissioner of Securities and the Attorney General of the State of West Virginia, relating to certain practices in the mutual fund industry, including late trading, market timing and sales compensation arrangements, the Company and its subsidiaries, as well as certain current or former executives and employees of the Company, have received requests for information and/or subpoenas to testify or produce documents. The Company and its current employees are providing documents and information in response to these requests and subpoenas. In addition, the Company has responded to requests for similar kinds of information from regulatory authorities in some of the foreign countries where the Company conducts its global asset management business.
The Staff of the SEC has informed the Company that it intends to recommend that the Commission authorize an action against the Fund’s investment adviser and a senior executive officer relating to the frequent trading issues that are the subject of the SEC’s investigation. These issues were previously disclosed as being under investigation by government authorities and the subject of an internal inquiry by the Company in its Annual Report on Form 10-K and on its public website. The Company currently is in discussions with the SEC Staff in an effort to resolve the issues raised in their investigation. Such discussions are preliminary and the Fund’s management has been advised that the Company cannot predict the likelihood of whether those discussions will result in a settlement and, if so, the terms of such settlement. The impact, if any, of these matters on the Fund is uncertain at this time. If the Company finds that it bears responsibility for any unlawful or improper conduct, it has committed to making the Fund or its shareholders whole, as appropriate.
FA-17
FRANKLIN TEMPLETON VARIABLE INSURANCE PRODUCTS TRUST
FRANKLIN AGGRESSIVE GROWTH SECURITIES FUND
Independent Auditors’ Report
To the Board of Trustees and Shareholders of
Franklin Templeton Variable Insurance Products Trust
In our opinion, the accompanying statement of assets and liabilities, including the statement of investments, and the related statements of operations and of changes in net assets and the financial highlights present fairly, in all material respects, the financial position of the Franklin Aggressive Growth Securities Fund (the Fund) (one of the funds constituting the Franklin Templeton Variable Insurance Products Trust) at December 31, 2003, the results of its operations for the year then ended, the changes in its net assets for each of the two years in the period then ended and the financial highlights for each of the periods presented, in conformity with accounting principles generally accepted in the United States of America. These financial statements and financial highlights (hereafter referred to as “financial statements”) are the responsibility of the Fund’s management; our responsibility is to express an opinion on these financial statements based on our audits. We conducted our audits of these financial statements in accordance with auditing standards generally accepted in the United States of America, which require that we plan and perform the audits to obtain reasonable assurance about whether the financial statements are free of material misstatement. An audit includes examining, on a test basis, evidence supporting the amounts and disclosures in the financial statements, assessing the accounting principles used and significant estimates made by management, and evaluating the overall financial statement presentation. We believe that our audits, which included confirmation of securities at December 31, 2003 by correspondence with the custodian and brokers, provide a reasonable basis for our opinion.
PricewaterhouseCoopers LLP
San Francisco, California
February 5, 2004, except for Note 7 as to which the date is February 12, 2004
FA-18
FRANKLIN GLOBAL COMMUNICATIONS SECURITIES FUND
Fund Goals and Primary Investments: Franklin Global Communications Securities Fund seeks capital appreciation and current income. The Fund invests primarily in investments of communications companies that are primarily engaged in providing the distribution, content and equipment related to the creation, transmission or processing of information in any nation, including the U.S. and emerging markets.
We are pleased to bring you Franklin Global Communications Securities Fund’s annual report for the fiscal year ended December 31, 2003.
Performance Overview
You can find the Fund’s one-year total return in the Performance Summary following this report. The Fund outperformed its benchmark, the Standard & Poor’s 500 Composite Index (S&P 500), which returned 28.67% for the year under review.1 Given that the Fund invests in only a few sectors found within the S&P 500, the Fund’s results versus the S&P 500 are not directly comparable.
Economic and Market Overview
During the year ended December 31, 2003, many factors impacted global economies and financial markets. Early in the year, economic uncertainty and geopolitical events, including impending war in Iraq, pushed U.S. interest rates to their lowest level in more than four decades, and the 10-year U.S. Treasury note’s yield fell to 3.13% in mid-June. However, following the end of major conflict in Iraq, many economic indicators turned positive. The U.S. government injected fiscal stimulus into the economy, approving another round of tax cuts and rebates that included dividend and capital gains tax reductions. In June, an accommodative Federal Reserve Board, in an attempt to bolster the economy, cut the federal funds target rate to 1.00%.
During the year, the U.S. trade deficit increased significantly, contributing to the U.S. dollar’s fall to record lows against the euro and other major currencies. However, the weak dollar provided a boost to the U.S. economy and corporate profits as exports became cheaper for foreign buyers. Robust consumer spending, especially for autos and homes, and strong business spending, particularly for equipment and software, contributed to the accelerated economic activity. In addition, U.S. federal spending stayed firm and inflation remained benign. U.S. gross domestic product (GDP) grew an annualized 8.2% in third
1. Source: Standard & Poor’s Micropal. One cannot invest directly in an index, nor is an index representative of the Fund’s portfolio. Please see Index Descriptions following the Fund Summaries.

FGC-1
quarter 2003, its strongest pace in nearly 20 years, and overall, 2003 GDP grew an estimated 3.1%. As economic data improved, some interest rates rose from their lows, and the 10-year Treasury note’s yield ended the period at 4.27%.
An equity market rally started in late March 2003 and continued through the end of the year. The rebound began with investors anticipating economic recovery in the second half of 2003, and it continued as data showed robust economic growth. Improved sentiment led many investors to rotate into economically sensitive and financially leveraged companies, specifically cyclical, technology, small-capitalization and emerging market stocks. The S&P 500 rose 28.67% for the 12 months ended December 31, 2003, while the technology-heavy Nasdaq Composite Index increased 50.93%. Telecommunications stocks, as measured by the Nasdaq Telecommunications Index, rose 45.75% for the same period.2
Investment Strategy
We are research driven, fundamental investors pursuing a disciplined blend of growth and value strategies. Relying on a team of analysts to provide in-depth industry expertise, we look for companies that will position the Fund to benefit from potential future technological advances and increasing worldwide demand in the communications industries. As a bottom-up investor focusing primarily on individual securities, we will focus on the market price of a company’s securities relative to our evaluation of the company’s potential long-term earnings, asset value and cash flow. Among the factors we also consider are a company’s historical value measures, including price/earnings ratio, profit margins and liquidation value.
Manager’s Discussion
Many telecommunications companies showed solid operational performance in 2003, largely due to efficiency gains aimed at increasing profits, which in turn benefited their underlying stock prices. The Fund’s shares of domestic and global wireless telecommunications companies benefited most from this trend, and proved to be some of our best performers during the year under review. After a prolonged industry slump, these companies demonstrated a revamped focus on profitability while taking advantage of new growth opportunities. During the year, investors became
2. Source: Standard & Poor’s Micropal. Please see Index Descriptions following the Fund Summaries.
Top 10 Holdings
Franklin Global Communications Securities Fund
12/31/03
| | |
Company Sector/Industry, Country | | % of Total
Net Assets |
|
| |
| Vodafone Group PLC, ADR | | 3.1% |
| Wireless Communications, U.K. | | |
| |
| Nextel Communications Inc., A | | 3.0% |
| Wireless Communications, U.S. | | |
| |
| BellSouth Corp. | | 2.9% |
| Major Telecommunications, U.S. | | |
| |
| Allstream Inc., B | | 2.6% |
| Major Telecommunications, Canada | | |
| |
| Telefonica SA, ADR | | 2.4% |
| Major Telecommunications, Spain | | |
| |
| Verizon Communications Inc. | | 2.4% |
| Major Telecommunications, U.S. | | |
| |
| Qwest Communications International Inc. | | 2.3% |
| Specialty Telecommunications, U.S. | | |
| |
| Tektronix Inc. | | 2.2% |
| Electronic Equipment & Instruments, U.S. | | |
| |
| Commonwealth Telephone Enterprises Inc. | | 2.2% |
| Specialty Telecommunications, U.S. | | |
| |
| Telefonos de Mexico SA de CV (Telmex), L, ADR | | 2.2% |
| Major Telecommunications, Mexico | | |
The dollar value, number of shares or principal amount, and complete legal titles of all portfolio holdings are listed in the Fund’s Statement of Investments.
FGC-2
drawn to their improving fundamentals and the relatively low stock price valuations many wireless stocks displayed.
Domestically, Western Wireless was among our best performers in the wireless telecommunications sector. Consistent with our strategy, we bought Western shares because we believed the company had one of the best and most experienced management teams in the industry. The company’s stock had an attractive valuation at our time of purchase, especially in light of our view that the company has fundamentals, including rural operations, that may attract less competition than urban markets and may reduce the impact of wireless number portability.
In the foreign markets, NII Holdings, a wireless service provider operating in Mexico, Brazil, Argentina, Chile and Peru, was another contributor to the Fund’s results. Consistent with our strategy, we purchased the stock because we felt the company had an attractive valuation and capable management team. The company has been able to grow its subscriber base and maintain profitability over the past several quarters.
Among our globally competitive wireless company holdings, Vodafone Group provided substantial support to the Fund’s overall returns. Vodafone provides a range of mobile telecommunications services, including voice and data communications. The company has a presence in the U.S., continental Europe and the U.K., and in the Far East. Following our strategy, we purchased Vodafone shares because we felt the company had an attractive stock valuation, strong competitive position, and significant exposure to a host of the world’s wireless communications growth opportunities.
Although the Fund posted excellent overall results this reporting period, there were a few disappointments in the portfolio. For example, our domestic wireline services (major telecommunications sector) holdings suffered from a combination of factors, including deteriorating fundamentals, line losses due to competing technologies (especially wireless competition), and an uncertain regulatory climate. Our strategy led us to purchase stock of AT&T, the major telecommunications provider, due to our belief that its valuation was attractive and the new management team had an opportunity to improve operations. AT&T stock faltered as the company faced tough, highly competitive market conditions that resulted in declining revenue and cash flow. Thus, AT&T negatively impacted Fund performance during the period. AT&T’s new management team is attempting to reduce costs to maximize cash flow and profitability. In
FGC-3
line with our strategy, we continued to hold AT&T in the portfolio at period-end, believing the new management team appeared on the right track to improved profitability.
Thank you for your participation in Franklin Global Communications Securities Fund. We look forward to serving your future investment needs.
This discussion reflects our analysis, opinions and portfolio holdings as of December 31, 2003, the end of the reporting period. The way we implement our main investment strategies and the resulting portfolio holdings may change depending on factors such as market and economic conditions. These opinions may not be relied upon as investment advice or an offer for a particular security. The information is not a complete analysis of every aspect of any market, country, industry, security or the Fund. Statements of fact are from sources considered reliable, but the advisor makes no representation or warranty as to their completeness or accuracy. Although historical performance is no guarantee of future results, these insights may help you understand our investment management philosophy.
FGC-4
PERFORMANCE SUMMARYASOF 12/31/03
Total return of Class 2 shares represents the average annual change in value, assuming reinvestment of dividends and capital gains. Average returns smooth out variations in returns, which can be significant; they are not the same as year-by-year results.
Franklin Global Communications Securities Fund – Class 2*
Periods ended 12/31/03
| | | | | | |
| | | 1-Year | | 5-Year | | 10-Year |
|
| | | |
Average Annual Total Return | | +40.44% | | -9.29% | | +0.74% |
*Because Class 2 shares were not offered until 1/6/99, standardized Class 2 Fund performance for prior periods represents the historical results of Class 1 shares. For periods beginning on 1/6/99, Class 2’s results reflect an additional 12b-1 fee expense, which also affects future performance. Since 1/6/99 (effective date), the average annual total return of Class 2 shares was -9.83%.
Ongoing market volatility can significantly affect short-term performance; recent returns may differ.
Total Return Index Comparison
for Hypothetical $10,000 Investment (1/1/94–12/31/03)
The graph compares the performance of Franklin Global Communications Securities Fund – Class 2* and the S&P 500. One cannot invest directly in an index, nor is an index representative of the Fund’s portfolio. Please see Important Notes to Performance Information preceding the Fund Summaries.
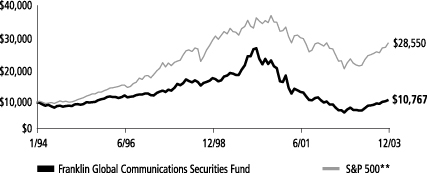
**Source: Standard & Poor’s Micropal. Please see Index Descriptions following the Fund Summaries.
Franklin Global Communications Securities Fund – Class 2
Performance reflects the Fund’s Class 2 operating expenses, but does not include any contract fees, expenses or sales charges. If they had been included, performance would be lower. These charges and deductions, particularly for variable life policies, can have a significant effect on contract values and insurance benefits. See the contract prospectus for a complete description of these expenses, including sales charges.
Since markets can go down as well as up, investment return and the value of your principal will fluctuate with market conditions, and you may have a gain or loss when you sell your shares.
Past performance does not guarantee future results.
FGC-5
SUPPLEMENT DATED JANUARY 20, 2004
TO THE PROSPECTUS OF
FRANKLIN GLOBAL COMMUNICATIONS SECURITIES FUND
DATED MAY 1, 2003
(Franklin Templeton Variable Insurance Products Trust)
The management section on page FGC-5 of the prospectus is replaced with the following:

Franklin Advisers, Inc. (Advisers), One Franklin Parkway, San Mateo, California 94403-1906, is the Fund’s investment manager.
The team responsible for the Fund’s management is:
| | |
| |
Grant Bowers VICE PRESIDENT OF ADVISERS | | Mr. Bowers has been a manager of the Fund since 2002, and has been with Franklin Templeton Investments since 1993. |
| |
Christopher Grisanti, CFA PORTFOLIO MANAGER OF ADVISERS | | Mr. Grisanti has been a manager of the Fund since January 2004 and has been with Franklin Templeton Investments since 1998. |
| |
Alex W. Peters, CFA VICE PRESIDENT OF ADVISERS | | Mr. Peters has been a manager of the Fund since 1999, and has been with Franklin Templeton Investments since 1992. |
The Fund pays Advisers a fee for managing the Fund’s assets and providing certain administrative facilities and services for the Fund. For the fiscal year ended December 31, 2002, the Fund paid 0.57% of its average daily net assets to Advisers for its services.
Please keep this supplement for future reference.
FGC-6
FRANKLIN TEMPLETON VARIABLE INSURANCE PRODUCTS TRUST
FRANKLIN GLOBAL COMMUNICATIONS SECURITIES FUND
Financial Highlights
| | | | | | | | | | | | | | | | | | | | |
| | | Class 1
| |
| | | Year Ended December 31,
| |
| | | 2003 | | | 2002 | | | 2001 | | | 2000 | | | 1999 | |
| | |
|
|
|
Per share operating performance | | | | | | | | | | | | | | | | | | | | |
(for a share outstanding throughout the year) | | | | | | | | | | | | | | | | | | | | |
Net asset value, beginning of year | | $ | 4.53 | | | $ | 6.87 | | | $ | 12.88 | | | $ | 24.86 | | | $ | 20.45 | |
| | |
|
|
|
Income from investment operations: | | | | | | | | | | | | | | | | | | | | |
Net investment incomea | | | .06 | | | | .04 | | | | .04 | | | | .11 | | | | .37 | |
Net realized and unrealized gains (losses) | | | 1.78 | | | | (2.33 | ) | | | (3.55 | ) | | | (6.77 | ) | | | 6.91 | |
| | |
|
|
|
Total from investment operations | | | 1.84 | | | | (2.29 | ) | | | (3.51 | ) | | | (6.66 | ) | | | 7.28 | |
| | |
|
|
|
Less distributions from: | | | | | | | | | | | | | | | | | | | | |
Net investment income | | | (.05 | ) | | | (.05 | ) | | | (.01 | ) | | | (.50 | ) | | | (.84 | ) |
Net realized gains | | | — | | | | — | | | | (2.49 | ) | | | (4.82 | ) | | | (2.03 | ) |
| | |
|
|
|
Total distributions | | | (.05 | ) | | | (.05 | ) | | | (2.50 | ) | | | (5.32 | ) | | | (2.87 | ) |
| | |
|
|
|
Net asset value, end of year | | $ | 6.32 | | | $ | 4.53 | | | $ | 6.87 | | | $ | 12.88 | | | $ | 24.86 | |
| | |
|
|
|
Total returnb | | | 40.46% | | | | (33.28 | )% | | | (29.24 | )% | | | (32.85 | )% | | | 39.42% | |
| | | | | |
Ratios/supplemental data | | | | | | | | | | | | | | | | | | | | |
Net assets, end of year (000’s) | | $ | 149,480 | | | $ | 130,255 | | | $ | 265,055 | | | $ | 523,288 | | | $ | 987,011 | |
Ratios to average net assets: | | | | | | | | | | | | | | | | | | | | |
Expenses | | | .64% | | | | .60% | | | | .55% | | | | .52% | | | | .51% | |
Net investment income | | | 1.08% | | | | .83% | | | | .46% | | | | .54% | | | | 1.81% | |
Portfolio turnover rate | | | 96.60% | | | | 97.75% | | | | 105.36% | | | | 117.99% | | | | 87.53% | |
| a | Based on average daily shares outstanding. |
| b | Total return does not include any fees, charges or expenses imposed by the variable annuity and life insurance contracts for which the Franklin Templeton Variable Insurance Products Trust serves as an underlying investment vehicle. Total return is not annualized for periods less than one year. |
FGC-7
FRANKLIN TEMPLETON VARIABLE INSURANCE PRODUCTS TRUST
FRANKLIN GLOBAL COMMUNICATIONS SECURITIES FUND
Financial Highlights (continued)
| | | | | | | | | | | | | | | | | | | | |
| | | Class 2
| |
| | | Year Ended December 31,
| |
| | | 2003 | | | 2002 | | | 2001 | | | 2000 | | | 1999c | |
| | |
|
|
|
Per share operating performance | | | | | | | | | | | | | | | | | | | | |
(for a share outstanding throughout the year) | | | | | | | | | | | | | | | | | | | | |
Net asset value, beginning of year | | $ | 4.51 | | | $ | 6.84 | | | $ | 12.86 | | | $ | 24.78 | | | $ | 21.02 | |
| | |
|
|
|
Income from investment operations: | | | | | | | | | | | | | | | | | | | | |
Net investment incomea | | | .05 | | | | .03 | | | | .02 | | | | .05 | | | | .26 | |
Net realized and unrealized gains (losses) | | | 1.77 | | | | (2.32 | ) | | | (3.54 | ) | | | (6.72 | ) | | | 6.37 | |
| | |
|
|
|
Total from investment operations | | | 1.82 | | | | (2.29 | ) | | | (3.52 | ) | | | (6.67 | ) | | | 6.63 | |
| | |
|
|
|
Less distributions from: | | | | | | | | | | | | | | | | | | | | |
Net investment income | | | (.05 | ) | | | (.04 | ) | | | (.01 | ) | | | (.43 | ) | | | (.84 | ) |
Net realized gains | | | — | | | | — | | | | (2.49 | ) | | | (4.82 | ) | | | (2.03 | ) |
| | |
|
|
|
Total distributions | | | (.05 | ) | | | (.04 | ) | | | (2.50 | ) | | | (5.25 | ) | | | (2.87 | ) |
| | |
|
|
|
Net asset value, end of year | | $ | 6.28 | | | $ | 4.51 | | | $ | 6.84 | | | $ | 12.86 | | | $ | 24.78 | |
| | |
|
|
|
Total returnb | | | 40.44% | | | | (33.52)% | | | | (29.40)% | | | | (32.97)% | | | | 35.17% | |
| | | | | |
Ratios/supplemental data | | | | | | | | | | | | | | | | | | | | |
Net assets, end of year (000’s) | | $ | 10,719 | | | $ | 1,490 | | | $ | 312 | | | $ | 499 | | | $ | 491 | |
Ratios to average net assets: | | | | | | | | | | | | | | | | | | | | |
Expenses | | | .89% | | | | .85% | | | | .80% | | | | .77% | | | | .77% | d |
Net investment income | | | .83% | | | | .58% | | | | .21% | | | | .29% | | | | 1.24% | d |
Portfolio turnover rate | | | 96.60% | | | | 97.75% | | | | 105.36% | | | | 117.99% | | | | 87.53% | |
| a | Based on average daily shares outstanding. |
| b | Total return does not include any fees, charges or expenses imposed by the variable annuity and life insurance contracts for which the Franklin Templeton Variable Insurance Products Trust serves as an underlying investment vehicle. Total return is not annualized for periods less than one year. |
| c | For the period January 6, 1999 (effective date) to December 31, 1999. |
FGC-8
See notes to financial statements.
FRANKLIN TEMPLETON VARIABLE INSURANCE PRODUCTS TRUST
FRANKLIN GLOBAL COMMUNICATIONS SECURITIES FUND
Statement of Investments, December 31, 2003
| | | | | | | |
| | | COUNTRY | | SHARES | | VALUE |
|
Common Stocks 90.8% | | | | | | | |
Advertising/Marketing Services .9% | | | | | | | |
Interpublic Group of Cos. Inc. | | United States | | 95,600 | | $ | 1,491,360 |
| | | | | | |
|
|
Broadcasting 2.2% | | | | | | | |
Clear Channel Communications Inc. | | United States | | 51,700 | | | 2,421,111 |
aRadio One Inc., D | | United States | | 57,400 | | | 1,107,820 |
| | | | | | |
|
|
| | | | | | | | 3,528,931 |
| | | | | | |
|
|
Cable/Satellite TV 3.1% | | | | | | | |
aComcast Corp. | | United States | | 96,200 | | | 3,009,136 |
aHughes Electronics Corp. | | United States | | 115,660 | | | 1,914,166 |
| | | | | | |
|
|
| | | | | | | | 4,923,302 |
| | | | | | |
|
|
Commercial Printing/Forms 1.5% | | | | | | | |
R.R. Donnelley & Sons Co. | | United States | | 80,700 | | | 2,433,105 |
| | | | | | |
|
|
Computer Communications 2.2% | | | | | | | |
a3Com Corp. | | United States | | 218,100 | | | 1,781,877 |
aExtreme Networks Inc. | | United States | | 233,300 | | | 1,682,093 |
| | | | | | |
|
|
| | | | | | | | 3,463,970 |
| | | | | | |
|
|
Computer Peripherals 3.0% | | | | | | | |
aLogitech International SA, ADR | | Switzerland | | 42,300 | | | 1,799,019 |
aSeagate Technology | | United States | | 79,500 | | | 1,502,550 |
aWestern Digital Corp. | | United States | | 128,100 | | | 1,510,299 |
| | | | | | |
|
|
| | | | | | | | 4,811,868 |
| | | | | | |
|
|
Data Processing Services 1.7% | | | | | | | |
First Data Corp. | | United States | | 66,400 | | | 2,728,376 |
| | | | | | |
|
|
Electronic Equipment/Instruments 2.2% | | | | | | | |
Tektronix Inc. | | United States | | 113,100 | | | 3,573,960 |
| | | | | | |
|
|
Electronics/Appliance Stores 1.8% | | | | | | | |
RadioShack Corp. | | United States | | 92,700 | | | 2,844,036 |
| | | | | | |
|
|
Electronics/Appliances 1.0% | | | | | | | |
Eastman Kodak Co. | | United States | | 64,200 | | | 1,648,014 |
| | | | | | |
|
|
Financial Publishing/Services 1.5% | | | | | | | |
The McGraw-Hill Cos. Inc. | | United States | | 33,400 | | | 2,335,328 |
| | | | | | |
|
|
Internet Retail 1.5% | | | | | | | |
aInteractive Corp. | | United States | | 72,900 | | | 2,473,497 |
| | | | | | |
|
|
Internet Software/Services 2.0% | | | | | | | |
aCheck Point Software Technologies Ltd. | | Israel | | 81,600 | | | 1,372,512 |
aInfoSpace Inc. | | United States | | 70,000 | | | 1,613,500 |
aUnited Online Inc. | | United States | | 9,100 | | | 152,789 |
| | | | | | |
|
|
| | | | | | | | 3,138,801 |
| | | | | | |
|
|
Major Telecommunications 28.6% | | | | | | | |
aAlaska Communications Systems Holdings Inc. | | United States | | 164,100 | | | 777,834 |
Allstream Inc., Class B | | Canada | | 73,200 | | | 4,198,020 |
Alltel Corp. | | United States | | 66,400 | | | 3,092,912 |
AT&T Corp. | | United States | | 148,000 | | | 3,004,400 |
BellSouth Corp. | | United States | | 164,000 | | | 4,641,200 |
Hellenic Telecommunications Organization SA | | Greece | | 136,400 | | | 1,803,068 |
FGC-9
FRANKLIN TEMPLETON VARIABLE INSURANCE PRODUCTS TRUST
FRANKLIN GLOBAL COMMUNICATIONS SECURITIES FUND
Statement of Investments, December 31, 2003 (cont.)
| | | | | | | |
| | | COUNTRY | | SHARES | | VALUE |
|
Common Stocks (cont.) | | | | | | | |
Major Telecommunications (cont.) | | | | | | | |
aKoninklijke KPN NV | | Netherlands | | 381,000 | | $ | 2,941,120 |
KT Corp. | | South Korea | | 63,700 | | | 2,384,406 |
Portugal Telecom SGPS SA, ADR | | Portugal | | 306,004 | | | 3,066,160 |
Telecom Corp. of New Zealand Ltd. | | New Zealand | | 918,447 | | | 3,238,151 |
Telefonica SA, ADR | | Spain | | 88,056 | | | 3,891,195 |
Telefonos de Mexico SA de CV (Telmex), L, ADR | | Mexico | | 105,700 | | | 3,491,271 |
Telstra Corp. Ltd. | | Australia | | 903,907 | | | 3,282,650 |
Telus Corp. | | Canada | | 114,125 | | | 2,291,773 |
Verizon Communications Inc. | | United States | | 107,400 | | | 3,767,592 |
| | | | | | |
|
|
| | | | | | | | 45,871,752 |
| | | | | | |
|
|
Media Conglomerates 1.9% | | | | | | | |
Viacom Inc., A | | United States | | 11,200 | | | 495,824 |
Viacom Inc., B | | United States | | 56,700 | | | 2,516,346 |
| | | | | | |
|
|
| | | | | | | | 3,012,170 |
| | | | | | |
|
|
Publishing: Newspapers 4.5% | | | | | | | |
Gannett Co. Inc. | | United States | | 35,700 | | | 3,183,012 |
The New York Times Co., A | | United States | | 51,000 | | | 2,437,290 |
Tribune Co. | | United States | | 31,600 | | | 1,630,560 |
| | | | | | |
|
|
| | | | | | | | 7,250,862 |
| | | | | | |
|
|
Semiconductors .9% | | | | | | | |
aSemtech Corp. | | United States | | 66,600 | | | 1,513,818 |
| | | | | | |
|
|
Specialty Telecommunications 8.6% | | | | | | | |
CenturyTel Inc. | | United States | | 73,700 | | | 2,404,094 |
aCitizens Communications Co., B | | United States | | 211,900 | | | 2,631,798 |
aCommonwealth Telephone Enterprises Inc. | | United States | | 92,700 | | | 3,499,425 |
aNTL Inc. | | United Kingdom | | 22,400 | | | 1,562,400 |
aQwest Communications International Inc. | | United States | | 859,400 | | | 3,712,608 |
| | | | | | |
|
|
| | | | | | | | 13,810,325 |
| | | | | | |
|
|
Telecommunications Equipment 3.6% | | | | | | | |
aArris Group Inc. | | United States | | 238,400 | | | 1,726,016 |
aComverse Technology Inc. | | United States | | 54,700 | | | 962,173 |
Nokia Corp., ADR | | Finland | | 135,000 | | | 2,295,000 |
aNortel Networks Corp. | | Canada | | 182,500 | | | 771,975 |
| | | | | | |
|
|
| | | | | | | | 5,755,164 |
| | | | | | |
|
|
Wholesale Distributors 2.0% | | | | | | | |
aImagistics International Inc. | | United States | | 83,100 | | | 3,116,250 |
| | | | | | |
|
|
Wireless Communications 16.1% | | | | | | | |
America Movil SA de CV, L, ADR | | Mexico | | 91,900 | | | 2,512,546 |
China Mobile (Hong Kong) Ltd., ADR | | China | | 125,600 | | | 1,950,568 |
aEuropolitan Holdings AB | | Sweden | | 273,500 | | | 1,786,514 |
aMillicom International Cellular SA | | Luxembourg | | 33,100 | | | 2,313,690 |
aNextel Communications Inc., A | | United States | | 169,500 | | | 4,756,170 |
aNII Holdings Inc., B | | United States | | 30,900 | | | 2,306,067 |
SK Telecom Co. Ltd., ADR | | South Korea | | 133,800 | | | 2,495,370 |
Vodafone Group PLC, ADR | | United Kingdom | | 198,700 | | | 4,975,448 |
FGC-10
FRANKLIN TEMPLETON VARIABLE INSURANCE PRODUCTS TRUST
FRANKLIN GLOBAL COMMUNICATIONS SECURITIES FUND
Statement of Investments, December 31, 2003 (cont.)
| | | | | | | | |
| | | COUNTRY | | SHARES | | VALUE |
|
Common Stocks (cont.) | | | | | | | | |
Wireless Communications (cont.) | | | | | | | | |
aWestern Wireless Corp., A | | United States | | | 146,700 | | $ | 2,693,412 |
| | | | | | | |
|
|
| | | | | | | | | 25,789,785 |
| | | | | | | |
|
|
Total Common Stocks (Cost $124,949,030) | | | | | | | | 145,514,674 |
| | | | | | | |
|
|
Preferred Stock (cost $394,938) .3% | | | | | | | | |
Consumer Services | | | | | | | | |
News Corp. Ltd., ADR, pfd. | | Australia | | | 12,940 | | | 391,436 |
| | | | | | | |
|
|
Total Investments before Repurchase Agreement (Cost $125,343,968) | | | | | �� | | | 145,906,110 |
| | | | | | | |
|
|
| | | |
| | | | | PRINCIPAL
AMOUNT
| | |
Repurchase Agreement (Cost $13,128,572) 8.2% | | | | | | | | |
bJoint Repurchase Agreement, .873%, 01/02/04 (Maturity Value $13,129,209) | | United States | | $ | 13,128,572 | | | 13,128,572 |
ABN AMRO Bank, N.V., New York Branch (Maturity Value $1,223,117) Banc of America Securities LLC (Maturity Value $1,223,117) Barclays Capital Inc. (Maturity Value $873,486) Bear, Stearns & Co. Inc. (Maturity Value $698,868) BNP Paribas Securities Corp. (Maturity Value $1,223,117) Deutsche Bank Securities Inc. (Maturity Value $1,223,117) Dresdner Kleinwort Wasserstein Securities LLC (Maturity Value $1,223,117) Goldman, Sachs & Co. (Maturity Value $698,868) Greenwich Capital Markets Inc. (Maturity Value $1,223,117) Lehman Brothers Inc. (Maturity Value $1,073,051) Morgan Stanley & Co. Inc. (Maturity Value $1,223,117) UBS Securities LLC (Maturity Value $1,223,117) | | | | | | | | |
| | | | |
|
| | | |
Total Investments (Cost $138,472,540) 99.3% | | | | | | | | 159,034,682 |
Other Assets, less Liabilities .7% | | | | | | | | 1,163,589 |
| | | | |
|
| | | |
Net Assets 100.0% | | | | | | | $ | 160,198,271 |
| | | | |
|
| | | |
aNon-income producing.
bSee Note 1(c) regarding joint repurchase agreement.
FGC-11
See notes to financial statements.
FRANKLIN TEMPLETON VARIABLE INSURANCE PRODUCTS TRUST
FRANKLIN GLOBAL COMMUNICATIONS SECURITIES FUND
Financial Statements
Statement of Assets and Liabilities
December 31, 2003
| | | | |
Assets: | | | | |
Investments in securities: | | | | |
Cost | | $ | 138,472,540 | |
| | |
|
|
|
Value | | | 159,034,682 | |
Receivables: | | | | |
Investment securities sold | | | 1,746,326 | |
Capital shares sold | | | 2,535 | |
Dividends and Interest | | | 392,644 | |
| | |
|
|
|
Total assets | | | 161,176,187 | |
| | |
|
|
|
Liabilities: | | | | |
Payables: | | | | |
Investment securities purchased | | | 821,852 | |
Capital shares redeemed | | | 43,953 | |
Affiliates | | | 80,571 | |
Other liabilities | | | 31,540 | |
| | |
|
|
|
Total liabilities | | | 977,916 | |
| | |
|
|
|
Net assets, at value | | $ | 160,198,271 | |
| | |
|
|
|
Net assets consist of: | | | | |
Undistributed net investment income | | $ | 1,434,605 | |
Net unrealized appreciation (depreciation) | | | 20,567,788 | |
Accumulated net realized gain (loss) | | | (265,645,892 | ) |
Capital shares | | | 403,841,770 | |
| | |
|
|
|
Net assets, at value | | $ | 160,198,271 | |
| | |
|
|
|
Class 1: | | | | |
Net assets, at value | | $ | 149,479,620 | |
| | |
|
|
|
Shares outstanding | | | 23,637,132 | |
| | |
|
|
|
Net asset value and offering price per share | | $ | 6.32 | |
| | |
|
|
|
Class 2: | | | | |
Net assets, at value | | $ | 10,718,651 | |
| | |
|
|
|
Shares outstanding | | | 1,707,663 | |
| | |
|
|
|
Net asset value and offering price per share | | $ | 6.28 | |
| | |
|
|
|
See notes to financial statements.
FGC-12
FRANKLIN TEMPLETON VARIABLE INSURANCE PRODUCTS TRUST
FRANKLIN GLOBAL COMMUNICATIONS SECURITIES FUND
Financial Statements (continued)
Statement of Operations
for the year ended December 31, 2003
| | | | |
Investment income: | | | | |
Dividends | | | $2,279,924 | |
Interest | | | 111,486 | |
| | |
|
|
|
Total investment income | | | 2,391,410 | |
| | |
|
|
|
Expenses: | | | | |
Management fees (Note 3) | | | 819,226 | |
Distribution fees - Class 2 (Note 3) | | | 11,278 | |
Transfer agent fees | | | 677 | |
Custodian fees | | | 21,587 | |
Reports to shareholders | | | 20,722 | |
Professional fees | | | 20,036 | |
Trustees’ fees and expenses | | | 1,372 | |
Other | | | 7,535 | |
| | |
|
|
|
Total expenses | | | 902,433 | |
| | |
|
|
|
Net investment income | | | 1,488,977 | |
| | |
|
|
|
Realized and unrealized gains (losses): | | | | |
Net realized gain (loss) from: | | | | |
Investments | | | 787,127 | |
Foreign currency transactions | | | (21,091 | ) |
| | |
|
|
|
Net realized gain (loss) | | | 766,036 | |
| | |
|
|
|
Net unrealized appreciation (depreciation) on: | | | | |
Investments | | | 45,608,298 | |
Translation of assets and liabilities denominated in foreign currencies | | | 5,646 | |
| | |
|
|
|
Net unrealized appreciation (depreciation) | | | 45,613,944 | |
| | |
|
|
|
Net realized and unrealized gain (loss) | | | 46,379,980 | |
| | |
|
|
|
Net increase (decrease) in net assets resulting from operations | | $ | 47,868,957 | |
| | |
|
|
|
See notes to financial statements.
FGC-13
FRANKLIN TEMPLETON VARIABLE INSURANCE PRODUCTS TRUST
FRANKLIN GLOBAL COMMUNICATIONS SECURITIES FUND
Financial Statements (continued)
Statements of Changes in Net Assets
for the years ended December 31, 2003 and 2002
| | | | | | | | |
| | | 2003
| | | 2002
| |
Increase (decrease) in net assets: | | | | | | | | |
Operations: | | | | | | | | |
Net investment income | | $ | 1,488,977 | | | $ | 1,456,605 | |
Net realized gain (loss) from investments and foreign currency transactions | | | 766,036 | | | | (89,410,386 | ) |
Net unrealized appreciation (depreciation) on investments and translation of assets and liabilities denominated in foreign currencies | | | 45,613,944 | | | | 6,275,419 | |
| | |
|
|
|
Net increase (decrease) in net assets resulting from operations | | | 47,868,957 | | | | (81,678,362 | ) |
Distributions to shareholders from: | | | | | | | | |
Net investment income: | | | | | | | | |
Class 1 | | | (1,238,199 | ) | | | (1,655,159 | ) |
Class 2 | | | (30,287 | ) | | | (4,896 | ) |
| | |
|
|
|
Total distributions to shareholders | | | (1,268,486) | | | | (1,660,055 | ) |
Capital share transactions: (Note 2) | | | | | | | | |
Class 1 | | | (25,751,370 | ) | | | (51,646,759 | ) |
Class 2 | | | 7,603,913 | | | | 1,363,628 | |
| | |
|
|
|
Total capital share transactions | | | (18,147,457 | ) | | | (50,283,131 | ) |
Net increase (decrease) in net assets | | | 28,453,014 | | | | (133,621,548 | ) |
Net assets: | | | | | | | | |
Beginning of year | | | 131,745,257 | | | | 265,366,805 | |
| | |
|
|
|
End of year | | $ | 160,198,271 | | | $ | 131,745,257 | |
| | |
|
|
|
Undistributed net investment income included in net assets: | | | | | | | | |
End of year | | $ | 1,434,605 | | | $ | 1,267,035 | |
| | |
|
|
|
See notes to financial statements.
FGC-14
FRANKLIN TEMPLETON VARIABLE INSURANCE PRODUCTS TRUST
FRANKLIN GLOBAL COMMUNICATIONS SECURITIES FUND
Notes to Financial Statements
1. ORGANIZATION AND SIGNIFICANT ACCOUNTING POLICIES
Franklin Templeton Variable Insurance Products Trust (the Trust) is registered under the Investment Company Act of 1940 as an open-end investment company, consisting of twenty-two separate series (the Funds). Franklin Global Communications Securities Fund (the Fund) included in this report is diversified. Shares of the Fund are sold only to insurance company separate accounts to fund the benefits of variable life insurance policies or variable annuity contracts. As of December 31, 2003, 100% of total Fund shares were sold through one insurance company. The Fund’s investment objective is growth and income.
The following summarizes the Fund’s significant accounting policies.
a. Security Valuation
Securities listed or traded on a recognized national exchange or NASDAQ are valued at the last reported sales price. Over-the-counter securities and listed securities for which no sale is reported are valued within the range of the latest quoted bid and asked prices. Foreign securities are valued at the close of trading of the foreign exchange or the NYSE, whichever is earlier. If events occur that materially affect the values of securities after the prices or foreign exchange rates are determined, or if market quotations are not readily available, the securities will be valued at fair value as determined following procedures approved by the Board of Trustees.
b. Foreign Currency Translation
Portfolio securities and other assets and liabilities denominated in foreign currencies are translated into U.S. dollars based on the exchange rate of such currencies against U.S. dollars on the date of valuation. Purchases and sales of securities and income items denominated in foreign currencies are translated into U.S. dollars at the exchange rate in effect on the transaction date.
The Fund does not separately report the effect of changes in foreign exchange rates from changes in market prices on securities held. Such changes are included in net realized and unrealized gain or loss from investments.
Realized foreign exchange gains or losses arise from sales of foreign currencies, currency gains or losses realized between the trade and settlement dates on securities transactions and the difference between the recorded amounts of dividends, interest, and foreign withholding taxes and the U.S. dollar equivalent of the amounts actually received or paid. Net unrealized foreign exchange gains and losses arise from changes in foreign exchange rates on foreign denominated assets and liabilities other than investments in securities held at the end of the reporting period.
c. Joint Repurchase Agreement
The Fund may enter into a joint repurchase agreement whereby its uninvested cash balance is deposited into a joint cash account to be used to invest in one or more repurchase agreements. The value and face amount of the joint repurchase agreement are allocated to the Fund based on its pro-rata interest. A repurchase agreement is accounted for as a loan by the Fund to the seller, collateralized by securities which are delivered to the Fund’s custodian. The market value, including accrued interest, of the initial collateralization is required to be at least 102% of the dollar amount invested by the Funds, with the value of the underlying securities marked to market daily to maintain coverage of at least 100%. At December 31, 2003, all repurchase agreements had been entered into on that date.
d. Foreign Currency Contracts
When the Fund purchases or sells foreign securities it may enter into foreign exchange contracts to minimize foreign exchange risk from the trade date to the settlement date of the transactions. A foreign exchange contract is an agreement between two parties to exchange different currencies at an agreed upon exchange rate on a specified date. Realized and unrealized gains and losses are included in the Statement of Operations.
FGC-15
FRANKLIN TEMPLETON VARIABLE INSURANCE PRODUCTS TRUST
FRANKLIN GLOBAL COMMUNICATIONS SECURITIES FUND
Notes to Financial Statements (continued)
1. ORGANIZATION AND SIGNIFICANT ACCOUNTING POLICIES (cont.)
The risks of these contracts include movement in the values of the foreign currencies relative to the U.S. dollar and the possible inability of the counterparties to fulfill their obligations under the contracts.
e. Income Taxes
No provision has been made for income taxes because the Fund’s policy is to qualify as a regulated investment company under the Internal Revenue Code and to distribute substantially all of its taxable income.
f. Security Transactions, Investment Income, Expenses and Distributions
Security transactions are accounted for on trade date. Realized gains and losses on security transactions are determined on a specific identification basis. Interest income and estimated expenses are accrued daily. Dividend income and distributions to shareholders are recorded on the ex-dividend date.
Common expenses incurred by the Trust are allocated among the Funds based on the ratio of net assets of each Fund to the combined net assets. Other expenses are charged to each Fund on a specific identification basis.
Realized and unrealized gains and losses and net investment income, other than class specific expenses, are allocated daily to each class of shares based upon the relative proportion of net assets of each class.
g. Accounting Estimates
The preparation of financial statements in accordance with accounting principles generally accepted in the United States of America requires management to make estimates and assumptions that affect the reported amounts of assets and liabilities at the date of the financial statements and the amounts of income and expenses during the reporting period. Actual results could differ from those estimates.
h. Guarantees and Indemnifications
Under the Trust’s organizational documents, its officers and trustees are indemnified against certain liability arising out of the performance of their duties to the Trust. Additionally, in the normal course of business, the Trust enters into contracts with service providers that contain general indemnification clauses. The Trust’s maximum exposure under these arrangements is unknown as this would involve future claims that may be made against the Trust that have not yet occurred. However, based on experience, the Trust expects the risk of loss to be remote.
FGC-16
FRANKLIN TEMPLETON VARIABLE INSURANCE PRODUCTS TRUST
FRANKLIN GLOBAL COMMUNICATIONS SECURITIES FUND
Notes to Financial Statements (continued)
2. SHARES OF BENEFICIAL INTEREST
The Fund offers two classes of shares: Class 1 and 2. Each class of shares differs by its distribution fees, voting rights on matters affecting a single class and its exchange privilege.
At December 31, 2003, there were an unlimited number of shares authorized ($.01 par value). Transactions in the Fund’s shares were as follows:
| | | | | | | | | | | | | | |
| | | Year Ended December 31,
| |
| | | 2003
| | | 2002
| |
| | | Shares
| | | Amount
| | | Shares
| | | Amount
| |
| Class 1 Shares: | | | | | | | | | | | | |
Shares sold | | 135,529 | | | $ | 698,512 | | | 307,366 | | | $ | 1,672,275 | |
Shares issued in reinvestment of distributions | | 230,149 | | | | 1,238,199 | | | 320,767 | | | | 1,655,159 | |
Shares redeemed | | (5,451,344 | ) | | | (27,688,081 | ) | | (10,514,281 | ) | | | (54,974,193 | ) |
| | |
|
|
Net decrease (decrease) | | (5,085,666 | ) | | $ | (25,751,370 | ) | | (9,886,148 | ) | | $ | (51,646,759 | ) |
| | |
|
|
| Class 2 Shares: | | | | | | | | | | | | |
Shares sold | | 1,509,954 | | | $ | 8,281,081 | | | 308,075 | | | $ | 1,482,602 | |
Shares issued in reinvestment of distributions | | 5,671 | | | | 30,287 | | | 953 | | | | 4,896 | |
Shares redeemed | | (138,375 | ) | | | (707,455 | ) | | (24,284 | ) | | | (123,870 | ) |
| | |
|
|
Net increase (decrease) | | 1,377,250 | | | $ | 7,603,913 | | | 284,744 | | | $ | 1,363,628 | |
| | |
|
|
3. TRANSACTIONS WITH AFFILIATES
Certain officers and trustees of the Fund are also officers and/or directors of the following entities:
| | |
| Entity | | Affiliation |
|
| Franklin Templeton Services LLC (FT Services) | | Administrative manager |
| Franklin Advisers Inc. (Advisers) | | Investment manager |
| Franklin/Templeton Distributors Inc. (Distributors) | | Principal underwriter |
| Franklin/Templeton Investor Services LLC (Investor Services) | | Transfer agent |
The Fund pays an investment management fee to Advisers based on the average daily net assets of the Fund as follows:
| | |
| Annualized Fee Rate | | Net Assets |
|
| .625% | | First $100 million |
| .500% | | over $100 million, up to and including $250 million |
| .450% | | over $250 million, up to and including $10 billion |
Fees are further reduced on net assets over $10 billion.
Under an agreement with Advisers, FT Services provides administrative services to the Fund. The fee is paid by Advisers based on the average daily net assets, and is not an additional expense of the Fund.
The Fund reimburses Distributors up to .25% per year of its average daily net assets of Class 2 for costs incurred in marketing the Fund’s shares.
Investor Services, under terms of an agreement, performs shareholder servicing for the Fund and is not paid by the Fund for the services.
FGC-17
FRANKLIN TEMPLETON VARIABLE INSURANCE PRODUCTS TRUST
FRANKLIN GLOBAL COMMUNICATIONS SECURITIES FUND
Notes to Financial Statements (continued)
4. INCOME TAXES
At December 31, 2003, the Fund had tax basis capital losses of $265,006,990 which may be carried over to offset future capital gains. Such losses expire as follows:
| | | |
Capital loss carryovers expiring in: | | | |
2009 | | $ | 156,027,828 |
2010 | | | 108,979,162 |
| | |
|
|
| | | $ | 265,006,990 |
| | |
|
|
The tax character of distributions paid during the years ended December 31, 2003 and 2002, was as follows:
| | | | | | |
| | | 2003
| | 2002
|
Distributions paid from: | | | | | | |
Ordinary Income | | $ | 1,268,486 | | $ | 1,660,055 |
| | |
|
At December 31, 2003, the cost of investments, net unrealized appreciation (depreciation), undistributed ordinary income and undistributed long term capital gains for income tax purposes were as follows:
| | | | |
Cost of investments | | $ | 139,111,442 | |
| | |
|
|
|
Unrealized appreciation | | | 25,088,251 | |
Unrealized depreciation | | | (5,165,011 | ) |
| | |
|
|
|
Net unrealized appreciation (depreciation) | | $ | 19,923,240 | |
| | |
|
|
|
Undistributed ordinary income | | $ | 1,434,605 | |
Undistributed long term capital gains | | | — | |
| | |
|
|
|
Distributable earnings | | $ | 1,434,605 | |
| | |
|
|
|
Net investment income differs for financial statement and tax purposes primarily due to differing treatments for foreign currency transactions.
Net realized gains (losses) differ for financial statement and tax purposes primarily due to differing treatments of wash sales and foreign currency transactions.
5. INVESTMENT TRANSACTIONS
Purchases and sales of investments (excluding short-term securities) for the year ended December 31, 2003 aggregated $123,732,651 and $140,045,269, respectively.
6. REGULATORY MATTERS
On February 4, 2004, the Securities Division of the Office of the Secretary of the Commonwealth of Massachusetts filed an administrative complaint against Franklin Resources, Inc. and certain of its subsidiaries (the “Company”), alleging violations of the Massachusetts Uniform Securities Act. The complaint arises from activity that occurred in 2001 during which time an officer of a Company subsidiary was negotiating an agreement with an investor relating to investments in a mutual fund and a hedge fund.
FGC-18
FRANKLIN TEMPLETON VARIABLE INSURANCE PRODUCTS TRUST
FRANKLIN GLOBAL COMMUNICATIONS SECURITIES FUND
Notes to Financial Statements (continued)
6. REGULATORY MATTERS (cont.)
The Company, in addition to other entities within Franklin Templeton Investments, has been named in shareholder class actions related to the matter described above. The Company believes that the claims made in the lawsuit are without merit and it intends to defend vigorously against the allegations. The Company and the Fund may be named in similar civil actions related to the matter described above.
In addition, as part of ongoing investigations by the U.S. Securities and Exchange Commission (the “SEC”), the U.S. Attorney for the Northern District of California, the New York Attorney General, the California Attorney General, the U.S. Attorney for the District of Massachusetts, the Florida Department of Financial Services, and the Commissioner of Securities and the Attorney General of the State of West Virginia, relating to certain practices in the mutual fund industry, including late trading, market timing and sales compensation arrangements, the Company and its subsidiaries, as well as certain current or former executives and employees of the Company, have received requests for information and/or subpoenas to testify or produce documents. The Company and its current employees are providing documents and information in response to these requests and subpoenas. In addition, the Company has responded to requests for similar kinds of information from regulatory authorities in some of the foreign countries where the Company conducts its global asset management business.
The Staff of the SEC has informed the Company that it intends to recommend that the Commission authorize an action against the Fund’s investment adviser and a senior executive officer relating to the frequent trading issues that are the subject of the SEC’s investigation. These issues were previously disclosed as being under investigation by government authorities and the subject of an internal inquiry by the Company in its Annual Report on Form 10-K and on its public website. The Company currently is in discussions with the SEC Staff in an effort to resolve the issues raised in their investigation. Such discussions are preliminary and the Fund’s management has been advised that the Company cannot predict the likelihood of whether those discussions will result in a settlement and, if so, the terms of such settlement. The impact, if any, of these matters on the Fund is uncertain at this time. If the Company finds that it bears responsibility for any unlawful or improper conduct, it has committed to making the Fund or its shareholders whole, as appropriate.
FGC-19
FRANKLIN TEMPLETON VARIABLE INSURANCE PRODUCTS TRUST
FRANKLIN GLOBAL COMMUNICATIONS SECURITIES FUND
Independent Auditors’ Report
To the Board of Trustees and Shareholders of
Franklin Templeton Variable Insurance Products Trust
In our opinion, the accompanying statement of assets and liabilities, including the statement of investments, and the related statements of operations and of changes in net assets and the financial highlights present fairly, in all material respects, the financial position of the Franklin Global Communications Securities Fund (the Fund) (one of the funds constituting the Franklin Templeton Variable Insurance Products Trust) at December 31, 2003, the results of its operations for the year then ended, the changes in its net assets for each of the two years in the period then ended and the financial highlights for each of the periods presented, in conformity with accounting principles generally accepted in the United States of America. These financial statements and financial highlights (hereafter referred to as “financial statements”) are the responsibility of the Fund’s management; our responsibility is to express an opinion on these financial statements based on our audits. We conducted our audits of these financial statements in accordance with auditing standards generally accepted in the United States of America, which require that we plan and perform the audits to obtain reasonable assurance about whether the financial statements are free of material misstatement. An audit includes examining, on a test basis, evidence supporting the amounts and disclosures in the financial statements, assessing the accounting principles used and significant estimates made by management, and evaluating the overall financial statement presentation. We believe that our audits, which included confirmation of securities at December 31, 2003 by correspondence with the custodian and brokers, provide a reasonable basis for our opinion.
PricewaterhouseCoopers LLP
San Francisco, California
February 5, 2004, except for Note 6 as to which the date is February 12, 2004
FGC-20
FRANKLIN TEMPLETON VARIABLE INSURANCE PRODUCTS TRUST
FRANKLIN GLOBAL COMMUNICATIONS SECURITIES FUND
Tax Designation (unaudited)
Under Section 854(b)(2) of the Code, the Fund hereby designates 65.56% of the ordinary income dividends as income qualifying for the dividends received deduction for the fiscal year ended December 31, 2003.
FGC-21
FRANKLIN GROWTHAND INCOME SECURITIES FUND
Fund Goals and Primary Investments: Franklin Growth and Income Securities Fund seeks capital appreciation, with current income as a secondary goal. The Fund invests mainly in common stocks with current dividend yields above the average of the Standard & Poor’s 500 Composite Index.1
This annual report for Franklin Growth and Income Securities Fund covers the fiscal year ended December 31, 2003.
Performance Overview
You can find the Fund’s one-year total return in the Performance Summary following this report. The Fund underperformed its benchmarks, the Russell 3000® Value Index, which returned 31.14%, and the Russell 1000® Value Index, which returned 30.03% for the year under review.2 The Russell 1000 Value Index replaced the Russell 3000 Value Index as the Fund’s benchmark. The manager believes the composition of the Russell 1000 Value Index better reflects the Fund’s holdings. The Fund’s returns were comparable to that of its peers, as measured by the Lipper VIP Equity Income Funds Objective Average, which returned 26.81% for the same period.3
Economic and Market Overview
During the year ended December 31, 2003, many factors impacted global economies and financial markets. Early in the year, economic uncertainty and geopolitical events, including impending war in Iraq, pushed U.S. interest rates to their lowest level in more than four decades, and the 10-year U.S. Treasury note’s yield fell to 3.13% in mid-June. However, following the end of major conflict in Iraq, many economic indicators turned positive. The U.S. government injected fiscal stimulus into the economy, approving another round of tax cuts and rebates that included dividend and capital gains tax reductions. In June, an accommodative Federal Reserve Board, in an attempt to bolster the economy, cut the federal funds target rate to 1.00%.
During the year, the U.S. trade deficit increased significantly, contributing to the U.S. dollar’s fall to record lows against the euro and other major currencies. However, the weak dollar provided a boost to the U.S. economy and corporate profits as exports became cheaper for
1. Please see Index Descriptions following the Fund Summaries.
2. Source: Standard & Poor’s Micropal. One cannot invest directly in an index, nor is an index representative of the Fund’s portfolio. Please see Index Descriptions following the Fund Summaries.
3. Source: Lipper Inc. One cannot invest directly in an index, nor is an index representative of the Fund’s portfolio. Please see Index Descriptions following the Fund Summaries.
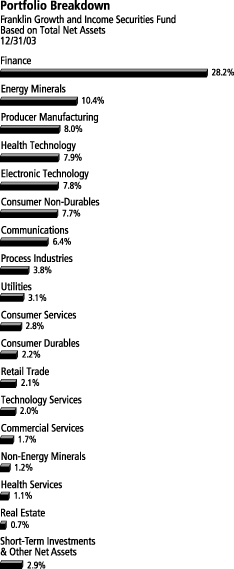
FGI-1
foreign buyers. Robust consumer spending, especially for autos and homes, and strong business spending, particularly for equipment and software, contributed to the accelerated economic activity. In addition, U.S. federal spending stayed firm and inflation remained benign. U.S. gross domestic product (GDP) grew an annualized 8.2% in third quarter 2003, its strongest pace in nearly 20 years, and overall, 2003 GDP grew an estimated 3.1%. As economic data improved, some interest rates rose from their lows, and the 10-year Treasury note’s yield ended the period at 4.27%.
An equity market rally started in late March 2003 and continued through the end of the year. The rebound began with investors anticipating economic recovery in the second half of 2003, and it continued as data showed robust economic growth. Improved sentiment led many investors to rotate into economically sensitive and financially leveraged companies, specifically cyclical, technology, small-capitalization and emerging market stocks. The Standard & Poor’s 500 Composite Index (S&P 500) rose 28.67% for the 12 months ended December 31, 2003, while the technology-heavy Nasdaq Composite Index increased 50.93%.4
Investment Strategy
We are research driven, fundamental investors, pursuing a disciplined value-oriented strategy. As bottom-up investors focusing primarily on individual securities, we look at the market price of a company’s securities relative to our evaluation of the company’s potential long-term earnings, asset value and cash flow, with a special emphasis on current dividend yield. We believe that high relative dividend yield is frequently a good indicator of value.
Manager’s Discussion
The Fund’s strategy emphasizes dividend-paying stocks. Despite the reduced tax rate for qualified dividends, dividend-paying stocks underperformed non-dividend paying issues for the year. Income-paying stocks were disappointing relative performers during the first three quarters of the year but exhibited relative strength in the fourth quarter. According to an article in The Wall Street Journal, non-dividend paying stocks in the S&P 500 outpaced their dividend-paying counterparts by approximately 26 percentage points for the year under review.5
4. Source: Standard & Poor’s Micropal. Please see Index Descriptions following the Fund Summaries.
5. Source: Brown, Ken, “Dividend Stocks Could Become Favorites in ‘04,” The Wall Street Journal, wsj.com, 12/29/03.
Top 10 Holdings
Franklin Growth and Income
Securities Fund
12/31/03
| | |
Company
Sector/Industry,
Country | | % of Total
Net Assets |
|
| |
| Citigroup Inc. | | 3.5% |
| Finance, U.S. | | |
| |
| ChevronTexaco Corp. | | 3.1% |
| Energy Minerals, U.S. | | |
| |
| BP PLC, ADR | | 3.0% |
| Energy Minerals, U.K. | | |
| |
| General Electric Co. | | 2.5% |
| Producer Manufacturing, U.S. |
| |
| Altria Group Inc. | | 2.3% |
| Consumer Non-Durables, U.S. |
| |
| Dow Chemical Co. | | 2.2% |
| Process Industries, U.S. | | |
| |
| Washington Mutual Inc. | | 2.1% |
| Finance, U.S. | | |
| |
| Morgan Stanley | | 2.0% |
| Finance, U.S. | | |
| |
| Shell Transport & Trading Co. PLC, ADR | | 2.0% |
| Energy Minerals, U.K. | | |
| |
| Fannie Mae | | 2.0% |
| Finance, U.S. | | |
The dollar value, number of shares or principal amount, and complete legal titles of all portfolio holdings are listed in the Fund’s Statement of Investments.
FGI-2
Our largest sector position was in finance, at 28.2% of total net assets on December 31, 2003. This large allocation benefited the Fund’s absolute returns the most as the sector was up nearly 33%. Within this group, FleetBoston Financial (FBF) and JP Morgan Chase (JPM) were two of the Fund’s best performers. FBF gained 88% largely because of an acquisition bid from Bank of America, and JPM increased 60% as fundamentals improved. Although this was our largest sector, we were underweighted compared with the benchmark index’s 35% allocation. We selectively added to existing positions as well as initiated new positions. Overall, fundamentals were strong within the finance sector, and many companies significantly raised their dividends in recent months.
Some of our investments in energy minerals, non-energy minerals and commercial services were among the largest positive contributors to the Fund’s results for the year. Responding to higher-than-expected oil prices and rapid economic growth in mainland China, energy producer PetroChina gained 106% since we purchased it and was among the Fund’s most rewarding investments. Aluminum producer Alcoa gained 95% since purchase, and printing company R.R. Donnelley & Sons posted a 45% one-year total return. Within electronic technology, our investment in factory equipment company Rockwell Automation (+77%), defense contractor General Dynamics (+57%) and wireless phone company Motorola (+64%) contributed favorably to returns. During the year, we selectively realized profits among these technology and energy related holdings.
An eclectic group of stocks performed well, including filter company Pall (+64%), retailer Nordstrom (+76%) and restaurant chain McDonald’s (+57%). We sold or reduced positions in Nordstrom and McDonald’s as they met our price targets. Honeywell and United Technologies were stand-out performers within the producer manufacturing sector. Honeywell gained 43% and United Technologies rose 55% for the 12-month period.
Although the Fund performed well, we underperformed the benchmark index for several reasons. Utilities accounted for the largest percentage of the Fund’s relative underperformance for the period. Although this group was underweighted, periods of poor performance for specific
stocks in our portfolio, such as Duke Energy and First Energy, overshadowed the group’s otherwise positive returns. Our holdings in the communications sector registered the Fund’s most disappointing results. Shares of AT&T performed especially poorly after the company lowered its earnings outlook and warned that weak trends in recent
FGI-3
periods would persist. On an encouraging note, the company increased its annualized dividend 27% during the year.
Corporations appeared to respond favorably to legislation that lowered taxes on qualified dividends. The number of companies paying dividends increased for the first time in 10 years, with an average increase of 26%, according to Standard & Poor’s. Several companies within our portfolio significantly increased their dividends, most notably Citigroup (+75%), McDonald’s (+70%), and Wells Fargo (+50%).
At fiscal year-end, consistent with our strategy, our investment attention was oriented toward companies we believed were attractively valued and most likely to increase their dividends. These would include “fallen angel” growth companies in sectors such as technology and health care. We also increased our investments in selected finance companies and beaten-up cyclicals that we believe have the potential for a strong earnings recovery. Conversely, we were generally underweighted in consumer and interest rate-sensitive sectors relative to the Russell 1000 Value Index.
Thank you for your participation in Franklin Growth and Income Securities Fund. We look forward to serving your future investment needs.
This discussion reflects our analysis, opinions and portfolio holdings as of December 31, 2003, the end of the reporting period. The way we implement our main investment strategies and the resulting portfolio holdings may change depending on factors such as market and economic conditions. These opinions may not be relied upon as investment advice or an offer for a particular security. The information is not a complete analysis of every aspect of any market, country, industry, security or the Fund. Statements of fact are from sources considered reliable, but the advisor makes no representation or warranty as to their completeness or accuracy. Although historical performance is no guarantee of future results, these insights may help you understand our investment management philosophy.
FGI-4
PERFORMANCE SUMMARYASOF 12/31/03
Total return of Class 2 shares represents the average annual change in value, assuming reinvestment of dividends and capital gains. Average returns smooth out variations in returns, which can be significant; they are not the same as year-by-year results.
Franklin Growth and Income Securities Fund – Class 2*
Periods ended 12/31/03
| | | | | | |
| | | 1-Year | | 5-Year | | 10-Year |
|
| | | |
Average Annual Total Return | | +25.70% | | +4.22% | | +9.72% |
*Because Class 2 shares were not offered until 1/6/99, standardized Class 2 Fund performance for prior periods represents the historical results of Class 1 shares. For periods beginning on 1/6/99, Class 2’s results reflect an additional 12b-1 fee expense, which also affects future performance. Since 1/6/99 (effective date), the average annual total return of Class 2 shares was +3.88%.
Ongoing market volatility can significantly affect short-term performance; recent returns may differ.
Total Return Index Comparison
for Hypothetical $10,000 Investment (1/1/94–12/31/03)
The graph compares the performance of Franklin Growth and Income Securities Fund – Class 2,* the Russell 3000 Value Index, the Russell 1000 Value Index, and the Lipper VIP Equity Income Funds Objective Average, as well as the Consumer Price Index (CPI). The Russell 1000 Value Index is replacing the Russell 3000 Value Index as the Fund’s benchmark. The manager believes the composition of the Russell 1000 Value Index better reflects the Fund’s holdings. One cannot invest directly in an index, nor is an index representative of the Fund’s portfolio. Please see Important Notes to Performance Information preceding the Fund Summaries.
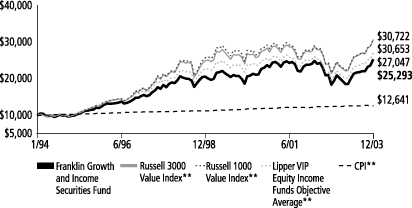
**Sources: Standard & Poor’s Micropal; Lipper Inc. Please see Index Descriptions following the Fund Summaries.
Franklin Growth
and Income Securities Fund – Class 2
Performance reflects the Fund’s Class 2 operating expenses, but does not include any contract fees, expenses or sales charges. If they had been included, performance would be lower. These charges and deductions, particularly for variable life policies, can have a significant effect on contract values and insurance benefits. See the contract prospectus for a complete description of these expenses, including sales charges.
Since markets can go down as well as up, investment return and the value of your principal will fluctuate with market conditions, and you may have a gain or loss when you sell your shares.
Past performance does not guarantee future results.
FGI-5
FRANKLIN TEMPLETON VARIABLE INSURANCE PRODUCTS TRUST
FRANKLIN GROWTHAND INCOME SECURITIES FUND
Financial Highlights
| | | | | | | | | | | | | | | | | | | | |
| | | Class 1
| |
| | | Year ended December 31,
| |
| | | 2003 | | | 2002 | | | 2001 | | | 2000 | | | 1999 | |
| | |
|
|
|
Per share operating performance | | | | | | | | | | | | | | | | | | | | |
(for a share outstanding throughout the year) | | | | | | | | | | | | | | | | | | | | |
Net asset value, beginning of year | | $ | 11.82 | | | $ | 15.27 | | | $ | 17.16 | | | $ | 17.78 | | | $ | 20.36 | |
| | |
|
|
|
Income from investment operations: | | | | | | | | | | | | | | | | | | | | |
Net investment incomea | | | .36 | | | | .39 | | | | .37 | c | | | .45 | | | | .57 | |
Net realized and unrealized gains (losses) | | | 2.66 | | | | (2.58 | ) | | | (.70 | )c | | | 2.26 | | | | (.16 | ) |
| | |
|
|
|
Total from investment operations | | | 3.02 | | | | (2.19 | ) | | | (.33 | ) | | | 2.71 | | | | .41 | |
| | |
|
|
|
Less distributions from: | | | | | | | | | | | | | | | | | | | | |
Net investment income | | | (.40 | ) | | | (.42 | ) | | | (.05 | ) | | | (1.17 | ) | | | (.79 | ) |
Net realized gains | | | — | | | | (.84 | ) | | | (1.51 | ) | | | (2.16 | ) | | | (2.20 | ) |
| | |
|
|
|
Total distributions | | | (.40 | ) | | | (1.26 | ) | | | (1.56 | ) | | | (3.33 | ) | | | (2.99 | ) |
| | |
|
|
|
Net asset value, end of year | | $ | 14.44 | | | $ | 11.82 | | | $ | 15.27 | | | $ | 17.16 | | | $ | 17.78 | |
| | |
|
|
|
| | | | | |
Total returnb | | | 26.06% | | | | (15.53)% | | | | (2.02)% | | | | 17.99% | | | | 1.10% | |
Ratios/supplemental data | | | | | | | | | | | | | | | | | | | | |
Net assets, end of year (000’s) | | $ | 505,393 | | | $ | 455,680 | | | $ | 646,851 | | | $ | 810,837 | | | $ | 964,553 | |
Ratios to average net assets: | | | | | | | | | | | | | | | | | | | | |
Expenses | | | .53% | | | | .53% | | | | .51% | | | | .50% | | | | .49% | |
Net investment income | | | 2.92% | | | | 2.85% | | | | 2.31% | c | | | 2.75% | | | | 2.94% | |
Portfolio turnover rate | | | 43.18% | | | | 96.61% | | | | 119.78% | | | | 66.82% | | | | 39.80% | |
| a | Based on average daily shares outstanding. |
| b | Total return does not include any fees, charges or expenses imposed by the variable annuity and life insurance contracts for which the Franklin Templeton Variable Insurance Products Trust serves as an underlying investment vehicle. Total return is not annualized for periods less than one year. |
| c | Effective January 1, 2001, the Fund adopted the provisions of the AICPA Audit and Accounting Guide of Investment Companies and began amortizing all premium and discount on fixed-income securities, as required. The effect of this change was as follows: |
| | |
Net investment income per share | | $(.026) |
Net realized and unrealized gains (losses) per share | | .026 |
Ratio of net investment income to average net assets | | (0.17)% |
Per share data and ratios for prior periods have not been restated to reflect this change in accounting policy.
FGI-6
FRANKLIN TEMPLETON VARIABLE INSURANCE PRODUCTS TRUST
FRANKLIN GROWTHAND INCOME SECURITIES FUND
Financial Highlights (continued)
| | | | | | | | | | | | | | | | | | | | |
| | | Class 2
| |
| | | Year Ended December 31,
| |
| | | 2003 | | | 2002 | | | 2001 | | | 2000 | | | 1999d | |
| | |
|
|
|
Per share operating performance | | | | | | | | | | | | | | | | | | | | |
(for a share outstanding throughout the year) | | | | | | | | | | | | | | | | | | | | |
Net asset value, beginning of year | | $ | 11.74 | | | $ | 15.20 | | | $ | 17.13 | | | $ | 17.73 | | | $ | 20.71 | |
| | |
|
|
|
Income from investment operations: | | | | | | | | | | | | | | | | | | | | |
Net investment incomea | | | .33 | | | | .34 | | | | .33 | c | | | .40 | | | | 0.47 | |
Net realized and unrealized gains (losses) | | | 2.63 | | | | (2.54 | ) | | | (.70 | )c | | | 2.27 | | | | (0.46 | ) |
| | |
|
|
|
Total from investment operations | | | 2.96 | | | | (2.20 | ) | | | (.37 | ) | | | 2.67 | | | | 0.01 | |
| | |
|
|
|
Less distributions from: | | | | | | | | | | | | | | | | | | | | |
Net investment income | | | (.39 | ) | | | (.42 | ) | | | (.05 | ) | | | (1.11 | ) | | | (0.79 | ) |
Net realized gains | | | — | | | | (.84 | ) | | | (1.51 | ) | | | (2.16 | ) | | | (2.20 | ) |
| | |
|
|
|
Total distributions | | | (.39 | ) | | | (1.26 | ) | | | (1.56 | ) | | | (3.27 | ) | | | (2.99 | ) |
| | |
|
|
|
Net asset value, end of year | | $ | 14.31 | | | $ | 11.74 | | | $ | 15.20 | | | $ | 17.13 | | | $ | 17.73 | |
| | |
|
|
|
| | | | | |
Total returnb | | | 25.70% | | | | (15.72)% | | | | (2.28)% | | | | 17.79% | | | | (0.86)% | |
Ratios/supplemental data | | | | | | | | | | | | | | | | | | | | |
Net assets, end of year (000’s) | | $ | 136,824 | | | $ | 38,379 | | | $ | 11,789 | | | $ | 2,311 | | | $ | 789 | |
Ratios to average net assets: | | | | | | | | | | | | | | | | | | | | |
Expenses | | | .78% | | | | .78% | | | | .76% | | | | .75% | | | | .75% | e |
Net investment income | | | 2.67% | | | | 2.60% | | | | 2.13% | c | | | 2.46% | | | | 2.55% | e |
Portfolio turnover rate | | | 43.18% | | | | 96.61% | | | | 119.78% | | | | 66.82% | | | | 39.80% | |
| a | Based on average daily shares outstanding. |
| b | Total return does not include any fees, charges or expenses imposed by the variable annuity and life insurance contracts for which the Franklin Templeton Variable Insurance Products Trust serves as an underlying investment vehicle. Total return is not annualized for periods less than one year. |
| c | Effective January 1, 2001, the Fund adopted the provisions of the AICPA Audit and Accounting Guide of Investment Companies and began amortizing all premium and discount on fixed-income securities, as required. The effect of this change was as follows: |
| | |
Net investment income per share | | $(.026) |
Net realized and unrealized gains (losses) per share | | .026 |
Ratio of net investment income to average net assets | | (.17)% |
Per share data and ratios for prior periods have not been restated to reflect this change in accounting policy.
| d | For the period January 6, 1999 (effective date) to December 31, 1999. |
See notes to financial statements.
FGI-7
FRANKLIN TEMPLETON VARIABLE INSURANCE PRODUCTS TRUST
FRANKLIN GROWTHAND INCOME SECURITIES FUND
Statement of Investments, December 31, 2003
| | | | | |
| | | SHARES | | VALUE |
|
| | | | | | |
Common Stocks 93.4% | | | | | |
Commercial Services 1.7% | | | | | |
R.R. Donnelley & Sons Co. | | 369,500 | | $ | 11,140,425 |
| | | | |
|
|
Communications 6.4% | | | | | |
Alltel Corp. | | 111,600 | | | 5,198,328 |
AT&T Corp. | | 265,100 | | | 5,381,530 |
BellSouth Corp. | | 354,100 | | | 10,021,030 |
SBC Communications Inc. | | 390,372 | | | 10,176,998 |
Verizon Communications Inc. | | 291,022 | | | 10,209,052 |
| | | | |
|
|
| | | | | | 40,986,938 |
| | | | |
|
|
Consumer Durables 1.6% | | | | | |
Newell Rubbermaid Inc. | | 144,000 | | | 3,278,880 |
Stanley Works | | 194,600 | | | 7,369,502 |
| | | | |
|
|
| | | | | | 10,648,382 |
| | | | |
|
|
Consumer Non-Durables 7.7% | | | | | |
Altria Group Inc. | | 266,600 | | | 14,508,372 |
British American Tobacco PLC (United Kingdom) | | 248,800 | | | 3,429,512 |
Colgate-Palmolive Co. | | 95,500 | | | 4,779,775 |
Kimberly-Clark Corp. | | 199,800 | | | 11,806,182 |
Loews Corp. — Carolina Group | | 129,900 | | | 3,278,676 |
Sara Lee Corp. | | 526,100 | | | 11,421,631 |
| | | | |
|
|
| | | | | | 49,224,148 |
| | | | |
|
|
Consumer Services 2.8% | | | | | |
Dow Jones & Co. Inc. | | 117,300 | | | 5,847,405 |
Mandalay Resort Group | | 101,000 | | | 4,516,720 |
McDonald’s Corp. | | 124,300 | | | 3,086,369 |
The Walt Disney Co. | | 201,300 | | | 4,696,329 |
| | | | |
|
|
| | | | | | 18,146,823 |
| | | | |
|
|
Electronic Technology 7.8% | | | | | |
Diebold Inc. | | 53,500 | | | 2,882,045 |
General Dynamics Corp. | | 106,000 | | | 9,581,340 |
Hewlett-Packard Co. | | 317,100 | | | 7,283,787 |
Motorola Inc. | | 563,900 | | | 7,934,073 |
Nokia Corp., ADR (Finland) | | 271,800 | | | 4,620,600 |
Raytheon Co. | | 277,300 | | | 8,330,092 |
Rockwell Automation Inc. | | 262,300 | | | 9,337,880 |
| | | | |
|
|
| | | | | | 49,969,817 |
| | | | |
|
|
Energy Minerals 10.4% | | | | | |
BP PLC, ADR (United Kingdom) | | 385,100 | | | 19,004,685 |
ChevronTexaco Corp. | | 227,958 | | | 19,693,292 |
Exxon Mobil Corp. | | 222,544 | | | 9,124,304 |
Petrochina Co. Ltd., ADR (China) | | 100,700 | | | 5,744,935 |
Shell Transport & Trading Co. PLC, ADR (United Kingdom) | | 290,300 | | | 13,072,209 |
| | | | |
|
|
| | | | | | 66,639,425 |
| | | | |
|
|
Finance 26.7% | | | | | |
Arthur J. Gallagher & Co. | | 250,300 | | | 8,132,247 |
Bank of America Corp. | | 141,300 | | | 11,364,759 |
Citigroup Inc. | | 468,900 | | | 22,760,406 |
FGI-8
FRANKLIN TEMPLETON VARIABLE INSURANCE PRODUCTS TRUST
FRANKLIN GROWTHAND INCOME SECURITIES FUND
Statement of Investments, December 31, 2003 (cont.)
| | | | | |
| | | SHARES | | VALUE |
|
| | | | | | |
Common Stocks (cont.) | | | | | |
Finance (cont.) | | | | | |
Fannie Mae | | 170,800 | | $ | 12,820,248 |
Fleet Boston Financial Corp. | | 263,600 | | | 11,506,140 |
Jefferson-Pilot Corp. | | 118,300 | | | 5,991,895 |
JP Morgan Chase & Co. | | 330,170 | | | 12,127,144 |
KeyCorp | | 106,400 | | | 3,119,648 |
Marsh & McLennan Cos. Inc. | | 196,700 | | | 9,419,963 |
Morgan Stanley | | 227,200 | | | 13,148,064 |
National Commerce Financial Corp. | | 331,800 | | | 9,051,504 |
Old Republic International Corp. | | 119,400 | | | 3,027,984 |
St. Paul Cos. Inc. | | 300,100 | | | 11,898,965 |
U.S. Bancorp | | 407,500 | | | 12,135,350 |
Washington Mutual Inc. | | 338,300 | | | 13,572,596 |
Wells Fargo & Co. | | 193,500 | | | 11,395,215 |
| | | | |
|
|
| | | | | | 171,472,128 |
| | | | |
|
|
Health Services 1.1% | | | | | |
CIGNA Corp. | | 121,900 | | | 7,009,250 |
| | | | |
|
|
Health Technology 7.9% | | | | | |
Abbott Laboratories | | 162,600 | | | 7,577,160 |
Bristol-Myers Squibb Co. | | 211,100 | | | 6,037,460 |
Merck & Co. Inc. | | 138,000 | | | 6,375,600 |
Pall Corp. | | 293,900 | | | 7,885,337 |
Pfizer Inc. | | 269,300 | | | 9,514,369 |
Schering-Plough Corp. | | 281,000 | | | 4,886,590 |
Wyeth | | 199,200 | | | 8,456,040 |
| | | | |
|
|
| | | | | | 50,732,556 |
| | | | |
|
|
Non-Energy Minerals 1.2% | | | | | |
Alcoa Inc. | | 200,400 | | | 7,615,200 |
| | | | |
|
|
Process Industries 3.8% | | | | | |
Dow Chemical Co. | | 335,400 | | | 13,942,578 |
E.I. du Pont de Nemours & Co. | | 234,200 | | | 10,747,438 |
| | | | |
|
|
| | | | | | 24,690,016 |
| | | | |
|
|
Producer Manufacturing 8.0% | | | | | |
Avery Dennison Corp. | | 83,800 | | | 4,694,476 |
Delphi Corp. | | 560,500 | | | 5,722,705 |
General Electric Co. | | 511,400 | | | 15,843,172 |
Honeywell International Inc. | | 334,200 | | | 11,172,306 |
Pitney Bowes Inc. | | 204,400 | | | 8,302,728 |
United Technologies Corp. | | 59,900 | | | 5,676,723 |
| | | | |
|
|
| | | | | | 51,412,110 |
| | | | |
|
|
Real Estate Investment Trusts .7% | | | | | |
Vornado Realty Trust | | 84,300 | | | 4,615,425 |
| | | | |
|
|
Retail Trade 1.2% | | | | | |
J.C. Penney Co. Inc. | | 287,400 | | | 7,552,872 |
| | | | |
|
|
FGI-9
FRANKLIN TEMPLETON VARIABLE INSURANCE PRODUCTS TRUST
FRANKLIN GROWTHAND INCOME SECURITIES FUND
Statement of Investments, December 31, 2003 (cont.)
| | | | | | |
| | | SHARES | | VALUE |
|
| | | | | | | |
Common Stocks (cont.) | | | | | | |
Technology Services 2.0% | | | | | | |
Automatic Data Processing Inc. | | | 108,900 | | $ | 4,313,529 |
Electronic Data Systems Corp. | | | 188,300 | | | 4,620,882 |
Microsoft Corp. | | | 151,100 | | | 4,161,294 |
| | | | | |
|
|
| | | | | | | 13,095,705 |
| | | | | |
|
|
Utilities 2.4% | | | | | | |
Pinnacle West Capital Corp. | | | 144,900 | | | 5,798,898 |
PPL Corp. | | | 141,400 | | | 6,186,250 |
ScottishPower PLC (United Kingdom) | | | 483,300 | | | 3,220,645 |
| | | | | |
|
|
| | | | | | | 15,205,793 |
| | | | | |
|
|
Total Common Stocks (Cost $474,601,485) | | | | | | 600,157,013 |
| | | | | |
|
|
Convertible Preferred Stocks 3.7% | | | | | | |
Consumer Durables .5% | | | | | | |
Ford Motor Co. Capital Trust II, 6.50%, cvt. pfd. | | | 60,400 | | | 3,373,340 |
| | | | | |
|
|
Finance 1.5% | | | | | | |
Capital One Financial, 6.25%, cvt. pfd. | | | 64,400 | | | 3,099,250 |
Prudential Financial Inc., 6.75%, cvt. pfd. | | | 98,000 | | | 6,379,800 |
| | | | | |
|
|
| | | | | | | 9,479,050 |
| | | | | |
|
|
Retail Trade .9% | | | | | | |
Toys R Us Inc., 6.25%, cvt. pfd. | | | 147,600 | | | 5,896,620 |
| | | | | |
|
|
Utilities .8% | | | | | | |
Sierra Pacific Resources Co., 9.00%, cvt. pfd., PIES | | | 130,100 | | | 4,742,145 |
| | | | | |
|
|
Total Convertible Preferred Stocks (Cost $22,439,640) | | | | | | 23,491,155 |
| | | | | |
|
|
Total Investments before Repurchase Agreement (Cost $497,041,125) | | | | | | 623,648,168 |
| | | | | |
|
|
| | |
| | | PRINCIPAL
AMOUNT
| | |
Repurchase Agreement (Cost $17,132,886) 2.7% | | | | | | |
aJoint Repurchase Agreement, .873%, 01/02/04 (Maturity Value $17,133,717) ABN AMRO Bank, N.V., New York Branch (Maturity Value $1,596,177) Banc of America Securities LLC (Maturity Value $1,596,177) Barclays Capital Inc. (Maturity Value $1,139,906) Bear, Stearns & Co. Inc. (Maturity Value $902,029) BNP Paribas Securities Corp. (Maturity Value $1,596,177) Deutsche Bank Securities Inc. (Maturity Value $1,596,177) Dresdner Kleinwort Wasserstein Securities LLC (Maturity Value $1,596,177) Goldman, Sachs & Co. (Maturity Value $902,028) Greenwich Capital Markets Inc. (Maturity Value $1,596,177) Lehman Brothers Inc. (Maturity Value $1,400,338) Morgan Stanley & Co. Inc. (Maturity Value $1,596,177) UBS Securities LLC (Maturity Value $1,596,177) | | $ | 17,132,886 | | | 17,132,886 |
| | | | | |
|
|
Total Investments (Cost $514,174,011) 99.8% | | | | | | 640,781,054 |
Other Assets, less Liabilities .2% | | | | | | 1,436,032 |
| | | | | |
|
|
Net Assets 100.0% | | | | | $ | 642,217,086 |
| | | | | |
|
|
| a | See Note 1(c) regarding joint repurchase agreement. |
See notes to financial statements.
FGI-10
FRANKLIN TEMPLETON VARIABLE INSURANCE PRODUCTS TRUST
FRANKLIN GROWTHAND INCOME SECURITIES FUND
Financial Statements
Statement of Assets and Liabilities
December 31, 2003
| | | | |
Assets: | | | | |
Investments in securities: | | | | |
Cost | | $ | 514,174,011 | |
| | |
|
|
|
Value | | | 640,781,054 | |
Receivables: | | | | |
Capital shares sold | | | 398,729 | |
Dividends and Interest | | | 1,570,283 | |
| | |
|
|
|
Total assets | | | 642,750,066 | |
| | |
|
|
|
Liabilities: | | | | |
Payables: | | | | |
Capital shares redeemed | | | 168,752 | |
Affiliates | | | 306,078 | |
Custodian fees | | | 1,365 | |
Reports to shareholders | | | 27,000 | |
Other liabilities | | | 29,785 | |
| | |
|
|
|
Total liabilities | | | 532,980 | |
| | |
|
|
|
Net assets, at value | | $ | 642,217,086 | |
| | |
|
|
|
Net assets consist of: | | | | |
Undistributed net investment income | | $ | 15,635,006 | |
Net unrealized appreciation (depreciation) | | | 126,607,043 | |
Accumulated net realized gain (loss) | | | (32,375,338 | ) |
Capital shares | | | 532,350,375 | |
| | |
|
|
|
Net assets, at value | | $ | 642,217,086 | |
| | |
|
|
|
Class 1: | | | | |
Net assets, at value | | $ | 505,393,446 | |
| | |
|
|
|
Shares outstanding | | | 34,999,810 | |
| | |
|
|
|
Net asset value and offering price per share | | $ | 14.44 | |
| | |
|
|
|
Class 2: | | | | |
Net assets, at value | | $ | 136,823,640 | |
| | |
|
|
|
Shares outstanding | | | 9,558,134 | |
| | |
|
|
|
Net asset value and offering price per share | | $ | 14.31 | |
| | |
|
|
|
See notes to financial statements.
FGI-11
FRANKLIN TEMPLETON VARIABLE INSURANCE PRODUCTS TRUST
FRANKLIN GROWTHAND INCOME SECURITIES FUND
Financial Statements (continued)
Statement of Operations
for the year ended December 31, 2003
| | | | |
Investment income: | | | | |
Dividends | | $ | 18,164,780 | |
Interest | | | 287,526 | |
| | |
|
|
|
Total investment income | | | 18,452,306 | |
| | |
|
|
|
Expenses: | | | | |
Management fees (Note 3) | | | 2,657,683 | |
Distribution fees - Class 2 (Note 3) | | | 187,854 | |
Transfer Agent fees | | | 2,259 | |
Custodian fees | | | 4,360 | |
Reports to shareholders | | | 88,695 | |
Professional fees | | | 28,806 | |
Trustees’ fees and expenses | | | 5,243 | |
Other | | | 30,732 | |
| | |
|
|
|
Total expenses | | | 3,005,632 | |
| | |
|
|
|
Net investment income | | | 15,446,674 | |
| | |
|
|
|
Realized and unrealized gains (losses): | | | | |
Net realized gain (loss) from: | | | | |
Investments | | | (8,088,075 | ) |
Foreign currency transactions | | | (30,812 | ) |
| | |
|
|
|
Net realized gain (loss) | | | (8,118,887 | ) |
Net unrealized appreciation (depreciation) on investments | | | 121,978,025 | |
| | |
|
|
|
Net realized and unrealized gain (loss) | | | 113,859,138 | |
| | |
|
|
|
Net increase (decrease) in net assets resulting from operations | | $ | 129,305,812 | |
| | |
|
|
|
See notes to financial statements.
FGI-12
FRANKLIN TEMPLETON VARIABLE INSURANCE PRODUCTS TRUST
FRANKLIN GROWTHAND INCOME SECURITIES FUND
Financial Statements (continued)
Statements of Changes in Net Assets
for the years ended December 31, 2003 and 2002
| | | | | | | | |
| | | 2003 | | | 2002 | |
| | |
| |
Increase (decrease) in net assets: | | | | | | | | |
Operations: | | | | | | | | |
Net investment income | | $ | 15,446,674 | | | $ | 16,487,104 | |
Net realized gain (loss) from investments and foreign currency transactions | | | (8,118,887 | ) | | | (22,388,259 | ) |
Net unrealized appreciation (depreciation) on investments | | | 121,978,025 | | | | (93,969,652 | ) |
| | |
| |
Net increase (decrease) in net assets resulting from operations | | | 129,305,812 | | | | (99,870,807 | ) |
Distributions to shareholders from: | | | | | | | | |
Net investment income: | | | | | | | | |
Class 1 | | | (14,899,120 | ) | | | (17,112,240 | ) |
Class 2 | | | (2,173,929 | ) | | | (789,171 | ) |
Net realized gains: | | | | | | | | |
Class 1 | | | — | | | | (34,010,678 | ) |
Class 2 | | | — | | | | (1,599,783 | ) |
| | |
| |
Total distributions to shareholders | | | (17,073,049 | ) | | | (53,511,872 | ) |
Capital share transactions: (Note 2) | | | | | | | | |
Class 1 | | | (42,683,749 | ) | | | (45,168,545 | ) |
Class 2 | | | 78,608,309 | | | | 33,971,092 | |
| | |
| |
Total capital share transactions | | | 35,924,560 | | | | (11,197,453 | ) |
Net increase (decrease) in net assets | | | 148,157,323 | | | | (164,580,132 | ) |
Net assets: | | | | | | | | |
Beginning of year | | | 494,059,763 | | | | 658,639,895 | |
| | |
| |
End of year | | $ | 642,217,086 | | | $ | 494,059,763 | |
| | |
| |
Undistributed net investment income included in net assets: | | | | | | | | |
End of year | | $ | 15,635,006 | | | $ | 16,876,313 | |
| | |
| |
See notes to financial statements.
FGI-13
FRANKLIN TEMPLETON VARIABLE INSURANCE PRODUCTS TRUST
FRANKLIN GROWTHAND INCOME SECURITIES FUND
Notes to Financial Statements
1. ORGANIZATION AND SIGNIFICANT ACCOUNTING POLICIES
Franklin Templeton Variable Insurance Products Trust (the Trust) is registered under the Investment Company Act of 1940 as an open-end investment company, consisting of twenty-two separate series (the Funds). Franklin Growth and Income Securities Fund (the Fund) included in this report is diversified. Shares of the Fund are sold only to insurance company separate accounts to fund the benefits of variable life insurance policies or variable annuity contracts. As of December 31, 2003, over 87% of total Fund shares were sold through one insurance company. The Fund’s investment objective is current income.
The following summarizes the Fund’s significant accounting policies.
a. Security Valuation
Securities listed or traded on a recognized national exchange or NASDAQ are valued at the last reported sales price. Over-the-counter securities and listed securities for which no sale is reported are valued within the range of the latest quoted bid and asked prices. Foreign securities are valued at the close of trading of the foreign exchange or the NYSE, whichever is earlier. If events occur that materially affect the values of securities after the prices or foreign exchange rates are determined, or if market quotations are not readily available, the securities will be valued at fair value as determined following procedures approved by the Board of Trustees.
b. Foreign Currency Translation
Portfolio securities and other assets and liabilities denominated in foreign currencies are translated into U.S. dollars based on the exchange rate of such currencies against U.S. dollars on the date of valuation. Purchases and sales of securities and income items denominated in foreign currencies are translated into U.S. dollars at the exchange rate in effect on the transaction date.
The Fund does not separately report the effect of changes in foreign exchange rates from changes in market prices on securities held. Such changes are included in net realized and unrealized gain or loss from investments.
Realized foreign exchange gains or losses arise from sales of foreign currencies, currency gains or losses realized between the trade and settlement dates on securities transactions and the difference between the recorded amounts of dividends, interest, and foreign withholding taxes and the U.S. dollar equivalent of the amounts actually received or paid. Net unrealized foreign exchange gains and losses arise from changes in foreign exchange rates on foreign denominated assets and liabilities other than investments in securities held at the end of the reporting period.
c. Joint Repurchase Agreement
The Fund may enter into a joint repurchase agreement whereby its uninvested cash balance is deposited into a joint cash account to be used to invest in one or more repurchase agreements. The value and face amount of the joint repurchase agreement are allocated to the Fund based on its pro-rata interest. A repurchase agreement is accounted for as a loan by the Fund to the seller, collateralized by securities which are delivered to the Fund’s custodian. The market value, including accrued interest, of the initial collateralization is required to be at least 102% of the dollar amount invested by the Funds, with the value of the underlying securities marked to market daily to maintain coverage of at least 100%. At December 31, 2003, all repurchase agreements had been entered into on that date.
d. Foreign Currency Contracts
When the Fund purchases or sells foreign securities it may enter into foreign exchange contracts to minimize foreign exchange risk from the trade date to the settlement date of the transactions. A foreign exchange contract is an agreement between two parties to exchange different currencies at an agreed upon exchange rate on a specified date. Realized and unrealized gains and losses are included in the Statement of Operations.
FGI-14
FRANKLIN TEMPLETON VARIABLE INSURANCE PRODUCTS TRUST
FRANKLIN GROWTHAND INCOME SECURITIES FUND
Notes to Financial Statements (continued)
1. ORGANIZATION AND SIGNIFICANT ACCOUNTING POLICIES (cont.)
The risks of these contracts include movement in the values of the foreign currencies relative to the U.S. dollar and the possible inability of the counterparties to fulfill their obligations under the contracts.
e. Income Taxes
No provision has been made for income taxes because the Fund’s policy is to qualify as a regulated investment company under the Internal Revenue Code and to distribute substantially all of its taxable income.
f. Security Transactions, Investment Income, Expenses and Distributions
Security transactions are accounted for on trade date. Realized gains and losses on security transactions are determined on a specific identification basis. Interest income and estimated expenses are accrued daily. Discounts and premiums on securities purchased are amortized over the lives of the respective securities. Dividend income and distributions to shareholders are recorded on the ex-dividend date.
Common expenses incurred by the Trust are allocated among the Funds based on the ratio of net assets of each Fund to the combined net assets. Other expenses are charged to each Fund on a specific identification basis.
Realized and unrealized gains and losses and net investment income, other than class specific expenses, are allocated daily to each class of shares based upon the relative proportion of net assets of each class.
g. Accounting Estimates
The preparation of financial statements in accordance with accounting principles generally accepted in the United States of America requires management to make estimates and assumptions that affect the reported amounts of assets and liabilities at the date of the financial statements and the amounts of income and expenses during the reporting period. Actual results could differ from those estimates.
h. Guarantees and Indemnifications
Under the Trust’s organizational documents, its officers and trustees are indemnified against certain liability arising out of the performance of their duties to the Trust. Additionally, in the normal course of business, the Trust enters into contracts with service providers that contain general indemnification clauses. The Trust’s maximum exposure under these arrangements is unknown as this would involve future claims that may be made against the Trust that have not yet occurred. However, based on experience, the Trust expects the risk of loss to be remote.
FGI-15
FRANKLIN TEMPLETON VARIABLE INSURANCE PRODUCTS TRUST
FRANKLIN GROWTHAND INCOME SECURITIES FUND
Notes to Financial Statements (continued)
2. SHARES OF BENEFICIAL INTEREST
The Fund offers two classes of shares: Class 1 and 2. Each class of shares differs by its distribution fees, voting rights on matters affecting a single class and its exchange privilege.
At December 31, 2003, there were an unlimited number of shares authorized ($.01 par value). Transactions in the Fund’s shares were as follows:
| | | | | | | | | | | | | | |
| | | Year Ended December 31,
| |
| | | 2003
| | | 2002
| |
| Class 1 Shares: | | Shares
| | | Amount
| | | Shares
| | | Amount
| |
Shares sold | | 2,360,924 | | | $ | 28,273,066 | | | 545,381 | | | $ | 8,254,474 | |
Shares issued on mergera | | — | | | | — | | | 1,625,533 | | | | 25,081,974 | |
Shares issued in reinvestment of distributions | | 1,175,936 | | | | 14,899,120 | | | 3,683,207 | | | | 51,122,918 | |
Shares redeemed | | (7,072,721 | ) | | | (85,855,935 | ) | | (9,675,660 | ) | | | (129,627,911 | ) |
| | |
| |
Net decrease (decrease) | | (3,535,861 | ) | | $ | (42,683,749 | ) | | (3,821,539 | ) | | $ | (45,168,545 | ) |
| | |
| |
| Class 2 Shares: | | | | | | | | | | | | |
Shares sold | | 6,534,882 | | | $ | 81,389,712 | | | 2,734,254 | | | $ | 36,986,172 | |
Shares issued on mergera | | — | | | | — | | | 429,930 | | | | 6,599,428 | |
Shares issued in reinvestment of distributions | | 172,808 | | | | 2,173,929 | | | 173,113 | | | | 2,388,954 | |
Shares redeemed | | (417,670 | ) | | | (4,955,332 | ) | | (844,623 | ) | | | (12,003,462 | ) |
| | |
| |
Net increase (decrease) | | 6,290,020 | | | $ | 78,608,309 | | | 2,492,674 | | | $ | 33,971,092 | |
| | |
| |
| a | On May 1, 2002, the Fund acquired the net assets of Franklin Templeton Variable Insurance Products Trust — Franklin Natural Resources Fund (Natural Resources) in a taxable exchange pursuant to a plan of reorganization approved by Natural Resources’ shareholders. |
3. TRANSACTIONS WITH AFFILIATES
Certain officers and trustees of the Fund are also officers and/or directors of the following entities:
| | |
| Entity | | Affiliation |
|
Franklin Templeton Services LLC (FT Services) | | Administrative manager |
Franklin Advisers Inc. (Advisers) | | Investment manager |
Franklin/Templeton Distributors Inc. (Distributors) | | Principal underwriter |
Franklin/Templeton Investor Services LLC (Investor Services) | | Transfer agent |
The Fund pays an investment management fee to Advisers based on the average daily net assets of the Fund as follows:
| | |
| Annualized Fee Rate | | Net Assets |
|
| .625% | | First $100 million |
| .500% | | over $100 million, up to and including $250 million |
| .450% | | over $250 million, up to and including $10 billion |
Fees are further reduced on net assets over $10 billion.
Under an agreement with Advisers, FT Services provides administrative services to the Fund. The fee is paid by Advisers based on the average daily net assets, and is not an additional expense of the Fund.
The Fund reimburses Distributors up to .25% per year of its average daily net assets of Class 2 for costs incurred in marketing the Fund’s shares.
Investor Services, under terms of an agreement, performs shareholder servicing for the Fund and is not paid by the Fund for the services.
FGI-16
FRANKLIN TEMPLETON VARIABLE INSURANCE PRODUCTS TRUST
FRANKLIN GROWTHAND INCOME SECURITIES FUND
Notes to Financial Statements (continued)
4. INCOME TAXES
At December 31, 2003, the Fund had tax basis capital losses of $28,255,601 which may be carried over to offset future capital gains. Such losses expire as follows:
| | | |
Capital loss carryovers expiring in: | | | |
2010 | | $ | 16,950,178 |
2011 | | | 11,305,423 |
| | |
|
|
| | | $ | 28,255,601 |
| | |
|
|
At December 31, 2003, the Fund has deferred currency losses occurring subsequent to October 31, 2003 of $32,639. For tax purposes, such losses will be reflected in the year ending December 31, 2004.
The tax character of distributions paid during the years ended December 31, 2003 and 2002, was as follows:
| | | | | | |
| | | 2003
| | 2002
|
Distributions paid from: | | | | | | |
Ordinary income | | $ | 17,073,049 | | $ | 17,935,266 |
Long term capital gains | | | — | | | 35,576,606 |
| | |
|
|
| | | $ | 17,073,049 | | $ | 53,511,872 |
| | |
|
|
At December 31, 2003, the cost of investments, net unrealized appreciation (depreciation), undistributed ordinary income and undistributed long term capital gains for income tax purposes were as follows:
| | | | |
Cost of investments | | $ | 518,261,111 | |
| | |
|
|
|
Unrealized appreciation | | | 125,551,172 | |
Unrealized depreciation | | | (3,031,229 | ) |
| | |
|
|
|
Net unrealized appreciation (depreciation) | | $ | 122,519,943 | |
| | |
|
|
|
Undistributed ordinary income | | $ | 15,635,006 | |
Undistributed long term capital gains | | | — | |
| | |
|
|
|
Distributable earnings | | $ | 15,635,006 | |
| | |
|
|
|
Net investment income differs for financial statement and tax purposes primarily due to differing treatments of foreign currency transactions and bond discounts and premiums.
Net realized losses differ for financial statement and tax purposes primarily due to differing treatments of wash sales, foreign currency transactions and bond discounts and premiums.
5. INVESTMENT TRANSACTIONS
Purchases and sales of investments (excluding short-term securities) for the year ended December 31, 2003 aggregated $252,279,525 and $223,349,623, respectively.
FGI-17
FRANKLIN TEMPLETON VARIABLE INSURANCE PRODUCTS TRUST
FRANKLIN GROWTHAND INCOME SECURITIES FUND
Notes to Financial Statements (continued)
6. REGULATORY MATTERS
On February 4, 2004, the Securities Division of the Office of the Secretary of the Commonwealth of Massachusetts filed an administrative complaint against Franklin Resources, Inc. and certain of its subsidiaries (the “Company”), alleging violations of the Massachusetts Uniform Securities Act. The complaint arises from activity that occurred in 2001 during which time an officer of a Company subsidiary was negotiating an agreement with an investor relating to investments in a mutual fund and a hedge fund.
The Company, in addition to other entities within Franklin Templeton Investments, has been named in shareholder class actions related to the matter described above. The Company believes that the claims made in the lawsuit are without merit and it intends to defend vigorously against the allegations. The Company and the Fund may be named in similar civil actions related to the matter described above.
In addition, as part of ongoing investigations by the U.S. Securities and Exchange Commission (the “SEC”), the U.S. Attorney for the Northern District of California, the New York Attorney General, the California Attorney General, the U.S. Attorney for the District of Massachusetts, the Florida Department of Financial Services, and the Commissioner of Securities and the Attorney General of the State of West Virginia relating to certain practices in the mutual fund industry, including late trading, market timing and sales compensation arrangements, the Company and its subsidiaries, as well as certain current or former executives and employees of the Company, have received requests for information and/or subpoenas to testify or produce documents. The Company and its current employees are providing documents and information in response to these requests and subpoenas. In addition, the Company has responded to requests for similar kinds of information from regulatory authorities in some of the foreign countries where the Company conducts its global asset management business.
The Staff of the SEC has informed the Company that it intends to recommend that the Commission authorize an action against the Fund’s investment adviser and a senior executive officer relating to the frequent trading issues that are the subject of the SEC’s investigation. These issues were previously disclosed as being under investigation by government authorities and the subject of an internal inquiry by the Company in its Annual Report on Form 10-K and on its public website. The Company currently is in discussions with the SEC Staff in an effort to resolve the issues raised in their investigation. Such discussions are preliminary and the Fund’s management has been advised that the Company cannot predict the likelihood of whether those discussions will result in a settlement and, if so, the terms of such settlement. The impact, if any, of these matters on the Fund is uncertain at this time. If the Company finds that it bears responsibility for any unlawful or improper conduct, it has committed to making the Fund or its shareholders whole, as appropriate.
FGI-18
FRANKLIN TEMPLETON VARIABLE INSURANCE PRODUCTS TRUST
FRANKLIN GROWTHAND INCOME SECURITIES FUND
Independent Auditors’ Report
To the Board of Trustees and Shareholders of
Franklin Templeton Variable Insurance Products Trust
In our opinion, the accompanying statement of assets and liabilities, including the statement of investments, and the related statements of operations and of changes in net assets and the financial highlights present fairly, in all material respects, the financial position of the Franklin Growth and Income Securities Fund (the Fund) (one of the funds constituting the Franklin Templeton Variable Insurance Products Trust) at December 31, 2003, the results of its operations for the year then ended, the changes in its net assets for each of the two years in the period then ended and the financial highlights for each of the periods presented, in conformity with accounting principles generally accepted in the United States of America. These financial statements and financial highlights (hereafter referred to as “financial statements”) are the responsibility of the Fund’s management; our responsibility is to express an opinion on these financial statements based on our audits. We conducted our audits of these financial statements in accordance with auditing standards generally accepted in the United States of America, which require that we plan and perform the audits to obtain reasonable assurance about whether the financial statements are free of material misstatement. An audit includes examining, on a test basis, evidence supporting the amounts and disclosures in the financial statements, assessing the accounting principles used and significant estimates made by management, and evaluating the overall financial statement presentation. We believe that our audits, which included confirmation of securities at December 31, 2003 by correspondence with the custodian and brokers, provide a reasonable basis for our opinion.
PricewaterhouseCoopers LLP
San Francisco, California
February 5, 2004, except for Note 6 as to which the date is February 12, 2004
FGI-19
FRANKLIN TEMPLETON VARIABLE INSURANCE PRODUCTS TRUST
FRANKLIN GROWTHAND INCOME SECURITIES FUND
Tax Designation (unaudited)
Under Section 854(b)(2) of the Code, the Fund hereby designates 84.88% of the ordinary income dividends as income qualifying for the dividends received deduction for the fiscal year ended December 31, 2003.
FGI-20
FRANKLIN HIGH INCOME FUND
Fund Goals and Primary Investments: Franklin High Income Fund seeks a high level of current income, with capital appreciation as a secondary goal. The Fund invests mainly in debt securities, including lower-rated “junk bonds,” offering high yield and expected total return. The Fund may also invest in foreign securities, including emerging markets.
We are pleased to bring you Franklin High Income Fund’s annual report for the fiscal year ended December 31, 2003.
Performance Overview
You can find the Fund’s one-year total return in the Performance Summary following this report. The Fund outperformed its benchmark, the Credit Suisse First Boston (CSFB) High Yield Index, which returned 27.94% for the year under review.1
Economic and Market Overview
During the year ended December 31, 2003, many factors impacted global economies and financial markets. Early in the year, economic uncertainty and geopolitical events, including impending war in Iraq, pushed U.S. interest rates to their lowest level in more than four decades, and the 10-year U.S. Treasury note’s yield fell to 3.13% in mid-June. However, following the end of major conflict in Iraq, many economic indicators turned positive. In the U.S., third quarter 2003 gross domestic product (GDP) grew an annualized 8.2%, its strongest pace in nearly 20 years. Overall, 2003 GDP grew an estimated 3.1%. The U.S. trade deficit increased significantly, contributing to the U.S. dollar’s fall to record lows against the euro and other major currencies during the year. However, the weak dollar provided a boost to the U.S. economy and corporate profits as exports became cheaper for foreign buyers. Robust consumer spending, especially for autos and homes, and a rebound in business spending, particularly for equipment and software, contributed to the accelerated economic activity. In addition, U.S. federal spending stayed firm and inflation remained benign. As economic data improved, some interest rates rose from their lows, and the 10-year Treasury note’s yield ended the period at 4.27%.
Foreign economies also showed signs of recovery and benign inflation following a low growth and disinflationary environment that facilitated monetary easing in many major economies during the reporting period. While economic growth accelerated in the U.S., it remained strong in
1. Source: Credit Suisse First Boston. One cannot invest directly in an index, nor is an index representative of the Fund’s portfolio. Please see Index Descriptions following the Fund Summaries.
Top 10 Sectors/Industries
Franklin High Income Fund
Based on Total Net Assets
12/31/03
| | |
| |
| Consumer Services | | 19.0% |
| |
| Communications | | 12.6% |
| |
| Process Industries | | 12.1% |
| |
| Producer Manufacturing | | 7.3% |
| |
| Industrial Services | | 7.1% |
| |
| Utilities | | 6.6% |
| |
| Health Services | | 4.9% |
| |
| Consumer Durables | | 4.0% |
| |
| Electronic Technology | | 3.6% |
| |
| Transportation | | 2.9% |
The dollar value, number of shares or principal amount, and complete legal titles of all portfolio holdings are listed in the Fund’s Statement of Investments.
FH-1
Asia, and was weak, yet positive, in Europe. Despite these signs of economic recovery, benign inflationary trends continued, supported by cyclical productivity gains and excess capacity in labor and capital.
Investment Strategy
The primary criteria we use for selecting securities are yield and expected return. We search for securities we believe offer opportunities for income today and growth tomorrow. We perform independent analysis of the corporate debt securities being considered for the Fund’s portfolio, rather than relying principally on the ratings assigned by rating agencies. In our analysis, we consider a variety of factors: a security’s relative value based on such factors as anticipated cash flow, interest or dividend coverage, asset coverage and earnings prospects; the experience and strength of a company’s management; the company’s sensitivity to changes in interest rates and business conditions; the company’s debt maturity schedules and borrowing requirements; and the company’s changing financial condition and market recognition of the change.
Manager’s Discussion
The Fund’s outperformance relative to the CSFB High Yield Index was driven primarily by advantageous industry weightings. For example, the Fund was overweighted in the wireless communications industry versus the benchmark index.2 Because this industry delivered some of the high yield market’s highest returns in 2003, our relatively overweighted allocation enhanced the Fund’s relative and absolute performance during the year. Conversely, textiles was one of 2003’s poorest performing industries represented in the index. The Fund had no exposure to this industry during the reporting period, which helped relative performance.
Security selection also benefited relative performance throughout 2003. Utilities was among the top-performing sectors during the year, and certain of the Fund’s utilities positions outperformed the sector, contributing to the Fund’s relative outperformance. Fund holdings AES Corp., Aquila and Calpine each outperformed the overall utilities sector and the CSFB High Yield Index for the year.
2. Wireless communications holdings are part of the communications sector in the Statement of Investments.
FH-2
Although overall portfolio positioning enhanced the Fund’s performance, certain industry weightings had a negative impact. Our weightings versus the index in broadcasting, telecommunications and cable hindered relative performance.4 The Fund was generally overweighted in broadcasting during the year, but this industry’s performance trailed that of the overall high yield market as measured by the index; therefore, the Fund’s performance was negatively impacted. On the other hand, the Fund’s relatively underweighted positions in telecommunications and cable during the year constrained the Fund’s relative return because these industries were among the top performing for 2003.
Thank you for your participation in Franklin High Income Fund. We look forward to serving your future investment needs.
4. Broadcasting and cable holdings are part of the consumer services sector in the Statement of Investments. Telecommunications holdings are part of the communications sector.
This discussion reflects our analysis, opinions and portfolio holdings as of December 31, 2003, the end of the reporting period. The way we implement our main investment strategies and the resulting portfolio holdings may change depending on factors such as market and economic conditions. These opinions may not be relied upon as investment advice or an offer for a particular security. The information is not a complete analysis of every aspect of any market, country, industry, security or the Fund. Statements of fact are from sources considered reliable, but the advisor makes no representation or warranty as to their completeness or accuracy. Although historical performance is no guarantee of future results, these insights may help you understand our investment management philosophy.
FH-3
PERFORMANCE SUMMARYASOF 12/31/03
Total return of Class 2 shares represents the average annual change in value, assuming reinvestment of dividends and capital gains. Average returns smooth out variations in returns, which can be significant; they are not the same as year-by-year results.
Franklin High Income Fund – Class 2*
Periods ended 12/31/03
| | | | | | |
| | | 1-Year | | 5-Year | | 10-Year |
|
| | | |
Average Annual Total Return | | +31.18% | | +1.26% | | +4.80% |
*Because Class 2 shares were not offered until 1/6/99, standardized Class 2 Fund performance for prior periods represents the historical results of Class 1 shares. For periods beginning on 1/6/99, Class 2’s results reflect an additional 12b-1 fee expense, which also affects future performance. Since 1/6/99 (effective date), the average annual total return of Class 2 shares was +1.15%.
Ongoing market volatility can significantly affect short-term performance; recent returns may differ.
Total Return Index Comparison
for Hypothetical $10,000 Investment (1/1/94–12/31/03)
The graph compares the performance of Franklin High Income Fund – Class 2* and the CSFB High Yield Index. One cannot invest directly in an index, nor is an index representative of the Fund’s portfolio. Please see Important Notes to Performance Information preceding the Fund Summaries.
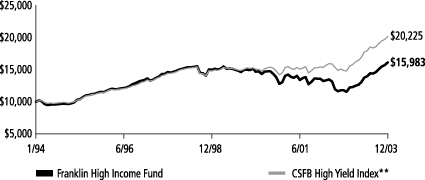
**Source: Credit Suisse First Boston. Please see Index Descriptions following the Fund Summaries.
Franklin High Income Fund – Class 2
Performance reflects the Fund’s Class 2 operating expenses, but does not include any contract fees, expenses or sales charges. If they had been included, performance would be lower. These charges and deductions, particularly for variable life policies, can have a significant effect on contract values and insurance benefits. See the contract prospectus for a complete description of these expenses, including sales charges.
Since markets can go down as well as up, investment return and the value of your principal will fluctuate with market conditions, and you may have a gain or loss when you sell your shares.
FH-4
Past performance does not guarantee future results.
FRANKLIN TEMPLETON VARIABLE INSURANCE PRODUCTS TRUST
FRANKLIN HIGH INCOME FUND
Financial Highlights
| | | | | | | | | | | | | | | | | | | | |
| | | Class 1
| |
| | | Year Ended December 31,
| |
| | | 2003 | | | 2002 | | | 2001 | | | 2000 | | | 1999 | |
| | |
|
|
|
Per share operating performance | | | | | | | | | | | | | | | | | | | | |
(for a share outstanding throughout the year) | | | | | | | | | | | | | | | | | | | | |
| | | | | |
Net asset value, beginning of year | | $ | 5.67 | | | $ | 7.44 | | | $ | 8.54 | | | $ | 9.86 | | | $ | 13.28 | |
| | |
|
|
|
Income from investment operations: | | | | | | | | | | | | | | | | | | | | |
Net investment incomea | | | .51 | | | | .63 | | | | .87 | c | | | 1.08 | | | | 1.24 | |
Net realized and unrealized gains (losses) | | | 1.21 | | | | (1.30 | ) | | | (.50 | )c | | | (2.36 | ) | | | (1.19 | ) |
| | |
|
|
|
Total from investment operations | | | 1.72 | | | | (.67 | ) | | | .37 | | | | (1.28 | ) | | | .05 | |
| | |
|
|
|
Less distributions from: | | | | | | | | | | | | | | | | | | | | |
Net investment income | | | (.58 | ) | | | (1.10 | ) | | | (1.47 | ) | | | (.04 | ) | | | (3.03 | ) |
Net realized gains | | | — | | | | — | | | | — | | | | — | | | | (.44 | ) |
| | |
|
|
|
Total distributions | | | (.58 | ) | | | (1.10 | ) | | | (1.47 | ) | | | (.04 | ) | | | (3.47 | ) |
| | |
|
|
|
Net asset value, end of year | | $ | 6.81 | | | $ | 5.67 | | | $ | 7.44 | | | $ | 8.54 | | | $ | 9.86 | |
| | |
|
|
|
| | | | | |
Total returnb | | | 31.50% | | | | (9.55)% | | | | 4.26% | | | | (13.00)% | | | | (.07)% | |
Ratios/supplemental data | | | | | | | | | | | | | | | | | | | | |
Net assets, end of year (000’s) | | $ | 136,218 | | | $ | 111,746 | | | $ | 151,924 | | | $ | 189,986 | | | $ | 314,131 | |
Ratios to average net assets: | | | | | | | | | | | | | | | | | | | | |
Expenses | | | .62% | | | | .63% | | | | .62% | | | | .57% | | | | .54% | |
Net investment income | | | 8.19% | | | | 9.92% | | | | 10.63% | c | | | 11.43% | | | | 9.97% | |
Portfolio turnover rate | | | 52.01% | | | | 56.01% | | | | 30.03% | | | | 20.37% | | | | 22.17% | |
| a | Based on average daily shares outstanding. |
| b | Total return does not include any fees, charges or expenses imposed by the variable annuity and life insurance contracts for which the Franklin Templeton Variable Insurance Products Trust serves as an underlying investment vehicle. Total return is not annualized for periods less than one year. |
| c | Effective January 1, 2001, the Fund adopted the provisions of the AICPA Audit and Accounting Guide of Investment Companies and began amortizing all premium and discount on fixed-income securities, as required. The effect of this change was as follows: |
| | |
Net investment income per share | | $(.004) |
New realized and unrealized gains (losses) per share | | .004 |
Ratio of net investment income to average net assets | | (.05)% |
Per share data and ratios for prior periods have not been restated to reflect this change in accounting policy.
FH-5
FRANKLIN TEMPLETON VARIABLE INSURANCE PRODUCTS TRUST
FRANKLIN HIGH INCOME FUND
Financial Highlights (continued)
| | | | | | | | | | | | | | | | | | | | |
| | | Class 2
| |
| | | Year Ended December 31,
| |
| | | 2003 | | | 2002 | | | 2001 | | | 2000 | | | 1999d | |
| | |
|
|
|
Per share operating performance | | | | | | | | | | | | | | | | | | | | |
(for a share outstanding throughout the year) | | | | | | | | | | | | | | | | | | | | |
| | | | | |
Net asset value, beginning of year | | $ | 5.62 | | | $ | 7.41 | | | $ | 8.50 | | | $ | 9.83 | | | $ | 13.36 | |
| | |
|
|
|
Income from investment operations: | | | | | | | | | | | | | | | | | | | | |
Net investment incomea | | | .48 | | | | .56 | | | | .84 | c | | | 1.04 | | | | 1.11 | |
Net realized and unrealized gains (losses) | | | 1.21 | | | | (1.25 | ) | | | (.48 | )c | | | (2.33 | ) | | | (1.18 | ) |
| | |
|
|
|
Total from investment operations | | | 1.69 | | | | (.69 | ) | | | .36 | | | | (1.29 | ) | | | (.07 | ) |
| | |
|
|
|
Less distributions from: | | | | | | | | | | | | | | | | | | | | |
Net investment income | | | (.58 | ) | | | (1.10 | ) | | | (1.45 | ) | | | (.04 | ) | | | (3.02 | ) |
Net realized gains | | | — | | | | — | | | | — | | | | — | | | | (.44 | ) |
| | |
|
|
|
Total distributions | | | (.58 | ) | | | (1.10 | ) | | | (1.45 | ) | | | (.04 | ) | | | (3.46 | ) |
| | |
|
|
|
Net asset value, end of year | | $ | 6.73 | | | $ | 5.62 | | | $ | 7.41 | | | $ | 8.50 | | | $ | 9.83 | |
| | |
|
|
|
| | | | | |
Total returnb | | | 31.18% | | | | (9.96)% | | | | 4.18% | | | | (13.15)% | | | | (0.96)% | |
Ratios/supplemental data | | | | | | | | | | | | | | | | | | | | |
Net assets, end of year (000’s) | | $ | 58,681 | | | $ | 7,326 | | | $ | 832 | | | $ | 432 | | | $ | 448 | |
Ratios to average net assets: | | | | | | | | | | | | | | | | | | | | |
Expenses | | | .87% | | | | .88% | | | | .87% | | | | .82% | | | | .80% | e |
Net investment income | | | 7.94% | | | | 9.67% | | | | 10.39% | c | | | 11.16% | | | | 9.51% | e |
Portfolio turnover rate | | | 52.01% | | | | 56.01% | | | | 30.03% | | | | 20.37% | | | | 22.17% | |
| a | Based on average daily shares outstanding. |
| b | Total return does not include any fees, charges or expenses imposed by the variable annuity and life insurance contracts for which the Franklin Templeton Variable Insurance Products Trust serves as an underlying investment vehicle. Total return is not annualized for periods less than one year. |
| c | Effective January 1, 2001, the Fund adopted the provisions of the AICPA Audit and Accounting Guide of Investment Companies and began amortizing all premium and discount on fixed-income securities, as required. The effect of this change was as follows: |
| | |
Net investment income per share | | $(.004) |
New realized and unrealized gains (losses) per share | | .004 |
Ratio of net investment income to average net assets | | (.05)% |
Per share data and ratios for prior periods have not been restated to reflect this change in accounting policy.
| d | For the period January 6, 1999 (effective date) to December 31, 1999. |
See notes to financial statements.
FH-6
FRANKLIN TEMPLETON VARIABLE INSURANCE PRODUCTS TRUST
FRANKLIN HIGH INCOME FUND
Statement of Investments, December 31, 2003
| | | | | | | | |
| | | COUNTRY | | PRINCIPAL AMOUNTf | | VALUE |
|
Bonds 90.2% | | | | | | | | |
Commercial Services 2.0% | | | | | | | | |
American Color Graphics, senior secured note, 144A, 10.00%, 6/15/10 | | United States | | $ | 1,700,000 | | $ | 1,751,000 |
Johnsondiversey Hold Inc., senior disc. note, 144A, zero cpn. to 5/15/07, 10.67% thereafter, 5/15/13 | | United States | | | 2,800,000 | | | 2,156,000 |
aKey3Media Group Inc., senior sub. note, 11.25%, 6/15/11 | | United States | | | 2,000,000 | | | 20,000 |
| | | | | | | |
|
|
| | | | | | | | | 3,927,000 |
| | | | | | | |
|
|
Communications 10.3% | | | | | | | | |
Crown Castle International Corp., senior note, 9.375%, 8/01/11 | | United States | | | 1,000,000 | | | 1,115,000 |
Dobson Communications, senior note, 144A, 8.875%, 10/01/13 | | United States | | | 2,000,000 | | | 2,035,000 |
Nexstar Finance Inc., senior sub. note, 144A, 7.00%, 1/15/14 | | United States | | | 2,000,000 | | | 2,020,000 |
Nextel Communications Inc., senior note, 7.375%, 8/01/15 | | United States | | | 2,000,000 | | | 2,160,000 |
Nextel Partners Inc., senior note, 11.00%, 3/15/10 | | United States | | | 1,000,000 | | | 1,112,500 |
Nextel Partners Inc., senior note, 8.125%, 7/01/11 | | United States | | | 1,000,000 | | | 1,070,000 |
Nortel Networks Corp., 6.875%, 9/01/23 | | Canada | | | 2,300,000 | | | 2,196,500 |
Rural Cellular Corp., senior note, 9.875%, 2/01/10 | | United States | | | 2,000,000 | | | 2,140,000 |
Time Warner Telecom Inc., senior note, 10.125%, 2/01/11 | | United States | | | 2,100,000 | | | 2,247,000 |
Triton PCS Inc., senior note, 8.50%, 6/01/13 | | United States | | | 2,000,000 | | | 2,160,000 |
US West Communications Inc., 6.875%, 9/15/33 | | United States | | | 2,000,000 | | | 1,910,000 |
| | | | | | | |
|
|
| | | | | | | | | 20,166,000 |
| | | | | | | |
|
|
Consumer Durables 4.0% | | | | | | | | |
D.R. Horton Inc., senior note, 8.50%, 4/15/12 | | United States | | | 2,000,000 | | | 2,270,000 |
General Motors, 8.25%, 7/15/23 | | United States | | | 2,000,000 | | | 2,276,638 |
Norcraft Cos. LP, senior sub. note, 144A, 9.00%, 11/01/11 | | United States | | | 1,100,000 | | | 1,193,500 |
Sealy Mattress Co., senior sub. disc. note, B, 10.875%, 12/15/07 | | United States | | | 2,000,000 | | | 2,085,000 |
| | | | | | | |
|
|
| | | | | | | | | 7,825,138 |
| | | | | | | |
|
|
Consumer Non-Durables 2.3% | | | | | | | | |
Armkel Finance Inc., senior sub. note, 9.50%, 8/15/09 | | United States | | | 1,000,000 | | | 1,102,500 |
Philip Morris Cos. Inc., 7.75%, 1/15/27 | | United States | | | 1,500,000 | | | 1,622,953 |
Smithfield Foods Inc., senior note, 7.75%, 5/15/13 | | United States | | | 1,700,000 | | | 1,776,500 |
aStyling Technology Corp., senior sub. note, 10.875%, 7/01/08 | | United States | | | 3,000,000 | | | 12,780 |
| | | | | | | |
|
|
| | | | | | | | | 4,514,733 |
| | | | | | | |
|
|
Consumer Services 19.0% | | | | | | | | |
a,bAdelphia Communications Corp., senior note, 10.25%, 6/15/11 | | United States | | | 2,500,000 | | | 2,375,000 |
Advanstar Communications, senior secured note, 144A, 10.75%, 8/15/10 | | United States | | | 1,500,000 | | | 1,631,250 |
Aztar Corp., senior sub. note, 8.875%, 5/15/07 | | United States | | | 1,000,000 | | | 1,048,750 |
Aztar Corp., senior sub. note, 9.00%, 8/15/11 | | United States | | | 500,000 | | | 551,250 |
aCallahan NordRhein-Westfalen, senior note, 14.00%, 7/15/10 | | United States | | | 2,750,000 | | | 182,188 |
Chancellor Media Corp., senior note, 8.00%, 11/01/08 | | United States | | | 700,000 | | | 813,750 |
Charter Communications Holdings II, senior note, 144A, 10.25%, 9/15/10 | | United States | | | 2,500,000 | | | 2,637,500 |
Coast Hotel & Casino Inc., senior sub. note, 9.50%, 4/01/09 | | United States | | | 1,500,000 | | | 1,593,750 |
Dex Media Inc., senior note, 144A, 8.00%, 11/15/13 | | United States | | | 500,000 | | | 527,500 |
Dex Media West LLC, senior sub. note, 144A, 9.875% 8/15/13 | | United States | | | 1,500,000 | | | 1,751,250 |
Diamond Holdings PLC, senior note, 9.125%, 2/01/08 | | United Kingdom | | | 1,500,000 | | | 1,558,125 |
DIRECTV Holdings/Finance, senior note, 8.375%, 3/15/13 | | United States | | | 2,000,000 | | | 2,330,000 |
EchoStar DBS Corp., senior note, 10.375%, 10/01/07 | | United States | | | 1,500,000 | | | 1,651,875 |
EchoStar DBS Corp., senior note, 144A, 6.375%, 10/01/11 | | United States | | | 2,000,000 | | | 2,060,000 |
Gaylord Entertainment Co, senior note, 144A, 8.00%, 11/15/03 | | United States | | | 500,000 | | | 530,000 |
Granite Broadcasting Corp., senior sub. note, 10.375%, 5/15/05 | | United States | | | 1,500,000 | | | 1,505,625 |
FH-7
FRANKLIN TEMPLETON VARIABLE INSURANCE PRODUCTS TRUST
FRANKLIN HIGH INCOME FUND
Statement of Investments, December 31, 2003 (cont.)
| | | | | | | | |
| | | COUNTRY | | PRINCIPAL AMOUNTf | | VALUE |
|
Bonds (cont.) | | | | | | | | |
Consumer Services (cont.) | | | | | | | | |
Hollywood Park, senior sub. note, B, 9.25%, 2/15/07 | | United States | | $ | 1,875,000 | | $ | 1,950,000 |
Lin Television Corp., senior sub. note, 144A, 6.50%, 5/15/13 | | United States | | | 2,015,000 | | | 2,025,075 |
Park Place Entertainment Corp., senior sub. note 7.875%, 3/15/10 | | United States | | | 2,000,000 | | | 2,225,000 |
Royal Caribbean Cruises Ltd., senior note, 8.00%, 5/15/10 | | United States | | | 800,000 | | | 876,000 |
Royal Caribbean Cruises Ltd., senior note, 6.875%, 12/01/13 | | United States | | | 1,200,000 | | | 1,215,000 |
Six Flags Inc., senior note, 8.875%, 2/01/10 | | United States | | | 1,700,000 | | | 1,753,125 |
Station Casinos Inc., senior sub. note, 9.875%, 7/01/10 | | United States | | | 1,400,000 | | | 1,547,000 |
Vivendi Universal, senior note, 144A, 9.25%, 4/15/10 | | France | | | 700,000 | | | 833,000 |
Yell Finance BV, senior disc. note, zero cpn. to 8/01/06, 13.50% thereafter, 8/01/11 | | United Kingdom | | | 1,282,000 | | | 1,185,850 |
Young Broadcasting Inc., senior sub. note, 144A, 8.75%, 1/15/14 | | United States | | | 700,000 | �� | | 712,250 |
| | | | | | | |
|
|
| | | | | | | | | 37,070,113 |
| | | | | | | |
|
|
Electronic Technology 3.6% | | | | | | | | |
Be Aerospace, senior note, 144A, 8.50%, 10/01/10 | | United States | | | 1,500,000 | | | 1,616,250 |
Flextronics International Ltd., senior sub. note, 6.50%, 5/15/13 | | Singapore | | | 2,000,000 | | | 2,080,000 |
ON Semiconductor Corp., 13.00%, 5/15/08 | | United States | | | 2,000,000 | | | 2,330,000 |
Vought Aircraft Industries, senior note, 144A, Inc., 8.00%, 7/15/11 | | United States | | | 1,000,000 | | | 1,026,250 |
| | | | | | | |
|
|
| | | | | | | | | 7,052,500 |
| | | | | | | |
|
|
Energy Minerals 2.8% | | | | | | | | |
Arch Western Finance, senior note, 144A, 6.75%, 7/01/13 | | United States | | | 1,800,000 | | | 1,858,500 |
Peabody Energy Corp., senior note, B, 6.875%, 3/15/13 | | United States | | | 1,300,000 | | | 1,378,000 |
Williams Cos., senior note, 8.625%, 6/01/10 | | United States | | | 2,000,000 | | | 2,255,000 |
| | | | | | | |
|
|
| | | | | | | | | 5,491,500 |
| | | | | | | |
|
|
Finance .5% | | | | | | | | |
Western Financial Bank-FSB, sub. deb., 9.625%, 5/15/12 | | United States | | | 800,000 | | | 896,000 |
| | | | | | | |
|
|
Health Services 4.1% | | | | | | | | |
Alliance Imaging Inc., senior sub. note, 10.375%, 4/15/11 | | United States | | | 2,000,000 | | | 2,130,000 |
HealthSouth Corp., senior note, 8.50%, 2/01/08 | | United States | | | 1,600,000 | | | 1,544,000 |
a,bMagellan Health Services Inc., senior sub. note, 9.00%, 2/15/08 | | United States | | | 2,750,000 | | | 2,048,750 |
United Surgical Partners, senior sub. note, 10.00%, 12/15/11 | | United States | | | 2,000,000 | | | 2,280,000 |
| | | | | | | |
|
|
| | | | | | | | | 8,002,750 |
| | | | | | | |
|
|
Industrial Services 7.0% | | | | | | | | |
a,dAll Star Gas Corp., senior note, 11.00%, 6/30/03 | | United States | | | 2,085,834 | | | 292,017 |
Allied Waste North America Inc., senior secured note, 144A, 6.50%, 11/15/10 | | United States | | | 2,000,000 | | | 2,060,000 |
Grant Prideco Escrow, senior note, 9.00%, 12/15/09 | | United States | | | 2,000,000 | | | 2,210,000 |
Great Lakes Dredge & Dock, senior sub. note, 144A, 7.75%, 12/15/13 | | United States | | | 300,000 | | | 310,125 |
Gulfterra Energy Partners, senior sub. note, 10.625%, 12/01/12 | | United States | | | 1,000,000 | | | 1,245,000 |
Hanover Equipment Trust 01, senior secured note, B, 8.75%, 9/01/11 | | United States | | | 2,000,000 | | | 2,130,000 |
SESI L.L.C., senior note, 8.875%, 5/15/11 | | United States | | | 1,500,000 | | | 1,642,500 |
Universal Compression Inc., senior note, 7.25%, 5/15/10 | | United States | | | 2,000,000 | | | 2,090,000 |
URS Corp., senior sub. note, 12.25%, 5/01/09 | | United States | | | 1,600,000 | | | 1,718,000 |
| | | | | | | |
|
|
| | | | | | | | | 13,697,642 |
| | | | | | | |
|
|
Non-Energy Minerals 1.2% | | | | | | | | |
Century Aluminum Co., first mortgage, 11.75%, 4/15/08 | | United States | | | 2,000,000 | | | 2,240,000 |
| | | | | | | |
|
|
FH-8
FRANKLIN TEMPLETON VARIABLE INSURANCE PRODUCTS TRUST
FRANKLIN HIGH INCOME FUND
Statement of Investments, December 31, 2003 (cont.)
| | | | | | | | |
| | | COUNTRY | | PRINCIPAL AMOUNTf | | VALUE |
|
Bonds (cont.) | | | | | | | | |
Process Industries 12.0% | | | | | | | | |
Doane Pet Care Co., senior sub. note, 9.75%, 5/15/07 | | United States | | $ | 957,000 | | $ | 861,300 |
Georgia-Pacific Corp., 8.125%, 5/15/11 | | United States | | | 2,000,000 | | | 2,210,000 |
Graham Packaging Co., senior sub. note, B, 8.75%, 1/15/08 | | United States | | | 2,000,000 | | | 2,055,000 |
HMP Equity Holdings Corp., 144A, zero cpn., 5/15/08 | | United States | | | 2,200,000 | | | 1,353,000 |
Huntsman ICI Chemicals, senior disc. note, zero cpn., 12/31/09 | | United States | | | 1,800,000 | | | 877,500 |
IMC Global Inc., senior note, 144A, 10.875%, 8/01/13 | | United States | | | 1,500,000 | | | 1,650,000 |
Jefferson Smurfit Corp., senior note, 7.50%, 6/01/13 | | United States | | | 2,000,000 | | | 2,100,000 |
Lyondell Chemical Co., senior secured note, 10.50%, 6/01/13 | | United States | | | 2,000,000 | | | 2,190,000 |
MDP Acquisitions PLC, senior note, 9.625%, 10/01/12 | | Irish Republic | | | 2,000,000 | | | 2,250,000 |
Nalco Company, senior sub. note, 144A, 8.875%, 11/15/13 | | United States | | | 1,000,000 | | | 1,065,000 |
Owens-Illinois Inc., senior note, 7.80%, 5/15/18 | | United States | | | 1,500,000 | | | 1,558,125 |
aPolysindo International Finance Co. BV, secured note, 9.375%, 7/30/07 | | Indonesia | | | 4,250,000 | | | 403,750 |
Pliant Corp., senior sub. note, 13.00%, 6/01/10 | | United States | | | 2,000,000 | | | 1,840,000 |
Resolution Performance Products, senior note, 9.50%, 4/15/10 | | United States | | | 1,400,000 | | | 1,428,000 |
aTjiwi Kimia Finance Mauritius, senior note, 10.00%, 8/01/04 | | Indonesia | | | 2,000,000 | | | 650,000 |
United Industries Corp., senior sub. note, 9.875%, 4/01/09 | | United States | | | 900,000 | | | 947,250 |
| | | | | | | |
|
|
| | | | | | | | | 23,438,925 |
| | | | | | | |
|
|
Producer Manufacturing 7.3% | | | | | | | | |
Case New Holland Inc., senior note, 144A, 9.25%, 8/01/11 | | United States | | | 2,000,000 | | | 2,250,000 |
Fimep SA, senior note, 10.50%, 2/15/13 | | France | | | 2,000,000 | | | 2,333,500 |
aGoss Graphic Systems Inc., 12.25%, 11/19/05 | | United States | | | 1,912,374 | | | — |
H&E Equipment/Finance, 11.125%, 6/15/12 | | United States | | | 2,000,000 | | | 2,020,000 |
Hexcel Corp., senior sub. note, 9.75%, 1/15/99 | | United States | | | 1,300,000 | | | 1,368,250 |
Joy Global Inc., senior sub. note, 8.75%, 3/15/12 | | United States | | | 1,500,000 | | | 1,680,000 |
Motors & Gears, senior note, 10.75%, 11/15/06 | | United States | | | 2,000,000 | | | 1,710,000 |
TRW Automotive Inc., senior note, 9.375%, 2/15/13 | | United States | | | 1,400,000 | | | 1,606,500 |
TRW Automotive Inc., senior sub. note, 11.00%, 2/15/13 | | United States | | | 300,000 | | | 354,750 |
Westinghouse Air Brake, senior note, 144A, 6.875%, 7/31/13 | | United States | | | 800,000 | | | 833,000 |
| | | | | | | |
|
|
| | | | | | | | | 14,156,000 |
| | | | | | | |
|
|
Real Estate Development .9% | | | | | | | | |
Forest City Enterprises., senior note, 7.625%, 6/01/15 | | United States | | | 1,700,000 | | | 1,812,625 |
| | | | | | | |
|
|
Real Estate Investment Trusts 2.7% | | | | | | | | |
Corrections Corp. of America, senior note, 9.875%, 5/01/09 | | United States | | | 1,400,000 | | | 1,569,750 |
Corrections Corp. of America, senior note, 7.50%, 5/01/11 | | United States | | | 300,000 | | | 316,500 |
Corrections Corp. of America, senior note, 144A, 7.50%, 5/01/11 | | United States | | | 200,000 | | | 211,000 |
Host Marriott LP, senior note, 9.50%, 1/15/07 | | United States | | | 1,500,000 | | | 1,676,250 |
Meristar Hospitality Corp., senior note, 10.50%, 6/15/09 | | United States | | | 1,300,000 | | | 1,417,000 |
| | | | | | | |
|
|
| | | | | | | | | 5,190,500 |
| | | | | | | |
|
|
Retail Trade 1.0% | | | | | | | | |
Rite Aid Corp., senior note, 144A, 6.125%, 12/15/08 | | United States | | | 2,000,000 | | | 1,910,000 |
| | | | | | | |
|
|
Transportation 2.9% | | | | | | | | |
American Airlines, 9.71%, 1/02/07 | | United States | | | 1,512,541 | | | 1,375,467 |
CP Ships Ltd., senior note, 10.375%, 7/15/12 | | United Kingdom | | | 1,500,000 | | | 1,747,500 |
aHolt Group Inc., senior note, 9.75%, 1/15/06 | | United States | | | 5,250,000 | | | 157,500 |
Laidlaw International Inc., senior note, 144A, 10.75%, 6/15/11 | | United States | | | 2,000,000 | | | 2,270,000 |
| | | | | | | |
|
|
| | | | | | | | | 5,550,467 |
| | | | | | | |
|
|
FH-9
FRANKLIN TEMPLETON VARIABLE INSURANCE PRODUCTS TRUST
FRANKLIN HIGH INCOME FUND
Statement of Investments, December 31, 2003 (cont.)
| | | | | | | | |
| | | COUNTRY | | PRINCIPAL AMOUNTf | | VALUE |
|
Bonds (cont.) | | | | | | | | |
Utilities 6.6% | | | | | | | | |
AES Corp., senior secured note, 144A, 9.00%, 5/15/15 | | United States | | $ | 2,000,000 | | $ | 2,270,000 |
Aquila Inc., 14.875%, 7/01/12 | | United States | | | 2,000,000 | | | 2,685,000 |
Calpine Canada Energy Finance, senior note, 8.50%, 5/01/08 | | United States | | | 1,000,000 | | | 802,500 |
Calpine Corp., senior secured note, 144A, 8.75%, 7/15/13 | | United States | | | 1,500,000 | | | 1,470,000 |
CMS Energy Corp., senior note, 7.50%, 1/15/09 | | United States | | | 2,000,000 | | | 2,070,000 |
Dynegy Holdings Inc., senior note, 8.75%, 2/15/12 | | United States | | | 2,300,000 | | | 2,331,625 |
PG&E Corp., senior secured note, 144A, 6.875%, 7/15/08 | | United States | | | 1,100,000 | | | 1,196,250 |
| | | | | | | |
|
|
| | | | | | | | | 12,825,375 |
| | | | | | | |
|
|
Total Bonds (Cost $183,394,415) | | | | | | | | 175,767,268 |
| | | | | | | |
|
|
Convertible Bond (Cost $153,566) .4% | | | | | | | | |
Communications | | | | | | | | |
Millicom International Cellular SA, senior note, cvt., PIK, 144A, 2.00%, 6/01/06 | | Luxembourg | | | 129,000 | | | 840,435 |
| | | | | | | |
|
|
| | | |
| | | | | SHARES/ WARRANTS
| | |
Common Stocks and Warrants 1.9% | | | | | | | | |
Communications 1.8% | | | | | | | | |
cArch Wireless Inc., A | | United States | | | 1,321 | | | 26,156 |
cCall-Net Enterprises Inc., B | | Canada | | | 47,553 | | | 190,212 |
cDobson Communications Corp. | | United States | | | 78,146 | | | 513,419 |
cICG Communications Inc. | | United States | | | 10,694 | | | 70,580 |
cICG Communications Inc., wts., 10/10/07 | | United States | | | 1,772 | | | 665 |
cICO Global Communications Holdings Ltd. | | United States | | | 300,767 | | | 153,391 |
cICO Global Communications Holdings Ltd., wts., 5/16/06 | | United States | | | 75,546 | | | 377 |
International Wireless Communications Holdings Inc. | | United States | | | 377,088 | | | 75,418 |
cLoral Space & Communications Ltd., wts., 1/15/07 | | United States | | | 1,500 | | | 15 |
cMetrocall Holdings Inc. | | United States | | | 23,100 | | | 1,686,300 |
cNII Holdings Inc., B | | United States | | | 9,569 | | | 714,135 |
c,dPoland Telecom Finance, wts., 144A, 12/01/07 | | Poland | | | 8,000 | | | — |
cXO Communications Inc. | | United States | | | 4,875 | | | 28,033 |
cXO Communications Inc., wts., A, 1/16/10 | | United States | | | 9,749 | | | 19,010 |
cXO Communications Inc., wts., B, 1/16/10 | | United States | | | 7,312 | | | 12,430 |
cXO Communications Inc., wts., C, 1/16/10 | | United States | | | 7,312 | | | 8,043 |
| | | | | | | |
|
|
| | | | | | | | | 3,498,184 |
| | | | | | | |
|
|
Consumer Services | | | | | | | | |
cJack in the Box Inc. | | United States | | | 210 | | | 4,486 |
| | | | | | | |
|
|
Industrial Services .1% | | | | | | | | |
cTransocean Inc., wts., 144A, 5/01/09 | | United States | | | 1,500 | | | 214,500 |
| | | | | | | |
|
|
Producer Manufacturing | | | | | | | | |
cGoss Holdings Inc., B | | United States | | | 44,604 | | | — |
| | | | | | | |
|
|
Utilities | | | | | | | | |
c,dEmpire Gas Corp., wts., 7/15/04 | | United States | | | 6,900 | | | — |
| | | | | | | |
|
|
Total Common Stocks and Warrants (Cost $12,099,763) | | | | | | | | 3,717,170 |
| | | | | | | |
|
|
Preferred Stocks .9% | | | | | | | | |
Communications | | | | | | | | |
Metrocall Holdings Inc., 15.00%, pfd., A | | United States | | | 2,787 | | | 32,329 |
| | | | | | | |
|
|
FH-10
FRANKLIN TEMPLETON VARIABLE INSURANCE PRODUCTS TRUST
FRANKLIN HIGH INCOME FUND
Statement of Investments, December 31, 2003 (cont.)
| | | | | | | | |
| | | COUNTRY | | SHARES | | VALUE |
|
Preferred Stocks (cont.) | | | | | | | | |
Health Services .8% | | | | | | | | |
Fresenius Medical Care Capital Trust II, 7.875% | | Germany | | | 1,500,000 | | $ | 1,608,750 |
| | | | | | | |
|
|
Process Industries .1% | | | | | | | | |
aAsia Pulp & Paper Co. Ltd., 12.00%, pfd. | | Indonesia | | | 4,500,000 | | | 78,750 |
| | | | | | | |
|
|
Total Preferred Stocks (Cost $5,958,119) | | | | | | | | 1,719,829 |
| | | | | | | |
|
|
Convertible Preferred Stock (Cost $246,000) .1% | | | | | | | | |
Communications | | | | | | | | |
Dobson Communications Corp., 6.00%, cvt. pfd. | | United States | | | 1,500 | | | 270,000 |
| | | | | | | |
|
|
Total Investments before Repurchase Agreement (Cost $201,851,863) | | | | | | | | 182,314,702 |
| | | | | | | |
|
|
| | | |
| | | | | PRINCIPAL AMOUNTf
| | |
Repurchase Agreement (Cost $9,119,002) 4.7% | | | | | | | | |
eJoint Repurchase Agreement, .873%, 01/02/04 (Maturity Value $9,119,444) | | United States | | $ | 9,119,002 | | | 9,119,002 |
ABN AMRO Bank, N.V., New York Branch (Maturity Value $849,567) Banc of America Securities LLC (Maturity Value $849,567) Barclays Capital Inc. (Maturity Value $606,720) Bear, Stearns & Co. Inc. (Maturity Value $485,428) BNP Paribas Securities Corp. (Maturity Value $849,567) Deutsche Bank Securities Inc. (Maturity Value $849,567) Dresdner Kleinwort Wasserstein Securities LLC (Maturity Value $849,567) Goldman, Sachs & Co. (Maturity Value $485,428) Greenwich Capital Markets Inc. (Maturity Value $849,567) Lehman Brothers Inc. (Maturity Value $745,332) Morgan Stanley & Co. Inc. (Maturity Value $849,567) UBS Securities LLC (Maturity Value $849,567) | | | | | | | | |
| | | | | | | |
|
|
Total Investments (Cost $210,970,865) 98.2% | | | | | | | | 191,433,704 |
Other Assets, less Liabilities 1.8% | | | | | | | | 3,465,842 |
| | | | | | | |
|
|
Net Assets 100.0% | | | | | | | $ | 194,899,546 |
| | | | | | | |
|
|
| a | The fund discontinues accruing income on defaulted securities. See Note 6. |
| b | See Note 8 regarding other considerations. |
| d | See Note 7 regarding restricted securities. |
| e | See Note 1(c) regarding joint repurchase agreement. |
| f | The principal amount is stated in U.S. dollars unless otherwise indicated. |
FH-11
FRANKLIN TEMPLETON VARIABLE INSURANCE PRODUCTS TRUST
FRANKLIN HIGH INCOME FUND
Financial Statements
Statement of Assets and Liabilities
December 31, 2003
| | | | |
Assets: | | | | |
Investments in securities: | | | | |
Cost | | $ | 210,970,865 | |
| | |
|
|
|
Value | | | 191,433,704 | |
Cash | | | 1,630 | |
Receivables: | | | | |
Investment securities sold | | | 89,063 | |
Capital shares sold | | | 218,224 | |
Dividends and Interest | | | 3,454,480 | |
| | |
|
|
|
Total assets | | | 195,197,101 | |
| | |
|
|
|
Liabilities: | | | | |
Payables: | | | | |
Capital shares redeemed | | | 160,607 | |
Affiliates | | | 113,053 | |
Other liabilities | | | 23,895 | |
| | |
|
|
|
Total liabilities | | | 297,555 | |
| | |
|
|
|
Net assets, at value | | $ | 194,899,546 | |
| | |
|
|
|
Net assets consist of: | | | | |
Undistributed net investment income | | $ | 8,905,397 | |
Net unrealized appreciation (depreciation) | | | (19,537,161 | ) |
Accumulated net realized gain (loss) | | | (114,469,548 | ) |
Capital shares | | | 320,000,858 | |
| | |
|
|
|
Net assets, at value | | $ | 194,899,546 | |
| | |
|
|
|
Class 1: | | | | |
Net assets, at value | | $ | 136,218,322 | |
| | |
|
|
|
Shares outstanding | | | 19,998,888 | |
| | |
|
|
|
Net asset value and offering price per share | | $ | 6.81 | |
| | |
|
|
|
Class 2: | | | | |
Net assets, at value | | $ | 58,681,224 | |
| | |
|
|
|
Shares outstanding | | | 8,713,217 | |
| | |
|
|
|
Net asset value and offering price per share | | $ | 6.73 | |
| | |
|
|
|
See notes to financial statements.
FH-12
FRANKLIN TEMPLETON VARIABLE INSURANCE PRODUCTS TRUST
FRANKLIN HIGH INCOME FUND
Financial Statements (continued)
Statement of Operations
for the year ended December 31, 2003
| | | | |
Investment income: | | | | |
Dividends | | $ | 296,012 | |
Interest | | | 12,749,130 | |
| | |
|
|
|
Total investment income | | | 13,045,142 | |
| | |
|
|
|
Expenses: | | | | |
Management fees (Note 3) | | | 864,304 | |
Distribution fees - Class 2 (Note 3) | | | 64,841 | |
Transfer agent fees | | | 844 | |
Custodian fees | | | 1,402 | |
Reports to shareholders | | | 20,110 | |
Professional fees | | | 15,497 | |
Trustees’ fees and expenses | | | 1,367 | |
Other | | | 11,795 | |
| | |
|
|
|
Total expenses | | | 980,160 | |
| | |
|
|
|
Net investment income | | | 12,064,982 | |
| | |
|
|
|
Realized and unrealized gains (losses): | | | | |
Net realized gain (loss) from investments | | | (13,030,110 | ) |
Net unrealized appreciation (depreciation) on investments | | | 41,254,872 | |
| | |
|
|
|
Net realized and unrealized gain (loss) | | | 28,224,762 | |
| | |
|
|
|
Net increase (decrease) in net assets resulting from operations | | $ | 40,289,744 | |
| | |
|
|
|
See notes to financial statements.
FH-13
FRANKLIN TEMPLETON VARIABLE INSURANCE PRODUCTS TRUST
FRANKLIN HIGH INCOME FUND
Financial Statements (continued)
Statements of Changes in Net Assets
for the years ended December 31, 2003 and 2002
| | | | | | | | |
| | | 2003 | | | 2002 | |
| | |
| |
Increase (decrease) in net assets: | | | | | | | | |
Operations: | | | | | | | | |
Net investment income | | $ | 12,064,982 | | | $ | 12,719,902 | |
Net realized gain (loss) from investments and foreign currrency transactions | | | (13,030,110 | ) | | | (55,072,152 | ) |
Net unrealized appreciation (depreciation) on investments | | | 41,254,872 | | | | 29,111,763 | |
| | |
| |
Net increase (decrease) in net assets resulting from operations | | | 40,289,744 | | | | (13,240,487 | ) |
Distributions to shareholders from: | | | | | | | | |
Net investment income: | | | | | | | | |
Class 1 | | | (11,192,157 | ) | | | (19,700,643 | ) |
Class 2 | | | (2,049,901 | ) | | | (340,095 | ) |
| | |
| |
Total distributions to shareholders | | | (13,242,058 | ) | | | (20,040,738 | ) |
Capital share transactions: (Note 2) | | | | | | | | |
Class 1 | | | 2,030,563 | | | | (7,270,704 | ) |
Class 2 | | | 46,749,559 | | | | 6,868,444 | |
| | |
| |
Total capital share transactions | | | 48,780,122 | | | | (402,260 | ) |
Net increase (decrease) in net assets | | | 75,827,808 | | | | (33,683,485 | ) |
Net assets: | | | | | | | | |
Beginning of year | | | 119,071,738 | | | | 152,755,223 | |
| | |
| |
End of year | | $ | 194,899,546 | | | $ | 119,071,738 | |
| | |
| |
Undistributed net investment income included in net assets: | | | | | | | | |
End of year | | $ | 8,905,397 | | | $ | 10,080,163 | |
| | |
| |
See notes to financial statements.
FH-14
FRANKLIN TEMPLETON VARIABLE INSURANCE PRODUCTS TRUST
FRANKLIN HIGH INCOME FUND
Notes to Financial Statements
1. ORGANIZATION AND SIGNIFICANT ACCOUNTING POLICIES
Franklin Templeton Variable Insurance Products Trust (the Trust) is registered under the Investment Company Act of 1940 as an open-end investment company, consisting of twenty-two separate series (the Funds). Franklin High Income Fund (the Fund) included in this report is diversified. Shares of the Fund are sold only to insurance company separate accounts to fund the benefits of variable life insurance policies or variable annuity contracts. As of December 31, 2003, 100% of total Fund shares were sold through one insurance company. The Fund’s investment objective is current income.
The following summarizes the Fund’s significant accounting policies.
a. Security Valuation
Securities listed or traded on a recognized national exchange or NASDAQ are valued at the last reported sales price. Over-the-counter securities and listed securities for which no sale is reported are valued within the range of the latest quoted bid and asked prices. Foreign securities are valued at the close of trading of the foreign exchange or the NYSE, whichever is earlier. If events occur that materially affect the values of securities after the prices or foreign exchange rates are determined, or if market quotations are not readily available, the securities will be valued at fair value as determined following procedures approved by the Board of Trustees.
b. Foreign Currency Translation
Portfolio securities and other assets and liabilities denominated in foreign currencies are translated into U.S. dollars based on the exchange rate of such currencies against U.S. dollars on the date of valuation. Purchases and sales of securities and income items denominated in foreign currencies are translated into U.S. dollars at the exchange rate in effect on the transaction date.
The Fund does not separately report the effect of changes in foreign exchange rates from changes in market prices on securities held. Such changes are included in net realized and unrealized gain or loss from investments.
Realized foreign exchange gains or losses arise from sales of foreign currencies, currency gains or losses realized between the trade and settlement dates on securities transactions and the difference between the recorded amounts of dividends, interest, and foreign withholding taxes and the U.S. dollar equivalent of the amounts actually received or paid. Net unrealized foreign exchange gains and losses arise from changes in foreign exchange rates on foreign denominated assets and liabilities other than investments in securities held at the end of the reporting period.
c. Joint Repurchase Agreement
The Fund may enter into a joint repurchase agreement whereby its uninvested cash balance is deposited into a joint cash account to be used to invest in one or more repurchase agreements. The value and face amount of the joint repurchase agreement are allocated to the Fund based on its pro-rata interest. A repurchase agreement is accounted for as a loan by the Fund to the seller, collateralized by securities which are delivered to the Fund’s custodian. The market value, including accrued interest, of the initial collateralization is required to be at least 102% of the dollar amount invested by the Funds, with the value of the underlying securities marked to market daily to maintain coverage of at least 100%. At December 31, 2003, all repurchase agreements had been entered into on that date.
d. Foreign Currency Contracts
When the Fund purchases or sells foreign securities it may enter into foreign exchange contracts to minimize foreign exchange risk from the trade date to the settlement date of the transactions. A foreign exchange contract is an agreement between two parties to exchange different currencies at an agreed upon exchange rate on a specified date. Realized and unrealized gains and losses are included in the Statement of Operations.
FH-15
FRANKLIN TEMPLETON VARIABLE INSURANCE PRODUCTS TRUST
FRANKLIN HIGH INCOME FUND
Notes to Financial Statements (continued)
1. ORGANIZATION AND SIGNIFICANT ACCOUNTING POLICIES (cont.)
The risks of these contracts include movement in the values of the foreign currencies relative to the U.S. dollar and the possible inability of the counterparties to fulfill their obligations under the contracts.
e. Income Taxes
No provision has been made for income taxes because the Fund’s policy is to qualify as a regulated investment company under the Internal Revenue Code and to distribute substantially all of its taxable income.
f. Security Transactions, Investment Income, Expenses and Distributions
Security transactions are accounted for on trade date. Realized gains and losses on security transactions are determined on a specific identification basis. Interest income and estimated expenses are accrued daily. Discounts and premiums on securities purchased are amortized over the lives of the respective securities. Dividend income and distributions to shareholders are recorded on the ex-dividend date.
Common expenses incurred by the Trust are allocated among the Funds based on the ratio of net assets of each Fund to the combined net assets. Other expenses are charged to each Fund on a specific identification basis.
Realized and unrealized gains and losses and net investment income, other than class specific expenses, are allocated daily to each class of shares based upon the relative proportion of net assets of each class.
g. Accounting Estimates
The preparation of financial statements in accordance with accounting principles generally accepted in the United States of America requires management to make estimates and assumptions that affect the reported amounts of assets and liabilities at the date of the financial statements and the amounts of income and expenses during the reporting period. Actual results could differ from those estimates.
h. Guarantees and Indemnifications
Under the Trust’s organizational documents, its officers and trustees are indemnified against certain liability arising out of the performance of their duties to the Trust. Additionally, in the normal course of business, the Trust enters into contracts with service providers that contain general indemnification clauses. The Trust’s maximum exposure under these arrangements is unknown as this would involve future claims that may be made against the Trust that have not yet occurred. However, based on experience, the Trust expects the risk of loss to be remote.
FH-16
FRANKLIN TEMPLETON VARIABLE INSURANCE PRODUCTS TRUST
FRANKLIN HIGH INCOME FUND
Notes to Financial Statements (continued)
2. SHARES OF BENEFICIAL INTEREST
The Fund offers two classes of shares: Class 1 and 2. Each class of shares differs by its distribution fees, voting rights on matters affecting a single class and its exchange privilege.
At December 31, 2003, there were an unlimited number of shares authorized ($.01 par value). Transactions in the Fund’s shares were as follows:
| | | | | | | | | | | | | | |
| | | Year Ended December 31,
| |
| | | 2003
| | | 2002
| |
| Class 1 Shares: | | Shares
| | | Amount
| | | Shares
| | | Amount
| |
Shares sold | | 11,487,433 | | | $ | 71,330,100 | | | 8,163,015 | | | $ | 51,125,305 | |
Shares issued in reinvestment of distributions | | 1,828,784 | | | | 11,192,157 | | | 3,333,442 | | | | 19,700,643 | |
Shares redeemed | | (13,033,894 | ) | | | (80,491,694 | ) | | (12,198,620 | ) | | | (78,096,652 | ) |
| | |
| |
Net decrease (decrease) | | 282,323 | | | $ | 2,030,563 | | | (702,163 | ) | | $ | (7,270,704 | ) |
| | |
| |
| Class 2 Shares: | | | | | | | | | | | | |
Shares sold | | 9,104,383 | | | $ | 56,921,673 | | | 2,136,319 | | | $ | 13,142,002 | |
Shares issued in reinvestment of distributions | | 338,268 | | | | 2,049,901 | | | 57,938 | | | | 340,095 | |
Shares redeemed | | (2,032,596 | ) | | | (12,222,015 | ) | | (1,003,347 | ) | | | (6,613,653 | ) |
| | |
| |
Net increase (decrease) | | 7,410,055 | | | $ | 46,749,559 | | | 1,190,910 | | | $ | 6,868,444 | |
| | |
| |
3. TRANSACTIONS WITH AFFILIATES
Certain officers and trustees of the Fund are also officers and/or directors of the following entities:
| | |
| Entity | | Affiliation |
|
Franklin Templeton Services LLC (FT Services) | | Administrative manager |
Franklin Advisers Inc. (Advisers) | | Investment manager |
Franklin/Templeton Distributors Inc. (Distributors) | | Principal underwriter |
Franklin/Templeton Investor Services LLC (Investor Services) | | Transfer agent |
The Fund pays an investment management fee to Advisers based on the average daily net assets of the Fund as follows:
| | |
| Annualized Fee Rate | | Net Assets |
|
| .625% | | First $100 million |
| .500% | | over $100 million, up to and including $250 million |
| .450% | | over $250 million, up to and including $10 billion |
Fees are further reduced on net assets over $10 billion.
Under an agreement with Advisers, FT Services provides administrative services to the Fund. The fee is paid by Advisers based on the average daily net assets, and is not an additional expense of the Fund.
The Fund reimburses Distributors up to .25% per year of its average daily net assets of Class 2 for costs incurred in marketing the Fund’s shares.
Investor Services, under terms of an agreement, performs shareholder servicing for the Fund and is not paid by the Fund for the services.
FH-17
FRANKLIN TEMPLETON VARIABLE INSURANCE PRODUCTS TRUST
FRANKLIN HIGH INCOME FUND
Notes to Financial Statements (continued)
4. INCOME TAXES
At December 31, 2003, the Fund had tax basis capital losses of $114,469,549 which may be carried over to offset future capital gains. Such losses expire as follows:
| | | |
Capital loss carryovers expiring in: | | | |
2007 | | $ | 2,294,320 |
2008 | | | 26,944,467 |
2009 | | | 14,152,532 |
2010 | | | 46,366,314 |
2011 | | | 24,711,916 |
| | |
|
|
| | | $ | 114,469,549 |
| | |
|
|
The tax character of distributions paid during the years ended December 31, 2003 and 2002, was as follows:
| | | | | | |
| | | 2003
| | 2002
|
Distributions paid from: | | | | | | |
Ordinary income | | $ | 13,242,058 | | $ | 20,040,738 |
| | |
|
At December 31, 2003, the cost of investments, net unrealized appreciation (depreciation), undistributed ordinary income and undistributed long term capital gains for income tax purposes were as follows:
| | | | |
Cost of investments | | $ | 211,401,718 | |
| | |
|
|
|
Unrealized appreciation | | $ | 16,787,252 | |
Unrealized depreciation | | | (36,755,266 | ) |
| | |
|
|
|
Net unrealized appreciation (depreciation) | | $ | (19,968,014 | ) |
| | |
|
|
|
Undistributed ordinary income | | $ | 10,338,269 | |
Undistributed long term capital gains | | | — | |
| | |
|
|
|
Distributable earnings | | $ | 10,338,269 | |
| | |
|
|
|
Net investment income and net realized gains and losses differ for financial statement and tax purposes primarily due to differing treatments of defaulted securities, foreign currency transactions and bond discounts and premiums.
5. INVESTMENT TRANSACTIONS
Purchases and sales of investments (excluding short-term securities) for the year ended December 31, 2003 aggregated $117,456,874 and $73,277,170, respectively.
6. CREDIT RISK AND DEFAULTED SECURITIES
The Fund has 89.6% of its portfolio invested in below investment grade and comparable quality unrated high yield securities, which tend to be more sensitive to economic conditions than higher rated securities. The risk of loss due to default by the issuer may be significantly greater for the holders of high yielding securities because such securities are generally unsecured and are often subordinated to other creditors of the issuer.
The Fund held defaulted and/or other securities for which the income has been deemed uncollectible. The Fund discontinues accruing income on these securities and provides an estimate for losses on interest receivable. At December 31, 2003, the value of these securities was $6,220,735 representing 3.2% of the Fund’s net assets. For information as to specific securities, see the accompanying Statement of Investments.
FH-18
FRANKLIN TEMPLETON VARIABLE INSURANCE PRODUCTS TRUST
FRANKLIN HIGH INCOME FUND
Notes to Financial Statements (continued)
7. RESTRICTED SECURITIES
At December 31, 2003, investments in securities included issues that are restricted or illiquid. Restricted securities are often purchased in private placement transactions, are not registered under the Securities Act of 1933, may have contractual restrictions on resale, and are valued under methods approved by the Board of Trustees as reflecting fair value. A security may also be considered illiquid if it lacks a readily available market or if its valuation has not changed for a certain period of time. At December 31, 2003, the Fund held investments in restricted and illiquid securities that were valued under approved methods by the Trustees, as follows:
| | | | | | | | | | | |
Principal Amount/ Shares | | Issuer | | Acquisition Date | | Cost | | Value |
|
| $ | 2,085,834 | | All Star Gas Corp., senior note, 11.00%, 6/30/03 | | 2/23/01 | | $ | 1,836,487 | | $ | 292,017 |
| | 6,900 | | Empire Gas Corp., wts., 7/15/04 | | 6/23/94 | | | 11,286 | | | — |
| | 8,000 | | Poland Telecom Finance, wts., 144A, 12/01/07 | | 11/24/97 | | | 48,000 | | | — |
| | | | | | | | | | |
|
|
| | | | Total Restricted Securities (.1% of Net Assets) | | | | | | | $ | 292,017 |
| | | | | | | | | | |
|
|
8. OTHER CONSIDERATIONS
Advisers, as the Fund’s Manager, may serve as a member of various bondholders’ steering committees, on credit committees, or may represent the Fund in certain corporate restructuring negotiations. Currently the Manager serves in one or more of these capacities for Adelphia Communications Corp. and Magellan Health Services Inc. As a result of this involvement, Advisers may be in possession of certain material non-public information. If the Fund’s Manager, while in possession of such information, seeks to sell any of its holdings in these securities it will comply with all applicable federal securities laws.
9. REGULATORY MATTERS
On February 4, 2004, the Securities Division of the Office of the Secretary of the Commonwealth of Massachusetts filed an administrative complaint against Franklin Resources, Inc. and certain of its subsidiaries (the “Company”), alleging violations of the Massachusetts Uniform Securities Act. The complaint arises from activity that occurred in 2001 during which time an officer of a Company subsidiary was negotiating an agreement with an investor relating to investments in a mutual fund and a hedge fund.
The Company, in addition to other entities within Franklin Templeton Investments, has been named in shareholder class actions related to the matter described above. The Company believes that the claims made in the lawsuit are without merit and it intends to defend vigorously against the allegations. The Company and the Fund may be named in similar civil actions related to the matter described above.
In addition, as part of ongoing investigations by the U.S. Securities and Exchange Commission (the “SEC”), the U.S. Attorney for the Northern District of California, the New York Attorney General, the California Attorney General, the U.S. Attorney for the District of Massachusetts, the Florida Department of Financial Services and the Commissioner of Securities and the Attorney General of the State of West Virginia, relating to certain practices in the mutual fund industry, including late trading, market timing and sales compensation arrangements, the Company and its subsidiaries, as well as certain current or former executives and employees of the Company, have received requests for information and/or subpoenas to testify or produce documents. The Company and its current employees are providing documents and information in response to these requests and subpoenas. In addition, the Company has responded to requests for similar kinds of information from regulatory authorities in some of the foreign countries where the Company conducts its global asset management business.
FH-19
FRANKLIN TEMPLETON VARIABLE INSURANCE PRODUCTS TRUST
FRANKLIN HIGH INCOME FUND
Notes to Financial Statements (continued)
9. REGULATORY MATTERS (cont.)
The Staff of the SEC has informed the Company that it intends to recommend that the Commission authorize an action against the Fund’s investment adviser and a senior executive officer relating to the frequent trading issues that are the subject of the SEC’s investigation. These issues were previously disclosed as being under investigation by government authorities and the subject of an internal inquiry by the Company in its Annual Report on Form 10-K and on its public website. The Company currently is in discussions with the SEC Staff in an effort to resolve the issues raised in their investigation. Such discussions are preliminary and the Fund’s management has been advised that the Company cannot predict the likelihood of whether those discussions will result in a settlement and, if so, the terms of such settlement. The impact, if any, of these matters on the Fund is uncertain at this time. If the Company finds that it bears responsibility for any unlawful or improper conduct, it has committed to making the Fund or its shareholders whole, as appropriate.
FH-20
FRANKLIN TEMPLETON VARIABLE INSURANCE PRODUCTS TRUST
FRANKLIN HIGH INCOME FUND
Independent Auditors’ Report
To the Board of Trustees and Shareholders of
Franklin Templeton Variable Insurance Products Trust
In our opinion, the accompanying statement of assets and liabilities, including the statement of investments, and the related statements of operations and of changes in net assets and the financial highlights present fairly, in all material respects, the financial position of the Franklin High Income Fund (the Fund) (one of the funds constituting the Franklin Templeton Variable Insurance Products Trust) at December 31, 2003, the results of its operations for the year then ended, the changes in its net assets for each of the two years in the period then ended and the financial highlights for each of the periods presented, in conformity with accounting principles generally accepted in the United States of America. These financial statements and financial highlights (hereafter referred to as “financial statements”) are the responsibility of the Fund’s management; our responsibility is to express an opinion on these financial statements based on our audits. We conducted our audits of these financial statements in accordance with auditing standards generally accepted in the United States of America, which require that we plan and perform the audits to obtain reasonable assurance about whether the financial statements are free of material misstatement. An audit includes examining, on a test basis, evidence supporting the amounts and disclosures in the financial statements, assessing the accounting principles used and significant estimates made by management, and evaluating the overall financial statement presentation. We believe that our audits, which included confirmation of securities at December 31, 2003 by correspondence with the custodian and brokers, provide a reasonable basis for our opinion.
PricewaterhouseCoopers LLP
San Francisco, California
February 5, 2004, except for Note 9 as to which the date is February 12, 2004
FH-21
FRANKLIN TEMPLETON VARIABLE INSURANCE PRODUCTS TRUST
FRANKLIN HIGH INCOME FUND
Tax Designation (unaudited)
Under Section 854(b)(2) of the Code, the Fund hereby designates 0.28% of the ordinary income dividends as income qualifying for the dividends received deduction for the fiscal year ended December 31, 2003.
FH-22
FRANKLIN INCOME SECURITIES FUND
Fund Goals and Primary Investments: Franklin Income Securities Fund seeks to maximize income while maintaining prospects for capital appreciation. The Fund invests in debt and equity securities, including lower-rated “junk bonds.”
We are pleased to bring you Franklin Income Securities Fund’s annual report for the fiscal year ended December 31, 2003.
Performance Overview
You can find the Fund’s one-year total return in the Performance Summary following this report. The Fund outperformed its benchmarks, the Standard & Poor’s 500 Composite Index (S&P 500), the Lehman Brothers (LB) U.S. Government/Credit Index, the LB U.S. Aggregate Index and the Lipper VIP Income Funds Objective Average, which returned 28.67%, 4.67%, 4.10% and 16.94%, respectively, for the year under review.1 The Fund changed benchmark indexes from the LB U.S. Government/Credit Index to LB U.S. Aggregate Index because the LB U.S. Aggregate Index provides a broader representation of the bond market and is a more appropriate comparison for the Fund’s portfolio.
Economic and Market Overview
During the year ended December 31, 2003, many factors impacted global economies and financial markets. Early in the year, economic uncertainty and geopolitical events, including impending war in Iraq, pushed U.S. interest rates to their lowest level in more than four decades, and the 10-year U.S. Treasury note’s yield fell to 3.13% in mid-June. However, following the end of major conflict in Iraq, many economic indicators turned positive. The U.S. government injected fiscal stimulus into the economy, approving another round of tax cuts and rebates that included dividend and capital gains tax reductions. In June, an accommodative Federal Reserve Board, in an attempt to bolster the economy, cut the federal funds target rate to 1.00%.
During the year, the U.S. trade deficit increased significantly, contributing to the U.S. dollar’s fall to record lows against the euro and other major currencies. However, the weak dollar provided a boost to the U.S. economy and corporate profits as exports became cheaper for foreign buyers. Robust consumer spending, especially for autos and homes, and strong business spending, particularly for equipment and
1. Sources: Standard & Poor’s Micropal; Lipper Inc. One cannot invest directly in an index, nor is an index representative of the Fund’s portfolio. Please see Index Descriptions following the Fund Summaries.
FI-1
software, contributed to the accelerated economic activity. In addition,
U.S. federal spending stayed firm and inflation remained benign. U.S. gross domestic product (GDP) grew an annualized 8.2% in third quarter 2003, its strongest pace in nearly 20 years, and overall, 2003 GDP grew an estimated 3.1%. As economic data improved, some interest rates rose from their lows, and the 10-year Treasury note’s yield ended the period at 4.27%.
An equity market rally started in late March 2003 and continued through the end of the year. The rebound began with investors anticipating economic recovery in the second half of 2003, and it continued as data showed robust economic growth. Improved sentiment led many investors to rotate into economically sensitive and financially leveraged companies, specifically cyclical, technology, small-capitalization and emerging market stocks. The S&P 500 rose 28.67% for the 12 months ended December 31, 2003, while the technology-heavy Nasdaq Composite Index increased 50.93%.2
Investment Strategy
We search for undervalued or out-of-favor securities we believe offer opportunities for income today and growth tomorrow. We perform independent analysis of the debt securities being considered for the Fund’s portfolio, rather than relying principally on ratings assigned by rating agencies. In analyzing debt and equity securities, we consider a variety of factors, including: a security’s relative value based on such factors as anticipated cash flow, interest or dividend coverage, asset coverage, and earnings prospects; the experience and strength of a company’s management; a company’s sensitivity to changes in interest rates and business conditions; a company’s debt maturity schedules and borrowing requirements; and a company’s changing financial condition and market recognition of the change.
Manager’s Discussion
Based on our overall investment strategy, several portfolio management actions favorably impacted Fund performance in 2003. We gradually reduced the Fund’s exposure to the most interest rate-sensitive securities, including our holdings of mortgage-backed securities issued by FNMA, GNMA and FHLMC. We adopted a similar strategy among the portfolio’s investment grade and non-investment grade corporate bonds.
2. Source: Standard & Poor’s Micropal. Please see Index Descriptions following the Fund Summaries.
Top Five Stock Holdings
Franklin Income Securities Fund
12/31/03
| | |
Company Sector/Industry | | % of Total Net Assets |
|
| |
| Ford Motor Capital Trust II | | 1.7% |
| Consumer Durables | | |
| |
| ChevronTexaco Corp. | | 1.5% |
| Energy Minerals | | |
| |
| Bristol-Myers Squibb Co. | | 1.3% |
| Health Technology | | |
| |
| FirstEnergy Corp. | | 1.3% |
| Utilities | | |
| |
| Pfizer Inc. | | 1.3% |
| Health Technology | | |
The dollar value, number of shares or principal amount, and complete legal titles of all portfolio holdings are listed in the Fund’s Statement of Investments.
FI-2
With a continuation of historically low interest rates during much of 2003, as represented by 10-year U.S. Treasuries, our mortgage-backed securities holdings were able to deliver total returns we regard as attractive. As a result, we took profits and redeployed the proceeds into securities we believed had greater potential to help us meet the Fund’s dual objective of income and growth. We also took advantage of profit-taking opportunities among the Fund’s corporate bonds, specifically those trading at substantial premiums to par value (also called face or nominal value) and offering only slightly higher yields than comparable maturity U.S. Treasuries. For example, we eliminated positions in AT&T Wireless 7.875% senior notes due 2011, Allied Waste 10% senior subordinate notes due 2009, and Fairchild Semiconductor 10.5% senior subordinate notes due 2009. These securities’ improving fundamentals, combined with greater risk tolerance among investors, led to a substantial decline in their overall yields.
Within the corporate sector, investment-grade and lower-rated bonds tended to perform well amid improving corporate fundamentals and relatively stable financial markets. Total returns were also aided during times of the year when interest rates were declining, because bond prices rise when rates fall. Over the course of 2003, we took profits in securities that had appreciated and we believe no longer offered the combination of attractive current yield and longer-term appreciation potential, in line with the Fund’s investment strategy. For example, the yield difference between U.S. Treasury securities and non-investment grade corporate bonds tightened over the course of the year from 9.47 percentage points to 4.86 percentage points as represented by the CSFB High Yield Bond Index.3 Despite strong corporate bond performance in 2003, at period-end we continued to look for opportunities to add to holdings that we believed still offered the optimum combination of yield and long-term capital appreciation potential. Consistent with this strategy, we added to our existing positions in Allegheny Energy, Charter Communications, Calpine and Dynegy Holdings.
At year-end, electric utilities represented the Fund’s largest sector weighting due to our assessment of the sector’s attractive combination of dividend yield and stable earnings growth profile from regulated utility operations.
3. Source: Credit Suisse First Boston (CSFB). Please see Index Descriptions following the Fund Summaries. Treasuries, if held to maturity, offer a fixed rate of return and fixed principal value; their interest payments and principal are guaranteed.
Top Five Bond Holdings
Franklin Income Securities Fund
12/31/03
| | |
Issuer
Sector/Industry | | % of Total
Net Assets |
|
| |
| Charter Communications Holdings LLC | | 2.7% |
| Consumer Services | | |
| |
| Qwest Capital Funding | | 1.5% |
| Electronic Technology | | |
| |
| Calpine Corp. | | 1.3% |
| Utilities | | |
| |
| Nortel Networks Corp. (Canada) | | 1.2% |
| Electronic Technology | | |
| |
| FNMA | | 1.2% |
| Government Bonds | | |
FI-3
We added to positions in numerous holdings including Alliant Energy, Duke Energy, Exelon and FirstEnergy. We noticed many companies in the electric utilities industry pursuing a “back-to-basics” approach, emphasizing a more stable and predictable business profile pursuing excess cash flow to be deployed for balance sheet strengthening and dividend increases.
A pick-up in economic growth, both in the U.S. and abroad, as well as geopolitical turmoil in several major oil producing regions, supported higher global oil prices for most of 2003. At period-end, the Fund’s positions in international integrated oil companies included ChevronTexaco, Royal Dutch Petroleum and BP, all of which favorably contributed to Fund performance through a combination of attractive dividend yields and share price appreciation.
Thank you for your participation in Franklin Income Securities Fund. We look forward to serving your future investment needs.
This discussion reflects our analysis, opinions and portfolio holdings as of December 31, 2003, the end of the reporting period. The way we implement our main investment strategies and the resulting portfolio holdings may change depending on factors such as market and economic conditions. These opinions may not be relied upon as investment advice or an offer for a particular security. The information is not a complete analysis of every aspect of any market, country, industry, security or the Fund. Statements of fact are from sources considered reliable, but the advisor makes no representation or warranty as to their completeness or accuracy. Although historical performance is no guarantee of future results, these insights may help you understand our investment management philosophy.
FI-4
PERFORMANCE SUMMARYASOF 12/31/03
Total return of Class 2 shares represents the average annual change in value, assuming reinvestment of dividends and capital gains. Average returns smooth out variations in returns, which can be significant; they are not the same as year-by-year results.
Franklin Income Securities Fund – Class 2*
Periods ended 12/31/03
| | | | | | |
| | | 1-Year | | 5-Year | | 10-Year |
|
| | | |
Average Annual Total Return | | +31.72% | | +9.06% | | +8.89% |
*Because Class 2 shares were not offered until 1/6/99, standardized Class 2 Fund performance for prior periods represents the historical results of Class 1 shares. For periods beginning on 1/6/99, Class 2’s results reflect an additional 12b-1 fee expense, which also affects future performance. Since 1/6/99 (effective date), the average annual total return of Class 2 shares was +8.90%.
Ongoing market volatility can significantly affect short-term performance; recent returns may differ.
Total Return Index Comparison
for Hypothetical $10,000 Investment (1/1/94–12/31/03)
The graph compares the performance of Franklin Income Securities Fund – Class 2,* the S&P 500, the LB Government/Credit Index, the LB U.S. Aggregate Index and the Lipper VIP Income Funds Objective Average. One cannot invest directly in an index, nor is an index representative of the Fund’s portfolio. Please see Important Notes to Performance Information preceding the Fund Summaries.
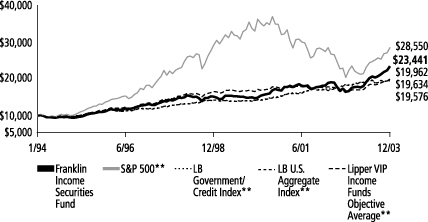
**Sources: Standard & Poor’s Micropal; Lipper Inc. Please see Index Descriptions following the Fund Summaries.
Franklin Income Securities Fund – Class 2
Performance reflects the Fund’s Class 2 operating expenses, but does not include any contract fees, expenses or sales charges. If they had been included, performance would be lower. These charges and deductions, particularly for variable life policies, can have a significant effect on contract values and insurance benefits. See the contract prospectus for a complete description of these expenses, including sales charges.
Since markets can go down as well as up, investment return and the value of your principal will fluctuate with market conditions, and you may have a gain or loss when you sell your shares.
Past performance does not guarantee future results.
FI-5
FRANKLIN TEMPLETON VARIABLE INSURANCE PRODUCTS TRUST
FRANKLIN INCOME SECURITIES FUND
Financial Highlights
| | | | | | | | | | | | | | | | | | | | |
| | | Class 1
| |
| | | Year Ended December 31,
| |
| | | 2003 | | | 2002 | | | 2001 | | | 2000 | | | 1999 | |
| | |
|
|
|
Per share operating performance | | | | | | | | | | | | | | | | | | | | |
(for a share outstanding throughout the year) | | | | | | | | | | | | | | | | | | | | |
Net asset value, beginning of year | | $ | 11.48 | | | $ | 12.96 | | | $ | 14.70 | | | $ | 14.69 | | | $ | 16.92 | |
| | |
|
|
|
Income from investment operations: | | | | | | | | | | | | | | | | | | | | |
Net investment incomea | | | .81 | | | | .90 | | | | 1.09 | d | | | 1.17 | | | | 1.19 | |
Net realized and unrealized gains (losses) | | | 2.79 | | | | (.89 | ) | | | (.92 | )d | | | 1.40 | | | | (1.43 | ) |
| | |
|
|
|
Total from investment operations | | | 3.60 | | | | .01 | | | | .17 | | | | 2.57 | | | | (.24 | ) |
| | |
|
|
|
Less distributions from: | | | | | | | | | | | | | | | | | | | | |
Net investment income | | | (.68 | ) | | | (1.23 | ) | | | (1.03 | ) | | | (1.85 | ) | | | (1.46 | ) |
Net realized gains | | | — | | | | (.26 | ) | | | (.88 | ) | | | (.71 | ) | | | (.53 | ) |
| | |
|
|
|
Total distributions | | | (.68 | ) | | | (1.49 | ) | | | (1.91 | ) | | | (2.56 | ) | | | (1.99 | ) |
| | |
|
|
|
Net asset value, end of year | | $ | 14.40 | | | $ | 11.48 | | | $ | 12.96 | | | $ | 14.70 | | | $ | 14.69 | |
| | |
|
|
|
| | | | | |
Total returnb | | | 32.10% | | | | (.37 | )% | | | .98% | | | | 19.77% | | | | (1.82 | )% |
Ratios/supplemental data | | | | | | | | | | | | | | | | | | | | |
Net assets, end of year (000’s) | | $ | 537,950 | | | $ | 427,036 | | | $ | 527,047 | | | $ | 647,370 | | | $ | 775,116 | |
Ratios to average net assets: | | | | | | | | | | | | | | | | | | | | |
Expenses | | | .51% | | | | .53% | | | | .53% | | | | .50% | | | | .50% | |
Net investment income | | | 6.33% | | | | 7.40% | | | | 7.90% | d | | | 8.21% | | | | 7.41% | |
Portfolio turnover rate | | | 47.03% | | | | 62.00% | | | | 32.52% | | | | 23.92% | | | | 11.89% | |
Portfolio turnover rate excluding mortgage dollar rollsc | | | 45.50% | | | | — | | | | — | | | | — | | | | — | |
| a | Based on average daily shares outstanding. |
| b | Total return does not include any fees, charges or expenses imposed by the variable annuity and life insurance contracts for which the Franklin Templeton Variable Insurance Products Trust serves as an underlying investment vehicle. Total return is not annualized for periods less than one year. |
| c | See Note 1(e) regarding mortgage dollar rolls. |
| d | Effective January 1, 2001, the Fund adopted the provisions of the AICPA Audit and Accounting Guide of Investment Companies and began recording all paydown gains and losses as part of investment income and amortizing all premium and discount on fixed-income securities, as required. The effect of this change was as follows: |
| | |
Net investment income per share | | $.008 |
Net realized and unrealized gains/losses per share | | (.008) |
Ratio of net investment income to average net assets | | .06% |
Per share data and ratios for prior periods have not been restated to reflect this change in the accounting policy.
FI-6
FRANKLIN TEMPLETON VARIABLE INSURANCE PRODUCTS TRUST
FRANKLIN INCOME SECURITIES FUND
Financial Highlights (continued)
| | | | | | | | | | | | | | | | | | | | |
| | | Class 2
| |
| | | Year Ended December 31,
| |
| | | 2003 | | | 2002 | | | 2001 | | | 2000 | | | 1999e | |
| | |
|
|
|
Per share operating performance | | | | | | | | | | | | | | | | | | | | |
(for a share outstanding throughout the year) | | | | | | | | | | | | | | | | | | | | |
Net asset value, beginning of year | | $ | 11.38 | | | $ | 12.88 | | | $ | 14.66 | | | $ | 14.65 | | | $ | 17.07 | |
| | |
|
|
|
Income from investment operations: | | | | | | | | | | | | | | | | | | | | |
Net investment incomea | | | .76 | | | | .84 | | | | 1.03 | d | | | 1.14 | | | | 1.10 | |
Net realized and unrealized gains (losses) | | | 2.77 | | | | (.86 | ) | | | (.90 | )d | | | 1.39 | | | | (1.53 | ) |
| | |
|
|
|
Total from investment operations | | | 3.53 | | | | (.02 | ) | | | .13 | | | | 2.53 | | | | (.43 | ) |
| | |
|
|
|
Less distributions from: | | | | | | | | | | | | | | | | | | | | |
Net investment income | | | (.68 | ) | | | (1.22 | ) | | | (1.03 | ) | | | (1.81 | ) | | | (1.46 | ) |
Net realized gains | | | — | | | | (.26 | ) | | | (.88 | ) | | | (.71 | ) | | | (.53 | ) |
| | |
|
|
|
Total distributions | | | (.68 | ) | | | (1.48 | ) | | | (1.91 | ) | | | (2.52 | ) | | | (1.99 | ) |
| | |
|
|
|
Net asset value, end of year | | $ | 14.23 | | | $ | 11.38 | | | $ | 12.88 | | | $ | 14.66 | | | $ | 14.65 | |
| | |
|
|
|
| | | | | |
Total returnb | | | 31.72% | | | | (.61)% | | | | .76% | | | | 19.43% | | | | (2.93)% | |
Ratios/supplemental data | | | | | | | | | | | | | | | | | | | | |
Net assets, end of year (000’s) | | $ | 621,001 | | | $ | 70,130 | | | $ | 9,067 | | | $ | 2,534 | | | $ | 1,302 | |
Ratios to average net assets: | | | | | | | | | | | | | | | | | | | | |
Expenses | | | .76% | | | | .78% | | | | .78% | | | | .75% | | | | .75%f | |
Net investment income | | | 6.08% | | | | 7.15% | | | | 7.68%d | | | | 7.99% | | | | 7.36%f | |
Portfolio turnover rate | | | 47.03% | | | | 62.00% | | | | 32.52% | | | | 23.92% | | | | 11.89% | |
Portfolio turnover rate excluding mortgage dollar rollsc | | | 45.50% | | | | — | | | | — | | | | — | | | | — | |
| a | Based on average daily shares outstanding. |
| b | Total return does not include any fees, charges or expenses imposed by the variable annuity and life insurance contracts for which the Franklin Templeton Variable Insurance Products Trust serves as an underlying investment vehicle. Total return is not annualized for periods less than one year. |
| c | See Note 1(e) regarding mortgage dollar rolls. |
| d | Effective January 1, 2001, the Fund adopted the provisions of the AICPA Audit and Accounting Guide of Investment Companies and began recording all paydown gains and losses as part of investment income and amortizing all premium and discount on fixed-income securities, as required. The effect of this change was as follows: |
| | |
Net investment income per share | | $.008 |
Net realized and unrealized gains/losses per share | | (.008) |
Ratio of net investment income to average net assets | | .06% |
Per share data and ratios for prior periods have not been restated to reflect this change in the accounting policy.
| e | For the period January 6, 1999 (effective date) to December 31, 1999. |
See notes to financial statements.
FI-7
FRANKLIN TEMPLETON VARIABLE INSURANCE PRODUCTS TRUST
FRANKLIN INCOME SECURITIES FUND
Statement of Investments, December 31, 2003
| | | | | | | |
| | | COUNTRY | | SHARES/
WARRANTS | | VALUE |
|
Common Stocks and Warrants 37.2% | | | | | | | |
Communications 1.8% | | | | | | | |
AT&T Corp. | | United States | | 200,000 | | $ | 4,060,000 |
aMicrocell Telecommunications Inc., B | | Canada | | 9,252 | | | 123,790 |
SBC Communications Inc. | | United States | | 300,000 | | | 7,821,000 |
Verizon Communications Inc. | | United States | | 250,000 | | | 8,770,000 |
aXO Communications Inc. | | United States | | 6,967 | | | 40,058 |
aXO Communications Inc., wts., A, 1/16/10 | | United States | | 13,934 | | | 27,172 |
aXO Communications Inc., wts., B, 1/16/10 | | United States | | 10,451 | | | 17,767 |
aXO Communications Inc., wts., C, 1/16/10 | | United States | | 10,451 | | | 11,496 |
| | | | | | |
|
|
| | | | | | | | 20,871,283 |
| | | | | | |
|
|
Consumer Non-Durables 1.7% | | | | | | | |
Altria Group Inc. | | United States | | 200,000 | | | 10,884,000 |
Coca-Cola Co. | | United States | | 50,000 | | | 2,537,500 |
Loews Corp. — Carolina Group | | United States | | 227,900 | | | 5,752,196 |
| | | | | | |
|
|
| | | | | | | | 19,173,696 |
| | | | | | |
|
|
Electronic Technology .2% | | | | | | | |
Lockheed Martin Corp. | | United States | | 48,100 | | | 2,472,340 |
| | | | | | |
|
|
Energy Minerals 4.3% | | | | | | | |
BP PLC, ADR | | United Kingdom | | 225,000 | | | 11,103,750 |
a,bCallon Petroleum Company $10, wts., 12/08/10 | | United States | | 90,000 | | | 345,870 |
Canadian Oil Sands Trust | | Canada | | 305,000 | | | 10,783,865 |
ChevronTexaco Corp. | | United States | | 200,000 | | | 17,278,000 |
aMission Resources Corp. | | United States | | 1,170,000 | | | 2,644,200 |
Royal Dutch Petroleum Co., N.Y. shs. | | Netherlands | | 150,000 | | | 7,858,500 |
| | | | | | |
|
|
| | | | | | | | 50,014,185 |
| | | | | | |
|
|
Finance 2.5% | | | | | | | |
Comerica Inc. | | United States | | 120,000 | | | 6,727,200 |
Fleet Boston Financial Corp. | | United States | | 300,000 | | | 13,095,000 |
JP Morgan Chase & Co. | | United States | | 250,000 | | | 9,182,500 |
| | | | | | |
|
|
| | | | | | | | 29,004,700 |
| | | | | | |
|
|
Health Technology 4.7% | | | | | | | |
Bristol-Myers Squibb Co. | | United States | | 525,000 | | | 15,015,000 |
Johnson & Johnson Inc. | | United States | | 150,000 | | | 7,749,000 |
Merck & Co. Inc. | | United States | | 175,000 | | | 8,085,000 |
Pfizer Inc. | | United States | | 413,300 | | | 14,601,889 |
Schering-Plough Corp. | | United States | | 300,000 | | | 5,217,000 |
Wyeth | | United States | | 100,000 | | | 4,245,000 |
| | | | | | |
|
|
| | | | | | | | 54,912,889 |
| | | | | | |
|
|
Non-Energy Minerals 1.1% | | | | | | | |
AngloGold Ltd., ADR | | South Africa | | 171,300 | | | 7,999,710 |
Barrick Gold Corp. | | Canada | | 200,000 | | | 4,542,000 |
| | | | | | |
|
|
| | | | | | | | 12,541,710 |
| | | | | | |
|
|
Process Industries 2.0% | | | | | | | |
Dow Chemical Co. | | United States | | 175,000 | | | 7,274,750 |
E.I. du Pont de Nemours & Co. | | United States | | 150,000 | | | 6,883,500 |
Eastman Chemical Co. | | United States | | 100,000 | | | 3,953,000 |
FI-8
FRANKLIN TEMPLETON VARIABLE INSURANCE PRODUCTS TRUST
FRANKLIN INCOME SECURITIES FUND
Statement of Investments, December 31, 2003 (cont.)
| | | | | | | |
| | | COUNTRY | | SHARES/
WARRANTS | | VALUE |
|
Common Stocks and Warrants (cont.) | | | | | | | |
Process Industries (cont.) | | | | | | | |
Georgia-Pacific Corp. | | United States | | 121,662 | | $ | 3,731,374 |
Lyondell Chemical Co. | | United States | | 83,500 | | | 1,415,325 |
| | | | | | |
|
|
| | | | | | | | 23,257,949 |
| | | | | | |
|
|
Real Estate Investment Trusts 1.0% | | | | | | | |
Archstone-Smith Trust | | United States | | 27,342 | | | 765,031 |
Felcor Lodging Trust Inc. | | United States | | 197,700 | | | 2,190,516 |
iStar Financial Inc. | | United States | | 118,500 | | | 4,609,650 |
Liberty Property Trust | | United States | | 50,000 | | | 1,945,000 |
ProLogis | | United States | | 60,000 | | | 1,925,400 |
| | | | | | |
|
|
| | | | | | | | 11,435,597 |
| | | | | | |
|
|
Utilities 17.9% | | | | | | | |
Alliant Energy Corp. | | United States | | 400,000 | | | 9,960,000 |
Ameren Corp. | | United States | | 250,000 | | | 11,500,000 |
American Electric Power Co. Inc. | | United States | | 300,000 | | | 9,153,000 |
CenterPoint Energy Inc. | | United States | | 200,000 | | | 1,938,000 |
Cinergy Corp. | | United States | | 259,500 | | | 10,071,195 |
CMS Energy Corp. | | United States | | 306,000 | | | 2,607,120 |
Dominion Resources Inc. | | United States | | 200,000 | | | 12,766,000 |
DTE Energy Co. | | United States | | 221,500 | | | 8,727,100 |
Duke Energy Corp. | | United States | | 300,000 | | | 6,135,000 |
Energy East Corp. | | United States | | 250,000 | | | 5,600,000 |
Exelon Corp. | | United States | | 220,000 | | | 14,599,200 |
FirstEnergy Corp. | | United States | | 415,000 | | | 14,608,014 |
FPL Group Inc. | | United States | | 118,200 | | | 7,732,644 |
Hawaiian Electric Industries Inc. | | United States | | 60,000 | | | 2,842,200 |
KeySpan Corp. | | United States | | 250,000 | | | 9,200,000 |
NiSource Inc. | | United States | | 350,000 | | | 7,679,000 |
ONEOK Inc. | | United States | | 619,900 | | | 13,687,392 |
Pepco Holdings Inc. | | United States | | 300,000 | | | 5,862,000 |
Pinnacle West Capital Corp. | | United States | | 125,500 | | | 5,022,510 |
PPL Corp. | | United States | | 87,800 | | | 3,841,250 |
Progress Energy Inc. | | United States | | 200,000 | | | 9,052,000 |
Public Service Enterprise Group Inc. | | United States | | 140,000 | | | 6,132,000 |
Puget Energy Inc. | | United States | | 250,000 | | | 5,942,500 |
Sempra Energy | | United States | | 139,100 | | | 4,181,346 |
Southern Co. | | United States | | 250,000 | | | 7,562,500 |
TECO Energy Inc. | | United States | | 200,000 | | | 2,882,000 |
TXU Corp. | | United States | | 160,000 | | | 3,795,200 |
Xcel Energy Inc. | | United States | | 260,000 | | | 4,414,800 |
| | | | | | |
|
|
| | | | | | | | 207,493,971 |
| | | | | | |
|
|
Total Common Stocks and Warrants (Cost $359,071,105) | | | | | | | 431,178,320 |
| | | | | | |
|
|
Preferred Stocks (Cost $7,620,963) | | | | | | | |
Process Industries | | | | | | | |
cAsia Pulp & Paper Co. Ltd., 12.00%, pfd. | | Indonesia | | 10,073,000 | | | 176,277 |
| | | | | | |
|
|
FI-9
FRANKLIN TEMPLETON VARIABLE INSURANCE PRODUCTS TRUST
FRANKLIN INCOME SECURITIES FUND
Statement of Investments, December 31, 2003 (cont.)
| | | | | | | | |
| | | COUNTRY | | SHARES/
WARRANTS | | VALUE |
|
Convertible Preferred Stocks 9.4% | | | | | | | | |
Communications 1.5% | | | | | | | | |
Alltel Corp., 7.75%, cvt. pfd. | | United States | | | 200,000 | | $ | 9,940,000 |
Citigroup Global Markets Holdings Inc., into Motorola, 8.00% cvt. pfd. | | United States | | | 100,000 | | | 7,050,000 |
Dobson Communications Corp., 6.00%, cvt. pfd. | | United States | | | 3,100 | | | 558,000 |
| | | | | | | |
|
|
| | | | | | | | | 17,548,000 |
| | | | | | | |
|
|
Consumer Durables 2.6% | | | | | | | | |
Ford Motor Co. Capital Trust II, 6.50%, cvt. pfd. | | United States | | | 360,000 | | | 20,106,000 |
General Motors Corp., 6.25%, cvt. pfd. | | United States | | | 300,000 | | | 9,690,000 |
| | | | | | | |
|
|
| | | | | | | | | 29,796,000 |
| | | | | | | |
|
|
Electronic Technology .6% | | | | | | | | |
Goldman Sachs Group Inc., into Lockheed Martin Corp. 8.00%, cvt. pfd. | | United States | | | 62,000 | | | 3,154,870 |
Solectron Corp., 7.25%, cvt. pfd. | | United States | | | 250,000 | | | 4,170,000 |
| | | | | | | |
|
|
| | | | | | | | | 7,324,870 |
| | | | | | | |
|
|
Energy Minerals .6% | | | | | | | | |
Nuevo Financing I, 5.75%, cvt. pfd., A | | United States | | | 102,500 | | | 4,228,125 |
Unocal Corp., 6.25%, cvt. pfd. | | United States | | | 50,000 | | | 2,712,500 |
| | | | | | | |
|
|
| | | | | | | | | 6,940,625 |
| | | | | | | |
|
|
Finance .4% | | | | | | | | |
Travelers Property Casualty Corp., 4.50%, cvt. pfd. | | United States | | | 200,000 | | | 4,900,000 |
| | | | | | | |
|
|
Industrial Services 1.4% | | | | | | | | |
Allied Waste Industries Inc., 6.25%, cvt. pfd. | | United States | | | 130,500 | | | 9,983,250 |
Lehman Brothers Holdings Inc. into Weatherford International, 6.00%, cvt. pfd. | | United States | | | 180,000 | | | 6,772,500 |
| | | | | | | |
|
|
| | | | | | | | | 16,755,750 |
| | | | | | | |
|
|
Real Estate Investment Trusts 1.4% | | | | | | | | |
Glenborough Realty Trust Inc., 7.75%, cvt. pfd., A | | United States | | | 205,000 | | | 5,049,150 |
Host Marriott Corp., 6.75%, cvt. pfd. | | United States | | | 138,000 | | | 7,218,780 |
Reckson Associates Realty Corp., 7.625%, cvt. pfd., A | | United States | | | 140,000 | | | 3,605,000 |
| | | | | | | |
|
|
| | | | | | | | | 15,872,930 |
| | | | | | | |
|
|
Technology Services .3% | | | | | | | | |
Electronic Data Systems Corp., 7.625%, cvt. pfd. | | United States | | | 35,000 | | | 802,550 |
Goldman Sachs Group Inc. into IBM, 8.00%, cvt. pfd. | | United States | | | 25,000 | | | 2,148,950 |
| | | | | | | |
|
|
| | | | | | | | | 2,951,500 |
| | | | | | | |
|
|
Utilities .6% | | | | | | | | |
FPL Group Inc., 8.50%, cvt. pfd. | | United States | | | 62,300 | | | 3,596,579 |
Sempra Energy, 8.50%, cvt. pfd. | | United States | | | 120,000 | | | 3,386,040 |
| | | | | | | |
|
|
| | | | | | | | | 6,982,619 |
| | | | | | | |
|
|
Total Convertible Preferred Stocks (Cost $95,563,176) | | | | | | | | 109,072,294 |
| | | | | | | |
|
|
| | | |
| | | | | PRINCIPAL
AMOUNT
| | |
Bonds 29.7% | | | | | | | | |
Commercial Services .2% | | | | | | | | |
American Color Graphics, senior secured note, 144A, 10.00%, 6/15/10 | | United States | | $ | 1,200,000 | | | 1,236,000 |
Johnsondiversey Inc., senior sub. note, 9.625%, 5/15/12 | | United States | | | 600,000 | | | 672,000 |
| | | | | | | |
|
|
| | | | | | | | | 1,908,000 |
| | | | | | | |
|
|
FI-10
FRANKLIN TEMPLETON VARIABLE INSURANCE PRODUCTS TRUST
FRANKLIN INCOME SECURITIES FUND
Statement of Investments, December 31, 2003 (cont.)
| | | | | | | | |
| | | COUNTRY | | PRINCIPAL
AMOUNT | | VALUE |
|
Bonds (cont.) | | | | | | | | |
Communications 1.2% | | | | | | | | |
Dobson Communications Corp., senior note, 10.875%, 7/01/10 | | United States | | $ | 3,000,000 | | $ | 3,285,000 |
Time Warner Telecom Inc., senior note, 10.125%, 2/01/11 | | United States | | | 2,900,000 | | | 3,103,000 |
US West Communications Inc., 6.875%, 9/15/33 | | United States | | | 5,400,000 | | | 5,157,000 |
cWorldCom Inc., 8.00%, 5/15/06 | | United States | | | 6,000,000 | | | 2,025,000 |
| | | | | | | |
|
|
| | | | | | | | | 13,570,000 |
| | | | | | | |
|
|
Consumer Durables 1.0% | | | | | | | | |
General Motors, 8.375%, 7/15/33 | | United States | | | 10,000,000 | | | 11,643,030 |
| | | | | | | |
|
|
Consumer Services 4.8% | | | | | | | | |
c,dAdelphia Communications Corp., senior note, 7.875%, 5/01/09 | | United States | | | 3,400,000 | | | 3,128,000 |
c,dAdelphia Communications Corp., senior note, 10.875%, 10/01/10 | | United States | | | 1,900,000 | | | 1,786,000 |
cCablevision SA, 13.75%, 5/01/09 | | Argentina | | | 2,000,000 | | | 1,050,000 |
CanWest Media Inc., senior sub. note, 10.625%, 5/15/11 | | Canada | | | 2,600,000 | | | 2,977,000 |
Charter Communications Holdings LLC, senior note, 8.625%, 4/01/09 | | United States | | | 5,000,000 | | | 4,387,500 |
Charter Communications Holdings LLC, senior note, 10.75%, 10/01/09 | | United States | | | 10,000,000 | | | 9,225,000 |
CKE Restaurants Inc., senior sub. note, 9.125%, 5/01/09 | | United States | | | 300,000 | | | 309,000 |
CSC Holdings Inc., senior note, B, 7.625%, 4/01/11 | | United States | | | 5,000,000 | | | 5,287,500 |
CSC Holdings Inc., senior sub. deb., 9.875%, 4/01/23 | | United States | | | 3,000,000 | | | 3,153,750 |
Dex Media West LLC, senior sub. note, 144A, 9.875% 8/15/13 | | United States | | | 6,200,000 | | | 7,238,500 |
EchoStar DBS Corp., senior note, 10.375%, 10/01/07 | | United States | | | 3,700,000 | | | 4,074,625 |
El Dorado Resorts LLC, senior sub. note, 10.50%, 8/15/06 | | United States | | | 429,000 | | | 435,435 |
bLone Cypress Co., sub. note, 11.50%, 8/01/09 | | United States | | | 1,860,234 | | | 1,960,221 |
Six Flags Inc., senior note, 9.50%, 2/01/09 | | United States | | | 2,800,000 | | | 2,947,000 |
Universal City Development, senior note, 144A, 11.75%, 4/01/10 | | United States | | | 3,000,000 | | | 3,525,000 |
Venetian Casino/LV Sands, 11.00%, 6/15/10 | | United States | | | 2,100,000 | | | 2,446,500 |
Young Broadcasting Inc., senior sub. note, 10.00%, 3/01/11 | | United States | | | 1,427,000 | | | 1,544,728 |
| | | | | | | |
|
|
| | | | | | | | | 55,475,759 |
| | | | | | | |
|
|
Electronic Technology 2.6% | | | | | | | | |
AMKOR Technology Inc., senior note, 7.75%, 5/15/13 | | United States | | | 4,500,000 | | | 4,848,750 |
Lucent Technologies, 6.45%, 3/15/29 | | United States | | | 10,400,000 | | | 8,229,000 |
Qwest Capital Funding, 7.00%, 8/03/09 | | United States | | | 8,500,000 | | | 8,478,750 |
Qwest Capital Funding, 7.25%, 2/15/11 | | United States | | | 9,000,000 | | | 8,910,000 |
| | | | | | | |
|
|
| | | | | | | | | 30,466,500 |
| | | | | | | |
|
|
Energy Minerals 1.3% | | | | | | | | |
Callon Petroleum Co., 9.75%, 12/08/10 | | United States | | | 6,000,000 | | | 5,664,300 |
Chesapeake Energy Corp., senior note, 8.125%, 4/01/11 | | United States | | | 3,800,000 | | | 4,246,500 |
Williams Cos., senior note, 8.625%, 6/01/10 | | United States | | | 5,000,000 | | | 5,637,500 |
| | | | | | | |
|
|
| | | | | | | | | 15,548,300 |
| | | | | | | |
|
|
Finance .7% | | | | | | | | |
Ford Motor Credit Co., 7.00%, 10/01/13 | | United States | | | 8,000,000 | | | 8,452,376 |
| | | | | | | |
|
|
Health Services 1.0% | | | | | | | | |
HealthSouth Corp., senior note, 7.625%, 6/01/12 | | United States | | | 3,900,000 | | | 3,666,000 |
Tenet Healthcare Corp., senior note, 6.375%, 12/01/11 | | United States | | | 8,000,000 | | | 7,720,000 |
| | | | | | | |
|
|
| | | | | | | | | 11,386,000 |
| | | | | | | |
|
|
Industrial Services .7% | | | | | | | | |
El Paso Corp., senior note, 6.75%, 5/15/09 | | United States | | | 8,500,000 | | | 8,149,375 |
| | | | | | | |
|
|
FI-11
FRANKLIN TEMPLETON VARIABLE INSURANCE PRODUCTS TRUST
FRANKLIN INCOME SECURITIES FUND
Statement of Investments, December 31, 2003 (cont.)
| | | | | | | | |
| | | COUNTRY | | PRINCIPAL
AMOUNT | | VALUE |
|
Bonds (cont.) | | | | | | | | |
Non-Energy Minerals .1% | | | | | | | | |
Century Aluminum Co., first mortgage, 11.75%, 4/15/08 | | United States | | $ | 800,000 | | $ | 896,000 |
| | | | | | | |
|
|
Process Industries 5.1% | | | | | | | | |
Consoltex Group Inc., PIK, 11.00%, 1/31/09 | | United States | | | 11,799,040 | | | 1,180 |
Equistar Chemicals LP, senior note, 10.125%, 9/01/08 | | United States | | | 6,000,000 | | | 6,600,000 |
Four M Corp., senior note, B, 12.00%, 6/01/06 | | United States | | | 2,000,000 | | | 2,000,000 |
Georgia-Pacific Corp., senior note, 9.375%, 2/01/13 | | United States | | | 4,700,000 | | | 5,428,500 |
Graphic Packaging International, 144A, senior sub. note 9.50%, 8/15/13 | | United States | | | 9,000,000 | | | 9,990,000 |
Huntsman Advanced Materials LLC, senior secured note, 144A, 11.00%, 7/15/10 | | United States | | | 2,200,000 | | | 2,442,000 |
Hunstman LLC, 144A, 11.625%, 10/15/10 | | United States | | | 4,500,000 | | | 4,612,500 |
IMC Global Inc., senior note, 144A, 10.875%, 8/01/13 | | United States | | | 8,500,000 | | | 9,350,000 |
Lyondell Chemical Co., senior secured note, 10.50%, 6/01/13 | | United States | | | 11,500,000 | | | 12,592,500 |
Nalco Co., senior note, 144A, 7.75%, 11/15/11 | | United States | | | 900,000 | | | 967,500 |
Nalco Co., senior sub. note, 144A, 8.875%, 11/15/13 | | United States | | | 700,000 | | | 745,500 |
Tyco International Group, 6.375%, 10/15/11 | | Luxembourg | | | 3,500,000 | | | 3,758,125 |
| | | | | | | |
|
|
| | | | | | | | | 58,487,805 |
| | | | | | | |
|
|
Producer Manufacturing 2.1% | | | | | | | | |
Case New Holland Inc., senior note, 144A, 9.25%, 8/01/11 | | United States | | | 9,000,000 | | | 10,125,000 |
Dana Corp., 7.00%, 3/01/29 | | United States | | | 3,300,000 | | | 3,295,875 |
H&E Equipment/Finance, 11.125%, 6/15/12 | | United States | | | 2,250,000 | | | 2,272,500 |
Manitowoc Co. Inc., senior sub. note, 10.50%, 8/01/12 | | United States | | | 2,300,000 | | | 2,630,625 |
Nortek Inc., senior sub. note, 9.875%, 6/15/11 | | United States | | | 3,100,000 | | | 3,433,250 |
Trench Electric & Trench Inc., senior sub. deb., 10.25%, 12/15/07 | | Canada | | | 2,350,000 | | | 2,420,500 |
| | | | | | | |
|
|
| | | | | | | | | 24,177,750 |
| | | | | | | |
|
|
Real Estate Investment Trusts 1.6% | | | | | | | | |
Felcor Lodging LP, 9.50%, 9/15/08 | | United States | | | 1,800,000 | | | 1,953,000 |
HMH Properties Inc., senior secured note, B, 7.875%, 8/01/08 | | United States | | | 3,750,000 | | | 3,914,063 |
HMH Properties Inc., senior note, C, 8.45%, 12/01/08 | | United States | | | 1,090,000 | | | 1,141,775 |
Host Marriott LP, senior note, 7.125%, 11/01/13 | | United States | | | 5,000,000 | | | 5,125,000 |
Meristar Hospitality Corp., 9.125%, 1/15/11 | | United States | | | 6,200,000 | | | 6,603,000 |
| | | | | | | |
|
|
| | | | | | | | | 18,736,838 |
| | | | | | | |
|
|
Transportation .7% | | | | | | | | |
Laidlaw International Inc., senior note, 144A, 10.75%, 6/15/11 | | United States | | | 7,000,000 | | | 7,945,000 |
| | | | | | | |
|
|
Utilities 6.6% | | | | | | | | |
AES Corp., senior note, 8.75%, 6/15/08 | | United States | | | 1,000,000 | | | 1,077,500 |
Allegheny Energy Inc., 144A, 8.75%, 4/15/12 | | United States | | | 10,000,000 | | | 9,475,000 |
Aquila Inc., 14.875%, 7/01/12 | | United States | | | 6,000,000 | | | 8,055,000 |
Calpine Canada Energy Finance, senior note, 8.50%, 5/01/08 | | Canada | | | 10,000,000 | | | 8,025,000 |
Calpine Corp., senior note, 8.625%, 8/15/10 | | United States | | | 10,000,000 | | | 7,850,000 |
Calpine Corp., senior note, 8.50%, 2/15/11 | | United States | | | 9,400,000 | | | 7,484,750 |
CMS Energy Corp., senior note, 144A, 7.75%, 8/01/10 | | United States | | | 6,000,000 | | | 6,337,500 |
Dynegy Holdings Inc., senior note, 6.875%, 4/01/11 | | United States | | | 3,500,000 | | | 3,241,875 |
Dynegy Holdings Inc., secured note, 144A, 10.125%, 7/15/13 | | United States | | | 8,000,000 | | | 9,240,000 |
Edison Mission Energy, senior note, 7.73%, 6/15/09 | | United States | | | 7,000,000 | | | 6,702,500 |
FI-12
FRANKLIN TEMPLETON VARIABLE INSURANCE PRODUCTS TRUST
FRANKLIN INCOME SECURITIES FUND
Statement of Investments, December 31, 2003 (cont.)
| | | | | | | | |
| | | COUNTRY | | PRINCIPAL
AMOUNT | | VALUE |
|
Bonds (cont.) | | | | | | | | |
Utilities (cont.) | | | | | | | | |
FirstEnergy Corp., 6.45%, 11/15/11 | | United States | | $ | 4,000,000 | | $ | 4,153,436 |
Nrg Energy Inc., 8.00%,12/15/13 144A | | United States | | | 4,900,000 | | | 5,175,625 |
| | | | | | | |
|
|
| | | | | | | | | 76,818,186 |
| | | | | | | |
|
|
Total Bonds (Cost $318,988,878) | | | | | | | | 343,660,919 |
| | | | | | | |
|
|
Convertible Bonds 7.3% | | | | | | | | |
Communications .5% | | | | | | | | |
Nextel Communications Inc., cvt., 5.25%, 1/15/10 | | United States | | | 6,000,000 | | | 6,120,000 |
| | | | | | | |
|
|
Consumer Services .5% | | | | | | | | |
c,dAdelphia Communications Corp., junior sub. note, cvt., 6.00%, 2/15/06 | | United States | | | 3,600,000 | | | 1,584,000 |
Mediacom Communications Corp., cvt, 5.25%, 7/01/06 | | United States | | | 4,000,000 | | | 3,890,000 |
| | | | | | | |
|
|
| | | | | | | | | 5,474,000 |
| | | | | | | |
|
|
Distribution Services 1.0% | | | | | | | | |
Amerisource Health Corp., cvt., 5.00%, 12/01/07 | | United States | | | 10,000,000 | | | 12,050,000 |
| | | | | | | |
|
|
Electronic Technology 3.2% | | | | | | | | |
Advanced Micro Devices Inc., cvt., FRN, 4.75%, 2/01/22 | | United States | | | 4,750,000 | | | 4,868,750 |
L-3 Communications Holdings Inc., cvt., 4.00%, 9/15/11 | | United States | | | 6,000,000 | | | 6,592,500 |
Lam Research Corp., cvt., 4.00%, 6/01/06 | | United States | | | 4,500,000 | | | 4,635,000 |
Nortel Networks Corp., senior note, cvt., 4.25%, 9/01/08 | | Canada | | | 15,000,000 | | | 14,268,750 |
PMC-Sierra Inc., cvt., 3.75%, 8/15/06 | | United States | | | 2,000,000 | | | 2,002,400 |
SCI Systems Inc., cvt., sub. note, 3.00%, 3/15/07 | | United States | | | 5,100,000 | | | 4,845,000 |
| | | | | | | |
|
|
| | | | | | | | | 37,212,400 |
| | | | | | | |
|
|
Health Technology .4% | | | | | | | | |
Enzon Pharmaceuticals Inc., cvt., 4.50%, 7/01/08 | | United States | | | 5,500,000 | | | 4,853,750 |
| | | | | | | |
|
|
Industrial Services .5% | | | | | | | | |
Hanover Compressor Co., cvt., 4.75%, 3/15/08 | | United States | | | 6,750,000 | | | 6,277,500 |
| | | | | | | |
|
|
Producer Manufacturing .7% | | | | | | | | |
Tyco International Group SA, cvt., 144A, 2.75%, 1/15/18 | | Luxembourg | | | 6,000,000 | | | 7,687,500 |
| | | | | | | |
|
|
Real Estate Investment Trusts .5% | | | | | | | | |
Meristar Hospitality Corp., cvt., 9.50%, 4/01/10 | | United States | | | 4,500,000 | | | 5,422,500 |
| | | | | | | |
|
|
Total Convertible Bonds (Cost $76,896,461) | | | | | | | | 85,097,650 |
| | | | | | | |
|
|
Zero Coupon/Step-Up Bonds 3.7% | | | | | | | | |
Consumer Services 3.2% | | | | | | | | |
Charter Communications Holdings LLC, senior disc. note, zero cpn. to 4/01/04, 9.92% thereafter, 4/01/11 | | United States | | | 5,000,000 | | | 4,300,000 |
Charter Communications Holdings LLC, senior disc. note, zero cpn. to 1/15/06, 13.50% thereafter, 1/15/11 | | United States | | | 17,500,000 | | | 13,125,000 |
Quebecor Media Inc., senior disc. note, zero cpn. to 7/15/06, 13.75% thereafter, 7/15/11 | | Canada | | | 3,500,000 | | | 3,101,875 |
Telenet Group Holding NV, senior note, 144A, zero cpn. to 12/15/03, 11.50% thereafter, 6/15/14 | | Belgium | | | 22,000,000 | | | 13,970,000 |
Yell Finance BV, senior disc. note, zero cpn. to 8/01/06, 13.50% thereafter, 8/01/11 | | United Kingdom | | | 2,129,000 | | | 1,969,325 |
| | | | | | | |
|
|
| | | | | | | | | 36,466,200 |
| | | | | | | |
|
|
Industrial Services .2% | | | | | | | | |
Hanover Compressor Co., sub. note, zero cpn., 3/31/07 | | United States | | | 3,100,000 | | | 2,294,000 |
| | | | | | | |
|
|
FI-13
FRANKLIN TEMPLETON VARIABLE INSURANCE PRODUCTS TRUST
FRANKLIN INCOME SECURITIES FUND
Statement of Investments, December 31, 2003 (cont.)
| | | | | | | | | |
| | | COUNTRY | | PRINCIPAL
AMOUNT | | VALUE | |
| |
Zero Coupon/Step-Up Bonds (cont.) | | | | | | | | | |
Process Industries .3% | | | | | | | | | |
Huntsman ICI Chemicals, senior disc. note, zero cpn., 12/31/09 | | United States | | $ | 8,000,000 | | $ | 3,900,000 | |
| | | | | | | |
|
|
|
Total Zero Coupon/Step-Up Bonds (Cost $38,910,537) | | | | | | | | 42,660,200 | |
| | | | | | | |
|
|
|
U.S. Government and Agency Securities 2.2% | | | | | | | | | |
eFHLMC, 6.00%, 1/01/31 | | | | | 3,548,643 | | | 3,676,465 | |
FNMA, 6.50%, 5/01/31 | | | | | 57,757 | | | 60,426 | |
FNMA, 6.50%, 1/01/32 | | | | | 2,512,637 | | | 2,628,718 | |
FNMA, 6.50%, 6/01/32 | | | | | 4,927,624 | | | 5,155,781 | |
FNMA, 6.50%, 7/01/32 | | | | | 2,180,696 | | | 2,281,665 | |
FNMA, 6.50%, 8/01/32 | | | | | 3,945,801 | | | 4,128,498 | |
GNMA, 6.00%, 1/15/29 | | | | | 19,072 | | | 19,846 | |
GNMA, 6.00%, 2/15/29 | | | | | 95,996 | | | 99,890 | |
GNMA, 6.00%, 3/15/29 | | | | | 150,062 | | | 156,149 | |
GNMA, 6.00%, 5/15/29 | | | | | 13,058 | | | 13,588 | |
GNMA, 6.00%, 12/15/31 | | | | | 110,864 | | | 115,333 | |
GNMA, 6.00%, 5/15/32 | | | | | 37,881 | | | 39,421 | |
GNMA, 6.00%, 9/15/32 | | | | | 58,281 | | | 60,651 | |
GNMA, 6.00%, 10/15/32 | | | | | 2,593,673 | | | 2,699,162 | |
GNMA, 6.00%, 11/15/32 | | | | | 3,964,092 | | | 4,125,316 | |
| | | | | | | |
|
|
|
Total U.S. Government and Agency Securities (Cost $24,725,487) | | | | | | | | 25,260,909 | |
| | | | | | | |
|
|
|
Total Long Term Investments (Cost $921,776,607) | | | | | | | | 1,037,106,569 | |
| | | | | | | |
|
|
|
fRepurchase Agreements (Cost $125,307,455) 10.8% | | | | | | | | | |
Joint Repurchase Agreement, .873%, 1/02/04 (Maturity Value $125,313,530) | | | | | 125,307,455 | | | 125,307,455 | |
ABN AMRO Bank, NV., New York Branch (Maturity Value $11,674,208) Banc of America Securities LLC (Maturity Value $11,674,208) Barclays Capital Inc. (Maturity Value $8,337,110) Bear, Stearns & Co. Inc. (Maturity Value $6,670,440) BNP Paribas Securities Corp. (Maturity Value $11,674,208) Deutsche Bank Securities Inc. (Maturity Value $11,674,208) Dresdner Kleinwort Wasserstein Securities LLC (Maturity Value $11,674,208) Goldman, Sachs & Co. (Maturity Value $6,670,440) Greenwich Capital Markets Inc. (Maturity Value $11,674,208) Lehman Brothers Inc. (Maturity Value $10,241,876) Morgan Stanley & Co. Inc. (Maturity Value $11,674,208) UBS Securities LLC (Maturity Value $11,674,208) Collateralized by U.S. Treasury Bills, Notes and Bonds, and U.S. Government Agency Securities | | | | | | | | | |
| | | | | | | |
|
|
|
Total Investments (Cost $1,047,084,062) 100.3% | | | | | | | | 1,162,414,024 | |
Other Assets, less Liabilities (.3%) | | | | | | | | (3,463,119 | ) |
| | | | | | | |
|
|
|
Net Assets 100.0% | | | | | | | $ | 1,158,950,905 | |
| | | | | | | |
|
|
|
| b | See Note 7 regarding restricted securities. |
| c | The fund discontinues accruing income on defaulted securities. See Note 6. |
| d | See Note 8 regarding other considerations. |
| e | See Note 1(d) regarding securities purchased on a when-issued, delayed delivery, or to-be-announced basis. |
| f | See Note 1(c) regarding joint repurchase agreement. |
See notes to financial statements.
FI-14
FRANKLIN TEMPLETON VARIABLE INSURANCE PRODUCTS TRUST
FRANKLIN INCOME SECURITIES FUND
Financial Statements
| | | | |
| Statement of Assets and Liabilities | | | | |
December 31, 2003 | | | | |
Assets: | | | | |
Investments in securities: | | | | |
Cost | | $ | 1,047,084,062 | |
| | |
|
|
|
Value | | | 1,162,414,024 | |
Receivables: | | | | |
Investment securities sold | | | 3,055,777 | |
Capital shares sold | | | 1,771,267 | |
Dividends and Interest | | | 10,920,340 | |
| | |
|
|
|
Total assets | | | 1,178,161,408 | |
| | |
|
|
|
Liabilities: | | | | |
Payables: | | | | |
Investment securities purchased | | | 18,195,435 | |
Capital shares redeemed | | | 284,965 | |
Affiliates | | | 666,379 | |
Other liabilities | | | 63,724 | |
| | |
|
|
|
Total liabilities | | | 19,210,503 | |
| | |
|
|
|
Net assets, at value | | $ | 1,158,950,905 | |
| | |
|
|
|
Net assets consist of: | | | | |
Undistributed net investment income | | $ | 41,582,064 | |
Net unrealized appreciation (depreciation) | | | 115,329,962 | |
Accumulated net realized gain (loss) | | | (37,457,636 | ) |
Capital shares | | | 1,039,496,515 | |
| | |
|
|
|
Net assets, at value | | $ | 1,158,950,905 | |
| | |
|
|
|
Class 1: | | | | |
Net assets, at value | | $ | 537,950,404 | |
| | |
|
|
|
Shares outstanding | | | 37,366,485 | |
| | |
|
|
|
Net asset value and offering price per share | | $ | 14.40 | |
| | |
|
|
|
Class 2: | | | | |
Net assets, at value | | $ | 621,000,501 | |
| | |
|
|
|
Shares outstanding | | | 43,627,646 | |
| | |
|
|
|
Net asset value and offering price per share | | $ | 14.23 | |
| | |
|
|
|
See notes to financial statements.
FI-15
FRANKLIN TEMPLETON VARIABLE INSURANCE PRODUCTS TRUST
FRANKLIN INCOME SECURITIES FUND
Financial Statements (continued)
Statement of Operations
for the year ended December 31, 2003
| | | | |
Investment income: | | | | |
Dividends | | $ | 19,395,415 | |
Interest | | | 33,279,688 | |
| | |
|
|
|
Total investment income | | | 52,675,103 | |
| | |
|
|
|
Expenses: | | | | |
Management fees (Note 3) | | | 3,709,956 | |
Distribution fees — Class 2 (Note 3) | | | 700,724 | |
Transfer agent fees | | | 4,988 | |
Custodian fees | | | 15,088 | |
Reports to shareholders | | | 107,256 | |
Professional fees | | | 30,721 | |
Trustees’ fees and expenses | | | 6,937 | |
Other | | | 41,965 | |
| | |
|
|
|
Total expenses | | | 4,617,635 | |
| | |
|
|
|
Net investment income | | | 48,057,468 | |
| | |
|
|
|
Realized and unrealized gains (losses): | | | | |
Net realized gain (loss) from: | | | | |
Investments | | | (19,644,648 | ) |
Foreign currency transactions | | | 17,494 | |
| | |
|
|
|
Net realized gain (loss) | | | (19,627,154 | ) |
Net unrealized appreciation (depreciation) on: | | | | |
Investments | | | 195,331,457 | |
Translation of assets and liabilities denominated in foreign currencies | | | (19,561) | |
| | |
|
|
|
Net unrealized appreciation (depreciation) | | | 195,311,896 | |
| | |
|
|
|
Net realized and unrealized gain (loss) | | | 175,684,742 | |
| | |
|
|
|
Net increase (decrease) in net assets resulting from operations | | $ | 223,742,210 | |
| | |
|
|
|
See notes to financial statements.
FI-16
FRANKLIN TEMPLETON VARIABLE INSURANCE PRODUCTS TRUST
FRANKLIN INCOME SECURITIES FUND
Financial Statements (continued)
Statements of Changes in Net Assets
for the years ended December 31, 2003 and 2002
| | | | | | | | |
| | | 2003 | | | 2002 | |
| | |
| |
Increase (decrease) in net assets: | | | | | | | | |
Operations: | | | | | | | | |
Net investment income | | $ | 48,057,468 | | | $ | 36,971,600 | |
Net realized gain (loss) from investments and foreign currency transactions | | | (19,627,154 | ) | | | (16,162,743 | ) |
Net unrealized appreciation (depreciation) on investments and translation of assets and liabilities denominated in foreign currencies | | | 195,311,896 | | | | (22,040,928 | ) |
| | |
| |
Net increase (decrease) in net assets resulting from operations | | | 223,742,210 | | | | (1,232,071 | ) |
Distributions to shareholders from: | | | | | | | | |
Net investment income: | | | | | | | | |
Class 1 | | | (25,944,365 | ) | | | (46,080,044 | ) |
Class 2 | | | (12,475,273 | ) | | | (1,712,911 | ) |
Net realized gains: | | | | | | | | |
Class 1 | | | — | | | | (9,646,747 | ) |
Class 2 | | | — | | | | (361,202 | ) |
| | |
| |
Total distributions to shareholders | | | (38,419,638) | | | | (57,800,904 | ) |
Capital share transactions: (Note 2) | | | | | | | | |
Class 1 | | | (330,826 | ) | | | (41,449,431 | ) |
Class 2 | | | 476,792,986 | | | | 61,535,455 | |
| | |
| |
Total capital share transactions | | | 476,462,160 | | | | 20,086,024 | |
Net increase (decrease) in net assets | | | 661,784,732 | | | | (38,946,951 | ) |
Net assets: | | | | | | | | |
Beginning of year | | | 497,166,173 | | | | 536,113,124 | |
| | |
| |
End of year | | $ | 1,158,950,905 | | | $ | 497,166,173 | |
| | |
| |
Undistributed net investment income included in net assets: | | | | | | | | |
End of year | | $ | 41,582,064 | | | $ | 31,394,413 | |
| | |
| |
See notes to financial statements.
FI-17
FRANKLIN TEMPLETON VARIABLE INSURANCE PRODUCTS TRUST
FRANKLIN INCOME SECURITIES FUND
Notes to Financial Statements
1. ORGANIZATION AND SIGNIFICANT ACCOUNTING POLICIES
Franklin Templeton Variable Insurance Products Trust (the Trust) is registered under the Investment Company Act of 1940 as an open-end investment company, consisting of twenty-two separate series (the Funds). The Franklin Income Securities Fund (the Fund) included in this report is diversified. Shares of the Fund are sold only to insurance company separate accounts to fund the benefits of variable life insurance policies or variable annuity contracts. As of December 31, 2003, over 84% of the total Fund shares were sold through one insurance company. The Fund’s investment objective is growth and income.
The following summarizes the Fund’s significant accounting policies.
a. Security Valuation
Securities listed or traded on a recognized national exchange or NASDAQ are valued at the last reported sales price. Over-the-counter securities and listed securities for which no sale is reported are valued within the range of the latest quoted bid and asked prices. Foreign securities are valued at the close of trading of the foreign exchange or the NYSE, whichever is earlier. If events occur that materially affect the values of securities after the prices or foreign exchange rates are determined, or if market quotations are not readily available, the securities will be valued at fair value as determined following procedures approved by the Board of Trustees.
b. Foreign Currency Translation
Portfolio securities and other assets and liabilities denominated in foreign currencies are translated into U.S. dollars based on the exchange rate of such currencies against U.S. dollars on the date of valuation. Purchases and sales of securities and income items denominated in foreign currencies are translated into U.S. dollars at the exchange rate in effect on the transaction date.
The Fund does not separately report the effect of changes in foreign exchange rates from changes in market prices on securities held. Such changes are included in net realized and unrealized gain or loss from investments.
Realized foreign exchange gains or losses arise from sales of foreign currencies, currency gains or losses realized between the trade and settlement dates on securities transactions and the difference between the recorded amounts of dividends, interest, and foreign withholding taxes and the U.S. dollar equivalent of the amounts actually received or paid. Net unrealized foreign exchange gains and losses arise from changes in foreign exchange rates on foreign denominated assets and liabilities other than investments in securities held at the end of the reporting period.
c. Joint Repurchase Agreements
The Fund may enter into a joint repurchase agreement whereby its uninvested cash balance is deposited into a joint cash account to be used to invest in one or more repurchase agreements. The value and face amount of the joint repurchase agreement are allocated to the Fund based on its pro-rata interest. A repurchase agreement is accounted for as a loan by the Fund to the seller, collateralized by securities which are delivered to the Fund’s custodian. The market value, including accrued interest, of the initial collateralization is required to be at least 102% of the dollar amount invested by the Fund, with the value of the underlying securities marked to market daily to maintain coverage of at least 100%. At December 31, 2003, all repurchase agreements had been entered into on that date.
d. Securities Purchased on a When-Issued, Delayed Delivery, or TBA Basis
The Fund may purchase securities on a when-issued, delayed delivery, or to-be-announced (TBA) basis, with payment and delivery scheduled for a future date. These transactions are subject to market fluctuations and are subject to the risk that the value at delivery may be more or less than the trade date purchase price. Although the Fund will generally purchase these securities with the intention of holding the securities, it may sell the securities before the settlement date. Sufficient assets have been segregated for these securities.
FI-18
FRANKLIN TEMPLETON VARIABLE INSURANCE PRODUCTS TRUST
FRANKLIN INCOME SECURITIES FUND
Notes to Financial Statements (continued)
1. ORGANIZATION AND SIGNIFICANT ACCOUNTING POLICIES (cont.)
e. Mortgage Dollar Rolls
The Fund enters into mortgage dollar rolls, typically on a TBA basis. Dollar rolls are agreements between the Fund and a financial institution to simultaneously sell and repurchase a mortgage-backed security at a future date. Gains or losses are realized at the time of the sale and the difference between the repurchase price and sale price is recorded as an unrealized gain to the Fund. The risks of mortgage dollar roll transactions include the potential inability of the counterparty to fulfill their obligations.
f. Income Taxes
No provision has been made for income taxes because the Fund’s policy is to qualify as a regulated investment company under the Internal Revenue Code and to distribute substantially all of its taxable income.
g. Security Transactions, Investment Income, Expenses and Distributions
Security transactions are accounted for on trade date. Realized gains and losses on security transactions are determined on a specific identification basis. Interest income and estimated expenses are accrued daily. Discounts and premiums on securities purchased are amortized over the lives of the respective securities. Dividend income and distributions to shareholders are recorded on the ex-dividend date.
Common expenses incurred by the Trust are allocated among the Funds based on the ratio of net assets of each fund to the combined net assets. Other expenses are charged to each fund on a specific identification basis.
Distributions received by the Fund from securities may be a return of capital (ROC). Such distributions reduce the cost basis of the securities, and any distributions in excess of the cost basis are recognized as capital gains.
Realized and unrealized gains and losses and net investment income, other than class specific expenses, are allocated daily to each class of shares based upon the relative proportion of net assets of each class.
h. Accounting Estimates
The preparation of financial statements in accordance with accounting principles generally accepted in the United States of America requires management to make estimates and assumptions that affect the reported amounts of assets and liabilities at the date of the financial statements and the amounts of income and expense during the reporting period. Actual results could differ from those estimates.
i. Guarantees and Indemnifications
Under the Trust’s organizational documents, its officers and trustees are indemnified against certain liability arising out of the performance of their duties to the Trust. Additionally, in the normal course of business, the Trust enters into contracts with service providers that contain general indemnification clauses. The Trust’s maximum exposure under these arrangements is unknown as this would involve future claims that may be made against the Trust that have not yet occurred. However, based on experience, the Trust expects the risk of loss to be remote.
2. SHARES OF BENEFICIAL INTEREST
The Fund offers two classes of shares: Class 1 and Class 2. Each class of shares differs by its distribution fees, voting rights on matters affecting a single class and its exchange privilege.
FI-19
FRANKLIN TEMPLETON VARIABLE INSURANCE PRODUCTS TRUST
FRANKLIN INCOME SECURITIES FUND
Notes to Financial Statements (continued)
2. SHARES OF BENEFICIAL INTEREST (cont.)
At December 31, 2003, there were an unlimited number of shares authorized ($.01 par value). Transactions in the Fund’s shares were as follows:
| | | | | | | | | | | | | | |
| | | Year Ended December 31,
| |
| | | 2003
| | | 2002
| |
| Class 1 Shares: | | Shares
| | | Amount
| | | Shares
| | | Amount
| |
Shares sold | | 4,419,445 | | | $ | 52,203,669 | | | 508,864 | | | $ | 6,691,697 | |
Shares issued in reinvestment of distributions | | 2,030,076 | | | | 25,944,365 | | | 4,663,330 | | | | 55,726,791 | |
Shares redeemed | | (6,284,305 | ) | | | (78,478,860 | ) | | (8,642,050 | ) | | | (103,867,919 | ) |
| | |
| |
Net increase (decrease) | | 165,216 | | | $ | (330,826 | ) | | (3,469,856 | ) | | $ | (41,449,431 | ) |
| | |
| |
| | | | |
| Class 2 Shares: | | | | | | | | | | | | |
Shares sold | | 37,243,295 | | | $ | 474,085,976 | | | 5,631,345 | | | $ | 63,504,458 | |
Shares issued in reinvestment of distributions | | 985,408 | | | | 12,475,273 | | | 174,883 | | | | 2,074,113 | |
Shares redeemed | | (763,349 | ) | | | (9,768,263 | ) | | (347,804 | ) | | | (4,043,116 | ) |
| | |
| |
Net increase (decrease) | | 37,465,354 | | | $ | 476,792,986 | | | 5,458,424 | | | $ | 61,535,455 | |
| | |
| |
3. TRANSACTIONS WITH AFFILIATES
Certain officers and trustees of the Trust are also officers and/or directors of the following entities:
| | |
| Entity | | Affiliation |
|
Franklin Advisers Inc. (Advisers) | | Investment manager |
Franklin Templeton Services LLC (FT Services) | | Administrative manager |
Franklin/Templeton Distributors Inc. (Distributors) | | Principal underwriter |
Franklin/Templeton Investor Services LLC (Investor Services) | | Transfer agent |
The Fund pays an investment management fee to Advisers based on the average daily net assets of the Fund as follows:
| | |
| Annualized Fee Rate | | Net Assets |
|
| .625% | | First $100 million |
| .500% | | Over $100 million, up to and including $250 million |
| .450% | | Over $250 million, up to and including $10 billion |
Fees are further reduced on net assets over $10 billion.
Under an agreement with Advisers, FT Services provides administrative services to the Fund. The fee is paid by Advisers based on the average daily net assets, and is not an additional expense of the Fund.
The Fund reimburses Distributors up to .25% per year of its average daily net assets of Class 2, for costs incurred in marketing the Fund’s shares.
Investor Services, under terms of an agreement, performs shareholder servicing for the Fund and is not paid by the Fund for the services.
FI-20
FRANKLIN TEMPLETON VARIABLE INSURANCE PRODUCTS TRUST
FRANKLIN INCOME SECURITIES FUND
Notes to Financial Statements (continued)
4. INCOME TAXES
At December 31, 2003, the Fund had tax basis capital losses of $27,472,299, which may be carried over to offset future capital gains. Such losses expire as follows:
| | | |
Capital loss carryovers expiring in: | | | |
2010 | | $ | 9,035,077 |
2011 | | | 18,437,222 |
| | |
|
| | | $ | 27,472,299 |
| | |
|
|
At December 31, 2003, the Fund had deferred capital and deferred currency losses occurring subsequent to October 31, 2003 of $9,028,860 and $531, respectively. For tax purposes, such losses will be reflected in the year ending December 31, 2004.
The tax character of distributions paid during the years ended December 31, 2003 and 2002 was as follows:
| | | | | | |
| | | 2003
| | 2002
|
Distributions paid from: | | | | | | |
Ordinary Income | | $ | 38,419,638 | | $ | 52,277,504 |
Long Term Capital gain | | | — | | | 5,523,400 |
| | |
|
| | | $ | 38,419,638 | | $ | 57,800,904 |
| | |
|
Net investment income differs for financial statement and tax purposes primarily due to differing treatments of defaulted securities, foreign currency transactions, mortgage dollar rolls, paydown losses, and bond discounts and premiums.
Net realized gains (losses) differ for financial statement and tax purposes primarily due to differing treatments of wash sales, foreign currency transactions, mortgage dollar rolls, paydown losses, bond discounts and premiums, and payment-in-kind bonds.
At December 31, 2003, the cost of investments, net unrealized appreciation (depreciation), undistributed ordinary income and undistributed long term capital gains for income tax purposes were as follows:
| | | | |
Cost of Investments | | $ | 1,050,195,422 | |
| | |
|
|
|
Unrealized appreciation | | $ | 157,627,301 | |
Unrealized depreciation | | | (45,408,699 | ) |
| | |
| |
Net unrealized appreciation (depreciation) | | $ | 112,218,602 | |
| | |
| |
Undistributed ordinary income | | $ | 43,969,084 | |
Undistributed long term capital gains | | | — | |
| | |
|
|
|
Distributable earnings | | $ | 43,969,084 | |
| | |
| |
5. INVESTMENT TRANSACTIONS
Purchases and sales of securities (excluding short-term securities) for the year ended December 31, 2003, aggregated $724,435,009 and $337,487,401 respectively.
6. CREDIT RISK AND DEFAULTED SECURITIES
The Fund has 37.4% of their portfolio invested in below investment grade and comparable quality unrated high yield securities, which tend to be more sensitive to economic conditions than higher rated securities. The risk of loss due to default by the issuer may be significantly greater for the holders of high yielding securities because such securities are generally unsecured and are often subordinated to other creditors of the issuer.
FI-21
FRANKLIN TEMPLETON VARIABLE INSURANCE PRODUCTS TRUST
FRANKLIN INCOME SECURITIES FUND
Notes to Financial Statements (continued)
6. CREDIT RISK AND DEFAULTED SECURITIES (cont.)
The Fund held defaulted and/or other securities for which the income has been deemed uncollectible. The Fund discontinues accruing income on these securities and provide an estimate for losses on interest receivable. At December 31, 2003, the value of these securities was $9,749,277 representing .84% of the Fund’s net assets. For information as to specific securities, see the accompanying Statement of Investments.
7. RESTRICTED SECURITIES
At December 31,2003, investments in securities included issues that are restricted or illiquid. Restricted securities are often purchased in private placement transactions, are not registered under the Securities Act of 1933, may have contractual restrictions on resale, and are valued under methods approved by the Board of Trustees as reflecting fair value. A security may also be considered illiquid if it lacks a readily available market or if its valuation has not changed for a certain period of time. At December 31, 2003, the Fund held investments in restricted and illiquid securities that were valued under approved methods by the Trustees, as follows:
| | | | | | | | | | |
Principal Amount/
Shares | | Issuer | | Acquisition
Date | | Cost | | Value |
|
| 90,000 | | Callon Petroleum Company $10, wts., 12/08/10 | | 12/08/2003 | | $ | 335,700 | | $ | 345,870 |
| 1,860,234 | | Lone Cypress, sub. note, 11.5%, 8/01/09 | | 12/02/1999 | | | 1,860,234 | | | 1,960,221 |
| | | | | | | | | |
|
|
| | | Total Restricted Securities (.20% of Net Assets) | | | | | | | $ | 2,306,091 |
| | | | | | | | | |
|
|
8. OTHER CONSIDERATIONS
Advisers, as the Fund’s Manager, may serve as a member of various bondholders’ steering committees, on credit committees, or may represent the Funds in certain corporate restructuring negotiations. Currently the manager serves on the bondholder committee of Adelphia Communications. As a result of this involvement, Advisers may be in possession of certain material non-public information. If the Fund’s manager, while in possession on such information, seeks to sell any of its holdings in these securities it will comply with all applicable federal securities laws.
9. REGULATORY MATTERS
On February 4, 2004, the Securities Division of the Office of the Secretary of the Commonwealth of Massachusetts filed an administrative complaint against Franklin Resources, Inc. and certain of its subsidiaries (the “Company”), alleging violations of the Massachusetts Uniform Securities Act. The complaint arises from activity that occurred in 2001 during which time an officer of a Company subsidiary was negotiating an agreement with an investor relating to investments in a mutual fund and a hedge fund.
The Company, in addition to other entities within Franklin Templeton Investments, has been named in shareholder class actions related to the matter described above. The Company believes that the claims made in the lawsuit are without merit and it intends to defend vigorously against the allegations. The Company and the Fund may be named in similar civil actions related to the matter described above.
FI-22
FRANKLIN TEMPLETON VARIABLE INSURANCE PRODUCTS TRUST
FRANKLIN INCOME SECURITIES FUND
Notes to Financial Statements (continued)
9. REGULATORY MATTERS (cont.)
In addition, as part of ongoing investigations by the U.S. Securities and Exchange Commission (the “SEC”), the U.S. Attorney for the Northern District of California, the New York Attorney General, the California Attorney General, the U.S. Attorney for the District of Massachusetts, the Florida Department of Financial Services, and the Commissioner of Securities and the Attorney General of the State of West Virginia, relating to certain practices in the mutual fund industry, including late trading, market timing and sales compensation arrangements, the Company and its subsidiaries, as well as certain current or former executives and employees of the Company, have received requests for information and/or subpoenas to testify or produce documents. The Company and its current employees are providing documents and information in response to these requests and subpoenas. In addition, the Company has responded to requests for similar kinds of information from regulatory authorities in some of the foreign countries where the Company conducts its global asset management business.
The Staff of the SEC has informed the Company that it intends to recommend that the Commission authorize an action against the Fund’s investment adviser and a senior executive officer relating to the frequent trading issues that are the subject of the SEC’s investigation. These issues were previously disclosed as being under investigation by government authorities and the subject of an internal inquiry by the Company in its Annual Report on Form 10-K and on its public website. The Company currently is in discussions with the SEC Staff in an effort to resolve the issues raised in their investigation. Such discussions are preliminary and the Fund’s management has been advised that the Company cannot predict the likelihood of whether those discussions will result in a settlement and, if so, the terms of such settlement. The impact, if any, of these matters on the Fund is uncertain at this time. If the Company finds that it bears responsibility for any unlawful or improper conduct, it has committed to making the Fund or its shareholders whole, as appropriate.
FI-23
FRANKLIN TEMPLETON VARIABLE INSURANCE PRODUCTS TRUST
FRANKLIN INCOME SECURITIES FUND
Independent Auditors’ Report
To the Board of Trustees and Shareholders
of Franklin Templeton Variable Insurance Products Trust
In our opinion, the accompanying statement of assets and liabilities, including the statement of investments, and the related statements of operations and of changes in net assets and the financial highlights present fairly, in all material respects, the financial position of the Franklin Income Securities Fund (the Fund) (one of the funds constituting the Franklin Templeton Variable Insurance Products Trust) at December 31, 2003, the results of its operations for the year then ended, the changes in its net assets for each of the two years in the period then ended and the financial highlights for each of the periods presented, in conformity with accounting principles generally accepted in the United States of America. These financial statements and financial highlights (hereafter referred to as “financial statements”) are the responsibility of the Fund’s management; our responsibility is to express an opinion on these financial statements based on our audits. We conducted our audits of these financial statements in accordance with auditing standards generally accepted in the United States of America, which require that we plan and perform the audits to obtain reasonable assurance about whether the financial statements are free of material misstatement. An audit includes examining, on a test basis, evidence supporting the amounts and disclosures in the financial statements, assessing the accounting principles used and significant estimates made by management, and evaluating the overall financial statement presentation. We believe that our audits, which included confirmation of securities at December 31, 2003 by correspondence with the custodian and brokers, provide a reasonable basis for our opinion.
PricewaterhouseCoopers LLP
San Francisco, California
February 5, 2004, except for Note 9 as to which the date is February 12, 2004
FI-24
FRANKLIN TEMPLETON VARIABLE INSURANCE PRODUCTS TRUST
FRANKLIN INCOME SECURITIES FUND
Tax Designation
Under Section 852(b)(2) of the Internal Revenue Code, the Fund hereby designates 29.36% of the ordinary income dividends as income qualifying for the dividends received deduction for the fiscal year ended December 31, 2003.
FI-25
FRANKLIN LARGE CAP GROWTH SECURITIES FUND
Fund Goal and Primary Investments: Franklin Large Cap Growth Securities Fund seeks capital appreciation. The Fund invests primarily in investments of U.S. large-cap companies with market capitalization values within those of the top 50% of companies in the Russell 1000® Index at the time of purchase.1 The Fund may hold significant positions in the technology sector (including health technology, electronic technology and technology services), and in communications and financial services companies.
We are pleased to bring you Franklin Large Cap Growth Securities Fund’s annual report for the fiscal year ended December 31, 2003.
Performance Overview
You can find the Fund’s one-year total return in the Performance Summary following this report. The Fund’s underperformed its benchmarks, the Standard & Poor’s 500 Composite Index (S&P 500) and Russell 1000 Growth Index, which returned 28.67% and 29.75% for the year under review.2
Economic and Market Overview
During the year ended December 31, 2003, many factors impacted global economies and financial markets. Early in the year, economic uncertainty and geopolitical events, including impending war in Iraq, pushed U.S. interest rates to their lowest level in more than four decades, and the 10-year U.S. Treasury note’s yield fell to 3.13% in mid-June. However, following the end of major conflict in Iraq, many economic indicators turned positive. The U.S. government injected fiscal stimulus into the economy, approving another round of tax cuts and rebates that included dividend and capital gains tax reductions. In June, an accommodative Federal Reserve Board, in an attempt to bolster the economy, cut the federal funds target rate to 1.00%.
During the year, the U.S. trade deficit increased significantly, contributing to the U.S. dollar’s fall to record lows against the euro and other major currencies. However, the weak dollar provided a boost to the U.S. economy and corporate profits as exports became cheaper for foreign buyers. Robust consumer spending, especially for autos and homes, and strong business spending, particularly for equipment and software, contributed to the accelerated economic activity. In addition, U.S. federal spending stayed firm and inflation remained benign. U.S.
1. Please see Index Descriptions following the Fund Summaries.
2. Source: Standard & Poor’s Micropal. One cannot invest directly in an index, nor is an index representative of the Fund’s portfolio. Please see Index Descriptions following the Fund Summaries.
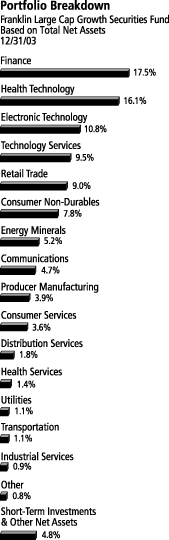
FL-1
gross domestic product (GDP) grew an annualized 8.2% in third quarter 2003, its strongest pace in nearly 20 years, and overall, 2003 GDP grew an estimated 3.1%. As economic data improved, some interest rates rose from their lows, and the 10-year Treasury note’s yield ended the period at 4.27%.
An equity market rally started in late March 2003 and continued through the end of the year. The rebound began with investors anticipating economic recovery in the second half of 2003, and it continued as data showed robust economic growth. Improved sentiment led many investors to rotate into economically sensitive and financially leveraged companies, specifically cyclical, technology, small-capitalization and emerging market stocks. The S&P 500 rose 28.67% for the 12 months ended December 31, 2003, while the technology-heavy Nasdaq Composite Index increased 50.93%.3
Investment Strategy
We are research driven, fundamental investors pursuing a growth strategy. As bottom-up investors focusing primarily on individual securities, we choose companies that we believe are positioned for growth in revenues, earnings or assets. In choosing investments, we focus on large-cap companies that have exhibited above average growth, strong financial records, or compelling valuations. In addition, we also consider management expertise, industry leadership, growth in market share and sustainable competitive advantage.
Manager’s Discussion
Looking back on the key factors impacting the Fund’s returns during 2003, we would like to remind our shareholders that our investment strategy is primarily bottom-up and individual stock selection-driven. However, we do recognize that our investors have interest in a top-down, industry- and sector-based discussion of key performance drivers.
On a sector-weighted basis compared with the S&P 500, the Fund’s top positive contributors to performance in 2003 were our overweighted position in the retail trade sector and our underweighted position in consumer non-durables. In retail trade, the Fund’s overweighted positions in Tuesday Morning, Cost Plus, Best Buy, Rent-A-Center and Nordstrom benefited performance, as did our significant underweighting in Wal-Mart, which performed poorly in 2003. We sold Cost Plus, Best Buy and Nordstrom by year-end.
3. Source: Standard & Poor’s Micropal. Please see Index Descriptions following the Fund Summaries.
FL-2
Other significant positive contributors to the Fund’s performance relative to the S&P 500 on an individual holdings basis included overweighted positions in finance-related companies CIT Group, Countrywide Financial and MBIA; electronic technology companies Amdocs (sold by year-end), Xilinx, Motorola, Applied Materials, Agilent Technologies and Linear Technology; and consumer services companies Cendant and McDonald’s.
Despite the Fund’s double-digit returns, there were some detractors to performance. Among these, most significant on a sector weightings basis were our overweighted positions in communications and technology services, including software. Overweighted positions in technology services companies Automatic Data Processing and Concord EFS also negatively impacted the Fund’s results, as did an overweighted position in software company Microsoft. Among our communications holdings, overweighted positions in telecommunications-related companies AT&T, SBC Communications and Sprint hindered performance. Total returns were also negatively affected by overweighted positions in aircraft manufacturer Boeing, energy company Anadarko Petroleum, pharmaceutical company Pfizer and finance company Fifth Third Bancorp. The Fund also witnessed poor relative performance among its underweighted positions in electronic technology companies Intel and Cisco Systems.
Some notable changes in the Fund’s positioning over the second half of the year included a significant increase in the energy minerals sector — in absolute terms as well as in comparison with the S&P 500. This was driven in part by our purchases of Exxon Mobil and Devon Energy. By year-end, the Fund’s energy minerals sector weighting stood at 5.2% of total net assets, slightly higher than the weighting in the S&P 500. We also gradually increased the Fund’s electronic technology sector weighting. This move was driven, in part, by our incremental purchases of Cisco Systems, Lexmark, Motorola, Lockheed Martin and Seagate Technology shares. At period-end, the Fund’s weighting in electronic technology stood at 10.8% of total net assets, just fractionally lower than the S&P 500’s weighting. Toward the very end of 2003, we sought to take advantage of a general decline in share prices and valuations in the retail trade sector to build an overweighted position there — 9.0% of total net assets versus 7.2% for the S&P 500 at year-end. Before this adjustment, the Fund’s mid-year 2003 retail trade sector weighting was approximately equal to that of the S&P 500. Specifically, the increase was driven in
Top 10 Holdings
Franklin Large Cap Growth Securities Fund
12/31/03
| | |
Company Sector/Industry | | % of Total
Net Assets |
|
| |
| Pfizer Inc. | | 3.4% |
| Health Technology | | |
| |
| Microsoft Corp. | | 3.2% |
| Technology Services | | |
| |
| Exxon Mobil Corp. | | 2.6% |
| Energy Minerals | | |
| |
| General Electric Co. | | 2.2% |
| Producer Manufacturing | | |
| |
| Wal-Mart Stores Inc. | | 2.0% |
| Retail Trade | | |
| |
| Citigroup Inc. | | 1.9% |
| Finance | | |
| |
| Altria Group Inc. | | 1.9% |
| Consumer Non-Durables | | |
| |
| Johnson & Johnson | | 1.8% |
| Health Technology | | |
| |
| American International Group Inc. | | 1.6% |
| Finance | | |
| |
Marsh & McLennan
Cos. Inc. | | 1.6% |
| Finance | | |
The dollar value, number of shares or principal amount, and complete legal titles of all portfolio holdings are listed in the Fund’s Statement of Investments.
FL-3
part by purchases of retailers such as Wal-Mart, Kohl’s, Ross Stores, Dollar Tree Stores and Family Dollar Stores.
Meanwhile, we gradually reduced the Fund’s exposure to the consumer services sector with partial sales of various stocks including Disney, Clear Channel Communications and McDonald’s. We also reduced the Fund’s stake in utilities as we sold off all shares of American Electric Power and TXU.
At year-end, one of the Fund’s largest sector weightings was health technology, constituting 16.1% of total net assets versus 12.6% in the S&P 500. Our selections among health technology stocks were composed primarily of overweighted positions in various large-capitalization and specialty pharmaceutical companies such as Pfizer, Merck, Wyeth, Johnson & Johnson, Forest Labs and King Pharmaceuticals. While we recognized significant challenges facing the pharmaceuticals industry, we believed the mitigating factors were abundantly reflected in their attractive stock price valuations, and thus sought to create some very attractive long-term investment opportunities, consistent with our investment strategy.
Thank you for your continued interest in Franklin Large Cap Growth Securities Fund. We look forward to serving your future investment needs.
This discussion reflects our analysis, opinions and portfolio holdings as of December 31, 2003, the end of the reporting period. The way we implement our main investment strategies and the resulting portfolio holdings may change depending on factors such as market and economic conditions. These opinions may not be relied upon as investment advice or an offer for a particular security. The information is not a complete analysis of every aspect of any market, country, industry, security or the Fund. Statements of fact are from sources considered reliable, but the advisor makes no representation or warranty as to their completeness or accuracy. Although historical performance is no guarantee of future results, these insights may help you understand our investment management philosophy.
FL-4
PERFORMANCE SUMMARYASOF 12/31/03
Total return of Class 2 shares represents the average annual change in value, assuming reinvestment of dividends and capital gains. Average returns smooth out variations in returns, which can be significant; they are not the same as year-by-year results.
Franklin Large Cap Growth Securities Fund – Class 2*
Periods ended 12/31/03
| | | | | | |
| | | 1-Year | | 5-Year | | Since
Inception
(5/1/96) |
|
| | | |
Average Annual Total Return | | +26.95% | | +3.63% | | +8.97% |
*Because Class 2 shares were not offered until 1/6/99, standardized Class 2 Fund performance for prior periods represents the historical results of Class 1 shares. For periods beginning on 1/6/99, Class 2’s results reflect an additional 12b-1 fee expense, which also affects future performance. Since 1/6/99 (effective date), the average annual total return of Class 2 shares was +3.14%.
Ongoing market volatility can significantly affect short-term performance; recent returns may differ.
Total Return Index Comparison
for Hypothetical $10,000 Investment (5/1/96–12/31/03)
The graph compares the performance of Franklin Large Cap Growth Securities Fund – Class 2,* the S&P 500 and the Russell 1000 Growth Index. One cannot invest directly in an index, nor is an index representative of the Fund’s portfolio. Please see Important Notes to Performance Information preceding the Fund Summaries.

**Source: Standard & Poor’s Micropal. Please see Index Descriptions following the Fund Summaries.
.
Franklin Large Cap Growth Securities Fund – Class 2
Performance reflects the Fund’s Class 2 operating expenses, but does not include any contract fees, expenses or sales charges. If they had been included, performance would be lower. These charges
and deductions, particularly for variable life policies, can have a significant effect on contract values and insurance benefits. See the contract prospectus for a complete description of these expenses, including sales charges.
Since markets can go down as well as up, investment return and the value of your principal will fluctuate with market conditions, and you may have a gain or loss when you sell your shares.
Past performance does not guarantee future results.
FL-5
FRANKLIN TEMPLETON VARIABLE INSURANCE PRODUCTS TRUST
FRANKLIN LARGE CAP GROWTH SECURITIES FUND
Financial Highlights
| | | | | | | | | | | | | | | | | | | | |
| | | Class 1
| |
| | | Year Ended December 31,
| |
| | | 2003 | | | 2002 | | | 2001 | | | 2000 | | | 1999 | |
| | |
|
|
|
Per share operating performance | | | | | | | | | | | | | | | | | | | | |
(for a share outstanding throughout the year) | | | | | | | | | | | | | | | | | | | | |
| | | | | |
Net asset value, beginning of year | | $ | 11.10 | | | $ | 14.52 | | | $ | 21.03 | | | $ | 21.07 | | | $ | 16.08 | |
| | |
|
|
|
Income from investment operations: | | | | | | | | | | | | | | | | | | | | |
Net investment incomea | | | .10 | | | | .09 | | | | .10 | | | | .09 | | | | .11 | |
Net realized and unrealized gains (losses) | | | 2.90 | | | | (3.41 | ) | | | (2.13 | ) | | | 1.14 | | | | 4.96 | |
| | |
|
|
|
Total from investment operations | | | 3.00 | | | | (3.32 | ) | | | (2.03 | ) | | | 1.23 | | | | 5.07 | |
| | |
|
|
|
Less distributions from: | | | | | | | | | | | | | | | | | | | | |
Net investment income | | | (.09 | ) | | | (.10 | ) | | | (.11 | ) | | | (.11 | ) | | | (.08 | ) |
Net realized gains | | | — | | | | — | | | | (4.37 | ) | | | (1.16 | ) | | | — | |
| | |
|
|
|
Total distributions | | | (.09 | ) | | | (.10 | ) | | | (4.48 | ) | | | (1.27 | ) | | | (.08 | ) |
| | |
|
|
|
Net asset value, end of year | | $ | 14.01 | | | $ | 11.10 | | | $ | 14.52 | | | $ | 21.03 | | | $ | 21.07 | |
| | |
|
|
|
| | | | | |
Total returnb | | | 27.14% | | | | (22.94%) | | | | (11.26)% | | | | 5.75% | | | | 31.65% | |
| | | | | |
Ratios/supplemental data | | | | | | | | | | | | | | | | | | | | |
Net assets, end of year (000’s) | | $ | 191,028 | | | $ | 175,917 | | | $ | 300,135 | | | $ | 431,384 | | | $ | 407,515 | |
Ratios to average net assets: | | | | | | | | | | | | | | | | | | | | |
Expenses | | | .79% | | | | .80% | | | | .78% | | | | .78% | | | | .77% | |
Net investment income | | | .86% | | | | .73% | | | | .56% | | | | .43% | | | | .63% | |
Portfolio turnover rate | | | 35.28% | | | | 59.65% | | | | 75.67% | | | | 70.16% | | | | 41.78% | |
| a | Based on average daily shares outstanding. |
| b | Total return does not include any fees, charges or expenses imposed by the variable annuity and life insurance contracts for which the Franklin Templeton Variable Insurance Products Trust serves as an underlying investment vehicle. Total return is not annualized for periods less than one year. |
FL-6
FRANKLIN TEMPLETON VARIABLE INSURANCE PRODUCTS TRUST
FRANKLIN LARGE CAP GROWTH SECURITIES FUND
Financial Highlights (continued)
| | | | | | | | | | | | | | | | | | | | |
| | | Class 2
| |
| | | Year Ended December 31,
| |
| | | 2003 | | | 2002 | | | 2001 | | | 2000 | | | 1999c | |
| | |
|
|
|
Per share operating performance | | | | | | | | | | | | | | | | | | | | |
(for a share outstanding throughout the year) | | | | | | | | | | | | | | | | | | | | |
Net asset value, beginning of year | | $ | 11.00 | | | $ | 14.43 | | | $ | 20.93 | | | $ | 21.01 | | | $ | 16.47 | |
| | |
|
|
|
Income from investment operations: | | | | | | | | | | | | | | | | | | | | |
Net investment incomea | | | .08 | | | | .07 | | | | .05 | | | | .03 | | | | .04 | |
Net realized and unrealized gains (losses) | | | 2.87 | | | | (3.40 | ) | | | (2.12 | ) | | | 1.13 | | | | 4.58 | |
| | |
|
|
|
Total from investment operations | | | 2.95 | | | | (3.33 | ) | | | (2.07 | ) | | | 1.16 | | | | 4.62 | |
| | |
|
|
|
Less distributions from: | | | | | | | | | | | | | | | | | | | | |
Net investment income | | | (.08 | ) | | | (.10 | ) | | | (.06 | ) | | | (.08 | ) | | | (.08 | ) |
Net realized gains | | | — | | | | — | | | | (4.37 | ) | | | (1.16 | ) | | | — | |
| | |
|
|
|
Total distributions | | | (.08 | ) | | | (.10 | ) | | | (4.43 | ) | | | (1.24 | ) | | | (.08 | ) |
| | |
|
|
|
Net asset value, end of year | | $ | 13.87 | | | $ | 11.00 | | | $ | 14.43 | | | $ | 20.93 | | | $ | 21.01 | |
| | |
|
|
|
Total returnb | | | 26.95% | | | | (23.19)% | | | | (11.43)% | | | | 5.46% | | | | 28.11% | |
| | | | | |
Ratios/supplemental data | | | | | | | | | | | | | | | | | | | | |
Net assets, end of year (000’s) | | $ | 128,029 | | | $ | 30,289 | | | $ | 5,290 | | | $ | 1,081 | | | $ | 542 | |
Ratios to average net assets: | | | | | | | | | | | | | | | | | | | | |
Expenses | | | 1.04% | | | | 1.05% | | | | 1.03% | | | | 1.03% | | | | 1.02% | d |
Net investment income | | | .61% | | | | .48% | | | | .30% | | | | .17% | | | | 0.22% | d |
Portfolio turnover rate | | | 35.28% | | | | 59.65% | | | | 75.67% | | | | 70.16% | | | | 41.78% | |
| a | Based on average daily shares outstanding. |
| b | Total return does not include any fees, charges or expenses imposed by the variable annuity and life insurance contracts for which the Franklin Templeton Variable Insurance Products Trust serves as an underlying investment vehicle. Total return is not annualized for periods less than one year. |
| c | For the period January 6, 1999 (effective date) to December 31, 1999. |
See notes to financial statements.
FL-7
FRANKLIN TEMPLETON VARIABLE INSURANCE PRODUCTS TRUST
FRANKLIN LARGE CAP GROWTH SECURITIES FUND
Statement of Investments, December 31, 2003
| | | | | |
| | | SHARES | | VALUE |
|
Common Stocks 95.2% | | | | | |
Communications 4.7% | | | | | |
AT&T Corp. | | 140,000 | | $ | 2,842,000 |
BellSouth Corp. | | 80,900 | | | 2,289,470 |
SBC Communications Inc. | | 136,100 | | | 3,548,127 |
Sprint Corp. (FON Group) | | 165,000 | | | 2,709,300 |
Verizon Communications Inc. | | 106,000 | | | 3,718,480 |
| | | | |
|
|
| | | | | | 15,107,377 |
| | | | |
|
|
Consumer Durables .4% | | | | | |
aElectronic Arts Inc. | | 24,600 | | | 1,175,388 |
aLeapfrog Enterprises Inc. | | 100 | | | 2,653 |
| | | | |
|
|
| | | | | | 1,178,041 |
| | | | |
|
|
Consumer Non-Durables 7.8% | | | | | |
Adolph Coors Co., B | | 31,300 | | | 1,755,930 |
Altria Group Inc. | | 111,700 | | | 6,078,714 |
Coca-Cola Co. | | 51,000 | | | 2,588,250 |
Colgate-Palmolive Co. | | 71,200 | | | 3,563,560 |
Kimberly-Clark Corp. | | 41,000 | | | 2,422,690 |
Loews Corp. – Carolina Group | | 60,000 | | | 1,514,400 |
PepsiCo Inc. | | 32,000 | | | 1,491,840 |
Procter & Gamble Co. | | 27,000 | | | 2,696,760 |
Sara Lee Corp. | | 124,000 | | | 2,692,040 |
| | | | |
|
|
| | | | | | 24,804,184 |
| | | | |
|
|
Consumer Services 3.6% | | | | | |
aCendant Corp. | | 100,000 | | | 2,227,000 |
Clear Channel Communications Inc. | | 25,700 | | | 1,203,531 |
aComcast Corp. | | 43,996 | | | 1,446,149 |
Darden Restaurants Inc. | | 60,000 | | | 1,262,400 |
McDonald’s Corp. | | 74,000 | | | 1,837,420 |
The New York Times Co., A | | 31,000 | | | 1,481,490 |
aUnivision Communications Inc., A | | 29,683 | | | 1,178,118 |
The Walt Disney Co. | | 42,000 | | | 979,860 |
| | | | |
|
|
| | | | | | 11,615,968 |
| | | | |
|
|
Distribution Services 1.8% | | | | | |
AmerisourceBergen Corp. | | 65,500 | | | 3,677,825 |
McKesson Corp. | | 60,000 | | | 1,929,600 |
| | | | |
|
|
| | | | | | 5,607,425 |
| | | | |
|
|
Electronic Technology 10.8% | | | | | |
aAgilent Technologies Inc. | | 52,000 | | | 1,520,480 |
aApplied Materials Inc. | | 165,000 | | | 3,704,250 |
aCisco Systems Inc. | | 180,000 | | | 4,372,200 |
Intel Corp. | | 120,000 | | | 3,864,000 |
aLexmark International Inc. | | 20,200 | | | 1,588,528 |
Linear Technology Corp. | | 65,000 | | | 2,734,550 |
Lockheed Martin Corp. | | 78,600 | | | 4,040,040 |
Motorola Inc. | | 153,400 | | | 2,158,338 |
Nokia Corp., ADR (Finland) | | 100,800 | | | 1,713,600 |
Qualcomm Inc. | | 34,000 | | | 1,833,620 |
FL-8
FRANKLIN TEMPLETON VARIABLE INSURANCE PRODUCTS TRUST
FRANKLIN LARGE CAP GROWTH SECURITIES FUND
Statement of Investments, December 31, 2003 (cont.)
| | | | | |
| | | SHARES | | VALUE |
|
Common Stocks (cont.) | | | | | |
Electronic Technology (cont.) | | | | | |
aSeagate Technology | | 186,200 | | $ | 3,519,180 |
aXilinx Inc. | | 84,000 | | | 3,254,160 |
| | | | |
|
|
| | | | | | 34,302,946 |
| | | | |
|
|
Energy Minerals 5.2% | | | | | |
Anadarko Petroleum Corp. | | 55,000 | | | 2,805,550 |
Devon Energy Corp. | | 56,000 | | | 3,206,560 |
Exxon Mobil Corp. | | 203,400 | | | 8,339,400 |
Royal Dutch Petroleum Co., N.Y. shs. (Netherlands) | | 40,000 | | | 2,095,600 |
| | | | |
|
|
| | | | | | 16,447,110 |
| | | | |
|
|
Finance 17.5% | | | | | |
American International Group Inc. | | 79,200 | | | 5,249,376 |
Bank of America Corp. | | 38,000 | | | 3,056,340 |
Bank of New York Co. Inc. | | 90,000 | | | 2,980,800 |
Bank One Corp. | | 42,000 | | | 1,914,780 |
aBerkshire Hathaway Inc., B | | 300 | | | 844,500 |
CIT Group Inc. | | 95,300 | | | 3,426,035 |
Citigroup Inc. | | 127,000 | | | 6,164,580 |
Countrywide Financial Corp. | | 45,333 | | | 3,438,508 |
Fannie Mae | | 38,000 | | | 2,852,280 |
Fifth Third Bancorp | | 69,100 | | | 4,083,810 |
Freddie Mac | | 69,700 | | | 4,064,904 |
Goldman Sachs Group Inc. | | 30,000 | | | 2,961,900 |
Marsh & McLennan Cos. Inc. | | 108,300 | | | 5,186,487 |
MBIA Inc. | | 24,000 | | | 1,421,520 |
The PMI Group Inc. | | 20,000 | | | 744,600 |
Washington Mutual Inc. | | 76,000 | | | 3,049,120 |
Wells Fargo & Co. | | 75,000 | | | 4,416,750 |
| | | | |
|
|
| | | | | | 55,856,290 |
| | | | |
|
|
Health Services 1.4% | | | | | |
CIGNA Corp. | | 1,200 | | | 69,000 |
HCA Inc. | | 69,900 | | | 3,002,904 |
Universal Health Services Inc., B | | 27,000 | | | 1,450,440 |
| | | | |
|
|
| | | | | | 4,522,344 |
| | | | |
|
|
Health Technology 16.1% | | | | | |
Abbott Laboratories | | 73,000 | | | 3,401,800 |
aAmgen Inc. | | 71,000 | | | 4,387,800 |
aBiogen Idec Inc. | | 50,000 | | | 1,839,000 |
Bristol-Myers Squibb Co. | | 94,000 | | | 2,688,400 |
aForest Laboratories Inc. | | 68,000 | | | 4,202,400 |
aGilead Sciences Inc. | | 17,000 | | | 988,380 |
Johnson & Johnson Inc. | | 113,200 | | | 5,847,912 |
aKing Pharmaceuticals Inc. | | 225,000 | | | 3,433,500 |
Medtronic Inc. | | 75,000 | | | 3,645,750 |
Merck & Co. Inc. | | 110,000 | | | 5,082,000 |
Pfizer Inc. | | 310,000 | | | 10,952,300 |
aShire Pharmaceuticals Group PLC, ADR (United Kingdom) | | 59,600 | | | 1,731,380 |
Wyeth | | 77,000 | | | 3,268,650 |
| | | | |
|
|
| | | | | | 51,469,272 |
| | | | |
|
|
FL-9
FRANKLIN TEMPLETON VARIABLE INSURANCE PRODUCTS TRUST
FRANKLIN LARGE CAP GROWTH SECURITIES FUND
Statement of Investments, December 31, 2003 (cont.)
| | | | | |
| | | SHARES | | VALUE |
|
Common Stocks (cont.) | | | | | |
Industrial Services .9% | | | | | |
Schlumberger Ltd. | | 50,000 | | $ | 2,736,000 |
| | | | |
|
|
Process Industries .4% | | | | | |
Georgia-Pacific Corp. | | 39,600 | | | 1,214,532 |
| | | | |
|
|
Producer Manufacturing 3.9% | | | | | |
General Electric Co. | | 225,000 | | | 6,970,500 |
aMettler-Toledo International Inc. (Switzerland) | | 38,200 | | | 1,612,422 |
United Technologies Corp. | | 42,200 | | | 3,999,294 |
| | | | |
|
|
| | | | | | 12,582,216 |
| | | | |
|
|
Retail Trade 9.0% | | | | | |
aAutoZone Inc. | | 27,800 | | | 2,368,838 |
CVS Corp. | | 25,400 | | | 917,448 |
Dillards Inc., A | | 50,000 | | | 823,000 |
aDollar Tree Stores Inc. | | 135,700 | | | 4,079,142 |
Family Dollar Stores Inc. | | 84,500 | | | 3,031,860 |
aKohl’s Corp. | | 65,500 | | | 2,943,570 |
aRent-A-Center Inc. | | 51,000 | | | 1,523,880 |
Ross Stores Inc. | | 68,200 | | | 1,802,526 |
Target Corp. | | 39,300 | | | 1,509,120 |
aTuesday Morning Corp. | | 91,700 | | | 2,773,925 |
Wal-Mart Stores Inc. | | 122,600 | | | 6,503,930 |
Walgreen Co. | | 16,000 | | | 582,080 |
| | | | |
|
|
| | | | | | 28,859,319 |
| | | | |
|
|
Technology Services 9.5% | | | | | |
aAccenture Ltd., A (Bermuda) | | 20,000 | | | 526,400 |
aAffiliated Computer Services Inc., A | | 66,700 | | | 3,632,482 |
Automatic Data Processing Inc. | | 100,000 | | | 3,961,000 |
Computer Associates International Inc. | | 76,400 | | | 2,088,776 |
aComputer Sciences Corp. | | 35,000 | | | 1,548,050 |
aConcord EFS Inc. | | 53,000 | | | 786,520 |
First Data Corp. | | 53,600 | | | 2,202,424 |
International Business Machines Corp. | | 46,000 | | | 4,263,280 |
Microsoft Corp. | | 374,000 | | | 10,299,960 |
Paychex Inc. | | 25,800 | | | 959,760 |
| | | | |
|
|
| | | | | | 30,268,652 |
| | | | |
|
|
Transportation 1.1% | | | | | |
Expeditors International of Washington Inc. | | 90,000 | | | 3,389,400 |
| | | | |
|
|
Utilities 1.1% | | | | | |
DTE Energy Co. | | 50,000 | | | 1,970,000 |
Exelon Corp. | | 25,500 | | | 1,692,180 |
| | | | |
|
|
| | | | | | 3,662,180 |
| | | | |
|
|
Total Common Stocks (Cost $256,358,343) | | | | | 303,623,256 |
| | | | |
|
|
FL-10
FRANKLIN TEMPLETON VARIABLE INSURANCE PRODUCTS TRUST
FRANKLIN LARGE CAP GROWTH SECURITIES FUND
Statement of Investments, December 31, 2003 (cont.)
| | | | | | | |
| | | PRINCIPAL
AMOUNT | | VALUE | |
| |
bRepurchase Agreement (Cost $23,925,553) 7.5% | | | | | | | |
Joint Repurchase Agreement, .873%, 01/02/04 (Maturity Value $23,926,713)
| | $ | 23,925,553 | | $ | 23,925,553 | |
ABN AMRO Bank, N.V., New York Branch (Maturity Value $2,229,013) | | | | | | | |
Banc of America Securities LLC (Maturity Value $2,229,013) Barclays Capital Inc. (Maturity Value $1,591,844) Bear, Sterns & Co. Inc. (Maturity Value $1,273,619) BNP Paribas Securities Corp. (Maturity Value $2,229,013) Deutsche Bank Securities Inc. (Maturity Value $2,229,013) Dresdner Kleinwort Wasserstein Securities LLC (Maturity Value $2,229,013) Goldman, Sachs & Co. (Maturity Value $1,273,619) Greenwich Capital Markets Inc. (Maturity Value $2,229,013) Lehman Brothers Inc. (Maturity Value $1,955,527) Morgan Stanley & Co. Inc. (Maturity Value $2,229,013) UBS Securities LLC (Maturity Value $2,229,013) | | | | | | | |
Collateralized by U.S. Treasury Bills, Notes, and Bonds, and U.S Government Agency Securities | | | | | | | |
| | | | | |
|
|
|
Total Investments (Cost $280,283,896) 102.7% | | | | | | 327,548,809 | |
Other Assets, less Liabilities (2.7)% | | | | | | (8,491,646 | ) |
| | | | | |
|
|
|
Net Assets 100.0% | | | | | $ | 319,057,163 | |
| | | | | |
|
|
|
| b | See Note 1(b) regarding joint repurchase agreement. |
See notes to financial statements.
FL-11
FRANKLIN TEMPLETON VARIABLE INSURANCE PRODUCTS TRUST
FRANKLIN LARGE CAP GROWTH SECURITIES FUND
Financial Statements
Statement of Assets and Liabilities
December 31, 2003
| | | |
Assets: | | | |
Investments in securities: | | | |
Cost | | $ | 280,283,896 |
| | |
|
|
Value | | | 327,548,809 |
Receivables: | | | |
Capital shares sold | | | 463,515 |
Dividends | | | 428,788 |
| | |
|
|
Total assets | | | 328,441,112 |
| | |
|
|
Liabilities: | | | |
Payables: | | | |
Investment securities purchased | | | 9,067,775 |
Capital shares redeemed | | | 47,500 |
Affiliates | | | 239,672 |
Other liabilities | | | 29,002 |
| | |
|
|
Total liabilities | | | 9,383,949 |
| | |
|
|
Net assets, at value | | $ | 319,057,163 |
| | |
|
|
Net assets consist of: | | | |
Undistributed net investment income | | $ | 1,927,301 |
Net unrealized appreciation (depreciation) | | | 47,264,913 |
Accumulated net realized gain (loss) | | | (51,262,288) |
Capital shares | | | 321,127,237 |
| | |
|
|
Net assets, at value | | $ | 319,057,163 |
| | |
|
|
Class 1: | | | |
Net assets, at value | | $ | 191,027,888 |
| | |
|
|
Shares outstanding | | | 13,631,696 |
| | |
|
|
Net asset value and offering price per share | | $ | 14.01 |
| | |
|
|
Class 2: | | | |
Net assets, at value | | $ | 128,029,275 |
| | |
|
|
Shares outstanding | | | 9,231,409 |
| | |
|
|
Net asset value and offering price per share | | $ | 13.87 |
| | |
|
|
See notes to financial statements.
FL-12
FRANKLIN TEMPLETON VARIABLE INSURANCE PRODUCTS TRUST
FRANKLIN LARGE CAP GROWTH SECURITIES FUND
Financial Statements (continued)
Statement of Operations
for the year ended December 31, 2003
| | | |
Investment income: | | | |
Dividends | | $ | 3,809,496 |
Interest | | | 196,816 |
| | |
|
|
Total investment income | | | 4,006,312 |
| | |
|
|
Expenses: | | | |
Management fees (Note 3) | | | 1,822,675 |
Distribution fees - Class 2 (Note 3) | | | 166,192 |
Transfer agent fees | | | 1,182 |
Custodian fees | | | 2,430 |
Reports to shareholders | | | 53,807 |
Professional fees | | | 16,484 |
Trustees’ fees and expenses | | | 2,324 |
Other | | | 13,510 |
| | |
|
|
Total expenses | | | 2,078,604 |
| | |
|
|
Net investment income | | | 1,927,708 |
| | |
|
|
Realized and unrealized gains (losses): | | | |
Net realized gain (loss) from investments | | | 1,479,180 |
Net unrealized appreciation (depreciation) on investments | | | 56,887,471 |
| | |
|
|
Net realized and unrealized gain (loss) | | | 58,366,651 |
| | |
|
|
Net increase (decrease) in net assets resulting from operations | | $ | 60,294,359 |
| | |
|
|
See notes to financial statements.
FL-13
FRANKLIN TEMPLETON VARIABLE INSURANCE PRODUCTS TRUST
FRANKLIN LARGE CAP GROWTH SECURITIES FUND
Financial Statements (continued)
Statements of Changes in Net Assets
For the year ended December 31, 2003 and 2002
| | | | | | | | |
| | | 2003 | | | 2002 | |
| | |
| |
Increase (decrease) in net assets: | | | | | | | | |
Operations: | | | | | | | | |
Net investment income | | $ | 1,927,708 | | | $ | 1,758,425 | |
Net realized gain (loss) from investments | | | 1,479,180 | | | | (30,320,684 | ) |
Net unrealized appreciation (depreciation) on investments | | | 56,887,471 | | | | (38,629,313 | ) |
| | |
| |
Net increase (decrease) in net assets resulting from operations | | | 60,294,359 | | | | (67,191,572 | ) |
Distributions to shareholders from: | | | | | | | | |
Net investment income: | | | | | | | | |
Class 1 | | | (1,331,195 | ) | | | (1,919,600 | ) |
Class 2 | | | (427,106 | ) | | | (96,711 | ) |
| | |
| |
Total distributions to shareholders | | | (1,758,301 | ) | | | (2,016,311 | ) |
Capital share transactions: (Note 2) | | | | | | | | |
Class 1 | | | (26,198,818 | ) | | | (58,273,965 | ) |
Class 2 | | | 80,514,244 | | | | 28,262,526 | |
| | |
| |
Total capital share transactions | | | 54,315,426 | | | | (30,011,439 | ) |
Net increase (decrease) in net assets | | | 112,851,484 | | | | (99,219,322 | ) |
Net assets: | | | | | | | | |
Beginning of year | | | 206,205,679 | | | | 305,425,001 | |
| | |
| |
End of year | | $ | 319,057,163 | | | $ | 206,205,679 | |
| | |
| |
Undistributed net investment income included in net assets: | | | | | | | | |
End of year | | $ | 1,927,301 | | | $ | 1,757,894 | |
| | |
| |
See notes to financial statements.
FL-14
FRANKLIN TEMPLETON VARIABLE INSURANCE PRODUCTS TRUST
FRANKLIN LARGE CAP GROWTH SECURITIES FUND
Notes to Financial Statements
1. ORGANIZATION AND SIGNIFICANT ACCOUNTING POLICIES
Franklin Templeton Variable Insurance Products Trust (the Trust) is registered under the Investment Company Act of 1940 as an open-end investment company, consisting of twenty-two separate series (the Funds). Franklin Large Cap Growth Securities Fund (the Fund) included in this report is diversified. Shares of the Fund are sold only to insurance company separate accounts to fund the benefits of variable life insurance policies or variable annuity contracts. As of December 31, 2003, over 79% of the total Fund shares were sold through one insurance company. The Fund’s investment objective is capital growth.
The following summarizes the Fund’s significant accounting policies.
a. Security Valuation
Securities listed or traded on a recognized national exchange or NASDAQ are valued at the last reported sales price. Over-the-counter securities and listed securities for which no sale is reported are valued within the range of the latest quoted bid and asked prices. If events occur that materially affect the values of securities after the prices are determined, or if market quotations are not readily available, the securities will be valued at fair value as determined following procedures approved by the Board of Trustees.
b. Joint Repurchase Agreements
The Fund may enter into a joint repurchase agreement whereby its uninvested cash balance is deposited into a joint cash account to be used to invest in one or more repurchase agreements. The value and face amount of the joint repurchase agreement are allocated to the Fund based on its pro-rata interest. A repurchase agreement is accounted for as a loan by the Fund to the seller, collateralized by securities which are delivered to the Fund’s custodian. The market value, including accrued interest, of the initial collateralization is required to be at least 102% of the dollar amount invested by the Fund, with the value of the underlying securities marked to market daily to maintain coverage of at least 100%. At December 31, 2003, all repurchase agreements had been entered into on that date.
c. Income Taxes
No provision has been made for income taxes because the fund’s policy is to qualify as a regulated investment company under the Internal Revenue Code and to distribute substantially all of its taxable income.
d. Security Transactions, Investment Income, Expenses and Distributions
Security transactions are accounted for on trade date. Realized gains and losses on security transactions are determined on a specific identification basis. Interest income and estimated expenses are accrued daily. Dividend income and distributions to shareholders are recorded on the ex-dividend date.
Common expenses incurred by the Trust are allocated among the Funds based on the ratio of net assets of each Fund to the combined net assets. Other expenses are charged to each Fund on a specific identification basis.
Realized and unrealized gains and losses and net investment income, other than class specific expenses, are allocated daily to each class of shares based upon the relative proportion of net assets of each class.
e. Accounting Estimates
The preparation of financial statements in accordance with accounting principles generally accepted in the United States of America requires management to make estimates and assumptions that affect the reported amounts of assets and liabilities at the date of the financial statements and the amounts of income and expenses during the reporting period. Actual results could differ from those estimates.
FL-15
FRANKLIN TEMPLETON VARIABLE INSURANCE PRODUCTS TRUST
FRANKLIN LARGE CAP GROWTH SECURITIES FUND
Notes to Financial Statements (continued)
1. ORGANIZATION AND SIGNIFICANT ACCOUNTING POLICIES (cont.)
f. Guarantees and Indemnifications
Under the Trust’s organizational documents, its officers and trustees are indemnified against certain liability arising out of the performance of their duties to the Trust. Additionally, in the normal course of business, the Trust enters into contracts with service providers that contain general indemnification clauses. The Trust’s maximum exposure under these arrangements is unknown as this would involve future claims that may be made against the Trust that have not yet occurred. However, based on experience, the Trust expects the risk of loss to be remote.
2. SHARES OF BENEFICIAL INTEREST
The Fund offers two classes of shares: Class 1 and Class 2. Each class of shares differs by its distribution fees, voting rights on matters affecting a single class, and its exchange privilege.
At December 31, 2003, there were an unlimited number of shares authorized ($.01 par value). Transactions in the Fund’ shares were as follows:
| | | | | | | | | | | | | | |
| | | Year Ended December 31,
| |
| | | 2003
| | | 2002
| |
| Class 1 Shares: | | Shares
| | | Amount
| | | Shares
| | | Amount
| |
Shares sold | | 688,775 | | | $ | 8,672,422 | | | 1,297,340 | | | $ | 17,726,425 | |
Shares issued in reinvestment of distributions | | 105,567 | | | | 1,331,195 | | | 149,735 | | | | 1,919,600 | |
Shares redeemed | | (3,017,447 | ) | | | (36,202,435 | ) | | (6,261,147 | ) | | | (77,919,990 | ) |
| | |
| |
Net increase (decrease) | | (2,223,105 | ) | | $ | (26,198,818 | ) | | (4,814,072 | ) | | $ | (58,273,965 | ) |
| | |
| |
| Class 2 Shares: | | | | | | | | | | | | |
Shares sold | | 6,995,198 | | | $ | 86,731,493 | | | 3,035,459 | | | $ | 36,852,947 | |
Shares issued in reinvestment of distributions | | 34,168 | | | | 427,106 | | | 7,597 | | | | 96,711 | |
Shares redeemed | | (550,967 | ) | | | (6,644,355 | ) | | (656,684 | ) | | | (8,687,132 | ) |
| | |
| |
Net increase (decrease) | | 6,478,399 | | | $ | 80,514,244 | | | 2,386,372 | | | $ | 28,262,526 | |
| | |
| |
3. TRANSACTIONS WITH AFFILIATES
Certain officers and trustees of the Fund are also officers and/or directors of the following entities:
| | |
| Entity | | Affiliation |
|
Franklin Templeton Services LLC (FT Services) | | Administrative manager |
Franklin Advisers Inc. (Advisers) | | Investment manager |
Franklin/Templeton Distributors Inc. (Distributors) | | Principal underwriter |
Franklin/Templeton Investor Services LLC (Investor Services) | | Transfer agent |
The Fund pays an investment management fee to Advisers based on the average daily net assets of the Fund as follows:
| | |
| Annualized Fee Rate | | Net Assets |
|
| .75% | | First $500 million |
| .625% | | Over $500 million, up to and including $1 billion |
| .50% | | Over $1 billion |
Under an agreement with Advisers, FT Services provides administrative services to the Fund. The fee is paid by Advisers based on the average daily net assets, and is not an additional expense of the Fund.
FL-16
FRANKLIN TEMPLETON VARIABLE INSURANCE PRODUCTS TRUST
FRANKLIN LARGE CAP GROWTH SECURITIES FUND
Notes to Financial Statements (continued)
3. TRANSACTIONS WITH AFFILIATES (cont.)
The Fund reimburses Distributors up to .25% per year of its average daily net assets of Class 2, for costs incurred in marketing the Fund’s shares.
Investor Services, under terms of an agreement, performs shareholder servicing for the Fund and is not paid by the Fund.
4. INCOME TAXES
At December 31, 2003, the Fund had tax basis capital losses of $49,804,588, which may be carried over to offset future capital gains. Such losses expire as follows:
| | | |
Capital loss carryovers expiring in: | | | |
2009 | | $ | 8,952,191 |
2010 | | | 39,271,476 |
2011 | | | 1,580,921 |
| | |
|
|
| | | $ | 49,804,588 |
| | |
|
|
Net realized gains (losses) differ for financial statement and tax purposes primarily due to differing treatment of wash sales.
The tax character of distributions paid during the year ended December 31, 2003 and 2002, was as follows:
| | | | | | |
| | | 2003
| | 2002
|
Distributions paid from: | | | | | | |
Ordinary income | | $ | 1,758,301 | | $ | 2,016,311 |
Long term capital gain | | | — | | | — |
| | |
|
| | | $ | 1,758,301 | | $ | 2,016,311 |
| | |
|
At December 31, 2003, the cost of investments, net unrealized appreciation, undistributed ordinary income and undistributed long term capital gains for income tax purposes were as follows:
| | | | |
Cost of investments | | $ | 281,741,592 | |
| | |
|
|
|
Unrealized appreciation | | | 52,981,911 | |
Unrealized depreciation | | | (7,174,694 | ) |
| | |
|
|
|
Net unrealized appreciation (depreciation) | | $ | 45,807,217 | |
| | |
|
|
|
Undistributed ordinary income | | $ | 1,927,301 | |
Undistributed long term capital gains | | | — | |
| | |
|
|
|
Distributable earnings | | $ | 1,927,301 | |
| | |
|
|
|
5. INVESTMENT TRANSACTIONS
Purchases and sales of investments (excluding short-term securities) for the year ended December 31, 2003 aggregated $131,548,591 and $80,566,651 respectively.
6. REGULATORY MATTERS
On February 4, 2004, the Securities Division of the Office of the Secretary of the Commonwealth of Massachusetts filed an administrative complaint against Franklin Resources, Inc. and certain of its subsidiaries (the “Company”), alleging violations of the Massachusetts Uniform Securities Act. The complaint arises from activity that occurred in 2001 during which time an officer of a Company subsidiary was negotiating an agreement with an investor relating to investments in a mutual fund and a hedge fund.
FL-17
Franklin Templeton Variable Insurance Products Trust
Franklin Large Cap Growth Securities Fund
Notes to Financial Statements (continued)
6. REGULATORY MATTERS (cont.)
The Company, in addition to other entities within Franklin Templeton Investments, has been named in shareholder class actions related to the matter described above. The Company believes that the claims made in the lawsuit are without merit and it intends to defend vigorously against the allegations. The Company and the Fund may be named in similar civil actions related to the matter described above.
In addition, as part of ongoing investigations by the U.S. Securities and Exchange Commission (the “SEC”), the U.S. Attorney for the Northern District of California, the New York Attorney General, the California Attorney General, the U.S. Attorney for the District of Massachusetts, the Florida Department of Financial Services, and the Commissioner of Securities and the Attorney General of the State of West Virginia, relating to certain practices in the mutual fund industry, including late trading, market timing and sales compensation arrangements, the Company and its subsidiaries, as well as certain current or former executives and employees of the Company, have received requests for information and/or subpoenas to testify or produce documents. The Company and its current employees are providing documents and information in response to these requests and subpoenas. In addition, the Company has responded to requests for similar kinds of information from regulatory authorities in some of the foreign countries where the Company conducts its global asset management business.
The Staff of the SEC has informed the Company that it intends to recommend that the Commission authorize an action against the Fund’s investment adviser and a senior executive officer relating to the frequent trading issues that are the subject of the SEC’s investigation. These issues were previously disclosed as being under investigation by government authorities and the subject of an internal inquiry by the Company in its Annual Report on Form 10-K and on its public website. The Company currently is in discussions with the SEC Staff in an effort to resolve the issues raised in their investigation. Such discussions are preliminary and the Fund’s management has been advised that the Company cannot predict the likelihood of whether those discussions will result in a settlement and, if so, the terms of such settlement. The impact, if any, of these matters on the Fund is uncertain at this time. If the Company finds that it bears responsibility for any unlawful or improper conduct, it has committed to making the Fund or its shareholders whole, as appropriate.
FL-18
FRANKLIN TEMPLETON VARIABLE INSURANCE PRODUCTS TRUST
FRANKLIN LARGE CAP GROWTH SECURITIES FUND
Independent Auditors’ Report
To the Board of Trustees and Shareholders
of Franklin Templeton Variable Insurance Products Trust
In our opinion, the accompanying statement of assets and liabilities, including the statement of investments, and the related statements of operations and of changes in net assets and the financial highlights present fairly, in all material respects, the financial position of the Franklin Large Cap Growth Securities Fund (the Fund) (one of the funds constituting the Franklin Templeton Variable Insurance Products Trust) at December 31, 2003, the results of its operations for the year then ended, the changes in its net assets for each of the two years in the period then ended and the financial highlights for each of the periods presented, in conformity with generally accepted accounting principles. These financial statements and financial highlights (hereafter referred to as “financial statements”) are the responsibility of the Fund’s management; our responsibility is to express an opinion on these financial statements based on our audits. We conducted our audits of these financial statements in accordance with generally accepted auditing standards, which require that we plan and perform the audit to obtain reasonable assurance about whether the financial statements are free of material misstatement. An audit includes examining, on a test basis, evidence supporting the amounts and disclosures in the financial statements, assessing the accounting principles used and significant estimates made by management, and evaluating the overall financial statement presentation. We believe that our audits, which included confirmation of securities at December 31, 2003 by correspondence with the custodian and brokers, provide a reasonable basis for our opinion.
PricewaterhouseCoopers LLP
San Francisco, California
February 5, 2004, except for Note 6 as to which the date is February 12, 2004
FL-19
FRANKLIN TEMPLETON VARIABLE INSURANCE PRODUCTS TRUST
FRANKLIN LARGE CAP GROWTH SECURITIES FUND
Tax Designation
Under Section 854(b)(2) of the Code, the Fund hereby designates 100% of the ordinary income dividends as income qualifying for the dividends received deduction for the fiscal year ended December 31, 2003.
FL-20
FRANKLIN MONEY MARKET FUND
Fund Goals and Primary Investments: Franklin Money Market Fund seeks high current income, consistent with liquidity and capital preservation. The Fund also seeks to maintain a stable share price of $1.00.1 The Fund invests in high quality U.S. dollar-denominated money market debt instruments.
We are pleased to bring you Franklin Money Market Fund’s annual report for the fiscal year ended December 31, 2003.
Economic and Market Overview
During the year ended December 31, 2003, many factors strongly impacted the U.S. economy and markets. In general, uncertainty about the economy’s strength and geopolitical events pushed interest rates down during the first part of the year. The Iraq conflict weighed heavily on many investors’ minds, which helped interest rates decline. By mid-June, the 10-year U.S. Treasury yield fell to 3.13%, the lowest level in more than four decades. For consumers, historically low mortgage rates enabled many homeowners to refinance their mortgages, and refinancing applications reached their highest levels on record. Additionally, the refinancing activity, rising home values and stabilizing equity markets improved consumers’ net worths and allowed them to continue spending, which helped to keep the economy moving forward.
Increases in business spending also helped economic growth. After having been largely absent since the end of 2000, business spending improved in the latter half of 2003. Nonresidential fixed investment increased 12.8% annualized in the third quarter of 2003, the highest increase since the second quarter of 2000. Lower interest rates during the past year allowed many businesses the opportunity to refinance their old debt at more attractive levels. This helped enhance business operating performance. Additionally, businesses continued to achieve productivity gains by reducing their labor forces and taking advantage of recent technology investments. Higher productivity levels helped dampen inflation. Core inflation (excluding food and energy), as measured by the Consumer Price Index, rose a modest 1.1% for the year. Expectations for lower inflation contributed to the historically lower overall interest rate environment during the period.
1. An investment in the Fund is not insured or guaranteed by the U.S. government or any other entity or institution. Although the Fund seeks to preserve the value of your investment at $1.00 per share, it is possible to lose money by investing in the Fund.
FM-1
While much of the economic data pointed toward an improving economy, one area that showed mixed results was employment. The unemployment rate began the year at 5.7%, spiked to 6.4% in June, and ended the year at 5.7%. With inflation expectations muted, the Federal Reserve Board continued its accommodative stance and reduced the federal funds target rate to 1.00% in June from 1.25%, and maintained this level through year-end.
Investment Strategy
In selecting investments, we use a conservative investment approach, focusing on the highest quality and the most liquid of eligible money market securities. We assess the relative value of each security meeting our credit criteria to find the best combination of assets we believe will maximize the Fund’s yield relative to our expectations of the investment environment. We monitor short-term interest rates, economic conditions, and Federal Reserve Board monetary policy to determine the portfolio maturity we believe will provide high overall return.
Manager’s Discussion
Consistent with our strategy, we continued to invest mainly in high-quality money market securities. For example, on December 31, 2003, more than 89.1% of the portfolio was invested in securities with an AA or higher long-term credit rating by independent credit rating agencies Standard & Poor’s and Moody’s Investors Service, with the balance rated A.2
Thank you for your participation in Franklin Money Market Fund. We look forward to serving your future investment needs.
2. These do not indicate ratings of the Fund.
This discussion reflects our analysis, opinions and portfolio holdings as of December 31, 2003, the end of the reporting period. The way we implement our main investment strategies and the resulting portfolio holdings may change depending on factors such as market and economic conditions. These opinions may not be relied upon as investment advice or an offer for a particular security. The information is not a complete analysis of every aspect of any market, country, industry, security or the Fund. Statements of fact are from sources considered reliable, but the advisor makes no representation or warranty as to their completeness or accuracy. Although historical performance is no guarantee of future results, these insights may help you understand our investment management philosophy.
Top 10 Holdings
Franklin Money Market Fund
12/31/03
| | |
| Security Name | | % of Total Net Assets |
|
| |
| ABN Amro Inc.—Repurchase Agreement | | 18.7% |
| |
| UBS Warburg LLC—Repurchase Agreement | | 18.7% |
| |
| Federal Home Loan Bank | | 8.6% |
| |
| Province of British Columbia | | 5.0% |
| |
| UBS AG | | 4.9% |
| |
| Citigroup Global Markets Holding | | 4.9% |
| |
| Coca-Cola Co. | | 4.9% |
| |
| General Electric Capital Corp. | | 4.1% |
| |
| HBOS Treasury Services | | 4.0% |
| |
| Shell Finance PLC (U.K.) | | 3.9% |
The dollar value, number of shares or principal amount, and complete legal titles of all portfolio holdings are listed in the Fund’s Statement of Investments.
FM-2
FRANKLIN TEMPLETON VARIABLE INSURANCE PRODUCTS TRUST
FRANKLIN MONEY MARKET FUND
Financial Highlights
| | | | | | | | | | | | | | | | | | | | |
| | | Class 1
| |
| | | Year Ended December 31,
| |
| | | 2003 | | | 2002 | | | 2001 | | | 2000 | | | 1999 | |
| | |
|
|
|
Per share operating performance | | | | | | | | | | | | | | | | | | | | |
(for a share outstanding throughout the year) | | | | | | | | | | | | | | | | | | | | |
Net asset value, beginning of year | | $ | 1.00 | | | $ | 1.00 | | | $ | 1.00 | | | $ | 1.00 | | | $ | 1.00 | |
| | |
|
|
|
Income from investment operations - net investment income | | | .01 | | | | .01 | | | | .04 | | | | .06 | | | | .05 | |
Less distributions from net investment income | | | (.01 | ) | | | (.01 | ) | | | (.04 | ) | | | (.06 | ) | | | (.05 | ) |
| | |
|
|
|
Net asset value, end of year | | $ | 1.00 | | | $ | 1.00 | | | $ | 1.00 | | | $ | 1.00 | | | $ | 1.00 | |
| | |
|
|
|
| | | | | |
Total returna | | | .52% | | | | 1.33% | | | | 3.91% | | | | 5.95% | | | | 4.76% | |
Ratios/supplemental data | | | | | | | | | | | | | | | | | | | | |
Net assets, end of year (000’s) | | $ | 81,734 | | | $ | 119,819 | | | $ | 200,911 | | | $ | 274,580 | | | $ | 364,028 | |
Ratios to average net assets: | | | | | | | | | | | | | | | | | | | | |
Expenses | | | .66% | | | | .63% | | | | .56% | | | | .55% | | | | .53% | |
Net investment income | | | .56% | | | | 1.37% | | | | 3.89% | | | | 5.75% | | | | 4.64% | |
| a | Total return does not include any fees, charges or expenses imposed by the variable annuity and life insurance contracts for which the Franklin Templeton Variable Insurance Products Trust serves as an underlying investment vehicle. Total return is not annualized for periods less than one year. |
FM-3
FRANKLIN TEMPLETON VARIABLE INSURANCE PRODUCTS TRUST
FRANKLIN MONEY MARKET FUND
Financial Highlights (continued)
| | | | | | | | | | | | | | | | | | | | |
| | | Class 2
| |
| | | Year Ended December 31,
| |
| | | 2003 | | | 2002 | | | 2001 | | | 2000 | | | 1999c | |
| | |
|
|
|
Per share operating performance | | | | | | | | | | | | | | | | | | | | |
(for a share outstanding throughout the year) | | | | | | | | | | | | | | | | | | | | |
Net asset value, beginning of year | | $ | 1.00 | | | $ | 1.00 | | | $ | 1.00 | | | $ | 1.00 | | | $ | 1.00 | |
| | |
|
|
|
Income from investment operations - net investment income | | | — | b | | | .01 | | | | .04 | | | | .06 | | | | .04 | |
Less distributions from net investment income | | | — | b | | | (.01 | ) | | | (.04 | ) | | | (.06 | ) | | | (.04 | ) |
| | |
|
|
|
Net asset value, end of year | | $ | 1.00 | | | $ | 1.00 | | | $ | 1.00 | | | $ | 1.00 | | | $ | 1.00 | |
| | |
|
|
|
| | | | | |
Total returna | | | .27% | | | | 1.08% | | | | 3.65% | | | | 5.69% | | | | 4.39% | |
Ratios/supplemental data | | | | | | | | | | | | | | | | | | | | |
Net assets, end of year (000’s) | | $ | 590 | | | $ | 479 | | | $ | 952 | | | $ | 21,609 | | | $ | 8,602 | |
Ratios to average net assets: | | | | | | | | | | | | | | | | | | | | |
Expenses | | | .91% | | | | .88% | | | | .81% | | | | .79% | | | | .79% | d |
Net investment income | | | .31% | | | | 1.12% | | | | 3.52% | | | | 5.59% | | | | 4.51% | d |
| a | Total return does not include any fees, charges or expenses imposed by the variable annuity and life insurance contracts for which the Franklin Templeton Variable Insurance Products Trust serves as an underlying investment vehicle. Total return is not annualized for periods less than one year. |
| b | Includes net investment income and distributions from net investment income in the amount of $.003. |
| c | For the period January 6, 1999 (effective date) to December 31, 1999. |
See notes to financial statements.
FM-4
FRANKLIN TEMPLETON VARIABLE INSURANCE PRODUCTS TRUST
FRANKLIN MONEY MARKET FUND
Statement of Investments, December 31, 2003
| | | | | | | |
| | | PRINCIPAL AMOUNT | | VALUE | |
| |
Certificates of Deposit 6.1% | | | | | | | |
UBS AG, Stamford Connecticut Branch, 1.305%, 4/16/04 | | $ | 4,000,000 | | | $ 4,000,000 | |
Wells Fargo Bank N.A., San Francisco Branch, 1.07%, 1/07/04 | | | 1,000,000 | | | 1,000,000 | |
| | | | | |
|
|
|
Total Certificates of Deposit (Cost $5,000,000) | | | | | | 5,000,000 | |
| | | | | |
|
|
|
Commercial Paper 47.3% | | | | | | | |
aBP Capital Markets PLC, 1.07%-1.10%, 2/09/04-3/02/04 | | | 1,400,000 | | | 1,398,095 | |
aCitigroup Global Markets Holding Inc., 1.03%-1.07%, 1/02/04-1/14/04 | | | 4,000,000 | | | 3,999,363 | |
aCoca-Cola Co., 1.03%, 1/05/04-1/12/04 | | | 4,000,000 | | | 3,999,142 | |
aDupont De Nemours & Co, 1.05%-1.07%, 1/21/04-2/10/04 | | | 3,090,000 | | | 3,086,734 | |
aGeneral Electric Capital Corp., 1.08%-1.12%, 1/15/04-4/08/04 | | | 3,392,000 | | | 3,386,972 | |
aGoldman Sachs Group Inc., 1.07%, 1/16/04 | | | 2,000,000 | | | 1,999,108 | |
aHBOS Treasury Services, 1.10%-1.13%, 1/05/04-3/19/04 | | | 3,265,000 | | | 3,259,642 | |
aLloyds TSB Bank PLC, 1.10%-1.11%, 1/22/04-3/09/04 | | | 1,700,000 | | | 1,697,504 | |
aMerrill Lynch & Co Inc., 1.04%, 1/29/04 | | | 1,000,000 | | | 999,191 | |
aMorgan Stanley & Co, 1.08%, 1/09/04 | | | 2,000,000 | | | 1,999,520 | |
aProvince of British Columbia, 1.11%, 4/19/04 | | | 4,100,000 | | | 4,086,221 | |
aRabobank USA Finance Corp, 1.04%, 1/30/04 | | | 934,000 | | | 933,218 | |
aRoyal Bank of Scotland PLC, 1.10%-1.12%, 1/20/04-1/27/04 | | | 2,350,000 | | | 2,348,207 | |
aShell Finance (UK) PLC, 1.06%-1.10%, 1/15/04-3/17/04 | | | 3,200,000 | | | 3,196,288 | |
aWestpac Capital Corp., 1.07%-1.11%, 1/28/04-2/12/04 | | | 2,600,000 | | | 2,597,391 | |
| | | | | |
|
|
|
Total Commercial Paper (Cost $38,986,596) | | | | | | 38,986,596 | |
| | | | | |
|
|
|
U.S. Government Agency Securities 9.3% | | | | | | | |
Federal Farm Credit Bank, 1.31%, 9/01/04 | | | 633,000 | | | 627,380 | |
Federal Home Loan Bank, 1.07%-1.40%, 1/23/04-11/26/04 | | | 6,000,000 | | | 5,983,897 | |
Federal Home Loan Bank, Strip, 4/05/04-5/04/04 | | | 1,070,000 | | | 1,065,465 | |
| | | | | |
|
|
|
Total U.S. Government Agency Securities (Cost $7,676,742) | | | | | | 7,676,742 | |
| | | | | |
|
|
|
Total Investments before Repurchase Agreements (Cost $51,663,338) | | | | | | 51,663,338 | |
| | | | | |
|
|
|
Repurchase Agreements 37.4% | | | | | | | |
bABN AMRO Bank NV., .90%, 1/02/04 (Maturity Value $15,390,770) Collateralized by U.S. Government Agency Securities | | | 15,390,000 | | | 15,390,000 | |
bUBS Securities LLC., .85%, 1/02/04 (Maturity Value $15,385,727) Collateralized by U.S. Government Agency Securities | | | 15,385,000 | | | 15,385,000 | |
| | | | | |
|
|
|
Total Repurchase Agreements (Cost $30,775,000) | | | | | | 30,775,000 | |
| | | | | |
|
|
|
Total Investments (Cost $82,438,338) 100.1% | | | | | | 82,438,338 | |
Other Assets, less Liabilities (.1)% | | | | | | (114,498 | ) |
| | | | | |
|
|
|
Net Assets 100.0% | | | | | $ | 82,323,840 | |
| | | | | |
|
|
|
| a | Securities are traded on a discount basis; the rates shown are the discount rates at the time of purchase by the fund. |
| b | See Note 1(b) regarding repurchase agreements. |
See notes to financial statements.
FM-5
FRANKLIN TEMPLETON VARIABLE INSURANCE PRODUCTS TRUST
FRANKLIN MONEY MARKET FUND
Financial Statements
Statement of Assets and Liabilities
December 31, 2003
| | | |
Assets: | | | |
Investments in securities, at value and cost | | $ | 51,663,338 |
Repurchase agreements, at value and cost | | | 30,775,000 |
Cash | | | 1,077 |
Receivable from interest | | | 39,072 |
| | |
|
|
Total assets | | | 82,478,487 |
| | |
|
|
Liabilities: | | | |
Payables: | | | |
Capital shares redeemed | | | 64,706 |
Affiliates | | | 47,259 |
Distributions to shareholders | | | 22,141 |
Other liabilities | | | 20,541 |
| | |
|
|
Total liabilities | | | 154,647 |
| | |
|
|
Net assets, at value | | $ | 82,323,840 |
| | |
|
|
Class 1: | | | |
Net assets, at value | | $ | 81,734,220 |
| | |
|
|
Shares outstanding | | | 81,734,220 |
| | |
|
|
Net asset value per share | | $ | 1.00 |
| | |
|
|
Class 2: | | | |
Net assets, at value | | | $589,620 |
| | |
|
|
Shares outstanding | | | 589,620 |
| | |
|
|
Net asset value per share | | $ | 1.00 |
| | |
|
|
See notes to financial statements.
FM-6
FRANKLIN TEMPLETON VARIABLE INSURANCE PRODUCTS TRUST
FRANKLIN MONEY MARKET FUND
Financial Statements (continued)
Statement of Operations
for the year ended December 31, 2003
| | | |
Investment income: | | | |
Interest | | | $1,217,495 |
| | |
|
|
Expenses: | | | |
Management fees (Note 3) | | | 619,226 |
Distribution fees - Class 2 (Note 3) | | | 1,267 |
Transfer agent fees | | | 353 |
Custodian fees | | | 977 |
Reports to shareholders | | | 21,091 |
Professional fees | | | 11,942 |
Trustees’ fees and expenses | | | 1,917 |
Other | | | 6,598 |
| | |
|
|
Total expenses | | | 663,371 |
| | |
|
|
Net investment income | | | 554,124 |
| | |
|
|
Net realized gain (loss) from investments | | | 577 |
| | |
|
|
Net increase (decrease) in net assets resulting from operations | | $ | 554,701 |
| | |
|
|
See notes to financial statements.
FM-7
FRANKLIN TEMPLETON VARIABLE INSURANCE PRODUCTS TRUST
FRANKLIN MONEY MARKET FUND
Financial Statements (continued)
Statements of Changes in Net Assets
For the year ended December 31, 2003 and 2002
| | | | | | | | |
| | | 2003 | | | 2002 | |
| | |
| |
Increase (decrease) in net assets: | | | | | | | | |
Operations: | | | | | | | | |
Net investment income | | $ | 554,124 | | | $ | 2,127,903 | |
Net realized gain (loss) from investments | | | 577 | | | | (444 | ) |
| | |
| |
Net increase (decrease) in net assets resulting from operations | | | 554,701 | | | | 2,127,459 | |
Distributions to shareholders from net investment income:a | | | | | | | | |
Class 1 | | | (553,446 | ) | | | (2,119,738 | ) |
Class 2 | | | (1,255 | ) | | | (7,721 | ) |
| | |
| |
Total distributions to shareholders | | | (554,701 | ) | | | (2,127,459 | ) |
Capital share transactions: (Note 2) | | | | | | | | |
Class 1 | | | (38,084,738 | ) | | | (81,091,795 | ) |
Class 2 | | | 110,815 | | | | (473,226 | ) |
| | |
| |
Total capital share transactions | | | (37,973,923 | ) | | | (81,565,021 | ) |
Net increase (decrease) in net assets | | | (37,973,923 | ) | | | (81,565,021 | ) |
Net assets: (there is no undistributed net investment income at beginning or end of year). | | | | | | | | |
Beginning of year | | | 120,297,763 | | | | 201,862,784 | |
| | |
| |
End of year | | $ | 82,323,840 | | | $ | 120,297,763 | |
| | |
| |
| a | Distributions were increased by net realized gains of $577 and decreased by net realized losses of $444 from security transactions for the years ended December 31, 2003 and 2002, respectively. |
See notes to financial statements.
FM-8
FRANKLIN TEMPLETON VARIABLE INSURANCE PRODUCTS TRUST
FRANKLIN MONEY MARKET FUND
Notes to Financial Statements
1. ORGANIZATION AND SIGNIFICANT ACCOUNTING POLICIES
Franklin Templeton Variable Insurance Products Trust (the Trust) is registered under the Investment Company Act of 1940 as an open-end investment company, consisting of twenty-two separate series (the Funds). Franklin Money Market Fund (the Fund) included in this report is diversified. Shares of the Fund are sold only to insurance company separate accounts to fund the benefits of variable life insurance policies or variable annuity contracts. As of December 31, 2003, 93.6% of the Fund’s shares were sold through one insurance company. The Fund’s investment objective is to obtain a high level of current income while seeking capital preservation and liquidity.
The following summarizes the Fund’s significant accounting policies.
a. Security Valuation
Securities are valued at amortized cost which approximates value.
b. Repurchase Agreements
The Fund may enter into repurchase agreements, which are accounted for as a loan by the Fund to the seller, collateralized by securities which are delivered to the Fund’s custodian. The market value, including accrued interest, of the initial collateralization is required to be at least 102% of the dollar amount invested by the Funds, with the value of the underlying securities marked to market daily to maintain coverage of at least 100%. At December 31, 2003, all repurchase agreements held by the Fund had been entered into on that date.
c. Income Taxes
No provision has been made for income taxes because the Fund’s policy is to qualify as a regulated investment company under the Internal Revenue Code and to distribute substantially all of its taxable income.
d. Security Transactions, Investment Income, Expenses and Distribution
Security transactions are accounted for on trade date. Realized gains and losses on security transactions are determined on a specific identification basis. Interest income and estimated expenses are accrued daily. Dividends from net investment income and capital gains or losses are normally declared daily. Such distributions are reinvested in additional shares of the Fund.
Common expenses incurred by the Trust are allocated among the Funds based on the ratio of net assets of each fund to the combined net assets. Other expenses are charged to each fund on a specific identification basis.
Net investment income, other than class specific expenses, is allocated daily to each class of shares based upon the relative value of the settled shares of each class. Realized and unrealized gains and losses are allocated daily based upon the relative proportion of net assets of each class.
e. Accounting Estimates
The preparation of financial statements in accordance with accounting principles generally accepted in the United States of America requires management to make estimates and assumptions that affect the reported amounts of assets and liabilities at the date of the financial statements and the amounts of income and expense during the reporting period. Actual results could differ from those estimates.
FM-9
FRANKLIN TEMPLETON VARIABLE INSURANCE PRODUCTS TRUST
FRANKLIN MONEY MARKET FUND
Notes to Financial Statements (continued)
1. ORGANIZATION AND SIGNIFICANT ACCOUNTING POLICIES (cont.)
f. Guarantees and Indemnifications
Under the Trust’s organizational documents, its officers and trustees are indemnified against certain liability arising out of the performance of their duties to the Trust. Additionally, in the normal course of business, the Trust enters into contracts with service providers that contain general indemnification clauses. The Trust’s maximum exposure under these arrangements is unknown as this would involve future claims that may be made against the Trust that have not yet occurred. However, based on experience, the Trust expects the risk of loss to be remote.
2. SHARES OF BENEFICIAL INTEREST
The Fund offers two classes of shares: Class 1 and Class 2. Each class of shares differs by its distribution fees, voting rights on matters affecting a single class, and its exchange privilege.
At December 31, 2003, there were an unlimited number of shares authorized ($.01 par value). Transactions in the Fund’s shares were as follows:
| | | | | | | | |
| | | Year Ended December 31,
| |
| Class 1 Shares: | | 2003
| | | 2002
| |
Shares sold | | $ | — | | | $ | 25,235,589 | |
Shares issued in reinvestment of distributions | | | 531,271 | | | | 2,119,892 | |
Shares redeemed | | | (38,616,009 | ) | | | (108,447,276 | ) |
| | |
|
|
|
Net increase (decrease) | | $ | (38,084,738 | ) | | $ | (81,091,795 | ) |
| | |
|
|
|
| Class 2 Shares: | | | | | | |
Shares sold | | $ | 242,800 | | | $ | 341,277 | |
Shares issued in reinvestment of distributions | | | 1,323 | | | | 7,721 | |
Shares redeemed | | | (133,308 | ) | | | (822,224 | ) |
| | |
|
|
|
Net increase (decrease) | | $ | 110,815 | | | $ | (473,226 | ) |
| | |
|
|
|
3. TRANSACTIONS WITH AFFILIATES
Certain officers and trustees of the Trust are also officers and/or directors of the following entities:
| | |
| Entity | | Affiliation |
|
Franklin Advisers Inc. (Advisers) | | Investment manager |
Franklin Templeton Services LLC (FT Services) | | Administrative manager |
Franklin/Templeton Distributors Inc (Distributors) | | Principal underwriter |
Franklin/Templeton Investor Services LLC (Investor Services) | | Transfer Agent |
The Fund pays an investment management fee to Advisers based on the average daily net assets of the Fund as follows:
| | |
| Annualized Fee Rate | | Net Assets |
|
| .625% | | First $100 million |
| .500% | | Over $100 million, up to and including $250 million |
| .450% | | Over $250 million, up to and including $10 billion |
Fees are further reduced on net assets over $10 billion.
FM-10
FRANKLIN TEMPLETON VARIABLE INSURANCE PRODUCTS TRUST
FRANKLIN MONEY MARKET FUND
Notes to Financial Statements (continued)
3. TRANSACTIONS WITH AFFILIATES (cont.)
Under an agreement with Advisers, FT Services provides administrative services to the Fund. The fee is paid by Advisers based on the average daily net assets, and is not an additional expense of the Fund.
The Fund reimburses Distributors up to .25% per year of its average daily net assets of Class 2, for costs incurred in marketing the Fund’s shares.
Investor Services, under terms of an agreement, performs shareholder servicing for the Fund and is not paid by the Fund for the services.
4. INCOME TAXES
At December 31, 2003, the Fund had tax basis capital losses of $724 which may be carried over to offset future capital gains. Such losses expire as follows:
| | | |
Capital loss carryovers expiring in: | | | |
2008 | | $ | 280 |
2010 | | | 444 |
| | |
|
|
| | | $ | 724 |
| | |
|
|
At December 31, 2003, the cost of investments and undistributed ordinary income for income tax purposes were as follows:
| | | |
Cost of investments | | $ | 82,438,338 |
Undistributed ordinary income | | $ | 29,996 |
5. REGULATORY MATTERS
On February 4, 2004, the Securities Division of the Office of the Secretary of the Commonwealth of Massachusetts filed an administrative complaint against Franklin Resources, Inc. and certain of its subsidiaries (the “Company”), alleging violations of the Massachusetts Uniform Securities Act. The complaint arises from activity that occurred in 2001 during which time an officer of a Company subsidiary was negotiating an agreement with an investor relating to investments in a mutual fund and a hedge fund.
The Company, in addition to other entities within Franklin Templeton Investments, has been named in shareholder class actions related to the matter described above. The Company believes that the claims made in the lawsuit are without merit and it intends to defend vigorously against the allegations. The Company and the Fund may be named in similar civil actions related to the matter described above.
In addition, as part of ongoing investigations by the U.S. Securities and Exchange Commission (the “SEC”), the U.S. Attorney for the Northern District of California, the New York Attorney General, the California Attorney General, the U.S. Attorney for the District of Massachusetts, the Florida Department of Financial Services, and the Commissioner of Securities and the Attorney General of the State of West Virginia, relating to certain practices in the mutual fund industry, including late trading, market timing and sales compensation arrangements, the Company and its subsidiaries, as well as certain current or former executives and employees of the Company, have received requests for information and/or subpoenas to testify or produce documents. The Company and its current employees are providing documents and information in response to these requests and subpoenas. In addition, the Company has responded to requests for similar kinds of information from regulatory authorities in some of the foreign countries where the Company conducts its global asset management business.
FM-11
FRANKLIN TEMPLETON VARIABLE INSURANCE PRODUCTS TRUST
FRANKLIN MONEY MARKET FUND
Notes to Financial Statements (continued)
5. REGULATORY MATTERS (cont.)
The Staff of the SEC has informed the Company that it intends to recommend that the Commission authorize an action against the Fund’s investment adviser and a senior executive officer relating to the frequent trading issues that are the subject of the SEC’s investigation. These issues were previously disclosed as being under investigation by government authorities and the subject of an internal inquiry by the Company in its Annual Report on Form 10-K and on its public website. The Company currently is in discussions with the SEC Staff in an effort to resolve the issues raised in their investigation. Such discussions are preliminary and the Fund’s management has been advised that the Company cannot predict the likelihood of whether those discussions will result in a settlement and, if so, the terms of such settlement. The impact, if any, of these matters on the Fund is uncertain at this time. If the Company finds that it bears responsibility for any unlawful or improper conduct, it has committed to making the Fund or its shareholders whole, as appropriate.
FM-12
FRANKLIN TEMPLETON VARIABLE INSURANCE PRODUCTS TRUST
FRANKLIN MONEY MARKET FUND
Independent Auditors’ Report
To the Board of Trustees and Shareholders of
Franklin Templeton Variable Insurance Products Trust
In our opinion, the accompanying statement of assets and liabilities, including the statement of investments, and the related statements of operations and of changes in net assets and the financial highlights present fairly, in all material respects, the financial position of the Franklin Money Market Fund (the Fund) (one of the funds constituting the Franklin Templeton Variable Insurance Products Trust) at December 31, 2003, the results of its operations for the year then ended, the changes in its net assets for each of the two years in the period then ended and the financial highlights for each of the periods presented, in conformity with accounting principles generally accepted in the United States of America. These financial statements and financial highlights (hereafter referred to as “financial statements”) are the responsibility of the Fund’s management; our responsibility is to express an opinion on these financial statements based on our audits. We conducted our audits of these financial statements in accordance with auditing standards generally accepted in the United States of America, which require that we plan and perform the audits to obtain reasonable assurance about whether the financial statements are free of material misstatement. An audit includes examining, on a test basis, evidence supporting the amounts and disclosures in the financial statements, assessing the accounting principles used and significant estimates made by management, and evaluating the overall financial statement presentation. We believe that our audits, which included confirmation of securities at December 31, 2003 by correspondence with the custodian and brokers, provide a reasonable basis for our opinion.
PricewaterhouseCoopers LLP
San Francisco, California
February 5, 2004, except for Note 5 as to which the date is February 12, 2004
FM-13
FRANKLIN REAL ESTATE FUND
Fund Goals and Primary Investments: Franklin Real Estate Fund seeks capital appreciation, with current income as a secondary goal. The Fund invests primarily in investments of companies operating in the real estate sector, primarily real estate investment trusts (REITs) and generally in small to medium capitalization companies.1
This annual report for Franklin Real Estate Fund covers the fiscal year ended December 31, 2003.
Performance Overview
You can find the Fund’s one-year total return in the Performance Summary following this report. The Fund outperformed the benchmark Standard & Poor’s 500 Composite Index (S&P 500), which returned 28.67% for the year under review, while the Fund’s return was comparable to that of the Wilshire Real Estate Securities Index’s 37.07% return for the same period.2
Economic and Market Overview
During the year ended December 31, 2003, many factors impacted global economies and financial markets. Early in the year, economic uncertainty and geopolitical events, including impending war in Iraq, pushed U.S. interest rates to their lowest level in more than four decades, and the 10-year U.S. Treasury note’s yield fell to 3.13% in mid-June. However, following the end of major conflict in Iraq, many economic indicators turned positive. The U.S. government injected fiscal stimulus into the economy, approving another round of tax cuts and rebates that included dividend and capital gains tax reductions. In June, an accommodative Federal Reserve Board, in an attempt to bolster the economy, cut the federal funds target rate to 1.00%.
During the year, the U.S. trade deficit increased significantly, contributing to the U.S. dollar’s fall to record lows against the euro and other major currencies. However, the weak dollar provided a boost to the U.S. economy and corporate profits as exports became cheaper for foreign buyers. Robust consumer spending, especially for autos and homes, and strong business spending, particularly for equipment and software, contributed to the accelerated economic activity. In addition,
1. Equity REITs are real estate companies that own and manage income-producing properties such as apartments or hotels. The income, primarily rent from these properties, is generally passed on to investors in the form of dividends. These companies provide experienced property management teams and generally concentrate on a specific geographic region and property type.
2. Source: Standard & Poor’s Micropal. One cannot invest directly in an index, nor is an index representative of the Fund’s portfolio. Please see Index Descriptions following the Fund Summaries.
FRE-1
U.S. federal spending stayed firm and inflation remained benign. U.S. gross domestic product (GDP) grew an annualized 8.2% in third quarter 2003, its strongest pace in nearly 20 years, and overall, 2003 GDP grew an estimated 3.1%. As economic data improved, some interest rates rose from their lows, and the 10-year Treasury note’s yield ended the period at 4.27%.
An equity market rally started in late March 2003 and continued through the end of the year. The rebound began with investors anticipating economic recovery in the second half of 2003, and it continued as data showed robust economic growth. Improved sentiment led many investors to rotate into economically sensitive and financially leveraged companies, specifically cyclical, technology, small-capitalization and emerging market stocks. The S&P 500 rose 28.67% for the 12 months ended December 31, 2003, while the technology-heavy Nasdaq Composite Index increased 50.93%.3
Real estate stocks, as measured by the Wilshire Real Estate Securities Index, outpaced the broader markets. Despite sluggish underlying conditions in the commercial real estate market, related stocks continued a strong upward trend begun more than three years ago. Investor interest in the sector was bolstered by the relatively high dividend yields offered by equity REITs compared with many other investments.
Investment Strategy
We are research driven, fundamental investors pursuing a disciplined strategy. As bottom-up investors focusing primarily on individual securities, we pay close attention to the market price of a company’s security relative to our evaluation of its potential long-term earnings, asset value
3. Source: Standard & Poor’s Micropal. Please see Index Descriptions following the Fund Summaries.
FRE-2
and cash flow. Using both qualitative and quantitative analysis, we evaluate security characteristics, the strength and quality of management, and underlying properties. In addition, we may consider other factors, such as the supply and demand outlook for various property types and regional markets.
Manager’s Discussion
The Fund had a strong year largely by adhering to its strategy of using its disciplined, value-oriented approach to investing in real estate securities. Consistent with our strategy, we continued to look for well-managed companies with valuable real estate assets that were trading at attractive valuations. In addition, we analyzed supply and demand trends and outlooks for various property types and regional real estate markets, while closely evaluating company managements and the underlying properties of their real estate securities.
Cendant, a consumer services stock, was a significant positive contributor for the Fund during the reporting period; its share price rose more than 112% in 2003. The company’s operating fundamentals remained solid during the year and it continued a stock repurchase program, returning capital to shareholders.
Within the retail sector, regional mall stocks aided Fund performance during the year, as cash flow among most of these companies continued to be positive. Our shares of General Growth Properties contributed to the Fund’s total return as its fundamentals improved within a fairly robust retail environment, aiding share price appreciation. Simon Property Group was another positive contributor to performance, as consumer spending benefited the higher-quality retail mall properties it owns and operates.
Despite the Fund’s solid one-year performance, some of our positions fell in value and detracted from overall Fund performance. Our hotel stocks, including the Fund’s shares of MeriStar Hospitality, saw weak performance as hotels spent much of 2003 trying to emerge from a slump. MeriStar continued to suffer from a reduction in business travelers. MeriStar also completed a secondary offering to improve its balance sheet and has been actively selling assets in an effort to set the stage for future growth.
Although not a large position in the Fund at period-end, Apartment Investment & Management, an apartment REIT, turned in a relatively weak performance during the reporting period. Apartment sector
Top 10 Holdings
Franklin Real Estate Fund
12/31/03
| | |
Company
Security Type | | % of Total
Net Assets |
|
| |
| Vornado Realty Trust | | 4.8% |
| Equity REIT – Diversified Property | | |
| |
| Equity Residential | | 4.6% |
| Equity REIT – Apartments | | |
| |
| Simon Property Group Inc. | | 4.1% |
| Equity REIT – Retail | | |
| |
Equity Office Properties Trust | | 3.9% |
| Equity REIT – Office | | |
| |
| The Macerich Co. | | 3.5% |
| Equity REIT– Retail | | |
| |
| Boston Properties Inc. | | 3.0% |
| Equity REIT – Office | | |
| |
| iStar Financial Inc. | | 2.9% |
| Equity REIT – Other | | |
| |
| ProLogis | | 2.9% |
| Equity REIT – Industrial | | |
| |
| Cendant Corp. | | 2.6% |
| Hotels & Travel | | |
| |
| Avalonbay Communities Inc. | | 2.6% |
| Equity REIT – Apartments | | |
The dollar value, number of shares or principal amount, and complete legal titles of all portfolio holdings are listed in the Fund’s Statement of Investments.
FRE-3
fundamentals remained soft as low interest rates encouraged potential renters to buy homes.
Thank you for your participation in Franklin Real Estate Fund. We look forward to serving your future investment needs.
This discussion reflects our analysis, opinions and portfolio holdings as of December 31, 2003, the end of the reporting period. The way we implement our main investment strategies and the resulting portfolio holdings may change depending on factors such as market and economic conditions. These opinions may not be relied upon as investment advice or an offer for a particular security. The information is not a complete analysis of every aspect of any market, country, industry, security or the Fund. Statements of fact are from sources considered reliable, but the advisor makes no representation or warranty as to their completeness or accuracy. Although historical performance is no guarantee of future results, these insights may help you understand our investment management philosophy.
FRE-4
PERFORMANCE SUMMARYASOF 12/31/03
Total return of Class 2 shares represents the average annual change in value, assuming reinvestment of dividends and capital gains. Average returns smooth out variations in returns, which can be significant; they are not the same as year-by-year results.
Franklin Real Estate Fund – Class 2*
Periods ended 12/31/03
| | | | | | |
| | | 1-Year | | 5-Year | | 10-Year |
|
| | | |
Average Annual Total Return | | +35.75% | | +12.99% | | +11.50% |
*Because Class 2 shares were not offered until 1/6/99, standardized Class 2 Fund performance for prior periods represents the historical results of Class 1 shares. For periods beginning on 1/6/99, Class 2’s results reflect an additional 12b-1 fee expense, which also affects future performance. Since 1/6/99 (effective date), the average annual total return of Class 2 shares was +12.72%.
Ongoing market volatility can significantly affect short-term performance; recent returns may differ.
Total Return Index Comparison
for Hypothetical $10,000 Investment (1/1/94–12/31/03)
The graph compares the performance of Franklin Real Estate Fund – Class 2,* the S&P 500 and the Wilshire Real Estate Securities Index. One cannot invest directly in an index, nor is an index representative of the Fund’s portfolio. Please see Important Notes to Performance Information preceding the Fund Summaries.
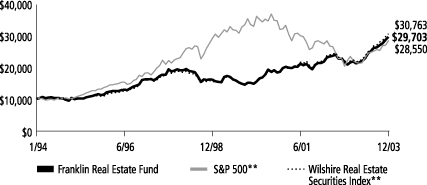
**Source: Standard & Poor’s Micropal. Please see Index Descriptions following the Fund Summaries.
Franklin Real Estate
Fund – Class 2
Performance reflects the Fund’s Class 2 operating expenses, but does not include any contract fees, expenses or sales charges. If they had been included, performance would be lower. These charges and deductions, particularly for variable life policies, can have a significant effect on contract values and insurance benefits. See the contract prospectus for a complete description of these expenses, including sales charges.
Since markets can go down as well as up, investment return and the value of your principal will fluctuate with market conditions, and you may have a gain or loss when you sell your shares.
Past performance does not guarantee future results.
FRE-5
FRANKLIN REAL ESTATE FUND
(FRANKLIN TEMPLETON VARIABLE INSURANCE PRODUCTS TRUST)
SUPPLEMENT DATED DECEMBER 26, 2003
TOTHE PROSPECTUS DATED MAY 1, 2003
The “Management” section of the prospectus (page FRE-4) is replaced with the following:
Franklin Advisers, Inc. (Advisers), One Franklin Parkway, San Mateo, California 94403-1906, is the Fund’s investment manager.
MANAGEMENT TEAM The team responsible for the Fund’s management is:
| | |
| |
Alex W. Peters, CFA VICE PRESIDENT, ADVISERS | | Mr. Peters has been a manager of the Fund since December 2003, and has been with Franklin Templeton Investments since 1992. |
| |
Samuel R. Kerner PORTFOLIO MANAGER, ADVISERS | | Mr. Kerner has been a manager of the Fund since 2000, and has been with Franklin Templeton Investments since 1996. |
The Fund pays Advisers a fee for managing the Fund’s assets and providing certain administrative facilities and services for the Fund. For the fiscal year ended December 31, 2002, the Fund paid 0.53% of its average daily net assets to Advisers for its services.
Please keep this supplement for future reference.
FRE-6
FRANKLIN TEMPLETON VARIABLE INSURANCE PRODUCTS TRUST
FRANKLIN REAL ESTATE FUND
Financial Highlights
| | | | | | | | | | | | | | | | | | | | |
| | | Class 1
| |
| | | Year Ended December 31,
| |
| | | 2003
| | | 2002
| | | 2001
| | | 2000
| | | 1999
| |
Per share operating performance | | | | | | | | | | | | | | | | | | | | |
(for a share outstanding throughout the year) | | | | | | | | | | | | | | | | | | | | |
| | | | | |
Net asset value, beginning of year | | $ | 18.05 | | | $ | 18.14 | | | $ | 17.47 | | | $ | 14.92 | | | $ | 19.93 | |
| | |
|
|
|
Income from investment operations: | | | | | | | | | | | | | | | | | | | | |
Net investment incomea | | | .74 | | | | .75 | | | | .74 | | | | .84 | | | | .88 | |
Net realized and unrealized gains (losses) | | | 5.67 | | | | (.30 | ) | | | .65 | | | | 3.55 | | | | (1.77 | ) |
| | |
|
|
|
Total from investment operations | | | 6.41 | | | | 0.45 | | | | 1.39 | | | | 4.39 | | | | (.89 | ) |
| | |
|
|
|
Less distributions from: | | | | | | | | | | | | | | | | | | | | |
Net investment income | | | (.55 | ) | | | (.54 | ) | | | (.72 | ) | | | (1.15 | ) | | | (1.73 | ) |
Net realized gains | | | — | | | | — | | | | — | | | | (.69 | ) | | | (2.39 | ) |
| | |
|
|
|
Total distributions | | | (.55 | ) | | | (.54 | ) | | | (.72 | ) | | | (1.84 | ) | | | (4.12 | ) |
| | |
|
|
|
Net asset value, end of year | | $ | 23.91 | | | $ | 18.05 | | | $ | 18.14 | | | $ | 17.47 | | | $ | 14.92 | |
| | |
|
|
|
| | | | | |
Total returnb | | | 36.08% | | | | 2.25% | | | | 8.19% | | | | 31.95% | | | | (6.14)% | |
| | | | | |
Ratios/supplemental data | | | | | | | | | | | | | | | | | | | | |
Net assets, end of year (000’s) | | $ | 134,468 | | | $ | 112,991 | | | $ | 134,058 | | | $ | 153,203 | | | $ | 158,553 | |
Ratios to average net assets: | | | | | | | | | | | | | | | | | | | | |
Expenses | | | .53% | | | | .57% | | | | .59% | | | | .60% | | | | .58% | |
Net investment income | | | 3.62% | | | | 4.23% | | | | 4.25% | | | | 5.29% | | | | 4.83% | |
Portfolio turnover rate | | | 15.44% | | | | 18.13% | | | | 34.21% | | | | 16.41% | | | | 10.27% | |
| a | Based on average daily shares outstanding. |
| b | Total return does not include any fees, charges or expenses imposed by the variable annuity and life insurance contracts for which the Franklin Templeton Variable Insurance Products Trust serves as an underlying investment vehicle. Total return is not annualized for periods less than one year. |
FRE-7
FRANKLIN TEMPLETON VARIABLE INSURANCE PRODUCTS TRUST
FRANKLIN REAL ESTATE FUND
Financial Highlights (continued)
| | | | | | | | | | | | | | | | | | | | |
| |
| | | Class 2
| |
| | | Year Ended December 31,
| |
| | | 2003
| | | 2002
| | | 2001
| | | 2000
| | | 1999c
| |
Per share operating performance | | | | | | | | | | | | | | | | | | | | |
(for a share outstanding throughout the year) | | | | | | | | | | | | | | | | | | | | |
| | | | | |
Net asset value, beginning of year | | $ | 17.88 | | | $ | 17.99 | | | $ | 17.38 | | | $ | 14.88 | | | $ | 20.21 | |
| | |
|
|
|
Income from investment operations: | | | | | | | | | | | | | | | | | | | | |
Net investment incomea | | | .74 | | | | .76 | | | | .80 | | | | .93 | | | | 1.29 | |
Net realized and unrealized gains (losses) | | | 5.55 | | | | (.35 | ) | | | .52 | | | | 3.41 | | | | (2.50 | ) |
| | |
|
|
|
Total from investment operations | | | 6.29 | | | | 0.41 | | | | 1.32 | | | | 4.34 | | | | (1.21 | ) |
| | |
|
|
|
Less distributions from: | | | | | | | | | | | | | | | | | | | | |
Net investment income | | | (.52 | ) | | | (.52 | ) | | | (.71 | ) | | | (1.15 | ) | | | (1.73 | ) |
Net realized gains | | | — | | | | — | | | | — | | | | (.69 | ) | | | (2.39 | ) |
| | |
|
|
|
Total distributions | | | (.52 | ) | | | (.52 | ) | | | (.71 | ) | | | (1.84 | ) | | | (4.12 | ) |
| | |
|
|
|
Net asset value, end of year | | $ | 23.65 | | | $ | 17.88 | | | $ | 17.99 | | | $ | 17.38 | | | $ | 14.88 | |
| | |
|
|
|
| | | | | |
Total returnb | | | 35.75% | | | | 2.07% | | | | 7.88% | | | | 31.59% | | | | (7.66)% | |
| | | | | |
Ratios/supplemental data | | | | | | | | | | | | | | | | | | | | |
Net assets, end of year (000’s) | | $ | 522,415 | | | $ | 249,116 | | | $ | 95,891 | | | $ | 23,743 | | | $ | 2,449 | |
Ratios to average net assets: | | | | | | | | | | | | | | | | | | | | |
Expenses | | | .78% | | | | .82% | | | | .84% | | | | .85% | | | | .83% | d |
Net investment income | | | 3.37% | | | | 3.98% | | | | 4.60% | | | | 5.75% | | | | 8.84% | d |
Portfolio turnover rate | | | 15.44% | | | | 18.13% | | | | 34.21% | | | | 16.41% | | | | 10.27% | |
| a | Based on average daily shares outstanding. |
| b | Total return does not include any fees, charges or expenses imposed by the variable annuity and life insurance contracts for which the Franklin Templeton |
| Variable | Insurance Products Trust serves as an underlying investment vehicle. Total return is not annualized for periods less than one year. |
| c | For the period January 6, 1999 (effective date) to December 31, 1999. |
See notes to financial statements.
FRE-8
FRANKLIN TEMPLETON VARIABLE INSURANCE PRODUCTS TRUST
FRANKLIN REAL ESTATE FUND
Statement of Investments, December 31, 2003
| | | | | |
| | | SHARES | | VALUE |
|
Common Stocks 89.4% | | | | | |
Equity REIT - Apartments 9.2% | | | | | |
Amli Residential Properties Trust | | 162,500 | | $ | 4,355,000 |
Apartment Investment & Management Co., A | | 83,000 | | | 2,863,500 |
Archstone-Smith Trust | | 215,360 | | | 6,025,773 |
Avalonbay Communities Inc. | | 352,000 | | | 16,825,600 |
Equity Residential | | 1,034,600 | | | 30,531,046 |
| | | | |
|
|
| | | | | | 60,600,919 |
| | | | |
|
|
Equity REIT - Diversified Property 12.9% | | | | | |
aAshford Hospitality Trust | | 436,000 | | | 4,094,040 |
Bedford Property Investors Inc. | | 231,280 | | | 6,621,546 |
Crescent Real Estate Equities Co. | | 171,800 | | | 2,942,934 |
Duke Realty Corp. | | 34,348 | | | 1,064,788 |
Glenborough Realty Trust Inc. | | 458,700 | | | 9,151,065 |
Lexington Corporate Properties Trust | | 207,100 | | | 4,181,349 |
Liberty Property Trust | | 425,000 | | | 16,532,500 |
Pennsylvania Real Estate Investment Trust | | 70,457 | | | 2,557,589 |
U.S. Restaurant Properties Inc. | | 375,200 | | | 6,393,408 |
Vornado Realty Trust | | 574,900 | | | 31,475,775 |
| | | | |
|
|
| | | | | | 85,014,994 |
| | | | |
|
|
Equity REIT - Health Care 1.9% | | | | | |
Ventas Inc. | | 455,000 | | | 10,010,000 |
Windrose Medical Properties | | 180,200 | | | 2,236,282 |
| | | | |
|
|
| | | | | | 12,246,282 |
| | | | |
|
|
Equity REIT - Hotels 2.4% | | | | | |
aHost Marriott Corp. | | 851,900 | | | 10,495,408 |
aMeriStar Hospitality Corp. | | 791,200 | | | 5,150,712 |
| | | | |
|
|
| | | | | | 15,646,120 |
| | | | |
|
|
Equity REIT - Industrial 5.3% | | | | | |
AMB Property Corp. | | 70,400 | | | 2,314,752 |
ProLogis | | 593,800 | | | 19,055,042 |
PS Business Parks Inc. | | 330,000 | | | 13,615,800 |
| | | | |
|
|
| | | | | | 34,985,594 |
| | | | |
|
|
Equity REIT - Manufactured Homes 1.3% | | | | | |
Manufactured Home Communities Inc. | | 146,600 | | | 5,519,490 |
Sun Communities Inc. | | 81,100 | | | 3,138,570 |
| | | | |
|
|
| | | | | | 8,658,060 |
| | | | |
|
|
Equity REIT - Office 19.9% | | | | | |
American Financial Realty Trust | | 147,700 | | | 2,518,285 |
Arden Realty Inc. | | 313,900 | | | 9,523,726 |
Boston Properties Inc. | | 410,250 | | | 19,769,947 |
Brandywine Realty Trust | | 422,000 | | | 11,296,940 |
CarrAmerica Realty Corp. | | 533,600 | | | 15,890,608 |
Corporate Office Properties Trust | | 160,000 | | | 3,360,000 |
Cousins Properties Inc. | | 167,600 | | | 5,128,560 |
Equity Office Properties Trust | | 896,352 | | | 25,680,485 |
Kilroy Realty Corp. | | 255,200 | | | 8,357,800 |
Parkway Properties Inc. | | 122,000 | | | 5,075,200 |
Reckson Associates Realty Corp. | | 228,700 | | | 5,557,410 |
FRE-9
FRANKLIN TEMPLETON VARIABLE INSURANCE PRODUCTS TRUST
FRANKLIN REAL ESTATE FUND
Statement of Investments, December 31, 2003 (cont.)
| | | | | |
| | | SHARES | | VALUE |
|
Common Stocks (cont.) | | | | | |
Equity REIT - Office (cont.) | | | | | |
SL Green Realty Corp. | | 249,000 | | $ | 10,221,450 |
Trizec Properties Inc. | | 529,200 | | | 8,149,680 |
| | | | |
|
|
| | | | | | 130,530,091 |
| | | | |
|
|
Equity REIT - Other 3.5% | | | | | |
Entertainment Properties Trust | | 110,000 | | | 3,818,100 |
iStar Financial Inc. | | 495,600 | | | 19,278,840 |
| | | | |
|
|
| | | | | | 23,096,940 |
| | | | |
|
|
Equity REIT - Retail 17.5% | | | | | |
Chelsea Property Group Inc. | | 75,700 | | | 4,149,117 |
General Growth Properties Inc. | | 471,600 | | | 13,086,900 |
Glimcher Realty Trust | | 202,000 | | | 4,520,760 |
Kimco Realty Corp. | | 101,600 | | | 4,546,600 |
The Macerich Co. | | 522,000 | | | 23,229,000 |
Ramco-Gershenson Properties Trust | | 257,100 | | | 7,275,930 |
Regency Centers Corp. | | 284,300 | | | 11,329,355 |
The Rouse Co. | | 335,400 | | | 15,763,800 |
Simon Property Group Inc. | | 584,800 | | | 27,099,632 |
Taubman Centers Inc. | | 199,200 | | | 4,103,520 |
| | | | |
|
|
| | | | | | 115,104,614 |
| | | | |
|
|
Equity REIT - Storage 1.9% | | | | | |
Public Storage Inc. | | 281,200 | | | 12,201,268 |
| | | | |
|
|
Apartments 1.8% | | | | | |
Boardwalk Equities Inc. (Canada) | | 858,200 | | | 11,868,906 |
| | | | |
|
|
Diversified Property 3.5% | | | | | |
Brookfield Properties Corp. (Canada) | | 185,560 | | | 5,325,572 |
Catellus Development Corp. | | 516,833 | | | 12,466,012 |
Forest City Enterprises Inc., A | | 110,000 | | | 5,226,100 |
| | | | |
|
|
| | | | | | 23,017,684 |
| | | | |
|
|
Home Builders 1.0% | | | | | |
aMeritage Corp. | | 98,600 | | | 6,538,166 |
| | | | |
|
|
Hotels & Travel 7.3% | | | | | |
aCendant Corp. | | 772,500 | | | 17,203,575 |
Fairmont Hotels & Resorts Inc. (Canada) | | 492,800 | | | 13,374,592 |
Hilton Hotels Corp. | | 293,600 | | | 5,029,368 |
aLa Quinta Corp. | | 597,500 | | | 3,829,975 |
Starwood Hotels & Resorts Worldwide Inc. | | 230,700 | | | 8,298,279 |
| | | | |
|
|
| | | | | | 47,735,789 |
| | | | |
|
|
Total Common Stocks (Cost $434,771,446) | | | | | 587,245,427 |
| | | | |
|
|
Convertible Preferred Stock (Cost $1,503,132) .5% | | | | | |
Hotels & Travel | | | | | |
Host Marriott Corp., 6.75%, cvt. pfd. | | 56,900 | | | 2,976,439 |
| | | | |
|
|
Total Long Term Investments (Cost $436,274,578) | | | | | 590,221,866 |
| | | | |
|
|
FRE-10
FRANKLIN TEMPLETON VARIABLE INSURANCE PRODUCTS TRUST
FRANKLIN REAL ESTATE FUND
Statement of Investments, December 31, 2003 (cont.)
| | | | | | |
| | | PRINCIPAL
AMOUNT
| | VALUE
|
Repurchase Agreement (Cost $63,374,549) 9.6% | | | | | | |
bJoint Repurchase Agreement .873%, 1/02/04, (Maturity Value $63,377,621) ABN AMRO Bank, N. V., New York Branch (Maturity Value $5,904,259) Banc of America Securities LLC (Maturity Value $5,904,259) Barclays Capital Inc. (Maturity Value $4,216,514) Bear, Stearns & Co. Inc. (Maturity Value $3,373,591) BNP Paribas Securities Corp. (Maturity Value $5,904,259) Deutsche Bank Securities Inc. (Maturity Value $5,904,259) Dresdner Kleinwort Wasserstein Securities LLC (Maturity Value $5,904,259) Goldman, Sachs & Co. (Maturity Value $3,373,591) Greenwich Capital Markets Inc. (Maturity Value $5,904,259) Lehman Brothers Inc. (Maturity Value $5,179,853) Morgan Stanley & Co. Inc. (Maturity Value $5,904,259) UBS Securities LLC (Maturity Value $5,904,259) Collateralized by U.S. Treasury Bills, Notes, and Bonds and U.S. Government Agency Securities | | $ | 63,374,549 | | $ | 63,374,549 |
| | | | | |
|
|
Total Investments (Cost $499,649,127) 99.5% | | | | | | 653,596,415 |
Other Assets, less Liabilities .5% | | | | | | 3,286,307 |
| | | | | |
|
|
Net Assets 100.0% | | | | | $ | 656,882,722 |
| | | | | |
|
|
| b | See Note 1(c) regarding joint repurchase agreement. |
See notes to financial statements.
FRE-11
FRANKLIN TEMPLETON VARIABLE INSURANCE PRODUCTS TRUST
FRANKLIN REAL ESTATE FUND
Financial Statements
Statement of Assets and Liabilities
December 31, 2003
| | | | |
| Assets: | | | | |
Investments in securities: | | | | |
Cost | | $ | 499,649,127 | |
| | |
|
|
|
Value | | | 653,596,415 | |
Cash | | | 23,659 | |
Receivables: | | | | |
Capital shares sold | | | 500,578 | |
Dividends | | | 3,347,852 | |
| | |
|
|
|
Total assets | | | 657,468,504 | |
| | |
|
|
|
Liabilities: | | | | |
Payables: | | | | |
Capital shares redeemed | | | 81,451 | |
Affiliates | | | 468,526 | |
Other liabilities | | | 35,805 | |
| | |
|
|
|
Total liabilities | | | 585,782 | |
| | |
|
|
|
Net assets, at value | | $ | 656,882,722 | |
| | |
|
|
|
Net assets consist of: | | | | |
Undistributed net investment income | | $ | 19,252,857 | |
Net unrealized appreciation (depreciation) | | | 153,947,288 | |
Accumulated net realized gain (loss) | | | (2,860,927 | ) |
Capital shares | | | 486,543,504 | |
| | |
|
|
|
Net assets, at value | | $ | 656,882,722 | |
| | |
|
|
|
Class 1: | | | | |
Net assets, at value | | $ | 134,467,799 | |
| | |
|
|
|
Shares outstanding | | | 5,622,892 | |
| | |
|
|
|
Net asset value and offering price per share | | $ | 23.91 | |
| | |
|
|
|
Class 2: | | | | |
Net assets, at value | | $ | 522,414,923 | |
| | |
|
|
|
Shares outstanding | | | 22,094,008 | |
| | |
|
|
|
Net asset value and offering price per share | | $ | 23.65 | |
| | |
|
|
|
See notes to financial statements.
FRE-12
FRANKLIN TEMPLETON VARIABLE INSURANCE PRODUCTS TRUST
FRANKLIN REAL ESTATE FUND
Financial Statements (continued)
Statement of Operations
for the year ended December 31, 2003
| | | |
Investment income: | | | |
Dividends | | $ | 20,165,368 |
Interest | | | 509,965 |
| | |
|
|
Total investment income | | | 20,675,333 |
| | |
|
|
Expenses: | | | |
Management fees (Note 3) | | | 2,391,891 |
Distribution fees - Class 2 (Note 3) | | | 891,984 |
Transfer agent fees | | | 3,441 |
Custodian fees | | | 4,707 |
Reports to shareholders | | | 64,975 |
Professional fees | | | 12,592 |
Trustees’ fees and expenses | | | 4,418 |
Other | | | 25,460 |
| | |
|
|
Total expenses | | | 3,399,468 |
| | |
|
|
Net investment income | | | 17,275,865 |
| | |
|
|
Realized and unrealized gains (losses): | | | |
Net realized gain (loss) from investments | | | 821,285 |
Net unrealized appreciation (depreciation) on investments | | | 132,680,180 |
| | |
|
|
Net realized and unrealized gain (loss) | | | 133,501,465 |
| | |
|
|
Net increase (decrease) in net assets resulting from operations | | $ | 150,777,330 |
| | |
|
|
See notes to financial statements.
FRE-13
FRANKLIN TEMPLETON VARIABLE INSURANCE PRODUCTS TRUST
FRANKLIN REAL ESTATE FUND
Financial Statements (continued)
Statements of Changes in Net Assets
for the year ended December 31, 2003 and 2002
| | | | | | | | |
| | | 2003
| | | 2002
| |
Increase (decrease) in net assets: | | | | | | | | |
Operations: | | | | | | | | |
Net investment income | | $ | 17,275,865 | | | $ | 12,273,479 | |
Net realized gain (loss) from investments | | | 821,285 | | | | 9,960,012 | |
Net unrealized appreciation (depreciation) on investments | | | 132,680,180 | | | | (21,421,211 | ) |
| | |
|
|
|
Net increase (decrease) in net assets resulting from operations | | | 150,777,330 | | | | 812,280 | |
Distributions to shareholders from: | | | | | | | | |
Net investment income: | | | | | | | | |
Class 1 | | | (3,177,591 | ) | | | (3,665,154 | ) |
Class 2 | | | (8,704,406 | ) | | | (4,495,007 | ) |
| | |
|
|
|
Total distributions to shareholders | | | (11,881,997 | ) | | | (8,160,161 | ) |
Capital share transactions: (Note 2) | | | | | | | | |
Class 1 | | | (12,667,903 | ) | | | (20,526,649 | ) |
Class 2 | | | 168,547,853 | | | | 160,033,068 | |
| | |
|
|
|
Total capital share transactions | | | 155,879,950 | | | | 139,506,419 | |
Net increase (decrease) in net assets | | | 294,775,283 | | | | 132,158,538 | |
Net assets: | | | | | | | | |
Beginning of year | | | 362,107,439 | | | | 229,948,901 | |
| | |
|
|
|
End of year | | | $656,882,722 | | | $ | 362,107,439 | |
| | |
|
|
|
Undistributed net investment income included in net assets: | | | | | | | | |
End of year | | $ | 19,252,857 | | | $ | 13,858,989 | |
| | |
|
|
|
See notes to financial statements.
FRE-14
FRANKLIN TEMPLETON VARIABLE INSURANCE PRODUCTS TRUST
FRANKLIN REAL ESTATE FUND
Notes to Financial Statements
1. ORGANIZATION AND SIGNIFICANT ACCOUNTING POLICIES
Franklin Templeton Variable Insurance Products Trust (the Trust) is registered under the Investment Company Act of 1940 as an open-end investment company, consisting of twenty-two separate series (the Funds). Franklin Real Estate Fund (the Fund) included in this report is diversified. Shares of the Fund are sold only to insurance company separate accounts to fund the benefits of variable life insurance policies or variable annuity contracts. As of December 31, 2003 over 54.3% of the Fund’s shares were sold through one insurance company. The Fund’s investment objective is growth and income.
The following summarizes the Fund’s significant accounting policies.
a. Security Valuation
Securities listed or traded on a recognized national exchange or NASDAQ are valued at the last reported sales price. Over-the-counter securities and listed securities for which no sale is reported are valued within the range of the latest quoted bid and asked prices. Foreign securities are valued at the close of trading of the foreign exchange or the NYSE, whichever is earlier. If events occur that materially affect the values of securities after the prices or foreign exchange rates are determined, or if market quotations are not readily available, the securities will be valued at fair value as determined following procedures approved by the Board of Trustees.
b. Foreign Currency Translation
Portfolio securities and other assets and liabilities denominated in foreign currencies are translated into U.S. dollars based on the exchange rate of such currencies against U.S. dollars on the date of valuation. Purchases and sales of securities and income items denominated in foreign currencies are translated into U.S. dollars at the exchange rate in effect on the transaction date.
The Fund does not separately report the effect of changes in foreign exchange rates from changes in market prices on securities held. Such changes are included in net realized and unrealized gain or loss from investments.
Realized foreign exchange gains or losses arise from sales of foreign currencies, currency gains or losses realized between the trade and settlement dates on securities transactions and the difference between the recorded amounts of dividends, interest, and foreign withholding taxes and the U.S. dollar equivalent of the amounts actually received or paid. Net unrealized foreign exchange gains and losses arise from changes in foreign exchange rates on foreign denominated assets and liabilities other than investments in securities held at the end of the reporting period.
c. Joint Repurchase Agreement
The Fund may enter into a joint repurchase agreement whereby its uninvested cash balance is deposited into a joint cash account to be used to invest in one or more repurchase agreements. The value and face amount of the joint repurchase agreement are allocated to the Fund based on its pro-rata interest. A repurchase agreement is accounted for as a loan by the Fund to the seller, collateralized by securities which are delivered to the Fund’s custodian. The market value, including accrued interest, of the initial collateralization is required to be at least 102% of the dollar amount invested by the Fund, with the value of the underlying securities marked to market daily to maintain coverage of at least 100%. At December 31, 2003, all repurchase agreements had been entered into on that date.
e. Income Taxes
No provision has been made for income taxes because the Fund’s policy is to qualify as a regulated investment company under the Internal Revenue Code and to distribute substantially all of its taxable income.
FRE-15
FRANKLIN TEMPLETON VARIABLE INSURANCE PRODUCTS TRUST
FRANKLIN REAL ESTATE FUND
Notes to Financial Statements (continued)
1. ORGANIZATION AND SIGNIFICANT ACCOUNTING POLICIES (cont.)
f. Security Transactions, Investment Income, Expenses and Distributions
Security transactions are accounted for on trade date. Realized gains and losses on security transactions are determined on a specific identification basis. Interest income and estimated expenses are accrued daily. Dividend income and distributions to shareholders are recorded on the ex-dividend date.
Common expenses incurred by the Trust are allocated among the Funds based on the ratio of net assets of each fund to the combined net assets. Other expenses are charged to each fund on a specific identification basis.
Distributions received by the Fund from securities may be a return of capital (ROC). Such distributions reduce the cost basis of the securities, and any distributions in excess of the cost basis are recognized as capital gains.
Realized and unrealized gains and losses and net investment income, other than class specific expenses, are allocated daily to each class of shares based upon the relative proportion of net assets of each class.
g. Accounting Estimates
The preparation of financial statements in accordance with accounting principles generally accepted in the United States of America requires management to make estimates and assumptions that affect the reported amounts of assets and liabilities at the date of the financial statements and the amounts of income and expense during the reporting period. Actual results could differ from those estimates.
h. Guarantees and Indemnifications
Under the Trust’s organizational documents, its officers and trustees are indemnified against certain liability arising out of the performance of their duties to the Trust. Additionally, in the normal course of business, the Trust enters into contracts with service providers that contain general indemnification clauses. The Trust’s maximum exposure under these arrangements is unknown as this would involve future claims that may be made against the Trust that have not yet occurred. However, based on experience, the Trust expects the risk of loss to be remote.
FRE-16
FRANKLIN TEMPLETON VARIABLE INSURANCE PRODUCTS TRUST
FRANKLIN REAL ESTATE FUND
Notes to Financial Statements (continued)
2. SHARES OF BENEFICIAL INTEREST
The Fund offers two classes of shares: Class 1 and Class 2. Each class of shares differs by its distribution fees, voting rights on matters affecting a single class, and its exchange privilege.
At December 31, 2003, there were an unlimited number of shares authorized ($.01 par value). Transactions in the Fund’s shares were as follows:
| | | | | | | | | | | | | | |
| | | Year Ended December 31,
| |
| | | 2003
| | | 2002
| |
| Class 1 Shares: | | Shares
| | | Amount
| | | Shares
| | | Amount
| |
Shares sold | | 108,708 | | | $ | 2,250,887 | | | 378,683 | | | $ | 7,219,909 | |
Shares issued in reinvestment of distributions | | 159,198 | | | | 3,177,591 | | | 187,668 | | | | 3,665,154 | |
Shares redeemed | | (904,315 | ) | | | (18,096,381 | ) | | (1,698,569 | ) | | | (31,411,712 | ) |
| | |
|
|
Net increase (decrease) | | (636,409 | ) | | $ | (12,667,903 | ) | | (1,132,218 | ) | | $ | (20,526,649 | ) |
| | |
| |
| Class 2 Shares: | | | | | | | | | | | | |
Shares sold | | 8,352,474 | | | $ | 172,419,233 | | | 9,199,579 | | | $ | 170,461,629 | |
Shares issued in reinvestment of distributions | | 440,506 | | | | 8,704,406 | | | 232,180 | | | | 4,495,007 | |
Shares redeemed | | (635,445 | ) | | | (12,575,786 | ) | | (824,400 | ) | | | (14,923,568 | ) |
| | |
|
|
Net increase (decrease) | | 8,157,535 | | | $ | 168,547,853 | | | 8,607,359 | | | $ | 160,033,068 | |
| | |
| |
3. TRANSACTIONS WITH AFFILIATES
Certain officers and trustees of the Trust are also officers and/or directors of the following entities:
| | |
| Entity | | Affiliation |
|
| Franklin Advisers Inc. (Advisers) | | Investment manager |
| Franklin Templeton Services LLC (FT Services) | | Administrative manager |
| Franklin/Templeton Distributors Inc (Distributors) | | Principal underwriter |
| Franklin/Templeton Investor Services LLC (Investor Services) | | Transfer Agent |
The Fund pays an investment management fee to Advisers based on the average daily net assets of the Fund as follows:
| | |
| Annualized Fee Rate | | Net Assets |
|
| .625% | | First $100 million |
| .500% | | Over $100 million, up to and including $250 million |
| .450% | | Over $250 million, up to and including $10 billion |
Fees are further reduced on net assets over $10 billion.
Under an agreement with Advisers, FT Services provides administrative services to the Fund. The fee is paid by Advisers based on the average daily net assets, and is not an additional expense of the Fund.
The Fund reimburses Distributors up to .25% per year of its average daily net assets of Class 2, for costs incurred in marketing the Fund’s shares.
Investor Services, under terms of an agreement, performs shareholder servicing for the Fund and is not paid by the Fund for the services.
FRE-17
FRANKLIN TEMPLETON VARIABLE INSURANCE PRODUCTS TRUST
FRANKLIN REAL ESTATE FUND
Notes to Financial Statements (continued)
4. INCOME TAXES
At December 31, 2003, the Fund had tax basis capital losses of $2,642,456 which may be carried over to offset future capital gains. Such losses expire as follows:
| | | |
Capital loss carryover expiring in: | | | |
2008 | | $ | 1,350,977 |
2011 | | | 1,291,479 |
| | |
|
|
| | | $ | 2,642,456 |
| | |
|
|
The tax character of distributions paid during the years ended December 31, 2003 and 2002, was as follows:
| | | | | | |
| | | 2003
| | 2002
|
Distributions paid from: | | | | | | |
Ordinary Income | | $ | 11,881,997 | | $ | 8,160,161 |
Long-term capital gains | | | — | | | — |
| | |
|
| | | $ | 11,881,997 | | $ | 8,160,161 |
| | |
|
Net realized gains (losses) differ for financial statement and tax purposes primarily due to differing treatments of wash sales.
At December 31, 2003, the cost of investments, net unrealized appreciation (depreciation), undistributed ordinary income, and undistributed long term capital gains for income tax purposes were as follows:
| | | | |
Cost of investments | | $ | 499,867,599 | |
| | |
|
|
|
Unrealized appreciation | | | 155,836,507 | |
Unrealized depreciation | | | (2,107,691 | ) |
| | |
|
|
|
Net unrealized appreciation (depreciation) | | $ | 153,728,816 | |
| | |
|
|
|
Undistributed ordinary income | | $ | 19,252,857 | |
Undistributed long term capital gains | | | — | |
| | |
|
|
|
Distributable earnings | | $ | 19,252,857 | |
| | |
|
|
|
5. INVESTMENT TRANSACTIONS
Purchases and sales of investments (excluding short-term securities) for the year ended December 31, 2003 aggregated $196,843,170 and $66,433,259, respectively.
6. REGULATORY MATTERS
On February 4, 2004, the Securities Division of the Office of the Secretary of the Commonwealth of Massachusetts filed an administrative complaint against Franklin Resources, Inc. and certain of its subsidiaries (the “Company”), alleging violations of the Massachusetts Uniform Securities Act. The complaint arises from activity that occurred in 2001 during which time an officer of a Company subsidiary was negotiating an agreement with an investor relating to investments in a mutual fund and a hedge fund.
The Company, in addition to other entities within Franklin Templeton Investments, has been named in shareholder class actions related to the matter described above. The Company believes that the claims made in the lawsuit are without merit and it intends to defend vigorously against the allegations. The Company and the Fund may be named in similar civil actions related to the matter described above.
FRE-18
FRANKLIN TEMPLETON VARIABLE INSURANCE PRODUCTS TRUST
FRANKLIN REAL ESTATE FUND
Notes to Financial Statements (continued)
6. REGULATORY MATTERS (cont.)
In addition, as part of ongoing investigations by the U.S. Securities and Exchange Commission (the “SEC”), the U.S. Attorney for the Northern District of California, the New York Attorney General, the California Attorney General, the U.S. Attorney for the District of Massachusetts, the Florida Department of Financial Services, and the Commissioner of Securities and the Attorney General of the State of West Virginia, relating to certain practices in the mutual fund industry, including late trading, market timing and sales compensation arrangements, the Company and its subsidiaries, as well as certain current or former executives and employees of the Company, have received requests for information and/or subpoenas to testify or produce documents. The Company and its current employees are providing documents and information in response to these requests and subpoenas. In addition, the Company has responded to requests for similar kinds of information from regulatory authorities in some of the foreign countries where the Company conducts its global asset management business.
The Staff of the SEC has informed the Company that it intends to recommend that the Commission authorize an action against of the Fund’s investment adviser and a senior executive officer relating to the frequent trading issues that are the subject of the SEC’s investigation. These issues were previously disclosed as being under investigation by government authorities and the subject of an internal inquiry by the Company in its Annual Report on Form 10-K and on its public website. The Company currently is in discussions with the SEC Staff in an effort to resolve the issues raised in their investigation. Such discussions are preliminary and the Fund’s management has been advised that the Company cannot predict the likelihood of whether those discussions will result in a settlement and, if so, the terms of such settlement. The impact, if any, of these matters on the Fund is uncertain at this time. If the Company finds that it bears responsibility for any unlawful or improper conduct, it has committed to making the Fund or its shareholders whole, as appropriate.
FRE-19
FRANKLIN TEMPLETON VARIABLE INSURANCE PRODUCTS TRUST
FRANKLIN REAL ESTATE FUND
Independent Auditors’ Report
To the Board of Directors and Shareholders of
Franklin Templeton Variable Insurance Products Trust
In our opinion, the accompanying statement of assets and liabilities, including the statement of investments, and the related statements of operations and of changes in net assets and the financial highlights present fairly, in all material respects, the financial position of Franklin Real Estate Fund (the Fund) (one of the funds constituting the Franklin Templeton Variable Insurance Products Trust) at December 31, 2003, the results of its operations for the year then ended, the changes in its net assets for each of the two years in the period then ended and the financial highlights for each of the periods presented, in conformity with accounting principles generally accepted in the United States of America. These financial statements and financial highlights (hereafter referred to as “financial statements”) are the responsibility of the Fund’s management; our responsibility is to express an opinion on these financial statements based on our audits. We conducted our audits of these financial statements in accordance with auditing standards generally accepted in the United States of America, which require that we plan and perform the audits to obtain reasonable assurance about whether the financial statements are free of material misstatement. An audit includes examining, on a test basis, evidence supporting the amounts and disclosures in the financial statements, assessing the accounting principles used and significant estimates made by management, and evaluating the overall financial statement presentation. We believe that our audits, which included confirmation of securities at December 31, 2003 by correspondence with the custodian and brokers, provide a reasonable basis for our opinion.
PricewaterhouseCoopers LLP
San Francisco, California
February 5, 2004, except for Note 6 as to which the date is February 12, 2004
FRE-20
FRANKLIN TEMPLETON VARIABLE INSURANCE PRODUCTS TRUST
FRANKLIN REAL ESTATE FUND
Tax Designation (unaudited)
Under Section 854(b)(2) of the Code, the Fund hereby designates 17% of the ordinary income dividends as income qualifying for the dividends received deduction for the fiscal year ended December 31, 2003.
FRE-21
FRANKLIN RISING DIVIDENDS SECURITIES FUND
Fund Goal and Primary Investments: Franklin Rising Dividends Securities Fund seeks long-term capital appreciation. Preservation of capital, while not a goal, is also an important consideration. The Fund primarily invests in equity securities of companies that have paid consistently rising dividends over the past 10 years.
This annual report for Franklin Rising Dividends Securities Fund covers the fiscal year ended December 31, 2003.
Performance Overview
You can find the Fund’s one-year total return in the Performance Summary following this report. The Fund underperformed its benchmark, the Russell Midcap® Value Index, which returned 38.07% for the year under review.1 Please note that the Fund employs a bottom-up stock selection process, and the managers invest in securities without regard to benchmark comparisons.
Economic and Market Overview
During the year ended December 31, 2003, many factors impacted global economies and financial markets. Early in the year, economic uncertainty and geopolitical events, including impending war in Iraq, pushed U.S. interest rates to their lowest level in more than four decades, and the 10-year U.S. Treasury note’s yield fell to 3.13% in mid-June. However, following the end of major conflict in Iraq, many economic indicators turned positive. The U.S. government injected fiscal stimulus into the economy, approving another round of tax cuts and rebates that included dividend and capital gains tax reductions. In June, an accommodative Federal Reserve Board, in an attempt to bolster the economy, cut the federal funds target rate to 1.00%.
During the year, the U.S. trade deficit increased significantly, contributing to the U.S. dollar’s fall to record lows against the euro and other major currencies. However, the weak dollar provided a boost to the U.S. economy and corporate profits as exports became cheaper for foreign buyers. Robust consumer spending, especially for autos and homes, and strong business spending, particularly for equipment and software, contributed to the accelerated economic activity. In addition, U.S. federal spending stayed firm and inflation remained benign. U.S. gross domestic product (GDP) grew an annualized 8.2% in third quarter 2003, its strongest pace in nearly 20 years, and overall, 2003 GDP
1. Source: Standard & Poor’s Micropal. One cannot invest directly in an index, nor is an index representative of the Fund’s portfolio. Please see Index Descriptions following the Fund Summaries.
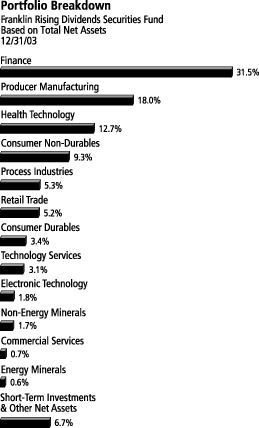
FRD-1
grew an estimated 3.1%. As economic data improved, some interest rates rose from their lows, and the 10-year Treasury note’s yield ended the period at 4.27%.
An equity market rally started in late March 2003 and continued through the end of the year. The rebound began with investors anticipating economic recovery in the second half of 2003, and it continued as data showed robust economic growth. Improved sentiment led many investors to rotate into economically sensitive and financially leveraged companies, specifically cyclical, technology, small-capitalization and emerging market stocks. The Standard & Poor’s 500 Composite Index (S&P 500) rose 28.67% for the 12 months ended December 31, 2003, while the technology-heavy Nasdaq Composite Index increased 50.93%.2
Investment Strategy
We are a research driven, fundamental investment adviser, pursuing a disciplined value-oriented strategy. As bottom-up investors concentrating primarily on individual securities, we seek fundamentally sound companies that meet our screening criteria: consistent, substantial dividend increases; reinvested earnings; and strong balance sheets. We attempt to acquire such stocks at attractive prices, often when they are out of favor with other investors. In following these criteria, we do not necessarily focus on companies whose securities pay a high dividend rate but rather on companies that consistently increase their dividends.
Manager’s Discussion
Significant positive contributors to the Fund’s one-year performance came from a variety of industries. Although many of the stock market’s top performers were economically sensitive companies, our best investment during the year was Old Republic International, a multi-line insurance company (finance sector). Old Republic rewarded investors with a $1 per share special dividend in December 2003, followed by a 3-for-2 stock split at year-end. Furthermore, Old Republic has posted 22 years of dividend increases. West Pharmaceutical Services was our most important contributor from the health technology sector. West is a small-capitalization company that develops and manufactures packaging materials and drug delivery devices for pharmaceutical and biologic companies. West has increased its dividend annually for the
2. Source: Standard & Poor’s Micropal. Please see Index Descriptions following the Fund Summaries.
FRD-2
Top 10 Holdings
Franklin Rising Dividends Securities Fund 12/31/03
| | |
Company
Sector/Industry | | % of Total
Net Assets |
|
| |
| Family Dollar Stores Inc. | | 4.2% |
| Retail Trade | | |
| |
| American International Group Inc. | | 4.2% |
| Finance | | |
| |
| Fannie Mae | | 4.1% |
| Finance | | |
| |
| Hillenbrand Industries Inc. | | 4.1% |
| Health Technology | | |
| |
| General Electric Co. | | 3.9% |
| Producer Manufacturing | | |
| |
| Old Republic International Corp. | | 3.9% |
| Finance | | |
| |
| Pfizer Inc. | | 3.9% |
| Health Technology | | |
| |
| Washington Mutual Inc. | | 3.8% |
| Finance | | |
| |
| Procter & Gamble Co. | | 3.6% |
| Consumer Non-Durables | | |
| |
| Alberto-Culver Co., B | | 3.2% |
| Consumer Non-Durables | | |
The dollar value, number of shares or principal amount, and complete legal titles of all portfolio holdings are listed in the Fund’s Statement of Investments.
last 10 years. The largest contributor from the producer manufacturing sector during the year was Graco. Graco manufactures fluid dispensing equipment and systems, such as paint sprayers used by building contractors. Graco declared a $2.25 special dividend in December 2003 and increased its regular quarterly dividend by 70%.
Despite the Fund’s double-digit total returns, two stocks in the portfolio declined during the year. The worst performance came from the Fund’s small position in Fresh Brands, a supermarket chain and grocery wholesaler based in Wisconsin; weak operating results led to several changes in its executive management team. The other declining stock in the portfolio was Leggett & Platt. Leggett is an engineered component manufacturer with heavy exposure to the residential furnishings market, and has 32 years of dividend increases. Bemis, which makes flexible packaging and pressure sensitive materials, only delivered a marginally positive return for the year; however, Bemis has increased its dividend for 20 consecutive years.
Consistent with our strategy, we added four new positions in 2003 that have long track records of increased dividends. During the year we purchased Erie Indemnity, the management company for the Erie Insurance Exchange, a personal and small commercial property and casualty insurer; Pfizer, the largest pharmaceutical company by market capitalization; Praxair, a supplier of industrial gases; and Procter & Gamble, the large consumer products conglomerate. The only company we eliminated from the portfolio during the Fund’s fiscal year was Pall, which cut its dividend in 2002.
FRD-3
Our 10 largest positions on December 31, 2003, represented 38.9% of the Fund’s total net assets. It is interesting to note how these 10 companies would, in aggregate, respond to the Fund’s screening criteria based on a simple average of statistical measures. On average, these 10 companies have raised their dividends 26 years in a row and by 264% in the past 10 years. Their most recent year-over-year dividend increases averaged 20% with a yield of 1.8% on December 31, 2003, and a dividend payout ratio of 28% based on estimates of calendar year 2003 operating earnings. The average price/earnings ratio was 17.3 times 2003 estimates versus 20.7 for that of the unmanaged S&P 500 on the same date.2
Thank you for your participation in Franklin Rising Dividends Securities Fund. We look forward to serving your future investment needs.
2. Source: Standard & Poor’s Micropal. Please see Index Descriptions following the Fund Summaries.
This discussion reflects our analysis, opinions and portfolio holdings as of December 31, 2003, the end of the reporting period. The way we implement our main investment strategies and the resulting portfolio holdings may change depending on factors such as market and economic conditions. These opinions may not be relied upon as investment advice or an offer for a particular security. The information is not a complete analysis of every aspect of any market, country, industry, security or the Fund. Statements of fact are from sources considered reliable, but the advisor makes no representation or warranty as to their completeness or accuracy. Although historical performance is no guarantee of future results, these insights may help you understand our investment management philosophy.
FRD-4
PERFORMANCE SUMMARYASOF 12/31/03
Total return of Class 2 shares represents the average annual change in value, assuming reinvestment of dividends and capital gains. Average returns smooth out variations in returns, which can be significant; they are not the same as year-by-year results.
Franklin Rising Dividends Securities Fund – Class 2*
Periods ended 12/31/03
| | | | | | |
| | | 1-Year | | 5-Year | | 10-Year |
|
| | | |
Average Annual Total Return | | +24.59% | | +8.63% | | +12.77% |
*Because Class 2 shares were not offered until 1/6/99, standardized Class 2 Fund performance for prior periods represents the historical results of Class 1 shares. For periods beginning on 1/6/99, Class 2’s results reflect an additional 12b-1 fee expense, which also affects future performance. Since 1/6/99 (effective date), the average annual total return of Class 2 shares was +8.46%.
Ongoing market volatility can significantly affect short-term performance; recent returns may differ.
Total Return Index Comparison
for Hypothetical $10,000 Investment (1/1/94–12/31/03)
The graph compares the performance of Franklin Rising Dividends Securities Fund – Class 2* and the Russell Midcap Value Index. One cannot invest directly in an index, nor is an index representative of the Fund’s portfolio. Please see Important Notes to Performance Information preceding the Fund Summaries.
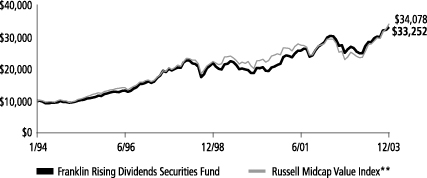
**Source: Standard & Poor’s Micropal. Please see Index Descriptions following the Fund Summaries.
Franklin Rising Dividends Securities Fund – Class 2
Performance reflects the Fund’s Class 2 operating expenses, but does not include any contract fees, expenses or sales charges. If they had been included, performance would be lower. These charges and deductions, particularly for variable life policies, can have a significant effect on contract values and insurance benefits. See the contract prospectus for a complete description of these expenses, including sales charges.
Since markets can go down as well as up, investment return and the value of your principal will fluctuate with market conditions, and you may have a gain or loss when you sell your shares.
Past performance does not guarantee future results.
FRD-5
FRANKLIN TEMPLETON VARIABLE INSURANCE PRODUCTS TRUST
FRANKLIN RISING DIVIDENDS SECURITIES FUND
Financial Highlights
| | | | | | | | | | | | | | | | | | | | |
| | | Class 1
| |
| | | Year Ended December 31,
| |
| | | 2003 | | | 2002 | | | 2001 | | | 2000 | | | 1999 | |
| | |
|
|
|
Per share operating performance | | | | | | | | | | | | | | | | | | | | |
(for a share outstanding throughout the year) | | | | | | | | | | | | | | | | | | | | |
Net asset value, beginning of year | | $ | 13.57 | | | $ | 14.19 | | | $ | 13.23 | | | $ | 13.61 | | | $ | 18.11 | |
| | |
|
|
|
Income from investment operations: | | | | | | | | | | | | | | | | | | | | |
Net investment incomea | | | .19 | | | | .16 | | | | .18 | | | | .20 | | | | .22 | |
Net realized and unrealized gains (losses) | | | 3.10 | | | | (.30 | ) | | | 1.60 | | | | 2.18 | | | | (1.57 | ) |
| | |
|
|
|
Total from investment operations | | | 3.29 | | | | (.14 | ) | | | 1.78 | | | | 2.38 | | | | (1.35 | ) |
| | |
|
|
|
Less distributions from: | | | | | | | | | | | | | | | | | | | | |
Net investment income | | | (.14 | ) | | | (.19 | ) | | | (.01 | ) | | | (.50 | ) | | | (.29 | ) |
Net realized gains | | | (.44 | ) | | | (.29 | ) | | | (.81 | ) | | | (2.26 | ) | | | (2.86 | ) |
| | |
|
|
|
Total distributions | | | (.58 | ) | | | (.48 | ) | | | (.82 | ) | | | (2.76 | ) | | | (3.15 | ) |
| | |
|
|
|
Net asset value, end of year | | $ | 16.28 | | | $ | 13.57 | | | $ | 14.19 | | | $ | 13.23 | | | $ | 13.61 | |
| | |
|
|
|
| | | | | |
Total returnb | | | 24.88% | | | | (1.32)% | | | | 13.90% | | | | 21.05% | | | | (9.70)% | |
Ratios/supplemental data | | | | | | | | | | | | | | | | | | | | |
Net assets, end of year (000’s) | | $ | 326,663 | | | $ | 292,881 | | | $ | 347,336 | | | $ | 363,485 | | | $ | 450,549 | |
Ratios to average net assets: | | | | | | | | | | | | | | | | | | | | |
Expenses | | | .76% | | | | .78% | | | | .76% | | | | .78% | | | | .75% | |
Net investment income | | | 1.39% | | | | 1.11% | | | | 1.36% | | | | 1.66% | | | | 1.35% | |
Portfolio turnover rate | | | 9.54% | | | | 14.06% | | | | 11.78% | | | | 12.26% | | | | 5.32% | |
| a | Based on average daily shares outstanding. |
| b | Total return does not include any fees, charges or expenses imposed by the variable annuity and life insurance contracts for which the Franklin Templeton Variable Insurance Products Trust serves as an underlying investment vehicle. Total return is not annualized for periods less than one year. |
FRD-6
FRANKLIN TEMPLETON VARIABLE INSURANCE PRODUCTS TRUST
FRANKLIN RISING DIVIDENDS SECURITIES FUND
Financial Highlights (continued)
| | | | | | | | | | | | | | | | | | | | |
| | | Class 2
| |
| | | Year Ended December 31,
| |
| | | 2003 | | | 2002 | | | 2001 | | | 2000 | | | 1999c | |
| | |
|
|
|
Per share operating performance | | | | | | | | | | | | | | | | | | | | |
(for a share outstanding throughout the year) | | | | | | | | | | | | | | | | | | | | |
Net asset value, beginning of year | | $ | 13.44 | | | $ | 14.09 | | | $ | 13.18 | | | $ | 13.56 | | | $ | 18.28 | |
| | |
|
|
|
Income from investment operations: | | | | | | | | | | | | | | | | | | | | |
Net investment incomea | | | .17 | | | | .13 | | | | .15 | | | | .17 | | | | .17 | |
Net realized and unrealized gains (losses) | | | 3.05 | | | | (.31 | ) | | | 1.58 | | | | 2.17 | | | | (1.74 | ) |
| | |
|
|
|
Total from investment operations | | | 3.22 | | | | (.18 | ) | | | 1.73 | | | | 2.34 | | | | (1.57 | ) |
| | |
|
|
|
Less distributions from: | | | | | | | | | | | | | | | | | | | | |
Net investment income | | | (.13 | ) | | | (.18 | ) | | | (.01 | ) | | | (.46 | ) | | | (.29 | ) |
Net realized gains | | | (.44 | ) | | | (.29 | ) | | | (.81 | ) | | | (2.26 | ) | | | (2.86 | ) |
| | |
|
|
|
Total distributions | | | (.57 | ) | | | (.47 | ) | | | (.82 | ) | | | (2.72 | ) | | | (3.15 | ) |
| | |
|
|
|
Net asset value, end of year | | $ | 16.09 | | | $ | 13.44 | | | $ | 14.09 | | | $ | 13.18 | | | $ | 13.56 | |
| | |
|
|
|
| | | | | |
Total returnb | | | 24.59% | | | | (1.58)% | | | | 13.57% | | | | 20.71% | | | | (10.84)% | |
Ratios/supplemental data | | | | | | | | | | | | | | | | | | | | |
Net assets, end of year (000’s) | | $ | 343,675 | | | $ | 63,879 | | | $ | 11,831 | | | $ | 1,041 | | | $ | 549 | |
Ratios to average net assets: | | | | | | | | | | | | | | | | | | | | |
Expenses | | | 1.01% | | | | 1.03% | | | | 1.01% | | | | 1.03% | | | | 1.01% | d |
Net investment income | | | 1.14% | | | | .86% | | | | 1.13% | | | | 1.44% | | | | 1.15% | d |
Portfolio turnover rate | | | 9.54% | | | | 14.06% | | | | 11.78% | | | | 12.26% | | | | 5.32% | |
| a | Based on average daily shares outstanding. |
| b | Total return does not include any fees, charges or expenses imposed by the variable annuity and life insurance contracts for which the Franklin Templeton Variable Insurance Products Trust serves as an underlying investment vehicle. Total return is not annualized for periods less than one year. |
| c | For the period January 6, 1999 (effective date) to December 31, 1999. |
FRD-7
See notes to financial statements.
FRANKLIN TEMPLETON VARIABLE INSURANCE PRODUCTS TRUST
FRANKLIN RISING DIVIDENDS SECURITIES FUND
Statement of Investments, December 31, 2003
| | | | | |
| | | SHARES | | VALUE |
|
Common Stocks 93.3% | | | | | |
Commercial Services .7% | | | | | |
ABM Industries Inc. | | 264,000 | | $ | 4,596,240 |
| | | | |
|
|
Consumer Durables 3.4% | | | | | |
Leggett & Platt Inc. | | 618,000 | | | 13,367,340 |
Russ Berrie & Co. Inc. | | 278,400 | | | 9,437,760 |
| | | | |
|
|
| | | | | | 22,805,100 |
| | | | |
|
|
Consumer Non-Durables 9.3% | | | | | |
Alberto-Culver Co., B | | 340,300 | | | 21,466,124 |
Altria Group Inc. | | 48,000 | | | 2,612,160 |
Lancaster Colony Corp. | | 109,600 | | | 4,949,536 |
Procter & Gamble Co. | | 239,700 | | | 23,941,236 |
Superior Uniform Group Inc. | | 248,600 | | | 4,089,470 |
Universal Corp. | | 115,800 | | | 5,114,886 |
| | | | |
|
|
| | | | | | 62,173,412 |
| | | | |
|
|
Electronic Technology 1.8% | | | | | |
Cohu Inc. | | 106,800 | | | 2,045,220 |
Diebold Inc. | | 189,000 | | | 10,181,430 |
| | | | |
|
|
| | | | | | 12,226,650 |
| | | | |
|
|
Energy Minerals .6% | | | | | |
Royal Dutch Petroleum Co., N.Y. shs. (Netherlands) | | 70,300 | | | 3,683,017 |
| | | | |
|
|
Finance 31.5% | | | | | |
AFLAC Inc. | | 439,600 | | | 15,904,728 |
American International Group Inc. | | 423,855 | | | 28,093,109 |
Arthur J. Gallagher & Co. | | 453,000 | | | 14,717,970 |
Erie Indemnity Co., A | | 276,800 | | | 11,730,784 |
Fannie Mae | | 366,500 | | | 27,509,490 |
Mercantile Bankshares Corp. | | 220,525 | | | 10,051,530 |
Mercury General Corp. | | 129,200 | | | 6,014,260 |
National Commerce Financial Corp. | | 680,200 | | | 18,555,856 |
Old Republic International Corp. | | 1,034,250 | | | 26,228,580 |
Peoples Bancorp Inc. | | 89,345 | | | 2,636,571 |
RLI Corp. | | 252,512 | | | 9,459,100 |
State Street Corp. | | 75,400 | | | 3,926,832 |
TrustCo Bank Corp. NY | | 328,588 | | | 4,320,932 |
U.S. Bancorp | | 87,749 | | | 2,613,165 |
Washington Mutual Inc. | | 630,200 | | | 25,283,624 |
Wilmington Trust Corp. | | 119,000 | | | 4,284,000 |
| | | | |
|
|
| | | | | | 211,330,531 |
| | | | |
|
|
Health Technology 12.7% | | | | | |
Becton, Dickinson & Co. | | 300,200 | | | 12,350,228 |
Hillenbrand Industries Inc. | | 439,400 | | | 27,269,164 |
Pfizer Inc. | | 739,000 | | | 26,108,870 |
West Pharmaceutical Services Inc. | | 562,800 | | | 19,078,920 |
| | | | |
|
|
| | | | | | 84,807,182 |
| | | | |
|
|
Non-Energy Minerals 1.7% | | | | | |
Nucor Corp. | | 206,800 | | | 11,580,800 |
| | | | |
|
|
FRD-8
FRANKLIN TEMPLETON VARIABLE INSURANCE PRODUCTS TRUST
FRANKLIN RISING DIVIDENDS SECURITIES FUND
Statement of Investments, December 31, 2003 (cont.)
| | | | | |
| | | SHARES | | VALUE |
|
Common Stocks (cont.) | | | | | |
Process Industries 5.3% | | | | | |
Bemis Co. Inc. | | 98,600 | | $ | 4,930,000 |
Donaldson Co. Inc. | | 104,900 | | | 6,205,884 |
Myers Industries Inc. | | 641,147 | | | 7,770,702 |
Praxair Inc. | | 439,000 | | | 16,769,800 |
| | | | |
|
|
| | | | | | 35,676,386 |
| | | | |
|
|
Producer Manufacturing 18.0% | | | | | |
Baldor Electric Co. | | 59,233 | | | 1,353,474 |
Brady Corp., A | | 114,400 | | | 4,661,800 |
Carlisle Cos. Inc. | | 239,300 | | | 14,563,798 |
CIRCOR International Inc. | | 132,350 | | | 3,189,635 |
Dover Corp. | | 170,600 | | | 6,781,350 |
General Electric Co. | | 851,000 | | | 26,363,980 |
Graco Inc. | | 234,075 | | | 9,386,407 |
Kaydon Corp. | | 109,600 | | | 2,832,064 |
Roper Industries Inc. | | 372,600 | | | 18,354,276 |
Superior Industries International Inc. | | 444,400 | | | 19,340,288 |
Teleflex Inc. | | 287,900 | | | 13,914,207 |
| | | | |
|
|
| | | | | | 120,741,279 |
| | | | |
|
|
Retail Trade 5.2% | | | | | |
Family Dollar Stores Inc. | | 784,100 | | | 28,133,508 |
Fresh Brands Inc. | | 227,700 | | | 2,504,700 |
Limited Brands Inc. | | 231,046 | | | 4,165,759 |
| | | | |
|
|
| | | | | | 34,803,967 |
| | | | |
|
|
Technology Services 3.1% | | | | | |
Reynolds & Reynolds Co., A | | 721,600 | | | 20,962,480 |
| | | | |
|
|
Total Common Stocks (Cost $444,992,561) | | | | | 625,387,044 |
| | | | |
|
|
Short Term Investment (Cost $43,278,528) 6.5% | | | | | |
aFranklin Institutional Fiduciary Trust Money Market Portfolio | | 43,278,528 | | | 43,278,528 |
| | | | |
|
|
Total Investments (Cost $488,271,089) 99.8% | | | | | 668,665,572 |
Other Assets, less Liabilities .2% | | | | | 1,671,826 |
| | | | |
|
|
Net Assets 100.0% | | | | $ | 670,337,398 |
| | | | |
|
|
| a | See Note 6 regarding investments in the Franklin Institutional Fiduciary Trust Money Market Portfolio. |
See notes to financial statements.
FRD-9
FRANKLIN TEMPLETON VARIABLE INSURANCE PRODUCTS TRUST
FRANKLIN RISING DIVIDENDS SECURITIES FUND
Financial Statements
Statement of Assets and Liabilities
December 31, 2003
| | | |
Assets: | | | |
Investments in securities: | | | |
Cost | | $ | 488,271,089 |
| | |
|
|
Value | | | 668,665,572 |
Cash | | | 57,784 |
Receivables: | | | |
Investment securities sold | | | 170,759 |
Capital shares sold | | | 1,287,783 |
Dividends | | | 943,970 |
| | |
|
|
Total assets | | | 671,125,868 |
| | |
|
|
Liabilities: | | | |
Payables: | | | |
Capital shares redeemed | | | 236,186 |
Affiliates | | | 503,134 |
Other liabilities | | | 49,150 |
| | |
|
|
Total liabilities | | | 788,470 |
| | |
|
|
Net assets, at value | | $ | 670,337,398 |
| | |
|
|
Net assets consist of: | | | |
Undistributed net investment income | | $ | 5,814,236 |
Net unrealized appreciation (depreciation) | | | 180,394,483 |
Accumulated net realized gain (loss) | | | 11,542,248 |
Capital shares | | | 472,586,431 |
| | |
|
|
Net assets, at value | | $ | 670,337,398 |
| | |
|
|
Class 1: | | | |
Net assets, at value | | $ | 326,662,527 |
| | |
|
|
Shares outstanding | | | 20,067,891 |
| | |
|
|
Net asset value and offering price per share | | | $16.28 |
| | |
|
|
Class 2: | | | |
Net assets, at value | | $ | 343,674,871 |
| | |
|
|
Shares outstanding | | | 21,361,737 |
| | |
|
|
Net asset value and offering price per share | | | $16.09 |
| | |
|
|
See notes to financial statements.
FRD-10
FRANKLIN TEMPLETON VARIABLE INSURANCE PRODUCTS TRUST
FRANKLIN RISING DIVIDENDS SECURITIES FUND
Financial Statements (continued)
Statement of Operations
for the year ended December 31, 2003
| | | |
Investment income: (net of foreign taxes of $19,090) | | | |
Dividends | | $ | 9,585,128 |
| | |
|
|
Expenses: | | | |
Management fees (Note 3) | | | 3,256,622 |
Distribution fees – Class 2 (Note 3) | | | 384,302 |
Transfer agent fees | | | 2,914 |
Custodian fees | | | 4,227 |
Reports to shareholders | | | 64,459 |
Professional fees | | | 28,161 |
Trustees’ fees and expenses | | | 4,152 |
Other | | | 24,691 |
| | |
|
|
Total expenses | | | 3,769,528 |
| | |
|
|
Net investment income | | | 5,815,600 |
| | |
|
|
Realized and unrealized gains (losses): | | | |
Net realized gain (loss) from investments | | | 12,013,697 |
Net unrealized appreciation (depreciation) on investments | | | 89,189,068 |
| | |
|
|
Net realized and unrealized gain (loss) | | | 101,202,765 |
| | |
|
|
Net increase (decrease) in net assets resulting from operations | | $ | 107,018,365 |
| | |
|
|
See notes to financial statements.
FRD-11
FRANKLIN TEMPLETON VARIABLE INSURANCE PRODUCTS TRUST
FRANKLIN RISING DIVIDENDS SECURITIES FUND
Financial Statements (continued)
Statements of Changes in Net Assets
For the years ended December 31, 2003 and 2002
| | | | | | | | |
| | | 2003 | | | 2002 | |
| | |
| |
Increase (decrease) in net assets: | | | | | | | | |
Operations: | | | | | | | | |
Net investment income | | $ | 5,815,600 | | | $ | 4,005,301 | |
Net realized gain (loss) from investments | | | 12,013,697 | | | | 12,430,771 | |
Net unrealized appreciation (depreciation) on investments | | | 89,189,068 | | | | (21,892,359 | ) |
| | |
| |
Net increase (decrease) in net assets resulting from operations | | | 107,018,365 | | | | (5,456,287 | ) |
Distributions to shareholders from: | | | | | | | | |
Net investment income: | | | | | | | | |
Class 1 | | | (2,869,400 | ) | | | (4,426,633 | ) |
Class 2 | | | (1,134,822 | ) | | | (372,154 | ) |
Net realized gains: | | | | | | | | |
Class 1 | | | (8,730,599 | ) | | | (6,786,420 | ) |
Class 2 | | | (3,701,357 | ) | | | (588,470 | ) |
| | |
| |
Total distributions to shareholders | | | (16,436,178 | ) | | | (12,173,677 | ) |
Capital share transactions: (Note 2) | | | | | | | | |
Class 1 | | | (20,625,618 | ) | | | (39,872,739 | ) |
Class 2 | | | 243,621,232 | | | | 55,095,055 | |
| | |
| |
Total capital share transactions | | | 222,995,614 | | | | 15,222,316 | |
Net increase (decrease) in net assets | | | 313,577,801 | | | | (2,407,648 | ) |
Net assets: | | | | | | | | |
Beginning of year | | | 356,759,597 | | | | 359,167,245 | |
| | |
| |
End of year | | $ | 670,337,398 | | | $ | 356,759,597 | |
| | |
|
|
|
Undistributed net investment income included in net assets: | | | | | | | | |
End of year | | $ | 5,814,236 | | | $ | 4,002,858 | |
| | |
|
|
|
See notes to financial statements.
FRD-12
FRANKLIN TEMPLETON VARIABLE INSURANCE PRODUCTS TRUST
FRANKLIN RISING DIVIDENDS SECURITIES FUND
Notes to Financial Statements
1. ORGANIZATION AND SIGNIFICANT ACCOUNTING POLICIES
Franklin Templeton Variable Insurance Products Trust (the Trust) is registered under the Investment Company Act of 1940 as an open-end investment company, consisting of twenty-two separate series (the Funds). The Franklin Rising Dividends Securities Fund (the Fund) included in this report is diversified. Shares of the Fund are sold only to insurance company separate accounts to fund the benefits of variable life insurance policies or variable annuity contracts. As of December 31, 2003, over 76% of the total Fund shares were sold through one insurance company. The Fund’s investment objective is growth and income.
The following summarizes the Fund’s significant accounting policies.
a. Security Valuation
Securities listed or traded on a recognized national exchange or NASDAQ are valued at the last reported sales price. Over-the-counter securities and listed securities for which no sale is reported are valued within the range of the latest quoted bid and asked prices. Investments in open-ended mutual funds are valued at the closing net asset value. If events occur that materially affect the values of securities after the prices are determined, or if market quotations are not readily available, the securities will be valued at fair value as determined following procedures approved by the Board of Trustees.
b. Income Taxes
No provision has been made for income taxes because the Fund’s policy is to qualify as a regulated investment company under the Internal Revenue Code and to distribute substantially all of its taxable income.
c. Security Transactions, Investment Income, Expenses and Distributions
Security transactions are accounted for on trade date. Realized gains and losses on security transactions are determined on a specific identification basis. Interest income and estimated expenses are accrued daily. Dividend income and distributions to shareholders are recorded on the ex-dividend date.
Common expenses incurred by the Trust are allocated among the Funds based on the ratio of net assets of each fund to the combined net assets. Other expenses are charged to each fund on a specific identification basis.
Realized and unrealized gains and losses and net investment income, other than class specific expenses, are allocated daily to each class of shares based upon the relative proportion of net assets of each class.
d. Accounting Estimates
The preparation of financial statements in accordance with accounting principles generally accepted in the United States of America requires management to make estimates and assumptions that affect the reported amounts of assets and liabilities at the date of the financial statements and the amounts of income and expense during the reporting period. Actual results could differ from those estimates.
e. Guarantees and Indemnifications
Under the Trust’s organizational documents, its officers and trustees are indemnified against certain liability arising out of the performance of their duties to the Trust. Additionally, in the normal course of business, the Trust enters into contracts with service providers that contain general indemnification clauses. The Trust’s maximum exposure under these arrangements is unknown as this would involve future claims that may be made against the Trust that have not yet occurred. However, based on experience, the Trust expects the risk of loss to be remote.
FRD-13
FRANKLIN TEMPLETON VARIABLE INSURANCE PRODUCTS TRUST
FRANKLIN RISING DIVIDENDS SECURITIES FUND
Notes to Financial Statements (continued)
2. SHARES OF BENEFICIAL INTEREST
The Fund offers two classes of shares: Class 1 and Class 2. Each class of shares differs by its distribution fees, voting rights on matters affecting a single class, and its exchange privilege.
At December 31, 2003, there were an unlimited number of shares authorized ($.01 par value). Transactions in the Fund’s shares were as follows:
| | | | | | | | | | | | | | |
| | | Year Ended December 31,
| |
| | | 2003
| | | 2002
| |
| Class 1 Shares: | | Shares
| | | Amount
| | | Shares
| | | Amount
| |
Shares sold | | 574,822 | | | $ | 8,584,713 | | | 1,165,077 | | | $ | 17,506,981 | |
Shares issued in reinvestment of distributions | | 820,948 | | | | 11,599,999 | | | 741,604 | | | | 11,213,053 | |
Shares redeemed | | (2,908,584 | ) | | | (40,810,330 | ) | | (4,810,513 | ) | | | (68,592,773 | ) |
| | |
| |
Net increase (decrease) | | (1,512,814 | ) | | $ | (20,625,618 | ) | | (2,903,832 | ) | | $ | (39,872,739 | ) |
| | |
| |
| Class 2 Shares: | | | | | | | | | | | | |
Shares sold | | 16,604,956 | | | $ | 243,911,817 | | | 4,272,940 | | | $ | 59,907,271 | |
Shares issued in reinvestment of distributions | | 345,935 | | | | 4,836,178 | | | 64,042 | | | | 960,624 | |
Shares redeemed | | (340,952 | ) | | | (5,126,763 | ) | | (425,107 | ) | | | (5,772,840 | ) |
| | |
| |
Net increase (decrease) | | 16,609,939 | | | $ | 243,621,232 | | | 3,911,875 | | | $ | 55,095,055 | |
| | |
| |
3. TRANSACTIONS WITH AFFILIATES
Certain officers and trustees of the Fund are also officers and/or directors of the following entities:
| | |
| Entity | | Affiliation |
|
Franklin Advisory Services LLC (Advisory Services) | | Investment manager |
Franklin Templeton Services LLC (FT Services) | | Administrative manager |
Franklin/Templeton Distributors Inc. (Distributors) | | Principal underwriter |
Franklin/Templeton Investor Services LLC (Investor Services) | | Transfer agent |
The Fund pays an investment management fee to Advisory Services based on the average daily net assets of the Fund as follows:
| | |
| Annualized Fee Rate | | Net Assets |
|
| .75% | | First $500 million |
| .625% | | Over $500 million, up to and including $1 billion |
| .50% | | Over $1 billion |
Under an agreement with Advisory Services, FT Services provides administrative services to the Fund. The fee is paid by Advisory Services based on the average daily net assets, and is not an additional expense of the Fund.
The Fund reimburses Distributors up to .25% per year of its average daily net assets of Class 2, for costs incurred in marketing the Fund’s shares.
Investor Services, under terms of an agreement, performs shareholder servicing for the Fund and is not paid by the Fund.
FRD-14
FRANKLIN TEMPLETON VARIABLE INSURANCE PRODUCTS TRUST
FRANKLIN RISING DIVIDENDS SECURITIES FUND
Notes to Financial Statements (continued)
4. INCOME TAXES
Net realized capital gains and losses differ for financial statement and tax purposes primarily due to the differing treatment of wash sales.
The tax character of distributions paid during the years ended December 31, 2003 and 2002, was as follows:
| | | | | | |
| | | 2003
| | 2002
|
Distributions paid from: | | | | | | |
Ordinary income | | $ | 4,040,358 | | $ | 4,798,787 |
Long term capital gain | | $ | 12,395,820 | | | 7,374,890 |
| | |
|
| | | $ | 16,436,178 | | $ | 12,173,677 |
| | |
|
At December 31, 2003, the cost of investments, net unrealized appreciation (depreciation), undistributed ordinary income and undistributed long term capital gains for income tax purposes were as follows:
| | | | |
Cost of investments | | $ | 488,739,133 | |
| | |
|
|
|
Unrealized appreciation | | $ | 181,457,233 | |
Unrealized depreciation | | | (1,530,794 | ) |
| | |
|
|
|
Net unrealized appreciation (depreciation) | | $ | 179,926,439 | |
| | |
|
|
|
Undistributed ordinary income | | $ | 5,814,237 | |
Undistributed long term capital gains | | | 12,010,292 | |
| | |
|
|
|
Distributable earnings | | $ | 17,824,529 | |
| | |
|
|
|
5. INVESTMENT TRANSACTIONS
Purchases and sales of securities (excluding short-term securities) for the year ended December 31, 2003 aggregated $218,563,530 and $41,299,846, respectively.
6. INVESTMENTS IN FRANKLIN INSTITUTIONAL FIDUCIARY TRUST MONEY MARKET PORTFOLIO
The Fund may invest in the Franklin Institutional Fiduciary Trust Money Market Portfolio (the Sweep Money Fund), an open-end investment company managed by Franklin Advisers Inc. (an affiliate of the advisor). Management fees paid by the Fund are reduced on assets invested in the Sweep Money Fund, in an amount not to exceed the management fees paid by the Sweep Money Fund. The Fund earned $157,853 of dividend income from investment in the Sweep Money Fund for the year ended December 31, 2003.
7. REGULATORY MATTERS
On February 4, 2004, the Securities Division of the Office of the Secretary of the Commonwealth of Massachusetts filed an administrative complaint against Franklin Resources, Inc. and certain of its subsidiaries (the “Company”), alleging violations of the Massachusetts Uniform Securities Act. The complaint arises from activity that occurred in 2001 during which time an officer of a Company subsidiary was negotiating an agreement with an investor relating to investments in a mutual fund and a hedge fund.
The Company, in addition to other entities within Franklin Templeton Investments, has been named in shareholder class actions related to the matter described above. The Company believes that the claims made in the lawsuit are without merit and it intends to defend vigorously against the allegations. The Company and the Fund may be named in similar civil actions related to the matter described above.
FRD-15
FRANKLIN TEMPLETON VARIABLE INSURANCE PRODUCTS TRUST
FRANKLIN RISING DIVIDENDS SECURITIES FUND
Notes to Financial Statements (continued)
7. REGULATORY MATTERS (cont.)
In addition, as part of ongoing investigations by the U.S. Securities and Exchange Commission (the “SEC”), the U.S. Attorney for the Northern District of California, the New York Attorney General, the California Attorney General, the U.S. Attorney for the District of Massachusetts, the Florida Department of Financial Services, and the Commissioner of Securities and the Attorney General of the State of West Virginia, relating to certain practices in the mutual fund industry, including late trading, market timing and sales compensation arrangements, the Company and its subsidiaries, as well as certain current or former executives and employees of the Company, have received requests for information and/or subpoenas to testify or produce documents. The Company and its current employees are providing documents and information in response to these requests and subpoenas. In addition, the Company has responded to requests for similar kinds of information from regulatory authorities in some of the foreign countries where the Company conducts its global asset management business.
The Staff of the SEC has informed the Company that it intends to recommend that the Commission authorize an action against an affiliate of the Fund’s adviser and a senior executive officer relating to the frequent trading issues that are the subject of the SEC’s investigation. These issues were previously disclosed as being under investigation by government authorities and the subject of an internal inquiry by the Company in its Annual Report on Form 10-K and on its public website. The Company currently is in discussions with the SEC Staff in an effort to resolve the issues raised in their investigation. Such discussions are preliminary and the Fund’s management has been advised that the Company cannot predict the likelihood of whether those discussions will result in a settlement and, if so, the terms of such settlement. The impact, if any, of these matters on the Fund is uncertain at this time. If the Company finds that it bears responsibility for any unlawful or improper conduct, it has committed to making the Fund or its shareholders whole, as appropriate.
FRD-16
FRANKLIN TEMPLETON VARIABLE INSURANCE PRODUCTS TRUST
FRANKLIN RISING DIVIDENDS SECURITIES FUND
Independent Auditors’ Report
To the Board of Trustees and Shareholders of
Franklin Templeton Variable Insurance Products Trust
In our opinion, the accompanying statement of assets and liabilities, including the statement of investments, and the related statements of operations and of changes in net assets and the financial highlights present fairly, in all material respects, the financial position of the Franklin Rising Dividends Securities Fund (the Fund) (one of the funds constituting the Franklin Templeton Variable Insurance Products Trust) at December 31, 2003, the results of its operations for the year then ended, the changes in its net assets for each of the two years in the period then ended and the financial highlights for each of the periods presented, in conformity with accounting principles generally accepted in the United States of America. These financial statements and financial highlights (hereafter referred to as “financial statements”) are the responsibility of the Fund’s management; our responsibility is to express an opinion on these financial statements based on our audits. We conducted our audits of these financial statements in accordance with auditing standards generally accepted in the United States of America, which require that we plan and perform the audits to obtain reasonable assurance about whether the financial statements are free of material misstatement. An audit includes examining, on a test basis, evidence supporting the amounts and disclosures in the financial statements, assessing the accounting principles used and significant estimates made by management, and evaluating the overall financial statement presentation. We believe that our audits, which included confirmation of securities at December 31, 2003 by correspondence with the custodian and brokers, provide a reasonable basis for our opinion.
PricewaterhouseCoopers LLP
San Francisco, California
February 5, 2004, except for Note 7 as to which the date is February 12, 2004
FRD-17
FRANKLIN TEMPLETON VARIABLE INSURANCE PRODUCTS TRUST
FRANKLIN RISING DIVIDENDS SECURITIES FUND
Tax Designation (unaudited)
Under Section 852(b)(3)(C) of the Internal Revenue Code, the Fund hereby designates $12,013,697 as a capital gain dividend for the fiscal year ended December 31, 2003.
Under Section 854(b)(2) of the Code, the Fund herby designates 100% of the ordinary income dividends as income qualifying for the dividends received deduction for the fiscal year ended December 31, 2003.
FRD-18
FRANKLIN SMALL CAP FUND
Fund Goal and Primary Investments: Franklin Small Cap Fund seeks long-term capital growth. The Fund invests primarily in investments of U.S. small-capitalization companies with market capitalization values not exceeding: (i) $1.5 billion; or (ii) the highest market capitalization value in the Russell 2000® Index; whichever is greater, at the time of purchase.1
We are pleased to bring you Franklin Small Cap Fund’s annual report for the fiscal year ended December 31, 2003.
Performance Overview
You can find the Fund’s one-year total return in the Performance Summary following this report. Compared with its benchmarks over the same period, the Fund outperformed the Standard & Poor’s 500 Composite Index’s (S&P 500’s) 28.67% return but underperformed the Russell 2500™ Growth Index’s 46.31% return.2
Economic and Market Overview
During the year ended December 31, 2003, many factors impacted global economies and financial markets. Early in the year, economic uncertainty and geopolitical events, including impending war in Iraq, pushed U.S. interest rates to their lowest level in more than four decades, and the 10-year U.S. Treasury note’s yield fell to 3.13% in mid-June. However, following the end of major conflict in Iraq, many economic indicators turned positive. The U.S. government injected fiscal stimulus into the economy, approving another round of tax cuts and rebates that included dividend and capital gains tax reductions. In June, an accommodative Federal Reserve Board, in an attempt to bolster the economy, cut the federal funds target rate to 1.00%.
During the year, the U.S. trade deficit increased significantly, contributing to the U.S. dollar’s fall to record lows against the euro and other major currencies. However, the weak dollar provided a boost to the U.S. economy and corporate profits as exports became cheaper for foreign buyers. Robust consumer spending, especially for autos and homes, and strong business spending, particularly for equipment and software, contributed to the accelerated economic activity. In addition, U.S. federal spending stayed firm and inflation remained benign. U.S. gross domestic product (GDP) grew an annualized 8.2% in third quarter 2003, its strongest pace in nearly 20 years, and overall, 2003 GDP
1. Please see Index Descriptions following the Fund Summaries.
2. Source: Standard & Poor’s Micropal. One cannot invest directly in an index, nor is an index representative of the Fund’s portfolio. Please see Index Descriptions following the Fund Summaries.
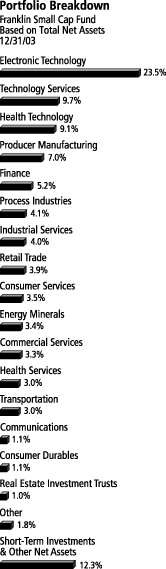
FSC-1
grew an estimated 3.1%. As economic data improved, some interest rates rose from their lows, and the 10-year Treasury note’s yield ended the period at 4.27%.
An equity market rally started in late March 2003 and continued through the end of the year. The rebound began with investors anticipating economic recovery in the second half of 2003, and it continued as data showed robust economic growth. Improved sentiment led many investors to rotate into economically sensitive and financially leveraged companies, specifically cyclical, technology, small-capitalization and emerging market stocks. The S&P 500 rose 28.67% for the 12 months ended December 31, 2003, while the technology-heavy Nasdaq Composite Index increased 50.93%.2
Investment Strategy
We are research driven, fundamental investors, pursuing a growth strategy. As bottom-up investors focusing primarily on individual securities, we choose companies that we believe are positioned for rapid growth in revenues, earnings or assets. We rely on a team of analysts to provide in-depth industry expertise, and we use qualitative and quantitative analyses to evaluate companies for distinct and sustainable competitive advantages. Advantages, such as a particular marketing or product niche, proven technology and industry leadership, are all factors we believe point to strong long-term growth potential.
Manager’s Discussion
The Fund’s overweighted position relative to the Russell 2500 Growth Index in electronic technology, specifically in semiconductors and electronic production equipment, helped performance during the year under review. A major contributor to return in this sector was Lam Research. Our specific stock selection in retail trade also contributed to returns as our investments in Fred’s and Tuesday Morning appreciated during the period. In health services, our underweighted position benefited Fund performance as this industry underperformed the index.
Although the Fund delivered strong returns, some factors constrained our results. Our overweighted position relative to the index in industrial services, which performed poorly relative to other sectors, detracted from Fund performance. In particular, Trico Marine Services
Top 10 Holdings
Franklin Small Cap Fund
12/31/03
| | |
Company Sector/Industry | | % of Total Net Assets |
|
| |
| Lam Research Corp. | | 2.0% |
| Electronic Technology | | |
| |
| Varian Semiconductor Equipment Associates Inc. | | 2.0% |
| Electronic Technology | | |
| |
| Tektronix Inc. | | 1.6% |
| Electronic Technology | | |
| |
| Mettler-Toledo International Inc. (Switzerland) | | 1.6% |
| Producer Manufacturing | | |
| |
| Varian Inc. | | 1.5% |
| Electronic Technology | | |
| |
| Micrel Inc. | | 1.3% |
| Electronic Technology | | |
| |
| Integrated Device Technology Inc. | | 1.3% |
| Electronic Technology | | |
| |
| Tom Brown Inc. | | 1.3% |
| Energy Minerals | | |
| |
| Semtech Corp. | | 1.3% |
| Electronic Technology | | |
| |
| Avocent Corp. | | 1.3% |
| Electronic Technology | | |
The dollar value, number of shares or principal amount, and complete legal titles of all portfolio holdings are listed in the Fund’s Statement of Investments.
FSC-2
(sold by year-end) declined in value during the reporting period. Our overweighted allocation as well as poor stock selection, such as Milacron (sold by year-end), in producer manufacturing hampered the Fund. Stock selection in technology services, such as Borland Software and Affiliated Computer Services, negatively impacted the Fund.
Thank you for your participation in Franklin Small Cap Fund. We look forward to serving your future investment needs.
This discussion reflects our analysis, opinions and portfolio holdings as of December 31, 2003, the end of the reporting period. The way we implement our main investment strategies and the resulting portfolio holdings may change depending on factors such as market and economic conditions. These opinions may not be relied upon as investment advice or an offer for a particular security. The information is not a complete analysis of every aspect of any market, country, industry, security or the Fund. Statements of fact are from sources considered reliable, but the advisor makes no representation or warranty as to their completeness or accuracy. Although historical performance is no guarantee of future results, these insights may help you understand our investment management philosophy.
FSC-3
PERFORMANCE SUMMARYASOF 12/31/03
Total return of Class 2 shares represents the average annual change in value, assuming reinvestment of dividends and capital gains. Average returns smooth out variations in returns, which can be significant; they are not the same as year-by-year results.
Franklin Small Cap Fund – Class 2*
Periods ended 12/31/03
| | | | | | |
| | | 1-Year | | 5-Year | | Since Inception (11/1/95) |
|
Average Annual Total Return | | +37.24% | | +6.78% | | +9.71% |
*Because Class 2 shares were not offered until 1/6/99, standardized Class 2 Fund performance for prior periods represents the historical results of Class 1 shares. For periods beginning on 1/6/99, Class 2’s results reflect an additional 12b-1 fee expense, which also affects future performance. Since 1/6/99 (effective date), the average annual total return of Class 2 shares was +6.00%.
Ongoing market volatility can significantly affect short-term performance; recent returns may differ.
Total Return Index Comparison for Hypothetical $10,000 Investment (11/1/95–12/31/03)
The graph compares the performance of Franklin Small Cap Fund – Class 2,* the S&P 500 and the Russell 2500 Growth Index. One cannot invest directly in an index, nor is an index representative of the Fund’s portfolio. Please see Important Notes to Performance Information preceding the Fund Summaries.
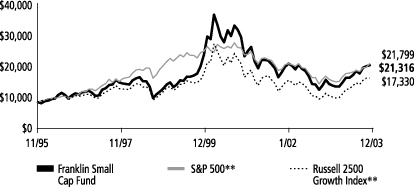
**Source: Standard & Poor’s Micropal. Please see Index Descriptions following the Fund Summaries.
Franklin Small Cap Fund – Class 2
Performance reflects the Fund’s Class 2 operating expenses, but does not include any contract fees, expenses or sales charges. If they had been included, performance would be lower. These charges and deductions, particularly for variable life policies, can have a significant effect on contract values and insurance benefits. See the contract prospectus for a complete description of these expenses, including sales charges.
Since markets can go down as well as up, investment return and the value of your principal will fluctuate with market conditions, and you may have a gain or loss when you sell your shares.
FSC-4
Past performance does not guarantee future results.
FRANKLIN TEMPLETON VARIABLE INSURANCE PRODUCTS TRUST
FRANKLIN SMALL CAP FUND
Financial Highlights
| | | | | | | | | | | | | | | | | | | | |
| | | Class 1
| |
| | | Year Ended December 31,
| |
| | | 2003 | | | 2002 | | | 2001 | | | 2000 | | | 1999 | |
| | |
|
|
|
Per share operating performance | | | | | | | | | | | | | | | | | | | | |
(For a share outstanding throughout the year) | | | | | | | | | | | | | | | | | | | | |
Net asset value, beginning of year | | $ | 12.79 | | | $ | 17.97 | | | $ | 21.25 | | | $ | 26.87 | | | $ | 13.72 | |
| | |
|
|
|
Income from investment operations: | | | | | | | | | | | | | | | | | | | | |
Net investment income (loss)a | | | (.03 | ) | | | (.02 | ) | | | .09 | | | | .11 | | | | (.01 | ) |
Net realized and unrealized gains (losses) | | | 4.84 | | | | (5.09 | ) | | | (3.28 | ) | | | (3.81 | ) | | | 13.25 | |
| | |
|
|
|
Total from investment operations | | | 4.81 | | | | (5.11 | ) | | | (3.19 | ) | | | (3.70 | ) | | | 13.24 | |
| | |
|
|
|
Less distributions from: | | | | | | | | | | | | | | | | | | | | |
Net investment income | | | — | | | | (.07 | ) | | | (.09 | ) | | | — | | | | (.08 | ) |
Net realized gains | | | — | | | | — | | | | — | | | | (1.92 | ) | | | (.01 | ) |
| | |
|
|
|
Total distributions | | | — | | | | (.07 | ) | | | (.09 | ) | | | (1.92 | ) | | | (.09 | ) |
| | |
|
|
|
Net asset value, end of year | | $ | 17.60 | | | $ | 12.79 | | | $ | 17.97 | | | $ | 21.25 | | | $ | 26.87 | |
| | |
|
|
|
| | | | | |
Total returnb | | | 37.61% | | | | (28.52)% | | | | (15.02)% | | | | (14.60)% | | | | 96.94% | |
| | | | | |
Ratios/supplemental data | | | | | | | | | | | | | | | | | | | | |
Net assets, end of year (000’s) | | $ | 197,551 | | | $ | 164,350 | | | $ | 266,694 | | | $ | 387,474 | | | $ | 488,062 | |
Ratios to average net assets: | | | | | | | | | | | | | | | | | | | | |
Expenses | | | .76% | | | | .79% | | | | .76% | | | | .75% | | | | .77% | |
Net investment income (loss) | | | (.24)% | | | | (.16)% | | | | .50% | | | | .42% | | | | (.05)% | |
Portfolio turnover rate | | | 45.00% | | | | 29.59% | | | | 37.94% | | | | 19.49% | | | | 39.49% | |
| a | Based on average daily shares outstanding. |
| b | Total return does not include any fees, charges or expenses imposed by the variable annuity and life insurance contracts for which the Franklin Templeton Variable Insurance Products Trust serves as an underlying investment vehicle. Total return is not annualized for periods less than one year. |
FSC-5
FRANKLIN TEMPLETON VARIABLE INSURANCE PRODUCTS TRUST
FRANKLIN SMALL CAP FUND
Financial Highlights (continued)
| | | | | | | | | | | | | | | | | | | | |
| | | Class 2
| |
| | | Year Ended December 31,
| |
| | | 2003 | | | 2002 | | | 2001 | | | 2000 | | | 1999c | |
| | |
|
|
|
Per share operating performance | | | | | | | | | | | | | | | | | | | | |
(For a share outstanding throughout the year) | | | | | | | | | | | | | | | | | | | | |
Net asset value, beginning of year | | $ | 12.70 | | | $ | 17.85 | | | $ | 21.14 | | | $ | 26.80 | | | $ | 14.25 | |
| | |
|
|
|
Income from investment operations: | | | | | | | | | | | | | | | | | | | | |
Net investment income (loss)a | | | (.07 | ) | | | (.06 | ) | | | .03 | | | | .12 | | | | (.04 | ) |
Net realized and unrealized gains (losses) | | | 4.80 | | | | (5.05 | ) | | | (3.25 | ) | | | (3.86 | ) | | | 12.68 | |
| | |
|
|
|
Total from investment operations | | | 4.73 | | | | (5.11 | ) | | | (3.22 | ) | | | (3.74 | ) | | | 12.64 | |
| | |
|
|
|
Less distributions from: | | | | | | | | | | | | | | | | | | | | |
Net investment income | | | — | | | | (.04 | ) | | | (.07 | ) | | | — | | | | (.08 | ) |
Net realized gains | | | — | | | | — | | | | — | | | | (1.92 | ) | | | (.01 | ) |
| | |
|
|
|
Total distributions | | | — | | | | (.04 | ) | | | (.07 | ) | | | (1.92 | ) | | | (.09 | ) |
| | |
|
|
|
Net asset value, end of year | | $ | 17.43 | | | $ | 12.70 | | | $ | 17.85 | | | $ | 21.14 | | | $ | 26.80 | |
| | |
|
|
|
| | | | | |
Total returnb | | | 37.24% | | | | (28.68)% | | | | (15.25)% | | | | (14.76)% | | | | 89.05% | |
Ratios/supplemental data | | | | | | | | | | | | | | | | | | | | |
Net assets, end of year (000’s) | | $ | 909,946 | | | $ | 415,952 | | | $ | 401,663 | | | $ | 301,420 | | | $ | 6,156 | |
Ratios to average net assets: | | | | | | | | | | | | | | | | | | | | |
Expenses | | | 1.01% | | | | 1.04% | | | | 1.01% | | | | 1.00% | | | | 1.02% | d |
Net investment income (loss) | | | (.49)% | | | | (.41)% | | | | .19% | | | | .49% | | | | (.18)% | d |
Portfolio turnover rate | | | 45.00% | | | | 29.59% | | | | 37.94% | | | | 19.49% | | | | 39.49% | |
| a | Based on average daily shares outstanding. |
| b | Total return does not include any fees, charges or expenses imposed by the variable annuity and life insurance contracts for which the Franklin Templeton Variable Insurance Products Trust serves as an underlying investment vehicle. Total return is not annualized for periods less than one year. |
| c | For the period January 6, 1999 (effective date) to December 31, 1999. |
See notes to financial statements.
FSC-6
FRANKLIN TEMPLETON VARIABLE INSURANCE PRODUCTS TRUST
FRANKLIN SMALL CAP FUND
Statement of Investments, December 31, 2003
| | | | | |
| | | SHARES | | VALUE |
|
Common Stocks 87.7% | | | | | |
Commercial Services 3.3% | | | | | |
aAquantive Inc. | | 425,800 | | $ | 4,364,450 |
Brinks Co. | | 209,400 | | | 4,734,534 |
CDI Corp. | | 90,700 | | | 2,970,425 |
aConcur Technologies Inc. | | 30,500 | | | 295,240 |
aCorporate Executive Board Co. | | 150,200 | | | 7,009,834 |
aDoubleClick Inc. | | 277,000 | | | 2,830,940 |
aLearning Tree International Inc. | | 52,000 | | | 904,280 |
aLECG Corp. | | 75,400 | | | 1,725,906 |
aMaximus Inc. | | 250,000 | | | 9,782,500 |
aResources Connection Inc. | | 74,600 | | | 2,037,326 |
| | | | |
|
|
| | | | | | 36,655,435 |
| | | | |
|
|
Communications 1.1% | | | | | |
aCommonwealth Telephone Enterprises Inc. | | 115,400 | | | 4,356,350 |
aNII Holdings Inc., B | | 105,600 | | | 7,880,928 |
| | | | |
|
|
| | | | | | 12,237,278 |
| | | | |
|
|
Consumer Durables 1.1% | | | | | |
Briggs & Stratton Corp. | | 37,800 | | | 2,547,720 |
aLeapfrog Enterprises Inc. | | 94,900 | | | 2,517,697 |
Polaris Industries Inc. | | 64,300 | | | 5,695,694 |
Winnebago Industries Inc. | | 19,000 | | | 1,306,250 |
| | | | |
|
|
| | | | | | 12,067,361 |
| | | | |
|
|
Consumer Non-Durables .5% | | | | | |
aNBTY Inc. | | 80,000 | | | 2,148,800 |
bNu Skin Enterprises Inc., A, P.I.P.E.S. | | 170,000 | | | 2,730,982 |
| | | | |
|
|
| | | | | | 4,879,782 |
| | | | |
|
|
Consumer Services 3.5% | | | | | |
aArgosy Gaming Co. | | 305,100 | | | 7,929,549 |
aEntercom Communications Corp. | | 62,000 | | | 3,283,520 |
aEntravision Communications Corp. | | 735,000 | | | 8,158,500 |
Four Seasons Hotels Inc. (Canada) | | 88,200 | | | 4,511,430 |
aJack in the Box Inc. | | 72,200 | | | 1,542,192 |
aMediacom Communications Corp., A | | 362,600 | | | 3,143,742 |
aRadio One Inc. | | 39,500 | | | 772,225 |
aRadio One Inc., D | | 236,400 | | | 4,562,520 |
Station Casinos Inc. | | 137,100 | | | 4,199,373 |
| | | | |
|
|
| | | | | | 38,103,051 |
| | | | |
|
|
Distribution Services .2% | | | | | |
aPerformance Food Group Co. | | 70,300 | | | 2,542,751 |
| | | | |
|
|
Electronic Technology 23.5% | | | | | |
a,b3Ware Inc. | | 411 | | | — |
aActel Corp. | | 257,800 | | | 6,212,980 |
aAdvanced Energy Industries Inc. | | 375,000 | | | 9,768,750 |
aAdvanced Fibre Communications Inc. | | 265,000 | | | 5,339,750 |
aAvocent Corp. | | 387,300 | | | 14,144,196 |
BEI Technologies Inc. | | 10,300 | | | 206,000 |
aCoherent Inc. | | 300,000 | | | 7,140,000 |
FSC-7
FRANKLIN TEMPLETON VARIABLE INSURANCE PRODUCTS TRUST
FRANKLIN SMALL CAP FUND
Statement of Investments, December 31, 2003 (cont.)
| | | | | |
| | | SHARES | | VALUE |
|
Common Stocks (cont.) | | | | | |
Electronic Technology (cont.) | | | | | |
aDrexler Technology Corp. | | 218,100 | | $ | 2,981,427 |
aElectro Scientific Industries Inc. | | 587,233 | | | 13,976,146 |
aExtreme Networks Inc. | | 1,159,100 | | | 8,357,111 |
aF5 Networks Inc. | | 342,500 | | | 8,596,750 |
aFLIR Systems Inc. | | 232,900 | | | 8,500,850 |
aIntegrated Circuit Systems Inc. | | 459,500 | | | 13,091,155 |
aIntegrated Device Technology Inc. | | 841,500 | | | 14,448,555 |
Intersil Corp. | | 87,200 | | | 2,166,920 |
aLam Research Corp. | | 700,000 | | | 22,610,000 |
aLattice Semiconductor Corp. | | 287,300 | | | 2,781,064 |
aLogitech International SA, ADR (Switzerland) | | 144,700 | | | 6,154,091 |
aMicrel Inc. | | 934,100 | | | 14,553,278 |
MTS Systems Corp. | | 140,500 | | | 2,701,815 |
National Instruments Corp. | | 250,000 | | | 11,367,500 |
aPericom Semiconductor Corp. | | 228,500 | | | 2,435,810 |
aSemtech Corp. | | 630,000 | | | 14,319,900 |
Tektronix Inc. | | 556,200 | | | 17,575,920 |
aTrimble Navigation Ltd. | | 216,500 | | | 8,062,460 |
aVarian Inc. | | 391,400 | | | 16,333,122 |
aVarian Semiconductor Equipment Associates Inc. | | 499,700 | | | 21,831,893 |
aVitesse Semiconductor Corp. | | 855,600 | | | 5,022,372 |
| | | | |
|
|
| | | | | | 260,679,815 |
| | | | |
|
|
Energy Minerals 3.4% | | | | | |
Chesapeake Energy Corp. | | 331,900 | | | 4,507,202 |
aNewfield Exploration Co. | | 126,100 | | | 5,616,494 |
aPremcor Inc. | | 174,700 | | | 4,542,200 |
aSpinnaker Exploration Co. | | 258,300 | | | 8,335,341 |
aTom Brown Inc. | | 446,200 | | | 14,389,950 |
| | | | |
|
|
| | | | | | 37,391,187 |
| | | | |
|
|
Finance 5.2% | | | | | |
American Capital Strategies Ltd. | | 214,500 | | | 6,377,085 |
Cullen/Frost Bankers Inc. | | 111,800 | | | 4,535,726 |
East West Bancorp Inc. | | 21,800 | | | 1,170,224 |
aeSPEED Inc., A | | 116,600 | | | 2,729,606 |
aFinancial Federal Corp. | | 175,000 | | | 5,346,250 |
aFranklin Bank Corp./Houston Texas | | 20,200 | | | 383,800 |
Greater Bay Bancorp Inc. | | 183,600 | | | 5,228,928 |
aNCO Group Inc. | | 225,200 | | | 5,127,804 |
Radian Group Inc. | | 77,676 | | | 3,786,705 |
aSilicon Valley Bancshares | | 145,100 | | | 5,233,757 |
Texas Regional Bancshares Inc., A | | 20,100 | | | 743,700 |
UCBH Holdings Inc. | | 137,600 | | | 5,362,272 |
Waddell & Reed Financial Inc., A | | 200,000 | | | 4,692,000 |
Westcorp | | 75,000 | | | 2,741,250 |
aWFS Financial Inc. | | 85,100 | | | 3,613,346 |
| | | | |
|
|
| | | | | | 57,072,453 |
| | | | |
|
|
FSC-8
FRANKLIN TEMPLETON VARIABLE INSURANCE PRODUCTS TRUST
FRANKLIN SMALL CAP FUND
Statement of Investments, December 31, 2003 (cont.)
| | | | | |
| | | SHARES | | VALUE |
|
Common Stocks (cont.) | | | | | |
Health Services 3.0% | | | | | |
aCoventry Health Care Inc. | | 123,800 | | $ | 7,983,862 |
aMolina Healthcare Inc. | | 202,300 | | | 5,104,029 |
aPharmaceutical Product Development Inc. | | 166,800 | | | 4,498,596 |
Select Medical Corp. | | 447,000 | | | 7,277,160 |
aSierra Health Services Inc. | | 319,400 | | | 8,767,530 |
| | | | |
|
|
| | | | | | 33,631,177 |
| | | | |
|
|
Health Technology 9.1% | | | | | |
aAdolor Corp. | | 258,200 | | | 5,169,164 |
aAlkermes Inc. | | 100,000 | | | 1,350,000 |
Alpharma Inc., A | | 140,400 | | | 2,822,040 |
aAmerican Medical Systems Holdings Ltd. | | 113,800 | | | 2,480,840 |
aAngiotech Pharmaceuticals Inc. (Canada) | | 112,300 | | | 5,165,800 |
aConceptus Inc. | | 266,300 | | | 2,828,106 |
aCTI Molecular Imaging Inc. | | 161,600 | | | 2,732,656 |
aFirst Horizon Pharmaceutical Corp. | | 500,500 | | | 5,605,600 |
Galen Holdings PLC, ADR (United Kingdom) | | 100,000 | | | 5,199,900 |
aIntegra LifeSciences Holdings Corp. | | 85,900 | | | 2,459,317 |
aInterMune Inc. | | 512,500 | | | 11,869,500 |
aKosan Biosciences Inc. | | 506,000 | | | 4,989,160 |
aNPS Pharmaceuticals Inc. | | 261,700 | | | 8,044,658 |
aOSI Pharmaceuticals Inc. | | 348,200 | | | 11,215,522 |
aSTERIS Corp. | | 339,800 | | | 7,679,480 |
aThoratec Corp. | | 296,100 | | | 3,852,261 |
aUnited Therapeutics Corp. | | 362,000 | | | 8,307,900 |
aVarian Medical Systems Inc. | | 112,000 | | | 7,739,200 |
aVentana Medical Systems Inc. | | 42,700 | | | 1,682,380 |
| | | | |
|
|
| | | | | | 101,193,484 |
| | | | |
|
|
Industrial Services 4.0% | | | | | |
aAllied Waste Industries Inc. | | 250,000 | | | 3,470,000 |
aAtwood Oceanics Inc. | | 59,200 | | | 1,890,848 |
aGrey Wolf Inc. | | 568,800 | | | 2,127,312 |
aOil States International Inc. | | 503,100 | | | 7,013,214 |
aPride International Inc. | | 270,000 | | | 5,032,800 |
aRowan Cos. Inc. | | 225,000 | | | 5,213,250 |
aShaw Group Inc. | | 133,100 | | | 1,812,822 |
aSuperior Energy Services Inc. | | 632,200 | | | 5,942,680 |
aVarco International Inc. | | 345,100 | | | 7,119,413 |
aWaste Connections Inc. | | 131,600 | | | 4,970,532 |
| | | | |
|
|
| | | | | | 44,592,871 |
| | | | |
|
|
Non-Energy Minerals .6% | | | | | |
Olin Corp. | | 143,100 | | | 2,870,586 |
Reliance Steel & Aluminum Co. | | 126,800 | | | 4,211,028 |
| | | | |
|
|
| | | | | | 7,081,614 |
| | | | |
|
|
Process Industries 4.1% | | | | | |
Bunge Ltd. | | 237,300 | | | 7,811,916 |
Cabot Corp. | | 361,500 | | | 11,510,160 |
a FMC Corp. | | 187,100 | | | 6,385,723 |
Minerals Technologies Inc. | | 75,000 | | | 4,443,750 |
FSC-9
FRANKLIN TEMPLETON VARIABLE INSURANCE PRODUCTS TRUST
FRANKLIN SMALL CAP FUND
Statement of Investments, December 31, 2003 (cont.)
| | | | | |
| | | SHARES | | VALUE |
|
Common Stocks (cont.) | | | | | |
Process Industries (cont.) | | | | | |
Nova Chemicals Corp. (Canada) | | 368,900 | | $ | 9,941,855 |
Valspar Corp. | | 100,300 | | | 4,956,826 |
| | | | |
|
|
| | | | | | 45,050,230 |
| | | | |
|
|
Producer Manufacturing 7.0% | | | | | |
a CUNO Inc. | | 12,800 | | | 576,384 |
aFlowserve Corp. | | 325,000 | | | 6,786,000 |
Gentex Corp. | | 246,900 | | | 10,903,104 |
Gibraltar Steel Corp. | | 158,100 | | | 3,976,215 |
Kennametal Inc. | | 162,300 | | | 6,451,425 |
a Mettler-Toledo International Inc. (Switzerland) | | 407,900 | | | 17,217,459 |
Oshkosh Truck Corp. | | 171,900 | | | 8,772,057 |
Superior Industries International Inc. | | 266,000 | | | 11,576,320 |
Toro Co. | | 98,600 | | | 4,575,040 |
a Wilson Greatbatch Technologies Inc. | | 150,000 | | | 6,340,500 |
| | | | |
|
|
| | | | | | 77,174,504 |
| | | | |
|
|
Real Estate Development .5% | | | | | |
a Jones Lang Lasalle Inc. | | 247,000 | | | 5,120,310 |
| | | | |
|
|
Real Estate Investment Trusts 1.0% | | | | | |
Glenborough Realty Trust Inc. | | 49,000 | | | 977,550 |
MeriStar Hospitality Corp. | | 1,064,584 | | | 6,930,442 |
SL Green Realty Corp. | | 80,000 | | | 3,284,000 |
| | | | |
|
|
| | | | | | 11,191,992 |
| | | | |
|
|
Retail Trade 3.9% | | | | | |
a Casual Male Retail Group Inc. | | 324,900 | | | 2,254,806 |
a Charming Shoppes Inc. | | 356,800 | | | 1,926,720 |
a Cost Plus Inc. | | 136,500 | | | 5,596,500 |
Fred’s Inc. | | 242,600 | | | 7,515,748 |
a Gymboree Corp. | | 264,000 | | | 4,548,720 |
a Hot Topic Inc. | | 175,350 | | | 5,165,811 |
a J. Jill Group Inc. | | 250,000 | | | 3,177,500 |
Regis Corp. | | 94,000 | | | 3,714,880 |
a Tuesday Morning Corp. | | 320,700 | | | 9,701,175 |
| | | | |
|
|
| | | | | | 43,601,860 |
| | | | |
|
|
Technology Services 9.7% | | | | | |
a Affiliated Computer Services Inc., A | | 198,200 | | | 10,793,972 |
a Ask Jeeves Inc. | | 234,000 | | | 4,240,080 |
a Aspen Technology Inc. | | 925,000 | | | 9,490,500 |
a BearingPoint Inc. | | 389,400 | | | 3,929,046 |
a Borland Software Corp. | | 545,000 | | | 5,302,850 |
a Entrust Inc. | | 750,000 | | | 3,060,000 |
Fair Isaac Inc. | | 75,255 | | | 3,699,536 |
aFileNET Corp. | | 366,700 | | | 9,930,236 |
Global Payments Inc. | | 128,500 | | | 6,054,920 |
aHyperion Solutions Corp. | | 327,900 | | | 9,882,906 |
aInformatica Corp. | | 500,000 | | | 5,150,000 |
aInfoSpace Inc. | | 109,000 | | | 2,512,450 |
aMicromuse Inc. | | 370,000 | | | 2,553,000 |
aNetIQ Corp. | | 424,400 | | | 5,623,300 |
FSC-10
FRANKLIN TEMPLETON VARIABLE INSURANCE PRODUCTS TRUST
FRANKLIN SMALL CAP FUND
Statement of Investments, December 31, 2003 (cont.)
| | | | | |
| | | SHARES | | VALUE |
|
Common Stocks (cont.) | | | | | |
Technology Services (cont.) | | | | | |
aQuest Software Inc. | | 319,000 | | $ | 4,529,800 |
aRetek Inc. | | 175,000 | | | 1,624,000 |
aRSA Security Inc. | | 362,800 | | | 5,151,760 |
aSapient Corp. | | 254,400 | | | 1,424,640 |
aVerity Inc. | | 630,800 | | | 10,528,052 |
awebMethods Inc. | | 209,390 | | | 1,915,918 |
| | | | |
|
|
| | | | | | 107,396,966 |
| | | | |
|
|
Transportation 3.0% | | | | | |
aABX Air Inc. | | 50 | | | 215 |
C.H. Robinson Worldwide Inc. | | 216,800 | | | 8,218,888 |
Expeditors International of Washington Inc. | | 123,800 | | | 4,662,308 |
aForward Air Corp. | | 191,500 | | | 5,266,250 |
aLandstar System Inc. | | 123,900 | | | 4,713,156 |
aOvernite Corp. | | 116,500 | | | 2,650,375 |
SkyWest Inc. | | 421,100 | | | 7,630,332 |
| | | | |
|
|
| | | | | | 33,141,524 |
| | | | |
|
|
Total Common Stocks (Cost $770,462,341) | | | | | 970,805,645 |
| | | | |
|
|
Preferred Stock (Cost $65,499) | | | | | |
a,b3Ware Inc., pfd., A-1 | | 6,968 | | | 65,499 |
| | | | |
|
|
Total Long Term Investments (Cost $770,527,840) | | | | | 970,871,144 |
| | | | |
|
|
Short Term Investments (Cost $134,463,707) 12.1% | | | | | |
cFranklin Institutional Fiduciary Trust Money Market Portfolio | | 134,463,707 | | | 134,463,707 |
| | | | |
|
|
Total Investments (Cost $904,991,547) 99.8% | | | | | 1,105,334,851 |
Other Assets, less Liabilities .2% | | | | | 2,162,375 |
| | | | |
|
|
Net Assets 100.0% | | | | $ | 1,107,497,226 |
| | | | |
|
|
| b | See Note 7 regarding restricted securities. |
| c | See Note 6 regarding investments in the Franklin Institutional Fiduciary Trust Money Market Portfolio. |
See notes to financial statements.
FSC-11
FRANKLIN TEMPLETON VARIABLE INSURANCE PRODUCTS TRUST
FRANKLIN SMALL CAP FUND
Financial Statements
Statement of Assets and Liabilities
December 31, 2003
| | | | |
Assets: | | | | |
Investments in securities: | | | | |
Cost | | $ | 904,991,547 | |
| | |
|
|
|
Value | | | 1,105,334,851 | |
Receivables: | | | | |
Investment securities sold | | | 3,361,335 | |
Capital shares sold | | | 717,375 | |
Dividends | | | 210,619 | |
| | |
|
|
|
Total assets | | | 1,109,624,180 | |
| | |
|
|
|
Liabilities: | | | | |
Payables: | | | | |
Investment securities purchased | | | 379,051 | |
Capital shares redeemed | | | 705,080 | |
Affiliates | | | 993,065 | |
Other liabilities | | | 49,758 | |
| | |
|
|
|
Total liabilities | | | 2,126,954 | |
| | |
|
|
|
Net assets, at value | | $ | 1,107,497,226 | |
| | |
|
|
|
Net assets consist of: | | | | |
Undistributed net investment income | | $ | — | |
Net unrealized appreciation (depreciation) | | | 200,343,304 | |
Accumulated net realized gain (loss) | | | (145,664,955 | ) |
Capital shares | | | 1,052,818,877 | |
| | |
|
|
|
Net assets, at value | | $ | 1,107,497,226 | |
| | |
|
|
|
Class 1: | | | | |
Net assets, at value | | $ | 197,551,265 | |
| | |
|
|
|
Shares outstanding | | | 11,226,781 | |
| | |
|
|
|
Net asset value and offering price per share | | $ | 17.60 | |
| | |
|
|
|
Class 2: | | | | |
Net assets, at value | | $ | 909,945,961 | |
| | |
|
|
|
Shares outstanding | | | 52,212,329 | |
| | |
|
|
|
Net asset value and offering price per share | | $ | 17.43 | |
| | |
|
|
|
See notes to financial statements.
FSC-12
FRANKLIN TEMPLETON VARIABLE INSURANCE PRODUCTS TRUST
FRANKLIN SMALL CAP FUND
Financial Statements (continued)
Statement of Operations
for the year ended December 31, 2003
| | | | |
Investment income: | | | | |
(net of foreign taxes of $18,551) | | | | |
Dividends | | $ | 4,018,303 | |
| | |
|
|
|
Expenses: | | | | |
Management fees (Note 3) | | | 3,667,101 | |
Administrative fees (Note 3) | | | 1,940,190 | |
Distribution fees - Class 2 (Note 3) | | | 1,514,388 | |
Transfer agent fees | | | 5,009 | |
Other | | | 306,347 | |
| | |
|
|
|
Total expenses | | | 7,433,035 | |
| | |
|
|
|
Net investment loss | | | (3,414,732 | ) |
| | |
|
|
|
Realized and unrealized gains (losses): | | | | |
Net realized gain (loss) from: | | | | |
Investments | | | (18,540,916 | ) |
Foreign currency transactions | | | (1,123 | ) |
| | |
|
|
|
Net realized gain (loss) | | | (18,542,039 | ) |
Net unrealized appreciation (depreciation) on investments | | | 280,516,980 | |
| | |
|
|
|
Net realized and unrealized gain (loss) | | | 261,974,941 | |
| | |
|
|
|
Net increase (decrease) in net assets resulting from operations | | $ | 258,560,209 | |
| | |
|
|
|
See notes to financial statements.
FSC-13
FRANKLIN TEMPLETON VARIABLE INSURANCE PRODUCTS TRUST
FRANKLIN SMALL CAP FUND
Financial Statements (continued)
Statements of Changes in Net Assets
For the years ended December 31, 2003 and 2002
| | | | | | | | |
| | | 2003 | | | 2002 | |
| | |
| |
Increase (decrease) in net assets: | | | | | | | | |
Operations: | | | | | | | | |
Net investment loss | | $ | (3,414,732 | ) | | $ | (1,931,994 | ) |
Net realized gain (loss) from investments and foreign currency transactions | | | (18,542,039 | ) | | | (80,346,044 | ) |
Net unrealized appreciation (depreciation) on investments | | | 280,516,980 | | | | (129,271,878 | ) |
| | |
| |
Net increase (decrease) in net assets resulting from operations | | | 258,560,209 | | | | (211,549,916 | ) |
Distributions to shareholders from: | | | | | | | | |
Net investment income: | | | | | | | | |
Class 1 | | | — | | | | (968,151 | ) |
Class 2 | | | — | | | | (994,005 | ) |
| | |
| |
Total distributions to shareholders | | | — | | | | (1,962,156 | ) |
Capital share transactions: (Note 2) | | | | | | | | |
Class 1 | | | (22,075,723 | ) | | | (25,542,310 | ) |
Class 2 | | | 290,711,064 | | | | 150,999,228 | |
| | |
| |
Total capital share transactions | | | 268,635,341 | | | | 125,456,918 | |
Net increase (decrease) in net assets | | | 527,195,550 | | | | (88,055,154 | ) |
Net assets: | | | | | | | | |
Beginning of year | | | 580,301,676 | | | | 668,356,830 | |
| | |
| |
End of year | | $ | 1,107,497,226 | | | $ | 580,301,676 | |
| | |
| |
Undistributed net investment income included in net assets: | | | | | | | | |
End of year | | $ | — | | | $ | — | |
| | |
| |
See notes to financial statements.
FSC-14
FRANKLIN TEMPLETON VARIABLE INSURANCE PRODUCTS TRUST
FRANKLIN SMALL CAP FUND
Notes to Financial Statements
1. ORGANIZATION AND SIGNIFICANT ACCOUNTING POLICIES
Franklin Templeton Variable Insurance Products Trust (the Trust) is registered under the Investment Company Act of 1940 as an open-end investment company, consisting of twenty-two separate series (the Funds). Franklin Small Cap Fund (the Fund) included in this report is diversified. Shares of the Fund are sold only to insurance company separate accounts to fund the benefits of variable life insurance policies or variable annuity contracts. The Fund’s investment objective is capital growth.
On November 18, 2003, the Board of Trustees for the Franklin Templeton Variable Insurance Products Trust approved a proposal to merge Franklin Aggressive Growth Securities Fund into the Franklin Small Cap Fund, subject to approval by the shareholders of the Franklin Aggressive Growth Securities Fund.
The following summarizes the Fund’s significant accounting policies.
a. Security Valuation
Securities listed or traded on a recognized national exchange or NASDAQ are valued at the last reported sales price. Over-the-counter securities and listed securities for which no sale is reported are valued within the range of the latest quoted bid and asked prices. Foreign securities are valued at the close of trading of the foreign exchange or the NYSE, whichever is earlier. If events occur that materially affect the values of securities after the prices of foreign exchange rates are determined, or if market quotations are not readily available, the securities will be valued at fair value as determined following procedures approved by the Board of Trustees.
b. Foreign Currency Translation
Portfolio securities and other assets and liabilities denominated in foreign currencies are translated into U.S. dollars based on the exchange rate of such currencies against U.S. dollars on the date of valuation. Purchases and sales of securities and income items denominated in foreign currencies are translated into U.S. dollars at the exchange rate in effect on the transaction date.
The Fund does not separately report the effect of changes in foreign exchange rates from changes in market prices on securities held. Such changes are included in net realized and unrealized gain or loss from investments.
Realized foreign exchange gains or losses arise from sales of foreign currencies, currency gains or losses realized between the trade and settlement dates on securities transactions and the difference between the recorded amounts of dividends, interest, and foreign withholding taxes and the U.S. dollar equivalent of the amounts actually received or paid. Net unrealized foreign exchange gains and losses arise from changes in foreign exchange rates on foreign denominated assets and liabilities other than investments in securities held at the end of the reporting period.
c. Foreign Currency Contracts
When the Fund purchases or sells foreign securities it may enter into foreign exchange contracts to minimize foreign exchange risk from the trade date to the settlement date of the transactions. A foreign exchange contract is an agreement between two parties to exchange different currencies at an agreed upon exchange rate on a specified date. Realized and unrealized gains and losses are included in the Statement of Operations.
The risks of these contracts include movement in the values of the foreign currencies relative to the U.S. dollar and the possible inability of the counterparties to fulfill their obligations under the contracts.
d. Income Taxes
No provision has been made for income taxes because the Fund’s policy is to qualify as a regulated investment company under the Internal Revenue Code and to distribute substantially all of its taxable income.
FSC-15
FRANKLIN TEMPLETON VARIABLE INSURANCE PRODUCTS TRUST
FRANKLIN SMALL CAP FUND
Notes to Financial Statements (continued)
1. ORGANIZATION AND SIGNIFICANT ACCOUNTING POLICIES (cont.)
e. Security Transactions, Investment Income, Expenses and Distributions
Security transactions are accounted for on trade date. Realized gains and losses on security transactions are determined on a specific identification basis. Estimated expenses are accrued daily. Dividend income and distributions to shareholders are recorded on the ex-dividend date.
Distributions received by the Fund from securities may be a return of capital (ROC). Such distributions reduce the cost basis of the securities, and any distributions in excess of the cost basis are recognized as capital gains.
Common expenses incurred by the Trust are allocated among the Funds based on the ratio of net assets of each Fund to the combined net assets. Other expenses are charged to each Fund on a specific identification basis.
Realized and unrealized gains and losses and net investment income, other than class specific expenses, are allocated daily to each class of shares based upon the relative proportion of net assets of each class.
f. Accounting Estimates
The preparation of financial statements in accordance with accounting principles generally accepted in the United States of America requires management to make estimates and assumptions that affect the reported amounts of assets and liabilities at the date of the financial statements and the amounts of income and expenses during the reporting period. Actual results could differ from those estimates.
g. Guarantees and Indemnifications
Under the Trust’s organizational documents, its officers and trustees are indemnified against certain liability arising out of the performance of their duties to the Trust. Additionally, in the normal course of business, the Trust enters into contracts with service providers that contain general indemnification clauses. The Trust’s maximum exposure under these arrangements is unknown as this would involve future claims that may be made against the Trust that have not yet occurred. However, based on experience, the Trust expects the risk of loss to be remote.
FSC-16
FRANKLIN TEMPLETON VARIABLE INSURANCE PRODUCTS TRUST
FRANKLIN SMALL CAP FUND
Notes to Financial Statements (continued)
2. SHARES OF BENEFICIAL INTEREST
The Fund offers two classes of shares: Class 1 and 2. Each class of shares differs by its distribution fees, voting rights on matters affecting a single class and its exchange privilege.
At December 31, 2003, there were an unlimited number of shares authorized ($.01 par value). Transactions in the Fund’s shares were as follows:
| | | | | | | | | | | | | | |
| | | Year Ended December 31,
| |
| | | 2003 | | | 2002 | |
| | |
| | |
| |
| Class 1 Shares: | | Shares | | | Amount | | | Shares | | | Amount | |
| | |
| |
Shares sold | | 763,219 | | | $ | 11,952,567 | | | 1,153,418 | | | $ | 18,182,473 | |
Shares issued on merger (Note 8)a | | 131,849 | | | | 1,739,071 | | | 1,202,758 | | | | 20,098,091 | |
Shares issued in reinvestment of distributions | | — | | | | — | | | 63,569 | | | | 968,152 | |
Shares redeemed | | (2,513,508 | ) | | | (35,767,361 | ) | | (4,419,152 | ) | | | (64,791,026 | ) |
| | |
| |
Net increase (decrease) | | (1,618,440 | ) | | $ | (22,075,723 | ) | | (1,999,407 | ) | | $ | (25,542,310 | ) |
| | |
| |
| Class 2 Shares: | | | | | | | | | | | | |
Shares sold | | 24,892,963 | | | $ | 372,062,375 | | | 23,004,447 | | | $ | 326,745,200 | |
Shares issued on merger (Note 8)a | | 986,724 | | | | 12,916,332 | | | 36,720 | | | | 609,184 | |
Shares issued in reinvestment of distributions | | — | | | | — | | | 65,654 | | | | 994,005 | |
Shares redeemed | | (6,409,960 | ) | | | (94,267,643 | ) | | (12,868,867 | ) | | | (177,349,161 | ) |
| | |
| |
Net increase (decrease) | | 19,469,727 | | | $ | 290,711,064 | | | 10,237,954 | | | $ | 150,999,228 | |
| | |
| |
| a | On May 1, 2002, the Fund acquired the net assets of Franklin Global Health Care Securities Fund in a taxable exchange pursuant to a plan of reorganization approved by the Franklin Global Health Care Securities Fund Shareholders. |
3. TRANSACTIONS WITH AFFILIATES
Certain officers and trustees of the Fund are also officers and/or directors of the following entities:
| | |
| Entity | | Affiliation |
|
Franklin Templeton Services LLC (FT Services) | | Administrative manager |
Franklin Advisers Inc. (Advisers) | | Investment manager |
Franklin/Templeton Distributors Inc. (Distributors) | | Principal underwriter |
Franklin/Templeton Investor Services LLC (Investor Services) | | Transfer agent |
The Fund pays an investment management fee to Advisers based on the average daily net assets of the Fund as follows:
| | |
| Annualized Fee Rate | | Net Assets |
|
| .55% | | First $500 million |
| .45% | | Over $500 million, up to and including $1 billion |
| .40% | | Over $1 billion, up to and including $1.5 billion |
Fees are further reduced on net assets over $1.5 billion.
The Fund pays an administration fee to FT Services of .25% per year of the average daily net assets of the Fund.
The Fund reimburses Distributors up to .25% per year of its average daily net assets of Class 2 for costs incurred in marketing the Fund’s shares.
Investor Services, under terms of an agreement, performs shareholder servicing for the Fund and is not paid by the Fund for the services.
FSC-17
FRANKLIN TEMPLETON VARIABLE INSURANCE PRODUCTS TRUST
FRANKLIN SMALL CAP FUND
Notes to Financial Statements (continued)
4. INCOME TAXES
At December 31, 2003, the Fund had tax basis capital losses of $145,649,486 which may be carried over to offset future capital gains. Such losses expire as follows:
| | | |
Capital loss carryovers expiring in: | | | |
2008 | | $ | 11,665,898 |
2009 | | | 23,790,865 |
2010 | | | 89,635,453 |
2011 | | | 20,557,270 |
| | |
|
|
| | | $ | 145,649,486 |
| | |
|
|
The tax character of distributions paid during the years ended December 31, 2003 and 2002, was as follows:
| | | | | | |
| | | 2003
| | 2002
|
Distributions paid from: | | | | | | |
Ordinary income | | $ | — | | $ | 1,962,156 |
Long term capital gain | | | — | | | — |
| | |
|
|
| | | $ | — | | $ | 1,962,156 |
| | |
|
|
At December 31, 2003, the cost of investments, net unrealized appreciation (depreciation), undistributed ordinary income and undistributed long term capital gains for income tax purposes were as follows:
| | | | |
Cost of investments | | $ | 905,007,016 | |
| | |
|
|
|
Unrealized appreciation | | $ | 223,653,083 | |
Unrealized depreciation | | | (23,325,248 | ) |
| | |
|
|
|
Net unrealized appreciation (depreciation) | | $ | 200,327,835 | |
| | |
|
|
|
Undistributed ordinary income | | $ | — | |
Undistributed long term capital gains | | | — | |
| | |
|
|
|
Distributable earnings | | $ | — | |
| | |
|
|
|
Net investment income differs for financial statement and tax purposes primarily due to differing treatments for foreign currency transactions.
Net realized gains (losses) differ for financial statement and tax purposes primarily due to differing treatments of wash sales and foreign currency transactions.
5. INVESTMENT TRANSACTIONS
Purchases and sales of securities (excluding short-term securities) for the year ended December 31, 2003 aggregated $497,133,238 and $307,908,969, respectively.
FSC-18
FRANKLIN TEMPLETON VARIABLE INSURANCE PRODUCTS TRUST
FRANKLIN SMALL CAP FUND
Notes to Financial Statements (continued)
6. INVESTMENT IN FRANKLIN INSTITUTIONAL FIDUCIARY TRUST MONEY MARKET PORTFOLIO
The Fund may invest in the Franklin Institutional Fiduciary Trust Money Market Portfolio (the Sweep Money Fund), an open-end investment company managed by Advisers. Management fees paid by the Fund are reduced on assets invested in the Sweep Money Fund, in an amount not to exceed the management fees paid by the Sweep Money Fund. The Fund earned $804,731 of dividend income from investment in the Sweep Money Fund for the year ended December 31, 2003.
7. RESTRICTED SECURITIES
At December 31, 2003, investments in securities included issues that are restricted or illiquid. Restricted securities are often purchased in private placement transactions, are not registered under the Securities Act of 1933, may have contractual restrictions on resale, and are valued under methods approved by the Board of Trustees as reflecting fair value. A security may also be considered illiquid if it lacks a readily available market or if its valuation has not changed for a certain period of time. At December 31, 2003, the Fund held investments in restricted and illiquid securities that were valued under approved methods by the Trustees, as follows:
| | | | | | | | | | |
| Shares | | Issuer | | Acquisition
Date | | Cost | | Value |
|
| 411 | | 3Ware Inc. | | 7/28/00 | | $ | 229,176 | | $ | — |
| 6,968 | | 3Ware Inc., pfd., A-1 | | 12/17/02 | | | 65,499 | | | 65,499 |
| 170,000 | | Nu Skin Enterprises Inc., A, P.I.P.E.S | | 10/23/03 | | | 2,201,500 | | | 2,730,982 |
| | | | | | | | | |
|
|
| | | Total Restricted Securities (0.25% of net assets) | | | | | | | $ | 2,796,481 |
| | | | | | | | | |
|
|
8. MERGER OF FRANKLIN TECHNOLOGY SECURITIES FUND
On May 1, 2003, the Franklin Templeton Variable Insurance Products Trust (FTVIPT) — Franklin Small Cap Fund (Small Cap) acquired the net assets of the FTVIPT — Franklin Technology Securities Fund (Technology) pursuant to a plan of reorganization. The merger was accomplished by a taxable exchange, and accounted for as a purchase.
The selected financial information and shares outstanding immediately before and after the acquisition were as follows:
| | | | | | | | | | | | | | | | |
| | | Class 1
| | Class 2
|
| Fund Name | | Net Assets | | NAV | | Shares | | Net Assets | | NAV | | Shares |
|
Technology | | $ | 1,739,071 | | $ | 3.30 | | 527,220 | | $ | 12,916,332 | | $ | 3.28 | | 3,942,678 |
Small Cap | | $ | 158,617,460 | | $ | 13.19 | | 12,023,169 | | $ | 483,814,924 | | $ | 13.09 | | 36,965,893 |
| | | | | | |
Small Cap — post merger | | $ | 160,356,531 | | $ | 13.19 | | 12,155,018 | | $ | 496,731,256 | | $ | 13.09 | | 37,952,617 |
9. REGULATORY MATTERS
On February 4, 2004, the Securities Division of the Office of the Secretary of the Commonwealth of Massachusetts filed an administrative complaint against Franklin Resources, Inc. and certain of its subsidiaries (the “Company”), alleging violations of the Massachusetts Uniform Securities Act. The complaint arises from activity that occurred in 2001 during which time an officer of a Company subsidiary was negotiating an agreement with an investor relating to investments in a mutual fund and a hedge fund.
The Company, in addition to other entities within Franklin Templeton Investments, has been named in shareholder class actions related to the matter described above. The Company believes that the claims made in the lawsuit are without merit and it intends to defend vigorously against the allegations. The Company and the Fund may be named in similar civil actions related to the matter described above.
FSC-19
FRANKLIN TEMPLETON VARIABLE INSURANCE PRODUCTS TRUST
FRANKLIN SMALL CAP FUND
Notes to Financial Statements (continued)
9. REGULATORY MATTERS (cont.)
In addition, as part of ongoing investigations by the U.S. Securities and Exchange Commission (the “SEC”), the U.S. Attorney for the Northern District of California, the New York Attorney General, the California Attorney General, the U.S. Attorney for the District of Massachusetts, the Florida Department of Financial Services, and the Commissioner of Securities and the Attorney General of the State of West Virginia, relating to certain practices in the mutual fund industry, including late trading, market timing and sales compensation arrangements, the Company and its subsidiaries, as well as certain current or former executives and employees of the Company, have received requests for information and/or subpoenas to testify or produce documents. The Company and its current employees are providing documents and information in response to these requests and subpoenas. In addition, the Company has responded to requests for similar kinds of information from regulatory authorities in some of the foreign countries where the Company conducts its global asset management business.
The Staff of the SEC has informed the Company that it intends to recommend that the Commission authorize an action against the Fund’s investment adviser and a senior executive officer relating to the frequent trading issues that are the subject of the SEC’s investigation. These issues were previously disclosed as being under investigation by government authorities and the subject of an internal inquiry by the Company in its Annual Report on Form 10-K and on its public website. The Company currently is in discussions with the SEC Staff in an effort to resolve the issues raised in their investigation. Such discussions are preliminary and the Fund’s management has been advised that the Company cannot predict the likelihood of whether those discussions will result in a settlement and, if so, the terms of such settlement. The impact, if any, of these matters on the Fund is uncertain at this time. If the Company finds that it bears responsibility for any unlawful or improper conduct, it has committed to making the Fund or its shareholders whole, as appropriate.
FSC-20
FRANKLIN TEMPLETON VARIABLE INSURANCE PRODUCTS TRUST
FRANKLIN SMALL CAP FUND
Independent Auditors’ Report
To the Board of Trustees and Shareholders of Franklin Templeton Variable Insurance Products Trust
In our opinion, the accompanying statement of assets and liabilities, including the statement of investments, and the related statements of operations and of changes in net assets and the financial highlights present fairly, in all material respects, the financial position of the Franklin Small Cap Fund (the Fund) (one of the funds constituting the Franklin Templeton Variable Insurance Products Trust) at December 31, 2003, the results of its operations for the year then ended, the changes in its net assets for each of the two years in the period then ended and the financial highlights for each of the periods presented, in conformity with accounting principles generally accepted in the United States of America. These financial statements and financial highlights (hereafter referred to as “financial statements”) are the responsibility of the Fund’s management; our responsibility is to express an opinion on these financial statements based on our audits. We conducted our audits of these financial statements in accordance with auditing standards generally accepted in the United States of America, which require that we plan and perform the audits to obtain reasonable assurance about whether the financial statements are free of material misstatement. An audit includes examining, on a test basis, evidence supporting the amounts and disclosures in the financial statements, assessing the accounting principles used and significant estimates made by management, and evaluating the overall financial statement presentation. We believe that our audits, which included confirmation of securities at December 31, 2003 by correspondence with the custodian and brokers, provide a reasonable basis for our opinion.
PricewaterhouseCoopers LLP
San Francisco, California
February 5, 2004, except for Note 9 as to which the date is February 12, 2004
FSC-21
FRANKLIN SMALL CAP VALUE SECURITIES FUND
Fund Goal and Primary Investments: Franklin Small Cap Value Securities Fund seeks long-term total return. The Fund invests primarily in equity securities of U.S. small capitalization companies that the Fund’s manager believes are undervalued.
This annual report for Franklin Small Cap Value Securities Fund covers the fiscal year ended December 31, 2003.
Performance Overview
You can find the Fund’s one-year total return in the Performance Summary following this report. The Fund underperformed the Russell 2000® Value Index, which returned 46.03% for the year under review.1 Please note that the Fund employs a bottom-up stock selection process, and the managers invest in securities without regard to benchmark comparisons.
Economic and Market Overview
During the year ended December 31, 2003, many factors impacted global economies and financial markets. Early in the year, economic uncertainty and geopolitical events, including impending war in Iraq, pushed U.S. interest rates to their lowest level in more than four decades, and the 10-year U.S. Treasury note’s yield fell to 3.13% in mid-June. However, following the end of major conflict in Iraq, many economic indicators turned positive. The U.S. government injected fiscal stimulus into the economy, approving another round of tax cuts and rebates that included dividend and capital gains tax reductions. In June, an accommodative Federal Reserve Board, in an attempt to bolster the economy, cut the federal funds target rate to 1.00%.
During the year, the U.S. trade deficit increased significantly, contributing to the U.S. dollar’s fall to record lows against the euro and other major currencies. However, the weak dollar provided a boost to the U.S. economy and corporate profits as exports became cheaper for foreign buyers. Robust consumer spending, especially for autos and homes, and strong business spending, particularly for equipment and software, contributed to the accelerated economic activity. In addition, U.S. federal spending stayed firm and inflation remained benign. U.S. gross domestic product (GDP) grew an annualized 8.2% in third quarter 2003, its strongest pace in nearly 20 years, and overall, 2003 GDP grew an estimated 3.1%. As economic data improved, some interest
1. Source: Standard & Poor’s Micropal. One cannot invest directly in an index, nor is an index representative of the Fund’s portfolio. Please see Index Descriptions following the Fund Summaries.
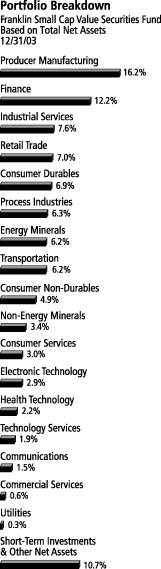
FSV-1
rates rose from their lows, and the 10-year Treasury note’s yield ended the period at 4.27%.
An equity market rally started in late March 2003 and continued through the end of the year. The rebound began with investors anticipating economic recovery in the second half of 2003, and it continued as data showed robust economic growth. Improved sentiment led many investors to rotate into economically sensitive and financially leveraged companies, specifically cyclical, technology, small-capitalization and emerging market stocks. The Standard & Poor’s 500 Composite Index (S&P 500) rose 28.67% for the 12 months ended December 31, 2003, while the technology-heavy Nasdaq Composite Index increased 50.93%.1
Investment Strategy
We are a research driven, fundamental investment adviser, pursuing a disciplined, value-oriented strategy for the Fund. As a bottom-up adviser concentrating primarily on individual securities, we focus on the market price of a company’s securities relative to our evaluation of the company’s potential long-term earnings, asset value or cash flow. We seek bargains among the “under-researched and unloved,” out-of-favor companies that offer, in our opinion, attractive long-term potential that might include current growth companies that are being ignored by the market, former growth companies that have stumbled recently, dropping sharply in price but that still have growth potential, or companies that are potential turnaround or takeover targets.
Manager’s Discussion
During the year under review, stocks that aided Fund performance came from a variety of sectors. OMI Corp. gained 117% during the Fund’s fiscal year, largely due to three-year-high oil tanker rates resulting from a shortage of vessels for shipping oil, contributing to the Fund’s transportation holdings’ overall positive results. Another solid performer was United States Steel, which produces, sells and transports steel mill products. The company’s stock appreciated 170% during the year and contributed to the Fund’s non-energy minerals sector’s overall positive performance. Energy minerals, one of the Fund’s top-performing sectors, was led by Nuevo Energy’s nearly 118% return for the period. Nuevo explores, acquires and develops crude oil and natural gas properties.
Despite the Fund’s double-digit total return, several Fund holdings declined in value during the year under review. Midwest Express (now
Top 10 Holdings
Franklin Small Cap Value
Securities Fund
12/31/03
| | |
Company
Sector/Industry | | % of Total
Net Assets |
|
| |
| OMI Corp. | | 1.9% |
| Transportation | | |
| |
| Peabody Energy Corp. | | 1.9% |
| Energy Minerals | | |
| |
| Reliance Steel & Aluminum Co. | | 1.8% |
| Non-Energy Minerals | | |
| |
| York International Corp. | | 1.8% |
| Producer Manufacturing | | |
| |
| Teekay Shipping Corp. (Bahamas) | | 1.8% |
| Transportation | | |
| |
| Roper Industries Inc. | | 1.7% |
| Producer Manufacturing | | |
| |
| Arthur J. Gallagher & Co. | | 1.7% |
| Finance | | |
| |
| Dillards Inc., A | | 1.6% |
| Retail Trade | | |
| |
| Consol Energy Inc. | | 1.6% |
| Energy Minerals | | |
| |
| Arch Coal Inc. | | 1.6% |
| Energy Minerals | | |
The dollar value, number of shares or principal amount, and complete legal titles of all portfolio holdings are listed in the Fund’s Statement of Investments.
FSV-2
Midwest Air Group) and Atlantic Coast Airlines Holdings each were impacted by reduced travel, due largely to war in Iraq, continued terrorist threats, and higher fuel prices. Atlantic Coast announced in October 2003 that Mesa Airlines had bid for the company, and we sold our position as open-market prices exceeded the proposed takeover price. We also sold our holdings in Midwest Express in July 2003 because of deteriorating fundamentals. In the industrial services sector, several companies recorded unfavorable results during the period, which hindered Fund performance.
The Fund experienced net inflows during its fiscal year, and we used the proceeds to invest in 17 new positions that fit our investment criteria. Allstream, a recent addition to the Fund, is a Canadian provider of communication services. At period-end, Allstream traded at 14.1 times 2004 estimated earnings and 2.1 times book value, had negligible long-term debt and a substantial tax-loss carryforward. We also initiated a position in Montpelier Re Holdings, a Bermuda-based reinsurer for the global insurance market. Consistent with our strategy, we thought Montpelier was attractively valued at period-end at 1.5 times book value and 8.9 times 2004 earnings estimates. Late in the reporting period, we added La Quinta, an owner and operator of franchise hotels, which traded at less than book value at period-end.
During the Fund’s fiscal year, 14 positions were eliminated from the portfolio, including three takeovers. We sold two takeovers after the acquiring companies announced bids because of higher market prices than the proposed takeover prices. We continued to hold a third takeover target, Airborne (now ABX Air), because the deal included Air Freight stock in addition to cash. The remaining Fund liquidations included stocks that had reached our price targets or where the companies’ fundamentals had deteriorated.
Thank you for your participation in Franklin Small Cap Value Securities Fund. We look forward to serving your future investment needs.
This discussion reflects our analysis, opinions and portfolio holdings as of December 31, 2003, the end of the reporting period. The way we implement our main investment strategies and the resulting portfolio holdings may change depending on factors such as market and economic conditions. These opinions may not be relied upon as investment advice or an offer for a particular security. The information is not a complete analysis of every aspect of any market, country, industry, security or the Fund. Statements of fact are from sources considered reliable, but the advisor makes no representation or warranty as to their completeness or accuracy. Although historical performance is no guarantee of future results, these insights may help you understand our investment management philosophy.
FSV-3
PERFORMANCE SUMMARYASOF 12/31/03
Total return of Class 2 shares represents the average annual change in value, assuming reinvestment of dividends and capital gains. Average returns smooth out variations in returns, which can be significant; they are not the same as year-by-year results.
Franklin Small Cap Value Securities Fund – Class 2*
Periods ended 12/31/03
| | | | | | |
| | | 1-Year | | 5-Year | | Since
Inception
(5/1/98) |
|
| | | |
Average Annual Total Return | | +32.12% | | +11.58% | | +5.39% |
*Because Class 2 shares were not offered until 1/6/99, standardized Class 2 Fund performance for prior periods represents the historical results of Class 1 shares. For periods beginning on 1/6/99, Class 2’s results reflect an additional 12b-1 fee expense, which also affects future performance. Since 1/6/99 (effective date), the average annual total return of Class 2 shares was +11.11%.
Ongoing market volatility can significantly affect short-term performance; recent returns may differ.
Total Return Index Comparison
for Hypothetical $10,000 Investment (5/1/98–12/31/03)
The graph compares the performance of Franklin Small Cap Value Securities Fund – Class 2* and the Russell 2000 Value Index. One cannot invest directly in an index, nor is an index representative of the Fund’s portfolio. Please see Important Notes to Performance Information preceding the Fund Summaries.
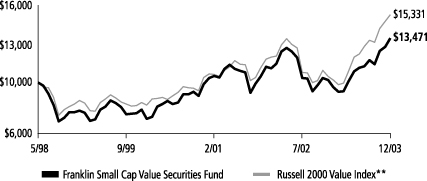
**Source: Standard & Poor’s Micropal. Please see Index Descriptions following the Fund Summaries.
Franklin Small Cap Value Securities Fund – Class 2
Performance reflects the Fund’s Class 2 operating expenses, but does not include any contract fees, expenses or sales charges. If they had been included, performance would be lower. These charges and deductions, particularly for variable life policies, can have a significant effect on contract values and insurance benefits. See the contract prospectus for a complete description of these expenses, including sales charges.
Since markets can go down as well as up, investment return and the value of your principal will fluctuate with market conditions, and you may have a gain or loss when you sell your shares.
Past performance does not guarantee future results.
FSV-4
FRANKLIN TEMPLETON VARIABLE INSURANCE PRODUCTS TRUST
FRANKLIN SMALL CAP VALUE SECURITIES FUND
Financial Highlights
| | | | | | | | | | | | | | | | | | | | |
| | | Class 1
| |
| | | Year Ended December 31,
| |
| | | 2003 | | | 2002 | | | 2001 | | | 2000 | | | 1999 | |
| | |
|
|
|
Per share operating performance | | | | | | | | | | | | | | | | | | | | |
(for a share outstanding throughout the year) | | | | | | | | | | | | | | | | | | | | |
| | | | | |
Net asset value, beginning of year | | $ | 9.70 | | | $ | 10.97 | | | $ | 9.86 | | | $ | 7.90 | | | $ | 7.79 | |
| | |
|
|
|
Income from investment operations: | | | | | | | | | | | | | | | | | | | | |
Net investment incomea | | | .06 | | | | .07 | | | | .11 | | | | .10 | | | | .05 | |
Net realized and unrealized gains (losses) | | | 3.08 | | | | (1.01 | ) | | | 1.29 | | | | 1.89 | | | | .08 | |
| | |
|
|
|
Total from investment operations | | | 3.14 | | | | (.94 | ) | | | 1.40 | | | | 1.99 | | | | .13 | |
| | |
|
|
|
Less distributions from: | | | | | | | | | | | | | | | | | | | | |
Net investment income | | | (.03 | ) | | | (.05 | ) | | | (.05 | ) | | | (.03 | ) | | | (.02 | ) |
Net realized gains | | | — | | | | (.28 | ) | | | (.24 | ) | | | — | | | | — | |
| | |
|
|
|
Total distributions | | | (.03 | ) | | | (.33 | ) | | | (.29 | ) | | | (.03 | ) | | | (.02 | ) |
| | |
|
|
|
Net asset value, end of year | | $ | 12.81 | | | $ | 9.70 | | | $ | 10.97 | | | $ | 9.86 | | | $ | 7.90 | |
| | |
|
|
|
| | | | | |
Total returnb | | | 32.47% | | | | (9.05)% | | | | 14.21% | | | | 25.23% | | | | 1.65% | |
| | | | | |
Ratios/supplemental data | | | | | | | | | | | | | | | | | | | | |
Net assets, end of year (000’s) | | $ | 37,108 | | | $ | 28,720 | | | $ | 32,604 | | | $ | 19,455 | | | $ | 11,320 | |
Ratios to average net assets: | | | | | | | | | | | | | | | | | | | | |
Expenses | | | .74% | | | | .76% | | | | .77% | | | | .84% | | | | .81% | |
Net investment income | | | .63% | | | | .63% | | | | 1.07% | | | | 1.13% | | | | .65% | |
Portfolio turnover rate | | | 12.52% | | | | 5.11% | | | | 40.54% | | | | 42.47% | | | | 61.23% | |
| a | Based on average daily shares outstanding. |
| b | Total return does not include any fees, charges or expenses imposed by the variable annuity and life insurance contracts for which the Franklin Templeton Variable Insurance Products Trust serves as an underlying investment vehicle. Total return is not annualized for periods less than one year. |
FSV-5
FRANKLIN TEMPLETON VARIABLE INSURANCE PRODUCTS TRUST
FRANKLIN SMALL CAP VALUE SECURITIES FUND
Financial Highlights (continued)
| | | | | | | | | | | | | | | | | | | | |
| | | Class 2
| |
| | | Year Ended December 31,
| |
| | | 2003 | | | 2002 | | | 2001 | | | 2000 | | | 1999c | |
| | |
|
|
|
Per share operating performance | | | | | | | | | | | | | | | | | | | | |
(for a share outstanding throughout the year) | | | | | | | | | | | | | | | | | | | | |
| | | | | |
Net asset value, beginning of year | | $ | 9.61 | | | $ | 10.89 | | | $ | 9.81 | | | $ | 7.88 | | | $ | 7.97 | |
| | |
|
|
|
Income from investment operations: | | | | | | | | | | | | | | | | | | | | |
Net investment incomea | | | .04 | | | | .04 | | | | .08 | | | | .08 | | | | .05 | |
Net realized and unrealized gains (losses) | | | 3.04 | | | | (1.00 | ) | | | 1.28 | | | | 1.88 | | | | (.12 | ) |
| | |
|
|
|
Total from investment operations | | | 3.08 | | | | (.96 | ) | | | 1.36 | | | | 1.96 | | | | (.07 | ) |
| | |
|
|
|
Less distributions from: | | | | | | | | | | | | | | | | | | | | |
Net investment income | | | (.02 | ) | | | (.04 | ) | | | (.04 | ) | | | (.03 | ) | | | (.02 | ) |
Net realized gains | | | — | | | | (.28 | ) | | | (.24 | ) | | | — | | | | — | |
| | |
|
|
|
Total distributions | | | (.02 | ) | | | (.32 | ) | | | (.28 | ) | | | (.03 | ) | | | (.02 | ) |
| | |
|
|
|
Net asset value, end of year | | $ | 12.67 | | | $ | 9.61 | | | $ | 10.89 | | | $ | 9.81 | | | $ | 7.88 | |
| | |
|
|
|
| | | | | |
Total returnb | | | 32.12% | | | | (9.26)% | | | | 13.79% | | | | 25.02% | | | | (.90)% | |
| | | | | |
Ratios/supplemental data | | | | | | | | | | | | | | | | | | | | |
Net assets, end of year (000’s) | | $ | 333,625 | | | $ | 125,302 | | | $ | 34,282 | | | $ | 7,209 | | | $ | 1,263 | |
Ratios to average net assets: | | | | | | | | | | | | | | | | | | | | |
Expenses | | | .99% | | | | 1.01% | | | | 1.02% | | | | 1.09% | | | | 1.06% | d |
Net investment income | | | .38% | | | | .38% | | | | .81% | | | | .90% | | | | .62% | d |
Portfolio turnover rate | | | 12.52% | | | | 5.11% | | | | 40.54% | | | | 42.47% | | | | 61.23% | |
| a | Based on average daily shares outstanding. |
| b | Total return does not include any fees, charges or expenses imposed by the variable annuity and life insurance contracts for which the Franklin Templeton Variable Insurance Products Trust serves as an underlying investment vehicle. Total return is not annualized for periods less than one year. |
| c | For the period January 6, 1999 (effective date) to December 31, 1999. |
See notes to financial statements.
FSV-6
FRANKLIN TEMPLETON VARIABLE INSURANCE PRODUCTS TRUST
FRANKLIN SMALL CAP VALUE SECURITIES FUND
Statement of Investments, December 31, 2003
| | | | | |
| | | SHARES | | VALUE |
|
Common Stocks 89.3% | | | | | |
Commercial Services .6% | | | | | |
ABM Industries Inc. | | 120,000 | | $ | 2,089,200 |
| | | | |
|
|
Communications 1.5% | | | | | |
aAllstream Inc., Class B (Canada) | | 95,000 | | | 5,448,250 |
| | | | |
|
|
Consumer Durables 6.9% | | | | | |
Action Performance Cos. Inc. | | 45,000 | | | 882,000 |
Briggs & Stratton Corp. | | 75,000 | | | 5,055,000 |
D.R. Horton Inc. | | 14,250 | | | 616,455 |
Hooker Furniture Corp. | | 45,000 | | | 1,836,000 |
La-Z-Boy Inc. | | 205,000 | | | 4,300,900 |
M/I Schottenstein Homes Inc. | | 41,600 | | | 1,624,480 |
aMonaco Coach Corp. | | 227,500 | | | 5,414,500 |
Russ Berrie & Co. Inc. | | 174,000 | | | 5,898,600 |
| | | | |
|
|
| | | | | | 25,627,935 |
| | | | |
|
|
Consumer Non-Durables 4.9% | | | | | |
Brown Shoe Co. Inc. | | 140,000 | | | 5,310,200 |
Lancaster Colony Corp. | | 60,000 | | | 2,709,600 |
Oshkosh B’Gosh Inc., A | | 152,900 | | | 3,281,234 |
Russell Corp. | | 17,000 | | | 298,520 |
Standard Commercial Corp. | | 48,500 | | | 973,395 |
aTimberland Co., A | | 100,000 | | | 5,207,000 |
Wolverine World Wide Inc. | | 13,000 | | | 264,940 |
| | | | |
|
|
| | | | | | 18,044,889 |
| | | | |
|
|
Consumer Services 3.0% | | | | | |
aAztar Corp. | | 185,000 | | | 4,162,500 |
Intrawest Corp. (Canada) | | 225,000 | | | 4,160,250 |
aLa Quinta Corp. | | 404,900 | | | 2,595,409 |
| | | | |
|
|
| | | | | | 10,918,159 |
| | | | |
|
|
Electronic Technology 2.9% | | | | | |
aAvocent Corp. | | 135,000 | | | 4,930,200 |
Cohu Inc. | | 105,000 | | | 2,010,750 |
Diebold Inc. | | 70,000 | | | 3,770,900 |
aSPACEHAB Inc. | | 13,500 | | | 20,655 |
| | | | |
|
|
| | | | | | 10,732,505 |
| | | | |
|
|
Energy Minerals 6.2% | | | | | |
Arch Coal Inc. | | 195,000 | | | 6,078,150 |
Consol Energy Inc. | | 235,000 | | | 6,086,500 |
Holly Corp. | | 60,000 | | | 1,650,000 |
aNuevo Energy Co. | | 41,100 | | | 993,387 |
Peabody Energy Corp. | | 165,000 | | | 6,882,150 |
aPioneer Natural Resources Co. | | 45,000 | | | 1,436,850 |
| | | | |
|
|
| | | | | | 23,127,037 |
| | | | |
|
|
Finance 12.2% | | | | | |
American National Insurance Co. | | 62,100 | | | 5,239,377 |
Arthur J. Gallagher & Co. | | 190,000 | | | 6,173,100 |
Chemical Financial Corp. | | 2,300 | | | 83,697 |
Corus Bankshares Inc. | | 13,000 | | | 410,280 |
FSV-7
FRANKLIN TEMPLETON VARIABLE INSURANCE PRODUCTS TRUST
FRANKLIN SMALL CAP VALUE SECURITIES FUND
Statement of Investments, December 31, 2003 (cont.)
| | | | | |
| | | SHARES | | VALUE |
|
Common Stocks (cont.) | | | | | |
Finance (cont.) | | | | | |
aDollar Thrifty Automotive Group Inc. | | 120,000 | | $ | 3,112,800 |
First Indiana Corp. | | 42,500 | | | 796,875 |
Hancock Holding Co. | | 35,000 | | | 1,909,950 |
Harleysville Group Inc. | | 95,000 | | | 1,889,550 |
IPC Holdings Ltd. (Bermuda) | | 107,500 | | | 4,186,050 |
Montpelier Re Holdings Ltd. (Bermuda) | | 145,000 | | | 5,321,500 |
Peoples Bancorp Inc. | | 70,350 | | | 2,076,029 |
The PMI Group Inc. | | 65,000 | | | 2,419,950 |
Presidential Life Corp. | | 189,200 | | | 2,489,872 |
Protective Life Corp. | | 68,200 | | | 2,307,888 |
RLI Corp. | | 110,000 | | | 4,120,600 |
StanCorp Financial Group Inc. | | 45,000 | | | 2,829,600 |
| | | | |
|
|
| | | | | | 45,367,118 |
| | | | |
|
|
Health Technology 2.2% | | | | | |
aSTERIS Corp. | | 234,800 | | | 5,306,480 |
West Pharmaceutical Services Inc. | | 85,000 | | | 2,881,500 |
| | | | |
|
|
| | | | | | 8,187,980 |
| | | | |
|
|
Industrial Services 7.6% | | | | | |
aAtwood Oceanics Inc. | | 85,000 | | | 2,714,900 |
ENSCO International Inc. | | 27,500 | | | 747,175 |
aGlobal Industries Ltd. | | 912,500 | | | 4,699,375 |
GlobalSantaFe Corp. | | 17,500 | | | 434,525 |
aLone Star Technologies Inc. | | 260,000 | | | 4,154,800 |
aOffshore Logistics Inc. | | 129,300 | | | 3,170,436 |
aOil States International Inc. | | 245,000 | | | 3,415,300 |
aRowan Cos. Inc. | | 135,000 | | | 3,127,950 |
aShaw Group Inc. | | 78,700 | | | 1,071,894 |
Tidewater Inc. | | 147,500 | | | 4,407,300 |
aTransocean Inc. | | 13,000 | | | 312,130 |
| | | | |
|
|
| | | | | | 28,255,785 |
| | | | |
|
|
Non-Energy Minerals 3.4% | | | | | |
Reliance Steel & Aluminum Co. | | 200,000 | | | 6,642,000 |
United States Steel Corp. | | 165,000 | | | 5,778,300 |
| | | | |
|
|
| | | | | | 12,420,300 |
| | | | |
|
|
Process Industries 6.3% | | | | | |
AptarGroup Inc. | | 117,500 | | | 4,582,500 |
Bunge Ltd. | | 160,000 | | | 5,267,200 |
Cabot Corp. | | 175,000 | | | 5,572,000 |
Myers Industries Inc. | | 210,000 | | | 2,545,200 |
RPM International Inc. | | 325,000 | | | 5,349,500 |
| | | | |
|
|
| | | | | | 23,316,400 |
| | | | |
|
|
Producer Manufacturing 16.2% | | | | | |
American Woodmark Corp. | | 10,600 | | | 583,530 |
aCable Design Technologies Corp. | | 205,900 | | | 1,851,041 |
Carlisle Cos. Inc. | | 30,000 | | | 1,825,800 |
FSV-8
FRANKLIN TEMPLETON VARIABLE INSURANCE PRODUCTS TRUST
FRANKLIN SMALL CAP VALUE SECURITIES FUND
Statement of Investments, December 31, 2003 (cont.)
| | | | | |
| | | SHARES | | VALUE |
|
Common Stocks (cont.) | | | | | |
Producer Manufacturing (cont.) | | | | | |
CIRCOR International Inc. | | 107,100 | | $ | 2,581,110 |
CNH Global NV (Netherlands) | | 160,000 | | | 2,656,000 |
aGenlyte Group Inc. | | 50,000 | | | 2,919,000 |
Graco Inc. | | 96,000 | | | 3,849,600 |
JLG Industries Inc. | | 195,000 | | | 2,969,850 |
aMettler-Toledo International Inc. (Switzerland) | | 140,000 | | | 5,909,400 |
aMueller Industries Inc. | | 150,000 | | | 5,154,000 |
aPowell Industries Inc. | | 87,700 | | | 1,679,455 |
Roper Industries Inc. | | 126,600 | | | 6,236,316 |
Stewart & Stevenson Services Inc. | | 78,000 | | | 1,095,900 |
Superior Industries International Inc. | | 90,000 | | | 3,916,800 |
Teleflex Inc. | | 68,000 | | | 3,286,440 |
Thomas Industries Inc. | | 70,000 | | | 2,426,200 |
Timken Co. | | 44,800 | | | 898,688 |
aTower Automotive Inc. | | 89,500 | | | 611,285 |
Watts Water Technologies Inc., A | | 140,000 | | | 3,108,000 |
York International Corp. | | 180,000 | | | 6,624,000 |
| | | | |
|
|
| | | | | | 60,182,415 |
| | | | |
|
|
Retail Trade 7.0% | | | | | |
aAmerican Eagle Outfitters Inc. | | 127,500 | | | 2,091,000 |
Dillards Inc., A | | 370,000 | | | 6,090,200 |
Fresh Brands Inc. | | 18,000 | | | 198,000 |
aLinens ‘n Things Inc. | | 147,500 | | | 4,436,800 |
aThe Men’s Wearhouse Inc. | | 165,000 | | | 4,126,650 |
Pier 1 Imports Inc. | | 85,000 | | | 1,858,100 |
aWest Marine Inc. | | 198,900 | | | 5,531,409 |
aZale Corp. | | 29,000 | | | 1,542,800 |
| | | | |
|
|
| | | | | | 25,874,959 |
| | | | |
|
|
Technology Services 1.9% | | | | | |
aNetIQ Corp. | | 115,000 | | | 1,523,750 |
Reynolds & Reynolds Co., A | | 195,000 | | | 5,664,750 |
| | | | |
|
|
| | | | | | 7,188,500 |
| | | | |
|
|
Transportation 6.2% | | | | | |
aABX Air Inc. | | 70,000 | | | 301,000 |
aKansas City Southern | | 65,100 | | | 932,232 |
aOMI Corp. | | 780,000 | | | 6,965,400 |
Overseas Shipholding Group Inc. | | 110,000 | | | 3,745,500 |
SkyWest Inc. | | 250,000 | | | 4,530,000 |
Teekay Shipping Corp. (Bahamas) | | 115,000 | | | 6,558,450 |
| | | | |
|
|
| | | | | | 23,032,582 |
| | | | |
|
|
Utilities .3% | | | | | |
aSierra Pacific Resources Co. | | 168,000 | | | 1,233,120 |
| | | | |
|
|
Total Common Stocks (Cost $261,751,484) | | | | | 331,047,134 |
| | | | |
|
|
Short Term Investments (Cost $38,324,388) 10.3% | | | | | |
bFranklin Institutional Fiduciary Trust Money Market Portfolio | | 38,324,388 | | | 38,324,388 |
| | | | |
|
|
Total Investments (Cost $300,075,872) 99.6% | | | | | 369,371,522 |
Other Assets, less Liabilities .4% | | | | | 1,360,975 |
| | | | |
|
|
Net Assets 100.0% | | | | $ | 370,732,497 |
| | | | |
|
|
| b | See Note 6 regarding investments in the Franklin Institutional Fiduciary Trust Money Market Portfolio. |
See notes to financial statements.
FSV-9
FRANKLIN TEMPLETON VARIABLE INSURANCE PRODUCTS TRUST
FRANKLIN SMALL CAP VALUE SECURITIES FUND
Financial Statements
Statement of Assets and Liabilities
December 31, 2003
| | | | |
Assets: | | | | |
Investments in securities: | | | | |
Cost | | $ | 300,075,872 | |
| | |
|
|
|
Value | | | 369,371,522 | |
Receivables: | | | | |
Investment securities sold | | | 897,842 | |
Capital shares sold | | | 611,402 | |
Dividends | | | 469,642 | |
| | |
|
|
|
Total assets | | | 371,350,408 | |
| | |
|
|
|
Liabilities: | | | | |
Payables: | | | | |
Funds advanced by custodian | | | 11,071 | |
Capital shares redeemed | | | 249,641 | |
Affiliates | | | 325,864 | |
Other liabilities | | | 31,335 | |
| | |
|
|
|
Total liabilities | | | 617,911 | |
| | |
|
|
|
Net assets, at value | | $ | 370,732,497 | |
| | |
|
|
|
Net assets consist of: | | | | |
Undistributed net investment income | | $ | 947,707 | |
Net unrealized appreciation (depreciation) | | | 69,295,650 | |
Accumulated net realized gain (loss) | | | (4,295,419 | ) |
Capital shares | | | 304,784,559 | |
| | |
|
|
|
Net assets, at value | | $ | 370,732,497 | |
| | |
|
|
|
Class 1: | | | | |
Net assets, at value | | $ | 37,107,652 | |
| | |
|
|
|
Shares outstanding | | | 2,895,945 | |
| | |
|
|
|
Net asset value and offering price per share | | $ | 12.81 | |
| | |
|
|
|
Class 2: | | | | |
Net assets, at value | | $ | 333,624,845 | |
| | |
|
|
|
Shares outstanding | | | 26,322,982 | |
| | |
|
|
|
Net asset value and offering price per share | | $ | 12.67 | |
| | |
|
|
|
See notes to financial statements.
FSV-10
FRANKLIN TEMPLETON VARIABLE INSURANCE PRODUCTS TRUST
FRANKLIN SMALL CAP VALUE SECURITIES FUND
Financial Statements (continued)
Statement of Operations
for the year ended December 31, 2003
| | | | |
Investment income: | | | | |
Dividends | | $ | 3,192,849 | |
| | |
|
|
|
Expenses: | | | | |
Management fees (Note 3) | | | 1,292,872 | |
Administrative fees (Note 3) | | | 341,811 | |
Distribution fees - Class 2 (Note 3) | | | 508,231 | |
Transfer agent fees | | | 1,809 | |
Custodian fees | | | 2,130 | |
Reports to shareholders | | | 61,400 | |
Professional fees | | | 18,566 | |
Trustees’ fees and expenses | | | 2,082 | |
Other | | | 13,389 | |
| | |
|
|
|
Total expenses | | | 2,242,290 | |
| | |
|
|
|
Net investment income | | | 950,559 | |
| | |
|
|
|
Realized and unrealized gains (losses): | | | | |
Net realized gain (loss) from: | | | | |
Investments | | | (2,905,215 | ) |
Foreign currency transactions | | | (610 | ) |
| | |
|
|
|
Net realized gain (loss) | | | (2,905,825 | ) |
Net unrealized appreciation (depreciation) on investments | | | 79,386,021 | |
| | |
|
|
|
Net realized and unrealized gain (loss) | | | 76,480,196 | |
| | |
|
|
|
Net increase (decrease) in net assets resulting from operations | | $ | 77,430,755 | |
| | |
|
|
|
See notes to financial statements.
FSV-11
FRANKLIN TEMPLETON VARIABLE INSURANCE PRODUCTS TRUST
FRANKLIN SMALL CAP VALUE SECURITIES FUND
Financial Statements (continued)
Statements of Changes in Net Assets
for the years ended December 31, 2003 and 2002
| | | | | | | | |
| | | 2003 | | | 2002 | |
| | |
| |
Increase (decrease) in net assets: | | | | | | | | |
Operations: | | | | | | | | |
Net investment income | | $ | 950,559 | | | $ | 510,537 | |
Net realized gain (loss) from investments and foreign currency transactions | | | (2,905,825 | ) | | | (1,240,229 | ) |
Net unrealized appreciation (depreciation) on investments | | | 79,386,021 | | | | (15,328,688 | ) |
| | |
| |
Net increase (decrease) in net assets resulting from operations | | | 77,430,755 | | | | (16,058,380 | ) |
Distributions to shareholders from: | | | | | | | | |
Net investment income: | | | | | | | | |
Class 1 | | | (92,314 | ) | | | (158,450 | ) |
Class 2 | | | (419,082 | ) | | | (299,301 | ) |
Net realized gains: | | | | | | | | |
Class 1 | | | — | | | | (959,618 | ) |
Class 2 | | | — | | | | (2,093,611 | ) |
| | |
| |
Total distributions to shareholders | | | (511,396) | | | | (3,510,980 | ) |
Capital share transactions: (Note 2) | | | | | | | | |
Class 1 | | | (270,231 | ) | | | 1,083,853 | |
Class 2 | | | 140,061,392 | | | | 105,621,633 | |
| | |
| |
Total capital share transactions | | | 139,791,161 | | | | 106,705,486 | |
Net increase (decrease) in net assets | | | 216,710,520 | | | | 87,136,126 | |
Net assets: | | | | | | | | |
Beginning of year | | | 154,021,977 | | | | 66,885,851 | |
| | |
| |
End of year | | $ | 370,732,497 | | | $ | 154,021,977 | |
| | |
| |
Undistributed net investment income included in net assets: | | | | | | | | |
End of year | | $ | 947,707 | | | $ | 509,154 | |
| | |
| |
See notes to financial statements.
FSV-12
FRANKLIN TEMPLETON VARIABLE INSURANCE PRODUCTS TRUST
FRANKLIN SMALL CAP VALUE SECURITIES FUND
Notes to Financial Statements
1. ORGANIZATION AND SIGNIFICANT ACCOUNTING POLICIES
Franklin Templeton Variable Insurance Products Trust (the Trust) is registered under the Investment Company Act of 1940 as an open-end investment company, consisting of twenty-two separate series (the Funds). Franklin Small Cap Value Securities Fund (the Fund) included in this report is non-diversified. Shares of the Fund are sold only to insurance company separate accounts to fund the benefits of variable life insurance policies or variable annuity contracts. The Fund’s investment objective is total return.
The following summarizes the Fund’s significant accounting policies.
a. Security Valuation
Securities listed or traded on a recognized national exchange or NASDAQ are valued at the last reported sales price. Over-the-counter securities and listed securities for which no sale is reported are valued within the range of the latest quoted bid and asked prices. Investments in open-end mutual funds are valued at the closing net asset value. Foreign securities are valued at the close of trading of the foreign exchange or the NYSE, whichever is earlier. If events occur that materially affect the values of securities after the prices or foreign exchange rates are determined, or if market quotations are not readily available, the securities will be valued at fair value as determined following procedures approved by the Board of Trustees.
b. Foreign Currency Translation
Portfolio securities and other assets and liabilities denominated in foreign currencies are translated into U.S. dollars based on the exchange rate of such currencies against U.S. dollars on the date of valuation. Purchases and sales of securities and income items denominated in foreign currencies are translated into U.S. dollars at the exchange rate in effect on the transaction date.
The Fund does not separately report the effect of changes in foreign exchange rates from changes in market prices on securities held. Such changes are included in net realized and unrealized gain or loss from investments.
Realized foreign exchange gains or losses arise from sales of foreign currencies, currency gains or losses realized between the trade and settlement dates on securities transactions and the difference between the recorded amounts of dividends, interest, and foreign withholding taxes and the U.S. dollar equivalent of the amounts actually received or paid. Net unrealized foreign exchange gains and losses arise from changes in foreign exchange rates on foreign denominated assets and liabilities other than investments in securities held at the end of the reporting period.
c. Income Taxes
No provision has been made for income taxes because the Fund’s policy is to qualify as a regulated investment company under the Internal Revenue Code and to distribute substantially all of its taxable income.
d. Security Transactions, Investment Income, Expenses and Distributions
Security transactions are accounted for on trade date. Realized gains and losses on security transactions are determined on a specific identification basis. Certain income from foreign securities is recorded as soon as information is available to the funds. Estimated expenses are accrued daily. Dividend income and distributions to shareholders are recorded on the ex-dividend date.
Common expenses incurred by the Trust are allocated among the Funds based on the ratio of net assets of each fund to the combined net assets. Other expenses are charged to each fund on a specific identification basis.
Realized and unrealized gains and losses and net investment income, other than class specific expenses, are allocated daily to each class of shares based upon the relative proportion of net assets of each class.
FSV-13
FRANKLIN TEMPLETON VARIABLE INSURANCE PRODUCTS TRUST
FRANKLIN SMALL CAP VALUE SECURITIES FUND
Notes to Financial Statements (continued)
1. ORGANIZATION AND SIGNIFICANT ACCOUNTING POLICIES (cont.)
e. Accounting Estimates
The preparation of financial statements in accordance with accounting principles generally accepted in the United States of America requires management to make estimates and assumptions that affect the reported amounts of assets and liabilities at the date of the financial statements and the amounts of income and expenses during the reporting period. Actual results could differ from those estimates.
f. Guarantees and Indemnifications
Under the Trust’s organizational documents, its officers and trustees are indemnified against certain liability arising out of the performance of their duties to the Trust. Additionally, in the normal course of business, the Trust enters into contracts with service providers that contain general indemnification clauses. The Trust’s maximum exposure under these arrangements is unknown as this would involve future claims that may be made against the Trust that have not yet occurred. However, based on experience, the Trust expects the risk of loss to be remote.
2. SHARES OF BENEFICIAL INTEREST
The Fund offers two classes of shares: Class 1 and Class 2. Each class of shares differs by its distribution fees, voting rights on matters affecting a single class and its exchange privilege.
At December 31, 2003, there were an unlimited number of shares authorized ($.01 par value). Transactions in the Fund’s shares were as follows:
| | | | | | | | | | | | | | |
| | | Year Ended December 31,
| |
| | | 2003
| | | 2002
| |
| Class 1 Shares: | | Shares
| | | Amount
| | | Shares
| | | Amount
| |
Shares sold | | 535,888 | | | $ | 5,992,067 | | | 1,067,913 | | | $ | 12,265,267 | |
Shares issued in reinvestment of distributions | | 8,652 | | | | 92,314 | | | 97,904 | | | | 1,118,068 | |
Shares redeemed | | (608,775 | ) | | | (6,354,612 | ) | | (1,177,077 | ) | | | (12,299,482 | ) |
| | |
| |
Net increase (decrease) | | (64,235 | ) | | $ | (270,231 | ) | | (11,260 | ) | | $ | 1,083,853 | |
| | |
| |
| Class 2 Shares: | | | | | | | | | | | | |
Shares sold | | 16,349,327 | | | $ | 172,717,267 | | | 10,964,657 | | | $ | 116,028,421 | |
Shares issued in reinvestment of distributions | | 39,648 | | | | 419,082 | | | 211,202 | | | | 2,392,912 | |
Shares redeemed | | (3,103,212 | ) | | | (33,074,957 | ) | | (1,285,701 | ) | | | (12,799,700 | ) |
| | |
| |
Net increase (decrease) | | 13,285,763 | | | $ | 140,061,392 | | | 9,890,158 | | | $ | 105,621,633 | |
| | |
| |
3. TRANSACTIONS WITH AFFILIATES
Certain officers and trustees of the Fund are also officers and/or directors of the following entities:
| | |
| Entity | | Affiliation |
|
Franklin Templeton Services LLC (FT Services) | | Administrative manager |
Franklin Advisory Services LLC (Advisory Services) | | Investment manager |
Franklin/Templeton Distributors Inc. (Distributors) | | Principal underwriter |
Franklin/Templeton Investor Services LLC (Investor Services) | | Transfer agent |
FSV-14
FRANKLIN TEMPLETON VARIABLE INSURANCE PRODUCTS TRUST
FRANKLIN SMALL CAP VALUE SECURITIES FUND
Notes to Financial Statements (continued)
3. TRANSACTIONS WITH AFFILIATES (cont.)
The Fund pays an investment management fee to Advisory Services based on the average daily net assets of the Fund as follows:
| | |
| Annualized Fee Rate | | Net Assets |
|
| .60% | | First $200 million |
| .50% | | Over $200 million, up to and including $1.3 billion |
| .40% | | Over $1.3 billion |
The Fund pays an administrative fee to FT Services based on the average daily net assets as follows:
| | |
| Annualized Fee Rate | | Net Assets |
|
| .15% | | First $200 million |
| .135% | | Over $200 million, up to and including $700 million |
| .10% | | Over $700 million, up to and including $1.2 billion |
Fees are further reduced on net assets over $1.2 billion.
The Fund reimburses Distributors up to .25% per year of its average daily net assets of Class 2, for costs incurred in marketing the Fund’s shares.
Investor Services, under terms of an agreement, performs shareholder servicing for the Fund and is not paid by the Fund.
4. INCOME TAXES
At December 31, 2003, the Fund had tax basis capital losses of $4,206,062, which may be carried over to offset future capital gains. Such losses expire as follows:
| | | |
Capital loss carryovers expiring in: | | | |
2010 | | $ | 968,401 |
2011 | | | 3,237,661 |
| | |
|
|
| | | $ | 4,206,062 |
| | |
|
|
Net investment income (loss) differs for financial statement and tax purposes primarily due to differing treatment of foreign currency transactions.
Net realized gains (losses) differ for financial statement and tax purposes primarily due to differing treatments of wash sales and foreign currency transactions.
The tax character of distributions paid during the years ended December 31, 2003 and 2002, was as follows:
| | | | | | |
| | | Year Ended December 31,
|
| | | 2003
| | 2002
|
Distributions paid from: | | | | | | |
Ordinary Income | | $ | 511,396 | | $ | 1,793,020 |
Long term capital gain | | | — | | | 1,717,960 |
| | |
|
| | | $ | 511,396 | | $ | 3,510,980 |
| | |
|
FSV-15
FRANKLIN TEMPLETON VARIABLE INSURANCE PRODUCTS TRUST
FRANKLIN SMALL CAP VALUE SECURITIES FUND
Notes to Financial Statements (continued)
4. INCOME TAXES (cont.)
At December 31, 2003, the cost of investments, net unrealized appreciation (depreciation), undistributed ordinary income and undistributed long term capital gains for income tax purposes were as follows:
| | | | |
Cost of investments | | $ | 300,165,229 | |
| | |
|
|
|
Unrealized appreciation | | | 73,212,303 | |
Unrealized depreciation | | | (4,006,010 | ) |
| | |
|
|
|
Net unrealized appreciation (depreciation) | | $ | 69,206,293 | |
| | |
|
|
|
Undistributed ordinary income | | $ | 947,707 | |
Undistributed long term capital gains | | | — | |
| | |
|
|
|
Distributable earnings | | $ | 947,707 | |
| | |
|
|
|
5. INVESTMENT TRANSACTIONS
Purchases and sales of investments (excluding short-term securities) for the year ended December 31, 2003 aggregated $136,838,800 and $27,329,178, respectfully.
6. INVESTMENT IN FRANKLIN INSTITUTIONAL FIDUCIARY TRUST MONEY MARKET PORTFOLIO
The Fund may invest in the Franklin Institutional Fiduciary Trust Money Market Portfolio (the Sweep Money Fund), an open-end investment company managed by Franklin Advisers, Inc. (an affiliate of the investment manager). Management fees paid by the Fund are reduced on assets invested in the Sweep Money Fund, in an amount not to exceed the management fees paid by the Sweep Money Fund. The Fund earned $134,946 of dividend income from investment in the Sweep Money Fund for the year ended December 31, 2003.
7. REGULATORY MATTERS
On February 4, 2004, the Securities Division of the Office of the Secretary of the Commonwealth of Massachusetts filed an administrative complaint against Franklin Resources, Inc. and certain of its subsidiaries (the “Company”), alleging violations of the Massachusetts Uniform Securities Act. The complaint arises from activity that occurred in 2001 during which time an officer of a Company subsidiary was negotiating an agreement with an investor relating to investments in a mutual fund and a hedge fund.
The Company, in addition to other entities within Franklin Templeton Investments, has been named in shareholder class actions related to the matter described above. The Company believes that the claims made in the lawsuit are without merit and it intends to defend vigorously against the allegations. The Company and the Fund may be named in similar civil actions related to the matter described above.
In addition, as part of ongoing investigations by the U.S. Securities and Exchange Commission (the “SEC”), the U.S. Attorney for the Northern District of California, the New York Attorney General, the California Attorney General, the U.S. Attorney for the District of Massachusetts, the Florida Department of Financial Services, and the Commissioner of Securities and the Attorney General of the State of West Virginia, relating to certain practices in the mutual fund industry, including late trading, market timing and sales compensation arrangements, the Company and its subsidiaries, as well as certain current or former executives and employees of the Company, have received requests for information and/or subpoenas to testify or produce documents. The Company and its current employees are providing documents and information in response to these requests and subpoenas. In addition, the Company has responded to requests for similar kinds of information from regulatory authorities in some of the foreign countries where the Company conducts its global asset management business.
FSV-16
FRANKLIN TEMPLETON VARIABLE INSURANCE PRODUCTS TRUST
FRANKLIN SMALL CAP VALUE SECURITIES FUND
Notes to Financial Statements (continued)
7. REGULATORY MATTERS (cont.)
The Staff of the SEC has informed the Company that it intends to recommend that the Commission authorize an action against an affiliate of the Fund’s adviser and a senior executive officer relating to the frequent trading issues that are the subject of the SEC’s investigation. These issues were previously disclosed as being under investigation by government authorities and the subject of an internal inquiry by the Company in its Annual Report on Form 10-K and on its public website. The Company currently is in discussions with the SEC Staff in an effort to resolve the issues raised in their investigation. Such discussions are preliminary and the Fund’s management has been advised that the Company cannot predict the likelihood of whether those discussions will result in a settlement and, if so, the terms of such settlement. The impact, if any, of these matters on the Fund is uncertain at this time. If the Company finds that it bears responsibility for any unlawful or improper conduct, it has committed to making the Fund or its shareholders whole, as appropriate.
FSV-17
FRANKLIN TEMPLETON VARIABLE INSURANCE PRODUCTS TRUST
FRANKLIN SMALL CAP VALUE SECURITIES FUND
Independent Auditors’ Report
To the Board of Trustees and Shareholders
of Franklin Templeton Variable Insurance Products Trust
In our opinion, the accompanying statement of assets and liabilities, including the statement of investments, and the related statements of operations and of changes in net assets and the financial highlights present fairly, in all material respects, the financial position of the Franklin Small Cap Value Securities Fund (the Fund) (one of the funds constituting the Franklin Templeton Variable Insurance Products Trust) at December 31, 2003, the results of its operations for the year then ended, the changes in its net assets for each of the two years in the period then ended and the financial highlights for each of the periods presented, in conformity with accounting principles generally accepted in the United States of America. These financial statements and financial highlights (hereafter referred to as “financial statements”) are the responsibility of the Fund’s management; our responsibility is to express an opinion on these financial statements based on our audits. We conducted our audits of these financial statements in accordance with auditing standards generally accepted in the United States of America, which require that we plan and perform the audits to obtain reasonable assurance about whether the financial statements are free of material misstatement. An audit includes examining, on a test basis, evidence supporting the amounts and disclosures in the financial statements, assessing the accounting principles used and significant estimates made by management, and evaluating the overall financial statement presentation. We believe that our audits, which included confirmation of securities at December 31, 2003 by correspondence with the custodian and brokers, provide a reasonable basis for our opinion.
PricewaterhouseCoopers LLP
San Francisco, California
February 5, 2004, except for Note 7, as to which the date is February 12, 2004
FSV-18
FRANKLIN TEMPLETON VARIABLE INSURANCE PRODUCTS TRUST
FRANKLIN SMALL CAP VALUE SECURITIES FUND
Tax Designation (unaudited)
Under Section 854(b)(2) of the Internal Revenue Code, the Fund hereby designates 100.00% of the ordinary income dividends paid as income qualifying for the dividends received deduction for the fiscal year ended December 31, 2003.
FSV-19
FRANKLIN STRATEGIC INCOME SECURITIES FUND
Fund Goals and Primary Investments: Franklin Strategic Income Securities Fund seeks a high level of current income, with capital appreciation over the long term as a secondary goal. The Fund invests mainly in U.S. and foreign debt securities, including those in emerging markets.
We are pleased to bring you Franklin Strategic Income Securities Fund’s annual report for the fiscal year ended December 31, 2003.
Performance Overview
You can find the Fund’s one-year total return in the Performance Summary following this report. The Fund outperformed its benchmarks, the Lehman Brothers U.S. Aggregate Index and the Lipper Multi-Sector Income Funds Objective Average, which returned 4.10% and 16.11% for the year under review.1
Economic and Market Overview
During the year ended December 31, 2003, many factors impacted global economies and financial markets. Early in the year, economic uncertainty and geopolitical events, including impending war in Iraq, pushed U.S. interest rates to their lowest level in more four decades, and the 10-year U.S. Treasury note’s yield fell to 3.13% in mid-June. However, following the end of major conflict in Iraq, many economic indicators turned positive. In the U.S., third quarter 2003 gross domestic product (GDP) grew an annualized 8.2%, its strongest pace in nearly 20 years. Overall, 2003 GDP grew an estimated 3.1%. The U.S. trade deficit increased significantly, contributing to the U.S. dollar’s fall to record lows against the euro and other major currencies during the year. However, the weak dollar provided a boost to the U.S. economy and corporate profits as exports became cheaper for foreign buyers. Robust consumer spending, especially for autos and homes, and a rebound in business spending, particularly for equipment and software, contributed to the accelerated economic activity. In addition, U.S. federal spending stayed firm and inflation remained benign. As economic data improved, some interest rates rose from their lows, and the 10-year Treasury note’s yield ended the period at 4.27%.
Foreign economies also showed signs of recovery and benign inflation following a low growth and disinflationary environment that facilitated monetary easing in many major economies during the reporting period.
1. Sources: Standard & Poor’s Micropal; Lipper Inc. One cannot invest directly in an index, nor is an index representative of the Fund’s portfolio. Please see Index Descriptions following the Fund Summaries.
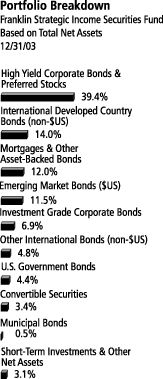
The dollar value, number of shares or principal amount, and complete legal titles of all portfolio holdings are listed in the Fund’s Statement of Investments.
FSI-1
While economic growth accelerated in the U.S., it remained strong in Asia, and was weak, yet positive, in Europe. Despite these signs of economic recovery, benign inflationary trends continued, supported by cyclical productivity gains and excess capacity in labor and capital.
Investment Strategy
We allocate our investments among the various types of debt available based on our assessment of changing economic, global market, industry, and issuer conditions. We use a top-down analysis of macroeconomic trends, combined with a bottom-up fundamental analysis of market sectors, industries and issuers to take advantage of varying sector reactions to economic events. For example, we evaluate business cycles, yield curves, country risk, and the relative interest rates among currencies, and values between and within markets. In selecting debt securities, we conduct our own analysis of the security’s intrinsic value rather than simply relying on the coupon rate or rating.
Manager’s Discussion
Consistent with our investment strategy, we invested across the fixed income market in sectors including high yield and investment grade corporate bonds, international developed and emerging market bonds, U.S. government and agency securities, mortgage- and other asset-backed securities, convertible securities and preferred stocks. The Fund’s performance benefited during the period from its allocation to high yield corporate bonds and preferred stocks, which at period-end represented the largest asset class weighting at 39.4% of total net assets. Over the past year the high yield corporate bond market was driven largely by a combination of improving fundamentals, such as declining corporate default rates and improving credit profiles, along with robust retail and institutional demand for the asset class. During the 12 months under review, yield spreads over Treasury securities in the high yield market compressed from 9.5% at the beginning of the period to 4.9% at the end, benefiting this sector’s performance relative to other fixed income sectors.
Our second-largest exposure at period-end was in international foreign currency government bonds. This asset class benefited from the U.S. dollar’s significant weakness versus other major currencies, albeit while experiencing significant volatility during the reporting period. Moreover, interest rate differentials between certain international government bonds and U.S. Treasury securities narrowed, providing further performance gains relative to U.S. government bonds.
FSI-2
U.S. dollar-denominated emerging market bonds also delivered strong returns during the period, as this sector’s yield spread over Treasury securities narrowed, at least partially due to stable-to-improving economic and political conditions in many developing countries. For example, in October 2003 Moody’s Investors Service, an independent credit rating agency, upgraded Russia’s sovereign debt to investment grade status. At period-end, Russian government bonds represented one of our largest holdings within the emerging market bond asset class.
Within the more interest rate-sensitive sectors, such as the U.S. government securities market, a moderate rise in domestic interest rates dampened returns. However, the Fund held a relatively low weighting in U.S. government and agency bonds, representing 4.4% of total net assets on December 31, 2003. The Fund had a somewhat heavier exposure to mortgage-backed securities, which generally outperformed the Treasury market as prepayment risk for these securities fell with the rise in interest rates, although nominal returns for mortgage-backed securities were still moderated by the interest rate rise. Finally, similar to the high yield market, investment grade corporate bond issues generally benefited from improved corporate credit fundamentals, reflected in a drop in investment grade corporate yield spreads over comparable Treasury securities by nearly half over the course of the year, from 1.8% at the beginning of the period to less than 1.0% by year-end. Consequently, investment grade corporate bonds outperformed U.S. government bonds during the period. At period-end, investment grade corporate bonds represented 6.9% of the Fund’s total net assets.
Thank you for your participation in Franklin Strategic Income Securities Fund. We look forward to serving your future investment needs.
This discussion reflects our analysis, opinions and portfolio holdings as of December 31, 2003, the end of the reporting period. The way we implement our main investment strategies and the resulting portfolio holdings may change depending on factors such as market and economic conditions. These opinions may not be relied upon as investment advice or an offer for a particular security. The information is not a complete analysis of every aspect of any market, country, industry, security or the Fund. Statements of fact are from sources considered reliable, but the advisor makes no representation or warranty as to their completeness or accuracy. Although historical performance is no guarantee of future results, these insights may help you understand our investment management philosophy.
FSI-3
PERFORMANCE SUMMARYASOF 12/31/03
Total return of Class 2 shares represents the average annual change in value, assuming reinvestment of dividends and capital gains. Average returns smooth out variations in returns, which can be significant; they are not the same as year-by-year results.
Franklin Strategic Income Securities Fund – Class 2*
Periods ended 12/31/03
| | | | |
| | | 1-Year | | Since
Inception
(7/1/99) |
|
| | |
Average Annual Total Return | | +20.10% | | +7.91% |
*Because Class 2 shares were not offered until 5/15/01, standardized Class 2 Fund performance for prior periods represents the historical results of Class 1 shares. For periods beginning on 5/15/01, Class 2’s results reflect an additional 12b-1 fee expense, which also affects future performance. Since 5/15/01 (commencement of sales), the average annual total return of Class 2 shares was +9.72%.
Ongoing market volatility can significantly affect short-term performance; recent returns may differ.
Total Return Index Comparison for Hypothetical $10,000 Investment (7/1/99–12/31/03)
The graph compares the performance of Franklin Strategic Income Securities Fund – Class 2,* the Lehman Brothers U.S. Aggregate Index and the Lipper Multi-Sector Income Funds Objective Average. One cannot invest directly in an index, nor is an index representative of the Fund’s portfolio. Please see Important Notes to Performance Information preceding the Fund Summaries.
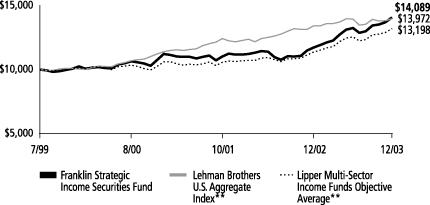
**Sources: Standard & Poor’s Micropal; Lipper Inc. Please see Index Descriptions following the Fund Summaries.
Franklin Strategic Income Securities Fund – Class 2
Performance reflects the Fund’s Class 2 operating expenses, but does not include any contract fees, expenses or sales charges. If they had been included, performance would be lower. These charges and deductions, particularly for variable life policies, can have a significant effect on contract values and insurance benefits. See the contract prospectus for a complete description of these expenses, including sales charges.
Since markets can go down as well as up, investment return and the value of your principal will fluctuate with market conditions, and you may have a gain or loss when you sell your shares.
Past performance does not guarantee future results.
FSI-4
FRANKLIN TEMPLETON VARIABLE INSURANCE PRODUCTS TRUST
FRANKLIN STRATEGIC INCOME SECURITIES FUND
Financial Highlights
| | | | | | | | | | | | | | | | | | | | |
| | | Class 1
| |
| | | Year Ended December 31,
| |
| | | 2003 | | | 2002 | | | 2001 | | | 2000 | | | 1999f | |
| | |
|
|
|
Per share operating performance | | | | | | | | | | | | | | | | | | | | |
(for a share outstanding throughout the year) | | | | | | | | | | | | | | | | | | | | |
Net asset value, beginning of year | | $ | 10.37 | | | $ | 9.87 | | | $ | 9.89 | | | $ | 9.96 | | | $ | 10.00 | |
| | |
|
|
|
Income from investment operations: | | | | | | | | | | | | | | | | | | | | |
Net investment incomea | | | .65 | | | | .73 | | | | .76 | e | | | .82 | | | | .38 | |
Net realized and unrealized gains (losses) | | | 1.44 | | | | (.23 | ) | | | (.32 | )e | | | (.33 | ) | | | (.12 | ) |
| | |
|
|
|
Total from investment operations | | | 2.09 | | | | .50 | | | | .44 | | | | .49 | | | | .26 | |
| | |
|
|
|
Less distributions from net investment income | | | (.30 | ) | | | — | d | | | (.46 | ) | | | (.56 | ) | | | (.30 | ) |
| | |
|
|
|
Net asset value, end of year | | $ | 12.16 | | | $ | 10.37 | | | $ | 9.87 | | | $ | 9.89 | | | $ | 9.96 | |
| | |
|
|
|
| | | | | |
Total returnb | | | 20.36% | | | | 5.12% | | | | 4.51% | | | | 4.95% | | | | 2.61% | |
| | | | | |
Ratios/supplemental data | | | | | | | | | | | | | | | | | | | | |
Net assets, end of year (000’s) | | $ | 359,947 | | | $ | 102,751 | | | $ | 43,778 | | | $ | 11,437 | | | $ | 4,741 | |
Ratios to average net assets: | | | | | | | | | | | | | | | | | | | | |
Expenses | | | .65% | | | | .66% | | | | .71% | | | | .75% | | | | .75% | g |
Expenses, excluding waiver and payments by affiliate | | | .65% | | | | .66% | | | | .71% | | | | .99% | | | | 1.46% | g |
Net investment income | | | 5.69% | | | | 7.37% | | | | 7.48% | e | | | 8.13% | | | | 7.52% | g |
Portfolio turnover rate | | | 49.87% | | | | 45.78% | | | | 35.21% | | | | 29.19% | | | | 9.96% | |
Portfolio turnover rate excluding mortgage dollar rollsc | | | 32.74% | | | | 40.50% | | | | 30.32% | | | | 29.19% | | | | 9.96% | |
| a | Based on average daily shares outstanding. |
| b | Total return does not include any fees, charges or expenses imposed by the variable annuity and life insurance contracts for which the Franklin Templeton Variable Insurance Products Trust serves as an underlying investment vehicle. Total return is not annualized for periods less than one year. |
| c | See Note 1(d) regarding mortgage dollar rolls. |
| d | Includes distributions of net investment income in the amount of $.005. |
| e | Effective January 1, 2001, the Fund adopted the provisions of the AICPA Audit and Accounting Guide of Investment Companies and began recording all paydown gains and losses as part of the investment income and amortizing all premium and discount on fixed-income securities, as required. The effect of this change was as follows: |
| | | |
Net investment income per share | | $(.018 | ) |
Net realized and unrealized losses per share | | .018 | |
Ratio of net investment income to average net assets | | (.18 | )% |
Per share data and ratios for prior periods have not been restated to reflect this change in accounting policy.
| f | For the period July 1, 1999 (effective date) to December 31, 1999. |
FSI-5
FRANKLIN TEMPLETON VARIABLE INSURANCE PRODUCTS TRUST
FRANKLIN STRATEGIC INCOME SECURITIES FUND
Financial Highlights (continued)
| | | | | | | | | | | | |
| | | Class 2
| |
| | | Year Ended December 31,
| |
| | | 2003 | | | 2002 | | | 2001e | |
| | |
|
|
|
Per share operating performance | | | | | | | | | | | | |
(for a share outstanding throughout the year) | | | | | | | | | | | | |
Net asset value, beginning of year | | $ | 10.29 | | | $ | 9.82 | | | $ | 10.14 | |
| | |
|
|
|
Income from investment operations: | | | | | | | | | | | | |
Net investment incomea | | | .62 | | | | .70 | | | | .45 | f |
Net realized and unrealized gains (losses) | | | 1.43 | | | | (.23 | ) | | | (.31 | )f |
| | |
|
|
|
Total from investment operations | | | 2.05 | | | | .47 | | | | .14 | |
| | |
|
|
|
Less distributions from net investment income | | | (.29 | ) | | | — | d | | | (.46 | ) |
| | |
|
|
|
Net asset value, end of year | | $ | 12.05 | | | $ | 10.29 | | | $ | 9.82 | |
| | |
|
|
|
| | | |
Total returnb | | | 20.10% | | | | 4.81% | | | | 1.38% | |
| | | |
Ratios/supplemental data | | | | | | | | | | | | |
Net assets, end of year (000’s) | | $ | 1,841 | | | $ | 210 | | | $ | 48 | |
Ratios to average net assets: | | | | | | | | | | | | |
Expenses | | | .90% | | | | .91% | | | | .96% | g |
Net investment income | | | 5.44% | | | | 7.12% | | | | 7.05% | g,f |
Portfolio turnover rate | | | 49.87% | | | | 45.78% | | | | 35.21% | |
Portfolio turnover rate excluding mortgage dollar rollsc | | | 32.74% | | | | 40.50% | | | | 30.32% | |
| a | Based on average daily shares outstanding. |
| b | Total return does not include any fees, charges or expenses imposed by the variable annuity and life insurance contracts for which the Franklin Templeton Variable Insurance Products Trust serves as an underlying investment vehicle. Total return is not annualized for periods less than one year. |
| c | See Note 1(d) regarding mortgage dollar rolls. |
| d | Includes distributions of net investment income in the amount of $.003. |
| e | For the period May 15, 2001 (effective date) to December 31, 2001. |
| f | Effective January 1, 2001, the Fund adopted the provisions of the AICPA Audit and Accounting Guide of Investment Companies and began recording all paydown gains and losses as part of the investment income and amortizing all premium and discount on fixed-income securities, as required. The effect of this change was as follows: |
| | | |
Net investment income per share | | $(.018 | ) |
Net realized and unrealized losses per share | | .018 | |
Ratio of net investment income to average net assets | | (.18 | )% |
Per share data and ratios for prior periods have not been restated to reflect this change in accounting policy.
See notes to financial statements.
FSI-6
FRANKLIN TEMPLETON VARIABLE INSURANCE PRODUCTS TRUST
FRANKLIN STRATEGIC INCOME SECURITIES FUND
Statement of Investments, December 31, 2003
| | | | | | | | |
| | | COUNTRY | | SHARES/
WARRANTS | | VALUE |
|
| | | | | | | | | |
Common Stocks and Warrants | | | | | | | | |
aXO Communications Inc. | | United States | | | 289 | | $ | 1,664 |
aXO Communications Inc., wts., A, 1/16/10 | | United States | | | 578 | | | 1,127 |
aXO Communications Inc., wts., B, 1/16/10 | | United States | | | 434 | | | 738 |
aXO Communications Inc., wts., C, 1/16/10 | | United States | | | 434 | | | 477 |
| | | | | | | |
|
|
Total Common Stocks and Warrants (Cost $183,497) | | | | | | | | 4,006 |
| | | | | | | |
|
|
Preferred Stock (Cost $2,435,097) .7% | | | | | | | | |
Fresenius Medical Care Capital Trust II, 7.875%, 2/01/08 | | Germany | | | 2,400,000 | | | 2,574,000 |
| | | | | | | |
|
|
Convertible Preferred Stocks 1.7% | | | | | | | | |
Consumer Durables .5% | | | | | | | | |
Ford Motor Co. Capital Trust II, 6.50%, cvt. pfd. | | United States | | | 34,000 | | | 1,898,900 |
| | | | | | | |
|
|
Electronic Technology .4% | | | | | | | | |
Northrop Grumman, 7.00%, cvt. pfd., B | | United States | | | 11,000 | | | 1,369,500 |
| | | | | | | |
|
|
Industrial Services .2% | | | | | | | | |
Allied Waste Industries Inc., 6.25%, cvt. pfd. | | United States | | | 12,000 | | | 918,000 |
| | | | | | | |
|
|
Technology Services .2% | | | | | | | | |
Electronic Data Systems Corp., 7.625%, cvt. pfd. | | United States | | | 31,000 | | | 710,830 |
| | | | | | | |
|
|
Utilities .4% | | | | | | | | |
FPL Group Inc., 8.50%, cvt. pfd. | | United States | | | 24,000 | | | 1,385,520 |
| | | | | | | |
|
|
Total Convertible Preferred Stocks (Cost $5,816,907) | | | | | | | | 6,282,750 |
| | | | | | | |
|
|
| | | |
| | | | | PRINCIPAL
AMOUNTd
| | |
Bonds 45.6% | | | | | | | | |
Commercial Services 1.2% | | | | | | | | |
Johnsondiversey Inc., senior sub. note B, 9.625%, 5/15/12 | | United States | | $ | 1,400,000 | | | 1,568,000 |
Johnsondiversey Hold Inc., senior disc. note, 144A, zero cpn. to 5/15/07, 10.67%
thereafter, 5/15/13 | | United States | | | 1,100,000 | | | 847,000 |
Lamar Media Corp., senior sub. note, 7.25%, 1/01/13 | | United States | | | 1,700,000 | | | 1,836,000 |
| | | | | | | |
|
|
| | | | | | | | | 4,251,000 |
| | | | | | | |
|
|
Communications 5.7% | | | | | | | | |
AT&T Wireless Services Inc., senior note, 8.125%, 5/01/12 | | United States | | | 1,700,000 | | | 2,002,854 |
Dobson Communications Corp., senior note, 10.875%, 7/01/10 | | United States | | | 700,000 | | | 766,500 |
Dobson Communications Corp., senior note, 144A, 8.875%, 10/01/13 | | United States | | | 1,000,000 | | | 1,017,500 |
Intelsat Ltd., 144A, 6.50%, 11/01/13 | | Bahamas | | | 2,400,000 | | | 2,508,691 |
Millicom International Cellular, senior note, 144A, 10.00%, 12/01/13 | | Luxembourg | | | 1,700,000 | | | 1,779,866 |
Nextel Communications Inc., senior note, 9.375%, 11/15/09 | | United States | | | 500,000 | | | 547,500 |
Nextel Communications Inc., senior note, 7.375%, 8/01/15 | | United States | | | 2,500,000 | | | 2,700,000 |
Nextel Partners Inc., senior note, 12.50%, 11/15/09 | | United States | | | 280,000 | | | 326,200 |
Rural Cellular Corp., senior note, 9.875%, 2/01/10 | | United States | | | 1,700,000 | | | 1,819,000 |
Time Warner Telecom Inc., senior note, 10.125%, 2/01/11 | | United States | | | 800,000 | | | 856,000 |
Triton PCS Inc., senior note, 8.50%, 6/01/13 | | United States | | | 1,700,000 | | | 1,836,000 |
US West Communications Inc., 6.875%, 9/15/33 | | United States | | | 2,400,000 | | | 2,292,000 |
bWorldCom Inc. WorldCom Group, senior note, 6.95%, 8/15/06 | | United States | | | 2,700,000 | | | 2,193,750 |
| | | | | | | |
|
|
| | | | | | | | | 20,645,861 |
| | | | | | | |
|
|
FSI-7
FRANKLIN TEMPLETON VARIABLE INSURANCE PRODUCTS TRUST
FRANKLIN STRATEGIC INCOME SECURITIES FUND
Statement of Investments, December 31, 2003 (cont.)
| | | | | | | | |
| | | COUNTRY | | PRINCIPAL
AMOUNTd | | VALUE |
|
| | | | | | | | | |
Bonds (cont.) | | | | | | | | |
Consumer Durables 1.7% | | | | | | | | |
D.R. Horton Inc., senior note, 8.50%, 4/15/12 | | United States | | $ | 2,200,000 | | $ | 2,497,000 |
General Motors, 8.25%, 7/15/23 | | United States | | | 1,300,000 | | | 1,479,815 |
General Motors, 8.375%, 7/15/33 | | United States | | | 1,000,000 | | | 1,164,303 |
Simmons, senior sub. note, 144A, 7.875%, 1/15/14 | | United States | | | 1,100,000 | | | 1,111,000 |
| | | | | | | |
|
|
| | | | | | | | | 6,252,118 |
| | | | | | | |
|
|
Consumer Non-Durables 1.6% | | | | | | | | |
Philip Morris Cos. Inc., 7.75%, 1/15/27 | | United States | | | 1,600,000 | | | 1,731,150 |
Revlon Consumer Products Corp., senior note, 9.00%, 11/01/06 | | United States | | | 1,200,000 | | | 792,000 |
Smithfield Foods Inc., senior note, 7.75%, 5/15/13 | | United States | | | 1,700,000 | | | 1,776,500 |
Tyson Foods Inc., senior note, 8.25%, 10/01/11 | | United States | | | 1,200,000 | | | 1,393,516 |
| | | | | | | |
|
|
| | | | | | | | | 5,693,166 |
| | | | | | | |
|
|
Consumer Services 9.9% | | | | | | | | |
Advanstar Communications, senior secured note, 144A, 10.75%, 8/15/10 | | United States | | | 190,000 | | | 2,066,250 |
AOL Time Warner Inc., 6.75%, 4/15/11 | | United States | | | 2,000,000 | | | 2,237,828 |
Aztar Corp., senior sub. note, 9.00%, 8/15/11 | | United States | | | 1,100,000 | | | 1,212,750 |
CanWest Media Inc., senior sub. note, 10.625%, 5/15/11 | | Canada | | | 700,000 | | | 801,500 |
CanWest Media Inc., senior note, 7.625%, 4/15/13 | | Canada | | | 1,000,000 | | | 1,100,000 |
Cendant Corp., senior note, 7.375%, 4/15/13 | | United States | | | 1,500,000 | | | 1,722,930 |
bCentury Communications Corp., senior disc. note, B, zero cpn., 1/15/08 | | United States | | | 700,000 | | | 430,500 |
Charter Communications Holdings II, senior note, 144A, 10.25%, 9/15/10 | | United States | | | 2,000,000 | | | 2,110,000 |
Charter Communications Holdings LLC, senior disc. note, zero cpn. to 4/01/04,
9.92% thereafter, 4/01/11 | | United States | | | 600,000 | | | 516,000 |
CSC Holdings Inc., senior deb., 7.625%, 7/15/18 | | United States | | | 1,900,000 | | | 2,004,500 |
Dex Media East LLC, senior note, B, 12.125%, 11/15/12 | | United States | | | 1,000,000 | | | 1,235,000 |
Dex Media West LLC, senior sub. note, 144A, 9.875% 8/15/13 | | United States | | | 900,000 | | | 1,050,750 |
DIRECTV Holdings/Finance, senior note, 8.375%, 3/15/13 | | United States | | | 1,800,000 | | | 2,097,000 |
EchoStar DBS Corp., senior note, 10.375%, 10/01/07 | | United States | | | 1,200,000 | | | 1,321,500 |
EchoStar DBS Corp., senior note, 144A, 6.375%, 10/01/11 | | United States | | | 1,400,000 | | | 1,442,000 |
Gaylord Entertainment Co, senior note, 144A, 8.00%, 11/15/03 | | United States | | | 600,000 | | | 636,000 |
Hollywood Park, senior sub. note, B, 9.25%, 2/15/07 | | United States | | | 1,900,000 | | | 1,976,000 |
Lin Television Corp., senior note, 8.00%, 1/15/08 | | United States | | | 1,100,000 | | | 1,186,625 |
Lin Television Corp., senior sub. note, 144A, 6.50%, 5/15/13 | | United States | | | 1,000,000 | | | 1,005,000 |
Meristar Hospitality Corp., senior note, 10.50%, 6/15/09 | | United States | | | 1,100,000 | | | 1,199,000 |
Park Place Entertainment Corp., senior sub. note, 9.375%, 02/15/07 | | United States | | | 2,400,000 | | | 2,730,000 |
Quebecor Media Inc., senior disc. note, zero cpn. to 7/15/06, 13.75% thereafter, 7/15/11 | | Canada | | | 1,700,000 | | | 1,506,625 |
Royal Caribbean Cruises Ltd., senior deb., 7.25%, 3/15/18 | | United States | | | 2,300,000 | | | 2,254,000 |
Six Flags Inc., senior note, 8.875%, 2/01/10 | | United States | | | 1,400,000 | | | 1,443,750 |
Station Casinos Inc., senior sub. note, 9.875%, 7/01/10 | | United States | | | 400,000 | | | 442,000 |
| | | | | | | |
|
|
| | | | | | | | | 35,727,508 |
| | | | | | | |
|
|
Electronic Technology 1.0% | | | | | | | | |
Flextronics International Ltd., senior sub. note, 6.50%, 5/15/13 | | Singapore | | | 2,400,000 | | | 2,496,000 |
Semiconductor Note Part, jr sub. note, 144A, zero cpn., 8/04/11 | | United States | | | 1,100,000 | | | 1,226,500 |
| | | | | | | |
|
|
| | | | | | | | | 3,722,500 |
| | | | | | | |
|
|
FSI-8
FRANKLIN TEMPLETON VARIABLE INSURANCE PRODUCTS TRUST
FRANKLIN STRATEGIC INCOME SECURITIES FUND
Statement of Investments, December 31, 2003 (cont.)
| | | | | | | | |
| | | COUNTRY | | PRINCIPAL
AMOUNTd | | VALUE |
|
| | | | | | | | | |
Bonds (cont.) | | | | | | | | |
Energy Minerals 1.1% | | | | | | | | |
Peabody Energy Corp., senior note, B, 6.875%, 3/15/13 | | United States | | $ | 2,100,000 | | $ | 2,226,000 |
Westport Resources Corp., senior sub. note, 8.25%, 11/01/11 | | United States | | | 1,300,000 | | | 1,436,500 |
Westport Resources Corp., senior sub. note, 144A, 8.25%, 11/01/11 | | United States | | | 400,000 | | | 442,000 |
| | | | | | | |
|
|
| | | | | | | | | 4,104,500 |
| | | | | | | |
|
|
Finance 3.1% | | | | | | | | |
Boston Properties Inc., senior note, 5.00%, 6/01/15 | | United States | | | 2,000,000 | | | 1,914,240 |
Citigroup Inc., sub. note, 5.625%, 8/27/12 | | United States | | | 1,000,000 | | | 1,057,452 |
Forest City Enterprises., senior note, 7.625%, 6/01/15 | | United States | | | 1,500,000 | | | 1,599,375 |
General Electric Capital Corp., 6.75%, 3/15/32 | | United States | | | 1,500,000 | | | 1,666,201 |
Host Marriott LP, senior note, 9.25%, 10/01/07 | | United States | | | 2,000,000 | | | 2,245,000 |
JP Morgan Chase & Co., sub. note, 5.75%, 1/02/13 | | United States | | | 1,800,000 | | | 1,901,416 |
Willis Corroon Corp., senior sub. note, 9.00%, 2/01/09 | | United Kingdom | | | 900,000 | | | 949,500 |
| | | | | | | |
|
|
| | | | | | | | | 11,333,184 |
| | | | | | | |
|
|
Health Services 1.4% | | | | | | | | |
Healthsouth Corp., senior note, 8.50%, 2/01/08 | | United States | | | 1,600,000 | | | 1,544,000 |
bMagellan Health Services Inc., senior sub. note, 9.00%, 2/15/08 | | United States | | | 600,000 | | | 447,000 |
Tenet Healthcare Corp., senior note, 6.375%, 12/01/11 | | United States | | | 2,400,000 | | | 2,316,000 |
United Surgical Partners, senior sub. note, 10.00%, 12/15/11 | | United States | | | 800,000 | | | 912,000 |
| | | | | | | |
|
|
| | | | | | | | | 5,219,000 |
| | | | | | | |
|
|
Health Technology .3% | | | | | | | | |
Wyeth, 6.45%, 2/01/24 | | United States | | | 1,000,000 | | | 1,027,703 |
| | | | | | | |
|
|
Industrial Services 2.1% | | | | | | | | |
Allied Waste North America Inc., senior secured note, 144A, 6.50%, 11/15/10 | | United States | | | 2,000,000 | | | 2,060,000 |
Grant Prideco Escrow, senior note, 9.00%, 12/15/09 | | United States | | | 1,100,000 | | | 1,215,500 |
Great Lakes Dredge & Dock, senior sub. note, 144A, 7.75%, 12/15/13 | | United States | | | 300,000 | | | 310,125 |
Hanover Equipment Trust 01, senior secured note, B, 8.75%, 9/01/11 | | United States | | | 2,200,000 | | | 2,343,000 |
URS Corp., senior note, 11.50%, 9/15/09 | | United States | | | 1,400,000 | | | 1,590,750 |
| | | | | | | |
|
|
| | | | | | | | | 7,519,375 |
| | | | | | | |
|
|
Non-Energy Minerals .8% | | | | | | | | |
Century Aluminum Co., first mortgage, 11.75%, 4/15/08 | | United States | | | 1,800,000 | | | 2,016,000 |
Oregon Steel Mills Inc., first mortgage, 10.00%, 7/15/09 | | United States | | | 1,100,000 | | | 970,750 |
| | | | | | | |
|
|
| | | | | | | | | 2,986,750 |
| | | | | | | |
|
|
Process Industries 5.2% | | | | | | | | |
Buckeye Technologies Inc., senior note, 144A, 8.50%, 10/01/13 | | United States | | | 1,400,000 | | | 1,505,000 |
Consolidated Container Co. LLC, senior disc. note, 10.125%, 7/15/09 | | United States | | | 900,000 | | | 549,000 |
Georgia-Pacific Corp., senior note, 9.375%, 2/01/13 | | United States | | | 2,100,000 | | | 2,425,500 |
Graham Packaging Co., senior sub. note, B, 8.75%, 1/15/08 | | United States | | | 900,000 | | | 924,750 |
Graham Packaging Co., senior sub. note, 144A, 8.75%, 1/15/08 | | United States | | | 800,000 | | | 822,000 |
Graham Packaging Co., senior disc. note, B, 10.75%, 1/15/09 | | United States | | | 400,000 | | | 415,000 |
Huntsman ICI Chemicals, senior disc. note, zero cpn., 12/31/09 | | United States | | | 3,500,000 | | | 1,706,250 |
IMC Global Inc., senior note, 144A, 10.875%, 8/01/13 | | United States | | | 2,100,000 | | | 2,310,000 |
Lyondell Chemical Co., senior secured note, B, 9.875%, 5/01/07 | | United States | | | 1,000,000 | | | 1,060,000 |
Lyondell Chemical Co., senior secured note, 10.50%, 6/01/13 | | United States | | | 1,400,000 | | | 1,533,000 |
Nalco Co., senior sub. note, 144A, 8.875%, 11/15/13 | | United States | | | 1,700,000 | | | 1,810,500 |
Owens-Illinois Inc., senior note, 7.80%, 5/15/18 | | United States | | | 2,300,000 | | | 2,389,125 |
Stone Container Corp., senior note, 8.375%, 7/01/12 | | United States | | | 1,200,000 | | | 1,308,000 |
| | | | | | | |
|
|
| | | | | | | | | 18,758,125 |
| | | | | | | |
|
|
FSI-9
FRANKLIN TEMPLETON VARIABLE INSURANCE PRODUCTS TRUST
FRANKLIN STRATEGIC INCOME SECURITIES FUND
Statement of Investments, December 31, 2003 (cont.)
| | | | | | | | |
| | | COUNTRY | | PRINCIPAL
AMOUNTd | | VALUE |
|
| | | | | | | | | |
Bonds (cont.) | | | | | | | | |
Producer Manufacturing 3.8% | | | | | | | | |
Case New Holland Inc., senior note, 144A, 9.25%, 8/01/11 | | United States | | $ | 2,000,000 | | $ | 2,250,000 |
Case New Holland Inc., senior note, 144A, 9.25%, 8/01/11 | | United States | | | 500,000 | | | 562,500 |
Cummins Inc., senior note, 144A, 9.50%, 12/01/10 | | United States | | | 1,700,000 | | | 1,967,750 |
Hutchison Whampoa International Ltd., senior note, 144A, 6.25%, 1/24/14 | | Hong Kong | | | 2,500,000 | | | 2,544,105 |
Fimep SA, senior note, 10.50%, 2/15/13 | | France | | | 1,700,000 | | | 1,983,475 |
Motors & Gears, senior note, 10.75%, 11/15/06 | | United States | | | 1,300,000 | | | 1,111,500 |
Norcraft Cos./Finance, senior sub. note, 144A, 9.00%, 11/01/11 | | United States | | | 800,000 | | | 868,000 |
TRW Automotive Inc., senior note, 9.375%, 2/15/13 | | United States | | | 1,300,000 | | | 1,491,750 |
TRW Automotive Inc., senior sub. note, 11.00%, 2/15/13 | | United States | | | 700,000 | | | 827,750 |
| | | | | | | |
|
|
| | | | | | | | | 13,606,830 |
| | | | | | | |
|
|
Retail Trade 1.2% | | | | | | | | |
Delhaize America Inc., 9.00%, 4/15/31 | | United States | | | 1,600,000 | | | 1,952,000 |
Kroger Co., senior note, 6.80%, 4/01/11 | | United States | | | 700,000 | | | 784,557 |
Rite Aid Corp., 7.70%, 2/15/27 | | United States | | | 1,800,000 | | | 1,656,000 |
| | | | | | | |
|
|
| | | | | | | | | 4,392,557 |
| | | | | | | |
|
|
Transportation 1.2% | | | | | | | | |
CP Ships Ltd., senior note, 10.375%, 7/15/12 | | United Kingdom | | | 1,300,000 | | | 1,514,500 |
Laidlaw International Inc., senior note, 144A, 10.75%, 6/15/11 | | United States | | | 1,400,000 | | | 1,589,000 |
United Air Lines, 7.73%, 7/01/10 | | United States | | | 1,700,000 | | | 1,407,610 |
| | | | | | | |
|
|
| | | | | | | | | 4,511,110 |
| | | | | | | |
|
|
Utilities 4.3% | | | | | | | | |
AES Corp., senior secured note, 144A, 9.00%, 5/15/15 | | United States | | | 1,900,000 | | | 2,156,500 |
Calpine Corp., senior secured note, 144A, 8.75%, 7/15/13 | | United States | | | 2,200,000 | | | 2,156,000 |
CMS Energy Corp., senior note, 7.50%, 1/15/09 | | United States | | | 2,000,000 | | | 2,070,000 |
Dynegy Holdings Inc., senior note, 8.75%, 2/15/12 | | United States | | | 2,200,000 | | | 2,230,250 |
Edison Mission, 9.875%, 4/15/11 | | United States | | | 1,100,000 | | | 1,149,500 |
Firstenergy Corp., senior note, 7.375%, 11/15/31 | | United States | | | 1,700,000 | | | 1,745,298 |
Utilicorp United Inc., senior note, 9.95%, 2/01/11 | | United States | | | 1,900,000 | | | 2,037,750 |
Williams Cos., senior note, 8.625%, 6/01/10 | | United States | | | 1,600,000 | | | 1,804,000 |
| | | | | | | |
|
|
| | | | | | | | | 15,349,298 |
| | | | | | | |
|
|
Total Bonds (Cost $153,532,664) | | | | | | | | 165,100,585 |
| | | | | | | |
|
|
Convertible Bonds 1.6% | | | | | | | | |
Consumer Services .4% | | | | | | | | |
bAdelphia Communications Corp., junior sub. note, cvt., 6.00%, 2/15/06 | | United States | | | 450,000 | | | 198,000 |
Liberty Media Corp. into Motorola, senior deb., cvt., 3.50%, 1/15/31 | | United States | | | 1,700,000 | | | 1,432,250 |
| | | | | | | |
|
|
| | | | | | | | | 1,630,250 |
| | | | | | | |
|
|
Electronic Technology 1.2% | | | | | | | | |
Fairchild Semiconductor Corp., cvt., 5.00%, 11/01/08 | | United States | | | 1,100,000 | | | 1,215,500 |
Nortel Networks Corp., senior note, cvt., 4.25%, 9/01/08 | | Canada | | | 2,200,000 | | | 2,092,750 |
SCI Systems Inc., cvt., sub. note, 3.00%, 3/15/07 | | United States | | | 1,000,000 | | | 950,000 |
| | | | | | | |
|
|
| | | | | | | | | 4,258,250 |
| | | | | | | |
|
|
Total Convertible Bonds (Cost $5,413,150) | | | | | | | | 5,888,500 |
| | | | | | | |
|
|
FSI-10
FRANKLIN TEMPLETON VARIABLE INSURANCE PRODUCTS TRUST
FRANKLIN STRATEGIC INCOME SECURITIES FUND
Statement of Investments, December 31, 2003 (cont.)
| | | | | | | | |
| | | COUNTRY | | PRINCIPAL
AMOUNTd | | VALUE |
|
| | | | | | | | | |
Other Mortgages/Asset Backed Securities 1.3% | | | | | | | | |
Centex Home Equity Loan Trust, 1999-1, A4, 6.39%, 10/25/27 | | United States | | $ | 318,238 | | $ | 329,820 |
Chase Funding Mortgage, Loan Asset Backed Certificates, CFAB, 2003-6, 4.499%, 8/25/2030 | | United States | | | 2,200,000 | | | 2,202,967 |
Green Tree Financial Corp., 1993-4, B1, 7.20%, 1/15/19 | | United States | | | 16,819 | | | 17,025 |
Keystone Owner Trust, 1997-P3, M2, 144A, 7.98%, 12/25/24 | | United States | | | 165,195 | | | 168,675 |
Morgan Stanley, 2003-HB1, D, 144A, 5.50%, 4/15/11 | | United States | | | 792,000 | | | 759,330 |
Residential Asset Securities Corp., 2002-KS8, A4, 4.58%, 11/25/30 | | United States | | | 1,000,000 | | | 1,023,018 |
| | | | | | | |
|
|
Total Other Mortgages/Asset Backed Securities (Cost $4,453,423) | | | | | | | | 4,500,835 |
| | | | | | | |
|
|
U.S. Government and Agency Securities 15.1% | | | | | | | | |
Other U.S. Government and Agencies Securities 2.6% | | | | | | | | |
FHLMC, 2.375%, 4/15/06 | | United States | | | 1,700,000 | | | 1,707,652 |
FHLMC, 2.875%, 12/15/06 | | United States | | | 1,430,000 | | | 1,441,266 |
FHLMC, 7.00%, 3/15/10 | | United States | | | 300,000 | | | 350,523 |
FHLMC, 5.50%, 9/15/11 | | United States | | | 300,000 | | | 323,049 |
FHLMC, 4.50%, 1/15/13 | | United States | | | 1,580,000 | | | 1,574,911 |
FNMA, 6.00%, 12/15/05 | | United States | | | 500,000 | | | 538,689 |
FNMA, 5.25%, 6/15/06 | | United States | | | 900,000 | | | 963,310 |
FNMA, 5.00%, 1/15/07 | | United States | | | 900,000 | | | 961,389 |
FNMA, 5.25%, 1/15/09 | | United States | | | 250,000 | | | 269,359 |
FNMA, 6.625%, 11/15/10 | | United States | | | 350,000 | | | 402,706 |
FNMA, 6.00%, 05/15/11 | | United States | | | 500,000 | | | 555,003 |
FNMA, 6.625%, 11/15/30 | | United States | | | 300,000 | | | 342,206 |
| | | | | | | |
|
|
| | | | | | | | | 9,430,063 |
| | | | | | | |
|
|
U.S. Government Agencies/Mortgages 10.7% | | | | | | | | |
FHLMC, 6.50%, 5/01/16 | | United States | | | 67,998 | | | 72,044 |
FHLMC, 6.00%, 5/01/17 | | United States | | | 119,795 | | | 125,746 |
FHLMC, 5.50%, 7/01/17 | | United States | | | 238,871 | | | 247,837 |
FHLMC, 5.50%, 9/01/17 | | United States | | | 256,006 | | | 265,615 |
FHLMC, 5.00%, 12/01/17 | | United States | | | 368,238 | | | 375,493 |
FHLMC, 4.50%, 10/01/18 | | United States | | | 497,549 | | | 498,224 |
cFHLMC, 4.50%, 1/01/19 | | United States | | | 1,500,000 | | | 1,500,000 |
FHLMC, 7.00%, 9/01/21 | | United States | | | 418,768 | | | 443,822 |
FHLMC, 6.50%, 12/01/23 | | United States | | | 82,218 | | | 86,610 |
FHLMC, 6.50%, 11/01/27 | | United States | | | 426,250 | | | 448,481 |
FHLMC, 7.50%, 3/01/30 | | United States | | | 18,302 | | | 19,659 |
FHLMC, 7.00%, 4/01/30 | | United States | | | 113,102 | | | 119,794 |
FHLMC, 7.50%, 8/01/30 | | United States | | | 5,648 | | | 6,068 |
FHLMC, 7.50%, 7/01/31 | | United States | | | 42,745 | | | 45,917 |
FHLMC, 6.50%, 10/01/31 | | United States | | | 202,518 | | | 212,188 |
FHLMC, 7.00%, 1/01/32 | | United States | | | 171,700 | | | 181,720 |
FHLMC, 6.50%, 6/01/32 | | United States | | | 194,669 | | | 203,980 |
FHLMC, 7.00%, 6/01/32 | | United States | | | 145,111 | | | 153,579 |
FHLMC, 6.50%, 7/01/32 | | United States | | | 372,079 | | | 389,874 |
FHLMC, 6.00%, 1/01/33 | | United States | | | 4,788,934 | | | 4,952,348 |
FHLMC, 5.50%, 3/01/33 | | United States | | | 453,372 | | | 459,235 |
FHLMC, 5.00%, 5/01/33 | | United States | | | 474,907 | | | 469,163 |
FHLMC, 5.00%, 6/01/33 | | United States | | | 398,460 | | | 393,640 |
FHLMC, 5.50%, 6/01/33 | | United States | | | 1,433,421 | | | 1,451,918 |
FHLMC, 5.00%, 7/01/33 | | United States | | | 158,824 | | | 156,903 |
FHLMC, 5.50%, 7/01/33 | | United States | | | 1,643,582 | | | 1,664,792 |
FHLMC, 5.00%, 9/01/33 | | United States | | | 841,275 | | | 831,100 |
FSI-11
FRANKLIN TEMPLETON VARIABLE INSURANCE PRODUCTS TRUST
FRANKLIN STRATEGIC INCOME SECURITIES FUND
Statement of Investments, December 31, 2003 (cont.)
| | | | | | | | |
| | | COUNTRY | | PRINCIPAL
AMOUNTd | | VALUE |
|
| | | | | | | | | |
U.S. Government and Agency Securities (cont.) | | | | | | | | |
U.S. Government Agencies/Mortgages (cont.) | | | | | | | | |
FHLMC, 5.00%, 10/01/33 | | United States | | $ | 2,405,839 | | $ | 2,376,739 |
FHLMC, 5.50%, 10/01/33 | | United States | | | 719,060 | | | 728,339 |
FHLMC, 5.50%, 11/01/33 | | United States | | | 499,691 | | | 506,139 |
cFHLMC, 5.00%, 1/01/34 | | United States | | | 1,300,000 | | | 1,283,344 |
FNMA, 7.00%, 5/01/12 | | United States | | | 16,566 | | | 17,706 |
FNMA, 6.00%, 4/01/16 | | United States | | | 25,079 | | | 26,341 |
FNMA, 6.00%, 7/01/16 | | United States | | | 110,848 | | | 116,428 |
FNMA, 5.50%, 10/01/16 | | United States | | | 29,511 | | | 30,628 |
FNMA, 5.00%, 10/01/17 | | United States | | | 244,288 | | | 249,524 |
FNMA, 5.50%, 12/01/17 | | United States | | | 244,781 | | | 254,005 |
FNMA, 5.00%, 6/01/18 | | United States | | | 1,867,288 | | | 1,907,485 |
FNMA, 6.50%, 6/01/28 | | United States | | | 713,325 | | | 747,123 |
FNMA, 7.00%, 2/01/29 | | United States | | | 38,692 | | | 41,048 |
FNMA, 6.50%, 5/01/31 | | United States | | | 181,185 | | | 189,551 |
FNMA, 6.50%, 8/01/31 | | United States | | | 59,935 | | | 62,704 |
FNMA, 7.50%, 9/01/31 | | United States | | | 130,936 | | | 139,957 |
FNMA, 6.50%, 12/01/31 | | United States | | | 207,457 | | | 217,041 |
FNMA, 7.00%, 1/01/32 | | United States | | | 39,710 | | | 42,057 |
FNMA, 6.50%, 4/01/32 | | United States | | | 139,731 | | | 146,201 |
FNMA, 6.50%, 6/01/32 | | United States | | | 50,855 | | | 53,210 |
FNMA, 6.50%, 8/01/32 | | United States | | | 616,266 | | | 644,793 |
FNMA, 6.50%, 9/01/32 | | United States | | | 146,193 | | | 152,947 |
FNMA, 6.00%, 4/01/33 | | United States | | | 948,474 | | | 981,125 |
FNMA, 5.00%, 6/01/33 | | United States | | | 942,475 | | | 933,431 |
FNMA, 5.50%, 8/01/33 | | United States | | | 647,212 | | | 656,171 |
FNMA, 5.50%, 11/01/33 | | United States | | | 1,980,035 | | | 2,007,443 |
GNMA, 7.50%, 1/20/28 | | United States | | | 100,776 | | | 107,452 |
GNMA, 7.00%, 10/15/28 | | United States | | | 529,089 | | | 564,962 |
GNMA, 7.00%, 2/15/29 | | United States | | | 52,045 | | | 55,522 |
GNMA, 7.50%, 9/15/30 | | United States | | | 21,241 | | | 22,805 |
GNMA, 6.50%, 4/15/31 | | United States | | | 34,222 | | | 36,041 |
GNMA, 6.50%, 11/15/31 | | United States | | | 89,273 | | | 94,196 |
GNMA, 6.50%, 1/20/32 | | United States | | | 522,884 | | | 550,391 |
GNMA, 6.50%, 2/15/32 | | United States | | | 29,186 | | | 30,780 |
GNMA, 6.50%, 2/20/32 | | United States | | | 223,694 | | | 235,461 |
GNMA, 7.50%, 4/20/32 | | United States | | | 455,357 | | | 485,095 |
GNMA, 6.50%, 5/20/32 | | United States | | | 71,151 | | | 74,894 |
GNMA, 7.00%, 6/15/32 | | United States | | | 123,053 | | | 131,175 |
GNMA, 5.50%, 1/15/33 | | United States | | | 255,338 | | | 259,935 |
GNMA, 6.00%, 1/15/33 | | United States | | | 787,500 | | | 819,394 |
GNMA, 6.50%, 1/20/33 | | United States | | | 327,494 | | | 344,728 |
GNMA, 7.00%, 2/20/33 | | United States | | | 2,439,618 | | | 2,592,997 |
GNMA, 5.50%, 6/15/33 | | United States | | | 1,015,115 | | | 1,033,388 |
GNMA, 5.00%, 9/15/33 | | United States | | | 299,006 | | | 296,051 |
GNMA, 5.00%, 11/20/33 | | United States | | | 717,845 | | | 710,703 |
GNMA, SF, 8.00%, 6/15/26 | | United States | | | 19,432 | | | 21,215 |
| | | | | | | |
|
|
| | | | | | | | | 38,754,415 |
| | | | | | | |
|
|
FSI-12
FRANKLIN TEMPLETON VARIABLE INSURANCE PRODUCTS TRUST
FRANKLIN STRATEGIC INCOME SECURITIES FUND
Statement of Investments, December 31, 2003 (cont.)
| | | | | | | | | |
| | | COUNTRY | | PRINCIPAL
AMOUNTd | | | VALUE |
|
| | | | | | | | | | |
U.S. Government and Agency Securities (cont.) | | | | | | | | | |
U.S. Government Securities 1.8% | | | | | | | | | |
U.S. Treasury Bond, 5.375%, 2/15/31 | | United States | | $ | 500,000 | | | $ | 521,582 |
U.S. Treasury Bond, 6.125%, 11/15/27 | | United States | | | 150,000 | | | | 169,160 |
U.S. Treasury Note, 1.625%,10/31/05 | | United States | | | 700,000 | | | | 699,126 |
U.S. Treasury Note, 2.00%, 5/15/06 | | United States | | | 1,000,000 | | | | 1,000,508 |
U.S. Treasury Note, 3.00%, 11/15/07 | | United States | | | 1,500,000 | | | | 1,513,361 |
U.S. Treasury Note, 4.00%, 11/15/12 | | United States | | | 150,000 | | | | 148,606 |
U.S. Treasury Note, 4.375%, 8/15/12 | | United States | | | 1,570,000 | | | | 1,601,646 |
U.S. Treasury Note, 5.625%, 5/15/08 | | United States | | | 600,000 | | | | 664,828 |
| | | | | | | | |
|
|
| | | | | | | | | | 6,318,817 |
| | | | | | | | |
|
|
Total U.S. Government and Agency Securities (Cost $54,079,332) | | | | | | | | | 54,503,295 |
| | | | | | | | |
|
|
Foreign Government and Agency Securities 30.4% | | | | | | | | | |
New South Wales Treasury Corp., 6.50%, 5/01/06 | | Australia | | | 983,000 | AUD | | | 755,231 |
New South Wales Treasury Corp., 8.00%, 3/01/08 | | Australia | | | 1,321,000 | AUD | | | 1,079,587 |
New South Wales Treasury Corp., 6.00%, 5/01/12 | | Australia | | | 1,570,000 | AUD | | | 1,196,288 |
Queensland Treasury Corp., 6.00%, 7/14/09 | | Australia | | | 3,820,000 | AUD | | | 2,927,823 |
Queensland Treasury Corp., 6.00%, 8/14/13 | | Australia | | | 1,220,000 | AUD | | | 934,558 |
Republic of Austria, 4.00%, 7/15/09 | | Austria | | | 700,000 | EUR | | | 896,176 |
Republic of Austria, 5.00%, 7/15/12 | | Austria | | | 40,000 | EUR | | | 53,301 |
Republic of Austria, 4.65%, 1/15/18 | | Austria | | | 1,500,000 | EUR | | | 1,900,921 |
Kingdom of Belgium, 4.75%, 9/28/06 | | Belgium | | | 100,000 | EUR | | | 131,981 |
Kingdom of Belgium, 7.50%, 7/29/08 | | Belgium | | | 146,000 | EUR | | | 214,746 |
Kingdom of Belgium, 5.00%, 9/28/12 | | Belgium | | | 790,000 | EUR | | | 1,051,573 |
Republic of Bulgaria, 144A, 8.25%, 1/15/15 | | Bulgaria | | | 1,078,000 | | | | 1,276,999 |
Republic of Bulgaria, Reg S, 8.25%, 1/15/15 | | Bulgaria | | | 270,000 | | | | 320,706 |
Government of Canada, 5.25%, 6/01/12 | | Canada | | | 160,000 | CAD | | | 129,860 |
Republic of Colombia, 10.00%, 1/23/12 | | Colombia | | | 320,000 | | | | 351,301 |
Republic of Columbia, 10.75%, 1/15/13 | | Colombia | | | 640,000 | | | | 718,752 |
Republic of Colombia, 11.75%, 2/25/20 | | Colombia | | | 1,110,000 | | | | 1,322,958 |
Kingdom of Denmark, 5.00%, 8/15/05 | | Denmark | | | 1,729,000 | DKK | | | 303,644 |
Kingdom of Denmark, 6.00%, 11/15/09 | | Denmark | | | 2,390,000 | DKK | | | 448,898 |
Kingdom of Denmark, 5.00%, 11/15/13 | | Denmark | | | 5,890,000 | DKK | | | 1,039,928 |
Government of Finland, 5.00%, 7/04/07 | | Finland | | | 330,000 | EUR | | | 440,535 |
Government of Finland, 5.75%, 2/23/11 | | Finland | | | 50,000 | EUR | | | 69,867 |
Government of Finland, 5.375%, 7/04/13 | | Finland | | | 1,625,000 | EUR | | | 2,222,897 |
Government of France, 3.00%, 7/12/08 | | France | | | 500,000 | EUR | | | 618,189 |
Government of France, 4.00%, 4/25/09 | | France | | | 1,130,000 | EUR | | | 1,451,625 |
Government of France, 4.00%, 10/25/09 | | France | | | 1,443,000 | EUR | | | 1,844,337 |
Government of France, 4.00%, 4/25/13 | | France | | | 2,365,000 | EUR | | | 2,926,971 |
Bundesrepublik Deutschland Board, 3.75%, 1/04/09 | | Germany | | | 1,070,000 | EUR | | | 1,362,738 |
Federal Republic of Germany, 6.00%, 7/04/07 | | Germany | | | 580,000 | EUR | | | 798,524 |
Federal Republic of Germany, 4.50%, 7/04/09 | | Germany | | | 192,000 | EUR | | | 252,157 |
Federal Republic of Germany, 5.00%, 7/04/11 | | Germany | | | 551,000 | EUR | | | 736,514 |
Hellenic Republic, 6.50%, 10/22/19 | | Greece | | | 1,000,000 | EUR | | | 1,488,711 |
Indonesia Recapital, 14.00%, 6/15/09 | | Indonesia | | | 7,750,000,000 | IDR | | | 954,200 |
Indonesia Recapital, 13.15%, 3/15/10 | | Indonesia | | | 13,925,000,000 | IDR | | | 1,661,576 |
Buoni Poliennali Del Tesoro, 7.75%, 11/01/06 | | Italy | | | 300,000 | EUR | | | 424,495 |
Buoni Poliennali Del Tesoro, 6.75%, 2/01/07 | | Italy | | | 130,000 | EUR | | | 181,357 |
Buoni Poliennali Del Tesoro, 4.50%, 5/01/09 | | Italy | | | 80,000 | EUR | | | 104,854 |
Buoni Poliennali Del Tesoro, 5.50%, 11/01/10 | | Italy | | | 43,000 | EUR | | | 59,116 |
United Mexican States, 8.625%, 3/12/08 | | Mexico | | | 100,000 | | | | 118,150 |
United Mexican States, 10.375%, 2/17/09 | | Mexico | | | 134,000 | | | | 170,012 |
United Mexican States, 9.875%, 2/01/10 | | Mexico | | | 1,612,000 | | | | 2,030,620 |
United Mexican States, 11.375%, 9/15/16 | | Mexico | | | 1,612,000 | | | | 2,293,876 |
FSI-13
FRANKLIN TEMPLETON VARIABLE INSURANCE PRODUCTS TRUST
FRANKLIN STRATEGIC INCOME SECURITIES FUND
Statement of Investments, December 31, 2003 (cont.)
| | | | | | | | | |
| | | COUNTRY | | PRINCIPAL
AMOUNTd | | | VALUE |
|
| | | | | | | | | | |
Foreign Government and Agency Securities (cont.) | | | | | | | | | |
United Mexican States, 8.125%, 12/30/19 | | Mexico | | $ | 2,030,000 | | | $ | 2,272,341 |
United Mexican States, 8.00% 09/24/22 | | Mexico | | | 280,000 | | | | 305,060 |
United Mexican States, 11.50%, 5/15/26 | | Mexico | | | 1,600,000 | | | | 2,324,000 |
Government of Netherlands, 5.75%, 2/15/07 | | Netherlands | | | 170,000 | EUR | | | 231,241 |
Government of Netherlands, 3.75%, 7/15/09 | | Netherlands | | | 80,000 | EUR | | | 101,251 |
Government of Netherlands, 5.00%, 7/15/12 | | Netherlands | | | 250,000 | EUR | | | 333,470 |
Government of Netherlands, 4.25% 7/15/13 | | Netherlands | | | 90,000 | EUR | | | 113,158 |
Government of New Zealand, 8.00%, 11/15/06 | | New Zealand | | | 300,000 | NZD | | | 208,764 |
Government of New Zealand, 7.00%, 7/15/09 | | New Zealand | | | 4,590,000 | NZD | | | 3,176,605 |
Government of New Zealand, 6.00%, 11/15/11 | | New Zealand | | | 1,600,000 | NZD | | | 1,058,231 |
Government of New Zealand, 6.50%, 4/15/13 | | New Zealand | | | 4,010,000 | NZD | | | 2,740,241 |
Kingdom of Norway, 6.75%, 1/15/07 | | Norway | | | 8,725,000 | NOK | | | 1,440,306 |
Kingdom of Norway, 5.50%, 5/15/09 | | Norway | | | 6,800,000 | NOK | | | 1,093,021 |
Republic of Panama, 8.875%, 9/30/27 | | Panama | | | 95,000 | | | | 100,225 |
Republic of Panama, 9.375%, 4/01/29 | | Panama | | | 75,000 | | | | 84,516 |
Republic of Peru, 9.125%, 1/15/08 | | Peru | | | 10,000 | | | | 11,800 |
Republic of Peru, 9.875%, 2/06/15 | | Peru | | | 380,000 | | | | 442,820 |
Republic of Peru, FRN, 5.00%, 3/07/17 | | Peru | | | 190,820 | | | | 178,115 |
Republic of Philippines, 9.875%, 3/16/10 | | Philippines | | | 630,000 | | | | 698,544 |
Republic of Philippines, 9.00%, 2/15/13 | | Philippines | | | 1,370,000 | | | | 1,430,759 |
Republic of Philippines, 10.625%, 3/16/25 | | Philippines | | | 2,542,000 | | | | 2,804,144 |
Federation of Russia, 144A, 12.75%, 6/24/28 | | Russia | | | 140,000 | | | | 222,950 |
Federation of Russia, 5.00%, 3/31/30 | | Russia | | | 5,030,000 | | | | 4,866,525 |
Federation of Russia, Reg S, 11.00%, 7/24/18 | | Russia | | | 840,000 | | | | 1,138,683 |
Federation of Russia, Reg S, 5.00%, 3/31/30 | | Russia | | | 7,105,000 | | | | 6,826,129 |
Korea Treasury Bond, 4.75%, 3/12/08 | | South Korea | | | 8,200,000,000 | KRW | | | 6,926,646 |
Republic of South Africa, 7.375%, 4/25/12 | | South Africa | | | 30,000 | | | | 33,759 |
Republic of South Africa, 8.50%, 6/23/17 | | South Africa | | | 200,000 | | | | 240,750 |
Bonos Y Oblig Del Estado, 3.25%, 1/31/05 | | Spain | | | 573,000 | EUR | | | 730,777 |
Bonos Y Oblig Del Estado, 6.00%, 1/31/08 | | Spain | | | 80,000 | EUR | | | 111,116 |
Bonos Y Oblig Del Estado, 5.15%, 7/30/09 | | Spain | | | 210,000 | EUR | | | 284,374 |
Government of Spain, 10.15%, 1/31/06 | | Spain | | | 58,000 | EUR | | | 84,037 |
Government of Spain, 4.80%, 10/31/06 | | Spain | | | 100,000 | EUR | | | 132,480 |
Government of Spain, 5.00%, 7/30/12 | | Spain | | | 350,000 | EUR | | | 466,461 |
Kingdom of Sweden, 6.00%, 2/09/05 | | Sweden | | | 12,890,000 | SEK | | | 1,849,848 |
Kingdom of Sweden, 3.50%, 4/20/06 | | Sweden | | | 6,400,000 | SEK | | | 891,709 |
Kingdom of Sweden, 6.50%, 5/05/08 | | Sweden | | | 2,400,000 | SEK | | | 366,411 |
Kingdom of Sweden, 5.00%, 1/28/09 | | Sweden | | | 13,685,000 | SEK | | | 1,976,035 |
Kingdom of Sweden, 5.50%, 10/08/12 | | Sweden | | | 21,390,000 | SEK | | | 3,151,536 |
Kingdom of Sweden, 6.75%, 5/05/14 | | Sweden | | | 9,710,000 | SEK | | | 1,562,995 |
Kingdom of Thailand, 6.00%, 3/05/05 | | Thailand | | | 63,500,000 | THB | | | 1,687,850 |
Kingdom of Thailand, 8.50%, 10/14/05 | | Thailand | | | 188,500,000 | THB | | | 5,328,524 |
Kingdom of Thailand, 4.125%, 2/12/08 | | Thailand | | | 17,000,000 | THB | | | 455,564 |
Kingdom of Thailand, 8.50%, 12/08/08 | | Thailand | | | 14,000,000 | THB | | | 446,209 |
Republic of Ukraine, 144A, 7.65%, 6/11/13 | | Ukraine | | | 3,800,000 | | | | 3,957,928 |
cRepublic of Ukraine, Reg S, 11.00%, 3/15/07 | | Ukraine | | | 98,001 | | | | 109,487 |
Ukraine Republic Of, Reg S, 7.65%, 6/11/13 | | Ukraine | | | 2,000,000 | | | | 2,083,120 |
United Kingdom, 7.50%, 12/07/06 | | United Kingdom | | | 332,000 | GBP | | | 643,394 |
Republic of Venezuela, 144A, 10.75%, 9/19/13 | | Venezuela | | | 200,000 | | | | 213,000 |
Republic of Venezuela, 9.25%, 9/15/27 | | Venezuela | | | 2,137,000 | | | | 1,948,014 |
cRepublic of Vietnam, 4.00%, 3/12/16 | | Vietnam | | | 700,000 | | | | 647,500 |
| | | | | | | | |
|
|
Total Foreign Government and Agency Securities (Cost $98,561,433) | | | | | | | | | 109,798,975 |
| | | | | | | | |
|
|
FSI-14
FRANKLIN TEMPLETON VARIABLE INSURANCE PRODUCTS TRUST
FRANKLIN STRATEGIC INCOME SECURITIES FUND
Statement of Investments, December 31, 2003 (cont.)
| | | | | | | | |
| | | COUNTRY | | PRINCIPAL
AMOUNTd | | VALUE |
|
Municipal Bond (Cost $1,816,961) .5% | | | | | | | | |
California St G.O., 5.5, 11/01/33 | | United States | | $ | 1,800,000 | | $ | 1,843,758 |
| | | | | | | |
|
|
Total Long Term Investments (Cost $326,292,464) | | | | | | | | 350,496,704 |
| | | | | | | |
|
|
Short Term Investments (Cost $10,584,979) 2.9% | | | | | | | | |
eFranklin Institutional Fiduciary Trust Money Market Portfolio | | United States | | | 10,584,979 | | | 10,584,979 |
| | | | | | | |
|
|
Total Investments (Cost $336,877,443) 99.8% | | | | | | | | 361,081,683 |
Other Assets, less Liabilities .2% | | | | | | | | 706,386 |
| | | | | | | |
|
|
Net Assets 100.0% | | | | | | | $ | 361,788,069 |
| | | | | | | |
|
|
Currency Abbreviations:
AUD - Australian Dollar
CAD - Canadian Dollar
DKK - Danish Krone
EUR - Euro
GBP - British Pound
IDR - Indonesian Rupiah
KRW - South Korean Won
NOK - Norwegian Krone
NZD - New Zealand Dollar
SEK - Swedish Krona
THB - Thai Baht
| b | The fund discontinues accruing income on defaulted securities. See Note 7. |
| c | See Note 1c regarding securities purchased on a when-issued, delayed delivery, or to-be-announced basis. |
| d | The principal amount is stated in U.S. dollars unless otherwise indicated. |
| e | See Note 6 regarding investments in the Franklin Institutional Fiduciary Trust Money Market Portfolio. |
See notes to financial statements.
FSI-15
FRANKLIN TEMPLETON VARIABLE INSURANCE PRODUCTS TRUST
FRANKLIN STRATEGIC INCOME SECURITIES FUND
Financial Statements
Statement of Assets and Liabilities
December 31, 2003
| | | |
Assets: | | | |
Investments in securities: | | | |
Cost | | $ | 336,877,443 |
| | |
|
|
Value | | | 361,081,683 |
Receivables: | | | |
Capital shares sold | | | 320,598 |
Dividends and Interest | | | 6,219,946 |
| | |
|
|
Total assets | | | 367,622,227 |
| | |
|
|
Liabilities: | | | |
Payables: | | | |
Investment securities purchased | | | 5,615,491 |
Capital shares redeemed | | | 335 |
Affiliates | | | 180,622 |
Other liabilities | | | 37,710 |
| | |
|
|
Total liabilities | | | 5,834,158 |
| | |
|
|
Net assets, at value | | $ | 361,788,069 |
| | |
|
|
Net assets consist of: | | | |
Undistributed net investment income | | $ | 12,709,647 |
Net unrealized appreciation (depreciation) | | | 24,297,301 |
Accumulated net realized gain (loss) | | | 586,184 |
Capital shares | | | 324,194,937 |
| | |
|
|
Net assets, at value | | $ | 361,788,069 |
| | |
|
|
Class 1: | | | |
Net assets, at value | | $ | 359,947,225 |
| | |
|
|
Shares outstanding | | | 29,599,047 |
| | |
|
|
Net asset value and offering price per share | | $ | 12.16 |
| | |
|
|
Class 2: | | | |
Net assets, at value | | $ | 1,840,844 |
| | |
|
|
Shares outstanding | | | 152,749 |
| | |
|
|
Net asset value and offering price per share | | $ | 12.05 |
| | |
|
|
See notes to financial statements.
FSI-16
FRANKLIN TEMPLETON VARIABLE INSURANCE PRODUCTS TRUST
FRANKLIN STRATEGIC INCOME SECURITIES FUND
Financial Statements (continued)
Statement of Operations
for the year ended December 31, 2003
| | | |
Investment income: | | | |
Dividends | | $ | 536,552 |
Interest | | | 13,401,094 |
| | |
|
|
Total investment income | | | 13,937,646 |
| | |
|
|
Expenses: | | | |
Management fees (Note 3) | | | 878,257 |
Administrative fees (Note 3) | | | 438,471 |
Distribution fees - Class 2 (Note 3) | | | 1,617 |
Transfer agent fees | | | 1,590 |
Custodian fees | | | 32,166 |
Reports to shareholders | | | 29,273 |
Professional fees | | | 21,046 |
Trustees’ fees and expenses | | | 2,512 |
Other | | | 22,509 |
| | |
|
|
Total expenses | | | 1,427,441 |
| | |
|
|
Net investment income | | | 12,510,205 |
| | |
|
|
Realized and unrealized gains (losses): | | | |
Net realized gain (loss) from: | | | |
Investments | | | 3,664,506 |
Foreign currency transactions | | | 174,104 |
| | |
|
|
Net realized gain (loss) | | | 3,838,610 |
Net unrealized appreciation (depreciation) on: | | | |
Investments | | | 23,091,276 |
Translation of assets and liabilities denominated in foreign currencies | | | 76,209 |
| | |
|
|
Net unrealized appreciation (depreciation) | | | 23,167,485 |
| | |
|
|
Net realized and unrealized gain (loss) | | | 27,006,095 |
| | |
|
|
Net increase (decrease) in net assets resulting from operations | | $ | 39,516,300 |
| | |
|
|
See notes to financial statements.
FSI-17
FRANKLIN TEMPLETON VARIABLE INSURANCE PRODUCTS TRUST
FRANKLIN STRATEGIC INCOME SECURITIES FUND
Financial Statements (continued)
Statements of Changes in Net Assets
for the year ended December 31, 2003 and 2002
| | | | | | | |
| | | 2003 | | | 2002 | |
| | |
| |
Increase (decrease) in net assets: | | | | | | | |
Operations: | | | | | | | |
Net investment income | | $ 12,510,205 | | | $ | 4,811,707 | |
Net realized gain (loss) from investments and foreign currency transactions | | 3,838,610 | | | | (2,129,248 | ) |
Net unrealized appreciation (depreciation) on investments and translation of assets and liabilities denominated in foreign currencies | | 23,167,485 | | | | 2,001,936 | |
| | |
| |
Net increase (decrease) in net assets resulting from operations | | 39,516,300 | | | | 4,684,395 | |
Distributions to shareholders from: | | | | | | | |
Net investment income: | | | | | | | |
Class 1 | | (5,519,539 | ) | | | (29,968 | ) |
Class 2 | | (8,268 | ) | | | (32 | ) |
| | |
| |
Total distributions to shareholders | | (5,527,807) | | | | (30,000 | ) |
Capital share transactions: (Note 2) | | | | | | | |
Class 1 | | 223,318,963 | | | | 54,327,713 | |
Class 2 | | 1,519,523 | | | | 153,014 | |
| | |
| |
Total capital share transactions | | 224,838,486 | | | | 54,480,727 | |
Net increase (decrease) in net assets | | 258,826,979 | | | | 59,135,122 | |
Net assets: | | | | | | | |
Beginning of year | | 102,961,090 | | | | 43,825,968 | |
| | |
| |
End of year | | $361,788,069 | | | $ | 102,961,090 | |
| | |
| |
Undistributed net investment income included in net assets: | | | | | | | |
End of year | | $ 12,709,647 | | | $ | 4,835,092 | |
| | |
| |
See notes to financial statements.
FSI-18
FRANKLIN TEMPLETON VARIABLE INSURANCE PRODUCTS TRUST
FRANKLIN STRATEGIC INCOME SECURITIES FUND
Notes to Financial Statements
1. ORGANIZATION AND SIGNIFICANT ACCOUNTING POLICIES
Franklin Templeton Variable Insurance Products Trust (the Trust) is registered under the Investment Company Act of 1940 as an open-end investment company, consisting of twenty-two separate series (the Funds). Franklin Strategic Income Securities Fund (the Fund) included in this report is non-diversified. Shares of the Fund are sold only to insurance company separate accounts to fund the benefits of variable life insurance policies or variable annuity contracts. As of December 31, 2003, over 99% of the Fund’s shares were sold through one insurance company. The Fund’s investment objective is to obtain a high level of current income while seeking capital appreciation.
The following summarizes the Fund’s significant accounting policies.
a. Security Valuation
Securities listed or traded on a recognized national exchange or NASDAQ are valued at the last reported sales price. Over-the-counter securities and listed securities for which no sale is reported are valued within the range of the latest quoted bid and asked prices. Investments in open-end mutual funds are valued at the closing net asset value. Foreign securities are valued at the close of trading of the foreign exchange or the NYSE, whichever is earlier. If events occur that materially affect the values of securities after the prices or foreign exchange rates are determined, or if market quotations are not readily available, the securities will be valued at fair value as determined following procedures approved by the Board of Trustees.
b. Foreign Currency Translation
Portfolio securities and other assets and liabilities denominated in foreign currencies are translated into U.S. dollars based on the exchange rate of such currencies against U.S. dollars on the date of valuation. Purchases and sales of securities and income items denominated in foreign currencies are translated into U.S. dollars at the exchange rate in effect on the transaction date.
The Fund does not separately report the effect of changes in foreign exchange rates from changes in market prices on securities held. Such changes are included in net realized and unrealized gain or loss from investments.
Realized foreign exchange gains or losses arise from sales of foreign currencies, currency gains or losses realized between the trade and settlement dates on securities transactions and the difference between the recorded amounts of dividends, interest, and foreign withholding taxes and the U.S. dollar equivalent of the amounts actually received or paid. Net unrealized foreign exchange gains and losses arise from changes in foreign exchange rates on foreign denominated assets and liabilities other than investments in securities held at the end of the reporting period.
c. Securities Purchased on a When-Issued, Delayed Delivery, or TBA Basis
The Fund may purchase securities on a when-issued, delayed delivery, or to-be-announced (TBA) basis, with payment and delivery scheduled for a future date. These transactions are subject to market fluctuations and are subject to the risk that the value at delivery may be more or less than the trade date purchase price. Although the Fund will generally purchase these securities with the intention of holding the securities, it may sell the securities before the settlement date. Sufficient assets have been segregated for these securities.
d. Mortgage Dollar Rolls
The Fund enters into mortgage dollar rolls, typically on a TBA basis. Dollar rolls are agreements between the Fund and a financial institution to simultaneously sell and repurchase a mortgage-backed security at a future date. Gains or losses are realized at the time of the sale and the difference between the repurchase price and sale price is recorded as an unrealized gain to the Fund. The risks of mortgage dollar roll transactions include the potential inability of the counterparty to fulfill their obligations.
e. Income Taxes
No provision has been made for income taxes because the Fund’s policy is to qualify as a regulated investment company under the Internal Revenue Code and to distribute substantially all of its taxable income.
FSI-19
FRANKLIN TEMPLETON VARIABLE INSURANCE PRODUCTS TRUST
FRANKLIN STRATEGIC INCOME SECURITIES FUND
Notes to Financial Statements (continued)
1. ORGANIZATION AND SIGNIFICANT ACCOUNTING POLICIES (cont.)
f. Security Transactions, Investment Income, Expenses and Distributions
Security transactions are accounted for on trade date. Realized gains and losses on security transactions are determined on a specific identification basis. Interest income and estimated expenses are accrued daily. Discounts and premiums on securities purchased are amortized over the lives of the respective securities. Dividend income and distributions to shareholders are recorded on the ex-dividend date.
Common expenses incurred by the Trust are allocated among the Funds based on the ratio of net assets of each fund to the combined net assets. Other expenses are charged to each fund on a specific identification basis.
Realized and unrealized gains and losses and net investment income, other than class specific expenses, are allocated daily to each class of shares based upon the relative proportion of net assets of each class.
g. Accounting Estimates
The preparation of financial statements in accordance with accounting principles generally accepted in the United States of America requires management to make estimates and assumptions that affect the reported amounts of assets and liabilities at the date of the financial statements and the amounts of income and expenses during the reporting period. Actual results could differ from those estimates.
h. Guarantees and Indemnifications
Under the Trust’s organizational documents, its officers and trustees are indemnified against certain liability arising out of the performance of their duties to the Trust. Additionally, in the normal course of business, the Trust enters into contracts with service providers that contain general indemnification clauses. The Trust’s maximum exposure under these arrangements is unknown as this would involve future claims that may be made against the Trust that have not yet occurred. However, based on experience, the Trust expects the risk of loss to be remote.
2. SHARES OF BENEFICIAL INTEREST
The Fund offers two classes of shares: Class 1 and Class 2. Each class of shares differs by its distribution fees, voting rights on matters affecting a single class, and its exchange privilege.
At December 31, 2003, there were an unlimited number of shares authorized ($.01 par value). Transactions in the Fund’s shares were as follows:
| | | | | | | | | | | | | | |
| | | Year Ended December 31,
| |
| | | 2003
| | | 2002
| |
| | | Shares
| | | Amount
| | | Shares
| | | Amount
| |
| Class 1 Shares: | | | | | | | | | | | | |
Shares sold | | 19,399,863 | | | $ | 219,913,794 | | | 5,630,598 | | | $ | 56,469,809 | |
Shares issued in reinvestment of distributions | | 479,960 | | | | 5,519,538 | | | 3,021 | | | | 29,968 | |
Shares redeemed | | (188,670 | ) | | | (2,114,369 | ) | | (220,896 | ) | | | (2,172,064 | ) |
| | |
| |
Net increase (decrease) | | 19,691,153 | | | $ | 223,318,963 | | | 5,472,723 | | | $ | 54,327,713 | |
| | |
| |
| Class 2 Shares: | | | | | | | | | | | | |
Shares sold | | 181,906 | | | $ | 2,090,164 | | | 18,004 | | | $ | 177,242 | |
Shares issued in reinvestment of distributions | | 724 | | | | 8,268 | | | 3 | | | | 32 | |
Shares redeemed | | (50,283 | ) | | | (578,909 | ) | | (2,460 | ) | | | (24,260 | ) |
| | |
| |
Net increase (decrease) | | 132,347 | | | $ | 1,519,523 | | | 15,547 | | | $ | 153,014 | |
| | |
| |
FSI-20
FRANKLIN TEMPLETON VARIABLE INSURANCE PRODUCTS TRUST
FRANKLIN STRATEGIC INCOME SECURITIES FUND
Notes to Financial Statements (continued)
3. TRANSACTIONS WITH AFFILIATES
Certain officers and trustees of the Trust are also officers and/or directors of the following entities:
| | |
| Entity | | Affiliation |
|
Franklin Advisers, Inc. (Advisers) | | Investment manager |
Franklin Templeton Services LLC (FT Services) | | Administrative manager |
Franklin/Templeton Distributors, Inc. (Distributors) | | Principal underwriter |
Franklin/Templeton Investor Services LLC (Investor Services) | | Transfer agent |
The Fund pays an investment management fee to Advisers based on the average daily net assets of the Fund as follows:
| | |
| Annualized Fee Rate | | Net Assets |
|
| .425% | | First $500 million |
| .325% | | Over $500 million, up to and including $1 billion |
| .280% | | Over $1 billion, up to and including $1.5 billion |
Fees are further reduced on assets over $1.5 billion.
The Fund pays an administrative fee to FT Services of .20% per year of the Fund’s average daily net assets.
The Fund reimburses Distributors up to .25% per year of the average daily net assets of Class 2 for costs incurred in marketing the Fund’s shares.
Investor Services, under terms of an agreement, performs shareholder servicing for the Fund and is not paid by the Fund for the services.
4. INCOME TAXES
The tax character of distributions paid during the years ended December 31, 2003 and 2002, was as follows:
| | | | | | |
| | | 2003
| | 2002
|
Distribution paid from ordinary income | | $ | 5,527,807 | | $ | 30,000 |
Net investment income (loss) differs for financial statement and tax purposes primarily due to differing treatments of defaulted securities, foreign currency transactions, mortgage dollar rolls, paydown losses, and bond discounts and premiums.
Net realized gains (losses) differ for financial statement and tax purposes primarily due to differing treatments of wash sales, foreign currency transactions, mortgage dollar rolls, paydown losses, and bond discounts and premiums.
FSI-21
FRANKLIN TEMPLETON VARIABLE INSURANCE PRODUCTS TRUST
FRANKLIN STRATEGIC INCOME SECURITIES FUND
Notes to Financial Statements (continued)
4. INCOME TAXES (cont.)
At December 31, 2003, the cost of investments, net unrealized appreciation (depreciation), undistributed ordinary income, and undistributed long term capital gains for income tax purposes was as follows:
| | | | |
Cost of Investments | | $ | 337,539,573 | |
| | |
|
|
|
Unrealized appreciation | | $ | 24,944,158 | |
Unrealized depreciation | | | (1,402,048 | ) |
| | |
|
|
|
Net unrealized appreciation (depreciation) | | $ | 23,542,110 | |
| | |
|
|
|
Undistributed ordinary income | | $ | 13,740,612 | |
Undistributed long-term capital gains | | | 258,001 | |
| | |
|
|
|
Distributable earnings | | $ | 13,998,613 | |
| | |
|
|
|
5. INVESTMENT TRANSACTIONS
Purchases and sales of investments (excluding short-term securities) for the year ended December 31, 2003 aggregated $335,384,810 and $103,414,082 respectively.
6. INVESTMENT IN FRANKLIN INSTITUTIONAL FIDUCIARY TRUST MONEY MARKET PORTFOLIO
The Fund may invest in the Franklin Institutional Fiduciary Trust Money Market Portfolio (the Sweep Money Fund), an open-end investment company managed by Advisers. Management fees paid by the Fund are reduced on assets invested in the Sweep Money Fund, in an amount not to exceed the management fees paid by the Sweep Money Fund. The Fund earned $132,246 of dividend income from investment in the Sweep Money Fund for the year ended December 31, 2003.
7. CREDIT RISK AND DEFAULTED SECURITIES
The Fund has 51.7% of its portfolio invested in below investment grade and comparable quality unrated high yield securities, which tend to be more sensitive to economic conditions than higher rated securities. The risk of loss due to default by the issuer may be significantly greater for the holders of high yielding securities because such securities are generally unsecured and are often subordinated to other creditors of the issuer.
The Fund held defaulted and/or other securities for which the income has been deemed uncollectible. The Fund discontinues accruing income on these securities and provides an estimate for losses on interest receivable. At December 31, 2003, the value of these securities was $3,269,250 representing .9% of the Fund’s net assets. For information as to specific securities see the accompanying Statement of Investments.
8. OTHER CONSIDERATIONS
Advisers, as the Fund’s Manager, may serve as a member of various bondholders’ steering committees, on credit committees, or may represent the Fund in certain corporate restructuring negotiations. Currently the Manager serves in one or more of these capacities for Adelphia Communications, Century Communications, Magellan Health Services, and United Air Lines. As a result of this involvement, Advisers may be in possession of certain material non-public information. If the Fund’s Manager, while in possession on such information, seeks to sell any of its holdings in these securities it will comply with all applicable federal securities laws.
FSI-22
FRANKLIN TEMPLETON VARIABLE INSURANCE PRODUCTS TRUST
FRANKLIN STRATEGIC INCOME SECURITIES FUND
Notes to Financial Statements (continued)
9. REGULATORY MATTERS
On February 4, 2004, the Securities Division of the Office of the Secretary of the Commonwealth of Massachusetts filed an administrative complaint against Franklin Resources, Inc. and certain of its subsidiaries (the “Company”), alleging violations of the Massachusetts Uniform Securities Act. The complaint arises from activity that occurred in 2001 during which time an officer of a Company subsidiary was negotiating an agreement with an investor relating to investments in a mutual fund and a hedge fund.
The Company, in addition to other entities within Franklin Templeton Investments, has been named in shareholder class actions related to the matter described above. The Company believes that the claims made in the lawsuit are without merit and it intends to defend vigorously against the allegations. The Company and the Fund may be named in similar civil actions related to the matter described above.
In addition, as part of ongoing investigations by the U.S. Securities and Exchange Commission (the “SEC”), the U.S. Attorney for the Northern District of California, the New York Attorney General, the California Attorney General, the U.S. Attorney for the District of Massachusetts, the Florida Department of Financial Services, and the Commissioner of Securities and the Attorney General of the State of West Virginia, relating to certain practices in the mutual fund industry, including late trading, market timing and sales compensation arrangements, the Company and its subsidiaries, as well as certain current or former executives and employees of the Company, have received requests for information and/or subpoenas to testify or produce documents. The Company and its current employees are providing documents and information in response to these requests and subpoenas. In addition, the Company has responded to requests for similar kinds of information from regulatory authorities in some of the foreign countries where the Company conducts its global asset management business.
The Staff of the SEC has informed the Company that it intends to recommend that the Commission authorize an action against the Fund’s investment adviser and a senior executive officer relating to the frequent trading issues that are the subject of the SEC’s investigation. These issues were previously disclosed as being under investigation by government authorities and the subject of an internal inquiry by the Company in its Annual Report on Form 10-K and on its public website. The Company currently is in discussions with the SEC Staff in an effort to resolve the issues raised in their investigation. Such discussions are preliminary and the Fund’s management has been advised that the Company cannot predict the likelihood of whether those discussions will result in a settlement and, if so, the terms of such settlement. The impact, if any, of these matters on the Fund is uncertain at this time. If the Company finds that it bears responsibility for any unlawful or improper conduct, it has committed to making the Fund or its shareholders whole, as appropriate.
FSI-23
FRANKLIN TEMPLETON VARIABLE INSURANCE PRODUCTS TRUST
FRANKLIN STRATEGIC INCOME SECURITIES FUND
Independent Auditors’ Report
To the Board of Trustees and Shareholders
of Franklin Templeton Variable Insurance Products Trust
In our opinion, the accompanying statement of assets and liabilities, including the statement of investments, and the related statements of operations and of changes in net assets and the financial highlights present fairly, in all material respects, the financial position of the Franklin Strategic Income Securities Fund (the Fund) (one of the funds constituting the Franklin Templeton Variable Insurance Products Trust) at December 31, 2003, the results of its operations for the year then ended, the changes in its net assets for each of the two years in the period then ended and the financial highlights for each of the periods presented, in conformity with accounting principles generally accepted in the United States of America. These financial statements and financial highlights (hereafter referred to as “financial statements”) are the responsibility of the Fund’s management; our responsibility is to express an opinion on these financial statements based on our audits. We conducted our audits of these financial statements in accordance with auditing standards generally accepted in the United States of America, which require that we plan and perform the audits to obtain reasonable assurance about whether the financial statements are free of material misstatement. An audit includes examining, on a test basis, evidence supporting the amounts and disclosures in the financial statements, assessing the accounting principles used and significant estimates made by management, and evaluating the overall financial statement presentation. We believe that our audits, which included confirmation of securities at December 31, 2003 by correspondence with the custodian and brokers, provide a reasonable basis for our opinion.
PricewaterhouseCoopers LLP
San Francisco, California
February 5, 2004, except for Note 9 as to which the date is February 12, 2004
FSI-24
FRANKLIN U.S. GOVERNMENT FUND
Fund Goal and Primary Investments: Franklin U.S. Government Fund seeks income. The Fund invests primarily in U.S. government securities, primarily fixed and variable rate mortgage-backed securities.
This annual report for Franklin U.S. Government Fund covers the fiscal year ended December 31, 2003.
Performance Overview
You can find the Fund’s one-year total return in the Performance Summary following this report. The Fund’s performance was comparable to that of its benchmarks, the Lehman Brothers Intermediate U.S. Government Bond Index and the Lipper VIP General U.S. Government Funds Objective Average, which returned 2.29% and 2.32% for the year under review.1
Economic and Market Overview
During the year ended December 31, 2003, many factors strongly impacted the U.S. economy and markets. In general, uncertainty about the economy’s strength and geopolitical events pushed interest rates down during the first part of the year. The Iraq conflict weighed heavily on many investors’ minds, which helped interest rates decline. By mid-June, the 10-year U.S. Treasury yield fell to 3.13%, the lowest level in more than four decades. For consumers, historically low mortgage rates enabled many homeowners to refinance their mortgages, and refinancing applications reached their highest levels on record. Prepayments on mortgage-backed securities increased as well. Additionally, the refinancing activity, rising home values and stabilizing equity markets improved consumers’ net worths and allowed them to continue spending, which helped to keep the economy moving forward.
Increases in business spending also helped economic growth. After having been largely absent since the end of 2000, business spending improved in the latter half of 2003. Nonresidential fixed investment increased 12.8% annualized in the third quarter of 2003, the highest increase since the second quarter of 2000. Lower interest rates during the past year allowed many businesses the opportunity to refinance their old debt at more attractive levels. This helped enhance business operating performance. Many corporate fixed income products also benefited from this improvement. Additionally, businesses continued to achieve productivity gains by reducing their labor forces and taking advantage of recent technology investments. Higher productivity levels
1. Sources: Standard & Poor’s Micropal; Lipper Inc. One cannot invest directly in an index, nor is an index representative of the Fund’s portfolio. Please see Index Descriptions following the Fund Summaries.
FUS-1
helped dampen inflation. Core inflation (excluding food and energy), as measured by the Consumer Price Index, rose a modest 1.1% for the year. Expectations for lower inflation contributed to the historically lower overall interest rate environment during the period.
As some of the immediate perceived risks related to the Iraq war subsided in late spring, and economic activity and domestic equity markets rebounded, interest rates rose as investors tolerated more risk in their portfolios. Rising interest rates led to higher mortgage rates, and although prepayments slowed, prices for bond and other interest rate-sensitive investments declined.
Investment Strategy
We generally buy, and hold, high-quality income securities. Using this straightforward approach, we seek to produce current income with a high degree of credit safety from a conservatively managed portfolio of U.S. government securities. Analyzing securities using proprietary and non-proprietary research, we seek to identify attractive investment opportunities.
Manager’s Discussion
During the year under review, our commitment to our investment strategy provided positive returns through a portfolio of mortgage-backed securities, U.S. Treasuries and agency debentures. At period-end, the Fund’s largest allocation was to agency mortgage-backed securities, which have historically offered a yield premium over comparable duration Treasuries.
Based on our research, we believe that agency mortgage-backed securities historically have offered attractive risk-adjusted returns over the past 5-, 10- and 15-year time periods versus other areas of the fixed income and equity markets. Such time periods include multiple economic, credit, prepayment and interest rate cycles. Our strategy within mortgages was to use our proprietary research to uncover areas of the markets where we thought prepayment risk was mispriced. During periods of stable or rising interest rates, these sectors can outperform similar maturity, government-guaranteed sectors. For example, during the last six months of the reporting period the Lehman Brothers Mortgage-Backed Securities Index returned 1.45%, while the Lehman Brothers U.S. Treasury Index returned -1.45%.2
2. Source: Standard & Poor’s Micropal. Please see Index Descriptions following the Fund Summaries.
Investment Holdings
Franklin U.S. Government Fund
12/31/03
| | |
| | | % of Total Net Assets |
|
| |
| Mortgage-Backed Securities | | 76.2% |
| |
| Agency Securities | | 24.1% |
| |
| Short-Term Investments & Other Net Assets less Liabilities | | -0.3% |
The dollar value, number of shares or principal amount, and complete legal titles of all portfolio holdings are listed in the Fund’s Statement of Investments.
FUS-2
Thank you for your participation in Franklin U.S. Government Fund. We look forward to serving your future investment needs.
This discussion reflects our analysis, opinions and portfolio holdings as of December 31, 2003, the end of the reporting period. The way we implement our main investment strategies and the resulting portfolio holdings may change depending on factors such as market and economic conditions. These opinions may not be relied upon as investment advice or an offer for a particular security. The information is not a complete analysis of every aspect of any market, country, industry, security or the Fund. Statements of fact are from sources considered reliable, but the advisor makes no representation or warranty as to their completeness or accuracy. Although historical performance is no guarantee of future results, these insights may help you understand our investment management philosophy.
FUS-3
PERFORMANCE SUMMARYASOF 12/31/03
Total return of Class 2 shares represents the average annual change in value, assuming reinvestment of dividends and capital gains. Average returns smooth out variations in returns, which can be significant; they are not the same as year-by-year results.
Franklin U.S. Government Fund – Class 2*
Periods ended 12/31/03
| | | | | | |
| | | 1-Year | | 5-Year | | 10-Year |
|
| | | |
Average Annual Total Return | | +2.21% | | +5.82% | | +6.30% |
*Because Class 2 shares were not offered until 1/6/99, standardized Class 2 Fund performance for prior periods represents the historical results of Class 1 shares. For periods beginning on 1/6/99, Class 2’s results reflect an additional 12b-1 fee expense, which also affects future performance. Since 1/6/99 (effective date), the average annual total return of Class 2 shares was +5.84%.
Ongoing market volatility can significantly affect short-term performance; recent returns may differ.
Total Return Index Comparison
for Hypothetical $10,000 Investment (1/1/94–12/31/03)
The graph compares the performance of Franklin U.S. Government Fund – Class 2,* the Lehman Brothers Intermediate U.S. Government Bond Index and the Lipper VIP General U.S. Government Funds Objective Average, as well as the Consumer Price Index (CPI). One cannot invest directly in an index, nor is an index representative of the Fund’s portfolio. Please see Important Notes to Performance Information preceding the Fund Summaries.
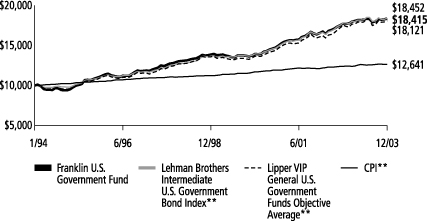
**Sources: Standard & Poor’s Micropal; Lipper Inc. Please see Index Descriptions following the Fund Summaries.
Franklin U.S. Government Fund – Class 2
Performance reflects the Fund’s Class 2 operating expenses, but does not include any contract fees, expenses or sales charges. If they had been included, performance would be lower. These charges and deductions, particularly for variable life policies, can have a significant effect on contract values and insurance benefits. See the contract prospectus for a complete description of these expenses, including sales charges.
Since markets can go down as well as up, investment return and the value of your principal will fluctuate with market conditions, and you may have a gain or loss when you sell your shares
FUS-4
Past performance does not guarantee future results.
FRANKLIN TEMPLETON VARIABLE INSURANCE PRODUCTS TRUST
FRANKLIN U.S. GOVERNMENT FUND
Financial Highlights
| | | | | | | | | | | | | | | | | | | | |
| | | Class 1
| |
| | | Year Ended December 31,
| |
| | | 2003 | | | 2002 | | | 2001 | | | 2000 | | | 1999 | |
| | |
|
|
|
Per share operating performance | | | | | | | | | | | | | | | | | | | | |
(for a share outstanding throughout the period) | | | | | | | | | | | | | | | | | | | | |
Net asset value, beginning of period | | $ | 13.61 | | | $ | 13.16 | | | $ | 13.16 | | | $ | 11.78 | | | $ | 13.89 | |
| | |
|
|
|
Income from investment operations: | | | | | | | | | | | | | | | | | | | | |
Net investment incomea | | | .51 | | | | .71 | | | | .80 | d | | | .79 | | | | .83 | |
Net realized and unrealized gains (losses) | | | (.18 | ) | | | .57 | | | | .17 | d | | | .60 | | | | (.96 | ) |
| | |
|
|
|
Total from investment operations | | | .33 | | | | 1.28 | | | | .97 | | | | 1.39 | | | | (.13 | ) |
| | |
|
|
|
Less distributions from net investment income | | | (.72 | ) | | | (.83 | ) | | | (.97 | ) | | | (.01 | ) | | | (1.98 | ) |
| | |
|
|
|
Net asset value, end of period | | $ | 13.22 | | | $ | 13.61 | | | $ | 13.16 | | | $ | 13.16 | | | $ | 11.78 | |
| | |
|
|
|
| | | | | |
Total returnb | | | 2.43% | | | | 10.08% | | | | 7.62% | | | | 11.82% | | | | (.94)% | |
Ratios/supplemental data | | | | | | | | | | | | | | | | | | | | |
Net assets, end of period (000’s) | | $ | 311,864 | | | $ | 382,663 | | | $ | 392,453 | | | $ | 424,513 | | | $ | 515,033 | |
Ratios to average net assets: | | | | | | | | | | | | | | | | | | | | |
Expenses | | | .53% | | | | .54% | | | | .53% | | | | .52% | | | | .51% | |
Net investment income | | | 3.79% | | | | 5.34% | | | | 6.06% | d | | | 6.48% | | | | 6.25% | |
Portfolio turnover rate | | | 72.09% | | | | 86.86% | | | | 35.94% | | | | 6.28% | | | | 7.90% | |
Portfolio turnover rate excluding mortgage dollar rollsc | | | 23.26% | | | | 38.47% | | | | 29.09% | | | | — | | | | — | |
| aBased | on average daily shares outstanding. |
| bTotal | return does not include any fees, charges or expenses imposed by the variable annuity and life insurance contracts for which the Franklin Templeton Variable Insurance Products Trust serves as an underlying investment vehicle. Total return is not annualized for periods less than one year. |
| cSee | Note 1(e) regarding mortgage dollar rolls. |
| dEffective | January 1, 2001, the Fund adopted the provisions of the AICPA Audit and Accounting Guide of Investment Companies and began recording all paydown gains and losses as part of investment income and amortizing all premium and discount on fixed-income securities, as required. The effect of this change was as follows: |
| | |
Net investment income per share | | $.016 |
Net realized and unrealized gains per share | | (.016) |
Ratio of net investment income to average net assets | | .12% |
Per share data and ratios for prior periods have not been restated to reflect this change in accounting policy.
FUS-5
FRANKLIN TEMPLETON VARIABLE INSURANCE PRODUCTS TRUST
FRANKLIN U.S. GOVERNMENT FUND
Financial Highlights (continued)
| | | | | | | | | | | | | | | | | | | | |
| | | Class 2
| |
| | | Year Ended December 31,
| |
| | | 2003 | | | 2002 | | | 2001 | | | 2000 | | | 1999e | |
| | |
|
|
|
Per share operating performance | | | | | | | | | | | | | | | | | | | | |
(for a share outstanding throughout the period) | | | | | | | | | | | | | | | | | | | | |
Net asset value, beginning of period | | $ | 13.49 | | | $ | 13.08 | | | $ | 13.11 | | | $ | 11.78 | | | $ | 13.89 | |
| | |
|
|
|
Income from investment operations: | | | | | | | | | | | | | | | | | | | | |
Net investment incomea | | | .46 | | | | .66 | | | | .75 | d | | | .77 | | | | .77 | |
Net realized and unrealized gains (losses) | | | (.16 | ) | | | .57 | | | | .18 | d | | | .57 | | | | (.92 | ) |
| | |
|
|
|
Total from investment operations | | | (.30 | ) | | | 1.23 | | | | .93 | | | | 1.34 | | | | (.15 | ) |
| | |
|
|
|
Less distributions from net investment income | | | (.71 | ) | | | (.82 | ) | | | (.96 | ) | | | (.01 | ) | | | (1.96 | ) |
| | |
|
|
|
Net asset value, end of period | | $ | 13.08 | | | $ | 13.49 | | | $ | 13.08 | | | $ | 13.11 | | | $ | 11.78 | |
| | |
|
|
|
| | | | | |
Total returnb | | | 2.21% | | | | 9.77% | | | | 7.37% | | | | 11.39% | | | | (1.10)% | |
Ratios/supplemental data | | | | | | | | | | | | | | | | | | | | |
Net assets, end of period (000’s) | | $ | 240,065 | | | $ | 136,875 | | | $ | 23,356 | | | $ | 3,961 | | | $ | 1,877 | |
Ratios to average net assets: | | | | | | | | | | | | | | | | | | | | |
Expenses | | | .78% | | | | .79% | | | | .78% | | | | .77% | | | | .77% | f |
Net investment income | | | 3.54% | | | | 5.09% | | | | 5.69% | d | | | 6.22% | | | | 5.95% | f |
Portfolio turnover rate | | | 72.09% | | | | 86.86% | | | | 35.94% | | | | 6.28% | | | | 7.90% | |
Portfolio turnover rate excluding mortgage dollar rollsc | | | 23.26% | | | | 38.47% | | | | 29.09% | | | | — | | | | — | |
| a | Based on average daily shares outstanding. |
| b | Total return does not include any fees, charges or expenses imposed by the variable annuity and life insurance contracts for which the Franklin Templeton Variable Insurance Products Trust serves as an underlying investment vehicle. Total return is not annualized for periods less than one year. |
| c | See Note 1(e) regarding mortgage dollar rolls. |
| d | Effective January 1, 2001, the Fund adopted the provisions of the AICPA Audit and Accounting Guide of Investment Companies and began recording all paydown gains and losses as part of investment income and amortizing all premium and discount on fixed-income securities, as required. The effect of this change was as follows: |
| | |
Net investment income per share | | $.016 |
Net realized and unrealized gains per share | | (.016) |
Ratio of net investment income to average net assets | | .12% |
Per share data and ratios for prior periods have not been restated to reflect this change in accounting policy.
| e | For the period January 6, 1999 (effective date) to December 31, 1999. |
See notes to financial statements.
FUS-6
FRANKLIN TEMPLETON VARIABLE INSURANCE PRODUCTS TRUST
FRANKLIN U.S. GOVERNMENT FUND
Statement of Investments, December 31, 2003
| | | | | | |
| | | PRINCIPAL
AMOUNT | | VALUE |
|
Mortgage-Backed Securities 76.2% | | | | | | |
Federal Home Loan Mortgage Corp. (FHLMC) Adjustable Rate .3% | | | | | | |
FHLMC, Cap 12.522%, Margin 2.105% + CMT, Resets Annually, 3.882%, 6/01/22 | | $ | 729,838 | | $ | 755,240 |
FHLMC, Cap 13.458%, Margin 2.195% + CMT, Resets Annually, 3.662%, 2/01/19 | | | 823,344 | | | 852,350 |
| | | | | |
|
|
| | | | | | | 1,607,590 |
| | | | | |
|
|
Federal Home Loan Mortgage Corp. (FHLMC) Fixed Rate 11.9% | | | | | | |
FHLMC, 5.00%, 6/01/33 - 12/01/33 | | | 10,957,425 | | | 10,824,889 |
aFHLMC, 5.00%, 1/01/34 | | | 5,000,000 | | | 4,935,940 |
FHLMC, 5.50%, 7/01/33 - 10/01/33 | | | 3,999,999 | | | 4,051,617 |
aFHLMC, 6.00%, 1/01/31 | | | 7,540,000 | | | 7,811,590 |
FHLMC, 6.00%, 1/01/24 - 9/01/33 | | | 8,306,095 | | | 8,592,609 |
FHLMC, 6.50%, 6/01/08 - 7/01/32 | | | 8,668,339 | | | 9,108,170 |
FHLMC, 7.00%, 4/01/24 - 10/01/32 | | | 7,688,466 | | | 8,145,057 |
FHLMC, 7.50%, 11/01/22 - 5/01/24 | | | 487,210 | | | 526,784 |
FHLMC, 8.00%, 1/01/17 - 5/01/22 | | | 198,932 | | | 217,206 |
FHLMC, 8.50%, 4/01/18 - 7/01/31 | | | 10,697,573 | | | 11,589,689 |
| | | | | |
|
|
| | | | | | | 65,803,551 |
| | | | | |
|
|
Federal National Mortgage Association (FNMA) Adjustable Rate 1.4% | | | | | | |
FNMA, Cap 12.490%, Margin 2.00% + CMT, Resets Annually, 3.246%, 2/01/19 | | | 985,532 | | | 1,010,880 |
FNMA, Cap 12.819%, Margin 2.127% + CMT, Resets Annually, 3.433%, 9/01/18 | | | 1,248,074 | | | 1,289,185 |
FNMA, Cap 13.313%, Margin 2.126% + CMT, Resets Annually, 4.298%, 7/01/19 | | | 943,060 | | | 950,210 |
FNMA, Cap 13.644%, Margin 2.011% + CMT, Resets Annually, 3.371%, 1/01/18 | | | 3,827,264 | | | 3,938,059 |
FNMA, Cap 15.156%, Margin 2.284% + 3CMT, Resets Tri-Annually, 6.433%, 3/01/20 | | | 354,087 | | | 366,479 |
| | | | | |
|
|
| | | | | | | 7,554,813 |
| | | | | |
|
|
Federal National Mortgage Association (FNMA) Fixed Rate 8.3% | | | | | | |
FNMA, 5.50%, 6/01/16 - 11/01/33 | | | 21,707,567 | | | 22,134,293 |
FNMA, 6.00%, 8/01/17 - 11/01/31 | | | 8,208,015 | | | 8,598,454 |
aFNMA, 6.00%, 1/01/29 | | | 5,170,000 | | | 5,344,488 |
FNMA, 6.50%, 1/01/24 - 8/01/32 | | | 3,909,179 | | | 4,100,297 |
FNMA, 7.00%, 5/01/24 - 9/01/31 | | | 1,372,288 | | | 1,454,156 |
FNMA, 7.50%, 4/01/23 - 8/01/25 | | | 594,691 | | | 638,137 |
FNMA, 8.00%, 7/01/16 - 2/01/25 | | | 1,100,261 | | | 1,202,817 |
FNMA, 8.50%, 10/01/19 - 8/01/21 | | | 41,593 | | | 45,612 |
aFNMA, 9.00%, 10/01/26 | | | 2,047,147 | | | 2,283,427 |
| | | | | |
|
|
| | | | | | | 45,801,681 |
| | | | | |
|
|
Government National Mortgage Association (GMNA) Fixed Rate 54.3% | | | | | | |
aGNMA I, 5.00%, 1/01/34 | | | 5,000,000 | | | 4,954,690 |
aGNMA I, 5.50%, 1/15/33 | | | 4,000,000 | | | 4,067,500 |
aGNMA I, 6.00%, 1/01/31 | | | 4,000,000 | | | 4,157,500 |
GNMA I, SF, 5.00%, 8/15/33 - 11/20/33 | | | 41,808,836 | | | 41,411,864 |
GNMA I, SF, 5.50%, 11/15/28 - 7/20/33 | | | 62,193,215 | | | 63,309,265 |
GNMA I, SF, 6.00%, 11/15/23 - 11/15/33 | | | 30,524,501 | | | 31,790,506 |
GNMA I, SF, 6.50%, 5/15/23 - 2/15/33 | | | 61,037,216 | | | 64,417,071 |
GNMA I, SF, 7.00%, 3/15/22 - 11/20/32 | | | 48,456,502 | | | 51,619,367 |
GNMA I, SF, 7.25%, 5/15/22 - 11/15/25 | | | 1,578,870 | | | 1,668,177 |
GNMA I, SF, 7.50%, 2/15/17 - 5/20/33 | | | 7,947,537 | | | 8,552,662 |
GNMA I, SF, 8.00%, 4/15/05 - 6/15/24 | | | 2,689,282 | | | 2,954,171 |
GNMA I, SF, 8.25%, 4/15/25 | | | 218,304 | | | 238,922 |
GNMA I, SF, 8.50%, 8/15/21 - 12/15/24 | | | 819,997 | | | 904,565 |
FUS-7
FRANKLIN TEMPLETON VARIABLE INSURANCE PRODUCTS TRUST
FRANKLIN U.S. GOVERNMENT FUND
Statement of Investments, December 31, 2003 (cont.)
| | | | | | |
| | | PRINCIPAL
AMOUNT | | VALUE |
|
Mortgage-Backed Securities (cont.) | | | | | | |
Government National Mortgage Association (GMNA) Fixed Rate (cont.) | | | | | | |
GNMA I, SF, 9.00%, 4/15/16 - 2/15/21 | | $ | 490,776 | | $ | 549,413 |
GNMA I, SF, 9.50%, 7/15/16 - 12/15/21 | | | 832,353 | | | 932,517 |
GNMA I, SF, 10.00%, 8/15/17 - 8/15/21 | | | 877,235 | | | 988,357 |
GNMA II, 6.50%, 12/20/27 - 3/20/28 | | | 3,807,750 | | | 4,014,145 |
GNMA II, 7.50%, 11/20/16 - 11/20/26 | | | 2,712,036 | | | 2,903,668 |
GNMA II, 8.00%, 7/20/16 - 8/20/26 | | | 255,798 | | | 278,842 |
GNMA II, 9.50%, 4/20/25 | | | 54,366 | | | 60,676 |
aGNMA II, 6.00%, 1/01/30 | | | 9,829,589 | | | 10,198,199 |
| | | | | |
|
|
| | | | | | | 299,972,077 |
| | | | | |
|
|
Total Mortgage-Backed Securities (Cost $412,390,569) | | | | | | 420,739,712 |
| | | | | |
|
|
Other Agency Securities 24.1% | | | | | | |
Federal Farm Credit Bank, 4.45%, 8/27/10 | | | 15,000,000 | | | 15,289,575 |
Federal Farm Credit Bank, 4.50%, 7/09/07 | | | 10,000,000 | | | 10,509,070 |
Federal Home Loan Bank, 2.25%, 5/15/06 | | | 25,000,000 | | | 25,019,975 |
Federal Home Loan Bank, 2.625%, 5/15/07 | | | 15,000,000 | | | 14,878,905 |
Federal Home Loan Bank, 4.875%, 05/15/07 | | | 5,000,000 | | | 5,318,370 |
FICO, Strip, Series 12, zero cpn., 12/06/14 | | | 13,569,000 | | | 7,802,596 |
FICO, Strip, Series 16, zero cpn., 10/05/10 | | | 4,745,000 | | | 3,580,847 |
Housing and Urban Development, 96-A, 7.625%, 8/01/14 | | | 5,000,000 | | | 5,407,810 |
Housing and Urban Development, 96-A, 7.66%, 8/01/15 | | | 5,000,000 | | | 5,406,360 |
Small Business Administration, 3.60%, 6/25/19 | | | 1,099,195 | | | 1,145,580 |
Small Business Administration, 3.875%, 3/25/18 | | | 1,488,187 | | | 1,564,056 |
Small Business Administration, 6.00%, 9/01/18 | | | 6,545,636 | | | 7,023,025 |
Small Business Administration, 6.45%, 12/01/15 | | | 2,268,104 | | | 2,450,669 |
Small Business Administration, 6.70%, 12/01/16 | | | 2,466,613 | | | 2,693,231 |
Small Business Administration, 6.85%, 7/01/17 | | | 2,806,698 | | | 3,085,119 |
Student Loan Marketing Association, zero cpn., 5/15/14 | | | 15,000,000 | | | 6,901,095 |
Tennessee Valley Authority, 5.88%, 4/01/36 | | | 10,000,000 | | | 10,993,360 |
Tennessee Valley Authority, Strip, zero cpn., 4/15/42 | | | 6,000,000 | | | 4,112,731 |
| | | | | |
|
|
Total Other Agency Securities (Cost $125,808,418) | | | | | | 133,182,374 |
| | | | | |
|
|
Total Long Term Investments (Cost $538,198,987) | | | | | | 553,922,086 |
| | | | | |
|
|
FUS-8
FRANKLIN TEMPLETON VARIABLE INSURANCE PRODUCTS TRUST
FRANKLIN U.S. GOVERNMENT FUND
Statement of Investments, December 31, 2003 (cont.)
| | | | | | | |
| | | PRINCIPAL
AMOUNT | | VALUE | |
| |
Repurchase Agreements (Cost $39,025,037) 7.1% | | | | | | | |
bJoint Repurchase Agreement, .873%, 1/02/04, (Maturity Value $39,026,930) | | $ | 39,025,037 | | $ | 39,025,037 | |
ABN AMRO Bank, N.V., New York Branch (Maturity Value $3,635,749) | | | | | | | |
Banc of America Securities LLC (Maturity Value $3,635,749) | | | | | | | |
Barclays Capital Inc. (Maturity Value $2,596,460) | | | | | | | |
Bear, Stearns & Co. Inc. (Maturity Value $2,077,403) | | | | | | | |
BNP Paribas Securities Corp. (Maturity Value $3,635,749) | | | | | | | |
Deutsche Bank Securities Inc. (Maturity Value $3,635,749) | | | | | | | |
Dresdner Kleinwort Wasserstein Securities LLC (Maturity Value $3,635,749) | | | | | | | |
Goldman, Sachs & Co. (Maturity Value $2,077,403) | | | | | | | |
Greenwich Capital Markets Inc. (Maturity Value $3,635,749) | | | | | | | |
Lehman Brothers Inc. (Maturity Value $3,189,672) | | | | | | | |
Morgan Stanley & Co. Inc. (Maturity Value $3,635,749) | | | | | | | |
UBS Securities LLC (Maturity Value $3,635,749) | | | | | | | |
Collateralized by U.S. Treasury Bills, Notes, and Bonds, and U.S. Government Agency Securities | | | | | | | |
| | | | | |
|
|
|
Total Investments Before Allowance for Paydowns 107.4% | | | | | | 592,947,123 | |
cAllowance for Paydowns | | | | | | (430,237 | ) |
| | | | | |
|
|
|
Total Investments (Cost $577,224,024) 107.4% | | | | | | 592,516,886 | |
Other Assets, less Liabilities (7.4%) | | | | | | (40,588,523 | ) |
| | | | | |
|
|
|
Net Assets 100.0% | | | | | $ | 551,928,363 | |
| | | | | |
|
|
|
| a | See Note 1(c) regarding securities purchases on a to-be-announced basis. |
| b | See Note 1(b) regarding joint repurchase agreement. |
| c | See Note 1(d) regarding allowance for paydowns. |
See notes to financial statements.
FUS-9
FRANKLIN TEMPLETON VARIABLE INSURANCE PRODUCTS TRUST
FRANKLIN U.S. GOVERNMENT FUND
Financial Statements
Statement of Assets and Liabilities
December 31, 2003
| | | | |
Assets: | | | | |
Investments in securities: | | | | |
Cost | | $ | 577,224,024 | |
| | |
|
|
|
Value | | $ | 592,516,886 | |
Receivables: | | | | |
Investment securities sold | | | 170,702 | |
Capital shares sold | | | 665,164 | |
Interest | | | 3,093,932 | |
| | |
|
|
|
Total assets | | | 596,446,684 | |
| | |
|
|
|
Liabilities: | | | | |
Payables: | | | | |
Investment securities purchased | | | 43,581,938 | |
Capital shares redeemed | | | 556,857 | |
Affiliates | | | 329,683 | |
Other liabilities | | | 49,843 | |
| | |
|
|
|
Total liabilities | | | 44,518,321 | |
| | |
|
|
|
Net assets, at value | | $ | 551,928,363 | |
| | |
|
|
|
Net assets consist of: | | | | |
Undistributed net investment income | | $ | 25,304,961 | |
Net unrealized appreciation (depreciation) | | | 15,292,862 | |
Accumulated net realized gain (loss) | | | (11,284,736 | ) |
Capital shares | | | 522,615,276 | |
| | |
|
|
|
Net assets, at value | | $ | 551,928,363 | |
| | |
|
|
|
Class 1: | | | | |
Net assets, at value | | $ | 311,863,814 | |
| | |
|
|
|
Shares outstanding | | | 23,587,836 | |
| | |
|
|
|
Net asset value per share | | $ | 13.22 | |
| | |
|
|
|
Class 2: | | | | |
Net assets, at value | | $ | 240,064,549 | |
| | |
|
|
|
Shares outstanding | | | 18,353,162 | |
| | |
|
|
|
Net asset value and maximum offering price per share | | $ | 13.08 | |
| | |
|
|
|
See notes to financial statements.
FUS-10
FRANKLIN TEMPLETON VARIABLE INSURANCE PRODUCTS TRUST
FRANKLIN U.S. GOVERNMENT FUND
Financial Statements (continued)
Statement of Operations
for the year ended December 31, 2003
| | | | |
Investment income: | | | | |
Interest | | | $23,790,309 | |
| | |
|
|
|
Expenses: | | | | |
Management fees (Note 3) | | | 2,732,761 | |
Distribution fees - Class 2 (Note 3) | | | 499,178 | |
Transfer agent fees | | | 3,492 | |
Custodian fees | | | 5,881 | |
Reports to shareholders | | | 96,293 | |
Professional fees | | | 23,675 | |
Trustees’ fees and expenses | | | 5,447 | |
Other | | | 36,684 | |
| | |
|
|
|
Total expenses | | | 3,403,411 | |
| | |
|
|
|
Net investment income | | | 20,386,898 | |
| | |
|
|
|
Realized and unrealized gains (losses): | | | | |
Net realized gain (loss) from investments | | | 3,046,596 | |
Net unrealized appreciation (depreciation) on investments | | | (10,903,820 | ) |
| | |
|
|
|
Net realized and unrealized gain (loss) | | | (7,857,224 | ) |
| | |
|
|
|
Net increase (decrease) in net assets resulting from operations | | $ | 12,529,674 | |
| | |
|
|
|
See notes to financial statements.
FUS-11
FRANKLIN TEMPLETON VARIABLE INSURANCE PRODUCTS TRUST
FRANKLIN U.S. GOVERNMENT FUND
Financial Statements (continued)
Statements of Changes in Net Assets
for the years ended December 31, 2003 and 2002
| | | | | | | | |
| | | 2003 | | | 2002 | |
| | |
| |
Increase (decrease) in net assets: | | | | | | | | |
Operations: | | | | | | | | |
Net investment income | | $ | 20,386,898 | | | $ | 24,218,463 | |
Net realized gain (loss) from investments | | | 3,046,596 | | | | 3,804,636 | |
Net unrealized appreciation (depreciation) on investments | | | (10,903,820 | ) | | | 15,233,412 | |
| | |
| |
Net increase (decrease) in net assets resulting from operations | | | 12,529,674 | | | | 43,256,511 | |
Distributions to shareholders from: | | | | | | | | |
Net investment income: | | | | | | | | |
Class 1 | | | (18,596,320 | ) | | | (22,736,492 | ) |
Class 2 | | | (10,519,204 | ) | | | (3,744,993 | ) |
| | |
| |
Total distributions to shareholders | | | (29,115,524 | ) | | | (26,481,485 | ) |
Capital share transactions: (Note 2) | | | | | | | | |
Class 1 | | | (60,577,726 | ) | | | (23,721,662 | ) |
Class 2 | | | 109,553,750 | | | | 110,675,553 | |
| | |
| |
Total capital share transactions | | | 48,976,024 | | | | 86,953,891 | |
Net increase (decrease) in net assets | | | 32,390,174 | | | | 103,728,917 | |
Net assets: | | | | | | | | |
Beginning of year | | | 519,538,189 | | | | 415,809,272 | |
| | |
| |
End of year | | $ | 551,928,363 | | | $ | 519,538,189 | |
| | |
| |
Undistributed net investment income included in net assets: | | | | | | | | |
End of year | | $ | 25,304,961 | | | $ | 25,975,527 | |
| | |
| |
See notes to financial statements.
FUS-12
FRANKLIN TEMPLETON VARIABLE INSURANCE PRODUCTS TRUST
FRANKLIN U.S. GOVERNMENT FUND
Notes to Financial Statements
1. ORGANIZATION AND SIGNIFICANT ACCOUNTING POLICIES
Franklin Templeton Variable Insurance Products Trust (the Trust) is registered under the Investment Company Act of 1940 as an open-end investment company, consisting of twenty-two separate series (the Funds). The Franklin U.S. Government Fund (the Fund) included in this report is diversified. Shares of the Fund are sold only to insurance company separate accounts to fund the benefits of variable life insurance policies or variable annuity contracts. As of December 31, 2003, over 90% of the total Fund shares were sold through one insurance company. The Fund’s investment objective is current income.
The following summarizes the Fund’s significant accounting policies.
a. Security Valuation
Securities listed or traded on a recognized national exchange or NASDAQ are valued at the latest reported sales price. Over-the-counter securities and listed securities for which no sale is reported are valued within the range of the latest quoted bid and asked prices. If events occur that materially affect the values of securities after the prices are determined, or if market quotations are not readily available, the securities will be valued at fair value as determined following procedures approved by the Board of Trustees.
b. Joint Repurchase Agreement
The Fund may enter into a joint repurchase agreement whereby its uninvested cash balance is deposited into a joint cash account to be used to invest in one or more repurchase agreements. The value and face amount of the joint repurchase agreement are allocated to the Fund based on its pro-rata interest. A repurchase agreement is accounted for as a loan by the Fund to the seller, collateralized by securities which are delivered to the Fund’s custodian. The market value, including accrued interest, of the initial collateralization is required to be at least 102% of the dollar amount invested by the Funds, with the value of the underlying securities marked to market daily to maintain coverage of at least 100%. At December 31, 2003, all repurchase agreements had been entered into on that date.
c. Securities Purchased on a TBA Basis
The Fund may purchase securities on a to-be-announced (TBA) basis, with payment and delivery scheduled for a future date. These transactions are subject to market fluctuations and are subject to the risk that the value at delivery may be more or less than the trade date purchase price. Although the Fund will generally purchase these securities with the intention of holding the securities, it may sell the securities before the settlement date. Sufficient assets have been segregated for these securities.
d. Allowance for Paydowns
The Fund provides estimates, based on historical experience, for anticipated paydown. The allowance is recorded as a reduction or increase to net assets as noted on the Statement of Investments and is included in the unrealized appreciation/depreciation shown on the accompanying financial statements.
e. Mortgage Dollar Rolls
The Fund enters into mortgage dollar rolls, typically on a TBA basis. Dollar rolls are agreements between the Fund and a financial institution to simultaneously sell and repurchase a mortgage-backed security at a future date. Gains or losses are realized at the time of the sale and the difference between the repurchase price and sale price is recorded as an unrealized gain to the Fund. The risks of mortgage dollar roll transactions include the potential inability of the counterparty to fulfill their obligations.
FUS-13
FRANKLIN TEMPLETON VARIABLE INSURANCE PRODUCTS TRUST
FRANKLIN U.S. GOVERNMENT FUND
Notes to Financial Statements (continued)
1. ORGANIZATION AND SIGNIFICANT ACCOUNTING POLICIES (cont.)
f. Income Taxes
No provision has been made for income taxes because the Fund’s policy is to qualify as a regulated investment company under the Internal Revenue Code and to distribute substantially all of its taxable income.
g. Security Transactions, Investment Income, Expenses and Distributions
Security transactions are accounted for on trade. Realized gains and losses on security transactions are determined on a specific identification basis. Interest income and estimated expenses are accrued daily. Discounts and premiums on securities purchased are amortized over the lives of the respective securities. Distributions to shareholders are recorded on the ex-dividend date.
Common expenses incurred by the Trust are allocated among the funds based on the ratio of net assets of each fund to the combined net assets. Other expenses are charged to each fund on a specific identification basis.
Realized and unrealized gains and losses and net investment income, other than class specific expenses, are allocated daily to each class of shares based upon the relative proportion of net assets of each class.
h. Accounting Estimates
The preparation of financial statements in accordance with accounting principles generally accepted in the United States of America requires management to make estimates and assumptions that affect the reported amounts of assets and liabilities at the date of the financial statements and the amounts of income and expense during the reporting period. Actual results could differ from those estimates.
i. Guarantees and Indemnifications
Under the Trust’s organizational documents, its officers and trustees are indemnified against certain liability arising out of the performance of their duties to the Trust. Additionally, in the normal course of business, the Trust enters into contracts with service providers that contain general indemnification clauses. The Trust’s maximum exposure under these arrangements is unknown as this would involve future claims that may be made against the Trust that have not yet occurred. However, based on experience, the Trust expects the risk of loss to be remote.
2. SHARES OF BENEFICIAL INTEREST
The Fund offers two classes of shares: Class 1 and Class 2. Each class of shares differs by its distribution fees, voting rights on matters affecting a single class, and its exchange privilege.
FUS-14
FRANKLIN TEMPLETON VARIABLE INSURANCE PRODUCTS TRUST
FRANKLIN U.S. GOVERNMENT FUND
Notes to Financial Statements (continued)
2. SHARES OF BENEFICIAL INTEREST (cont.)
At December 31, 2003, there were an unlimited number of shares authorized ($.01 par value). Transactions in the Fund’s shares were as follows:
| | | | | | | | | | | | | | |
| | | Year Ended December 31,
| |
| | | 2003
| | | 2002
| |
| Class 1 Shares: | | Shares
| | | Amount
| | | Shares
| | | Amount
| |
Shares sold | | 429,090 | | | $ | 5,692,469 | | | 2,108,070 | | | $ | 27,924,326 | |
Shares issued in reinvestment of distributions | | 1,410,949 | | | | 18,596,320 | | | 1,762,519 | | | | 22,736,492 | |
Shares redeemed | | (6,372,407 | ) | | | (84,866,515 | ) | | (5,568,427 | ) | | | (74,382,480 | ) |
| | |
| |
Net increase (decrease) | | (4,532,368 | ) | | $ | (60,577,726 | ) | | (1,697,838 | ) | | $ | (23,721,662 | ) |
| | |
| |
| Class 2 Shares: | | | | | | | | | | | | |
Shares sold | | 10,564,288 | | | $ | 140,491,586 | | | 9,927,016 | | | $ | 131,615,360 | |
Shares issued in reinvestment of distributions | | 806,069 | | | | 10,519,204 | | | 292,349 | | | | 3,744,993 | |
Shares redeemed | | (3,162,095 | ) | | | (41,457,040 | ) | | (1,859,896 | ) | | | (24,684,800 | ) |
| | |
| |
Net increase (decrease) | | 8,208,262 | | | $ | 109,553,750 | | | 8,359,469 | | | $ | 110,675,553 | |
| | |
| |
3. TRANSACTIONS WITH AFFILIATES
Certain officers and trustees of the Fund are also officers and/or directors of the following entities:
| | |
| Entity | | Affiliation |
|
Franklin Advisers, Inc. (Advisers)
| | Investment manager
|
Franklin Templeton Services, LLC (FT Services) | | Administrative manager |
Franklin/Templeton Distributors Inc. (Distributors) | | Principal underwriter |
Franklin/Templeton Investor Services, LLC (Investor Services) | | Transfer agent |
The Fund pays an investment management fee to Advisers based on the average daily net assets of the Fund as follows:
| | |
| Annualized Fee Rate | | Net Assets |
|
| .625% | | First $100 million |
| .50% | | over $100 million, up to and including $250 million |
| .45% | | over $250 million, up to and including $10 billion |
Fees are further reduced on net assets over $10 billion.
Under an agreement with Advisers, FT Services provides administrative services to the Fund. The fee is paid by Advisers based on average daily net assets, and is not an additional expense of the Fund.
The Fund reimburses Distributors up to .25% per year of its average daily net assets of Class 2, for costs incurred in marketing the Fund’s shares.
Investor Services, under terms of an agreement, performs shareholder servicing for the Fund and is not paid by the Fund for the services.
FUS-15
FRANKLIN TEMPLETON VARIABLE INSURANCE PRODUCTS TRUST
FRANKLIN U.S. GOVERNMENT FUND
Notes to Financial Statements (continued)
4. INCOME TAXES
At December 31, 2003, the Fund had tax basis capital losses of $10,480,690, which may be carried over to offset future capital gains. Such losses expire as follows:
| | | |
Capital loss carryover expiring in: | | | |
2005 | | $ | 169,754 |
2008 | | | 5,752,213 |
2011 | | | 4,558,723 |
| | |
|
| | | $ | 10,480,690 |
| | |
|
On December 31, 2003, the Fund had expired capital loss carryovers of $826,481, which were reclassified to paid-in capital.
At December 31, 2003, the Fund had deferred capital losses occurring subsequent to October 31, 2003 of $756,064. For tax purposes, such losses will be reflected in the year ending December 31, 2004.
Net investment income differs for financial statement and tax purposes primarily due to differing treatments of mortgage dollar rolls, paydown losses, bond discounts and premiums.
Net realized gains differ for financial statement and tax purposes primarily due to differing treatments of mortgage dollar rolls, paydown losses, bond discounts and premiums.
The tax character of distributions paid during the years ended December 31, 2003 and 2002, was as follows:
| | | | | | |
| | | 2003
| | 2002
|
Distributions paid from: | | | | | | |
Ordinary income | | $ | 29,115,524 | | $ | 26,481,485 |
Long term capital gain | | | — | | | — |
| | |
|
| | | $ | 29,115,524 | | $ | 26,481,485 |
| | |
|
At December 31, 2003, the cost of investments, net unrealized appreciation (depreciation), and undistributed ordinary income and undistributed long term capital gains for income tax purposes was as follows:
| | | | |
Cost of investments | | $ | 577,836,150 | |
| | |
|
|
|
Unrealized appreciation | | | 16,233,390 | |
Unrealized depreciation | | | (1,552,654 | ) |
| | |
|
|
|
| |
Net unrealized appreciation (depreciation) | | $ | 14,680,736 | |
| | |
|
|
|
Undistributed ordinary income | | $ | 26,869,109 | |
Undistributed long term capital gains | | | — | |
| | |
|
|
|
Distributable earnings | | $ | 26,869,109 | |
| | |
|
|
|
5. INVESTMENT TRANSACTIONS
Purchases and sales of securities (excluding short-term securities) for the year ended December 31, 2003 aggregated $708,557,705 and $395,801,222, respectively.
FUS-16
FRANKLIN TEMPLETON VARIABLE INSURANCE PRODUCTS TRUST
FRANKLIN U.S. GOVERNMENT FUND
Notes to Financial Statements (continued)
6. REGULATORY MATTERS
On February 4, 2004, the Securities Division of the Office of the Secretary of the Commonwealth of Massachusetts filed an administrative complaint against Franklin Resources, Inc. and certain of its subsidiaries (the “Company”), alleging violations of the Massachusetts Uniform Securities Act. The complaint arises from activity that occurred in 2001 during which time an officer of a Company subsidiary was negotiating an agreement with an investor relating to investments in a mutual fund and a hedge fund.
The Company, in addition to other entities within Franklin Templeton Investments, has been named in shareholder class actions related to the matter described above. The Company believes that the claims made in the lawsuit are without merit and it intends to defend vigorously against the allegations. The Company and the Fund may be named in similar civil actions related to the matter described above.
In addition, as part of ongoing investigations by the U.S. Securities and Exchange Commission (the “SEC”), the U.S. Attorney for the Northern District of California, the New York Attorney General, the California Attorney General, the U.S. Attorney for the District of Massachusetts, the Florida Department of Financial Services, and the Commissioner of Securities and the Attorney General of the State of West Virginia, relating to certain practices in the mutual fund industry, including late trading, market timing and sales compensation arrangements, the Company and its subsidiaries, as well as certain current or former executives and employees of the Company, have received requests for information and/or subpoenas to testify or produce documents. The Company and its current employees are providing documents and information in response to these requests and subpoenas. In addition, the Company has responded to requests for similar kinds of information from regulatory authorities in some of the foreign countries where the Company conducts its global asset management business.
The Staff of the SEC has informed the Company that it intends to recommend that the Commission authorize an action against the Fund’s investment adviser and a senior executive officer relating to the frequent trading issues that are the subject of the SEC’s investigation. These issues were previously disclosed as being under investigation by government authorities and the subject of an internal inquiry by the Company in its Annual Report on Form 10-K and on its public website. The Company currently is in discussions with the SEC Staff in an effort to resolve the issues raised in their investigation. Such discussions are preliminary and the Fund’s management has been advised that the Company cannot predict the likelihood of whether those discussions will result in a settlement and, if so, the terms of such settlement. The impact, if any, of these matters on the Fund is uncertain at this time. If the Company finds that it bears responsibility for any unlawful or improper conduct, it has committed to making the Fund or its shareholders whole, as appropriate.
FUS-17
FRANKLIN TEMPLETON VARIABLE INSURANCE PRODUCTS TRUST
FRANKLIN U.S. GOVERNMENT FUND
Independent Auditors’ Report
To the Board of Trustees and Shareholders
of Franklin Templeton Variable Insurance Products Trust
In our opinion, the accompanying statement of assets and liabilities, including the statement of investments, and the related statements of operations and of changes in net assets and the financial highlights present fairly, in all material respects, the financial position of the Franklin U.S. Government Fund (the Fund) (one of the funds constituting the Franklin Templeton Variable Insurance Products Trust) at December 31, 2003, the results of its operations for the year then ended, the changes in its net assets for each of the two years in the period then ended and the financial highlights for each of the periods presented, in conformity with accounting principles generally accepted in the United States of America. These financial statements and financial highlights (hereafter referred to as “financial statements”) are the responsibility of the Fund’s management; our responsibility is to express an opinion on these financial statements based on our audits. We conducted our audits of these financial statements in accordance with auditing standards generally accepted in the United States of America, which require that we plan and perform the audits to obtain reasonable assurance about whether the financial statements are free of material misstatement. An audit includes examining, on a test basis, evidence supporting the amounts and disclosures in the financial statements, assessing the accounting principles used and significant estimates made by management, and evaluating the overall financial statement presentation. We believe that our audits, which included confirmation of securities at December 31, 2003 by correspondence with the custodian and brokers, provide a reasonable basis for our opinion.
PricewaterhouseCoopers LLP
San Francisco, California
February 5, 2004, except for Note 6 as to which the date is February 12, 2004
FUS-18
FRANKLIN ZERO COUPON FUND 2010
Fund Goal and Primary Investments: Franklin Zero Coupon Fund 2010 seeks as high an investment return as is consistent with capital preservation. The Fund invests primarily in zero coupon debt securities, primarily U.S. Treasury-issued stripped securities and stripped securities issued by the U.S. government and its agencies and authorities. The Fund may not be appropriate for those who intend to redeem units before the maturity date.
This annual report for Franklin Zero Coupon Fund 2010 covers the fiscal year ended December 31, 2003.
Performance Overview
You can find the Fund’s one-year total return in the Performance Summary following this report. The Fund outperformed its benchmarks, the Merrill Lynch 10-Year Zero Coupon Bond Index and the Merrill Lynch 5-Year Zero Coupon Bond Index, which returned 2.61% and 2.57% for the year under review.1
Economic and Market Overview
During the year ended December 31, 2003, many factors strongly impacted the U.S. economy and markets. In general, uncertainty about the economy’s strength and geopolitical events pushed interest rates down during the first part of the year. The Iraq conflict weighed heavily on many investors’ minds, which helped interest rates decline. By mid-June, the 10-year U.S. Treasury yield fell to 3.13%, the lowest level in more than four decades. For consumers, historically low mortgage rates enabled many homeowners to refinance their mortgages, and refinancing applications reached their highest levels on record. Prepayments on mortgage-backed securities increased as well. Additionally, the refinancing activity, rising home values and stabilizing equity markets improved consumers’ net worths and allowed them to continue spending, which helped to keep the economy moving forward.
Increases in business spending also helped economic growth. After having been largely absent since the end of 2000, business spending improved in the latter half of 2003. Nonresidential fixed investment increased 12.8% annualized in the third quarter of 2003, the highest increase since the second quarter of 2000. Lower interest rates during the past year allowed many businesses the opportunity to refinance their old debt at more attractive levels. This helped enhance business operating performance. Many corporate fixed income products also
1. Source: Standard & Poor’s Micropal. One cannot invest directly in an index, nor is an index representative of the Fund’s portfolio. Please see Index Descriptions following the Fund Summaries.
FZ10-1
benefited from this improvement. Additionally, businesses continued to achieve productivity gains by reducing their labor forces and taking advantage of recent technology investments. Higher productivity levels helped dampen inflation. Core inflation (excluding food and energy), as measured by the Consumer Price Index, rose a modest 1.1% for the year. Expectations for lower inflation contributed to the historically lower overall interest rate environment during the period.
As some of the immediate perceived risks related to the Iraq war subsided in late spring, and economic activity and domestic equity markets rebounded, interest rates rose as investors tolerated more risk in their portfolios. Rising interest rates led to higher mortgage rates, and although prepayments slowed, prices for bond and other interest rate-sensitive investments declined.
Investment Strategy
In selecting investments for the Fund, we seek to keep the average duration of the Fund to within 12 months of its maturity Target Date. Duration is a measure of the length of an investment, taking into account the timing and amount of any interest payments and the principal repayment.
Manager’s Discussion
Declining interest rates early in the period benefited Fund performance. However, during periods of rising interest rates, such as those experienced over the latter half of 2003, investors tend to see fixed income portfolios with shorter durations outperform those with longer durations. This occurred and dampened Fund performance during the latter half of the year.
Thank you for your participation in Franklin Zero Coupon Fund 2010. We look forward to serving your future investment needs.
This discussion reflects our analysis, opinions and portfolio holdings as of December 31, 2003, the end of the reporting period. The way we implement our main investment strategies and the resulting portfolio holdings may change depending on factors such as market and economic conditions. These opinions may not be relied upon as investment advice or an offer for a particular security. The information is not a complete analysis of every aspect of any market, country, industry, security or the Fund. Statements of fact are from sources considered reliable, but the advisor makes no representation or warranty as to their completeness or accuracy. Although historical performance is no guarantee of future results, these insights may help you understand our investment management philosophy.
FZ10-2
PERFORMANCE SUMMARYASOF 12/31/03
Total return of Class 2 shares represents the average annual change in value, assuming reinvestment of dividends and capital gains. Average returns smooth out variation in returns, which can be significant; they are not the same as year-by-year results.
Franklin Zero Coupon Fund 2010 – Class 2*
Periods ended 12/31/03
| | | | | | |
| | | 1-Year | | 5-Year | | 10-Year |
|
| | | |
Average Annual Total Return | | +3.40% | | +6.45% | | +8.47% |
*Because Class 2 shares were not offered until 5/12/03, standardized Class 2 performance for prior periods represents the historical results of Class 1 shares. For periods beginning on 5/12/03, Class 2’s results reflects an additional 12b-1 fee expense, which also affects subsequent performance. Since 5/12/03 (commencement of sales), the aggregate total return of Class 2 shares was -1.93%
Ongoing market volatility can significantly affect short-term performance; recent returns may differ.
Total Return Index Comparison
for Hypothetical $10,000 Investment (1/1/94–12/31/03)
The graph compares the performance of Franklin Zero Coupon Fund 2010 – Class 2,* the Merrill Lynch 10-Year Zero Coupon Bond Index and the Merrill Lynch 5-Year Zero Coupon Bond Index, as well as the Consumer Price Index (CPI). The Merrill Lynch 5-Year Zero Coupon Bond Index is included to reflect the portfolio’s changing duration as it moves toward its 2010 target date. One cannot invest directly in an index, nor is an index representative of the Fund’s portfolio. Please see Important Notes to Performance Information preceding the Fund Summaries.
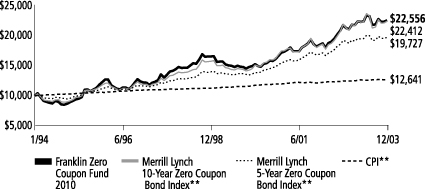
**Source: Standard & Poor’s Micropal. Please see Index Descriptions following the Fund Summaries.
Franklin Zero Coupon Fund 2010 – Class 2
Performance reflects the Fund’s Class 2 operating expenses, but does not include any contract fees, expenses or sales charges. If they had been included, performance would be lower. These charges and deductions, particularly for variable life policies, can have a significant effect on contract values and insurance benefits. See the contract prospectus for a complete description of these expenses, including sales charges.
Since markets can go down as well as up, investment return and the value of your principal will fluctuate with market conditions, and you may have a gain or loss when you sell your shares.
FZ10-3
Past performance does not guarantee future results.
FRANKLIN TEMPLETON VARIABLE INSURANCE PRODUCTS TRUST
FRANKLIN ZERO COUPON FUND – 2010
Financial Highlights
| | | | | | | | | | | | | | | | | | | | |
| | | Class 1
| |
| | | Year Ended December 31,
| |
| | | 2003 | | | 2002 | | | 2001 | | | 2000 | | | 1999 | |
| | |
|
|
|
Per share operating performance | | | | | | | | | | | | | | | | | | | | |
(for a share outstanding throughout the year) | | | | | | | | | | | | | | | | | | | | |
| | | | | |
Net asset value, beginning of year | | $ | 16.61 | | | $ | 15.33 | | | $ | 16.50 | | | $ | 14.15 | | | $ | 19.05 | |
| | |
|
|
|
Income from investment operations: | | | | | | | | | | | | | | | | | | | | |
Net investment incomea | | | .82 | | | | .87 | | | | .92 | | | | 0.94 | | | �� | .99 | |
Net realized and unrealized gains (losses) | | | (.20 | ) | | | 2.03 | | | | (.06 | ) | | | 1.67 | | | | (3.24 | ) |
| | |
|
|
|
Total from investment operations | | | .62 | | | | 2.90 | | | | .86 | | | | 2.61 | | | | (2.25 | ) |
| | |
|
|
|
Less distributions from: | | | | | | | | | | | | | | | | | | | | |
Net investment income | | | (.68 | ) | | | (.95 | ) | | | (1.21 | ) | | | (.02 | ) | | | (2.14 | ) |
Net realized gains | | | — | | | | (.67 | ) | | | (.82 | ) | | | (.24 | ) | | | (.51 | ) |
| | |
|
|
|
Total distributions | | | (.68 | ) | | | (1.62 | ) | | | (2.03 | ) | | | (.26 | ) | | | (2.65 | ) |
| | |
|
|
|
Net asset value, end of year | | $ | 16.55 | | | $ | 16.61 | | | $ | 15.33 | | | $ | 16.50 | | | $ | 14.15 | |
| | |
|
|
|
| | | | | |
Total returnb | | | 3.59% | | | | 20.10% | | | | 5.62% | | | | 18.72% | | | | (12.24)% | |
Ratios/supplemental data | | | | | | | | | | | | | | | | | | | | |
Net assets, end of year (000’s) | | $ | 72,833 | | | $ | 68,489 | | | $ | 51,002 | | | $ | 56,720 | | | $ | 66,049 | |
Ratios to average net assets: | | | | | | | | | | | | | | | | | | | | |
Expenses | | | .65% | | | | .68% | | | | .68% | | | | .65% | | | | .65% | |
Net investment income | | | 4.77% | | | | 5.48% | | | | 5.73% | | | | 6.28% | | | | 5.83% | |
Portfolio turnover rate | | | 38.37% | | | | 19.03% | | | | 23.68% | | | | 34.39% | | | | 19.30% | |
| a | Based on average daily shares outstanding. |
| b | Total return does not include any fees, charges or expenses imposed by the variable annuity and life insurance contracts for which the Franklin Templeton Variable Insurance Products Trust serves as an underlying investment vehicle. Total return is not annualized for periods less than one year. |
FZ10-4
FRANKLIN TEMPLETON VARIABLE INSURANCE PRODUCTS TRUST
FRANKLIN ZERO COUPON FUND – 2010
Financial Highlights (continued)
| | | | |
| | | Class 2
| |
| | | Period Ended | |
| | | 12/31/2003c
| |
Per share operating performance | | | | |
(for a share outstanding throughout the period) | | | | |
| |
Net asset value, beginning of period | | $ | 17.39 | |
| | |
|
|
|
Income from investment operations: | | | | |
Net investment incomea | | | .49 | |
Net realized and unrealized gains (losses) | | | (.68 | ) |
| | |
|
|
|
Total from investment operations | | | (.19 | ) |
Less distributions from net investment income | | | (.68 | ) |
| | |
|
|
|
Net asset value, end of period | | $ | 16.52 | |
| | |
|
|
|
| |
Total returnb | | | 3.40% | |
Ratios/supplemental data | | | | |
Net assets, end of period (000’s) | | $ | 11,649 | |
Ratios to average net assets: | | | | |
Expenses | | | .90% | |
Net investment income | | | 4.52% | |
Portfolio turnover rate | | | 38.37% | |
| a | Based on average daily shares outstanding. |
| b | Total return does not include any fees, charges or expenses imposed by the variable annuity and life insurance contracts for which the Franklin Templeton Variable Insurance Products Trust serves as an underlying investment vehicle. Total return is not annualized for periods less than one year. |
| c | For the period May 12, 2003 (effective date) to December 31, 2003. |
See notes to financial statements.
FZ10-5
FRANKLIN TEMPLETON VARIABLE INSURANCE PRODUCTS TRUST
FRANKLIN ZERO COUPON FUND – 2010
Statement of Investments, December 31, 2003
| | | | | | |
| | | PRINCIPAL
AMOUNT | | VALUE |
|
U.S. Government and Agency Securities 89.5% | | | | | | |
FHLMC, Strip, 7/15/10 | | $ | 11,150,000 | | $ | 8,522,001 |
FHLMC, Strip, 1/15/11 | | | 10,629,000 | | | 7,887,760 |
FICO, Strip, 19, 6/06/10 | | | 9,800,000 | | | 7,516,737 |
FICO, Strip, A, 8/08/10 | | | 7,000,000 | | | 5,319,062 |
FNMA, Strip, 8/12/09 | | | 1,975,000 | | | 1,595,508 |
FNMA, Strip, 8/01/10 | | | 8,250,000 | | | 6,118,390 |
FNMA, Strip, 8/12/10 | | | 1,230,000 | | | 933,250 |
REFCO, Strip, 10/15/10 | | | 10,000,000 | | | 7,627,140 |
SLMA, zero cpn., 5/15/14 | | | 8,650,000 | | | 3,979,631 |
Tennessee Valley Authority, Strip, 1/01/10 | | | 412,000 | | | 318,109 |
Tennessee Valley Authority, Strip, 4/15/10 | | | 12,000,000 | | | 9,181,068 |
Tennessee Valley Authority, Strip, 10/15/10 | | | 1,320,000 | | | 983,632 |
Tennessee Valley Authority, Strip, 1/15/11 | | | 10,669,000 | | | 7,802,133 |
Tennessee Valley Authority, Strip, 10/15/11 | | | 7,295,000 | | | 5,084,484 |
U.S. Treasury, Strip, 2/15/11 | | | 3,671,000 | | | 2,761,004 |
| | | | | |
|
|
Total U.S. Government and Agency Securities (Cost $65,688,173) | | | | | | 75,629,909 |
| | | | | |
|
|
Other Securities – AAA Rated 9.2% | | | | | | |
International Bank for Reconstruction and Development, 2/15/11 | | | 1,392,000 | | | 990,180 |
International Bank for Reconstruction and Development, 2/15/12 | | | 2,800,000 | | | 1,864,430 |
International Bank for Reconstruction and Development, 2/15/13 | | | 3,287,000 | | | 2,050,585 |
International Bank for Reconstruction and Development, 8/15/13 | | | 4,100,000 | | | 2,471,529 |
International Bank for Reconstruction and Development, Series 2, 2/15/11 | | | 500,000 | | | 355,668 |
| | | | | |
|
|
Total Other Securities – AAA Rated (Cost $6,529,530) | | | | | | 7,732,392 |
| | | | | |
|
|
Total Long Term Investments (Cost $72,217,703) | | | | | | 83,362,301 |
| | | | | |
|
|
aRepurchase Agreements (Cost $585,733) .7% | | | | | | |
Joint Repurchase Agreement, .873%, 1/02/04 (Maturity Value $585,761)
| | | 585,733 | | | 585,733 |
ABN AMRO Bank, N.V., New York Branch (Maturity Value $54,570)
| | | | | | |
Banc of America Securities LLC (Maturity Value $54,570)
| | | | | | |
Barclays Capital Inc. (Maturity Value $38,971)
| | | | | | |
Bear, Stearns & Co. Inc. (Maturity Value $31,180)
| | | | | | |
BNP Paribas Securities Corp. (Maturity Value $54,570)
| | | | | | |
Deutsche Bank Securities Inc. (Maturity Value $54,570)
| | | | | | |
Dresdner Kleinwort Wasserstein Securities LLC (Maturity Value $54,570)
| | | | | | |
Goldman, Sachs & Co. (Maturity Value $31,180)
| | | | | | |
Greenwich Capital Markets Inc. (Maturity Value $47,870)
| | | | | | |
Lehman Brothers Inc. (Maturity Value $54,570)
| | | | | | |
Morgan Stanley & Co. Inc. (Maturity Value $54,570)
| | | | | | |
UBS Securities LLC (Maturity Value $54,570) | | | | | | |
Collateralized by U.S. Treasury Bills, Notes, Bonds, and U.S. Government Agency Securities | | | | | | |
| | | | | |
|
|
Total Investments (Cost $72,803,436) 99.4% | | | | | | 83,948,034 |
Other Assets, less Liabilities .6% | | | | | | 534,155 |
| | | | | |
|
|
Net Assets 100.0% | | | | | $ | 84,482,189 |
| | | | | |
|
|
| a | See Note 1(b) regarding joint repurchase agreement. |
See notes to financial statements.
FZ10-6
FRANKLIN TEMPLETON VARIABLE INSURANCE PRODUCTS TRUST
FRANKLIN ZERO COUPON FUND – 2010
Financial Statements
Statement of Assets and Liabilities
December 31, 2003
| | | | |
Assets: | | | | |
Investments in securities: | | | | |
Cost | | $ | 72,803,436 | |
| | |
|
|
|
Value | | | 83,948,034 | |
Receivables for capital shares sold | | | 629,812 | |
| | |
|
|
|
Total assets | | | 84,577,846 | |
| | |
|
|
|
Liabilities: | | | | |
Payables: | | | | |
Capital shares redeemed | | | 23,619 | |
Affiliates | | | 49,093 | |
Reports to shareholders | | | 4,646 | |
Professional fees | | | 15,751 | |
Other liabilities | | | 2,548 | |
| | |
|
|
|
Total liabilities | | | 95,657 | |
| | |
|
|
|
Net assets, at value | | $ | 84,482,189 | |
| | |
|
|
|
Net assets consist of: | | | | |
Undistributed net investment income | | $ | 3,892,403 | |
Net unrealized appreciation (depreciation) | | | 11,144,598 | |
Accumulated net realized gain (loss) | | | (594,118 | ) |
Capital shares | | | 70,039,306 | |
| | |
|
|
|
Net assets, at value | | $ | 84,482,189 | |
| | |
|
|
|
Class 1: | | | | |
Net assets, at value | | $ | 72,833,266 | |
| | |
|
|
|
Shares outstanding | | | 4,401,745 | |
| | |
|
|
|
Net asset value and offering price per share | | $ | 16.55 | |
| | |
|
|
|
Class 2: | | | | |
Net assets, at value | | $ | 11,648,923 | |
| | |
|
|
|
Shares outstanding | | | 705,228 | |
| | |
|
|
|
Net asset value and offering price per share | | $ | 16.52 | |
| | |
|
|
|
FZ10-7
See notes to financial statements.
FRANKLIN TEMPLETON VARIABLE INSURANCE PRODUCTS TRUST
FRANKLIN ZERO COUPON FUND – 2010
Financial Statements (continued)
Statement of Operations
for the year ended December 31, 2003
| | | | |
Investment income: | | | | |
Interest | | | $4,435,911 | |
| | |
|
|
|
Expenses: | | | | |
Management fees (Note 3) | | | 494,783 | |
Distribution fees – Class 2 (Note 3) | | | 11,039 | |
Transfer agent fees | | | 506 | |
Custodian fees | | | 805 | |
Reports to shareholders | | | 12,940 | |
Professional fees | | | 18,439 | |
Trustees’ fees and expenses | | | 760 | |
Other | | | 6,632 | |
| | |
|
|
|
Total expenses | | | 545,904 | |
| | |
|
|
|
Net investment income | | | 3,890,007 | |
| | |
|
|
|
Realized and unrealized gains (losses): | | | | |
Net realized gain (loss) from investments | | | (141,473) | |
Net unrealized appreciation (depreciation) on investments | | | (1,454,844) | |
| | |
|
|
|
Net realized and unrealized gain (loss) | | | (1,596,317 | ) |
| | |
|
|
|
Net increase (decrease) in net assets resulting from operations | | $ | 2,293,690 | |
| | |
|
|
|
See notes to financial statements.
FZ10-8
FRANKLIN TEMPLETON VARIABLE INSURANCE PRODUCTS TRUST
FRANKLIN ZERO COUPON FUND – 2010
Financial Statements (continued)
Statements of Changes in Net Assets
For the year ended December 31, 2003 and 2002
| | | | | | | | |
| | | 2003 | | | 2002 | |
| | |
| |
Increase (decrease) in net assets: | | | | | | | | |
Operations: | | | | | | | | |
Net investment income | | $ | 3,890,007 | | | $ | 3,095,573 | |
Net realized gain (loss) from investments | | | (141,473 | ) | | | (432,337 | ) |
Net unrealized appreciation (depreciation) on investments | | | (1,454,844 | ) | | | 7,466,700 | |
| | |
| |
Net increase (decrease) in net assets resulting from operations | | | 2,293,690 | | | | 10,129,936 | |
Distributions to shareholders from: | | | | | | | | |
Net investment income: | | | | | | | | |
Class 1 | | | (3,089,057 | ) | | | (3,019,579 | ) |
Class 2 | | | (3,871 | ) | | | — | |
Net realized gains-Class 1 | | | — | | | | (2,117,685 | ) |
| | |
| |
Total distributions to shareholders | | | (3,092,928 | ) | | | (5,137,264 | ) |
Capital share transactions: (Note 2) | | | | | | | | |
Class 1 | | | 5,013,338 | | | | 12,494,918 | ) |
Class 2 | | | 11,778,876 | | | | — | |
| | |
| |
Total capital share transactions | | | 16,792,214 | | | | 12,494,918 | |
Net increase (decrease) in net assets | | | 15,992,976 | | | | 17,487,590 | |
Net assets: | | | | | | | | |
Beginning of year | | | 68,489,213 | | | | 51,001,623 | |
| | |
| |
End of year | | $ | 84,482,189 | | | $ | 68,489,213 | |
| | |
| |
Undistributed net investment income included in net assets: | | | | | | | | |
End of year | | $ | 3,892,403 | | | $ | 3,095,324 | |
| | |
| |
See notes to financial statements.
FZ10-9
FRANKLIN TEMPLETON VARIABLE INSURANCE PRODUCTS TRUST
FRANKLIN ZERO COUPON FUND – 2010
Notes to Financial Statements
1. ORGANIZATION AND SIGNIFICANT ACCOUNTING POLICIES
Franklin Templeton Variable Insurance Products Trust (the Trust) is registered under the Investment Company Act of 1940 as an open-end investment company, consisting of twenty-two separate series (the Funds). The Franklin Zero Coupon Fund-2010 (the Fund) included in this report is diversified. Shares of the Fund are sold only to insurance company separate accounts to fund the benefits of variable life insurance policies or variable annuity contracts. As of December 31, 2003, over 86% of the total Fund’s shares were sold through one insurance company. The Fund’s investment objective is current income.
The following summarizes the Fund’s significant accounting policies.
a. Security Valuation
Securities listed or traded on a recognized national exchange or NASDAQ are valued at the last reported sales price. Over-the-counter securities and listed securities for which no sale is reported are valued within the range of the latest quoted bid and asked prices. If events occur that materially affect the values of securities after the prices are determined, or if market quotations are not readily available, the securities will be valued at fair value as determined following procedures approved by the Board of Trustees.
b. Joint Repurchase Agreements
The Fund may enter into a joint repurchase agreement whereby its uninvested cash balance is deposited into a joint cash account to be used to invest in one or more repurchase agreements. The value and face amount of the joint repurchase agreement are allocated to the Fund based on its pro-rata interest. A repurchase agreement is accounted for as a loan by the Fund to the seller, collateralized by securities which are delivered to the Fund’s custodian. The market value, including accrued interest, of the initial collateralization is required to be at least 102% of the dollar amount invested by the Fund, with the value of the underlying securities marked to market daily to maintain coverage of at least 100%. At December 31, 2003, all repurchase agreements had been entered into on that date.
c. Income Taxes
No provision has been made for income taxes because the Fund’s policy is to qualify as a regulated investment company under the Internal Revenue Code and to distribute substantially all of its taxable income.
d. Security Transactions, Investment Income, Expenses and Distributions
Security transactions are accounted for on trade date. Realized gains and losses on security transactions are determined on a specific identification basis. Interest income and estimated expenses are accrued daily. Discounts on securities purchased are amortized over the lives of the respective securities. Distributions to shareholders are recorded on the ex-dividend date.
Common expenses incurred by the Trust are allocated among the Funds based on the ratio of net assets of each fund to the combined net assets. Other expenses are charged to each fund on a specific identification basis.
Realized and unrealized gains and losses and net investment income, other than class specific expenses, are allocated daily to each class of shares based upon the relative proportion of net assets of each class.
e. Accounting Estimates
The preparation of financial statements in accordance with accounting principles generally accepted in the United States of America requires management to make estimates and assumptions that affect the reported amounts of assets and liabilities at the date of the financial statements and the amounts of income and expenses during the reporting period. Actual results could differ from those estimates.
FZ10-10
FRANKLIN TEMPLETON VARIABLE INSURANCE PRODUCTS TRUST
FRANKLIN ZERO COUPON FUND – 2010
Notes to Financial Statements (continued)
1. ORGANIZATION AND SIGNIFICANT ACCOUNTING POLICIES (cont.)
f. Guarantees and Indemnifications
Under the Trust’s organizational documents, its officers and trustees are indemnified against certain liability arising out of the performance of their duties to the Trust. Additionally, in the normal course of business, the Trust enters into contracts with service providers that contain general indemnification clauses. The Trust’s maximum exposure under these arrangements is unknown as this would involve future claims that may be made against the Trust that have not yet occurred. However, based on experience, the Trust expects the risk of loss to be remote.
2. SHARES OF BENEFICIAL INTEREST
Effective May 12, 2003, the Fund offers two classes of shares: Class 1 and Class 2. Outstanding shares before that date were designated as Class 1 shares. Each class of shares differs by its distribution fees, voting rights on matters affecting a single class and its exchange privilege.
At December 31, 2003, there were an unlimited number of shares authorized ($.01 par value). Transactions in the Fund’s shares were as follows:
| | | | | | | | | | | | | | |
| | | Year Ended December 31,
| |
| | | 2003
| | | 2002
| |
| Class 1 Shares: | | Shares
| | | Amount
| | | Shares
| | | Amount
| |
Shares sold | | 1,372,218 | | | $ | 23,091,741 | | | 2,523,146 | | | $ | 40,144,293 | |
Shares issued in reinvestment of distributions | | 180,120 | | | | 3,089,057 | | | 347,582 | | | | 5,137,264 | |
Shares redeemed | | (1,273,553 | ) | | | (21,167,460 | ) | | (2,073,783 | ) | | | (32,786,639 | ) |
| | |
| |
Net increase (decrease) | | 278,785 | | | $ | 5,013,338 | | | 796,945 | | | $ | 12,494,918 | |
| | |
| |
| Class 2 Shares: | | | | | | | | | | | | |
Shares sold | | 1,043,127 | | | $ | 17,281,578 | | | | | | | | |
Shares issued in reinvestment of distributions | | 226 | | | | 3,871 | | | | | | | | |
Shares redeemed | | (338,125 | ) | | | (5,506,573 | ) | | | | | | | |
| | |
| | | | | | | |
Net increase (decrease) | | 705,228 | | | $ | 11,778,876 | | | | | | | | |
| | |
| | | | | | | |
3. TRANSACTIONS WITH AFFILIATES
Certain officers and trustees of the Trust are also officers and/or directors of the following entities:
| | |
| Entity | | Affiliation |
|
Franklin Advisers Inc. (Advisers) | | Investment manager |
Franklin Templeton Services LLC (FT Services) | | Administrative manager |
Franklin/Templeton Distributors Inc. (Distributors) | | Principal underwriter |
Franklin/Templeton Investor Services LLC (Investor Services) | | Transfer agent |
The Fund pays an investment management fee to Advisers based on the average daily net assets of the Fund as follows:
| | |
| Annualized Fee Rate | | Net Assets |
|
| .625% | | First $100 million |
| .500% | | Over $100 million, up to and including $250 million |
| .450% | | Over $250 million, up to and including $10 billion |
Fees are further reduced on net assets over $10 billion.
FZ10-11
FRANKLIN TEMPLETON VARIABLE INSURANCE PRODUCTS TRUST
FRANKLIN ZERO COUPON FUND – 2010
Notes to Financial Statements (continued)
3. TRANSACTIONS WITH AFFILIATES (cont.)
Under an agreement with Advisors, FT Services provides administrative services to the Fund. The fee is paid by the Fund’s investment manager based on the average daily net assets, and is not an additional expense of the Fund.
The Fund reimburses Distributors up to .25% per year of its average daily net assets of Class 2, for costs incurred in marketing the Fund’s shares.
Investor Services, under terms of an agreement, performs shareholder servicing for the Fund and is not paid by the Fund for the services.
4. INCOME TAXES
At December 31, 2003, the Fund had tax basis capital losses of $573,310 which may be carried over to offset future capital gains. Such losses expire as follows:
| | | |
Capital loss carryovers expiring in: | | | |
2010 | | $ | 274,229 |
2011 | | | 299,081 |
| | |
|
|
| | | $ | 573,310 |
| | |
|
|
At December 31, 2003, the Fund deferred capital losses occurring subsequent to October 31, 2003 of $501. For tax purposes, such losses will be reflected in the year ending December 31, 2004.
Net investment income differs for financial statement and tax purposes primarily due to differing treatments of bond discounts.
Net realized gains (losses) differ for financial statement and tax purposes primarily due to differing treatments of wash sales and bond discounts.
The tax character of distributions paid during the years ended December 31, 2003 and 2002 was as follows:
| | | | | | |
| | | 2003
| | 2002
|
Distributions paid from: | | | | | | |
Ordinary Income | | $ | 3,092,928 | | $ | 3,247,895 |
Long term capital gain | | | — | | | 1,889,369 |
| | |
|
| |
|
|
| | | $ | 3,092,928 | | $ | 5,137,264 |
| | |
|
| |
|
|
At December 31, 2003, the cost of investments, net unrealized appreciation (depreciation), undistributed ordinary income and undistributed long term capital gains for income tax purposes were as follows:
| | | | |
Cost of Investments | | $ | 72,821,002 | |
| | |
|
|
|
Unrealized appreciation | | $ | 11,147,342 | |
Unrealized depreciation | | | (20,310 | ) |
| | |
|
|
|
Net unrealized appreciation (depreciation) | | $ | 11,127,032 | |
| | |
|
|
|
Undistributed ordinary income | | $ | 3,889,659 | |
Undistributed long-term capital gains | | | — | |
| | |
|
|
|
Distributable earnings | | $ | 3,889,659 | |
| | |
|
|
|
5. INVESTMENT TRANSACTIONS
Purchases and sales of securities (excluding short-term securities) for the year ended December 31, 2003, aggregated $43,557,857 and $30,210,251, respectively.
FZ10-12
FRANKLIN TEMPLETON VARIABLE INSURANCE PRODUCTS TRUST
FRANKLIN ZERO COUPON FUND – 2010
Notes to Financial Statements (continued)
6. REGULATORY MATTERS
On February 4, 2004, the Securities Division of the Office of the Secretary of the Commonwealth of Massachusetts filed an administrative complaint against Franklin Resources, Inc. and certain of its subsidiaries (the “Company”), alleging violations of the Massachusetts Uniform Securities Act. The complaint arises from activity that occurred in 2001 during which time an officer of a Company subsidiary was negotiating an agreement with an investor relating to investments in a mutual fund and a hedge fund.
The Company, in addition to other entities within Franklin Templeton Investments, has been named in shareholder class actions related to the matter described above. The Company believes that the claims made in the lawsuit are without merit and it intends to defend vigorously against the allegations. The Company and the Fund may be named in similar civil actions related to the matter described above.
In addition, as part of ongoing investigations by the U.S. Securities and Exchange Commission (the “SEC”), the U.S. Attorney for the Northern District of California, the New York Attorney General, the California Attorney General, the U.S. Attorney for the District of Massachusetts, the Florida Department of Financial Services, and the Commissioner of Securities and the Attorney General of the State of West Virginia, relating to certain practices in the mutual fund industry, including late trading, market timing and sales compensation arrangements, the Company and its subsidiaries, as well as certain current or former executives and employees of the Company, have received requests for information and/or subpoenas to testify or produce documents. The Company and its current employees are providing documents and information in response to these requests and subpoenas. In addition, the Company has responded to requests for similar kinds of information from regulatory authorities in some of the foreign countries where the Company conducts its global asset management business.
The Staff of the SEC has informed the Company that it intends to recommend that the Commission authorize an action against the Fund’s investment adviser and a senior executive officer relating to the frequent trading issues that are the subject of the SEC’s investigation. These issues were previously disclosed as being under investigation by government authorities and the subject of an internal inquiry by the Company in its Annual Report on Form 10-K and on its public website. The Company currently is in discussions with the SEC Staff in an effort to resolve the issues raised in their investigation. Such discussions are preliminary and the Fund’s management has been advised that the Company cannot predict the likelihood of whether those discussions will result in a settlement and, if so, the terms of such settlement. The impact, if any, of these matters on the Fund is uncertain at this time. If the Company finds that it bears responsibility for any unlawful or improper conduct, it has committed to making the Fund or its shareholders whole, as appropriate.
FZ10-13
FRANKLIN TEMPLETON VARIABLE INSURANCE PRODUCTS TRUST
FRANKLIN ZERO COUPON FUND – 2010
Independent Auditors’ Report
To the Board of Trustees and Shareholders of
Franklin Templeton Variable Insurance Products Trust
In our opinion, the accompanying statement of assets and liabilities, including the statement of investments, and the related statements of operations and of changes in net assets and the financial highlights present fairly, in all material respects, the financial position of the Franklin Zero Coupon Fund—2010 (the Fund) (one of the Funds constituting the Franklin Templeton Variable Insurance Products Trust) at December 31, 2003, the results of its operations for the year then ended, the changes in its net assets for each of the two years in the period then ended and the financial highlights for each of the periods presented, in conformity with accounting principles generally accepted in the United States of America. These financial statements and financial highlights (hereafter referred to as “financial statements”) are the responsibility of the Fund’s management; our responsibility is to express an opinion on these financial statements based on our audits. We conducted our audits of these financial statements in accordance with auditing standards generally accepted in the United States of America, which require that we plan and perform the audits to obtain reasonable assurance about whether the financial statements are free of material misstatement. An audit includes examining, on a test basis, evidence supporting the amounts and disclosures in the financial statements, assessing the accounting principles used and significant estimates made by management, and evaluating the overall financial statement presentation. We believe that our audits, which included confirmation of securities at December 31, 2003 by correspondence with the custodian and brokers, provide a reasonable basis for our opinion.
PricewaterhouseCoopers LLP
San Francisco, California
February 5, 2004, except for Note 6 as to which the date is February 12, 2004
FZ10-14
MUTUAL DISCOVERY SECURITIES FUND
Fund Goal and Primary Investments: Mutual Discovery Securities Fund seeks capital appreciation. The Fund invests mainly in U.S. and foreign equity securities (including securities convertible, or that the manager expects to become convertible, into common or preferred stock) of companies that the Fund’s manager believes are available at market prices less than their value based on certain recognized or objective criteria. The Fund may also invest a significant portion in small capitalization companies.
This annual report for Mutual Discovery Securities Fund covers the fiscal year ended December 31, 2003.
Performance Overview
You can find the Fund’s one-year total return in the Performance Summary following this report. Compared with its benchmarks over the same period, the Fund slightly outperformed the Standard & Poor’s 500 Composite Index’s (S&P 500’s) 28.67% return but underperformed the Morgan Stanley Capital International (MSCI) World Index’s 33.76% return.1
Economic and Market Overview
Early in 2003, economic uncertainty and geopolitical events pushed U.S. interest rates to their lowest level in more than four decades. The U.S. government injected fiscal stimulus into the economy, approving another round of tax cuts and rebates that included dividend and capital gains tax reductions. In June, an accommodative Federal Reserve Board, in an attempt to bolster the economy, cut the federal funds target rate to 1.00%.
During the year, the U.S. trade deficit increased significantly, contributing to the U.S. dollar’s fall to record lows against the euro and other major currencies. However, the weak dollar provided a boost to the U.S. economy and corporate profits as exports became cheaper for foreign buyers. Robust consumer spending, especially for autos and homes, and strong business spending, particularly for equipment and software, contributed to the accelerated economic activity. In addition, U.S. federal spending stayed firm and inflation remained benign. U.S. gross domestic product (GDP) grew an annualized 8.2% in third quarter 2003, its strongest pace in nearly 20 years, and overall, 2003 GDP grew an estimated 3.1%. As economic data improved, some interest rates rose from their lows, and the 10-year Treasury note’s yield ended the period at 4.27%.
1. Source: Standard & Poor’s Micropal. One cannot invest directly in an index, nor is an index representative of the Fund’s portfolio. Please see Index Descriptions following the Fund Summaries.
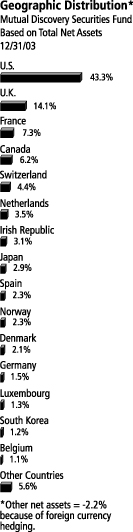
MD-1
Foreign economies also showed signs of recovery and benign inflation following a low growth and disinflationary environment that facilitated monetary easing in many major economies during the reporting period. While economic growth accelerated in the U.S., it remained strong in Asia, and was weak, yet positive, in Europe. Despite these signs of economic recovery, benign inflationary trends continued, supported by cyclical productivity gains and excess capacity in labor and capital.
A global equity market rally started in late March 2003 and continued through the end of the year. The rebound began with investors anticipating economic recovery in the second half of 2003, and it continued as data showed robust economic growth. Improved sentiment led many investors to rotate into economically sensitive and financially leveraged companies, specifically cyclical, technology, small-capitalization and emerging market stocks. Consequently, domestic and foreign equity markets generally performed well.
Investment Strategy
At Mutual Series, we follow a distinctive, three-pronged investment approach, which combines the purchase of undervalued equities with investments in distressed debt and risk arbitrage. We build the bulk of the portfolio by investing in undervalued common stock — stocks where we believe we are buying assets at a substantial discount to intrinsic or business value. We focus on situations where we believe there is limited downside risk, and the potential for substantial long-term appreciation; we believe successful investing is as much about avoiding and containing losses as it is about generating gains. We augment the Fund’s equity portfolio with investments in distressed securities and bankruptcy situations. As with equities, we undertake our own rigorous fundamental analysis of each situation and focus our efforts on situations where we believe there is limited risk and substantial upside potential. Lastly, the Fund will invest in arbitrage situations, another highly specialized field. In arbitrage investing, we generally seek to invest in companies in the process of being acquired, or undergoing mergers. By buying those shares at a discount to the announced deal value, the Fund seeks to earn a return as that discount narrows and the transaction is completed.
We will migrate the Fund’s capital toward the areas where we find the most compelling opportunities at any given moment. Typically, the bulk of the Fund’s assets will be invested in equities, while distressed investing and arbitrage will each represent a much smaller portion of the Fund. We may also hold a significant portion of the Fund’s assets in cash or high-quality, short-term debt instruments when other invest - -
Top 10 Sectors/Industries
Mutual Discovery Securities Fund
Based on Equity Securities
12/31/03
| | |
| | | % of Total
Net Assets |
|
| |
| Tobacco | | 8.9% |
| |
| Insurance | | 8.1% |
| |
| Media | | 7.4% |
| |
| Beverages | | 7.0% |
| |
| Metals & Mining | | 6.3% |
| |
| Food Products | | 5.7% |
| |
| Diversified Financial Services | | 4.9% |
| |
| Commercial Banks | | 4.4% |
| |
| Chemicals | | 3.4% |
| |
| Diversified Telecommunication Services | | 3.1% |
MD-2
ment opportunities are not sufficiently compelling. As a global fund, Mutual Discovery Securities Fund will seek out opportunities around the world, with an emphasis on developed markets — markets where we believe the political risks are low and potential returns are attractive. We will generally seek to hedge the Fund’s currency exposure when we believe it is advantageous to do so, in order to focus our efforts on analyzing business fundamentals and assessing the value of the company’s assets and liabilities.
Manager’s Discussion
Several of the most significant contributors to the Fund’s performance during the year under review were from our distressed portfolio, such as NTL, International Steel Group (ISG), Telewest Communications and Adelphia Communications. In January 2003, NTL emerged from bankruptcy. In the process, our bonds were converted into the new company’s equity, and share prices subsequently rose. ISG was formed to purchase selected steel assets from bankrupt U.S. steel companies. ISG went public in December 2003, resulting in investment appreciation. Telewest and Adelphia bond prices rose as the companies progressed through their respective bankruptcy processes.
Within equities, White Mountains Insurance Group was one of the Fund’s largest contributors during the period. Our investment in White Mountains reflects our focus on companies with strong or improving fundamentals, attractive valuations and management teams who think like owners. During 2003, the company benefited from strong price increases for primary and reinsurance risks, disciplined underwriting and solid returns from its investment portfolio. While many companies within the P&C insurance industry struggled with eroding capital from past underwriting mistakes and significant losses in their investment portfolios, we believe White Mountains utilized its much-improved balance sheet and industry knowledge to acquire insurance companies we believe are undervalued or capital-constrained and to increase exposure to what we feel are its most attractive lines of businesses. Primarily as a result of these actions, the company continued to improve profitability and enjoyed a 13% increase in its book value during 2003.
Also contributing positively to the Fund was SES Global, which offers global satellite services primarily to broadcasters, cable television networks and broadband telecommunications companies. We purchased most of the Fund’s position in a single block trade from another company, which was divesting non-core holdings to shore up its balance
Top 10 Equity Holdings
Mutual Discovery Securities Fund
12/31/03
| | |
Company
Sector/Industry,
Country | | % of Total
Net Assets |
|
| |
| Berkshire Hathaway Inc., A & B | | 3.2% |
| Insurance, U.S. | | |
| |
| British American Tobacco PLC | | 3.1% |
| Tobacco, U.K. | | |
| |
| Altadis SA | | 2.0% |
| Tobacco, Spain | | |
| |
| Newmont Mining Corp. | | 2.0% |
| Metals & Mining, U.S. | | |
| |
| Vinci SA | | 2.0% |
| Construction & Engineering, France | | |
| |
| Groupe Danone | | 2.0% |
| Food Products, France | | |
| |
Imperial Tobacco Group PLC | | 1.9% |
| Tobacco, U.K. | | |
| |
| NTL Inc. | | 1.6% |
| Diversified Telecommunication Services, U.K. | | |
| |
| Diageo PLC | | 1.6% |
| Beverages, U.K. | | |
| |
| Liberty Media Corp., A | | 1.6% |
| Media, U.S. | | |
The dollar value, number of shares or principal amount, and complete legal titles of all portfolio holdings are listed in the Fund’s Statement of Investments.
MD-3
sheet. This is an excellent example of a situation where keeping a cash reserve enabled the Fund to take advantage of an opportunity that arose quickly. As SES generated improved free cash flow, reduced balance sheet debt and signed contracts for additional satellite capacity, and as the technical pressure due to the forced sale abated, the company’s shares rose, resulting in a Fund gain.
Detracting from Fund performance during the reporting period were Allied Domecq (sold by year-end), one of the world’s largest spirits and wine companies; Abitibi-Consolidated, a Canadian paper and forest products company; and Beiersdorf, a German personal care products company. Allied Domecq’s stock declined after the company lowered its earnings outlook in February due to a weak U.S. dollar, higher pension expenses and weakness in its Spanish operations. Abitibi’s shares underperformed in 2003 after a weak U.S. dollar, soft sales and higher energy prices forced the company to reduce its earnings outlook and cut its dividend. Beiersdorf, which owns leading skin care brand Nivea, had been the subject of takeover speculation earlier in the year. Beiersdorf’s shares declined after the company’s major shareholders announced it would remain independent and not be sold.
Because the Fund generally hedges its foreign currency exposure, periods of a rising U.S. dollar should benefit relative performance, but a falling dollar should dampen relative performance, as was the case in 2003. Because we believed there were structural imbalances that placed the dollar at risk, we reduced the Fund’s hedges in 2003, which helped the Fund’s relative performance. We remained underhedged at year-end (we consider approximately 85% to be fully hedged).
Thank you for your participation in Mutual Discovery Securities Fund. We look forward to serving your future investment needs.
This discussion reflects our analysis, opinions and portfolio holdings as of December 31, 2003, the end of the reporting period. The way we implement our main investment strategies and the resulting portfolio holdings may change depending on factors such as market and economic conditions. These opinions may not be relied upon as investment advice or an offer for a particular security. The information is not a complete analysis of every aspect of any market, country, industry, security or the Fund. Statements of fact are from sources considered reliable, but the advisor makes no representation or warranty as to their completeness or accuracy. Although historical performance is no guarantee of future results, these insights may help you understand our investment management philosophy.
MD-4
PERFORMANCE SUMMARYASOF 12/31/03
Total return of Class 2 shares represents the average annual change in value, assuming reinvestment of dividends and capital gains. Average returns smooth out variations in returns, which can be significant; they are not the same as year-by-year results.
Mutual Discovery Securities Fund – Class 2*
Periods ended 12/31/03
| | | | | | |
| | | 1-Year | | 5-Year | | Since
Inception
(11/8/96) |
|
| | | |
Average Annual Total Return | | +28.99% | | +9.78% | | +8.94% |
*Because Class 2 shares were not offered until 1/6/99, standardized Class 2 Fund performance for prior periods represents the historical results of Class 1 shares. For periods beginning on 1/6/99, Class 2’s results reflect an additional 12b-1 fee expense, which also affects future performance. Since 1/6/99 (effective date), the average annual total return of Class 2 shares was +9.12%.
Ongoing market volatility can significantly affect short-term performance; recent returns may differ.
Total Return Index Comparison
for Hypothetical $10,000 Investment (11/8/96–12/31/03)
The graph compares the performance of Mutual Discovery Securities Fund – Class 2,* the S&P 500 and the MSCI World Index. One cannot invest directly in an index, nor is an index representative of the Fund’s portfolio. Please see Important Notes to Performance Information preceding the Fund Summaries.
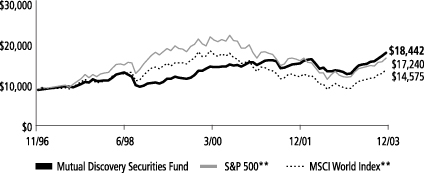
**Source: Standard & Poor’s Micropal. Please see Index Descriptions following the Fund Summaries.
Mutual Discovery Securities Fund – Class 2
Performance reflects the Fund’s Class 2 operating expenses, but does not include any contract fees, expenses or sales charges. If they had been included, performance would be lower. These charges and deductions, particularly for variable life policies, can have a significant effect on contract values and insurance benefits. See the contract prospectus for a complete description of these expenses, including sales charges.
Since markets can go down as well as up, investment return and the value of your principal will fluctuate with market conditions, and you may have a gain or loss when you sell your shares.
MD-5
Past performance does not guarantee future results.
FRANKLIN TEMPLETON VARIABLE INSURANCE PRODUCTS TRUST
MUTUAL DISCOVERY SECURITIES FUND
Financial Highlights
| | | | | | | | | | | | | | | | | | | | |
| | | Class 1
| |
| | | Year Ended December 31,
| |
| | | 2003
| | | 2002
| | | 2001
| | | 2000
| | | 1999
| |
Per share operating performance | | | | | | | | | | | | | | | | | | | | |
(for a share outstanding throughout the year) | | | | | | | | | | | | | | | | | | | | |
Net asset value, beginning of year | | $ | 11.06 | | | $ | 12.56 | | | $ | 14.55 | | | $ | 13.57 | | | $ | 11.29 | |
| | |
|
|
|
Income from investment operations: | | | | | | | | | | | | | | | | | | | | |
Net investment incomea | | | .19 | | | | .19 | | | | .24 | | | | .26 | | | | .17 | |
Net realized and unrealized gains (losses) | | | 3.01 | | | | (1.28 | ) | | | (.08 | ) | | | 1.14 | | | | 2.48 | |
| | |
|
|
|
Total from investment operations | | | 3.20 | | | | (1.09 | ) | | | .16 | | | | 1.40 | | | | 2.65 | |
| | |
|
|
|
Less distributions from: | | | | | | | | | | | | | | | | | | | | |
Net investment income | | | (.22 | ) | | | (.19 | ) | | | (.30 | ) | | | (.42 | ) | | | (.37 | ) |
Net realized gains | | | — | | | | (.22 | ) | | | (1.85 | ) | | | — | | | | — | |
| | |
|
|
|
Total distributions | | | (.22 | ) | | | (.41 | ) | | | (2.15 | ) | | | (.42 | ) | | | (.37 | ) |
| | |
|
|
|
Net asset value, end of year | | $ | 14.04 | | | $ | 11.06 | | | $ | 12.56 | | | $ | 14.55 | | | $ | 13.57 | |
| | |
|
|
|
| | | | | |
Total returnb | | | 29.19% | | | | (9.06)% | | | | .39% | | | | 10.45% | | | | 23.76% | |
| | | | | |
Ratios/supplemental data | | | | | | | | | | | | | | | | | | | | |
Net assets, end of year (000’s) | | $ | 134,332 | | | $ | 122,011 | | | $ | 164,527 | | | $ | 191,051 | | | $ | 202,777 | |
Ratios to average net assets:* | | | | | | | | | | | | | | | | | | | | |
Expensesc | | | 1.04% | | | | 1.03% | | | | 1.02% | | | | 1.02% | | | | 1.01% | |
Net investment income | | | 1.48% | | | | 1.55% | | | | 1.76% | | | | 1.80% | | | | 1.42% | |
Portfolio turnover rate | | | 41.52% | | | | 47.46% | | | | 64.58% | | | | 74.77% | | | | 104.69% | |
*Ratios to average net assets, excluding dividend expense on securities sold short: Expenses | | | 1.01% | | | | 1.02% | | | | 1.00% | | | | .98% | | | | .99% | |
aBased on average daily shares outstanding.
bTotal return does not include any fees, charges or expenses imposed by the variable annuity and life insurance contracts for which the Franklin Templeton Variable Insurance Products Trust serves as an underlying investment vehicle. Total return is not annualized for periods less than one year.
cIncludes dividend expense on securities sold short which varies from period to period. See below for expense ratios that reflect consistent operating expenses.
MD-6
FRANKLIN TEMPLETON VARIABLE INSURANCE PRODUCTS TRUST
MUTUAL DISCOVERY SECURITIES FUND
Financial Highlights (continued)
| | | | | | | | | | | | | | | | | | | | |
| | | Class 2
| |
| | | Year Ended December 31,
| |
| | | 2003
| | | 2002
| | | 2001
| | | 2000
| | | 1999d
| |
Per share operating performance | | | | | | | | | | | | | | | | | | | | |
(for a share outstanding throughout the year) | | | | | | | | | | | | | | | | | | | | |
Net asset value, beginning of year | | $ | 10.97 | | | $ | 12.50 | | | $ | 14.50 | | | $ | 13.54 | | | $ | 11.65 | |
| | |
|
|
| |
|
|
| |
|
|
| |
|
|
| |
|
|
|
Income from investment operations: | | | | | | | | | | | | | | | | | | | | |
Net investment incomea | | | .13 | | | | .16 | | | | .13 | | | | .22 | | | | .11 | |
Net realized and unrealized gains (losses) | | | 3.02 | | | | (1.29 | ) | | | .01 | | | | 1.14 | | | | 2.15 | |
| | |
|
|
| |
|
|
| |
|
|
| |
|
|
| |
|
|
|
Total from investment operations | | | 3.15 | | | | (1.13 | ) | | | .14 | | | | 1.36 | | | | 2.26 | |
| | |
|
|
| |
|
|
| |
|
|
| |
|
|
| |
|
|
|
Less distributions from: | | | | | | | | | | | | | | | | | | | | |
Net investment income | | | (.22 | ) | | | (.18 | ) | | | (.29 | ) | | | (.40 | ) | | | (.37 | ) |
Net realized gains | | | — | | | | (.22 | ) | | | (1.85 | ) | | | — | | | | — | |
| | |
|
|
| |
|
|
| |
|
|
| |
|
|
| |
|
|
|
Total distributions | | | (.22 | ) | | | (.40 | ) | | | (2.14 | ) | | | (.40 | ) | | | (.37 | ) |
| | |
|
|
| |
|
|
| |
|
|
| |
|
|
| |
|
|
|
Net asset value, end of year | | $ | 13.90 | | | $ | 10.97 | | | $ | 12.50 | | | $ | 14.50 | | | $ | 13.54 | |
| | |
|
|
| |
|
|
| |
|
|
| |
|
|
| |
|
|
|
| | | | | |
Total returnb | | | 28.99% | | | | (9.40)% | | | | .24% | | | | 10.21% | | | | 19.68% | |
| | | | | |
Ratios/supplemental data | | | | | | | | | | | | | | | | | | | | |
Net assets, end of year (000’s) | | $ | 160,371 | | | $ | 37,241 | | | $ | 5,681 | | | $ | 1,035 | | | $ | 413 | |
Ratios to average net assets:* | | | | | | | | | | | | | | | | | | | | |
Expensesc | | | 1.29% | | | | 1.28% | | | | 1.27% | | | | 1.27% | | | | 1.27% | e |
Net investment income | | | 1.23% | | | | 1.30% | | | | 1.03% | | | | 1.59% | | | | .94% | e |
Portfolio turnover rate | | | 41.52% | | | | 47.46% | | | | 64.58% | | | | 74.77% | | | | 104.69% | |
*Ratios to average net assets, excluding dividend expense on securities sold short: | | | | | | | | | | | | | | | | | | | | |
Expenses | | | 1.26% | | | | 1.27% | | | | 1.25% | | | | 1.23% | | | | 1.27%e | |
| a | Based on average daily shares outstanding. |
| b | Total return does not include any fees, charges or expenses imposed by the variable annuity and life insurance contracts for which the Franklin Templeton Variable Insurance Products Trust serves as an underlying investment vehicle. Total return is not annualized for periods less than one year. |
| c | Includes dividend expense on securities sold short which varies from period to period. See below for expense ratios that reflect consistent operating expenses. |
| d | For the period January 6, 1999 (effective date) to December 31, 1999. |
See notes to financial statements.
MD-7
FRANKLIN TEMPLETON VARIABLE INSURANCE PRODUCTS TRUST
MUTUAL DISCOVERY SECURITIES FUND
Statement of Investments, December 31, 2003
| | | | | | | |
| | | COUNTRY | | SHARES/ WARRANTS/ CONTRACTS | | VALUE |
|
Common Stocks and Other Equity Interests 79.6% | | | | | | | |
Aerospace & Defense .5% | | | | | | | |
Northrop Grumman Corp. | | United States | | 16,200 | | $ | 1,548,720 |
| | | | | | |
|
|
Airlines | | | | | | | |
aAtlantic Coast Airlines Holdings Inc. | | United States | | 1,800 | | | 17,820 |
| | | | | | |
|
|
Auto Components .4% | | | | | | | |
NGK Spark Plug Co. Ltd. | | Japan | | 7,000 | | | 56,760 |
Trelleborg AB, B | | Sweden | | 72,941 | | | 1,186,066 |
| | | | | | |
|
|
| | | | | | | | 1,242,826 |
| | | | | | |
|
|
Beverages 7.0% | | | | | | | |
Brown-Forman Corp., A | | United States | | 3,700 | | | 358,715 |
Brown-Forman Corp., B | | United States | | 10,780 | | | 1,007,391 |
aCarlsberg AS, A | | Denmark | | 3,500 | | | 144,076 |
Carlsberg AS, B | | Denmark | | 77,700 | | | 3,580,190 |
Coca-Cola Enterprises Inc. | | United States | | 15,500 | | | 338,985 |
Diageo PLC | | United Kingdom | | 355,440 | | | 4,676,758 |
Fomento Economico Mexicano SA de CV Femsa, ADR | | Mexico | | 60,300 | | | 2,223,864 |
Heineken Holding NV, A | | Netherlands | | 67,110 | | | 2,296,537 |
Kirin Brewery Co. Ltd. | | Japan | | 24,900 | | | 212,360 |
Molson Inc., A | | Canada | | 59,200 | | | 1,653,798 |
Orkla ASA | | Norway | | 173,270 | | | 3,880,656 |
Pepsi Bottling Group Inc. | | United States | | 9,500 | | | 229,710 |
| | | | | | |
|
|
| | | | | | | | 20,603,040 |
| | | | | | |
|
|
Biotechnology | | | | | | | |
aSICOR Inc. | | United States | | 1,600 | | | 43,520 |
| | | | | | |
|
|
Capital Markets .5% | | | | | | | |
C.I. Fund Management Inc. | | Canada | | 124,800 | | | 1,355,923 |
| | | | | | |
|
|
Chemicals 3.4% | | | | | | | |
Akzo Nobel NV | | Netherlands | | 48,130 | | | 1,857,692 |
Givaudan AG | | Switzerland | | 6,750 | | | 3,503,942 |
MG Technologies AG | | Germany | | 103,800 | | | 1,453,305 |
Solvay SA | | Belgium | | 29,070 | | | 2,520,891 |
Syngenta AG | | Switzerland | | 10,460 | | | 704,522 |
| | | | | | |
|
|
| | | | | | | | 10,040,352 |
| | | | | | |
|
|
Commercial Banks 4.5% | | | | | | | |
Allied Irish Banks PLC | | Irish Republic | | 276,700 | | | 4,425,525 |
aBanca Nazionale del Lavoro SpA | | Italy | | 224,600 | | | 536,853 |
Bank of Ireland | | Irish Republic | | 171,170 | | | 2,329,622 |
Danske Bank | | Denmark | | 101,550 | | | 2,382,571 |
DNB NOR ASA | | Norway | | 371,340 | | | 2,481,070 |
Fleet Boston Financial Corp. | | United States | | 5,500 | | | 240,075 |
KeyCorp | | United States | | 24,800 | | | 727,136 |
a,bNippon Investment LLC | | Japan | | 477,000 | | | 181,260 |
| | | | | | |
|
|
| | | | | | | | 13,304,112 |
| | | | | | |
|
|
MD-8
FRANKLIN TEMPLETON VARIABLE INSURANCE PRODUCTS TRUST
MUTUAL DISCOVERY SECURITIES FUND
Statement of Investments, December 31, 2003 (cont.)
| | | | | | | |
| | | COUNTRY | | SHARES/ WARRANTS/ CONTRACTS | | VALUE |
|
Common Stocks and Other Equity Interests (cont.) | | | | | | | |
Commercial Services & Supplies .7% | | | | | | | |
aAlderwoods Group Inc. | | United States | | 26,228 | | $ | 247,068 |
aCendant Corp. | | United States | | 45,300 | | | 1,008,831 |
Republic Services Inc. | | United States | | 37,100 | | | 950,873 |
| | | | | | |
|
|
| | | | | | | | 2,206,772 |
| | | | | | |
|
|
Computers & Peripherals | | | | | | | |
aDecisionOne Corp. | | United States | | 5,288 | | | 10,576 |
| | | | | | |
|
|
Construction & Engineering 2.0% | | | | | | | |
Vinci SA | | France | | 70,180 | | | 5,811,449 |
| | | | | | |
|
|
Construction Materials .8% | | | | | | | |
Ciments Francais SA | | France | | 22,650 | | | 1,585,614 |
RMC Group PLC | | United Kingdom | | 56,800 | | | 709,225 |
| | | | | | |
|
|
| | | | | | | | 2,294,839 |
| | | | | | |
|
|
Diversified Financial Services 4.9% | | | | | | | |
Brascan Corp., A | | Canada | | 92,700 | | | 2,850,045 |
E-L Financial Corp. Ltd. | | Canada | | 7,400 | | | 1,732,250 |
a,bElephant Capital Holdings Ltd. | | Japan | | 746 | | | 745,500 |
Euronext | | Netherlands | | 82,200 | | | 2,080,921 |
aIrish Life & Permanent PLC | | Irish Republic | | 147,300 | | | 2,368,914 |
a,bLeucadia National Corp. | | United States | | 34,780 | | | 1,523,190 |
Pargesa Holdings SA | | Switzerland | | 1,147 | | | 3,060,522 |
| | | | | | |
|
|
| | | | | | | | 14,361,342 |
| | | | | | |
|
|
Diversified Telecommunication Services 3.1% | | | | | | | |
a,b,cAboveNet Inc. | | United States | | 3,103 | | | 92,948 |
BCE Inc. | | Canada | | 46,400 | | | 1,037,694 |
Chunghwa Telecom Co. Ltd., ADR | | Taiwan | | 55,045 | | | 798,152 |
Global Crossing Holdings Ltd., Contingent Equity Distribution | | United States | | 2,239,973 | | | 1,959 |
aGlobal Crossing Ltd. | | United States | | 3,405 | | | 112,370 |
aKoninklijke KPN NV | | Netherlands | | 174,400 | | | 1,346,276 |
a,bNTL Inc. | | United Kingdom | | 30,150 | | | 1,997,814 |
aNTL Inc. | | United Kingdom | | 39,981 | | | 2,788,675 |
aSpectrasite Inc. | | United States | | 25,062 | | | 870,905 |
aXO Communications Inc. | | United States | | 49,930 | | | 212,203 |
| | | | | | |
|
|
| | | | | | | | 9,258,996 |
| | | | | | |
|
|
Electric Utilities 1.0% | | | | | | | |
E.ON AG | | Germany | | 25,950 | | | 1,699,778 |
a,bPG & E Corp., wts., 9/02/06 | | United States | | 667 | | | 16,664 |
aReliant Resources Inc. | | United States | | 164,000 | | | 1,207,040 |
| | | | | | |
|
|
| | | | | | | | 2,923,482 |
| | | | | | |
|
|
Food & Staples Retailing .4% | | | | | | | |
aKroger Co. | | United States | | 42,600 | | | 788,526 |
aSafeway Inc. | | United States | | 16,200 | | | 354,942 |
| | | | | | |
|
|
| | | | | | | | 1,143,468 |
| | | | | | |
|
|
MD-9
FRANKLIN TEMPLETON VARIABLE INSURANCE PRODUCTS TRUST
MUTUAL DISCOVERY SECURITIES FUND
Statement of Investments, December 31, 2003 (cont.)
| | | | | | | |
| | | COUNTRY | | SHARES/ WARRANTS/ CONTRACTS | | VALUE |
|
Common Stocks and Other Equity Interests (cont.) | | | | | | | |
Food Products 5.7% | | | | | | | |
Cadbury Schweppes PLC | | United Kingdom | | 402,627 | | $ | 2,956,942 |
Farmer Brothers Co. | | United States | | 4,200 | | | 1,307,250 |
Groupe Danone | | France | | 35,475 | | | 5,790,193 |
aKoninklijke Numico NV | | Netherlands | | 46,100 | | | 1,274,030 |
Lotte Confectionary Co. Ltd. | | South Korea | | 2,812 | | | 1,058,483 |
Nestle SA | | Switzerland | | 17,360 | | | 4,337,368 |
Weetabix Ltd., A | | United Kingdom | | 1,200 | | | 113,854 |
| | | | | | |
|
|
| | | | | | | | 16,838,120 |
| | | | | | |
|
|
Gas Utilities .2% | | | | | | | |
Tokyo Gas Co. Ltd. | | Japan | | 173,800 | | | 619,498 |
| | | | | | |
|
|
Health Care Equipment & Supplies .1% | | | | | | | |
Amersham PLC | | United Kingdom | | 21,800 | | | 298,740 |
| | | | | | |
|
|
Health Care Providers & Services 1.1% | | | | | | | |
aAdvancePCS | | United States | | 2,200 | | | 115,852 |
HCA Inc. | | United States | | 15,100 | | | 648,696 |
a,cKindred Healthcare Inc. | | United States | | 28,754 | | | 1,419,901 |
a,cKindred Healthcare Inc., Jul. 47.50 Calls, 7/11/11 | | United States | | 46 | | | 20,608 |
a,cKindred Healthcare Inc., Jan. 52.00 Calls, 1/01/12 | | United States | | 7 | | | — |
a,cKindred Healthcare Inc., wts., Series A, 4/20/06 | | United States | | 5,258 | | | 122,280 |
a,cKindred Healthcare Inc., wts., Series B, 4/20/06 | | United States | | 13,145 | | | 275,355 |
aLaboratory Corp. of America Holdings | | United States | | 5,100 | | | 188,445 |
aMid Atlantic Medical Services Inc. | | United States | | 1,600 | | | 103,680 |
aRotech Healthcare Inc. | | United States | | 8,060 | | | 185,380 |
aWellpoint Health Networks Inc. | | United States | | 1,200 | | | 116,388 |
| | | | | | |
|
|
| | | | | | | | 3,196,585 |
| | | | | | |
|
|
Hotels Restaurants & Leisure .2% | | | | | | | |
Cara Operations Ltd. | | Canada | | 500 | | | 2,782 |
Cara Operations Ltd., A | | Canada | | 27,000 | | | 147,928 |
aFHC Delaware Inc. | | United States | | 49,920 | | | 392,870 |
| | | | | | |
|
|
| | | | | | | | 543,580 |
| | | | | | |
|
|
Household Products .4% | | | | | | | |
KAO Corp. | | Japan | | 65,300 | | | 1,328,301 |
| | | | | | |
|
|
Insurance 8.2% | | | | | | | |
aAlleghany Corp. | | United States | | 3,614 | | | 804,115 |
aBerkshire Hathaway Inc., A | | United States | | 45 | | | 3,791,250 |
aBerkshire Hathaway Inc., B | | United States | | 2,000 | | | 5,630,000 |
Guinness Peat Group PLC | | New Zealand | | 271,000 | | | 332,721 |
Hartford Financial Services Group Inc. | | United States | | 32,000 | | | 1,888,960 |
IPC Holdings Ltd. | | Bermuda | | 15,500 | | | 603,570 |
John Hancock Financial Services Inc. | | United States | | 9,000 | | | 337,500 |
aMontpelier Re Holdings Ltd. | | Bermuda | | 4,857 | | | 178,252 |
Old Republic International Corp. | | United States | | 54,300 | | | 1,377,048 |
a,bOlympus Re Holdings Ltd. | | Bermuda | | 2,140 | | | 338,484 |
Prudential Financial Inc. | | United States | | 33,200 | | | 1,386,764 |
Travelers Property Casualty Corp., A | | United States | | 164,050 | | | 2,752,759 |
United Fire & Casualty Co. | | United States | | 14,700 | | | 593,292 |
White Mountains Insurance Group Inc. | | United States | | 6,200 | | | 2,851,690 |
bWhite Mountains Insurance Group Inc. | | United States | | 2,796 | | | 1,221,719 |
| | | | | | |
|
|
| | | | | | | | 24,088,124 |
| | | | | | |
|
|
MD-10
FRANKLIN TEMPLETON VARIABLE INSURANCE PRODUCTS TRUST
MUTUAL DISCOVERY SECURITIES FUND
Statement of Investments, December 31, 2003 (cont.)
| | | | | | | |
| | | COUNTRY | | SHARES/ WARRANTS/ CONTRACTS | | VALUE |
|
Common Stocks and Other Equity Interests (cont.) | | | | | | | |
IT Services .1% | | | | | | | |
Comdisco Contingent Equity Distribution | | United States | | 2,066,357 | | $ | 7,646 |
aComdisco Holding Co., Inc. | | United States | | 1 | | | 40 |
aConcord EFS Inc. | | United States | | 10,300 | | | 152,852 |
| | | | | | |
|
|
| | | | | | | | 160,538 |
| | | | | | |
|
|
Leisure Equipment & Products .7% | | | | | �� | | |
Agfa Gevaert NV | | Belgium | | 25,090 | | | 715,230 |
Nintendo Co. Ltd. | | Japan | | 13,300 | | | 1,241,019 |
| | | | | | |
|
|
| | | | | | | | 1,956,249 |
| | | | | | |
|
|
Machinery .9% | | | | | | | |
Alfa Laval AB | | Sweden | | 80,700 | | | 1,228,114 |
aSchindler Holding AG | | Switzerland | | 4,100 | | | 1,001,172 |
aSchindler Holding AG, Reg D | | Switzerland | | 1,800 | | | 499,212 |
| | | | | | |
|
|
| | | | | | | | 2,728,498 |
| | | | | | |
|
|
Media 7.1% | | | | | | | |
Astral Media Inc., A | | Canada | | 70,900 | | | 1,538,979 |
Dow Jones & Co. Inc. | | United States | | 2,000 | | | 99,700 |
E.W. Scripps Co., A | | United States | | 8,200 | | | 771,948 |
aEchoStar Communications Corp., A | | United States | | 25,500 | | | 867,000 |
Gannett Co. Inc. | | United States | | 3,700 | | | 329,892 |
aJC Decaux SA | | France | | 40,325 | | | 659,198 |
Lagardere SCA | | France | | 40,510 | | | 2,338,727 |
aLiberty Media Corp., A | | United States | | 391,846 | | | 4,659,049 |
McGraw-Hill Cos. Inc. | | United States | | 3,200 | | | 223,744 |
aNTL Europe Inc. | | United Kingdom | | 10,535 | | | 105 |
NV Holdingsmig de Telegraaf | | Netherlands | | 45,878 | | | 1,047,416 |
Omnicom Group Inc. | | United States | | 4,500 | | | 392,985 |
SES Global, FDR | | Luxembourg | | 381,600 | | | 3,850,656 |
Torstar Corp., B | | Canada | | 46,500 | | | 1,043,889 |
aTVMAX Holdings Inc. | | United States | | 3,535 | | | 8,837 |
Washington Post Co., B | | United States | | 3,821 | | | 3,023,939 |
| | | | | | |
|
|
| | | | | | | | 20,856,064 |
| | | | | | |
|
|
Metals & Mining 6.3% | | | | | | | |
Anglo American PLC | | United Kingdom | | 101,000 | | | 2,182,327 |
aApollo Gold Corp. | | Canada | | 93,900 | | | 215,085 |
aAshanti Goldfields Co. Ltd., GDR, Reg S | | Ghana | | 15,100 | | | 196,904 |
Barrick Gold Corp. | | Canada | | 75,900 | | | 1,723,689 |
Falconbridge Ltd. | | Canada | | 2,400 | | | 58,243 |
aGlamis Gold Ltd. | | Canada | | 39,200 | | | 675,857 |
Gold Fields Ltd. | | South Africa | | 31,900 | | | 456,397 |
Impala Platinum Holdings Ltd. | | South Africa | | 24,500 | | | 2,128,839 |
a,bInternational Steel Group | | United States | | 128,899 | | | 4,267,524 |
Newmont Mining Corp. | | United States | | 119,700 | | | 5,818,617 |
Noranda Inc. | | Canada | | 18,200 | | | 289,425 |
Pechiney SA, A | | France | | 500 | | | 30,588 |
Placer Dome Inc. | | Canada | | 25,100 | | | 450,042 |
aRandgold & Exploration Co. Ltd., ADR | | South Africa | | 2,000 | | | 32,798 |
aWheaton River Minerals Ltd. | | Canada | | 51,498 | | | 154,225 |
aWheaton River Minerals Ltd., wts., 5/30/07 | | Canada | | 20,700 | | | 37,002 |
| | | | | | |
|
|
| | | | | | | | 18,717,562 |
| | | | | | |
|
|
MD-11
FRANKLIN TEMPLETON VARIABLE INSURANCE PRODUCTS TRUST
MUTUAL DISCOVERY SECURITIEs FUND
Statement of Investments, December 31, 2003 (cont.)
| | | | | | | |
| | | COUNTRY | | SHARES/ WARRANTS/ CONTRACTS | | VALUE |
|
Common Stocks and Other Equity Interests (cont.) | | | | | | | |
Multi-Utilities & Unregulated Power .7% | | | | | | | |
Suez SA | | France | | 100,365 | | $ | 2,016,668 |
| | | | | | |
|
|
Oil & Gas 2.5% | | | | | | | |
BP PLC | | United Kingdom | | 158,600 | | | 1,286,153 |
BP PLC, ADR | | United Kingdom | | 9,000 | | | 444,150 |
Eni SpA | | Italy | | 67,710 | | | 1,277,676 |
Lukoil Holdings, ADR | | Russia | | 4,000 | | | 372,320 |
Norsk Hydro ASA | | Norway | | 6,500 | | | 401,072 |
Occidental Petroleum Corp. | | United States | | 5,700 | | | 240,768 |
aSouthwest Royalties Inc., A | | United States | | 3,410 | | | 102,295 |
Suncor Energy Inc. | | Canada | | 2,200 | | | 55,330 |
Total SA, B | | France | | 12,324 | | | 2,291,319 |
Total SA, B, ADR | | France | | 9,670 | | | 894,571 |
Yukos Corp., ADR | | Russia | | 3,200 | | | 136,800 |
| | | | | | |
|
|
| | | | | | | | 7,502,454 |
| | | | | | |
|
|
Paper & Forest Products 1.0% | | | | | | | |
Abitibi-Consolidated Inc. | | Canada | | 97,900 | | | 785,624 |
Potlatch Corp. | | United States | | 63,100 | | | 2,193,987 |
| | | | | | |
|
|
| | | | | | | | 2,979,611 |
| | | | | | |
|
|
Personal Products .4% | | | | | | | |
Beiersdorf AG | | Germany | | 9,200 | | | 1,127,371 |
| | | | | | |
|
|
Pharmaceuticals 1.3% | | | | | | | |
Merck & Co. Inc. | | United States | | 29,000 | | | 1,339,800 |
Takeda Chemical Industries Ltd. | | Japan | | 48,785 | | | 1,934,648 |
Wyeth | | United States | | 11,000 | | | 466,950 |
| | | | | | |
|
|
| | | | | | | | 3,741,398 |
| | | | | | |
|
|
Real Estate 1.6% | | | | | | | |
American Financial Realty Trust | | United States | | 5,400 | | | 92,070 |
aCanary Wharf Group PLC | | United Kingdom | | 185,900 | | | 891,046 |
iStar Financial Inc. | | United States | | 42,200 | | | 1,641,580 |
a,bSecurity Capital European Realty | | Luxembourg | | 4,563 | | | 33,994 |
a.bTorre Mayor Investments, LP | | Mexico | | 10 | | | 800,000 |
Ventas Inc. | | United States | | 55,600 | | | 1,223,200 |
| | | | | | |
|
|
| | | | | | | | 4,681,890 |
| | | | | | |
|
|
Road & Rail 1.1% | | | | | | | |
Canadian National Railway Co. | | Canada | | 20,400 | | | 1,294,486 |
Florida East Coast Industries Inc., A | | United States | | 33,300 | | | 1,102,230 |
Norfolk Southern Corp. | | United States | | 40,500 | | | 957,825 |
| | | | | | |
|
|
| | | | | | | | 3,354,541 |
| | | | | | |
|
|
Specialty Retail | | | | | | | |
New Look Group | | United Kingdom | | 19,300 | | | 107,451 |
| | | | | | |
|
|
Thrifts & Mortgage Finance 1.2% | | | | | | | |
Freddie Mac | | United States | | 37,000 | | | 2,157,840 |
Greenpoint Financial Corp. | | United States | | 2,946 | | | 104,053 |
Hudson City Bancorp Inc. | | United States | | 26,600 | | | 1,015,588 |
| | | | | | |
|
|
| | | | | | | | 3,277,481 |
| | | | | | |
|
|
MD-12
FRANKLIN TEMPLETON VARIABLE INSURANCE PRODUCTS TRUST
MUTUAL DISCOVERY SECURITIES FUND
Statement of Investments, December 31, 2003 (cont.)
| | | | | | | | | |
| | | COUNTRY | | SHARES/ WARRANTS/ CONTRACTS | | | VALUE |
|
Common Stocks and Other Equity Interests (cont.) | | | | | | | | | |
Tobacco 8.9% | | | | | | | | | |
Altadis SA | | Spain | | | 205,115 | | | $ | 5,821,251 |
Altria Group Inc. | | United States | | | 16,700 | | | | 908,814 |
British American Tobacco PLC | | United Kingdom | | | 663,675 | | | | 9,148,239 |
Gallaher Group PLC | | United Kingdom | | | 72,170 | | | | 775,174 |
Gallaher Group PLC, ADR | | United Kingdom | | | 1,000 | | | | 42,540 |
Imperial Tobacco Group PLC | | United Kingdom | | | 285,417 | | | | 5,620,356 |
ITC Ltd. | | India | | | 65,968 | | | | 1,423,535 |
KT&G Corp. | | South Korea | | | 25,000 | | | | 434,326 |
KT&G Corp., GDR, 144A | | South Korea | | | 222,090 | | | | 1,949,950 |
| | | | | | | | |
|
|
| | | | | | | | | | 26,124,185 |
| | | | | | | | |
|
|
Trading Companies & Distributors .3% | | | | | | | | | |
Compania de Distribucion Intefral Logista SA | | Spain | | | 30,900 | | | | 954,517 |
| | | | | | | | |
|
|
Transportation Infrastructure .4% | | | | | | | | | |
aLaidlaw International Inc. | | United States | | | 48,203 | | | | 666,647 |
Peninsular & Oriental Steam Navigation Co. | | United Kingdom | | | 93,800 | | | | 386,209 |
| | | | | | | | |
|
|
| | | | | | | | | | 1,052,856 |
| | | | | | | | |
|
|
Total Common Stocks and Other Equity Interests (Cost $178,954,864) | | | | | | | | | 234,419,519 |
| | | | | | | | |
|
|
Preferred Stocks .5% | | | | | | | | | |
Electric Utilities | | | | | | | | | |
aMontana Power Co., 8.45%, pfd. | | United States | | | 2,880 | | | | 34,560 |
| | | | | | | | |
|
|
Food Products .1% | | | | | | | | | |
Unilever NV, pfd. | | Netherlands | | | 43,200 | | | | 310,050 |
| | | | | | | | |
|
|
Insurance .1% | | | | | | | | | |
United Fire & Casualty Co., 6.375%, cvt. pfd. | | United States | | | 5,300 | | | | 153,700 |
| | | | | | | | |
|
|
Media .3% | | | | | | | | | |
News Corp. Ltd., ADR, pfd. | | Australia | | | 34,100 | | | | 1,031,525 |
NTL Europe Inc., 10.00%, A, pfd. | | United Kingdom | | | 4,660 | | | | 38,329 |
| | | | | | | | |
|
|
| | | | | | | | | | 1,069,854 |
| | | | | | | | |
|
|
Total Preferred Stocks (Cost $1,409,776) | | | | | | | | | 1,568,164 |
| | | | | | | | |
|
|
| | | |
| | | | | PRINCIPAL AMOUNTf
| | | |
Corporate Bonds & Notes 2.8% | | | | | | | | | |
Calpine Constructor Finance, | | | | | | | | | |
8.50%, 8/26/11 | | United States | | $ | 274,000 | | | | 284,960 |
First Priority Term Loan, 8/26/09 | | United States | | | 225,000 | | | | 236,250 |
Calpine Corp., 144A, 9.875%, 12/01/11 | | United States | | | 634,000 | | | | 654,605 |
Charter Communications Operating LLC, Bank Claim | | United States | | | 357,000 | | | | 344,505 |
DecisionOne Corp., Term Loan | | United States | | | 160,202 | | | | 112,142 |
Eurotunnel PLC, | | | | | | | | | |
12/31/18, Tier 2 | | United Kingdom | | | 160,314 | GBP | | | 209,500 |
12/31/25, Tier 3 | | United Kingdom | | | 254,024 | GBP | | | 250,109 |
Stabilization Advance S8, Tier 2 | | United Kingdom | | | 117,813 | GBP | | | 40,072 |
Eurotunnel SA, | | | | | | | | | |
5.28%, 12/31/18, Tier 2 (Pibor) | | France | | | 17,565 | EUR | | | 16,174 |
12/31/18, Tier 2 (Libor) | | France | | | 39,763 | EUR | | | 36,613 |
12/31/25, Tier 3 (Libor) | | France | | | 82,595 | EUR | | | 57,300 |
MD-13
FRANKLIN TEMPLETON VARIABLE INSURANCE PRODUCTS TRUST
MUTUAL DISCOVERY SECURITIES FUND
Statement of Investments, December 31, 2003 (cont.)
| | | | | | | | |
| | | COUNTRY | | PRINCIPAL AMOUNTf | | | VALUE |
|
Corporate Bonds & Notes (cont.) | | | | | | | | |
Eurotunnel SA, (cont.) | | | | | | | | |
Stabilization Advance S6, Tier 1 (Pibor) | | France | | 10,849 | EUR | | $ | 2,600 |
Stabilization Advance S6, Tier 2 (Libor) | | France | | 21,402 | EUR | | | 5,129 |
Stabilization Advance S7, Tier 1 (Pibor) | | France | | 36,561 | EUR | | | 8,762 |
Healthsouth Corp., | | | | | | | | |
8.50%, 2/01/08 | | United States | | 285,000 | | | | 275,025 |
7.00%, 6/15/08 | | United States | | 148,000 | | | | 138,750 |
8.375%, 10/01/11 | | United States | | 97,000 | | | | 92,150 |
7.625%, 6/01/12 | | United States | | 730,000 | | | | 686,200 |
cvt., 3.25%, 4/01/03 | | United States | | 531,000 | | | | 515,070 |
Marconi Corp., 10.00%, 10/31/08 | | United Kingdom | | 71,367 | | | | 79,217 |
Marconi PLC, 8.00%, 4/30/08 | | United Kingdom | | 365,215 | | | | 357,911 |
Mirant Mid-Atlantic LLC, | | | | | | | | |
8.625%, 6/30/12 | | United States | | 162,669 | | | | 163,584 |
9.125%, 6/30/17 | | United States | | 80,508 | | | | 80,558 |
10.06%, 12/30/28 | | United States | | 152,964 | | | | 154,589 |
bMP Finance Ltd., 5.00%, 8/28/07 | | Japan | | 2,227,000 | | | | 2,271,540 |
Providian Financial Corp, cvt., zero cpn., 2/15/21 | | United States | | 644,000 | | | | 307,510 |
Seton House Finance Ltd., 2/07/12 | | United Kingdom | | 2,553,000 | EUR | | | 740,653 |
Teco Panda, | | | | | | | | |
Bank Claim #2 | | United States | | 432,100 | | | | 308,951 |
Debt Service Reserve L/C Loan | | United States | | 24,800 | | | | 17,732 |
Project L/C Loan Facility | | United States | | 62,000 | | | | 44,330 |
TVMAX Holdings Inc., PIK, 14.00%, 2/01/06 | | United States | | 16,306 | | | | 16,306 |
| | | | | | | |
|
|
Total Corporate Bonds & Notes (Cost $7,549,565) | | | | | | | | 8,508,797 |
| | | | | | | |
|
|
Bonds & Notes in Reorganization 6.7% | | | | | | | | |
dAdelphia Communications Corp., | | | | | | | | |
9.25%, 10/01/02 | | United States | | 2,638,000 | | | | 2,453,340 |
8.125%, 7/15/03 | | United States | | 219,000 | | | | 203,670 |
7.50%, 1/15/04 | | United States | | 80,000 | | | | 74,000 |
9.50%, 2/15/04 | | United States | | 13,844 | | | | 12,944 |
10.50%, 7/15/04 | | United States | | 124,000 | | | | 117,180 |
10.25%, 11/01/06 | | United States | | 159,000 | | | | 148,665 |
8.375%, 2/01/08 | | United States | | 245,000 | | | | 229,687 |
7.75%, 1/15/09 | | United States | | 210,000 | | | | 196,350 |
7.875%, 5/01/09 | | United States | | 117,000 | | | | 107,640 |
9.375%, 11/15/09 | | United States | | 110,000 | | | | 104,500 |
10.25%, 6/15/11 | | United States | | 250,000 | | | | 237,500 |
dAES Drax Holdings Ltd., | | | | | | | | |
10.41%, 12/31/20 | | Cayman Islands | | 2,317,000 | | | | 2,038,960 |
9.07%, 12/31/25 | | Cayman Islands | | 220,000 | GBP | | | 340,667 |
dAiken Cnty SC Indl Rev Ref Beloit, 6.00%, 12/01/11 | | United States | | 20,000 | | | | 100 |
dAir Canada Inc., | | | | | | | | |
6.75%, 2/02/04 | | Canada | | 55,000 | CAD | | | 15,535 |
9.00%, 6/01/06 | | Canada | | 100,000 | CAD | | | 28,632 |
10.00%, 6/01/06 | | Canada | | 254,000 | EUR | | | 136,163 |
7.25%, 10/01/07 | | Canada | | 187,000 | CAD | | | 51,010 |
10.25%, 3/15/11 | | Canada | | 1,830,000 | | | | 745,725 |
Bank Claim | | Canada | | 625,300 | CAD | | | 174,198 |
Bank Claim | | Canada | | 11,338,000 | JPY | | | 40,202 |
Term Loan | | Canada | | 425,300 | | | | 157,361 |
zero cpn., 7/31/05 | | Canada | | 454,546 | | | | 175,000 |
MD-14
FRANKLIN TEMPLETON VARIABLE INSURANCE PRODUCTS TRUST
MUTUAL DISCOVERY SECURITIES FUND
Statement of Investments, December 31, 2003 (cont.)
| | | | | | | | | |
| | | COUNTRY | | PRINCIPAL AMOUNTf | | | VALUE |
|
Bonds & Notes in Reorganization (cont.) | | | | | | | | | |
dCentury Communications Corp., | | | | | | | | | |
9.50%, 3/01/05 | | United States | | $ | 15,000 | | | $ | 14,550 |
8.875%, 1/15/07 | | United States | | | 11,000 | | | | 10,725 |
8.375%, 12/15/07 | | United States | | | 20,000 | | | | 19,550 |
zero cpn., 3/15/03 | | United States | | | 223,000 | | | | 198,470 |
dDow Corning Corp., 9.375%, 2/01/08 | | United States | | | 300,000 | | | | 654,000 |
dHarnischfeger Industries Inc., | | | | | | | | | |
8.90%, 3/01/22 | | United States | | | 162,000 | | | | 907 |
8.70%, 6/15/22 | | United States | | | 159,000 | | | | 906 |
7.25%, 12/15/25 | | United States | | | 232,000 | | | | 1,322 |
6.875%, 2/15/27 | | United States | | | 216,000 | | | | 1,210 |
Stipulated Bank Claim | | United States | | | 250,450 | | | | 1,377 |
dMetromedia Fiber Network Inc., | | | | | | | | | |
14.00%, 3/15/07 | | United States | | | 880,000 | | | | 466,400 |
10.00%, 11/15/08 | | United States | | | 577,000 | | | | 39,669 |
senior note 10.00%, 12/15/09 | | United States | | | 575,000 | | | | 40,969 |
senior note 10.00%, 12/15/09 | | United States | | | 280,000 | EUR | | | 26,488 |
dMirant Corp., | | | | | | | | | |
Tranche C Revolver | | United States | | | 313,706 | | | | 194,498 |
4 Year Revolver, 7/17/05 | | United States | | | 258,149 | | | | 201,356 |
364 Day Revolver | | United States | | | 448,600 | | | | 264,674 |
dNorthwestern Corp., | | | | | | | | | |
8.75%, 3/15/12 | | United States | | | 359,000 | | | | 325,792 |
6.95%, 11/15/28 | | United States | | | 191,000 | | | | 171,184 |
dNRG Energy Inc., | | | | | | | | | |
7.625%, 2/01/06 | | United States | | | 250,000 | | | | 141,250 |
6.75%, 7/15/06 | | United States | | | 431,000 | | | | 243,515 |
7.50%, 6/15/07 | | United States | | | 245,000 | | | | 139,650 |
7.50%, 6/01/09 | | United States | | | 230,000 | | | | 131,100 |
8.25%, 9/15/10 | | United States | | | 287,000 | | | | 167,895 |
7.75%, 4/01/11 | | United States | | | 31,000 | | | | 17,825 |
8.00%, 11/01/13 | | United States | | | 1,550,000 | | | | 891,250 |
8.70%, 3/15/20 | | United States | | | 20,000 | | | | 11,600 |
8.625%, 4/01/31 | | United States | | | 226,000 | | | | 132,210 |
Revolver | | United States | | | 1,000,101 | | | | 620,062 |
dOwens Corning, Revolver | | United States | | | 1,969,266 | | | | 1,476,949 |
dParmalat Netherlands BV, 0.875%, 06/30/21 | | Italy | | | 350,000 | EUR | | | 110,788 |
dPG & E Corp., | | | | | | | | | |
9.625%, 11/01/05 | | United States | | | 853,000 | | | | 870,060 |
Commercial Paper, 1/18/01 | | United States | | | 35,000 | | | | 35,175 |
Commercial Paper, 1/30/01 | | United States | | | 18,000 | | | | 18,090 |
Commercial Paper, 2/16/01 | | United States | | | 54,000 | | | | 54,270 |
FRN, 144A, 8.333%, 10/31/01 | | United States | | | 271,000 | | | | 276,420 |
MTN, 5.94%, 10/07/03 | | United States | | | 44,000 | | | | 44,220 |
dPort Seattle Wash Rev Ref-Beloit Proj., 6.00%, 12/01/17 | | United States | | | 10,000 | | | | 50 |
dSafety Kleen Corp., 9.25%, 5/15/09 | | United States | | | 31,000 | | | | 1,550 |
dSafety Kleen Services, 9.25%, 6/01/08 | | United States | | | 3,000 | | | | 15 |
dTelewest Communications PLC, | | | | | | | | | |
11.00%, 10/01/07 | | United Kingdom | | | 321,000 | | | | 210,255 |
11.25%, 11/01/08 | | United Kingdom | | | 46,000 | | | | 29,785 |
MD-15
FRANKLIN TEMPLETON VARIABLE INSURANCE PRODUCTS TRUST
MUTUAL DISCOVERY SECURITIES FUND
Statement of Investments, December 31, 2003 (cont.)
| | | | | | | | | | |
| | | COUNTRY | | PRINCIPAL AMOUNTf | | | VALUE | |
| |
Bonds & Notes in Reorganization (cont.) | | | | | | | | | | |
dTelewest Communications PLC, (cont.) | | | | | | | | | | |
9.875%, 2/01/10 | | United Kingdom | | | 107,000 | GBP | | $ | 113,013 | |
Bank Claim | | United Kingdom | | | 1,174,313 | GBP | | | 998,547 | |
cvt., 5.25%, 2/19/07 | | United Kingdom | | | 307,000 | GBP | | | 291,277 | |
senior disc. note, zero cpn., 4/15/09 | | United Kingdom | | | 120,000 | | | | 63,000 | |
senior disc. note, zero cpn., 2/01/10 | | United Kingdom | | | 95,000 | | | | 47,025 | |
zero cpn., 4/15/04 | | United Kingdom | | | 371,000 | GBP | | | 332,074 | |
dTelewest Finance Ltd., cvt., 6.00%, 7/07/05 | | United Kingdom | | | 274,000 | | | | 290,440 | |
dWorldCom Inc., | | | | | | | | | | |
7.875%, 5/15/03 | | United States | | | 335,000 | | | | 113,063 | |
6.25%, 8/15/03 | | United States | | | 35,000 | | | | 11,813 | |
6.50%, 5/15/04 | | United States | | | 46,000 | | | | 15,525 | |
6.40%, 8/15/05 | | United States | | | 410,000 | | | | 138,375 | |
7.375%, 1/15/06 | | United States | | | 100,000 | | | | 33,750 | |
8.00%, 5/15/06 | | United States | | | 146,000 | | | | 49,275 | |
7.75%, 4/01/07 | | United States | | | 245,000 | | | | 82,688 | |
8.25%, 5/15/10 | | United States | | | 335,000 | | | | 113,063 | |
7.375%, 1/15/11 | | United States | | | 766,000 | | | | 258,525 | |
7.50%, 5/15/11 | | United States | | | 737,000 | | | | 248,738 | |
7.75%, 4/01/27 | | United States | | | 65,000 | | | | 21,938 | |
6.95%, 8/15/28 | | United States | | | 25,000 | | | | 8,438 | |
8.25%, 5/15/31 | | United States | | | 1,172,000 | | | | 395,550 | |
| | | | | | | | |
|
|
|
Total Bonds & Notes in Reorganization (Cost $16,160,518) | | | | | | | | | 19,673,177 | |
| | | | | | | | |
|
|
|
| | | | | SHARES/ PRINCIPAL AMOUNTf
| | | | |
Companies in Liquidation | | | | | | | | | | |
aBrunos Inc., Liquidating Unit | | United States | | | 2,247 | | | | 4,944 | |
aGuangdong International Trust & Investment Corp., | | | | | | | | | | |
144A, 8.75%, 10/24/16 | | China | | | 120,000 | | | | 7,500 | |
Revolver—Admitted Claim | | Hong Kong | | | 130,067 | | | | 8,129 | |
Structured Note—Admitted Claim | | Hong Kong | | | 205,745 | | | | 12,859 | |
Syndicated Loan—Admitted Claim | | Hong Kong | | | 355,733 | | | | 22,233 | |
| | | | | | | | |
|
|
|
Total Companies in Liquidation (Cost $50,949) | | | | | | | | | 55,665 | |
| | | | | | | | |
|
|
|
| | | | | PRINCIPAL AMOUNTf
| | | | |
U.S. Government and Agency Securities 12.2% | | | | | | | | | | |
eFederal National Mortgage Association, 1.010% to 1.286%, with maturities to 6/25/04 | | United States | | $ | 7,000,000 | | | | 6,985,506 | |
Federal Home Loan Bank, 0.75% to 1.42%, with maturities to 12/16/04 | | United States | | | 26,901,000 | | | | 26,787,998 | |
U.S. Treasury Bill, 0.97%, 4/01/04 | | United States | | | 2,000,000 | | | | 1,995,515 | |
| | | | | | | | |
|
|
|
Total U.S. Government and Agency Securities (Cost $35,752,174) | | | | | | | | | 35,769,019 | |
| | | | | | | | |
|
|
|
Short Term Investments (Cost $2,997,366) 1.0% | | | | | | | | | | |
Hbos Treasury Services, 1.093%, 1/29/04 | | United Kingdom | | | 3,000,000 | | | | 2,997,318 | |
| | | | | | | | |
|
|
|
Total Investments (Cost $242,875,211) 102.8% | | | | | | | | | 302,991,659 | |
| | | | | | | | |
|
|
|
Options Written | | | | | | | | | (387 | ) |
Securities Sold Short (.6%) | | | | | | | | | (1,813,911 | ) |
Net Equity in Forward Contracts (1.9%) | | | | | | | | | (5,730,713 | ) |
Other Assets, less Liabilities (.3%) | | | | | | | | | (743,247 | ) |
| | | | | | | | |
|
|
|
Net Assets 100.0% | | | | | | | | $ | 294,703,401 | |
| | | | | | | | |
|
|
|
MD-16
FRANKLIN TEMPLETON VARIABLE INSURANCE PRODUCTS TRUST
MUTUAL DISCOVERY SECURITIES FUND
Statement of Investments, December 31, 2003 (cont.)
| | | | | | | |
Option Written ISSUER | | COUNTRY | | CONTRACTS/
SHARES | | VALUE |
|
Diversified Telecommunications Services | | | | | | | |
XO Communications Inc., Jun. 4.25 Calls, 6/21/04 | | United States | | 49,930 | | $ | — |
| | | | | | |
|
|
Food & Staples Retailing | | | | | | | |
Safeway PLC, Jan. 2.70 Puts, 1/16/04 | | United Kingdom | | 120 | | | 387 |
| | | | | | |
|
|
Total Options Written (Premiums received $13,653) | | | | | | $ | 387 |
| | | | | | |
|
|
| | | |
Securities Sold Short ISSUER | | | | | | |
|
Capital Markets | | | | | | | |
gLehman Brothers Holdings Inc. | | United States | | 700 | | $ | 54,054 |
| | | | | | |
|
|
Commercial Banks .1% | | | | | | | |
gBank of America Corp. | | United States | | 3,100 | | | 249,333 |
| | | | | | |
|
|
Food Products .1% | | | | | | | |
gKraft Foods Inc., A | | United States | | 11,200 | | | 360,864 |
| | | | | | |
|
|
Health Care Providers & Services .1% | | | | | | | |
gAnthem Inc. | | United States | | 1,200 | | | 90,000 |
gCaremark RX Inc. | | United States | | 3,900 | | | 98,787 |
gUnited Health Group Inc. | | United States | | 1,400 | | | 81,452 |
| | | | | | |
|
|
| | | | | | | | 270,239 |
| | | | | | |
|
|
Insurance .1% | | | | | | | |
gManulife Financial Corp. | | Canada | | 10,600 | | | 342,380 |
| | | | | | |
|
|
Internet Software & Services | | | | | | | |
gYahoo! Inc. | | United States | | 1,185 | | | 53,527 |
| | | | | | |
|
|
IT Services .1% | | | | | | | |
gFirst Data Corp. | | United States | | 2,560 | | | 105,190 |
| | | | | | |
|
|
Media | | | | | | | |
gNews Corp. Ltd., ADR | | Australia | | 2,900 | | | 104,690 |
| | | | | | |
|
|
Metals & Mining .1% | | | | | | | |
gAlcan Inc. | | Canada | | 283 | | | 13,287 |
gAngloGold Ltd., ADR | | South Africa | | 4,400 | | | 205,480 |
gRandgold Resources Ltd., ADR | | United Kingdom | | 1,505 | | | 41,086 |
| | | | | | |
|
|
| | | | | | | | 259,853 |
| | | | | | |
|
|
Pharmaceuticals | | | | | | | |
gTeva Pharmaceutical Industries Ltd., ADR | | Israel | | 243 | | | 13,781 |
| | | | | | |
|
|
Total Securities Sold Short (Proceeds $1,764,589) | | | | | | $ | 1,813,911 |
| | | | | | |
|
|
| | | | | | | | |
| | | | | | | | | | | | | |
| | | | |
| Synthetic Equity Swaps (ses) ISSUER | | COUNTRY | | SHARES | | | VALUE AT 12/31/03 | | | UNREALIZED GAIN/(LOSS) | |
| |
Health Care Equipment & Supplies | | | | | | | | | | | | | |
hSmith & Nephew PLC, ses., 3.752 GBP | | United Kingdom | | (46 | ) | | $ | (386 | ) | | $ | (78 | ) |
hSmith & Nephew PLC, ses., 3.776 GBP | | United Kingdom | | (900 | ) | | | (7,560 | ) | | | (1,488 | ) |
| | | | | | | |
|
|
| |
|
|
|
| | | | | | | | | (7,946 | ) | | | (1,566 | ) |
| | | | | | | |
|
|
| |
|
|
|
MD-17
FRANKLIN TEMPLETON VARIABLE INSURANCE PRODUCTS TRUST
MUTUAL DISCOVERY SECURITIES FUND
Statement of Investments, December 31, 2003 (cont.)
| | | | | | | | | | | | | |
| Synthetic Equity Swaps (cont.) ISSUER | | COUNTRY | | SHARES | | | VALUE AT 12/31/03 | | | UNREALIZED GAIN (LOSS) | |
| |
Insurance | | | | | | | | | | | | | |
hAxa SA, ses., 15.850 EUR | | France | | 1,019 | | | $ | 21,812 | | | $ | 1,399 | |
hAxa SA, ses., 15.870 EUR | | France | | 200 | | | | 4,281 | | | | 270 | |
hAxa SA, ses., 16.030 EUR | | France | | 1,804 | | | | 38,615 | | | | 2,067 | |
hAxa SA, ses., 16.700 EUR | | France | | (1,019 | ) | | | (21,812 | ) | | | (389 | ) |
hAxa SA, ses., 16.770 EUR | | France | | (200 | ) | | | (4,281 | ) | | | (59 | ) |
hAxa SA, ses., 17.000 EUR | | France | | (1,804 | ) | | | (38,615 | ) | | | 61 | |
| | | | | | | |
|
|
|
| | | | | | | | | — | | | | 3,349 | |
| | | | | | | |
|
|
|
Real Estate | | | | | | | | | | | | | |
hChelsfield PLC, ses., 3.095 GBP | | United Kingdom | | 300 | | | | 1,650 | | | | (15 | ) |
hChelsfield PLC, ses., 3.107 GBP | | United Kingdom | | 1,000 | | | | 5,500 | | | | (71 | ) |
hChelsfield PLC, ses., 3.112 GBP | | United Kingdom | | 696 | | | | 3,828 | | | | (60 | ) |
hChelsfield PLC, ses., 3.154 GBP | | United Kingdom | | 9,600 | | | | 52,802 | | | | (1,476 | ) |
hChelsfield PLC, ses., 3.160 GBP | | United Kingdom | | 3,300 | | | | 18,151 | | | | (543 | ) |
hChelsfield PLC, ses., 3.165 GBP | | United Kingdom | | 1,400 | | | | 7,700 | | | | (243 | ) |
hChelsfield PLC, ses., 3.166 GBP | | United Kingdom | | 4,800 | | | | 26,401 | | | | (841 | ) |
| | | | | | | |
|
|
|
| | | | | | | | | 116,032 | | | | (3,249 | ) |
| | | | | | | |
|
|
|
Textiles, Apparel & Luxury Goods | | | | | | | | | | | | | |
hChristian Dior SA, ses., 46.766 EUR | | France | | 239 | | | | 14,479 | | | | 355 | |
hChristian Dior SA, ses., 47.220 EUR | | France | | 196 | | | | 11,874 | | | | 177 | |
hChristian Dior SA, ses., 47.384 EUR | | France | | 485 | | | | 29,383 | | | | 355 | |
hChristian Dior SA, ses., 47.614 EUR | | France | | 485 | | | | 29,383 | | | | 200 | |
hChristian Dior SA, ses., 47.790 EUR | | France | | 236 | | | | 14,298 | | | | 42 | |
hChristian Dior SA, ses., 48.208 EUR | | France | | 475 | | | | 28,777 | | | | (161 | ) |
hChristian Dior SA, ses., 48.550 EUR | | France | | 297 | | | | 17,993 | | | | (230 | ) |
hChristian Dior SA, ses., 48.586 EUR | | France | | 489 | | | | 29,625 | | | | (398 | ) |
hChristian Dior SA, ses., 48.790 EUR | | France | | 198 | | | | 11,995 | | | | (213 | ) |
hChristian Dior SA, ses., 49.000 EUR | | France | | 25 | | | | 1,515 | | | | (33 | ) |
hChristian Dior SA, ses., 49.027 EUR | | France | | 72 | | | | 4,362 | | | | (99 | ) |
hLVMH Moet Hennessy Louis Vuitton, ses., 56.520 EUR | | France | | (196 | ) | | | (14,265 | ) | | | (319 | ) |
hLVMH Moet Hennessy Louis Vuitton, ses., 57.050 EUR | | France | | (236 | ) | | | (17,176 | ) | | | (227 | ) |
hLVMH Moet Hennessy Louis Vuitton, ses., 58.672 EUR | | France | | (485 | ) | | | (35,298 | ) | | | 667 | |
hLVMH Moet Hennessy Louis Vuitton, ses., 58.860 EUR | | France | | (239 | ) | | | (17,394 | ) | | | 317 | |
hLVMH Moet Hennessy Louis Vuitton, ses., 58.900 EUR | | France | | (485 | ) | | | (35,298 | ) | | | 545 | |
hLVMH Moet Hennessy Louis Vuitton, ses., 59.841 EUR | | France | | (475 | ) | | | (34,571 | ) | | | 1,216 | |
hLVMH Moet Hennessy Louis Vuitton, ses., 60.149 EUR | | France | | (297 | ) | | | (21,616 | ) | | | 875 | |
hLVMH Moet Hennessy Louis Vuitton, ses., 60.300 EUR | | France | | (198 | ) | | | (14,410 | ) | | | 624 | |
hLVMH Moet Hennessy Louis Vuitton, ses., 60.421 EUR | | France | | (489 | ) | | | (35,589 | ) | | | 1,610 | |
hLVMH Moet Hennessy Louis Vuitton, ses., 60.950 EUR | | France | | (25 | ) | | | (1,820 | ) | | | 99 | |
hLVMH Moet Hennessy Louis Vuitton, ses., 60.950 EUR | | France | | (72 | ) | | | (5,240 | ) | | | 285 | |
| | | | | | | |
|
|
|
| | | | | | | | | (38,993 | ) | | | 5,687 | |
| | | | | | | |
|
|
|
Total Synthetic Equity Swaps | | | | | | | $ | 69,093 | | | $ | 4,221 | |
| | | | | | | |
|
|
|
Currency Abbreviations:
CAD - Canadian Dollar
EUR - Euro
GBP - British Pound
JPY - Japanese Yen
| b | See Note 8 regarding restricted securities. |
| c | See Note 9 regarding other considerations. |
| d | See Note 7 regarding defaulted securities. |
| e | See Note 1(g) regarding securities segregated with broker for securities sold short. |
| f | Principal amount is stated in U.S. dollar unless otherwise indicated. |
| g | See Note 1(g) regarding securities sold short. |
| h | See Note 1(e) regarding synthetic equity swaps. |
MD-18
See notes to financial statements.
FRANKLIN TEMPLETON VARIABLE INSURANCE PRODUCTS TRUST
MUTUAL DISCOVERY SECURITIES FUND
Financial Statements
Statement of Assets and Liabilities
December 31, 2003
| | | | |
Assets: | | | | |
Investments in securities: | | | | |
Cost | | $ | 242,875,211 | |
| | |
|
|
|
Value – (includes securities segregated with broker for securities sold short in the amount of $2,987,254) | | | 302,991,659 | |
Cash | | | 105,699 | |
Receivables: | | | | |
Investment securities sold | | | 743,705 | |
Capital shares sold | | | 738,227 | |
Dividends and interest | | | 405,966 | |
Unrealized gain on forward exchange contracts (Note 6) | | | 69,867 | |
Deposits with broker for securities sold short | | | 2,883,808 | |
Due from broker – variation margin (Note 1e) | | | 5,355 | |
| | |
|
|
|
Total assets | | | 307,944,286 | |
| | |
|
|
|
Liabilities: | | | | |
Payables: | | | | |
Investment securities purchased | | | 4,012,978 | |
Capital shares redeemed | | | 11,037 | |
Affiliates | | | 283,491 | |
Deferred tax liability (Note 1l) | | | 62,924 | |
Options written, at value (premiums received $13,653) | | | 387 | |
Securities sold short, at value (proceeds $1,764,589) | | | 1,813,911 | |
Unrealized loss on forward exchange contracts (Note 6) | | | 5,800,580 | |
Funds advanced by custodian – Foreign | | | 1,190,393 | |
Other liabilities | | | 65,184 | |
| | |
|
|
|
Total liabilities | | | 13,240,885 | |
| | |
|
|
|
Net assets, at value | | $ | 294,703,401 | |
| | |
|
|
|
Net assets consist of: | | | | |
Undistributed net investment income (loss) | | $ | 2,414,242 | |
Net unrealized appreciation (depreciation) | | | 54,335,339 | |
Accumulated net realized gain (loss) | | | (8,148,413 | ) |
Capital shares | | | 246,102,233 | |
| | |
|
|
|
Net assets, at value | | $ | 294,703,401 | |
| | |
|
|
|
Class 1: | | | | |
Net asset value and maximum offering price per share ($134,332,027÷9,569,298 shares outstanding) | | $ | 14.04 | |
| | |
|
|
|
Class 2: | | | | |
Net asset value and maximum offering price per share ($160,371,374÷11,537,085 shares outstanding) | | $ | 13.90 | |
| | |
|
|
|
See notes to financial statements.
MD-19
FRANKLIN TEMPLETON VARIABLE INSURANCE PRODUCTS TRUST
MUTUAL DISCOVERY SECURITIES FUND
Financial Statements (continued)
Statement of Operations
For the year ended December 31, 2003
| | | | |
Investment income: | | | | |
(net of foreign taxes of $250,193) | | | | |
Dividends | | $ | 3,099,101 | |
Interest | | | 1,949,459 | |
| | |
|
|
|
Total investment income | | | 5,048,560 | |
| | |
|
|
|
Expenses: | | | | |
Management fees (Note 3) | | | 1,618,534 | |
Administrative fees (Note 3) | | | 300,854 | |
Distribution fees – Class 2 (Note 3) | | | 203,832 | |
Custodian fees | | | 36,100 | |
Reports to shareholders | | | 33,500 | |
Professional fees | | | 27,344 | |
Trustees’ fees and expenses | | | 1,900 | |
Dividends on securities sold short | | | 57,816 | |
Other | | | 11,100 | |
| | |
|
|
|
Total expenses | | | 2,290,980 | |
| | |
|
|
|
Net investment income | | | 2,757,580 | |
| | |
|
|
|
Realized and unrealized gains (losses): | | | | |
Net realized gain (loss) from: | | | | |
Investments | | | 8,496,813 | |
Written options (Note 1f) | | | 24,534 | |
Foreign currency transactions | | | (7,140,173 | ) |
Securities sold short (Note 1g) | | | (123,080 | ) |
| | |
|
|
|
Net realized gain (loss) | | | 1,258,094 | |
Net unrealized appreciation (depreciation) on: | | | | |
Investments | | | 56,374,857 | |
Deferred taxes (Note 1l) | | | (51,356 | ) |
Translation of assets and liabilities denominated in foreign currencies | | | (3,660,829 | ) |
| | |
|
|
|
Net unrealized appreciation (depreciation) | | | 52,662,672 | |
| | |
|
|
|
Net realized and unrealized gain (loss) | | | 53,920,766 | |
| | |
|
|
|
Net increase (decrease) in net assets resulting from operations | | $ | 56,678,346 | |
| | |
|
|
|
See notes to financial statements.
MD-20
FRANKLIN TEMPLETON VARIABLE INSURANCE PRODUCTS TRUST
MUTUAL DISCOVERY SECURITIES FUND
Financial Statements (continued)
Statements of Changes in Net Assets
For the years ended December 31, 2003 and 2002
| | | | | | | | |
| | | 2003 | | | 2002 | |
| | |
| |
Increase (decrease) in net assets: | | | | | | | | |
Operations: | | | | | | | | |
Net investment income | | $ | 2,757,580 | | | $ | 2,519,236 | |
Net realized gain (loss) from investments, written options, securities sold short and foreign currency transactions | | | 1,258,094 | | | | (7,689,144 | ) |
Net unrealized appreciation (depreciation) on investments, deferred taxes and translation of assets and liabilities denominated in foreign currencies | | | 52,662,672 | | | | (10,098,519 | ) |
| | |
| |
Net increase (decrease) in net assets resulting from operations | | | 56,678,346 | | | | (15,268,427 | ) |
Distributions to shareholders from: | | | | | | | | |
Net investment income: | | | | | | | | |
Class 1 | | | (2,214,822 | ) | | | (2,341,069 | ) |
Class 2 | | | (1,329,275 | ) | | | (221,015 | ) |
Net realized gains: | | | | | | | | |
Class 1 | | | — | | | | (2,749,123 | ) |
Class 2 | | | — | | | | (269,767 | ) |
| | |
| |
Total distributions to shareholders | | | (3,544,097 | ) | | | (5,580,974 | ) |
Capital share transactions: (Note 2) | | | | | | | | |
Class 1 | | | (16,943,099 | ) | | | (24,189,253 | ) |
Class 2 | | | 99,261,086 | | | | 34,081,590 | |
| | |
| |
Total capital share transactions | | | 82,317,987 | | | | 9,892,337 | |
Net increase (decrease) in net assets | | | 135,452,236 | | | | (10,957,064 | ) |
Net assets: | | | | | | | | |
Beginning of year | | | 159,251,165 | | | | 170,208,229 | |
| | |
| |
End of year | | $ | 294,703,401 | | | $ | 159,251,165 | |
| | |
| |
Undistributed net investment income included in net assets: | | | | | | | | |
End of year | | $ | 2,414,242 | | | $ | 2,896,047 | |
| | |
| |
See notes to financial statements.
MD-21
FRANKLIN TEMPLETON VARIABLE INSURANCE PRODUCTS TRUST
MUTUAL DISCOVERY SECURITIES FUND
Notes to Financial Statements
1. ORGANIZATION AND SIGNIFICANT ACCOUNTING POLICIES
Franklin Templeton Variable Insurance Products Trust (the Trust) is registered under the Investment Company Act of 1940 as an open-end investment company, consisting of twenty-two separate series (the Funds). The Mutual Discovery Securities Fund (the Fund) included in this report is diversified. Shares of the Fund are sold only to insurance company separate accounts to fund the benefits of variable life insurance policies or variable annuity contracts. As of December 31, 2003, over 88.6% of the total Fund shares were sold through one insurance company. The Fund’s investment objective is capital growth.
The following summarizes the Fund’s significant accounting policies.
a. Security Valuation
Securities listed or traded on a recognized national exchange or NASDAQ are valued at the last reported sales price. Over-the-counter securities and listed securities for which no sale is reported are valued within the range of the latest quoted bid and asked prices. Investments in open-end mutual funds are valued at the closing net asset value. Foreign securities are valued at the close of trading of the foreign exchange or the NYSE, whichever is earlier. If events occur that materially affect the values of the securities after the prices or foreign exchange rates are determined, or if market quotations are not readily available, the securities will be valued at fair value as determined following procedures approved by the Board of Trustees.
b. Foreign Currency Translation
Portfolio securities and other assets and liabilities denominated in foreign currencies are translated into U.S. dollars based on the exchange rate of such currencies against U.S. dollars on the date of valuation. Purchases and sales of securities and income items denominated in foreign currencies are translated into U.S. dollars at the exchange rate in effect on the transaction date.
The Fund does not separately report the effect of changes in foreign exchange rates from changes in market prices on securities held. Such changes are included in net realized and unrealized gain or loss from investments.
Realized foreign exchange gains or losses arise from sales of foreign currencies, currency gains or losses realized between the trade and settlement dates on securities transactions and the difference between the recorded amounts of dividends, interest, and foreign withholding taxes and the U.S. dollar equivalent of the amounts actually received or paid. Net unrealized foreign exchange gains and losses arise from changes in foreign exchange rates on foreign denominated assets and liabilities other than investments in securities held at the end of the reporting period.
c. Foreign Currency Contracts
The Fund may enter into forward exchange contracts to hedge against fluctuations in foreign exchange rates. A forward exchange contract is an agreement between two parties to exchange different currencies at an agreed upon forward exchange rate at a future date. These contracts are valued daily and the Fund’s equity therein is included in the Statement of Assets and Liabilities. Realized and unrealized gains and losses are included in the Statement of Operations.
When the Fund purchases or sells foreign securities, it may enter into foreign exchange contracts to minimize foreign exchange risk from the trade date to the settlement date of the transactions. Realized and unrealized gains and losses are included in the Statement of Operations.
The risks of these contracts include movement in the values of the foreign currencies relative to the U.S. dollar and the possible inability of the counter parties to fulfill their obligations under the contracts.
MD-22
FRANKLIN TEMPLETON VARIABLE INSURANCE PRODUCTS TRUST
MUTUAL DISCOVERY SECURITIES FUND
Notes to Financial Statements (continued)
1. ORGANIZATION AND SIGNIFICANT ACCOUNTING POLICIES (cont.)
d. Securities Purchased on a When-Issued, Delayed Delivery, or TBA Basis
The Fund may purchase securities on a when-issued, delayed delivery, or to-be-announced (TBA) basis, with payment and delivery scheduled for a future date. These transactions are subject to market fluctuations and are subject to the risk that the value at delivery may be more or less than the trade date purchase price. Although the Fund will generally purchase these securities with the intention of holding the securities, it may sell the securities before the settlement date. Sufficient assets have been segregated for these securities.
e. Synthetic Equity Swaps
The Fund may engage in synthetic equity swaps. Synthetic equity swaps are contracts entered into between a broker and the Fund under which the parties agree to make payments to each other so as to replicate the economic consequences that would apply had a purchase or sale of the underlying security taken place. Upon entering into synthetic equity swaps, the Fund is required to pledge to the broker an amount of cash and/or other assets equal to a certain percentage of the contract amount (“initial margin”). Subsequent payments known as “variation margin”, are made or received by the Fund periodically, depending on fluctuations in the value of the underlying security. When the contract is closed, the Fund records a realized gain or loss equal to the difference between the value of the contract at the time it was opened and the value at the time it was closed. The risks of entering into equity swaps include unfavorable price movements in the underlying securities or the inability of the counterparties to fulfill their obligations under the contract.
f. Option Contracts
The Fund may purchase or write options. Options are contracts entitling the holder to purchase or sell a specified number of shares or units of a particular security at a specified price. Options purchased are recorded as investments; options written (sold) are recorded as liabilities. When the exercise of an option results in a cash settlement, the difference between the premium (original option value) and the settlement proceeds is realized as a gain or loss. When securities are acquired or delivered upon exercise of an option, the acquisition cost or sale proceeds are adjusted by the amount of the premium. When an option is closed, the difference between the premium and the cost to close the position is realized as a gain or loss. When an option expires, the premium is realized as a gain for options written or as a loss for options purchased. The risks include the possibility there may be an illiquid options market or the inability of the counterparties to fulfill their obligations under the contract. Writing options involves, to varying degrees, elements of market risk in excess of the amount recognized in the Statement of Assets and Liabilities.
g. Securities Sold Short
The Fund is engaged in selling securities short, which obligates the Fund to replace a security borrowed with the same security at the current market value. The Fund would incur a loss if the price of the security increases between the date of the short sale and the date on which the Fund replaces the borrowed security. The Fund would realize a gain if the price of the security declines between those dates. A gain, limited to the price at which the Fund sold the security short, or a loss, unlimited in size, will be recognized upon the termination of a short sale.
The Fund is required to establish a margin account with the broker lending the security sold short. While the short sale is outstanding, the broker retains the proceeds of the short sale and the Fund must maintain a deposit for the broker consisting of cash and securities having a value equal to a specified percentage of the value of the securities sold short.
h. Securities Lending
The Fund loans securities to certain brokers for which it received collateral against loaned securities in an amount equal to at least 102% of the market value of the loaned securities.
MD-23
FRANKLIN TEMPLETON VARIABLE INSURANCE PRODUCTS TRUST
MUTUAL DISCOVERY SECURITIES FUND
Notes to Financial Statements (continued)
1. ORGANIZATION AND SIGNIFICANT ACCOUNTING POLICIES (cont.)
i. Income Taxes
No provision has been made for income taxes because the Fund’s policy is to qualify as a regulated investment company under the Internal Revenue Code and to distribute substantially all of its taxable income.
j. Security Transactions, Investment Income, Expenses and Distributions
Security transactions are accounted for on trade date. Realized gains and losses on security transactions are determined on a specific identification basis. Certain income from foreign securities is recorded as soon as information is available to the Fund.
Interest income and estimated expenses are accrued daily. Discounts and premiums on securities purchased are amortized over the lives of the respective securities. Dividend income, dividends declared on securities sold short and distributions to shareholders are recorded on the ex-dividend date.
Common expenses incurred by the Trust are allocated among the Funds based on the ratio of net assets of each fund to the combined net assets. Other expenses are charged to each fund on a specific identification basis.
Distributions received by the Fund from securities may be a return of capital (ROC). Such distributions reduce the cost basis of the securities, and any distributions in excess of the cost basis are recognized as capital gains.
Realized and unrealized gains and losses and net investment income, other than class specific expenses, are allocated daily to each class of shares based upon the relative proportion of net assets of each class.
k. Accounting Estimates
The preparation of financial statements in accordance with accounting principles generally accepted in the United States of America requires management to make estimates and assumptions that affect the reported amounts of assets and liabilities at the date of the financial statements and the amounts of income and expense during the reporting period. Actual results could differ from those estimates.
l. Deferred Taxes
The Fund is subject to a tax imposed on net realized gains of securities of certain foreign countries. The Fund records an estimated deferred tax liability for net unrealized gains on these securities as reflected in the accompanying financial statements.
m. Guarantees and Indemnifications
Under the Trust’s organizational documents, its officers and trustees are indemnified against certain liability arising out of the performance of their duties to the Trust. Additionally, in the normal course of business, the Trust enters into contracts with service providers that contain general indemnification clauses. The Trust’s maximum exposure under these arrangements is unknown as this would involve future claims that may be made against the Trust that have not yet occurred. However, based on experience, the Trust expects the risk of loss to be remote.
2. SHARES OF BENEFICIAL INTEREST
The Fund offers two classes of shares: Class 1 and Class 2. Each class of shares differs by its distribution fees, voting rights on matters affecting a single class, and its exchange privilege.
MD-24
FRANKLIN TEMPLETON VARIABLE INSURANCE PRODUCTS TRUST
MUTUAL DISCOVERY SECURITIES FUND
Notes to Financial Statements (continued)
2. SHARES OF BENEFICIAL INTEREST (cont.)
At December 31, 2003, there were an unlimited number of shares authorized ($.01 par value). Transactions in the Fund’s shares were as follows:
| | | | | | | | | | | | | | |
| | | Year ended December 31,
| |
| | | 2003
| | | 2002
| |
| Class 1 Shares: | | Shares
| | | Amount
| | | Shares
| | | Amount
| |
Shares sold | | 99,648 | | | $ | 1,178,413 | | | 500,372 | | | $ | 6,299,567 | |
Shares issued on reinvestment of distributions | | 183,955 | | | | 2,214,822 | | | 403,663 | | | | 5,090,192 | |
Shares redeemed | | (1,747,279 | ) | | | (20,336,334 | ) | | (2,970,808 | ) | | | (35,579,012 | ) |
| | |
| |
Net increase (decrease) | | (1,463,676 | ) | | $ | (16,943,099 | ) | | (2,066,773 | ) | | $ | (24,189,253 | ) |
| | |
| |
| Class 2 Shares: | | | | | | | | | | | | |
Shares sold | | 8,207,573 | | | $ | 99,960,705 | | | 8,904,270 | | | $ | 107,444,507 | |
Shares issued on reinvestment of distributions | | 111,330 | | | | 1,329,275 | | | 39,168 | | | | 490,782 | |
Shares redeemed | | (175,895 | ) | | | (2,028,894 | ) | | (6,003,911 | ) | | | (73,853,699 | ) |
| | |
| |
Net increase (decrease) | | 8,143,008 | | | $ | 99,261,086 | | | 2,939,527 | | | $ | 34,081,590 | |
| | |
| |
3. TRANSACTIONS WITH AFFILIATES
Certain officers and trustees of the Trust are also officers and/or directors of the following entities:
| | |
| Entity | | Affiliation |
|
Franklin Templeton Services LLC (FT Services) | | Administrative manager |
Franklin Mutual Advisers LLC (Franklin Mutual) | | Investment manager |
Franklin/Templeton Distributors Inc. (Distributors) | | Principal underwriter |
Franklin/Templeton Investor Services LLC (Investor Services) | | Transfer agent |
The Fund pays an investment management fee to Franklin Mutual of .80% per year of the average daily net assets of the Fund.
The Fund pays administrative fees to FT Services based on the average daily net assets of the Fund as follows:
| | |
| Annualized Fee Rate | | Daily Net Assets |
|
| .15% | | First $200 million |
| .135% | | Over $200 million, up to and including $700 million |
| .10% | | Over $700 million, up to and including $1.2 billion |
Fees are further reduced on net assets over $1.2 billion.
The Fund reimburses Distributors up to .25% per year of its average daily net assets of Class 2, for costs incurred in marketing the Fund’s shares.
Investor Services, under terms of an agreement, performs shareholder servicing for the Fund and is not paid by the Fund for the services.
MD-25
FRANKLIN TEMPLETON VARIABLE INSURANCE PRODUCTS TRUST
MUTUAL DISCOVERY SECURITIES FUND
Notes to Financial Statements (continued)
4. INCOME TAXES
At December 31, 2003, the cost of investments, net unrealized appreciation (depreciation) and undistributed ordinary income for income tax purposes was as follows:
| | | | |
Cost of investments | | $ | 244,712,965 | |
| | |
|
|
|
Unrealized appreciation | | | 61,542,358 | |
Unrealized depreciation | | | (3,263,664 | ) |
| | |
|
|
|
Net unrealized appreciation (depreciation) | | $ | 58,278,694 | |
| | |
|
|
|
Distributable earnings—Undistributed ordinary income | | $ | 4,135,235 | |
| | |
|
|
|
The tax character of distributions paid during the years ended December 31, 2003 and 2002, was as follows:
| | | | | | |
| | | 2003
| | 2002
|
Distributions paid from: | | | | | | |
Ordinary income | | $ | 3,544,097 | | $ | 4,560,237 |
Long-term capital gains | | | — | | | 1,020,737 |
| | |
|
| |
|
|
| | | $
| 3,544,097
| | $
| 5,580,974
|
Net investment income (loss) differs for financial statement and tax purposes primarily due to differing treatments of defaulted securities, foreign currency transactions, passive foreign investment company shares, and bond discounts and premiums.
Net realized losses differ for financial statement and tax purposes primarily due to differing treatment of wash sales, foreign currency transactions and bond discounts and premiums.
At December 31, 2003, the Fund has deferred capital losses occurring subsequent to October 31, 2003 of $2,282,737. For tax purposes, such losses will be reflected in the year ending December 31, 2004.
At December 31, 2003, the Fund had tax basis capital losses which may be carried over to offset future capital gains. Such losses expire as follows:
| | | |
Capital loss carryovers expiring in: | | | |
2010 | | $ | 6,699,672 |
2011 | | | 4,363,507 |
| | |
|
|
| | | $ | 11,063,179 |
| | |
|
|
5. INVESTMENT TRANSACTIONS
Purchases and sales of securities (excluding short-term securities and securities sold short) for the year ended December 31, 2003 aggregated $142,612,971 and $70,944,403, respectively.
Transactions in options written during the year ended December 31, 2003 were as follows:
| | | | | | | |
| | | Number
of Contracts
| | | Premium
| |
Options outstanding at December 31, 2002 | | 10,000 | | | $ | 5,572 | |
Options written | | 50,886 | | | | 78,948 | |
Options expired | | (6,325 | ) | | | (20,074 | ) |
Options terminated in closing transactions | | (22 | ) | | | (5,003 | ) |
Options exercised | | (4,489 | ) | | | (45,790 | ) |
| | |
| |
Options outstanding at December 31, 2003 | | 50,050 | | | $ | 13,653 | |
| | |
| |
MD-26
FRANKLIN TEMPLETON VARIABLE INSURANCE PRODUCTS TRUST
MUTUAL DISCOVERY SECURITIES FUND
Notes to Financial Statements (continued)
6. FORWARD CURRENCY CONTRACTS
At December 31, 2003, the Fund has outstanding forward exchange contracts as set out below. The contracts are reported in the financial statements at the Fund’s net equity, as measured by the difference between the forward exchange rates at the reporting date and the forward exchange rates at the day of entry into the contracts.
| | | | | | | | | | | | | | | |
Contracts to buy:
| | In
Exchange for
| | Settlement
Date
| | Unrealized
Gain (Loss)
| |
| 50,000 | | British Pounds | | U.S. | | $ | 88,108 | | 1/28/04 | | U.S. | | $ | 1,205 | |
| 200,000 | | European Unit | | | | | 228,060 | | 1/28/04 | | | | | 24,009 | |
| 200,000 | | British Pounds | | | | | 354,924 | | 2/05/04 | | | | | 2,134 | |
| 800,000 | | European Unit | | | | | 1,005,076 | | 2/05/04 | | | | | 3,005 | |
| 11,304,159 | | Swedish Krona | | | | | 1,540,239 | | 3/23/04 | | | | | 24,631 | |
| | | | | | |
|
| | | | | |
|
|
|
| | | | | U.S. | | $ | 3,216,407 | | | | U.S. | | $ | 54,984 | |
| | | | | | |
|
| | | | | |
|
|
|
| | | |
Contracts to sell:
| | | | | | | |
| 957,480,000 | | Korean Won | | U.S. | | $ | 800,000 | | 3/18/04 | | U.S. | | $ | 2,193 | |
| 2,479,287 | | South African Rand | | | | | 375,583 | | 4/26/04 | | | | | 12,690 | |
| | | | | | |
|
| | | | | |
|
|
|
| | | | | U.S. | | $ | 1,175,583 | | | | | | | 14,883 | |
| | | | | | |
|
| | | | | |
|
|
|
| Unrealized gain on forward exchange contracts | | | | | | | | | U.S. | | $ | 69,867 | |
| | | | | | | | | | | | | |
|
|
|
| | | |
Contracts to sell:
| | | | | | | |
| 2,450,000 | | British Pounds | | U.S. | | $ | 4,259,335 | | 1/12/04 | | U.S. | | $ | (122,441 | ) |
| 5,999,326 | | British Pounds | | | | | 10,212,517 | | 1/20/04 | | | | | (510,458 | ) |
| 12,812,796 | | Canadian Dollars | | | | | 9,292,295 | | 1/21/04 | | | | | (613,099 | ) |
| 1,009,956 | | British Pounds | | | | | 1,716,758 | | 1/28/04 | | | | | (87,273 | ) |
| 2,667,997 | | British Pounds | | | | | 4,625,932 | | 2/11/04 | | | | | (134,676 | ) |
| 2,598,505 | | Swiss Franc | | | | | 1,906,083 | | 2/17/04 | | | | | (197,544 | ) |
| 11,740,443 | | European Unit | | | | | 12,974,811 | | 2/23/04 | | | | | (1,811,792 | ) |
| 10,194,000 | | Taiwan Dollars | | | | | 300,000 | | 2/25/04 | | | | | (265 | ) |
| 2,000,000 | | British Pounds | | | | | 3,370,600 | | 2/27/04 | | | | | (193,734 | ) |
| 33,019,105 | | Danish Krone | | | | | 5,438,697 | | 3/17/04 | | | | | (142,311 | ) |
| 85,883,801 | | Japanese Yen | | | | | 750,000 | | 3/18/04 | | | | | (53,366 | ) |
| 2,287,578,250 | | Korean Won | | | | | 1,900,000 | | 3/18/04 | | | | | (6,154 | ) |
| 26,025,395 | | Swedish Krona | | | | | 3,221,164 | | 3/23/04 | | | | | (381,612 | ) |
| 1,048,485 | | European Unit | | | | | 1,222,177 | | 3/25/04 | | | | | (97,233 | ) |
| 284,292,580 | | Japanese Yen | | | | | 2,563,264 | | 3/25/04 | | | | | (96,618 | ) |
| 29,097,438 | | Norwegian Krona | | | | | 4,088,861 | | 4/15/04 | | | | | (270,180 | ) |
| 10,137,827 | | European Unit | | | | | 11,763,018 | | 4/22/04 | | | | | (985,196 | ) |
| 5,829,132 | | South African Rand | | | | | 822,471 | | 4/26/04 | | | | | (30,740 | ) |
| 255,113,353 | | Japanese Yen | | | | | 2,328,265 | | 6/24/04 | | | | | (65,888 | ) |
| | | | | | |
|
| | | | | |
|
|
|
| | | | | U.S. | | $ | 82,756,248 | | | | | | | (5,800,580 | ) |
| | | | | | |
|
| | | | | |
|
|
|
| Unrealized loss on forward exchange contracts | | | | | | | | | | | | (5,800,580 | ) |
| | | | | | | | | �� | | | | |
|
|
|
| Net unrealized loss on forward exchange contracts | | | | | | | | | U.S. | | $ | (5,730,713 | ) |
| | | | | | | | | | | | | |
|
|
|
MD-27
FRANKLIN TEMPLETON VARIABLE INSURANCE PRODUCTS TRUST
MUTUAL DISCOVERY SECURITIES FUND
Notes to Financial Statements (continued)
7. CREDIT RISK AND DEFAULTED SECURITIES
The Fund held defaulted and/or other securities for which the income has been deemed uncollectible. The Fund discontinues accruing income on these securities and provides and estimate for losses on interest receivable. At December 31, 2003 the value of these securities was $19,673,177 representing 6.7% of the Fund’s net assets. For information as to specific securities, see the accompanying Statement of Investments.
8. RESTRICTED SECURITIES
At December 31, 2003, investments in securities included issues that are restricted or illiquid. Restricted securities are often purchased in private placement transactions, are not registered under the Securities Act of 1933, may have contractual restrictions on resale, and are valued under methods approved by the Board of Trustees as reflecting fair value. A security may also be considered illiquid if it lacks a readily available market or if its valuation has not changed for a certain period of time. At December 31, 2003, the Fund held investments in restricted and illiquid securities that were valued under approved methods by the Trustees, as follows:
| | | | | | | | | | |
| Shares | | Issuer | | Acquisition
Date | | Cost | | Value |
|
| 3,103 | | AboveNet Inc. | | 10/2/01 | | $ | 92,948 | | $ | 92,948 |
| 746 | | Elephant Capital Holdings Ltd. | | 10/21/03 | | | 745,500 | | | 745,500 |
| 128,899 | | International Steel Group | | 4/10/02 | | | 587,500 | | | 4,267,524 |
| 34,780 | | Leucadia National Corp. | | 12/20/02 | | | 1,225,995 | | | 1,523,190 |
| 2,227,000 | | MP Finance Ltd., 5.00%, 8/28/07 | | 8/29/03 | | | 2,184,362 | | | 2,271,540 |
| 477,000 | | Nippon Investments LLC | | 2/14/01 | | | — | | | 181,260 |
| 30,150 | | NTL Inc. | | 1/08/03 | | | 1,581,443 | | | 1,997,814 |
| 2,140 | | Olympus Re Holdings Ltd. | | 12/19/01 | | | 214,000 | | | 338,484 |
| 667 | | PG & E Corp., wts. 9/02/06 | | 10/29/02 | | | — | | | 16,664 |
| 4,563 | | Security Capital European Realty | | 4/08/98 | | | 103,688 | | | 33,994 |
| 10 | | Torre Mayor Investments, LP | | 10/28/02 | | | 1,000,000 | | | 800,000 |
| 2,796 | | White Mountains Insurance Group Inc. | | 10/22/02 | | | 824,820 | | | 1,221,719 |
| | | | | | | | | |
|
|
| | | Total Restricted Securities (4.6% of Net Assets) | | | | | | | $ | 13,490,637 |
| | | | | | | | | |
|
|
9. OTHER CONSIDERATIONS
A member of the Fund’s Portfolio Management team may serve as a member on the board of directors of certain companies in which the Fund invests and may represent the Fund in certain corporate negotiations. Currently, a member of the Portfolio Management team serves in one or more of these capacities for Kindred Healthcare and AboveNet Inc. As a result of this involvement, the Portfolio Manager could receive certain material non-public information which, pursuant to the Fund’s policies and the requirements of the federal securities laws, could prevent the Fund from trading in the securities of such companies for limited or extended periods of time.
10. REGULATORY MATTERS
On February 4, 2004, the Securities Division of the Office of the Secretary of the Commonwealth of Massachusetts filed an administrative complaint against Franklin Resources, Inc. and certain of its subsidiaries (the “Company”), alleging violations of the Massachusetts Uniform Securities Act. The complaint arises from activity that occurred in 2001 during which time an officer of a Company subsidiary was negotiating an agreement with an investor relating to investments in a mutual fund and a hedge fund.
MD-28
FRANKLIN TEMPLETON VARIABLE INSURANCE PRODUCTS TRUST
MUTUAL DISCOVERY SECURITIES FUND
Notes to Financial Statements (continued)
10. REGULATORY MATTERS (cont.)
The Company, in addition to other entities within Franklin Templeton Investments, has been named in shareholder class actions related to the matter described above. The Company believes that the claims made in the lawsuit are without merit and it intends to defend vigorously against the allegations. The Company and the Fund may be named in similar civil actions related to the matter described above.
In addition, as part of ongoing investigations by the U.S. Securities and Exchange Commission (the “SEC”), the U.S. Attorney for the Northern District of California, the New York Attorney General, the California Attorney General, the U.S. Attorney for the District of Massachusetts, the Florida Department of Financial Services, and the Commissioner of Securities and the Attorney General of the State of West Virginia, relating to certain practices in the mutual fund industry, including late trading, market timing and sales compensation arrangements, the Company and its subsidiaries, as well as certain current or former executives and employees of the Company, have received requests for information and/or subpoenas to testify or produce documents. The Company and its current employees are providing documents and information in response to these requests and subpoenas. In addition, the Company has responded to requests for similar kinds of information from regulatory authorities in some of the foreign countries where the Company conducts its global asset management business.
The Staff of the SEC has informed the Company that it intends to recommend that the Commission authorize an action against an affiliate of the Fund’s adviser and a senior executive officer relating to the frequent trading issues that are the subject of the SEC’s investigation. These issues were previously disclosed as being under investigation by government authorities and the subject of an internal inquiry by the Company in its Annual Report on Form 10-K and on its public website. The Company currently is in discussions with the SEC Staff in an effort to resolve the issues raised in their investigation. Such discussions are preliminary and the Fund’s management has been advised that the Company cannot predict the likelihood of whether those discussions will result in a settlement and, if so, the terms of such settlement. The impact, if any, of these matters on the Fund is uncertain at this time. If the Company finds that it bears responsibility for any unlawful or improper conduct, it has committed to making the Fund or its shareholders whole, as appropriate.
MD-29
FRANKLIN TEMPLETON VARIABLE INSURANCE PRODUCTS TRUST
MUTUAL DISCOVERY SECURITIES FUND
Independent Auditors’ Report
To the Board of Trustees and Shareholders of Franklin Templeton Variable Insurance Products Trust – Mutual Discovery Securities Fund
In our opinion, the accompanying statement of assets and liabilities, including the statement of investments, and the related statements of operations and of changes in net assets and the financial highlights present fairly, in all material respects, the financial position of the Mutual Discovery Securities Fund (the “Fund,” one of the funds constituting the Franklin Templeton Variable Insurance Products Trust) at December 31, 2003, the results of its operations for the year then ended, the changes in its net assets for each of the two years in the period then ended and the financial highlights for each of the periods presented, in conformity with accounting principles generally accepted in the United States of America. These financial statements and financial highlights (hereafter referred to as “financial statements”) are the responsibility of the Fund’s management; our responsibility is to express an opinion on these financial statements based on our audits. We conducted our audits of these financial statements in accordance with auditing standards generally accepted in the United States of America, which require that we plan and perform the audits to obtain reasonable assurance about whether the financial statements are free of material misstatement. An audit includes examining, on a test basis, evidence supporting the amounts and disclosures in the financial statements, assessing the accounting principles used and significant estimates made by management, and evaluating the overall financial statement presentation. We believe that our audits, which included confirmation of securities at December 31, 2003 by correspondence with the custodian and brokers, provide a reasonable basis for our opinion.
PricewaterhouseCoopers LLP
San Francisco, California
February 5, 2004, except for Note 10 as to which the date is February 12, 2004
MD-30
FRANKLIN TEMPLETON VARIABLE INSURANCE PRODUCTS TRUST
MUTUAL DISCOVERY SECURITIES FUND
Tax Designation (unaudited)
Under Section 854(b)(2) of the Code, the Fund hereby designates 17.72% of the ordinary income dividends as income qualifying for the dividends received deduction for the fiscal year ended December 31, 2003.
The foreign tax information will be disclosed in the June 30, 2004 semi-annual report of the funds.
MD-31
MUTUAL SHARES SECURITIES FUND
Fund Goals and Primary Investments: Mutual Shares Securities Fund seeks capital appreciation, with income as a secondary goal. The Fund invests mainly in equity securities (including securities convertible, or that the manager expects to become convertible, into common or preferred stock) of companies that the Fund’s manager believes are available at market prices less than their value based on certain recognized or objective criteria. The Fund may also invest a significant portion in small capitalization companies and a portion in foreign securities.
This annual report for Mutual Shares Securities Fund covers the fiscal year ended December 31, 2003.
Performance Overview
You can find the Fund’s one-year total return in the Performance Summary following this report. The Fund underperformed its benchmark, the Standard & Poor’s 500 Composite Index (S&P 500), which returned 28.67% for the year under review.1 Because our investment style seeks to assume less risk than the markets, the Fund may outperform when indexes are weak and underperform when markets rally.
Economic and Market Overview
Early in 2003, economic uncertainty and geopolitical events pushed U.S. interest rates to their lowest level in more than four decades. The U.S. government injected fiscal stimulus into the economy, approving another round of tax cuts and rebates that included dividend and capital gains tax reductions. In June, an accommodative Federal Reserve Board, in an attempt to bolster the economy, cut the federal funds target rate to 1.00%.
During the year, the U.S. trade deficit increased significantly, contributing to the U.S. dollar’s fall to record lows against the euro and other major currencies. However, the weak dollar provided a boost to the U.S. economy and corporate profits as exports became cheaper for foreign buyers. Robust consumer spending, especially for autos and homes, and strong business spending, particularly for equipment and software, contributed to the accelerated economic activity. In addition, U.S. federal spending stayed firm and inflation remained benign. U.S. gross domestic product (GDP) grew an annualized 8.2% in third
1. Source: Standard & Poor’s Micropal. One cannot invest directly in an index, nor is an index representative of the Fund’s portfolio. Please see Index Descriptions following the Fund Summaries.
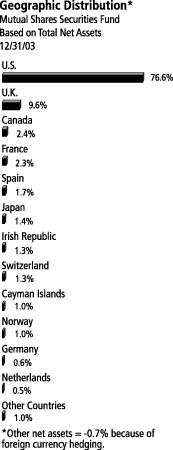
MS-1
quarter 2003, its strongest pace in nearly 20 years, and overall, 2003 GDP grew an estimated 3.1%. As economic data improved, some interest rates rose from their lows, and the 10-year Treasury note’s yield ended the period at 4.27%.
Foreign economies also showed signs of recovery and benign inflation following a low growth and disinflationary environment that facilitated monetary easing in many major economies during the reporting period. While economic growth accelerated in the U.S., it remained strong in Asia, and was weak, yet positive, in Europe. Despite these signs of economic recovery, benign inflationary trends continued, supported by cyclical productivity gains and excess capacity in labor and capital.
A global equity market rally started in late March 2003 and continued through the end of the year. The rebound began with investors anticipating economic recovery in the second half of 2003, and it continued as data showed robust economic growth. Improved sentiment led many investors to rotate into economically sensitive and financially leveraged companies, specifically cyclical, technology, small-capitalization and emerging market stocks. Consequently, domestic and foreign equity markets generally performed well.
Investment Strategy
At Mutual Series, we are committed to our distinctive three-pronged approach to investing. The first prong of our investment strategy, and the component that typically comprises the largest portion of our portfolio, is investing in undervalued stocks. When selecting undervalued equities, we seek to invest in fundamentally strong companies, with healthy balance sheets, high-quality assets, substantial free cash flow and shareholder-oriented management teams whose stocks are trading at material discounts to our assessment of the companies’ intrinsic or business value. While most of our undervalued equity investments are made in publicly traded companies, we occasionally may invest in privately held companies as well.
Our second investment prong is bankruptcy or distressed investing, a highly specialized field, which is complex and can take many forms. The most common distressed investment the Fund undertakes is the purchase of the debt of financially troubled or bankrupt companies at a substantial discount to face value. After the financially distressed company is reorganized, often in bankruptcy court, the old bonds are typically replaced with new securities issued by the financially stronger company.
Top 10 Sectors/Industries
Mutual Shares Securities Fund
Based on Equity Securities
12/31/03
| | |
| | | % of Total
Net Assets |
|
| |
| Insurance | | 16.7% |
| |
| Media | | 8.0% |
| |
| Tobacco | | 7.0% |
| |
| Metals & Mining | | 5.7% |
| |
| Beverages | | 3.3% |
| |
| Food Products | | 3.1% |
| |
| Thrifts & Mortgage Finance | | 2.7% |
| |
| Diversified Telecommunication Services | | 2.4% |
| |
| Pharmaceuticals | | 2.3% |
| |
| Commercial Banks | | 2.1% |
MS-2
The third prong of our investment strategy is participating in arbitrage situations, another highly specialized field. When companies announce mergers or takeovers, commonly referred to as “deals,” the target company may trade at a discount to the bid it ultimately accepts. One form of arbitrage involves the purchase of the target company stock when it is trading below the value we believe it is likely to receive in a deal. In keeping with our commitment to a conservative investment approach, we primarily focus our arbitrage efforts on announced deals, generally eschewing rumored deals or other situations we consider to be risky.
Manager’s Discussion
While all three prongs of our investment strategy contributed to Fund performance during the year under review, the strongest contributors were the distressed and equity portfolios. Three of our best performers in 2003 included International Steel Group (ISG); White Mountains Insurance Group, a property and casualty (P&C) insurer; and NTL Communications, a distressed investment.
ISG, the nation’s second-largest steel producer, restructured and assimilated steel facilities and we feel that the company emerged as a competitive, low-cost operator. Our ISG investment’s value was highlighted in the public markets during the first half of December when the company raised capital through an initial public offer (IPO). The IPO was very well received and ISG’s stock price appreciated almost 40% in December, contributing to a solid 2003 performance.
Our investment in White Mountains reflects our focus on companies with strong or improving fundamentals, attractive valuations and management teams who think like owners. During 2003, the company benefited from strong price increases for primary and reinsurance risks, disciplined underwriting and solid returns from its investment portfolio. While many companies within the P&C insurance industry struggled with eroding capital from past underwriting mistakes and significant losses in their investment portfolios, we believe White Mountains utilized its much-improved balance sheet and industry knowledge to acquire insurance companies we believe are undervalued or capital-constrained and to increase exposure to what we feel are its most attractive lines of businesses. Primarily as a result of these actions, the company continued to improve profitability and enjoyed a 13% increase in its book value during 2003.
Top 10 Holdings
Mutual Shares Securities Fund
12/31/03
| | |
Company Sector/Industry,
Country | | % of Total
Net Assets |
|
| |
| Berkshire Hathaway Inc., A & B | | 4.9% |
| Insurance, U.S. | | |
| |
| White Mountains Insurance Group Inc., common & restricted | | 3.3% |
| Insurance, U.S. | | |
| |
| Liberty Media Corp., A | | 2.5% |
| Media, U.S. | | |
| |
| Newmont Mining Corp. | | 2.5% |
| Metals & Mining, U.S. | | |
| |
| British American Tobacco PLC, ord. & ADR | | 2.0% |
| Tobacco, U.K. | | |
| |
| Washington Post Co., B | | 1.8% |
| Media, U.S. | | |
| |
| Altadis SA | | 1.7% |
| Tobacco, Spain | | |
| |
| Hartford Financial Services Group Inc. | | 1.7% |
| Insurance, U.S. | | |
| |
| Willis Group Holdings Ltd. | | 1.6% |
| Insurance, U.S. | | |
| |
| R.J. Reynolds Tobacco Holdings Inc. | | 1.6% |
| Tobacco, U.S. | | |
The dollar value, number of shares or principal amount, and complete legal titles of all portfolio holdings are listed in the Fund’s Statement of Investments.
MS-3
A reorganized NTL, the U.K.’s largest cable company, emerged from bankruptcy in January 2003. As global cable valuations recovered, the new NTL shares performed well during the year and appreciated more than 15 times from their lows.
Although the Fund’s successes during the reporting period were many, not all of our investments performed as well as we hoped. Three of the Fund’s underperformers included Allied Domecq (sold by year-end), one of the world’s largest spirits and wine companies; Abitibi-Consolidated (sold by year-end), a Canadian paper and forest products company; and Beiersdorf, a German personal care products company. Allied Domecq’s stock declined after the company lowered its earnings outlook in February due to a weak U.S. dollar, higher pension expenses and weakness in its Spanish operations. Abitibi’s shares underperformed in 2003 after a weak U.S. dollar, soft sales and higher energy prices forced the company to reduce its earnings outlook and cut its dividend. Beiersdorf, which had been the subject of takeover speculation earlier in the year, declined after the company’s major shareholders announced the company would remain independent and not be sold.
Thank you for your participation in Mutual Shares Securities Fund. We look forward to serving your future investment needs.
This discussion reflects our analysis, opinions and portfolio holdings as of December 31, 2003, the end of the reporting period. The way we implement our main investment strategies and the resulting portfolio holdings may change depending on factors such as market and economic conditions. These opinions may not be relied upon as investment advice or an offer for a particular security. The information is not a complete analysis of every aspect of any market, country, industry, security or the Fund. Statements of fact are from sources considered reliable, but the advisor makes no representation or warranty as to their completeness or accuracy. Although historical performance is no guarantee of future results, these insights may help you understand our investment management philosophy.
MS-4
PERFORMANCE SUMMARYASOF 12/31/03
Total return of Class 2 shares represents the average annual change in value, assuming reinvestment of dividends and capital gains. Average returns smooth out variations in returns, which can be significant; they are not the same as year-by-year results.
Mutual Shares Securities Fund – Class 2*
Periods ended 12/31/03
| | | | | | |
| | | 1-Year | | 5-Year | | Since
Inception
(11/8/96) |
|
| | | |
Average Annual Total Return | | +25.15% | | +8.73% | | +9.02% |
*Because Class 2 shares were not offered until 1/6/99, standardized Class 2 Fund performance for prior periods represents the historical results of Class 1 shares. For periods beginning on 1/6/99, Class 2’s results reflect an additional 12b-1 fee expense, which also affects future performance. Since 1/6/99 (effective date), the average annual total return of Class 2 shares was +8.04%.
Ongoing market volatility can significantly affect short-term performance; recent returns may differ.
Total Return Index Comparison
for Hypothetical $10,000 Investment (11/8/96–12/31/03)
The graph compares the performance of Mutual Shares Securities Fund – Class 2* and the S&P 500. One cannot invest directly in an index, nor is an index representative of the Fund’s portfolio. Please see Important Notes to Performance Information preceding the Fund Summaries.
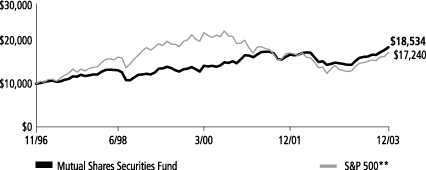
**Source: Standard & Poor’s Micropal. Please see Index Descriptions following the Fund Summaries.
Mutual Shares
Securities Fund – Class 2
Performance reflects the Fund’s Class 2 operating expenses, but does not include any contract fees, expenses or sales charges. If they had been included, performance would be lower. These charges and deductions, particularly for variable life policies, can have a significant effect on contract values and insurance benefits. See the contract prospectus for a complete description of these expenses, including sales charges.
Since markets can go down as well as up, investment return and the value of your principal will fluctuate with market conditions, and you may have a gain or loss when you sell your shares.
MS-5
Past performance does not guarantee future results.
FRANKLIN TEMPLETON VARIABLE INSURANCE PRODUCTS TRUST
MUTUAL SHARES SECURITIES FUND
Financial Highlights
| | | | | | | | | | | | | | | | | | | | |
| | | Class 1
| |
| | | Year Ended December 31,
| |
| | | 2003
| | | 2002
| | | 2001
| | | 2000
| | | 1999
| |
Per share operating performance | | | | | | | | | | | | | | | | | | | | |
(for a share outstanding throughout the year) | | | | | | | | | | | | | | | | | | | | |
| | | | | |
Net asset value, beginning of year | | $ | 12.09 | | | $ | 14.08 | | | $ | 14.24 | | | $ | 13.23 | | | $ | 11.96 | |
| | |
|
|
|
Income from investment operations: | | | | | | | | | | | | | | | | | | | | |
Net investment incomea | | | .18 | | | | .20 | | | | .21 | | | | .30 | | | | .20 | |
Net realized and unrealized gains (losses) | | | 2.88 | | | | (1.78 | ) | | | .86 | | | | 1.42 | | | | 1.41 | |
| | |
|
|
|
Total from investment operations | | | 3.06 | | | | (1.58 | ) | | | 1.07 | | | | 1.72 | | | | 1.61 | |
| | |
|
|
|
Less distributions from: | | | | | | | | | | | | | | | | | | | | |
Net investment income | | | (.15 | ) | | | (.12 | ) | | | (.29 | ) | | | (.38 | ) | | | (.34 | ) |
Net realized gains | | | — | | | | (.29 | ) | | | (.94 | ) | | | (.33 | ) | | | — | |
| | |
|
|
|
Total distributions | | | (.15 | ) | | | (.41 | ) | | | (1.23 | ) | | | (.71 | ) | | | (.34 | ) |
| | |
|
|
|
Net asset value, end of year | | $ | 15.00 | | | $ | 12.09 | | | $ | 14.08 | | | $ | 14.24 | | | $ | 13.23 | |
| | |
|
|
|
| | | | | |
Total returnb | | | 25.48% | | | | (11.56)% | | | | 7.31% | | | | 13.62% | | | | 13.40% | |
Ratios/ supplemental data | | | | | | | | | | | | | | | | | | | | |
Net assets, end of year (000’s) | | $ | 312,386 | | | $ | 288,928 | | | $ | 399,336 | | | $ | 407,063 | | | $ | 448,278 | |
Ratios to average net assets:* | | | | | | | | | | | | | | | | | | | | |
Expensesc | | | .80% | | | | .80% | | | | .79% | | | | .80% | | | | .79% | |
Net investment income | | | 1.33% | | | | 1.57% | | | | 1.42% | | | | 2.23% | | | | 1.59% | |
Portfolio turnover rate | | | 55.71% | | | | 49.80% | | | | 54.73% | | | | 66.67% | | | | 80.02% | |
*Ratios to average net assets, excluding dividend expense on securities sold short: | | | | | | | | | | | | | | | | | | | | |
Expenses | | | .76% | | | | .79% | | | | .78% | | | | .77% | | | | .77% | |
| aBased | on average daily shares outstanding. |
| bTotal | return does not include any fees, charges or expenses imposed by the variable annuity and life insurance contracts for which the Franklin Templeton Variable Insurance Products Trust serves as an underlying investment vehicle. Total return is not annualized for periods less that one year. |
| cIncludes | dividend expense on securities sold short which varies from period to period. See below for expense ratios that reflect consistent operating expenses. |
MS-6
.
FRANKLIN TEMPLETON VARIABLE INSURANCE PRODUCTS TRUST
MUTUAL SHARES SECURITIES FUND
Financial Highlights (continued)
| | | | | | | | | | | | | | | | | | | | |
| | | Class 2
| |
| | | Year Ended December 31 ,
| |
| | | 2003
| | | 2002
| | | 2001
| | | 2000
| | | 1999d
| |
Per share operating performance | | | | | | | | | | | | | | | | | | | | |
(for a share outstanding throughout the year) | | | | | | | | | | | | | | | | | | | | |
| | | | | |
Net asset value, beginning of year | | $ | 12.02 | | | $ | 14.03 | | | $ | 14.22 | | | $ | 13.25 | | | $ | 12.36 | |
| | |
|
|
|
Income from investment operations: | | | | | | | | | | | | | | | | | | | | |
Net investment incomea | | | .14 | | | | .16 | | | | .15 | | | | .26 | | | | .16 | |
Net realized and unrealized gains (losses) | | | 2.88 | | | | (1.77 | ) | | | .88 | | | | 1.41 | | | | 1.07 | |
| | |
|
|
|
Total from investment operations | | | 3.02 | | | | (1.61 | ) | | | 1.03 | | | | 1.67 | | | | 1.23 | |
| | |
|
|
|
Less distributions from: | | | | | | | | | | | | | | | | | | | | |
Net investment income | | | (.14 | ) | | | (.11 | ) | | | (.28 | ) | | | (.37 | ) | | | (.34 | ) |
Net realized gains | | | — | | | | (.29 | ) | | | (.94 | ) | | | (.33 | ) | | | — | |
| | |
|
|
|
Total distributions | | | (.14 | ) | | | (.40 | ) | | | (1.22 | ) | | | (.70 | ) | | | (.34 | ) |
| | |
|
|
|
Net asset value, end of year | | $ | 14.90 | | | $ | 12.02 | | | $ | 14.03 | | | $ | 14.22 | | | $ | 13.25 | |
| | |
|
|
|
| | | | | |
Total returnb | | | 25.15% | | | | (11.81)% | | | | 7.04% | | | | 13.25% | | | | 9.91% | |
Ratios/ supplemental data | | | | | | | | | | | | | | | | | | | | |
Net assets, end of year (000’s) | | $ | 1,469,745 | | | $ | 589,738 | | | $ | 262,621 | | | $ | 37,087 | | | $ | 5,716 | |
Ratios to average net assets:* | | | | | | | | | | | | | | | | | | | | |
Expensesc | | | 1.05% | | | | 1.05% | | | | 1.04% | | | | 1.05% | | | | 1.04% | e |
Net investment income | | | 1.08% | | | | 1.32% | | | | 1.04% | | | | 1.96% | | | | 1.26% | e |
Portfolio turnover rate | | | 55.71% | | | | 49.80% | | | | 54.73% | | | | 66.67% | | | | 80.02% | |
*Ratios to average net assets, excluding dividend expense on securities sold short: | | | | | | | | | | | | | | | | | | | | |
Expenses | | | 1.01% | | | | 1.04% | | | | 1.03% | | | | 1.02% | | | | 1.04% | |
| a | Based on average daily shares outstanding. |
| b | Total return does not include any fees, charges or expenses imposed by the variable annuity and life insurance contracts for which the Franklin Templeton Variable Insurance Products Trust serves as an underlying investment vehicle. Total return is not annualized for periods less that one year. |
| c | Includes dividend expense on securities sold short which varies from period to period. See below for expense ratios that reflect consistent operating expenses. |
| d | For the period January 6, 1999 (effective date) to December 31, 1999. |
MS-7
See notes to financial statements.
FRANKLIN TEMPLETON VARIABLE INSURANCE PRODUCTS TRUST
MUTUAL SHARES SECURITIES FUND
Statement of Investments, December 31, 2003
| | | | | | | | | |
| | | | | COUNTRY | | SHARES/
WARRANTS/
CONTRACTS | | VALUE |
|
| | | Common Stocks and Other Equity Interests 66.4% | | | | | | | |
| | | Aerospace & Defense .6% | | | | | | | |
| | | Northrop Grumman Corp. | | United States | | 120,000 | | $ | 11,472,000 |
| | | | | | | | |
|
|
| | | Airlines | | | | | | | |
| a | | Atlantic Coast Airlines Holdings Inc. | | United States | | 10,700 | | | 105,930 |
| | | | | | | | |
|
|
| | | Beverages 3.3% | | | | | | | |
| | | Brown-Forman Corp., A | | United States | | 3,800 | | | 368,410 |
| | | Brown-Forman Corp., B | | United States | | 42,965 | | | 4,015,079 |
| | | Coca-Cola Enterprises Inc. | | United States | | 95,800 | | | 2,095,146 |
| | | Diageo PLC | | United Kingdom | | 2,117,374 | | | 27,859,686 |
| | | Heineken Holding NV, A | | Netherlands | | 127,905 | | | 4,376,971 |
| | | Orkla ASA | | Norway | | 802,860 | | | 17,981,322 |
| | | Pepsi Bottling Group Inc. | | United States | | 57,600 | | | 1,392,768 |
| | | | | | | | |
|
|
| | | | | | | | | | 58,089,382 |
| | | | | | | | |
|
|
| | | Biotechnology | | | | | | | |
| a | | SICOR Inc. | | United States | | 11,000 | | | 299,200 |
| | | | | | | | |
|
|
| | | Capital Markets .2% | | | | | | | |
| | | Bear Stearns Cos. Inc. | | United States | | 37,420 | | | 2,991,729 |
| | | | | | | | |
|
|
| | | Chemicals .9% | | | | | | | |
| | | International Flavors & Fragrances Inc. | | United States | | 469,300 | | | 16,387,956 |
| | | | | | | | |
|
|
| | | Commercial Banks 2.2% | | | | | | | |
| | | Allied Irish Banks PLC | | Irish Republic | | 802,400 | | | 12,833,542 |
| | | Bank of Ireland | | Irish Republic | | 761,384 | | | 10,362,428 |
| | | Danske Bank | | Denmark | | 294,580 | | | 6,911,451 |
| | | Fleet Boston Financial Corp. | | United States | | 47,500 | | | 2,073,375 |
| | | KeyCorp | | United States | | 219,100 | | | 6,424,012 |
| a,b | | Nippon Investment LLC | | Japan | | 1,148,000 | | | 436,240 |
| | | U.S. Bancorp | | United States | | 35,752 | | | 1,065,558 |
| | | | | | | | |
|
|
| | | | | | | | | | 40,106,606 |
| | | | | | | | |
|
|
| | | Commercial Services & Supplies .9% | | | | | | | |
| a | | Alderwoods Group Inc. | | United States | | 66,448 | | | 625,940 |
| a | | Cendant Corp. | | United States | | 296,577 | | | 6,604,770 |
| | | Republic Services Inc. | | United States | | 329,700 | | | 8,450,211 |
| | | | | | | | |
|
|
| | | | | | | | | | 15,680,921 |
| | | | | | | | |
|
|
| | | Computers & Peripherals | | | | | | | |
| a | | DecisionOne Corp. | | United States | | 26,349 | | | 52,698 |
| | | | | | | | |
|
|
| | | Construction Materials .3% | | | | | | | |
| | | Martin Marietta Materials Inc. | | United States | | 129,600 | | | 6,087,312 |
| | | | | | | | |
|
|
| | | Diversified Financial Services 1.5% | | | | | | | |
| | | Brascan Corp., A | | Canada | | 447,300 | | | 13,752,160 |
| a,b | | Elephant Capital Holdings Ltd. | | Japan | | 4,595 | | | 4,594,900 |
| a,b | | Leucadia National Corp. | | United States | | 184,830 | | | 8,094,630 |
| | | | | | | | |
|
|
| | | | | | | | | | 26,441,690 |
| | | | | | | | |
|
|
MS-8
FRANKLIN TEMPLETON VARIABLE INSURANCE PRODUCTS TRUST
MUTUAL SHARES SECURITIES FUND
Statement of Investments, December 31, 2003 (cont.)
| | | | | | | |
| | | COUNTRY | | SHARES/
WARRANTS/
CONTRACTS | | VALUE |
|
Common Stocks and Other Equity Interests (cont.) | | | | | | | |
Diversified Telecommunication Services 2.4% | | | | | | | |
a,b,cAboveNet Inc. | | United States | | 10,442 | | $ | 312,783 |
BCE Inc. | | Canada | | 295,000 | | | 6,597,408 |
Global Crossing Holdings Ltd., Contingent Equity Distribution | | United States | | 9,018,431 | | | 7,891 |
aGlobal Crossing Ltd. | | United States | | 13,853 | | | 457,142 |
aKoninklijke KPN NV | | Netherlands | | 437,100 | | | 3,374,183 |
aNTL Inc. | | United Kingdom | | 224,423 | | | 15,653,504 |
a,bNTL Inc. | | United Kingdom | | 169,343 | | | 11,221,090 |
aSpectrasite Inc. | | United States | | 120,846 | | | 4,199,398 |
aXO Communications Inc. | | United States | | 230,239 | | | 978,516 |
| | | | | | |
|
|
| | | | | | | | 42,801,915 |
| | | | | | |
|
|
Electric Utilities 1.3% | | | | | | | |
aAllegheny Energy Inc. | | United States | | 965,600 | | | 12,321,056 |
E.ON AG | | Germany | | 92,000 | | | 6,026,185 |
a,bPG & E Corp, wts., 9/02/06 | | United States | | 1,520 | | | 37,976 |
aReliant Resources Inc. | | United States | | 695,000 | | | 5,115,200 |
| | | | | | |
|
|
| | | | | | | | 23,500,417 |
| | | | | | |
|
|
Food & Staples Retailing .4% | | | | | | | |
aKroger Co. | | United States | | 290,000 | | | 5,367,900 |
aSafeway Inc. | | United States | | 68,900 | | | 1,509,599 |
| | | | | | |
|
|
| | | | | | | | 6,877,499 |
| | | | | | |
|
|
Food Products 3.3% | | | | | | | |
Cadbury Schweppes PLC | | United Kingdom | | 1,900,794 | | | 13,959,663 |
Groupe Danone | | France | | 131,069 | | | 21,392,947 |
Nestle SA | | Switzerland | | 92,190 | | | 23,033,524 |
| | | | | | |
|
|
| | | | | | | | 58,386,134 |
| | | | | | |
|
|
Health Care Equipment & Supplies .6% | | | | | | | |
Amersham PLC | | United Kingdom | | 134,400 | | | 1,841,772 |
Hillenbrand Industries Inc. | | United States | | 147,400 | | | 9,147,644 |
| | | | | | |
|
|
| | | | | | | | 10,989,416 |
| | | | | | |
|
|
Health Care Providers & Services .8% | | | | | | | |
aAdvancePCS | | United States | | 13,500 | | | 710,910 |
HCA Inc. | | United States | | 120,500 | | | 5,176,680 |
aHealth Net Inc., A | | United States | | 14,765 | | | 482,815 |
a,cKindred Healthcare Inc. | | United States | | 70,034 | | | 3,458,349 |
a,cKindred Healthcare Inc., Jul. 47.50 Calls, 7/11/11 | | United States | | 114 | | | 51,072 |
a,cKindred Healthcare Inc., Jan. 52.00 Calls, 1/01/12 | | United States | | 17 | | | — |
a,cKindred Healthcare Inc., wts., Series A, 4/20/06 | | United States | | 12,897 | | | 299,933 |
a,cKindred Healthcare Inc., wts., Series B, 4/20/06 | | United States | | 32,243 | | | 675,410 |
aLaboratory Corp. of America Holdings | | United States | | 33,800 | | | 1,248,910 |
aMid Atlantic Medical Services Inc. | | United States | | 11,400 | | | 738,720 |
aRotech Healthcare Inc. | | United States | | 41,340 | | | 950,820 |
aWellpoint Health Networks Inc. | | United States | | 7,400 | | | 717,726 |
| | | | | | |
|
|
| | | | | | | | 14,511,345 |
| | | | | | |
|
|
MS-9
FRANKLIN TEMPLETON VARIABLE INSURANCE PRODUCTS TRUST
MUTUAL SHARES SECURITIES FUND
Statement of Investments, December 31, 2003 (cont.)
| | | | | | | |
| | | COUNTRY | | SHARES/
WARRANTS/
CONTRACTS | | VALUE |
|
Common Stocks and Other Equity Interests (cont.) | | | | | | | |
Hotels Restaurants & Leisure .2% | | | | | | | |
Cara Operations Ltd., A | | Canada | | 27,600 | | $ | 151,215 |
aFHC Delaware, Inc. | | United States | | 139,062 | | | 1,094,418 |
aPark Place Entertainment Corp. | | United States | | 160,600 | | | 1,739,298 |
| | | | | | |
|
|
| | | | | | | | 2,984,931 |
| | | | | | |
|
|
Insurance 16.8% | | | | | | | |
aAlleghany Corp. | | United States | | 21,566 | | | 4,798,435 |
aBerkshire Hathaway Inc., A | | United States | | 151 | | | 12,721,750 |
aBerkshire Hathaway Inc., B | | United States | | 26,667 | | | 75,067,605 |
Hartford Financial Services Group Inc. | | United States | | 510,300 | | | 30,123,009 |
John Hancock Financial Services Inc. | | United States | | 56,900 | | | 2,133,750 |
MetLife Inc. | | United States | | 255,700 | | | 8,609,419 |
aMontpelier Re Holdings Ltd. | | Bermuda | | 36,947 | | | 1,355,955 |
Nationwide Financial Services Inc., A | | United States | | 786,500 | | | 26,001,690 |
Old Republic International Corp. | | United States | | 651,000 | | | 16,509,360 |
a,bOlympus Re Holdings Ltd. | | Bermuda | | 16,280 | | | 2,575,008 |
Prudential Financial Inc. | | United States | | 255,900 | | | 10,688,943 |
Travelers Property Casualty Corp., A | | United States | | 1,293,085 | | | 21,697,966 |
| White Mountains Insurance Group Inc. | | United States | | 99,151 | | | 45,604,503 |
bWhite Mountains Insurance Group Inc. | | United States | | 30,898 | | | 13,500,958 |
Willis Group Holdings Ltd. | | United States | | 841,600 | | | 28,673,312 |
| | | | | | |
|
|
| | | | | | | | 300,061,663 |
| | | | | | |
|
|
IT Services .1% | | | | | | | |
Comdisco Contingent Equity Distribution | | United States | | 8,175,255 | | | 30,248 |
aComdisco Holding Co., Inc. | | United States | | 12 | | | 480 |
aConcord EFS Inc. | | United States | | 67,600 | | | 1,003,184 |
| | | | | | |
|
|
| | | | | | | | 1,033,912 |
| | | | | | |
|
|
Media 7.9% | | | | | | | |
Dow Jones & Co. Inc. | | United States | | 211,000 | | | 10,518,350 |
E.W. Scripps Co., A | | United States | | 108,216 | | | 10,187,454 |
aEchoStar Communications Corp., A | | United States | | 574,200 | | | 19,522,800 |
aFox Entertainment Group Inc., A | | United States | | 46,200 | | | 1,346,730 |
Gannett Co. Inc. | | United States | | 23,800 | | | 2,122,008 |
Lagardere SCA | | France | | 74,580 | | | 4,305,659 |
aLiberty Media Corp., A | | United States | | 3,811,090 | | | 45,313,860 |
McGraw-Hill Cos. Inc. | | United States | | 31,700 | | | 2,216,464 |
Meredith Corp. | | United States | | 99,659 | | | 4,864,356 |
aNTL Europe Inc. | | United Kingdom | | 42,220 | | | 422 |
Omnicom Group Inc. | | United States | | 60,600 | | | 5,292,198 |
aSinclair Broadcast Group Inc., A | | United States | | 211,600 | | | 3,157,072 |
aTVMAX Holdings Inc. | | United States | | 7,459 | | | 18,648 |
Washington Post Co., B | | United States | | 41,469 | | | 32,818,567 |
| | | | | | |
|
|
| | | | | | | | 141,684,588 |
| | | | | | |
|
|
Metals & Mining 5.7% | | | | | | | |
Anglo American PLC | | United Kingdom | | 711,090 | | | 15,364,666 |
Anglo American PLC, ADR | | United Kingdom | | 200 | | | 4,424 |
aAshanti Goldfields Co. Ltd., GDR, Reg S | | Ghana | | 48,000 | | | 625,920 |
MS-10
FRANKLIN TEMPLETON VARIABLE INSURANCE PRODUCTS TRUST
MUTUAL SHARES SECURITIES FUND
Statement of Investments, December 31, 2003 (cont.)
| | | | | | | |
| | | COUNTRY | | SHARES/
WARRANTS/
CONTRACTS | | VALUE |
|
Common Stocks and Other Equity Interests (cont.) | | | | | | | |
Metals & Mining (cont.) | | | | | | | |
Barrick Gold Corp. | | Canada | | 437,600 | | $ | 9,937,896 |
Falconbridge Ltd. | | Canada | | 14,500 | | | 351,882 |
aGlamis Gold Ltd. | | Canada | | 124,800 | | | 2,151,708 |
Gold Fields Ltd. | | South Africa | | 177,200 | | | 2,535,221 |
a,bInternational Steel Group | | United States | | 639,453 | | | 21,170,690 |
Newmont Mining Corp. | | United States | | 927,700 | | | 45,095,497 |
Noranda Inc. | | Canada | | 111,600 | | | 1,774,719 |
Placer Dome Inc. | | Canada | | 127,600 | | | 2,287,864 |
aRandgold & Exploration Co. Ltd., ADR | | South Africa | | 8,700 | | | 142,671 |
aWheaton River Minerals Ltd., wts., 5/30/07 | | Canada | | 221,465 | | | 395,886 |
| | | | | | |
|
|
| | | | | | | | 101,839,044 |
| | | | | | |
|
|
Oil & Gas 1.3% | | | | | | | |
BP PLC | | United Kingdom | | 803,000 | | | 6,511,860 |
BP PLC, ADR | | United Kingdom | | 5,100 | | | 251,685 |
Occidental Petroleum Corp. | | United States | | 35,400 | | | 1,495,296 |
aSouthwest Royalties Inc., A | | United States | | 6,820 | | | 204,590 |
Suncor Energy Inc. | | Canada | | 13,300 | | | 334,494 |
Total SA, B | | France | | 76,970 | | | 14,310,517 |
| | | | | | |
|
|
| | | | | | | | 23,108,442 |
| | | | | | |
|
|
Personal Products .3% | | | | | | | |
Beiersdorf AG | | Germany | | 38,889 | | | 4,765,472 |
| | | | | | |
|
|
Pharmaceuticals 2.3% | | | | | | | |
Merck & Co. Inc. | | United States | | 229,300 | | | 10,593,660 |
Takeda Chemical Industries Ltd. | | Japan | | 129,415 | | | 5,132,162 |
Valeant Phamaceuticals International | | United States | | 656,200 | | | 16,503,430 |
Wyeth | | United States | | 222,000 | | | 9,423,900 |
| | | | | | |
|
|
| | | | | | | | 41,653,152 |
| | | | | | |
|
|
Real Estate 1.3% | | | | | | | |
aAlexander’s Inc. | | United States | | 7,800 | | | 972,348 |
American Financial Realty Trust | | United States | | 45,800 | | | 780,890 |
aCanary Wharf Group PLC | | United Kingdom | | 1,535,898 | | | 7,361,786 |
aFieldstone Investment Corp. | | United States | | 449,300 | | | 7,525,775 |
a,bSecurity Capital European Realty | | Luxembourg | | 8,958 | | | 66,737 |
St. Joe Co. | | United States | | 112,200 | | | 4,183,938 |
Ventas Inc. | | United States | | 97,800 | | | 2,151,600 |
| | | | | | |
|
|
| | | | | | | | 23,043,074 |
| | | | | | |
|
|
Road & Rail 2.0% | | | | | | | |
Burlington Northern Santa Fe Corp. | | United States | | 232,000 | | | 7,505,200 |
Florida East Coast Industries Inc., A | | United States | | 451,813 | | | 14,955,010 |
Norfolk Southern Corp. | | United States | | 524,600 | | | 12,406,790 |
| | | | | | |
|
|
| | | | | | | | 34,867,000 |
| | | | | | |
|
|
Specialty Retail | | | | | | | |
New Look Group | | United Kingdom | | 70,000 | | | 389,717 |
| | | | | | |
|
|
MS-11
FRANKLIN TEMPLETON VARIABLE INSURANCE PRODUCTS TRUST
MUTUAL SHARES SECURITIES FUND
Statement of Investments, December 31, 2003 (cont.)
| | | | | | | | | |
| | | COUNTRY | | SHARES/
WARRANTS/
CONTRACTS | | | VALUE |
|
Common Stocks and Other Equity Interests (cont.) | | | | | | | | | |
Thrifts & Mortgage Finance 2.7% | | | | | | | | | |
Freddie Mac | | United States | | | 315,000 | | | $ | 18,370,800 |
Greenpoint Financial Corp. | | United States | | | 47,441 | | | | 1,675,616 |
Hudson City Bancorp Inc. | | United States | | | 225,600 | | | | 8,613,408 |
Sovereign Bancorp Inc. | | United States | | | 816,600 | | | | 19,394,250 |
| | | | | | | | |
|
|
| | | | | | | | | | 48,054,074 |
| | | | | | | | |
|
|
Tobacco 7.0% | | | | | | | | | |
Altadis SA | | Spain | | | 1,066,115 | | | | 30,256,796 |
Altria Group Inc. | | United States | | | 204,870 | | | | 11,149,025 |
British American Tobacco PLC | | United Kingdom | | | 2,514,956 | | | | 34,666,693 |
British American Tobacco PLC, ADR | | United Kingdom | | | 4,300 | | | | 118,981 |
Imperial Tobacco Group PLC | | United Kingdom | | | 1,013,947 | | | | 19,966,375 |
R.J. Reynolds Tobacco Holdings Inc. | | United States | | | 491,200 | | | | 28,563,280 |
| | | | | | | | |
|
|
| | | | | | | | | | 124,721,150 |
| | | | | | | | |
|
|
Transportation Infrastructure .1% | | | | | | | | | |
aLaidlaw International Inc. | | United States | | | 144,616 | | | | 2,000,039 |
| | | | | | | | |
|
|
Total Common Stocks and Other Equity Interests (Cost $929,960,727) | | | | | | | | | 1,184,988,408 |
| | | | | | | | |
|
|
Preferred Stocks .3% | | | | | | | | | |
Electric Utilities | | | | | | | | | |
aMontana Power Co., 8.45% pfd. | | United States | | | 17,650 | | | | 211,800 |
| | | | | | | | |
|
|
Food Products .1% | | | | | | | | | |
Unilever NV, pfd. | | Netherlands | | | 261,750 | | | | 1,878,605 |
| | | | | | | | |
|
|
Media .2% | | | | | | | | | |
News Corp. Ltd., ADR, pfd. | | Australia | | | 78,700 | | | | 2,380,675 |
NTL Europe Inc., 10.00%, A, pfd. | | United Kingdom | | | 18,774 | | | | 154,416 |
| | | | | | | | |
|
|
| | | | | | | | | | 2,535,091 |
| | | | | | | | |
|
|
Total Preferred Stocks (Cost $4,122,095) | | | | | | | | | 4,625,496 |
| | | | | | | | |
|
|
| | | | �� | PRINCIPAL
AMOUNTf
| | | |
Corporate Bonds & Notes 2.4% | | | | | | | | | |
Calpine Constructor Finance,
8.50%, 8/26/11 | | United States | | $ | 1,693,000 | | | | 1,760,720 |
First Priority Term Loan, 8/26/09 | | United States | | | 1,392,000 | | | | 1,461,600 |
Calpine Corp., 144A, 9.875%, 12/01/11 | | United States | | | 3,896,000 | | | | 4,022,620 |
Charter Communications Operating LLC, Bank Claim | | United States | | | 2,062,200 | | | | 1,990,023 |
DecisionOne Corp., Term Loan | | United States | | | 798,394 | | | | 558,876 |
Eurotunnel PLC, | | | | | | | | | |
12/31/18, Tier 2 | | United Kingdom | | | 385,556 | GBP | | | 503,851 |
12/31/25, Tier 3 | | United Kingdom | | | 531,240 | GBP | | | 523,052 |
Participating Loan Note, 4/30/40 | | United Kingdom | | | 58,000 | GBP | | | 22,323 |
Stabilization Advance S8, Tier 2 | | United Kingdom | | | 147,693 | GBP | | | 50,235 |
MS-12
FRANKLIN TEMPLETON VARIABLE INSURANCE PRODUCTS TRUST
MUTUAL SHARES SECURITIES FUND
Statement of Investments, December 31, 2003 (cont.)
| | | | | | | | |
| | | COUNTRY | | PRINCIPAL
AMOUNTf | | | VALUE |
|
Corporate Bonds & Notes (cont.) | | | | | | | | |
Eurotunnel SA | | | | | | | | |
5.28%, 12/31/18, Tier 2 (Pibor) | | France | | 45,056 | EUR | | $ | 41,487 |
5.28%, 12/31/25, Tier 3 (Pibor) | | France | | 84,795 | EUR | | | 58,826 |
12/31/18, Tier 2 (Libor) | | France | | 60,952 | EUR | | | 56,124 |
12/31/25, Tier 3 (Libor) | | France | | 619,054 | EUR | | | 429,465 |
Stabilization Advance S6, Tier 1 (Pibor) | | France | | 22,154 | EUR | | | 5,309 |
Stabilization Advance S6, Tier 2 (Pibor) | | France | | 43,502 | EUR | | | 10,425 |
Stabilization Advance S7, Tier 1 (Pibor) | | France | | 55,949 | EUR | | | 13,408 |
Healthsouth Corp., | | | | | | | | |
8.50%, 2/01/08 | | United States | | 1,651,000 | | | | 1,593,215 |
7.00%, 6/15/08 | | United States | | 890,000 | | | | 834,375 |
8.375%, 10/01/11 | | United States | | 520,000 | | | | 494,000 |
7.625%, 6/01/12 | | United States | | 4,259,000 | | | | 4,003,460 |
cvt., 3.25%, 4/01/03 | | United States | | 3,219,000 | | | | 3,122,430 |
Marconi Corp., 10.00%, 10/31/08 | | United Kingdom | | 407,903 | | | | 452,772 |
Marconi PLC, 8.00%, 4/30/08 | | United Kingdom | | 2,146,476 | | | | 2,103,546 |
Mirant Mid-Atlantic LLC, | | | | | | | | |
8.625%, 6/30/12 | | United States | | 973,345 | | | | 978,820 |
9.125%, 6/30/17 | | United States | | 483,045 | | | | 483,347 |
10.06%, 12/30/28 | | United States | | 638,163 | | | | 644,943 |
bMP Finance Ltd., 5.00%, 8/28/07 | | Japan | | 13,716,000 | | | | 13,990,320 |
Providian Financial Corp, cvt., zero cpn., 2/15/21 | | United States | | 2,562,000 | | | | 1,223,355 |
Teco Panda, | | | | | | | | |
Bank Claim #2 | | United States | | 2,655,600 | | | | 1,898,754 |
Debt Service Reserve L/C Loan | | United States | | 152,300 | | | | 108,895 |
Project L/C Loan Facility | | United States | | 380,800 | | | | 272,272 |
TVMAX Holdings Inc., PIK, 14.00%, 2/01/06 | | United States | | 34,406 | | | | 34,406 |
| | | | | | | |
|
|
Total Corporate Bonds & Notes (Cost $38,879,168) | | | | | | | | 43,747,254 |
| | | | | | | |
|
|
Bonds & Notes in Reorganization 7.3% | | | | | | | | |
dAdelphia Communications Corp., | | | | | | | | |
9.25%, 10/01/02 | | United States | | 3,746,000 | | | | 3,483,780 |
8.125%, 7/15/03 | | United States | | 1,895,000 | | | | 1,762,350 |
7.50%, 1/15/04 | | United States | | 350,000 | | | | 323,750 |
9.50%, 2/15/04 | | United States | | 1,000,000 | | | | 935,000 |
10.50%, 7/15/04 | | United States | | 5,577,000 | | | | 5,270,265 |
10.25%, 11/01/06 | | United States | | 799,000 | | | | 747,065 |
8.375%, 2/01/08 | | United States | | 1,123,000 | | | | 1,052,812 |
7.75%, 1/15/09 | | United States | | 991,000 | | | | 926,585 |
7.875%, 5/01/09 | | United States | | 3,228,000 | | | | 2,969,760 |
9.375%, 11/15/09 | | United States | | 12,310,000 | | | | 11,694,500 |
10.875%, 10/01/10 | | United States | | 2,000,000 | | | | 1,880,000 |
10.25%, 6/15/11 | | United States | | 1,220,000 | | | | 1,159,000 |
dAES Drax Holdings Ltd., | | | | | | | | |
10.41%, 12/31/20 | | Cayman Islands | | 18,057,000 | | | | 15,890,160 |
9.07%, 12/31/25 | | Cayman Islands | | 1,725,000 | GBP | | | 2,671,139 |
dAiken Cnty SC Indl Rev Ref Beloit, 6.00%, 12/01/11 | | United States | | 45,000 | | | | 225 |
dAir Canada Inc., | | | | | | | | |
6.75%, 2/02/04 | | Canada | | 343,000 | CAD | | | 96,881 |
9.00%, 6/01/06 | | Canada | | 614,000 | CAD | | | 175,802 |
10.00%, 6/01/06 | | Canada | | 1,583,000 | EUR | | | 848,606 |
7.25%, 10/01/07 | | Canada | | 168,000 | CAD | | | 45,827 |
10.25%, 3/15/11 | | Canada | | 11,639,000 | | | | 4,742,892 |
Bank Claim | | Canada | | 2,887,200 | CAD | | | 804,327 |
Bank Claim | | Canada | | 69,759,000 | JPY | | | 247,349 |
Term Loan | | Canada | | 2,073,000 | | | | 767,010 |
zero cpn., 7/31/05 | | Canada | | 818,200 | | | | 315,007 |
MS-13
FRANKLIN TEMPLETON VARIABLE INSURANCE PRODUCTS TRUST
MUTUAL SHARES SECURITIES FUND
Statement of Investments, December 31, 2003 (cont.)
| | | | | | | | | | | |
| | | | | COUNTRY | | PRINCIPAL
AMOUNTf | | | VALUE |
| | |
|
| | | Bonds & Notes in Reorganization (cont.) | | | | | | | | | |
| d | | Century Communications Corp., | | | | | | | | | |
| | | 9.50%, 3/01/05 | | United States | | $ | 75,000 | | | $ | 72,750 |
| | | 8.875%, 1/15/07 | | United States | | | 55,000 | | | | 53,625 |
| | | 8.375%, 12/15/07 | | United States | | | 90,000 | | | | 87,975 |
| | | zero cpn., 3/15/03 | | United States | | | 1,010,000 | | | | 898,900 |
| d | | Dow Corning Corp., | | | | | | | | | |
| | | 9.375%, 2/01/08 | | United States | | | 550,000 | | | | 1,199,000 |
| | | Bank Debt #1 | | United States | | | 100,000 | | | | 180,000 |
| d | | Harnischfeger Industries Inc., | | | | | | | | | |
| | | 8.90%, 3/01/22 | | United States | | | 410,000 | | | | 2,296 |
| | | 8.70%, 6/15/22 | | United States | | | 360,000 | | | | 2,052 |
| | | 7.25%, 12/15/25 | | United States | | | 519,000 | | | | 2,958 |
| | | 6.875%, 2/15/27 | | United States | | | 463,000 | | | | 2,593 |
| | | Stipulated Bank Claim | | United States | | | 603,475 | | | | 3,319 |
| d | | Metromedia Fiber Network Inc., | | | | | | | | | |
| | | 14.00%, 3/15/07 | | United States | | | 2,897,000 | | | | 1,535,410 |
| | | 10.00%, 11/15/08 | | United States | | | 2,297,000 | | | | 157,919 |
| | | senior note, 10.00%, 12/15/09 | | United States | | | 2,418,000 | | | | 172,283 |
| | | senior note, 10.00%, 12/15/09 | | United States | | | 1,085,000 | EUR | | | 102,643 |
d | | Mirant Corp., | | | | | | | | | |
| | | Tranche C Revolver | | United States | | | 1,904,055 | | | | 1,180,514 |
| | | 4 Year Revolver, 7/17/05 | | United States | | | 1,564,014 | | | | 1,219,931 |
| | | 364 Day Revolver | | United States | | | 2,716,500 | | | | 1,602,735 |
| d | | Northwestern Corp., | | | | | | | | | |
| | | 8.75%, 3/15/12 | | United States | | | 2,193,000 | | | | 1,990,148 |
| | | 6.95%, 11/15/28 | | United States | | | 1,155,000 | | | | 1,035,169 |
| d | | NRG Energy Inc., | | | | | | | | | |
| | | 7.625%, 2/01/06 | | United States | | | 1,425,000 | | | | 805,125 |
| | | 6.75%, 7/15/06 | | United States | | | 2,600,000 | | | | 1,469,000 |
| | | 7.50%, 6/15/07 | | United States | | | 1,405,000 | | | | 800,850 |
| | | 7.50%, 6/01/09 | | United States | | | 1,405,000 | | | | 800,850 |
| | | 8.25%, 9/15/10 | | United States | | | 8,370,000 | | | | 4,896,450 |
| | | 7.75%, 4/01/11 | | United States | | | 200,000 | | | | 115,000 |
| | | 8.00%, 11/01/13 | | United States | | | 2,015,000 | | | | 1,158,625 |
| | | 8.70%, 3/15/20 | | United States | | | 855,000 | | | | 495,900 |
| | | 8.625%, 4/01/31 | | United States | | | 1,315,000 | | | | 769,275 |
| | | Bank Claim | | United States | | | 15,000,000 | | | | 7,500,000 |
| | | Revolver | | United States | | | 6,418,893 | | | | 3,979,714 |
| d | | Owens Corning, Revolver | | United States | | | 8,719,580 | | | | 6,539,685 |
| d | | Parmalat Netherlands BV, 0.875%, 06/30/21 | | Italy | | | 1,250,000 | EUR | | | 395,670 |
| d | | PG & E Corp., | | | | | | | | | |
| | | 9.625%, 11/01/05 | | United States | | | 2,269,000 | | | | 2,314,380 |
| | | Commercial Paper, 1/18/01 | | United States | | | 92,000 | | | | 92,460 |
| | | Commercial Paper, 1/30/01 | | United States | | | 45,000 | | | | 45,225 |
| | | Commercial Paper, 2/16/01 | | United States | | | 136,000 | | | | 136,680 |
| | | FRN, 144A, 8.333% 10/31/01 | | United States | | | 610,000 | | | | 622,200 |
| | | MTN, 5.94%, 10/07/03 | | United States | | | 115,000 | | | | 115,575 |
| d | | Port Seattle Wash Rev Ref-Beloit Proj., 6.00%, 12/01/17 | | United States | | | 20,000 | | | | 100 |
MS-14
FRANKLIN TEMPLETON VARIABLE INSURANCE PRODUCTS TRUST
MUTUAL SHARES SECURITIES FUND
Statement of Investments, December 31, 2003 (cont.)
| | | | | | | | | | |
| | | COUNTRY | | PRINCIPAL
AMOUNTf | | | VALUE | |
| |
Bonds & Notes in Reorganization (cont.) | | | | | | | | | | |
dSafety Kleen Corp., 9.25%, 5/15/09 | | United States | | $ | 63,000 | | | $ | 3,150 | |
dSafety Kleen Services, 9.25%, 6/01/08 | | United States | | | 5,000 | | | | 25 | |
dTelewest Communications PLC, | | | | | | | | | | |
11.00%, 10/01/07 | | United Kingdom | | | 1,783,000 | | | | 1,167,865 | |
11.25%, 11/01/08 | | United Kingdom | | | 230,000 | | | | 148,925 | |
9.875%, 2/01/10 | | United Kingdom | | | 610,000 | GBP | | | 644,278 | |
Bank Claim | | United Kingdom | | | 6,542,600 | GBP | | | 5,563,336 | |
cvt., 5.25%, 2/19/07 | | United Kingdom | | | 1,810,000 | GBP | | | 1,717,298 | |
senior disc. note, zero cpn., 4/15/09 | | United Kingdom | | | 675,000 | | | | 354,375 | |
senior disc. note, zero cpn., 2/01/10 | | United Kingdom | | | 485,000 | | | | 240,075 | |
zero cpn., 4/15/04 | | United Kingdom | | | 1,916,000 | GBP | | | 1,714,971 | |
dTelewest Finance Ltd., cvt., 6.00%, 7/07/05 | | United Kingdom | | | 1,475,000 | | | | 1,563,500 | |
dWorldCom Inc., | | | | | | | | | | |
7.875%, 5/15/03 | | United States | | | 1,910,000 | | | | 644,625 | |
6.50%, 5/15/04 | | United States | | | 11,000,000 | | | | 3,712,500 | |
6.40%, 8/15/05 | | United States | | | 2,827,000 | | | | 954,113 | |
7.375%, 1/15/06 | | United States | | | 620,000 | | | | 209,250 | |
8.00%, 5/15/06 | | United States | | | 620,000 | | | | 209,250 | |
7.75%, 4/01/07 | | United States | | | 1,430,000 | | | | 482,625 | |
8.25%, 5/15/10 | | United States | | | 1,745,000 | | | | 588,938 | |
7.375%, 1/15/11 | | United States | | | 3,819,000 | | | | 1,288,913 | |
7.50%, 5/15/11 | | United States | | | 4,470,000 | | | | 1,508,625 | |
7.75%, 4/01/27 | | United States | | | 340,000 | | | | 114,750 | |
6.95%, 8/15/28 | | United States | | | 150,000 | | | | 50,625 | |
8.25%, 5/15/31 | | United States | | | 10,264,000 | | | | 3,464,100 | |
| | | | | | | | |
|
|
|
Total Bonds & Notes in Reorganization (Cost $106,265,449) | | | | | | | | | 129,711,188 | |
| | | | | | | | |
|
|
|
| | | | | SHARES/
PRINCIPAL AMOUNTf
| | | | |
Companies in Liquidation .1% | | | | | | | | | | |
aBrunos Inc., Liquidating Unit | | United States | | | 5,044 | | | | 11,097 | |
aGuangdong International Trust & Investment Corp., 144A, 8.75%, 10/24/16 | | China | | | 630,000 | | | | 39,375 | |
aPeregrine Investments Holdings Ltd., 6.70%, 1/15/98 | | Hong Kong | | | 5,000,000 | JPY | | | 3,032 | |
aPIV Investment Finance (Cayman) Ltd. | | Hong Kong | | | 12,200,000 | | | | 1,464,000 | |
| | | | | | | | |
|
|
|
Total Companies in Liquidation (Cost $36,337) | | | | | | | | | 1,517,504 | |
| | | | | | | | |
|
|
|
| | | | | PRINCIPAL
AMOUNT
| | | | |
U.S. Government and Agency Securities 24.9% | | | | | | | | | | |
Federal National Mortgage Association, 1.010% to 1.286%, with maturities to 7/23/04 | | United States | | $ | 108,813,000 | | | | 108,522,229 | |
eFederal Home Loan Bank, 1.022% to 2.260%, with maturities to 1/26/07 | | United States | | | 273,371,000 | | | | 272,313,322 | |
eFederal Home Loan Mortgage Corp, 1.356% to 2.500%, with maturities to 5/19/06 | | United States | | | 45,000,000 | | | | 44,935,941 | |
eU.S. Treasury Bills, 0.985% to 1.035%, with maturities to 5/06/04 | | United States | | | 18,000,000 | | | | 17,970,793 | |
| | | | | | | | |
|
|
|
Total U.S. Government and Agency Securities (Cost $443,585,627) | | | | | | | | | 443,742,285 | |
| | | | | | | | |
|
|
|
Total Investments (Cost $1,522,849,403) 101.4% | | | | | | | | | 1,808,332,135 | |
| | | | | | | | |
|
|
|
| | | |
Options Written | | | | | | | | | (2,288 | ) |
Securities Sold Short (.7)% | | | | | | | | | (13,332,394 | ) |
Net Equity in Forward Contracts (.9)% | | | | | | | | | (15,634,205 | ) |
Other Assets, less Liabilities .2% | | | | | | | | | 2,767,518 | |
| | | | | | | | |
|
|
|
Net Assets 100.0% | | | | | | | | $ | 1,782,130,766 | |
| | | | | | | | |
|
|
|
MS-15
FRANKLIN TEMPLETON VARIABLE INSURANCE PRODUCTS TRUST
MUTUAL SHARES SECURITIES FUND
Statement of Investments, December 31, 2003 (cont.)
| | | | | | | |
Option Written ISSUER | | COUNTRY | | CONTRACTS | | VALUE |
|
Diversified Telecommunication Services | | | | | | | |
XO Communications Inc., Jun. 4.25 Calls, 6/21/04 | | United States | | 230,239 | | $ | — |
| | | | | | |
|
|
Food & Staples Retailing | | | | | | | |
Safeway PLC, Jan. 2.70 Puts, 1/16/04 | | United Kingdom | | 710 | | | 2,288 |
| | | | | | |
|
|
Total Options Written (Premiums Received $64,483) | | | | | | $ | 2,288 |
| | | | | | |
|
|
| | | |
Securities Sold Short ISSUER | | COUNTRY | | SHARES | | VALUE |
|
Capital Markets | | | | | | | |
gLehman Brothers Holdings Inc. | | United States | | 3,179 | | $ | 245,483 |
| | | | | | |
|
|
| | | |
Commercial Banks .1% | | | | | | | |
gBank of America Corp. | | United States | | 26,200 | | | 2,107,266 |
| | | | | | |
|
|
Food Products .2% | | | | | | | |
gKraft Foods Inc., A | | United States | | 130,700 | | | 4,211,154 |
| | | | | | |
|
|
Health Care Providers & Services .1% | | | | | | | |
gAnthem Inc. | | United States | | 7,400 | | | 555,000 |
gCaremark RX Inc. | | United States | | 29,200 | | | 739,636 |
gUnited Health Group Inc. | | United States | | 9,300 | | | 541,074 |
| | | | | | |
|
|
| | | | | | | | 1,835,710 |
| | | | | | |
|
|
Insurance .1% | | | | | | | |
gManulife Financial Corp. | | Canada | | 67,400 | | | 2,177,020 |
| | | | | | |
|
|
Internet Software & Services | | | | | | | |
gYahoo! Inc. | | United States | | 6,902 | | | 311,763 |
| | | | | | |
|
|
IT Services .1% | | | | | | | |
gFirst Data Corp. | | United States | | 18,600 | | | 764,274 |
| | | | | | |
|
|
Media | | | | | | | |
gNews Corp. Ltd., ADR | | Australia | | 17,600 | | | 635,360 |
| | | | | | |
|
|
Metals & Mining .1% | | | | | | | |
gAlcan Inc. | | Canada | | 1,637 | | | 76,857 |
gAngloGold Ltd., ADR | | South Africa | | 14,000 | | | 653,800 |
gRandgold Resources Ltd., ADR | | United Kingdom | | 7,000 | | | 191,100 |
| | | | | | |
|
|
| | | | | | | | 921,757 |
| | | | | | |
|
|
Pharmaceuticals | | | | | | | |
gTeva Pharmaceutical Industries Ltd., ADR | | Israel | | 2,162 | | | 122,607 |
| | | | | | |
|
|
Total Securities Sold Short (Proceeds $13,432,906) | | | | | | $ | 13,332,394 |
| | | | | | |
|
|
| | | | | | | | | | | | | |
| | | | |
Synthetic Equity Swaps (ses) ISSUER | | COUNTRY | | SHARES | | | VALUE AT
12/31/03 | | | UNREALIZED
GAIN/(LOSS) | |
| |
Health Care Equipment & Supplies | | | | | | | | | | | | | |
hSmith & Nephew PLC, ses., 3.752 GBP | | United Kingdom | | (267 | ) | | $ | (2,243 | ) | | $ | (453 | ) |
hSmith & Nephew PLC, ses., 3.776 GBP | | United Kingdom | | (5,400 | ) | | | (45,362 | ) | | | (8,926 | ) |
| | | | | | | |
|
|
|
| | | | | | | | | (47,605 | ) | | | (9,379 | ) |
| | | | | | | |
|
|
|
Insurance | | | | | | | | | | | | | |
hAxa SA, ses., 15.850 EUR | | France | | 6,236 | | | | 133,482 | | | | 8,564 | |
hAxa SA, ses., 15.870 EUR | | France | | 1,500 | | | | 32,108 | | | | 2,022 | |
hAxa SA, ses., 16.030 EUR | | France | | 11,033 | | | | 236,163 | | | | 12,641 | |
hAxa SA, ses., 16.700 EUR | | France | | (6,236 | ) | | | (133,482 | ) | | | (2,382 | ) |
hAxa SA, ses., 16.770 EUR | | France | | (1,500 | ) | | | (32,108 | ) | | | (441 | ) |
hAxa SA, ses., 17.000 EUR | | France | | (11,033 | ) | | | (236,163 | ) | | | 371 | |
| | | | | | | |
|
|
|
| | | | | | | | | 0 | | | | 20,775 | |
| | | | | | | |
|
|
|
MS-16
FRANKLIN TEMPLETON VARIABLE INSURANCE PRODUCTS TRUST
MUTUAL SHARES SECURITIES FUND
Statement of Investments, December 31, 2003 (cont.)
| | | | | | | | | | | | | |
| | | | |
Synthetic Equity Swaps (ses) (cont.) ISSUER | | COUNTRY | | SHARES | | | VALUE AT
12/31/03 | | | UNREALIZED
GAIN (LOSS) | |
| |
Real Estate | | | | | | | | | | | | | |
hChelsfield PLC, ses., 3.095 GBP | | United Kingdom | | 1,900 | | | $ | 10,450 | | | $ | (92 | ) |
hChelsfield PLC, ses., 3.107 GBP | | United Kingdom | | 5,900 | | | | 32,452 | | | | (417 | ) |
hChelsfield PLC, ses., 3.112 GBP | | United Kingdom | | 4,271 | | | | 23,492 | | | | (365 | ) |
hChelsfield PLC, ses., 3.154 GBP | | United Kingdom | | 59,100 | | | | 325,065 | | | | (9,087 | ) |
hChelsfield PLC, ses., 3.160 GBP | | United Kingdom | | 20,100 | | | | 110,555 | | | | (3,309 | ) |
hChelsfield PLC, ses., 3.165 GBP | | United Kingdom | | 8,900 | | | | 48,952 | | | | (1,544 | ) |
hChelsfield PLC, ses., 3.166 GBP | | United Kingdom | | 29,500 | | | | 162,258 | | | | (5,170 | ) |
| | | | | | | |
|
|
|
| | | | | | | | | 713,224 | | | | (19,984 | ) |
| | | | | | | |
|
|
|
Textiles, Apparel & Luxury Goods | | | | | | | | | | | | | |
hChristian Dior SA, ses., 46.766 EUR | | France | | 1,468 | | | | 88,935 | | | | 2,180 | |
hChristian Dior SA, ses., 47.220 EUR | | France | | 1,199 | | | | 72,639 | | | | 1,085 | |
hChristian Dior SA, ses., 47.384 EUR | | France | | 2,979 | | | | 180,476 | | | | 2,180 | |
hChristian Dior SA, ses., 47.614 EUR | | France | | 2,979 | | | | 180,476 | | | | 1,230 | |
hChristian Dior SA, ses., 47.790 EUR | | France | | 1,445 | | | | 87,542 | | | | 260 | |
hChristian Dior SA, ses., 48.208 EUR | | France | | 2,916 | | | | 176,659 | | | | (985 | ) |
hChristian Dior SA, ses., 48.550 EUR | | France | | 1,824 | | | | 110,503 | | | | (1,415 | ) |
hChristian Dior SA, ses., 48.586 EUR | | France | | 3,003 | | | | 181,930 | | | | (2,442 | ) |
hChristian Dior SA, ses., 48.790 EUR | | France | | 1,215 | | | | 73,608 | | | | (1,304 | ) |
hChristian Dior SA, ses., 49.000 EUR | | France | | 80 | | | | 4,847 | | | | (107 | ) |
hChristian Dior SA, ses., 49.027 EUR | | France | | 444 | | | | 26,899 | | | | (609 | ) |
hLVMH Moet Hennessy Louis Vuitton, ses., 56.520 EUR | | France | | (1,199 | ) | | | (87,263 | ) | | | (1,952 | ) |
hLVMH Moet Hennessy Louis Vuitton, ses., 57.050 EUR | | France | | (1,445 | ) | | | (105,167 | ) | | | (1,388 | ) |
hLVMH Moet Hennessy Louis Vuitton, ses., 58.672 EUR | | France | | (2,979 | ) | | | (216,812 | ) | | | 3,344 | |
hLVMH Moet Hennessy Louis Vuitton, ses., 58.860 EUR | | France | | (1,468 | ) | | | (106,841 | ) | | | 1,949 | |
hLVMH Moet Hennessy Louis Vuitton, ses., 58.900 EUR | | France | | (2,979 | ) | | | (216,812 | ) | | | 4,097 | |
hLVMH Moet Hennessy Louis Vuitton, ses., 59.841 EUR | | France | | (2,916 | ) | | | (212,227 | ) | | | 7,466 | |
hLVMH Moet Hennessy Louis Vuitton, ses., 60.149 EUR | | France | | (1,824 | ) | | | (132,751 | ) | | | 5,375 | |
hLVMH Moet Hennessy Louis Vuitton, ses., 60.300 EUR | | France | | (1,215 | ) | | | (88,428 | ) | | | 3,827 | |
hLVMH Moet Hennessy Louis Vuitton, ses., 60.421 EUR | | France | | (3,003 | ) | | | (218,558 | ) | | | 9,889 | |
hLVMH Moet Hennessy Louis Vuitton, ses., 60.950 EUR | | France | | (444 | ) | | | (32,314 | ) | | | 1,758 | |
hLVMH Moet Hennessy Louis Vuitton, ses., 60.950 EUR | | France | | (80 | ) | | | (5,822 | ) | | | 317 | |
| | | | | | | |
|
|
|
| | | | | | | | | (238,481 | ) | | | 34,755 | |
| | | | | | | |
|
|
|
Total Synthetic Equity Swaps | | | | | | | $ | 427,498 | | | $ | 26,167 | |
| | | | | | | |
|
|
|
| | |
Currency Abbreviations: |
| CAD - Canadian Dollar |
| EUR - Euro |
| GBP - British Pound |
| JPY - Japanese Yen |
| b | See Note 9 regarding restricted securities. |
| c | See Note 10 regarding other considerations. |
| d | See Note 8 regarding defaulted securities. |
| e | See Note 1(g) regarding securities segregated with broker for securities sold short. |
| f | Principal amount is stated in U.S. dollar unless otherwise indicated. |
| g | See Note 1(g) regarding securities sold short. |
| h | See Note 1(e) regarding synthetic equity swaps. |
MS-17
See notes to financial statements.
FRANKLIN TEMPLETON VARIABLE INSURANCE PRODUCTS TRUST
MUTUAL SHARES SECURITIES FUND
Financial Statements
Statement of Assets and Liabilities
December 31, 2003
| | | | |
Assets: | | | | |
Investments in securities: | | | | |
Cost | | $ | 1,522,849,403 | |
| | |
|
|
|
Value - (includes securities segregated with broker for securities sold short in the amount of $18,429,216) | | | 1,808,332,135 | |
Cash | | | 434,304 | |
Foreign currency, at value (cost $610,219) | | | 972,908 | |
Receivables: | | | | |
Investment securities sold | | | 2,557,543 | |
Capital shares sold | | | 1,642,134 | |
Dividends and interest | | | 2,318,539 | |
Unrealized gain on forward exchange contracts (Note 7) | | | 1,047,484 | |
Deposits with broker for securities sold short | | | 15,303,411 | |
Due from broker - Variation margin (Note 1e) | | | 33,110 | |
| | |
|
|
|
Total assets | | | 1,832,641,568 | |
| | |
|
|
|
Liabilities: | | | | |
Payables: | | | | |
Investment securities purchased | | | 18,483,390 | |
Capital shares redeemed | | | 136,366 | |
Affiliates | | | 1,592,325 | |
Options written, at value (premiums received $64,483) | | | 2,288 | |
Securities sold short, at value (proceeds $13,432,906 ) | | | 13,332,394 | |
Unrealized loss on forward exchange contracts (Note 7) | | | 16,681,689 | |
Other liabilities | | | 282,350 | |
| | |
|
|
|
Total liabilities | | | 50,510,802 | |
| | |
|
|
|
Net assets, at value | | $ | 1,782,130,766 | |
| | |
|
|
|
Net assets consist of: | | | | |
Undistributed net investment income (loss) | | $ | 14,428,647 | |
Net unrealized appreciation (depreciation) | | | 270,423,453 | |
Accumulated net realized gain (loss) | | | (33,451,176 | ) |
Capital shares | | | 1,530,729,842 | |
| | |
|
|
|
Net assets, at value | | $ | 1,782,130,766 | |
| | |
|
|
|
Class 1: | | | | |
Net asset value and maximum offering price per share ($312,386,153 ÷ 20,820,981 shares outstanding) | | $ | 15.00 | |
| | |
|
|
|
Class 2: | | | | |
Net asset value and maximum offering price per share ($1,469,744,613 ÷ 98,647,778 shares outstanding) | | $ | 14.90 | |
| | |
|
|
|
See notes to financial statements.
MS-18
FRANKLIN TEMPLETON VARIABLE INSURANCE PRODUCTS TRUST
MUTUAL SHARES SECURITIES FUND
Financial Statements (continued)
Statement of Operations
for the year ended December 31, 2003
| | | | |
Investment income: | | | | |
(net of foreign taxes of $650,979) | | | | |
Dividends | | $ | 12,661,881 | |
Interest | | | 13,259,968 | |
| | |
|
|
|
Total investment income | | | 25,921,849 | |
| | |
|
|
|
Expenses: | | | | |
Management fees (Note 3) | | | 7,279,926 | |
Administrative fees (Note 3) | | | 1,461,840 | |
Distribution fees - Class 2 (Note 3) | | | 2,329,085 | |
Custodian fees | | | 127,200 | |
Reports to shareholders | | | 320,300 | |
Professional fees | | | 41,661 | |
Trustees’ fees and expenses | | | 11,000 | |
Dividends on securities sold short | | | 479,014 | |
Other | | | 30,800 | |
| | |
|
|
|
Total expenses | | | 12,080,826 | |
| | |
|
|
|
Net investment income | | | 13,841,023 | |
| | |
|
|
|
Realized and unrealized gains (losses): | | | | |
Net realized gain (loss) from: | | | | |
Investments | | | 34,162,369 | |
Written Options (Note 1f) | | | 179,735 | |
Foreign currency transactions | | | (23,865,744 | ) |
Securities sold short (Note 1g) | | | (1,938,996 | ) |
| | |
|
|
|
Net realized gain (loss) | | | 8,537,364 | |
Net unrealized appreciation (depreciation) on: | | | | |
Investments | | | 288,073,262 | |
Translation of assets and liabilities denominated in foreign currencies | | | (9,394,540 | ) |
| | |
|
|
|
Net unrealized appreciation (depreciation) | | | 278,678,722 | |
| | |
|
|
|
Net realized and unrealized gain (loss) | | | 287,216,086 | |
| | |
|
|
|
Net increase (decrease) in net assets resulting from operations | | $ | 301,057,109 | |
| | |
|
|
|
See notes to financial statements.
MS-19
FRANKLIN TEMPLETON VARIABLE INSURANCE PRODUCTS TRUST
MUTUAL SHARES SECURITIES FUND
Financial Statements (continued)
Statements of Changes in Net Assets
for the years ended December 31, 2003 and 2002
| | | | | | | | |
| | | 2003 | | | 2002 | |
| | |
|
|
|
Increase (decrease) in net assets: | | | | | | | | |
Operations: | | | | | | | | |
Net investment income | | $ | 13,841,023 | | | $ | 11,074,067 | |
Net realized gain (loss) from investments, written options, securities sold short and foreign currency transactions | | | 8,537,364 | | | | (37,295,738 | ) |
Net unrealized appreciation (depreciation) on investments and translation of assets and liabilities denominated in foreign currencies | | | 278,678,722 | | | | (74,747,568 | ) |
| | |
|
|
|
Net increase (decrease) in net assets resulting from operations | | | 301,057,109 | | | | (100,969,239 | ) |
Distributions to shareholders from: | | | | | | | | |
Net investment income: | | | | | | | | |
Class 1 | | | (3,290,885 | ) | | | (3,339,385 | ) |
Class 2 | | | (9,026,103 | ) | | | (3,698,558 | ) |
Net realized gains: | | | | | | | | |
Class 1 | | | — | | | | (7,639,415 | ) |
Class 2 | | | — | | | | (9,170,486 | ) |
| | |
|
|
|
Total distributions to shareholders | | | (12,316,988 | ) | | | (23,847,844 | ) |
Capital share transactions: (Note 2) | | | | | | | | |
Class 1 | | | (38,975,858 | ) | | | (56,246,676 | ) |
Class 2 | | | 653,701,033 | | | | 397,772,006 | |
| | |
|
|
|
Total capital share transactions | | | 614,725,175 | | | | 341,525,330 | |
Net increase (decrease) in net assets | | | 903,465,296 | | | | 216,708,247 | |
Net assets: | | | | | | | | |
Beginning of year | | | 878,665,470 | | | | 661,957,223 | |
| | |
|
|
|
End of year | | $ | 1,782,130,766 | | | $ | 878,665,470 | |
| | |
|
|
|
Undistributed net investment income included in net assets: | | | | | | | | |
End of year | | $ | 14,428,647 | | | $ | 10,495,227 | |
| | |
|
|
|
See notes to financial statements.
MS-20
FRANKLIN TEMPLETON VARIABLE INSURANCE PRODUCTS TRUST
MUTUAL SHARES SECURITIES FUND
Notes to Financial Statements
1. ORGANIZATION AND SIGNIFICANT ACCOUNTING POLICIES
Franklin Templeton Variable Insurance Products Trust (the Trust) is registered under the Investment Company Act of 1940 as an open-end investment company, consisting of twenty-two separate series (the Funds). The Mutual Shares Securities Fund (the Fund) included in this report is diversified. Shares of the Fund are sold only to insurance company separate accounts to fund the benefits of variable life insurance policies or variable annuity contracts. As of December 31, 2003, over 51% of the total Fund shares were sold through one insurance company. The Fund’s investment objective is capital growth.
The following summarizes the Fund’s significant accounting policies.
a. Security Valuation
Securities listed or traded on a recognized national exchange or NASDAQ are valued at the last reported sales price. Over-the-counter securities and listed securities for which no sale is reported are valued within the range of the latest quoted bid and asked prices. Investments in open-end mutual funds are valued at the closing net asset value. Foreign securities are valued at the close of trading of the foreign exchange or the NYSE, whichever is earlier. If events occur that materially affect the values of securities after the prices or foreign exchange rates are determined, or if market quotations are not readily available, the securities will be valued at fair value as determined following procedures approved by the Board of Trustees.
b. Foreign Currency Translation
Portfolio securities and other assets and liabilities denominated in foreign currencies are translated into U.S. dollars based on the exchange rate of such currencies against U.S. dollars on the date of valuation. Purchases and sales of securities and income items denominated in foreign currencies are translated into U.S. dollars at the exchange rate in effect on the transaction date.
The Fund does not separately report the effect of changes in foreign exchange rates from changes in market prices on securities held. Such changes are included in net realized and unrealized gain or loss from investments.
Realized foreign exchange gains or losses arise from sales of foreign currencies, currency gains or losses realized between the trade and settlement dates on securities transactions and the difference between the recorded amounts of dividends, interest, and foreign withholding taxes and the U.S. dollar equivalent of the amounts actually received or paid. Net unrealized foreign exchange gains and losses arise from changes in foreign exchange rates on foreign denominated assets and liabilities other than investments in securities held at the end of the reporting period.
c. Foreign Currency Contracts
The Fund may enter into forward exchange contracts to hedge against fluctuations in foreign exchange rates. A forward exchange contract is an agreement between two parties to exchange different currencies at an agreed upon forward exchange rate at a future date. These contracts are valued daily and the Fund’s equity therein is included in the Statement of Assets and Liabilities. Realized and unrealized gains and losses are included in the Statement of Operations.
When the Fund purchases or sells foreign securities it may enter into foreign exchange contracts to minimize foreign exchange risk from the trade date to the settlement date of the transactions. Realized and unrealized gains and losses are included in the Statement of Operations.
The risks of these contracts include movement in the values of the foreign currencies relative to the U.S. dollar and the possible inability of the counter parties to fulfill their obligations under the contracts.
d. Securities Purchase on a When-Issued, Delayed Delivery, or TBA Basis
The Fund may purchase securities on a when-issued, delayed delivery, or to-be-announced (TBA) basis, with payment and delivery scheduled for a future date. These transactions are subject to market fluctuations and are subject to the risk that the
MS-21
FRANKLIN TEMPLETON VARIABLE INSURANCE PRODUCTS TRUST
MUTUAL SHARES SECURITIES FUND
Notes to Financial Statements (continued)
1. ORGANIZATION AND SIGNIFICANT ACCOUNTING POLICIES (cont.)
d. Securities Purchase on a When-Issed, Delayed Delivery, or TBA Basis (cont.)
value at delivery may be more or less than the trade date purchase price. Although the Fund will generally purchase these securities with the intention of holding the securities, it may sell the securities before the settlement date. Sufficient assets have been segregated for these securities.
e. Synthetic Equity Swaps
The Fund may engage in synthetic equity swaps. Synthetic equity swaps are contracts entered into between a broker and the Fund under which the parties agree to make payments to each other so as to replicate the economic consequences that would apply had a purchase or sale of the underlying security taken place. Upon entering into synthetic equity swaps, the Fund is required to pledge to the broker an amount of cash and/or other assets equal to a certain percentage of the contract amount (“initial margin”). Subsequent payments known as “variation margin”, are made or received by the Fund periodically, depending on fluctuations in the value of the underlying security. When the contract is closed, the Fund records a realized gain or loss equal to the difference between the value of the contract at the time it was opened and the value at the time it was closed. The risks of entering into equity swaps include unfavorable price movements in the underlying securities or the inability of the counterparties to fulfill their obligations under the contract.
f. Option Contracts
The Fund may purchase or write options. Options are contracts entitling the holder to purchase or sell a specified number of shares or units of a particular security at a specified price. Options purchased are recorded as investments; options written (sold) are recorded as liabilities. When the exercise of an option results in a cash settlement, the difference between the premium (original option value) and the settlement proceeds is realized as a gain or loss. When securities are acquired or delivered upon exercise of an option, the acquisition cost or sale proceeds are adjusted by the amount of the premium. When an option is closed, the difference between the premium and the cost to close the position is realized as a gain or loss. When an option expires, the premium is realized as a gain for options written or as a loss for options purchased. The risks include the possibility there may be an illiquid options market, or the inability of the counterparties to fulfill their obligations under the contract. Writing options involves, to varying degrees, elements of market risk in excess of the amount recognized in the Statement of Assets and Liabilities.
g. Securities Sold Short
The Fund is engaged in selling securities short, which obligates the Fund to replace a security borrowed with the same security at the current market value. The Fund would incur a loss if the price of the security increases between the date of the short sale and the date on which the Fund replaces the borrowed security. The Fund would realize a gain if the price of the security declines between those dates. A gain, limited to the price at which the Fund sold the security short, or a loss, unlimited in size, will be recognized upon the termination of a short sale.
The Fund is required to establish a margin account with the broker lending the security sold short. While the short sale is outstanding, the broker retains the proceeds of the short sale and the Fund must maintain a deposit for the broker consisting of cash and securities having a value equal to a specified percentage of the value of the securities sold short.
h. Securities Lending
The Fund loans securities to certain brokers for which it received collateral against loaned securities in an amount equal to at least 102% of the market value of the loaned securities.
MS-22
FRANKLIN TEMPLETON VARIABLE INSURANCE PRODUCTS TRUST
MUTUAL SHARES SECURITIES FUND
Notes to Financial Statements (continued)
1. ORGANIZATION AND SIGNIFICANT ACCOUNTING POLICIES (cont.)
i. Income Taxes
No provision has been made for income taxes because the Fund’s policy is to qualify as a regulated investment company under the Internal Revenue Code and to distribute substantially all of its taxable income.
j. Security Transactions, Investment Income, Expenses and Distributions
Security transactions are accounted for on trade date. Realized gains and losses on security transactions are determined on a specific identification basis. Certain income from foreign securities is recorded as soon as information is available to the Fund. Interest income and estimated expenses are accrued daily. Discounts and premiums on securities purchased are amortized over the lives of the respective securities. Dividend income, dividends declared on securities sold short and distributions to shareholders are recorded on the ex-dividend date.
Common expenses incurred by the Trust are allocated among the Funds based on the ratio of net assets of each fund to the combined net assets. Other expenses are charged to each fund on a specific identification basis.
Distributions received by the Fund from securities may be a return of capital (ROC). Such distributions reduce the cost basis of the securities, and any distributions in excess of the cost basis are recognized as capital gains.
Realized and unrealized gains and losses and net investment income, other than class specific expenses, are allocated daily to each class of shares based upon the relative proportion of net assets of each class.
k. Accounting Estimates
The preparation of financial statements in accordance with accounting principles generally accepted in the United States of America requires management to make estimates and assumptions that affect the reported amounts of assets and liabilities at the date of the financial statements and the amounts of income and expense during the reporting period. Actual results could differ from those estimates.
l. Guarantees and Indemnifications
Under the Trust’s organizational documents, its officers and trustees are indemnified against certain liability arising out of the performance of their duties to the Trust. Additionally, in the normal course of business, the Trust enters into contracts with service providers that contain general indemnification clauses. The Trust’s maximum exposure under these arrangements is unknown as this would involve future claims that may be made against the Trust that have not yet occurred. However, based on experience, the Trust expects the risk of loss to be remote.
2. SHARES OF BENEFICIAL INTEREST
The Fund offers two classes of shares: Class 1 and Class 2. Each class of shares differs by its distribution fees, voting rights on matters affecting a single class, and its exchange privilege.
MS-23
FRANKLIN TEMPLETON VARIABLE INSURANCE PRODUCTS TRUST
MUTUAL SHARES SECURITIES FUND
Notes to Financial Statements (continued)
2. SHARES OF BENEFICIAL INTEREST (cont.)
At December 31, 2003, there were an unlimited number of shares authorized ($.01 par value). Transactions in the Fund’s shares were as follows:
| | | | | | | | | | | | | | |
| | | Year ended December 31,
| |
| | | 2003
| | | 2002
| |
| Class 1 Shares: | | Shares
| | | Amount
| | | Shares
| | | Amount
| |
Shares sold | | 255,723 | | | $ | 3,324,112 | | | 1,104,143 | | | $ | 15,457,891 | |
Shares issued on reinvestment of distributions | | 247,994 | | | | 3,290,886 | | | 805,488 | | | | 10,978,800 | |
Shares redeemed | | (3,582,053 | ) | | | (45,590,856 | ) | | (6,372,892 | ) | | | (82,683,367 | ) |
| | |
| |
Net increase (decrease) | | (3,078,336 | ) | | $ | (38,975,858 | ) | | (4,463,261 | ) | | $ | (56,246,676 | ) |
| | |
| |
| Class 2 Shares: | | | | | | | | | | | | |
Shares sold | | 54,231,399 | | | $ | 712,756,799 | | | 36,489,325 | | | $ | 472,129,169 | |
Shares issued on reinvestment of distributions | | 684,314 | | | | 9,026,103 | | | 948,345 | | | | 12,869,044 | |
Shares redeemed | | (5,323,957 | ) | | | (68,081,869 | ) | | (7,102,935 | ) | | | (87,226,207 | ) |
| | |
| |
Net increase (decrease) | | 49,591,756 | | | $ | 653,701,033 | | | 30,334,735 | | | $ | 397,772,006 | |
| | |
| |
3. TRANSACTIONS WITH AFFILIATES
Certain officers and trustees of the Trust are also officers and/or directors of the following entities:
| | |
| Entity | | Affiliation |
|
Franklin Templeton Services LLC (FT Services) | | Administrative manager |
Franklin Mutual Advisers LLC (Franklin Mutual) | | Investment manager |
Franklin/Templeton Distributors Inc. (Distributors) | | Principal underwriter |
Franklin/Templeton Investor Services LLC (Investor Services) | | Transfer agent |
The Fund pays an investment management fee to Franklin Mutual of .60% per year of the average daily net assets of the Fund.
The Fund pays administrative fees to FT Services based on the average daily net assets of the Fund as follows:
| | |
| Annualized Fee Rate | | Daily Net Assets |
|
| .15% | | First $200 million |
| .135% | | Over $200 million, up to and including $700 million |
| .10% | | Over $700 million, up to and including $1.2 billion |
| .075% | | Over $1.2 billion |
The Fund reimburses Distributors up to ..25% per year of its average daily net assets of Class 2, for costs incurred in marketing the Fund’s shares.
Investor Services, under terms of an agreement, performs shareholder servicing for the Fund and is not paid by the Fund for the services.
MS-24
FRANKLIN TEMPLETON VARIABLE INSURANCE PRODUCTS TRUST
MUTUAL SHARES SECURITIES FUND
Notes to Financial Statements (continued)
4. INCOME TAXES
At December 31, 2003, the cost of investments, net unrealized appreciation (depreciation) and undistributed ordinary income for income tax purpose was:
| | | | |
Cost of investments | | $ | 1,527,196,535 | |
| | |
|
|
|
Unrealized appreciation | | | 289,967,700 | |
Unrealized depreciation | | | (8,832,100 | ) |
| | |
|
|
|
Net unrealized appreciation (depreciation) | | $ | 281,135,600 | |
| | |
|
|
|
Distributable earnings—Undistributed ordinary income | | $ | 16,897,762 | |
| | |
|
|
|
The tax character of distributions paid during the years ended December 31, 2003 and 2002, was as follows:
| | | | | | |
| | | 2003
| | 2002
|
Distributions paid from: | | | | | | |
Ordinary income | | $ | 12,316,988 | | $ | 8,944,526 |
Long-term capital gain | | | — | | | 14,903,318 |
| | |
|
| | | $ | 12,316,988 | | $ | 23,847,844 |
| | |
|
Net Investment Income (loss) differs for financial statement and tax purposes primarily due to differing treatments of defaulted securities, foreign currency transactions and bond discounts and premiums.
Net realized losses differ for financial statement and tax purposes primarily due to differing treatment of wash sales, foreign currency transactions and bond discounts and premiums.
At December 31, 2003, the Fund has deferred capital losses occurring subsequent to October 31, 2003 of $4,566,879. For tax purposes, such losses will be reflected in the year ending December 31, 2004.
At December 31, 2003, the Fund had tax basis capital losses which may be carried over to offset future capital gains. Such losses expire as follows:
| | | |
Capital loss expiring on: | | | |
2010 | | $ | 33,868,516 |
2011 | | | 7,220,378 |
| | |
|
|
| | | $ | 41,088,894 |
| | |
|
|
5. INVESTMENT TRANSACTIONS
Purchases and sales of securities (excluding short-term securities and securities sold short) for the year ended December 31, 2003 aggregated $964,542,806 and $475,105,919, respectively.
Transactions in options written during the year ended December 31, 2003 were as follows:
| | | | | | | |
| | | Number of
Contracts
| | | Premium
| |
| Options outstanding at December 31, 2002 | | 51,300 | | | $ | 31,802 | |
| Options written | | 242,956 | | | | 481,956 | |
| Options expired | | (41,431 | ) | | | (150,077 | ) |
| Options terminated in closing transactions | | (21,717 | ) | | | (265,932 | ) |
| Options closed | | (159 | ) | | | (33,266 | ) |
| | |
| |
| Options outstanding at December 31, 2003 | | 230,949 | | | $ | 64,483 | |
| | |
| |
MS-25
FRANKLIN TEMPLETON VARIABLE INSURANCE PRODUCTS TRUST
MUTUAL SHARES SECURITIES FUND
Notes to Financial Statements (continued)
6. INVESTMENTS IN FRANKLIN INSTITUTIONAL FIDUCIARY TRUST MONEY MARKET PORTFOLIO
The Fund may invest in the Franklin Institutional Fiduciary Trust Money Market Portfolio (the Sweep Money Fund), an open-end investment company managed by Franklin Advisers Inc. (an affiliate of the Fund’s Investment Manager). Management fees paid by the Fund are reduced on assets invested in the Sweep Money Fund, in an amount not to exceed the management fees paid by the Sweep Money Fund. The Fund earned $63,763 of dividend income from investments in the Sweep Money Fund.
7. FORWARD CURRENCY CONTRACTS
At December 31, 2003, the Fund has outstanding forward exchange contracts as set out below. The contracts are reported in the financial statements at the Fund’s net equity, as measured by the difference between the forward exchange rates at the reporting date and the forward exchange rates at the day of entry into the contracts.
| | | | | | | | | | | | | | | |
| Contracts to buy: | | In
Exchange for | | Settlement
Date | | Unrealized
Gain (Loss) | |
|
| 16,751,685 | | Canadian Dollars | | | | U.S.$ | 12,387,452 | | 1/21/04 | | | | U.S.$ | 563,043 | |
| 600,000 | | British Pounds | | | | | 1,057,290 | | 1/28/04 | | | | | 14,459 | |
| 2,850,000 | | European Unit | | | | | 3,465,338 | | 1/28/04 | | | | | 126,641 | |
| 500,000 | | British Pounds | | | | | 887,310 | | 2/05/04 | | | | | 5,335 | |
| 3,200,000 | | European Unit | | | | | 4,020,304 | | 2/05/04 | | | | | 12,020 | |
| 550,376,652 | | Japanese Yen | | | | | 4,986,137 | | 3/25/04 | | | | | 163,265 | |
| 4,704,362 | | European Unit | | | | | 5,768,112 | | 3/25/04 | | | | | 151,844 | |
| | | | | | |
|
| | | | | |
|
|
|
| | | | | | | U.S.$ | 32,571,943 | | | | | | U.S.$ | 1,036,607 | |
| | | | | | |
|
| | | | | |
|
|
|
| | | | |
Contracts to sell:
| | | | | | | | | |
| 2,320,874 | | South African Rand | | | | U.S.$ | 350,583 | | 4/26/04 | | | | U.S. | $10,877 | |
| | | | | | |
|
| | | | | |
|
|
|
| Unrealized gain on forward exchange contracts | | | | | | | | | | | U.S.$ | 1,047,484 | |
| | | | | | | | | | | | | |
|
|
|
| | | | |
Contracts to sell:
| | | | | | | | | |
| 4,805,167 | | British Pounds | | | | | 8,524,367 | | 1/06/04 | | | | | (73,608) | |
| 1,500,000 | | European Unit | | | | | 1,869,000 | | 1/06/04 | | | | | (22,704 | ) |
| 13,887,676 | | British Pounds | | | | | 24,152,332 | | 1/12/04 | | | | | (685,500 | ) |
| 14,350,000 | | British Pounds | | | | | 24,267,427 | | 1/20/04 | | | | | (1,381,237 | ) |
| 38,743,250 | | Canadian Dollars | | | | | 27,595,514 | | 1/21/04 | | | | | (2,356,354 | ) |
| 15,000,000 | | British Pounds | | | | | 25,302,000 | | 1/28/04 | | | | | (1,491,721 | ) |
| 5,146,117 | | European Unit | | | | | 6,041,541 | | 1/28/04 | | | | | (444,332 | ) |
| 15,000,000 | | British Pounds | | | | | 26,004,000 | | 2/11/04 | | | | | (761,066 | ) |
| 17,957,185 | | European Unit | | | | | 19,843,161 | | 2/23/04 | | | | | (2,770,169 | ) |
| 4,500,000 | | British Pounds | | | | | 7,583,850 | | 2/27/04 | | | | | (435,901 | ) |
| 7,313,816 | | European Unit | | | | | 8,206,358 | | 3/11/04 | | | | | (1,000,843 | ) |
| 37,397,174 | | Danish Krone | | | | | 6,159,610 | | 3/17/04 | | | | | (161,395 | ) |
| 526,955,204 | | Japanese Yen | | | | | 4,600,000 | | 3/18/04 | | | | | (329,191 | ) |
| 4,120,529 | | European Unit | | | | | 4,697,403 | | 3/25/04 | | | | | (487,859 | ) |
| 692,035,430 | | Japanese Yen | | | | | 6,212,167 | | 3/25/04 | | | | | (262,614 | ) |
| 107,638,519 | | Norwegian Krona | | | | | 15,126,547 | | 4/15/04 | | | | | (998,612 | ) |
| 16,485,969 | | European Unit | | | | | 19,130,210 | | 4/22/04 | | | | | (1,600,727 | ) |
| 5,660,863 | | South African Rand | | | | | 807,194 | | 4/26/04 | | | | | (21,386 | ) |
| 14,850,000 | | European Unit | | | | | 17,477,103 | | 4/28/04 | | | | | (1,193,772 | ) |
| 491,053,849 | | Japanese Yen | | | | | 4,432,938 | | 6/24/04 | | | | | (175,437 | ) |
| | | | | | |
|
| | | | | |
|
|
|
| | | | | | | U.S.$ | 258,032,722 | | | | | | | (16,654,428 | ) |
| | | | | | |
|
| | | | | |
|
|
|
| Net unrealized loss on offsetting forward exchange contracts | | | | | | | | | | | | (27,261 | ) |
| | | | | | | | | | | | | |
|
|
|
| Unrealized loss on forward exchange contracts | | | | | | | | | | | | (16,681,689 | ) |
| | | | | | | | | | | | | |
|
|
|
| Net unrealized loss on forward exchange contracts | | | | | | | | | | | U.S.$ | (15,634,205 | ) |
| | | | | | | | | | | | | |
|
|
|
MS-26
FRANKLIN TEMPLETON VARIABLE INSURANCE PRODUCTS TRUST
MUTUAL SHARES SECURITIES FUND
Notes to Financial Statements (continued)
8. CREDIT RISK DEFAULTED SECURITIES
The Fund held defaulted and/or other securities for which the income has been deemed uncollectible. The Fund discontinues accruing income on these securities and provides an estimate for losses on interest receivable. At December 31, 2003, the value of these securities was $129,711,188 representing 7.3% of the Fund’s net assets. For information as to specific securities, see the accompanying Statement of Investments.
9. RESTRICTED SECURITIES
At December 31, 2003, investments in securities included issues that are restricted or illiquid. Restricted securities are often purchased in private placement transactions, are not registered under the Securities Act of 1933, may have contractual restrictions on resale, and are valued under methods approved by the Board of Trustees as reflecting fair value. A security may also be considered illiquid if it lacks a readily available market or if its valuation has not changed for a certain period of time. At December 31, 2003, the Fund held investments in restricted and illiquid securities that were valued under approved methods by the Trustees, as follows:
| | | | | | | | | | |
| Shares | | Issuer | | Acquisition
Date | | Cost | | Value |
|
| 10,442 | | AboveNet Inc. | | 11/25/03 | | $ | 312,783 | | $ | 312,783 |
| 4,595 | | Elephant Capital Holdings Ltd. | | 10/22/03 | | | 4,594,900 | | | 4,594,900 |
| 639,453 | | International Steel Group | | 4/10/02 | | | 3,118,750 | | | 21,170,690 |
| 184,830 | | Leucadia National Corp. | | 12/20/02 | | | 6,515,258 | | | 8,094,630 |
| 13,716,000 | | MP Finance Ltd., 5.00%, 8/28/07 | | 10/22/03 | | | 13,453,263 | | | 13,990,320 |
| 1,148,000 | | Nippon Investments LLC | | 2/14/01 | | | — | | | 436,240 |
| 169,343 | | NTL Inc. | | 9/21/01 | | | 8,887,840 | | | 11,221,091 |
| 16,280 | | Olympus Re Holdings Ltd. | | 12/19/01 | | | 1,628,000 | | | 2,575,008 |
| 1,520 | | PG & E Corp., wts. 9/02/06 | | 10/29/02 | | | — | | | 37,976 |
| 8,958 | | Security Capital European Realty | | 4/08/98 | | | 203,480 | | | 66,737 |
| 30,898 | | White Mountains Insurance Group Inc. | | 6/01/01 | | | 9,114,910 | | | 13,500,958 |
| | | | | | | | | |
|
|
| | | Total Restricted Securities (4.3% of Net Assets) | | | | | | | $ | 76,001,333 |
| | | | | | | | | |
|
|
10. OTHER CONSIDERATIONS
A member of the Fund’s Portfolio Management team may serve as a member on the board of directors of certain companies in which the Fund invests and may represent the Fund in certain corporate negotiations. Currently, a member of the Portfolio Management team serves in one or more of these capacities for Kindred Healthcare and AboveNet Inc. As a result of this involvement, the Portfolio Manager could receive certain material non-public information which, pursuant to the Fund’s policies and the requirements of the federal securities laws, could prevent the Fund from trading in the securities of such companies for limited or extended periods of time.
11. REGULATORY MATTERS
On February 4, 2004, the Securities Division of the Office of the Secretary of the Commonwealth of Massachusetts filed an administrative complaint against Franklin Resources, Inc. and certain of its subsidiaries (the “Company”), alleging violations of the Massachusetts Uniform Securities Act. The complaint arises from activity that occurred in 2001 during which time an officer of a Company subsidiary was negotiating an agreement with an investor relating to investments in a mutual fund and a hedge fund.
MS-27
FRANKLIN TEMPLETON VARIABLE INSURANCE PRODUCTS TRUST
MUTUAL SHARES SECURITIES FUND
Notes to Financial Statements (continued)
11. REGULATORY MATTERS (cont.)
The Company, in addition to other entities within Franklin Templeton Investments, has been named in shareholder class actions related to the matter described above. The Company believes that the claims made in the lawsuit are without merit and it intends to defend vigorously against the allegations. The Company and the Fund may be named in similar civil actions related to the matter described above.
In addition, as part of ongoing investigations by the U.S. Securities and Exchange Commission (the “SEC”), the U.S. Attorney for the Northern District of California, the New York Attorney General, the California Attorney General, the U.S. Attorney for the District of Massachusetts, the Florida Department of Financial Services, and the Commissioner of Securities and the Attorney General of the State of West Virginia, relating to certain practices in the mutual fund industry, including late trading, market timing and sales compensation arrangements, the Company and its subsidiaries, as well as certain current or former executives and employees of the Company, have received requests for information and/or subpoenas to testify or produce documents. The Company and its current employees are providing documents and information in response to these requests and subpoenas. In addition, the Company has responded to requests for similar kinds of information from regulatory authorities in some of the foreign countries where the Company conducts its global asset management business.
The Staff of the SEC has informed the Company that it intends to recommend that the Commission authorize an action against an affiliate of the Fund’s adviser and a senior executive officer relating to the frequent trading issues that are the subject of the SEC’s investigation. These issues were previously disclosed as being under investigation by government authorities and the subject of an internal inquiry by the Company in its Annual Report on Form 10-K and on its public website. The Company currently is in discussions with the SEC Staff in an effort to resolve the issues raised in their investigation. Such discussions are preliminary and the Fund’s management has been advised that the Company cannot predict the likelihood of whether those discussions will result in a settlement and, if so, the terms of such settlement. The impact, if any, of these matters on the Fund is uncertain at this time. If the Company finds that it bears responsibility for any unlawful or improper conduct, it has committed to making the Fund or its shareholders whole, as appropriate.
MS-28
FRANKLIN TEMPLETON VARIABLE INSURANCE PRODUCTS TRUST
MUTUAL SHARES SECURITIES FUND
Independent Auditor’s Report
To the Board of Trustees and Shareholders
of Franklin Templeton Variable Insurance Products Trust – Mutual Shares Securities Fund
In our opinion, the accompanying statement of assets and liabilities, including the statement of investments, and the related statements of operations and of changes in net assets and the financial highlights present fairly, in all material respects, the financial position of the Mutual Shares Securities Fund (the “Fund,” one of the funds constituting the Franklin Templeton Variable Insurance Products Trust) at December 31, 2003, the results of its operations for the year then ended, the changes in its net assets for each of the two years in the period then ended and the financial highlights for each of the periods presented, in conformity with accounting principles generally accepted in the United States of America. These financial statements and financial highlights (hereafter referred to as “financial statements”) are the responsibility of the Fund’s management; our responsibility is to express an opinion on these financial statements based on our audits. We conducted our audits of these financial statements in accordance with auditing standards generally accepted in the United States of America, which require that we plan and perform the audits to obtain reasonable assurance about whether the financial statements are free of material misstatement. An audit includes examining, on a test basis, evidence supporting the amounts and disclosures in the financial statements, assessing the accounting principles used and significant estimates made by management, and evaluating the overall financial statement presentation. We believe that our audits, which included confirmation of securities at December 31, 2003 by correspondence with the custodian and brokers, provide a reasonable basis for our opinion.
PricewaterhouseCoopers LLP
San Francisco, California
February 5, 2004, except for Note 11 as to which the date is February 12, 2004
MS-29
FRANKLIN TEMPLETON VARIABLE INSURANCE PRODUCTS TRUST
MUTUAL SHARES SECURITIES FUND
Tax Designation (unaudited)
Under Section 854(b)(2) of the Code, the Fund hereby designates 51.83% of the ordinary income dividends as income qualifying for the dividends received deduction for the fiscal year ended December 31, 2003.
MS-30
TEMPLETON DEVELOPING MARKETS SECURITIES FUND
Fund Goal and Primary Investments: Templeton Developing Markets Securities Fund seeks long-term capital appreciation. The Fund invests primarily in emerging markets investments.
This annual report for Templeton Developing Markets Securities Fund covers the period ended December 31, 2003.
Performance Overview
You can find the Fund’s one-year total return in the Performance Summary following this report. The Fund underperformed its benchmarks, the Morgan Stanley Capital International (MSCI) Emerging Markets Free (EMF) Index and the Standard & Poor’s/International Finance Corporation Investable (S&P/IFCI) Composite Index, which returned 56.28% and 57.16% for the year under review.1 Please note that the index performance numbers are purely for reference and that Templeton does not index its funds, but rather undertakes investments on the basis of careful, fundamental research.
Economic and Market Overview
For the year ended December 31, 2003, generally improving economic growth worldwide had favorable effects on many emerging market economies, which exhibited faster growth than many developed countries. Many emerging country financial markets seemed to reflect the strengthening global economic conditions. Early in 2003, concerns about military conflicts in Afghanistan and Iraq, as well as high oil prices, rattled investor confidence, and most equity markets experienced losses in the first quarter. However, a quicker-than-expected end to major combat in Iraq relieved some market concerns, and many emerging markets rebounded in the second quarter. The severe acute respiratory syndrome (SARS) outbreak in early spring greatly impacted Asian market performance as regional tourism suffered, particularly the airline and hospitality sectors. However, the containment of SARS in following months allowed concerns to subside, and investors returned from the sidelines. Largely as a result, emerging markets generally outperformed the U.S., European and Japanese markets for the 12 months under review. For example, the MSCI EMF Index returned 56.28% for the year ended December 31, 2003. The Standard & Poor’s 500 Composite Index (S&P 500), a broad measure of U.S. equity performance, returned 28.67%, while the MSCI Europe Australasia Far
1. Source: Standard & Poor’s Micropal. One cannot invest directly in an index, nor is an index representative of the Fund’s portfolio. Please see Index Descriptions following the Fund Summaries.
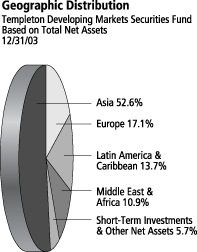
TD-1
East (EAFE) Index and MSCI Japan Index returned 39.17% and 36.15% for the same one-year period.2
During the Fund’s fiscal year, Latin American markets were some of the world’s strongest performing as political and financial issues that engulfed the region in 2002 subsided. Brazil and Argentina experienced renewed investor interest as their governments strove to implement key structural reforms and sealed agreements with the International Monetary Fund. Asian markets rebounded sharply in 2003’s second half largely due to strong macroeconomic data. In Africa, South Africa ended years of ongoing debate, and the government agreed to provide free AIDS-related treatments, creating the world’s largest such program. Eastern European equity markets’ upward trend continued as prospective European Union (EU) candidates successfully passed referendums for accession into the EU in 2004. In Russia, an investigation and subsequent arrest of Michail Khodorkovsky, the CEO and major shareholder of oil company Yukos, as well as the breakup of the Sibneft-Yukos merger, contributed to some severe market fluctuations during 2003’s fourth quarter. For the year, however, Russia’s market outperformed its regional peers. To the south, Turkey’s market appeared to take recent terrorist attacks in stride and continued its upward trend as investor confidence seemed to remain largely unshaken.
Investment Strategy
Our investment philosophy is bottom-up, value-oriented and long-term. In choosing investments, we may make onsite visits to companies to assess critical factors such as management strength and local conditions. In addition, we focus on the market price of a company’s securities relative to our evaluation of the company’s potential long-term (typically 5 years) earnings, asset value, cash flow and balance sheet. Among factors we consider are a company’s historical value measures, including price/earnings ratio, book value, profit margins and liquidation value. We perform in-depth research to construct an action list from which we make our investment decisions.
Manager’s Discussion
During the year under review, the Fund’s performance benefited from underweighted positions, relative to the MSCI EMF Index, in South Korea and Malaysia because those countries underperformed the index. Also helping Fund performance were relatively overweighted positions in China, Turkey and Austria, which outperformed the index.
2. Source: Standard & Poor’s Micropal. Please see Index Descriptions following the Fund Summaries.
TD-2
By industry, the Fund’s holdings in banks (including commercial banks), information technology (IT) services and industrial conglomerates provided the greatest contribution to Fund performance relative to the MSCI EMF Index during the period. Individual contributors included Turkey’s Akbank and Brazil’s Banco Bradesco. Within IT services, Satyam Computers, an Indian IT services company with strong working relationships with multinationals, led performance. Industrial conglomerates that helped the Fund’s relative performance included India’s Grasim Industries and Singapore’s Keppel.
Areas that hindered Fund performance during the period included a relatively overweighted position in the Philippines and underweighted positions in Brazil and Russia. The Fund’s Philippine position is concentrated in San Miguel Corp., one of the largest beverage companies in the Asia-Pacific region. The company and its subsidiaries have broad exposure in the Asia-Pacific region and operate more than 100 facilities in the Philippines, China and other Southeast Asian countries. We believe Asia’s economic recovery could bode well for the company; therefore, consistent with our investment strategy, we continued to hold the stock. Poor liquidity made additional investments in Russia difficult, while Brazil’s strong market performance led to increasingly expensive valuations.
During the Fund’s fiscal year, we made investments in several Asian countries, including Taiwan, Singapore and China (Red Chip shares, Hong Kong-listed companies with significant exposure to China, and H shares, Hong Kong-listed Chinese companies). Consistent with our investment strategy, we purchased shares of China Mobile, a dominant wireless telecommunications operator in China; China Telecom and Taiwan Cellular, key integrated telecommunications services providers in China and Taiwan, respectively; and Singapore Telecommunications, one of Asia’s leading communications companies. Conversely, we undertook selective sales in strong performers in Indonesia and Thailand as some stock valuations became expensive.
Top 10 Countries
Templeton Developing Markets Securities Fund
12/31/03
| | |
South Korea | | 11.7% |
| |
South Africa | | 11.1% |
| |
China | | 9.8% |
| |
Taiwan | | 9.6% |
| |
Brazil | | 7.7% |
| |
Singapore | | 6.4% |
| |
Hong Kong | | 5.7% |
| |
Mexico | | 5.1% |
| |
India | | 3.9% |
| |
Turkey | | 3.4% |
TD-3
Consistent with our strategy, in Latin America we added to our shares of Telefonos de Mexico, the country’s largest integrated telecommunications services provider, which increased our overall Mexican holdings. We decreased our Argentina position during the period and repositioned our Brazil holdings by adding to our shares of Embraer-Empresa Brasileira de Aeronautica, one of the world’s largest aircraft manufacturers, and reducing our position and taking profits in Cia Vale Do Rio Doce.
We purchased shares in several European companies during the fiscal year, including Poland’s Telekomunikacja Polska SA, Greece’s Hellenic Telecommunications Organization SA (OTE) and the Czech Republic’s Cesky Telecom. Largely as a result of these purchases and some of our Asian investments, the Fund’s exposure to telecommunications increased during the period. We sold some of our Turkey holdings before the terrorist attacks there, locking in gains.
Thank you for your participation in Templeton Developing Markets Securities Fund. We look forward to serving your future investment needs.
This discussion reflects our analysis, opinions and portfolio holdings as of December 31, 2003, the end of the reporting period. The way we implement our main investment strategies and the resulting portfolio holdings may change depending on factors such as market and economic conditions. These opinions may not be relied upon as investment advice or an offer for a particular security. The information is not a complete analysis of every aspect of any market, country, industry, security or the Fund. Statements of fact are from sources considered reliable, but the advisor makes no representation or warranty as to their completeness or accuracy. Although historical performance is no guarantee of future results, these insights may help you understand our investment management philosophy.
Top 10 Equity Holdings
Templeton Developing Markets
Securities Fund
12/31/03
| | |
Company Sector/Industry,
Country | | % of Total Net Assets |
|
| |
Anglo American PLC Metals & Mining,
South Africa | | 3.6% |
| |
SABMiller PLC Beverages, South Africa | | 2.5% |
| |
Citic Pacific Ltd. Industrial Conglomerates, Hong Kong | | 2.1% |
| |
Hyundai Motor Co. Ltd. Automobiles, South Korea | | 2.0% |
| |
China Mobile (Hong Kong) Ltd., fgn. Wireless Telecommunication Services, China | | 2.0% |
| |
Lukoil Holdings, ADR Oil & Gas, Russia | | 1.8% |
| |
Petroleo Brasileiro SA, ADR, pfd. Oil & Gas, Brazil | | 1.7% |
| |
Telefonos de Mexico SA de CV (Telmex), L, ADR Diversified Telecommunication Services, Mexico | | 1.6% |
| |
Banco Bradesco SA, ADR, pfd. Banks, Brazil | | 1.6% |
| |
Kimberly Clark de Mexico SA de CV, A Household Products, Mexico | | 1.6% |
The dollar value, number of shares or principal amount, and complete legal titles of all portfolio holdings are listed in the Fund’s Statement of Investments.
TD-4
PERFORMANCE SUMMARYASOF 12/31/03
Total return of Class 2 shares represents the average annual change in value, assuming reinvestment of dividends and capital gains. Average returns smooth out variations in returns, which can be significant; they are not the same as year-by-year results.
Templeton Developing Markets Securities Fund – Class 2* Periods ended 12/31/03
| | | | | | |
| | | 1-Year | | 5-Year | | Since Inception (3/4/96) |
|
Average Annual Total Return | | +52.99% | | +7.90% | | -3.29% |
*Performance prior to the 5/1/00 merger reflects the historical performance of Templeton Developing Markets Fund. Additionally, because Class 2 shares were not offered until 5/1/97, standardized Class 2 Fund performance for prior periods represents the historical results of Class 1 shares. For periods beginning on 5/1/97, Class 2’s results reflect an additional 12b-1 fee expense, which also affects future performance. Since 5/1/97 (effective date), the average annual total return of Class 2 shares was -3.73%.
Ongoing market volatility can significantly affect short-term performance; recent returns may differ.
Total Return Index Comparison
for Hypothetical $10,000 Investment (3/4/96–12/31/03)
The graph compares the performance of Templeton Developing Markets Securities Fund – Class 2,* the MSCI Emerging Markets Free Index and the S&P/IFCI Composite Index. One cannot invest directly in an index, nor is an index representative of the Fund’s portfolio. Please see Important Notes to Performance Information preceding the Fund Summaries.
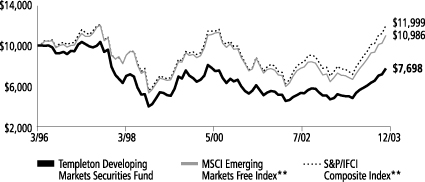
**Source: Standard & Poor’s Micropal. Please see Index Descriptions following the Fund Summaries.
Templeton Developing Markets Securities Fund – Class 2
Performance reflects the Fund’s Class 2 operating expenses, but does not include any contract fees, expenses or sales charges. If they had been included, performance would be lower. These charges and deductions, particularly for variable life policies, can have a significant effect on contract values and insurance benefits. See the contract prospectus for a complete description of these expenses, including sales charges.
Since markets can go down as well as up, investment return and the value of your principal will fluctuate with market conditions, and you may have a gain or loss when you sell your shares.
TD-5
Past performance does not guarantee future results.
FRANKLIN TEMPLETON VARIABLE INSURANCE PRODUCTS TRUST
TEMPLETON DEVELOPING MARKETS SECURITIES FUND
Financial Highlightsa
| | | | | | | | | | | | | | | | | | | | |
| | | Class 1
| |
| | | Year Ended December 31,
| |
| | | 2003 | | | 2002 | | | 2001 | | | 2000 | | | 1999 | |
| | |
|
|
|
Per share operating performance | | | | | | | | | | | | | | | | | | | | |
(For a share outstanding throughout the year) | | | | | | | | | | | | | | | | | | | | |
Net asset value, beginning of year | | $ | 4.71 | | | $ | 4.78 | | | $ | 5.25 | | | $ | 7.77 | | | $ | 5.13 | |
| | |
|
|
|
Income from investment operations: | | | | | | | | | | | | | | | | | | | | |
Net investment incomeb | | | .13 | | | | .07 | | | | .08 | | | | .07 | | | | .05 | |
Net realized and unrealized gains (losses) | | | 2.38 | | | | (.06 | ) | | | (.50 | ) | | | (2.52 | ) | | | 2.67 | |
| | |
|
|
|
Total from investment operations | | | 2.51 | | | | .01 | | | | (.42 | ) | | | (2.45 | ) | | | 2.72 | |
| | |
|
|
|
Less distributions from net investment income | | | (.08 | ) | | | (.08 | ) | | | (.05 | ) | | | (.07 | ) | | | (.08 | ) |
| | |
|
|
|
Net asset value, end of year | | $ | 7.14 | | | $ | 4.71 | | | $ | 4.78 | | | $ | 5.25 | | | $ | 7.77 | |
| | |
|
|
|
| | | | | |
Total returnc | | | 53.74% | | | | .04% | | | | (8.08)% | | | | (31.76)% | | | | 53.84% | |
Ratios/supplemental data | | | | | | | | | | | | | | | | | | | | |
Net assets, end of year (000’s) | | $ | 359,299 | | | $ | 225,454 | | | $ | 240,289 | | | $ | 301,645 | | | $ | 297,605 | |
Ratios to average net assets: | | | | | | | | | | | | | | | | | | | | |
Expenses | | | 1.55% | | | | 1.58% | | | | 1.57% | | | | 1.56% | | | | 1.50% | |
Net investment income | | | 2.35% | | | | 1.45% | | | | 1.64% | | | | 1.13% | | | | .82% | |
Portfolio turnover rate | | | 46.20% | | | | 57.91% | | | | 78.29% | | | | 89.48% | | | | 60.27% | |
| a | Financial highlights presented reflect historical financial information from Templeton Variable Products Series Fund (TVP)-Templeton Developing Markets Fund as a result of a merger on May 1, 2000. |
| b | Based on average daily shares outstanding. |
| c | Total return does not include any fees, charges or expenses imposed by the variable annuity and life insurance contracts for which the Franklin Templeton Variable Insurance Products Trust serves as an underlying investment vehicle. Total return is not annualized for periods less than one year. |
TD-6
FRANKLIN TEMPLETON VARIABLE INSURANCE PRODUCTS TRUST
TEMPLETON DEVELOPING MARKETS SECURITIES FUND
Financial Highlightsa (continued)
| | | | | | | | | | | | | | | | | | | | |
| | | Class 2
| |
| | | Year Ended December 31,
| |
| | | 2003 | | | 2002 | | | 2001 | | | 2000 | | | 1999 | |
| | |
|
|
|
Per share operating performance | | | | | | | | | | | | | | | | | | | | |
(For a share outstanding throughout the year) | | | | | | | | | | | | | | | | | | | | |
Net asset value, beginning of year | | $ | 4.69 | | | $ | 4.76 | | | $ | 5.22 | | | $ | 7.74 | | | $ | 5.12 | |
| | |
|
|
|
Income from investment operations: | | | | | | | | | | | | | | | | | | | | |
Net investment incomeb | | | .11 | | | | .06 | | | | .07 | | | | .06 | | | | .03 | |
Net realized and unrealized gains (losses) | | | 2.35 | | | | (.06 | ) | | | (.49 | ) | | | (2.53 | ) | | | 2.66 | |
| | |
|
|
|
Total from investment operations | | | 2.46 | | | | — | | | | (.42 | ) | | | (2.47 | ) | | | 2.69 | |
| | |
|
|
|
Less distributions from net investment income | | | (.06 | ) | | | (.07 | ) | | | (.04 | ) | | | (.05 | ) | | | (.07 | ) |
| | |
|
|
|
Net asset value, end of year | | $ | 7.09 | | | $ | 4.69 | | | $ | 4.76 | | | $ | 5.22 | | | $ | 7.74 | |
| | |
|
|
|
| | | | | |
Total returnc | | | 52.99% | | | | (.15)% | | | | (8.08)% | | | | (32.04)% | | | | 53.27% | |
Ratios/supplemental data | | | | | | | | | | | | | | | | | | | | |
Net assets, end of year (000’s) | | $ | 170,953 | | | $ | 80,952 | | | $ | 64,081 | | | $ | 56,617 | | | $ | 49,654 | |
Ratios to average net assets: | | | | | | | | | | | | | | | | | | | | |
Expenses | | | 1.80% | | | | 1.83% | | | | 1.82% | | | | 1.81% | | | | 1.75% | |
Net investment income | | | 2.10% | | | | 1.20% | | | | 1.37% | | | | .88% | | | | .52% | |
Portfolio turnover rate | | | 46.20% | | | | 57.91% | | | | 78.29% | | | | 89.48% | | | | 60.27% | |
| a | Financial highlights presented reflect historical financial information from Templeton Variable Products Series Fund (TVP)-Templeton Developing Markets Fund as a result of a merger on May 1, 2000. |
| b | Based on average daily shares outstanding. |
| c | Total return does not include any fees, charges or expenses imposed by the variable annuity and life insurance contracts for which the Franklin Templeton Variable Insurance Products Trust serves as an underlying investment vehicle. Total return is not annualized for periods less than one year. |
See notes to financial statements.
TD-7
FRANKLIN TEMPLETON VARIABLE INSURANCE PRODUCTS TRUST
TEMPLETON DEVELOPING MARKETS SECURITIES FUND
Statement of Investments, December 31, 2003
| | | | | | | |
| | | INDUSTRY | | SHARES/
RIGHTS/
WARRANTS | | VALUE |
|
| | | | | | | | |
Long Term Investments 94.3% | | | | | | | |
Argentina 1.0% | | | | | | | |
Tenaris SA, ADR | | Energy Equipment & Services | | 152,914 | | $ | 5,095,095 |
| | | | | | |
|
|
Austria 2.8% | | | | | | | |
aBank Austria Creditanstalt, Reg S | | Banks | | 95,500 | | | 4,878,595 |
OMV AG | | Oil & Gas | | 47,065 | | | 7,009,883 |
Wienerberger AG | | Building Products | | 106,392 | | | 2,842,309 |
| | | | | | |
|
|
| | | | | | | | 14,730,787 |
| | | | | | |
|
|
Brazil 7.7% | | | | | | | |
Banco Bradesco SA, ADR, pfd. | | Banks | | 325,181 | | | 8,588,030 |
Centrais Eletricas Brasileiras SA | | Electric Utilities | | 92,373,000 | | | 1,552,891 |
Centrais Eletricas Brasileiras SA | | Electric Utilities | | 159,745,000 | | | 2,685,488 |
Cia Vale do Rio Doce, ADR, pfd., A | | Metals & Mining | | 82,885 | | | 4,269,406 |
aCompanhia Paranaense de Energia-Copel, ADR, pfd. | | Electric Utilities | | 61,700 | | | 294,309 |
Duratex SA, pfd. | | Building Products | | 24,097,583 | | | 693,359 |
Embraer-Empresa Brasileira de Aeronautica SA, ADR | | Aerospace & Defense | | 205,254 | | | 7,190,048 |
Petroleo Brasileiro SA, ADR, pfd. | | Oil & Gas | | 338,985 | | | 9,037,340 |
Souza Cruz SA | | Tobacco | | 297,200 | | | 3,118,282 |
Unibanco Uniao de Bancos Brasileiros SA, GDR | | Banks | | 135,495 | | | 3,380,600 |
| | | | | | |
|
|
| | | | | | | | 40,809,753 |
| | | | | | |
|
|
China 9.8% | | | | | | | |
Beijing Enterprises Holdings Ltd. | | Industrial Conglomerates | | 1,370,000 | | | 1,605,827 |
China Mobile (Hong Kong) Ltd., fgn. | | Wireless Telecommunication Services | | 3,378,000 | | | 10,377,312 |
China Petroleum & Chemical Corp., H | | Oil & Gas | | 17,520,000 | | | 7,841,980 |
China Resources Enterprise Ltd. | | Distributors | | 4,248,000 | | | 4,815,086 |
China Telecom Corp. Ltd., H | | Diversified Telecommunication Services | | 15,932,000 | | | 6,566,850 |
China Travel International Investment Hong Kong Ltd. | | Hotels Restaurants & Leisure | | 12,082,000 | | | 2,287,668 |
Cofco International Ltd. | | Food Products | | 1,700,000 | | | 1,094,853 |
Huadian Power International Corp Ltd. | | Electric Utilities | | 5,670,000 | | | 2,373,577 |
PetroChina Co. Ltd., H | | Oil & Gas | | 12,300,000 | | | 7,050,209 |
Shanghai Industrial Holdings Ltd. | | Industrial Conglomerates | | 1,829,000 | | | 4,181,662 |
TCL International Holdings Inc. | | Household Durables | | 7,194,000 | | | 3,173,715 |
Travelsky Technology Ltd., H | | IT Consulting & Services | | 802,000 | | | 862,577 |
| | | | | | |
|
|
| | | | | | | | 52,231,316 |
| | | | | | |
|
|
Croatia .7% | | | | | | | |
Pliva D D, GDR, Reg S | | Pharmaceuticals | | 218,000 | | | 3,553,400 |
| | | | | | |
|
|
Czech Republic .6% | | | | | | | |
Cesky Telecom AS | | Diversified Telecommunication Services | | 117,990 | | | 1,341,795 |
CEZ AS | | Electric Utilities | | 350,850 | | | 1,999,052 |
| | | | | | |
|
|
| | | | | | | | 3,340,847 |
| | | | | | |
|
|
Denmark .8% | | | | | | | |
Carlsberg AS, B | | Beverages | | 98,060 | | | 4,518,320 |
| | | | | | |
|
|
Egypt .2% | | | | | | | |
Commercial International Bank Ltd. | | Banks | | 311,380 | | | 1,111,170 |
| | | | | | |
|
|
Greece 1.3% | | | | | | | |
Coca-Cola Hellenic Bottling Co., SA | | Beverages | | 132,757 | | | 2,766,329 |
Hellenic Telecommunications Organization SA (OTE) | | Diversified Telecommunication Services | | 315,390 | | | 4,169,131 |
| | | | | | |
|
|
| | | | | | | | 6,935,460 |
| | | | | | |
|
|
TD-8
FRANKLIN TEMPLETON VARIABLE INSURANCE PRODUCTS TRUST
TEMPLETON DEVELOPING MARKETS SECURITIES FUND
Statement of Investments, December 31, 2003 (cont.)
| | | | | | | |
| | | INDUSTRY | | SHARES/
RIGHTS/
WARRANTS | | VALUE |
|
| | | | | | | | |
Long Term Investments (cont.) | | | | | | | |
Hong Kong 5.7% | | | | | | | |
Cheung Kong Holdings Ltd. | | Real Estate | | 528,000 | | $ | 4,199,598 |
Cheung Kong Infrastructure Holdings Ltd. | | Construction Materials | | 580,000 | | | 1,299,912 |
Citic Pacific Ltd. | | Industrial Conglomerates | | 4,360,000 | | | 11,119,584 |
Dairy Farm International Holdings Ltd. | | Food & Drug Retailing | | 1,655,833 | | | 2,773,520 |
Guoco Group Ltd. | | Diversified Financials | | 130,000 | | | 954,454 |
Hang Lung Group Ltd. | | Real Estate | | 1,279,000 | | | 1,598,009 |
Henderson Investment Ltd. | | Real Estate | | 1,344,000 | | | 1,549,384 |
Hong Kong Land Holdings Ltd. | | Real Estate | | 675,000 | | | 1,147,500 |
aHopewell Highway Infrastructure Ltd., wts., 08/05/06 | | Transportation Infrastructure | | 30,000 | | | 5,835 |
Hopewell Holdings Ltd. | | Transportation Infrastructure | | 282,000 | | | 434,064 |
HSBC Holdings PLC | | Banks | | 38,800 | | | 612,216 |
MTR Corp. Ltd. | | Road & Rail | | 1,558,707 | | | 2,057,904 |
Tack Fat Group International Ltd. | | Specialty Retail | | 5,042,000 | | | 513,058 |
Tingyi (Cayman Islands) Holding Corp. | | Food Products | | 8,138,000 | | | 1,907,770 |
VTech Holdings Ltd. | | Communications Equipment | | 32,000 | | | 45,546 |
| | | | | | |
|
|
| | | | | | | | 30,218,354 |
| | | | | | |
|
|
Hungary 2.7% | | | | | | | |
Egis RT | | Pharmaceuticals | | 50,884 | | | 2,070,522 |
Gedeon Richter Ltd. | | Pharmaceuticals | | 40,592 | | | 4,805,479 |
Matav RT | | Diversified Telecommunication Services | | 493,000 | | | 1,877,718 |
MOL Magyar Olaj-Es Gazipari RT | | Oil & Gas | | 188,140 | | | 5,728,102 |
| | | | | | |
|
|
| | | | | | | | 14,481,821 |
| | | | | | |
|
|
India 3.9% | | | | | | | |
Container Corp. of India Ltd. | | Road & Rail | | 34,944 | | | 509,666 |
HCL Technologies Ltd. | | IT Consulting & Services | | 131,500 | | | 883,104 |
Hero Honda Motors Ltd. | | Automobiles | | 261,869 | | | 2,576,217 |
Hindustan Petroleum Corp. Ltd. | | Oil & Gas | | 362,004 | | | 3,471,271 |
aIndraprastha Gas Ltd. | | Gas Utilities | | 125,000 | | | 406,438 |
ITC Ltd. | | Tobacco | | 48,300 | | | 1,042,274 |
Mahanagar Telephone Nigam Ltd. | | Diversified Telecommunication Services | | 1,468,285 | | | 4,431,405 |
aMaruti Udyog Ltd. | | Automobiles | | 249,000 | | | 2,053,670 |
Nestle India Ltd. | | Food Products | | 12,000 | | | 181,348 |
Satyam Computers Services Ltd. | | IT Consulting & Services | | 459,421 | | | 3,699,031 |
Union Bank of India Ltd. | | Banks | | 881,400 | | | 990,066 |
Videsh Sanchar Nigam Ltd. | | Diversified Telecommunication Services | | 203,030 | | | 656,371 |
| | | | | | |
|
|
| | | | | | | | 20,900,861 |
| | | | | | |
|
|
Indonesia 2.2% | | | | | | | |
PT Gudang Garam TBK | | Tobacco | | 1,672,000 | | | 2,699,816 |
PT Indosat (Persero) TBK | | Diversified Telecommunication Services | | 3,410,500 | | | 6,073,909 |
aPT Perusahaan Gas Negara, 144A | | Oil & Gas | | 1,731,000 | | | 318,557 |
PT Telekomunikasi Indonesia TBK, B | | Diversified Telecommunication Services | | 3,194,645 | | | 2,560,268 |
| | | | | | |
|
|
| | | | | | | | 11,652,550 |
| | | | | | |
|
|
Israel | | | | | | | |
Elbit Systems Ltd. | | Aerospace & Defense | | 12,476 | | | 224,540 |
| | | | | | |
|
|
TD-9
FRANKLIN TEMPLETON VARIABLE INSURANCE PRODUCTS TRUST
TEMPLETON DEVELOPING MARKETS SECURITIES FUND
Statement of Investments, December 31, 2003 (cont.)
| | | | | | | |
| | | INDUSTRY | | SHARES/
RIGHTS/
WARRANTS | | VALUE |
|
| | | | | | | | |
Long Term Investments (cont.) | | | | | | | |
Malaysia .4% | | | | | | | |
Tanjong PLC | | Hotels Restaurants & Leisure | | 14,000 | | $ | 39,789 |
YTL Power International Bhd. | | Electric Utilities | | 2,259,100 | | | 1,997,520 |
| | | | | | |
|
|
| | | | | | | | 2,037,309 |
| | | | | | |
|
|
Mexico 5.1% | | | | | | | |
Alfa SA | | Industrial Conglomerates | | 7,000 | | | 20,993 |
Embotelladoras Arca SA | | Food & Drug Retailing | | 132,000 | | | 252,553 |
Embotelladoras Arca SA, 144A | | Food & Drug Retailing | | 294,833 | | | 564,098 |
Fomento Economico Mexicano SA de CV Femsa, ADR | | Beverages | | 86,020 | | | 3,172,417 |
Grupo Bimbo SA de CV, A | | Food Products | | 496,100 | | | 931,519 |
Grupo Carso SA de CV | | Industrial Conglomerates | | 703,500 | | | 2,472,869 |
Grupo Continental SA | | Beverages | | 494,359 | | | 835,865 |
Grupo Televisa SA, ADR | | Media | | 36,000 | | | 1,434,960 |
Kimberly Clark de Mexico SA de CV, A | | Household Products | | 3,273,400 | | | 8,389,412 |
Telefonos de Mexico SA de CV (Telmex), L, ADR | | Diversified Telecommunication Services | | 263,882 | | | 8,716,022 |
| | | | | | |
|
|
| | | | | | | | 26,790,708 |
| | | | | | |
|
|
Peru | | | | | | | |
Credicorp Ltd. | | Banks | | 5,100 | | | 68,085 |
| | | | | | |
|
|
Philippines .8% | | | | | | | |
San Miguel Corp., B | | Beverages | | 3,892,630 | | | 4,487,182 |
| | | | | | |
|
|
Poland 2.4% | | | | | | | |
aBRE Bank SA | | Banks | | 34,625 | | | 855,704 |
Polski Koncern Naftowy Orlen SA | | Oil & Gas | | 887,238 | | | 5,926,140 |
Telekomunikacja Polska SA | | Diversified Telecommunication Services | | 1,498,800 | | | 6,066,638 |
| | | | | | |
|
|
| | | | | | | | 12,848,482 |
| | | | | | |
|
|
Russia 1.9% | | | | | | | |
Aeroflot | | Airlines | | 25,100 | | | 17,319 |
bLukoil Holdings, ADR | | Oil & Gas | | 102,807 | | | 9,569,276 |
Yuzhnaya Telecommunication Co. | | Diversified Telecommunication Services | | 2,913,300 | | | 282,590 |
| | | | | | |
|
|
| | | | | | | | 9,869,185 |
| | | | | | |
|
|
Singapore 6.4% | | | | | | | |
Comfortdelgro Corp. Ltd. | | Road & Rail | | 4,474,000 | | | 2,147,036 |
DBS Group Holdings Ltd. | | Banks | | 430,000 | | | 3,721,957 |
Fraser & Neave Ltd. | | Beverages | | 1,005,681 | | | 7,461,332 |
Keppel Corp. Ltd. | | Industrial Conglomerates | | 2,032,600 | | | 7,300,748 |
Singapore Airlines Ltd. | | Airlines | | 702,000 | | | 4,629,571 |
Singapore Press Holdings Ltd. | | Media | | 54,000 | | | 600,954 |
Singapore Technologies Engineering Ltd. | | Aerospace & Defense | | 2,069,000 | | | 2,485,285 |
Singapore Telecommunications Ltd. | | Diversified Telecommunication Services | | 4,819,000 | | | 5,561,585 |
| | | | | | |
|
|
| | | | | | | | 33,908,468 |
| | | | | | |
|
|
South Africa 11.1% | | | | | | | |
Anglo American PLC | | Metals & Mining | | 893,410 | | | 19,139,720 |
Barloworld Ltd. | | Industrial Conglomerates | | 202,350 | | | 2,126,570 |
BHP Billiton PLC | | Metals & Mining | | 286,200 | | | 2,486,831 |
Imperial Holdings Ltd. | | Air Freight & Couriers | | 289,177 | | | 2,902,601 |
Nampak Ltd. | | Containers & Packaging | | 291,200 | | | 567,131 |
TD-10
FRANKLIN TEMPLETON VARIABLE INSURANCE PRODUCTS TRUST
TEMPLETON DEVELOPING MARKETS SECURITIES FUND
Statement of Investments, December 31, 2003 (cont.)
| | | | | | | |
| | | INDUSTRY | | SHARES/
RIGHTS/
WARRANTS | | VALUE |
|
| | | | | | | | |
Long Term Investments (cont.) | | | | | | | |
South Africa (cont.) | | | | | | | |
Nedcor Ltd. | | Banks | | 92,000 | | $ | 854,945 |
Old Mutual PLC | | Insurance | | 2,773,960 | | | 4,568,560 |
Remgro Ltd. | | Industrial Conglomerates | | 680,270 | | | 7,195,065 |
SABMiller PLC | | Beverages | | 1,304,424 | | | 13,290,476 |
Sasol Ltd. | | Oil & Gas | | 410,087 | | | 5,836,444 |
| | | | | | |
|
|
| | | | | | | | 58,968,343 |
| | | | | | |
|
|
South Korea 11.7% | | | | | | | |
CJ Corp. | | Food Products | | 67,200 | | | 3,502,409 |
Dong-A Pharmaceutical Co. Ltd. | | Pharmaceuticals | | 55,633 | | | 866,129 |
Hite Brewery Co. Ltd. | | Beverages | | 49,490 | | | 3,630,236 |
Hyundai Development Co. | | Construction & Engineering | | 463,020 | | | 4,799,242 |
Hyundai Motor Co. Ltd. | | Automobiles | | 247,460 | | | 10,488,233 |
Kangwon Land Inc. | | Hotels Restaurants & Leisure | | 574,055 | | | 6,841,444 |
Korea Electric Power Corp. | | Electric Utilities | | 306,189 | | | 5,499,324 |
Korea Gas Corp. | | Gas Utilities | | 92,390 | | | 1,919,138 |
KT Corp. | | Diversified Telecommunication Services | | 71,340 | | | 2,670,385 |
KT&G Corp. | | Tobacco | | 68,990 | | | 1,198,567 |
LG Card Co. Ltd. | | Consumer Finance | | 299,013 | | | 764,158 |
LG Chem Ltd. | | Chemicals | | 440 | | | 20,311 |
LG Home Shopping Inc. | | Internet & Catalog Retail | | 12,830 | | | 648,230 |
LG Household & Health Care Ltd. | | Household Products | | 88,940 | | | 2,321,472 |
LG International Corp. | | Trading Companies & Distributors | | 75,000 | | | 503,567 |
Poongsan Corp. | | Metals & Mining | | 28,970 | | | 306,355 |
POSCO | | Metals & Mining | | 16,330 | | | 2,233,982 |
Samsung Corp. | | Trading Companies & Distributors | | 268,540 | | | 2,231,260 |
Samsung Fine Chemicals | | Chemicals | | 221,490 | | | 3,039,330 |
Samsung Heavy Industries Co. Ltd. | | Machinery | | 779,620 | | | 4,311,956 |
SK Corp. | | Oil & Gas | | 183,880 | | | 4,228,546 |
| | | | | | |
|
|
| | | | | | | | 62,024,274 |
| | | | | | |
|
|
Taiwan 9.6% | | | | | | | |
Acer Inc. | | Computers & Peripherals | | 1,675,000 | | | 2,491,532 |
Amtran Technology Co. Ltd. | | Computers & Peripherals | | 575,000 | | | 484,389 |
Cheng Shin Rubber Industry Co. Ltd. | | Auto Components | | 327,000 | | | 417,057 |
Chinatrust Financial Holding Co. Ltd. | | Banks | | 2,438,980 | | | 2,449,756 |
Chunghwa Telcom Co. Ltd. | | Diversified Telecommunication Services | | 1,570,000 | | | 2,279,853 |
D-Link Corp. | | Communications Equipment | | 3,870,000 | | | 5,163,800 |
Delta Electronics Inc. | | Electronic Equipment & Instruments | | 3,453,255 | | | 4,424,642 |
Elan Microelectronics Corp. | | Software | | 2,555,000 | | | 2,295,361 |
Elite Semiconductor Memory Technology Inc. | | Electrical Equipment | | 759,400 | | | 1,465,116 |
Fubon Financial Holding Co. Ltd. | | Diversified Financials | | 1,092,000 | | | 1,045,361 |
Lite-on Technology Corp. | | Computers & Peripherals | | 4,404,000 | | | 4,669,926 |
Mega Financial Holdings Co. Ltd. | | Banks | | 4,070,503 | | | 2,445,899 |
Micro-Star International Co. Ltd. | | Computers & Peripherals | | 104,000 | | | 153,166 |
Phoenixtec Power Co. Ltd. | | Electrical Equipment | | 1,487,270 | | | 1,743,545 |
President Chain Store Corp. | | Food & Drug Retailing | | 1,276,000 | | | 1,954,403 |
Sunplus Technology Co. Ltd. | | Semiconductors & Semiconductor Equipment | | 3,426,000 | | | 6,407,982 |
Taiwan Cellular Corp. | | Wireless Telecommunication Services | | 5,285,302 | | | 4,592,530 |
Taiwan Glass Industrial Corp. | | Building Products | | 235,000 | | | 177,894 |
TD-11
FRANKLIN TEMPLETON VARIABLE INSURANCE PRODUCTS TRUST
TEMPLETON DEVELOPING MARKETS SECURITIES FUND
Statement of Investments, December 31, 2003 (cont.)
| | | | | | | | |
| | | INDUSTRY | | SHARES/
RIGHTS/
WARRANTS | | VALUE |
|
| | | | | | | | | |
Long Term Investments (cont.) | | | | | | | | |
Taiwan (cont.) | | | | | | | | |
aTatung Co. Ltd. | | Industrial Conglomerates | | | 4,438,000 | | $ | 1,124,206 |
Tsann Kuen Enterprise Co. Ltd. | | Household Durables | | | 1,008,000 | | | 1,466,722 |
UNI-President Enterprises Corp. | | Food Products | | | 3,218,600 | | | 1,322,518 |
Yuanta Core Pacific Securities Co. | | Diversified Financials | | | 3,488,212 | | | 2,085,735 |
| | | | | | | |
|
|
| | | | | | | | | 50,661,393 |
| | | | | | | |
|
|
Thailand 2.1% | | | | | | | | |
Delta Electronics (Thailand) Public Co. Ltd. | | Electronic Equipment & Instruments | | | 1,295,000 | | | 879,185 |
Hana Microelectronics Co. Ltd., fgn. | | Electronic Equipment & Instruments | | | 283,000 | | | 892,801 |
Krung Thai Bank Public Co. Ltd., fgn. | | Banks | | | 1,200,000 | | | 372,515 |
National Finance Public Co. Ltd., fgn. | | Consumer Finance | | | 1,023,700 | | | 431,467 |
PTT Exploration & Production Public Co. Ltd., fgn. | | Oil & Gas | | | 1,004,200 | | | 6,792,242 |
Shin Corporation Public Co. Ltd., fgn. | | Wireless Telecommunication Services | | | 260,000 | | | 255,915 |
Siam City Cement Public Co. Ltd., fgn. | | Construction Materials | | | 58,000 | | | 333,750 |
Siam Makro Public Co. Ltd., fgn. | | Food & Drug Retailing | | | 96,000 | | | 111,452 |
aTelecomasia Corp. Public Co. Ltd., purch. rts. | | Diversified Telecommunication Services | | | 344,616 | | | — |
Thai Airways International Public Co. Ltd., fgn. | | Airlines | | | 401,600 | | | 463,706 |
aThai Military Bank Public Co. Ltd., fgn. | | Banks | | | 1,680,000 | | | 290,441 |
Thai Union Frozen Products Ltd., fgn. | | Food Products | | | 110,000 | | | 88,838 |
| | | | | | | |
|
|
| | | | | | | | | 10,912,312 |
| | | | | | | |
|
|
Turkey 3.4% | | | | | | | | |
Akbank | | Banks | | | 497,801,261 | | | 2,604,158 |
Arcelik AS, Br. | | Household Durables | | | 1,103,826,400 | | | 6,128,003 |
Migros Turk T.A.S. | | Food & Drug Retailing | | | 178,149,000 | | | 2,548,608 |
Tupras-Turkiye Petrol Rafineleri AS | | Oil & Gas | | | 781,213,000 | | | 6,505,473 |
| | | | | | | |
|
|
| | | | | | | | | 17,786,242 |
| | | | | | | |
|
|
Total Long Term Investments
(Cost $375,486,632) | | | | | | | | 500,166,257 |
| | | | | | | |
|
|
| | | | | PRINCIPAL
AMOUNT | | |
|
Short Term Investment (Cost $29,789,752) 5.6% | | | | | | | | |
U.S. Treasury Bill, .845% to .92%, 1/2/04 - 3/25/04 | | | | $ | 29,835,000 | | | 29,793,685 |
| | | | | | | |
|
|
Total Investments (Cost $405,276,384) 99.9% | | | | | | | | 529,959,942 |
Other Assets, less Liabilities .1% | | | | | | | | 292,476 |
| | | | | | | |
|
|
Net Assets 100.0% | | | | | | | $ | 530,252,418 |
| | | | | | | |
|
|
| b | See Note 6 regarding other considerations. |
TD-12
FRANKLIN TEMPLETON VARIABLE INSURANCE PRODUCTS TRUST
TEMPLETON DEVELOPING MARKETS SECURITIES FUND
Financial Statements
Statement of Assets and Liabilities
December 31, 2003
| | | |
Assets: | | | |
Investments in securities: | | | |
Cost | | $ | 405,276,384 |
| | |
|
|
Value | | | 529,959,942 |
Foreign currency, at value (cost $1,032,821) | | | 1,035,766 |
Receivables: | | | |
Investment securities sold | | | 1,610,393 |
Capital shares sold | | | 905,555 |
Dividends and interest | | | 1,117,412 |
| | |
|
|
Total assets | | | 534,629,068 |
| | |
|
|
Liabilities: | | | |
Payables: | | | |
Investment securities purchased | | | 1,194,914 |
Capital shares redeemed | | | 400,623 |
Affiliates | | | 654,802 |
Deferred tax liability (Note 1f) | | | 1,922,971 |
Funds advanced by custodian | | | 4,457 |
Other liabilities | | | 198,883 |
| | |
|
|
Total liabilities | | | 4,376,650 |
| | |
|
|
Net assets, at value | | $ | 530,252,418 |
| | |
|
|
Net assets consist of: | | | |
Undistributed net investment income | | $ | 5,951,933 |
Net unrealized appreciation (depreciation) | | | 122,749,174 |
Accumulated net realized gain (loss) | | | (199,577,235) |
Capital shares | | | 601,128,546 |
| | |
|
|
Net assets, at value | | $ | 530,252,418 |
| | |
|
|
Class 1: | | | |
Net assets, at value | | $ | 359,299,298 |
| | |
|
|
Shares outstanding | | | 50,348,005 |
| | |
|
|
Net asset value and offering price per share | | $ | 7.14 |
| | |
|
|
Class 2: | | | |
Net assets, at value | | $ | 170,953,120 |
| | |
|
|
Shares outstanding | | | 24,101,077 |
| | |
|
|
Net asset value and offering price per share | | $ | 7.09 |
| | |
|
|
See notes to financial statements.
TD-13
FRANKLIN TEMPLETON VARIABLE INSURANCE PRODUCTS TRUST
TEMPLETON DEVELOPING MARKETS SECURITIES FUND
Financial Statements (continued)
Statement of Operations
for the year ended December 31, 2003
| | | | |
Investment income: (net of foreign taxes and fees of $1,154,374) | | | | |
Dividends | | $ | 14,244,030 | |
Interest | | | 93,559 | |
| | |
|
|
|
Total investment income | | | 14,337,589 | |
| | |
|
|
|
Expenses: | | | | |
Management fees (Note 3) | | | 4,585,327 | |
Administrative fees (Note 3) | | | 525,214 | |
Distribution fees – Class 2 (Note 3) | | | 257,460 | |
Transfer agent fees | | | 2,054 | |
Custodian fees | | | 373,147 | |
Reports to shareholders | | | 148,264 | |
Professional fees | | | 35,822 | |
Trustees’ fees and expenses | | | 3,447 | |
Other | | | 23,250 | |
| | |
|
|
|
Total expenses | | | 5,953,985 | |
| | |
|
|
|
Net investment income | | | 8,383,604 | |
| | |
|
|
|
Realized and unrealized gains (losses): | | | | |
Net realized gain (loss) from: | | | | |
Investments (net of foreign taxes of $468,507) (Note 1f) | | | 19,346,500 | |
Foreign currency transactions | | | (510,671 | ) |
| | |
|
|
|
Net realized gain (loss) | | | 18,835,829 | |
Net unrealized appreciation (depreciation) on: | | | | |
Investments | | | 143,243,426 | |
Translation of assets and liabilities denominated in foreign currencies | | | (14,496 | ) |
Deferred taxes (Note 1f) | | | (1,914,669 | ) |
| | |
|
|
|
Net unrealized appreciation (depreciation) | | | 141,314,261 | |
| | |
|
|
|
Net realized and unrealized gain (loss) | | | 160,150,090 | |
| | |
|
|
|
Net increase (decrease) in net assets resulting from operations | | $ | 168,533,694 | |
| | |
|
|
|
See notes to financial statements.
TD-14
FRANKLIN TEMPLETON VARIABLE INSURANCE PRODUCTS TRUST
TEMPLETON DEVELOPING MARKETS SECURITIES FUND
Financial Statements (continued)
Statements of Changes in Net Assets
For the years ended December 31, 2003 and 2002
| | | | | | | | |
| | | 2003 | | | 2002 | |
| | |
| |
Increase (decrease) in net assets: | | | | | | | | |
Operations: | | | | | | | | |
Net investment income | | $ | 8,383,604 | | | $ | 4,455,928 | |
Net realized gain (loss) from investments and foreign currency transactions | | | 18,835,829 | | | | (9,268,738 | ) |
Net unrealized appreciation (depreciation) on investments and translation of assets and liabilities denominated in foreign currencies | | | 141,314,261 | | | | 6,877,309 | |
| | |
|
|
| |
|
|
|
Net increase (decrease) in net assets resulting from operations | | | 168,533,694 | | | | 2,064,499 | |
Distributions to shareholders from: | | | | | | | | |
Net investment income: | | | | | | | | |
Class 1 | | | (3,521,009 | ) | | | (3,878,945 | ) |
Class 2 | | | (1,068,523 | ) | | | (1,149,535 | ) |
| | |
|
|
| |
|
|
|
Total distributions to shareholders | | | (4,589,532 | ) | | | (5,028,480 | ) |
Capital share transactions: (Note 2) | | | | | | | | |
Class 1 | | | 18,051,739 | | | | (12,115,583 | ) |
Class 2 | | | 41,851,167 | | | | 17,115,195 | |
| | |
|
|
| |
|
|
|
Total capital share transactions | | | 59,902,906 | | | | 4,999,612 | |
Net increase (decrease) in net assets | | | 223,847,068 | | | | 2,035,631 | |
Net assets: | | | | | | | | |
Beginning of year | | | 306,405,350 | | | | 304,369,719 | |
| | |
|
|
| |
|
|
|
End of year | | $ | 530,252,418 | | | $ | 306,405,350 | |
| | |
| |
Undistributed net investment income included in net assets: | | | | | | | | |
End of year | | $ | 5,951,933 | | | $ | 3,131,753 | |
| | |
|
|
| |
|
|
|
See notes to financial statements.
TD-15
FRANKLIN TEMPLETON VARIABLE INSURANCE PRODUCTS TRUST
TEMPLETON DEVELOPING MARKETS SECURITIES FUND
Notes to Financial Statements
1. ORGANIZATION AND SIGNIFICANT ACCOUNTING POLICIES
Franklin Templeton Variable Insurance Products Trust (the Trust) is registered under the Investment Company Act of 1940 as an open-end investment company, consisting of twenty-two separate series (the Funds). The Templeton Developing Markets Securities Fund (the Fund) included in this report is diversified. Shares of the Fund are sold only to insurance company separate accounts to fund the benefits of variable life insurance policies or variable annuity contracts. The Fund’s investment objective is capital growth.
The following summarizes the Fund’s significant accounting policies.
a. Security Valuation
Securities listed or traded on a recognized national exchange or NASDAQ are valued at the last reported sales price. Over-the-counter securities and listed securities for which no sale is reported are valued within the range of the latest quoted bid and asked prices. Foreign securities are valued at the close of trading of the foreign exchange or the NYSE, whichever is earlier. If events occur that materially affect the values of securities after the prices or foreign exchange rates are determined, or if market quotations are not readily available, the securities will be valued at fair value as determined following procedures approved by the Board of Trustees.
b. Foreign Currency Translation
Portfolio securities and other assets and liabilities denominated in foreign currencies are translated into U.S. dollars based on the exchange rate of such currencies against U.S. dollars on the date of valuation. Purchases and sales of securities and income items denominated in foreign currencies are translated into U.S. dollars at the exchange rate in effect on the transaction date.
The Fund does not separately report the effect of changes in foreign exchange rates from changes in market prices on securities held. Such changes are included in net realized and unrealized gain or loss from investments.
Realized foreign exchange gains or losses arise from sales of foreign currencies, currency gains or losses realized between the trade and settlement dates on securities transactions and the difference between the recorded amounts of dividends, interest, and foreign withholding taxes and the U.S. dollar equivalent of the amounts actually received or paid. Net unrealized foreign exchange gains and losses arise from changes in foreign exchange rates on foreign denominated assets and liabilities other than investments in securities held at the end of the reporting period.
c. Foreign Currency Contracts
When the Fund purchases or sells foreign securities it may enter into foreign exchange contracts to minimize foreign exchange risk from the trade date to the settlement date of the transactions. A foreign exchange contract is an agreement between two parties to exchange different currencies at an agreed upon exchange rate on a specified date. Realized and unrealized gains and losses are included in the Statement of Operations.
The risks of these contracts include movement in the values of the foreign currencies relative to the U.S. dollar and the possible inability of the counterparties to fulfill their obligations under the contracts.
d. Income Taxes
No provision has been made for income taxes because the Fund’s policy is to qualify as a regulated investment company under the Internal Revenue Code and to distribute substantially all of its taxable income.
TD-16
FRANKLIN TEMPLETON VARIABLE INSURANCE PRODUCTS TRUST
TEMPLETON DEVELOPING MARKETS SECURITIES FUND
Notes to Financial Statements (continued)
1. ORGANIZATION AND SIGNIFICANT ACCOUNTING POLICIES (cont.)
e. Security Transactions, Investment Income, Expenses and Distributions
Security transactions are accounted for on trade date. Realized gains and losses on security transactions are determined on a specific identification basis. Certain income from foreign securities is recorded as soon as information is available to the Fund. Interest income and estimated expenses are accrued daily. Dividend income and distributions to shareholders are recorded on the ex-dividend date.
Common expenses incurred by the Trust are allocated among the Funds based on the ratio of net assets of each fund to the combined net assets. Other expenses are charged to each fund on a specific identification basis.
Realized and unrealized gains and losses and net investment income, other than class specific expenses, are allocated daily to each class of shares based upon the relative proportion of net assets of each class.
f. Deferred Taxes
The Fund is subject to a tax imposed on net realized gains of securities of certain foreign countries. The Fund records an estimated deferred tax liability for net unrealized gains on these securities as reflected in the accompanying financial statements.
g. Accounting Estimates
The preparation of financial statements in accordance with accounting principles generally accepted in the United States of America requires management to make estimates and assumptions that affect the reported amounts of assets and liabilities at the date of the financial statements and the amounts of income and expenses during the reporting period. Actual results could differ from those estimates.
h. Guarantees and Indemnifications
Under the Trust’s organizational documents, its officers and trustees are indemnified against certain liability arising out of the performance of their duties to the Trust. Additionally, in the normal course of business, the Trust enters into contracts with service providers that contain general indemnification clauses. The Trust’s maximum exposure under these arrangements is unknown as this would involve future claims that may be made against the Trust that have not yet occurred. However, based on experience, the Trust expects the risk of loss to be remote.
TD-17
FRANKLIN TEMPLETON VARIABLE INSURANCE PRODUCTS TRUST
TEMPLETON DEVELOPING MARKETS SECURITIES FUND
Notes to Financial Statements (continued)
2. SHARES OF BENEFICIAL INTEREST
The Fund offers two classes of shares: Class 1 and Class 2. Each class of shares differs by its distribution fees, voting rights on matters affecting a single class, and its exchange privilege.
At December 31, 2003, there were an unlimited number of shares authorized ($.01 par value). Transactions in the Fund’s shares were as follows:
| | | | | | | | | | | | | | |
| | | Year Ended December 31,
| |
| | | 2003
| | | 2002
| |
| Class 1 Shares: | | Shares
| | | Amount
| | | Shares
| | | Amount
| |
Shares sold | | 10,436,573 | | | $ | 60,506,599 | | | 20,100,040 | | | $ | 96,134,388 | |
Shares issued in reinvestment of distributions | | 652,039 | | | | 3,521,009 | | | 751,734 | | | | 3,878,945 | |
Shares redeemed | | (8,573,395 | ) | | | (45,975,869 | ) | | (23,322,593 | ) | | | (112,128,916 | ) |
| | |
| |
Net increase (decrease) | | 2,515,217 | | | $ | 18,051,739 | | | (2,470,819 | ) | | $ | (12,115,583 | ) |
| | |
| |
| Class 2 Shares: | | | | | | | | | | | | |
Shares sold | | 30,181,277 | | | $ | 163,641,071 | | | 65,809,894 | | | $ | 323,925,644 | |
Shares issued in reinvestment of distributions | | 198,398 | | | | 1,068,523 | | | 223,645 | | | | 1,149,535 | |
Shares redeemed | | (23,541,038 | ) | | | (122,858,427 | ) | | (62,244,002 | ) | | | (307,959,984 | ) |
| | |
| |
Net increase (decrease) | | 6,838,637 | | | $ | 41,851,167 | | | 3,789,537 | | | $ | 17,115,195 | |
| | |
| |
3. TRANSACTIONS WITH AFFILIATES
Certain officers and trustees of the Fund are also officers and/or directors of the following entities:
| | |
| Entity | | Affiliation |
|
Franklin Templeton Services LLC (FT Services) | | Administrative manager |
Templeton Asset Management Ltd. (TAML) | | Investment manager |
Franklin/Templeton Distributors Inc. (Distributors) | | Principal underwriter |
Franklin/Templeton Investor Services LLC (Investor Services) | | Transfer agent |
The Fund pays an investment management fee to TAML of 1.25% per year of the average daily net assets of the fund.
The Fund pays an administrative fee to FT Services based on the average daily net assets of the Fund as follows:
| | |
| Annualized Fee Rate | | Net Assets |
|
.15% | | First $200 million |
.135% | | Over $200 million, up to and including $700 million |
.10% | | Over $700 million, up to and including $1.2 billion |
Fees are further reduced on net assets over $1.2 billion.
The Fund reimburses Distributors up to .25% per year of its average daily net assets of Class 2, for costs incurred in marketing the Fund’s shares.
Investor Services, under terms of an agreement, performs shareholder servicing for the Fund and is not paid by the Fund.
TD-18
FRANKLIN TEMPLETON VARIABLE INSURANCE PRODUCTS TRUST
TEMPLETON DEVELOPING MARKETS SECURITIES FUND
Notes to Financial Statements (continued)
4. INCOME TAXES
At December 31, 2003, the Fund had tax basis capital losses of $197,860,620, which may be carried over to offset future capital gains. Such losses expire as follows:
| | | |
Capital loss carryovers expiring in: | | | |
2006 | | $ | 19,633,396 |
2007 | | | 91,657,992 |
2009 | | | 62,323,035 |
2010 | | | 24,246,197 |
| | |
|
| | | $ | 197,860,620 |
| | |
|
At December 31, 2003, the Fund had deferred currency losses occurring subsequent to October 31, 2003 of $115,389. For tax purposes, such losses will be reflected in the year ending December 31, 2004.
Net investment income differs for financial statement and tax purposes primarily due to differing treatments of foreign currency transactions and passive foreign investment company shares.
Net realized gains and losses differ for financial statement and tax purposes primarily due to differing treatments of wash sales, foreign currency transactions, and passive foreign investment company shares.
The tax character of distributions paid during the years ended December 31, 2003 and 2002, was as follows:
| | | | | | |
| | | 2003
| | 2002
|
Distributions paid from: | | | | | | |
Ordinary income | | $ | 4,589,532 | | $ | 5,028,480 |
Long term capital gain | | | — | | | — |
| | |
|
| | | $ | 4,589,532 | | $ | 5,028,480 |
| | |
|
At December 31, 2003, the cost of investments, net unrealized appreciation (depreciation), undistributed ordinary income and undistributed long term capital gains for income tax purposes were as follows:
| | | | |
Cost of investments | | $ | 411,565,787 | |
| | |
| |
Unrealized appreciation | | $ | 128,486,746 | |
Unrealized depreciation | | | (10,092,591 | ) |
| | |
| |
Net unrealized appreciation (depreciation) | | $ | 118,394,155 | |
| | |
| |
Undistributed ordinary income | | $ | 10,640,108 | |
Undistributed long term capital gains | | | — | |
Distributable earnings | | $ | 10,640,108 | |
| | |
| |
5. INVESTMENT TRANSACTIONS
Purchases and sales of securities (excluding short-term securities) for the year ended December 31, 2003 aggregated $202,924,854 and $165,313,499, respectively.
6. OTHER CONSIDERATIONS
TAML, as the Fund’s Manager, may serve as a member on the board of directors of certain companies in which the Fund invests and/or may represent the Fund in certain corporate negotiations. Currently, the Manager serves in one or more of these capacities for Lukoil Holdings. As a result of this involvement, the Manager may be in possession of certain material non-public information which, pursuant to the Fund’s policies and the requirements of the federal securities laws, could prevent the Fund from trading in the securities of such companies for limited or extended periods of time.
TD-19
FRANKLIN TEMPLETON VARIABLE INSURANCE PRODUCTS TRUST
TEMPLETON DEVELOPING MARKETS SECURITIES FUND
Notes to Financial Statements (continued)
7. REGULATORY MATTERS
On February 4, 2004, the Securities Division of the Office of the Secretary of the Commonwealth of Massachusetts filed an administrative complaint against Franklin Resources, Inc. and certain of its subsidiaries (the “Company”), alleging violations of the Massachusetts Uniform Securities Act. The complaint arises from activity that occurred in 2001 during which time an officer of a Company subsidiary was negotiating an agreement with an investor relating to investments in a mutual fund and a hedge fund.
The Company, in addition to other entities within Franklin Templeton Investments, has been named in shareholder class actions related to the matter described above. The Company believes that the claims made in the lawsuit are without merit and it intends to defend vigorously against the allegations. The Company and the Fund may be named in similar civil actions related to the matter described above.
In addition, as part of ongoing investigations by the U.S. Securities and Exchange Commission (the “SEC”), the U.S. Attorney for the Northern District of California, the New York Attorney General, the California Attorney General, the U.S. Attorney for the District of Massachusetts, the Florida Department of Financial Services and the Commissioner of Securities and the Attorney General of the State of West Virginia, relating to certain practices in the mutual fund industry, including late trading, market timing and sales compensation arrangements, the Company and its subsidiaries, as well as certain current or former executives and employees of the Company, have received requests for information and/or subpoenas to testify or produce documents. The Company and its current employees are providing documents and information in response to these requests and subpoenas. In addition, the Company has responded to requests for similar kinds of information from regulatory authorities in some of the foreign countries where the Company conducts its global asset management business.
The Staff of the SEC has informed the Company that it intends to recommend that the Commission authorize an action against an affiliate of the Fund’s adviser and a senior executive officer relating to the frequent trading issues that are the subject of the SEC’s investigation. These issues were previously disclosed as being under investigation by government authorities and the subject of an internal inquiry by the Company in its Annual Report on Form 10-K and on its public website. The Company currently is in discussions with the SEC Staff in an effort to resolve the issues raised in their investigation. Such discussions are preliminary and the Fund’s management has been advised that the Company cannot predict the likelihood of whether those discussions will result in a settlement and, if so, the terms of such settlement. The impact, if any, of these matters on the Fund is uncertain at this time. If the Company finds that it bears responsibility for any unlawful or improper conduct, it has committed to making the Fund or its shareholders whole, as appropriate.
TD-20
FRANKLIN TEMPLETON VARIABLE INSURANCE PRODUCTS TRUST
TEMPLETON DEVELOPING MARKETS SECURITIES FUND
Independent Auditors’ Report
To the Board of Trustees and Shareholders of
Franklin Templeton Variable Insurance Products Trust
In our opinion, the accompanying statement of assets and liabilities, including the statement of investments, and the related statements of operations and of changes in net assets and the financial highlights present fairly, in all material respects, the financial position of the Templeton Developing Markets Securities Fund (the Fund) (one of the funds constituting the Franklin Templeton Variable Insurance Products Trust) at December 31, 2003, the results of its operations for the year then ended, the changes in its net assets for each of the two years in the period then ended and the financial highlights for each of the periods presented, in conformity with accounting principles generally accepted in the United States of America. These financial statements and financial highlights (hereafter referred to as “financial statements”) are the responsibility of the Fund’s management; our responsibility is to express an opinion on these financial statements based on our audits. We conducted our audits of these financial statements in accordance with auditing standards generally accepted in the United States of America, which require that we plan and perform the audits to obtain reasonable assurance about whether the financial statements are free of material misstatement. An audit includes examining, on a test basis, evidence supporting the amounts and disclosures in the financial statements, assessing the accounting principles used and significant estimates made by management, and evaluating the overall financial statement presentation. We believe that our audits, which included confirmation of securities at December 31, 2003 by correspondence with the custodian and brokers, provide a reasonable basis for our opinion.
PricewaterhouseCoopers LLP
San Francisco, California
February 5, 2004, except for Note 7 as to which the date is February 12, 2004
TD-21
FRANKLIN TEMPLETON VARIABLE INSURANCE PRODUCTS TRUST
TEMPLETON DEVELOPING MARKETS SECURITIES FUND
Tax Designation (unaudited)
At December 31, 2003, more than 50% of the Fund’s total assets were invested in securities of foreign issuers. In most instances, foreign taxes were withheld from dividends paid to the Fund on these investments. The Fund elects to treat foreign taxes paid under Section 853 of the Internal Revenue Code. This election will allow shareholders of record in June, 2004, to treat their proportionate share of foreign taxes paid by the Fund as having been paid directly by them. The shareholder shall consider these amounts as foreign taxes paid in the tax year in which they receive the Fund distribution.
The foreign tax information will be disclosed in the June 30, 2004 semi-annual report of the Fund.
TD-22
TEMPLETON FOREIGN SECURITIES FUND
Fund Goal and Primary Investments: Templeton Foreign Securities Fund seeks long-term capital growth. The Fund invests primarily in investments of issuers located outside the U.S., including those in emerging markets.
This annual report for Templeton Foreign Securities Fund covers the fiscal year ended December 31, 2003.
Performance Overview
You can find the Fund’s one-year total return in the Performance Summary following this report. The Fund underperformed its benchmark, the Morgan Stanley Capital International Europe Australasia Far East (MSCI EAFE) Index, which returned 39.17% for the year under review.1
Economic and Market Overview
In spring 2003, the end of major conflict in Iraq coincided with the start of a global equity market rally that produced the strongest annual total returns since 1986. The rally’s main catalyst was an improving global economy, underpinned by expansionary fiscal and monetary policies, corporate restructuring and consolidation, and more than two years of declining equity valuations that created potential opportunities in Asia, Europe and the Americas.
In many countries, including the U.S., China and Japan, gross domestic product (GDP) growth accelerated in 2003, particularly in the second half of the year. In the U.S., GDP grew at annualized rates of 3.1% and 8.2% in the second and third quarters. Over the same periods, consumer spending rose at annualized rates of 3.3% and 6.9% spurred largely by tax cuts, car-buying incentives and mortgage refinancing, as interest rates remained at the lowest level in more than four decades. Industrial production increased in the U.S., China, Japan and South Korea in the second half of the year, as did consumer sentiment in the U.S., U.K., Germany and Sweden, and business sentiment in the U.S., Australia, Germany and Japan. In short, a synchronized global economic recovery gained momentum in the second half of 2003.
Further evidence of this recovery was the continued rise in the prices of base metals and other commodities. This was due, in part, to greater demand in China. On December 31, 2003, contracts for aluminum and other metals such silver, gold, copper and zinc were anywhere from
1. Source: Standard & Poor’s Micropal. One cannot invest directly in an index, nor is an index representative of the Fund’s portfolio. Please see Index Descriptions following the Fund Summaries.
TF-1
19% to 50% higher than 12 months before.2 While gold crossed the $400-an-ounce threshold for the first time in more than seven years, such agricultural commodities as cotton and soybeans gained approximately 40%.2 Despite rising commodities prices, global inflation remained subdued throughout the year.
In 2003, the value of the U.S. dollar fell against most major currencies, including a 17% decline versus the euro.3 While the decline magnified top-line and earnings-per-share growth in the U.S., it had the opposite effect in Europe. The dollar decline also benefited U.S. investors in international equities because it increased the returns of investments denominated in currencies that appreciated against the dollar, such as the euro. Although the dollar’s decline significantly affected equity market returns, it was not the only reason for the past year’s gains. Equity markets in many countries, including emerging market countries, produced stronger gains than the U.S. equity market, even in their local currencies. These countries benefited from the improving economic and financial market conditions in 2003.
Investment Strategy
Our investment philosophy is bottom-up, value-oriented and long-term. In choosing investments, we generally focus on the market price of a company’s securities relative to our evaluation of the company’s potential long-term earnings, asset value and cash flow. Among factors we consider are a company’s historical value measures, including price/earnings ratio, profit margins and liquidation value. We do in-depth research to construct a bargain list from which we buy.
Manager’s Discussion
During the 12 months under review, the Fund’s overweighted position in the industrials sector relative to the MSCI EAFE Index benefited performance as that sector outperformed the overall index, and the Fund’s industrials sector holdings posted better overall returns than the index’s overall industrials sector return. The Fund’s overweighted utilities sector exposure also helped performance because our utilities stocks outperformed the index’s overall utilities return. In addition, the Fund’s overweighted position in materials aided performance, as the materials sector outperformed the overall MSCI EAFE Index for the year under review.
2. Source: Reuters, Commodity Research Bureau Index; London Metal Exchange.
3. Source: European Central Bank.
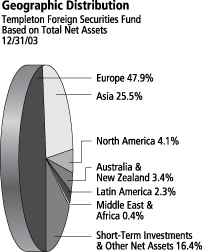
TF-2
Despite the Fund’s double-digit return, some sector positioning dampened performance. Detractors from Fund performance during the year included our underweighted position in the financials sector, and our financials sector holdings’ underperformance relative to the index. The underperformance of the Fund’s energy and consumer staples holdings also hindered relative performance during the reporting period. In addition, the Fund held more than 10% of its total net assets in short-term investments and other net assets (cash) during the period, which constrained performance.
Thank you for your participation in Templeton Foreign Securities Fund. We look forward to serving your future investment needs.
This discussion reflects our analysis, opinions and portfolio holdings as of December 31, 2003, the end of the reporting period. The way we implement our main investment strategies and the resulting portfolio holdings may change depending on factors such as market and economic conditions. These opinions may not be relied upon as investment advice or an offer for a particular security. The information is not a complete analysis of every aspect of any market, country, industry, security or the Fund. Statements of fact are from sources considered reliable, but the advisor makes no representation or warranty as to their completeness or accuracy. Although historical performance is no guarantee of future results, these insights may help you understand our investment management philosophy.
Top 10 Holdings
Templeton Foreign Securities Fund 12/31/03
| | |
Company Sector/Industry,
Country | | % of Total
Net Assets |
|
| |
| Samsung Electronics Co. Ltd. | | 1.8% |
| Semiconductors & Semiconductor Equipment, South Korea | | |
| |
| Denso Corp. | | 1.8% |
| Auto Components, Japan | | |
| |
| Nippon Telegraph & Telephone Corp. | | 1.8% |
| Diversified Telecommunication Services, Japan | | |
| |
| Sony Corp. | | 1.7% |
| Household Durables, Japan | | |
| |
| Aventis SA | | 1.6% |
| Pharmaceuticals, France | | |
| |
Koninklijke Philips
Electronics NV | | 1.5% |
| Household Durables, Netherlands | | |
| |
| Cheung Kong Holdings Ltd. | | 1.5% |
| Real Estate, Hong Kong | | |
| |
| Volkswagen AG, ord. & pfd. | | 1.4% |
| Automobiles, Germany | | |
| |
| Eni SpA | | 1.4% |
| Oil & Gas, Italy | | |
| |
| Nordea AB, FDR | | 1.4% |
| Banks, Sweden | | |
The dollar value, number of shares or principal amount, and complete legal titles of all portfolio holdings are listed in the Fund’s Statement of Investments.
TF-3
PERFORMANCE SUMMARYASOF 12/31/03
Total return of Class 2 shares represents the average annual change in value, assuming reinvestment of dividends and capital gains. Average returns smooth out variations in returns, which can be significant; they are not the same as year-by-year results.
Templeton Foreign Securities Fund – Class 2*
Periods ended 12/31/03
| | | | | | |
| | | 1-Year | | 5-Year | | 10-Year |
|
| | | |
Average Annual Total Return | | +32.21% | | +1.70% | | +6.60% |
*Performance prior to the 5/1/00 merger reflects the historical performance of Templeton International Fund. Additionally, because Class 2 shares were not offered until 5/1/97, standardized Class 2 Fund performance for prior periods represents the historical results of Class 1 shares. For periods beginning on 5/1/97, Class 2’s results reflect an additional 12b-1 fee expense, which also affects future performance. Since 5/1/97 (effective date), the average annual total return of Class 2 shares was +4.00%.
Ongoing market volatility can significantly affect short-term performance; recent returns may differ.
Total Return Index Comparison
for Hypothetical $10,000 Investment (1/1/94–12/31/03)
The graph compares the performance of Templeton Foreign Securities Fund – Class 2* and the MSCI EAFE Index. One cannot invest directly in an index, nor is an index representative of the Fund’s portfolio. Please see Important Notes to Performance Information preceding the Fund Summaries.
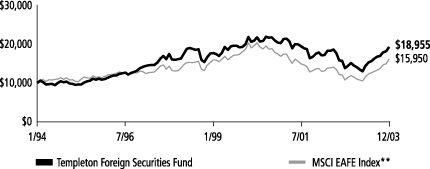
**Source: Standard & Poor’s Micropal. Please see Index Descriptions following the Fund Summaries.
Templeton Foreign Securities Fund – Class 2
Performance reflects the Fund’s Class 2 operating expenses, but does not include any contract fees, expenses or sales charges. If they had been included, performance would be lower. These charges and deductions, particularly for variable life policies, can have a significant effect on contract values and insurance benefits. See the contract prospectus for a complete description of these expenses, including sales charges.
Since markets can go down as well as up, investment return and the value of your principal will fluctuate with market conditions, and you may have a gain or loss when you sell your shares.
TF-4
Past performance does not guarantee future results.
FRANKLIN TEMPLETON VARIABLE INSURANCE PRODUCTS TRUST
TEMPLETON FOREIGN SECURITIES FUND
Financial Highlightsa
| | | | | | | | | | | | | | | | | | | | |
| | | Class 1
| |
| | | Year Ended December 31,
| |
| | | 2003 | | | 2002 | | | 2001 | | | 2000 | | | 1999 | |
| | |
|
|
|
Per share operating performance | | | | | | | | | | | | | | | | | | | | |
(for a share outstanding throughout the year) | | | | | | | | | | | | | | | | | | | | |
| | | | | |
Net asset value, beginning of year | | $ | 9.51 | | | $ | 11.85 | | | $ | 18.78 | | | $ | 22.25 | | | $ | 20.69 | |
| | |
|
|
|
Income from investment operations: | | | | | | | | | | | | | | | | | | | | |
Net investment incomeb | | | .19 | | | | .22 | | | | .23 | | | | .40 | | | | .33 | |
Net realized and unrealized gains (losses) | | | 2.87 | | | | (2.37 | ) | | | (5.23 | ) | | | (.95 | ) | | | 3.78 | |
| | |
|
|
|
Total from investment operations | | | 3.06 | | | | (2.15 | ) | | | (5.00 | ) | | | (.55 | ) | | | 4.11 | |
| | |
|
|
|
Less distributions from: | | | | | | | | | | | | | | | | | | | | |
Net investment income | | | (.20 | ) | | | (.19 | ) | | | (.26 | ) | | | (.43 | ) | | | (.57 | ) |
Net realized gains | | | — | | | | — | | | | (1.67 | ) | | | (2.49 | ) | | | (1.98 | ) |
| | |
|
|
|
Total distributions | | | (.20 | ) | | | (.19 | ) | | | (1.93 | ) | | | (2.92 | ) | | | (2.55 | ) |
| | |
|
|
|
Net asset value, end of year | | $ | 12.37 | | | $ | 9.51 | | | $ | 11.85 | | | $ | 18.78 | | | $ | 22.25 | |
| | |
|
|
|
| | | | | |
Total returnc | | | 32.55% | | | | (18.40)% | | | | (15.75)% | | | | (2.19)% | | | | 23.61% | |
Ratios/supplemental data | | | | | | | | | | | | | | | | | | | | |
Net assets, end of year (000’s) | | $ | 472,665 | | | $ | 397,420 | | | $ | 565,220 | | | $ | 776,495 | | | $ | 1,056,798 | |
Ratios to average net assets: | | | | | | | | | | | | | | | | | | | | |
Expenses | | | .87% | | | | .88% | | | | .90% | | | | .87% | | | | .85% | |
Net investment income | | | 1.81% | | | | 1.97% | | | | 1.59% | | | | 2.08% | | | | 1.69% | |
Portfolio turnover rate | | | 18.01% | | | | 28.12% | | | | 20.00% | | | | 32.81% | | | | 30.04% | |
| a | Financial highlights presented reflect historical financial information from Templeton Variable Products Series Fund (TVP) - Templeton International Securities Fund as a result of a merger May 1, 2000. |
| b | Based on average daily shares outstanding. |
| c | Total return does not include any fees, charges or expenses imposed by the variable annuity and life insurance contracts for which the Franklin Templeton Variable Insurance Products Trust serves as an underlying investment vehicle. Total return is not annualized for periods less than one year. |
TF-5
FRANKLIN TEMPLETON VARIABLE INSURANCE PRODUCTS TRUST
TEMPLETON FOREIGN SECURITIES FUND
Financial Highlightsa (continued)
| | | | | | | | | | | | | | | | | | | | |
| | | Class 2
| |
| | | Year Ended December 31,
| |
| | | 2003 | | | 2002 | | | 2001 | | | 2000 | | | 1999 | |
| | |
|
|
|
Per share operating performance | | | | | | | | | | | | | | | | | | | | |
(for a share outstanding throughout the year) | | | | | | | | | | | | | | | | | | | | |
| | | | | |
Net asset value, beginning of year | | $ | 9.42 | | | $ | 11.74 | | | $ | 18.67 | | | $ | 22.13 | | | $ | 20.61 | |
| | |
|
|
|
Income from investment operations: | | | | | | | | | | | | | | | | | | | | |
Net investment incomeb | | | .15 | | | | .17 | | | | .18 | | | | .31 | | | | .25 | |
Net realized and unrealized gains (losses) | | | 2.85 | | | | (2.32 | ) | | | (5.21 | ) | | | (.90 | ) | | | 3.78 | |
| | |
|
|
|
Total from investment operations | | | 3.00 | | | | (2.15 | ) | | | (5.03 | ) | | | (.59 | ) | | | 4.03 | |
| | |
|
|
|
Less distributions from: | | | | | | | | | | | | | | | | | | | | |
Net investment income | | | (.18 | ) | | | (.17 | ) | | | (.23 | ) | | | (.38 | ) | | | (.53 | ) |
Net realized gains | | | — | | | | — | | | | (1.67 | ) | | | (2.49 | ) | | | (1.98 | ) |
| | |
|
|
|
Total distributions | | | (.18 | ) | | | (.17 | ) | | | (1.90 | ) | | | (2.87 | ) | | | (2.51 | ) |
| | |
|
|
|
Net asset value, end of year | | $ | 12.24 | | | $ | 9.42 | | | $ | 11.74 | | | $ | 18.67 | | | $ | 22.13 | |
| | |
|
|
|
| | | | | |
Total returnc | | | 32.21% | | | | (18.56)% | | | | (15.99)% | | | | (2.38)% | | | | 23.23% | |
Ratios/supplemental data | | | | | | | | | | | | | | | | | | | | |
Net assets, end of year (000’s) | | $ | 653,594 | | | $ | 299,760 | | | $ | 225,505 | | | $ | 187,115 | | | $ | 101,365 | |
Ratios to average net assets: | | | | | | | | | | | | | | | | | | | | |
Expenses | | | 1.12% | | | | 1.13% | | | | 1.15% | | | | 1.12% | | | | 1.10% | |
Net investment income | | | 1.56% | | | | 1.72% | | | | 1.32% | | | | 1.66% | | | | 1.26% | |
Portfolio turnover rate | | | 18.01% | | | | 28.12% | | | | 20.00% | | | | 32.81% | | | | 30.04% | |
| a | Financial highlights presented reflect historical financial information from Templeton Variable Products Series Fund (TVP) - Templeton International Fund a result of a merger May 1, 2000. |
| b | Based on average daily shares outstanding. |
| c | Total return does not include any fees, charges or expenses imposed by the variable annuity and life insurance contracts for which the Franklin Templeton Variable Insurance Products Trust serves as an underlying investment vehicle. Total return is not annualized for periods less than one year. |
See notes to financial statements.
TF-6
FRANKLIN TEMPLETON VARIABLE INSURANCE PRODUCTS TRUST
TEMPLETON FOREIGN SECURITIES FUND
Statement of Investments, December 31, 2003
| | | | | | | |
| | | COUNTRY | | SHARES | | VALUE |
|
Common Stocks 82.4% | | | | | | | |
Aerospace & Defense .9% | | | | | | | |
BAE Systems PLC | | United Kingdom | | 3,544,411 | | $ | 10,675,555 |
| | | | | | |
|
|
Air Freight & Couriers 1.2% | | | | | | | |
Deutsche Post AG | | Germany | | 677,613 | | | 13,948,845 |
| | | | | | |
|
|
Airlines .7% | | | | | | | |
Qantas Airways Ltd. | | Australia | | 3,060,000 | | | 7,585,272 |
| | | | | | |
|
|
Auto Components 4.2% | | | | | | | |
Autoliv Inc., SDR | | Sweden | | 393,611 | | | 14,934,166 |
Denso Corp. | | Japan | | 1,044,800 | | | 20,570,383 |
Michelin SA, B | | France | | 266,820 | | | 12,243,834 |
| | | | | | |
|
|
| | | | | | | | 47,748,383 |
| | | | | | |
|
|
Automobiles .9% | | | | | | | |
Volkswagen AG | | Germany | | 181,815 | | | 10,170,907 |
| | | | | | |
|
|
Banks 6.2% | | | | | | | |
Abbey National PLC | | United Kingdom | | 628,800 | | | 5,977,208 |
DBS Group Holdings Ltd. | | Singapore | | 662,000 | | | 5,730,083 |
DBS Group Holdings Ltd., 144A | | Singapore | | 650,000 | | | 5,626,215 |
HSBC Holdings PLC | | Hong Kong | | 147,855 | | | 2,332,969 |
Kookmin Bank, ADR | | South Korea | | 314,560 | | | 11,902,950 |
Lloyds TSB Group PLC | | United Kingdom | | 1,387,500 | | | 11,127,620 |
Nordea AB, FDR | | Sweden | | 2,135,083 | | | 15,943,102 |
UBS AG | | Switzerland | | 161,000 | | | 11,026,238 |
| | | | | | |
|
|
| | | | | | | | 69,666,385 |
| | | | | | |
|
|
Biotechnology .4% | | | | | | | |
aCellTech Group PLC | | United Kingdom | | 630,000 | | | 4,263,082 |
| | | | | | |
|
|
Chemicals 2.9% | | | | | | | |
Akzo Nobel NV | | Netherlands | | 329,003 | | | 12,698,652 |
BASF AG | | Germany | | 184,669 | | | 10,423,736 |
Bayer AG, Br. | | Germany | | 333,400 | | | 9,840,515 |
| | | | | | |
|
|
| | | | | | | | 32,962,903 |
| | | | | | |
|
|
Commercial Services & Supplies 1.6% | | | | | | | |
Adecco SA | | Switzerland | | 86,100 | | | 5,534,627 |
Securitas AB, B | | Sweden | | 809,980 | | | 10,919,358 |
Societe BIC SA | | France | | 23,250 | | | 1,074,521 |
| | | | | | |
|
|
| | | | | | | | 17,528,506 |
| | | | | | |
|
|
Computers & Peripherals .8% | | | | | | | |
NEC Corp. | | Japan | | 1,058,000 | | | 7,789,139 |
Seiko Epson Corp., 144A | | Japan | | 14,800 | | | 690,491 |
| | | | | | |
|
|
| | | | | | | | 8,479,630 |
| | | | | | |
|
|
Construction Materials .7% | | | | | | | |
Cemex SA, ADR | | Mexico | | 315,900 | | | 8,276,580 |
| | | | | | |
|
|
Diversified Financials 3.8% | | | | | | | |
Housing Development Finance Corp. Ltd. | | India | | 41,040 | | | 579,597 |
ING Groep NV | | Netherlands | | 450,610 | | | 10,509,308 |
Nomura Holdings Inc. | | Japan | | 525,730 | | | 8,952,666 |
TF-7
FRANKLIN TEMPLETON VARIABLE INSURANCE PRODUCTS TRUST
TEMPLETON FOREIGN SECURITIES FUND
Statement of Investments, December 31, 2003 (cont.)
| | | | | | | |
| | | COUNTRY | | SHARES | | VALUE |
|
Common Stocks (cont.) | | | | | | | |
Diversified Financials (cont.) | | | | | | | |
Rodamco Europe NV | | Netherlands | | 164,000 | | $ | 9,550,807 |
Swire Pacific Ltd., B | | Hong Kong | | 12,648,627 | | | 13,359,620 |
| | | | | | |
|
|
| | | | | | | | 42,951,998 |
| | | | | | |
|
|
Diversified Telecommunication Services 6.8% | | | | | | | |
BCE Inc. | | Canada | | 410,160 | | | 9,172,857 |
Chunghwa Telecom Co. Ltd., ADR | | Taiwan | | 472,300 | | | 6,848,350 |
KT Corp., ADR | | South Korea | | 420,880 | | | 8,026,182 |
Nippon Telegraph & Telephone Corp. | | Japan | | 4,236 | | | 20,434,935 |
Telecom Corp. of New Zealand Ltd. | | New Zealand | | 2,964,626 | | | 10,452,325 |
Telefonica SA, ADR | | Spain | | 247,113 | | | 10,919,923 |
Telefonos de Mexico SA de CV (Telmex), L, ADR | | Mexico | | 333,129 | | | 11,003,251 |
| | | | | | |
|
|
| | | | | | | | 76,857,823 |
| | | | | | |
|
|
Electric Utilities 3.7% | | | | | | | |
E. On AG | | Germany | | 142,653 | | | 9,344,059 |
Endesa SA | | Spain | | 547,398 | | | 10,529,540 |
Hong Kong Electric Holdings Ltd. | | Hong Kong | | 1,800,000 | | | 7,117,832 |
Iberdrola SA, Br. | | Spain | | 528,222 | | | 10,440,513 |
Korea Electric Power Corp. | | South Korea | | 250,000 | | | 4,490,139 |
| | | | | | |
|
|
| | | | | | | | 41,922,083 |
| | | | | | |
|
|
Electrical Equipment .8% | | | | | | | |
Kidde PLC | | United Kingdom | | 2,724,071 | | | 5,193,490 |
Vestas Wind Systems AS | | Denmark | | 261,605 | | | 4,254,353 |
| | | | | | |
|
|
| | | | | | | | 9,447,843 |
| | | | | | |
|
|
Electronic Equipment & Instruments 1.2% | | | | | | | |
Hitachi Ltd. | | Japan | | 2,213,867 | | | 13,344,761 |
| | | | | | |
|
|
Energy Equipment & Services .6% | | | | | | | |
IHC Caland NV | | Netherlands | | 115,874 | | | 6,284,791 |
| | | | | | |
|
|
Food & Drug Retailing .9% | | | | | | | |
J Sainsbury PLC | | United Kingdom | | 1,830,860 | | | 10,250,469 |
| | | | | | |
|
|
Food Products 2.6% | | | | | | | |
Cadbury Schweppes PLC | | United Kingdom | | 1,300,000 | | | 9,547,359 |
Nestle SA | | Switzerland | | 51,790 | | | 12,939,648 |
Unilever PLC | | United Kingdom | | 728,934 | | | 6,795,302 |
| | | | | | |
|
|
| | | | | | | | 29,282,309 |
| | | | | | |
|
|
Health Care Equipment & Supplies 1.1% | | | | | | | |
Amersham PLC | | United Kingdom | | 918,222 | | | 12,697,875 |
| | | | | | |
|
|
Health Care Providers & Services .7% | | | | | | | |
Mayne Group Ltd. | | Australia | | 3,390,208 | | | 8,327,176 |
| | | | | | |
|
|
Household Durables 3.2% | | | | | | | |
Koninklijke Philips Electronics NV | | Netherlands | | 576,739 | | | 16,840,953 |
Sony Corp. | | Japan | | 560,854 | | | 19,415,586 |
| | | | | | |
|
|
| | | | | | | | 36,256,539 |
| | | | | | |
|
|
TF-8
FRANKLIN TEMPLETON VARIABLE INSURANCE PRODUCTS TRUST
TEMPLETON FOREIGN SECURITIES FUND
Statement of Investments, December 31, 2003 (cont.)
| | | | | | | |
| | | COUNTRY | | SHARES | | VALUE |
|
Common Stocks (cont.) | | | | | | | |
Industrial Conglomerates 2.2% | | | | | | | |
Hutchison Whampoa Ltd. | | Hong Kong | | 1,962,000 | | $ | 14,468,095 |
Smiths Group PLC | | United Kingdom | | 837,500 | | | 9,910,089 |
| | | | | | |
|
|
| | | | | | | | 24,378,184 |
| | | | | | |
|
|
Insurance 7.2% | | | | | | | |
Ace Ltd. | | Bermuda | | 337,803 | | | 13,991,800 |
AXA SA | | France | | 479,792 | | | 10,270,018 |
AXA SA, 144A | | France | | 40,480 | | | 866,480 |
aPICC Property & Casualty Co. Ltd., 144A | | China | | 330,000 | | | 147,709 |
Sampo OYJ, A | | Finland | | 1,292,550 | | | 13,368,958 |
Sompo Japan Insurance Inc. | | Japan | | 1,694,000 | | | 13,925,670 |
Swiss Reinsurance Co. | | Switzerland | | 235,318 | | | 15,887,652 |
XL Capital Ltd., A | | Bermuda | | 162,428 | | | 12,596,291 |
| | | | | | |
|
|
| | | | | | | | 81,054,578 |
| | | | | | |
|
|
IT Consulting & Services .5% | | | | | | | |
Satyam Computers Services Ltd. | | India | | 728,666 | | | 5,866,859 |
| | | | | | |
|
|
Machinery 1.0% | | | | | | | |
Volvo AB, B | | Sweden | | 369,264 | | | 11,290,437 |
| | | | | | |
|
|
Media 2.2% | | | | | | | |
Reed Elsevier NV | | Netherlands | | 877,400 | | | 10,901,097 |
Reuters Group PLC | | United Kingdom | | 1,842,300 | | | 7,750,318 |
Wolters Kluwer NV | | Netherlands | | 380,280 | | | 5,947,871 |
| | | | | | |
|
|
| | | | | | | | 24,599,286 |
| | | | | | |
|
|
Metals & Mining 3.0% | | | | | | | |
Alcan Inc. | | Canada | | 55,334 | | | 2,652,235 |
Barrick Gold Corp. | | Canada | | 330,494 | | | 7,496,056 |
BHP Billiton Ltd. | | Australia | | 1,338,050 | | | 12,289,377 |
POSCO, ADR | | South Korea | | 331,100 | | | 11,247,467 |
| | | | | | |
|
|
| | | | | | | | 33,685,135 |
| | | | | | |
|
|
Multi-Utilities 1.1% | | | | | | | |
National Grid Transco PLC | | United Kingdom | | 736,100 | | | 5,274,235 |
Suez SA | | France | | 354,000 | | | 7,113,042 |
| | | | | | |
|
|
| | | | | | | | 12,387,277 |
| | | | | | |
|
|
Oil & Gas 5.9% | | | | | | | |
BP PLC | | United Kingdom | | 1,647,720 | | | 13,362,044 |
Eni SpA | | Italy | | 845,840 | | | 15,960,856 |
Repsol YPF SA | | Spain | | 723,515 | | | 14,108,907 |
Shell Transport & Trading Co. PLC | | United Kingdom | | 1,679,653 | | | 12,493,436 |
Total SA, B | | France | | 54,077 | | | 10,054,175 |
| | | | | | |
|
|
| | | | | | | | 65,979,418 |
| | | | | | |
|
|
Paper & Forest Products 2.1% | | | | | | | |
Stora Enso OYJ, R | | Finland | | 671,830 | | | 9,010,270 |
UPM-Kymmene Corp. | | Finland | | 764,284 | | | 14,576,153 |
| | | | | | |
|
|
| | | | | | | | 23,586,423 |
| | | | | | |
|
|
TF-9
FRANKLIN TEMPLETON VARIABLE INSURANCE PRODUCTS TRUST
TEMPLETON FOREIGN SECURITIES FUND
Statement of Investments, December 31, 2003 (cont.)
| | | | | | | | |
| | | COUNTRY | | SHARES | | | VALUE |
|
Common Stocks (cont.) | | | | | | | | |
Pharmaceuticals 4.4% | | | | | | | | |
Aventis SA | | France | | 266,548 | | | $ | 17,617,451 |
GlaxoSmithKline PLC | | United Kingdom | | 514,900 | | | | 11,798,428 |
Ono Pharmaceutical Co. Ltd. | | Japan | | 299,000 | | | | 11,243,539 |
aShire Pharmaceuticals Group PLC | | United Kingdom | | 928,000 | | | | 9,012,370 |
| | | | | | | |
|
|
| | | | | | | | | 49,671,788 |
| | | | | | | |
|
|
Real Estate 1.5% | | | | | | | | |
Cheung Kong Holdings Ltd. | | Hong Kong | | 2,086,137 | | | | 16,592,684 |
| | | | | | | |
|
|
Road & Rail .5% | | | | | | | | |
East Japan Railway Co. | | Japan | | 1,100 | | | | 5,183,354 |
| | | | | | | |
|
|
Semiconductors & Semiconductor Equipment 2.4% | | | | | | | | |
ASM Pacific Technology Ltd. | | Hong Kong | | 252,500 | | | | 1,105,802 |
Samsung Electronics Co. Ltd. | | South Korea | | 54,850 | | | | 20,761,519 |
aTaiwan Semiconductor Manufacturing Co. | | Taiwan | | 2,494,800 | | | | 4,666,268 |
| | | | | | | |
|
|
| | | | | | | | | 26,533,589 |
| | | | | | | |
|
|
Software 1.7% | | | | | | | | |
aCheck Point Software Technologies Ltd. | | Israel | | 268,550 | | | | 4,517,011 |
Nintendo Co. Ltd. | | Japan | | 163,000 | | | | 15,209,480 |
| | | | | | | |
|
|
| | | | | | | | | 19,726,491 |
| | | | | | | |
|
|
Wireless Telecommunication Services .8% | | | | | | | | |
China Mobile (Hong Kong) Ltd., fgn. | | China | | 2,932,000 | | | | 9,007,187 |
| | | | | | | |
|
|
Total Common Stocks (Cost $763,745,208) | | | | | | | | 928,472,405 |
| | | | | | | |
|
|
Preferred Stocks 1.1% | | | | | | | | |
Cia Vale do Rio Doce, A, ADR, pfd. | | Brazil | | 132,792 | | | | 6,840,116 |
Volkswagen AG, pfd. | | Germany | | 160,254 | | | | 5,841,752 |
| | | | | | | |
|
|
Total Preferred Stocks (Cost $8,049,893) | | | | | | | | 12,681,868 |
| | | | | | | |
|
|
| | | | | PRINCIPAL
AMOUNTSc | | | |
| | | | |
|
| | | |
Convertible Bonds .1% | | | | | | | | |
Axa SA, cvt., zero cpn., 12/21/04 | | France | | 29,987 | EUR | | | 604,808 |
Axa SA, cvt., 144A, zero cpn., 12/21/04 | | France | | 2,530 | EUR | | | 51,028 |
| | | | | | | |
|
|
Total Convertible Bonds (Cost $485,675) | | | | | | | | 655,836 |
| | | | | | | |
|
|
Total Long Term Investments (Cost $772,280,776) | | | | | | | | 941,810,109 |
| | | | | | | |
|
|
| | | | | SHARES | | | |
| | | | |
|
| | | |
Short Term Investments (Cost $176,523,500) 15.7% | | | | | | | | |
bFranklin Institutional Fiduciary Trust Money Market Portfolio | | United States | | 176,523,500 | | | | 176,523,500 |
| | | | | | | |
|
|
Total Investments (Cost $948,804,276) 99.3% | | | | | | | | 1,118,333,609 |
Other Assets, less Liabilities .7% | | | | | | | | 7,925,852 |
| | | | | | | |
|
|
Net Assets 100.0% | | | | | | | $ | 1,126,259,461 |
| | | | | | | |
|
|
Currency Abbreviations:
EUR - Euro
| b | See Note 6 regarding investments in the Franklin Institutional Fiduciary Trust Money Market Portfolio. |
| c | The principal amount is stated in US dollars unless otherwise indicated. |
See notes to financial statements.
TF-10
FRANKLIN TEMPLETON VARIABLE INSURANCE PRODUCTS TRUST
TEMPLETON FOREIGN SECURITIES FUND
Financial Statements
Statement of Assets and Liabilities
December 31, 2003
| | | | |
Assets: | | | | |
Investments in securities: | | | | |
Cost | | $ | 948,804,276 | |
| | |
|
|
|
Value | | | 1,118,333,609 | |
Cash | | | 77,965 | |
Foreign currency, at value (cost $7,986,229) | | | 8,104,073 | |
Receivables: | | | | |
Capital shares sold | | | 1,243,792 | |
Dividends and interest | | | 1,653,004 | |
| | |
|
|
|
Total assets | | | 1,129,412,443 | |
| | |
|
|
|
Liabilities: | | | | |
Payables: | | | | |
Investment securities purchased | | | 455,400 | |
Capital shares redeemed | | | 871,002 | |
Affiliates | | | 936,118 | |
Deferred tax liability (Note 1f) | | | 624,409 | |
Other liabilities | | | 266,053 | |
| | |
|
|
|
Total liabilities | | | 3,152,982 | |
| | |
|
|
|
Net assets, at value | | $ | 1,126,259,461 | |
| | |
|
|
|
Net assets consist of: | | | | |
Undistributed net investment income | | $ | 13,972,294 | |
Net unrealized appreciation (depreciation) | | | 169,136,446 | |
Accumulated net realized gain (loss) | | | (146,674,699 | ) |
Capital shares | | | 1,089,825,420 | |
| | |
|
|
|
Net assets, at value | | $ | 1,126,259,461 | |
| | |
|
|
|
Class 1: | | | | |
Net assets, at value | | $ | 472,665,174 | |
| | |
|
|
|
Shares outstanding | | | 38,198,511 | |
| | |
|
|
|
Net asset value and offering price per share | | $ | 12.37 | |
| | |
|
|
|
Class 2: | | | | |
Net assets, at value | | $ | 653,594,287 | |
| | |
|
|
|
Shares outstanding | | | 53,391,172 | |
| | |
|
|
|
Net asset value and offering price per share | | $ | 12.24 | |
| | |
|
|
|
See notes to financial statements.
TF-11
FRANKLIN TEMPLETON VARIABLE INSURANCE PRODUCTS TRUST
TEMPLETON FOREIGN SECURITIES FUND
Financial Statements (continued)
Statement of Operations
for the year ended December 31, 2003
| | | | |
Investment income: | | | | |
(net of foreign taxes and fees of $2,708,201) | | | | |
Dividends | | $ | 22,240,216 | |
Interest | | | 11,106 | |
| | |
|
|
|
Total investment income | | | 22,251,322 | |
| | |
|
|
|
Expenses: | | | | |
Management fees (Note 3) | | | 5,421,046 | |
Administrative fees (Note 3) | | | 1,100,974 | |
Distribution fees - Class 2 (Note 3) | | | 1,051,609 | |
Transfer agent fees | | | 6,838 | |
Other | | | 725,130 | |
| | |
|
|
|
Total expenses | | | 8,305,597 | |
| | |
|
|
|
Net investment income | | | 13,945,725 | |
| | |
|
|
|
Realized and unrealized gains (losses): | | | | |
Net realized gain (loss) from: | | | | |
Investments | | | (31,135,006 | ) |
Foreign currency transactions | | | 43,941 | |
| | |
|
|
|
Net realized gain (loss) | | | (31,091,065 | ) |
| | |
|
|
|
Net unrealized appreciation (depreciation) on: | | | | |
Investments | | | 272,546,674 | |
Translation of assets and liabilities denominated in foreign currencies | | | 205,168 | |
Deferred taxes (Note 1f) | | | (624,409 | ) |
| | |
|
|
|
Net unrealized appreciation (depreciation) | | | 272,127,433 | |
| | |
|
|
|
Net realized and unrealized gain (loss) | | | 241,036,368 | |
| | |
|
|
|
Net increase (decrease) in net assets resulting from operations | | $ | 254,982,093 | |
| | |
|
|
|
See notes to financial statements.
TF-12
FRANKLIN TEMPLETON VARIABLE INSURANCE PRODUCTS TRUST
TEMPLETON FOREIGN SECURITIES FUND
Financial Statements (continued)
Statements of Changes in Net Assets
for the years ended December 31, 2003 and 2002
| | | | | | | | |
| | | 2003 | | | 2002 | |
| | |
|
|
|
Increase (decrease) in net assets: | | | | | | | | |
Operations: | | | | | | | | |
Net investment income | | $ | 13,945,725 | | | $ | 14,225,614 | |
Net realized gain (loss) from investments and foreign currency transactions | | | (31,091,065 | ) | | | (89,762,160 | ) |
Net unrealized appreciation (depreciation) on investments and translation of assets and liabilities denominated in foreign currencies, and deferred taxes | | | 272,127,433 | | | | (61,179,717 | ) |
| | |
| |
Net increase (decrease) in net assets resulting from operations | | | 254,982,093 | | | | (136,716,263 | ) |
Distributions to shareholders from: | | | | | | | | |
Net investment income: | | | | | | | | |
Class 1 | | | (7,698,069 | ) | | | (8,763,684 | ) |
Class 2 | | | (6,848,227 | ) | | | (4,308,628 | ) |
| | |
| |
Total distributions to shareholders | | | (14,546,296 | ) | | | (13,072,312 | ) |
Capital share transactions: (Note 2) | | | | | | | | |
Class 1 | | | (35,694,170 | ) | | | (64,156,384 | ) |
Class 2 | | | 224,338,382 | | | | 120,399,514 | |
| | |
| |
Total capital share transactions | | | 188,644,212 | | | | 56,243,130 | |
Net increase (decrease) in net assets | | | 429,080,009 | | | | (93,545,445 | ) |
Net assets: | | | | | | | | |
Beginning of year | | | 697,179,452 | | | | 790,724,897 | |
| | |
| |
End of year | | $ | 1,126,259,461 | | | $ | 697,179,452 | |
| | |
| |
Undistributed net investment income included in net assets: | | | | | | | | |
End of year | | $ | 13,972,294 | | | $ | 14,477,229 | |
| | |
|
|
|
See notes to financial statements.
TF-13
FRANKLIN TEMPLETON VARIABLE INSURANCE PRODUCTS TRUST
TEMPLETON FOREIGN SECURITIES FUND
Notes to Financial Statements
1. ORGANIZATION AND SIGNIFICANT ACCOUNTING POLICIES
Franklin Templeton Variable Insurance Products Trust (the Trust) is registered under the Investment Company Act of 1940 as an open-end investment company consisting of twenty-two separate series (the Funds). Templeton Foreign Securities Fund (the Fund) included in this report is diversified. Shares of the Fund are sold only to insurance company separate accounts to fund the benefits of variable life insurance policies or variable annuity contracts. The Fund’s investment objective is capital growth.
The following summarizes the Fund’s significant accounting policies.
a. Security Valuation
Securities listed or traded on a recognized national exchange or NASDAQ are valued at the last reported sales price. Over-the-counter securities and listed securities for which no sale is reported are valued within the range of the latest quoted bid and asked prices. Foreign securities are valued at the close of trading of the foreign exchange or the NYSE, whichever is earlier. If events occur that materially affect the values of securities after the prices or foreign exchange rates are determined, or if market quotations are not readily available, the securities will be valued at fair value as determined following procedures approved by the Board of Trustees.
b. Foreign Currency Translation
Portfolio securities and other assets and liabilities denominated in foreign currencies are translated into U.S. dollars based on the exchange rate of such currencies against U.S. dollars on the date of valuation. Purchases and sales of securities and income items denominated in foreign currencies are translated into U.S. dollars at the exchange rate in effect on the transaction date.
The Fund does not separately report the effect of changes in foreign exchange rates from changes in market prices on securities held. Such changes are included in net realized and unrealized gain or loss from investments.
Realized foreign exchange gains or losses arise from sales of foreign currencies, currency gains or losses realized between the trade and settlement dates on securities transactions and the difference between the recorded amounts of dividends, interest, and foreign withholding taxes and the U.S. dollar equivalent of the amounts actually received or paid. Net unrealized foreign exchange gains and losses arise from changes in foreign exchange rates on foreign denominated assets and liabilities other than investments in securities held at the end of the reporting period.
c. Foreign Currency Contracts
When the Fund purchases or sells foreign securities it may enter into foreign exchange contracts to minimize foreign exchange risk from the trade date to the settlement date of the transactions. A foreign exchange contract is an agreement between two parties to exchange different currencies at an agreed upon exchange rate on a specified date. Realized and unrealized gains and losses are included in the Statement of Operations.
The risks of these contracts include movement in the values of the foreign currencies relative to the U.S. dollar and the possible inability of the counterparties to fulfill their obligations under the contracts.
d. Income Taxes
No provision has been made for income taxes because the Fund’s policy is to qualify as a regulated investment company under the Internal Revenue Code and to distribute substantially all of its taxable income.
TF-14
FRANKLIN TEMPLETON VARIABLE INSURANCE PRODUCTS TRUST
TEMPLETON FOREIGN SECURITIES FUND
Notes to Financial Statements (continued)
1. ORGANIZATION AND SIGNIFICANT ACCOUNTING POLICIES (cont.)
e. Security Transactions, Investment Income, Expenses and Distributions
Security transactions are accounted for on trade date. Realized gains and losses on security transactions are determined on a specific identification basis. Certain income from foreign securities is recorded as soon as information is available to the Fund. Interest income and estimated expenses are accrued daily. Dividend income and distributions to shareholders are recorded on the ex-dividend date.
Common expenses incurred by the Trust are allocated among the Funds based on the ratio of net assets of each Fund to the combined net assets. Other expenses are charged to each fund on a specific identification basis.
Realized and unrealized gains and losses and net investment income, other than class specific expenses, are allocated daily to each class of shares based upon the relative proportion of net assets of each class.
f. Deferred Taxes
The Fund is subject to a tax imposed on net realized gains of securities of certain foreign countries. The Fund records an estimated deferred tax liability for net unrealized gains on these securities as reflected in the accompanying financial statements.
g. Accounting Estimates
The preparation of financial statements in accordance with accounting principles generally accepted in the United States of America requires management to make estimates and assumptions that affect the reported amounts of assets and liabilities at the date of the financial statements and the amounts of income and expense during the reporting period. Actual results could differ from those estimates.
h. Guarantees and Indemnifications
Under the Trust’s organizational documents, its officers and trustees are indemnified against certain liability arising out of the performance of their duties to the Trust. Additionally, in the normal course of business, the Trust enters into contracts with service providers that contain general indemnification clauses. The Trust’s maximum exposure under these arrangements is unknown as this would involve future claims that may be made against the Trust that have not yet occurred. However, based on experience, the Trust expects the risk of loss to be remote.
TF-15
FRANKLIN TEMPLETON VARIABLE INSURANCE PRODUCTS TRUST
TEMPLETON FOREIGN SECURITIES FUND
Notes to Financial Statements (continued)
2. SHARES OF BENEFICIAL INTEREST
The Fund offers two classes of shares: Class 1 and Class 2. Each class of shares differs by its distribution fees, voting rights on matters affecting a single class and its exchange privilege.
At December 31, 2003, there were an unlimited number of shares authorized ($.01 par value). Transactions in the Fund’s shares were as follows:
| | | | | | | | | | | | | | |
| | | Year Ended December 31,
| |
| | | 2003
| | | 2002
| |
| Class 1 Shares: | | Shares
| | | Amount
| | | Shares
| | | Amount
| |
Shares sold | | 4,070,068 | | | $ | 41,441,600 | | | 16,717,042 | | | $ | 179,100,108 | |
Shares issued on mergera | | — | | | | — | | | 1,133,785 | | | | 13,775,492 | |
Shares issued in reinvestment of distributions | | 745,937 | | | | 7,698,069 | | | 754,190 | | | | 8,763,684 | |
Shares redeemed | | (8,386,415 | ) | | | (84,833,839 | ) | | (24,542,240 | ) | | | (265,795,668 | ) |
| | |
| |
Net increase (decrease) | | (3,570,410 | ) | | $ | (35,694,170 | ) | | (5,937,223 | ) | | $ | (64,156,384 | ) |
| | |
|
|
| Class 2 Shares: | | | | | | | | | | | | |
Shares sold | | 77,265,095 | | | $ | 769,052,246 | | | 160,323,831 | | | $ | 1,703,285,592 | |
Shares issued on mergera | | — | | | | — | | | 1,702,025 | | | | 20,475,362 | |
Shares issued in reinvestment of distributions | | 669,785 | | | | 6,848,227 | | | 374,013 | | | | 4,308,628 | |
Shares redeemed | | (56,376,439 | ) | | | (551,562,091 | ) | | (149,780,718 | ) | | | (1,607,670,068 | ) |
| | |
| |
Net increase (decrease) | | 21,558,441 | | | $ | 224,338,382 | | | 12,619,151 | | | $ | 120,399,514 | |
| | |
| |
| a | On May 1, 2002, the Fund acquired the net assets of Templeton International Smaller Companies Fund in a taxable exchange pursuant to a plan of reorganization approved by the Templeton International Smaller Companies Fund shareholders. |
3. TRANSACTIONS WITH AFFILIATES
Certain officers and trustees of the Fund are also officers and/or directors of the following entities:
| | |
| Entity | | Affiliation |
|
Franklin Templeton Services LLC (FT Services) | | Administrative manager |
Templeton Investment Counsel LLC (TIC) | | Investment manager |
Franklin/Templeton Distributors Inc. (Distributors) | | Principal underwriter |
Franklin/Templeton Investor Services LLC (Investor Services) | | Transfer agent |
The Fund pays an investment management fee to TIC based on the average daily net assets of the Fund as follows:
| | |
| Annualized Fee Rate | | Net Assets |
|
| .75% | | First $200 million |
| .675% | | Over $200 million, up to and including $1.3 billion |
| .60% | | Over $1.3 billion |
The Fund pays a business management fees to FT Services based on the average daily net assets of the Fund as follows:
| | |
| Annualized Fee Rate | | Net Assets |
|
| .15% | | First $200 million |
| .135% | | Over $200 million, up to and including $700 million |
| .10% | | Over $700 million, up to and including $1.2 billion |
Fees are further reduced on net assets over $1.2 billion.
The Fund reimburses Distributors up to .25% per year of its average daily net assets of Class 2, for costs incurred in marketing the Fund’s shares.
Investor Services, under terms of an agreement, performs shareholder servicing for the Fund and is not paid by the Fund for the services.
TF-16
FRANKLIN TEMPLETON VARIABLE INSURANCE PRODUCTS TRUST
TEMPLETON FOREIGN SECURITIES FUND
Notes to Financial Statements (continued)
4. INCOME TAXES
At December 31, 2003, the Fund had tax basis capital losses of $146,623,002 which may be carried over to offset future capital gains. Such losses expire as follows:
| | | |
Capital loss carryovers expiring in: | | | |
2009 | | $ | 25,468,205 |
2010 | | | 54,671,097 |
2011 | | | 66,483,700 |
| | |
|
| | | $ | 146,623,002 |
| | |
|
|
At December 31, 2003, the Fund has deferred currency losses occurring subsequent to October 31, 2003 of $51,695. For tax purposes, such losses will be reflected in the year ending December 31, 2004.
The tax character of distributions paid during the years ended December 31, 2003 and 2002, was as follows:
| | | | | | |
| | | 2003
| | 2002
|
Distributions paid from: | | | | | | |
Ordinary income | | $ | 14,546,296 | | $ | 13,072,312 |
Long term capital gains | | | — | | | — |
| | |
|
| | | $ | 14,546,296 | | $ | 13,072,312 |
| | |
|
At December 31, 2003, the cost of investments, net unrealized appreciation (depreciation), undistributed ordinary income and undistributed long term capital gains for income tax purposes were as follows:
| | | | |
Cost of investments | | $ | 949,111,026 | |
| | |
|
|
|
Unrealized appreciation | | $ | 220,505,970 | |
Unrealized depreciation | | | (51,283,387 | ) |
| | |
|
|
|
Net unrealized appreciation (depreciation) | | $ | 169,222,583 | |
| | |
|
|
|
Undistributed ordinary income | | $ | 14,279,043 | |
Undistributed long term capital gains | | | — | |
| | |
|
|
|
Distributable earnings | | $ | 14,279,043 | |
| | |
|
|
|
Net investment income and net realized gains (losses) differ for financial statement and tax purposes primarily due to differing treatments of foreign currency transactions and passive foreign investment company shares.
5. INVESTMENT TRANSACTIONS
Purchases and sales of securities (excluding short-term securities) for the period ended December 31, 2003 aggregated $223,736,214 and $129,917,072, respectively.
6. INVESTMENT IN FRANKLIN INSTITUTIONAL FIDUCIARY TRUST MONEY MARKET PORTFOLIO
The Fund may invest in the Franklin Institutional Fiduciary Trust Money Market Portfolio (the Sweep Money Fund), an open-end investment company managed by Advisers. Management fees paid by the Fund are reduced on assets invested in the Sweep Money Fund, in an amount not to exceed the management fees paid by the Sweep Money Fund. The Fund earned $797,901 of dividend income from investment in the Sweep Money Fund for the period ended December 31, 2003.
TF-17
FRANKLIN TEMPLETON VARIABLE INSURANCE PRODUCTS TRUST
TEMPLETON FOREIGN SECURITIES FUND
Notes to Financial Statements (continued)
7. REGULATORY MATTERS
On February 4, 2004, the Securities Division of the Office of the Secretary of the Commonwealth of Massachusetts filed an administrative complaint against Franklin Resources, Inc. and certain of its subsidiaries (the “Company”), alleging violations of the Massachusetts Uniform Securities Act. The complaint arises from activity that occurred in 2001 during which time an officer of a Company subsidiary was negotiating an agreement with an investor relating to investments in a mutual fund and a hedge fund.
The Company, in addition to other entities within Franklin Templeton Investments, has been named in shareholder class actions related to the matter described above. The Company believes that the claims made in the lawsuit are without merit and it intends to defend vigorously against the allegations. The Company and the Fund may be named in similar civil actions related to the matter described above.
In addition, as part of ongoing investigations by the U.S. Securities and Exchange Commission (the “SEC”), the U.S. Attorney for the Northern District of California, the New York Attorney General, the California Attorney General, the U.S. Attorney for the District of Massachusetts, the Florida Department of Financial Services, and the Commissioner of Securities and the Attorney General of the State of West Virginia, relating to certain practices in the mutual fund industry, including late trading, market timing and sales compensation arrangements, the Company and its subsidiaries, as well as certain current or former executives and employees of the Company, have received requests for information and/or subpoenas to testify or produce documents. The Company and its current employees are providing documents and information in response to these requests and subpoenas. In addition, the Company has responded to requests for similar kinds of information from regulatory authorities in some of the foreign countries where the Company conducts its global asset management business.
The Staff of the SEC has informed the Company that it intends to recommend that the Commission authorize an action against an affiliate of the Fund’s adviser and a senior executive officer relating to the frequent trading issues that are the subject of the SEC’s investigation. These issues were previously disclosed as being under investigation by government authorities and the subject of an internal inquiry by the Company in its Annual Report on Form 10-K and on its public website. The Company currently is in discussions with the SEC Staff in an effort to resolve the issues raised in their investigation. Such discussions are preliminary and the Fund’s management has been advised that the Company cannot predict the likelihood of whether those discussions will result in a settlement and, if so, the terms of such settlement. The impact, if any, of these matters on the Fund is uncertain at this time. If the Company finds that it bears responsibility for any unlawful or improper conduct, it has committed to making the Fund or its shareholders whole, as appropriate.
TF-18
FRANKLIN TEMPLETON VARIABLE INSURANCE PRODUCTS TRUST
TEMPLETON FOREIGN SECURITIES FUND
Independent Auditors’ Report
To the Board of Trustees and Shareholders of
Franklin Templeton Variable Insurance Products Trust
In our opinion, the accompanying statement of assets and liabilities, including the statement of investments, and the related statements of operations and of changes in net assets and the financial highlights present fairly, in all material respects, the financial position of the Templeton Foreign Securities Fund (the Fund) (one of the funds constituting the Franklin Templeton Variable Insurance Products Trust) at December 31, 2003, the results of its operations for the year then ended, the changes in its net assets for each of the two years in the period then ended and the financial highlights for each of the periods presented, in conformity with accounting principles generally accepted in the United States of America. These financial statements and financial highlights (hereafter referred to as “financial statements”) are the responsibility of the Fund’s management; our responsibility is to express an opinion on these financial statements based on our audits. We conducted our audits of these financial statements in accordance with auditing standards generally accepted in the United States of America, which require that we plan and perform the audits to obtain reasonable assurance about whether the financial statements are free of material misstatement. An audit includes examining, on a test basis, evidence supporting the amounts and disclosures in the financial statements, assessing the accounting principles used and significant estimates made by management, and evaluating the overall financial statement presentation. We believe that our audits, which included confirmation of securities at December 31, 2003 by correspondence with the custodian and brokers, provide a reasonable basis for our opinion.
PricewaterhouseCoopers LLP
San Francisco, California
February 5, 2004, except for Note 7 as to which the date is February 12, 2004
TF-19
FRANKLIN TEMPLETON VARIABLE INSURANCE PRODUCTS TRUST
TEMPLETON FOREIGN SECURITIES FUND
Tax Designation (unaudited)
At December 31, 2003, more than 50% of the Fund’s total assets were invested in securities of foreign issuers. In most instances, foreign taxes were withheld from dividends paid to the Fund on these investments. The Fund elects to treat foreign taxes paid under Section 853 of the Internal Revenue Code. This election will allow shareholders of record in June 2004, to treat their proportionate share of foreign taxes paid by the Fund as having been paid directly by them. The shareholder shall consider these amounts as foreign taxes paid in the tax year in which they receive the Fund distribution.
The foreign tax information will be disclosed in the June 30, 2004, semi-annual report of the Fund.
TF-20
TEMPLETON GLOBAL ASSET ALLOCATION FUND
Fund Goal and Primary Investments: Templeton Global Asset Allocation Fund seeks high total return. The Fund will invest in equity securities of companies of any country, debt securities of companies and governments of any country, and in money market instruments. The Fund may invest in lower-rated “junk bonds.”
We are pleased to bring you Templeton Global Asset Allocation Fund’s annual report covering the fiscal year ended December 31, 2003.
Performance Overview
You can find the Fund’s one-year total return in the Performance Summary following this report. The Fund underperformed its broad equity benchmark, the Morgan Stanley Capital International (MSCI) All Country World Free Index, which returned 34.63% for the year under review, and it outperformed its fixed income benchmark, the J.P. Morgan Global Government Bond Index (JPM GGBI), which returned 14.51% for the same period.1
Economic and Market Overview
In spring 2003, the end of major conflict in Iraq coincided with the start of a global equity market rally that produced the strongest annual total returns since 1986. The rally’s main catalyst was an improving global economy, underpinned by expansionary fiscal and monetary policies, corporate restructuring and consolidation, and more than two years of declining equity valuations that created potential opportunities in Asia, Europe and the Americas.
In many countries, including the U.S., China and Japan, gross domestic product (GDP) growth accelerated in 2003, particularly in the second half of the year. In the U.S., GDP grew at annualized rates of 3.1% and 8.2% in the second and third quarters. Over the same periods, consumer spending rose at annualized rates of 3.3% and 6.9% spurred largely by tax cuts, car-buying incentives and mortgage refinancing, as interest rates remained at the lowest level in more than four decades. Industrial production increased in the U.S., China, Japan and South Korea in the second half of the year, as did consumer sentiment in the U.S., U.K., Germany and Sweden, and business sentiment in the U.S., Australia, Germany and Japan. In short, a synchronized global economic recovery gained momentum in the second half of 2003.
1. Sources: Standard & Poor’s Micropal; J.P. Morgan. One cannot invest directly in an index, nor is an index representative of the Fund’s portfolio. Please see Index Descriptions following the Fund Summaries.
TGA-1
Further evidence of this recovery was the continued rise in the prices of base metals and other commodities. This was due, in part, to greater demand in China. On December 31, 2003, contracts for aluminum and other metals such as silver, gold, copper and zinc were anywhere from 19% to 50% higher than 12 months before.2 While gold crossed the $400-an-ounce threshold for the first time in more than seven years, such agricultural commodities as cotton and soybeans gained approximately 40%.2 Despite rising commodities prices, global inflation remained subdued throughout the year.
In 2003, the value of the U.S. dollar fell against most major currencies, including a 17% decline versus the euro.3 While the decline magnified top-line and earnings-per-share growth in the U.S., it had the opposite effect in Europe. The dollar decline also benefited U.S. investors in international equities because it increased the returns of investments denominated in currencies that appreciated against the dollar, such as the euro. Although the dollar’s decline significantly affected equity market returns, it was not the only reason for the past year’s gains. Equity markets in many countries, including emerging market countries, produced stronger gains than the U.S. equity market, even in their local currencies. These countries benefited from the improving economic and financial market conditions in 2003.
Global bond markets benefited from the low interest rate environment and currency developments as most major currencies appreciated against the U.S. dollar during the reporting period. The euro zone and other European countries had positive short-term yield differentials and stronger balance-of-payment positions relative to the U.S. For example, in contrast to a widening U.S. current account deficit during the year, the euro zone posted a trailing 12-month current account surplus in September 2003. In addition, export growth and current account surpluses supported international reserve accumulation in many countries.
Investment Strategy
Our investment philosophy is bottom-up, value-oriented and long-term. In choosing equity investments, we will focus on the market price of a company’s securities relative to our evaluation of the company’s potential long-term earnings, asset value and cash flow. Among factors we consider are a company’s historical value measures, including price/earnings ratio, profit margins and liquidation value.
2. Source: Reuters, Commodity Research Bureau Index; London Metal Exchange.
3. Source: European Central Bank.
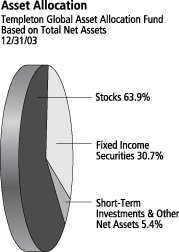
TGA-2
In choosing debt investments, we allocate our assets among issuers, geographic regions and currencies based upon our assessment of relative interest rates among currencies, our outlook for changes in interest rates, and credit risks. With respect to debt securities, we may also from time to time make use of forward currency exchange contracts (Hedging Instruments) for hedging purposes.
Manager’s Discussion
During the 12 months under review, the Fund’s overweighted equity position in the materials sector relative to the MSCI All Country World Free Index benefited performance as that sector outperformed the overall index, and the Fund’s equity holdings in materials posted better overall returns than the index’s overall materials sector return. The Fund’s equity positions in the industrials sector also benefited relative performance because they outperformed the overall index.
Despite the Fund’s double-digit returns, some equity sector positioning dampened performance. Detractors from Fund performance during the year included poor performance from several of the Fund’s consumer staples holdings. The Fund’s underweighted financials sector exposure, despite the outperformance of several of the Fund’s specific financials positions, also hindered overall relative performance because that sector outperformed the overall index for the period.
Regarding the Fund’s income allocation, developed market interest rate movements, currency returns and emerging market bonds, in addition to income, contributed to the Fund’s performance. Monetary easing by certain major central banks around the world provided a positive backdrop for local bond markets and positively impacted the Fund’s performance. Slow economic growth at the beginning of the year, accompanied by heightened geopolitical uncertainty, rising unemployment and disinflationary pressures provided a favorable environment for an accommodative monetary stance at many major central banks.
The U.S. dollar’s depreciation against the euro positively impacted Fund performance during the period, as the euro represented the largest currency exposure of the Fund’s fixed income securities throughout the reporting period. However, currencies from some regions, particularly Asia, did not experience similar appreciation against the U.S. dollar despite larger trade surpluses with the U.S. Consequently, the Fund reallocated some exposure toward the end of the reporting period away from the euro zone and into Asia seeking to position the Fund for
Top 5 Country Holdings
Templeton Global Asset Allocation Fund
Based on Total Net Assets 12/31/03
| | |
|
| |
| U.S. | | 13.1% |
| |
| U.K. | | 7.5% |
| |
| Germany | | 6.8% |
| |
| France | | 6.8% |
| |
| Sweden | | 6.5% |
Top 5 Sectors/Industries
Templeton Global Asset Allocation Fund
Based on Equity Securities 12/31/03
| | |
| | | % of Total
Net Assets |
|
| |
| Diversified Telecommunication Services | | 4.7% |
| |
| Insurance | | 4.7% |
| |
| Pharmaceuticals | | 4.3% |
| |
| Banks | | 3.5% |
| |
| Media | | 3.0% |
The dollar value, number of shares or principal amount, and complete legal titles of all portfolio holdings are listed in the Fund’s Statement of Investments.
TGA-3
potential global economic recovery as well as to take advantage of the discrepancy between currency performance and macroeconomic trends.
The Australian dollar and New Zealand dollar were the top performing developed country currencies, appreciating 25.27% and 20.34%, respectively, against the U.S. dollar during the Fund’s fiscal year, bringing these countries’ bond returns in U.S. dollar terms to 37.32% and 33.75%.4 The Fund’s positions in the two countries contributed positively to the Fund’s performance during the period.
Japan underperformed other developed bond markets in U.S. dollar terms, returning only 9.84% during the year, with 9.69% appreciation of the yen against the U.S. dollar.5 Although Japan benefited during the past year from a cyclical economic recovery and improving export strength, concerns remained about the country’s banking sector health and structural reform progress. We sought exposure to Asia’s cyclical, regional economic recovery through a variety of currencies from the region without exposure to any country-specific risks in Japan.
Thank you for your participation in Templeton Global Asset Allocation Fund. We look forward to serving your future investment needs.
4. Source: JPM GGBI; Citigroup World Government Bond Index.
5. Source: J.P. Morgan Government Bond Index Monitor, December 2003.
This discussion reflects our analysis, opinions and portfolio holdings as of December 31, 2003, the end of the reporting period. The way we implement our main investment strategies and the resulting portfolio holdings may change depending on factors such as market and economic conditions. These opinions may not be relied upon as investment advice or an offer for a particular security. The information is not a complete analysis of every aspect of any market, country, industry, security or the Fund. Statements of fact are from sources considered reliable, but the advisor makes no representation or warranty as to their completeness or accuracy. Although historical performance is no guarantee of future results, these insights may help you understand our investment management philosophy.
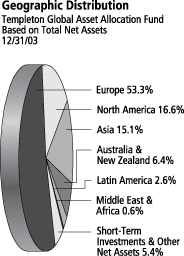
TGA-4
PERFORMANCE SUMMARYASOF 12/31/03
Total return of Class 2 shares represents the average annual change in value, assuming reinvestment of dividends and capital gains. Average returns smooth out variations in returns, which can be significant; they are not the same as year-by-year results.
Templeton Global Asset Allocation Fund – Class 2*
Periods ended 12/31/03
| | | | | | | | |
| | | 1-Year | | 5-Year | | 10-Year | | |
|
| | | | |
Average Annual Total Return | | +31.95% | | +6.85% | | +9.19% | | |
*Performance prior to the 5/1/00 merger reflects the historical performance of Templeton Asset Allocation Fund. Additionally, because Class 2 shares were not offered until 5/1/97, standardized Class 2 Fund performance for prior periods represents the historical results of Class 1 shares. For periods beginning on 5/1/97, Class 2’s results reflect an additional 12b-1 fee expense, which also affects future performance. Since 5/1/97 (effective date), the average annual total return of Class 2 shares was +7.47%.
Ongoing market volatility can significantly affect short-term performance; recent returns may differ.
Total Return Index Comparison for Hypothetical $10,000 Investment (1/1/94–12/31/03)
The graph compares the performance of Templeton Global Asset Allocation Fund – Class 2,* the MSCI All Country World Free Index and the J.P. Morgan Global Government Bond Index. One cannot invest directly in an index, nor is an index representative of the Fund’s portfolio. Please see Important Notes to Performance Information preceding the Fund Summaries.
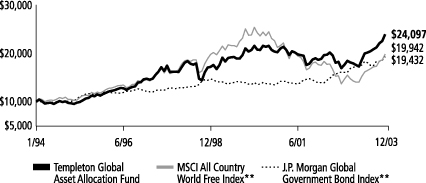
**Sources: Standard & Poor’s Micropal; J.P. Morgan. Please see Index Descriptions following the Fund Summaries.
Templeton Global Asset Allocation Fund – Class 2
Performance reflects the Fund’s Class 2 operating expenses, but does not include any contract fees, expenses or sales charges. If they had been included, performance would be lower. These charges and deductions, particularly for variable life policies, can have a significant effect on contract values and insurance benefits. See the contract prospectus for a complete description of these expenses, including sales charges.
Since markets can go down as well as up, investment return and the value of your principal will fluctuate with market conditions, and you may have a gain or loss when you sell your shares.
Past performance does not guarantee future results.
TGA-5
TEMPLETON GLOBAL ASSET ALLOCATION FUND
FRANKLIN TEMPLETON VARIABLE INSURANCE PRODUCTS TRUST
SUPPLEMENT DATED FEBRUARY 12, 2004
TOTHE PROSPECTUS DATED MAY 1, 2003
The Management section on page TGA-5 is replaced with the following:
Templeton Investment Counsel, LLC (Investment Counsel), Broward Financial Centre, Suite 2100, For Lauderdale, Florida 33394, is the Fund’s investment manager.
Under an agreement with TIC, Franklin Advisers, Inc. (Advisers), One Franklin Parkway, San Mateo, California 94403-1906, is the Fund’s sub-advisor. Advisers provides Investment Counsel with investment management advice and assistance with respect to the Fund’s investments in debt securities.
The team responsible for managing the equity portion of the Fund is:
| | |
| |
Peter A. Nori, CFA EXECUTIVE VICE PRESIDENT/PORTFOLIO MANAGER—RESEARCH ANALYST | | Mr. Nori has managed the equity portion of the Fund since 1996, and has been with Franklin Templeton Investments since 1987. |
| |
Tucker Scott, CFA SENIOR VICE PRESIDENT | | Mr. Scott has managed the equity portion of the Fund since 1998, and has been with Franklin Templeton Investments since 1996. |
| |
Mark R. Beveridge, CFA EXECUTIVE VICE PRESIDENT/PORTFOLIO MANAGER—RESEARCH ANALYST | | Mr. Beveridge has been a manager of the Fund since 2003, and has been with Franklin Templeton Investments since 1985. |
|
The team responsible for managing the bond portion of the Fund is: |
| |
Alexander C. Calvo SENIOR VICE PRESIDENT OF ADVISERS | | Mr. Calvo has managed the bond portion of the Fund since 1998, and has been with Franklin Templeton Investments since 1995. |
| |
Michael Hasenstab, PH.D. PORTFOLIO MANAGER/RESEARCH ANALYST OF ADVISERS | | Dr. Hasenstab has been a manager of the bond portion of the Fund since 2002 and an analyst since 2001. He first joined Franklin Templeton Investments in 1995, rejoining again in 2001 after a three-year leave to obtain his PH.D. |
The Fund pays Investment Counsel a fee for managing the Fund’s assets. For the fiscal year ended December 31, 2002, the management fee, before any reduction, was 0.62% of the Fund’s average daily net assets. Under an agreement by Investment Counsel to reduce its fee to reflect reduced services resulting from the Fund’s investment in a Franklin Templeton money fund, the Fund paid 0.60% of its average daily net assets to Investment Counsel for its services. This reduction is required by the Board and an SEC order.
Please keep this supplement for future reference.
TGA-6
FRANKLIN TEMPLETON VARIABLE INSURANCE PRODUCTS TRUST
TEMPLETON GLOBAL ASSET ALLOCATION FUND
Financial Highlightsa
| | | | | | | | | | | | | | | | | | | | |
| | | Class 1
| |
| | | Year Ended December 31,
| |
| | | 2003 | | | 2002 | | | 2001 | | | 2000 | | | 1999 | |
| | |
|
|
|
Per share operating performance | | | | | | | | | | | | | | | | | | | | |
(For a share outstanding throughout the year) | | | | | | | | | | | | | | | | | | | | |
| | | | | |
Net asset value, beginning of year | | $ | 14.59 | | | $ | 15.51 | | | $ | 19.22 | | | $ | 23.37 | | | $ | 22.46 | |
| | |
|
|
|
Income from investment operations: | | | | | | | | | | | | | | | | | | | | |
Net investment incomeb | | | .41 | | | | .39 | | | | .38 | d | | | .44 | | | | .44 | |
Net realized and unrealized gains (losses) | | | 4.23 | | | | (1.01 | ) | | | (2.16 | )d | | | (.45 | ) | | | 3.78 | |
| | |
|
|
|
Total from investment operations | | | 4.64 | | | | (.62 | ) | | | (1.78 | ) | | | (.01 | ) | | | 4.22 | |
| | |
|
|
|
Less distributions from: | | | | | | | | | | | | | | | | | | | | |
Net investment income | | | (.45 | ) | | | (.30 | ) | | | (.26 | ) | | | (.52 | ) | | | (.50 | ) |
Net realized gains | | | — | | | | — | | | | (1.67 | ) | | | (3.62 | ) | | | (2.81 | ) |
| | |
|
|
|
Total distributions | | | (.45 | ) | | | (.30 | ) | | | (1.93 | ) | | | (4.14 | ) | | | (3.31 | ) |
| | |
|
|
|
Net asset value, end of year | | $ | 18.78 | | | $ | 14.59 | | | $ | 15.51 | | | $ | 19.22 | | | $ | 23.37 | |
| | |
|
|
|
Total returnc | | | 32.31% | | | | (4.17 | )% | | | (9.72 | )% | | | .29% | | | | 22.86% | |
Ratios/supplemental data | | | | | | | | | | | | | | | | | | | | |
Net assets, end of year (000’s) | | $ | 572,798 | | | $ | 425,470 | | | $ | 501,074 | | | $ | 628,244 | | | $ | 671,549 | |
Ratios to average net assets: | | | | | | | | | | | | | | | | | | | | |
Expenses | | | .81% | | | | .81% | | | | .81% | | | | .81% | | | | .74% | |
Net investment income | | | 2.54% | | | | 2.56% | | | | 2.28% | d | | | 2.20% | | | | 2.06% | |
Portfolio turnover rate | | | 34.25% | | | | 27.27% | | | | 35.63% | | | | 30.32% | | | | 45.34% | |
| a | Financial highlights presented reflect historical financial information from Templeton Variable Products Series Fund (TVP)-Templeton Asset Allocation Fund as a result of a merger May 1, 2000. |
| b | Based on average daily shares outstanding. |
| c | Total return does not include any fees, charges or expenses imposed by the variable annuity and life insurance contracts for which the Franklin Templeton Variable Insurance Products Trust serves as an underlying investment vehicle. Total return is not annualized for periods less than one year. |
| d | Effective January 1, 2001, the Fund adopted the provisions of the AICPA Audit and Accounting Guide of Investment Companies and began amortizing all premium and discount on fixed-income securities, as required. The effect of this change was as follows: |
| | |
Net investment income per share | | $(0.018) |
Net realized and unrealized gains per share | | 0.018 |
Ratio of net investment income to average net assets | | (.10)% |
Per share data and ratios for prior periods have not been restated to reflect this change in accounting policy.
TGA-7
FRANKLIN TEMPLETON VARIABLE INSURANCE PRODUCTS TRUST
TEMPLETON GLOBAL ASSET ALLOCATION FUND
Financial Highlightsa (continued)
| | | | | | | | | | | | | | | | | | | | |
| | | Class 2
| |
| | | Year Ended December 31,
| |
| | | 2003 | | | 2002 | | | 2001 | | | 2000 | | | 1999 | |
| | |
|
|
|
Per share operating performance | | | | | | | | | | | | | | | | | | | | |
(For a share outstanding throughout the year | | | | | | | | | | | | | | | | | | | | |
| | | | | |
Net asset value, beginning of year | | $ | 14.49 | | | $ | 15.41 | | | $ | 19.13 | | | $ | 23.27 | | | $ | 22.38 | |
| | |
|
|
|
Income from investment operations: | | | | | | | | | | | | | | | | | | | | |
Net investment incomeb | | | .36 | | | | .34 | | | | 0.33 | d | | | .37 | | | | .36 | |
Net realized and unrealized gains (losses) | | | 4.20 | | | | (1.00 | ) | | | (2.15 | )d | | | (.43 | ) | | | 3.80 | |
| | |
|
|
|
Total from investment operations | | | 4.56 | | | | (.66 | ) | | | (1.82 | ) | | | (.06 | ) | | | 4.16 | |
| | |
|
|
|
Less distributions from: | | | | | | | | | | | | | | | | | | | | |
Net investment income | | | (.41 | ) | | | (.26 | ) | | | (.23 | ) | | | (.46 | ) | | | (.46 | ) |
Net realized gains | | | — | | | | — | | | | (1.67 | ) | | | (3.62 | ) | | | (2.81 | ) |
| | |
|
|
|
Total distributions | | | (.41 | ) | | | (.26 | ) | | | (1.90 | ) | | | (4.08 | ) | | | (3.27 | ) |
| | |
|
|
|
Net asset value, end of year | | $ | 18.64 | | | $ | 14.49 | | | $ | 15.41 | | | $ | 19.13 | | | $ | 23.27 | |
| | |
|
|
|
Total returnc | | | 31.95% | | | | (4.39 | )% | | | (9.95 | )% | | | .04% | | | | 22.54% | |
Ratios/supplemental data | | | | | | | | | | | | | | | | | | | | |
Net assets, end of year (000’s) | | $ | 55,754 | | | $ | 39,926 | | | $ | 38,974 | | | $ | 32,346 | | | $ | 20,962 | |
Ratios to average net assets: | | | | | | | | | | | | | | | | | | | | |
Expenses | | | 1.06% | | | | 1.06% | | | | 1.06% | | | | 1.07% | | | | .99% | |
Net investment income | | | 2.29% | | | | 2.31% | | | | 1.99% | d | | | 1.91% | | | | 1.71% | |
Portfolio turnover rate | | | 34.25% | | | | 27.27% | | | | 35.63% | | | | 30.32% | | | | 45.34% | |
| a | Financial highlights presented reflect historical financial information from Templeton Variable Products Series Fund (TVP)-Templeton Asset Allocation Fund as a result of a merger May 1, 2000. |
| b | Based on average daily shares outstanding. |
| c | Total return does not include any fees, charges or expenses imposed by the variable annuity and life insurance contracts for which the Franklin Templeton Variable Insurance Products Trust serves as an underlying investment vehicle. Total return is not annualized for periods less than one year. |
| d | Effective January 1, 2001, the Fund adopted the provisions of the AICPA Audit and Accounting Guide of Investment Companies and began amortizing all premium and discount on fixed-income securities, as required. The effect of this change was as follows: |
| | |
Net investment income per share | | $(0.018) |
Net realized and unrealized gains per share | | 0.018 |
Ratio of net investment income to average net assets | | (.10)% |
Per share data and ratios for prior periods have not been restated to reflect this change in accounting policy.
See notes to financial statements.
TGA-8
FRANKLIN TEMPLETON VARIABLE INSURANCE PRODUCTS TRUST
TEMPLETON GLOBAL ASSET ALLOCATION FUND
Statement of Investments, December 31, 2003
| | | | | | | |
| | | COUNTRY | | SHARES | | VALUE |
|
Common Stocks 63.5% | | | | | | | |
Aerospace & Defense 2.2% | | | | | | | |
BAE Systems PLC | | United Kingdom | | 153,055 | | $ | 460,992 |
Boeing Co. | | United States | | 116,600 | | | 4,913,524 |
Rolls-Royce Group PLC | | United Kingdom | | 2,733,657 | | | 8,674,043 |
| | | | | | |
|
|
| | | | | | | | 14,048,559 |
| | | | | | |
|
|
Air Freight & Couriers 1.3% | | | | | | | |
Deutsche Post AG | | Germany | | 382,790 | | | 7,879,835 |
| | | | | | |
|
|
Auto Components 1.7% | | | | | | | |
Autoliv Inc., SDR | | Sweden | | 129,000 | | | 4,894,445 |
Valeo SA | | France | | 140,790 | | | 5,638,348 |
| | | | | | |
|
|
| | | | | | | | 10,532,793 |
| | | | | | |
|
|
Automobiles .6% | | | | | | | |
Volkswagen AG | | Germany | | 70,650 | | | 3,952,230 |
| | | | | | |
|
|
Banks 3.5% | | | | | | | |
DBS Group Holdings Ltd. | | Singapore | | 476,000 | | | 4,120,120 |
Kookmin Bank, ADR | | South Korea | | 164,670 | | | 6,231,113 |
Lloyds TSB Group PLC | | United Kingdom | | 343,900 | | | 2,758,046 |
Nordea AB, FDR | | Sweden | | 955,960 | | | 7,138,349 |
UBS AG | | Switzerland | | 29,200 | | | 1,999,790 |
| | | | | | |
|
|
| | | | | | | | 22,247,418 |
| | | | | | |
|
|
Chemicals 2.9% | | | | | | | |
Akzo Nobel NV | | Netherlands | | 63,665 | | | 2,457,302 |
BASF AG | | Germany | | 100,840 | | | 5,691,965 |
Bayer AG, Br. | | Germany | | 109,940 | | | 3,244,950 |
Dow Chemical Co. | | United States | | 156,500 | | | 6,505,705 |
| | | | | | |
|
|
| | | | | | | | 17,899,922 |
| | | | | | |
|
|
Commercial Services & Supplies 1.0% | | | | | | | |
Adecco SA | | Switzerland | | 53,000 | | | 3,406,913 |
R.R. Donnelley & Sons Co. | | United States | | 103,660 | | | 3,125,349 |
| | | | | | |
|
|
| | | | | | | | 6,532,262 |
| | | | | | |
|
|
Computers & Peripherals .4% | | | | | | | |
NEC Corp. | | Japan | | 319,000 | | | 2,348,521 |
Seiko Epson Corp., 144A | | Japan | | 7,500 | | | 349,911 |
| | | | | | |
|
|
| | | | | | | | 2,698,432 |
| | | | | | |
|
|
Containers & Packaging 1.2% | | | | | | | |
Temple-Inland Inc. | | United States | | 117,540 | | | 7,366,232 |
| | | | | | |
|
|
Diversified Financials 2.6% | | | | | | | |
ING Groep NV | | Netherlands | | 312,632 | | | 7,291,329 |
Nomura Holdings Inc. | | Japan | | 244,600 | | | 4,165,298 |
Swire Pacific Ltd., A | | Hong Kong | | 780,000 | | | 4,812,458 |
| | | | | | |
|
|
| | | | | | | | 16,269,085 |
| | | | | | |
|
|
Diversified Telecommunication Services 4.7% | | | | | | | |
Cable & Wireless PLC | | United Kingdom | | 975,500 | | | 2,331,309 |
Chunghwa Telecom Co. Ltd., ADR | | Taiwan | | 141,200 | | | 2,047,400 |
KT Corp., ADR | | South Korea | | 208,260 | | | 3,971,518 |
TGA-9
FRANKLIN TEMPLETON VARIABLE INSURANCE PRODUCTS TRUST
TEMPLETON GLOBAL ASSET ALLOCATION FUND
Statement of Investments, December 31, 2003 (cont.)
| | | | | | | |
| | | COUNTRY | | SHARES | | VALUE |
|
Common Stocks (cont.) | | | | | | | |
Diversified Telecommunication Services (cont.) | | | | | | | |
Nippon Telegraph & Telephone Corp. | | Japan | | 1,152 | | $ | 5,557,376 |
Nippon Telegraph & Telephone Corp., ADR | | Japan | | 5,680 | | | 139,501 |
Telecom Corp. of New Zealand Ltd. | | New Zealand | | 1,772,970 | | | 6,250,927 |
Telefonica SA, ADR | | Spain | | 96,339 | | | 4,257,220 |
Telefonos de Mexico SA de CV (Telmex), L, ADR | | Mexico | | 151,858 | | | 5,015,870 |
| | | | | | |
|
|
| | | | | | | | 29,571,121 |
| | | | | | |
|
|
Electric Utilities 1.6% | | | | | | | |
E.On AG | | Germany | | 92,290 | | | 6,045,181 |
Endesa SA | | Spain | | 122,000 | | | 2,346,746 |
Endesa SA, ADR | | Spain | | 88,000 | | | 1,680,800 |
| | | | | | |
|
|
| | | | | | | | 10,072,727 |
| | | | | | |
|
|
Electrical Equipment .9% | | | | | | | |
Kidde PLC | | United Kingdom | | 1,581,900 | | | 3,015,921 |
Vestas Wind Systems AS | | Denmark | | 148,160 | | | 2,409,452 |
| | | | | | |
|
|
| | | | | | | | 5,425,373 |
| | | | | | |
|
|
Electronic Equipment & Instruments .8% | | | | | | | |
Hitachi Ltd. | | Japan | | 845,000 | | | 5,093,496 |
| | | | | | |
|
|
Finance .7% | | | | | | | |
JP Morgan Chase & Co. | | United States | | 76,000 | | | 2,791,480 |
Morgan Stanley | | United States | | 30,900 | | | 1,788,183 |
| | | | | | |
|
|
| | | | | | | | 4,579,663 |
| | | | | | |
|
|
Food & Drug Retailing 1.0% | | | | | | | |
J Sainsbury PLC | | United Kingdom | | 1,166,200 | | | 6,529,225 |
| | | | | | |
|
|
Food Products 2.7% | | | | | | | |
Cadbury Schweppes PLC | | United Kingdom | | 37,230 | | | 273,422 |
Kraft Foods Inc., A | | United States | | 133,290 | | | 4,294,604 |
Nestle SA | | Switzerland | | 29,910 | | | 7,472,965 |
Unilever PLC | | United Kingdom | | 513,650 | | | 4,788,372 |
| | | | | | |
|
|
| | | | | | | | 16,829,363 |
| | | | | | |
|
|
Health Care Providers & Services .5% | | | | | | | |
aWellpoint Health Networks Inc. | | United States | | 35,030 | | | 3,397,560 |
| | | | | | |
|
|
Household Durables 2.3% | | | | | | | |
Koninklijke Philips Electronics NV | | Netherlands | | 283,767 | | | 8,286,082 |
Sony Corp. | | Japan | | 41,300 | | | 1,429,719 |
Sony Corp., ADR | | Japan | | 136,900 | | | 4,746,323 |
| | | | | | |
|
|
| | | | | | | | 14,462,124 |
| | | | | | |
|
|
Insurance 4.7% | | | | | | | |
Ace Ltd. | | Bermuda | | 101,700 | | | 4,212,414 |
AXA SA | | France | | 316,124 | | | 6,766,680 |
aPICC Property & Casualty Co. Ltd., 144A | | China | | 190,000 | | | 85,044 |
Riunione Adriatica di Sicurta SpA | | Italy | | 387,122 | | | 6,592,012 |
Swiss Reinsurance Co. | | Switzerland | | 95,570 | | | 6,452,472 |
XL Capital Ltd., A | | Bermuda | | 68,810 | | | 5,336,216 |
| | | | | | |
|
|
| | | | | | | | 29,444,838 |
| | | | | | |
|
|
TGA-10
FRANKLIN TEMPLETON VARIABLE INSURANCE PRODUCTS TRUST
TEMPLETON GLOBAL ASSET ALLOCATION FUND
Statement of Investments, December 31, 2003 (cont.)
| | | | | | | |
| | | COUNTRY | | SHARES | | VALUE |
|
Common Stocks (cont.) | | | | | | | |
Internet Software & Services .7% | | | | | | | |
aBearingpoint Inc. | | United States | | 410,000 | | $ | 4,136,900 |
| | | | | | |
|
|
IT Consulting & Services 1.6% | | | | | | | |
aCeridian Corp. | | United States | | 305,700 | | | 6,401,358 |
Satyam Computers Services Ltd. | | India | | 431,198 | | | 3,471,794 |
| | | | | | |
|
|
| | | | | | | | 9,873,152 |
| | | | | | |
|
|
Leisure Equipment & Products .4% | | | | | | | |
Mattel Inc. | | United States | | 131,100 | | | 2,526,297 |
| | | | | | |
|
|
Machinery 1.7% | | | | | | | |
Atlas Copco AB, A | | Sweden | | 199,100 | | | 7,125,242 |
Volvo AB, B | | Sweden | | 124,268 | | | 3,799,558 |
| | | | | | |
|
|
| | | | | | | | 10,924,800 |
| | | | | | |
|
|
Media 3.0% | | | | | | | |
aComcast Corp. | | United States | | 62,636 | | | 2,058,845 |
John Fairfax Holdings Ltd. | | Australia | | 2,021,680 | | | 5,361,779 |
Reed Elsevier NV | | Netherlands | | 501,600 | | | 6,232,038 |
aTime Warner Inc. | | United States | | 110,900 | | | 1,995,091 |
Wolters Kluwer NV | | Netherlands | | 215,741 | | | 3,374,355 |
| | | | | | |
|
|
| | | | | | | | 19,022,108 |
| | | | | | |
|
|
Metals & Mining 1.8% | | | | | | | |
Barrick Gold Corp. | | Canada | | 290 | | | 6,578 |
BHP Billiton Ltd. | | Australia | | 551,100 | | | 5,061,601 |
POSCO, ADR | | South Korea | | 180,000 | | | 6,114,600 |
| | | | | | |
|
|
| | | | | | | | 11,182,779 |
| | | | | | |
|
|
Multi-Utilities 1.2% | | | | | | | |
National Grid Transco PLC | | United Kingdom | | 420,100 | | | 3,010,061 |
Suez SA | | France | | 229,280 | | | 4,607,001 |
| | | | | | |
|
|
| | | | | | | | 7,617,062 |
| | | | | | |
|
|
Multiline Retail .7% | | | | | | | |
Target Corp. | | United States | | 107,000 | | | 4,108,800 |
| | | | | | |
|
|
Oil & Gas 2.9% | | | | | | | |
BP PLC | | United Kingdom | | 206,700 | | | 1,676,216 |
Eni SpA | | Italy | | 307,225 | | | 5,797,283 |
Husky Energy Inc. | | Canada | | 267,350 | | | 4,855,643 |
Shell Transport & Trading Co. PLC | | United Kingdom | | 756,100 | | | 5,623,951 |
| | | | | | |
|
|
| | | | | | | | 17,953,093 |
| | | | | | |
|
|
Paper & Forest Products .9% | | | | | | | |
Stora Enso OYJ, R | | Finland | | 416,260 | | | 5,607,539 |
| | | | | | |
|
|
Pharmaceuticals 4.3% | | | | | | | |
Abbott Laboratories | | United States | | 118,000 | | | 5,498,800 |
Aventis SA | | France | | 109,200 | | | 7,217,558 |
Bristol-Myers Squibb Co. | | United States | | 217,420 | | | 6,218,212 |
GlaxoSmithKline PLC | | United Kingdom | | 119,250 | | | 2,732,497 |
Ono Pharmaceutical Co. Ltd. | | Japan | | 137,000 | | | 5,151,721 |
| | | | | | |
|
|
| | | | | | | | 26,818,788 |
| | | | | | |
|
|
TGA-11
FRANKLIN TEMPLETON VARIABLE INSURANCE PRODUCTS TRUST
TEMPLETON GLOBAL ASSET ALLOCATION FUND
Statement of Investments, December 31,2003 (cont.)
| | | | | | | | |
| | | COUNTRY | | SHARES | | | VALUE |
|
Common Stocks (cont.) | | | | | | | | |
Real Estate 1.3% | | | | | | | | |
Cheung Kong Holdings Ltd. | | Hong Kong | | 1,031,500 | | | $ | 8,204,329 |
| | | | | | | |
|
|
Road & Rail .5% | | | | | | | | |
Nippon Express Co. Ltd. | | Japan | | 660,000 | | | | 3,116,171 |
| | | | | | | |
|
|
Semiconductors & Semiconductor Equipment 1.0% | | | | | | | | |
Samsung Electronics Co. Ltd. | | South Korea | | 16,790 | | | | 6,355,258 |
| | | | | | | |
|
|
Software 2.9% | | | | | | | | |
aBMC Software Inc. | | United States | | 291,900 | | | | 5,443,935 |
aCheck Point Software Technologies Ltd. | | Israel | | 216,000 | | | | 3,633,120 |
Nintendo Co. Ltd. | | Japan | | 54,800 | | | | 5,113,371 |
aSynopsys Inc. | | United States | | 128,080 | | | | 4,323,981 |
| | | | | | | |
|
|
| | | | | | | | | 18,514,407 |
| | | | | | | |
|
|
Specialty Retail .4% | | | | | | | | |
aToys R Us Inc. | | United States | | 191,600 | | | | 2,421,824 |
| | | | | | | |
|
|
Wireless Telecommunication Services .9% | | | | | | | | |
aAT&T Wireless Services Inc. | | United States | | 370,000 | | | | 2,956,300 |
China Mobile (Hong Kong) Ltd., fgn. | | China | | 928,000 | | | | 2,850,842 |
| | | | | | | |
|
|
| | | | | | | | | 5,807,142 |
| | | | | | | |
|
|
Total Common Stocks (Cost $327,740,545) | | | | | | | | 399,022,707 |
| | | | | | | |
|
|
Preferred Stock (Cost $1,226,665) .4% | | | | | | | | |
Cia Vale do Rio Doce, A, ADR, pfd. | | Brazil | | 46,840 | | | | 2,412,729 |
| | | | | | | |
|
|
| | | |
| | | | | PRINCIPAL
AMOUNTc
| | | |
Bonds 30.6% | | | | | | | | |
Buoni Poliennali Del Tesoro, | | | | | | | | |
7.75%, 11/01/06 | | Italy | | 3,974,190 | EUR | | | 5,623,419 |
5.50%, 11/01/10 | | Italy | | 2,300,000 | EUR | | | 3,162,004 |
5.00%, 2/01/12 | | Italy | | 1,810,000 | EUR | | | 2,407,702 |
Federal Republic of Germany, | | | | | | | | |
4.00%, 6/25/04 | | Germany | | 500,000 | EUR | | | 636,226 |
5.00%, 8/19/05 | | Germany | | 3,268,000 | EUR | | | 4,315,837 |
6.00%, 7/04/07 | | Germany | | 5,242,000 | EUR | | | 7,217,007 |
5.00%, 7/04/11 | | Germany | | 3,015,000 | EUR | | | 4,030,106 |
Federation of Russia, Reg S, 5.00% to 3/31/07, 7.50% thereafter, 3/31/30 | | Russia | | 10,400,000 | | | | 9,991,800 |
Finland Govt, 3.00%, 07/04/08 | | Finland | | 1,850,000 | EUR | | | 2,288,465 |
French Treasury Note, 4.75%, 7/12/07 | | France | | 5,400,000 | EUR | | | 7,158,678 |
Government of Canada, | | | | | | | | |
6.00%, 6/01/08 | | Canada | | 2,212,000 | CAD | | | 1,859,287 |
6.00%, 6/01/11 | | Canada | | 6,849,000 | CAD | | | 5,807,565 |
Government of France, | | | | | | | | |
3.00%, 7/12/08 | | France | | 2,100,000 | EUR | | | 2,596,392 |
4.00%, 10/25/09 | | France | | 6,420,000 | EUR | | | 8,205,575 |
Government of Netherlands, | | | | | | | | |
5.75%, 2/15/07 | | Netherlands | | 3,958,000 | EUR | | | 5,383,838 |
5.00%, 7/15/12 | | Netherlands | | 1,760,000 | EUR | | | 2,347,629 |
Government of New Zealand, 7.00%, 7/15/09 | | New Zealand | | 20,308,000 | NZD | | | 14,054,574 |
TGA-12
FRANKLIN TEMPLETON VARIABLE INSURANCE PRODUCTS TRUST
TEMPLETON GLOBAL ASSET ALLOCATION FUND
Statement of Investments, December 31, 2003 (cont.)
| | | | | | | | |
| | | COUNTRY | | PRINCIPAL
AMOUNTc | | | VALUE |
|
Bonds (cont.) | | | | | | | | |
Government of Spain, | | | | | | | | |
4.50%, 7/30/04 | | Spain | | 1,850,000 | EUR | | $ | 2,366,040 |
10.15%, 1/31/06 | | Spain | | 2,450,000 | EUR | | | 3,549,842 |
4.80%, 10/31/06 | | Spain | | 7,480,000 | EUR | | | 9,909,490 |
5.00%, 7/30/12 | | Spain | | 2,920,000 | EUR | | | 3,891,614 |
Kingdom of Belgium, | | | | | | | | |
7.50%, 7/29/08 | | Belgium | | 4,193,000 | EUR | | | 6,167,328 |
5.00%, 9/28/12 | | Belgium | | 1,760,000 | EUR | | | 2,342,745 |
Kingdom of Denmark, | | | | | | | | |
5.00%, 8/15/05 | | Denmark | | 11,696,000 | DKK | | | 2,054,029 |
6.00%, 11/15/11 | | Denmark | | 14,660,000 | DKK | | | 2,775,346 |
5.00%, 11/15/13 | | Denmark | | 25,080,000 | DKK | | | 4,428,082 |
Kingdom of Norway, 5.75%, 11/30/04 | | Norway | | 5,030,000 | NOK | | | 779,360 |
Kingdom of Sweden, | | | | | | | | |
6.00%, 2/09/05 | | Sweden | | 35,430,000 | SEK | | | 5,084,572 |
5.50%, 10/08/12 | | Sweden | | 86,010,000 | SEK | | | 12,672,444 |
Kingdom of Thailand, 6.00%, 3/05/05 | | Thailand | | 172,000,000 | THB | | | 4,571,814 |
New South Wales Treasury Corp., | | | | | | | | |
6.50%, 5/01/06 | | Australia | | 9,688,000 | AUD | | | 7,443,211 |
8.00%, 3/01/08 | | Australia | | 2,430,000 | AUD | | | 1,985,916 |
Queensland Treasury Corp., 6.00%, 7/14/09 | | Australia | | 300,000 | AUD | | | 229,934 |
Republic of Austria, | | | | | | | | |
5.00%, 1/15/08 | | Austria | | 4,900,000 | EUR | | | 6,560,734 |
5.00%, 7/15/12 | | Austria | | 4,800,000 | EUR | | | 6,396,067 |
Republic of Bulgaria, 144A, 8.25%, 1/15/15 | | Bulgaria | | 2,748,000 | | | | 3,255,281 |
Republic of Indonesia, 14.00%, 6/15/09 | | Indonesia | | 18,000,000,000 | IDR | | | 2,216,207 |
Republic of Panama, 8.875%, 9/30/27 | | Panama | | 960,000 | | | | 1,012,800 |
Republic of Peru, FRN, 5.00%, 3/07/17 | | Peru | | 1,034,000 | | | | 965,154 |
Republic of Philippines, | | | | | | | | |
9.875%, 1/15/19 | | Philippines | | 1,400,000 | | | | 1,487,500 |
10.625%, 3/16/25 | | Philippines | | 1,070,000 | | | | 1,180,344 |
United Kingdom, 7.50%, 12/07/06 | | United Kingdom | | 2,717,000 | GBP | | | 5,265,370 |
United Mexican States, | | | | | | | | |
9.875%, 2/01/10 | | Mexico | | 724,000 | | | | 912,016 |
11.375%, 9/15/16 | | Mexico | | 1,330,000 | | | | 1,892,590 |
11.50%, 5/15/26 | | Mexico | | 2,895,000 | | | | 4,204,988 |
| | | | | | | |
|
|
Total Bonds (Cost $146,160,281) | | | | | | | | 192,686,922 |
| | | | | | | |
|
|
TGA-13
FRANKLIN TEMPLETON VARIABLE INSURANCE PRODUCTS TRUST
TEMPLETON GLOBAL ASSET ALLOCATION FUND
Statement of Investments, December 31, 2003 (cont.)
| | | | | | | | |
| | | COUNTRY | | PRINCIPAL
AMOUNTc | | | VALUE |
|
Convertible Bond (Cost $295,091) .1% | | | | | | | | |
Axa SA, cvt., zero cpn., 12/21/04 | | France | | 19,757 | EUR | | $ | 398,479 |
| | | | | | | |
|
|
Total Long Term Investments (Cost $475,422,582) | | | | | | | $ | 594,520,837 |
| | | | | | | |
|
|
| | | |
| | | | | SHARES
| | | |
Short Term Investments 4.7% | | | | | | | | |
bFranklin Institutional Fiduciary Trust Money Market Portfolio | | United States | | 25,296,859 | | | | 25,296,859 |
| | | | | | | |
|
|
| | | |
| | | | | PRINCIPAL
AMOUNTc
| | | |
Thailand Treasury Bill, zero cpn., 9/30/04 | | Thailand | | 183,500,000 | THB | | | 4,576,527 |
| | | | | | | |
|
|
Total Short Term Investments (Cost $29,843,136) | | | | | | | | 29,873,386 |
| | | | | | | |
|
|
Total Investments (Cost $505,265,718) 99.3% | | | | | | | | 624,394,223 |
Other Assets, less Liabilities .7% | | | | | | | | 4,158,425 |
| | | | | | | |
|
|
Net Assets 100.0% | | | | | | | $ | 628,552,648 |
| | | | | | | |
|
|
Currency Abbreviations:
AUD - Australian Dollar
CAD - Canadian Dollar
DKK - Danish Krone
EUR - Euro
GBP - British Pound
IDR - Indonesian Rupiah
NOK - Norwegian Krone
NZD - New Zealand Dollar
SEK - Swedish Krona
THB - Thai Baht
| b | See Note 6 regarding investments in the Franklin Institutional Fiduciary Trust Money Market Portfolio. |
| c | The principal amount is stated in U.S. dollars unless otherwise indicated. |
See notes to financial statements.
TGA-14
FRANKLIN TEMPLETON VARIABLE INSURANCE PRODUCTS TRUST
TEMPLETON GLOBAL ASSET ALLOCATION FUND
Financial Statements
Statement of Assets and Liabilities
December 31, 2003
| | | | |
Assets: | | | | |
Investments in securities: | | | | |
Cost | | $ | 505,265,718 | |
| | |
|
|
|
Value | | | 624,394,223 | |
Cash | | | 33,029 | |
Foreign currency, at value (cost $132,838) | | | 84,130 | |
Receivables: | | | | |
Capital shares sold | | | 22,194 | |
Dividends and interest | | | 5,260,367 | |
| | |
|
|
|
Total assets | | | 629,793,943 | |
| | |
|
|
|
Liabilities: | | | | |
Payables: | | | | |
Investment securities purchased | | | 257,678 | |
Capital shares redeemed | | | 379,781 | |
Affiliates | | | 398,604 | |
Deferred tax liability (Note 1f) | | | 104,220 | |
Other liabilities | | | 101,012 | |
| | |
|
|
|
Total liabilities | | | 1,241,295 | |
| | |
|
|
|
Net assets, at value | | $ | 628,552,648 | |
| | |
|
|
|
Net assets consist of: | | | | |
Undistributed net investment income | | $ | 14,496,244 | |
Net unrealized appreciation (depreciation) | | | 119,371,539 | |
Accumulated net realized gain (loss) | | | (56,385,081 | ) |
Capital shares | | | 551,069,946 | |
| | |
|
|
|
Net assets, at value | | $ | 628,552,648 | |
| | |
|
|
|
Class 1: | | | | |
Net assets, at value | | $ | 572,798,449 | |
| | |
|
|
|
Shares outstanding | | | 30,503,902 | |
| | |
|
|
|
Net asset value and offering price per share | | $ | 18.78 | |
| | |
|
|
|
Class 2: | | | | |
Net assets, at value | | $ | 55,754,199 | |
| | |
|
|
|
Shares outstanding | | | 2,990,819 | |
| | |
|
|
|
Net asset value and offering price per share | | $ | 18.64 | |
| | |
|
|
|
See notes to financial statements.
TGA-15
FRANKLIN TEMPLETON VARIABLE INSURANCE PRODUCTS TRUST
TEMPLETON GLOBAL ASSET ALLOCATION FUND
Financial Statements (continued)
Statement of Operations
for the year ended December 31, 2003
| | | | |
Investment income: | | | | |
(net of foreign taxes and fees of $1,023,360) | | | | |
Dividends | | $ | 8,617,648 | |
Interest | | | 8,545,712 | |
| | |
|
|
|
Total investment income | | | 17,163,360 | |
| | |
|
|
|
Expenses: | | | | |
Management fees (Note 3) | | | 3,073,575 | |
Administrative fees (Note 3) | | | 719,976 | |
Distribution fees - Class 2 (Note 3) | | | 112,664 | |
Transfer Agent fees | | | 2,740 | |
Other | | | 372,267 | |
| | |
|
|
|
Total expenses | | | 4,281,222 | |
| | |
|
|
|
Net investment income | | | 12,882,138 | |
| | |
|
|
|
Realized and unrealized gains (losses): | | | | |
Net realized gain (loss) from: | | | | |
Investments | | | (48,100,795 | ) |
Foreign currency transactions | | | 370,532 | |
| | |
|
|
|
Net realized gain (loss) | | | (47,730,263 | ) |
Net unrealized appreciation (depreciation) on: | | | | |
Investments | | | 183,925,992 | |
Translation of assets and liabilities denominated in foreign currencies | | | 111,224 | |
Deferred taxes (Note 1f) | | | (104,220) | |
| | |
|
|
|
Net unrealized appreciation (depreciation) | | | 183,932,996 | |
| | |
|
|
|
Net realized and unrealized gain (loss) | | | 136,202,733 | |
| | |
|
|
|
Net increase (decrease) in net assets resulting from operations | | $ | 149,084,871 | |
| | |
|
|
|
See notes to financial statements.
TGA-16
FRANKLIN TEMPLETON VARIABLE INSURANCE PRODUCTS TRUST
TEMPLETON GLOBAL ASSET ALLOCATION FUND
Financial Statements (continued)
Statements of Changes in Net Assets
for the years ended December 31, 2003 and 2002
| | | | | | | | |
| | | 2003 | | | 2002 | |
| | |
| |
Increase (decrease) in net assets: | | | | | | | | |
Operations: | | | | | | | | |
Net investment income | | $ | 12,882,138 | | | $ | 12,861,961 | |
Net realized gain (loss) from investments and foreign currency transactions | | | (47,730,263 | ) | | | 3,691,354 | |
Net unrealized appreciation (depreciation) on investments and translation of assets and liabilities denominated in foreign currencies, and deferred taxes | | | 183,932,996 | | | | (38,051,023 | ) |
| | |
| |
Net increase (decrease) in net assets resulting from operations | | | 149,084,871 | | | | (21,497,708 | ) |
Distributions to shareholders from: | | | | | | | | |
Net investment income: | | | | | | | | |
Class 1 | | | (12,872,007 | ) | | | (9,120,690 | ) |
Class 2 | | | (1,147,201 | ) | | | (750,622 | ) |
| | |
| |
Total distributions to shareholders | | | (14,019,208 | ) | | | (9,871,312 | ) |
Capital share transactions: (Note 2) | | | | | | | | |
Class 1 | | | 24,154,273 | | | | (46,847,936 | ) |
Class 2 | | | 3,935,942 | | | | 3,566,120 | |
| | |
| |
Total capital share transactions | | | 28,090,215 | | | | (43,281,816 | ) |
Net increase (decrease) in net assets | | | 163,155,878 | | | | (74,650,836 | ) |
Net assets: | | | | | | | | |
Beginning of year | | | 465,396,770 | | | | 540,047,606 | |
| | |
| |
End of year | | $ | 628,552,648 | | | $ | 465,396,770 | |
| | |
| |
Undistributed net investment income included in net assets: | | | | | | | | |
End of year | | $ | 14,496,244 | | | $ | 12,858,724 | |
| | |
| |
See notes to financial statements.
TGA-17
FRANKLIN TEMPLETON VARIABLE INSURANCE PRODUCTS TRUST
TEMPLETON GLOBAL ASSET ALLOCATION FUND
Notes to Financial Statements
1. ORGANIZATION AND SIGNIFICANT ACCOUNTING POLICIES
Franklin Templeton Variable Insurance Products Trust (the Trust) is registered under the Investment Company Act of 1940 as an open-end investment company, consisting of twenty-two separate series (the Funds). Templeton Global Asset Allocation Fund (the Fund) included in this report is diversified. Shares of the Fund are sold only to insurance company separate accounts to fund the benefits of variable life insurance policies or variable annuity contracts. As of December 31, 2003, over 53% of the total Fund shares were sold through one insurance company. The Fund’s investment objective is high total return.
The following summarizes the Fund’s significant accounting policies.
a. Security Valuation
Securities listed or traded on a recognized national exchange or NASDAQ are valued at the last reported sales price. Over-the-counter securities and listed securities for which no sale is reported are valued within the range of the latest quoted bid and asked prices. Foreign securities are valued at the close of trading of the foreign exchange or the NYSE, whichever is earlier. If events occur that materially affect the values of securities after the prices or foreign exchange rates are determined, or if market quotations are not readily available, the securities will be valued at fair value as determined following procedures approved by the Board of Trustees.
b. Foreign Currency Translation
Portfolio securities and other assets and liabilities denominated in foreign currencies are translated into U.S. dollars based on the exchange rate of such currencies against U.S. dollars on the date of valuation. Purchases and sales of securities and income items denominated in foreign currencies are translated into U.S. dollars at the exchange rate in effect on the transaction date.
The Fund does not separately report the effect of changes in foreign exchange rates from changes in market prices on securities held. Such changes are included in net realized and unrealized gain or loss from investments.
Realized foreign exchange gains or losses arise from sales of foreign currencies, currency gains or losses realized between the trade and settlement dates on securities transactions and the difference between the recorded amounts of dividends, interest, and foreign withholding taxes and the U.S. dollar equivalent of the amounts actually received or paid. Net unrealized foreign exchange gains and losses arise from changes in foreign exchange rates on foreign denominated assets and liabilities other than investments in securities held at the end of the reporting period.
c. Foreign Currency Contracts
When the Fund purchases or sells foreign securities it may enter into foreign exchange contracts to minimize foreign exchange risk from the trade date to the settlement date of the transactions. A foreign exchange contract is an agreement between two parties to exchange different currencies at an agreed upon exchange rate on a specified date. Realized and unrealized gains and losses are included in the Statement of Operations.
The risks of these contracts include movement in the values of the foreign currencies relative to the U.S. dollar and the possible inability of the counterparties to fulfill their obligations under the contracts.
d. Income Taxes
No provision has been made for income taxes because the Fund’s policy is to qualify as a regulated investment company under the Internal Revenue Code and to distribute substantially all of its taxable income.
e. Security Transactions, Investment Income, Expenses and Distributions
Security transactions are accounted for on trade date. Realized gains and losses on security transactions are determined on a specific identification basis. Certain income from foreign securities is recorded as soon as information is available to the Fund.
TGA-18
FRANKLIN TEMPLETON VARIABLE INSURANCE PRODUCTS TRUST
TEMPLETON GLOBAL ASSET ALLOCATION FUND
Notes to Financial Statements (continued)
1. ORGANIZATION AND SIGNIFICANT ACCOUNTING POLICIES (cont.)
e. Security Transactions, Investment Income, Expenses and Distributions (cont.)
Interest income and estimated expenses are accrued daily. Discounts and premiums on securities purchased are amortized over the lives of the respective securities. Dividend income and distributions to shareholders are recorded on the ex-dividend date.
Common expenses incurred by the Trust are allocated among the Funds based on the ratio of net assets of each Fund to the combined net assets. Other expenses are charged to each Fund on a specific identification basis.
Realized and unrealized gains and losses and net investment income, other than class specific expenses, are allocated daily to each class of shares based upon the relative proportion of net assets of each class.
f. Deferred Taxes
The Fund is subject to a tax imposed on net realized gains of securities of certain foreign countries. The Fund records an estimated deferred tax liability for net unrealized gains on these securities as reflected in the accompanying financial statements.
g. Accounting Estimates
The preparation of financial statements in accordance with accounting principles generally accepted in the United States of America requires management to make estimates and assumptions that affect the reported amounts of assets and liabilities at the date of the financial statements and the amounts of income and expenses during the reporting period. Actual results could differ from those estimates.
h. Guarantees and Indemnifications
Under the Trust’s organizational documents, its officers and trustees are indemnified against certain liability arising out of the performance of their duties to the Trust. Additionally, in the normal course of business, the Trust enters into contracts with service providers that contain general indemnification clauses. The Trust’s maximum exposure under these arrangements is unknown as this would involve future claims that may be made against the Trust that have not yet occurred. However, based on experience, the Trust expects the risk of loss to be remote.
2. SHARES OF BENEFICIAL INTEREST
The Fund offers two classes of shares: Class 1 and Class 2. Each class of shares differs by its distribution fees, voting rights on matters affecting a single class and its exchange privilege.
At December 31, 2003, there were an unlimited number of shares authorized ($.01 par value). Transactions in the Fund’s shares were as follows:
| | | | | | | | | | | | | | |
| | | Year Ended December 31,
| |
| | | 2003
| | | 2002
| |
| Class 1 Shares: | | Shares
| | | Amount
| | | Shares
| | | Amount
| |
Shares sold | | 2,924,694 | | | $ | 48,227,589 | | | 526,225 | | | $ | 7,952,010 | |
Shares issued in reinvestment of distributions | | 795,550 | | | | 12,872,007 | | | 578,357 | | | | 9,120,690 | |
Shares redeemed | | (2,381,733 | ) | | | (36,945,323 | ) | | (4,250,902 | ) | | | (63,920,636 | ) |
| | |
| |
Net increase (decrease) | | 1,338,511 | | | $ | 24,154,273 | | | (3,146,320 | ) | | $ | (46,847,936 | ) |
| | |
| |
| Class 2 Shares: | | | | | | | | | | | | |
Shares sold | | 949,657 | | | $ | 15,396,855 | | | 2,038,410 | | | $ | 29,793,094 | |
Shares issued in reinvestment of distributions | | 71,299 | | | | 1,147,201 | | | 47,872 | | | | 750,622 | |
Shares redeemed | | (785,835 | ) | | | (12,608,114 | ) | | (1,859,712 | ) | | | (26,977,596 | ) |
| | |
| |
Net increase (decrease) | | 235,121 | | | $ | 3,935,942 | | | 226,570 | | | $ | 3,566,120 | |
| | |
| |
TGA-19
FRANKLIN TEMPLETON VARIABLE INSURANCE PRODUCTS TRUST
TEMPLETON GLOBAL ASSET ALLOCATION FUND
Notes to Financial Statements (continued)
3. TRANSACTIONS WITH AFFILIATES
Certain officers and trustees of the Fund are also officers and/or directors of the following entities:
| | |
| Entity | | Affiliation |
|
Franklin Templeton Services LLC (FT Services) | | Administrative manager |
Templeton Investment Counsel LLC (TIC) | | Investment manager |
Franklin/Templeton Distributors Inc. (Distributors) | | Principal underwriter |
Franklin/Templeton Investor Services LLC (Investor Services) | | Transfer agent |
The Fund pays an investment management fee to TIC based on the average daily net assets of the Fund as follows:
| | |
| Annualized Fee Rate | | Net Assets |
|
| .65% | | First $200 million |
| .585% | | Over $200 million, up to and including $1.3 billion |
| .52% | | Over $1.3 billion |
Under a subadvisory agreement, Advisers, an affiliate of TIC, provides subadvisory services to the Fund and receives from TIC fees based on the average daily net assets of the Fund.
The Fund pays business management fees to FT Services based on the average daily net assets of the Fund as follows:
| | |
| Annualized Fee Rate | | Net Assets |
|
| .15% | | First $200 million |
| .135% | | Over $200 million, up to and including $700 million |
| .10% | | Over $700 million, up to and including $1.2 billion |
Fees are further reduced on net assets over $1.2 billion.
The Fund reimburses Distributors up to .25% per year of its average daily net assets of Class 2, for costs incurred in marketing the Fund’s shares.
Investor Services, under terms of an agreement, performs shareholder servicing for the Fund and is not paid by the Fund.
4. INCOME TAXES
At December 31, 2003, the Fund had tax basis capital losses of $55,040,780 which may be carried over to offset future capital gains. Such losses expire as follows:
Capital loss carryovers expiring in:
| | | |
2009 | | $ | 5,082,133 |
2010 | | | 443,666 |
2011 | | | 49,514,981 |
| | |
|
| | | $ | 55,040,780 |
| | |
|
At December 31, 2003, the Fund has deferred capital losses occurring subsequent to October 31, 2003 of $1,342,049. For tax purposes, such losses will be reflected in the year ending December 31, 2004.
TGA-20
FRANKLIN TEMPLETON VARIABLE INSURANCE PRODUCTS TRUST
TEMPLETON GLOBAL ASSET ALLOCATION FUND
Notes to Financial Statements (continued)
4. INCOME TAXES (cont.)
The tax character of distributions paid during the years ended December 31, 2003 and 2002, was as follows:
| | | | | | |
| | | 2003
| | 2002
|
Distributions paid from: | | | | | | |
Ordinary income | | $ | 14,019,208 | | $ | 9,871,312 |
Long term capital gain | | | — | | | — |
| | |
|
| | | $ | 14,019,208 | | $ | 9,871,312 |
| | |
|
At December 31, 2003, the cost of investments, net unrealized appreciation (depreciation), undistributed ordinary income and undistributed long term capital gains for income tax purposes were as follows:
| | | | |
Cost of investments | | $ | 507,515,139 | |
| | |
|
|
|
Unrealized appreciation | | $ | 139,515,607 | |
Unrealized depreciation | | | (22,636,523 | ) |
| | |
|
|
|
Net unrealized appreciation (depreciation) | | $ | 116,879,084 | |
| | |
|
|
|
Undistributed ordinary income | | $ | 16,743,414 | |
Undistributed long term capital gains | | | — | |
| | |
|
|
|
Distributable earnings | | $ | 16,743,414 | |
| | |
|
|
|
Net investment income differs for financial statement and tax purposes primarily due to differing treatments of foreign currency transactions, and bond discounts and premiums.
Net realized gains (losses) differ for financial statement and tax purposes primarily due to differing treatments of wash sales, foreign currency transactions, and bond discounts and premiums.
5. INVESTMENT TRANSACTIONS
Purchases and sales of securities (excluding short-term securities) for the period ended December 31, 2003 aggregated $168,260,830 and $168,677,960, respectively.
6. INVESTMENT IN FRANKLIN INSTITUTIONAL FIDUCIARY TRUST MONEY MARKET PORTFOLIO
The Fund may invest in the Franklin Institutional Fiduciary Trust Money Market Portfolio (the Sweep Money Fund), an open-end investment company managed by Advisers. Management fees paid by the Fund are reduced on assets invested in the Sweep Money Fund, in an amount not to exceed the management fees paid by the Sweep Money Fund. The Fund earned $109,039 of dividend income from investment in the Sweep Money Fund for the period ended December 31, 2003.
7. REGULATORY MATTERS
On February 4, 2004, the Securities Division of the Office of the Secretary of the Commonwealth of Massachusetts filed an administrative complaint against Franklin Resources, Inc. and certain of its subsidiaries (the “Company”), alleging violations of the Massachusetts Uniform Securities Act. The complaint arises from activity that occurred in 2001 during which time an officer of a Company subsidiary was negotiating an agreement with an investor relating to investments in a mutual fund and a hedge fund.
TGA-21
FRANKLIN TEMPLETON VARIABLE INSURANCE PRODUCTS TRUST
TEMPLETON GLOBAL ASSET ALLOCATION FUND
Notes to Financial Statements (continued)
7. REGULATORY MATTERS (cont.)
The Company, in addition to other entities within Franklin Templeton Investments, has been named in shareholder class actions related to the matter described above. The Company believes that the claims made in the lawsuit are without merit and it intends to defend vigorously against the allegations. The Company and the Fund may be named in similar civil actions related to the matter described above.
In addition, as part of ongoing investigations by the U.S. Securities and Exchange Commission (the “SEC”), the U.S. Attorney for the Northern District of California, the New York Attorney General, the California Attorney General, the U.S. Attorney for the District of Massachusetts, the Florida Department of Financial Services, and the Commissioner of Securities and the Attorney General of the State of West Virginia, relating to certain practices in the mutual fund industry, including late trading, market timing and sales compensation arrangements, the Company and its subsidiaries, as well as certain current or former executives and employees of the Company, have received requests for information and/or subpoenas to testify or produce documents. The Company and its current employees are providing documents and information in response to these requests and subpoenas. In addition, the Company has responded to requests for similar kinds of information from regulatory authorities in some of the foreign countries where the Company conducts its global asset management business.
The Staff of the SEC has informed the Company that it intends to recommend that the Commission authorize an action against an affiliate of the Fund’s adviser and a senior executive officer relating to the frequent trading issues that are the subject of the SEC’s investigation. These issues were previously disclosed as being under investigation by government authorities and the subject of an internal inquiry by the Company in its Annual Report on Form 10-K and on its public website. The Company currently is in discussions with the SEC Staff in an effort to resolve the issues raised in their investigation. Such discussions are preliminary and the Fund’s management has been advised that the Company cannot predict the likelihood of whether those discussions will result in a settlement and, if so, the terms of such settlement. The impact, if any, of these matters on the Fund is uncertain at this time. If the Company finds that it bears responsibility for any unlawful or improper conduct, it has committed to making the Fund or its shareholders whole, as appropriate.
TGA-22
FRANKLIN TEMPLETON VARIABLE INSURANCE PRODUCTS TRUST
TEMPLETON GLOBAL ASSET ALLOCATION FUND
Independent Auditors’ Report
To the Board of Trustees and Shareholders
of Franklin Templeton Variable Insurance Products Trust
In our opinion, the accompanying statement of assets and liabilities, including the statement of investments, and the related statements of operations and of changes in net assets and the financial highlights present fairly, in all material respects, the financial position of the Templeton Global Asset Allocation Fund (the Fund) (one of the funds constituting the Franklin Templeton Variable Insurance Products Trust) at December 31, 2003, the results of its operations for the year then ended, the changes in its net assets for each of the two years in the period then ended and the financial highlights for each of the periods presented, in conformity with accounting principles generally accepted in the United States of America. These financial statements and financial highlights (hereafter referred to as “financial statements”) are the responsibility of the Fund’s management; our responsibility is to express an opinion on these financial statements based on our audits. We conducted our audits of these financial statements in accordance with auditing standards generally accepted in the United States of America, which require that we plan and perform the audits to obtain reasonable assurance about whether the financial statements are free of material misstatement. An audit includes examining, on a test basis, evidence supporting the amounts and disclosures in the financial statements, assessing the accounting principles used and significant estimates made by management, and evaluating the overall financial statement presentation. We believe that our audits, which included confirmation of securities at December 31, 2003 by correspondence with the custodian and brokers, provide a reasonable basis for our opinion.
PricewaterhouseCoopers LLP
San Francisco, California
February 5, 2004, except for Note 7 as to which the date is February 12, 2004
TGA-23
FRANKLIN TEMPLETON VARIABLE INSURANCE PRODUCTS TRUST
TEMPLETON GLOBAL ASSET ALLOCATION FUND
Tax Designation (unaudited)
Under Section 854(b)(2) of the Code, the Fund hereby designates 7.00% of the ordinary income dividends as income qualifying for the dividends received deduction for the fiscal year ended December 31, 2003.
At December 31, 2003, more than 50% of the Fund’s total assets were invested in securities of foreign issuers. In most instances, foreign taxes were withheld from dividends paid to the Fund on these investments. The Fund elects to treat foreign taxes paid under Section 853 of the Internal Revenue Code. This election will allow shareholders of record in June 2004, to treat their proportionate share of foreign taxes paid by the Fund as having been paid directly by them. The shareholder shall consider these amounts as foreign taxes paid in the tax year in which they receive the Fund distribution.
The foreign tax information will be disclosed in the June 30, 2004, semi-annual report of the Fund.
TGA-24
TEMPLETON GLOBAL INCOME SECURITIES FUND
Fund Goals and Primary Investments: Templeton Global Income Securities Fund seeks high current income, consistent with preservation of capital. Capital appreciation is a secondary consideration. The Fund invests mainly in debt securities of governments and their political subdivisions and agencies, supranational organizations and companies located anywhere in the world, including emerging markets. The Fund may also invest in lower-rated “junk bonds.”
We are pleased to bring you Templeton Global Income Securities Fund’s annual report for the fiscal year ended December 31, 2003.
Performance Overview
You can find the Fund’s one-year total return in the Performance Summary following this report. The Fund outperformed its benchmark, the J.P. Morgan Global Government Bond Index (JPM GGBI), which delivered cumulative total returns of 2.22% in local currency terms and 14.51% in U.S. dollar terms for the same period.1
Economic and Market Overview
During the year under review, many global developed economies showed signs of recovery and benign inflationary pressures following an environment of low growth and disinflation that facilitated monetary easing in many major economies. Economic growth accelerated in the U.S., remained strong in Asia and was weak, yet positive, in Europe. Despite these signs of economic recovery, inflationary pressures remained benign, supported by productivity growth and excess capacity in labor and capital. Global bond markets benefited from the low interest rate environment and currency developments as most major currencies appreciated against the U.S. dollar.
The U.S. dollar depreciated 15.26% relative to the nation’s major trading partners for the 12 months ended December 31, 2003.2 The U.S. experienced deteriorating balance of payment fundamentals during the year, as record trade deficit levels drove the U.S. current account deficit to $135 billion for third quarter 2003, or 4.9% of gross domestic product (GDP) on an annualized basis.3 The current account deficit combined with a fiscal deficit created a “twin-deficit” problem similar to previous periods when the U.S. dollar came under pressure.
1. Source: J.P. Morgan. One cannot invest directly in an index, nor is an index representative of the Fund’s portfolio. Please see Index Descriptions following the Fund Summaries.
2. Source: Federal Reserve.
3. Source: Bureau of Economic Analysis.
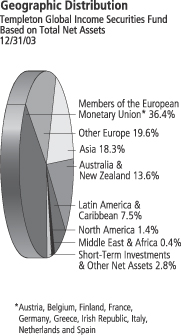
TGI-1
Despite generally lower economic growth rates than those of the U.S., the euro zone and other European countries had positive short-term yield differentials and stronger balance of payment positions relative to the U.S. For example, in contrast to the widening U.S. current account deficit during the year, the euro zone posted a trailing 12-month current account surplus in September 2003 of 2.0% of GDP.4 In the Scandinavian countries of Norway and Sweden, short-term government securities offered higher yields than similar maturity U.S. Treasuries despite aggressive monetary easing during the past year. Export strength and relatively high commodity prices helped Norway and Sweden maintain current account surpluses.
In Asia, economic growth improved in many countries over the past year, accompanied by low inflationary pressures. Export growth and current account surpluses in many of the countries supported international reserve accumulation, particularly in Japan and among the newly industrialized economies of South Korea, Thailand and Indonesia. By the end of the year, these reserve levels represented increases of 44.6%, 28.0%, 11.1% and 14.8%, respectively, over year-ago figures.5
Reduced interest rates in developed economies generally benefit emerging market borrowers through lower borrowing costs and positive investment flows from investors seeking higher returns outside developed countries. Additionally, emerging market credit fundamentals remained favorable, highlighted by the past year’s large number of sovereign credit upgrades. For example, independent credit rating agency Moody’s Investors Service upgraded Russia’s long-term foreign currency rating to investment grade. Standard & Poor’s, another independent credit rating agency, raised Indonesia’s and Thailand’s foreign currency sovereign ratings during the year.
Investment Strategy
We allocate the Fund’s assets among issuers, geographic regions, and currencies based upon our assessment of relative interest rates among currencies, our outlook for changes in interest rates, and credit risks. In considering these factors, we evaluate a country’s changing market, economic and political conditions, such as inflation rate, growth prospects, global trade patterns and government policies. We intend to manage the Fund’s exposure to various currencies, and may from time to time seek to hedge (protect) against currency risk by using forward currency exchange contracts.
4. Source: European Central Bank, Eurostat.
5. Sources: Japan Ministry of Finance; Bank of Korea; Bank of Thailand; Bank of Indonesia.
TGI-2
Manager’s Discussion
In addition to income, developed market interest rate movements, currency returns and emerging market bonds contributed to the Fund’s strong one-year performance.
Monetary easing by certain major central banks around the world provided a positive backdrop for local bond markets and positively impacted the Fund’s performance. Slow economic growth at the beginning of the year, accompanied by heightened geopolitical uncertainty, rising unemployment and disinflationary pressures provided a favorable environment for an accommodative monetary stance at many major central banks. In the U.S., the Federal Reserve Board lowered the federal funds target rate 25 basis points (0.25%) to 1.00%. However, the yield curve steepened on prospects of stronger economic growth later in the year and the U.S. Treasury market declined 2.44% for the full year. As a result, the Fund benefited from its underweighted allocation to the U.S. In Europe, policymakers at the European Central Bank (ECB) reduced its reference rate 75 basis points (0.75%) to 2.00% and euro-zone bond markets returned 3.98% in local currency terms.6 Similarly, Denmark, Sweden and Norway lowered rates and those countries’ bonds returned 4.55%, 5.04% and 11.08%, respectively, in local currency terms.7 Additionally, the Reserve Bank of New Zealand reduced its official reference rate 75 basis points (0.75%) to 4.75%, driving 6.56% local currency return.8
The U.S. dollar’s depreciation against most major currencies positively impacted Fund performance during the period. Throughout the reporting period, the euro represented the Fund’s largest currency exposure. The euro appreciated 16.80% against the U.S. dollar, with EMU bond markets returning 24.98%.9 The Fund benefited from its exposure to other European countries. During the year, the Swedish krona appreciated 17.42% against the U.S. dollar, while the Danish krone was up 16.60% and the Norwegian krone rose 3.97%. The strong currency appreciation combined with local market returns helped produce bond market returns of 27.19%, 25.36% and 15.67% in U.S. dollar terms for Sweden, Denmark and Norway, respectively.7 Currencies from other regions, particularly Asia, did not experience similar appreciation against the U.S. dollar despite larger trade surpluses with the U.S. Of
6. Sources: European Central Bank; J.P. Morgan Government Bond Index Monitor, December 2003.
7. Sources: JPM GGBI; Citigroup World Government Bond Index.
8. Sources: Reserve Bank of New Zealand; J.P. Morgan Government Bond Index Monitor, December 2003.
9. Source: J.P. Morgan Government Bond Index Monitor, December 2003.
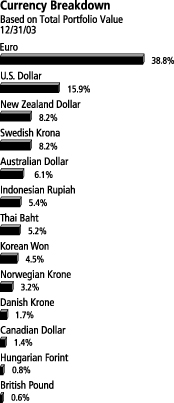
The dollar value, number of shares or principal amount, and complete legal titles of all portfolio holdings are listed in the Fund’s Statement of Investments.
TGI-3
the roughly $41 billion monthly U.S. trade deficit, Asia accounted for about $22 billion versus $8 billion in western Europe.10 Consequently, the Fund reallocated some exposure toward the end of the reporting period away from the euro zone and into Asia seeking to position the Fund for potential global economic recovery as well as to take advantage of the discrepancy between currency performance and macroeconomic trends.
The Australian dollar and New Zealand dollar were the top performing developed country currencies, appreciating 25.27% and 20.34%, respectively, against the U.S. dollar during the Fund’s fiscal year, bringing these countries’ bond returns in U.S. dollar terms to 37.32% and 33.75%.11 The Fund’s overweighted positions in the two countries contributed to the Fund’s outperformance during the period. Australia and New Zealand, although running relatively large current account deficits, differed from the U.S. in that they had balanced fiscal accounts, thus not creating a “twin-deficit” condition. From a balance of payments perspective, their current account deficits were balanced by strong foreign investment flows in an economic environment of high yields relative to other developed nations, as well as fiscal surpluses. Australia and New Zealand also each exhibited strong economic growth during the year, reporting 2.6% and 3.5% annual growth in third quarter 2003.12
Japan underperformed other developed bond markets in U.S. dollar terms, returning only 9.84% during the year, with 9.69% appreciation of the yen against the U.S. dollar.9 Although Japan benefited during the past year from a cyclical economic recovery and improving export strength, concerns remained about the country’s banking sector health and structural reform progress. We sought exposure to Asia’s cyclical, regional economic recovery through a variety of currencies from the region without exposure to any country-specific risks in Japan.
The Fund also invested in emerging market sovereign debt that is typically non-investment grade and compensates for greater credit risk by offering higher income or coupon. During the 12-month period, emerging market returns contributed to Fund performance as the J.P. Morgan Emerging Markets Bond Index Global (JPM EMBIG) delivered strong returns. Emerging bond markets, as measured by JPM EMBIG, returned 25.66% during the 12-month period. Sovereign interest rate spreads declined from 7.25 percentage points greater than the U.S. Treasury
10. Source: U.S. Census Bureau, 10/31/03.
11. Sources: JPM GGBI; J.P. Morgan Government Bond Index Broad.
12. Sources: Australia Bureau of Statistics; Statistics New Zealand.
TGI-4
market at the beginning of the reporting period to 4.03 percentage points by period-end.13 Reduced interest rates in developed economies generally benefit emerging market borrowers through lower borrowing costs and positive investment flows from investors seeking higher returns outside developed countries. Regionally, Latin American sovereign debt returned 32.97%, eastern Europe 22.07% and Asia 9.02%.13
The Fund increased allocation to emerging markets during the period, largely through increased exposure to euro and local currency denominated debt markets we believe have opportunities for potential currency appreciation as well as attractive yield characteristics. Primarily, we expanded and diversified the Fund’s Asian exposure later in the reporting period to include South Korea, Thailand and Indonesia. The regional cyclical recovery in Asia supported growth rates while current account surpluses from competitive trade conditions contributed to international reserve accumulation.
Thank you for your continued participation in Templeton Global Income Securities Fund. We look forward to serving your future investment needs.
13. Source: J.P. Morgan. Please see Index Descriptions following the Fund Summaries.
This discussion reflects our analysis, opinions and portfolio holdings as of December 31, 2003, the end of the reporting period. The way we implement our main investment strategies and the resulting portfolio holdings may change depending on factors such as market and economic conditions. These opinions may not be relied upon as investment advice or an offer for a particular security. The information is not a complete analysis of every aspect of any market, country, industry, security or the Fund. Statements of fact are from sources considered reliable, but the advisor makes no representation or warranty as to their completeness or accuracy. Although historical performance is no guarantee of future results, these insights may help you understand our investment management philosophy.
TGI-5
PERFORMANCE SUMMARYASOF 12/31/03
Total return of Class 2 shares represents the average annual change in value, assuming reinvestment of dividends and capital gains. Average returns smooth out variations in returns, which can be significant; they are not the same as year-by-year results.
Templeton Global Income Securities Fund – Class 2*
Periods ended 12/31/03
| | | | | | |
| | | 1-Year | | 5-Year | | 10-Year |
|
| | | |
Average Annual Total Return | | +22.44% | | +8.20% | | +6.87% |
*Because Class 2 shares were not offered until 1/6/99, standardized Class 2 Fund performance for prior periods represents the historical results of Class 1 shares. For periods beginning on 1/6/99, Class 2’s results reflects an additional 12b-1 fee expense, which also affects future performance. Since 1/6/99 (effective date), the average annual total return of Class 2 shares was +8.13%.
Ongoing market volatility can significantly affect short-term performance; recent returns may differ.
Total Return Index Comparison
for Hypothetical $10,000 Investment (1/1/94–12/31/03)
The graph compares the performance of Templeton Global Income Securities Fund – Class 2* and the J.P. Morgan Global Government Bond Index, as well as the Consumer Price Index (CPI). One cannot invest directly in an index, nor is an index representative of the Fund’s portfolio. Please see Important Notes to Performance Information preceding the Fund Summaries.
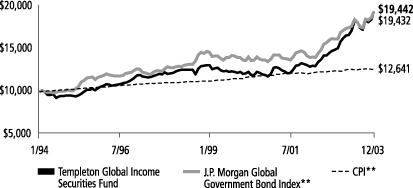
**Source: Standard & Poor’s Micropal. Please see Index Descriptions following the Fund Summaries.
Templeton Global Income Securities Fund – Class 2
Performance reflects the Fund’s Class 2 operating expenses, but does not include any contract fees, expenses or sales charges. If they had been included, performance would be lower. These charges and deductions, particularly for variable life policies, can have a significant effect on contract values and insurance benefits. See the contract prospectus for a complete description of these expenses, including sales charges.
Since markets can go down as well as up, investment return and the value of your principal will fluctuate with market conditions, and you may have a gain or loss when you sell your shares.
Past performance does not guarantee future results.
TGI-6
TEMPLETON GLOBAL INCOME SECURITIES FUND
FRANKLIN TEMPLETON VARIABLE INSURANCE PRODUCTS TRUST
SUPPLEMENT DATED FEBRUARY 12, 2004
TO THE PROSPECTUS DATED MAY 1, 2003
The Management section on page TGI-5 is replaced with the following:
Franklin Advisers, Inc. (Advisers), One Franklin Parkway, San Mateo, California 94403-1906, is the Fund’s investment manager.
The team responsible for the Fund’s management is:
| | |
| Alexander C. Calvo SENIOR VICE PRESIDENT OF ADVISERS | | Mr. Calvo has been a manager of the Fund since 1998, and has been with Franklin Templeton Investments since 1995. |
| |
Michael Hasenstab, Ph.D. PORTFOLIO MANAGER/RESEARCH ANALYST OF ADVISERS | | Dr. Hasenstab has been a manager of the Fund since 2002 and an analyst since 2001. He first joined Franklin Templeton Investments in 1995, rejoining again in 2001 after a three-year leave to obtain his Ph.D. |
The Fund pays Advisers a fee for managing the Fund’s assets and providing certain administrative facilities and services for the Fund. For the fiscal year ended December 31, 2002, the Fund paid 0.63% of its average daily net assets to Advisers for its services.
Please keep this supplement for future reference
TGI-7
FRANKLIN TEMPLETON VARIABLE INSURANCE PRODUCTS TRUST
TEMPLETON GLOBAL INCOME SECURITIES FUND
Financial Highlights
| | | | | | | | | | | | | | | | | | | | |
| | | Class 1
| |
| | | Year Ended December 31,
| |
| | | 2003 | | | 2002 | | | 2001 | | | 2000 | | | 1999 | |
| | |
|
|
|
Per share operating performance | | | | | | | | | | | | | | | | | | | | |
(for a share outstanding throughout the year) | | | | | | | | | | | | | | | | | | | | |
| | | | | |
Net asset value, beginning of year | | $ | 13.67 | | | $ | 11.39 | | | $ | 11.53 | | | $ | 11.07 | | | $ | 12.87 | |
| | |
|
|
|
Income from investment operations: | | | | | | | | | | | | | | | | | | | | |
Net investment incomea | | | .69 | | | | .59 | | | | .59 | c | | | .68 | | | | .68 | |
Net realized and unrealized gains (losses) | | | 2.35 | | | | 1.83 | | | | (.32 | )c | | | (.20 | ) | | | (1.42 | ) |
| | |
|
|
|
Total from investment operations | | | 3.04 | | | | 2.42 | | | | .27 | | | | .48 | | | | (.74 | ) |
| | |
|
|
|
Less distributions from net investment income | | | (1.17 | ) | | | (.14 | ) | | | (.41 | ) | | | (.02 | ) | | | (1.06 | ) |
| | |
|
|
|
Net asset value, end of year | | $ | 15.54 | | | $ | 13.67 | | | $ | 11.39 | | | $ | 11.53 | | | $ | 11.07 | |
| | |
|
|
|
| | | | | |
Total returnb | | | 22.72% | | | | 21.44% | | | | 2.55% | | | | 4.32% | | | | (5.79)% | |
Ratios/supplemental data | | | | | | | | | | | | | | | | | | | | |
Net assets, end of year (000’s) | | $ | 52,842 | | | $ | 50,622 | | | $ | 63,781 | | | $ | 81,171 | | | $ | 90,537 | |
Ratios to average net assets: | | | | | | | | | | | | | | | | | | | | |
Expenses | | | .76% | | | | .73% | | | | .71% | | | | .72% | | | | .65% | |
Net investment income | | | 4.72% | | | | 4.88% | | | | 5.22% | c | | | 6.22% | | | | 5.65% | |
Portfolio turnover rate | | | 53.01% | | | | 27.91% | | | | 122.45% | | | | 40.43% | | | | 80.76% | |
| a | Based on average daily shares outstanding. |
| b | Total return does not include any fees, charges or expenses imposed by the variable annuity and life insurance contracts for which the Franklin Templeton Variable Insurance Products Trust serves as an underlying investment vehicle. Total return is not annualized for periods less than one year. |
| c | Effective January 1, 2001, the fund adopted the provisions of the AICPA Audit and Accounting Guide of Investment Companies and began amortizing all premium and discount on fixed-income securities, as required. The effect of this change was as follows: |
| | |
Net investment income (loss) per share | | $(.059) |
Net realized and unrealized gains (losses) per share | | .059 |
Ratio of net investment income to average net assets | | (.53)% |
Per share data and ratios for prior periods have not been restated to reflect this change in accounting policy.
TGI-8
FRANKLIN TEMPLETON VARIABLE INSURANCE PRODUCTS TRUST
TEMPLETON GLOBAL INCOME SECURITIES FUND
Financial Highlights (continued)
| | | | | | | | | | | | | | | | | | | | |
| | | Class 2
| |
| | | Year Ended December 31,
| |
| | | 2003 | | | 2002 | | | 2001 | | | 2000 | | | 1999d | |
| | |
|
|
|
Per share operating performance | | | | | | | | | | | | | | | | | | | | |
(for a share outstanding throughout the year) | | | | | | | | | | | | | | | | | | | | |
| | | | | |
Net asset value, beginning of year | | $ | 13.59 | | | $ | 11.33 | | | $ | 11.48 | | | $ | 11.04 | | | $ | 12.93 | |
| | |
|
|
|
Income from investment operations: | | | | | | | | | | | | | | | | | | | | |
Net investment incomea | | | .65 | | | | .54 | | | | .55 | c | | | .65 | | | | .60 | |
Net realized and unrealized gains (losses) | | | 2.33 | | | | 1.84 | | | | (.31 | )c | | | (.19 | ) | | | (1.44 | ) |
| | |
|
|
|
Total from investment operations | | | 2.98 | | | | 2.38 | | | | .24 | | | | .46 | | | | (.84 | ) |
| | |
|
|
|
Less distributions from net investment income | | | (1.15 | ) | | | (.12 | ) | | | (.39 | ) | | | (.02 | ) | | | (1.05 | ) |
| | |
|
|
|
Net asset value, end of year | | $ | 15.42 | | | $ | 13.59 | | | $ | 11.33 | | | $ | 11.48 | | | $ | 11.04 | |
| | |
|
|
|
| | | | | |
Total returnb | | | 22.44% | | | | 21.15% | | | | 2.24% | | | | 4.14% | | | | (6.53)% | |
Ratios/supplemental data | | | | | | | | | | | | | | | | | | | | |
Net assets, end of year (000’s) | | $ | 5,181 | | | $ | 2,119 | | | $ | 1,286 | | | $ | 1,237 | | | $ | 443 | |
Ratios to average net assets: | | | | | | | | | | | | | | | | | | | | |
Expenses | | | 1.01% | | | | .98% | | | | .96% | | | | .97% | | | | .91% | e |
Net investment income | | | 4.47% | | | | 4.63% | | | | 4.95% | c | | | 5.94% | | | | 5.36% | e |
Portfolio turnover rate | | | 53.01% | | | | 27.91% | | | | 122.45% | | | | 40.43% | | | | 80.76% | |
| a | Based on average daily shares outstanding. |
| b | Total return does not include any fees, charges or expenses imposed by the variable annuity and life insurance contracts for which the Franklin Templeton Variable Insurance Products Trust serves as an underlying investment vehicle. Total return is not annualized for periods less than one year. |
| c | Effective January 1, 2001, the fund adopted the provisions of the AICPA Audit and Accounting Guide of Investment Companies and began amortizing all premium and discount on fixed-income securities, as required. The effect of this change was as follows: |
| | |
Net investment income (loss) per share | | $(.059) |
Net realized and unrealized gains (losses) per share | | .059 |
Ratio of net investment income to average net assets | | (.53)% |
Per share data and ratios for prior periods have not been restated to reflect this change in accounting policy.
| d | For the period January 6, 1999 (effective date) to December 31, 1999. |
See notes to financial statements.
TGI-9
FRANKLIN TEMPLETON VARIABLE INSURANCE PRODUCTS TRUST
TEMPLETON GLOBAL INCOME SECURITIES FUND
Statement of Investments, December 31, 2003
| | | | | |
| | | PRINCIPAL
AMOUNTa | | | VALUE |
|
Long Term Investments 97.2% | | | | | |
Australia 6.0% | | | | | |
New South Wales Treasury Corp., | | | | | |
6.50%, 5/01/06 | | 200,000 | AUD | | 153,658 |
8.00%, 3/01/08 | | 1,990,000 | AUD | | 1,626,327 |
Queensland Treasury Corp., 6.00%, 8/14/13 | | 2,200,000 | AUD | | 1,685,269 |
| | | | | |
|
| | | | | | 3,465,254 |
| | | | | |
|
Austria 4.1% | | | | | |
Republic of Austria, | | | | | |
5.00%, 7/15/12 | | 850,000 | EUR | | 1,132,637 |
4.65%, 1/15/18 | | 1,000,000 | EUR | | 1,267,280 |
| | | | | |
|
| | | | | | 2,399,917 |
| | | | | |
|
Belgium 3.9% | | | | | |
Kingdom of Belgium, 7.50%, 7/29/08 | | 1,531,000 | EUR | | 2,251,891 |
| | | | | |
|
Bulgaria .2% | | | | | |
Republic of Bulgaria, FRN, 1.9375%, 7/28/11 | | 122,550 | | | 120,291 |
| | | | | |
|
Canada 1.4% | | | | | |
Government of Canada, 6.00%, 6/01/11 | | 937,000 | CAD | | 794,523 |
| | | | | |
|
Colombia .6% | | | | | |
Republic of Colombia, | | | | | |
10.00%, 1/23/12 | | 132,000 | | | 144,911 |
11.75%, 2/25/20 | | 159,000 | | | 189,505 |
| | | | | |
|
| | | | | | 334,416 |
| | | | | |
|
Denmark 1.7% | | | | | |
Kingdom of Denmark, | | | | | |
5.00%, 11/15/13 | | 3,950,000 | DKK | | 697,405 |
7.00%, 11/10/24 | | 1,300,000 | DKK | | 279,758 |
| | | | | |
|
| | | | | | 977,163 |
| | | | | |
|
Finland 3.9% | | | | | |
Government of Finland, | | | | | |
5.00%, 4/25/09 | | 660,000 | EUR | | 886,147 |
5.375%, 7/04/13 | | 1,000,000 | EUR | | 1,367,936 |
| | | | | |
|
| | | | | | 2,254,083 |
| | | | | |
|
France 4.7% | | | | | |
Government of France, | | | | | |
4.00%, 10/25/09 | | 1,055,000 | EUR | | 1,348,424 |
4.00%, 4/25/13 | | 930,000 | EUR | | 1,150,986 |
4.25%, 4/25/19 | | 200,000 | EUR | | 240,549 |
| | | | | |
|
| | | | | | 2,739,959 |
| | | | | |
|
Germany 2.7% | | | | | |
Federal Republic of Germany, | | | | | |
3.25%, 2/17/04 | | 657,000 | EUR | | 829,951 |
5.00%, 7/04/11 | | 532,000 | EUR | | 711,117 |
| | | | | |
|
| | | | | | 1,541,068 |
| | | | | |
|
TGI-10
FRANKLIN TEMPLETON VARIABLE INSURANCE PRODUCTS TRUST
TEMPLETON GLOBAL INCOME SECURITIES FUND
Statement of Investments, December 31, 2003 (cont.)
| | | | | |
| | | PRINCIPAL
AMOUNTa | | | VALUE |
|
Long Term Investments (cont.) | | | | | |
Greece 3.1% | | | | | |
Hellenic Republic, | | | | | |
4.60%, 5/20/13 | | 700,000 | EUR | | 894,469 |
6.50%, 10/22/19 | | 600,000 | EUR | | 893,226 |
| | | | | |
|
| | | | | | 1,787,695 |
| | | | | |
|
Hungary .8% | | | | | |
Government of Hungary, 8.50%, 10/12/05 | | 101,100,000 | HUF | | 470,643 |
| | | | | |
|
Indonesia 5.3% | | | | | |
Indonesia Recapital Bond, | | | | | |
12.125%, 2/15/06 | | 1,800,000,000 | IDR | | 216,385 |
13.15%, 3/15/10 | | 6,005,000,000 | IDR | | 716,536 |
Republic of Indonesia, 14.00%, 6/15/09 | | 17,407,000,000 | IDR | | 2,143,195 |
| | | | | |
|
| | | | | | 3,076,116 |
| | | | | |
|
Irish Republic 3.2% | | | | | |
Republic of Ireland, 5.00%, 4/18/13 | | 1,400,000 | EUR | | 1,865,225 |
| | | | | |
|
Italy 2.8% | | | | | |
Buoni Poliennali Del Tesoro, 7.75%, 11/01/06 | | 1,131,293 | EUR | | 1,600,763 |
| | | | | |
|
Mexico 2.8% | | | | | |
United Mexican States, | | | | | |
9.875%, 2/01/10 | | 800,000 | | | 1,007,752 |
144A, 7.50%, 3/08/10 | | 450,000 | EUR | | 631,833 |
| | | | | |
|
| | | | | | 1,639,585 |
| | | | | |
|
Netherlands 4.7% | | | | | |
Government of Netherlands, 5.75%, 2/15/07 | | 2,008,000 | EUR | | 2,731,366 |
| | | | | |
|
New Zealand 7.6% | | | | | |
Government of New Zealand, | | | | | |
7.00%, 7/15/09 | | 5,140,000 | NZD | | 3,557,244 |
6.00%, 11/15/11 | | 1,300,000 | NZD | | 859,813 |
| | | | | |
|
| | | | | | 4,417,057 |
| | | | | |
|
Norway 3.1% | | | | | |
Kingdom of Norway, | | | | | |
6.75%, 1/15/07 | | 7,350,000 | NOK | | 1,213,323 |
5.50%, 5/15/09 | | 3,600,000 | NOK | | 578,658 |
| | | | | |
|
| | | | | | 1,791,981 |
| | | | | |
|
Philippines 3.6% | | | | | |
Republic of Philippines, | | | | | |
9.00%, 2/15/13 | | 700,000 | | | 731,045 |
10.625%, 3/16/25 | | 1,200,000 | | | 1,323,750 |
| | | | | |
|
| | | | | | 2,054,795 |
| | | | | |
|
Russia 3.3% | | | | | |
Federation of Russia, | | | | | |
12.75%, 6/24/28 | | 105,000 | | | 168,073 |
Reg S, 11.00%, 7/24/18 | | 1,250,000 | | | 1,694,469 |
Reg S, 5.00% to 3/31/07, 7.50% thereafter, 3/31/30 | | 34,000 | | | 32,666 |
| | | | | |
|
| | | | | | 1,895,208 |
| | | | | |
|
TGI-11
FRANKLIN TEMPLETON VARIABLE INSURANCE PRODUCTS TRUST
TEMPLETON GLOBAL INCOME SECURITIES FUND
Statement of Investments, December 31, 2003 (cont.)
| | | | | |
| | | PRINCIPAL
AMOUNTa | | | VALUE |
|
Long Term Investments (cont.) | | | | | |
South Africa .4% | | | | | |
Republic of South Africa, 5.25%, 5/16/13 | | 200,000 | EUR | | 243,063 |
| | | | | |
|
South Korea 4.4% | | | | | |
Korea Treasury Bond, | | | | | |
4.50%, 9/03/06 | | 160,000,000 | KRW | | 135,192 |
4.75%, 3/12/08 | | 2,883,000,000 | KRW | | 2,435,307 |
| | | | | |
|
| | | | | | 2,570,499 |
| | | | | |
|
Spain 3.3% | | | | | |
Bonos Y Oblig Del Estado, | | | | | |
6.00%, 1/31/08 | | 200,000 | EUR | | 277,790 |
5.50%, 7/30/17 | | 400,000 | EUR | | 551,766 |
Government of Spain, | | | | | |
10.15%, 1/31/06 | | 378,000 | EUR | | 547,690 |
5.00%, 7/30/12 | | 410,000 | EUR | | 546,425 |
| | | | | |
|
| | | | | | 1,923,671 |
| | | | | |
|
Sweden 7.9% | | | | | |
Kingdom of Sweden, | | | | | |
6.00%, 2/09/05 | | 5,500,000 | SEK | | 789,307 |
3.50%, 4/20/06 | | 1,200,000 | SEK | | 167,195 |
5.50%, 10/08/12 | | 24,780,000 | SEK | | 3,651,008 |
| | | | | |
|
| | | | | | 4,607,510 |
| | | | | |
|
Thailand 5.0% | | | | | |
Kingdom of Thailand, | | | | | |
6.00%, 3/05/05 | | 8,000,000 | THB | | 212,642 |
8.50%, 10/14/05 | | 63,500,000 | THB | | 1,795,020 |
8.00%, 12/08/06 | | 3,500,000 | THB | | 103,018 |
4.125%, 2/12/08 | | 9,000,000 | THB | | 241,181 |
8.50%, 12/08/08 | | 1,000,000 | THB | | 31,872 |
4.80%, 4/09/10 | | 20,000,000 | THB | | 534,757 |
| | | | | |
|
| | | | | | 2,918,490 |
| | | | | |
|
Ukraine 2.0% | | | | | |
Republic of Ukraine, 144A, 7.65%, 6/11/13 | | 1,130,000 | | | 1,176,963 |
| | | | | |
|
United Kingdom .6% | | | | | |
United Kingdom, 7.50%, 12/07/06 | | 175,000 | GBP | | 339,139 |
| | | | | |
|
TGI-12
FRANKLIN TEMPLETON VARIABLE INSURANCE PRODUCTS TRUST
TEMPLETON GLOBAL INCOME SECURITIES FUND
Statement of Investments, December 31, 2003 (cont.)
| | | | | | | |
| | | PRINCIPAL
AMOUNTa | | | VALUE |
|
Long Term Investments (cont.) | | | | | | | |
Venezuela 4.1% | | | | | | | |
Republic of Venezuela, | | | | | | | |
9.25%, 9/15/27 | | $ | 2,390,000 | | | $ | 2,178,640 |
144A, 10.75%, 9/19/13 | | | 200,000 | | | | 213,000 |
| | | | | | |
|
|
| | | | | | | | 2,391,640 |
| | | | | | |
|
|
Total Long Term Investments (Cost $46,912,583) | | | | | | | 56,379,974 |
| | | | | | |
|
|
Short Term Investment (Cost $189,207) .3% | | | | | | | |
New Zealand Treasury Bill, 5.15%, 6/16/04 | | | 300,000 | NZD | | | 196,552 |
| | | | | | |
|
|
Total Investments (Cost $47,101,790) 97.5% | | | | | | | 56,576,526 |
Other Assets, less Liabilities 2.5% | | | | | | | 1,446,161 |
| | | | | | |
|
|
Net Assets 100.0% | | | | | | $ | 58,022,687 |
| | | | | | |
|
|
Currency Abbreviations:
AUD - Australian Dollar
CAD - Canadian Dollar
DKK - Danish Krone
EUR - Euro
GBP - British Pound
HUF - Hungarian Forint
IDR - Indonesian Rupiah
KRW - Korean Won
NOK - Norwegian Krone
NZD - New Zealand Dollar
SEK - Swedish Krona
THB - Thai Baht
| a | The principal amount is stated in U.S. dollars unless otherwise indicated. |
TGI-13
FRANKLIN TEMPLETON VARIABLE INSURANCE PRODUCTS TRUST
TEMPLETON GLOBAL INCOME SECURITIES FUND
Financial Statements
Statement of Assets and Liabilities
December 31, 2003
| | | | |
Assets: | | | | |
Investments in securities: | | | | |
Cost | | $ | 47,101,790 | |
| | |
|
|
|
Value | | | 56,576,526 | |
Cash | | | 69,023 | |
Foreign currency, at value (cost $21,941) | | | 21,164 | |
Receivables: | | | | |
Capital shares sold | | | 5,995 | |
Interest | | | 1,437,463 | |
| | |
|
|
|
Total assets | | | 58,110,171 | |
| | |
|
|
|
Liabilities: | | | | |
Payables: | | | | |
Capital shares redeemed | | | 27,196 | |
Affiliates | | | 32,310 | |
Custodian fees | | | 8,400 | |
Professional fees | | | 15,934 | |
Other liabilities | | | 3,644 | |
| | |
|
|
|
Total liabilities | | | 87,484 | |
| | |
|
|
|
Net assets, at value | | $ | 58,022,687 | |
| | |
|
|
|
Net assets consist of: | | | | |
Undistributed net investment income | | $ | 5,047,873 | |
Net unrealized appreciation (depreciation) | | | 9,556,787 | |
Accumulated net realized gain (loss) | | | (10,279,568 | ) |
Capital shares | | | 53,697,595 | |
| | |
|
|
|
Net assets, at value | | $ | 58,022,687 | |
| | |
|
|
|
Class 1: | | | | |
Net assets, at value | | $ | 52,841,926 | |
| | |
|
|
|
Shares outstanding | | | 3,400,132 | |
| | |
|
|
|
Net asset value and offering price per share | | $ | 15.54 | |
| | |
|
|
|
Class 2: | | | | |
Net assets, at value | | $ | 5,180,761 | |
| | |
|
|
|
Shares outstanding | | | 335,983 | |
| | |
|
|
|
Net asset value and offering price per share | | $ | 15.42 | |
| | |
|
|
|
See notes to financial statements.
TGI-14
FRANKLIN TEMPLETON VARIABLE INSURANCE PRODUCTS TRUST
TEMPLETON GLOBAL INCOME SECURITIES FUND
Financial Statements (continued)
Statement of Operations
for the year ended December 31, 2003
| | | |
Interest income (net of foreign taxes of $7,986) | | $ | 3,034,021 |
| | |
|
|
Expenses: | | | |
Management fees (Note 3) | | | 345,404 |
Distribution fees - Class 2 (Note 3) | | | 9,820 |
Transfer agent fees | | | 280 |
Custodian fees | | | 31,765 |
Reports to shareholders | | | 23,939 |
Professional fees | | | 16,682 |
Trustees’ fees and expenses | | | 535 |
Other | | | 3,619 |
| | |
|
|
Total expenses | | | 432,044 |
| | |
|
|
Net investment income | | | 2,601,977 |
| | |
|
|
Realized and unrealized gains (losses): | | | |
Net realized gain (loss) from: | | | |
Investments | | | 3,654,666 |
Foreign currency transactions | | | 160,681 |
| | |
|
|
Net realized gain (loss) | | | 3,815,347 |
| | |
|
|
Net unrealized appreciation (depreciation) on: | | | |
Investments | | | 4,915,997 |
Translation of assets and liabilities denominated in foreign currencies | | | 24,640 |
| | |
|
|
Net unrealized appreciation (depreciation) | | | 4,940,637 |
| | |
|
|
Net realized and unrealized gain (loss) | | | 8,755,984 |
| | |
|
|
Net increase (decrease) in net assets resulting from operations | | $ | 11,357,961 |
| | |
|
|
See notes to financial statements.
TGI-15
FRANKLIN TEMPLETON VARIABLE INSURANCE PRODUCTS TRUST
TEMPLETON GLOBAL INCOME SECURITIES FUND
Financial Statements (continued)
Statements of Changes in Net Assets
for the years ended December 31, 2003 and 2002
| | | | | | | | |
| | | 2003
| | | 2002
| |
Increase (decrease) in net assets: | | | | | | | | |
Operations: | | | | | | | | |
Net investment income | | $ | 2,601,977 | | | $ | 2,843,587 | |
Net realized gain (loss) from investments and foreign currency transactions | | | 3,815,347 | | | | 1,188,208 | |
Net unrealized appreciation (depreciation) on investments and translation of assets and liabilities denominated in foreign currencies | | | 4,940,637 | | | | 7,043,474 | |
| | |
|
|
|
Net increase (decrease) in net assets resulting from operations | | | 11,357,961 | | | | 11,075,269 | |
Distributions to shareholders from: | | | | | | | | |
Net investment income: | | | | | | | | |
Class 1 | | | (3,980,291 | ) | | | (721,350 | ) |
Class 2 | | | (323,749 | ) | | | (15,678 | ) |
| | |
|
|
|
Total distributions to shareholders | | | (4,304,040 | ) | | | (737,028 | ) |
Capital share transactions: (Note 2) | | | | | | | | |
Class 1 | | | (4,386,768 | ) | | | (23,182,049 | ) |
Class 2 | | | 2,614,619 | | | | 518,247 | |
| | |
|
|
|
Total capital share transactions | | | (1,772,149 | ) | | | (22,663,802 | ) |
Net increase (decrease) in net assets | | | 5,281,772 | | | | (12,325,561 | ) |
Net assets: | | | | | | | | |
Beginning of year | | | 52,740,915 | | | | 65,066,476 | |
| | |
|
|
|
End of year | | $ | 58,022,687 | | | $ | 52,740,915 | |
| | |
| |
Undistributed net investment income included in net assets: | | | | | | | | |
End of year | | $ | 5,047,873 | | | $ | 3,745,859 | |
| | |
| |
See notes to financial statements.
TGI-16
FRANKLIN TEMPLETON VARIABLE INSURANCE PRODUCTS TRUST
TEMPLETON GLOBAL INCOME SECURITIES FUND
Notes to Financial Statements
1. ORGANIZATION AND SIGNIFICANT ACCOUNTING POLICIES
Franklin Templeton Variable Insurance Products Trust (the Trust) is registered under the Investment Company Act of 1940 as an open-end investment company, consisting of twenty-two separate series (the Funds). The Templeton Global Income Securities Fund (the Fund) included in this report is non-diversified. Shares of the Fund are sold only to insurance company separate accounts to fund the benefits of variable life insurance policies or variable annuity contracts. As of December 31, 2003, 76% of the total Fund shares were sold through one insurance company. The Fund’s investment objective is current income.
The following summarizes the Fund’s significant accounting policies.
a. Security Valuation
Securities listed or traded on a recognized national exchange or NASDAQ are valued at the last reported sales price. Over-the-counter securities and listed securities for which no sale is reported are valued within the range of the latest quoted bid and asked prices. Foreign securities are valued at the close of trading of the foreign exchange or the NYSE, whichever is earlier. If events occur that materially affect the values of securities after the prices or foreign exchange rates are determined, or if market quotations are not readily available, the securities will be valued at fair value as determined following procedures approved by the Board of Trustees.
b. Foreign Currency Translation
Portfolio securities and other assets and liabilities denominated in foreign currencies are translated into U.S. dollars based on the exchange rate of such currencies against U.S. dollars on the date of valuation. Purchases and sales of securities and income items denominated in foreign currencies are translated into U.S. dollars at the exchange rate in effect on the transaction date.
The Fund does not separately report the effect of changes in foreign exchange rates from changes in market prices on securities held. Such changes are included in net realized and unrealized gain or loss from investments.
Realized foreign exchange gains or losses arise from sales of foreign currencies, currency gains or losses realized between the trade and settlement dates on securities transactions and the difference between the recorded amounts of dividends, interest, and foreign withholding taxes and the U.S. dollar equivalent of the amounts actually received or paid. Net unrealized foreign exchange gains and losses arise from changes in foreign exchange rates on foreign denominated assets and liabilities other than investments in securities held at the end of the reporting period.
c. Foreign Currency Contracts
When the Fund purchases or sells foreign securities it may enter into foreign exchange contracts to minimize foreign exchange risk from the trade date to the settlement date of the transactions. A foreign exchange contract is an agreement between two parties to exchange different currencies at an agreed upon exchange rate on a specified date. Realized and unrealized gains and losses are included in the Statement of Operations.
The risks of these contracts include movement in the values of the foreign currencies relative to the U.S. dollar and the possible inability of the counterparties to fulfill their obligations under the contracts.
d. Income Taxes
No provision has been made for income taxes because the Fund’s policy is to qualify as a regulated investment company under the Internal Revenue Code and to distribute substantially all of its taxable income.
TGI-17
FRANKLIN TEMPLETON VARIABLE INSURANCE PRODUCTS TRUST
TEMPLETON GLOBAL INCOME SECURITIES FUND
Notes to Financial Statements (continued)
1. ORGANIZATION AND SIGNIFICANT ACCOUNTING POLICIES (cont.)
e. Security Transactions, Investment Income, Expenses and Distributions
Security transactions are accounted for on trade date. Realized gains and losses on security transactions are determined on a specific identification basis. Certain income from foreign securities is recorded as soon as information is available to the Fund. Interest income and estimated expenses are accrued daily. Discounts and premiums on securities purchased are amortized over the lives of the respective securities. Distributions to shareholders are recorded on the ex-dividend date.
Common expenses incurred by the Trust are allocated among the Funds based on the ratio of net assets of each fund to the combined net assets. Other expenses are charged to each fund on a specific identification basis.
Realized and unrealized gains and losses and net investment income, other than class specific expenses, are allocated daily to each class of shares based upon the relative proportion of net assets of each class.
f. Accounting Estimates
The preparation of financial statements in accordance with accounting principles generally accepted in the United States of America requires management to make estimates and assumptions that affect the reported amounts of assets and liabilities at the date of the financial statements and the amounts of income and expenses during the reporting period. Actual results could differ from those estimates.
g. Guarantees and Indemnifications
Under the Trust’s organizational documents, its officers and trustees are indemnified against certain liability arising out of the performance of their duties to the Trust. Additionally, in the normal course of business, the Trust enters into contracts with service providers that contain general indemnification clauses. The Trust’s maximum exposure under these arrangements is unknown as this would involve future claims that may be made against the Trust that have not yet occurred. However, based on experience, the Trust expects the risk of loss to be remote.
2. SHARES OF BENEFICIAL INTEREST
The Fund offers two classes of shares: Class 1 and Class 2. Each class of shares differs by its distribution fees, voting rights on matters affecting a single class, and its exchange privilege.
At December 31, 2003, there were an unlimited number of shares authorized ($.01 par value). Transactions in the Fund’s shares were as follows:
| | | | | | | | | | | | | | |
| | | Year Ended December 31,
| |
| | | 2003
| | | 2002
| |
| Class 1 Shares: | | Shares
| | | Amount
| | | Shares
| | | Amount
| |
Shares sold | | 157,660 | | | $ | 2,314,617 | | | 256,364 | | | $ | 3,077,773 | |
Shares issued in reinvestment of distributions | | 271,137 | | | | 3,980,291 | | | 60,012 | | | | 721,350 | |
Shares redeemed | | (733,010 | ) | | | (10,681,676 | ) | | (2,210,800 | ) | | | (26,981,172 | ) |
| | |
|
|
Net increase (decrease) | | (304,213 | ) | | $ | (4,386,768 | ) | | (1,894,424 | ) | | $ | (23,182,049 | ) |
| | |
|
|
| Class 2 Shares: | | | | | | | | | | | | |
Shares sold | | 255,207 | | | $ | 3,668,776 | | | 54,900 | | | $ | 671,632 | |
Shares issued in reinvestment of distributions | | 22,205 | | | | 323,749 | | | 1,310 | | | | 15,678 | |
Shares redeemed | | (97,419 | ) | | | (1,377,906 | ) | | (13,677 | ) | | | (169,063 | ) |
| | |
|
|
Net increase (decrease) | | 179,993 | | | $ | 2,614,619 | | | 42,533 | | | $ | 518,247 | |
| | |
|
|
TGI-18
FRANKLIN TEMPLETON VARIABLE INSURANCE PRODUCTS TRUST
TEMPLETON GLOBAL INCOME SECURITIES FUND
Notes to Financial Statements (continued)
3. TRANSACTIONS WITH AFFILIATES
Certain officers and trustees of the Fund are also officers and/or directors of the following entities:
| | |
| Entity | | Affiliation |
|
Franklin Templeton Services LLC (FT Services) | | Administrative manager |
Franklin Advisers Inc. (Advisers) | | Investment manager |
Franklin/Templeton Distributors Inc. (Distributors) | | Principal underwriter |
Franklin/Templeton Investor Services LLC (Investor Services) | | Transfer agent |
The Fund pays an investment management fee to Advisers based on the average daily net assets of the Fund as follows:
| | |
| Annualized Fee Rate | | Net Assets |
|
| .625% | | First $100 million |
| .500% | | Over $100 million, up to and including $250 million |
| .450% | | Over $250 million, up to and including $10 billion |
Fees are further reduced on net assets over $10 billion.
Under an agreement with Advisers, FT Services provides administrative services to the Fund. The fee is paid by Advisers based on the average daily net assets, and is not an additional expense of the Fund.
The Fund reimburses Distributors up to .25% per year of its average daily net assets of Class 2, for costs incurred in marketing the Fund’s shares.
Investor Services, under terms of an agreement, performs shareholder servicing for the Fund and is not paid by the Fund.
4. INCOME TAXES
At December 31, 2003, the Fund had tax basis capital losses of $10,067,343, which may be carried over to offset future capital gains. Such losses expire as follows:
| | | |
2007 | | $ | 5,870,061 |
2008 | | | 2,370,518 |
2009 | | | 1,649,034 |
2010 | | | 177,730 |
| | |
|
|
Total | | $ | 10,067,343 |
| | |
|
|
On December 31, 2003 the Fund had expired capital loss carryovers of $633,271, which were reclassified to paid-in capital.
At December 31, 2003, the Fund has deferred capital losses occurring subsequent to October 31, 2003 of $160,781. For tax purposes, such losses will be reflected in the year ending December 31, 2004.
Net investment income differs for financial statement and tax purposes primarily due to differing treatments of foreign currency transactions and bond discounts and premiums.
Net realized gains and losses differ for financial statement and tax purposes primarily due to differing treatments of wash sales, foreign currency transactions, and bond discounts and premiums.
TGI-19
FRANKLIN TEMPLETON VARIABLE INSURANCE PRODUCTS TRUST
TEMPLETON GLOBAL INCOME SECURITIES FUND
Notes to Financial Statements (continued)
4. INCOME TAXES (cont.)
The tax character of distributions paid during the years ended December 31, 2003 and 2002, was as follows:
| | | | | | |
| | | 2003
| | 2002
|
Distributions paid from: | | | | | | |
Ordinary income | | $ | 4,304,040 | | $ | 737,028 |
Long term capital gain | | | — | | | — |
| | |
|
|
| | | $ | 4,304,040 | | $ | 737,028 |
| | |
|
|
At December 31, 2003, the cost of investments, net unrealized appreciation (depreciation), undistributed ordinary income and undistributed long term capital gains for income tax purposes were as follows:
| | | | |
Cost of investments | | $ | 47,708,770 | |
| | |
|
|
|
Unrealized appreciation | | $ | 9,098,185 | |
Unrealized depreciation | | | (230,429 | ) |
| | |
|
|
|
Net unrealized appreciation (depreciation) | | $ | 8,867,756 | |
| | |
|
|
|
Undistributed ordinary income | | $ | 5,603,410 | |
Undistributed long term capital gains | | | — | |
| | |
|
|
|
Distributable earnings | | $ | 5,603,410 | |
| | |
|
|
|
5. INVESTMENT TRANSACTIONS
Purchases and sales of investments (excluding short-term securities) for the year ended December 31, 2003 aggregated $28,184,223 and $29,905,911, respectively.
6. REGULATORY MATTERS
On February 4, 2004, the Securities Division of the Office of the Secretary of the Commonwealth of Massachusetts filed an administrative complaint against Franklin Resources, Inc. and certain of its subsidiaries (the “Company”), alleging violations of the Massachusetts Uniform Securities Act. The complaint arises from activity that occurred in 2001 during which time an officer of a Company subsidiary was negotiating an agreement with an investor relating to investments in a mutual fund and a hedge fund.
The Company, in addition to other entities within Franklin Templeton Investments, has been named in shareholder class actions related to the matter described above. The Company believes that the claims made in the lawsuit are without merit and it intends to defend vigorously against the allegations. The Company and the Fund may be named in similar civil actions related to the matter described above.
In addition, as part of ongoing investigations by the U.S. Securities and Exchange Commission (the “SEC”), the U.S. Attorney for the Northern District of California, the New York Attorney General, the California Attorney General, the U.S. Attorney for the District of Massachusetts, the Florida Department of Financial Services, and the Commissioner of Securities and the Attorney General of the State of West Virginia, relating to certain practices in the mutual fund industry, including late trading, market timing and sales compensation arrangements, the Company and its subsidiaries, as well as certain current or former executives and employees of the Company, have received requests for information and/or subpoenas to testify or produce documents. The Company and its current employees are providing documents and information in response to these requests and subpoenas. In addition, the Company has responded to requests for similar kinds of information from regulatory authorities in some of the foreign countries where the Company conducts its global asset management business.
TGI-20
FRANKLIN TEMPLETON VARIABLE INSURANCE PRODUCTS TRUST
TEMPLETON GLOBAL INCOME SECURITIES FUND
Notes to Financial Statements (continued)
6. REGULATORY MATTERS (cont.)
The Staff of the SEC has informed the Company that it intends to recommend that the Commission authorize an action against the Fund’s investment adviser and a senior executive officer relating to the frequent trading issues that are the subject of the SEC’s investigation. These issues were previously disclosed as being under investigation by government authorities and the subject of an internal inquiry by the Company in its Annual Report on Form 10-K and on its public website. The Company currently is in discussions with the SEC Staff in an effort to resolve the issues raised in their investigation. Such discussions are preliminary and the Fund’s management has been advised that the Company cannot predict the likelihood of whether those discussions will result in a settlement and, if so, the terms of such settlement. The impact, if any, of these matters on the Fund is uncertain at this time. If the Company finds that it bears responsibility for any unlawful or improper conduct, it has committed to making the Fund or its shareholders whole, as appropriate.
TGI-21
FRANKLIN TEMPLETON VARIABLE INSURANCE PRODUCTS TRUST
TEMPLETON GLOBAL INCOME SECURITIES FUND
Independent Auditors’ Report
To the Board of Trustees and Shareholders of
Franklin Templeton Variable Insurance Products Trust
In our opinion, the accompanying statement of assets and liabilities, including the statement of investments, and the related statements of operations and of changes in net assets and the financial highlights present fairly, in all material respects, the financial position of the Templeton Global Income Securities Fund (the Fund) (one of the funds constituting the Franklin Templeton Variable Insurance Products Trust) at December 31, 2003, the results of its operations for the year then ended, the changes in its net assets for each of the two years in the period then ended and the financial highlights for each of the periods presented, in conformity with accounting principles generally accepted in the United States of America. These financial statements and financial highlights (hereafter referred to as “financial statements”) are the responsibility of the Fund’s management; our responsibility is to express an opinion on these financial statements based on our audits. We conducted our audits of these financial statements in accordance with auditing standards generally accepted in the United States of America, which require that we plan and perform the audits to obtain reasonable assurance about whether the financial statements are free of material misstatement. An audit includes examining, on a test basis, evidence supporting the amounts and disclosures in the financial statements, assessing the accounting principles used and significant estimates made by management, and evaluating the overall financial statement presentation. We believe that our audits, which included confirmation of securities at December 31, 2003 by correspondence with the custodian and brokers, provide a reasonable basis for our opinion.
PricewaterhouseCoopers LLP
San Francisco, California
February 5, 2004, except for Note 6 as to which the date is February 12, 2004
TGI-22
FRANKLIN TEMPLETON VARIABLE INSURANCE PRODUCTS TRUST
TEMPLETON GLOBAL INCOME SECURITIES FUND
Tax Designation (unaudited)
At December 31, 2003, more than 50% of the Fund’s total assets were invested in securities of foreign issuers. In most instances, foreign taxes were withheld from interest paid to the Fund on these investments. The Fund elects to treat foreign taxes paid under Section 853 of the Internal Revenue Code. This election will allow shareholders of record in June, 2004, to treat their proportionate share of foreign taxes paid by the Fund as having been paid directly by them. The shareholder shall consider these amounts as foreign taxes paid in the tax year in which they receive the Fund distribution.
The foreign tax information will be disclosed in the June 30, 2004 semi-annual report of the Fund.
TGI-23
TEMPLETON GROWTH SECURITIES FUND
Fund Goal and Primary Investments: Templeton Growth Securities Fund seeks long-term capital growth. The Fund invests mainly in equity securities of companies located anywhere in the world, including those in the U.S. and emerging markets.
This annual report for Templeton Growth Securities Fund covers the period ended December 31, 2003.
Performance Overview
You can find the Fund’s one-year total return in the Performance Summary following this report. The Fund underperformed its benchmark, the Morgan Stanley Capital International (MSCI) All Country World Free Index, which returned 34.63% for the year under review.1
Economic and Market Overview
In spring 2003, the end of major conflict in Iraq coincided with the start of a global equity market rally that produced the strongest annual total returns since 1986. The rally’s main catalyst was an improving global economy, underpinned by expansionary fiscal and monetary policies, corporate restructuring and consolidation, and more than two years of declining equity valuations that created potential opportunities in Asia, Europe and the Americas.
In many countries, including the U.S., China and Japan, gross domestic product (GDP) growth accelerated in 2003, particularly in the second half of the year. In the U.S., GDP grew at annualized rates of 3.1% and 8.2% in the second and third quarters. Over the same periods, consumer spending rose at annualized rates of 3.3% and 6.9% spurred largely by tax cuts, car-buying incentives and mortgage refinancing, as interest rates remained at the lowest level in more than four decades. Industrial production increased in the U.S., China, Japan and South Korea in the second half of the year, as did consumer sentiment in the U.S., U.K., Germany and Sweden, and business sentiment in the U.S., Australia, Germany and Japan. In short, a synchronized global economic recovery gained momentum in the second half of 2003.
Further evidence of this recovery was the continued rise in the prices of base metals and other commodities. This was due, in part, to greater demand in China. On December 31, 2003, contracts for aluminum and other metals such silver, gold, copper and zinc were anywhere from
1. Source: Standard & Poor’s Micropal. One cannot invest directly in an index, nor is an index representative of the Fund’s portfolio. Please see Index Descriptions following the Fund Summaries.
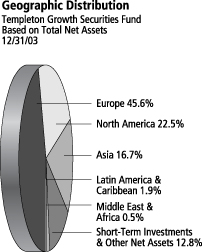
TG-1
19% to 50% higher than 12 months before.2 While gold crossed the $400-an-ounce threshold for the first time in more than seven years, such agricultural commodities as cotton and soybeans gained approximately 40%.2 Despite rising commodities prices, global inflation remained subdued throughout the year.
In 2003, the value of the U.S. dollar fell against most major currencies, including a 17% decline versus the euro.3 While the decline magnified top-line and earnings-per-share growth in the U.S., it had the opposite effect in Europe. The dollar decline also benefited U.S. investors in international equities because it increased the returns of investments denominated in currencies that appreciated against the dollar, such as the euro. Although the dollar’s decline significantly affected equity market returns, it was not the only reason for the past year’s gains. Equity markets in many countries, including emerging market countries, produced stronger gains than the U.S. equity market, even in their local currencies. These countries benefited from the improving economic and financial market conditions in 2003.
Investment Strategy
Our investment philosophy is bottom-up, value-oriented and long-term. In choosing investments, we will focus on the market price of a company’s securities relative to our evaluation of the company’s potential long-term earnings, asset value and cash flow. Among factors we consider are a company’s historical value measures, including price/earnings ratio, profit margins and liquidation value. We do in-depth research to construct a bargain list from which we buy.
Manager’s Discussion
During the year under review, Fund performance benefited from several areas of the market. For example, the Fund’s energy and utilities sector exposure contributed to performance, as our holdings in those sectors outperformed the benchmark MSCI All Country World Free Index.4 Our health care holdings also outperformed the overall index, and during the period, we purchased shares of such health care sector companies as pharmaceuticals GlaxoSmithKline, Aventis and Novartis. In addition, the Fund’s consumer discretionary holdings benefited relative performance as they outperformed the benchmark index’s return.5
2. Source: Reuters, Commodity Research Bureau Index; London Metal Exchange.
3. Source: European Central Bank.
4. The energy sector comprises energy equipment and services, and oil and gas, and the utilities sector comprises electric utilities, gas utilities and multi-utilities in the Statement of Investments.
5. The consumer discretionary sector comprises automobiles; hotels, restaurants and leisure; household durables; media; multi-line retail and specialty retail in the Statement of Investments.
TG-2
From a regional standpoint, our relatively overweighted European exposure benefited Fund performance, as did the fact that many of our specific European holdings outperformed the index’s European stocks.
Hindering the Fund’s performance relative to the index were the Fund’s materials sector holdings, which underperformed those of the index during the fiscal year.6 In addition, the consumer staples sector underperformed the index; therefore, our exposure to that sector detracted from overall performance.7 Regionally, our Asian holdings, which underperformed those of the index during the period, hindered relative performance.
We generally found more value in European and Asian stocks, which traded at 13 times estimated 2004 earnings at period-end, than in U.S. stocks, which traded at 18 times estimated 2004 earnings at period-end. Consistent with our strategy, during the fiscal year we sold for a profit shares of EMC, Volvo, Komatsu, BHP Billiton, Burlington Resources, Mylan Labs and Merrill Lynch, and we purchased shares of TDC, BP PLC, Unilever, Nintendo, Reuters, National Grid and Reed Elsevier.
Thank you for your participation in Templeton Growth Securities Fund. We look forward to serving your future investment needs.
6. The materials sector comprises chemicals, containers and packaging, metals and mining, and paper and forest products in the Statement of Investments.
7. The consumer staples sector comprises food products in the Statement of Investments.
This discussion reflects our analysis, opinions and portfolio holdings as of December 31, 2003, the end of the reporting period. The way we implement our main investment strategies and the resulting portfolio holdings may change depending on factors such as market and economic conditions. These opinions may not be relied upon as investment advice or an offer for a particular security. The information is not a complete analysis of every aspect of any market, country, industry, security or the Fund. Statements of fact are from sources considered reliable, but the advisor makes no representation or warranty as to their completeness or accuracy. Although historical performance is no guarantee of future results, these insights may help you understand our investment management philosophy.
Top 10 Holdings
Templeton Growth Securities Fund 12/31/03
| | |
Company
Sector/Industry,
Country | | % of Total
Net Assets |
|
| |
| BP PLC | | 1.8% |
| Oil & Gas, U.K. | | |
| |
| Shell Transport & Trading Co. PLC | | 1.7% |
| Oil & Gas, U.K. | | |
| |
| E.ON AG | | 1.7% |
| Electric Utilities, Germany | | |
| |
| Bristol-Myers Squibb Co. | | 1.6% |
| Pharmaceuticals, U.S. | | |
| |
| Aventis SA | | 1.6% |
| Pharmaceuticals, France | | |
| |
| Eni SpA | | 1.6% |
| Oil & Gas, Italy | | |
| |
| Nestle SA | | 1.6% |
| Food Products, Switzerland | | |
| |
| GlaxoSmithKline PLC | | 1.5% |
| Pharmaceuticals, U.K. | | |
| |
| J Sainsbury PLC | | 1.4% |
| Food & Drug Retailing, U.K. | | |
| |
| Cheung Kong Holdings Ltd. | | 1.3% |
| Real Estate, Hong Kong | | |
The dollar value, number of shares or principal amount, and complete legal titles of all portfolio holdings are listed in the Fund’s Statement of Investments.
TG-3
PERFORMANCE SUMMARYASOF 12/31/03
Total return of Class 2 shares represents the average annual change in value, assuming reinvestment of dividends and capital gains. Average returns smooth out variations in returns, which can be significant; they are not the same as year-by-year results.
Templeton Growth Securities Fund – Class 2*
Periods ended 12/31/03
| | | | | | |
| | | 1-Year | | 5-Year | | Since
Inception
(3/15/94) |
|
| | | |
Average Annual Total Return | | +32.13% | | +5.44% | | +8.74% |
*Because Class 2 shares were not offered until 1/6/99, standardized Class 2 Fund performance for prior periods represents the historical results of Class 1 shares. For periods beginning on 1/6/99, Class 2’s results reflect an additional 12b-1 fee expense, which also affects future performance. Since 1/6/99 (effective date), the average annual total return of Class 2 shares was +4.66%.
Ongoing market volatility can significantly affect short-term performance; recent returns may differ.
Total Return Index Comparison
for Hypothetical $10,000 Investment (3/15/94–12/31/03)
The graph compares the performance of Templeton Growth Securities Fund – Class 2* and the MSCI All Country World Free Index. One cannot invest directly in an index, nor is an index representative of the Fund’s portfolio. Please see Important Notes to Performance Information preceding the Fund Summaries.
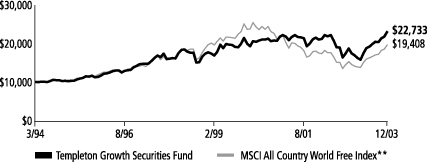
**Source: Standard & Poor’s Micropal. Please see Index Descriptions following the Fund Summaries.
Templeton Growth Securities Fund – Class 2
Performance reflects the Fund’s Class 2 operating expenses, but does not include any contract fees, expenses or sales charges. If they had been included, performance would be lower. These charges and deductions, particularly for variable life policies, can have a significant effect on contract values and insurance benefits. See the contract prospectus for a complete description of these expenses, including sales charges.
Since markets can go down as well as up, investment return and the value of your principal will fluctuate with market conditions, and you may have a gain or loss when you sell your shares.
Past performance does not guarantee future results.
TG-4
TEMPLETON GROWTH SECURITIES FUND
(FRANKLIN TEMPLETON VARIABLE INSURANCE PRODUCTS TRUST)
SUPPLEMENT DATED DECEMBER 17, 2003
TOTHE PROSPECTUS DATED MAY 1, 2003
The prospectus is amended by replacing the MANAGEMENT section (page TG-5) with the following:
MANAGEMENT
Templeton Global Advisors Limited (TGAL), Lyford Cay, Nassau, Bahamas, is the Fund’s investment manager. Under an agreement with TGAL, Templeton Asset Management Limited (TAML), #7 Temasek Boulevard #38-3, Suntec Tower One, Singapore 038987, serves as the fund’s sub-advisor. TAML provides TGAL with investment management advice and assistance.
MANAGEMENT TEAM The team responsible for the Fund’s management is:
| | |
| |
Alan Chua, CFA PORTFOLIO MANAGER, TAML | | Mr. Chua has been a manager of the Fund since January 2004 and has been with Franklin Templeton Investments since 2000. Previously, he was an associate director with UBS Asset Management. |
| |
Dale Winner, CFA SENIOR VICE PRESIDENT, TGAL | | Mr. Winner has been a manager of the Fund since 2001, and has been with Franklin Templeton Investments since 1995. |
| |
Murdo Murchison, CFA EXECUTIVE VICE PRESIDENT, TGAL | | Mr. Murchison has been a manager of the Fund since 2001, and has been with Franklin Templeton Investments since 1993. |
The Fund pays TGAL a fee for managing its assets and providing certain administrative facilities and services to the Fund. For the fiscal year ended December 31, 2002, the Fund paid 0.81% of its average net assets to TGAL for its services.
Please keep this supplement for future reference.
TG-5
FRANKLIN TEMPLETON VARIABLE INSURANCE PRODUCTS TRUST
TEMPLETON GROWTH SECURITIES FUND
Financial Highlights
| | | | | | | | | | | | | | | | | | | | |
| | | Class 1
| |
| | | Year Ended December 31,
| |
| | | 2003 | | | 2002 | | | 2001 | | | 2000 | | | 1999 | |
| | |
|
|
|
Per share operating performance | | | | | | | | | | | | | | | | | | | | |
(For a share outstanding throughout the year) | | | | | | | | | | | | | | | | | | | | |
Net asset value, beginning of year | | $ | 8.67 | | | $ | 11.09 | | | $ | 13.76 | | | $ | 15.63 | | | $ | 14.77 | |
| | |
|
|
|
Income from investment operations: | | | | | | | | | | | | | | | | | | | | |
Net investment incomea | | | .17 | | | | .17 | | | | .26 | | | | .30 | | | | .28 | |
Net realized and unrealized gains (losses) | | | 2.63 | | | | (2.13 | ) | | | (.36 | ) | | | (.15 | ) | | | 2.66 | |
| | |
|
|
|
Total from investment operations | | | 2.80 | | | | (1.96 | ) | | | (.10 | ) | | | .15 | | | | 2.94 | |
| | |
|
|
|
Less distributions from: | | | | | | | | | | | | | | | | | | | | |
Net investment income | | | (.16 | ) | | | (.24 | ) | | | (.28 | ) | | | (.27 | ) | | | (.36 | ) |
Net realized gains | | | — | | | | (.22 | ) | | | (2.29 | ) | | | (1.75 | ) | | | (1.72 | ) |
| | |
|
|
|
Total distributions | | | (.16 | ) | | | (.46 | ) | | | (2.57 | ) | | | (2.02 | ) | | | (2.08 | ) |
| | |
|
|
|
Net asset value, end of year | | $ | 11.31 | | | $ | 8.67 | | | $ | 11.09 | | | $ | 13.76 | | | $ | 15.63 | |
| | |
|
|
|
| | | | | |
Total returnb | | | 32.62% | | | | (18.32)% | | | | (.98)% | | | | 1.74% | | | | 21.04% | |
Ratios/supplemental data | | | | | | | | | | | | | | | | | | | | |
Net assets, end of year (000’s) | | $ | 769,339 | | | $ | 665,537 | | | $ | 966,725 | | | $ | 1,163,637 | | | $ | 708,310 | |
Ratios to average net assets: | | | | | | | | | | | | | | | | | | | | |
Expenses | | | .88% | | | | .87% | | | | .85% | | | | .88% | | | | .88% | |
Net investment income | | | 1.74% | | | | 1.69% | | | | 2.13% | | | | 2.18% | | | | 1.87% | |
Portfolio turnover rate | | | 37.43% | | | | 30.67% | | | | 31.05% | | | | 69.67% | | | | 46.54% | |
aBased on average daily shares outstanding.
bTotal return does not include any fees, charges or expenses imposed by the variable annuity and life insurance contracts for which the Franklin Templeton Variable Insurance Products Trust serves as an underlying investment vehicle. Total return is not annualized for periods less than one year.
TG-6
FRANKLIN TEMPLETON VARIABLE INSURANCE PRODUCTS TRUST
TEMPLETON GROWTH SECURITIES FUND
Financial Highlights (continued)
| | | | | | | | | | | | | | | | | | | | |
| | | Class 2
| |
| | | Year Ended December 31,
| |
| | | 2003 | | | 2002 | | | 2001 | | | 2000 | | | 1999c | |
| | |
|
|
|
Per share operating performance | | | | | | | | | | | | | | | | | | | | |
(For a share outstanding throughout the year) | | | | | | | | | | | | | | | | | | | | |
Net asset value, beginning of year | | $ | 8.59 | | | $ | 11.01 | | | $ | 13.69 | | | $ | 15.60 | | | $ | 15.34 | |
| | |
|
|
|
Income from investment operations: | | | | | | | | | | | | | | | | | | | | |
Net investment incomea | | | .13 | | | | .13 | | | | .21 | | | | .25 | | | | .17 | |
Net realized and unrealized gains (losses) | | | 2.62 | | | | (2.10 | ) | | | (.34 | ) | | | (.15 | ) | | | 2.17 | |
| | |
|
|
|
Total from investment operations | | | 2.75 | | | | (1.97 | ) | | | (.13 | ) | | | .10 | | | | 2.34 | |
| | |
|
|
|
Less distributions from: | | | | | | | | | | | | | | | | | | | | |
Net investment income | | | (.15 | ) | | | (.23 | ) | | | (.26 | ) | | | (.26 | ) | | | (.36 | ) |
Net realized gains | | | — | | | | (.22 | ) | | | (2.29 | ) | | | (1.75 | ) | | | (1.72 | ) |
| | |
|
|
|
Total distributions | | | (.15 | ) | | | (.45 | ) | | | (2.55 | ) | | | (2.01 | ) | | | (2.08 | ) |
| | |
|
|
|
Net asset value, end of year | | $ | 11.19 | | | $ | 8.59 | | | $ | 11.01 | | | $ | 13.69 | | | $ | 15.60 | |
| | |
|
|
|
| | | | | |
Total returnb | | | 32.13% | | | | (18.49)% | | | | (1.31)% | | | | 1.47% | | | | 16.35% | |
Ratios/supplemental data | | | | | | | | | | | | | | | | | | | | |
Net assets, end of year (000’s) | | $ | 511,659 | | | $ | 190,054 | | | $ | 113,925 | | | $ | 79,043 | | | $ | 4,483 | |
Ratios to average net assets: | | | | | | | | | | | | | | | | | | | | |
Expenses | | | 1.13% | | | | 1.12% | | | | 1.10% | | | | 1.12% | | | | 1.14% | d |
Net investment income | | | 1.49% | | | | 1.44% | | | | 1.80% | | | | 1.87% | | | | 1.17% | d |
Portfolio turnover rate | | | 37.43% | | | | 30.67% | | | | 31.05% | | | | 69.67% | | | | 46.54% | |
| a | Based on average daily shares outstanding. |
| b | Total return does not include any fees, charges or expenses imposed by the variable annuity and life insurance contracts for which the Franklin Templeton Variable Insurance Products Trust serves as an underlying investment vehicle. Total return is not annualized for periods less than one year. |
| c | For the period January 6, 1999 (effective date) to December 31, 1999. |
See notes to financial statements.
TG-7
FRANKLIN TEMPLETON VARIABLE INSURANCE PRODUCTS TRUST
TEMPLETON GROWTH SECURITIES FUND
Statement of Investments, December 31, 2003
| | | | | | | |
| | | COUNTRY | | SHARES | | VALUE |
|
Common Stocks 85.9% | | | | | | | |
Aerospace & Defense 2.6% | | | | | | | |
BAE Systems PLC | | United Kingdom | | 3,247,043 | | $ | 9,779,900 |
BAE Systems PLC, 144A | | United Kingdom | | 35,823 | | | 107,897 |
Boeing Co. | | United States | | 289,000 | | | 12,178,460 |
Rolls-Royce Group PLC | | United Kingdom | | 3,661,602 | | | 11,618,463 |
| | | | | | |
|
|
| | | | | | | | 33,684,720 |
| | | | | | |
|
|
Airlines .8% | | | | | | | |
Singapore Airlines Ltd. | | Singapore | | 1,560,100 | | | 10,288,595 |
| | | | | | |
|
|
Automobiles .7% | | | | | | | |
Volkswagen AG | | Germany | | 165,400 | | | 9,252,636 |
| | | | | | |
|
|
Banks 7.5% | | | | | | | |
Abbey National PLC | | United Kingdom | | 1,703,959 | | | 16,197,387 |
DBS Group Holdings Ltd. | | Singapore | | 725,000 | | | 6,275,393 |
HSBC Holdings PLC | | Hong Kong | | 461,601 | | | 7,283,492 |
Kookmin Bank | | South Korea | | 323,500 | | | 12,122,765 |
Lloyds TSB Group PLC | | United Kingdom | | 1,924,424 | | | 15,433,701 |
Nordea AB | | Sweden | | 1,610,770 | | | 12,088,666 |
Standard Chartered PLC | | United Kingdom | | 691,455 | | | 11,418,830 |
UBS AG | | Switzerland | | 213,966 | | | 14,653,665 |
| | | | | | |
|
|
| | | | | | | | 95,473,899 |
| | | | | | |
|
|
Chemicals 3.7% | | | | | | | |
Akzo Nobel NV | | Netherlands | | 355,200 | | | 13,709,788 |
BASF AG | | Germany | | 145,200 | | | 8,195,888 |
Bayer AG, Br. | | Germany | | 418,290 | | | 12,346,097 |
Syngenta AG | | Switzerland | | 196,100 | | | 13,208,110 |
| | | | | | |
|
|
| | | | | | | | 47,459,883 |
| | | | | | |
|
|
Commercial Services & Supplies 1.7% | | | | | | | |
Brambles Industries PLC | | United Kingdom | | 1,784,500 | | | 6,500,882 |
Securitas AB | | Sweden | | 503,790 | | | 6,791,604 |
Waste Management Inc. | | United States | | 297,408 | | | 8,803,277 |
| | | | | | |
|
|
| | | | | | | | 22,095,763 |
| | | | | | |
|
|
Computers & Peripherals .3% | | | | | | | |
Hewlett-Packard Co. | | United States | | 144,590 | | | 3,321,232 |
| | | | | | |
|
|
Containers & Packaging .3% | | | | | | | |
Temple-Inland Inc. | | United States | | 59,950 | | | 3,757,067 |
| | | | | | |
|
|
Diversified Financials 2.5% | | | | | | | |
Morgan Stanley | | United States | | 100,000 | | | 5,787,000 |
Nomura Holdings Inc. | | Japan | | 899,000 | | | 15,309,088 |
Swire Pacific Ltd., A | | Hong Kong | | 1,748,800 | | | 10,789,778 |
| | | | | | |
|
|
| | | | | | | | 31,885,866 |
| | | | | | |
|
|
Diversified Telecommunication Services 7.1% | | | | | | | |
BCE Inc. | | Canada | | 344,317 | | | 7,700,338 |
KT Corp., ADR | | South Korea | | 688,360 | | | 13,127,025 |
Nippon Telegraph & Telephone Corp. | | Japan | | 3,501 | | | 16,889,213 |
Portugal Telecom SGPS SA | | Portugal | | 543,450 | | | 5,470,145 |
SBC Communications Inc. | | United States | | 441,280 | | | 11,504,170 |
TDC AS | | Denmark | | 430,274 | | | 15,525,332 |
TG-8
FRANKLIN TEMPLETON VARIABLE INSURANCE PRODUCTS TRUST
TEMPLETON GROWTH SECURITIES FUND
Statement of Investments, December 31, 2003 (cont.)
| | | | | | | |
| | | COUNTRY | | SHARES | | VALUE |
|
Common Stocks (cont.) | | | | | | | |
Diversified Telecommunication Services (cont) | | | | | | | |
aTelefonica SA | | Spain | | 540,160 | | $ | 7,930,704 |
Telefonos de Mexico SA de CV (Telmex), L, ADR | | Mexico | | 368,216 | | | 12,162,174 |
| | | | | | |
|
|
| | | | | | | | 90,309,101 |
| | | | | | |
|
|
Electric Utilities 4.2% | | | | | | | |
E.On AG | | Germany | | 323,600 | | | 21,196,453 |
Endesa SA | | Spain | | 600,000 | | | 11,541,372 |
Hong Kong Electric Holdings Ltd. | | Hong Kong | | 2,680,498 | | | 10,599,630 |
Iberdrola SA, Br. | | Spain | | 331,200 | | | 6,546,297 |
Korea Electric Power Corp. | | South Korea | | 229,100 | | | 4,114,763 |
| | | | | | |
|
|
| | | | | | | | 53,998,515 |
| | | | | | |
|
|
Electronic Equipment & Instruments 1.6% | | | | | | | |
aCelestica Inc. | | Canada | | 445,040 | | | 6,706,753 |
Hitachi Ltd. | | Japan | | 2,191,500 | | | 13,209,937 |
| | | | | | |
|
|
| | | | | | | | 19,916,690 |
| | | | | | |
|
|
Energy Equipment & Services .9% | | | | | | | |
aNoble Corp. | | United States | | 327,600 | | | 11,721,528 |
| | | | | | |
|
|
Food & Drug Retailing 3.3% | | | | | | | |
Albertson’s Inc. | | United States | | 537,800 | | | 12,181,170 |
J Sainsbury PLC | | United Kingdom | | 3,133,140 | | | 17,541,568 |
aKroger Co. | | United States | | 654,190 | | | 12,109,057 |
| | | | | | |
|
|
| | | | | | | | 41,831,795 |
| | | | | | |
|
|
Food Products 5.5% | | | | | | | |
Cadbury Schweppes PLC | | United Kingdom | | 1,880,000 | | | 13,806,949 |
General Mills Inc. | | United States | | 205,670 | | | 9,316,851 |
H.J. Heinz Co. | | United States | | 278,585 | | | 10,148,852 |
Nestle SA | | Switzerland | | 80,399 | | | 20,087,561 |
Unilever NV | | Netherlands | | 263,257 | | | 17,217,300 |
| | | | | | |
|
|
| | | | | | | | 70,577,513 |
| | | | | | |
|
|
Gas Utilities .5% | | | | | | | |
TransCanada Corp. | | Canada | | 300,000 | | | 6,472,432 |
| | | | | | |
|
|
Health Care Providers & Services .6% | | | | | | | |
AmerisourceBergen Corp. | | United States | | 3,400 | | | 190,910 |
CIGNA Corp. | | United States | | 126,750 | | | 7,288,125 |
HCA Inc. | | United States | | 3,500 | | | 150,360 |
| | | | | | |
|
|
| | | | | | | | 7,629,395 |
| | | | | | |
|
|
Hotels Restaurants & Leisure 1.2% | | | | | | | |
Accor SA | | France | | 213,300 | | | 9,658,767 |
Carnival Corp. | | United States | | 157,373 | | | 6,252,429 |
| | | | | | |
|
|
| | | | | | | | 15,911,196 |
| | | | | | |
|
|
Household Durables 1.5% | | | | | | | |
Koninklijke Philips Electronics NV | | Netherlands | | 315,570 | | | 9,214,740 |
Sony Corp. | | Japan | | 299,100 | | | 10,354,213 |
| | | | | | |
|
|
| | | | | | | | 19,568,953 |
| | | | | | |
|
|
TG-9
FRANKLIN TEMPLETON VARIABLE INSURANCE PRODUCTS TRUST
TEMPLETON GROWTH SECURITIES FUND
Statement of Investments, December 31, 2003 (cont.)
| | | | | | | |
| | | COUNTRY | | SHARES | | VALUE |
|
Common Stocks (cont.) | | | | | | | |
Industrial Conglomerates 1.9% | | | | | | | |
Hutchison Whampoa Ltd. | | Hong Kong | | 1,068,000 | | $ | 7,875,599 |
Smiths Group PLC | | United Kingdom | | 850,100 | | | 10,059,184 |
Tyco International Ltd. | | United States | | 262,920 | | | 6,967,380 |
| | | | | | |
|
|
| | | | | | | | 24,902,163 |
| | | | | | |
|
|
Insurance 4.4% | | | | | | | |
Ace Ltd. | | Bermuda | | 302,000 | | | 12,508,840 |
AXA SA | | France | | 348,340 | | | 7,456,269 |
Swiss Reinsurance Co. | | Switzerland | | 223,730 | | | 15,105,280 |
Willis Group Holdings Ltd. | | United States | | 270,398 | | | 9,212,460 |
XL Capital Ltd., A | | Bermuda | | 155,300 | | | 12,043,515 |
| | | | | | |
|
|
| | | | | | | | 56,326,364 |
| | | | | | |
|
|
IT Consulting & Services 1.4% | | | | | | | |
Electronic Data Systems Corp. | | United States | | 525,302 | | | 12,890,911 |
Satyam Computers Services Ltd. | | India | | 686,066 | | | 5,523,865 |
| | | | | | |
|
|
| | | | | | | | 18,414,776 |
| | | | | | |
|
|
Machinery | | | | | | | |
Volvo AB, B | | Sweden | | 993 | | | 30,362 |
| | | | | | |
|
|
Media 3.5% | | | | | | | |
Pearson PLC | | United Kingdom | | 1,063,752 | | | 11,844,646 |
Reed Elsevier NV | | Netherlands | | 1,005,800 | | | 12,496,380 |
Reuters Group PLC | | United Kingdom | | 2,141,933 | | | 9,010,835 |
aTime Warner Inc. | | United States | | 300,000 | | | 5,397,000 |
Wolters Kluwer NV | | Netherlands | | 349,853 | | | 5,471,969 |
| | | | | | |
|
|
| | | | | | | | 44,220,830 |
| | | | | | |
|
|
Metals & Mining 1.8% | | | | | | | |
Barrick Gold Corp. | | Canada | | 348,800 | | | 7,921,248 |
BHP Billiton PLC | | United Kingdom | | 1,065,996 | | | 9,312,509 |
POSCO | | South Korea | | 39,792 | | | 5,443,639 |
| | | | | | |
|
|
| | | | | | | | 22,677,396 |
| | | | | | |
|
|
Multi-Utilities 1.3% | | | | | | | |
National Grid Transco PLC | | United Kingdom | | 2,334,378 | | | 16,726,066 |
| | | | | | |
|
|
Multiline Retail .4% | | | | | | | |
Marks & Spencer Group PLC | | United Kingdom | | 1,099,900 | | | 5,690,394 |
| | | | | | |
|
|
Oil & Gas 5.8% | | | | | | | |
BP PLC | | United Kingdom | | 2,873,817 | | | 23,304,973 |
Eni SpA | | Italy | | 1,081,305 | | | 20,404,040 |
Repsol YPF SA | | Spain | | 424,530 | | | 8,278,549 |
Shell Transport & Trading Co. PLC | | United Kingdom | | 2,982,593 | | | 22,184,841 |
| | | | | | |
|
|
| | | | | | | | 74,172,403 |
| | | | | | |
|
|
Paper & Forest Products 3.2% | | | | | | | |
Bowater Inc. | | United States | | 191,800 | | | 8,882,258 |
International Paper Co. | | United States | | 240,000 | | | 10,346,400 |
Stora Enso OYJ, R | | Finland | | 763,800 | | | 10,289,334 |
UPM-Kymmene Corp. | | Finland | | 624,400 | | | 11,908,335 |
| | | | | | |
|
|
| | | | | | | | 41,426,327 |
| | | | | | |
|
|
TG-10
FRANKLIN TEMPLETON VARIABLE INSURANCE PRODUCTS TRUST
TEMPLETON GROWTH SECURITIES FUND
Statement of Investments, December 31, 2003 (cont.)
| | | | | | | | |
| | | COUNTRY | | SHARES | | | VALUE |
|
Common Stocks (cont.) | | | | | | | | |
Pharmaceuticals 8.8% | | | | | | | | |
Abbott Laboratories | | United States | | 283,510 | | | $ | 13,211,566 |
Aventis SA | | France | | 308,743 | | | | 20,406,323 |
Bristol-Myers Squibb Co. | | United States | | 737,730 | | | | 21,099,078 |
GlaxoSmithKline PLC | | United Kingdom | | 815,888 | | | | 18,695,273 |
Novartis AG | | Switzerland | | 297,700 | | | | 13,515,953 |
Pfizer Inc. | | United States | | 420,000 | | | | 14,838,600 |
aShire Pharmaceuticals Group PLC | | United Kingdom | | 1,111,940 | | | | 10,798,723 |
| | | | | | | |
|
|
| | | | | | | | | 112,565,516 |
| | | | | | | |
|
|
Real Estate 1.3% | | | | | | | | |
Cheung Kong Holdings Ltd. | | Hong Kong | | 2,166,499 | | | | 17,231,866 |
| | | | | | | |
|
|
Semiconductors & Semiconductor Equipment .8% | | | | | | | | |
Samsung Electronics Co. Ltd. | | South Korea | | 26,320 | | | | 9,962,501 |
| | | | | | | |
|
|
Software 1.7% | | | | | | | | |
aCheck Point Software Technologies Ltd. | | Israel | | 390,510 | | | | 6,568,378 |
Nintendo Co. Ltd. | | Japan | | 160,000 | | | | 14,929,551 |
| | | | | | | |
|
|
| | | | | | | | | 21,497,929 |
| | | | | | | |
|
|
Specialty Retail .4% | | | | | | | | |
aToys R Us Inc. | | United States | | 375,000 | | | | 4,740,000 |
| | | | | | | |
|
|
Wireless Telecommunication Services 2.7% | | | | | | | | |
aAT&T Wireless Services Inc. | | United States | | 1,522,000 | | | | 12,160,780 |
China Mobile (Hong Kong) Ltd., fgn. | | China | | 3,598,500 | | | | 11,054,694 |
SK Telecom Co. Ltd. | | South Korea | | 61,223 | | | | 10,225,243 |
SK Telecom Co. Ltd., ADR | | South Korea | | 54,400 | | | | 1,015,038 |
| | | | | | | |
|
|
| | | | | | | | | 34,455,755 |
| | | | | | | |
|
|
Total Common Stocks (Cost $968,463,184) | | | | | | | | 1,100,197,427 |
| | | | | | | |
|
|
Preferred Stocks 1.2% | | | | | | | | |
Cia Vale do Rio Doce, ADR, pfd., A | | Brazil | | 138,500 | | | | 7,134,135 |
Petroleo Brasileiro SA, ADR, pfd. | | Brazil | | 173,100 | | | | 4,614,846 |
Volkswagen AG, pfd. | | Germany | | 108,300 | | | | 3,947,868 |
| | | | | | | |
|
|
Total Preferred Stocks (Cost $10,732,153) | | | | | | | | 15,696,849 |
| | | | | | | |
|
|
Convertible Bond (Cost $325,173) .1% | | | | PRINCIPAL
AMOUNTc
|
| | | |
AXA SA, cvt., zero cpn., 12/21/04 | | France | | 21,771 | EUR | | | 439,100 |
| | | | | | | |
|
|
Total Investments before Repurchase Agreements (Cost $979,520,510) | | | | | | | | 1,116,333,376 |
| | | | | | | |
|
|
Repurchase Agreements 11.8% | | | | | | | | |
b BZW Securities Inc. 0.84%, 1/02/04 (Maturity Value $70,003,267)
Collateralized by U.S. Treasury Bills, Notes and Bonds, and U.S. Government Agency Securities | | United States | | 70,000,000 | | | | 70,000,000 |
b Federal Home Loan Bank .75%, 1/02/04 (Maturity Value $11,470,000)
Collateralized by U.S. Treasury Bills, Notes and Bonds, and U.S. Government Agency Securities | | United States | | 11,470,000 | | | | 11,469,522 |
b Paribas Corp .93%, 1/02/04 (Maturity Value $70,003,617)
Collateralized by U.S. Treasury Bills, Notes and Bonds, and Government Agency Securities | | United States | | 70,000,000 | | | | 70,000,000 |
TG-11
FRANKLIN TEMPLETON VARIABLE INSURANCE PRODUCTS TRUST
TEMPLETON GROWTH SECURITIES FUND
Statement of Investments, December 31, 2003 (cont.)
| | | | | | | |
| | | COUNTRY | | SHARES | | VALUE |
|
Repurchase Agreements (cont.) | | | | | | | |
Total Repurchase Agreements (Cost $151,469,522) | | | | | | $ | 151,469,522 |
| | | | | | |
|
|
Total Investments (Cost $1,130,990,032) 99.0% | | | | | | | 1,267,802,898 |
Other Assets, less Liabilities 1.0% | | | | | | | 13,194,830 |
| | | | | | |
|
|
Net Assets 100.0% | | | | | | $ | 1,280,997,728 |
| | | | | | |
|
|
Currency Abbreviations:
EUR - Euro
| b | See Note 1(c) regarding repurchase agreements. |
| c | The principal amount is stated in U.S. dollars unless otherwise indicated. |
See notes to financial statements.
TG-12
FRANKLIN TEMPLETON VARIABLE INSURANCE PRODUCTS TRUST
TEMPLETON GROWTH SECURITIES FUND
Financial Statements
Statement of Assets and Liabilities
December 31, 2003
| | | |
Assets: | | | |
Investments in securities: | | | |
Cost | | $ | 979,520,510 |
| | |
|
|
Value | | | 1,116,333,376 |
Repurchase agreements, at value and cost | | | 151,469,522 |
Cash | | | 76,092 |
Foreign currency, at value (cost $6,829,852) | | | 7,061,422 |
Receivables: | | | |
Investment securities sold | | | 4,086,363 |
Capital shares sold | | | 1,340,813 |
Dividends and Interest | | | 2,685,276 |
| | |
|
|
Total assets | | | 1,283,052,864 |
| | |
|
|
Liabilities: | | | |
Payables: | | | |
Investment securities purchased | | | 195,143 |
Capital shares redeemed | | | 373,015 |
Affiliates | | | 1,020,837 |
Deferred tax liability (Note 1g) | | | 258,124 |
Other liabilities | | | 208,017 |
| | |
|
|
Total liabilities | | | 2,055,136 |
| | |
|
|
Net assets, at value | | $ | 1,280,997,728 |
| | |
|
|
Net assets consist of: | | | |
Undistributed net investment income | | $ | 16,602,943 |
Net unrealized appreciation (depreciation) | | | 136,894,643 |
Accumulated net realized gain (loss) | | | (78,853,936) |
Capital shares | | | 1,206,354,078 |
| | |
|
|
Net assets, at value | | $ | 1,280,997,728 |
| | |
|
|
Class 1: | | | |
Net assets, at value | | $ | 769,339,086 |
| | |
|
|
Shares outstanding | | | 68,049,173 |
| | |
|
|
Net asset value and offering price per share | | $ | 11.31 |
| | |
|
|
Class 2: | | | |
Net assets, at value | | $ | 511,658,642 |
| | |
|
|
Shares outstanding | | | 45,705,756 |
| | |
|
|
Net asset value and offering price per share | | $ | 11.19 |
| | |
|
|
See notes to financial statements.
TG-13
FRANKLIN TEMPLETON VARIABLE INSURANCE PRODUCTS TRUST
TEMPLETON GROWTH SECURITIES FUND
Financial Statements (continued)
Statement of Operations
for the year ended December 31, 2003
| | | | |
Investment income: | | | | |
(net of foreign taxes and fees of $2,469,013) | | | | |
Dividends | | | $ 24,724,072 | |
Interest | | | 1,037,496 | |
| | |
|
|
|
Total investment income | | | 25,761,568 | |
| | |
|
|
|
Expenses: | | | | |
Management fees (Note 3) | | | 7,964,686 | |
Distribution fees - Class 2 (Note 3) | | | 768,510 | |
Transfer agent fees | | | 5,244 | |
Other | | | 634,281 | |
| | |
|
|
|
Total expenses | | | 9,372,721 | |
| | |
|
|
|
Net investment income | | | 16,388,847 | |
| | |
|
|
|
Realized and unrealized gains (losses): | | | | |
Net realized gain (loss) from: | | | | |
Investments (net of foreign taxes of $84,349) (Note 1g) | | | (17,384,016 | ) |
Foreign currency transactions | | | 252,727 | |
| | |
|
|
|
Net realized gain (loss) | | | (17,131,289 | ) |
Net unrealized appreciation (depreciation) on: | | | | |
Investments | | | 296,364,236 | |
Translation of assets and liabilities denominated in foreign currencies | | | 693,277 | |
Deferred taxes (Note 1g) | | | (258,124 | ) |
| | |
|
|
|
Net unrealized appreciation (depreciation) | | | 296,799,389 | |
| | |
|
|
|
Net realized and unrealized gain (loss) | | | 279,668,100 | |
| | |
|
|
|
Net increase (decrease) in net assets resulting from operations | | $ | 296,056,947 | |
| | |
|
|
|
See notes to financial statements.
TG-14
FRANKLIN TEMPLETON VARIABLE INSURANCE PRODUCTS TRUST
TEMPLETON GROWTH SECURITIES FUND
Financial Statements (continued)
Statements of Changes in Net Assets
for the years ended December 31, 2003 and 2002
| | | | | | | | |
| | | 2003 | | | 2002 | |
| | |
| |
Increase (decrease) in net assets: | | | | | | | | |
Operations: | | | | | | | | |
Net investment income | | $ | 16,388,847 | | | $ | 16,151,877 | |
Net realized gain (loss) from investments and foreign currency transactions | | | (17,131,289 | ) | | | (59,721,285 | ) |
Net unrealized appreciation (depreciation) on investments and translation of assets and liabilities denominated in foreign currencies, and deferred taxes | | | 296,799,389 | | | | (148,198,002 | ) |
| | |
| |
Net increase (decrease) in net assets resulting from operations | | | 296,056,947 | | | | (191,767,410 | ) |
Distributions to shareholders from: | | | | | | | | |
Net investment income: | | | | | | | | |
Class 1 | | | (11,363,488 | ) | | | (20,070,527 | ) |
Class 2 | | | (4,553,762 | ) | | | (3,259,082 | ) |
Net realized gains: | | | | | | | | |
Class 1 | | | — | | | | (18,428,918 | ) |
Class 2 | | | — | | | | (3,204,573 | ) |
| | |
| |
Total distributions to shareholders | | | (15,917,250) | | | | (44,963,100 | ) |
Capital share transactions: (Note 2) | | | | | | | | |
Class 1 | | | (80,154,599 | ) | | | (102,174,647 | ) |
Class 2 | | | 225,420,705 | | | | 113,847,109 | |
| | |
| |
Total capital share transactions | | | 145,266,106 | | | | 11,672,462 | |
Net increase (decrease) in net assets | | | 425,405,803 | | | | (225,058,048 | ) |
Net assets: | | | | | | | | |
Beginning of year | | | 855,591,925 | | | | 1,080,649,973 | |
| | |
| |
End of year | | $ | 1,280,997,728 | | | $ | 855,591,925 | |
| | |
| |
Undistributed net investment income included in net assets: | | | | | | | | |
End of year | | | $16,602,943 | | | $ | 15,907,519 | |
| | |
| |
See notes to financial statements.
TG-15
FRANKLIN TEMPLETON VARIABLE INSURANCE PRODUCTS TRUST
TEMPLETON GROWTH SECURITIES FUND
Notes to Financial Statements
1. ORGANIZATION AND SIGNIFICANT ACCOUNTING POLICIES
Franklin Templeton Variable Insurance Products Trust (the Trust) is registered under the Investment Company Act of 1940 as an open-end investment company consisting of twenty-two separate series (the Funds). Templeton Growth Securities Fund (the Fund) included in this report is diversified. Shares of the Fund are sold only to insurance company separate accounts to fund the benefits of variable life insurance policies or variable annuity contracts. The Fund’s investment objective is capital growth.
The following summarizes the Fund’s significant accounting policies.
a. Security Valuation
Securities listed or traded on a recognized national exchange or NASDAQ are valued at the last reported sales price. Over-the-counter securities and listed securities for which no sale is reported are valued within the range of the latest quoted bid and asked prices. Foreign securities are valued at the close of trading of the foreign exchange or the NYSE, whichever is earlier. If events occur that materially affect the values of securities after the prices or foreign exchange rates are determined, or if market quotations are not readily available, the securities will be valued at fair value as determined following procedures approved by the Board of Trustees.
b. Foreign Currency Translation
Portfolio securities and other assets and liabilities denominated in foreign currencies are translated into U.S. dollars based on the exchange rate of such currencies against U.S. dollars on the date of valuation. Purchases and sales of securities and income items denominated in foreign currencies are translated into U.S. dollars at the exchange rate in effect on the transaction date.
The Fund does not separately report the effect of changes in foreign exchange rates from changes in market prices on securities held. Such changes are included in net realized and unrealized gain or loss from investments.
Realized foreign exchange gains or losses arise from sales of foreign currencies, currency gains or losses realized between the trade and settlement dates on securities transactions and the difference between the recorded amounts of dividends, interest, and foreign withholding taxes and the U.S. dollar equivalent of the amounts actually received or paid. Net unrealized foreign exchange gains and losses arise from changes in foreign exchange rates on foreign denominated assets and liabilities other than investments in securities held at the end of the reporting period.
c. Repurchase Agreements
The Fund may enter into repurchase agreements, which are accounted for as a loan by the Fund to the seller, collateralized by securities which are delivered to the Fund’s custodian. The market value, including accrued interest, of the initial collateralization is required to be at least 102% of the dollar amount invested by the Fund, with the value of the underlying securities marked to market daily to maintain coverage of at least 100%. At December 31, 2003, all repurchase agreements held by the Fund had been entered into on that date.
d. Foreign Currency Contracts
When the Fund purchases or sells foreign securities it may enter into foreign exchange contracts to minimize foreign exchange risk from the trade date to the settlement date of the transactions. A foreign exchange contract is an agreement between two parties to exchange different currencies at an agreed upon exchange rate on a specified date. Realized and unrealized gains and losses are included in the Statement of Operations.
The risks of these contracts include movement in the values of the foreign currencies relative to the U.S. dollar and the possible inability of the counterparties to fulfill their obligations under the contracts.
TG-16
FRANKLIN TEMPLETON VARIABLE INSURANCE PRODUCTS TRUST
TEMPLETON GROWTH SECURITIES FUND
Notes to Financial Statements (continued)
1. ORGANIZATION AND SIGNIFICANT ACCOUNTING POLICIES (cont.)
e. Income Taxes
No provision has been made for income taxes because the Fund’s policy is to qualify as a regulated investment company under the Internal Revenue Code and to distribute substantially all of its taxable income.
f. Security Transactions, Investment Income, Expenses and Distributions
Security transactions are accounted for on trade date. Realized gains and losses on security transactions are determined on a specific identification basis. Certain income from foreign securities is recorded as soon as information is available to the Fund. Interest income and estimated expenses are accrued daily. Dividend income and distributions to shareholders are recorded on the ex-dividend date.
Common expenses incurred by the Trust are allocated among the Funds based on the ratio of net assets of each Fund to the combined net assets. Other expenses are charged to each Fund on a specific identification basis.
Realized and unrealized gains and losses and net investment income, other than class specific expenses, are allocated daily to each class of shares based upon the relative proportion of net assets of each class.
g. Deferred Taxes
The Fund is subject to a tax imposed on net realized gains of securities of certain foreign countries. The Fund records an estimated deferred tax liability for net unrealized gains on these securities as reflected in the accompanying financial statements.
h. Accounting Estimates
The preparation of financial statements in accordance with accounting principles generally accepted in the United States of America requires management to make estimates and assumptions that affect the reported amounts of assets and liabilities at the date of the financial statements and the amounts of income and expense during the reporting period. Actual results could differ from those estimates.
i. Guarantees and Indemnifications
Under the Trust’s organizational documents, its officers and trustees are indemnified against certain liability arising out of the performance of their duties to the Trust. Additionally, in the normal course of business, the Trust enters into contracts with service providers that contain general indemnification clauses. The Trust’s maximum exposure under these arrangements is unknown as this would involve future claims that may be made against the Trust that have not yet occurred. However, based on experience, the Trust expects the risk of loss to be remote.
2. SHARES OF BENEFICIAL INTEREST
The Fund offers two classes of shares: Class 1 and Class 2. Each class of shares differs by its distribution fees, voting rights on matters affecting a single class and its exchange privilege.
TG-17
FRANKLIN TEMPLETON VARIABLE INSURANCE PRODUCTS TRUST
TEMPLETON GROWTH SECURITIES FUND
Notes to Financial Statements (continued)
2. SHARES OF BENEFICIAL INTEREST (cont.)
At December 31, 2003, there were an unlimited number of shares authorized ($.01 par value). Transactions in the Fund’s shares were as follows:
| | | | | | | | | | | | | | |
| | | Year Ended December 31,
| |
| | | 2003
| | | 2002
| |
| Class 1 Shares: | | Shares
| | | Amount
| | | Shares
| | | Amount
| |
Shares sold | | 1,110,988 | | | $ | 10,553,604 | | | 27,335,041 | | | $ | 291,949,245 | |
Shares issued in reinvestment of distributions | | 1,181,236 | | | | 11,363,488 | | | 3,694,764 | | | | 38,499,445 | |
Shares redeemed | | (11,030,466 | ) | | | (102,071,691 | ) | | (41,405,187 | ) | | | (432,623,337 | ) |
| | |
| |
Net increase (decrease) | | (8,738,242 | ) | | $ | (80,154,599 | ) | | (10,375,382 | ) | | $ | (102,174,647 | ) |
| | |
| |
| Class 2 Shares: | | | | | | | | | | | | |
Shares sold | | 30,448,582 | | | $ | 289,636,811 | | | 21,239,772 | | | $ | 207,175,310 | |
Shares issued in reinvestment of distributions | | 477,333 | | | | 4,553,762 | | | 624,508 | | | | 6,463,655 | |
Shares redeemed | | (7,334,303 | ) | | | (68,769,868 | ) | | (10,095,406 | ) | | | (99,791,856 | ) |
| | |
| |
Net increase (decrease) | | 23,591,612 | | | $ | 225,420,705 | | | 11,768,874 | | | $ | 113,847,109 | |
| | |
| |
3. TRANSACTIONS WITH AFFILIATES
Certain officers and trustees of the Fund are also officers and/or directors of the following entities:
| | |
| Entity | | Affiliation |
|
Franklin Templeton Services LLC (FT Services) | | Administrative manager |
Templeton Asset Management Ltd. (TAML) | | Investment manager |
Templeton Global Advisors Ltd. (TGAL) | | Investment manager |
Franklin/Templeton Distributors Inc. (Distributors) | | Principal underwriter |
Franklin/Templeton Investor Services LLC (Investor Services) | | Transfer agent |
The Fund pays an investment management fee to TGAL based on the average daily net assets of the Fund as follows:
| | |
| Annualized Fee Rate | | Net Assets |
|
| 1.00% | | First $100 million |
| .90% | | Over $100 million, up to and including $250 million |
.80%
.75% | | Over $250 million, up to and including $500 million Over $500 million |
Under an agreement with TGAL, FT Services provides administrative services to the Fund. The fee is paid by TGAL based on the average daily net assets, and is not an additional expense of the Fund.
Under a subadvisory agreement, TAML, an affiliate of TGAL, provides subadvisory services to the Fund and receives from TGAL fees based on the average daily net assets of the Fund.
The Fund reimburses Distributors up to .25% per year of its average daily net assets of Class 2 shares for costs incurred in marketing the Fund’s shares.
Investor Services, under terms of an agreement, performs shareholder servicing for the Fund and is not paid by the Fund for the services.
TG-18
FRANKLIN TEMPLETON VARIABLE INSURANCE PRODUCTS TRUST
TEMPLETON GROWTH SECURITIES FUND
Notes to Financial Statements (continued)
4. INCOME TAXES
At December 31, 2003, the Fund had tax basis capital losses of $78,798,487, which may be carried over to offset future capital gains. Such losses expire as follows:
| | | |
Capital loss carryovers expiring in: | | | |
2010 | | $ | 52,333,376 |
2011 | | | 26,465,111 |
| | |
|
| | | $ | 78,798,487 |
| | |
|
At December 31, 2003, the Fund had deferred currency losses occurring subsequent to October 31, 2003 of $55,449. For tax purposes, such losses will be reflected in the year ending December 31, 2004.
The tax character of distributions paid during the years ended December 31, 2003 and 2002, was as follows:
| | | | | | |
| | | 2003
| | 2002
|
Distributions paid from: | | | | | | |
Ordinary income | | $ | 15,917,250 | | $ | 33,239,449 |
Long term capital gain | | | — | | | 11,723,651 |
| | |
|
| | | $ | 15,917,250 | | $ | 44,963,100 |
| | |
|
At December 31, 2003, the cost of investments, net unrealized appreciation (depreciation), undistributed ordinary income and undistributed long term capital gains for income tax purposes were as follows:
| | | | |
Cost of investments | | $ | 1,130,978,446 | |
| | |
|
|
|
Unrealized appreciation | | $ | 195,803,036 | |
Unrealized depreciation | | | (58,978,584 | ) |
| | |
|
|
|
Net unrealized appreciation (depreciation) | | $ | 136,824,452 | |
| | |
|
|
|
Undistributed ordinary income | | $ | 16,591,356 | |
Undistributed long term capital gains | | | — | |
| | |
|
|
|
Distributable earnings | | $ | 16,591,356 | |
| | |
|
|
|
Net investment income (loss) differs for financial statements and tax purposes primarily due to differing treatment of foreign currency transactions.
Net realized gains (losses) differ for financial statement and tax purposes primarily due to differing treatment of wash sales and foreign currency transactions.
5. INVESTMENT TRANSACTIONS
Purchases and sales of securities (excluding short-term securities) for the period ended December 31, 2003 aggregated $355,356,084 and $327,926,441, respectively.
6. REGULATORY MATTERS
On February 4, 2004, the Securities Division of the Office of the Secretary of the Commonwealth of Massachusetts filed an administrative complaint against Franklin Resources, Inc. and certain of its subsidiaries (the “Company”), alleging violations of the Massachusetts Uniform Securities Act. The complaint arises from activity that occurred in 2001 during which time an officer of a Company subsidiary was negotiating an agreement with an investor relating to investments in a mutual fund and a hedge fund.
TG-19
FRANKLIN TEMPLETON VARIABLE INSURANCE PRODUCTS TRUST
TEMPLETON GROWTH SECURITIES FUND
Notes to Financial Statements (continued)
6. REGULATORY MATTERS (cont.)
The Company, in addition to other entities within Franklin Templeton Investments, has been named in shareholder class actions related to the matter described above. The Company believes that the claims made in the lawsuit are without merit and it intends to defend vigorously against the allegations. The Company and the Fund may be named in similar civil actions related to the matter described above.
In addition, as part of ongoing investigations by the U.S. Securities and Exchange Commission (the “SEC”), the U.S. Attorney for the Northern District of California, the New York Attorney General, the California Attorney General, the U.S. Attorney for the District of Massachusetts, the Florida Department of Financial Services, and the Commissioner of Securities and the Attorney General of the State of West Virginia, relating to certain practices in the mutual fund industry, including late trading, market timing and sales compensation arrangements, the Company and its subsidiaries, as well as certain current or former executives and employees of the Company, have received requests for information and/or subpoenas to testify or produce documents. The Company and its current employees are providing documents and information in response to these requests and subpoenas. In addition, the Company has responded to requests for similar kinds of information from regulatory authorities in some of the foreign countries where the Company conducts its global asset management business.
The Staff of the SEC has informed the Company that it intends to recommend that the Commission authorize an action against an affiliate of the Fund’s adviser and a senior executive officer relating to the frequent trading issues that are the subject of the SEC’s investigation. These issues were previously disclosed as being under investigation by government authorities and the subject of an internal inquiry by the Company in its Annual Report on Form 10-K and on its public website. The Company currently is in discussions with the SEC Staff in an effort to resolve the issues raised in their investigation. Such discussions are preliminary and the Fund’s management has been advised that the Company cannot predict the likelihood of whether those discussions will result in a settlement and, if so, the terms of such settlement. The impact, if any, of these matters on the Fund is uncertain at this time. If the Company finds that it bears responsibility for any unlawful or improper conduct, it has committed to making the Fund or its shareholders whole, as appropriate.
TG-20
FRANKLIN TEMPLETON VARIABLE INSURANCE PRODUCTS TRUST
TEMPLETON GROWTH SECURITIES FUND
Independent Auditors’ Report
To the Board of Trustees and Shareholders
of Franklin Templeton Variable Insurance Products Trust
In our opinion, the accompanying statement of assets and liabilities, including the statement of investments, and the related statements of operations and of changes in net assets and the financial highlights present fairly, in all material respects, the financial position of the Templeton Growth Securities Fund (the Fund) (one of the funds constituting the Franklin Templeton Variable Insurance Products Trust) at December 31, 2003, the results of its operations for the year then ended, the changes in its net assets for each of the two years in the period then ended and the financial highlights for each of the periods presented, in conformity with accounting principles generally accepted in the United States of America. These financial statements and financial highlights (hereafter referred to as “financial statements”) are the responsibility of the Fund’s management; our responsibility is to express an opinion on these financial statements based on our audits. We conducted our audits of these financial statements in accordance with auditing standards generally accepted in the United States of America, which require that we plan and perform the audits to obtain reasonable assurance about whether the financial statements are free of material misstatement. An audit includes examining, on a test basis, evidence supporting the amounts and disclosures in the financial statements, assessing the accounting principles used and significant estimates made by management, and evaluating the overall financial statement presentation. We believe that our audits, which included confirmation of securities at December 31, 2003 by correspondence with the custodian and brokers, provide a reasonable basis for our opinion.
PricewaterhouseCoopers LLP
San Francisco, California
February 5, 2004, except for Note 6 as to which the date is February 12, 2004
TG-21
FRANKLIN TEMPLETON VARIABLE INSURANCE PRODUCTS TRUST
TEMPLETON GROWTH SECURITIES FUND
Tax Designation (unaudited)
Under Section 854(b)(2) of the Code, the Fund hereby designates 28.40% of the ordinary income dividends as income qualifying for the dividends received deduction for the fiscal year ended December 31, 2003.
At December 31, 2003, more than 50% of the Fund’s total assets were invested in securities of foreign issuers. In most instances, foreign taxes were withheld from dividends paid to the Fund on these investments. The Fund elects to treat foreign taxes paid under Section 853 of the Internal Revenue Code. This election will allow shareholders of record in June 2004, to treat their proportionate share of foreign taxes paid by the Funds as having been paid directly by them. The shareholder shall consider these amounts as foreign taxes paid in the tax year in which they receive the Fund distribution.
The foreign tax information will be disclosed in the June 30, 2004, semi-annual report of the Fund.
TG-22
INDEX DESCRIPTIONS
The indexes are unmanaged and include reinvested distributions.
Consumer Price Index (CPI) is a measure of the average changes in price for a fixed basket of goods and services regularly bought by U.S. consumers; published by the Bureau of Labor Statistics.
Credit Suisse First Boston (CSFB) High Yield Index is designed to mirror the investable universe of the U.S. dollar denominated high yield debt market.
Dow Jones Industrial Average (the Dow) is price-weighted based on the average market price of 30 blue chip stocks of companies that are generally industry leaders. The average is found by adding the prices of the 30 stocks and dividing by a denominator that has been adjusted for stock splits and other corporate actions.
J.P. Morgan Emerging Markets Bond Index Global (EMBIG) tracks total returns for U.S. dollar-denominated debt instruments issued by emerging markets sovereign and quasi-sovereign entities: Brady bonds, loans and Eurobonds.
J.P. Morgan EMU Government Bond Index is a euro-aggregated index weighted by market capitalization. The index includes only liquid bullet euro-denominated fixed-rate debt, which has been issued by participating governments. No callable, puttable or convertible features are allowed. Bonds must have at least 12 months remaining maturity. The EMU bond index is fully invested. All coupons received are immediately invested back into the entire index until the next index rebalancing.
J.P. Morgan Global Government Bond Index (JPM GGBI) tracks total returns of government bonds in developed countries globally. The bonds included in the index are weighted according to their market capitalization. The index is unhedged and expressed in terms of $US.
J.P. Morgan U.S. Government Bond Total Return Index includes only actively traded fixed-rate bonds with a remaining maturity of one year or longer. The index is based on the gross price (net price plus accrued interest) of bonds in the index. The index is expressed in terms of $US.
Lehman Brothers Intermediate U.S. Government Bond Index includes securities issued by the U.S. Treasury or agency. These include public obligations of the U.S. Treasury with remaining maturity of one year or more and publicly issued debt of U.S. governmental agencies, quasi-federal corporations, and corporate or foreign debt. All issues included must have one to ten years to final maturity and must be rated investment grade (Baa3 or better) by Moody’s Investors Service. They must also be dollar-denominated and non-convertible. Total return includes price appreciation/depreciation and income as a percentage of the original investment. The index is rebalanced monthly by market capitalization.
Lehman Brothers Mortgage-Backed Securities (MBS) Index covers the mortgage-backed pass-through securities of Ginnie Mae (GNMA), Fannie Mae (FNMA) and Freddie Mac (FHLMC). The securities must have a weighted average maturity of at least one year, have at least $200 million par amount outstanding and be fixed rate. The index excludes buydowns, graduated equity mortgages and project loans. Non-agency (whole loan), 20-year securities, ARM securities and CMOs are also excluded.
IND-1
Lehman Brothers U.S. Treasury Index includes public obligations of the U.S. Treasury with a remaining maturity of one year or more. All issues must have at least one year to final maturity regardless of call features, have at least $200 million par amount outstanding and rated investment grade (Baa3 or better) by Moody’s Investors Service. They must also be dollar-denominated, non-convertible and publicly issued. The index excludes Treasury bills (because of the maturity constraint), flower bonds, targeted investor notes, and state and local government series bonds, STRIPS and Treasury Inflation-Protection Securities.
Lehman Brothers U.S. Aggregate Index represents securities that are SEC-registered, taxable and dollar denominated. The index covers the U.S. investment grade fixed-rate bond market, with index components for government and corporate securities, mortgage pass-through securities and asset-backed securities. All issues included must have at least one year to final maturity and must be rated investment grade (Baa3 or better) by Moody’s Investors Service. They must also be dollar-denominated and non-convertible. Total return includes price appreciation/depreciation and income as a percentage of the original investment. The index is rebalanced monthly by market capitalization.
Lehman Brothers U.S. Government/Credit Index includes securities issued by the U.S. Treasury or agency and publicly issued U.S. corporate and specified foreign debentures and secured notes that meet the specified maturity, liquidity and quality requirements. These include public obligations of the U.S. Treasury with remaining maturity of one year or more and publicly issued debt of U.S. governmental agencies, quasi-federal corporations, and corporate or foreign debt. The credit portion includes both corporate and non-corporate sectors. The corporate sectors are industrial, utility, and finance, which includes both U.S. and non-U.S. corporations. The non-corporate sectors are sovereign, supranational, foreign agency, and foreign local government. All issues included must have at least one year to final maturity and must be rated investment grade (Baa3 or better) by Moody’s Investors Service. They must also be dollar-denominated and non-convertible. Total return includes price appreciation/depreciation and income as a percentage of the original investment. The index is rebalanced monthly by market capitalization.
Lipper Multi-Sector Income Funds Objective Average is an equally weighted average calculation of performance figures for all funds within the Lipper Multi-Sector Income Funds classification in the Lipper Open-End underlying funds universe. Lipper Multi-Sector Income Funds are defined as funds that seek current income by allocating assets among different fixed income securities sectors (not primarily in one sector except for defensive purposes), including U.S. and foreign governments, with a significant portion rated below investment grade. For the one-year period ended 12/31/03, there were 112 funds in this category. Lipper calculations do not include contract fees, expenses or sales charges, and may have been different if such charges had been considered.
IND-2
Lipper VIP Equity Income Funds Objective Average is an equally weighted average calculation of performance figures for all funds within the Lipper Equity Income Funds classification in the Lipper VIP underlying funds universe. Lipper Equity Income Funds are defined as funds that seek relatively high current income and growth of income through investing at least 60% of their portfolios in equity securities. For the one-year period ended 12/31/03, there were 56 funds in this category. Lipper calculations do not include contract fees, expenses or sales charges, and may have been different if such charges had been considered.
Lipper VIP General U.S. Government Funds Objective Average is an equally weighted average calculation of performance figures for all funds within the Lipper U.S. Government Funds classification in the Lipper VIP underlying funds universe. Lipper U.S. Government Funds are defined as funds that invest primarily in U.S. government and Agency issues. For the one-year period ended 12/31/03, there were 48 funds in this category. Lipper calculations do not include contract fees, expenses or sales charges, and may have been different if such charges had been considered.
Lipper VIP Income Funds Objective Average is an equally weighted average calculation of performance figures for all funds within the Lipper Income Funds classification in the Lipper VIP underlying funds universe. Lipper Income Funds seek a high level of current income by investing in income-producing stocks, bonds and money market instruments. For the one-year period ended 12/31/03, there were 14 funds in this category. Lipper calculations do not include contract fees, expenses or sales charges, and may have been different if such charges had been considered.
Lipper VIP Multi-Cap Value Funds Objective Average is an equally weighted average calculation of performance figures for all funds within the Lipper Multi-Cap Value Funds classification in the Lipper VIP underlying funds universe. Lipper Multi-Cap Value Funds are defined as funds that invest in a variety of market capitalization ranges without concentrating 75% of their equity assets in any one market capitalization range over an extended period of time. For the one-year period ended 12/31/03, there were 107 funds in this category. Lipper calculations do not include contract fees, expenses or sales charges, and may have been different if such charges had been considered.
Lipper VIP Target Maturity Funds Objective Average is an equally weighted average calculation of performance figures for all funds within the Lipper Target Maturity Funds classification in the Lipper VIP underlying funds universe. Lipper Target Maturity Funds are defined as funds that invest principally in zero coupon U.S. Treasury securities or in coupon-bearing U.S. government securities targeted to mature in a specific year. For the one-year period ended 12/31/03, there were 9 funds in this category. Lipper calculations do not include contract fees, expenses or sales charges, and may have been different if such charges had been considered.
Lipper VIP Utility Funds Objective Average is an equally weighted average calculation of performance figures for all funds within the Lipper Utility Funds classification in the Lipper VIP underlying funds universe. Lipper Utility Funds are defined as funds that invest primarily in utility shares. For the one-year period ended 12/31/03, there were 25 funds in this category. Lipper calculations do not include contract fees, expenses or sales charges, and may have been different if such charges had been considered.
IND-3
Merrill Lynch 2-, 5- and 10-Year Zero Coupon Bond Indexes include zero coupon bonds that pay no interest and are issued at a discount from redemption price.
Morgan Stanley Capital International (MSCI) All Country (AC) World Free Index is market capitalization-weighted and measures total returns of equity securities available to foreign (non-local) investors in developed and emerging markets globally.
Morgan Stanley Capital International (MSCI) Emerging Markets Free Index is market capitalization-weighted and measures total returns of equity securities available to foreign (non-local) investors in emerging markets globally.
Morgan Stanley Capital International (MSCI) Europe Australasia Far East (EAFE) Index is market capitalization-weighted and measures total returns of equity securities in developed markets in Europe, Australasia and the Far East.
Morgan Stanley Capital International (MSCI) Japan Index is market capitalization-weighted and measures total returns of equity securities in Japan.
Morgan Stanley Capital International (MSCI) Korea Index is market capitalization-weighted and measures total returns of equity securities in Korea.
Morgan Stanley Capital International (MSCI) World Financial Index is market capitalization-weighted and measures total returns of financial securities in developed markets globally.
Morgan Stanley Capital International (MSCI) World Index is market capitalization-weighted and measures total returns of equity securities in developed markets globally.
Mortgage Bankers Association Refinancing Index covers all mortgage applications to refinance an existing mortgage. It is the best overall gauge of mortgage refinancing activity.
Nasdaq Telecommunications Index is a capitalization-weighted index designed to measure performance of all Nasdaq stocks in the telecommunications sector. The index was developed with a base value of 100 as of February 5, 1971.
National Association of Securities Dealers Automated Quotations (Nasdaq) Composite Index measures all domestic and international common stocks listed on The Nasdaq Stock Market. The index is market value-weighted and includes over 3,000 companies.
Russell 1000® Growth Index is market capitalization-weighted and measures performance of those Russell 1000 Index companies with higher price-to-book ratios and higher forecasted growth values.
Russell 1000 Index is market capitalization-weighted and measures performance of the 1,000 largest companies in the Russell 3000 Index, which represented approximately 92% of total market capitalization of the Russell 3000 Index, as of 12/31/03.
Russell 1000 Value Index is market capitalization-weighted and measures performance of those Russell 1000 Index companies with lower price-to-book ratios and lower forecasted growth values.
IND-4
Russell 2000® Index is market capitalization-weighted and measures performance of the 2,000 smallest companies in the Russell 3000 Index, which represented approximately 8% of total market capitalization of the Russell 3000 Index, as of 12/31/03.
Russell 2000 Value Index is market capitalization-weighted and measures performance of those Russell 2000 Index companies with lower price-to-book ratios and lower forecasted growth values.
Russell 2500™ Growth Index is market capitalization-weighted and measures performance of those Russell 2500 Index companies with higher price-to-book ratios and higher forecasted growth values.
Russell 3000® Growth Index is market capitalization-weighted and measures performance of those Russell 3000 Index companies with higher price-to-book ratios and higher forecasted growth values.
Russell 3000 Index is market capitalization-weighted and measures performance of the 3,000 largest U.S. companies based on total market capitalization, which represented approximately 98% of the investable U.S. equity market, as of 12/31/03.
Russell 3000 Value Index is market capitalization-weighted and measures performance of those Russell 3000 Index companies with lower price-to-book ratios and lower forecasted growth values.
Russell Midcap® Value Index is market capitalization-weighted and measures performance of those Russell Midcap companies with lower price-to-book ratios and lower forecasted growth values.
Standard & Poor’s 500 Composite Index (S&P 500) consists of 500 stocks chosen for market size, liquidity and industry group representation. Each stock’s weight in the index is proportionate to its market value. The S&P 500 is one of the most widely used benchmarks of U.S. equity performance.
S&P/International Finance Corporation Investable (IFCI) Composite Index is a market capitalization weighted index designed to measure the performance of emerging market stocks. It tracks approximately 2,000 securities in countries such as Brazil, Mexico, China and South Korea. Performance represents total return in $US.
Wilshire Real Estate Securities Index is a broad measure of the performance of publicly traded real estate securities, such as real estate investment trusts and real estate operating companies. The index is capitalization-weighted and rebalanced monthly, and returns are calculated on a buy-and-hold basis.
IND-5
Board Members and Officers
Independent Board Members
| | | | | | | | |
| Name, Age and Address | | Position | | Length of
Time Served | | Number of
Portfolios in Fund
Complex Overseen
by Board Member* | | Other Directorships Held |
|
| | | | |
FRANK H. ABBOTT, III (82) One Franklin Parkway San Mateo, CA 94403-1906 | | Trustee | | Since 1988 | | 113 | | None |
|
Principal Occupation During Past 5 Years: President and Director, Abbott Corporation (an investment company). |
|
| | | | |
HARRIS J. ASHTON (71) One Franklin Parkway San Mateo, CA 94403-1906 | | Trustee | | Since 1988 | | 142 | | Director, Bar-S Foods (meat packing company). |
|
Principal Occupation During Past 5 Years: Director of various companies; and formerly, Director, RBC Holdings, Inc. (bank holding company) (until 2002); and President, Chief Executive Officer and Chairman of the Board, General Host Corporation (nursery and craft centers) (until 1998). |
|
| | | | |
ROBERT F. CARLSON (75) One Franklin Parkway San Mateo, CA 94403-1906 | | Trustee | | Since 1998 | | 52 | | None |
|
Principal Occupation During Past 5 Years: Senior Member and past President, Board of Administration, California Public Employees Retirement Systems (CALPERS); and formerly, member and Chairman of the Board, Sutter Community Hospitals; member, Corporate Board, Blue Shield of California; and Chief Counsel, California Department of Transportation. |
|
| | | | |
S. JOSEPH FORTUNATO (71) One Franklin Parkway San Mateo, CA 94403-1906 | | Trustee | | Since 1989 | | 143 | | None |
|
Principal Occupation During Past 5 Years: Attorney; and formerly, member of the law firm of Pitney, Hardin, Kipp & Szuch. |
|
| | | | |
FRANK W.T. LAHAYE (74) One Franklin Parkway San Mateo, CA 94403-1906 | | Trustee | | Since 1988 | | 115 | | Director, The California Center for Land Recycling (redevelopment). |
|
Principal Occupation During Past 5 Years: General Partner, Las Olas L.P. (Asset Management); and formerly, Chairman, Peregrine Venture Management Company (venture capital). |
|
| | | | |
GORDON S. MACKLIN (75) One Franklin Parkway San Mateo, CA 94403-1906 | | Trustee | | Since 1993 | | 142 | | Director, White Mountains Insurance Group, Ltd. (holding company); Martek Biosciences Corporation; MedImmune, Inc. (biotechnology); Overstock.com (Internet services); and Spacehab, Inc. (aerospace services); and formerly, Director, MCI Communication Corporation (subsequently known as MCI WorldCom, Inc. and WorldCom, Inc.) (communications services) (1988-2002). |
|
Principal Occupation During Past 5 Years: Deputy Chairman, White Mountains Insurance Group, Ltd. (holding company); and formerly, Chairman, White River Corporation (financial services) (1993-1998) and Hambrecht & Quist Group (investment banking) (1987-1992); and President, National Association of Securities Dealers, Inc. (1970-1987). |
|
BOD-1
Interested Board Members and Officers
| | | | | | | | |
| Name, Age and Address | | Position | | Length of
Time Served | | Number of
Portfolios in Fund
Complex Overseen
by Board Member* | | Other Directorships Held |
|
| | | | |
**CHARLES B. JOHNSON (70) One Franklin Parkway San Mateo, CA 94403-1906 | | Trustee and Chairman of the Board | | Since 1988 | | 142 | | None |
|
Principal Occupation During Past 5 Years: Chairman of the Board, Member—Office of the Chairman and Director, Franklin Resources, Inc.; Vice President, Franklin Templeton Distributors, Inc.; Director, Fiduciary Trust Company International; and officer and/or director or trustee, as the case may be, of some of the other subsidiaries of Franklin Resources, Inc. and of 46 of the investment companies in Franklin Templeton Investments. |
|
| | | | |
**RUPERT H. JOHNSON, JR. (63) One Franklin Parkway San Mateo, CA 94403-1906 | | Trustee, President and Chief Executive Officer—Investment Management | | Trustee since 1988 and President and Chief Executive Officer—Investment Management since 2002 | | 125 | | None |
|
Principal Occupation During Past 5 Years: Vice Chairman, Member—Office of the Chairman and Director, Franklin Resources, Inc.; Vice President and Director, Franklin Templeton Distributors, Inc.; Director, Franklin Advisers, Inc. and Franklin Investment Advisory Services, Inc.; Senior Vice President, Franklin Advisory Services, LLC; and officer and/or director or trustee, as the case may be, of some of the other subsidiaries of Franklin Resources, Inc. and of 49 of the investment companies in Franklin Templeton Investments. |
|
| | | | |
**CHRISTOPHER H. PINKERTON (45) One Franklin Parkway San Mateo, CA 94403-1906 | | Trustee | | Since 2001 | | 22 | | None |
|
Principal Occupation During Past 5 Years: President, Chairman and Chief Executive Officer, USAllianz Investor Services, LLC and USAllianz Advisors; President and Chief Executive Officer, USAllianz Investment Advisor and USAllianz VIP Trust; Senior Vice President, Variable Products Division, Allianz Life Insurance Company of North America; fellow, Life Management Institute; and formerly, Vice President of Marketing, Nationwide Financial Services (until 1999). |
|
| | | | |
HARMON E. BURNS (58) One Franklin Parkway San Mateo, CA 94403-1906 | | Vice President | | Since 1988 | | Not
Applicable | | None |
|
Principal Occupation During Past 5 Years: Vice Chairman, Member—Office of the Chairman and Director, Franklin Resources, Inc.; Vice President and Director, Franklin Templeton Distributors, Inc.; Executive Vice President, Franklin Advisers, Inc.; Director, Franklin Investment Advisory Services, Inc.; and officer and/or director or trustee, as the case may be, of some of the other subsidiaries of Franklin Resources, Inc. and of 49 of the investment companies in Franklin Templeton Investments. |
|
| | | | |
MARTIN L. FLANAGAN (43) One Franklin Parkway San Mateo, CA 94403-1906 | | Vice President | | Since 1995 | | Not
Applicable | | None |
|
Principal Occupation During Past 5 Years: Co-President and Chief Executive Officer, Franklin Resources, Inc.; Senior Vice President and Chief Financial Officer, Franklin Mutual Advisers, LLC; Executive Vice President, Chief Financial Officer and Director, Templeton Worldwide, Inc.; Executive Vice President and Chief Operating Officer, Templeton Investment Counsel, LLC; President and Director, Franklin Advisers, Inc.; Executive Vice President, Franklin Investment Advisory Services, Inc. and Franklin Templeton Investor Services, LLC; Chief Financial Officer, Franklin Advisory Services, LLC; Chairman, Franklin Templeton Services, LLC; and officer and/or director or trustee, as the case may be, of some of the other subsidiaries of Franklin Resources, Inc. and of 49 of the investment companies in Franklin Templeton Investments. |
|
BOD-2
| | | | | | | | |
| Name, Age and Address | | Position | | Length of
Time Served | | Number of
Portfolios in Fund
Complex Overseen
by Board Member* | | Other Directorships Held |
|
| | | | |
JIMMY D. GAMBILL (56) 500 East Broward Blvd. Suite 2100 Fort Lauderdale, FL 33394-3091 | | Senior Vice President and Chief Executive Officer—Finance and Administration | | Since 2002 | | Not
Applicable | | None |
|
Principal Occupation During Past 5 Years: President, Franklin Templeton Services, LLC; Senior Vice President, Templeton Worldwide, Inc.; and officer of 51 of the investment companies in Franklin Templeton Investments. |
|
| | | | |
DAVID P. GOSS (56) One Franklin Parkway San Mateo, CA 94403-1906 | | Vice President | | Since 2000 | | Not
Applicable | | None |
|
Principal Occupation During Past 5 Years: Associate General Counsel, Franklin Resources, Inc.; officer and director of one of the subsidiaries of Franklin Resources, Inc.; officer of 51 of the investment companies in Franklin Templeton Investments; and formerly, President, Chief Executive Officer and Director, Property Resources Equity Trust (until 1999) and Franklin Select Realty Trust (until 2000). |
|
| | | | |
BARBARA J. GREEN (56) One Franklin Parkway San Mateo, CA 94403-1906 | | Vice President | | Since 2000 | | Not
Applicable | | None |
|
Principal Occupation During Past 5 Years: Vice President, Deputy General Counsel and Secretary, Franklin Resources, Inc.; Secretary and Senior Vice President, Templeton Worldwide, Inc.; Secretary, Franklin Advisers, Inc., Franklin Advisory Services, LLC, Franklin Investment Advisory Services, Inc., Franklin Mutual Advisers, LLC, Franklin Templeton Alternative Strategies, Inc., Franklin Templeton Investor Services, LLC, Franklin Templeton Services, LLC, Franklin Templeton Distributors, Inc., Templeton Investment Counsel, LLC, and Templeton/Franklin Investment Services, Inc.; and officer of some of the other subsidiaries of Franklin Resources, Inc. and of 51 of the investment companies in Franklin Templeton Investments; and formerly, Deputy Director, Division of Investment Management, Executive Assistant and Senior Advisor to the Chairman, Counselor to the Chairman, Special Counsel and Attorney Fellow, U.S. Securities and Exchange Commission (1986-1995); Attorney, Rogers & Wells (until 1986); and Judicial Clerk, U.S. District Court (District of Massachusetts) (until 1979). |
|
| | | | |
MICHAEL O. MAGDOL (66) 600 Fifth Avenue Rockefeller Center New York, NY 10048-0772 | | Vice President—AML Compliance | | Since 2002 | | Not
Applicable | | Director, FTI Banque, Arch Chemicals, Inc. and Lingnan Foundation. |
|
Principal Occupation During Past 5 Years: Vice Chairman, Chief Banking Officer and Director, Fiduciary Trust Company International; and officer and/or director, as the case may be, of some of the other subsidiaries of Franklin Resources, Inc. and of 48 of the investment companies in Franklin Templeton Investments. |
|
| | | | |
KIMBERLEY H. MONASTERIO (40) One Franklin Parkway San Mateo, CA 94403-1906 | | Treasurer and Chief Financial Officer | | Treasurer since 2000 and Chief Financial Officer since 2002 | | Not
Applicable | | None |
|
Principal Occupation During Past 5 Years: Senior Vice President, Franklin Templeton Services, LLC; and officer of 51 of the investment companies in Franklin Templeton Investments. |
|
BOD-3
| | | | | | | | |
| Name, Age and Address | | Position | | Length of
Time Served | | Number of
Portfolios in Fund
Complex Overseen
by Board Member* | | Other Directorships Held |
|
| | | | |
MURRAY L. SIMPSON (66) One Franklin Parkway San Mateo, CA 94403-1906 | | Vice President and Secretary | | Since 2000 | | Not
Applicable | | None |
|
Principal Occupation During Past 5 Years: Executive Vice President and General Counsel, Franklin Resources, Inc.; officer and/or director, as the case may be, of some of the subsidiaries of Franklin Resources, Inc. and of 51 of the investment companies in Franklin Templeton Investments; and formerly, Chief Executive Officer and Managing Director, Templeton Franklin Investment Services (Asia) Limited (until 2000); and Director, Templeton Asset Management Ltd. (until 1999). |
|
| *We | base the number of portfolios on each separate series of the U.S. registered investment companies within the Franklin Templeton Investments fund complex. These portfolios have a common investment adviser or affiliated investment advisers. |
| **Charles | B. Johnson and Rupert H. Johnson, Jr. are considered interested persons of the Trust under the federal securities laws due to their positions as officers and directors and major shareholders of Franklin Resources, Inc., which is the parent company of the Trusts’ adviser and distributor. Mr. Pinkerton is considered an interested person of the Trust because of the share ownership of Allianz Life in the Trust. |
Note: Charles B. Johnson and Rupert H. Johnson, Jr. are brothers.
The Sarbanes-Oxley Act of 2002 and Rules adopted by the Securities and Exchange Commission require the Fund to disclose whether the Fund’s Audit Committee includes at least one member who is an audit committee financial expert within the meaning of such Act and Rules. The Fund’s Board of Directors have determined that there is at least one such financial expert on the Audit Committee and has designated Frank W.T. LaHaye as its audit committee financial expert. The Board believes that Mr. LaHaye qualifies as such an expert in view of his extensive business background and experience, including service as President and Director of McCormick Selph Associates from 1954 through 1965; Director and Chairman of Teledyne Canada Ltd. from 1966 through 1971; Director and Chairman of Quarterdeck Corporation from 1982 through 1998; and services as a Director of various other public companies including U.S. Telephone Inc. (1981-1984), Fisher Imaging Inc. (1991-1998) and Digital Transmissions Systems (1995-1999). In addition, Mr. LaHaye served from 1981 to 2000 as a Director and Chairman of Peregrine Venture Management Co., a venture capital firm, and has been a Member and Chairman of the Fund’s Audit Committee since its inception. As a result of such background and experience, the Board of Directors believes that Mr. LaHaye has acquired an understanding of generally accepted accounting principles and financial statements, the general application of such principles in connection with the accounting estimates, accruals and reserves, and analyzing and evaluating financial statements that present a breadth and level of complexity of accounting issues generally comparable to those of the Fund, as well as an understanding of internal controls and procedures for financial reporting and an understanding of audit committee functions. Mr. LaHaye is an independent Director as that term is defined under the relevant Securities and Exchange Commission Rules and Releases.
The Statement of Additional Information (SAI) Includes additional information about the board members and is available, without charge, upon request. Contract owners may call 1-800/321-8563 or their insurance companies to request the SAI.
BOD-4
FRANKLIN TEMPLETON VARIABLE INSURANCE PRODUCTS TRUST
Proxy Voting Policies and Procedures
The Fund has established Proxy Voting Policies and Procedures (“Policies”) that the Fund uses to determine how to vote proxies relating to portfolio securities. Shareholders may view the Fund’s complete Policies online at franklintempleton.com. Alternatively, shareholders may request copies of the Policies free of charge by calling the Proxy Group collect at 1-954/847-2268 or by sending a written request to: Franklin Templeton Companies, LLC, 500 East Broward Boulevard, Suite 1500, Fort Lauderdale, FL 33394, Attention: Proxy Group.
PV-1
(a) The Registrant has adopted a code of ethics that applies to its principal executive officers and principal financial and accounting officer.
(c) N/A
(d) N/A
(f) Pursuant to Item 10(a), the Registrant is attaching as an exhibit a copy of its code of ethics that applies to its principal executive officers financial and accounting officer.
FRANKLIN TEMPLETON INVESTMENTS
CODE OF ETHICS
AND
POLICY STATEMENT ON INSIDER TRADING
TABLE OF CONTENTS
Page 1
CODE OF ETHICS
Franklin Resources, Inc. and all of its subsidiaries, and the funds in the Franklin Templeton Group of Funds (the “Funds”) (collectively, “Franklin Templeton Investments”) will follow this Code of Ethics (the “Code”) and Policy Statement on Insider Trading (the “Insider Trading Policy”), including any supplemental memoranda. Additionally, the subsidiaries listed in Appendix C of this Code, together with Franklin Resources, Inc., the Funds, the Fund’s investment advisers and principal underwriter, have adopted the Code and Insider Trading Policy.
PART 1 - STATEMENT OF PRINCIPLES
Franklin Templeton Investments’ policy is that the interests of shareholders and clients are paramount and come before the interests of any director, officer or employee of Franklin Templeton Investments.1
Personal investing activities of ALL directors, officers and employees of Franklin Templeton Investments should be conducted in a manner to avoid actual OR potential conflicts of interest with Franklin Templeton Investments, Fund shareholders, and other clients of any Franklin Templeton adviser.
Directors, officers and employees of Franklin Templeton Investments shall use their positions with Franklin Templeton Investments and any investment opportunities they learn of because of their positions with Franklin Templeton Investments, in a manner consistent with their fiduciary duties for the benefit of Fund shareholders, and clients.
PART 2 - PURPOSES, AND CONSEQUENCES OF NON-COMPLIANCE
It is important that you read and understand this document, because its overall purpose is to help all of us comply with the law and to preserve and protect the outstanding reputation of Franklin Templeton Investments. This document was adopted to comply with Securities and Exchange Commission rules under the Investment Company Act of 1940 (“1940 Act”), the Investment Advisers Act of 1940 (“Advisers Act”), the Insider Trading and Securities Fraud Enforcement Act of 1988 (“ITSFEA”), industry practice and the recommendations contained in the ICI’s Report of the Advisory Group on Personal Investing. Any violation of the Code or Insider Trading Policy, including engaging in a prohibited transaction or failing to file required reports, may result in disciplinary action, and, when appropriate, termination of employment and/or referral to appropriate governmental agencies.
Page 2
PART 3 - COMPLIANCE REQUIREMENTS FOR ALL ACCESS PERSONS
| 3.1 | WHO IS COVERED BY THE CODE AND HOW DOES IT WORK? |
The principles contained in the Code must be observed by ALL directors, officers and employees2 of Franklin Templeton Investments. However, there are different categories of restrictions on personal investing activities. The category in which you have been placed generally depends on your job function, although unique circumstances may result in you being placed in a different category.
The Code covers the following categories of employees who are described below:
| (1) | ACCESS PERSONS: Access Persons are those employees who have “ACCESS TO INFORMATION” concerning recommendations made to a Fund or client with regard to the purchase or sale of a security. Examples of “ACCESS TO INFORMATION” would include having access to trading systems, portfolio accounting systems, research databases or settlement information. Access Persons would typically include employees, including Futures Associates, in the following departments: |
| | • | information services & technology; |
| | • | legal and legal compliance |
| | • | and anyone else designated by the Director, Global Compliance |
In addition, you are an Access Person if you are any of the following:
| | • | an officer or and directors of funds; |
| | • | an officer or director of an investment advisor or broker-dealer subsidiary in Franklin Templeton Investments; |
| | • | a person that controls those entities; and |
| | • | any Franklin Resources’ Proprietary Account (“Proprietary Account”)3 |
| (2) | PORTFOLIO PERSONS: Portfolio Persons are a subset of Access Persons and are those employees of Franklin Templeton Investments, who, in connection with his or her regular functions or duties, makes or participates in the decision to purchase or sell a security by a Fund in Franklin Templeton Investments, or any other client or if his or her functions relate to the making of any recommendations about those purchases or sales. Portfolio Persons include: |
| | • | employees serving in equivalent capacities (such as Futures Associates); |
| | • | employees supervising the activities of Portfolio Persons; and anyone else |
| | • | designated by the Director, Global Compliance |
| (3) | NON-ACCESS PERSONS: If you are an employee of Franklin Templeton Investments AND you do not fit into any of the above categories, you are a Non-Access Person. Because you do not normally receive confidential information about Fund portfolios, you are subject only to the prohibited transaction provisions described in 3.4 of this Code and the Franklin Resources, Inc.’s Standards of Business Conduct contained in the Employee Handbook. |
Page 3
Please contact the Legal Compliance Department if you are unsure as to what category you fall in or whether you should be considered to be an Access Person or Portfolio Person.
The Code works by prohibiting some transactions and requiring pre-clearance and reporting of most others. NON-ACCESS PERSONS do not have to pre-clear their security transactions, and, in most cases, do not have to report their transactions. “INDEPENDENT DIRECTORS” need not pre-clear or report any securities transaction unless you knew, or should have known that, during the 15-day period before or after the transaction, the security was purchased or sold or considered for purchase or sale by a Fund or Franklin Resources for a Fund. (SEE Section 5.2.B below.) HOWEVER, PERSONAL INVESTING ACTIVITIES OF ALL EMPLOYEES AND INDEPENDENT DIRECTORS ARE TO BE CONDUCTED IN COMPLIANCE WITH THE PROHIBITED TRANSACTIONS PROVISIONS CONTAINED IN 3.4 BELOW. If you have any questions regarding your personal securities activity, contact the Legal Compliance Department.
| 3.2 | WHAT ACCOUNTS AND TRANSACTIONS ARE COVERED? |
The Code covers all of your personal securities accounts and transactions, as well as transactions by any of Franklin Resource’s Proprietary Accounts. It also covers all securities and accounts in which you have “beneficial ownership.”4 A transaction by or for the account of your spouse, or any other family member living in your home is considered to be the same as a transaction by you. Also, a transaction for any account in which you have any economic interest (other than the account of an unrelated client for which advisory fees are received) AND have or share investment control is generally considered the same as a transaction by you. For example, if you invest in a corporation that invests in securities and you have or share control over its investments, that corporation’s securities transactions are considered yours.
However, you are not deemed to have a pecuniary interest in any securities held by a partnership, corporation, trust or similar entity unless you control, or share control of such entity, or have, or share control over its investments. For example, securities transactions of a trust or foundation in which you do not have an economic interest (i.e., you are not the trustor or beneficiary) but of which you are a trustee are not considered yours unless you have voting or investment control of its assets. Accordingly, each time the words “you” or “your” are used in this document, they apply not only to your personal transactions and accounts, but also to all transactions and accounts in which you have any direct or indirect beneficial interest. If it is not clear whether a particular account or transaction is covered, ask a Preclearance Officer for guidance.
| 3.3 | WHAT SECURITIES ARE EXEMPT FROM THE CODE OF ETHICS? |
You do not need to pre-clear OR report transactions of the following securities:
| | (1) | securities that are direct obligations of the U. S. Government (i.e., issued or guaranteed by the U.S. Government, such as Treasury bills, notes and bonds, including U.S. Savings Bonds and derivatives thereof); |
| | (2) | high quality short-term instruments, including but not limited to bankers’ acceptances, bank certificates of deposit, commercial paper and repurchase agreements; |
| | (3) | shares of registered open-end investment companies (“mutual funds”); and |
Page 4
| | (4) | commodity futures (excluding futures on individual securities), currencies, currency forwards and derivatives thereof. |
Such transactions are also exempt from: (i) the prohibited transaction provisions contained in Part 3.4 such as front-running; (ii) the additional compliance requirements applicable to portfolio persons contained in Part 4; and (iii) the applicable reporting requirements contained in Part 5.
| 3.4 | PROHIBITED TRANSACTIONS FOR ALL ACCESS PERSONS |
Certain transactions described below have been determined by the courts and the SEC to be prohibited by law. The Code reiterates that these types of transactions are a violation of the Statement of Principals and are prohibited. Preclearance, which is a cornerstone of our compliance efforts, cannot detect transactions which are dependent upon INTENT, or which by their nature, occur before any order has been placed for a fund or client. A Preclearance Officer, who is there to assist you with compliance with the Code, CANNOT guarantee any transaction or transactions comply with the Code or the law. The fact that your transaction receives preclearance, shows evidence of good faith, but depending upon all the facts, may not provide a full and complete defense to any accusation of violation of the Code or of the law. For example, if you executed a transaction for which you received approval, or if the transaction was exempt from preclearance (e.g., a transaction for 100 shares or less), would not preclude a subsequent finding that front-running or scalping occurred because such activity are dependent upon your intent. Intent cannot be detected during preclearance, but only after a review of all the facts.
In the final analysis, compliance remains the responsibility of EACH individual effecting personal securities transactions.
| | B. | FRONT-RUNNING: TRADING AHEAD OF A FUND OR CLIENT |
You cannot front-run any trade of a Fund or client. The term “front-run” means knowingly trading before a contemplated transaction by a Fund or client of any Franklin Templeton adviser, whether or not your trade and the Fund’s or client’s trade take place in the same market. Thus, you may not:
| | (1) | purchase a security if you intend, or know of Franklin Templeton Investments’ intention, to purchase that security or a related security on behalf of a Fund or client, or |
| | (2) | sell a security if you intend, or know of Franklin Templeton Investments’ intention, to sell that security or a related security on behalf of a Fund or client. |
You cannot purchase a security (or its economic equivalent) with the intention of recommending that the security be purchased for a Fund, or client, or sell short a security (or its economic equivalent) with the intention of recommending that the security be sold for a Fund or client. Scalping is prohibited whether or not you realize a profit from such transaction.
| | D. | TRADING PARALLEL TO A FUND OR CLIENT |
You cannot buy a security if you know that the same or a related security is being bought contemporaneously by a Fund or client, or sell a security if you know that the same or a related security is being sold contemporaneously by a Fund or client.
Page 5
| | E. | TRADING AGAINST A FUND OR CLIENT |
You cannot:
| | (1) | buy a security if you know that a Fund or client is selling the same or a related security, or has sold the security, until seven (7) calendar days after the Fund’s or client’s order has either been executed or withdrawn, or |
| | (2) | sell a security if you know that a Fund or client is buying the same or a related security, or has bought the security until seven (7) calendar days after the Fund’s or client’s order has either been executed or withdrawn. |
Refer to Section I.A., “Pre-Clearance Standards,” of Appendix A of the Code for more details regarding the preclearance of personal securities transactions.
| | F. | USING PROPRIETARY INFORMATION FOR PERSONAL TRANSACTIONS |
You cannot buy or sell a security based on Proprietary Information 5 without disclosing the information and receiving written authorization. If you wish to purchase or sell a security about which you obtained such information, you must report all of the information you obtained regarding the security to the Appropriate Analyst(s)6, or to the Director, Global Compliance for dissemination to the Appropriate Analyst(s).
You will be permitted to purchase or sell such security if the Appropriate Analyst(s) confirms to the Preclearance Desk that there is no intention to engage in a transaction regarding the security within seven (7) calendar days on behalf of an Associated Client7 and you subsequently preclear such security in accordance with Part 6 below.
| | G. | CERTAIN TRANSACTIONS IN SECURITIES OF FRANKLIN RESOURCES, INC., AND AFFILIATED CLOSED-END FUNDS, AND REAL ESTATE INVESTMENT TRUST |
If you are an employee of Franklin Resources, Inc. or any of its affiliates, including Franklin Templeton Investments, you cannot effect a short sale of the securities, including “short sales against the box” of Franklin Resources, Inc., or any of the Franklin or Templeton closed-end funds, or any other security issued by Franklin Resources, Inc. or its affiliates. This prohibition would also apply to effecting economically equivalent transactions, including, but not limited to purchasing and selling call or put options and “swap” transactions or other derivatives. Officers and directors of Franklin Templeton Investments who may be covered by Section 16 of the Securities Exchange Act of 1934, are reminded that their obligations under that section are in addition to their obligations under this Code.
As an employee of Franklin Templeton Investments, you may not serve as a director, trustee, or in a similar capacity for any public or private company (excluding not-for-profit companies, charitable groups, and eleemosynary organizations) unless you receive approval from Franklin Resources, Inc. Presidents (excluding the vote of any member who is seeking such approval for himself) and it is determined that your service is consistent with the interests of the clients of Franklin Templeton Investments. You must notify the Legal Compliance Department in writing of your interest in serving as a director, which includes the justification for such directorship. Legal Compliance will process the request through Franklin Resources, Inc. Presidents.
Legal Compliance will advise you of Franklin Resources, Inc. Presidents decision. If approved, the Legal Compliance Department will furnish procedures applicable to serving as an outside director to you.
Page 6
PART 4 - ADDITIONAL COMPLIANCE REQUIREMENTS APPLICABLE TO PORTFOLIO PERSONS8
| 4.1 | REQUIREMENT TO DISCLOSE INTEREST AND METHOD OF DISCLOSURE |
As a Portfolio Person, you must promptly disclose your direct or indirect beneficial interest in a security whenever you learn that the security is under consideration for purchase or sale by an Associated Client in the Franklin Templeton Group and you;
| | (1) | Have or share investment control of the Associated Client; |
| | (2) | Make any recommendation or participate in the determination of which recommendation shall be made on behalf of the Associated Client; or |
| | (3) | Have functions or duties that relate to the determination of which recommendation shall be made to the Associated Client. |
In such instances, you must initially disclose that beneficial interest orally to the primary portfolio manager (or other Appropriate Analyst) of the Associated Client(s) considering the security, the Director of Research and Trading or the Director, Global Compliance. Following that oral disclosure, you must send a written acknowledgment of that interest on Schedule E (or on a form containing substantially similar information) to the primary portfolio manager (or other Appropriate Analyst), with a copy to the Legal Compliance Department.
| 4.2 | SHORT SALES OF SECURITIES |
You cannot sell short ANY security held by your Associated Clients, including “short sales against the box”. Additionally, Portfolio Persons associated with the Templeton Group of Funds and clients cannot sell short any security on the Templeton “Bargain List”. This prohibition would also apply to effecting economically equivalent transactions, including, but not limited to, sales of uncovered call options, purchases of put options while not owning the underlying security and short sales of bonds that are convertible into equity positions.
Portfolio Persons cannot profit from the purchase and sale or sale and purchase within sixty calendar days of any security, including derivatives. Portfolio Persons are responsible for transactions that may occur in margin and option accounts and all such transactions must comply with this restriction.8 This restriction does NOT apply to:
| | (1) | trading within a shorter period if you do not realize a profit and if you do not violate any other provisions of this Code; AND |
| | (2) | profiting on the purchase and sale or sale and purchase within sixty calendar days of the following securities: |
| | ¨ | securities that are direct obligations of the U.S. Government, such as Treasury bills, notes and bonds, and U.S. Savings Bonds and derivatives thereof; |
| | ¨ | high quality short-term instruments (“money market instruments”) including but not limited to (i) bankers’ acceptances, (ii) U.S. bank certificates of deposit; (iii) commercial paper; and (iv) repurchase agreements; |
Page 7
| | ¨ | shares of registered open-end investment companies including Exchange Traded Funds (EFT) and Holding Company Depository Receipts (Hldrs); |
| | ¨ | commodity futures, currencies, currency forwards and derivatives thereof. |
Calculation of profits during the 60-calendar day holding period generally will be based on “last-in, first-out” (“LIFO”). Portfolio Persons may elect to calculate their 60 calendar day profits on either a LIFO or FIFO (“first-in, first-out”) basis when there has not been any activity in such security by their Associated Clients during the previous 60 calendar days.
| 4.4 | SECURITIES SOLD IN A PUBLIC OFFERING |
Portfolio Persons cannot buy securities in any initial public offering, or a secondary offering by an issuer, INCLUDING initial public offerings of securities made by closed-end funds and real estate investment trusts advised by Franklin Templeton Investments. Purchases of open-end mutual funds are excluded from this prohibition.
| 4.5 | INTERESTS IN PARTNERSHIPS AND SECURITIES ISSUED IN PRIVATE PLACEMENTS |
Portfolio Persons cannot acquire limited partnership interests or other securities in private placements unless they:
| | (1) | complete the Private Placement Checklist (Schedule H); |
| | (2) | provide supporting documentation (e.g., a copy of the offering memorandum); and |
| | (3) | obtain approval of the appropriate Chief Investment Officer; and |
| | (4) | submit all documents to the Legal Compliance Department |
Approval will only be granted after the Director of Global Compliance consults with an executive officer of Franklin Resources, Inc.
PART 5 - REPORTING REQUIREMENTS FOR ALL ACCESS PERSONS
| 5.1 | REPORTING OF BENEFICIAL OWNERSHIP AND SECURITIES TRANSACTIONS |
Compliance with the following personal securities transaction reporting procedures is essential to enable us to meet our responsibilities to Funds and other clients and to comply with regulatory requirements. You are expected to comply with both the letter and spirit of these requirements, including completing and filing all reports required under the Code in a timely manner.
| 5.2 | INITIAL HOLDINGS AND BROKERAGE ACCOUNT REPORTS |
A. ALL ACCESS PERSONS (EXCEPT INDEPENDENT DIRECTORS)
Every employee (new or transfer) of Franklin Templeton Investments who becomes an Access Person, must file:
| | (1) | An Acknowledgement Form; |
| | (2) | Schedule C: Initial, Annual & Updated Disclosure of Securities Holdings; and |
| | (3) | Schedule F: Initial, Annual & Updated Disclosure of Securities Accounts |
The Acknowledgement Form, Schedule C and Schedule F MUST be completed and returned to the Legal Compliance Department within 10 CALENDAR DAYS of the date the employee becomes an access person.
Page 8
| 5.3 | QUARTERLY TRANSACTION REPORTS |
| | A. | ALL ACCESS PERSONS (EXCEPT INDEPENDENT DIRECTORS) |
You MUST report ALL securities transactions by; (i) providing the Legal Compliance Department with copies of ALL broker’s confirmations and statements within 10 calendar days after the end of the calendar quarter (which may be sent under separate cover by the broker) showing ALL transactions and holdings in securities AND (ii) certifying by January 30th of each year that you have disclosed all such brokerage accounts on Schedule F to the Legal Compliance Department. The brokerage statements and confirmations must include all transactions in securities in which you have, or by reason of the transaction acquire any direct or indirect beneficial ownership, including transactions in a discretionary account and transactions for any account in which you have any economic interest AND have or share investment control. Also, if you acquire securities by any other method which is not being reported to the Legal Compliance Department by a duplicate confirmation statement at or near the time of the acquisition, you must report that acquisition to the Legal Compliance Department on Schedule B within 10 calendar days after you are notified of the acquisition. Such acquisitions include, among other things, securities acquired by gift, inheritance, vesting,9 stock splits, merger or reorganization of the issuer of the security.
You must file these documents with the Legal Compliance Department not later than 10 calendar days after the end of each quarter, but you need not show or report transactions for any account over which you had no direct or indirect influence or control.10 Failure to timely report transactions is a violation of Rule 17j-1 as well as the Code, and may be reported to the Fund’s Board of Directors and may also result, among other things, in denial of future personal security transaction requests.
If you are a director of a Fund within Franklin Templeton Investments but you are not an “interested person” of the Fund, you are not required to file transaction reports unless you knew or should have known that, during the 15-day period before or after a transaction, the security was purchased or sold, or considered for purchase or sale, by a Fund or by Franklin Templeton Investments on behalf of a Fund.
| 5.4 | ANNUAL REPORTS - ALL ACCESS PERSONS |
| | A. | SECURITIES ACCOUNTS REPORTS (EXCEPT INDEPENDENT DIRECTORS) |
As an access person, you must file a report of all personal securities accounts on Schedule F, with the Legal Compliance Department, annually by January 30th. You must report the name and description of each securities account in which you have a direct or indirect beneficial interest, including securities accounts of a spouse and minor children. You must also report any account in which you have any economic interest AND have or share investment control (e.g., trusts, foundations, etc.) other than an account for a Fund in, or a client of, Franklin Templeton Investments.
| | B. | SECURITIES HOLDINGS REPORTS (EXCEPT INDEPENDENT DIRECTORS) |
You must file a report of personal securities holdings on Schedule C, with the Legal Compliance Department, by January 30th of each year. This report should include ALL of your securities holdings, including any security acquired by a transaction, gift, inheritance, vesting, merger or reorganization of the issuer of the security, in which you have any direct or indirect beneficial ownership, including securities holdings in a discretionary account and for any account in which you have any economic interest AND have or share investment control. Your securities holding information must be current as of a date no more than 30 days before the report is submitted. You may attach copies of
Page 9
year-end brokerage statements to the Schedule C in lieu of listing each security position on the schedule.
| | C. | CERTIFICATION OF COMPLIANCE WITH THE CODE OF ETHICS (INCLUDING INDEPENDENT DIRECTORS) |
All access persons, including independent directors, will be asked to certify that they will comply with FRANKLIN TEMPLETON INVESTMENTS’ CODE OF ETHICS AND POLICY STATEMENT ON INSIDER TRADING by filing the Acknowledgment Form with the Legal Compliance Department within 10 business days of receipt of the Code. Thereafter, you will be asked to certify that you have complied with the Code during the preceding year by filing a similar Acknowledgment Form by January 30 of each year.
| 5.5 | BROKERAGE ACCOUNTS AND CONFIRMATIONS OF SECURITIES TRANSACTIONS (EXCEPT INDEPENDENT DIRECTORS) |
If you are an access person, in Franklin Templeton Investments, before or at a time contemporaneous with opening a brokerage account with a registered broker-dealer, or a bank, or placing an initial order for the purchase or sale of securities with that broker-dealer or bank, you must:
| | (1) | notify the Legal Compliance Department, in writing, by completing Schedule D or by providing substantially similar information; and |
| | (2) | notify the institution with which the account is opened, in writing, of your association with Franklin Templeton Investments. |
The Compliance Department will request the institution in writing to send to it duplicate copies of confirmations and statements for all transactions effected in the account simultaneously with their mailing to you.
If you have an existing account on the effective date of this Code or upon becoming an access person, you must comply within 10 days with conditions (1) and (2) above.
PART 6 - PRE-CLEARANCE REQUIREMENTS
| 6.1 | PRIOR APPROVAL OF SECURITIES TRANSACTIONS |
Unless you are covered by Paragraph C or D below, you cannot buy or sell any security, without first contacting a Preclearance Officer by fax, phone, or e-mail and obtaining his or her approval. Approval is good until the close of the business day following the day clearance is granted but may be extended in special circumstances, shortened or rescinded, as explained in Appendix A.
| | B. | SECURITIES NOT REQUIRING PRECLEARANCE |
The securities enumerated below do not require preclearance under the Code. However, all other provisions of the Code apply, including, but not limited to: (i) the prohibited transaction provisions contained in Part 3.4 such as front-running; (ii) the additional compliance requirements applicable to portfolio persons contained in Part 4, (iii) the applicable reporting requirements contained in Part 5; and (iv) insider trading prohibitions. You need NOT pre-clear transactions in the following securities:
| | (1) | FRANKLIN RESOURCES, INC., AND ITS AFFILIATES. Purchases and sales of securities of Franklin Resources, Inc., closed-end funds of the Franklin Templeton Group, or real estate investment trusts advised by Franklin Properties Inc., as these securities cannot be purchased on behalf of our advisory clients.11 |
Page 10
| | • | Transactions of 500 shares or less of any security, regardless of where it is traded in any 30 day period; or |
| | • | Transactions of 1000 shares or less of the top 50 securities by volume during the previous calendar quarter on the NYSE or NASDAQ NMS (does not include Small Cap or OTC) in any 30 day period. |
| | • | Transactions in municipal bonds with a face value of $100,000 or less. |
HOWEVER, YOU MAY NOT EXECUTE ANY TRANSACTION, REGARDLESS OF QUANTITY, IF YOU LEARN THAT THE FUNDS ARE ACTIVE IN THE SECURITY. IT WILL BE PRESUMED THAT YOU HAVE KNOWLEDGE OF FUND ACTIVITY IN THE SECURITY IF, AMONG OTHER THINGS, YOU ARE DENIED APPROVAL TO GO FORWARD WITH A TRANSACTION REQUEST.
| | (3) | DIVIDEND REINVESTMENT PLANS: Transactions made pursuant to dividend reinvestment plans (“DRIPs”) do not require preclearance regardless of quantity or Fund activity. |
| | (4) | GOVERNMENT OBLIGATIONS. Transactions in securities issued or guaranteed by the governments of the United States, Canada, the United Kingdom, France, Germany, Switzerland, Italy and Japan, or their agencies or instrumentalities, or derivatives thereof. |
| | (5) | PAYROLL DEDUCTION PLANS. Securities purchased by an employee’s spouse pursuant to a payroll deduction program, provided the access person has previously notified the Compliance Department in writing that the spouse will be participating in the payroll deduction program. |
| | (6) | EMPLOYER STOCK OPTION PROGRAMS. Transactions involving the exercise and/or purchase by an access person or an access person’s spouse of securities pursuant to a program sponsored by a corporation employing the access person or spouse. |
| | (7) | PRO RATA DISTRIBUTIONS. Purchases effected by the exercise of rights issued pro rata to all holders of a class of securities or the sale of rights so received. |
| | (8) | TENDER OFFERS. Transactions in securities pursuant to a bona fide tender offer made for any and all such securities to all similarly situated shareholders in conjunction with mergers, acquisitions, reorganizations and/or similar corporate actions. However, tenders pursuant to offers for less than all outstanding securities of a class of securities of an issuer must be precleared. |
| | (9) | NOT ELIGIBLE FOR FUNDS AND CLIENTS. Transactions in any securities that are prohibited investments for all Funds and clients advised by the entity employing the access person. |
| | (10) | NO INVESTMENT CONTROL. Transactions effected for an account or entity over which you do not have or share investment control (i.e., an account where someone else exercises complete investment control). |
| | (11) | NO BENEFICIAL OWNERSHIP. Transactions in which you do not acquire or dispose of direct or indirect beneficial ownership (i.e., an account where in you have no financial interest). |
| | (12) | ETFS AND HOLDRS. Transactions in Exchange-Traded Funds and Holding Company Depository Receipts (Holdrs). |
Page 11
Although an access person’s securities transaction may be exempt from preclearing, such transactions must comply with the prohibited transaction provisions of Section 3.4 above. Additionally, you may not trade any securities as to which you have “inside information” (see attached FRANKLIN TEMPLETON INVESTMENTS’ POLICY STATEMENT ON INSIDER TRADING). If you have any questions, contact a Preclearance Officer before engaging in the transaction. If you have any doubt whether you have or might acquire direct or indirect beneficial ownership or have or share investment control over an account or entity in a particular transaction, or whether a transaction involves a security covered by the Code, you should consult with a Preclearance Officer before engaging in the transaction.
You need not pre-clear transactions in any discretionary account for which a registered broker-dealer, a registered investment adviser, or other investment manager acting in a similar fiduciary capacity, which is not affiliated with Franklin Templeton Investments, exercises sole investment discretion, if the following conditions are met:12
| | (1) | The terms of each account relationship (“Agreement”) must be in writing and filed with a Preclearance Officer prior to any transactions. |
| | (2) | Any amendment to each Agreement must be filed with a Preclearance Officer prior to its effective date. |
| | (3) | The Portfolio Person certifies to the Compliance Department at the time such account relationship commences, and annually thereafter, as contained in Schedule G of the Code that such Portfolio Person does not have direct or indirect influence or control over the account, other than the right to terminate the account. |
| | (4) | Additionally, any discretionary account that you open or maintain with a registered broker-dealer, a registered investment adviser, or other investment manager acting in a similar fiduciary capacity must provide duplicate copies of confirmations and statements for all transactions effected in the account simultaneously with their delivery to you., If your discretionary account acquires securities which are not reported to a Preclearance Officer by a duplicate confirmation, such transaction must be reported to a Preclearance Officer on Schedule B within 10 days after you are notified of the acquisition.13 |
However, if you make ANY request that the discretionary account manager enter into or refrain from a specific transaction or class of transactions, you must first consult with a Preclearance Officer and obtain approval prior to making such request.
| | D. | DIRECTORS WHO ARE NOT ADVISORY PERSONS OR ADVISORY REPRESENTATIVES |
You need not pre-clear any securities if:
| | (1) | You are a director of a Fund in Franklin Templeton Investments and a director of the fund’s advisor; |
| | (2) | You are not an “advisory person”14 of a Fund in Franklin Templeton Investments; and |
| | (3) | You are not an employee of any Fund, |
Page 12
or
| | (1) | You are a director of a Fund in the Franklin Templeton Group; |
| | (2) | You are not an “advisory representative”15 of Franklin Resources or any subsidiary; and |
| | (3) | You are not an employee of any Fund, |
unless you know or should know that, during the 15-day period before the transaction, the security was purchased or sold, or considered for purchase or sale, by a Fund or by Franklin Resources on behalf of a Fund or other client.
Directors, other than independent Directors, qualifying under this paragraph are required to comply with all applicable provisions of the Code including reporting their initial holdings and brokerage accounts in accordance with 5.2, personal securities transactions and accounts in accordance with 5.3 and 5.5, and annual reports in accordance with 5.4 of the Code.
| | E. | LIMITED EXCEPTION FOR CERTAIN PROPRIETARY ACCOUNTS |
Franklin Templeton Investments may sponsor private partnerships and other pooled investment accounts (“affiliated accounts”) intended for distribution to unaffiliated persons. At the outset of operations of such affiliated accounts, Franklin Templeton Investments will likely have a significant ownership interest, thereby causing the affiliated account to be a Proprietary Account. Though considered a Proprietary Account for all other purposes of this Code, an affiliated account need not pre-clear any securities transaction during the first full 12 month period after its commencement of operations.
PART 7 - PENALTIES FOR VIOLATIONS OF THE CODE
The Code is designed to assure compliance with applicable law and to maintain shareholder confidence in Franklin Templeton Investments.
In adopting this Code, it is the intention of the Boards of Directors/Trustees, to attempt to achieve 100% compliance with all requirements of the Code - but it is recognized that this may not be possible. Incidental failures to comply with the Code are not necessarily a violation of the law or the Franklin Templeton Investment’s Statement of Principles. Such isolated or inadvertent violations of the Code not resulting in a violation of law or the Statement of Principles will be referred to the Director, Global Compliance and/or management personnel, and disciplinary action commensurate with the violation, if warranted, will be imposed. Additionally, if you violate any of the enumerated prohibited transactions contained in Parts 3 and 4 of the Code, you will be expected to give up ANY profits realized from these transactions to Franklin Resources for the benefit of the affected Funds or other clients. If Franklin Resources cannot determine which Fund(s) or client(s) were affected, the proceeds will be donated to a charity chosen by Franklin Resources. Please refer to the following page for guidance of the types of sanctions that would likely be imposed for isolated or inadvertent violations of the Code.
However, failure to disgorge profits when requested or a pattern of violations that individually do not violate the law or Statement of Principles, but which taken together demonstrate a lack of respect for the Code of Ethics, may result in more significant disciplinary action including termination of employment. A violation of the Code resulting in a violation of the law will be severely sanctioned, with disciplinary action including, but not limited to, referral of the matter to the board of directors of the affected Fund, termination of employment or referral of the matter to the appropriate regulatory agency for civil and/or criminal investigation.
Page 13
CODE OF ETHICS SANCTION GUIDELINES
| | |
VIOLATION
| | SANCTION IMPOSED
|
| |
• Failure to preclear but otherwise would have been approved (i.e., no conflict with the fund’s transactions). | | Reminder Memo |
| |
• Failure to preclear but otherwise would have been approved (i.e., no conflict with the fund’s transactions) twice within 12 calendar months - | | 30 Day Personal Securities Trading Suspension |
| |
• Failure to preclear and the transaction would have been disapproved: | | |
| |
• Failure to preclear but otherwise would have been approved (i.e., no conflict with the fund’s transactions) three times or more within 12 calendar months | | Greater Than 30 Day Personal Securities Trading Suspension (e.g., 60 or 90 Days) |
| |
• Failure to preclear and the transaction would have been disapproved twice or more within 12 calendar months | | |
| |
• Profiting from short-swing trades (profiting on purchase & sale/sale & purchase within 60 days | | Profits are donated to The United Way (or charity of employee’s choice) |
| |
• Repeated violations of the Code of after Ethics even if each individual violation might be considered deminimis | | Fines levied discussion with the General Counsel and and appropriate CIO. |
PART 8 - A REMINDER ABOUT THE FRANKLIN TEMPLETON INVESTMENTS INSIDER TRADING POLICY
The Code of Ethics is primarily concerned with transactions in securities held or to be acquired by any of the Funds or Franklin Resources’ clients, regardless of whether those transactions are based on inside information or actually harm a Fund or a client.
The Insider Trading Policy (attached to this document) deals with the problem of insider trading in securities that could result in harm to a Fund, a client, or members of the public, and applies to all directors, officers and employees of any entity in the Franklin Templeton Investments. Although the requirements of the Code and the Insider Trading Policy are similar, you must comply with both.
PART 9 - FOREIGN COUNTRY SUPPLEMENTS (CANADA)
The Investment Funds Institute of Canada (“IFIC”) has implemented a new Model Code of Ethics for Personal Investing (the “IFIC Code”) to be adopted by all IFIC members. Certain provisions in the IFIC Code differ from the provisions of Franklin Templeton Investments Code of Ethics (the “FT Code”). This Supplementary Statement of Requirements for Canadian Employees (the “Canadian Supplement”) describes certain further specific requirements that govern the
Page 14
activities of Franklin Templeton Investments Corp. (“FTIC”). It is important to note that the Canadian Supplement does not replace the FT Code but adds certain restrictions on trading activities, which must be read in conjunction with the Code.
All capitalized terms in this Canadian Supplement, unless defined in this Canadian Supplement, have the meaning set forth in the FT Code.
INITIAL PUBLIC AND SECONDARY OFFERINGS
Access Persons cannot buy securities in any initial public offering, or a secondary offering by an issuer. Public offerings of securities made by Franklin Templeton Investments, including open-end and closed-end mutual funds, real estate investment trusts and securities of Franklin Resources, Inc, are excluded from this prohibition.
NOTE: THE FT CODE PRESENTLY PROHIBITS PORTFOLIO PERSONS FROM BUYING SECURITIES IN ANY INITIAL PUBLIC OFFERING, OR A SECONDARY OFFERING BY AN ISSUER (SEE SECTION 4.5 OF THE FT CODE). THIS PROVISION EXTENDS SECTION 4.5 OF THE FT CODE TO ALL ACCESS PERSONS.
INTERESTS IN PARTNERSHIPS AND SECURITIES ISSUED IN PRIVATE PLACEMENTS
Access Persons and Portfolio Persons cannot acquire limited partnership interests or other securities in private placements unless they obtain approval of the Compliance Officer after he or she consults with an executive officer of Franklin Resources, Inc. Purchases of limited partnership interests or other securities in private placements will not be approved, unless in addition to the requirements for the approval of other trades and such other requirements as the executive officer of Franklin Resources, Inc. may require, the Compliance Officer is satisfied that the issuer is a “private company” as defined in the SECURITIES ACT (Ontario) and the Access Person has no reason to believe that the issuer will make a public offering of its securities in the foreseeable future.
NOTE: THE FT CODE PRESENTLY PROHIBITS AS A GENERAL RULE PORTFOLIO PERSONS FROM BUYING LIMITED PARTNERSHIP INTERESTS OR OTHER SECURITIES IN PRIVATE PLACEMENTS (SEE SECTION 4.6 OF THE FT CODE). THIS SECTION EXTENDS THE AMBIT OF THE PROHIBITION TO ACCESS PERSONS AND LIMITS THE EXCEPTION TO THE GENERAL RULE CONTAINED IN SECTION 4.6 OF THE FT CODE.
ADDITIONAL REQUIREMENTS TO OBTAIN APPROVAL FOR PERSONAL TRADES Prior to an Access Person obtaining approval for a personal trade he or she must advise the Compliance Officer that he or she:
| • | Does not possess material non-public information relating to the security; |
| • | Is not aware of any proposed trade or investment program relating to that security by any of the Franklin Templeton Group of Funds; |
| • | Believes that the proposed trade has not been offered because of the Access Person’s position in Franklin Templeton Investments and is available to any market participant on the same terms; |
| • | Believes that the proposed trade does not contravene any of the prohibited activities set out in Section 3.4 of the FT Code, and in the case of Portfolio Persons does not violate any of the additional requirements set out in Part 4 of the FT Code; and |
| • | Will provide any other information requested by the Compliance Officer concerning the proposed personal trade. |
Page 15
An Access Person may contact the Compliance Officer by fax, phone or e-mail to obtain his or her approval.
NOTE: THE METHOD OF OBTAINING APPROVAL IS PRESENTLY SET OUT IN SECTION 6.1A OF THE FT CODE AND PROVIDES THAT AN ACCESS PERSON MAY CONTACT THE COMPLIANCE OFFICER BY FAX, PHONE OR E-MAIL. THE ADDITIONAL REQUIREMENT DESCRIBED ABOVE MAKES IT CLEAR THAT AN ACCESS PERSON MAY CONTINUE TO CONTACT THE COMPLIANCE OFFICER IN THE SAME MANNER AS BEFORE. THE ACCESS PERSON WILL HAVE DEEMED TO HAVE CONFIRMED COMPLIANCE WITH THE ABOVE REQUIREMENTS PRIOR TO OBTAINING APPROVAL FROM THE COMPLIANCE OFFICER.
APPOINTMENT OF INDEPENDENT REVIEW PERSON
FTIC shall appoint an independent review person who will be responsible for approval of all personal trading rules and other provisions of the FT Code with respect to FTIC and for monitoring the administration of the FT Code from time to time with respect to FTIC employees. The Compliance Officer will provide a written report to the Independent Review Person, at least annually, summarizing:
| • | Compliance with the FT Code for the period under review |
| • | Violations of the FT Code for the period under review |
| • | Sanctions imposed by Franklin Templeton Investments for the period under review |
| • | Changes in procedures recommended by the FT Code |
| • | Any other information requested by the Independent Review Person |
APPENDIX A: COMPLIANCE PROCEDURES AND DEFINITIONS
This appendix sets forth the additional responsibilities and obligations of Compliance Officers, and the Legal/Administration and Legal/Compliance Departments, under Franklin Templeton Investments’ Code of Ethics and Policy Statement on Insider Trading.
| I. | RESPONSIBILITIES OF EACH DESIGNATED COMPLIANCE OFFICER |
| | A. | PRE-CLEARANCE STANDARDS |
The Director, Global Compliance, or a Preclearance Officer, shall only permit an access person to go forward with a proposed security/16/ transaction if he or she determines that, considering all of the facts and circumstances, the transaction does not violate the provisions of Rule 17j-1, or of this Code and there is no likelihood of harm to a client.
Unless there are special circumstances that make it appropriate to disapprove a personal securities transaction request, a Preclearance Officer shall consider only those securities transactions of the “Associated Clients” of the access person, including open and executed orders and recommendations, in determining whether to approve such a request. “Associated Clients” are those Funds or clients whose trading information would be available to the access person during the course of his or her regular functions or duties. Currently, there are three groups of Associated Clients: (i) the Franklin Mutual Series Funds and clients advised by Franklin Mutual Advisers, LLC (“Mutual Clients”); (ii) the Franklin Group of Funds and the clients advised by the various Franklin investment advisers (“Franklin Clients”); and (iii) the Templeton Group of Funds and the clients advised by the various Templeton investment advisers (“Templeton Clients”). Thus, persons who have access to the trading information of Mutual Clients generally will be precleared solely against the securities transactions of the Mutual Clients, including open and executed orders and recommendations. Similarly, persons who have access to the trading information of Franklin
Page 16
Clients or Templeton Clients generally will be precleared solely against the securities transactions of Franklin Clients or Templeton Clients, as appropriate.
Certain officers of Franklin Templeton Investments, as well as legal, compliance, fund accounting, investment operations and other personnel who generally have access to trading information of the funds and clients of Franklin Templeton Investments during the course of their regular functions and duties, will have their personal securities transactions precleared against executed transactions, open orders and recommendations of the entire Franklin Templeton Investments.
| | (a) | SECURITIES TRANSACTIONS BY FUNDS OR CLIENTS |
No clearance shall be given for any transaction in any security on any day during which an Associated Client of the access person has executed a buy or sell order in that security, until seven (7) calendar days after the order has been executed. Notwithstanding a transaction in the previous seven days, clearance may be granted to sell if all Associated Clients have disposed of the security.
| | (b) | SECURITIES UNDER CONSIDERATION |
OPEN ORDERS
No clearance shall be given for any transaction in any security on any day which an Associated Client of the access person has a pending buy or sell order for such security, until seven (7) calendar days after the order has been executed.
RECOMMENDATIONS
No clearance shall be given for any transaction in any security on any day on which a recommendation for such security was made by a Portfolio Person, until seven (7) calendar days after the recommendation was made and no orders have subsequently been executed or are pending.
In considering requests by Portfolio Personnel for approval of limited partnerships and other private placement securities transactions, the Director, Global Compliance shall consult with an executive officer of Franklin Resources, Inc. In deciding whether to approve the transaction, the Director, Global Compliance and the executive officer shall take into account, among other factors, whether the investment opportunity should be reserved for a Fund or other client, and whether the investment opportunity is being offered to the Portfolio Person by virtue of his or her position with Franklin Templeton Investments. If the Portfolio Person receives clearance for the transaction, an investment in the same issuer may only be made for a Fund or client if an executive officer of Franklin Resources, Inc., who has been informed of the Portfolio Person’s pre-existing investment and who has no interest in the issuer, approves the transaction.
If a Preclearance Officer approves a proposed securities transaction, the order for the transaction must be placed and effected by the close of the next business day following the day approval was granted. The Director, Global Compliance may, in his or her discretion, extend the clearance period up to seven calendar days, beginning on the date of the approval, for a securities
Page 17
transaction of any access person who demonstrates that special circumstances make the extended clearance period necessary and appropriate.17 The Director, Global Compliance may, in his or her discretion, after consultation with a member of senior management for Franklin Resources, Inc., renew the approval for a particular transaction for up to an additional seven calendar days upon a similar showing of special circumstances by the access person. The Director, Global Compliance may shorten or rescind any approval or renewal of approval under this paragraph if he or she determines it is appropriate to do so.
| | B. | WAIVERS BY THE DIRECTOR, GLOBAL COMPLIANCE |
The Director, Global Compliance may, in his or her discretion, after consultation with an executive officer of Franklin Resources, Inc., waive compliance by any access person with the provisions of the Code, if he or she finds that such a waiver:
| | (1) | is necessary to alleviate undue hardship or in view of unforeseen circumstances or is otherwise appropriate under all the relevant facts and circumstances; |
| | (2) | will not be inconsistent with the purposes and objectives of the Code; |
| | (3) | will not adversely affect the interests of advisory clients of Franklin Templeton Investments, the interests of Franklin Templeton Investments or its affiliates; and |
| | (4) | will not result in a transaction or conduct that would violate provisions of applicable laws or regulations. |
Any waiver shall be in writing, shall contain a statement of the basis for it, and the Director, Global Compliance, shall promptly send a copy to the General Counsel of Franklin Resources, Inc.
| | C. | CONTINUING RESPONSIBILITIES OF THE LEGAL COMPLIANCE DEPARTMENT |
A Preclearance Officer shall make a record of all requests for pre-clearance regarding the purchase or sale of a security, including the date of the request, the name of the access person, the details of the proposed transaction, and whether the request was approved or denied. A Preclearance Officer shall keep a record of any waivers given, including the reasons for each exception and a description of any potentially conflicting Fund or client transactions.
A Preclearance Officer shall also collect the signed initial acknowledgments of receipt and the annual acknowledgments from each access person of receipt of a copy of the Code and Insider Trading Policy, as well as reports, as applicable, on Schedules B, C, D, E and F of the Code. In addition, a Preclearance Officer shall request copies of all confirmations, and other information with respect to an account opened and maintained with the broker-dealer by any access person of the Franklin Templeton Group. A Preclearance Officer shall preserve those acknowledgments and reports, the records of consultations and waivers, and the confirmations, and other information for the period required by applicable regulation.
A Preclearance Officer shall review brokerage transaction confirmations, account statements, Schedules B, C, D, E, F and Private Placement Checklists of Access Persons for compliance with the Code. The reviews shall include, but are not limited to;
| | (1) | Comparison of brokerage confirmations, Schedule Bs, and/or brokerage statements to preclearance request worksheets or, if a private placement, the Private Placement Checklist; |
Page 18
| | (2) | Comparison of brokerage statements and/or Schedule Cs to current securities holding information; |
| | (3) | Comparison of Schedule F to current securities account information; |
| | (4) | Conducting periodic “back-testing” of access person transactions, Schedule Es and/or Schedule Gs in comparison to fund and client transactions; |
A Preclearance Officer shall evidence review by initialing and dating the appropriate document. Any apparent violations of the Code detected by a Preclearance Officer during his or her review shall be promptly brought to the attention of the Director, Global Compliance.
| | D. | PERIODIC RESPONSIBILITIES OF THE LEGAL COMPLIANCE DEPARTMENT |
The Legal Compliance Department shall consult with the General Counsel and the Human Resources Department, as the case may be, to assure that:
| | (1) | Adequate reviews and audits are conducted to monitor compliance with the reporting, pre-clearance, prohibited transaction and other requirements of the Code. |
| | (2) | Adequate reviews and audits are conducted to monitor compliance with the reporting, pre-clearance, prohibited transaction and other requirements of the Code. |
| | (3) | All access persons and new employees of the Franklin Templeton Group are adequately informed and receive appropriate education and training as to their duties and obligations under the Code. |
| | (4) | There are adequate educational, informational and monitoring efforts to ensure that reasonable steps are taken to prevent and detect unlawful insider trading by access persons and to control access to inside information. |
| | (5) | Written compliance reports are submitted to the Board of Directors of Franklin Resources, Inc., and the Board of each relevant Fund at least annually. Such reports will describe any issues arising under the Code or procedures since the last report, including, but not limited to, information about material violations of the Code or procedures and sanctions imposed in response to the material violations. |
| | (6) | The Legal Compliance Department will certify at least annually to the Fund’s board of directors that Franklin Templeton Investments has adopted procedures reasonably necessary to prevent Access Persons from violating the Code, and |
| | (7) | Appropriate records are kept for the periods required by law. |
| | E. | APPROVAL BY FUND’S BOARD OF DIRECTORS |
The Board of Directors/Trustees must base its approval of the Code on a determination that the Code contains provisions reasonably necessary to prevent access persons from engaging in any conduct prohibited by rule 17j-1.
At the time a new fund is organized, the Legal Compliance Department will provide the Fund’s board of directors, a certification that the investment adviser and principal underwriter has adopted procedures reasonably necessary to
Page 19
prevent Access Persons from violating the Code. Such certification will state that the Code contains provisions reasonably necessary to prevent Access Persons from violating the Code.
| | (3) | Material Changes to the Code of Ethics |
The Legal Compliance Department will provide the Fund’s board of directors a written description of all material changes to the Code no later than six months after adoption of the material change by Franklin Templeton Investments.
| II. | COMPILATION OF DEFINITIONS OF IMPORTANT TERMS |
For purposes of the Code of Ethics and Insider Trading Policy, the terms below have the following meanings:
1934 ACT - The Securities Exchange Act of 1934, as amended.
1940 ACT - The Investment Company Act of 1940, as amended.
ACCESSPERSON - Each director, trustee, general partner or officer, and any other person that directly or indirectly controls (within the meaning of Section 2(a)(9) of the 1940 Act) the Franklin Templeton Group or a person, including an Advisory Representative, who has access to information concerning recommendations made to a Fund or client with regard to the purchase or sale of a security.
ADVISORY REPRESENTATIVE - Any officer or director of Franklin Resources; any employee who makes any recommendation, who participates in the determination of which recommendation shall be made, or whose functions or duties relate to the determination of which recommendation shall be made; any employee who, in connection with his or her duties, obtains any information concerning which securities are being recommended prior to the effective dissemination of such recommendations or of the information concerning such recommendations; and any of the following persons who obtain information concerning securities recommendations being made by Franklin Resources prior to the effective dissemination of such recommendations or of the information concerning such recommendations: (i) any person in a control relationship to Franklin Resources, (ii) any affiliated person of such controlling person, and (iii) any affiliated person of such affiliated person.
AFFILIATED PERSON - it meaning as Section 2(a)(3) of the Investment Company Act of 1940. An “affiliated person” of an investment company includes directors, officers, employees, and the investment adviser. In addition, it includes any person owning 5% of the company’s voting securities, any person in which the investment company owns 5% or more of the voting securities, and any person directly or indirectly controlling, controlled by, or under common control with the company.
APPROPRIATE ANALYST – With respect to any access person, any securities analyst or portfolio manager making investment recommendations or investing funds on behalf of an Associated Client and who may be reasonably expected to recommend or consider the purchase or sale of a security.
ASSOCIATED CLIENT – A Fund or client whose trading information would be available to the access person during the course of his or her regular functions or duties.
BENEFICIAL OWNERSHIP – Has the same meaning as in Rule 16a-1(a)(2) under the 1934 Act. Generally, a person has a beneficial ownership in a security if he or she, directly or indirectly, through any contract, arrangement, understanding, relationship or otherwise, has or shares a direct or indirect pecuniary interest in the security. There is a presumption of a pecuniary interest in a security held or acquired by a member of a person’s immediate family sharing the same household.
Page 20
EXCHANGE TRADED FUNDS AND HOLDING COMPANY DEPOSITORY RECEIPTS - An Exchange - Traded Fund or “ETF” is a basket of securities that is designed to generally track an index—broad stock or bond market, stock industry sector, or international stock. Holding Company Depository Receipts “Holdrs” are securities that represent an investor’s ownership in the common stock or American Depository Receipts of specified companies in a particular industry, sector or group.
FUNDS - Investment companies in the Franklin Templeton Group of Funds.
HELD OR TO BE ACQUIRED - A security is “held or to be acquired” if within the most recent 15 days it (i) is or has been held by a Fund, or (ii) is being or has been considered by a Fund or its investment adviser for purchase by the Fund.
PORTFOLIO PERSON - Any employee of Franklin Templeton Investments, who, in connection with his or her regular functions or duties, makes or participates in the decision to purchase or sell a security by a Fund in Franklin Templeton Investments, or any other client or if his or her functions relate to the making of any recommendations about those purchases or sales. Portfolio Persons include portfolio managers, research analysts, traders, persons serving in equivalent capacities (such as Management Trainees), persons supervising the activities of Portfolio Persons, and anyone else designated by the Director, Global Compliance
PROPRIETARY ACCOUNTS - Any corporate account or other account including, but not limited to, a limited partnership, a corporate hedge fund, a limited liability company or any other pooled investment vehicle in which Franklin Resources or its affiliates, owns 25 percent or more of the outstanding capital or is entitled to 25% or more of the profits or losses in the account (excluding any asset based investment management fees based on average periodic net assets in accounts).
SECURITY - Any stock, note, bond, evidence of indebtedness, participation or interest in any profit-sharing plan or limited or general partnership, investment contract, certificate of deposit for a security, fractional undivided interest in oil or gas or other mineral rights, any put, call, straddle, option, or privilege on any security (including a certificate of deposit), guarantee of, or warrant or right to subscribe for or purchase any of the foregoing, and in general any interest or instrument commonly known as a security, except commodity futures, currency and currency forwards. For the purpose of this Code, “security” does not include:
| | (1) | Direct obligations of the Government of the United States; |
| | (2) | Bankers’ acceptances, bank certificates of deposit, commercial paper and high quality short-term debt instruments, including repurchase agreements; and |
| | (3) | Shares issued by open-end funds. |
SEE Section III of Appendix A for a summary of different requirements for different types of securities.
| III. | SECURITIES EXEMPT FROM THE PROHIBITED, REPORTING, AND PRE-CLEARANCE PROVISIONS |
| | A. | PROHIBITED TRANSACTIONS |
Securities that are EXEMPT from the prohibited transaction provisions of Section 3.4 include:
| | (1) | securities that are direct obligations of the U.S. Government, such as Treasury bills, notes and bonds, and U.S. Savings Bonds and derivatives thereof; |
Page 21
| | (2) | high quality short-term instruments (“money market instruments”) including but not limited to (i) bankers’ acceptances, (ii) U.S. bank certificates of deposit; (iii) commercial paper; and (iv) repurchase agreements; |
| | (3) | shares of registered open-end investment companies; |
| | (4) | commodity futures, currencies, currency forwards and derivatives thereof; |
| | (5) | securities that are prohibited investments for all Funds and clients advised by the entity employing the access person; and |
| | (6) | transactions in securities issued or guaranteed by the governments or their agencies or instrumentalities of Canada, the United Kingdom, France, Germany, Switzerland, Italy and Japan and derivatives thereof. |
| | B. | REPORTING AND PRECLEARANCE |
Securities that are EXEMPT from both the reporting requirements of Section 5 and preclearance requirements of Section 6 of the Code include:
| | (1) | securities that are direct obligations of the U.S. Government, such as Treasury bills, notes and bonds, and U.S. Savings Bonds and derivatives thereof; |
| | (2) | high quality short-term instruments (“money market instruments”) including but not limited to (i) bankers’ acceptances, (ii) U.S. bank certificates of deposit; (iii) commercial paper; and (iv) repurchase agreements; |
| | (3) | shares of registered open-end investment companies; and |
| | (4) | commodity futures, currencies, currency forwards and derivatives thereof. |
Rule 17j-1 under the Investment Company Act of 1940 (“1940 Act”) makes it unlawful for any affiliated person of Franklin Templeton Investments in connection with the purchase or sale of a security, including any option to purchase or sell, and any security convertible into or exchangeable for, any security that is “held or to be acquired” by a Fund in Franklin Templeton Investments:
| | A. | To employ any device, scheme or artifice to defraud a Fund; |
| | B. | To make to a Fund any untrue statement of a material fact or omit to state to a Fund a material fact necessary in order to make the statements made, in light of the circumstances under which they are made, not misleading; |
| | C. | To engage in any act, practice, or course of business which operates or would operate as a fraud or deceit upon a Fund; or |
| | D. | To engage in any manipulative practice with respect to a Fund. |
A security is “held or to be acquired” if within the most recent 15 days it (i) is or has been held by a Fund, or (ii) is being or has been considered by a Fund or its investment adviser for purchase by the Fund.
Page 22
APPENDIX B: ACKNOWLEGMENT FORM AND SCHEDULES
ACKNOWLEDGMENT FORM
CODE OF ETHICS AND POLICY STATEMENT ON INSIDER TRADING
TO: DIRECTOR OF GLOBAL COMPLIANCE, LEGAL COMPLIANCE DEPARTMENT
I HEREBY ACKNOWLEDGE RECEIPT OF A COPY OF FRANKLIN TEMPLETON INVESTMENTS CODE OF ETHICS AND POLICY STATEMENT ON INSIDER TRADING, Amended and Restated, May 2003, WHICH I HAVE READ AND UNDERSTAND. I WILL COMPLY FULLY WITH ALL PROVISIONS OF THE CODE AND THE INSIDER TRADING POLICY TO THE EXTENT THEY APPLY TO ME DURING THE PERIOD OF MY EMPLOYMENT. ADDITIONALLY, I AUTHORIZE ANY BROKER-DEALER, BANK OR INVESTMENT ADVISER WITH WHOM I HAVE SECURITIES ACCOUNTS AND ACCOUNTS IN WHICH I HAVE BENEFICIAL OWNERSHIP, TO PROVIDE BROKERAGE CONFIRMATIONS AND STATEMENTS AS REQUIRED FOR COMPLIANCE WITH THE CODE. I FURTHER UNDERSTAND AND ACKNOWLEDGE THAT ANY VIOLATION OF THE CODE OR INSIDER TRADING POLICY, INCLUDING ENGAGING IN A PROHIBITED TRANSACTION OR FAILURE TO FILE REPORTS AS REQUIRED (SEE SCHEDULES B, C, D, E, F AND G), MAY SUBJECT ME TO DISCIPLINARY ACTION, INCLUDING TERMINATION OF EMPLOYMENT.
Instructions:
| | 1. | Complete all sections of this form. |
| | 2. | Print the completed form, sign, and date. |
| | 3. | Submit completed form to Legal Compliance via: |
Inter-office Mail to: Preclearance
L-Comp SM-920/2
U.S. Mail to: Franklin Templeton Investments
Attn: Legal-Compliance/Preclearance
P.O. Box 25050
San Mateo, CA 94402-5050
Telephone: (650) 312-3693 Fax: (650) 312-5646
E-mail: Preclear, Legal (internal address);
Lpreclear@frk.com (external address)
| | |
|
| EMPLOYEE’S NAME: | | SIGNATURE |
| | | |
|
| TITLE: | | |
| | | |
|
| DEPARTMENT: | | |
| | | |
|
| LOCATION: | | |
| | | |
|
INITIAL DISCLOSURE DATE OR YEAR END: | | |
| | | |
|
Page 23
SCHEDULE A: LEGAL AND COMPLIANCE OFFICERS AND PRECLEARANCE DESK TELEPHONE & FAX NUMBERS18
LEGAL OFFICER
MURRAY L. SIMPSON
EXECUTIVE VICE PRESIDENT & GENERAL COUNSEL
FRANKLIN TEMPLETON INVESTMENTS
ONE FRANKLIN PARKWAY
SAN MATEO, CA 94403-1906
(650) 525 -7331
COMPLIANCE OFFICERS
| | |
| DIRECTOR, GLOBAL COMPLIANCE | | PRECLEARANCE OFFICERS |
| |
| James M. Davis | | Stephanie Harwood, Supervisor |
| Franklin Templeton Investments | | Lisa Del Carlo |
| One Franklin Parkway | | Darlene Nisby |
| San Mateo, CA 94403-1906 | | Legal Compliance Department |
| (650) 312-2832 | | Franklin Templeton Investments |
| | | One Franklin Parkway |
| | | San Mateo, CA 94403-1906 |
| | | (650) 312-3693 (telephone) |
| | | (650) 312-5646 (facsimile) |
| | | Preclear, Legal (internal e-mail address) |
| | | Lpreclear@frk.com (external e-mail address) |
SCHEDULE B - TRANSACTIONS REPORT
This report of personal securities transactions not reported by duplicate confirmations and brokerage statements pursuant to Section 5.3 of the Code is required pursuant to Rule 204-2(a) of the Investment Advisers Act of 1940 or Rule 17j-1(c) of the Investment Company Act of 1940. The report must be completed and submitted to the Compliance Department no later than 10 calendar days after the end of the calendar quarter. Refer to Section 5.3 of the Code of Ethics for further instructions.
Instructions:
| | 1. | Complete all sections of this form. |
| | 2. | Print completed form, sign, and date. |
| | 3. | Submit completed form to Legal Compliance via: |
Inter-office Mail to: Preclearance
L-Comp SM-920/2
U.S. Mail to: Franklin Templeton Investments
Attn: Legal-Compliance/Preclearance
P.O. Box 25050
San Mateo, CA 94402-5050
Telephone: (650) 312-3693 Fax: (650) 312-5646
E-mail: Preclear, Legal (internal address); Lpreclear@frk.com
(external address)
Page 24
| | | | | | | | | | |
PRE-CLEARED THROUGH
COMPLIANCE TRADE
BUY, SELL DEPARTMENT
DATE OR OTHER (DATE
OR N/A)
| | SECURITY NAME
DESCRIPTION AND
TYPE OF SECURITY
(COMMON, BOND,
OPTION, ETC.)
| | QUANTITY
| | PRICE
| | PRINCIPAL AMOUNT
| | BROKER-DEALER OR
BANK AND
ACCOUNT NUMBER
|
| | | | | | | | | | | |
| | | | | | | | | | | |
| | | | | | | | | | | |
| | | | | | | | | | | |
| | | | | | | | | | | |
| | | | | | | | | | | |
| | | | | | | | | | | |
| | | | | | | | | | | |
THE REPORT OR RECORDING OF ANY TRANSACTIONS ABOVE SHALL NOT BE CONSTRUED AS AN ADMISSION THAT I HAVE ANY DIRECT OR INDIRECT OWNERSHIP IN THE SECURITIES.
| | |
|
| EMPLOYEE’S NAME: | | |
| | | |
|
| QUARTER ENDING: | | |
| | | |
|
SCHEDULE C - INITIAL, ANNUAL, & UPDATED DISCLOSURE OF ACCESS PERSONS SECURITIES HOLDINGS
This report shall set forth the security name or description and security class of each security holding in which you have a direct or indirect beneficial interest, including holdings by a spouse, minor children, trusts, foundations, and any account for which trading authority has been delegated to you, other than authority to trade for a Fund in or a client of Franklin Templeton Investments. In lieu of listing each security position below, you may instead attach copies of brokerage statements, sign below and return Schedule C and brokerage statements to the Legal Compliance Department within 10 days if an initial report or by January 30th of each year if an annual report. Refer to Sections 5.2.A and 5.4.A of the Code for additional filing instructions.
Page 25
Instructions:
| | 1. | Complete all sections of this form. |
| | 2. | Print completed form, sign, and date. |
| | 3. | Submit completed form to Legal Compliance via: |
Inter-office Mail to: Preclearance
L-Comp SM-920/2
U.S. Mail to: Franklin Templeton Investments
Attn: Legal-Compliance/Preclearance
P.O. Box 25050
San Mateo, CA 94402-5050
Telephone: (650) 312-3693 Fax: (650) 312-5646
E-mail: Preclear, Legal (internal address); Lpreclear@frk.com
(external address)
Securities that are EXEMPT from being reported on Schedule C include: (i) securities that are direct obligations of the U.S. Government, such as Treasury bills, notes and bonds, and U.S. Savings Bonds and derivatives thereof; (ii) high quality short-term instruments (“money market instruments”) including but not limited to bankers’ acceptances, U.S. bank certificates of deposit; commercial paper; and repurchase agreements; (iii) shares of registered open-end investment companies; and (iv) commodity futures, currencies, currency forwards and derivatives thereof.
| ¨ | I DID NOT HAVE ANY PERSONAL SECURITIES HOLDINGS FOR YEAR ENDED: (OR CURRENT DATE IF INITIAL DISCLOSURE) |
| ¨ | I HAVE ATTACHED STATEMENTS CONTAINING ALL MY PERSONAL SECURITIES HOLDINGS FOR YEAR ENDED: (OR CURRENT DATE IF INITIAL DISCLOSURE) |
| ¨ | I HAVE LISTED BELOW ALL MY PERSONAL SECURITIES HOLDINGS FOR YEAR ENDED: (OR CURRENT DATE IF INITIAL DISCLOSURE) |
| | | | | | |
Security Description,
including interest rate and
Account
maturity (if appropriate)
Number
| | Security Type
(Stock, Bond,
Option, etc.)
| | Quantity &
Principal
Amount
| | Name of Broker-
Dealer or Bank
|
TO THE BEST OF MY KNOWLEDGE I HAVE DISCLOSED ALL OF MY SECURITIES ACCOUNTS AND/OR INVESTMENTS IN WHICH I HAVE A DIRECT OR INDIRECT BENEFICIAL INTEREST, INCLUDING SECURITY ACCOUNTS OF A SPOUSE, MINOR CHILDREN, TRUSTS, FOUNDATIONS, AND ANY ACCOUNT FOR WHICH TRADING AUTHORITY HAS BEEN DELEGATED AN UNAFFILIATED PARTY.
| | | | | | |
|
| EMPLOYEE’S NAME: | | Print: | | Signature: | | Date: |
YEAR ENDED OR CURRENT
DATE IF INITIAL
DISCLOSURE:
Page 26
SCHEDULE D – NOTIFICATION OF SECURITIES ACCOUNT
All Franklin registered representatives and Access Persons, PRIOR TO OPENING A BROKERAGE ACCOUNT OR PLACING AN INITIAL ORDER, are required to notify the Legal Compliance Preclearance Department and the executing broker-dealer in writing. This includes accounts in which the registered representative or access person has or will have a financial interest in (e.g., a spouse’s account) or discretionary authority (e.g., a trust account for a minor child).
UPON RECEIPT OF THE NOTIFICATION OF SECURITIES ACCOUNT FORM, THE LEGAL COMPLIANCE PRECLEARANCE DEPARTMENT WILL CONTACT THE BROKER-DEALER IDENTIFIED BELOW AND REQUEST THAT DUPLICATE CONFIRMATIONS AND STATEMENTS OF YOUR BROKERAGE ACCOUNT ARE SENT TO FRANKLIN TEMPLETON INVESTMENTS.
Instructions:
| | 1. | Complete all sections of this form. |
| | 2. | Print the completed form, sign, and date. |
| | 3. | Submit completed form to Legal Compliance via: |
Inter-office Mail to: Preclearance
L-Comp SM-920/2
U.S. Mail to: Franklin Templeton Investments
Attn: Legal-Compliance/Preclearance
P.O. Box 25050
San Mateo, CA 94402-5050
Telephone: (650) 312-3693 Fax: (650) 312-5646
E-mail: Preclear, Legal (internal address); Lpreclear@frk.com
(external address)
| | |
|
| EMPLOYEE INFORMATION: | | |
| | | |
|
| EMPLOYEE’S NAME: | | |
| | | |
|
| EXTENSION: | | |
| | | |
|
| DEPARTMENT: | | |
| | | |
|
| INTEROFFICE MAIL CODE: | | |
| | | |
| | | | | | |
|
ARE YOU A REGISTERED REPRESENTATIVE? (NASD LICENSED, I.E. SERIES 6, 7) | | ¨ Yes | | ¨ No |
|
| ARE YOU AN ACCESS PERSON? | | ¨ Yes | | ¨ No |
| | |
|
| ACCOUNT INFORMATION: | | |
| | | |
|
ACCOUNT NAME: (IF OTHER THAN EMPLOYEE, STATE RELATIONSHIP I.E., SPOUSE) | | |
|
| ACCOUNT# OR SOCIAL SECURITY #: | | |
| | | |
|
| FIRM NAME: | | |
| | | |
|
| ATTENTION (OPTIONAL): | | |
| | | |
|
| FIRM ADDRESS: | | |
| | | |
|
| CITY/STATE/ZIP CODE: | | |
| | | |
Page 27
SCHEDULE E – NOTIFICATION OF DIRECT OR INDIRECT BENEFICIAL INTEREST
If you have any beneficial ownership in a security and you recommend to the Appropriate Analyst that the security be considered for purchase or sale by an Associated Client, or if you carry out a purchase or sale of that security for an Associated Client, you must disclose your beneficial ownership to the Legal-Compliance Department and the Appropriate Analyst in writing on Schedule E (or an equivalent form containing similar information) before the purchase or sale, or before or simultaneously with the recommendation.
Instructions:
| | 1. | Complete all sections of this form. |
| | 2. | Print completed form, sign, and date. |
| | 3. | Submit completed form to Legal Compliance via: |
Inter-office Mail to: Preclearance
L-Comp SM-920/2
U.S. Mail to: Franklin Templeton Investments
Attn: Legal-Compliance/Preclearance
P.O. Box 25050
San Mateo, CA 94402-5050
Telephone: (650) 312-3693 Fax: (650) 312-5646
E-mail: Preclear, Legal (internal address); Lpreclear@frk.com
(external address)
| | | | | | | | | | | | |
OF DATE OF
SECURITY PERSON
DESCRIPTION
NOTIFIED
| | OWNERSHIP
TYPE: (DIRECT OR
VERBAL
INDIRECT
NOTIFICATION)
| | YEAR
ACQUIRED
| | METHOD OF
ACQUISITION
(PURCHASE
/GIFT/OTHER)
| | DATE AND
METHOD
LEARNED
THAT SECURITY’S
UNDER
CONSIDERATION
BY FUNDS
| | PRIMARY
MANAGER OR
PORTFOLIO
ANALYST
| | NAME
|
| | | | |
EMPLOYEE’S NAME: |
| | | | | |
| | | |
|
| SIGNATURE | | | | DATE |
Page 28
SCHEDULE F – INITIAL, ANNUAL, & UPDATED DISCLOSURE OF SECURITIES ACCOUNTS
This report shall set forth the name and description of each securities account in which you have a direct or indirect beneficial interest, including securities accounts of a spouse, minor children, trusts, foundations, and any account for which trading authority has been delegated to you, other than authority to trade for a Fund in or a client of the Franklin Templeton Group. In lieu of listing each securities account below, you may instead attach copies of the brokerage statements, sign below and return Schedule F and brokerage statements to the Compliance Department.
Instructions:
| | 1. | Complete all sections of this form. |
| | 2. | Print completed form, sign, and date. |
| | 3. | Submit completed form to Legal Compliance via: |
Inter-office Mail to: Preclearance
L-Comp SM-920/2
U.S. Mail to: Franklin Templeton Investments
Attn: Legal-Compliance/Preclearance
P.O. Box 25050
San Mateo, CA 94402-5050
Telephone: (650) 312-3693 Fax: (650) 312-5646
E-mail: Preclear, Legal (internal address); Lpreclear@frk.com
(external address)
| | | | | | |
ACCOUNT NAME(S) (REGISTRATION
SHOWN ACCOUNT ON
STATEMENT) NUMBER
| | NAME OF
BROKERAGE FIRM,
BANK OR
INVESTMENT
ADVISER
| | ADDRESS OF BROKERAGE
FIRM, BANK OR
INVESTMENT
ADVISER (STREET/CITY
/STATE/ZIP CODE)
| | NAME OF
ACCOUNT
EXECUTIVE/
REPRESENTATIVE
|
Page 29
TO THE BEST OF MY KNOWLEDGE I HAVE DISCLOSED ALL OF MY SECURITIES ACCOUNTS IN WHICH I HAVE A DIRECT OR INDIRECT BENEFICIAL INTEREST, INCLUDING SECURITY ACCOUNTS OF A SPOUSE, MINOR CHILDREN, TRUSTS, FOUNDATIONS, AND ANY ACCOUNT FOR WHICH TRADING AUTHORITY HAS BEEN DELEGATED TO ME.
| | | | |
|
| EMPLOYEE’S NAME: | | | | |
| |
|
YEAR ENDED OR CURRENT DATE IF INITIAL DISCLOSURE: | | | | |
| |
|
| | |
| | | | | |
| | | |
|
| SIGNATURE | | | | DATE |
SCHEDULE G - INITIAL AND ANNUAL CERTIFICATION OF DISCRETIONARY AUTHORITY
This report shall set forth the account name or description in which you have a direct or indirect beneficial interest, including holdings by a spouse, minor children, trusts, foundations, and as to which trading authority has been delegated by you to an unaffiliated registered broker-dealer, registered investment adviser, or other investment manager acting in a similar fiduciary capacity, who exercises sole investment discretion.
Instructions:
| | 1. | Complete all sections of this form. |
| | 2. | Print completed form, sign, and date. |
| | 3. | Submit completed form to Legal Compliance via: |
Inter-office Mail to: Preclearance
L-Comp SM-920/2
U.S. Mail to: Franklin Templeton Investments
Attn: Legal-Compliance/Preclearance
P.O. Box 25050
San Mateo, CA 94402-5050
Telephone: (650) 312-3693 Fax: (650) 312-5646
E-mail: Preclear, Legal (internal address); Lpreclear@frk.com
(external address)
| | | | | | |
NAME(S) SHOWN ON ACCOUNT OR INVESTMENT
| | NAME DESCRIPTION OF BROKERAGE FIRM, BANK,
INVESTMENT ADVISER OR INVESTMENT
| | TYPE OF OWNERSHIP: DIRECT OWNERSHIP (DO) INDIRECT OWNERSHIP (IO)
| | ACCOUNT NUMBER (IF APPLICABLE)
|
Page 30
TO THE BEST OF MY KNOWLEDGE I HAVE DISCLOSED ALL OF MY SECURITIES ACCOUNTS AND/OR INVESTMENTS IN WHICH I HAVE A DIRECT OR INDIRECT BENEFICIAL INTEREST, INCLUDING SECURITY ACCOUNTS OF A SPOUSE, MINOR CHILDREN, TRUSTS, FOUNDATIONS, AND ANY ACCOUNT FOR WHICH TRADING AUTHORITY HAS BEEN DELEGATED AN UNAFFILIATED PARTY. FURTHER, I CERTIFY THAT I DO NOT HAVE ANY DIRECT OR INDIRECT INFLUENCE OR CONTROL OVER THE ACCOUNTS LISTED ABOVE.
| | | | |
| | | | | |
|
| EMPLOYEE’S NAME: | | | | |
| |
|
| YEAR ENDED: | | | | |
| |
|
| | |
| | | | | |
| | | |
|
| SIGNATURE | | | | DATE |
SCHEDULE H: CHECKLIST FOR INVESTMENTS IN PARTNERSHIPS AND SECURITIES ISSUED IN PRIVATE PLACEMENTS MADE BY PORTFOLIO PERSONS
In considering requests by portfolio personnel for approval of limited partnerships and other private placement securities transactions, the Compliance officer shall consult with an executive officer of Franklin Resources, Inc. In deciding whether to approve the transaction, the Compliance officer and the executive officer shall take into account, among other factors, whether the is being offered to the access person by virtue of his or her position with Franklin Templeton Investments. IF THE ACCESS PERSON RECEIVES CLEARANCE FOR THE TRANSACTION, NO INVESTMENT IN THE SAME ISSUER MAY BE MADE FOR A FUND OR CLIENT UNLESS AN EXECUTIVE OFFICER OF FRANKLIN RESOURCES, INC., WITH NO INTEREST IN THE ISSUER, APPROVES THE TRANSACTION.
Instructions:
| | 1. | Complete all sections of this form. |
| | 2. | Print the completed form, sign, and date. |
| | 3. | Submit completed form to Legal Compliance via: |
Inter-office Mail to: Preclearance
L-Comp SM-920/2
U.S. Mail to: Franklin Templeton Investments
Attn: Legal-Compliance/Preclearance
P.O. Box 25050
San Mateo, CA 94402-5050
Telephone: (650) 312-3693 Fax: (650) 312-5646
E-mail: Preclear, Legal (internal address); Lpreclear@frk.com
(external address)
IN ORDER TO EXPEDITE YOUR REQUEST, PLEASE PROVIDE THE FOLLOWING INFORMATION:
| | | | |
|
| NAME/DESCRIPTION OF PROPOSED INVESTMENT: | | | | |
| |
|
| PROPOSED INVESTMENT AMOUNT: | | | | |
| |
|
Page 31
| 1) | PLEASE ATTACH PAGES OF THE OFFERING MEMORANDUM (OR OTHER DOCUMENTS) SUMMARIZING THE INVESTMENT OPPORTUNITY, INCLUDING: |
| | i) | Name of the partnership/hedge fund/issuer; |
| | ii) | Name of the general partner, location & telephone number; |
| | iii) | Summary of the offering; including the total amount the offering/issuer; |
| | iv) | Percentage your investment will represent of the total offering; |
| | v) | Plan of distribution; and |
| | vi) | Investment objective and strategy, |
| 2) | PLEASE RESPOND TO THE FOLLOWING QUESTIONS: |
| | a) | Was this investment opportunity presented to you in your capacity as a portfolio manager? If no, please explain the relationship, if any, you have to the issuer or principals of the issuer. |
| | b) | Is this investment opportunity suitable for any fund/client that you advise?/19/ If yes, why isn’t the investment being made on behalf of the fund/client? If no, why isn’t the investment opportunity suitable for the fund/clients? |
| | c) | Do any of the fund/clients that you advise presently hold securities of the issuer of this proposed investment (e.g., common stock, preferred stock, corporate debt, loan participations, partnership interests, etc.)? If yes, please provide the names of the funds/clients and security description. |
| | d) | Do you presently have or will you have any managerial role with the company/issuer as a result of your investment? If yes, please explain in detail your responsibilities, including any compensation you will receive. |
| | e) | Will you have any investment control or input to the investment decision making process? |
| | f) | Will you receive reports of portfolio holdings? If yes, when and how frequently will these be provided? |
| 3) | REMINDER: PERSONAL SECURITIES TRANSACTIONS THAT DO NOT GENERATE BROKERAGE CONFIRMATIONS (E.G., INVESTMENTS PRIVATE PLACEMENTS) MUST BE REPORTED TO THE LEGAL-COMPLIANCE DEPARTMENT ON THE SCHEDULE B FORM WITHIN 10 CALENDAR DAYS AFTER YOU ARE NOTIFIED. |
| | | | |
| | | | | |
PORTFOLIO PERSON’S NAME | |
SIGNATURE | |
DATE |
| | |
| APPROVED BY: | | | | |
CHIEF INVESTMENT OFFICER’S NAME | |
SIGNATURE | |
DATE |
| | | | | |
|
| LEGAL COMPLIANCE USE ONLY |
|
| | | | | | |
| DATE RECEVIED : | | | | DATE ENTERED IN LOTUS NOTES: | | |
Page 32
DATE FORWARDED TO FRI OFFICER:
| | | | |
| APPROVED BY: | | | | |
| | |
| | | | | |
| | | |
|
| JAMES M. DAVIS, DIRECTOR, GLOBAL COMPLIANCE | | | | DATE |
| | |
| | | | | |
| | | |
|
| MURRAY L. SIMPSON, EVP-GENERAL COUNSEL | | | | DATE |
| | | | |
DATE ENTERED IN EXAMINER: | | PRECLEAED: | | ¨ ¨ |
| | | | | YES NO
(ATTACH E-MAIL) |
APPENDIX C: INVESTMENT ADVISOR AND BROKER-DEALER AND OTHER
SUBSIDIARIES OF FRANKLIN RESOURCES, INC. - MAY 2003
| | | | |
Franklin Advisers, Inc. FIA | | IA | | Closed Joint-Stock Company Templeton (Russia) |
| | |
Franklin Advisory Services, LLC FBD | | IA | | Templeton Unit Trust Management Ltd. (UK) |
| | |
Franklin Investment Advisory FIA Services, Inc. | | IA | | Orion Fund Management Ltd. |
| | |
Franklin Private Client Group, Inc. IA | | IA | | Templeton Global Advisors Ltd. (Bahamas) |
| | |
| | | | | |
| | |
Franklin Mutual Advisers, LLC FIA/FBD | | IA | | Templeton Asset Management (India) Pvt. Ltd. |
| | |
Franklin Properties, Inc. FBD | | REA | | Templeton Italia SIM S.P.A. (Italy) |
| | |
Franklin/Templeton Distributors, FBD Inc. | | BD | | Franklin Templeton Investment Services Gmbh (Germany) |
| | |
Templeton (Switzerland), Ltd. Trust Co | | FBD | | Fiduciary Trust International of the South |
| | |
Franklin Templeton International BM Services S.A. (Luxembourg) | | FBD | | Franklin Templeton Services, LLC |
Page 33
| | | | |
| | |
Franklin Templeton Investments IA/FIA Australia Limited | | FIA | | Franklin Templeton Investments Corp. (Ontario) |
| | |
Franklin/Templeton Investor IA Services, LLC | | TA | | Templeton Global Advisors Limited (Bahamas) |
| | |
Franklin Templeton Alternative IA/FIA Strategies, LLC | | IA | | Templeton Asset Management Ltd. (Singapore) |
| | |
FTI Institutional, LLC Trust Co. | | IA | | Fiduciary Trust Company International |
| | |
Franklin Templeton Asset IA Strategies LLC | | IA | | Fiduciary International, Inc |
| | |
Fiduciary Financial Services, Corp. IA | | BD | | Fiduciary Investment Management International Inc. |
| | |
Franklin Templeton Asset FIA Management S.A. (France) | | FIA | | Fiduciary Trust International Australia Limited |
| | |
Franklin Templeton Investments FIA (Asia) Limited (Hong Kong) | | FBD/IA | | Fiduciary Trust International Asia Limited (Hong Kong) |
| | |
Franklin Templeton Investment IA/FIA Management Limited (UK) | | IA/FIA | | Fiduciary Trust International Limited (UK) |
| | |
Franklin Templeton Investments FIA Corp. (Canada) | | IA/FIA | | Fiduciary Trust International Investment Management, Inc. (Japan) |
| | |
Templeton/Franklin Investment Services, Inc | | IA/BD | | |
| | |
Templeton Investment Counsel, LLC | | IA | | |
| | |
Templeton Asset Management, Ltd. | | IA/FIA | | |
| | |
Franklin Templeton Investments Japan Ltd. | | FIA | | |
| | | | |
Codes: | | IA: | | US registered investment adviser |
| | | BD: | | US registered broker-dealer |
| | | FIA: | | Foreign equivalent investment adviser |
| | | FBD: | | Foreign equivalent broker-dealer |
| | | TA: | | US registered transfer agent |
| | | BM: | | Business manager to the funds |
| | | REA: | | Real estate adviser |
| | | Trust: | | Trust company |
Page 34
POLICY STATEMENT ON INSIDER TRADING
Pursuant to the Insider Trading and Securities Fraud Enforcement Act of 1988, it is the policy of Franklin Templeton Investments to forbid any officer, director, employee, consultant acting in a similar capacity, or other person associated with Franklin Templeton Investments from trading, either personally or on behalf of clients, including all client assets managed by the entities in Franklin Templeton Investments, on material non-public information or communicating material non-public information to others in violation of the law. This conduct is frequently referred to as “insider trading.” Franklin Templeton Investment’s Policy Statement on Insider Trading applies to every officer, director, employee or other person associated with Franklin Templeton Investments and extends to activities within and outside their duties with Franklin Templeton Investments. Every officer, director and employee must read and retain this policy statement. Any questions regarding Franklin Templeton Investments Policy Statement on Insider Trading or the Compliance Procedures should be referred to the Legal Department.
The term “insider trading” is not defined in the federal securities laws, but generally is used to refer to the use of material non-public information to trade in securities (whether or not one is an “insider”) or to communications of material non-public information to others.
While the law concerning insider trading is not static, it is generally understood that the law prohibits:
| | (1) | trading by an insider, while in possession of material non-public information; or |
| | (2) | trading by a non-insider, while in possession of material non-public information, where the information either was disclosed to the non-insider in violation of an insider’s duty to keep it confidential or was misappropriated; or |
| | (3) | communicating material non-public information to others. |
The elements of insider trading and the penalties for such unlawful conduct are discussed below. If, after reviewing this policy statement, you have any questions, you should consult the Legal Department.
The concept of “insider” is broad. It includes officers, directors and employees of a company. In addition, a person can be a “temporary insider” if he or she enters into a special confidential relationship in the conduct of a company’s affairs and as a result is given access to information solely for the company’s purposes. A temporary insider can include, among others, a company’s outside attorneys, accountants, consultants, bank lending officers, and the employees of such organizations. In addition, an investment adviser may become a temporary insider of a company it advises or for which it performs other services. According to the U.S. Supreme Court, the company must expect the outsider to keep the disclosed non-public information confidential and the relationship must at least imply such a duty before the outsider will be considered an insider.
Page 35
| | C. | WHAT IS MATERIAL INFORMATION? |
Trading on inside information is not a basis for liability unless the information is material. “Material information” generally is defined as information for which there is a substantial likelihood that a reasonable investor would consider it important in making his or her investment decisions, or information that is reasonably certain to have a substantial effect on the price of the company’s securities. Information that officers, directors and employees should consider material includes, but is not limited to: dividend changes, earnings estimates, changes in previously released earnings estimates, significant merger or acquisition proposals or agreements, major litigation, liquidation problems, and extraordinary management developments.
Material information does not have to relate to a company’s business. For example, in CARPENTER V. U.S., 108 U.S. 316 (1987), the Supreme Court considered as material certain information about the contents of a forthcoming newspaper column that was expected to affect the market price of a security. In that case, a WALL STREET JOURNAL reporter was found criminally liable for disclosing to others the dates that reports on various companies would appear in the WALL STREET JOURNAL and whether those reports would be favorable or not.
| | D. | WHAT IS NON-PUBLIC INFORMATION? |
Information is non-public until it has been effectively communicated to the marketplace. One must be able to point to some fact to show that the information is generally public. For example, information found in a report filed with the Securities and Exchange Commission (“SEC”), or appearing in Dow Jones, Reuters Economic Services, THE WALL STREET JOURNAL or other publications of general circulation would be considered public.
In 1980, the Supreme Court found that there is no general duty to disclose before trading on material non-public information, but that such a duty arises only where there is a fiduciary relationship. That is, there must be a relationship between the parties to the transaction such that one party has a right to expect that the other party will not disclose any material non-public information or refrain from trading. CHIARELLA V. U.S., 445 U.S. 22 (1980).
In DIRKS V. SEC, 463 U.S. 646 (1983), the Supreme Court stated alternate theories under which non-insiders can acquire the fiduciary duties of insiders. They can enter into a confidential relationship with the company through which they gain information (E.G., attorneys, accountants), or they can acquire a fiduciary duty to the company’s shareholders as “tippees” if they are aware or should have been aware that they have been given confidential information by an insider who has violated his fiduciary duty to the company’s shareholders.
However, in the “tippee” situation, a breach of duty occurs only if the insider personally benefits, directly or indirectly, from the disclosure. The benefit does not have to be pecuniary but can be a gift, a reputational benefit that will translate into future earnings, or even evidence of a relationship that suggests a quid pro quo.
| | 2. | MISAPPROPRIATION THEORY |
Another basis for insider trading liability is the “misappropriation” theory, under which liability is established when trading occurs on material non-public information that was stolen or misappropriated from any other person. In U.S. V. CARPENTER, SUPRA, the Court found, in 1987, a columnist defrauded THE WALL STREET JOURNAL when he stole information from the WALL STREET JOURNAL and used it for trading in the securities markets. It should be noted that the misappropriation theory can be used to reach a variety of individuals not previously thought to be encompassed under the fiduciary duty theory.
Page 36
| | F. | PENALTIES FOR INSIDER TRADING |
Penalties for trading on or communicating material non-public information are severe, both for individuals involved in such unlawful conduct and their employers. A person can be subject to some or all of the penalties below even if he or she does not personally benefit from the violation. Penalties include:
| | • | disgorgement of profits; |
| | • | fines for the person who committed the violation of up to three times the profit gained or loss avoided, whether or not the person actually benefited; and |
| | • | fines for the employer or other controlling person of up to the greater of $1,000,000 or three times the amount of the profit gained or loss avoided. |
In addition, any violation of this policy statement can result in serious sanctions by the Franklin Templeton Group, including dismissal of any person involved.
| | G. | INSIDER TRADING PROCEDURES |
Each access person, Compliance Officer, the Risk Management Department, and the Legal Department, as the case may be, shall comply with the following procedures.
| | 1. | IDENTIFYING INSIDE INFORMATION |
Before trading for yourself or others, including investment companies or private accounts managed by the Franklin Templeton Group, in the securities of a company about which you may have potential inside information, ask yourself the following questions:
| | • | Is the information material? |
| | • | Is this information that an investor would consider important in making his or her investment decisions? |
| | • | Is this information that would substantially affect the market price of the securities if generally disclosed? |
| | • | Is the information non-public? |
| | • | To whom has this information been provided? |
| | • | Has the information been effectively communicated to the marketplace (e.g., published in REUTERS, THE WALL STREET JOURNAL or other publications of general circulation)? |
If, after consideration of these questions, you believe that the information may be material and non-public, or if you have questions as to whether the information is material and non-public, you should take the following steps:
| | (i) | Report the matter immediately to the designated Compliance Officer, or if he or she is not available, to the Legal Department. |
| | (ii) | Do not purchase or sell the securities on behalf of yourself or others, including investment companies or private accounts managed by Franklin Templeton Investments. |
Page 37
| | (iii) | Do not communicate the information inside or outside Franklin Templeton Investments , other than to the Compliance Officer or the Legal Department. |
| | (iv) | The Compliance Officer shall immediately contact the Legal Department for advice concerning any possible material, non-public information. |
| | (v) | After the Legal Department has reviewed the issue and consulted with the Compliance Officer, you will be instructed either to continue the prohibitions against trading and communication noted in (ii) and (iii), or you will be allowed to trade and communicate the information. |
| | (vi) | In the event the information in your possession is determined by the Legal Department or the Compliance Officer to be material and non-public, it may not be communicated to anyone, including persons within Franklin Templeton Investments, except as provided in (i) above. In addition, care should be taken so that the information is secure. For example, files containing the information should be sealed and access to computer files containing material non-public information should be restricted to the extent practicable. |
| | 2. | RESTRICTING ACCESS TO OTHER SENSITIVE INFORMATION |
All Franklin Templeton Investments personnel also are reminded of the need to be careful to protect from disclosure other types of sensitive information that they may obtain or have access to as a result of their employment or association with Franklin Templeton Investments.
| | (I) | GENERAL ACCESS CONTROL PROCEDURES |
Franklin Templeton Investments has established a process by which access to company files that may contain sensitive or non-public information such as the Bargain List and the Source of Funds List is carefully limited. Since most of the Franklin Templeton Group files, which contain sensitive information, are stored in computers, personal identification numbers, passwords and/or code access numbers are distributed to Franklin Templeton Investments computer access persons only. This activity is monitored on an ongoing basis. In addition, access to certain areas likely to contain sensitive information is normally restricted by access codes.
Regulation FD under the Securities Exchange Act of 1934, as amended (the “1934 Act”), prohibits certain persons associated with Franklin Resources, Inc., its affiliates, subsidiaries (collectively, “FTI”) and closed-end fund advised by an investment advisory subsidiary of Resources (“FTI Closed-End Funds”) and persons associated with the FTI investment adviser to the FTI Closed-End Funds, from selectively disclosing material nonpublic information about Resources and the FTI Closed-End Funds to certain securities market professionals and shareholders. Regulation FD is designed to promote the full and fair disclosure of information by issuers such as Resources and the FTI Closed-End Funds.
The scope of Regulation FD is limited. Regulation FD applies to Resources and FTI Closed-End Funds, but does not apply to open-end investment companies managed by the FTI investment advisers. The rule also does not apply to all communications about the Resources or FTI Closed-End Funds with outside persons. Rather, Regulation FD applies only to communications to securities market professionals and to any shareholder of the Resources or FTI Closed-End Funds under circumstances in which it is reasonably foreseeable that such shareholder
Page 38
will trade on the basis of the information. In addition, Regulation FD does not apply to all employees and officers. It only applies to certain senior officials of Resources and the FTI Closed-End Funds and those persons who regularly communicate with securities market professionals or with shareholders. Consequently, Regulation FD and the Franklin Templeton Investments Fair Disclosure Policies and Procedures (the “Policies and Procedures”) will not apply to a variety of legitimate, ordinary-course business communications or to disclosures made to the media. Irrespective of Regulation FD, all Franklin personnel must comply with the “Franklin Templeton Investment Policy Statement on Insider Trading” and should be aware that disclosure of material nonpublic information to another person may constitute a form of illegal insider trading called “tipping.”
| B. | FTI’S CORPORATE POLICY FOR REGULATION FD |
Franklin Templeton Investments is committed to complying with Regulation FD by making fair disclosure of information about Resources or FTI Closed-End Funds without advantage to any particular securities market professional, shareholder or investor. It is not the intention of these Policies and Procedures, however, to interfere with legitimate, ordinary-course business communications or disclosures made to the media or governmental agencies. FTI believes it is in its best interest to maintain an active and open dialogue with securities market professionals, shareholders and investors regarding Resources and the FTI Closed-End Funds. FTI will continue to provide current and potential shareholders access to key information reasonably required for making an informed decision on whether to invest in shares of Resources or FTI Closed-End Funds. FTI personnel will make appropriate announcements and conduct interviews about Resources and FTI Closed-End Funds with the media, in accordance with Corporate Communication’s policies and procedures regarding such announcements or interviews.
| C. | GENERAL PROVISIONS OF REGULATION FD |
WHENEVER:
| | (1) | AN ISSUER, OR PERSON ACTING ON ITS BEHALF (i.e. any senior official or any other officer, employee or agent of an issuer (or issuer’s investment adviser) who regularly communicates with securities professionals or shareholders, or any employee directed to make a disclosure by a member of senior management) |
| | (2) | DISCLOSES MATERIAL NON-PUBLIC INFORMATION |
| | (3) | TO CERTAIN SPECIFIED PERSONS (generally, securities market professionals or holders of the issuer’s securities who may trade on the basis of the information) |
THEN:
| | (4) | the issuer must make public disclosure of that same information: |
| | • | simultaneously (for intentional disclosures), or |
| | • | promptly (for non-intentional disclosures). |
In the case of non-intentional disclosures, “promptly” means no later than 24 hours (or the commencement of the next day’s trading on the NYSE, whichever is later), after a senior official learns of the disclosure and knows, or is reckless in not knowing, that the information is both material and non-public.
Page 39
| D. | PERSONS TO WHOM SELECTIVE DISCLOSURE MAY NOT BE MADE: |
| | (1) | BROKER-DEALERS and their associated persons; |
| | (2) | INVESTMENT ADVISERS, certain institutional investment managers and their associated persons, |
| | (3) | INVESTMENT COMPANIES, hedge funds and their affiliated persons, and |
| | (4) | HOLDERS OF THE ISSUER’S SECURITIES, under circumstances where it is reasonably foreseeable that such person would purchase or sell securities on the basis of the information. |
The Regulation is designed to cover sell-side analysts, buy-side analysts, institutional investment managers, and other market professionals who may be likely to trade on the basis of selectively disclosed information.
| E. | EXCLUSIONS FROM REGULATION FD |
SELECTIVE DISCLOSURES MAY BE MADE TO THE FOLLOWING AND NOT VIOLATE REGULATION FD:
| (1) | communications to “temporary insiders” who owe a duty of trust or confidence to the issuer (i.e. attorneys, investment bankers, or accountants); |
| (2) | any person who expressly agrees to maintain the information in confidence (i.e., disclosures by a public company to private investors in private offerings); |
| (3) | an entity whose primary business is the issuance of a credit rating, if the information is disclosed for the sole purpose of developing such ratings and the entity’s ratings are publicly available; and |
| (4) | communications made in connection with most offerings of securities registered under the Securities Act of 1933. |
| F. | METHODS OF PUBLIC DISCLOSURE: |
An issuer’s disclosure obligation may be met by any method reasonably designed to provide broad, non-exclusionary distribution of the information to the public. Acceptable methods of public disclosure include:
| | • | Furnishing or filing with the SEC a Form 8-K (not applicable to closed-end investment companies); |
| | • | press releases distributed through a widely circulated news or wire service; or |
| | • | announcements made through press conferences or conference calls that interested members of the public may attend or listen to either in person, by telephonic transmission, or by other electronic transmission (including use of the Internet), of which the public has adequate notice and means of access. |
Posting of new information on an issuer’s own website is NOT by itself a sufficient method of public disclosure. It may be used in combination with other methods.
Page 40
Appropriate training will be provided to certain employees identified as follows:
| | • | Corporate Communications Department |
| | • | Portfolio managers of FTI Closed-End Funds and their assistants; |
| | • | Managers and supervisors of Customer Services Representatives. |
As part of this training, each employee will be notified that they should not communicate on substantive matters involving Franklin Resources Inc., or the FTI Closed-End Funds except in accordance with these Policies and Procedures.
All inquiries regarding these Policie and Procedures should be addressed to Barbara Green, Deputy General Counel (650-525-7188, or Jim Davis, Director, Global Compliance (650-312-2832).
| I. | FREQUENTLY ASKED QUESTIONS: |
| | (1) | WHEN IS DISCLOSURE CONSIDERED INTENTIONAL WITHIN THE MEANING OF REGULATION FD? |
Under Regulation FD, selective disclosure is considered intentional when the issuer (or person acting on its behalf) knows, or is reckless in not knowing, that the information disclosed is BOTH material and non-public. For example, non-intentional selective disclosures may occur when company officials inadvertently disclose material information in response to questions from analysts or shareholders or when a decision is made to selectively disclose information that the company does not view as material but the market moves in response to the disclosure.
| | (2) | WHAT IS NON-PUBLIC INFORMATION? |
Information is non-public if it has not been disseminated in a manner making it available to investors generally.
| | (3) | WHAT IS MATERIAL INFORMATION? |
Regulation FD deems information material if “there is a substantial likelihood that a reasonable shareholder would consider it important” in making an investment decision or if there a substantial likelihood that a fact would be viewed by a reasonable investor as having “significantly altered the ‘total mix’ of information made available.”
| | (4) | ARE THERE SPECIFIC TYPES OF INFORMATION THAT ARE CONSIDERED MATERIAL? |
There is no bright line test to determine materiality. However, below is a list of items that should be reviewed carefully to determine whether they are material.
| | • | An impending departure of a portfolio manager who is primarily responsible for day-to-day management of a Closed-End Fund; |
| | • | A plan to convert a Closed-End Fund from a closed-end investment company to an open-end investment company; |
| | • | A plan to merge a Closed-End Fund into another investment company; |
| | • | Impending purchases or sales of particular portfolio securities; |
Page 41
| | • | Information about Resources related to earnings or earnings forecasts; |
| | • | Mergers, acquisitions, tender offers, joint ventures, or material change in assets; |
| | • | Changes in control or in management; |
| | • | Change in auditors or auditor notification that the issuer may no longer rely on an auditor’s audit report; |
| | • | Events regarding Resources or an FTI Closed-End Fund’s securities - e.g., repurchase plans, stock splits or changes in dividends, calls of securities for redemption, changes to the rights of security holders, public or private sales of additional securities; and |
| | • | Bankruptcies or receiverships. |
| | (5) | ARE ALL ISSUER COMMUNICATIONS COVERED BY THE RULE? |
No. Regulation FD applies only to communications by the issuer’s senior management, its investor relations professionals and others who regularly communicate with securities market professionals and security holders when those communications are made to securities market professionals and security holders under circumstances in which it is reasonably foreseeable that the holders will trade on the basis of the information. Regulation FD isn’t intended to apply to persons who are engaged in ordinary-course business communications with the issuer or to interfere with disclosures to the media. However, the traditional disclosure concerns (such as “tipping” material non-public information and leaking disclosure into the market) still apply.
| | (6) | ARE COMMUNICATIONS TO THE MEDIA COVERED BY REGULATION FD? |
No. However, an interview with a reporter is not the best way to disseminate material information to the public and is not a method of public disclosure mentioned by the SEC as a means to satisfy Regulation FD.
(7) ARE ONE-ON-ONE DISCUSSIONS WITH ANALYSTS PERMITTED?
Yes. Regulation FD is not intended to undermine the role of analysts in “sifting through and extracting information that may not be significant to the ordinary investor to reach material conclusions.” However, persons covered by Regulation FD must be cautious not to selectively provide material non-public information in one-on-one discussions. (This may be confusing to some - perhaps this should be deleted).
| | (8) | MAY ISSUERS PROVIDE GUIDANCE ON EARNINGS? |
Not selectively. Although many issuers have historically provided earnings guidance, the SEC observed in Regulation FD’s adopting release that an issuer that has a private conversation with an analyst in which the issuer provides direct or indirect guidance as to whether earnings will be higher than, lower than or even the same as forecasted will likely violate the rule. Regulation FD may be violated simply by confirming in a non-public manner an earnings forecast that is already public, because such confirmation may be material.
Page 42
| J. | SUPPLEMENTAL INFORMATION—SEC’S DIVISION OF COPORATE FINANCE |
| | (1) | INTERPRETATIONS ISSUED OCTOBER 2000 |
| 1. | CAN AN ISSUER EVER CONFIRM SELECTIVELY A FORECAST IT HAS PREVIOUSLY MADE TO THE PUBLIC WITHOUT TRIGGERING THE RULE’S PUBLIC REPORTING REQUIREMENTS? |
Yes. In assessing the materiality of an issuer’s confirmation of its own forecast, the issuer should consider whether the confirmation conveys any information above and beyond the original forecast and whether that additional information is itself material. That may depend on, among other things, the amount of time that has elapsed between the original forecast and the confirmation (or the amount of time elapsed since the last public confirmation, if applicable). For example, a confirmation of expected quarterly earnings made near the end of a quarter might convey information about how the issuer actually performed. In that respect, the inference a reasonable investor may draw from such a confirmation may differ significantly from the inference he or she may have drawn from the original forecast early in the quarter. The materiality of a confirmation also may depend on, among other things, intervening events. For example, if it is clear that the issuer’s forecast is highly dependent on a particular customer and the customer subsequently announces that it is ceasing operations, a confirmation by the issuer of a prior forecast may be material.
We note that a statement by an issuer that it has “not changed,” or that it is “still comfortable with,” a prior forecast is no different than a confirmation of a prior forecast. Moreover, under certain circumstances, an issuer’s reference to a prior forecast may imply that the issuer is confirming the forecast. If, when asked about a prior forecast, the issuer does not want to confirm it, the issuer may simply wish to say “no comment.” If an issuer wishes to refer back to the prior estimate without implicitly confirming it, the issuer should make clear that the prior estimate was as of the date it was given and is not being updated as of the time of the subsequent statement.
| 2. | DOES REGULATION FD CREATE A DUTY TO UPDATE? |
No. Regulation FD does not change existing law with respect to any duty to update.
| 3. | IF AN ISSUER WANTS TO MAKE PUBLIC DISCLOSURE OF MATERIAL NONPUBLIC INFORMATION UNDER REGULATION FD BY MEANS OF A CONFERENCE CALL, WHAT INFORMATION MUST THE ISSUER PROVIDE IN THE NOTICE AND HOW FAR IN ADVANCE SHOULD NOTICE BE GIVEN? |
An adequate advance notice under Regulation FD must include the date, time, and call-in information for the conference call. Issuers also should consider the following non-exclusive factors in determining what constitutes adequate advance notice of a conference call:
| | • | TIMING: Public notice should be provided a reasonable period of time ahead of the conference call. For example, for a quarterly earnings announcement that the issuer makes on a regular basis, notice of several days would be reasonable. We recognize, however, that the period of notice may be shorter when unexpected events occur and the information is critical or time sensitive. |
| | • | AVAILABILITY: If a transcript or re-play of the conference call will be available after it has occurred, for instance via the issuer’s website, we encourage issuers to indicate in the notice how, and for how long, such a record will be available to the public. |
Page 43
| 4. | CAN AN ISSUER SATISFY REGULATION FD’S PUBLIC DISCLOSURE REQUIREMENT BY DISCLOSING MATERIAL NONPUBLIC INFORMATION AT A SHAREHOLDER MEETING THAT IS OPEN TO ALL SHAREHOLDERS, BUT NOT TO THE PUBLIC? |
No. If a shareholder meeting is not accessible by the public, an issuer’s selective disclosure of material nonpublic information at the meeting would not satisfy Regulation FD’s public disclosure requirement.
| 5. | COULD AN EXCHANGE ACT FILING OTHER THAN A FORM 8-K, SUCH AS A FORM 10-Q OR PROXY STATEMENT, CONSTITUTE PUBLIC DISCLOSURE? |
Yes. In general, including information in a document publicly filed on EDGAR with the SEC within the time frames that Regulation FD requires would satisfy the rule. In considering whether that disclosure is sufficient, however, companies must take care to bring the disclosure to the attention of readers of the document, must not bury the information, and must not make the disclosure in a piecemeal fashion throughout the filing.
| 6. | FOR PURPOSES OF REGULATION FD, MUST AN ISSUER WAIT SOME PERIOD OF TIME AFTER MAKING A FILING OR FURNISHING A REPORT ON EDGAR THAT COMPLIES WITH THE EXCHANGE ACT BEFORE MAKING DISCLOSURE OF THE SAME INFORMATION TO A SELECT AUDIENCE? |
Prior to making disclosure to a select audience, the issuer need only confirm that the filing or furnished report has received a filing date (as determined in accordance with Rules 12 and 13 of Regulation S-T) that is no later than the date of the selective disclosure.
| 7. | CAN AN ISSUER EVER REVIEW AND COMMENT ON AN ANALYST’S MODEL PRIVATELY WITHOUT TRIGGERING REGULATION FD’S DISCLOSURE REQUIREMENTS? |
Yes. It depends on whether, in so doing, the issuer communicates material nonpublic information. For example, an issuer ordinarily would not be conveying material nonpublic information if it corrected historical facts that were a matter of public record. An issuer also would not be conveying such information if it shared seemingly inconsequential data which, pieced together with public information by a skilled analyst with knowledge of the issuer and the industry, helps form a mosaic that reveals material nonpublic information. It would not violate Regulation FD to reveal this type of data even if, when added to the analyst’s own fund of knowledge, it is used to construct his or her ultimate judgments about the issuer. An issuer may not, however, use the discussion of an analyst’s model as a vehicle for selectively communicating - either expressly or in code - material nonpublic information.
| 8. | DURING A NONPUBLIC MEETING WITH ANALYSTS, AN ISSUER’S CEO PROVIDES MATERIAL NONPUBLIC INFORMATION ON A SUBJECT SHE HAD NOT PLANNED TO COVER. ALTHOUGH THE CEO HAD NOT PLANNED TO DISCLOSE THIS INFORMATION WHEN SHE ENTERED THE MEETING, AFTER HEARING THE DIRECTION OF THE DISCUSSION, SHE DECIDED TO PROVIDE IT, KNOWING THAT THE INFORMATION WAS MATERIAL AND NONPUBLIC. WOULD THIS BE CONSIDERED AN INTENTIONAL DISCLOSURE THAT VIOLATED REGULATION FD BECAUSE NO SIMULTANEOUS PUBLIC DISCLOSURE WAS MADE? |
Yes. A disclosure is “intentional” under Regulation FD when the person making it either knows, or is reckless in not knowing, that the information he or she is communicating is both material and nonpublic. In this example, the CEO knew that the information was material and nonpublic, so the disclosure was “intentional” under Regulation FD, even though she did not originally plan to make it.
| 9. | MAY AN ISSUER PROVIDE MATERIAL NONPUBLIC INFORMATION TO ANALYSTS AS LONG AS THE ANALYSTS EXPRESSLY AGREE TO MAINTAIN CONFIDENTIALITY UNTIL THE INFORMATION IS PUBLIC? |
Yes.
Page 44
| 10. | IF AN ISSUER GETS AN AGREEMENT TO MAINTAIN MATERIAL NONPUBLIC INFORMATION IN CONFIDENCE, MUST IT ALSO GET THE ADDITIONAL STATEMENT THAT THE RECIPIENT AGREES NOT TO TRADE ON THE INFORMATION IN ORDER TO RELY ON THE EXCLUSION IN RULE 100(B)(2)(II) OF REGULATION FD? |
No. An express agreement to maintain the information in confidence is sufficient. If a recipient of material nonpublic information subject to such a confidentiality agreement trades or advises others to trade, he or she could face insider trading liability.
| 11. | IF AN ISSUER WISHES TO RELY ON THE CONFIDENTIALITY AGREEMENT EXCLUSION OF REGULATION FD, IS IT SUFFICIENT TO GET AN ACKNOWLEDGMENT THAT THE RECIPIENT OF THE MATERIAL NONPUBLIC INFORMATION WILL NOT USE THE INFORMATION IN VIOLATION OF THE FEDERAL SECURITIES LAWS? |
No. The recipient must expressly agree to keep the information confidential.
| 12. | MUST ROAD SHOW MATERIALS IN CONNECTION WITH A REGISTERED PUBLIC OFFERING BE DISCLOSED UNDER REGULATION FD? |
Any disclosure made “in connection with” a registered public offering of the type excluded from Regulation FD is not subject to Regulation FD. That includes road shows in those offerings. All other road shows are subject to Regulation FD in the absence of another applicable exclusion from Regulation FD. For example, a disclosure in a road show in an unregistered offering is subject to Regulation FD. Also, a disclosure in a road show made while the issuer is not in registration and is not otherwise engaged in a securities offering is subject to Regulation FD. If, however, those who receive road show information expressly agree to keep the material nonpublic information confidential, disclosure to them is not subject to Regulation FD.
| 13. | CAN AN ISSUER DISCLOSE MATERIAL NONPUBLIC INFORMATION TO ITS EMPLOYEES (WHO MAY ALSO BE SHAREHOLDERS) WITHOUT MAKING PUBLIC DISCLOSURE OF THE INFORMATION? |
Yes. Rule 100(b)(1) states that Regulation FD applies to disclosures made to “any person outside the issuer.” Regulation FD does not apply to communications of confidential information to employees of the issuer. An issuer’s officers, directors, and other employees are subject to duties of trust and confidence and face insider trading liability if they trade or tip.
| 14. | IF AN ISSUER HAS A POLICY THAT LIMITS WHICH SENIOR OFFICIALS ARE AUTHORIZED TO SPEAK TO PERSONS ENUMERATED IN RULE 100(B)(1)(I) - (B)(1)(IV), WILL DISCLOSURES BY SENIOR OFFICIALS NOT AUTHORIZED TO SPEAK UNDER THE POLICY BE SUBJECT TO REGULATION FD? |
No. Selective disclosures of material nonpublic information by senior officials not authorized to speak to enumerated persons are made in breach of a duty of trust or confidence to the issuer and are not covered by Regulation FD. Such disclosures may, however, trigger liability under existing insider trading law.
| 15. | A PUBLICLY TRADED COMPANY HAS DECIDED TO CONDUCT A PRIVATE PLACEMENT OF SHARES AND THEN SUBSEQUENTLY REGISTER THE RESALE BY THOSE SHAREHOLDERS ON A FORM S-3 REGISTRATION STATEMENT. THE COMPANY AND ITS INVESTMENT BANKERS CONDUCT MINI-ROAD SHOWS OVER A THREE-DAY PERIOD DURING THE PRIVATE PLACEMENT. DOES THE RESALE REGISTRATION STATEMENT FILED AFTER COMPLETION OF |
Page 45
| | THE PRIVATE PLACEMENT AFFECT WHETHER DISCLOSURE AT THE ROAD SHOWS IS COVERED BY REGULATION FD? |
No. The road shows are made in connection with an offering by the issuer that is not registered (i.e., the private placement), regardless of whether a registration statement is later filed for an offering by those who purchased in the private placement.
| | ( 2) | ADDITIONAL INTERPRETATIONS ISSUED DECEMBER 2000 |
| 16. | DOES THE MERE PRESENCE OF THE PRESS AT AN OTHERWISE NON-PUBLIC MEETING ATTENDED BY PERSONS OUTSIDE THE ISSUER DESCRIBED IN PARAGRAPH (B)(1) OF RULE 100 UNDER REGULATION FD RENDER THE MEETING PUBLIC FOR PURPOSES OF REGULATION FD? |
Regulation FD states that a company can make public disclosure by filing or furnishing a Form 8-K or by disseminating information through another method (or combination of methods) that is reasonably designed to provide broad, non-exclusionary distribution of the information to the public. Some companies may attempt to satisfy the latter method for public dissemination by merely having the press in attendance at a meeting to which the public is not invited or otherwise present. If it is attended by persons outside the issuer described in paragraph (b)(1) of Rule 100 under Regulation FD and if it is not otherwise public, the meeting will not necessarily be deemed public for purposes of Regulation FD by the mere presence of the press at the meeting. Whether or not the meeting would be deemed public would depend, among other things, on when, what and how widely the press reports on the meeting.
| 17. | IS REGULATION FD INTENDED TO REPLACE THE PRACTICE OF USING A PRESS RELEASE TO DISSEMINATE EARNINGS INFORMATION IN ADVANCE OF A CONFERENCE CALL OR WEBCAST AT WHICH EARNINGS INFORMATION WILL BE DISCUSSED? |
No. In adopting Regulation FD, the Commission specifically indicated that it did not intend the regulation to alter or supplant the rules of self-regulatory organizations with respect to the use of press releases to announce material developments. In this regard, the Commission specifically endorsed a model for the planned disclosure of material information, such as earnings, in which the conference call or webcast is preceded by a press release containing the earnings information.
SUPPLEMENTAL MEMORANDUM
CHINESE WALL PROCEDURES
Under The Chinese Wall, access persons from Advisory Groups (as defined in Appendix A) are prohibited from having access to investment information of an Advisory Group other than his or her own Advisory Group with the following exception: Access persons to Floating Rate may have access to Investment Information of Franklin Templeton, but access persons to Franklin Templeton may not have access to Floating Rate.
The Chinese Wall applies to all access persons, including part-time employees, and consultants, and are in addition to those obligations prescribed by Franklin Templeton Code of Ethics (the “Code of Ethics”).
Page 46
Questions regarding these procedures should be directed to the attention of Jim Davis, Legal Compliance Department, at 650-312-2832 or e-mailed to:
jdavis@frk.com.
GENERAL PROCEDURES
CONFIDENTIALITY. Access persons within one Advisory Group (e.g., Franklin Templeton) may not disclose Investment Information to access persons of the other Advisory Group (e.g., Franklin Mutual). Any communication of Investment Information outside an Advisory Group should be limited to persons (such as Accounting, Investment Operations, Legal and Compliance personnel) who have a valid “need to know” such information and each of whom is specifically prohibited from disclosing Investment Information from one to another except when necessary for regulatory purposes. Nothing contained herein is designed to prohibit the proper exchange of accounting, operational, legal or compliance information among such persons in the normal course of performing his or her duties.
DISCUSSIONS. Access persons within one Advisory Group should avoid discussing Investment Information in the presence of persons who do not have a need to know the information. Extreme caution should be taken with discussions in public places such as hallways, elevators, taxis, airplanes, airports, restaurants, and social gatherings. Avoid discussing confidential information on speakerphones. Mobile telephones should be used with great care because they are not secure.
ACCESS. Access persons should limit physical access to areas where confidential or proprietary information may be present or discussed. Only persons with a valid business reason for being in such an area should be permitted. In this regard, meetings with personnel who are not members of the same Advisory Group should be conducted in conference rooms rather than employee offices. Work on confidential projects should take place in areas that are physically separate and secure.
OUTSIDE INQUIRIES. Any person not specifically authorized to respond to press or other outside inquiries concerning a particular matter should refer all calls relating to the matter to the attention of Holly Gibson-Brady, Director, Corporate Communications, Franklin Templeton Investments, in San Mateo, California, at (650) 312-4701.
DOCUMENTS AND DATABASES. Confidential documents should not be stored in common office areas where unauthorized persons may read them. Such documents should be stored in secure locations and not left exposed overnight on desks or in workrooms.
Confidential databases and other confidential information accessible by computer should be protected by passwords or otherwise secured against access by unauthorized persons.
FAXING PROCEDURES. Confidential documents should not be faxed to locations where they may be read by unauthorized persons, including to other FRI offices outside the Advisory Group, unless steps have been taken to remove or redact any confidential information included in such documents. Prior to faxing a document that includes confidential information, the sender should confirm that the recipient is attending the machine that receives such documents.
THE CHINESE WALL
GENERAL. FRI has adopted the Chinese Wall to separate investment management activities conducted by certain investment advisory subsidiaries of FRI. The Chinese Wall may be amended or supplemented from time to time by memoranda circulated by the Legal Compliance Department.
Page 47
CHINESE WALL RESTRICTIONS. Except in accordance with the Wall-crossing procedures described below or in accordance with such other procedures as may be developed by the Legal Compliance Department for a particular department or division:
| • | No access person in any Advisory Group (as defined in Appendix A) should disclose Investment Information to any access person in the any other Advisory Group, or give such access persons access to any file or database containing such Investment Information; and |
| • | No access person in any Advisory Group should obtain or make any effort to obtain Investment Information within the any other Advisory Group from any person. |
An access person who obtains Investment Information of an Advisory Group other than his or her own in a manner other than in accordance with the Chinese Wall procedures described herein, should immediately notify an appropriate supervisory person in his or her department who, in turn, should consult with the Legal Compliance Department concerning what, if any, action should be taken. Unless expressly advised to the contrary by the Legal Compliance Department, such employee should refrain from engaging in transactions in the related securities or other securities of the related issuer for any account and avoid further disclosure of the information.
CROSSING PROCEDURES. Disclosure of Investment Information of one Advisory Group to an access person in another Advisory Group on a “need to know” basis in the performance of his or her duties, should be made only if absolutely necessary. In such instance, the disclosure of such information may be made only in accordance with the specific procedures set forth below.
An access person within one Advisory Group must obtain prior approval from the Legal Compliance Department before making any disclosure of Investment Information to an access person within the other Advisory Group.
Before approval is granted, the Legal Compliance Department must be notified in writing by an Executive Officer within the Advisory Group (the “Originating Group”) which proposes to cross the Chinese Wall of (1) the identity of the Advisory Group access person(s) who are proposed to cross the Chinese Wall, (2) the identity of the access person(s) in the other Advisory Group (the “Receiving Group”) who are proposed to receive the Investment Information, (3) the applicable issuer(s), (4) the nature of the information to be discussed, and (5) the reason for crossing the Chinese Wall. The form of notice is attached to this Memorandum as Appendix B.
The Legal Compliance Department will notify an Executive Officer within the Receiving Group of the identity of the access person(s) who are proposed to cross the Chinese Wall. The Legal Compliance Department may not disclose any additional information to such person.
If approval is obtained from an Executive Officer within the Receiving Group, the Legal Compliance Department will notify the requesting Executive Officer in the Originating Group that the proposed Wall-crosser(s) may be contacted. Personnel from the Legal Compliance Department or their designees must attend all meetings where Wall-crossing communications are made. Communications permitted by these crossing procedures should be conducted in a manner not to be overheard or received by persons not authorized to receive confidential information.
The Legal Compliance Department will maintain a record of Wall-crossings.
Page 48
An access person who has crossed the Chinese Wall under these procedures must maintain the confidentiality of the Investment Information received and may use it only for the purposes for which it was disclosed.
Any questions or issues arising in connection with these crossing procedures will be resolved between the appropriate Executive Officers(s), the Legal Compliance Department and the Legal Department.
APPENDIX A
FRANKLIN TEMPLETON INVESTMENT’S ADVISORY GROUPS (12/02)
| 1. | FRANKLIN/TEMPLETON ADVISORY GROUP |
Franklin Advisers, Inc.
Franklin Advisory Services, LLC
Franklin Investment Advisory Services, Inc.
Franklin Private Client Group, Inc.
Franklin Templeton Investments Corp (Canada)
Franklin Templeton Investment Management, Limited (UK)
Franklin Templeton Investments Japan, Ltd.
Franklin Templeton Investments Australia Limited
FTI Institutional, LLC
Franklin Templeton Asset Strategies, LLC
Franklin Templeton Investments (Asia) Limited
Franklin Templeton Asset Management S.A., (France)
Templeton/Franklin Investment Services, Inc.
Templeton Investment Counsel, LLC
Templeton Asset Management, Limited.
Templeton Global Advisors Limited (Bahamas)
Templeton Asset Management (India) Pvt. Ltd.
Fiduciary Trust Company International (NY)
Fiduciary International, Inc.
Fiduciary Investment Management International, Inc.
Fiduciary Trust International Asia Limited (Hong Kong)
Fiduciary Trust International Australia Limited
Fiduciary Trust International Limited (UK)
Fiduciary Trust International Investment Management, Inc. (Japan)
Page 49
Fiduciary Trust International of California
Fiduciary Trust International of the South (Florida)
FTI -Banque Fiduciary Trust (Switzerland)
| 2. | FRANKLIN FLOATING RATE TRUST ADVISORY GROUP |
| 3. | FRANKLIN MUTUAL ADVISORY GROUP |
APPENDIX B
M E M O R A N D U M
TO: The Legal Compliance Department - San Mateo
FROM:
RE: Chinese Wall Crossing
DATE:
The following access person(s)
Name Title Department
within the Advisory Group are proposing to cross the Chinese Wall and communicate certain Investment Information to the access persons within the Advisory Group identified below.
Name Title Department
Such access person(s) will cross the Chinese Wall with respect to the following issuer:
The following is a description of the nature of the information to be discussed by such access person(s):
Page 50
Modified on
Code of Ethics Revised 12-03-02 Readonly.doc
| | | | |
APPROVED: | | | | |
| | |
| | |
| | | EXECUTIVE OFFICER (ORIGINATING GROUP) | | |
| | |
| | | | | |
| | |
| | |
| | | Executive Officer (Receiving Group) | | |
| 1 | “Director” includes trustee. |
| 2 | The term “employee or employees” includes futures associates, as well as regular employees of Franklin Templeton Investments. |
| 3 | SEE Appendix A. II., for definition of “Proprietary Accounts.” |
| 4 | Generally, a person has “beneficial ownership” in a security if he or she, directly or indirectly, through any contract, arrangement, understanding, relationship or otherwise, has or shares a direct or indirect pecuniary interest in the security. There is a presumption of a pecuniary interest in a security held or acquired by a member of a person’s immediate family sharing the same household. |
| 5 | Proprietary Information: Information that is obtained or developed during the ordinary course of employment with Franklin Templeton Investments, whether by you or someone else, and is not available to persons outside of Franklin Templeton Investments. Examples of such Proprietary Information include, among other things, internal research reports, research materials supplied to Franklin Templeton Investments by vendors and broker-dealers not generally available to the public, minutes of departmental/research meetings and conference calls, and communications with company officers (including confidentiality agreements). Examples of non-Proprietary Information include mass media publications (e.g., The Wall Street Journal, Forbes, and Fortune), certain specialized publications available to the public (e.g., Morningstar, Value Line, Standard and Poors), and research reports available to the general public. |
| 6 | The Director, Global Compliance is designated on Schedule A. The “Appropriate Analyst” means any securities analyst or portfolio manager, other than you, |
Page 51
| | making recommendations or investing funds on behalf of any associated client, who may be reasonably expected to recommend or consider the purchase or sale of the security in question. |
| 7 | Associated Client: A Fund or client who’s trading information would be available to the access person during the course of his or her regular functions or duties. |
| 8 | This restriction applies equally to transactions occurring in margin and option accounts, which may not be due to direct actions by the Portfolio Person. For example, a stock held less than 60 days that is sold to meet a margin call or the underlying stock of a covered call option held less than 60 days that is called away, would be a violation of this restriction if these transactions resulted in a profit for the Portfolio Person. |
| 9 | You are not required to separately report the vesting of shares or options of Franklin Resources, Inc., received pursuant to a deferred compensation plan as such information is already maintained. |
| 10 | See Sections 3.2 and 4.6 of the Code. Also, confirmations and statements of transactions in open-end mutual funds, including mutual funds sponsored by Franklin Templeton Investments are not required. See Section 3.3 above for a list of other securities that need not be reported. If you have any beneficial ownership in a discretionary account, transactions in that account are treated as yours and must be reported by the manager of that account (see Section 6.1.C below). |
| 11 | Officers, directors and certain other key management personnel who perform significant policy-making functions of Franklin Resources, Inc., the closed-end funds, and/or real estate investment trusts may have ownership reporting requirements in addition to these reporting requirements. Contact the Legal Compliance Department for additional information. SEE also the “Insider Trading Policy” attached. |
| 12 | Please note that these conditions apply to any discretionary account in existence prior to the effective date of this Code or prior to your becoming an access person. Also, the conditions apply to transactions in any discretionary account, including pre-existing accounts, in which you have any direct or indirect beneficial ownership, even if it is not in your name. |
| 13 | Any pre-existing agreement must be promptly amended to comply with this condition. The required reports may be made in the form of an account statement if they are filed by the applicable deadline. |
| 14 | An “advisory person” of a registered investment company or an investment adviser is any employee, who in connection with his or her regular functions or duties, makes, participates in, or obtains information regarding the purchase or sale of a security by an advisory client, or whose functions relate to the making of any recommendations with respect to such purchases or sales. Advisory person also includes any natural person in a control relationship to such company or investment adviser who obtains information concerning recommendations made to such company with regard to the purchase or sale of a security. |
| 15 | Generally, an “advisory representative” is any person who makes any recommendation, who participates in the determination of which recommendation shall be made, or whose functions or duties relate to the determination of which recommendation shall be made, or who, in connection with his duties, obtains any information concerning which securities are being recommended prior to the effective dissemination of such recommendations or of the information concerning such recommendations. See Section II of Appendix A for the legal definition of “Advisory Representative.” |
Page 52
| 16 | Security includes any option to purchase or sell, and any security that is exchangeable for or convertible into, any security that is held or to be acquired by a fund. |
| 17 | Special circumstances include but are not limited to, for example, differences in time zones, delays due to travel, and the unusual size of proposed trades or limit orders. Limit orders must expire within the applicable clearance period. |
| 19 | If an investment opportunity is presented to you in your capacity as a portfolio manager AND the investment opportunity is suitable for the fund/ client, it must first be offered to the fund/client before any personal securities transaction can be effected. |
Page 53
| Item 3. | | Audit Committee Financial Expert. |
(a) (1) The registrant has an audit committee financial expert serving on its audit committee.
(2) The audit committee financial expert is Frank W.T. LaHaye, and he is “independent” as defined under the relevant Securities and Exchange Commission Rules and Releases.
| Item 4. | | Principal Accountant Fees and Services |
(a) Audit Fees
The aggregate fees paid to the principal accountant for professional services rendered by the principal accountant for the audit of the registrant’s annual financial statements or for services that are normally provided by the principal accountant in connection with statutory and regulatory filings or engagements were $430,529 for the fiscal year ended December 31, 2003 and $446,500 for the fiscal year ended December 31, 2002.
(b) Audit-Related Fees
The aggregate fees paid to the principal accountant for assurance and related services rendered by the principal accountant to the registrant that are reasonably related to the performance of the audit of the registrant’s financial statements and are not reported under paragraph (a) of Item 4 were $0 for the fiscal year ended December 31, 2003 and $5,998 for the fiscal year ended December 31, 2002. The services for which these fees were paid included payments for internal control examination pursuant to the Statement of Auditing Standards No. 70 and other attestation services.
The aggregate fees paid to the principal accountant for assurance and related services rendered by the principal accountant to the registrant’s investment adviser and any entity controlling, controlled by or under common control with the investment adviser that provides ongoing services to the registrant that are reasonably related to the performance of the audit of the their financial statements were $337,344 for the fiscal year ended December 31, 2003 and $357,762 for the fiscal year ended December 31, 2002. The services for which these fees were paid included payments for internal control examination pursuant to the Statement of Auditing Standards No. 70 and other attestation services.
(c) Tax Fees
There were no fees paid to the principal accountant for professional services rendered by the principal accountant to the registrant for tax compliance, tax advice and tax planning.
The aggregate fees paid to the principal accountant for professional services rendered by the principal accountant to the registrant’s investment adviser and any entity controlling, controlled by or under common control with the investment adviser that provides ongoing services to the registrant for tax compliance, tax advice and tax planning were $2,760 for the fiscal year ended December 31, 2003 and $84,424 for the fiscal year ended December 31, 2002. The services for which these fees were paid included payments for tax compliance and advice.
(d) All Other Fees
There were no fees paid to the principal accountant for products and services rendered by the principal accountant to the registrant, other than the services reported in paragraphs (a)-(c) of Item 4.
There were no fees paid to the principal accountant for products and services rendered by the principal accountant to the registrant’s investment adviser and any entity controlling, controlled by or under
common control with the investment adviser that provides ongoing services to the registrant, other than the services reported in paragraphs (a)-(c) of Item 4.
(e) (1) The Fund’s audit committee is directly responsible for approving the services to be provided by the auditors, including:
(i) pre-approval of all audit and audit related services;
(ii) pre-approval of all non-audit related services to be provided to the Fund by the auditors;
(iii) pre-approval of all non-audit related services to be provided to the Fund by the auditors to the Fund’s investment adviser or to any entity that controls, is controlled by or is under common control with the Fund’s investment adviser and that provides ongoing services to the Fund where the non-audit services relate directly to the operations or financial reporting of the Fund; and
(iv) establishment by the audit committee, if deemed necessary or appropriate, as an alternative to committee pre-approval of services to be provided by the auditors, as required by paragraphs (ii) and (iii) above, of policies and procedures to permit such services to be pre-approved by other means, such as through establishment of guidelines or by action of a designated member or members of the committee; provided the policies and procedures are detailed as to the particular service and the committee is informed of each service and such policies and procedures do not include delegation of audit committee responsibilities, as contemplated under the Securities Exchange Act of 1934, to management; subject, in the case of (ii) through (iv), to any waivers, exceptions or exemptions that may be available under applicable law or rules.
(e) (2) None of the services provided to the registrant described in paragraphs (b)-(d) of Item 4 were pre-approved by the audit committee pursuant to paragraph (c)(7)(i)(C) of Rule 2-01 of regulation S-X.
(f) No disclosures are required by this Item 4(f).
(g) The aggregate non-audit fees paid to the principal accountant for services rendered by the principal accountant to the registrant and the registrant’s investment adviser and any entity controlling, controlled by or under common control with the investment adviser that provides ongoing services to the registrant were $340,104 for the fiscal year ended December 31, 2003 and $448,184 for the fiscal year ended December 31, 2002.
(h) No disclosures are required by this Item 4(h).
| Item 5. | | Audit Committee of Listed Registrants. N/A |
| Item 7. | | Disclosure of Proxy Voting Policies and Procedures for Closed-End Management Investment Companies. N/A |
| Item 9. | | Controls and Procedures. |
(a) Evaluation of Disclosure Controls and Procedures. The Registrant maintains disclosure controls and procedures that are designed to ensure that information required to be disclosed in the Registrant’s
filings under the Securities Exchange Act of 1934 and the Investment Company Act of 1940 is recorded, processed, summarized and reported within the periods specified in the rules and forms of the Securities and Exchange Commission. Such information is accumulated and communicated to the Registrant’s management, including its principal executive officer and principal financial officer, as appropriate, to allow timely decisions regarding required disclosure. The Registrant’s management, including the principal executive officer and the principal financial officer, recognizes that any set of controls and procedures, no matter how well designed and operated, can provide only reasonable assurance of achieving the desired control objectives.
Within 90 days prior to the filing date of this Shareholder Report on Form N-CSR, the Registrant had carried out an evaluation, under the supervision and with the participation of the Registrant’s management, including the Registrant’s principal executive officer and the Registrant’s principal financial officer, of the effectiveness of the design and operation of the Registrant’s disclosure controls and procedures. Based on such evaluation, the Registrant’s principal executive officer and principal financial officer concluded that the Registrant’s disclosure controls and procedures are effective.
(b) Changes in Internal Controls. There have been no significant changes in the Registrant’s internal controls or in other factors that could significantly affect the internal controls subsequent to the date of their evaluation in connection with the preparation of this Shareholder Report on Form N-CSR.
(A) Code of Ethics for Principal Executive and Senior Financial Officers.
(B) (1) Certifications pursuant to Section 302 of the Sarbanes-Oxley Act of 2002 of Jimmy D. Gambill, Chief Executive Officer - Finance and Administration, and Kimberley H. Monasterio, Chief Financial Officer
(B) (2) Certifications pursuant to Section 906 of the Sarbanes-Oxley Act of 2002 of Jimmy D. Gambill, Chief Executive Officer - Finance and Administration, and Kimberley H. Monasterio, Chief Financial Officer
SIGNATURES
Pursuant to the requirements of the Securities Exchange Act of 1934 and the Investment Company Act of 1940, the registrant has duly caused this report to be signed on its behalf by the undersigned, thereunto duly authorized.
| | |
| FRANKLIN TEMPLETON VARIABLE INSURANCE PRODUCTS TRUST |
| |
| By | | /s/ Jimmy D. Gambill |
| | |
|
| | | Jimmy D. Gambill |
| | | Chief Executive Officer - Finance and Administration |
| Date | | February 27, 2004 |
Pursuant to the requirements of the Securities Exchange Act of 1934 and the Investment Company Act of 1940, this report has been signed below by the following persons on behalf of the registrant and in the capacities and on the dates indicated.
| | |
| |
| By | | /s/ Jimmy D. Gambill |
| | |
|
| | | Jimmy D. Gambill |
| | | Chief Executive Officer - Finance and Administration |
| Date | | February 27, 2004 |
| | |
| Company Name |
| |
| By | | /s/ Kimberley H. Monasterio |
| | |
|
| | | Kimberley H. Monasterio |
| | | Chief Financial Officer |
| Date | | February 27, 2004 |