UNITED STATES
SECURITIES AND EXCHANGE COMMISSION
Washington, D.C. 20549
FORM N-CSR
CERTIFIED SHAREHOLDER REPORT OF REGISTERED MANAGEMENT INVESTMENT
COMPANIES
Investment Company Act file number 811-5583
Franklin Templeton Variable Insurance Products Trust
(Exact name of registrant as specified in charter)
| | |
| One Franklin Parkway, San Mateo, CA | | 94403-1906 |
| (Address of principal executive offices) | | (Zip code) |
Murray L. Simpson, One Franklin Parkway, San Mateo, CA 94403-1906
(Name and address of agent for service)
Registrant’s telephone number, including area code: (650) 312-2000
Date of fiscal year end: 12/31
Date of reporting period: 12/31/03
Item 1. Reports to Stockholders
FRANKLIN TEMPLETON VARIABLE INSURANCE PRODUCTS TRUST ANNUAL REPORT
TABLEOF CONTENTS
| | |
A Word About Risk | | i |
Important Notes to Performance Information | | ii |
Regulatory Update | | iii |
Fund Summaries | | |
Templeton Developing Markets Securities Fund | | TD-1 |
Templeton Foreign Securities Fund | | TF-1 |
Templeton Global Asset Allocation Fund | | TGA-1 |
*Prospectus Supplement | | TGA-6 |
Templeton Global Income Securities Fund | | TGI-1 |
*Prospectus Supplement | | TGI-7 |
Templeton Growth Securities Fund | | TG-1 |
*Prospectus Supplement | | TG-5 |
Index Descriptions | | IND-1 |
Board Members and Officers | | BOD-1 |
Proxy Voting Policies and Procedures | | PV-1 |
*Not part of the annual report
| | |
| |
NOT FDIC INSURED | MAY LOSE VALUE | NO BANK GUARANTEE |
| |
PHOENIX CL1 A03 02-04 TIP
A WORDABOUT RISK
All of the funds are subject to certain risks, which will cause investment returns and the value of your principal to increase or decrease. Generally, investments offering the potential for higher returns are accompanied by a higher degree of risk. Stocks and other equities, representing an ownership interest in an individual company, historically have outperformed other asset classes over the long term, but tend to fluctuate more dramatically over the shorter term. Securities of smaller companies, and companies involved in reorganization or bankruptcy, may have greater price swings and greater credit and other risks. By having significant investment in particular sectors from time to time, some funds carry greater risk of adverse developments in those sectors than a fund that always invests in a wider variety of sectors. The technology sector can be among the most volatile market sectors.
Bonds and other debt obligations are affected by the creditworthiness of their issuers, and changes in interest rates, with prices declining as interest rates increase. High yield, lower-rated (“junk”) bonds generally have greater price swings and higher default risks than investment grade bonds.
Foreign investing, especially in emerging market countries, has additional risks such as changes in currency values, market price swings, and economic, political or social instability. These and other risks pertaining to specific funds, such as specialized industry or geographical sectors or use of complex securities, are discussed in the Franklin Templeton Variable Insurance Products Trust prospectus. Your investment representative can help you determine which funds may be right for you.
i
IMPORTANT NOTESTO
PERFORMANCE INFORMATION
Total return of the funds is the percentage change in value of a hypothetical $10,000 investment over the indicated periods and includes reinvestment of dividends and capital gains. Inception dates of the funds may have preceded the effective dates of the subaccounts, contracts, or their availability in all states. Performance data is historical and cannot predict or guarantee future results. Principal value and investment return will fluctuate with market conditions, and you may have a gain or loss when you withdraw your money.
When reviewing the index comparisons, please keep in mind that indexes have a number of inherent performance differentials over the funds. First, unlike the funds, which must hold a minimum amount of cash to maintain liquidity, indexes do not have a cash component. Second, the funds are actively managed and, thus, are subject to management fees to cover salaries of securities analysts or portfolio managers in addition to other expenses. Indexes are unmanaged and do not include any commissions or other expenses typically associated with investing in securities. Third, indexes often contain a different mix of securities than the fund to which they are compared. Additionally, please remember that indexes are simply a measure of performance and cannot be invested in directly.
ii
REGULATORY UPDATE
As of February 12, 2004
To Our Valued Contract Owners:
In our efforts to fulfill our ongoing commitment to providing you with timely and accurate information, we have prepared this statement to give you an overview of current industry issues as they pertain to Franklin Resources, Inc. (Franklin Templeton Investments) and our subsidiary companies (the “Company”). Any further updates on these and other matters will be disclosed on the Company’s website at franklintempleton.com under “Statement on Current Industry Issues.”
On February 4, 2004, the Securities Division of the Office of the Secretary of the Commonwealth of Massachusetts filed an administrative complaint against Franklin Resources, Inc. and certain of its subsidiaries, alleging violations of the Massachusetts Uniform Securities Act. The complaint arises from activity that occurred in 2001 during which time an officer of a Company subsidiary was negotiating an agreement with an investor relating to investments in a mutual fund and a hedge fund.
The Company, in addition to other entities within Franklin Templeton Investments, has been named in shareholder class actions related to the matter described above. The Company believes that the claims made in the lawsuit are without merit and it intends to defend vigorously against the allegations. The Company and the Fund(s) may be named in similar civil actions related to the matter described above.
In addition, as part of ongoing investigations by the U.S. Securities and Exchange Commission (the “SEC”), the U.S. Attorney for the Northern District of California, the New York Attorney General, the California Attorney General, the U.S. Attorney for the District of Massachusetts, the Florida Department of Financial Services, and the Commissioner of Securities and the Attorney General of the State of West Virginia, relating to certain practices in the mutual fund industry, including late trading, market timing and sales compensation arrangements, the Company and its subsidiaries, as well as certain current or former executives and employees of the Company, have received requests for information and/or subpoenas to testify or produce documents. The Company and its current employees are providing documents and information in response to these requests and subpoenas. In addition, the Company has responded to requests for similar kinds of information from regulatory authorities in some of the foreign countries where the Company conducts its global asset management business.
The Staff of the SEC has informed the Company that it intends to recommend that the Commission authorize an action against the Funds’ investment adviser and/or an affiliate adviser and a senior executive officer relating to the frequent trading issues that are the subject of the SEC’s investigation. These issues were previously disclosed as being under investigation by government authorities and the subject of an internal inquiry by the Company in its Annual Report on Form 10-K and on its public website. The Company currently is in discussions with the SEC Staff in an effort to resolve the issues raised in their investigation. Such discussions are preliminary and the Company cannot predict the likelihood of whether those discussions will result in a settlement and, if so, the terms of such settlement. The impact, if any, of these matters on a fund is uncertain at this time. If it is found that the Company bears responsibility for any unlawful or improper conduct, we have committed to making a fund or its shareholders whole, as appropriate.
iii
TEMPLETON DEVELOPING MARKETS SECURITIES FUND
Fund Goal and Primary Investments: Templeton Developing Markets Securities Fund seeks long-term capital appreciation. The Fund invests primarily in emerging markets investments.
This annual report for Templeton Developing Markets Securities Fund covers the period ended December 31, 2003.
Performance Overview
You can find the Fund’s one-year total return in the Performance Summary following this report. The Fund underperformed its benchmarks, the Morgan Stanley Capital International (MSCI) Emerging Markets Free (EMF) Index and the Standard & Poor’s/International Finance Corporation Investable (S&P/IFCI) Composite Index, which returned 56.28% and 57.16% for the year under review.1 Please note that the index performance numbers are purely for reference and that Templeton does not index its funds, but rather undertakes investments on the basis of careful, fundamental research.
Economic and Market Overview
For the year ended December 31, 2003, generally improving economic growth worldwide had favorable effects on many emerging market economies, which exhibited faster growth than many developed countries. Many emerging country financial markets seemed to reflect the strengthening global economic conditions. Early in 2003, concerns about military conflicts in Afghanistan and Iraq, as well as high oil prices, rattled investor confidence, and most equity markets experienced losses in the first quarter. However, a quicker-than-expected end to major combat in Iraq relieved some market concerns, and many emerging markets rebounded in the second quarter. The severe acute respiratory syndrome (SARS) outbreak in early spring greatly impacted Asian market performance as regional tourism suffered, particularly the airline and hospitality sectors. However, the containment of SARS in following months allowed concerns to subside, and investors returned from the sidelines. Largely as a result, emerging markets generally outperformed the U.S., European and Japanese markets for the 12 months under review. For example, the MSCI EMF Index returned 56.28% for the year ended December 31, 2003. The Standard & Poor’s 500 Composite Index (S&P 500), a broad measure of U.S. equity performance, returned 28.67%, while the MSCI Europe Australasia Far
1. Source: Standard & Poor’s Micropal. One cannot invest directly in an index, nor is an index representative of the Fund’s portfolio. Please see Index Descriptions following the Fund Summaries.
TD-1
East (EAFE) Index and MSCI Japan Index returned 39.17% and 36.15% for the same one-year period.2
During the Fund’s fiscal year, Latin American markets were some of the world’s strongest performing as political and financial issues that engulfed the region in 2002 subsided. Brazil and Argentina experienced renewed investor interest as their governments strove to implement key structural reforms and sealed agreements with the International Monetary Fund. Asian markets rebounded sharply in 2003’s second half largely due to strong macroeconomic data. In Africa, South Africa ended years of ongoing debate, and the government agreed to provide free AIDS-related treatments, creating the world’s largest such program. Eastern European equity markets’ upward trend continued as prospective European Union (EU) candidates successfully passed referendums for accession into the EU in 2004. In Russia, an investigation and subsequent arrest of Michail Khodorkovsky, the CEO and major shareholder of oil company Yukos, as well as the breakup of the Sibneft-Yukos merger, contributed to some severe market fluctuations during 2003’s fourth quarter. For the year, however, Russia’s market outperformed its regional peers. To the south, Turkey’s market appeared to take recent terrorist attacks in stride and continued its upward trend as investor confidence seemed to remain largely unshaken.
Investment Strategy
Our investment philosophy is bottom-up, value-oriented and long-term. In choosing investments, we may make onsite visits to companies to assess critical factors such as management strength and local conditions. In addition, we focus on the market price of a company’s securities relative to our evaluation of the company’s potential long-term (typically 5 years) earnings, asset value, cash flow and balance sheet. Among factors we consider are a company’s historical value measures, including price/earnings ratio, book value, profit margins and liquidation value. We perform in-depth research to construct an action list from which we make our investment decisions.
Manager’s Discussion
During the year under review, the Fund’s performance benefited from underweighted positions, relative to the MSCI EMF Index, in South Korea and Malaysia because those countries underperformed the index. Also helping Fund performance were relatively overweighted positions in China, Turkey and Austria, which outperformed the index.
2. Source: Standard & Poor’s Micropal. Please see Index Descriptions following the Fund Summaries.
TD-2
By industry, the Fund’s holdings in banks (including commercial banks), information technology (IT) services and industrial conglomerates provided the greatest contribution to Fund performance relative to the MSCI EMF Index during the period. Individual contributors included Turkey’s Akbank and Brazil’s Banco Bradesco. Within IT services, Satyam Computers, an Indian IT services company with strong working relationships with multinationals, led performance. Industrial conglomerates that helped the Fund’s relative performance included India’s Grasim Industries and Singapore’s Keppel.
Areas that hindered Fund performance during the period included a relatively overweighted position in the Philippines and underweighted positions in Brazil and Russia. The Fund’s Philippine position is concentrated in San Miguel Corp., one of the largest beverage companies in the Asia-Pacific region. The company and its subsidiaries have broad exposure in the Asia-Pacific region and operate more than 100 facilities in the Philippines, China and other Southeast Asian countries. We believe Asia’s economic recovery could bode well for the company; therefore, consistent with our investment strategy, we continued to hold the stock. Poor liquidity made additional investments in Russia difficult, while Brazil’s strong market performance led to increasingly expensive valuations.
During the Fund’s fiscal year, we made investments in several Asian countries, including Taiwan, Singapore and China (Red Chip shares, Hong Kong-listed companies with significant exposure to China, and H shares, Hong Kong-listed Chinese companies). Consistent with our investment strategy, we purchased shares of China Mobile, a dominant wireless telecommunications operator in China; China Telecom and Taiwan Cellular, key integrated telecommunications services providers in China and Taiwan, respectively; and Singapore Telecommunications, one of Asia’s leading communications companies. Conversely, we undertook selective sales in strong performers in Indonesia and Thailand as some stock valuations became expensive.
Top 10 Countries
Templeton Developing Markets Securities Fund
12/31/03
| | |
South Korea | | 11.7% |
| |
South Africa | | 11.1% |
| |
China | | 9.8% |
| |
Taiwan | | 9.6% |
| |
Brazil | | 7.7% |
| |
Singapore | | 6.4% |
| |
Hong Kong | | 5.7% |
| |
Mexico | | 5.1% |
| |
India | | 3.9% |
| |
Turkey | | 3.4% |
TD-3
Consistent with our strategy, in Latin America we added to our shares of Telefonos de Mexico, the country’s largest integrated telecommunications services provider, which increased our overall Mexican holdings. We decreased our Argentina position during the period and repositioned our Brazil holdings by adding to our shares of Embraer-Empresa Brasileira de Aeronautica, one of the world’s largest aircraft manufacturers, and reducing our position and taking profits in Cia Vale Do Rio Doce.
We purchased shares in several European companies during the fiscal year, including Poland’s Telekomunikacja Polska SA, Greece’s Hellenic Telecommunications Organization SA (OTE) and the Czech Republic’s Cesky Telecom. Largely as a result of these purchases and some of our Asian investments, the Fund’s exposure to telecommunications increased during the period. We sold some of our Turkey holdings before the terrorist attacks there, locking in gains.
Thank you for your participation in Templeton Developing Markets Securities Fund. We look forward to serving your future investment needs.
This discussion reflects our analysis, opinions and portfolio holdings as of December 31, 2003, the end of the reporting period. The way we implement our main investment strategies and the resulting portfolio holdings may change depending on factors such as market and economic conditions. These opinions may not be relied upon as investment advice or an offer for a particular security. The information is not a complete analysis of every aspect of any market, country, industry, security or the Fund. Statements of fact are from sources considered reliable, but the advisor makes no representation or warranty as to their completeness or accuracy. Although historical performance is no guarantee of future results, these insights may help you understand our investment management philosophy.
Top 10 Equity Holdings
Templeton Developing Markets
Securities Fund
12/31/03
| | |
Company Sector/Industry,
Country | | % of Total Net Assets |
|
| |
Anglo American PLC Metals & Mining,
South Africa | | 3.6% |
| |
SABMiller PLC Beverages, South Africa | | 2.5% |
| |
Citic Pacific Ltd. Industrial Conglomerates, Hong Kong | | 2.1% |
| |
Hyundai Motor Co. Ltd. Automobiles, South Korea | | 2.0% |
| |
China Mobile (Hong Kong) Ltd., fgn. Wireless Telecommunication Services, China | | 2.0% |
| |
Lukoil Holdings, ADR Oil & Gas, Russia | | 1.8% |
| |
Petroleo Brasileiro SA, ADR, pfd. Oil & Gas, Brazil | | 1.7% |
| |
Telefonos de Mexico SA de CV (Telmex), L, ADR Diversified Telecommunication Services, Mexico | | 1.6% |
| |
Banco Bradesco SA, ADR, pfd. Banks, Brazil | | 1.6% |
| |
Kimberly Clark de Mexico SA de CV, A Household Products, Mexico | | 1.6% |
The dollar value, number of shares or principal amount, and complete legal titles of all portfolio holdings are listed in the Fund’s Statement of Investments.
TD-4
PERFORMANCE SUMMARYASOF 12/31/03
Total return of Class 1 shares represents the average annual change in value, assuming reinvestment of dividends and capital gains. Average returns smooth out variations in returns, which can be significant; they are not the same as year-by-year results.
Templeton Developing Markets Securities Fund – Class 1*
Periods ended 12/31/03
| | | | | | |
| | | 1-Year | | 5-Year | | Since
Inception (3/4/96) |
|
| | | |
Average Annual Total Return | | +53.74% | | +8.22% | | -3.07% |
*Performance prior to the 5/1/00 merger reflects the historical performance of Templeton Developing Markets Fund.
Ongoing market volatility can significantly affect short-term performance; recent returns may differ.
Total Return Index Comparison
for Hypothetical $10,000 Investment (3/4/96–12/31/03)
The graph compares the performance of Templeton Developing Markets Securities Fund – Class 1,* the MSCI Emerging Markets Free Index and the S&P/IFCI Composite Index. One cannot invest directly in an index, nor is an index representative of the Fund’s portfolio. Please see Important Notes to Performance Information preceding the Fund Summaries.
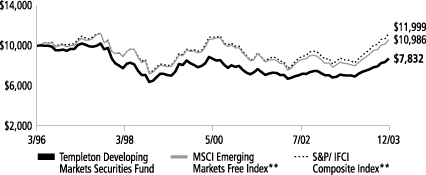
**Source: Standard & Poor’s Micropal. Please see Index Descriptions following the Fund Summaries.
Templeton Developing Markets Securities Fund – Class 1
Performance reflects the Fund’s Class 1 operating expenses, but does not include any contract fees, expenses or sales charges. If they had been included, performance would be lower. These charges
and deductions, particularly for variable life policies, can have a significant effect on contract values and insurance benefits. See the contract prospectus for a complete description of these expenses, including sales charges.
Since markets can go down as well as up, investment return and the value of your principal will fluctuate with market conditions, and you may have a gain or loss when you sell your shares.
TD-5
Past performance does not guarantee future results.
FRANKLIN TEMPLETON VARIABLE INSURANCE PRODUCTS TRUST
TEMPLETON DEVELOPING MARKETS SECURITIES FUND
Financial Highlightsa
| | | | | | | | | | | | | | | | | | | | |
| | | Class 1
| |
| | | Year Ended December 31,
| |
| | | 2003 | | | 2002 | | | 2001 | | | 2000 | | | 1999 | |
| | |
|
|
|
Per share operating performance | | | | | | | | | | | | | | | | | | | | |
(For a share outstanding throughout the year) | | | | | | | | | | | | | | | | | | | | |
Net asset value, beginning of year | | $ | 4.71 | | | $ | 4.78 | | | $ | 5.25 | | | $ | 7.77 | | | $ | 5.13 | |
| | |
|
|
|
Income from investment operations: | | | | | | | | | | | | | | | | | | | | |
Net investment incomeb | | | .13 | | | | .07 | | | | .08 | | | | .07 | | | | .05 | |
Net realized and unrealized gains (losses) | | | 2.38 | | | | (.06 | ) | | | (.50 | ) | | | (2.52 | ) | | | 2.67 | |
| | |
|
|
|
Total from investment operations | | | 2.51 | | | | .01 | | | | (.42 | ) | | | (2.45 | ) | | | 2.72 | |
| | |
|
|
|
Less distributions from net investment income | | | (.08 | ) | | | (.08 | ) | | | (.05 | ) | | | (.07 | ) | | | (.08 | ) |
| | |
|
|
|
Net asset value, end of year | | $ | 7.14 | | | $ | 4.71 | | | $ | 4.78 | | | $ | 5.25 | | | $ | 7.77 | |
| | |
|
|
|
| | | | | |
Total returnc | | | 53.74% | | | | .04% | | | | (8.08)% | | | | (31.76)% | | | | 53.84% | |
Ratios/supplemental data | | | | | | | | | | | | | | | | | | | | |
Net assets, end of year (000’s) | | $ | 359,299 | | | $ | 225,454 | | | $ | 240,289 | | | $ | 301,645 | | | $ | 297,605 | |
Ratios to average net assets: | | | | | | | | | | | | | | | | | | | | |
Expenses | | | 1.55% | | | | 1.58% | | | | 1.57% | | | | 1.56% | | | | 1.50% | |
Net investment income | | | 2.35% | | | | 1.45% | | | | 1.64% | | | | 1.13% | | | | .82% | |
Portfolio turnover rate | | | 46.20% | | | | 57.91% | | | | 78.29% | | | | 89.48% | | | | 60.27% | |
| a | Financial highlights presented reflect historical financial information from Templeton Variable Products Series Fund (TVP)-Templeton Developing Markets Fund as a result of a merger on May 1, 2000. |
| b | Based on average daily shares outstanding. |
| c | Total return does not include any fees, charges or expenses imposed by the variable annuity and life insurance contracts for which the Franklin Templeton Variable Insurance Products Trust serves as an underlying investment vehicle. Total return is not annualized for periods less than one year. |
TD-6
FRANKLIN TEMPLETON VARIABLE INSURANCE PRODUCTS TRUST
TEMPLETON DEVELOPING MARKETS SECURITIES FUND
Financial Highlightsa (continued)
| | | | | | | | | | | | | | | | | | | | |
| | | Class 2
| |
| | | Year Ended December 31,
| |
| | | 2003 | | | 2002 | | | 2001 | | | 2000 | | | 1999 | |
| | |
|
|
|
Per share operating performance | | | | | | | | | | | | | | | | | | | | |
(For a share outstanding throughout the year) | | | | | | | | | | | | | | | | | | | | |
Net asset value, beginning of year | | $ | 4.69 | | | $ | 4.76 | | | $ | 5.22 | | | $ | 7.74 | | | $ | 5.12 | |
| | |
|
|
|
Income from investment operations: | | | | | | | | | | | | | | | | | | | | |
Net investment incomeb | | | .11 | | | | .06 | | | | .07 | | | | .06 | | | | .03 | |
Net realized and unrealized gains (losses) | | | 2.35 | | | | (.06 | ) | | | (.49 | ) | | | (2.53 | ) | | | 2.66 | |
| | |
|
|
|
Total from investment operations | | | 2.46 | | | | — | | | | (.42 | ) | | | (2.47 | ) | | | 2.69 | |
| | |
|
|
|
Less distributions from net investment income | | | (.06 | ) | | | (.07 | ) | | | (.04 | ) | | | (.05 | ) | | | (.07 | ) |
| | |
|
|
|
Net asset value, end of year | | $ | 7.09 | | | $ | 4.69 | | | $ | 4.76 | | | $ | 5.22 | | | $ | 7.74 | |
| | |
|
|
|
| | | | | |
Total returnc | | | 52.99% | | | | (.15)% | | | | (8.08)% | | | | (32.04)% | | | | 53.27% | |
Ratios/supplemental data | | | | | | | | | | | | | | | | | | | | |
Net assets, end of year (000’s) | | $ | 170,953 | | | $ | 80,952 | | | $ | 64,081 | | | $ | 56,617 | | | $ | 49,654 | |
Ratios to average net assets: | | | | | | | | | | | | | | | | | | | | |
Expenses | | | 1.80% | | | | 1.83% | | | | 1.82% | | | | 1.81% | | | | 1.75% | |
Net investment income | | | 2.10% | | | | 1.20% | | | | 1.37% | | | | .88% | | | | .52% | |
Portfolio turnover rate | | | 46.20% | | | | 57.91% | | | | 78.29% | | | | 89.48% | | | | 60.27% | |
| a | Financial highlights presented reflect historical financial information from Templeton Variable Products Series Fund (TVP)-Templeton Developing Markets Fund as a result of a merger on May 1, 2000. |
| b | Based on average daily shares outstanding. |
| c | Total return does not include any fees, charges or expenses imposed by the variable annuity and life insurance contracts for which the Franklin Templeton Variable Insurance Products Trust serves as an underlying investment vehicle. Total return is not annualized for periods less than one year. |
See notes to financial statements.
TD-7
FRANKLIN TEMPLETON VARIABLE INSURANCE PRODUCTS TRUST
TEMPLETON DEVELOPING MARKETS SECURITIES FUND
Statement of Investments, December 31, 2003
| | | | | | | |
| | | INDUSTRY | | SHARES/
RIGHTS/
WARRANTS | | VALUE |
|
| | | | | | | | |
Long Term Investments 94.3% | | | | | | | |
Argentina 1.0% | | | | | | | |
Tenaris SA, ADR | | Energy Equipment & Services | | 152,914 | | $ | 5,095,095 |
| | | | | | |
|
|
Austria 2.8% | | | | | | | |
aBank Austria Creditanstalt, Reg S | | Banks | | 95,500 | | | 4,878,595 |
OMV AG | | Oil & Gas | | 47,065 | | | 7,009,883 |
Wienerberger AG | | Building Products | | 106,392 | | | 2,842,309 |
| | | | | | |
|
|
| | | | | | | | 14,730,787 |
| | | | | | |
|
|
Brazil 7.7% | | | | | | | |
Banco Bradesco SA, ADR, pfd. | | Banks | | 325,181 | | | 8,588,030 |
Centrais Eletricas Brasileiras SA | | Electric Utilities | | 92,373,000 | | | 1,552,891 |
Centrais Eletricas Brasileiras SA | | Electric Utilities | | 159,745,000 | | | 2,685,488 |
Cia Vale do Rio Doce, ADR, pfd., A | | Metals & Mining | | 82,885 | | | 4,269,406 |
aCompanhia Paranaense de Energia-Copel, ADR, pfd. | | Electric Utilities | | 61,700 | | | 294,309 |
Duratex SA, pfd. | | Building Products | | 24,097,583 | | | 693,359 |
Embraer-Empresa Brasileira de Aeronautica SA, ADR | | Aerospace & Defense | | 205,254 | | | 7,190,048 |
Petroleo Brasileiro SA, ADR, pfd. | | Oil & Gas | | 338,985 | | | 9,037,340 |
Souza Cruz SA | | Tobacco | | 297,200 | | | 3,118,282 |
Unibanco Uniao de Bancos Brasileiros SA, GDR | | Banks | | 135,495 | | | 3,380,600 |
| | | | | | |
|
|
| | | | | | | | 40,809,753 |
| | | | | | |
|
|
China 9.8% | | | | | | | |
Beijing Enterprises Holdings Ltd. | | Industrial Conglomerates | | 1,370,000 | | | 1,605,827 |
China Mobile (Hong Kong) Ltd., fgn. | | Wireless Telecommunication Services | | 3,378,000 | | | 10,377,312 |
China Petroleum & Chemical Corp., H | | Oil & Gas | | 17,520,000 | | | 7,841,980 |
China Resources Enterprise Ltd. | | Distributors | | 4,248,000 | | | 4,815,086 |
China Telecom Corp. Ltd., H | | Diversified Telecommunication Services | | 15,932,000 | | | 6,566,850 |
China Travel International Investment Hong Kong Ltd. | | Hotels Restaurants & Leisure | | 12,082,000 | | | 2,287,668 |
Cofco International Ltd. | | Food Products | | 1,700,000 | | | 1,094,853 |
Huadian Power International Corp Ltd. | | Electric Utilities | | 5,670,000 | | | 2,373,577 |
PetroChina Co. Ltd., H | | Oil & Gas | | 12,300,000 | | | 7,050,209 |
Shanghai Industrial Holdings Ltd. | | Industrial Conglomerates | | 1,829,000 | | | 4,181,662 |
TCL International Holdings Inc. | | Household Durables | | 7,194,000 | | | 3,173,715 |
Travelsky Technology Ltd., H | | IT Consulting & Services | | 802,000 | | | 862,577 |
| | | | | | |
|
|
| | | | | | | | 52,231,316 |
| | | | | | |
|
|
Croatia .7% | | | | | | | |
Pliva D D, GDR, Reg S | | Pharmaceuticals | | 218,000 | | | 3,553,400 |
| | | | | | |
|
|
Czech Republic .6% | | | | | | | |
Cesky Telecom AS | | Diversified Telecommunication Services | | 117,990 | | | 1,341,795 |
CEZ AS | | Electric Utilities | | 350,850 | | | 1,999,052 |
| | | | | | |
|
|
| | | | | | | | 3,340,847 |
| | | | | | |
|
|
Denmark .8% | | | | | | | |
Carlsberg AS, B | | Beverages | | 98,060 | | | 4,518,320 |
| | | | | | |
|
|
Egypt .2% | | | | | | | |
Commercial International Bank Ltd. | | Banks | | 311,380 | | | 1,111,170 |
| | | | | | |
|
|
Greece 1.3% | | | | | | | |
Coca-Cola Hellenic Bottling Co., SA | | Beverages | | 132,757 | | | 2,766,329 |
Hellenic Telecommunications Organization SA (OTE) | | Diversified Telecommunication Services | | 315,390 | | | 4,169,131 |
| | | | | | |
|
|
| | | | | | | | 6,935,460 |
| | | | | | |
|
|
TD-8
FRANKLIN TEMPLETON VARIABLE INSURANCE PRODUCTS TRUST
TEMPLETON DEVELOPING MARKETS SECURITIES FUND
Statement of Investments, December 31, 2003 (cont.)
| | | | | | | |
| | | INDUSTRY | | SHARES/
RIGHTS/
WARRANTS | | VALUE |
|
| | | | | | | | |
Long Term Investments (cont.) | | | | | | | |
Hong Kong 5.7% | | | | | | | |
Cheung Kong Holdings Ltd. | | Real Estate | | 528,000 | | $ | 4,199,598 |
Cheung Kong Infrastructure Holdings Ltd. | | Construction Materials | | 580,000 | | | 1,299,912 |
Citic Pacific Ltd. | | Industrial Conglomerates | | 4,360,000 | | | 11,119,584 |
Dairy Farm International Holdings Ltd. | | Food & Drug Retailing | | 1,655,833 | | | 2,773,520 |
Guoco Group Ltd. | | Diversified Financials | | 130,000 | | | 954,454 |
Hang Lung Group Ltd. | | Real Estate | | 1,279,000 | | | 1,598,009 |
Henderson Investment Ltd. | | Real Estate | | 1,344,000 | | | 1,549,384 |
Hong Kong Land Holdings Ltd. | | Real Estate | | 675,000 | | | 1,147,500 |
aHopewell Highway Infrastructure Ltd., wts., 08/05/06 | | Transportation Infrastructure | | 30,000 | | | 5,835 |
Hopewell Holdings Ltd. | | Transportation Infrastructure | | 282,000 | | | 434,064 |
HSBC Holdings PLC | | Banks | | 38,800 | | | 612,216 |
MTR Corp. Ltd. | | Road & Rail | | 1,558,707 | | | 2,057,904 |
Tack Fat Group International Ltd. | | Specialty Retail | | 5,042,000 | | | 513,058 |
Tingyi (Cayman Islands) Holding Corp. | | Food Products | | 8,138,000 | | | 1,907,770 |
VTech Holdings Ltd. | | Communications Equipment | | 32,000 | | | 45,546 |
| | | | | | |
|
|
| | | | | | | | 30,218,354 |
| | | | | | |
|
|
Hungary 2.7% | | | | | | | |
Egis RT | | Pharmaceuticals | | 50,884 | | | 2,070,522 |
Gedeon Richter Ltd. | | Pharmaceuticals | | 40,592 | | | 4,805,479 |
Matav RT | | Diversified Telecommunication Services | | 493,000 | | | 1,877,718 |
MOL Magyar Olaj-Es Gazipari RT | | Oil & Gas | | 188,140 | | | 5,728,102 |
| | | | | | |
|
|
| | | | | | | | 14,481,821 |
| | | | | | |
|
|
India 3.9% | | | | | | | |
Container Corp. of India Ltd. | | Road & Rail | | 34,944 | | | 509,666 |
HCL Technologies Ltd. | | IT Consulting & Services | | 131,500 | | | 883,104 |
Hero Honda Motors Ltd. | | Automobiles | | 261,869 | | | 2,576,217 |
Hindustan Petroleum Corp. Ltd. | | Oil & Gas | | 362,004 | | | 3,471,271 |
aIndraprastha Gas Ltd. | | Gas Utilities | | 125,000 | | | 406,438 |
ITC Ltd. | | Tobacco | | 48,300 | | | 1,042,274 |
Mahanagar Telephone Nigam Ltd. | | Diversified Telecommunication Services | | 1,468,285 | | | 4,431,405 |
aMaruti Udyog Ltd. | | Automobiles | | 249,000 | | | 2,053,670 |
Nestle India Ltd. | | Food Products | | 12,000 | | | 181,348 |
Satyam Computers Services Ltd. | | IT Consulting & Services | | 459,421 | | | 3,699,031 |
Union Bank of India Ltd. | | Banks | | 881,400 | | | 990,066 |
Videsh Sanchar Nigam Ltd. | | Diversified Telecommunication Services | | 203,030 | | | 656,371 |
| | | | | | |
|
|
| | | | | | | | 20,900,861 |
| | | | | | |
|
|
Indonesia 2.2% | | | | | | | |
PT Gudang Garam TBK | | Tobacco | | 1,672,000 | | | 2,699,816 |
PT Indosat (Persero) TBK | | Diversified Telecommunication Services | | 3,410,500 | | | 6,073,909 |
aPT Perusahaan Gas Negara, 144A | | Oil & Gas | | 1,731,000 | | | 318,557 |
PT Telekomunikasi Indonesia TBK, B | | Diversified Telecommunication Services | | 3,194,645 | | | 2,560,268 |
| | | | | | |
|
|
| | | | | | | | 11,652,550 |
| | | | | | |
|
|
Israel | | | | | | | |
Elbit Systems Ltd. | | Aerospace & Defense | | 12,476 | | | 224,540 |
| | | | | | |
|
|
TD-9
FRANKLIN TEMPLETON VARIABLE INSURANCE PRODUCTS TRUST
TEMPLETON DEVELOPING MARKETS SECURITIES FUND
Statement of Investments, December 31, 2003 (cont.)
| | | | | | | |
| | | INDUSTRY | | SHARES/
RIGHTS/
WARRANTS | | VALUE |
|
| | | | | | | | |
Long Term Investments (cont.) | | | | | | | |
Malaysia .4% | | | | | | | |
Tanjong PLC | | Hotels Restaurants & Leisure | | 14,000 | | $ | 39,789 |
YTL Power International Bhd. | | Electric Utilities | | 2,259,100 | | | 1,997,520 |
| | | | | | |
|
|
| | | | | | | | 2,037,309 |
| | | | | | |
|
|
Mexico 5.1% | | | | | | | |
Alfa SA | | Industrial Conglomerates | | 7,000 | | | 20,993 |
Embotelladoras Arca SA | | Food & Drug Retailing | | 132,000 | | | 252,553 |
Embotelladoras Arca SA, 144A | | Food & Drug Retailing | | 294,833 | | | 564,098 |
Fomento Economico Mexicano SA de CV Femsa, ADR | | Beverages | | 86,020 | | | 3,172,417 |
Grupo Bimbo SA de CV, A | | Food Products | | 496,100 | | | 931,519 |
Grupo Carso SA de CV | | Industrial Conglomerates | | 703,500 | | | 2,472,869 |
Grupo Continental SA | | Beverages | | 494,359 | | | 835,865 |
Grupo Televisa SA, ADR | | Media | | 36,000 | | | 1,434,960 |
Kimberly Clark de Mexico SA de CV, A | | Household Products | | 3,273,400 | | | 8,389,412 |
Telefonos de Mexico SA de CV (Telmex), L, ADR | | Diversified Telecommunication Services | | 263,882 | | | 8,716,022 |
| | | | | | |
|
|
| | | | | | | | 26,790,708 |
| | | | | | |
|
|
Peru | | | | | | | |
Credicorp Ltd. | | Banks | | 5,100 | | | 68,085 |
| | | | | | |
|
|
Philippines .8% | | | | | | | |
San Miguel Corp., B | | Beverages | | 3,892,630 | | | 4,487,182 |
| | | | | | |
|
|
Poland 2.4% | | | | | | | |
aBRE Bank SA | | Banks | | 34,625 | | | 855,704 |
Polski Koncern Naftowy Orlen SA | | Oil & Gas | | 887,238 | | | 5,926,140 |
Telekomunikacja Polska SA | | Diversified Telecommunication Services | | 1,498,800 | | | 6,066,638 |
| | | | | | |
|
|
| | | | | | | | 12,848,482 |
| | | | | | |
|
|
Russia 1.9% | | | | | | | |
Aeroflot | | Airlines | | 25,100 | | | 17,319 |
bLukoil Holdings, ADR | | Oil & Gas | | 102,807 | | | 9,569,276 |
Yuzhnaya Telecommunication Co. | | Diversified Telecommunication Services | | 2,913,300 | | | 282,590 |
| | | | | | |
|
|
| | | | | | | | 9,869,185 |
| | | | | | |
|
|
Singapore 6.4% | | | | | | | |
Comfortdelgro Corp. Ltd. | | Road & Rail | | 4,474,000 | | | 2,147,036 |
DBS Group Holdings Ltd. | | Banks | | 430,000 | | | 3,721,957 |
Fraser & Neave Ltd. | | Beverages | | 1,005,681 | | | 7,461,332 |
Keppel Corp. Ltd. | | Industrial Conglomerates | | 2,032,600 | | | 7,300,748 |
Singapore Airlines Ltd. | | Airlines | | 702,000 | | | 4,629,571 |
Singapore Press Holdings Ltd. | | Media | | 54,000 | | | 600,954 |
Singapore Technologies Engineering Ltd. | | Aerospace & Defense | | 2,069,000 | | | 2,485,285 |
Singapore Telecommunications Ltd. | | Diversified Telecommunication Services | | 4,819,000 | | | 5,561,585 |
| | | | | | |
|
|
| | | | | | | | 33,908,468 |
| | | | | | |
|
|
South Africa 11.1% | | | | | | | |
Anglo American PLC | | Metals & Mining | | 893,410 | | | 19,139,720 |
Barloworld Ltd. | | Industrial Conglomerates | | 202,350 | | | 2,126,570 |
BHP Billiton PLC | | Metals & Mining | | 286,200 | | | 2,486,831 |
Imperial Holdings Ltd. | | Air Freight & Couriers | | 289,177 | | | 2,902,601 |
Nampak Ltd. | | Containers & Packaging | | 291,200 | | | 567,131 |
TD-10
FRANKLIN TEMPLETON VARIABLE INSURANCE PRODUCTS TRUST
TEMPLETON DEVELOPING MARKETS SECURITIES FUND
Statement of Investments, December 31, 2003 (cont.)
| | | | | | | |
| | | INDUSTRY | | SHARES/
RIGHTS/
WARRANTS | | VALUE |
|
| | | | | | | | |
Long Term Investments (cont.) | | | | | | | |
South Africa (cont.) | | | | | | | |
Nedcor Ltd. | | Banks | | 92,000 | | $ | 854,945 |
Old Mutual PLC | | Insurance | | 2,773,960 | | | 4,568,560 |
Remgro Ltd. | | Industrial Conglomerates | | 680,270 | | | 7,195,065 |
SABMiller PLC | | Beverages | | 1,304,424 | | | 13,290,476 |
Sasol Ltd. | | Oil & Gas | | 410,087 | | | 5,836,444 |
| | | | | | |
|
|
| | | | | | | | 58,968,343 |
| | | | | | |
|
|
South Korea 11.7% | | | | | | | |
CJ Corp. | | Food Products | | 67,200 | | | 3,502,409 |
Dong-A Pharmaceutical Co. Ltd. | | Pharmaceuticals | | 55,633 | | | 866,129 |
Hite Brewery Co. Ltd. | | Beverages | | 49,490 | | | 3,630,236 |
Hyundai Development Co. | | Construction & Engineering | | 463,020 | | | 4,799,242 |
Hyundai Motor Co. Ltd. | | Automobiles | | 247,460 | | | 10,488,233 |
Kangwon Land Inc. | | Hotels Restaurants & Leisure | | 574,055 | | | 6,841,444 |
Korea Electric Power Corp. | | Electric Utilities | | 306,189 | | | 5,499,324 |
Korea Gas Corp. | | Gas Utilities | | 92,390 | | | 1,919,138 |
KT Corp. | | Diversified Telecommunication Services | | 71,340 | | | 2,670,385 |
KT&G Corp. | | Tobacco | | 68,990 | | | 1,198,567 |
LG Card Co. Ltd. | | Consumer Finance | | 299,013 | | | 764,158 |
LG Chem Ltd. | | Chemicals | | 440 | | | 20,311 |
LG Home Shopping Inc. | | Internet & Catalog Retail | | 12,830 | | | 648,230 |
LG Household & Health Care Ltd. | | Household Products | | 88,940 | | | 2,321,472 |
LG International Corp. | | Trading Companies & Distributors | | 75,000 | | | 503,567 |
Poongsan Corp. | | Metals & Mining | | 28,970 | | | 306,355 |
POSCO | | Metals & Mining | | 16,330 | | | 2,233,982 |
Samsung Corp. | | Trading Companies & Distributors | | 268,540 | | | 2,231,260 |
Samsung Fine Chemicals | | Chemicals | | 221,490 | | | 3,039,330 |
Samsung Heavy Industries Co. Ltd. | | Machinery | | 779,620 | | | 4,311,956 |
SK Corp. | | Oil & Gas | | 183,880 | | | 4,228,546 |
| | | | | | |
|
|
| | | | | | | | 62,024,274 |
| | | | | | |
|
|
Taiwan 9.6% | | | | | | | |
Acer Inc. | | Computers & Peripherals | | 1,675,000 | | | 2,491,532 |
Amtran Technology Co. Ltd. | | Computers & Peripherals | | 575,000 | | | 484,389 |
Cheng Shin Rubber Industry Co. Ltd. | | Auto Components | | 327,000 | | | 417,057 |
Chinatrust Financial Holding Co. Ltd. | | Banks | | 2,438,980 | | | 2,449,756 |
Chunghwa Telcom Co. Ltd. | | Diversified Telecommunication Services | | 1,570,000 | | | 2,279,853 |
D-Link Corp. | | Communications Equipment | | 3,870,000 | | | 5,163,800 |
Delta Electronics Inc. | | Electronic Equipment & Instruments | | 3,453,255 | | | 4,424,642 |
Elan Microelectronics Corp. | | Software | | 2,555,000 | | | 2,295,361 |
Elite Semiconductor Memory Technology Inc. | | Electrical Equipment | | 759,400 | | | 1,465,116 |
Fubon Financial Holding Co. Ltd. | | Diversified Financials | | 1,092,000 | | | 1,045,361 |
Lite-on Technology Corp. | | Computers & Peripherals | | 4,404,000 | | | 4,669,926 |
Mega Financial Holdings Co. Ltd. | | Banks | | 4,070,503 | | | 2,445,899 |
Micro-Star International Co. Ltd. | | Computers & Peripherals | | 104,000 | | | 153,166 |
Phoenixtec Power Co. Ltd. | | Electrical Equipment | | 1,487,270 | | | 1,743,545 |
President Chain Store Corp. | | Food & Drug Retailing | | 1,276,000 | | | 1,954,403 |
Sunplus Technology Co. Ltd. | | Semiconductors & Semiconductor Equipment | | 3,426,000 | | | 6,407,982 |
Taiwan Cellular Corp. | | Wireless Telecommunication Services | | 5,285,302 | | | 4,592,530 |
Taiwan Glass Industrial Corp. | | Building Products | | 235,000 | | | 177,894 |
TD-11
FRANKLIN TEMPLETON VARIABLE INSURANCE PRODUCTS TRUST
TEMPLETON DEVELOPING MARKETS SECURITIES FUND
Statement of Investments, December 31, 2003 (cont.)
| | | | | | | | |
| | | INDUSTRY | | SHARES/
RIGHTS/
WARRANTS | | VALUE |
|
| | | | | | | | | |
Long Term Investments (cont.) | | | | | | | | |
Taiwan (cont.) | | �� | | | | | | |
aTatung Co. Ltd. | | Industrial Conglomerates | | | 4,438,000 | | $ | 1,124,206 |
Tsann Kuen Enterprise Co. Ltd. | | Household Durables | | | 1,008,000 | | | 1,466,722 |
UNI-President Enterprises Corp. | | Food Products | | | 3,218,600 | | | 1,322,518 |
Yuanta Core Pacific Securities Co. | | Diversified Financials | | | 3,488,212 | | | 2,085,735 |
| | | | | | | |
|
|
| | | | | | | | | 50,661,393 |
| | | | | | | |
|
|
Thailand 2.1% | | | | | | | | |
Delta Electronics (Thailand) Public Co. Ltd. | | Electronic Equipment & Instruments | | | 1,295,000 | | | 879,185 |
Hana Microelectronics Co. Ltd., fgn. | | Electronic Equipment & Instruments | | | 283,000 | | | 892,801 |
Krung Thai Bank Public Co. Ltd., fgn. | | Banks | | | 1,200,000 | | | 372,515 |
National Finance Public Co. Ltd., fgn. | | Consumer Finance | | | 1,023,700 | | | 431,467 |
PTT Exploration & Production Public Co. Ltd., fgn. | | Oil & Gas | | | 1,004,200 | | | 6,792,242 |
Shin Corporation Public Co. Ltd., fgn. | | Wireless Telecommunication Services | | | 260,000 | | | 255,915 |
Siam City Cement Public Co. Ltd., fgn. | | Construction Materials | | | 58,000 | | | 333,750 |
Siam Makro Public Co. Ltd., fgn. | | Food & Drug Retailing | | | 96,000 | | | 111,452 |
aTelecomasia Corp. Public Co. Ltd., purch. rts. | | Diversified Telecommunication Services | | | 344,616 | | | — |
Thai Airways International Public Co. Ltd., fgn. | | Airlines | | | 401,600 | | | 463,706 |
aThai Military Bank Public Co. Ltd., fgn. | | Banks | | | 1,680,000 | | | 290,441 |
Thai Union Frozen Products Ltd., fgn. | | Food Products | | | 110,000 | | | 88,838 |
| | | | | | | |
|
|
| | | | | | | | | 10,912,312 |
| | | | | | | |
|
|
Turkey 3.4% | | | | | | | | |
Akbank | | Banks | | | 497,801,261 | | | 2,604,158 |
Arcelik AS, Br. | | Household Durables | | | 1,103,826,400 | | | 6,128,003 |
Migros Turk T.A.S. | | Food & Drug Retailing | | | 178,149,000 | | | 2,548,608 |
Tupras-Turkiye Petrol Rafineleri AS | | Oil & Gas | | | 781,213,000 | | | 6,505,473 |
| | | | | | | |
|
|
| | | | | | | | | 17,786,242 |
| | | | | | | |
|
|
Total Long Term Investments
(Cost $375,486,632) | | | | | | | | 500,166,257 |
| | | | | | | |
|
|
| | | | | PRINCIPAL
AMOUNT | | |
|
Short Term Investment (Cost $29,789,752) 5.6% | | | | | | | | |
U.S. Treasury Bill, .845% to .92%, 1/2/04 - 3/25/04 | | | | $ | 29,835,000 | | | 29,793,685 |
| | | | | | | |
|
|
Total Investments (Cost $405,276,384) 99.9% | | | | | | | | 529,959,942 |
Other Assets, less Liabilities .1% | | | | | | | | 292,476 |
| | | | | | | |
|
|
Net Assets 100.0% | | | | | | | $ | 530,252,418 |
| | | | | | | |
|
|
| b | See Note 6 regarding other considerations. |
TD-12
FRANKLIN TEMPLETON VARIABLE INSURANCE PRODUCTS TRUST
TEMPLETON DEVELOPING MARKETS SECURITIES FUND
Financial Statements
Statement of Assets and Liabilities
December 31, 2003
| | | |
Assets: | | | |
Investments in securities: | | | |
Cost | | $ | 405,276,384 |
| | |
|
|
Value | | | 529,959,942 |
Foreign currency, at value (cost $1,032,821) | | | 1,035,766 |
Receivables: | | | |
Investment securities sold | | | 1,610,393 |
Capital shares sold | | | 905,555 |
Dividends and interest | | | 1,117,412 |
| | |
|
|
Total assets | | | 534,629,068 |
| | |
|
|
Liabilities: | | | |
Payables: | | | |
Investment securities purchased | | | 1,194,914 |
Capital shares redeemed | | | 400,623 |
Affiliates | | | 654,802 |
Deferred tax liability (Note 1f) | | | 1,922,971 |
Funds advanced by custodian | | | 4,457 |
Other liabilities | | | 198,883 |
| | |
|
|
Total liabilities | | | 4,376,650 |
| | |
|
|
Net assets, at value | | $ | 530,252,418 |
| | |
|
|
Net assets consist of: | | | |
Undistributed net investment income | | $ | 5,951,933 |
Net unrealized appreciation (depreciation) | | | 122,749,174 |
Accumulated net realized gain (loss) | | | (199,577,235) |
Capital shares | | | 601,128,546 |
| | |
|
|
Net assets, at value | | $ | 530,252,418 |
| | |
|
|
Class 1: | | | |
Net assets, at value | | $ | 359,299,298 |
| | |
|
|
Shares outstanding | | | 50,348,005 |
| | |
|
|
Net asset value and offering price per share | | $ | 7.14 |
| | |
|
|
Class 2: | | | |
Net assets, at value | | $ | 170,953,120 |
| | |
|
|
Shares outstanding | | | 24,101,077 |
| | |
|
|
Net asset value and offering price per share | | $ | 7.09 |
| | |
|
|
See notes to financial statements.
TD-13
FRANKLIN TEMPLETON VARIABLE INSURANCE PRODUCTS TRUST
TEMPLETON DEVELOPING MARKETS SECURITIES FUND
Financial Statements (continued)
Statement of Operations
for the year ended December 31, 2003
| | | | |
Investment income: (net of foreign taxes and fees of $1,154,374) | | | | |
Dividends | | $ | 14,244,030 | |
Interest | | | 93,559 | |
| | |
|
|
|
Total investment income | | | 14,337,589 | |
| | |
|
|
|
Expenses: | | | | |
Management fees (Note 3) | | | 4,585,327 | |
Administrative fees (Note 3) | | | 525,214 | |
Distribution fees – Class 2 (Note 3) | | | 257,460 | |
Transfer agent fees | | | 2,054 | |
Custodian fees | | | 373,147 | |
Reports to shareholders | | | 148,264 | |
Professional fees | | | 35,822 | |
Trustees’ fees and expenses | | | 3,447 | |
Other | | | 23,250 | |
| | |
|
|
|
Total expenses | | | 5,953,985 | |
| | |
|
|
|
Net investment income | | | 8,383,604 | |
| | |
|
|
|
Realized and unrealized gains (losses): | | | | |
Net realized gain (loss) from: | | | | |
Investments (net of foreign taxes of $468,507) (Note 1f) | | | 19,346,500 | |
Foreign currency transactions | | | (510,671 | ) |
| | |
|
|
|
Net realized gain (loss) | | | 18,835,829 | |
Net unrealized appreciation (depreciation) on: | | | | |
Investments | | | 143,243,426 | |
Translation of assets and liabilities denominated in foreign currencies | | | (14,496 | ) |
Deferred taxes (Note 1f) | | | (1,914,669 | ) |
| | |
|
|
|
Net unrealized appreciation (depreciation) | | | 141,314,261 | |
| | |
|
|
|
Net realized and unrealized gain (loss) | | | 160,150,090 | |
| | |
|
|
|
Net increase (decrease) in net assets resulting from operations | | $ | 168,533,694 | |
| | |
|
|
|
See notes to financial statements.
TD-14
FRANKLIN TEMPLETON VARIABLE INSURANCE PRODUCTS TRUST
TEMPLETON DEVELOPING MARKETS SECURITIES FUND
Financial Statements (continued)
Statements of Changes in Net Assets
For the years ended December 31, 2003 and 2002
| | | | | | | | |
| | | 2003 | | | 2002 | |
| | |
| |
Increase (decrease) in net assets: | | | | | | | | |
Operations: | | | | | | | | |
Net investment income | | $ | 8,383,604 | | | $ | 4,455,928 | |
Net realized gain (loss) from investments and foreign currency transactions | | | 18,835,829 | | | | (9,268,738 | ) |
Net unrealized appreciation (depreciation) on investments and translation of assets and liabilities denominated in foreign currencies | | | 141,314,261 | | | | 6,877,309 | |
| | |
|
|
| |
|
|
|
Net increase (decrease) in net assets resulting from operations | | | 168,533,694 | | | | 2,064,499 | |
Distributions to shareholders from: | | | | | | | | |
Net investment income: | | | | | | | | |
Class 1 | | | (3,521,009 | ) | | | (3,878,945 | ) |
Class 2 | | | (1,068,523 | ) | | | (1,149,535 | ) |
| | |
|
|
| |
|
|
|
Total distributions to shareholders | | | (4,589,532 | ) | | | (5,028,480 | ) |
Capital share transactions: (Note 2) | | | | | | | | |
Class 1 | | | 18,051,739 | | | | (12,115,583 | ) |
Class 2 | | | 41,851,167 | | | | 17,115,195 | |
| | |
|
|
| |
|
|
|
Total capital share transactions | | | 59,902,906 | | | | 4,999,612 | |
Net increase (decrease) in net assets | | | 223,847,068 | | | | 2,035,631 | |
Net assets: | | | | | | | | |
Beginning of year | | | 306,405,350 | | | | 304,369,719 | |
| | |
|
|
| |
|
|
|
End of year | | $ | 530,252,418 | | | $ | 306,405,350 | |
| | |
| |
Undistributed net investment income included in net assets: | | | | | | | | |
End of year | | $ | 5,951,933 | | | $ | 3,131,753 | |
| | |
|
|
| |
|
|
|
See notes to financial statements.
TD-15
FRANKLIN TEMPLETON VARIABLE INSURANCE PRODUCTS TRUST
TEMPLETON DEVELOPING MARKETS SECURITIES FUND
Notes to Financial Statements
1. ORGANIZATION AND SIGNIFICANT ACCOUNTING POLICIES
Franklin Templeton Variable Insurance Products Trust (the Trust) is registered under the Investment Company Act of 1940 as an open-end investment company, consisting of twenty-two separate series (the Funds). The Templeton Developing Markets Securities Fund (the Fund) included in this report is diversified. Shares of the Fund are sold only to insurance company separate accounts to fund the benefits of variable life insurance policies or variable annuity contracts. The Fund’s investment objective is capital growth.
The following summarizes the Fund’s significant accounting policies.
a. Security Valuation
Securities listed or traded on a recognized national exchange or NASDAQ are valued at the last reported sales price. Over-the-counter securities and listed securities for which no sale is reported are valued within the range of the latest quoted bid and asked prices. Foreign securities are valued at the close of trading of the foreign exchange or the NYSE, whichever is earlier. If events occur that materially affect the values of securities after the prices or foreign exchange rates are determined, or if market quotations are not readily available, the securities will be valued at fair value as determined following procedures approved by the Board of Trustees.
b. Foreign Currency Translation
Portfolio securities and other assets and liabilities denominated in foreign currencies are translated into U.S. dollars based on the exchange rate of such currencies against U.S. dollars on the date of valuation. Purchases and sales of securities and income items denominated in foreign currencies are translated into U.S. dollars at the exchange rate in effect on the transaction date.
The Fund does not separately report the effect of changes in foreign exchange rates from changes in market prices on securities held. Such changes are included in net realized and unrealized gain or loss from investments.
Realized foreign exchange gains or losses arise from sales of foreign currencies, currency gains or losses realized between the trade and settlement dates on securities transactions and the difference between the recorded amounts of dividends, interest, and foreign withholding taxes and the U.S. dollar equivalent of the amounts actually received or paid. Net unrealized foreign exchange gains and losses arise from changes in foreign exchange rates on foreign denominated assets and liabilities other than investments in securities held at the end of the reporting period.
c. Foreign Currency Contracts
When the Fund purchases or sells foreign securities it may enter into foreign exchange contracts to minimize foreign exchange risk from the trade date to the settlement date of the transactions. A foreign exchange contract is an agreement between two parties to exchange different currencies at an agreed upon exchange rate on a specified date. Realized and unrealized gains and losses are included in the Statement of Operations.
The risks of these contracts include movement in the values of the foreign currencies relative to the U.S. dollar and the possible inability of the counterparties to fulfill their obligations under the contracts.
d. Income Taxes
No provision has been made for income taxes because the Fund’s policy is to qualify as a regulated investment company under the Internal Revenue Code and to distribute substantially all of its taxable income.
TD-16
FRANKLIN TEMPLETON VARIABLE INSURANCE PRODUCTS TRUST
TEMPLETON DEVELOPING MARKETS SECURITIES FUND
Notes to Financial Statements (continued)
1. ORGANIZATION AND SIGNIFICANT ACCOUNTING POLICIES (cont.)
e. Security Transactions, Investment Income, Expenses and Distributions
Security transactions are accounted for on trade date. Realized gains and losses on security transactions are determined on a specific identification basis. Certain income from foreign securities is recorded as soon as information is available to the Fund. Interest income and estimated expenses are accrued daily. Dividend income and distributions to shareholders are recorded on the ex-dividend date.
Common expenses incurred by the Trust are allocated among the Funds based on the ratio of net assets of each fund to the combined net assets. Other expenses are charged to each fund on a specific identification basis.
Realized and unrealized gains and losses and net investment income, other than class specific expenses, are allocated daily to each class of shares based upon the relative proportion of net assets of each class.
f. Deferred Taxes
The Fund is subject to a tax imposed on net realized gains of securities of certain foreign countries. The Fund records an estimated deferred tax liability for net unrealized gains on these securities as reflected in the accompanying financial statements.
g. Accounting Estimates
The preparation of financial statements in accordance with accounting principles generally accepted in the United States of America requires management to make estimates and assumptions that affect the reported amounts of assets and liabilities at the date of the financial statements and the amounts of income and expenses during the reporting period. Actual results could differ from those estimates.
h. Guarantees and Indemnifications
Under the Trust’s organizational documents, its officers and trustees are indemnified against certain liability arising out of the performance of their duties to the Trust. Additionally, in the normal course of business, the Trust enters into contracts with service providers that contain general indemnification clauses. The Trust’s maximum exposure under these arrangements is unknown as this would involve future claims that may be made against the Trust that have not yet occurred. However, based on experience, the Trust expects the risk of loss to be remote.
TD-17
FRANKLIN TEMPLETON VARIABLE INSURANCE PRODUCTS TRUST
TEMPLETON DEVELOPING MARKETS SECURITIES FUND
Notes to Financial Statements (continued)
2. SHARES OF BENEFICIAL INTEREST
The Fund offers two classes of shares: Class 1 and Class 2. Each class of shares differs by its distribution fees, voting rights on matters affecting a single class, and its exchange privilege.
At December 31, 2003, there were an unlimited number of shares authorized ($.01 par value). Transactions in the Fund’s shares were as follows:
| | | | | | | | | | | | | | |
| | | Year Ended December 31,
| |
| | | 2003
| | | 2002
| |
| Class 1 Shares: | | Shares
| | | Amount
| | | Shares
| | | Amount
| |
Shares sold | | 10,436,573 | | | $ | 60,506,599 | | | 20,100,040 | | | $ | 96,134,388 | |
Shares issued in reinvestment of distributions | | 652,039 | | | | 3,521,009 | | | 751,734 | | | | 3,878,945 | |
Shares redeemed | | (8,573,395 | ) | | | (45,975,869 | ) | | (23,322,593 | ) | | | (112,128,916 | ) |
| | |
| |
Net increase (decrease) | | 2,515,217 | | | $ | 18,051,739 | | | (2,470,819 | ) | | $ | (12,115,583 | ) |
| | |
| |
| Class 2 Shares: | | | | | | | | | | | | |
Shares sold | | 30,181,277 | | | $ | 163,641,071 | | | 65,809,894 | | | $ | 323,925,644 | |
Shares issued in reinvestment of distributions | | 198,398 | | | | 1,068,523 | | | 223,645 | | | | 1,149,535 | |
Shares redeemed | | (23,541,038 | ) | | | (122,858,427 | ) | | (62,244,002 | ) | | | (307,959,984 | ) |
| | |
| |
Net increase (decrease) | | 6,838,637 | | | $ | 41,851,167 | | | 3,789,537 | | | $ | 17,115,195 | |
| | |
| |
3. TRANSACTIONS WITH AFFILIATES
Certain officers and trustees of the Fund are also officers and/or directors of the following entities:
| | |
| Entity | | Affiliation |
|
Franklin Templeton Services LLC (FT Services) | | Administrative manager |
Templeton Asset Management Ltd. (TAML) | | Investment manager |
Franklin/Templeton Distributors Inc. (Distributors) | | Principal underwriter |
Franklin/Templeton Investor Services LLC (Investor Services) | | Transfer agent |
The Fund pays an investment management fee to TAML of 1.25% per year of the average daily net assets of the fund.
The Fund pays an administrative fee to FT Services based on the average daily net assets of the Fund as follows:
| | |
| Annualized Fee Rate | | Net Assets |
|
.15% | | First $200 million |
.135% | | Over $200 million, up to and including $700 million |
.10% | | Over $700 million, up to and including $1.2 billion |
Fees are further reduced on net assets over $1.2 billion.
The Fund reimburses Distributors up to .25% per year of its average daily net assets of Class 2, for costs incurred in marketing the Fund’s shares.
Investor Services, under terms of an agreement, performs shareholder servicing for the Fund and is not paid by the Fund.
TD-18
FRANKLIN TEMPLETON VARIABLE INSURANCE PRODUCTS TRUST
TEMPLETON DEVELOPING MARKETS SECURITIES FUND
Notes to Financial Statements (continued)
4. INCOME TAXES
At December 31, 2003, the Fund had tax basis capital losses of $197,860,620, which may be carried over to offset future capital gains. Such losses expire as follows:
| | | |
Capital loss carryovers expiring in: | | | |
2006 | | $ | 19,633,396 |
2007 | | | 91,657,992 |
2009 | | | 62,323,035 |
2010 | | | 24,246,197 |
| | |
|
| | | $ | 197,860,620 |
| | |
|
At December 31, 2003, the Fund had deferred currency losses occurring subsequent to October 31, 2003 of $115,389. For tax purposes, such losses will be reflected in the year ending December 31, 2004.
Net investment income differs for financial statement and tax purposes primarily due to differing treatments of foreign currency transactions and passive foreign investment company shares.
Net realized gains and losses differ for financial statement and tax purposes primarily due to differing treatments of wash sales, foreign currency transactions, and passive foreign investment company shares.
The tax character of distributions paid during the years ended December 31, 2003 and 2002, was as follows:
| | | | | | |
| | | 2003
| | 2002
|
Distributions paid from: | | | | | | |
Ordinary income | | $ | 4,589,532 | | $ | 5,028,480 |
Long term capital gain | | | — | | | — |
| | |
|
| | | $ | 4,589,532 | | $ | 5,028,480 |
| | |
|
At December 31, 2003, the cost of investments, net unrealized appreciation (depreciation), undistributed ordinary income and undistributed long term capital gains for income tax purposes were as follows:
| | | | |
Cost of investments | | $ | 411,565,787 | |
| | |
| |
Unrealized appreciation | | $ | 128,486,746 | |
Unrealized depreciation | | | (10,092,591 | ) |
| | |
| |
Net unrealized appreciation (depreciation) | | $ | 118,394,155 | |
| | |
| |
Undistributed ordinary income | | $ | 10,640,108 | |
Undistributed long term capital gains | | | — | |
Distributable earnings | | $ | 10,640,108 | |
| | |
| |
5. INVESTMENT TRANSACTIONS
Purchases and sales of securities (excluding short-term securities) for the year ended December 31, 2003 aggregated $202,924,854 and $165,313,499, respectively.
6. OTHER CONSIDERATIONS
TAML, as the Fund’s Manager, may serve as a member on the board of directors of certain companies in which the Fund invests and/or may represent the Fund in certain corporate negotiations. Currently, the Manager serves in one or more of these capacities for Lukoil Holdings. As a result of this involvement, the Manager may be in possession of certain material non-public information which, pursuant to the Fund’s policies and the requirements of the federal securities laws, could prevent the Fund from trading in the securities of such companies for limited or extended periods of time.
TD-19
FRANKLIN TEMPLETON VARIABLE INSURANCE PRODUCTS TRUST
TEMPLETON DEVELOPING MARKETS SECURITIES FUND
Notes to Financial Statements (continued)
7. REGULATORY MATTERS
On February 4, 2004, the Securities Division of the Office of the Secretary of the Commonwealth of Massachusetts filed an administrative complaint against Franklin Resources, Inc. and certain of its subsidiaries (the “Company”), alleging violations of the Massachusetts Uniform Securities Act. The complaint arises from activity that occurred in 2001 during which time an officer of a Company subsidiary was negotiating an agreement with an investor relating to investments in a mutual fund and a hedge fund.
The Company, in addition to other entities within Franklin Templeton Investments, has been named in shareholder class actions related to the matter described above. The Company believes that the claims made in the lawsuit are without merit and it intends to defend vigorously against the allegations. The Company and the Fund may be named in similar civil actions related to the matter described above.
In addition, as part of ongoing investigations by the U.S. Securities and Exchange Commission (the “SEC”), the U.S. Attorney for the Northern District of California, the New York Attorney General, the California Attorney General, the U.S. Attorney for the District of Massachusetts, the Florida Department of Financial Services and the Commissioner of Securities and the Attorney General of the State of West Virginia, relating to certain practices in the mutual fund industry, including late trading, market timing and sales compensation arrangements, the Company and its subsidiaries, as well as certain current or former executives and employees of the Company, have received requests for information and/or subpoenas to testify or produce documents. The Company and its current employees are providing documents and information in response to these requests and subpoenas. In addition, the Company has responded to requests for similar kinds of information from regulatory authorities in some of the foreign countries where the Company conducts its global asset management business.
The Staff of the SEC has informed the Company that it intends to recommend that the Commission authorize an action against an affiliate of the Fund’s adviser and a senior executive officer relating to the frequent trading issues that are the subject of the SEC’s investigation. These issues were previously disclosed as being under investigation by government authorities and the subject of an internal inquiry by the Company in its Annual Report on Form 10-K and on its public website. The Company currently is in discussions with the SEC Staff in an effort to resolve the issues raised in their investigation. Such discussions are preliminary and the Fund’s management has been advised that the Company cannot predict the likelihood of whether those discussions will result in a settlement and, if so, the terms of such settlement. The impact, if any, of these matters on the Fund is uncertain at this time. If the Company finds that it bears responsibility for any unlawful or improper conduct, it has committed to making the Fund or its shareholders whole, as appropriate.
TD-20
FRANKLIN TEMPLETON VARIABLE INSURANCE PRODUCTS TRUST
TEMPLETON DEVELOPING MARKETS SECURITIES FUND
Independent Auditors’ Report
To the Board of Trustees and Shareholders of
Franklin Templeton Variable Insurance Products Trust
In our opinion, the accompanying statement of assets and liabilities, including the statement of investments, and the related statements of operations and of changes in net assets and the financial highlights present fairly, in all material respects, the financial position of the Templeton Developing Markets Securities Fund (the Fund) (one of the funds constituting the Franklin Templeton Variable Insurance Products Trust) at December 31, 2003, the results of its operations for the year then ended, the changes in its net assets for each of the two years in the period then ended and the financial highlights for each of the periods presented, in conformity with accounting principles generally accepted in the United States of America. These financial statements and financial highlights (hereafter referred to as “financial statements”) are the responsibility of the Fund’s management; our responsibility is to express an opinion on these financial statements based on our audits. We conducted our audits of these financial statements in accordance with auditing standards generally accepted in the United States of America, which require that we plan and perform the audits to obtain reasonable assurance about whether the financial statements are free of material misstatement. An audit includes examining, on a test basis, evidence supporting the amounts and disclosures in the financial statements, assessing the accounting principles used and significant estimates made by management, and evaluating the overall financial statement presentation. We believe that our audits, which included confirmation of securities at December 31, 2003 by correspondence with the custodian and brokers, provide a reasonable basis for our opinion.
PricewaterhouseCoopers LLP
San Francisco, California
February 5, 2004, except for Note 7 as to which the date is February 12, 2004
TD-21
FRANKLIN TEMPLETON VARIABLE INSURANCE PRODUCTS TRUST
TEMPLETON DEVELOPING MARKETS SECURITIES FUND
Tax Designation (unaudited)
At December 31, 2003, more than 50% of the Fund’s total assets were invested in securities of foreign issuers. In most instances, foreign taxes were withheld from dividends paid to the Fund on these investments. The Fund elects to treat foreign taxes paid under Section 853 of the Internal Revenue Code. This election will allow shareholders of record in June, 2004, to treat their proportionate share of foreign taxes paid by the Fund as having been paid directly by them. The shareholder shall consider these amounts as foreign taxes paid in the tax year in which they receive the Fund distribution.
The foreign tax information will be disclosed in the June 30, 2004 semi-annual report of the Fund.
TD-22
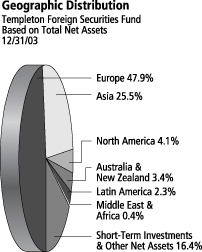
TEMPLETON FOREIGN SECURITIES FUND
Fund Goal and Primary Investments: Templeton Foreign Securities Fund seeks long-term capital growth. The Fund invests primarily in investments of issuers located outside the U.S., including those in emerging markets.
This annual report for Templeton Foreign Securities Fund covers the fiscal year ended December 31, 2003.
Performance Overview
You can find the Fund’s one-year total return in the Performance Summary following this report. The Fund underperformed its benchmark, the Morgan Stanley Capital International Europe Australasia Far East (MSCI EAFE) Index, which returned 39.17% for the year under review.1
Economic and Market Overview
In spring 2003, the end of major conflict in Iraq coincided with the start of a global equity market rally that produced the strongest annual total returns since 1986. The rally’s main catalyst was an improving global economy, underpinned by expansionary fiscal and monetary policies, corporate restructuring and consolidation, and more than two years of declining equity valuations that created potential opportunities in Asia, Europe and the Americas.
In many countries, including the U.S., China and Japan, gross domestic product (GDP) growth accelerated in 2003, particularly in the second half of the year. In the U.S., GDP grew at annualized rates of 3.1% and 8.2% in the second and third quarters. Over the same periods, consumer spending rose at annualized rates of 3.3% and 6.9% spurred largely by tax cuts, car-buying incentives and mortgage refinancing, as interest rates remained at the lowest level in more than four decades. Industrial production increased in the U.S., China, Japan and South Korea in the second half of the year, as did consumer sentiment in the U.S., U.K., Germany and Sweden, and business sentiment in the U.S., Australia, Germany and Japan. In short, a synchronized global economic recovery gained momentum in the second half of 2003.
Further evidence of this recovery was the continued rise in the prices of base metals and other commodities. This was due, in part, to greater demand in China. On December 31, 2003, contracts for aluminum and other metals such silver, gold, copper and zinc were anywhere from
1. Source: Standard & Poor’s Micropal. One cannot invest directly in an index, nor is an index representative of the Fund’s portfolio. Please see Index Descriptions following the Fund Summaries.
TF-1
19% to 50% higher than 12 months before.2 While gold crossed the $400-an-ounce threshold for the first time in more than seven years, such agricultural commodities as cotton and soybeans gained approximately 40%.2 Despite rising commodities prices, global inflation remained subdued throughout the year.
In 2003, the value of the U.S. dollar fell against most major currencies, including a 17% decline versus the euro.3 While the decline magnified top-line and earnings-per-share growth in the U.S., it had the opposite effect in Europe. The dollar decline also benefited U.S. investors in international equities because it increased the returns of investments denominated in currencies that appreciated against the dollar, such as the euro. Although the dollar’s decline significantly affected equity market returns, it was not the only reason for the past year’s gains. Equity markets in many countries, including emerging market countries, produced stronger gains than the U.S. equity market, even in their local currencies. These countries benefited from the improving economic and financial market conditions in 2003.
Investment Strategy
Our investment philosophy is bottom-up, value-oriented and long-term. In choosing investments, we generally focus on the market price of a company’s securities relative to our evaluation of the company’s potential long-term earnings, asset value and cash flow. Among factors we consider are a company’s historical value measures, including price/earnings ratio, profit margins and liquidation value. We do in-depth research to construct a bargain list from which we buy.
Manager’s Discussion
During the 12 months under review, the Fund’s overweighted position in the industrials sector relative to the MSCI EAFE Index benefited performance as that sector outperformed the overall index, and the Fund’s industrials sector holdings posted better overall returns than the index’s overall industrials sector return. The Fund’s overweighted utilities sector exposure also helped performance because our utilities stocks outperformed the index’s overall utilities return. In addition, the Fund’s overweighted position in materials aided performance, as the materials sector outperformed the overall MSCI EAFE Index for the year under review.
2. Source: Reuters, Commodity Research Bureau Index; London Metal Exchange.
3. Source: European Central Bank.
TF-2
Despite the Fund’s double-digit return, some sector positioning dampened performance. Detractors from Fund performance during the year included our underweighted position in the financials sector, and our financials sector holdings’ underperformance relative to the index. The underperformance of the Fund’s energy and consumer staples holdings also hindered relative performance during the reporting period. In addition, the Fund held more than 10% of its total net assets in short-term investments and other net assets (cash) during the period, which constrained performance.
Thank you for your participation in Templeton Foreign Securities Fund. We look forward to serving your future investment needs.
This discussion reflects our analysis, opinions and portfolio holdings as of December 31, 2003, the end of the reporting period. The way we implement our main investment strategies and the resulting portfolio holdings may change depending on factors such as market and economic conditions. These opinions may not be relied upon as investment advice or an offer for a particular security. The information is not a complete analysis of every aspect of any market, country, industry, security or the Fund. Statements of fact are from sources considered reliable, but the advisor makes no representation or warranty as to their completeness or accuracy. Although historical performance is no guarantee of future results, these insights may help you understand our investment management philosophy.
Top 10 Holdings
Templeton Foreign Securities Fund 12/31/03
| | |
Company Sector/Industry,
Country | | % of Total
Net Assets |
|
| |
| Samsung Electronics Co. Ltd. | | 1.8% |
| Semiconductors & Semiconductor Equipment, South Korea | | |
| |
| Denso Corp. | | 1.8% |
| Auto Components, Japan | | |
| |
| Nippon Telegraph & Telephone Corp. | | 1.8% |
| Diversified Telecommunication Services, Japan | | |
| |
| Sony Corp. | | 1.7% |
| Household Durables, Japan | | |
| |
| Aventis SA | | 1.6% |
| Pharmaceuticals, France | | |
| |
Koninklijke Philips
Electronics NV | | 1.5% |
| Household Durables, Netherlands | | |
| |
| Cheung Kong Holdings Ltd. | | 1.5% |
| Real Estate, Hong Kong | | |
| |
| Volkswagen AG, ord. & pfd. | | 1.4% |
| Automobiles, Germany | | |
| |
| Eni SpA | | 1.4% |
| Oil & Gas, Italy | | |
| |
| Nordea AB, FDR | | 1.4% |
| Banks, Sweden | | |
The dollar value, number of shares or principal amount, and complete legal titles of all portfolio holdings are listed in the Fund’s Statement of Investments.
TF-3
PERFORMANCE SUMMARYASOF 12/31/03
Total return of Class 1 shares represents the average annual change in value, assuming reinvestment of dividends and capital gains. Average returns smooth out variations in returns, which can be significant; they are not the same as year-by-year results.
Templeton Foreign Securities Fund – Class 1*
Periods ended 12/31/03
| | | | | | |
| | | 1-Year | | 5-Year | | 10-Year |
|
| | | |
Average Annual Total Return | | +32.55% | | +1.96% | | +6.78% |
*Performance prior to the 5/1/00 merger reflects the historical performance of Templeton International Fund.
Ongoing market volatility can significantly affect short-term performance; recent returns may differ.
Total Return Index Comparison for Hypothetical $10,000 Investment (1/1/94–12/31/03)
The graph compares the performance of Templeton Foreign Securities Fund – Class 1* and the MSCI EAFE Index. One cannot invest directly in an index, nor is an index representative of the Fund’s portfolio. Please see Important Notes to Performance Information preceding the Fund Summaries.
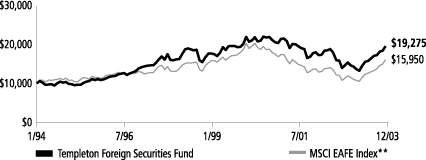
**Source: Standard & Poor’s Micropal. Please see Index Descriptions following the Fund Summaries.
Templeton
Foreign Securities
Fund – Class 1
Performance reflects the Fund’s Class 1 operating expenses, but does not include any contract fees, expenses or sales charges. If they had been included, performance would be lower. These charges and deductions, particularly for variable life policies, can have a significant effect on contract values and insurance benefits. See the contract prospectus for a complete description of these expenses, including sales charges.
Since markets can go down as well as up, investment return and the value of your principal will fluctuate with market conditions, and you may have a gain or loss when you sell your shares.
TF-4
Past performance does not guarantee future results.
FRANKLIN TEMPLETON VARIABLE INSURANCE PRODUCTS TRUST
TEMPLETON FOREIGN SECURITIES FUND
Financial Highlightsa
| | | | | | | | | | | | | | | | | | | | |
| | | Class 1
| |
| | | Year Ended December 31,
| |
| | | 2003 | | | 2002 | | | 2001 | | | 2000 | | | 1999 | |
| | |
|
|
|
Per share operating performance | | | | | | | | | | | | | | | | | | | | |
(for a share outstanding throughout the year) | | | | | | | | | | | | | | | | | | | | |
| | | | | |
Net asset value, beginning of year | | $ | 9.51 | | | $ | 11.85 | | | $ | 18.78 | | | $ | 22.25 | | | $ | 20.69 | |
| | |
|
|
|
Income from investment operations: | | | | | | | | | | | | | | | | | | | | |
Net investment incomeb | | | .19 | | | | .22 | | | | .23 | | | | .40 | | | | .33 | |
Net realized and unrealized gains (losses) | | | 2.87 | | | | (2.37 | ) | | | (5.23 | ) | | | (.95 | ) | | | 3.78 | |
| | |
|
|
|
Total from investment operations | | | 3.06 | | | | (2.15 | ) | | | (5.00 | ) | | | (.55 | ) | | | 4.11 | |
| | |
|
|
|
Less distributions from: | | | | | | | | | | | | | | | | | | | | |
Net investment income | | | (.20 | ) | | | (.19 | ) | | | (.26 | ) | | | (.43 | ) | | | (.57 | ) |
Net realized gains | | | — | | | | — | | | | (1.67 | ) | | | (2.49 | ) | | | (1.98 | ) |
| | |
|
|
|
Total distributions | | | (.20 | ) | | | (.19 | ) | | | (1.93 | ) | | | (2.92 | ) | | | (2.55 | ) |
| | |
|
|
|
Net asset value, end of year | | $ | 12.37 | | | $ | 9.51 | | | $ | 11.85 | | | $ | 18.78 | | | $ | 22.25 | |
| | |
|
|
|
| | | | | |
Total returnc | | | 32.55% | | | | (18.40)% | | | | (15.75)% | | | | (2.19)% | | | | 23.61% | |
Ratios/supplemental data | | | | | | | | | | | | | | | | | | | | |
Net assets, end of year (000’s) | | $ | 472,665 | | | $ | 397,420 | | | $ | 565,220 | | | $ | 776,495 | | | $ | 1,056,798 | |
Ratios to average net assets: | | | | | | | | | | | | | | | | | | | | |
Expenses | | | .87% | | | | .88% | | | | .90% | | | | .87% | | | | .85% | |
Net investment income | | | 1.81% | | | | 1.97% | | | | 1.59% | | | | 2.08% | | | | 1.69% | |
Portfolio turnover rate | | | 18.01% | | | | 28.12% | | | | 20.00% | | | | 32.81% | | | | 30.04% | |
| a | Financial highlights presented reflect historical financial information from Templeton Variable Products Series Fund (TVP) - Templeton International Securities Fund as a result of a merger May 1, 2000. |
| b | Based on average daily shares outstanding. |
| c | Total return does not include any fees, charges or expenses imposed by the variable annuity and life insurance contracts for which the Franklin Templeton Variable Insurance Products Trust serves as an underlying investment vehicle. Total return is not annualized for periods less than one year. |
TF-5
FRANKLIN TEMPLETON VARIABLE INSURANCE PRODUCTS TRUST
TEMPLETON FOREIGN SECURITIES FUND
Financial Highlightsa (continued)
| | | | | | | | | | | | | | | | | | | | |
| | | Class 2
| |
| | | Year Ended December 31,
| |
| | | 2003 | | | 2002 | | | 2001 | | | 2000 | | | 1999 | |
| | |
|
|
|
Per share operating performance | | | | | | | | | | | | | | | | | | | | |
(for a share outstanding throughout the year) | | | | | | | | | | | | | | | | | | | | |
| | | | | |
Net asset value, beginning of year | | $ | 9.42 | | | $ | 11.74 | | | $ | 18.67 | | | $ | 22.13 | | | $ | 20.61 | |
| | |
|
|
|
Income from investment operations: | | | | | | | | | | | | | | | | | | | | |
Net investment incomeb | | | .15 | | | | .17 | | | | .18 | | | | .31 | | | | .25 | |
Net realized and unrealized gains (losses) | | | 2.85 | | | | (2.32 | ) | | | (5.21 | ) | | | (.90 | ) | | | 3.78 | |
| | |
|
|
|
Total from investment operations | | | 3.00 | | | | (2.15 | ) | | | (5.03 | ) | | | (.59 | ) | | | 4.03 | |
| | |
|
|
|
Less distributions from: | | | | | | | | | | | | | | | | | | | | |
Net investment income | | | (.18 | ) | | | (.17 | ) | | | (.23 | ) | | | (.38 | ) | | | (.53 | ) |
Net realized gains | | | — | | | | — | | | | (1.67 | ) | | | (2.49 | ) | | | (1.98 | ) |
| | |
|
|
|
Total distributions | | | (.18 | ) | | | (.17 | ) | | | (1.90 | ) | | | (2.87 | ) | | | (2.51 | ) |
| | |
|
|
|
Net asset value, end of year | | $ | 12.24 | | | $ | 9.42 | | | $ | 11.74 | | | $ | 18.67 | | | $ | 22.13 | |
| | |
|
|
|
| | | | | |
Total returnc | | | 32.21% | | | | (18.56)% | | | | (15.99)% | | | | (2.38)% | | | | 23.23% | |
Ratios/supplemental data | | | | | | | | | | | | | | | | | | | | |
Net assets, end of year (000’s) | | $ | 653,594 | | | $ | 299,760 | | | $ | 225,505 | | | $ | 187,115 | | | $ | 101,365 | |
Ratios to average net assets: | | | | | | | | | | | | | | | | | | | | |
Expenses | | | 1.12% | | | | 1.13% | | | | 1.15% | | | | 1.12% | | | | 1.10% | |
Net investment income | | | 1.56% | | | | 1.72% | | | | 1.32% | | | | 1.66% | | | | 1.26% | |
Portfolio turnover rate | | | 18.01% | | | | 28.12% | | | | 20.00% | | | | 32.81% | | | | 30.04% | |
| a | Financial highlights presented reflect historical financial information from Templeton Variable Products Series Fund (TVP) - Templeton International Fund a result of a merger May 1, 2000. |
| b | Based on average daily shares outstanding. |
| c | Total return does not include any fees, charges or expenses imposed by the variable annuity and life insurance contracts for which the Franklin Templeton Variable Insurance Products Trust serves as an underlying investment vehicle. Total return is not annualized for periods less than one year. |
See notes to financial statements.
TF-6
FRANKLIN TEMPLETON VARIABLE INSURANCE PRODUCTS TRUST
TEMPLETON FOREIGN SECURITIES FUND
Statement of Investments, December 31, 2003
| | | | | | | |
| | | COUNTRY | | SHARES | | VALUE |
|
Common Stocks 82.4% | | | | | | | |
Aerospace & Defense .9% | | | | | | | |
BAE Systems PLC | | United Kingdom | | 3,544,411 | | $ | 10,675,555 |
| | | | | | |
|
|
Air Freight & Couriers 1.2% | | | | | | | |
Deutsche Post AG | | Germany | | 677,613 | | | 13,948,845 |
| | | | | | |
|
|
Airlines .7% | | | | | | | |
Qantas Airways Ltd. | | Australia | | 3,060,000 | | | 7,585,272 |
| | | | | | |
|
|
Auto Components 4.2% | | | | | | | |
Autoliv Inc., SDR | | Sweden | | 393,611 | | | 14,934,166 |
Denso Corp. | | Japan | | 1,044,800 | | | 20,570,383 |
Michelin SA, B | | France | | 266,820 | | | 12,243,834 |
| | | | | | |
|
|
| | | | | | | | 47,748,383 |
| | | | | | |
|
|
Automobiles .9% | | | | | | | |
Volkswagen AG | | Germany | | 181,815 | | | 10,170,907 |
| | | | | | |
|
|
Banks 6.2% | | | | | | | |
Abbey National PLC | | United Kingdom | | 628,800 | | | 5,977,208 |
DBS Group Holdings Ltd. | | Singapore | | 662,000 | | | 5,730,083 |
DBS Group Holdings Ltd., 144A | | Singapore | | 650,000 | | | 5,626,215 |
HSBC Holdings PLC | | Hong Kong | | 147,855 | | | 2,332,969 |
Kookmin Bank, ADR | | South Korea | | 314,560 | | | 11,902,950 |
Lloyds TSB Group PLC | | United Kingdom | | 1,387,500 | | | 11,127,620 |
Nordea AB, FDR | | Sweden | | 2,135,083 | | | 15,943,102 |
UBS AG | | Switzerland | | 161,000 | | | 11,026,238 |
| | | | | | |
|
|
| | | | | | | | 69,666,385 |
| | | | | | |
|
|
Biotechnology .4% | | | | | | | |
aCellTech Group PLC | | United Kingdom | | 630,000 | | | 4,263,082 |
| | | | | | |
|
|
Chemicals 2.9% | | | | | | | |
Akzo Nobel NV | | Netherlands | | 329,003 | | | 12,698,652 |
BASF AG | | Germany | | 184,669 | | | 10,423,736 |
Bayer AG, Br. | | Germany | | 333,400 | | | 9,840,515 |
| | | | | | |
|
|
| | | | | | | | 32,962,903 |
| | | | | | |
|
|
Commercial Services & Supplies 1.6% | | | | | | | |
Adecco SA | | Switzerland | | 86,100 | | | 5,534,627 |
Securitas AB, B | | Sweden | | 809,980 | | | 10,919,358 |
Societe BIC SA | | France | | 23,250 | | | 1,074,521 |
| | | | | | |
|
|
| | | | | | | | 17,528,506 |
| | | | | | |
|
|
Computers & Peripherals .8% | | | | | | | |
NEC Corp. | | Japan | | 1,058,000 | | | 7,789,139 |
Seiko Epson Corp., 144A | | Japan | | 14,800 | | | 690,491 |
| | | | | | |
|
|
| | | | | | | | 8,479,630 |
| | | | | | |
|
|
Construction Materials .7% | | | | | | | |
Cemex SA, ADR | | Mexico | | 315,900 | | | 8,276,580 |
| | | | | | |
|
|
Diversified Financials 3.8% | | | | | | | |
Housing Development Finance Corp. Ltd. | | India | | 41,040 | | | 579,597 |
ING Groep NV | | Netherlands | | 450,610 | | | 10,509,308 |
Nomura Holdings Inc. | | Japan | | 525,730 | | | 8,952,666 |
TF-7
FRANKLIN TEMPLETON VARIABLE INSURANCE PRODUCTS TRUST
TEMPLETON FOREIGN SECURITIES FUND
Statement of Investments, December 31, 2003 (cont.)
| | | | | | | |
| | | COUNTRY | | SHARES | | VALUE |
|
Common Stocks (cont.) | | | | | | | |
Diversified Financials (cont.) | | | | | | | |
Rodamco Europe NV | | Netherlands | | 164,000 | | $ | 9,550,807 |
Swire Pacific Ltd., B | | Hong Kong | | 12,648,627 | | | 13,359,620 |
| | | | | | |
|
|
| | | | | | | | 42,951,998 |
| | | | | | |
|
|
Diversified Telecommunication Services 6.8% | | | | | | | |
BCE Inc. | | Canada | | 410,160 | | | 9,172,857 |
Chunghwa Telecom Co. Ltd., ADR | | Taiwan | | 472,300 | | | 6,848,350 |
KT Corp., ADR | | South Korea | | 420,880 | | | 8,026,182 |
Nippon Telegraph & Telephone Corp. | | Japan | | 4,236 | | | 20,434,935 |
Telecom Corp. of New Zealand Ltd. | | New Zealand | | 2,964,626 | | | 10,452,325 |
Telefonica SA, ADR | | Spain | | 247,113 | | | 10,919,923 |
Telefonos de Mexico SA de CV (Telmex), L, ADR | | Mexico | | 333,129 | | | 11,003,251 |
| | | | | | |
|
|
| | | | | | | | 76,857,823 |
| | | | | | |
|
|
Electric Utilities 3.7% | | | | | | | |
E. On AG | | Germany | | 142,653 | | | 9,344,059 |
Endesa SA | | Spain | | 547,398 | | | 10,529,540 |
Hong Kong Electric Holdings Ltd. | | Hong Kong | | 1,800,000 | | | 7,117,832 |
Iberdrola SA, Br. | | Spain | | 528,222 | | | 10,440,513 |
Korea Electric Power Corp. | | South Korea | | 250,000 | | | 4,490,139 |
| | | | | | |
|
|
| | | | | | | | 41,922,083 |
| | | | | | |
|
|
Electrical Equipment .8% | | | | | | | |
Kidde PLC | | United Kingdom | | 2,724,071 | | | 5,193,490 |
Vestas Wind Systems AS | | Denmark | | 261,605 | | | 4,254,353 |
| | | | | | |
|
|
| | | | | | | | 9,447,843 |
| | | | | | |
|
|
Electronic Equipment & Instruments 1.2% | | | | | | | |
Hitachi Ltd. | | Japan | | 2,213,867 | | | 13,344,761 |
| | | | | | |
|
|
Energy Equipment & Services .6% | | | | | | | |
IHC Caland NV | | Netherlands | | 115,874 | | | 6,284,791 |
| | | | | | |
|
|
Food & Drug Retailing .9% | | | | | | | |
J Sainsbury PLC | | United Kingdom | | 1,830,860 | | | 10,250,469 |
| | | | | | |
|
|
Food Products 2.6% | | | | | | | |
Cadbury Schweppes PLC | | United Kingdom | | 1,300,000 | | | 9,547,359 |
Nestle SA | | Switzerland | | 51,790 | | | 12,939,648 |
Unilever PLC | | United Kingdom | | 728,934 | | | 6,795,302 |
| | | | | | |
|
|
| | | | | | | | 29,282,309 |
| | | | | | |
|
|
Health Care Equipment & Supplies 1.1% | | | | | | | |
Amersham PLC | | United Kingdom | | 918,222 | | | 12,697,875 |
| | | | | | |
|
|
Health Care Providers & Services .7% | | | | | | | |
Mayne Group Ltd. | | Australia | | 3,390,208 | | | 8,327,176 |
| | | | | | |
|
|
Household Durables 3.2% | | | | | | | |
Koninklijke Philips Electronics NV | | Netherlands | | 576,739 | | | 16,840,953 |
Sony Corp. | | Japan | | 560,854 | | | 19,415,586 |
| | | | | | |
|
|
| | | | | | | | 36,256,539 |
| | | | | | |
|
|
TF-8
FRANKLIN TEMPLETON VARIABLE INSURANCE PRODUCTS TRUST
TEMPLETON FOREIGN SECURITIES FUND
Statement of Investments, December 31, 2003 (cont.)
| | | | | | | |
| | | COUNTRY | | SHARES | | VALUE |
|
Common Stocks (cont.) | | | | | | | |
Industrial Conglomerates 2.2% | | | | | | | |
Hutchison Whampoa Ltd. | | Hong Kong | | 1,962,000 | | $ | 14,468,095 |
Smiths Group PLC | | United Kingdom | | 837,500 | | | 9,910,089 |
| | | | | | |
|
|
| | | | | | | | 24,378,184 |
| | | | | | |
|
|
Insurance 7.2% | | | | | | | |
Ace Ltd. | | Bermuda | | 337,803 | | | 13,991,800 |
AXA SA | | France | | 479,792 | | | 10,270,018 |
AXA SA, 144A | | France | | 40,480 | | | 866,480 |
aPICC Property & Casualty Co. Ltd., 144A | | China | | 330,000 | | | 147,709 |
Sampo OYJ, A | | Finland | | 1,292,550 | | | 13,368,958 |
Sompo Japan Insurance Inc. | | Japan | | 1,694,000 | | | 13,925,670 |
Swiss Reinsurance Co. | | Switzerland | | 235,318 | | | 15,887,652 |
XL Capital Ltd., A | | Bermuda | | 162,428 | | | 12,596,291 |
| | | | | | |
|
|
| | | | | | | | 81,054,578 |
| | | | | | |
|
|
IT Consulting & Services .5% | | | | | | | |
Satyam Computers Services Ltd. | | India | | 728,666 | | | 5,866,859 |
| | | | | | |
|
|
Machinery 1.0% | | | | | | | |
Volvo AB, B | | Sweden | | 369,264 | | | 11,290,437 |
| | | | | | |
|
|
Media 2.2% | | | | | | | |
Reed Elsevier NV | | Netherlands | | 877,400 | | | 10,901,097 |
Reuters Group PLC | | United Kingdom | | 1,842,300 | | | 7,750,318 |
Wolters Kluwer NV | | Netherlands | | 380,280 | | | 5,947,871 |
| | | | | | |
|
|
| | | | | | | | 24,599,286 |
| | | | | | |
|
|
Metals & Mining 3.0% | | | | | | | |
Alcan Inc. | | Canada | | 55,334 | | | 2,652,235 |
Barrick Gold Corp. | | Canada | | 330,494 | | | 7,496,056 |
BHP Billiton Ltd. | | Australia | | 1,338,050 | | | 12,289,377 |
POSCO, ADR | | South Korea | | 331,100 | | | 11,247,467 |
| | | | | | |
|
|
| | | | | | | | 33,685,135 |
| | | | | | |
|
|
Multi-Utilities 1.1% | | | | | | | |
National Grid Transco PLC | | United Kingdom | | 736,100 | | | 5,274,235 |
Suez SA | | France | | 354,000 | | | 7,113,042 |
| | | | | | |
|
|
| | | | | | | | 12,387,277 |
| | | | | | |
|
|
Oil & Gas 5.9% | | | | | | | |
BP PLC | | United Kingdom | | 1,647,720 | | | 13,362,044 |
Eni SpA | | Italy | | 845,840 | | | 15,960,856 |
Repsol YPF SA | | Spain | | 723,515 | | | 14,108,907 |
Shell Transport & Trading Co. PLC | | United Kingdom | | 1,679,653 | | | 12,493,436 |
Total SA, B | | France | | 54,077 | | | 10,054,175 |
| | | | | | |
|
|
| | | | | | | | 65,979,418 |
| | | | | | |
|
|
Paper & Forest Products 2.1% | | | | | | | |
Stora Enso OYJ, R | | Finland | | 671,830 | | | 9,010,270 |
UPM-Kymmene Corp. | | Finland | | 764,284 | | | 14,576,153 |
| | | | | | |
|
|
| | | | | | | | 23,586,423 |
| | | | | | |
|
|
TF-9
FRANKLIN TEMPLETON VARIABLE INSURANCE PRODUCTS TRUST
TEMPLETON FOREIGN SECURITIES FUND
Statement of Investments, December 31, 2003 (cont.)
| | | | | | | | |
| | | COUNTRY | | SHARES | | | VALUE |
|
Common Stocks (cont.) | | | | | | | | |
Pharmaceuticals 4.4% | | | | | | | | |
Aventis SA | | France | | 266,548 | | | $ | 17,617,451 |
GlaxoSmithKline PLC | | United Kingdom | | 514,900 | | | | 11,798,428 |
Ono Pharmaceutical Co. Ltd. | | Japan | | 299,000 | | | | 11,243,539 |
aShire Pharmaceuticals Group PLC | | United Kingdom | | 928,000 | | | | 9,012,370 |
| | | | | | | |
|
|
| | | | | | | | | 49,671,788 |
| | | | | | | |
|
|
Real Estate 1.5% | | | | | | | | |
Cheung Kong Holdings Ltd. | | Hong Kong | | 2,086,137 | | | | 16,592,684 |
| | | | | | | |
|
|
Road & Rail .5% | | | | | | | | |
East Japan Railway Co. | | Japan | | 1,100 | | | | 5,183,354 |
| | | | | | | |
|
|
Semiconductors & Semiconductor Equipment 2.4% | | | | | | | | |
ASM Pacific Technology Ltd. | | Hong Kong | | 252,500 | | | | 1,105,802 |
Samsung Electronics Co. Ltd. | | South Korea | | 54,850 | | | | 20,761,519 |
aTaiwan Semiconductor Manufacturing Co. | | Taiwan | | 2,494,800 | | | | 4,666,268 |
| | | | | | | |
|
|
| | | | | | | | | 26,533,589 |
| | | | | | | |
|
|
Software 1.7% | | | | | | | | |
aCheck Point Software Technologies Ltd. | | Israel | | 268,550 | | | | 4,517,011 |
Nintendo Co. Ltd. | | Japan | | 163,000 | | | | 15,209,480 |
| | | | | | | |
|
|
| | | | | | | | | 19,726,491 |
| | | | | | | |
|
|
Wireless Telecommunication Services .8% | | | | | | | | |
China Mobile (Hong Kong) Ltd., fgn. | | China | | 2,932,000 | | | | 9,007,187 |
| | | | | | | |
|
|
Total Common Stocks (Cost $763,745,208) | | | | | | | | 928,472,405 |
| | | | | | | |
|
|
Preferred Stocks 1.1% | | | | | | | | |
Cia Vale do Rio Doce, A, ADR, pfd. | | Brazil | | 132,792 | | | | 6,840,116 |
Volkswagen AG, pfd. | | Germany | | 160,254 | | | | 5,841,752 |
| | | | | | | |
|
|
Total Preferred Stocks (Cost $8,049,893) | | | | | | | | 12,681,868 |
| | | | | | | |
|
|
| | | | | PRINCIPAL
AMOUNTSc | | | |
| | | | |
|
| | | |
Convertible Bonds .1% | | | | | | | | |
Axa SA, cvt., zero cpn., 12/21/04 | | France | | 29,987 | EUR | | | 604,808 |
Axa SA, cvt., 144A, zero cpn., 12/21/04 | | France | | 2,530 | EUR | | | 51,028 |
| | | | | | | |
|
|
Total Convertible Bonds (Cost $485,675) | | | | | | | | 655,836 |
| | | | | | | |
|
|
Total Long Term Investments (Cost $772,280,776) | | | | | | | | 941,810,109 |
| | | | | | | |
|
|
| | | | | SHARES | | | |
| | | | |
|
| | | |
Short Term Investments (Cost $176,523,500) 15.7% | | | | | | | | |
bFranklin Institutional Fiduciary Trust Money Market Portfolio | | United States | | 176,523,500 | | | | 176,523,500 |
| | | | | | | |
|
|
Total Investments (Cost $948,804,276) 99.3% | | | | | | | | 1,118,333,609 |
Other Assets, less Liabilities .7% | | | | | | | | 7,925,852 |
| | | | | | | |
|
|
Net Assets 100.0% | | | | | | | $ | 1,126,259,461 |
| | | | | | | |
|
|
Currency Abbreviations:
EUR - Euro
| b | See Note 6 regarding investments in the Franklin Institutional Fiduciary Trust Money Market Portfolio. |
| c | The principal amount is stated in US dollars unless otherwise indicated. |
See notes to financial statements.
TF-10
FRANKLIN TEMPLETON VARIABLE INSURANCE PRODUCTS TRUST
TEMPLETON FOREIGN SECURITIES FUND
Financial Statements
Statement of Assets and Liabilities
December 31, 2003
| | | | |
Assets: | | | | |
Investments in securities: | | | | |
Cost | | $ | 948,804,276 | |
| | |
|
|
|
Value | | | 1,118,333,609 | |
Cash | | | 77,965 | |
Foreign currency, at value (cost $7,986,229) | | | 8,104,073 | |
Receivables: | | | | |
Capital shares sold | | | 1,243,792 | |
Dividends and interest | | | 1,653,004 | |
| | |
|
|
|
Total assets | | | 1,129,412,443 | |
| | |
|
|
|
Liabilities: | | | | |
Payables: | | | | |
Investment securities purchased | | | 455,400 | |
Capital shares redeemed | | | 871,002 | |
Affiliates | | | 936,118 | |
Deferred tax liability (Note 1f) | | | 624,409 | |
Other liabilities | | | 266,053 | |
| | |
|
|
|
Total liabilities | | | 3,152,982 | |
| | |
|
|
|
Net assets, at value | | $ | 1,126,259,461 | |
| | |
|
|
|
Net assets consist of: | | | | |
Undistributed net investment income | | $ | 13,972,294 | |
Net unrealized appreciation (depreciation) | | | 169,136,446 | |
Accumulated net realized gain (loss) | | | (146,674,699 | ) |
Capital shares | | | 1,089,825,420 | |
| | |
|
|
|
Net assets, at value | | $ | 1,126,259,461 | |
| | |
|
|
|
Class 1: | | | | |
Net assets, at value | | $ | 472,665,174 | |
| | |
|
|
|
Shares outstanding | | | 38,198,511 | |
| | |
|
|
|
Net asset value and offering price per share | | $ | 12.37 | |
| | |
|
|
|
Class 2: | | | | |
Net assets, at value | | $ | 653,594,287 | |
| | |
|
|
|
Shares outstanding | | | 53,391,172 | |
| | |
|
|
|
Net asset value and offering price per share | | $ | 12.24 | |
| | |
|
|
|
See notes to financial statements.
TF-11
FRANKLIN TEMPLETON VARIABLE INSURANCE PRODUCTS TRUST
TEMPLETON FOREIGN SECURITIES FUND
Financial Statements (continued)
Statement of Operations
for the year ended December 31, 2003
| | | | |
Investment income: | | | | |
(net of foreign taxes and fees of $2,708,201) | | | | |
Dividends | | $ | 22,240,216 | |
Interest | | | 11,106 | |
| | |
|
|
|
Total investment income | | | 22,251,322 | |
| | |
|
|
|
Expenses: | | | | |
Management fees (Note 3) | | | 5,421,046 | |
Administrative fees (Note 3) | | | 1,100,974 | |
Distribution fees - Class 2 (Note 3) | | | 1,051,609 | |
Transfer agent fees | | | 6,838 | |
Other | | | 725,130 | |
| | |
|
|
|
Total expenses | | | 8,305,597 | |
| | |
|
|
|
Net investment income | | | 13,945,725 | |
| | |
|
|
|
Realized and unrealized gains (losses): | | | | |
Net realized gain (loss) from: | | | | |
Investments | | | (31,135,006 | ) |
Foreign currency transactions | | | 43,941 | |
| | |
|
|
|
Net realized gain (loss) | | | (31,091,065 | ) |
| | |
|
|
|
Net unrealized appreciation (depreciation) on: | | | | |
Investments | | | 272,546,674 | |
Translation of assets and liabilities denominated in foreign currencies | | | 205,168 | |
Deferred taxes (Note 1f) | | | (624,409 | ) |
| | |
|
|
|
Net unrealized appreciation (depreciation) | | | 272,127,433 | |
| | |
|
|
|
Net realized and unrealized gain (loss) | | | 241,036,368 | |
| | |
|
|
|
Net increase (decrease) in net assets resulting from operations | | $ | 254,982,093 | |
| | |
|
|
|
See notes to financial statements.
TF-12
FRANKLIN TEMPLETON VARIABLE INSURANCE PRODUCTS TRUST
TEMPLETON FOREIGN SECURITIES FUND
Financial Statements (continued)
Statements of Changes in Net Assets
for the years ended December 31, 2003 and 2002
| | | | | | | | |
| | | 2003 | | | 2002 | |
| | |
|
|
|
Increase (decrease) in net assets: | | | | | | | | |
Operations: | | | | | | | | |
Net investment income | | $ | 13,945,725 | | | $ | 14,225,614 | |
Net realized gain (loss) from investments and foreign currency transactions | | | (31,091,065 | ) | | | (89,762,160 | ) |
Net unrealized appreciation (depreciation) on investments and translation of assets and liabilities denominated in foreign currencies, and deferred taxes | | | 272,127,433 | | | | (61,179,717 | ) |
| | |
| |
Net increase (decrease) in net assets resulting from operations | | | 254,982,093 | | | | (136,716,263 | ) |
Distributions to shareholders from: | | | | | | | | |
Net investment income: | | | | | | | | |
Class 1 | | | (7,698,069 | ) | | | (8,763,684 | ) |
Class 2 | | | (6,848,227 | ) | | | (4,308,628 | ) |
| | |
| |
Total distributions to shareholders | | | (14,546,296 | ) | | | (13,072,312 | ) |
Capital share transactions: (Note 2) | | | | | | | | |
Class 1 | | | (35,694,170 | ) | | | (64,156,384 | ) |
Class 2 | | | 224,338,382 | | | | 120,399,514 | |
| | |
| |
Total capital share transactions | | | 188,644,212 | | | | 56,243,130 | |
Net increase (decrease) in net assets | | | 429,080,009 | | | | (93,545,445 | ) |
Net assets: | | | | | | | | |
Beginning of year | | | 697,179,452 | | | | 790,724,897 | |
| | |
| |
End of year | | $ | 1,126,259,461 | | | $ | 697,179,452 | |
| | |
| |
Undistributed net investment income included in net assets: | | | | | | | | |
End of year | | $ | 13,972,294 | | | $ | 14,477,229 | |
| | |
|
|
|
See notes to financial statements.
TF-13
FRANKLIN TEMPLETON VARIABLE INSURANCE PRODUCTS TRUST
TEMPLETON FOREIGN SECURITIES FUND
Notes to Financial Statements
1. ORGANIZATION AND SIGNIFICANT ACCOUNTING POLICIES
Franklin Templeton Variable Insurance Products Trust (the Trust) is registered under the Investment Company Act of 1940 as an open-end investment company consisting of twenty-two separate series (the Funds). Templeton Foreign Securities Fund (the Fund) included in this report is diversified. Shares of the Fund are sold only to insurance company separate accounts to fund the benefits of variable life insurance policies or variable annuity contracts. The Fund’s investment objective is capital growth.
The following summarizes the Fund’s significant accounting policies.
a. Security Valuation
Securities listed or traded on a recognized national exchange or NASDAQ are valued at the last reported sales price. Over-the-counter securities and listed securities for which no sale is reported are valued within the range of the latest quoted bid and asked prices. Foreign securities are valued at the close of trading of the foreign exchange or the NYSE, whichever is earlier. If events occur that materially affect the values of securities after the prices or foreign exchange rates are determined, or if market quotations are not readily available, the securities will be valued at fair value as determined following procedures approved by the Board of Trustees.
b. Foreign Currency Translation
Portfolio securities and other assets and liabilities denominated in foreign currencies are translated into U.S. dollars based on the exchange rate of such currencies against U.S. dollars on the date of valuation. Purchases and sales of securities and income items denominated in foreign currencies are translated into U.S. dollars at the exchange rate in effect on the transaction date.
The Fund does not separately report the effect of changes in foreign exchange rates from changes in market prices on securities held. Such changes are included in net realized and unrealized gain or loss from investments.
Realized foreign exchange gains or losses arise from sales of foreign currencies, currency gains or losses realized between the trade and settlement dates on securities transactions and the difference between the recorded amounts of dividends, interest, and foreign withholding taxes and the U.S. dollar equivalent of the amounts actually received or paid. Net unrealized foreign exchange gains and losses arise from changes in foreign exchange rates on foreign denominated assets and liabilities other than investments in securities held at the end of the reporting period.
c. Foreign Currency Contracts
When the Fund purchases or sells foreign securities it may enter into foreign exchange contracts to minimize foreign exchange risk from the trade date to the settlement date of the transactions. A foreign exchange contract is an agreement between two parties to exchange different currencies at an agreed upon exchange rate on a specified date. Realized and unrealized gains and losses are included in the Statement of Operations.
The risks of these contracts include movement in the values of the foreign currencies relative to the U.S. dollar and the possible inability of the counterparties to fulfill their obligations under the contracts.
d. Income Taxes
No provision has been made for income taxes because the Fund’s policy is to qualify as a regulated investment company under the Internal Revenue Code and to distribute substantially all of its taxable income.
TF-14
FRANKLIN TEMPLETON VARIABLE INSURANCE PRODUCTS TRUST
TEMPLETON FOREIGN SECURITIES FUND
Notes to Financial Statements (continued)
1. ORGANIZATION AND SIGNIFICANT ACCOUNTING POLICIES (cont.)
e. Security Transactions, Investment Income, Expenses and Distributions
Security transactions are accounted for on trade date. Realized gains and losses on security transactions are determined on a specific identification basis. Certain income from foreign securities is recorded as soon as information is available to the Fund. Interest income and estimated expenses are accrued daily. Dividend income and distributions to shareholders are recorded on the ex-dividend date.
Common expenses incurred by the Trust are allocated among the Funds based on the ratio of net assets of each Fund to the combined net assets. Other expenses are charged to each fund on a specific identification basis.
Realized and unrealized gains and losses and net investment income, other than class specific expenses, are allocated daily to each class of shares based upon the relative proportion of net assets of each class.
f. Deferred Taxes
The Fund is subject to a tax imposed on net realized gains of securities of certain foreign countries. The Fund records an estimated deferred tax liability for net unrealized gains on these securities as reflected in the accompanying financial statements.
g. Accounting Estimates
The preparation of financial statements in accordance with accounting principles generally accepted in the United States of America requires management to make estimates and assumptions that affect the reported amounts of assets and liabilities at the date of the financial statements and the amounts of income and expense during the reporting period. Actual results could differ from those estimates.
h. Guarantees and Indemnifications
Under the Trust’s organizational documents, its officers and trustees are indemnified against certain liability arising out of the performance of their duties to the Trust. Additionally, in the normal course of business, the Trust enters into contracts with service providers that contain general indemnification clauses. The Trust’s maximum exposure under these arrangements is unknown as this would involve future claims that may be made against the Trust that have not yet occurred. However, based on experience, the Trust expects the risk of loss to be remote.
TF-15
FRANKLIN TEMPLETON VARIABLE INSURANCE PRODUCTS TRUST
TEMPLETON FOREIGN SECURITIES FUND
Notes to Financial Statements (continued)
2. SHARES OF BENEFICIAL INTEREST
The Fund offers two classes of shares: Class 1 and Class 2. Each class of shares differs by its distribution fees, voting rights on matters affecting a single class and its exchange privilege.
At December 31, 2003, there were an unlimited number of shares authorized ($.01 par value). Transactions in the Fund’s shares were as follows:
| | | | | | | | | | | | | | |
| | | Year Ended December 31,
| |
| | | 2003
| | | 2002
| |
| Class 1 Shares: | | Shares
| | | Amount
| | | Shares
| | | Amount
| |
Shares sold | | 4,070,068 | | | $ | 41,441,600 | | | 16,717,042 | | | $ | 179,100,108 | |
Shares issued on mergera | | — | | | | — | | | 1,133,785 | | | | 13,775,492 | |
Shares issued in reinvestment of distributions | | 745,937 | | | | 7,698,069 | | | 754,190 | | | | 8,763,684 | |
Shares redeemed | | (8,386,415 | ) | | | (84,833,839 | ) | | (24,542,240 | ) | | | (265,795,668 | ) |
| | |
| |
Net increase (decrease) | | (3,570,410 | ) | | $ | (35,694,170 | ) | | (5,937,223 | ) | | $ | (64,156,384 | ) |
| | |
|
|
| Class 2 Shares: | | | | | | | | | | | | |
Shares sold | | 77,265,095 | | | $ | 769,052,246 | | | 160,323,831 | | | $ | 1,703,285,592 | |
Shares issued on mergera | | — | | | | — | | | 1,702,025 | | | | 20,475,362 | |
Shares issued in reinvestment of distributions | | 669,785 | | | | 6,848,227 | | | 374,013 | | | | 4,308,628 | |
Shares redeemed | | (56,376,439 | ) | | | (551,562,091 | ) | | (149,780,718 | ) | | | (1,607,670,068 | ) |
| | |
| |
Net increase (decrease) | | 21,558,441 | | | $ | 224,338,382 | | | 12,619,151 | | | $ | 120,399,514 | |
| | |
| |
| a | On May 1, 2002, the Fund acquired the net assets of Templeton International Smaller Companies Fund in a taxable exchange pursuant to a plan of reorganization approved by the Templeton International Smaller Companies Fund shareholders. |
3. TRANSACTIONS WITH AFFILIATES
Certain officers and trustees of the Fund are also officers and/or directors of the following entities:
| | |
| Entity | | Affiliation |
|
Franklin Templeton Services LLC (FT Services) | | Administrative manager |
Templeton Investment Counsel LLC (TIC) | | Investment manager |
Franklin/Templeton Distributors Inc. (Distributors) | | Principal underwriter |
Franklin/Templeton Investor Services LLC (Investor Services) | | Transfer agent |
The Fund pays an investment management fee to TIC based on the average daily net assets of the Fund as follows:
| | |
| Annualized Fee Rate | | Net Assets |
|
| .75% | | First $200 million |
| .675% | | Over $200 million, up to and including $1.3 billion |
| .60% | | Over $1.3 billion |
The Fund pays a business management fees to FT Services based on the average daily net assets of the Fund as follows:
| | |
| Annualized Fee Rate | | Net Assets |
|
| .15% | | First $200 million |
| .135% | | Over $200 million, up to and including $700 million |
| .10% | | Over $700 million, up to and including $1.2 billion |
Fees are further reduced on net assets over $1.2 billion.
The Fund reimburses Distributors up to .25% per year of its average daily net assets of Class 2, for costs incurred in marketing the Fund’s shares.
Investor Services, under terms of an agreement, performs shareholder servicing for the Fund and is not paid by the Fund for the services.
TF-16
FRANKLIN TEMPLETON VARIABLE INSURANCE PRODUCTS TRUST
TEMPLETON FOREIGN SECURITIES FUND
Notes to Financial Statements (continued)
4. INCOME TAXES
At December 31, 2003, the Fund had tax basis capital losses of $146,623,002 which may be carried over to offset future capital gains. Such losses expire as follows:
| | | |
Capital loss carryovers expiring in: | | | |
2009 | | $ | 25,468,205 |
2010 | | | 54,671,097 |
2011 | | | 66,483,700 |
| | |
|
| | | $ | 146,623,002 |
| | |
|
|
At December 31, 2003, the Fund has deferred currency losses occurring subsequent to October 31, 2003 of $51,695. For tax purposes, such losses will be reflected in the year ending December 31, 2004.
The tax character of distributions paid during the years ended December 31, 2003 and 2002, was as follows:
| | | | | | |
| | | 2003
| | 2002
|
Distributions paid from: | | | | | | |
Ordinary income | | $ | 14,546,296 | | $ | 13,072,312 |
Long term capital gains | | | — | | | — |
| | |
|
| | | $ | 14,546,296 | | $ | 13,072,312 |
| | |
|
At December 31, 2003, the cost of investments, net unrealized appreciation (depreciation), undistributed ordinary income and undistributed long term capital gains for income tax purposes were as follows:
| | | | |
Cost of investments | | $ | 949,111,026 | |
| | |
|
|
|
Unrealized appreciation | | $ | 220,505,970 | |
Unrealized depreciation | | | (51,283,387 | ) |
| | |
|
|
|
Net unrealized appreciation (depreciation) | | $ | 169,222,583 | |
| | |
|
|
|
Undistributed ordinary income | | $ | 14,279,043 | |
Undistributed long term capital gains | | | — | |
| | |
|
|
|
Distributable earnings | | $ | 14,279,043 | |
| | |
|
|
|
Net investment income and net realized gains (losses) differ for financial statement and tax purposes primarily due to differing treatments of foreign currency transactions and passive foreign investment company shares.
5. INVESTMENT TRANSACTIONS
Purchases and sales of securities (excluding short-term securities) for the period ended December 31, 2003 aggregated $223,736,214 and $129,917,072, respectively.
6. INVESTMENT IN FRANKLIN INSTITUTIONAL FIDUCIARY TRUST MONEY MARKET PORTFOLIO
The Fund may invest in the Franklin Institutional Fiduciary Trust Money Market Portfolio (the Sweep Money Fund), an open-end investment company managed by Advisers. Management fees paid by the Fund are reduced on assets invested in the Sweep Money Fund, in an amount not to exceed the management fees paid by the Sweep Money Fund. The Fund earned $797,901 of dividend income from investment in the Sweep Money Fund for the period ended December 31, 2003.
TF-17
FRANKLIN TEMPLETON VARIABLE INSURANCE PRODUCTS TRUST
TEMPLETON FOREIGN SECURITIES FUND
Notes to Financial Statements (continued)
7. REGULATORY MATTERS
On February 4, 2004, the Securities Division of the Office of the Secretary of the Commonwealth of Massachusetts filed an administrative complaint against Franklin Resources, Inc. and certain of its subsidiaries (the “Company”), alleging violations of the Massachusetts Uniform Securities Act. The complaint arises from activity that occurred in 2001 during which time an officer of a Company subsidiary was negotiating an agreement with an investor relating to investments in a mutual fund and a hedge fund.
The Company, in addition to other entities within Franklin Templeton Investments, has been named in shareholder class actions related to the matter described above. The Company believes that the claims made in the lawsuit are without merit and it intends to defend vigorously against the allegations. The Company and the Fund may be named in similar civil actions related to the matter described above.
In addition, as part of ongoing investigations by the U.S. Securities and Exchange Commission (the “SEC”), the U.S. Attorney for the Northern District of California, the New York Attorney General, the California Attorney General, the U.S. Attorney for the District of Massachusetts, the Florida Department of Financial Services, and the Commissioner of Securities and the Attorney General of the State of West Virginia, relating to certain practices in the mutual fund industry, including late trading, market timing and sales compensation arrangements, the Company and its subsidiaries, as well as certain current or former executives and employees of the Company, have received requests for information and/or subpoenas to testify or produce documents. The Company and its current employees are providing documents and information in response to these requests and subpoenas. In addition, the Company has responded to requests for similar kinds of information from regulatory authorities in some of the foreign countries where the Company conducts its global asset management business.
The Staff of the SEC has informed the Company that it intends to recommend that the Commission authorize an action against an affiliate of the Fund’s adviser and a senior executive officer relating to the frequent trading issues that are the subject of the SEC’s investigation. These issues were previously disclosed as being under investigation by government authorities and the subject of an internal inquiry by the Company in its Annual Report on Form 10-K and on its public website. The Company currently is in discussions with the SEC Staff in an effort to resolve the issues raised in their investigation. Such discussions are preliminary and the Fund’s management has been advised that the Company cannot predict the likelihood of whether those discussions will result in a settlement and, if so, the terms of such settlement. The impact, if any, of these matters on the Fund is uncertain at this time. If the Company finds that it bears responsibility for any unlawful or improper conduct, it has committed to making the Fund or its shareholders whole, as appropriate.
TF-18
FRANKLIN TEMPLETON VARIABLE INSURANCE PRODUCTS TRUST
TEMPLETON FOREIGN SECURITIES FUND
Independent Auditors’ Report
To the Board of Trustees and Shareholders of
Franklin Templeton Variable Insurance Products Trust
In our opinion, the accompanying statement of assets and liabilities, including the statement of investments, and the related statements of operations and of changes in net assets and the financial highlights present fairly, in all material respects, the financial position of the Templeton Foreign Securities Fund (the Fund) (one of the funds constituting the Franklin Templeton Variable Insurance Products Trust) at December 31, 2003, the results of its operations for the year then ended, the changes in its net assets for each of the two years in the period then ended and the financial highlights for each of the periods presented, in conformity with accounting principles generally accepted in the United States of America. These financial statements and financial highlights (hereafter referred to as “financial statements”) are the responsibility of the Fund’s management; our responsibility is to express an opinion on these financial statements based on our audits. We conducted our audits of these financial statements in accordance with auditing standards generally accepted in the United States of America, which require that we plan and perform the audits to obtain reasonable assurance about whether the financial statements are free of material misstatement. An audit includes examining, on a test basis, evidence supporting the amounts and disclosures in the financial statements, assessing the accounting principles used and significant estimates made by management, and evaluating the overall financial statement presentation. We believe that our audits, which included confirmation of securities at December 31, 2003 by correspondence with the custodian and brokers, provide a reasonable basis for our opinion.
PricewaterhouseCoopers LLP
San Francisco, California
February 5, 2004, except for Note 7 as to which the date is February 12, 2004
TF-19
FRANKLIN TEMPLETON VARIABLE INSURANCE PRODUCTS TRUST
TEMPLETON FOREIGN SECURITIES FUND
Tax Designation (unaudited)
At December 31, 2003, more than 50% of the Fund’s total assets were invested in securities of foreign issuers. In most instances, foreign taxes were withheld from dividends paid to the Fund on these investments. The Fund elects to treat foreign taxes paid under Section 853 of the Internal Revenue Code. This election will allow shareholders of record in June 2004, to treat their proportionate share of foreign taxes paid by the Fund as having been paid directly by them. The shareholder shall consider these amounts as foreign taxes paid in the tax year in which they receive the Fund distribution.
The foreign tax information will be disclosed in the June 30, 2004, semi-annual report of the Fund.
TF-20
TEMPLETON GLOBAL ASSET ALLOCATION FUND
Fund Goal and Primary Investments: Templeton Global Asset Allocation Fund seeks high total return. The Fund will invest in equity securities of companies of any country, debt securities of companies and governments of any country, and in money market instruments. The Fund may invest in lower-rated “junk bonds.”
We are pleased to bring you Templeton Global Asset Allocation Fund’s annual report covering the fiscal year ended December 31, 2003.
Performance Overview
You can find the Fund’s one-year total return in the Performance Summary following this report. The Fund underperformed its broad equity benchmark, the Morgan Stanley Capital International (MSCI) All Country World Free Index, which returned 34.63% for the year under review, and it outperformed its fixed income benchmark, the J.P. Morgan Global Government Bond Index (JPM GGBI), which returned 14.51% for the same period.1
Economic and Market Overview
In spring 2003, the end of major conflict in Iraq coincided with the start of a global equity market rally that produced the strongest annual total returns since 1986. The rally’s main catalyst was an improving global economy, underpinned by expansionary fiscal and monetary policies, corporate restructuring and consolidation, and more than two years of declining equity valuations that created potential opportunities in Asia, Europe and the Americas.
In many countries, including the U.S., China and Japan, gross domestic product (GDP) growth accelerated in 2003, particularly in the second half of the year. In the U.S., GDP grew at annualized rates of 3.1% and 8.2% in the second and third quarters. Over the same periods, consumer spending rose at annualized rates of 3.3% and 6.9% spurred largely by tax cuts, car-buying incentives and mortgage refinancing, as interest rates remained at the lowest level in more than four decades. Industrial production increased in the U.S., China, Japan and South Korea in the second half of the year, as did consumer sentiment in the U.S., U.K., Germany and Sweden, and business sentiment in the U.S., Australia, Germany and Japan. In short, a synchronized global economic recovery gained momentum in the second half of 2003.
1. Sources: Standard & Poor’s Micropal; J.P. Morgan. One cannot invest directly in an index, nor is an index representative of the Fund’s portfolio. Please see Index Descriptions following the Fund Summaries.
TGA-1
Further evidence of this recovery was the continued rise in the prices of base metals and other commodities. This was due, in part, to greater demand in China. On December 31, 2003, contracts for aluminum and other metals such as silver, gold, copper and zinc were anywhere from 19% to 50% higher than 12 months before.2 While gold crossed the $400-an-ounce threshold for the first time in more than seven years, such agricultural commodities as cotton and soybeans gained approximately 40%.2 Despite rising commodities prices, global inflation remained subdued throughout the year.
In 2003, the value of the U.S. dollar fell against most major currencies, including a 17% decline versus the euro.3 While the decline magnified top-line and earnings-per-share growth in the U.S., it had the opposite effect in Europe. The dollar decline also benefited U.S. investors in international equities because it increased the returns of investments denominated in currencies that appreciated against the dollar, such as the euro. Although the dollar’s decline significantly affected equity market returns, it was not the only reason for the past year’s gains. Equity markets in many countries, including emerging market countries, produced stronger gains than the U.S. equity market, even in their local currencies. These countries benefited from the improving economic and financial market conditions in 2003.
Global bond markets benefited from the low interest rate environment and currency developments as most major currencies appreciated against the U.S. dollar during the reporting period. The euro zone and other European countries had positive short-term yield differentials and stronger balance-of-payment positions relative to the U.S. For example, in contrast to a widening U.S. current account deficit during the year, the euro zone posted a trailing 12-month current account surplus in September 2003. In addition, export growth and current account surpluses supported international reserve accumulation in many countries.
Investment Strategy
Our investment philosophy is bottom-up, value-oriented and long-term. In choosing equity investments, we will focus on the market price of a company’s securities relative to our evaluation of the company’s potential long-term earnings, asset value and cash flow. Among factors we consider are a company’s historical value measures, including price/earnings ratio, profit margins and liquidation value.
2. Source: Reuters, Commodity Research Bureau Index; London Metal Exchange.
3. Source: European Central Bank.
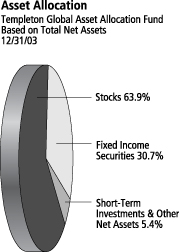
TGA-2
In choosing debt investments, we allocate our assets among issuers, geographic regions and currencies based upon our assessment of relative interest rates among currencies, our outlook for changes in interest rates, and credit risks. With respect to debt securities, we may also from time to time make use of forward currency exchange contracts (Hedging Instruments) for hedging purposes.
Manager’s Discussion
During the 12 months under review, the Fund’s overweighted equity position in the materials sector relative to the MSCI All Country World Free Index benefited performance as that sector outperformed the overall index, and the Fund’s equity holdings in materials posted better overall returns than the index’s overall materials sector return. The Fund’s equity positions in the industrials sector also benefited relative performance because they outperformed the overall index.
Despite the Fund’s double-digit returns, some equity sector positioning dampened performance. Detractors from Fund performance during the year included poor performance from several of the Fund’s consumer staples holdings. The Fund’s underweighted financials sector exposure, despite the outperformance of several of the Fund’s specific financials positions, also hindered overall relative performance because that sector outperformed the overall index for the period.
Regarding the Fund’s income allocation, developed market interest rate movements, currency returns and emerging market bonds, in addition to income, contributed to the Fund’s performance. Monetary easing by certain major central banks around the world provided a positive backdrop for local bond markets and positively impacted the Fund’s performance. Slow economic growth at the beginning of the year, accompanied by heightened geopolitical uncertainty, rising unemployment and disinflationary pressures provided a favorable environment for an accommodative monetary stance at many major central banks.
The U.S. dollar’s depreciation against the euro positively impacted Fund performance during the period, as the euro represented the largest currency exposure of the Fund’s fixed income securities throughout the reporting period. However, currencies from some regions, particularly Asia, did not experience similar appreciation against the U.S. dollar despite larger trade surpluses with the U.S. Consequently, the Fund reallocated some exposure toward the end of the reporting period away from the euro zone and into Asia seeking to position the Fund for
Top 5 Country Holdings
Templeton Global Asset Allocation Fund
Based on Total Net Assets 12/31/03
| | |
|
| |
| U.S. | | 13.1% |
| |
| U.K. | | 7.5% |
| |
| Germany | | 6.8% |
| |
| France | | 6.8% |
| |
| Sweden | | 6.5% |
Top 5 Sectors/Industries
Templeton Global Asset Allocation Fund
Based on Equity Securities 12/31/03
| | |
| | | % of Total
Net Assets |
|
| |
| Diversified Telecommunication Services | | 4.7% |
| |
| Insurance | | 4.7% |
| |
| Pharmaceuticals | | 4.3% |
| |
| Banks | | 3.5% |
| |
| Media | | 3.0% |
The dollar value, number of shares or principal amount, and complete legal titles of all portfolio holdings are listed in the Fund’s Statement of Investments.
TGA-3
potential global economic recovery as well as to take advantage of the discrepancy between currency performance and macroeconomic trends.
The Australian dollar and New Zealand dollar were the top performing developed country currencies, appreciating 25.27% and 20.34%, respectively, against the U.S. dollar during the Fund’s fiscal year, bringing these countries’ bond returns in U.S. dollar terms to 37.32% and 33.75%.4 The Fund’s positions in the two countries contributed positively to the Fund’s performance during the period.
Japan underperformed other developed bond markets in U.S. dollar terms, returning only 9.84% during the year, with 9.69% appreciation of the yen against the U.S. dollar.5 Although Japan benefited during the past year from a cyclical economic recovery and improving export strength, concerns remained about the country’s banking sector health and structural reform progress. We sought exposure to Asia’s cyclical, regional economic recovery through a variety of currencies from the region without exposure to any country-specific risks in Japan.
Thank you for your participation in Templeton Global Asset Allocation Fund. We look forward to serving your future investment needs.
4. Source: JPM GGBI; Citigroup World Government Bond Index.
5. Source: J.P. Morgan Government Bond Index Monitor, December 2003.
This discussion reflects our analysis, opinions and portfolio holdings as of December 31, 2003, the end of the reporting period. The way we implement our main investment strategies and the resulting portfolio holdings may change depending on factors such as market and economic conditions. These opinions may not be relied upon as investment advice or an offer for a particular security. The information is not a complete analysis of every aspect of any market, country, industry, security or the Fund. Statements of fact are from sources considered reliable, but the advisor makes no representation or warranty as to their completeness or accuracy. Although historical performance is no guarantee of future results, these insights may help you understand our investment management philosophy.
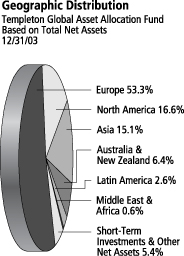
TGA-4
PERFORMANCE SUMMARYASOF 12/31/03
Total return of Class 1 shares represents the average annual change in value, assuming reinvestment of dividends and capital gains. Average returns smooth out variations in returns, which can be significant; they are not the same as year-by-year results.
Templeton Global Asset Allocation Fund – Class 1*
Periods ended 12/31/03
| | | | | | |
| | | 1-Year | | 5-Year | | 10-Year |
|
| | | |
Average Annual Total Return | | +32.31% | | +7.12% | | +9.38% |
*Performance prior to the 5/1/00 merger reflects the historical performance of Templeton Asset Allocation Fund.
Ongoing market volatility can significantly affect short-term performance; recent returns may differ.
Total Return Index Comparison for Hypothetical $10,000 Investment (1/1/94–12/31/03)
The graph compares the performance of Templeton Global Asset Allocation Fund – Class 1,* the MSCI All Country World Free Index and the J.P. Morgan Global Government Bond Index. One cannot invest directly in an index, nor is an index representative of the Fund’s portfolio. Please see Important Notes to Performance Information preceding the Fund Summaries.
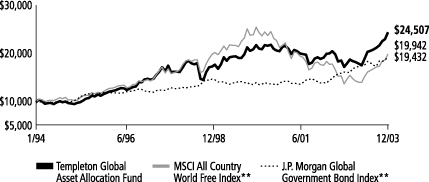
**Sources: Standard & Poor’s Micropal; J.P. Morgan. Please see Index Descriptions following the Fund Summaries.
Templeton Global Asset Allocation Fund – Class 1
Performance reflects the Fund’s Class 1 operating expenses, but does not include any contract fees, expenses or sales charges. If they had been included, performance would be lower. These charges and deductions, particularly for variable life policies, can have a significant effect on contract values and insurance benefits. See the contract prospectus for a complete description of these expenses, including sales charges.
Since markets can go down as well as up, investment return and the value of your principal will fluctuate with market conditions, and you may have a gain or loss when you sell your shares.
Past performance does not guarantee future results.
TGA-5
TEMPLETON GLOBAL ASSET ALLOCATION FUND
FRANKLIN TEMPLETON VARIABLE INSURANCE PRODUCTS TRUST
SUPPLEMENT DATED FEBRUARY 12, 2004
TOTHE PROSPECTUS DATED MAY 1, 2003
The Management section on page TGA-5 is replaced with the following:
Templeton Investment Counsel, LLC (Investment Counsel), Broward Financial Centre, Suite 2100, For Lauderdale, Florida 33394, is the Fund’s investment manager.
Under an agreement with TIC, Franklin Advisers, Inc. (Advisers), One Franklin Parkway, San Mateo, California 94403-1906, is the Fund’s sub-advisor. Advisers provides Investment Counsel with investment management advice and assistance with respect to the Fund’s investments in debt securities.
The team responsible for managing the equity portion of the Fund is:
| | |
| |
Peter A. Nori, CFA EXECUTIVE VICE PRESIDENT/PORTFOLIO MANAGER—RESEARCH ANALYST | | Mr. Nori has managed the equity portion of the Fund since 1996, and has been with Franklin Templeton Investments since 1987. |
| |
Tucker Scott, CFA SENIOR VICE PRESIDENT | | Mr. Scott has managed the equity portion of the Fund since 1998, and has been with Franklin Templeton Investments since 1996. |
| |
Mark R. Beveridge, CFA EXECUTIVE VICE PRESIDENT/PORTFOLIO MANAGER—RESEARCH ANALYST | | Mr. Beveridge has been a manager of the Fund since 2003, and has been with Franklin Templeton Investments since 1985. |
|
The team responsible for managing the bond portion of the Fund is: |
| |
Alexander C. Calvo SENIOR VICE PRESIDENT OF ADVISERS | | Mr. Calvo has managed the bond portion of the Fund since 1998, and has been with Franklin Templeton Investments since 1995. |
| |
Michael Hasenstab, PH.D. PORTFOLIO MANAGER/RESEARCH ANALYST OF ADVISERS | | Dr. Hasenstab has been a manager of the bond portion of the Fund since 2002 and an analyst since 2001. He first joined Franklin Templeton Investments in 1995, rejoining again in 2001 after a three-year leave to obtain his PH.D. |
The Fund pays Investment Counsel a fee for managing the Fund’s assets. For the fiscal year ended December 31, 2002, the management fee, before any reduction, was 0.62% of the Fund’s average daily net assets. Under an agreement by Investment Counsel to reduce its fee to reflect reduced services resulting from the Fund’s investment in a Franklin Templeton money fund, the Fund paid 0.60% of its average daily net assets to Investment Counsel for its services. This reduction is required by the Board and an SEC order.
Please keep this supplement for future reference.
TGA-6
FRANKLIN TEMPLETON VARIABLE INSURANCE PRODUCTS TRUST
TEMPLETON GLOBAL ASSET ALLOCATION FUND
Financial Highlightsa
| | | | | | | | | | | | | | | | | | | | |
| | | Class 1
| |
| | | Year Ended December 31,
| |
| | | 2003 | | | 2002 | | | 2001 | | | 2000 | | | 1999 | |
| | |
|
|
|
Per share operating performance | | | | | | | | | | | | | | | | | | | | |
(For a share outstanding throughout the year) | | | | | | | | | | | | | | | | | | | | |
| | | | | |
Net asset value, beginning of year | | $ | 14.59 | | | $ | 15.51 | | | $ | 19.22 | | | $ | 23.37 | | | $ | 22.46 | |
| | |
|
|
|
Income from investment operations: | | | | | | | | | | | | | | | | | | | | |
Net investment incomeb | | | .41 | | | | .39 | | | | .38 | d | | | .44 | | | | .44 | |
Net realized and unrealized gains (losses) | | | 4.23 | | | | (1.01 | ) | | | (2.16 | )d | | | (.45 | ) | | | 3.78 | |
| | |
|
|
|
Total from investment operations | | | 4.64 | | | | (.62 | ) | | | (1.78 | ) | | | (.01 | ) | | | 4.22 | |
| | |
|
|
|
Less distributions from: | | | | | | | | | | | | | | | | | | | | |
Net investment income | | | (.45 | ) | | | (.30 | ) | | | (.26 | ) | | | (.52 | ) | | | (.50 | ) |
Net realized gains | | | — | | | | — | | | | (1.67 | ) | | | (3.62 | ) | | | (2.81 | ) |
| | |
|
|
|
Total distributions | | | (.45 | ) | | | (.30 | ) | | | (1.93 | ) | | | (4.14 | ) | | | (3.31 | ) |
| | |
|
|
|
Net asset value, end of year | | $ | 18.78 | | | $ | 14.59 | | | $ | 15.51 | | | $ | 19.22 | | | $ | 23.37 | |
| | |
|
|
|
Total returnc | | | 32.31% | | | | (4.17 | )% | | | (9.72 | )% | | | .29% | | | | 22.86% | |
Ratios/supplemental data | | | | | | | | | | | | | | | | | | | | |
Net assets, end of year (000’s) | | $ | 572,798 | | | $ | 425,470 | | | $ | 501,074 | | | $ | 628,244 | | | $ | 671,549 | |
Ratios to average net assets: | | | | | | | | | | | | | | | | | | | | |
Expenses | | | .81% | | | | .81% | | | | .81% | | | | .81% | | | | .74% | |
Net investment income | | | 2.54% | | | | 2.56% | | | | 2.28% | d | | | 2.20% | | | | 2.06% | |
Portfolio turnover rate | | | 34.25% | | | | 27.27% | | | | 35.63% | | | | 30.32% | | | | 45.34% | |
| a | Financial highlights presented reflect historical financial information from Templeton Variable Products Series Fund (TVP)-Templeton Asset Allocation Fund as a result of a merger May 1, 2000. |
| b | Based on average daily shares outstanding. |
| c | Total return does not include any fees, charges or expenses imposed by the variable annuity and life insurance contracts for which the Franklin Templeton Variable Insurance Products Trust serves as an underlying investment vehicle. Total return is not annualized for periods less than one year. |
| d | Effective January 1, 2001, the Fund adopted the provisions of the AICPA Audit and Accounting Guide of Investment Companies and began amortizing all premium and discount on fixed-income securities, as required. The effect of this change was as follows: |
| | |
Net investment income per share | | $(0.018) |
Net realized and unrealized gains per share | | 0.018 |
Ratio of net investment income to average net assets | | (.10)% |
Per share data and ratios for prior periods have not been restated to reflect this change in accounting policy.
TGA-7
FRANKLIN TEMPLETON VARIABLE INSURANCE PRODUCTS TRUST
TEMPLETON GLOBAL ASSET ALLOCATION FUND
Financial Highlightsa (continued)
| | | | | | | | | | | | | | | | | | | | |
| | | Class 2
| |
| | | Year Ended December 31,
| |
| | | 2003 | | | 2002 | | | 2001 | | | 2000 | | | 1999 | |
| | |
|
|
|
Per share operating performance | | | | | | | | | | | | | | | | | | | | |
(For a share outstanding throughout the year | | | | | | | | | | | | | | | | | | | | |
| | | | | |
Net asset value, beginning of year | | $ | 14.49 | | | $ | 15.41 | | | $ | 19.13 | | | $ | 23.27 | | | $ | 22.38 | |
| | |
|
|
|
Income from investment operations: | | | | | | | | | | | | | | | | | | | | |
Net investment incomeb | | | .36 | | | | .34 | | | | 0.33 | d | | | .37 | | | | .36 | |
Net realized and unrealized gains (losses) | | | 4.20 | | | | (1.00 | ) | | | (2.15 | )d | | | (.43 | ) | | | 3.80 | |
| | |
|
|
|
Total from investment operations | | | 4.56 | | | | (.66 | ) | | | (1.82 | ) | | | (.06 | ) | | | 4.16 | |
| | |
|
|
|
Less distributions from: | | | | | | | | | | | | | | | | | | | | |
Net investment income | | | (.41 | ) | | | (.26 | ) | | | (.23 | ) | | | (.46 | ) | | | (.46 | ) |
Net realized gains | | | — | | | | — | | | | (1.67 | ) | | | (3.62 | ) | | | (2.81 | ) |
| | |
|
|
|
Total distributions | | | (.41 | ) | | | (.26 | ) | | | (1.90 | ) | | | (4.08 | ) | | | (3.27 | ) |
| | |
|
|
|
Net asset value, end of year | | $ | 18.64 | | | $ | 14.49 | | | $ | 15.41 | | | $ | 19.13 | | | $ | 23.27 | |
| | |
|
|
|
Total returnc | | | 31.95% | | | | (4.39 | )% | | | (9.95 | )% | | | .04% | | | | 22.54% | |
Ratios/supplemental data | | | | | | | | | | | | | | | | | | | | |
Net assets, end of year (000’s) | | $ | 55,754 | | | $ | 39,926 | | | $ | 38,974 | | | $ | 32,346 | | | $ | 20,962 | |
Ratios to average net assets: | | | | | | | | | | | | | | | | | | | | |
Expenses | | | 1.06% | | | | 1.06% | | | | 1.06% | | | | 1.07% | | | | .99% | |
Net investment income | | | 2.29% | | | | 2.31% | | | | 1.99% | d | | | 1.91% | | | | 1.71% | |
Portfolio turnover rate | | | 34.25% | | | | 27.27% | | | | 35.63% | | | | 30.32% | | | | 45.34% | |
| a | Financial highlights presented reflect historical financial information from Templeton Variable Products Series Fund (TVP)-Templeton Asset Allocation Fund as a result of a merger May 1, 2000. |
| b | Based on average daily shares outstanding. |
| c | Total return does not include any fees, charges or expenses imposed by the variable annuity and life insurance contracts for which the Franklin Templeton Variable Insurance Products Trust serves as an underlying investment vehicle. Total return is not annualized for periods less than one year. |
| d | Effective January 1, 2001, the Fund adopted the provisions of the AICPA Audit and Accounting Guide of Investment Companies and began amortizing all premium and discount on fixed-income securities, as required. The effect of this change was as follows: |
| | |
Net investment income per share | | $(0.018) |
Net realized and unrealized gains per share | | 0.018 |
Ratio of net investment income to average net assets | | (.10)% |
Per share data and ratios for prior periods have not been restated to reflect this change in accounting policy.
See notes to financial statements.
TGA-8
FRANKLIN TEMPLETON VARIABLE INSURANCE PRODUCTS TRUST
TEMPLETON GLOBAL ASSET ALLOCATION FUND
Statement of Investments, December 31, 2003
| | | | | | | |
| | | COUNTRY | | SHARES | | VALUE |
|
Common Stocks 63.5% | | | | | | | |
Aerospace & Defense 2.2% | | | | | | | |
BAE Systems PLC | | United Kingdom | | 153,055 | | $ | 460,992 |
Boeing Co. | | United States | | 116,600 | | | 4,913,524 |
Rolls-Royce Group PLC | | United Kingdom | | 2,733,657 | | | 8,674,043 |
| | | | | | |
|
|
| | | | | | | | 14,048,559 |
| | | | | | |
|
|
Air Freight & Couriers 1.3% | | | | | | | |
Deutsche Post AG | | Germany | | 382,790 | | | 7,879,835 |
| | | | | | |
|
|
Auto Components 1.7% | | | | | | | |
Autoliv Inc., SDR | | Sweden | | 129,000 | | | 4,894,445 |
Valeo SA | | France | | 140,790 | | | 5,638,348 |
| | | | | | |
|
|
| | | | | | | | 10,532,793 |
| | | | | | |
|
|
Automobiles .6% | | | | | | | |
Volkswagen AG | | Germany | | 70,650 | | | 3,952,230 |
| | | | | | |
|
|
Banks 3.5% | | | | | | | |
DBS Group Holdings Ltd. | | Singapore | | 476,000 | | | 4,120,120 |
Kookmin Bank, ADR | | South Korea | | 164,670 | | | 6,231,113 |
Lloyds TSB Group PLC | | United Kingdom | | 343,900 | | | 2,758,046 |
Nordea AB, FDR | | Sweden | | 955,960 | | | 7,138,349 |
UBS AG | | Switzerland | | 29,200 | | | 1,999,790 |
| | | | | | |
|
|
| | | | | | | | 22,247,418 |
| | | | | | |
|
|
Chemicals 2.9% | | | | | | | |
Akzo Nobel NV | | Netherlands | | 63,665 | | | 2,457,302 |
BASF AG | | Germany | | 100,840 | | | 5,691,965 |
Bayer AG, Br. | | Germany | | 109,940 | | | 3,244,950 |
Dow Chemical Co. | | United States | | 156,500 | | | 6,505,705 |
| | | | | | |
|
|
| | | | | | | | 17,899,922 |
| | | | | | |
|
|
Commercial Services & Supplies 1.0% | | | | | | | |
Adecco SA | | Switzerland | | 53,000 | | | 3,406,913 |
R.R. Donnelley & Sons Co. | | United States | | 103,660 | | | 3,125,349 |
| | | | | | |
|
|
| | | | | | | | 6,532,262 |
| | | | | | |
|
|
Computers & Peripherals .4% | | | | | | | |
NEC Corp. | | Japan | | 319,000 | | | 2,348,521 |
Seiko Epson Corp., 144A | | Japan | | 7,500 | | | 349,911 |
| | | | | | |
|
|
| | | | | | | | 2,698,432 |
| | | | | | |
|
|
Containers & Packaging 1.2% | | | | | | | |
Temple-Inland Inc. | | United States | | 117,540 | | | 7,366,232 |
| | | | | | |
|
|
Diversified Financials 2.6% | | | | | | | |
ING Groep NV | | Netherlands | | 312,632 | | | 7,291,329 |
Nomura Holdings Inc. | | Japan | | 244,600 | | | 4,165,298 |
Swire Pacific Ltd., A | | Hong Kong | | 780,000 | | | 4,812,458 |
| | | | | | |
|
|
| | | | | | | | 16,269,085 |
| | | | | | |
|
|
Diversified Telecommunication Services 4.7% | | | | | | | |
Cable & Wireless PLC | | United Kingdom | | 975,500 | | | 2,331,309 |
Chunghwa Telecom Co. Ltd., ADR | | Taiwan | | 141,200 | | | 2,047,400 |
KT Corp., ADR | | South Korea | | 208,260 | | | 3,971,518 |
TGA-9
FRANKLIN TEMPLETON VARIABLE INSURANCE PRODUCTS TRUST
TEMPLETON GLOBAL ASSET ALLOCATION FUND
Statement of Investments, December 31, 2003 (cont.)
| | | | | | | |
| | | COUNTRY | | SHARES | | VALUE |
|
Common Stocks (cont.) | | | | | | | |
Diversified Telecommunication Services (cont.) | | | | | | | |
Nippon Telegraph & Telephone Corp. | | Japan | | 1,152 | | $ | 5,557,376 |
Nippon Telegraph & Telephone Corp., ADR | | Japan | | 5,680 | | | 139,501 |
Telecom Corp. of New Zealand Ltd. | | New Zealand | | 1,772,970 | | | 6,250,927 |
Telefonica SA, ADR | | Spain | | 96,339 | | | 4,257,220 |
Telefonos de Mexico SA de CV (Telmex), L, ADR | | Mexico | | 151,858 | | | 5,015,870 |
| | | | | | |
|
|
| | | | | | | | 29,571,121 |
| | | | | | |
|
|
Electric Utilities 1.6% | | | | | | | |
E.On AG | | Germany | | 92,290 | | | 6,045,181 |
Endesa SA | | Spain | | 122,000 | | | 2,346,746 |
Endesa SA, ADR | | Spain | | 88,000 | | | 1,680,800 |
| | | | | | |
|
|
| | | | | | | | 10,072,727 |
| | | | | | |
|
|
Electrical Equipment .9% | | | | | | | |
Kidde PLC | | United Kingdom | | 1,581,900 | | | 3,015,921 |
Vestas Wind Systems AS | | Denmark | | 148,160 | | | 2,409,452 |
| | | | | | |
|
|
| | | | | | | | 5,425,373 |
| | | | | | |
|
|
Electronic Equipment & Instruments .8% | | | | | | | |
Hitachi Ltd. | | Japan | | 845,000 | | | 5,093,496 |
| | | | | | |
|
|
Finance .7% | | | | | | | |
JP Morgan Chase & Co. | | United States | | 76,000 | | | 2,791,480 |
Morgan Stanley | | United States | | 30,900 | | | 1,788,183 |
| | | | | | |
|
|
| | | | | | | | 4,579,663 |
| | | | | | |
|
|
Food & Drug Retailing 1.0% | | | | | | | |
J Sainsbury PLC | | United Kingdom | | 1,166,200 | | | 6,529,225 |
| | | | | | |
|
|
Food Products 2.7% | | | | | | | |
Cadbury Schweppes PLC | | United Kingdom | | 37,230 | | | 273,422 |
Kraft Foods Inc., A | | United States | | 133,290 | | | 4,294,604 |
Nestle SA | | Switzerland | | 29,910 | | | 7,472,965 |
Unilever PLC | | United Kingdom | | 513,650 | | | 4,788,372 |
| | | | | | |
|
|
| | | | | | | | 16,829,363 |
| | | | | | |
|
|
Health Care Providers & Services .5% | | | | | | | |
aWellpoint Health Networks Inc. | | United States | | 35,030 | | | 3,397,560 |
| | | | | | |
|
|
Household Durables 2.3% | | | | | | | |
Koninklijke Philips Electronics NV | | Netherlands | | 283,767 | | | 8,286,082 |
Sony Corp. | | Japan | | 41,300 | | | 1,429,719 |
Sony Corp., ADR | | Japan | | 136,900 | | | 4,746,323 |
| | | | | | |
|
|
| | | | | | | | 14,462,124 |
| | | | | | |
|
|
Insurance 4.7% | | | | | | | |
Ace Ltd. | | Bermuda | | 101,700 | | | 4,212,414 |
AXA SA | | France | | 316,124 | | | 6,766,680 |
aPICC Property & Casualty Co. Ltd., 144A | | China | | 190,000 | | | 85,044 |
Riunione Adriatica di Sicurta SpA | | Italy | | 387,122 | | | 6,592,012 |
Swiss Reinsurance Co. | | Switzerland | | 95,570 | | | 6,452,472 |
XL Capital Ltd., A | | Bermuda | | 68,810 | | | 5,336,216 |
| | | | | | |
|
|
| | | | | | | | 29,444,838 |
| | | | | | |
|
|
TGA-10
FRANKLIN TEMPLETON VARIABLE INSURANCE PRODUCTS TRUST
TEMPLETON GLOBAL ASSET ALLOCATION FUND
Statement of Investments, December 31, 2003 (cont.)
| | | | | | | |
| | | COUNTRY | | SHARES | | VALUE |
|
Common Stocks (cont.) | | | | | | | |
Internet Software & Services .7% | | | | | | | |
aBearingpoint Inc. | | United States | | 410,000 | | $ | 4,136,900 |
| | | | | | |
|
|
IT Consulting & Services 1.6% | | | | | | | |
aCeridian Corp. | | United States | | 305,700 | | | 6,401,358 |
Satyam Computers Services Ltd. | | India | | 431,198 | | | 3,471,794 |
| | | | | | |
|
|
| | | | | | | | 9,873,152 |
| | | | | | |
|
|
Leisure Equipment & Products .4% | | | | | | | |
Mattel Inc. | | United States | | 131,100 | | | 2,526,297 |
| | | | | | |
|
|
Machinery 1.7% | | | | | | | |
Atlas Copco AB, A | | Sweden | | 199,100 | | | 7,125,242 |
Volvo AB, B | | Sweden | | 124,268 | | | 3,799,558 |
| | | | | | |
|
|
| | | | | | | | 10,924,800 |
| | | | | | |
|
|
Media 3.0% | | | | | | | |
aComcast Corp. | | United States | | 62,636 | | | 2,058,845 |
John Fairfax Holdings Ltd. | | Australia | | 2,021,680 | | | 5,361,779 |
Reed Elsevier NV | | Netherlands | | 501,600 | | | 6,232,038 |
aTime Warner Inc. | | United States | | 110,900 | | | 1,995,091 |
Wolters Kluwer NV | | Netherlands | | 215,741 | | | 3,374,355 |
| | | | | | |
|
|
| | | | | | | | 19,022,108 |
| | | | | | |
|
|
Metals & Mining 1.8% | | | | | | | |
Barrick Gold Corp. | | Canada | | 290 | | | 6,578 |
BHP Billiton Ltd. | | Australia | | 551,100 | | | 5,061,601 |
POSCO, ADR | | South Korea | | 180,000 | | | 6,114,600 |
| | | | | | |
|
|
| | | | | | | | 11,182,779 |
| | | | | | |
|
|
Multi-Utilities 1.2% | | | | | | | |
National Grid Transco PLC | | United Kingdom | | 420,100 | | | 3,010,061 |
Suez SA | | France | | 229,280 | | | 4,607,001 |
| | | | | | |
|
|
| | | | | | | | 7,617,062 |
| | | | | | |
|
|
Multiline Retail .7% | | | | | | | |
Target Corp. | | United States | | 107,000 | | | 4,108,800 |
| | | | | | |
|
|
Oil & Gas 2.9% | | | | | | | |
BP PLC | | United Kingdom | | 206,700 | | | 1,676,216 |
Eni SpA | | Italy | | 307,225 | | | 5,797,283 |
Husky Energy Inc. | | Canada | | 267,350 | | | 4,855,643 |
Shell Transport & Trading Co. PLC | | United Kingdom | | 756,100 | | | 5,623,951 |
| | | | | | |
|
|
| | | | | | | | 17,953,093 |
| | | | | | |
|
|
Paper & Forest Products .9% | | | | | | | |
Stora Enso OYJ, R | | Finland | | 416,260 | | | 5,607,539 |
| | | | | | |
|
|
Pharmaceuticals 4.3% | | | | | | | |
Abbott Laboratories | | United States | | 118,000 | | | 5,498,800 |
Aventis SA | | France | | 109,200 | | | 7,217,558 |
Bristol-Myers Squibb Co. | | United States | | 217,420 | | | 6,218,212 |
GlaxoSmithKline PLC | | United Kingdom | | 119,250 | | | 2,732,497 |
Ono Pharmaceutical Co. Ltd. | | Japan | | 137,000 | | | 5,151,721 |
| | | | | | |
|
|
| | | | | | | | 26,818,788 |
| | | | | | |
|
|
TGA-11
FRANKLIN TEMPLETON VARIABLE INSURANCE PRODUCTS TRUST
TEMPLETON GLOBAL ASSET ALLOCATION FUND
Statement of Investments, December 31,2003 (cont.)
| | | | | | | | |
| | | COUNTRY | | SHARES | | | VALUE |
|
Common Stocks (cont.) | | | | | | | | |
Real Estate 1.3% | | | | | | | | |
Cheung Kong Holdings Ltd. | | Hong Kong | | 1,031,500 | | | $ | 8,204,329 |
| | | | | | | |
|
|
Road & Rail .5% | | | | | | | | |
Nippon Express Co. Ltd. | | Japan | | 660,000 | | | | 3,116,171 |
| | | | | | | |
|
|
Semiconductors & Semiconductor Equipment 1.0% | | | | | | | | |
Samsung Electronics Co. Ltd. | | South Korea | | 16,790 | | | | 6,355,258 |
| | | | | | | |
|
|
Software 2.9% | | | | | | | | |
aBMC Software Inc. | | United States | | 291,900 | | | | 5,443,935 |
aCheck Point Software Technologies Ltd. | | Israel | | 216,000 | | | | 3,633,120 |
Nintendo Co. Ltd. | | Japan | | 54,800 | | | | 5,113,371 |
aSynopsys Inc. | | United States | | 128,080 | | | | 4,323,981 |
| | | | | | | |
|
|
| | | | | | | | | 18,514,407 |
| | | | | | | |
|
|
Specialty Retail .4% | | | | | | | | |
aToys R Us Inc. | | United States | | 191,600 | | | | 2,421,824 |
| | | | | | | |
|
|
Wireless Telecommunication Services .9% | | | | | | | | |
aAT&T Wireless Services Inc. | | United States | | 370,000 | | | | 2,956,300 |
China Mobile (Hong Kong) Ltd., fgn. | | China | | 928,000 | | | | 2,850,842 |
| | | | | | | |
|
|
| | | | | | | | | 5,807,142 |
| | | | | | | |
|
|
Total Common Stocks (Cost $327,740,545) | | | | | | | | 399,022,707 |
| | | | | | | |
|
|
Preferred Stock (Cost $1,226,665) .4% | | | | | | | | |
Cia Vale do Rio Doce, A, ADR, pfd. | | Brazil | | 46,840 | | | | 2,412,729 |
| | | | | | | |
|
|
| | | |
| | | | | PRINCIPAL
AMOUNTc
| | | |
Bonds 30.6% | | | | | | | | |
Buoni Poliennali Del Tesoro, | | | | | | | | |
7.75%, 11/01/06 | | Italy | | 3,974,190 | EUR | | | 5,623,419 |
5.50%, 11/01/10 | | Italy | | 2,300,000 | EUR | | | 3,162,004 |
5.00%, 2/01/12 | | Italy | | 1,810,000 | EUR | | | 2,407,702 |
Federal Republic of Germany, | | | | | | | | |
4.00%, 6/25/04 | | Germany | | 500,000 | EUR | | | 636,226 |
5.00%, 8/19/05 | | Germany | | 3,268,000 | EUR | | | 4,315,837 |
6.00%, 7/04/07 | | Germany | | 5,242,000 | EUR | | | 7,217,007 |
5.00%, 7/04/11 | | Germany | | 3,015,000 | EUR | | | 4,030,106 |
Federation of Russia, Reg S, 5.00% to 3/31/07, 7.50% thereafter, 3/31/30 | | Russia | | 10,400,000 | | | | 9,991,800 |
Finland Govt, 3.00%, 07/04/08 | | Finland | | 1,850,000 | EUR | | | 2,288,465 |
French Treasury Note, 4.75%, 7/12/07 | | France | | 5,400,000 | EUR | | | 7,158,678 |
Government of Canada, | | | | | | | | |
6.00%, 6/01/08 | | Canada | | 2,212,000 | CAD | | | 1,859,287 |
6.00%, 6/01/11 | | Canada | | 6,849,000 | CAD | | | 5,807,565 |
Government of France, | | | | | | | | |
3.00%, 7/12/08 | | France | | 2,100,000 | EUR | | | 2,596,392 |
4.00%, 10/25/09 | | France | | 6,420,000 | EUR | | | 8,205,575 |
Government of Netherlands, | | | | | | | | |
5.75%, 2/15/07 | | Netherlands | | 3,958,000 | EUR | | | 5,383,838 |
5.00%, 7/15/12 | | Netherlands | | 1,760,000 | EUR | | | 2,347,629 |
Government of New Zealand, 7.00%, 7/15/09 | | New Zealand | | 20,308,000 | NZD | | | 14,054,574 |
TGA-12
FRANKLIN TEMPLETON VARIABLE INSURANCE PRODUCTS TRUST
TEMPLETON GLOBAL ASSET ALLOCATION FUND
Statement of Investments, December 31, 2003 (cont.)
| | | | | | | | |
| | | COUNTRY | | PRINCIPAL
AMOUNTc | | | VALUE |
|
Bonds (cont.) | | | | | | | | |
Government of Spain, | | | | | | | | |
4.50%, 7/30/04 | | Spain | | 1,850,000 | EUR | | $ | 2,366,040 |
10.15%, 1/31/06 | | Spain | | 2,450,000 | EUR | | | 3,549,842 |
4.80%, 10/31/06 | | Spain | | 7,480,000 | EUR | | | 9,909,490 |
5.00%, 7/30/12 | | Spain | | 2,920,000 | EUR | | | 3,891,614 |
Kingdom of Belgium, | | | | | | | | |
7.50%, 7/29/08 | | Belgium | | 4,193,000 | EUR | | | 6,167,328 |
5.00%, 9/28/12 | | Belgium | | 1,760,000 | EUR | | | 2,342,745 |
Kingdom of Denmark, | | | | | | | | |
5.00%, 8/15/05 | | Denmark | | 11,696,000 | DKK | | | 2,054,029 |
6.00%, 11/15/11 | | Denmark | | 14,660,000 | DKK | | | 2,775,346 |
5.00%, 11/15/13 | | Denmark | | 25,080,000 | DKK | | | 4,428,082 |
Kingdom of Norway, 5.75%, 11/30/04 | | Norway | | 5,030,000 | NOK | | | 779,360 |
Kingdom of Sweden, | | | | | | | | |
6.00%, 2/09/05 | | Sweden | | 35,430,000 | SEK | | | 5,084,572 |
5.50%, 10/08/12 | | Sweden | | 86,010,000 | SEK | | | 12,672,444 |
Kingdom of Thailand, 6.00%, 3/05/05 | | Thailand | | 172,000,000 | THB | | | 4,571,814 |
New South Wales Treasury Corp., | | | | | | | | |
6.50%, 5/01/06 | | Australia | | 9,688,000 | AUD | | | 7,443,211 |
8.00%, 3/01/08 | | Australia | | 2,430,000 | AUD | | | 1,985,916 |
Queensland Treasury Corp., 6.00%, 7/14/09 | | Australia | | 300,000 | AUD | | | 229,934 |
Republic of Austria, | | | | | | | | |
5.00%, 1/15/08 | | Austria | | 4,900,000 | EUR | | | 6,560,734 |
5.00%, 7/15/12 | | Austria | | 4,800,000 | EUR | | | 6,396,067 |
Republic of Bulgaria, 144A, 8.25%, 1/15/15 | | Bulgaria | | 2,748,000 | | | | 3,255,281 |
Republic of Indonesia, 14.00%, 6/15/09 | | Indonesia | | 18,000,000,000 | IDR | | | 2,216,207 |
Republic of Panama, 8.875%, 9/30/27 | | Panama | | 960,000 | | | | 1,012,800 |
Republic of Peru, FRN, 5.00%, 3/07/17 | | Peru | | 1,034,000 | | | | 965,154 |
Republic of Philippines, | | | | | | | | |
9.875%, 1/15/19 | | Philippines | | 1,400,000 | | | | 1,487,500 |
10.625%, 3/16/25 | | Philippines | | 1,070,000 | | | | 1,180,344 |
United Kingdom, 7.50%, 12/07/06 | | United Kingdom | | 2,717,000 | GBP | | | 5,265,370 |
United Mexican States, | | | | | | | | |
9.875%, 2/01/10 | | Mexico | | 724,000 | | | | 912,016 |
11.375%, 9/15/16 | | Mexico | | 1,330,000 | | | | 1,892,590 |
11.50%, 5/15/26 | | Mexico | | 2,895,000 | | | | 4,204,988 |
| | | | | | | |
|
|
Total Bonds (Cost $146,160,281) | | | | | | | | 192,686,922 |
| | | | | | | |
|
|
TGA-13
FRANKLIN TEMPLETON VARIABLE INSURANCE PRODUCTS TRUST
TEMPLETON GLOBAL ASSET ALLOCATION FUND
Statement of Investments, December 31, 2003 (cont.)
| | | | | | | | |
| | | COUNTRY | | PRINCIPAL
AMOUNTc | | | VALUE |
|
Convertible Bond (Cost $295,091) .1% | | | | | | | | |
Axa SA, cvt., zero cpn., 12/21/04 | | France | | 19,757 | EUR | | $ | 398,479 |
| | | | | | | |
|
|
Total Long Term Investments (Cost $475,422,582) | | | | | | | $ | 594,520,837 |
| | | | | | | |
|
|
| | | |
| | | | | SHARES
| | | |
Short Term Investments 4.7% | | | | | | | | |
bFranklin Institutional Fiduciary Trust Money Market Portfolio | | United States | | 25,296,859 | | | | 25,296,859 |
| | | | | | | |
|
|
| | | |
| | | | | PRINCIPAL
AMOUNTc
| | | |
Thailand Treasury Bill, zero cpn., 9/30/04 | | Thailand | | 183,500,000 | THB | | | 4,576,527 |
| | | | | | | |
|
|
Total Short Term Investments (Cost $29,843,136) | | | | | | | | 29,873,386 |
| | | | | | | |
|
|
Total Investments (Cost $505,265,718) 99.3% | | | | | | | | 624,394,223 |
Other Assets, less Liabilities .7% | | | | | | | | 4,158,425 |
| | | | | | | |
|
|
Net Assets 100.0% | | | | | | | $ | 628,552,648 |
| | | | | | | |
|
|
Currency Abbreviations:
AUD - Australian Dollar
CAD - Canadian Dollar
DKK - Danish Krone
EUR - Euro
GBP - British Pound
IDR - Indonesian Rupiah
NOK - Norwegian Krone
NZD - New Zealand Dollar
SEK - Swedish Krona
THB - Thai Baht
| b | See Note 6 regarding investments in the Franklin Institutional Fiduciary Trust Money Market Portfolio. |
| c | The principal amount is stated in U.S. dollars unless otherwise indicated. |
See notes to financial statements.
TGA-14
FRANKLIN TEMPLETON VARIABLE INSURANCE PRODUCTS TRUST
TEMPLETON GLOBAL ASSET ALLOCATION FUND
Financial Statements
Statement of Assets and Liabilities
December 31, 2003
| | | | |
Assets: | | | | |
Investments in securities: | | | | |
Cost | | $ | 505,265,718 | |
| | |
|
|
|
Value | | | 624,394,223 | |
Cash | | | 33,029 | |
Foreign currency, at value (cost $132,838) | | | 84,130 | |
Receivables: | | | | |
Capital shares sold | | | 22,194 | |
Dividends and interest | | | 5,260,367 | |
| | |
|
|
|
Total assets | | | 629,793,943 | |
| | |
|
|
|
Liabilities: | | | | |
Payables: | | | | |
Investment securities purchased | | | 257,678 | |
Capital shares redeemed | | | 379,781 | |
Affiliates | | | 398,604 | |
Deferred tax liability (Note 1f) | | | 104,220 | |
Other liabilities | | | 101,012 | |
| | |
|
|
|
Total liabilities | | | 1,241,295 | |
| | |
|
|
|
Net assets, at value | | $ | 628,552,648 | |
| | |
|
|
|
Net assets consist of: | | | | |
Undistributed net investment income | | $ | 14,496,244 | |
Net unrealized appreciation (depreciation) | | | 119,371,539 | |
Accumulated net realized gain (loss) | | | (56,385,081 | ) |
Capital shares | | | 551,069,946 | |
| | |
|
|
|
Net assets, at value | | $ | 628,552,648 | |
| | |
|
|
|
Class 1: | | | | |
Net assets, at value | | $ | 572,798,449 | |
| | |
|
|
|
Shares outstanding | | | 30,503,902 | |
| | |
|
|
|
Net asset value and offering price per share | | $ | 18.78 | |
| | |
|
|
|
Class 2: | | | | |
Net assets, at value | | $ | 55,754,199 | |
| | |
|
|
|
Shares outstanding | | | 2,990,819 | |
| | |
|
|
|
Net asset value and offering price per share | | $ | 18.64 | |
| | |
|
|
|
See notes to financial statements.
TGA-15
FRANKLIN TEMPLETON VARIABLE INSURANCE PRODUCTS TRUST
TEMPLETON GLOBAL ASSET ALLOCATION FUND
Financial Statements (continued)
Statement of Operations
for the year ended December 31, 2003
| | | | |
Investment income: | | | | |
(net of foreign taxes and fees of $1,023,360) | | | | |
Dividends | | $ | 8,617,648 | |
Interest | | | 8,545,712 | |
| | |
|
|
|
Total investment income | | | 17,163,360 | |
| | |
|
|
|
Expenses: | | | | |
Management fees (Note 3) | | | 3,073,575 | |
Administrative fees (Note 3) | | | 719,976 | |
Distribution fees - Class 2 (Note 3) | | | 112,664 | |
Transfer Agent fees | | | 2,740 | |
Other | | | 372,267 | |
| | |
|
|
|
Total expenses | | | 4,281,222 | |
| | |
|
|
|
Net investment income | | | 12,882,138 | |
| | |
|
|
|
Realized and unrealized gains (losses): | | | | |
Net realized gain (loss) from: | | | | |
Investments | | | (48,100,795 | ) |
Foreign currency transactions | | | 370,532 | |
| | |
|
|
|
Net realized gain (loss) | | | (47,730,263 | ) |
Net unrealized appreciation (depreciation) on: | | | | |
Investments | | | 183,925,992 | |
Translation of assets and liabilities denominated in foreign currencies | | | 111,224 | |
Deferred taxes (Note 1f) | | | (104,220) | |
| | |
|
|
|
Net unrealized appreciation (depreciation) | | | 183,932,996 | |
| | |
|
|
|
Net realized and unrealized gain (loss) | | | 136,202,733 | |
| | |
|
|
|
Net increase (decrease) in net assets resulting from operations | | $ | 149,084,871 | |
| | |
|
|
|
See notes to financial statements.
TGA-16
FRANKLIN TEMPLETON VARIABLE INSURANCE PRODUCTS TRUST
TEMPLETON GLOBAL ASSET ALLOCATION FUND
Financial Statements (continued)
Statements of Changes in Net Assets
for the years ended December 31, 2003 and 2002
| | | | | | | | |
| | | 2003 | | | 2002 | |
| | |
| |
Increase (decrease) in net assets: | | | | | | | | |
Operations: | | | | | | | | |
Net investment income | | $ | 12,882,138 | | | $ | 12,861,961 | |
Net realized gain (loss) from investments and foreign currency transactions | | | (47,730,263 | ) | | | 3,691,354 | |
Net unrealized appreciation (depreciation) on investments and translation of assets and liabilities denominated in foreign currencies, and deferred taxes | | | 183,932,996 | | | | (38,051,023 | ) |
| | |
| |
Net increase (decrease) in net assets resulting from operations | | | 149,084,871 | | | | (21,497,708 | ) |
Distributions to shareholders from: | | | | | | | | |
Net investment income: | | | | | | | | |
Class 1 | | | (12,872,007 | ) | | | (9,120,690 | ) |
Class 2 | | | (1,147,201 | ) | | | (750,622 | ) |
| | |
| |
Total distributions to shareholders | | | (14,019,208 | ) | | | (9,871,312 | ) |
Capital share transactions: (Note 2) | | | | | | | | |
Class 1 | | | 24,154,273 | | | | (46,847,936 | ) |
Class 2 | | | 3,935,942 | | | | 3,566,120 | |
| | |
| |
Total capital share transactions | | | 28,090,215 | | | | (43,281,816 | ) |
Net increase (decrease) in net assets | | | 163,155,878 | | | | (74,650,836 | ) |
Net assets: | | | | | | | | |
Beginning of year | | | 465,396,770 | | | | 540,047,606 | |
| | |
| |
End of year | | $ | 628,552,648 | | | $ | 465,396,770 | |
| | |
| |
Undistributed net investment income included in net assets: | | | | | | | | |
End of year | | $ | 14,496,244 | | | $ | 12,858,724 | |
| | |
| |
See notes to financial statements.
TGA-17
FRANKLIN TEMPLETON VARIABLE INSURANCE PRODUCTS TRUST
TEMPLETON GLOBAL ASSET ALLOCATION FUND
Notes to Financial Statements
1. ORGANIZATION AND SIGNIFICANT ACCOUNTING POLICIES
Franklin Templeton Variable Insurance Products Trust (the Trust) is registered under the Investment Company Act of 1940 as an open-end investment company, consisting of twenty-two separate series (the Funds). Templeton Global Asset Allocation Fund (the Fund) included in this report is diversified. Shares of the Fund are sold only to insurance company separate accounts to fund the benefits of variable life insurance policies or variable annuity contracts. As of December 31, 2003, over 53% of the total Fund shares were sold through one insurance company. The Fund’s investment objective is high total return.
The following summarizes the Fund’s significant accounting policies.
a. Security Valuation
Securities listed or traded on a recognized national exchange or NASDAQ are valued at the last reported sales price. Over-the-counter securities and listed securities for which no sale is reported are valued within the range of the latest quoted bid and asked prices. Foreign securities are valued at the close of trading of the foreign exchange or the NYSE, whichever is earlier. If events occur that materially affect the values of securities after the prices or foreign exchange rates are determined, or if market quotations are not readily available, the securities will be valued at fair value as determined following procedures approved by the Board of Trustees.
b. Foreign Currency Translation
Portfolio securities and other assets and liabilities denominated in foreign currencies are translated into U.S. dollars based on the exchange rate of such currencies against U.S. dollars on the date of valuation. Purchases and sales of securities and income items denominated in foreign currencies are translated into U.S. dollars at the exchange rate in effect on the transaction date.
The Fund does not separately report the effect of changes in foreign exchange rates from changes in market prices on securities held. Such changes are included in net realized and unrealized gain or loss from investments.
Realized foreign exchange gains or losses arise from sales of foreign currencies, currency gains or losses realized between the trade and settlement dates on securities transactions and the difference between the recorded amounts of dividends, interest, and foreign withholding taxes and the U.S. dollar equivalent of the amounts actually received or paid. Net unrealized foreign exchange gains and losses arise from changes in foreign exchange rates on foreign denominated assets and liabilities other than investments in securities held at the end of the reporting period.
c. Foreign Currency Contracts
When the Fund purchases or sells foreign securities it may enter into foreign exchange contracts to minimize foreign exchange risk from the trade date to the settlement date of the transactions. A foreign exchange contract is an agreement between two parties to exchange different currencies at an agreed upon exchange rate on a specified date. Realized and unrealized gains and losses are included in the Statement of Operations.
The risks of these contracts include movement in the values of the foreign currencies relative to the U.S. dollar and the possible inability of the counterparties to fulfill their obligations under the contracts.
d. Income Taxes
No provision has been made for income taxes because the Fund’s policy is to qualify as a regulated investment company under the Internal Revenue Code and to distribute substantially all of its taxable income.
e. Security Transactions, Investment Income, Expenses and Distributions
Security transactions are accounted for on trade date. Realized gains and losses on security transactions are determined on a specific identification basis. Certain income from foreign securities is recorded as soon as information is available to the Fund.
TGA-18
FRANKLIN TEMPLETON VARIABLE INSURANCE PRODUCTS TRUST
TEMPLETON GLOBAL ASSET ALLOCATION FUND
Notes to Financial Statements (continued)
1. ORGANIZATION AND SIGNIFICANT ACCOUNTING POLICIES (cont.)
e. Security Transactions, Investment Income, Expenses and Distributions (cont.)
Interest income and estimated expenses are accrued daily. Discounts and premiums on securities purchased are amortized over the lives of the respective securities. Dividend income and distributions to shareholders are recorded on the ex-dividend date.
Common expenses incurred by the Trust are allocated among the Funds based on the ratio of net assets of each Fund to the combined net assets. Other expenses are charged to each Fund on a specific identification basis.
Realized and unrealized gains and losses and net investment income, other than class specific expenses, are allocated daily to each class of shares based upon the relative proportion of net assets of each class.
f. Deferred Taxes
The Fund is subject to a tax imposed on net realized gains of securities of certain foreign countries. The Fund records an estimated deferred tax liability for net unrealized gains on these securities as reflected in the accompanying financial statements.
g. Accounting Estimates
The preparation of financial statements in accordance with accounting principles generally accepted in the United States of America requires management to make estimates and assumptions that affect the reported amounts of assets and liabilities at the date of the financial statements and the amounts of income and expenses during the reporting period. Actual results could differ from those estimates.
h. Guarantees and Indemnifications
Under the Trust’s organizational documents, its officers and trustees are indemnified against certain liability arising out of the performance of their duties to the Trust. Additionally, in the normal course of business, the Trust enters into contracts with service providers that contain general indemnification clauses. The Trust’s maximum exposure under these arrangements is unknown as this would involve future claims that may be made against the Trust that have not yet occurred. However, based on experience, the Trust expects the risk of loss to be remote.
2. SHARES OF BENEFICIAL INTEREST
The Fund offers two classes of shares: Class 1 and Class 2. Each class of shares differs by its distribution fees, voting rights on matters affecting a single class and its exchange privilege.
At December 31, 2003, there were an unlimited number of shares authorized ($.01 par value). Transactions in the Fund’s shares were as follows:
| | | | | | | | | | | | | | |
| | | Year Ended December 31,
| |
| | | 2003
| | | 2002
| |
| Class 1 Shares: | | Shares
| | | Amount
| | | Shares
| | | Amount
| |
Shares sold | | 2,924,694 | | | $ | 48,227,589 | | | 526,225 | | | $ | 7,952,010 | |
Shares issued in reinvestment of distributions | | 795,550 | | | | 12,872,007 | | | 578,357 | | | | 9,120,690 | |
Shares redeemed | | (2,381,733 | ) | | | (36,945,323 | ) | | (4,250,902 | ) | | | (63,920,636 | ) |
| | |
| |
Net increase (decrease) | | 1,338,511 | | | $ | 24,154,273 | | | (3,146,320 | ) | | $ | (46,847,936 | ) |
| | |
| |
| Class 2 Shares: | | | | | | | | | | | | |
Shares sold | | 949,657 | | | $ | 15,396,855 | | | 2,038,410 | | | $ | 29,793,094 | |
Shares issued in reinvestment of distributions | | 71,299 | | | | 1,147,201 | | | 47,872 | | | | 750,622 | |
Shares redeemed | | (785,835 | ) | | | (12,608,114 | ) | | (1,859,712 | ) | | | (26,977,596 | ) |
| | |
| |
Net increase (decrease) | | 235,121 | | | $ | 3,935,942 | | | 226,570 | | | $ | 3,566,120 | |
| | |
| |
TGA-19
FRANKLIN TEMPLETON VARIABLE INSURANCE PRODUCTS TRUST
TEMPLETON GLOBAL ASSET ALLOCATION FUND
Notes to Financial Statements (continued)
3. TRANSACTIONS WITH AFFILIATES
Certain officers and trustees of the Fund are also officers and/or directors of the following entities:
| | |
| Entity | | Affiliation |
|
Franklin Templeton Services LLC (FT Services) | | Administrative manager |
Templeton Investment Counsel LLC (TIC) | | Investment manager |
Franklin/Templeton Distributors Inc. (Distributors) | | Principal underwriter |
Franklin/Templeton Investor Services LLC (Investor Services) | | Transfer agent |
The Fund pays an investment management fee to TIC based on the average daily net assets of the Fund as follows:
| | |
| Annualized Fee Rate | | Net Assets |
|
| .65% | | First $200 million |
| .585% | | Over $200 million, up to and including $1.3 billion |
| .52% | | Over $1.3 billion |
Under a subadvisory agreement, Advisers, an affiliate of TIC, provides subadvisory services to the Fund and receives from TIC fees based on the average daily net assets of the Fund.
The Fund pays business management fees to FT Services based on the average daily net assets of the Fund as follows:
| | |
| Annualized Fee Rate | | Net Assets |
|
| .15% | | First $200 million |
| .135% | | Over $200 million, up to and including $700 million |
| .10% | | Over $700 million, up to and including $1.2 billion |
Fees are further reduced on net assets over $1.2 billion.
The Fund reimburses Distributors up to .25% per year of its average daily net assets of Class 2, for costs incurred in marketing the Fund’s shares.
Investor Services, under terms of an agreement, performs shareholder servicing for the Fund and is not paid by the Fund.
4. INCOME TAXES
At December 31, 2003, the Fund had tax basis capital losses of $55,040,780 which may be carried over to offset future capital gains. Such losses expire as follows:
Capital loss carryovers expiring in:
| | | |
2009 | | $ | 5,082,133 |
2010 | | | 443,666 |
2011 | | | 49,514,981 |
| | |
|
| | | $ | 55,040,780 |
| | |
|
At December 31, 2003, the Fund has deferred capital losses occurring subsequent to October 31, 2003 of $1,342,049. For tax purposes, such losses will be reflected in the year ending December 31, 2004.
TGA-20
FRANKLIN TEMPLETON VARIABLE INSURANCE PRODUCTS TRUST
TEMPLETON GLOBAL ASSET ALLOCATION FUND
Notes to Financial Statements (continued)
4. INCOME TAXES (cont.)
The tax character of distributions paid during the years ended December 31, 2003 and 2002, was as follows:
| | | | | | |
| | | 2003
| | 2002
|
Distributions paid from: | | | | | | |
Ordinary income | | $ | 14,019,208 | | $ | 9,871,312 |
Long term capital gain | | | — | | | — |
| | |
|
| | | $ | 14,019,208 | | $ | 9,871,312 |
| | |
|
At December 31, 2003, the cost of investments, net unrealized appreciation (depreciation), undistributed ordinary income and undistributed long term capital gains for income tax purposes were as follows:
| | | | |
Cost of investments | | $ | 507,515,139 | |
| | |
|
|
|
Unrealized appreciation | | $ | 139,515,607 | |
Unrealized depreciation | | | (22,636,523 | ) |
| | |
|
|
|
Net unrealized appreciation (depreciation) | | $ | 116,879,084 | |
| | |
|
|
|
Undistributed ordinary income | | $ | 16,743,414 | |
Undistributed long term capital gains | | | — | |
| | |
|
|
|
Distributable earnings | | $ | 16,743,414 | |
| | |
|
|
|
Net investment income differs for financial statement and tax purposes primarily due to differing treatments of foreign currency transactions, and bond discounts and premiums.
Net realized gains (losses) differ for financial statement and tax purposes primarily due to differing treatments of wash sales, foreign currency transactions, and bond discounts and premiums.
5. INVESTMENT TRANSACTIONS
Purchases and sales of securities (excluding short-term securities) for the period ended December 31, 2003 aggregated $168,260,830 and $168,677,960, respectively.
6. INVESTMENT IN FRANKLIN INSTITUTIONAL FIDUCIARY TRUST MONEY MARKET PORTFOLIO
The Fund may invest in the Franklin Institutional Fiduciary Trust Money Market Portfolio (the Sweep Money Fund), an open-end investment company managed by Advisers. Management fees paid by the Fund are reduced on assets invested in the Sweep Money Fund, in an amount not to exceed the management fees paid by the Sweep Money Fund. The Fund earned $109,039 of dividend income from investment in the Sweep Money Fund for the period ended December 31, 2003.
7. REGULATORY MATTERS
On February 4, 2004, the Securities Division of the Office of the Secretary of the Commonwealth of Massachusetts filed an administrative complaint against Franklin Resources, Inc. and certain of its subsidiaries (the “Company”), alleging violations of the Massachusetts Uniform Securities Act. The complaint arises from activity that occurred in 2001 during which time an officer of a Company subsidiary was negotiating an agreement with an investor relating to investments in a mutual fund and a hedge fund.
TGA-21
FRANKLIN TEMPLETON VARIABLE INSURANCE PRODUCTS TRUST
TEMPLETON GLOBAL ASSET ALLOCATION FUND
Notes to Financial Statements (continued)
7. REGULATORY MATTERS (cont.)
The Company, in addition to other entities within Franklin Templeton Investments, has been named in shareholder class actions related to the matter described above. The Company believes that the claims made in the lawsuit are without merit and it intends to defend vigorously against the allegations. The Company and the Fund may be named in similar civil actions related to the matter described above.
In addition, as part of ongoing investigations by the U.S. Securities and Exchange Commission (the “SEC”), the U.S. Attorney for the Northern District of California, the New York Attorney General, the California Attorney General, the U.S. Attorney for the District of Massachusetts, the Florida Department of Financial Services, and the Commissioner of Securities and the Attorney General of the State of West Virginia, relating to certain practices in the mutual fund industry, including late trading, market timing and sales compensation arrangements, the Company and its subsidiaries, as well as certain current or former executives and employees of the Company, have received requests for information and/or subpoenas to testify or produce documents. The Company and its current employees are providing documents and information in response to these requests and subpoenas. In addition, the Company has responded to requests for similar kinds of information from regulatory authorities in some of the foreign countries where the Company conducts its global asset management business.
The Staff of the SEC has informed the Company that it intends to recommend that the Commission authorize an action against an affiliate of the Fund’s adviser and a senior executive officer relating to the frequent trading issues that are the subject of the SEC’s investigation. These issues were previously disclosed as being under investigation by government authorities and the subject of an internal inquiry by the Company in its Annual Report on Form 10-K and on its public website. The Company currently is in discussions with the SEC Staff in an effort to resolve the issues raised in their investigation. Such discussions are preliminary and the Fund’s management has been advised that the Company cannot predict the likelihood of whether those discussions will result in a settlement and, if so, the terms of such settlement. The impact, if any, of these matters on the Fund is uncertain at this time. If the Company finds that it bears responsibility for any unlawful or improper conduct, it has committed to making the Fund or its shareholders whole, as appropriate.
TGA-22
FRANKLIN TEMPLETON VARIABLE INSURANCE PRODUCTS TRUST
TEMPLETON GLOBAL ASSET ALLOCATION FUND
Independent Auditors’ Report
To the Board of Trustees and Shareholders
of Franklin Templeton Variable Insurance Products Trust
In our opinion, the accompanying statement of assets and liabilities, including the statement of investments, and the related statements of operations and of changes in net assets and the financial highlights present fairly, in all material respects, the financial position of the Templeton Global Asset Allocation Fund (the Fund) (one of the funds constituting the Franklin Templeton Variable Insurance Products Trust) at December 31, 2003, the results of its operations for the year then ended, the changes in its net assets for each of the two years in the period then ended and the financial highlights for each of the periods presented, in conformity with accounting principles generally accepted in the United States of America. These financial statements and financial highlights (hereafter referred to as “financial statements”) are the responsibility of the Fund’s management; our responsibility is to express an opinion on these financial statements based on our audits. We conducted our audits of these financial statements in accordance with auditing standards generally accepted in the United States of America, which require that we plan and perform the audits to obtain reasonable assurance about whether the financial statements are free of material misstatement. An audit includes examining, on a test basis, evidence supporting the amounts and disclosures in the financial statements, assessing the accounting principles used and significant estimates made by management, and evaluating the overall financial statement presentation. We believe that our audits, which included confirmation of securities at December 31, 2003 by correspondence with the custodian and brokers, provide a reasonable basis for our opinion.
PricewaterhouseCoopers LLP
San Francisco, California
February 5, 2004, except for Note 7 as to which the date is February 12, 2004
TGA-23
FRANKLIN TEMPLETON VARIABLE INSURANCE PRODUCTS TRUST
TEMPLETON GLOBAL ASSET ALLOCATION FUND
Tax Designation (unaudited)
Under Section 854(b)(2) of the Code, the Fund hereby designates 7.00% of the ordinary income dividends as income qualifying for the dividends received deduction for the fiscal year ended December 31, 2003.
At December 31, 2003, more than 50% of the Fund’s total assets were invested in securities of foreign issuers. In most instances, foreign taxes were withheld from dividends paid to the Fund on these investments. The Fund elects to treat foreign taxes paid under Section 853 of the Internal Revenue Code. This election will allow shareholders of record in June 2004, to treat their proportionate share of foreign taxes paid by the Fund as having been paid directly by them. The shareholder shall consider these amounts as foreign taxes paid in the tax year in which they receive the Fund distribution.
The foreign tax information will be disclosed in the June 30, 2004, semi-annual report of the Fund.
TGA-24
TEMPLETON GLOBAL INCOME SECURITIES FUND
Fund Goals and Primary Investments: Templeton Global Income Securities Fund seeks high current income, consistent with preservation of capital. Capital appreciation is a secondary consideration. The Fund invests mainly in debt securities of governments and their political subdivisions and agencies, supranational organizations and companies located anywhere in the world, including emerging markets. The Fund may also invest in lower-rated “junk bonds.”
We are pleased to bring you Templeton Global Income Securities Fund’s annual report for the fiscal year ended December 31, 2003.
Performance Overview
You can find the Fund’s one-year total return in the Performance Summary following this report. The Fund outperformed its benchmark, the J.P. Morgan Global Government Bond Index (JPM GGBI), which delivered cumulative total returns of 2.22% in local currency terms and 14.51% in U.S. dollar terms for the same period.1
Economic and Market Overview
During the year under review, many global developed economies showed signs of recovery and benign inflationary pressures following an environment of low growth and disinflation that facilitated monetary easing in many major economies. Economic growth accelerated in the U.S., remained strong in Asia and was weak, yet positive, in Europe. Despite these signs of economic recovery, inflationary pressures remained benign, supported by productivity growth and excess capacity in labor and capital. Global bond markets benefited from the low interest rate environment and currency developments as most major currencies appreciated against the U.S. dollar.
The U.S. dollar depreciated 15.26% relative to the nation’s major trading partners for the 12 months ended December 31, 2003.2 The U.S. experienced deteriorating balance of payment fundamentals during the year, as record trade deficit levels drove the U.S. current account deficit to $135 billion for third quarter 2003, or 4.9% of gross domestic product (GDP) on an annualized basis.3 The current account deficit combined with a fiscal deficit created a “twin-deficit” problem similar to previous periods when the U.S. dollar came under pressure.
1. Source: J.P. Morgan. One cannot invest directly in an index, nor is an index representative of the Fund’s portfolio. Please see Index Descriptions following the Fund Summaries.
2. Source: Federal Reserve.
3. Source: Bureau of Economic Analysis.
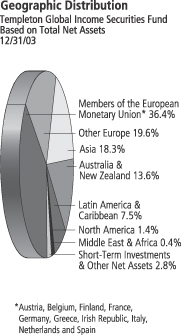
TGI-1
Despite generally lower economic growth rates than those of the U.S., the euro zone and other European countries had positive short-term yield differentials and stronger balance of payment positions relative to the U.S. For example, in contrast to the widening U.S. current account deficit during the year, the euro zone posted a trailing 12-month current account surplus in September 2003 of 2.0% of GDP.4 In the Scandinavian countries of Norway and Sweden, short-term government securities offered higher yields than similar maturity U.S. Treasuries despite aggressive monetary easing during the past year. Export strength and relatively high commodity prices helped Norway and Sweden maintain current account surpluses.
In Asia, economic growth improved in many countries over the past year, accompanied by low inflationary pressures. Export growth and current account surpluses in many of the countries supported international reserve accumulation, particularly in Japan and among the newly industrialized economies of South Korea, Thailand and Indonesia. By the end of the year, these reserve levels represented increases of 44.6%, 28.0%, 11.1% and 14.8%, respectively, over year-ago figures.5
Reduced interest rates in developed economies generally benefit emerging market borrowers through lower borrowing costs and positive investment flows from investors seeking higher returns outside developed countries. Additionally, emerging market credit fundamentals remained favorable, highlighted by the past year’s large number of sovereign credit upgrades. For example, independent credit rating agency Moody’s Investors Service upgraded Russia’s long-term foreign currency rating to investment grade. Standard & Poor’s, another independent credit rating agency, raised Indonesia’s and Thailand’s foreign currency sovereign ratings during the year.
Investment Strategy
We allocate the Fund’s assets among issuers, geographic regions, and currencies based upon our assessment of relative interest rates among currencies, our outlook for changes in interest rates, and credit risks. In considering these factors, we evaluate a country’s changing market, economic and political conditions, such as inflation rate, growth prospects, global trade patterns and government policies. We intend to manage the Fund’s exposure to various currencies, and may from time to time seek to hedge (protect) against currency risk by using forward currency exchange contracts.
4. Source: European Central Bank, Eurostat.
5. Sources: Japan Ministry of Finance; Bank of Korea; Bank of Thailand; Bank of Indonesia.
TGI-2
Manager’s Discussion
In addition to income, developed market interest rate movements, currency returns and emerging market bonds contributed to the Fund’s strong one-year performance.
Monetary easing by certain major central banks around the world provided a positive backdrop for local bond markets and positively impacted the Fund’s performance. Slow economic growth at the beginning of the year, accompanied by heightened geopolitical uncertainty, rising unemployment and disinflationary pressures provided a favorable environment for an accommodative monetary stance at many major central banks. In the U.S., the Federal Reserve Board lowered the federal funds target rate 25 basis points (0.25%) to 1.00%. However, the yield curve steepened on prospects of stronger economic growth later in the year and the U.S. Treasury market declined 2.44% for the full year. As a result, the Fund benefited from its underweighted allocation to the U.S. In Europe, policymakers at the European Central Bank (ECB) reduced its reference rate 75 basis points (0.75%) to 2.00% and euro-zone bond markets returned 3.98% in local currency terms.6 Similarly, Denmark, Sweden and Norway lowered rates and those countries’ bonds returned 4.55%, 5.04% and 11.08%, respectively, in local currency terms.7 Additionally, the Reserve Bank of New Zealand reduced its official reference rate 75 basis points (0.75%) to 4.75%, driving 6.56% local currency return.8
The U.S. dollar’s depreciation against most major currencies positively impacted Fund performance during the period. Throughout the reporting period, the euro represented the Fund’s largest currency exposure. The euro appreciated 16.80% against the U.S. dollar, with EMU bond markets returning 24.98%.9 The Fund benefited from its exposure to other European countries. During the year, the Swedish krona appreciated 17.42% against the U.S. dollar, while the Danish krone was up 16.60% and the Norwegian krone rose 3.97%. The strong currency appreciation combined with local market returns helped produce bond market returns of 27.19%, 25.36% and 15.67% in U.S. dollar terms for Sweden, Denmark and Norway, respectively.7 Currencies from other regions, particularly Asia, did not experience similar appreciation against the U.S. dollar despite larger trade surpluses with the U.S. Of
6. Sources: European Central Bank; J.P. Morgan Government Bond Index Monitor, December 2003.
7. Sources: JPM GGBI; Citigroup World Government Bond Index.
8. Sources: Reserve Bank of New Zealand; J.P. Morgan Government Bond Index Monitor, December 2003.
9. Source: J.P. Morgan Government Bond Index Monitor, December 2003.
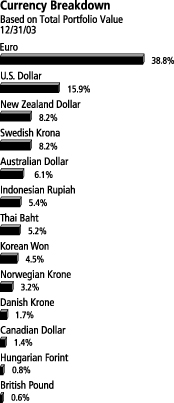
The dollar value, number of shares or principal amount, and complete legal titles of all portfolio holdings are listed in the Fund’s Statement of Investments.
TGI-3
the roughly $41 billion monthly U.S. trade deficit, Asia accounted for about $22 billion versus $8 billion in western Europe.10 Consequently, the Fund reallocated some exposure toward the end of the reporting period away from the euro zone and into Asia seeking to position the Fund for potential global economic recovery as well as to take advantage of the discrepancy between currency performance and macroeconomic trends.
The Australian dollar and New Zealand dollar were the top performing developed country currencies, appreciating 25.27% and 20.34%, respectively, against the U.S. dollar during the Fund’s fiscal year, bringing these countries’ bond returns in U.S. dollar terms to 37.32% and 33.75%.11 The Fund’s overweighted positions in the two countries contributed to the Fund’s outperformance during the period. Australia and New Zealand, although running relatively large current account deficits, differed from the U.S. in that they had balanced fiscal accounts, thus not creating a “twin-deficit” condition. From a balance of payments perspective, their current account deficits were balanced by strong foreign investment flows in an economic environment of high yields relative to other developed nations, as well as fiscal surpluses. Australia and New Zealand also each exhibited strong economic growth during the year, reporting 2.6% and 3.5% annual growth in third quarter 2003.12
Japan underperformed other developed bond markets in U.S. dollar terms, returning only 9.84% during the year, with 9.69% appreciation of the yen against the U.S. dollar.9 Although Japan benefited during the past year from a cyclical economic recovery and improving export strength, concerns remained about the country’s banking sector health and structural reform progress. We sought exposure to Asia’s cyclical, regional economic recovery through a variety of currencies from the region without exposure to any country-specific risks in Japan.
The Fund also invested in emerging market sovereign debt that is typically non-investment grade and compensates for greater credit risk by offering higher income or coupon. During the 12-month period, emerging market returns contributed to Fund performance as the J.P. Morgan Emerging Markets Bond Index Global (JPM EMBIG) delivered strong returns. Emerging bond markets, as measured by JPM EMBIG, returned 25.66% during the 12-month period. Sovereign interest rate spreads declined from 7.25 percentage points greater than the U.S. Treasury
10. Source: U.S. Census Bureau, 10/31/03.
11. Sources: JPM GGBI; J.P. Morgan Government Bond Index Broad.
12. Sources: Australia Bureau of Statistics; Statistics New Zealand.
TGI-4
market at the beginning of the reporting period to 4.03 percentage points by period-end.13 Reduced interest rates in developed economies generally benefit emerging market borrowers through lower borrowing costs and positive investment flows from investors seeking higher returns outside developed countries. Regionally, Latin American sovereign debt returned 32.97%, eastern Europe 22.07% and Asia 9.02%.13
The Fund increased allocation to emerging markets during the period, largely through increased exposure to euro and local currency denominated debt markets we believe have opportunities for potential currency appreciation as well as attractive yield characteristics. Primarily, we expanded and diversified the Fund’s Asian exposure later in the reporting period to include South Korea, Thailand and Indonesia. The regional cyclical recovery in Asia supported growth rates while current account surpluses from competitive trade conditions contributed to international reserve accumulation.
Thank you for your continued participation in Templeton Global Income Securities Fund. We look forward to serving your future investment needs.
13. Source: J.P. Morgan. Please see Index Descriptions following the Fund Summaries.
This discussion reflects our analysis, opinions and portfolio holdings as of December 31, 2003, the end of the reporting period. The way we implement our main investment strategies and the resulting portfolio holdings may change depending on factors such as market and economic conditions. These opinions may not be relied upon as investment advice or an offer for a particular security. The information is not a complete analysis of every aspect of any market, country, industry, security or the Fund. Statements of fact are from sources considered reliable, but the advisor makes no representation or warranty as to their completeness or accuracy. Although historical performance is no guarantee of future results, these insights may help you understand our investment management philosophy.
TGI-5
PERFORMANCE SUMMARYASOF 12/31/03
Total return of Class 1 shares represents the average annual change in value, assuming reinvestment of dividends and capital gains. Average returns smooth out variations in returns, which can be significant; they are not the same as year-by-year results.
Templeton Global Income Securities Fund – Class 1
Periods ended 12/31/03
| | | | | | |
| | | 1-Year | | 5-Year | | 10-Year |
|
| | | |
Average Annual Total Return | | +22.72% | | +8.48% | | +7.01% |
Ongoing market volatility can significantly affect short-term performance; recent returns may differ.
Total Return Index Comparison for Hypothetical $10,000 Investment (1/1/94–12/31/03)
The graph compares the performance of Templeton Global Income Securities Fund – Class 1 and the J.P. Morgan Global Government Bond Index, as well as the Consumer Price Index (CPI). One cannot invest directly in an index, nor is an index representative of the Fund’s portfolio. Please see Important Notes to Performance Information preceding the Fund Summaries.
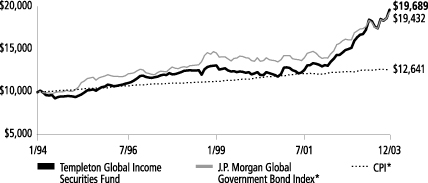
*Source: Standard & Poor’s Micropal. Please see Index Descriptions following the Fund Summaries.
Templeton Global Income Securities Fund – Class 1
Performance reflects the Fund’s Class 1 operating expenses, but does not include any contract fees, expenses or sales charges. If they had been included, performance would be lower. These charges and deductions, particularly for variable life policies, can have a significant effect on contract values and insurance benefits. See the contract prospectus for a complete description of these expenses, including sales charges.
Since markets can go down as well as up, investment return and the value of your principal will fluctuate with market conditions, and you may have a gain or loss when you sell your shares.
TGI-6
Past performance does not guarantee future results.
TEMPLETON GLOBAL INCOME SECURITIES FUND
FRANKLIN TEMPLETON VARIABLE INSURANCE PRODUCTS TRUST
SUPPLEMENT DATED FEBRUARY 12, 2004
TO THE PROSPECTUS DATED MAY 1, 2003
The Management section on page TGI-5 is replaced with the following:

Franklin Advisers, Inc. (Advisers), One Franklin Parkway, San Mateo, California 94403-1906, is the Fund’s investment manager.
The team responsible for the Fund’s management is:
| | |
| Alexander C. Calvo SENIOR VICE PRESIDENT OF ADVISERS | | Mr. Calvo has been a manager of the Fund since 1998, and has been with Franklin Templeton Investments since 1995. |
| |
Michael Hasenstab, Ph.D. PORTFOLIO MANAGER/RESEARCH ANALYST OF ADVISERS | | Dr. Hasenstab has been a manager of the Fund since 2002 and an analyst since 2001. He first joined Franklin Templeton Investments in 1995, rejoining again in 2001 after a three-year leave to obtain his Ph.D. |
The Fund pays Advisers a fee for managing the Fund’s assets and providing certain administrative facilities and services for the Fund. For the fiscal year ended December 31, 2002, the Fund paid 0.63% of its average daily net assets to Advisers for its services.
Please keep this supplement for future reference
TGI-7
FRANKLIN TEMPLETON VARIABLE INSURANCE PRODUCTS TRUST
TEMPLETON GLOBAL INCOME SECURITIES FUND
Financial Highlights
| | | | | | | | | | | | | | | | | | | | |
| | | Class 1
| |
| | | Year Ended December 31,
| |
| | | 2003 | | | 2002 | | | 2001 | | | 2000 | | | 1999 | |
| | |
|
|
|
Per share operating performance | | | | | | | | | | | | | | | | | | | | |
(for a share outstanding throughout the year) | | | | | | | | | | | | | | | | | | | | |
| | | | | |
Net asset value, beginning of year | | $ | 13.67 | | | $ | 11.39 | | | $ | 11.53 | | | $ | 11.07 | | | $ | 12.87 | |
| | |
|
|
|
Income from investment operations: | | | | | | | | | | | | | | | | | | | | |
Net investment incomea | | | .69 | | | | .59 | | | | .59 | c | | | .68 | | | | .68 | |
Net realized and unrealized gains (losses) | | | 2.35 | | | | 1.83 | | | | (.32 | )c | | | (.20 | ) | | | (1.42 | ) |
| | |
|
|
|
Total from investment operations | | | 3.04 | | | | 2.42 | | | | .27 | | | | .48 | | | | (.74 | ) |
| | |
|
|
|
Less distributions from net investment income | | | (1.17 | ) | | | (.14 | ) | | | (.41 | ) | | | (.02 | ) | | | (1.06 | ) |
| | |
|
|
|
Net asset value, end of year | | $ | 15.54 | | | $ | 13.67 | | | $ | 11.39 | | | $ | 11.53 | | | $ | 11.07 | |
| | |
|
|
|
| | | | | |
Total returnb | | | 22.72% | | | | 21.44% | | | | 2.55% | | | | 4.32% | | | | (5.79)% | |
Ratios/supplemental data | | | | | | | | | | | | | | | | | | | | |
Net assets, end of year (000’s) | | $ | 52,842 | | | $ | 50,622 | | | $ | 63,781 | | | $ | 81,171 | | | $ | 90,537 | |
Ratios to average net assets: | | | | | | | | | | | | | | | | | | | | |
Expenses | | | .76% | | | | .73% | | | | .71% | | | | .72% | | | | .65% | |
Net investment income | | | 4.72% | | | | 4.88% | | | | 5.22% | c | | | 6.22% | | | | 5.65% | |
Portfolio turnover rate | | | 53.01% | | | | 27.91% | | | | 122.45% | | | | 40.43% | | | | 80.76% | |
| a | Based on average daily shares outstanding. |
| b | Total return does not include any fees, charges or expenses imposed by the variable annuity and life insurance contracts for which the Franklin Templeton Variable Insurance Products Trust serves as an underlying investment vehicle. Total return is not annualized for periods less than one year. |
| c | Effective January 1, 2001, the fund adopted the provisions of the AICPA Audit and Accounting Guide of Investment Companies and began amortizing all premium and discount on fixed-income securities, as required. The effect of this change was as follows: |
| | |
Net investment income (loss) per share | | $(.059) |
Net realized and unrealized gains (losses) per share | | .059 |
Ratio of net investment income to average net assets | | (.53)% |
Per share data and ratios for prior periods have not been restated to reflect this change in accounting policy.
TGI-8
FRANKLIN TEMPLETON VARIABLE INSURANCE PRODUCTS TRUST
TEMPLETON GLOBAL INCOME SECURITIES FUND
Financial Highlights (continued)
| | | | | | | | | | | | | | | | | | | | |
| | | Class 2
| |
| | | Year Ended December 31,
| |
| | | 2003 | | | 2002 | | | 2001 | | | 2000 | | | 1999d | |
| | |
|
|
|
Per share operating performance | | | | | | | | | | | | | | | | | | | | |
(for a share outstanding throughout the year) | | | | | | | | | | | | | | | | | | | | |
| | | | | |
Net asset value, beginning of year | | $ | 13.59 | | | $ | 11.33 | | | $ | 11.48 | | | $ | 11.04 | | | $ | 12.93 | |
| | |
|
|
|
Income from investment operations: | | | | | | | | | | | | | | | | | | | | |
Net investment incomea | | | .65 | | | | .54 | | | | .55 | c | | | .65 | | | | .60 | |
Net realized and unrealized gains (losses) | | | 2.33 | | | | 1.84 | | | | (.31 | )c | | | (.19 | ) | | | (1.44 | ) |
| | |
|
|
|
Total from investment operations | | | 2.98 | | | | 2.38 | | | | .24 | | | | .46 | | | | (.84 | ) |
| | |
|
|
|
Less distributions from net investment income | | | (1.15 | ) | | | (.12 | ) | | | (.39 | ) | | | (.02 | ) | | | (1.05 | ) |
| | |
|
|
|
Net asset value, end of year | | $ | 15.42 | | | $ | 13.59 | | | $ | 11.33 | | | $ | 11.48 | | | $ | 11.04 | |
| | |
|
|
|
| | | | | |
Total returnb | | | 22.44% | | | | 21.15% | | | | 2.24% | | | | 4.14% | | | | (6.53)% | |
Ratios/supplemental data | | | | | | | | | | | | | | | | | | | | |
Net assets, end of year (000’s) | | $ | 5,181 | | | $ | 2,119 | | | $ | 1,286 | | | $ | 1,237 | | | $ | 443 | |
Ratios to average net assets: | | | | | | | | | | | | | | | | | | | | |
Expenses | | | 1.01% | | | | .98% | | | | .96% | | | | .97% | | | | .91% | e |
Net investment income | | | 4.47% | | | | 4.63% | | | | 4.95% | c | | | 5.94% | | | | 5.36% | e |
Portfolio turnover rate | | | 53.01% | | | | 27.91% | | | | 122.45% | | | | 40.43% | | | | 80.76% | |
| a | Based on average daily shares outstanding. |
| b | Total return does not include any fees, charges or expenses imposed by the variable annuity and life insurance contracts for which the Franklin Templeton Variable Insurance Products Trust serves as an underlying investment vehicle. Total return is not annualized for periods less than one year. |
| c | Effective January 1, 2001, the fund adopted the provisions of the AICPA Audit and Accounting Guide of Investment Companies and began amortizing all premium and discount on fixed-income securities, as required. The effect of this change was as follows: |
| | |
Net investment income (loss) per share | | $(.059) |
Net realized and unrealized gains (losses) per share | | .059 |
Ratio of net investment income to average net assets | | (.53)% |
Per share data and ratios for prior periods have not been restated to reflect this change in accounting policy.
| d | For the period January 6, 1999 (effective date) to December 31, 1999. |
See notes to financial statements.
TGI-9
FRANKLIN TEMPLETON VARIABLE INSURANCE PRODUCTS TRUST
TEMPLETON GLOBAL INCOME SECURITIES FUND
Statement of Investments, December 31, 2003
| | | | | |
| | | PRINCIPAL
AMOUNTa | | | VALUE |
|
Long Term Investments 97.2% | | | | | |
Australia 6.0% | | | | | |
New South Wales Treasury Corp., | | | | | |
6.50%, 5/01/06 | | 200,000 | AUD | | 153,658 |
8.00%, 3/01/08 | | 1,990,000 | AUD | | 1,626,327 |
Queensland Treasury Corp., 6.00%, 8/14/13 | | 2,200,000 | AUD | | 1,685,269 |
| | | | | |
|
| | | | | | 3,465,254 |
| | | | | |
|
Austria 4.1% | | | | | |
Republic of Austria, | | | | | |
5.00%, 7/15/12 | | 850,000 | EUR | | 1,132,637 |
4.65%, 1/15/18 | | 1,000,000 | EUR | | 1,267,280 |
| | | | | |
|
| | | | | | 2,399,917 |
| | | | | |
|
Belgium 3.9% | | | | | |
Kingdom of Belgium, 7.50%, 7/29/08 | | 1,531,000 | EUR | | 2,251,891 |
| | | | | |
|
Bulgaria .2% | | | | | |
Republic of Bulgaria, FRN, 1.9375%, 7/28/11 | | 122,550 | | | 120,291 |
| | | | | |
|
Canada 1.4% | | | | | |
Government of Canada, 6.00%, 6/01/11 | | 937,000 | CAD | | 794,523 |
| | | | | |
|
Colombia .6% | | | | | |
Republic of Colombia, | | | | | |
10.00%, 1/23/12 | | 132,000 | | | 144,911 |
11.75%, 2/25/20 | | 159,000 | | | 189,505 |
| | | | | |
|
| | | | | | 334,416 |
| | | | | |
|
Denmark 1.7% | | | | | |
Kingdom of Denmark, | | | | | |
5.00%, 11/15/13 | | 3,950,000 | DKK | | 697,405 |
7.00%, 11/10/24 | | 1,300,000 | DKK | | 279,758 |
| | | | | |
|
| | | | | | 977,163 |
| | | | | |
|
Finland 3.9% | | | | | |
Government of Finland, | | | | | |
5.00%, 4/25/09 | | 660,000 | EUR | | 886,147 |
5.375%, 7/04/13 | | 1,000,000 | EUR | | 1,367,936 |
| | | | | |
|
| | | | | | 2,254,083 |
| | | | | |
|
France 4.7% | | | | | |
Government of France, | | | | | |
4.00%, 10/25/09 | | 1,055,000 | EUR | | 1,348,424 |
4.00%, 4/25/13 | | 930,000 | EUR | | 1,150,986 |
4.25%, 4/25/19 | | 200,000 | EUR | | 240,549 |
| | | | | |
|
| | | | | | 2,739,959 |
| | | | | |
|
Germany 2.7% | | | | | |
Federal Republic of Germany, | | | | | |
3.25%, 2/17/04 | | 657,000 | EUR | | 829,951 |
5.00%, 7/04/11 | | 532,000 | EUR | | 711,117 |
| | | | | |
|
| | | | | | 1,541,068 |
| | | | | |
|
TGI-10
FRANKLIN TEMPLETON VARIABLE INSURANCE PRODUCTS TRUST
TEMPLETON GLOBAL INCOME SECURITIES FUND
Statement of Investments, December 31, 2003 (cont.)
| | | | | |
| | | PRINCIPAL
AMOUNTa | | | VALUE |
|
Long Term Investments (cont.) | | | | | |
Greece 3.1% | | | | | |
Hellenic Republic, | | | | | |
4.60%, 5/20/13 | | 700,000 | EUR | | 894,469 |
6.50%, 10/22/19 | | 600,000 | EUR | | 893,226 |
| | | | | |
|
| | | | | | 1,787,695 |
| | | | | |
|
Hungary .8% | | | | | |
Government of Hungary, 8.50%, 10/12/05 | | 101,100,000 | HUF | | 470,643 |
| | | | | |
|
Indonesia 5.3% | | | | | |
Indonesia Recapital Bond, | | | | | |
12.125%, 2/15/06 | | 1,800,000,000 | IDR | | 216,385 |
13.15%, 3/15/10 | | 6,005,000,000 | IDR | | 716,536 |
Republic of Indonesia, 14.00%, 6/15/09 | | 17,407,000,000 | IDR | | 2,143,195 |
| | | | | |
|
| | | | | | 3,076,116 |
| | | | | |
|
Irish Republic 3.2% | | | | | |
Republic of Ireland, 5.00%, 4/18/13 | | 1,400,000 | EUR | | 1,865,225 |
| | | | | |
|
Italy 2.8% | | | | | |
Buoni Poliennali Del Tesoro, 7.75%, 11/01/06 | | 1,131,293 | EUR | | 1,600,763 |
| | | | | |
|
Mexico 2.8% | | | | | |
United Mexican States, | | | | | |
9.875%, 2/01/10 | | 800,000 | | | 1,007,752 |
144A, 7.50%, 3/08/10 | | 450,000 | EUR | | 631,833 |
| | | | | |
|
| | | | | | 1,639,585 |
| | | | | |
|
Netherlands 4.7% | | | | | |
Government of Netherlands, 5.75%, 2/15/07 | | 2,008,000 | EUR | | 2,731,366 |
| | | | | |
|
New Zealand 7.6% | | | | | |
Government of New Zealand, | | | | | |
7.00%, 7/15/09 | | 5,140,000 | NZD | | 3,557,244 |
6.00%, 11/15/11 | | 1,300,000 | NZD | | 859,813 |
| | | | | |
|
| | | | | | 4,417,057 |
| | | | | |
|
Norway 3.1% | | | | | |
Kingdom of Norway, | | | | | |
6.75%, 1/15/07 | | 7,350,000 | NOK | | 1,213,323 |
5.50%, 5/15/09 | | 3,600,000 | NOK | | 578,658 |
| | | | | |
|
| | | | | | 1,791,981 |
| | | | | |
|
Philippines 3.6% | | | | | |
Republic of Philippines, | | | | | |
9.00%, 2/15/13 | | 700,000 | | | 731,045 |
10.625%, 3/16/25 | | 1,200,000 | | | 1,323,750 |
| | | | | |
|
| | | | | | 2,054,795 |
| | | | | |
|
Russia 3.3% | | | | | |
Federation of Russia, | | | | | |
12.75%, 6/24/28 | | 105,000 | | | 168,073 |
Reg S, 11.00%, 7/24/18 | | 1,250,000 | | | 1,694,469 |
Reg S, 5.00% to 3/31/07, 7.50% thereafter, 3/31/30 | | 34,000 | | | 32,666 |
| | | | | |
|
| | | | | | 1,895,208 |
| | | | | |
|
TGI-11
FRANKLIN TEMPLETON VARIABLE INSURANCE PRODUCTS TRUST
TEMPLETON GLOBAL INCOME SECURITIES FUND
Statement of Investments, December 31, 2003 (cont.)
| | | | | |
| | | PRINCIPAL
AMOUNTa | | | VALUE |
|
Long Term Investments (cont.) | | | | | |
South Africa .4% | | | | | |
Republic of South Africa, 5.25%, 5/16/13 | | 200,000 | EUR | | 243,063 |
| | | | | |
|
South Korea 4.4% | | | | | |
Korea Treasury Bond, | | | | | |
4.50%, 9/03/06 | | 160,000,000 | KRW | | 135,192 |
4.75%, 3/12/08 | | 2,883,000,000 | KRW | | 2,435,307 |
| | | | | |
|
| | | | | | 2,570,499 |
| | | | | |
|
Spain 3.3% | | | | | |
Bonos Y Oblig Del Estado, | | | | | |
6.00%, 1/31/08 | | 200,000 | EUR | | 277,790 |
5.50%, 7/30/17 | | 400,000 | EUR | | 551,766 |
Government of Spain, | | | | | |
10.15%, 1/31/06 | | 378,000 | EUR | | 547,690 |
5.00%, 7/30/12 | | 410,000 | EUR | | 546,425 |
| | | | | |
|
| | | | | | 1,923,671 |
| | | | | |
|
Sweden 7.9% | | | | | |
Kingdom of Sweden, | | | | | |
6.00%, 2/09/05 | | 5,500,000 | SEK | | 789,307 |
3.50%, 4/20/06 | | 1,200,000 | SEK | | 167,195 |
5.50%, 10/08/12 | | 24,780,000 | SEK | | 3,651,008 |
| | | | | |
|
| | | | | | 4,607,510 |
| | | | | |
|
Thailand 5.0% | | | | | |
Kingdom of Thailand, | | | | | |
6.00%, 3/05/05 | | 8,000,000 | THB | | 212,642 |
8.50%, 10/14/05 | | 63,500,000 | THB | | 1,795,020 |
8.00%, 12/08/06 | | 3,500,000 | THB | | 103,018 |
4.125%, 2/12/08 | | 9,000,000 | THB | | 241,181 |
8.50%, 12/08/08 | | 1,000,000 | THB | | 31,872 |
4.80%, 4/09/10 | | 20,000,000 | THB | | 534,757 |
| | | | | |
|
| | | | | | 2,918,490 |
| | | | | |
|
Ukraine 2.0% | | | | | |
Republic of Ukraine, 144A, 7.65%, 6/11/13 | | 1,130,000 | | | 1,176,963 |
| | | | | |
|
United Kingdom .6% | | | | | |
United Kingdom, 7.50%, 12/07/06 | | 175,000 | GBP | | 339,139 |
| | | | | |
|
TGI-12
FRANKLIN TEMPLETON VARIABLE INSURANCE PRODUCTS TRUST
TEMPLETON GLOBAL INCOME SECURITIES FUND
Statement of Investments, December 31, 2003 (cont.)
| | | | | | | |
| | | PRINCIPAL
AMOUNTa | | | VALUE |
|
Long Term Investments (cont.) | | | | | | | |
Venezuela 4.1% | | | | | | | |
Republic of Venezuela, | | | | | | | |
9.25%, 9/15/27 | | $ | 2,390,000 | | | $ | 2,178,640 |
144A, 10.75%, 9/19/13 | | | 200,000 | | | | 213,000 |
| | | | | | |
|
|
| | | | | | | | 2,391,640 |
| | | | | | |
|
|
Total Long Term Investments (Cost $46,912,583) | | | | | | | 56,379,974 |
| | | | | | |
|
|
Short Term Investment (Cost $189,207) .3% | | | | | | | |
New Zealand Treasury Bill, 5.15%, 6/16/04 | | | 300,000 | NZD | | | 196,552 |
| | | | | | |
|
|
Total Investments (Cost $47,101,790) 97.5% | | | | | | | 56,576,526 |
Other Assets, less Liabilities 2.5% | | | | | | | 1,446,161 |
| | | | | | |
|
|
Net Assets 100.0% | | | | | | $ | 58,022,687 |
| | | | | | |
|
|
Currency Abbreviations:
AUD - Australian Dollar
CAD - Canadian Dollar
DKK - Danish Krone
EUR - Euro
GBP - British Pound
HUF - Hungarian Forint
IDR - Indonesian Rupiah
KRW - Korean Won
NOK - Norwegian Krone
NZD - New Zealand Dollar
SEK - Swedish Krona
THB - Thai Baht
| a | The principal amount is stated in U.S. dollars unless otherwise indicated. |
TGI-13
FRANKLIN TEMPLETON VARIABLE INSURANCE PRODUCTS TRUST
TEMPLETON GLOBAL INCOME SECURITIES FUND
Financial Statements
Statement of Assets and Liabilities
December 31, 2003
| | | | |
Assets: | | | | |
Investments in securities: | | | | |
Cost | | $ | 47,101,790 | |
| | |
|
|
|
Value | | | 56,576,526 | |
Cash | | | 69,023 | |
Foreign currency, at value (cost $21,941) | | | 21,164 | |
Receivables: | | | | |
Capital shares sold | | | 5,995 | |
Interest | | | 1,437,463 | |
| | |
|
|
|
Total assets | | | 58,110,171 | |
| | |
|
|
|
Liabilities: | | | | |
Payables: | | | | |
Capital shares redeemed | | | 27,196 | |
Affiliates | | | 32,310 | |
Custodian fees | | | 8,400 | |
Professional fees | | | 15,934 | |
Other liabilities | | | 3,644 | |
| | |
|
|
|
Total liabilities | | | 87,484 | |
| | |
|
|
|
Net assets, at value | | $ | 58,022,687 | |
| | |
|
|
|
Net assets consist of: | | | | |
Undistributed net investment income | | $ | 5,047,873 | |
Net unrealized appreciation (depreciation) | | | 9,556,787 | |
Accumulated net realized gain (loss) | | | (10,279,568 | ) |
Capital shares | | | 53,697,595 | |
| | |
|
|
|
Net assets, at value | | $ | 58,022,687 | |
| | |
|
|
|
Class 1: | | | | |
Net assets, at value | | $ | 52,841,926 | |
| | |
|
|
|
Shares outstanding | | | 3,400,132 | |
| | |
|
|
|
Net asset value and offering price per share | | $ | 15.54 | |
| | |
|
|
|
Class 2: | | | | |
Net assets, at value | | $ | 5,180,761 | |
| | |
|
|
|
Shares outstanding | | | 335,983 | |
| | |
|
|
|
Net asset value and offering price per share | | $ | 15.42 | |
| | |
|
|
|
See notes to financial statements.
TGI-14
FRANKLIN TEMPLETON VARIABLE INSURANCE PRODUCTS TRUST
TEMPLETON GLOBAL INCOME SECURITIES FUND
Financial Statements (continued)
Statement of Operations
for the year ended December 31, 2003
| | | |
Interest income (net of foreign taxes of $7,986) | | $ | 3,034,021 |
| | |
|
|
Expenses: | | | |
Management fees (Note 3) | | | 345,404 |
Distribution fees - Class 2 (Note 3) | | | 9,820 |
Transfer agent fees | | | 280 |
Custodian fees | | | 31,765 |
Reports to shareholders | | | 23,939 |
Professional fees | | | 16,682 |
Trustees’ fees and expenses | | | 535 |
Other | | | 3,619 |
| | |
|
|
Total expenses | | | 432,044 |
| | |
|
|
Net investment income | | | 2,601,977 |
| | |
|
|
Realized and unrealized gains (losses): | | | |
Net realized gain (loss) from: | | | |
Investments | | | 3,654,666 |
Foreign currency transactions | | | 160,681 |
| | |
|
|
Net realized gain (loss) | | | 3,815,347 |
| | |
|
|
Net unrealized appreciation (depreciation) on: | | | |
Investments | | | 4,915,997 |
Translation of assets and liabilities denominated in foreign currencies | | | 24,640 |
| | |
|
|
Net unrealized appreciation (depreciation) | | | 4,940,637 |
| | |
|
|
Net realized and unrealized gain (loss) | | | 8,755,984 |
| | |
|
|
Net increase (decrease) in net assets resulting from operations | | $ | 11,357,961 |
| | |
|
|
See notes to financial statements.
TGI-15
FRANKLIN TEMPLETON VARIABLE INSURANCE PRODUCTS TRUST
TEMPLETON GLOBAL INCOME SECURITIES FUND
Financial Statements (continued)
Statements of Changes in Net Assets
for the years ended December 31, 2003 and 2002
| | | | | | | | |
| | | 2003
| | | 2002
| |
Increase (decrease) in net assets: | | | | | | | | |
Operations: | | | | | | | | |
Net investment income | | $ | 2,601,977 | | | $ | 2,843,587 | |
Net realized gain (loss) from investments and foreign currency transactions | | | 3,815,347 | | | | 1,188,208 | |
Net unrealized appreciation (depreciation) on investments and translation of assets and liabilities denominated in foreign currencies | | | 4,940,637 | | | | 7,043,474 | |
| | |
|
|
|
Net increase (decrease) in net assets resulting from operations | | | 11,357,961 | | | | 11,075,269 | |
Distributions to shareholders from: | | | | | | | | |
Net investment income: | | | | | | | | |
Class 1 | | | (3,980,291 | ) | | | (721,350 | ) |
Class 2 | | | (323,749 | ) | | | (15,678 | ) |
| | |
|
|
|
Total distributions to shareholders | | | (4,304,040 | ) | | | (737,028 | ) |
Capital share transactions: (Note 2) | | | | | | | | |
Class 1 | | | (4,386,768 | ) | | | (23,182,049 | ) |
Class 2 | | | 2,614,619 | | | | 518,247 | |
| | |
|
|
|
Total capital share transactions | | | (1,772,149 | ) | | | (22,663,802 | ) |
Net increase (decrease) in net assets | | | 5,281,772 | | | | (12,325,561 | ) |
Net assets: | | | | | | | | |
Beginning of year | | | 52,740,915 | | | | 65,066,476 | |
| | |
|
|
|
End of year | | $ | 58,022,687 | | | $ | 52,740,915 | |
| | |
| |
Undistributed net investment income included in net assets: | | | | | | | | |
End of year | | $ | 5,047,873 | | | $ | 3,745,859 | |
| | |
| |
See notes to financial statements.
TGI-16
FRANKLIN TEMPLETON VARIABLE INSURANCE PRODUCTS TRUST
TEMPLETON GLOBAL INCOME SECURITIES FUND
Notes to Financial Statements
1. ORGANIZATION AND SIGNIFICANT ACCOUNTING POLICIES
Franklin Templeton Variable Insurance Products Trust (the Trust) is registered under the Investment Company Act of 1940 as an open-end investment company, consisting of twenty-two separate series (the Funds). The Templeton Global Income Securities Fund (the Fund) included in this report is non-diversified. Shares of the Fund are sold only to insurance company separate accounts to fund the benefits of variable life insurance policies or variable annuity contracts. As of December 31, 2003, 76% of the total Fund shares were sold through one insurance company. The Fund’s investment objective is current income.
The following summarizes the Fund’s significant accounting policies.
a. Security Valuation
Securities listed or traded on a recognized national exchange or NASDAQ are valued at the last reported sales price. Over-the-counter securities and listed securities for which no sale is reported are valued within the range of the latest quoted bid and asked prices. Foreign securities are valued at the close of trading of the foreign exchange or the NYSE, whichever is earlier. If events occur that materially affect the values of securities after the prices or foreign exchange rates are determined, or if market quotations are not readily available, the securities will be valued at fair value as determined following procedures approved by the Board of Trustees.
b. Foreign Currency Translation
Portfolio securities and other assets and liabilities denominated in foreign currencies are translated into U.S. dollars based on the exchange rate of such currencies against U.S. dollars on the date of valuation. Purchases and sales of securities and income items denominated in foreign currencies are translated into U.S. dollars at the exchange rate in effect on the transaction date.
The Fund does not separately report the effect of changes in foreign exchange rates from changes in market prices on securities held. Such changes are included in net realized and unrealized gain or loss from investments.
Realized foreign exchange gains or losses arise from sales of foreign currencies, currency gains or losses realized between the trade and settlement dates on securities transactions and the difference between the recorded amounts of dividends, interest, and foreign withholding taxes and the U.S. dollar equivalent of the amounts actually received or paid. Net unrealized foreign exchange gains and losses arise from changes in foreign exchange rates on foreign denominated assets and liabilities other than investments in securities held at the end of the reporting period.
c. Foreign Currency Contracts
When the Fund purchases or sells foreign securities it may enter into foreign exchange contracts to minimize foreign exchange risk from the trade date to the settlement date of the transactions. A foreign exchange contract is an agreement between two parties to exchange different currencies at an agreed upon exchange rate on a specified date. Realized and unrealized gains and losses are included in the Statement of Operations.
The risks of these contracts include movement in the values of the foreign currencies relative to the U.S. dollar and the possible inability of the counterparties to fulfill their obligations under the contracts.
d. Income Taxes
No provision has been made for income taxes because the Fund’s policy is to qualify as a regulated investment company under the Internal Revenue Code and to distribute substantially all of its taxable income.
TGI-17
FRANKLIN TEMPLETON VARIABLE INSURANCE PRODUCTS TRUST
TEMPLETON GLOBAL INCOME SECURITIES FUND
Notes to Financial Statements (continued)
1. ORGANIZATION AND SIGNIFICANT ACCOUNTING POLICIES (cont.)
e. Security Transactions, Investment Income, Expenses and Distributions
Security transactions are accounted for on trade date. Realized gains and losses on security transactions are determined on a specific identification basis. Certain income from foreign securities is recorded as soon as information is available to the Fund. Interest income and estimated expenses are accrued daily. Discounts and premiums on securities purchased are amortized over the lives of the respective securities. Distributions to shareholders are recorded on the ex-dividend date.
Common expenses incurred by the Trust are allocated among the Funds based on the ratio of net assets of each fund to the combined net assets. Other expenses are charged to each fund on a specific identification basis.
Realized and unrealized gains and losses and net investment income, other than class specific expenses, are allocated daily to each class of shares based upon the relative proportion of net assets of each class.
f. Accounting Estimates
The preparation of financial statements in accordance with accounting principles generally accepted in the United States of America requires management to make estimates and assumptions that affect the reported amounts of assets and liabilities at the date of the financial statements and the amounts of income and expenses during the reporting period. Actual results could differ from those estimates.
g. Guarantees and Indemnifications
Under the Trust’s organizational documents, its officers and trustees are indemnified against certain liability arising out of the performance of their duties to the Trust. Additionally, in the normal course of business, the Trust enters into contracts with service providers that contain general indemnification clauses. The Trust’s maximum exposure under these arrangements is unknown as this would involve future claims that may be made against the Trust that have not yet occurred. However, based on experience, the Trust expects the risk of loss to be remote.
2. SHARES OF BENEFICIAL INTEREST
The Fund offers two classes of shares: Class 1 and Class 2. Each class of shares differs by its distribution fees, voting rights on matters affecting a single class, and its exchange privilege.
At December 31, 2003, there were an unlimited number of shares authorized ($.01 par value). Transactions in the Fund’s shares were as follows:
| | | | | | | | | | | | | | |
| | | Year Ended December 31,
| |
| | | 2003
| | | 2002
| |
| Class 1 Shares: | | Shares
| | | Amount
| | | Shares
| | | Amount
| |
Shares sold | | 157,660 | | | $ | 2,314,617 | | | 256,364 | | | $ | 3,077,773 | |
Shares issued in reinvestment of distributions | | 271,137 | | | | 3,980,291 | | | 60,012 | | | | 721,350 | |
Shares redeemed | | (733,010 | ) | | | (10,681,676 | ) | | (2,210,800 | ) | | | (26,981,172 | ) |
| | |
|
|
Net increase (decrease) | | (304,213 | ) | | $ | (4,386,768 | ) | | (1,894,424 | ) | | $ | (23,182,049 | ) |
| | |
|
|
| Class 2 Shares: | | | | | | | | | | | | |
Shares sold | | 255,207 | | | $ | 3,668,776 | | | 54,900 | | | $ | 671,632 | |
Shares issued in reinvestment of distributions | | 22,205 | | | | 323,749 | | | 1,310 | | | | 15,678 | |
Shares redeemed | | (97,419 | ) | | | (1,377,906 | ) | | (13,677 | ) | | | (169,063 | ) |
| | |
|
|
Net increase (decrease) | | 179,993 | | | $ | 2,614,619 | | | 42,533 | | | $ | 518,247 | |
| | |
|
|
TGI-18
FRANKLIN TEMPLETON VARIABLE INSURANCE PRODUCTS TRUST
TEMPLETON GLOBAL INCOME SECURITIES FUND
Notes to Financial Statements (continued)
3. TRANSACTIONS WITH AFFILIATES
Certain officers and trustees of the Fund are also officers and/or directors of the following entities:
| | |
| Entity | | Affiliation |
|
Franklin Templeton Services LLC (FT Services) | | Administrative manager |
Franklin Advisers Inc. (Advisers) | | Investment manager |
Franklin/Templeton Distributors Inc. (Distributors) | | Principal underwriter |
Franklin/Templeton Investor Services LLC (Investor Services) | | Transfer agent |
The Fund pays an investment management fee to Advisers based on the average daily net assets of the Fund as follows:
| | |
| Annualized Fee Rate | | Net Assets |
|
| .625% | | First $100 million |
| .500% | | Over $100 million, up to and including $250 million |
| .450% | | Over $250 million, up to and including $10 billion |
Fees are further reduced on net assets over $10 billion.
Under an agreement with Advisers, FT Services provides administrative services to the Fund. The fee is paid by Advisers based on the average daily net assets, and is not an additional expense of the Fund.
The Fund reimburses Distributors up to .25% per year of its average daily net assets of Class 2, for costs incurred in marketing the Fund’s shares.
Investor Services, under terms of an agreement, performs shareholder servicing for the Fund and is not paid by the Fund.
4. INCOME TAXES
At December 31, 2003, the Fund had tax basis capital losses of $10,067,343, which may be carried over to offset future capital gains. Such losses expire as follows:
| | | |
2007 | | $ | 5,870,061 |
2008 | | | 2,370,518 |
2009 | | | 1,649,034 |
2010 | | | 177,730 |
| | |
|
|
Total | | $ | 10,067,343 |
| | |
|
|
On December 31, 2003 the Fund had expired capital loss carryovers of $633,271, which were reclassified to paid-in capital.
At December 31, 2003, the Fund has deferred capital losses occurring subsequent to October 31, 2003 of $160,781. For tax purposes, such losses will be reflected in the year ending December 31, 2004.
Net investment income differs for financial statement and tax purposes primarily due to differing treatments of foreign currency transactions and bond discounts and premiums.
Net realized gains and losses differ for financial statement and tax purposes primarily due to differing treatments of wash sales, foreign currency transactions, and bond discounts and premiums.
TGI-19
FRANKLIN TEMPLETON VARIABLE INSURANCE PRODUCTS TRUST
TEMPLETON GLOBAL INCOME SECURITIES FUND
Notes to Financial Statements (continued)
4. INCOME TAXES (cont.)
The tax character of distributions paid during the years ended December 31, 2003 and 2002, was as follows:
| | | | | | |
| | | 2003
| | 2002
|
Distributions paid from: | | | | | | |
Ordinary income | | $ | 4,304,040 | | $ | 737,028 |
Long term capital gain | | | — | | | — |
| | |
|
|
| | | $ | 4,304,040 | | $ | 737,028 |
| | |
|
|
At December 31, 2003, the cost of investments, net unrealized appreciation (depreciation), undistributed ordinary income and undistributed long term capital gains for income tax purposes were as follows:
| | | | |
Cost of investments | | $ | 47,708,770 | |
| | |
|
|
|
Unrealized appreciation | | $ | 9,098,185 | |
Unrealized depreciation | | | (230,429 | ) |
| | |
|
|
|
Net unrealized appreciation (depreciation) | | $ | 8,867,756 | |
| | |
|
|
|
Undistributed ordinary income | | $ | 5,603,410 | |
Undistributed long term capital gains | | | — | |
| | |
|
|
|
Distributable earnings | | $ | 5,603,410 | |
| | |
|
|
|
5. INVESTMENT TRANSACTIONS
Purchases and sales of investments (excluding short-term securities) for the year ended December 31, 2003 aggregated $28,184,223 and $29,905,911, respectively.
6. REGULATORY MATTERS
On February 4, 2004, the Securities Division of the Office of the Secretary of the Commonwealth of Massachusetts filed an administrative complaint against Franklin Resources, Inc. and certain of its subsidiaries (the “Company”), alleging violations of the Massachusetts Uniform Securities Act. The complaint arises from activity that occurred in 2001 during which time an officer of a Company subsidiary was negotiating an agreement with an investor relating to investments in a mutual fund and a hedge fund.
The Company, in addition to other entities within Franklin Templeton Investments, has been named in shareholder class actions related to the matter described above. The Company believes that the claims made in the lawsuit are without merit and it intends to defend vigorously against the allegations. The Company and the Fund may be named in similar civil actions related to the matter described above.
In addition, as part of ongoing investigations by the U.S. Securities and Exchange Commission (the “SEC”), the U.S. Attorney for the Northern District of California, the New York Attorney General, the California Attorney General, the U.S. Attorney for the District of Massachusetts, the Florida Department of Financial Services, and the Commissioner of Securities and the Attorney General of the State of West Virginia, relating to certain practices in the mutual fund industry, including late trading, market timing and sales compensation arrangements, the Company and its subsidiaries, as well as certain current or former executives and employees of the Company, have received requests for information and/or subpoenas to testify or produce documents. The Company and its current employees are providing documents and information in response to these requests and subpoenas. In addition, the Company has responded to requests for similar kinds of information from regulatory authorities in some of the foreign countries where the Company conducts its global asset management business.
TGI-20
FRANKLIN TEMPLETON VARIABLE INSURANCE PRODUCTS TRUST
TEMPLETON GLOBAL INCOME SECURITIES FUND
Notes to Financial Statements (continued)
6. REGULATORY MATTERS (cont.)
The Staff of the SEC has informed the Company that it intends to recommend that the Commission authorize an action against the Fund’s investment adviser and a senior executive officer relating to the frequent trading issues that are the subject of the SEC’s investigation. These issues were previously disclosed as being under investigation by government authorities and the subject of an internal inquiry by the Company in its Annual Report on Form 10-K and on its public website. The Company currently is in discussions with the SEC Staff in an effort to resolve the issues raised in their investigation. Such discussions are preliminary and the Fund’s management has been advised that the Company cannot predict the likelihood of whether those discussions will result in a settlement and, if so, the terms of such settlement. The impact, if any, of these matters on the Fund is uncertain at this time. If the Company finds that it bears responsibility for any unlawful or improper conduct, it has committed to making the Fund or its shareholders whole, as appropriate.
TGI-21
FRANKLIN TEMPLETON VARIABLE INSURANCE PRODUCTS TRUST
TEMPLETON GLOBAL INCOME SECURITIES FUND
Independent Auditors’ Report
To the Board of Trustees and Shareholders of
Franklin Templeton Variable Insurance Products Trust
In our opinion, the accompanying statement of assets and liabilities, including the statement of investments, and the related statements of operations and of changes in net assets and the financial highlights present fairly, in all material respects, the financial position of the Templeton Global Income Securities Fund (the Fund) (one of the funds constituting the Franklin Templeton Variable Insurance Products Trust) at December 31, 2003, the results of its operations for the year then ended, the changes in its net assets for each of the two years in the period then ended and the financial highlights for each of the periods presented, in conformity with accounting principles generally accepted in the United States of America. These financial statements and financial highlights (hereafter referred to as “financial statements”) are the responsibility of the Fund’s management; our responsibility is to express an opinion on these financial statements based on our audits. We conducted our audits of these financial statements in accordance with auditing standards generally accepted in the United States of America, which require that we plan and perform the audits to obtain reasonable assurance about whether the financial statements are free of material misstatement. An audit includes examining, on a test basis, evidence supporting the amounts and disclosures in the financial statements, assessing the accounting principles used and significant estimates made by management, and evaluating the overall financial statement presentation. We believe that our audits, which included confirmation of securities at December 31, 2003 by correspondence with the custodian and brokers, provide a reasonable basis for our opinion.
PricewaterhouseCoopers LLP
San Francisco, California
February 5, 2004, except for Note 6 as to which the date is February 12, 2004
TGI-22
FRANKLIN TEMPLETON VARIABLE INSURANCE PRODUCTS TRUST
TEMPLETON GLOBAL INCOME SECURITIES FUND
Tax Designation (unaudited)
At December 31, 2003, more than 50% of the Fund’s total assets were invested in securities of foreign issuers. In most instances, foreign taxes were withheld from interest paid to the Fund on these investments. The Fund elects to treat foreign taxes paid under Section 853 of the Internal Revenue Code. This election will allow shareholders of record in June, 2004, to treat their proportionate share of foreign taxes paid by the Fund as having been paid directly by them. The shareholder shall consider these amounts as foreign taxes paid in the tax year in which they receive the Fund distribution.
The foreign tax information will be disclosed in the June 30, 2004 semi-annual report of the Fund.
TGI-23
TEMPLETON GROWTH SECURITIES FUND
Fund Goal and Primary Investments: Templeton Growth Securities Fund seeks long-term capital growth. The Fund invests mainly in equity securities of companies located anywhere in the world, including those in the U.S. and emerging markets.
This annual report for Templeton Growth Securities Fund covers the period ended December 31, 2003.
Performance Overview
You can find the Fund’s one-year total return in the Performance Summary following this report. The Fund underperformed its benchmark, the Morgan Stanley Capital International (MSCI) All Country World Free Index, which returned 34.63% for the year under review.1
Economic and Market Overview
In spring 2003, the end of major conflict in Iraq coincided with the start of a global equity market rally that produced the strongest annual total returns since 1986. The rally’s main catalyst was an improving global economy, underpinned by expansionary fiscal and monetary policies, corporate restructuring and consolidation, and more than two years of declining equity valuations that created potential opportunities in Asia, Europe and the Americas.
In many countries, including the U.S., China and Japan, gross domestic product (GDP) growth accelerated in 2003, particularly in the second half of the year. In the U.S., GDP grew at annualized rates of 3.1% and 8.2% in the second and third quarters. Over the same periods, consumer spending rose at annualized rates of 3.3% and 6.9% spurred largely by tax cuts, car-buying incentives and mortgage refinancing, as interest rates remained at the lowest level in more than four decades. Industrial production increased in the U.S., China, Japan and South Korea in the second half of the year, as did consumer sentiment in the U.S., U.K., Germany and Sweden, and business sentiment in the U.S., Australia, Germany and Japan. In short, a synchronized global economic recovery gained momentum in the second half of 2003.
Further evidence of this recovery was the continued rise in the prices of base metals and other commodities. This was due, in part, to greater demand in China. On December 31, 2003, contracts for aluminum and other metals such silver, gold, copper and zinc were anywhere from
1. Source: Standard & Poor’s Micropal. One cannot invest directly in an index, nor is an index representative of the Fund’s portfolio. Please see Index Descriptions following the Fund Summaries.
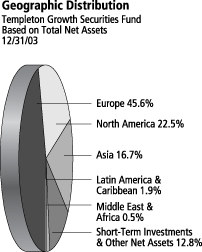
TG-1
19% to 50% higher than 12 months before.2 While gold crossed the $400-an-ounce threshold for the first time in more than seven years, such agricultural commodities as cotton and soybeans gained approximately 40%.2 Despite rising commodities prices, global inflation remained subdued throughout the year.
In 2003, the value of the U.S. dollar fell against most major currencies, including a 17% decline versus the euro.3 While the decline magnified top-line and earnings-per-share growth in the U.S., it had the opposite effect in Europe. The dollar decline also benefited U.S. investors in international equities because it increased the returns of investments denominated in currencies that appreciated against the dollar, such as the euro. Although the dollar’s decline significantly affected equity market returns, it was not the only reason for the past year’s gains. Equity markets in many countries, including emerging market countries, produced stronger gains than the U.S. equity market, even in their local currencies. These countries benefited from the improving economic and financial market conditions in 2003.
Investment Strategy
Our investment philosophy is bottom-up, value-oriented and long-term. In choosing investments, we will focus on the market price of a company’s securities relative to our evaluation of the company’s potential long-term earnings, asset value and cash flow. Among factors we consider are a company’s historical value measures, including price/earnings ratio, profit margins and liquidation value. We do in-depth research to construct a bargain list from which we buy.
Manager’s Discussion
During the year under review, Fund performance benefited from several areas of the market. For example, the Fund’s energy and utilities sector exposure contributed to performance, as our holdings in those sectors outperformed the benchmark MSCI All Country World Free Index.4 Our health care holdings also outperformed the overall index, and during the period, we purchased shares of such health care sector companies as pharmaceuticals GlaxoSmithKline, Aventis and Novartis. In addition, the Fund’s consumer discretionary holdings benefited relative performance as they outperformed the benchmark index’s return.5
2. Source: Reuters, Commodity Research Bureau Index; London Metal Exchange.
3. Source: European Central Bank.
4. The energy sector comprises energy equipment and services, and oil and gas, and the utilities sector comprises electric utilities, gas utilities and multi-utilities in the Statement of Investments.
5. The consumer discretionary sector comprises automobiles; hotels, restaurants and leisure; household durables; media; multi-line retail and specialty retail in the Statement of Investments.
TG-2
From a regional standpoint, our relatively overweighted European exposure benefited Fund performance, as did the fact that many of our specific European holdings outperformed the index’s European stocks.
Hindering the Fund’s performance relative to the index were the Fund’s materials sector holdings, which underperformed those of the index during the fiscal year.6 In addition, the consumer staples sector underperformed the index; therefore, our exposure to that sector detracted from overall performance.7 Regionally, our Asian holdings, which underperformed those of the index during the period, hindered relative performance.
We generally found more value in European and Asian stocks, which traded at 13 times estimated 2004 earnings at period-end, than in U.S. stocks, which traded at 18 times estimated 2004 earnings at period-end. Consistent with our strategy, during the fiscal year we sold for a profit shares of EMC, Volvo, Komatsu, BHP Billiton, Burlington Resources, Mylan Labs and Merrill Lynch, and we purchased shares of TDC, BP PLC, Unilever, Nintendo, Reuters, National Grid and Reed Elsevier.
Thank you for your participation in Templeton Growth Securities Fund. We look forward to serving your future investment needs.
6. The materials sector comprises chemicals, containers and packaging, metals and mining, and paper and forest products in the Statement of Investments.
7. The consumer staples sector comprises food products in the Statement of Investments.
This discussion reflects our analysis, opinions and portfolio holdings as of December 31, 2003, the end of the reporting period. The way we implement our main investment strategies and the resulting portfolio holdings may change depending on factors such as market and economic conditions. These opinions may not be relied upon as investment advice or an offer for a particular security. The information is not a complete analysis of every aspect of any market, country, industry, security or the Fund. Statements of fact are from sources considered reliable, but the advisor makes no representation or warranty as to their completeness or accuracy. Although historical performance is no guarantee of future results, these insights may help you understand our investment management philosophy.
Top 10 Holdings
Templeton Growth Securities Fund 12/31/03
| | |
Company
Sector/Industry,
Country | | % of Total
Net Assets |
|
| |
| BP PLC | | 1.8% |
| Oil & Gas, U.K. | | |
| |
| Shell Transport & Trading Co. PLC | | 1.7% |
| Oil & Gas, U.K. | | |
| |
| E.ON AG | | 1.7% |
| Electric Utilities, Germany | | |
| |
| Bristol-Myers Squibb Co. | | 1.6% |
| Pharmaceuticals, U.S. | | |
| |
| Aventis SA | | 1.6% |
| Pharmaceuticals, France | | |
| |
| Eni SpA | | 1.6% |
| Oil & Gas, Italy | | |
| |
| Nestle SA | | 1.6% |
| Food Products, Switzerland | | |
| |
| GlaxoSmithKline PLC | | 1.5% |
| Pharmaceuticals, U.K. | | |
| |
| J Sainsbury PLC | | 1.4% |
| Food & Drug Retailing, U.K. | | |
| |
| Cheung Kong Holdings Ltd. | | 1.3% |
| Real Estate, Hong Kong | | |
The dollar value, number of shares or principal amount, and complete legal titles of all portfolio holdings are listed in the Fund’s Statement of Investments.
TG-3
PERFORMANCE SUMMARYASOF 12/31/03
Total return of Class 1 shares represents the average annual change in value, assuming reinvestment of dividends and capital gains. Average returns smooth out variations in returns, which can be significant; they are not the same as year-by-year results.
Templeton Growth Securities Fund – Class 1
Periods ended 12/31/03
| | | | | | |
| | | 1-Year | | 5-Year | | Since Inception
(3/15/94) |
|
| | | |
Average Annual Total Return | | +32.62% | | +5.72% | | +8.89% |
Ongoing market volatility can significantly affect short-term performance; recent returns may differ.
Total Return Index Comparison
for Hypothetical $10,000 Investment (3/15/94–12/31/03)
The graph compares the performance of Templeton Growth Securities Fund – Class 1 and the MSCI All Country World Free Index. One cannot invest directly in an index, nor is an index representative of the Fund’s portfolio. Please see Important Notes to Performance Information preceding the Fund Summaries.
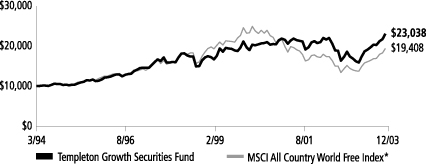
*Source: Standard & Poor’s Micropal. Please see Index Descriptions following the Fund Summaries.
Templeton Growth Securities Fund – Class 1
Performance reflects the Fund’s Class 1 operating expenses, but does not include any contract fees, expenses or sales charges. If they had been included, performance would be lower. These charges and deductions, particularly for variable life policies, can have a significant effect on contract values and insurance benefits. See the contract prospectus for a complete description of these expenses, including sales charges.
Since markets can go down as well as up, investment return and the value of your principal will fluctuate with market conditions, and you may have a gain or loss when you sell your shares.
TG-4
Past performance does not guarantee future results.
TEMPLETON GROWTH SECURITIES FUND
(FRANKLIN TEMPLETON VARIABLE INSURANCE PRODUCTS TRUST)
SUPPLEMENT DATED DECEMBER 17, 2003
TOTHE PROSPECTUS DATED MAY 1, 2003
The prospectus is amended by replacing the MANAGEMENT section (page TG-5) with the following:
MANAGEMENT
Templeton Global Advisors Limited (TGAL), Lyford Cay, Nassau, Bahamas, is the Fund’s investment manager. Under an agreement with TGAL, Templeton Asset Management Limited (TAML), #7 Temasek Boulevard #38-3, Suntec Tower One, Singapore 038987, serves as the fund’s sub-advisor. TAML provides TGAL with investment management advice and assistance.
MANAGEMENT TEAM The team responsible for the Fund’s management is:
| | |
| |
Alan Chua, CFA PORTFOLIO MANAGER, TAML | | Mr. Chua has been a manager of the Fund since January 2004 and has been with Franklin Templeton Investments since 2000. Previously, he was an associate director with UBS Asset Management. |
| |
Dale Winner, CFA SENIOR VICE PRESIDENT, TGAL | | Mr. Winner has been a manager of the Fund since 2001, and has been with Franklin Templeton Investments since 1995. |
| |
Murdo Murchison, CFA EXECUTIVE VICE PRESIDENT, TGAL | | Mr. Murchison has been a manager of the Fund since 2001, and has been with Franklin Templeton Investments since 1993. |
The Fund pays TGAL a fee for managing its assets and providing certain administrative facilities and services to the Fund. For the fiscal year ended December 31, 2002, the Fund paid 0.81% of its average net assets to TGAL for its services.
Please keep this supplement for future reference.
TG-5
FRANKLIN TEMPLETON VARIABLE INSURANCE PRODUCTS TRUST
TEMPLETON GROWTH SECURITIES FUND
Financial Highlights
| | | | | | | | | | | | | | | | | | | | |
| | | Class 1
| |
| | | Year Ended December 31,
| |
| | | 2003 | | | 2002 | | | 2001 | | | 2000 | | | 1999 | |
| | |
|
|
|
Per share operating performance | | | | | | | | | | | | | | | | | | | | |
(For a share outstanding throughout the year) | | | | | | | | | | | | | | | | | | | | |
Net asset value, beginning of year | | $ | 8.67 | | | $ | 11.09 | | | $ | 13.76 | | | $ | 15.63 | | | $ | 14.77 | |
| | |
|
|
|
Income from investment operations: | | | | | | | | | | | | | | | | | | | | |
Net investment incomea | | | .17 | | | | .17 | | | | .26 | | | | .30 | | | | .28 | |
Net realized and unrealized gains (losses) | | | 2.63 | | | | (2.13 | ) | | | (.36 | ) | | | (.15 | ) | | | 2.66 | |
| | |
|
|
|
Total from investment operations | | | 2.80 | | | | (1.96 | ) | | | (.10 | ) | | | .15 | | | | 2.94 | |
| | |
|
|
|
Less distributions from: | | | | | | | | | | | | | | | | | | | | |
Net investment income | | | (.16 | ) | | | (.24 | ) | | | (.28 | ) | | | (.27 | ) | | | (.36 | ) |
Net realized gains | | | — | | | | (.22 | ) | | | (2.29 | ) | | | (1.75 | ) | | | (1.72 | ) |
| | |
|
|
|
Total distributions | | | (.16 | ) | | | (.46 | ) | | | (2.57 | ) | | | (2.02 | ) | | | (2.08 | ) |
| | |
|
|
|
Net asset value, end of year | | $ | 11.31 | | | $ | 8.67 | | | $ | 11.09 | | | $ | 13.76 | | | $ | 15.63 | |
| | |
|
|
|
| | | | | |
Total returnb | | | 32.62% | | | | (18.32)% | | | | (.98)% | | | | 1.74% | | | | 21.04% | |
Ratios/supplemental data | | | | | | | | | | | | | | | | | | | | |
Net assets, end of year (000’s) | | $ | 769,339 | | | $ | 665,537 | | | $ | 966,725 | | | $ | 1,163,637 | | | $ | 708,310 | |
Ratios to average net assets: | | | | | | | | | | | | | | | | | | | | |
Expenses | | | .88% | | | | .87% | | | | .85% | | | | .88% | | | | .88% | |
Net investment income | | | 1.74% | | | | 1.69% | | | | 2.13% | | | | 2.18% | | | | 1.87% | |
Portfolio turnover rate | | | 37.43% | | | | 30.67% | | | | 31.05% | | | | 69.67% | | | | 46.54% | |
aBased on average daily shares outstanding.
bTotal return does not include any fees, charges or expenses imposed by the variable annuity and life insurance contracts for which the Franklin Templeton Variable Insurance Products Trust serves as an underlying investment vehicle. Total return is not annualized for periods less than one year.
TG-6
FRANKLIN TEMPLETON VARIABLE INSURANCE PRODUCTS TRUST
TEMPLETON GROWTH SECURITIES FUND
Financial Highlights (continued)
| | | | | | | | | | | | | | | | | | | | |
| | | Class 2
| |
| | | Year Ended December 31,
| |
| | | 2003 | | | 2002 | | | 2001 | | | 2000 | | | 1999c | |
| | |
|
|
|
Per share operating performance | | | | | | | | | | | | | | | | | | | | |
(For a share outstanding throughout the year) | | | | | | | | | | | | | | | | | | | | |
Net asset value, beginning of year | | $ | 8.59 | | | $ | 11.01 | | | $ | 13.69 | | | $ | 15.60 | | | $ | 15.34 | |
| | |
|
|
|
Income from investment operations: | | | | | | | | | | | | | | | | | | | | |
Net investment incomea | | | .13 | | | | .13 | | | | .21 | | | | .25 | | | | .17 | |
Net realized and unrealized gains (losses) | | | 2.62 | | | | (2.10 | ) | | | (.34 | ) | | | (.15 | ) | | | 2.17 | |
| | |
|
|
|
Total from investment operations | | | 2.75 | | | | (1.97 | ) | | | (.13 | ) | | | .10 | | | | 2.34 | |
| | |
|
|
|
Less distributions from: | | | | | | | | | | | | | | | | | | | | |
Net investment income | | | (.15 | ) | | | (.23 | ) | | | (.26 | ) | | | (.26 | ) | | | (.36 | ) |
Net realized gains | | | — | | | | (.22 | ) | | | (2.29 | ) | | | (1.75 | ) | | | (1.72 | ) |
| | |
|
|
|
Total distributions | | | (.15 | ) | | | (.45 | ) | | | (2.55 | ) | | | (2.01 | ) | | | (2.08 | ) |
| | |
|
|
|
Net asset value, end of year | | $ | 11.19 | | | $ | 8.59 | | | $ | 11.01 | | | $ | 13.69 | | | $ | 15.60 | |
| | |
|
|
|
| | | | | |
Total returnb | | | 32.13% | | | | (18.49)% | | | | (1.31)% | | | | 1.47% | | | | 16.35% | |
Ratios/supplemental data | | | | | | | | | | | | | | | | | | | | |
Net assets, end of year (000’s) | | $ | 511,659 | | | $ | 190,054 | | | $ | 113,925 | | | $ | 79,043 | | | $ | 4,483 | |
Ratios to average net assets: | | | | | | | | | | | | | | | | | | | | |
Expenses | | | 1.13% | | | | 1.12% | | | | 1.10% | | | | 1.12% | | | | 1.14% | d |
Net investment income | | | 1.49% | | | | 1.44% | | | | 1.80% | | | | 1.87% | | | | 1.17% | d |
Portfolio turnover rate | | | 37.43% | | | | 30.67% | | | | 31.05% | | | | 69.67% | | | | 46.54% | |
| a | Based on average daily shares outstanding. |
| b | Total return does not include any fees, charges or expenses imposed by the variable annuity and life insurance contracts for which the Franklin Templeton Variable Insurance Products Trust serves as an underlying investment vehicle. Total return is not annualized for periods less than one year. |
| c | For the period January 6, 1999 (effective date) to December 31, 1999. |
See notes to financial statements.
TG-7
FRANKLIN TEMPLETON VARIABLE INSURANCE PRODUCTS TRUST
TEMPLETON GROWTH SECURITIES FUND
Statement of Investments, December 31, 2003
| | | | | | | |
| | | COUNTRY | | SHARES | | VALUE |
|
Common Stocks 85.9% | | | | | | | |
Aerospace & Defense 2.6% | | | | | | | |
BAE Systems PLC | | United Kingdom | | 3,247,043 | | $ | 9,779,900 |
BAE Systems PLC, 144A | | United Kingdom | | 35,823 | | | 107,897 |
Boeing Co. | | United States | | 289,000 | | | 12,178,460 |
Rolls-Royce Group PLC | | United Kingdom | | 3,661,602 | | | 11,618,463 |
| | | | | | |
|
|
| | | | | | | | 33,684,720 |
| | | | | | |
|
|
Airlines .8% | | | | | | | |
Singapore Airlines Ltd. | | Singapore | | 1,560,100 | | | 10,288,595 |
| | | | | | |
|
|
Automobiles .7% | | | | | | | |
Volkswagen AG | | Germany | | 165,400 | | | 9,252,636 |
| | | | | | |
|
|
Banks 7.5% | | | | | | | |
Abbey National PLC | | United Kingdom | | 1,703,959 | | | 16,197,387 |
DBS Group Holdings Ltd. | | Singapore | | 725,000 | | | 6,275,393 |
HSBC Holdings PLC | | Hong Kong | | 461,601 | | | 7,283,492 |
Kookmin Bank | | South Korea | | 323,500 | | | 12,122,765 |
Lloyds TSB Group PLC | | United Kingdom | | 1,924,424 | | | 15,433,701 |
Nordea AB | | Sweden | | 1,610,770 | | | 12,088,666 |
Standard Chartered PLC | | United Kingdom | | 691,455 | | | 11,418,830 |
UBS AG | | Switzerland | | 213,966 | | | 14,653,665 |
| | | | | | |
|
|
| | | | | | | | 95,473,899 |
| | | | | | |
|
|
Chemicals 3.7% | | | | | | | |
Akzo Nobel NV | | Netherlands | | 355,200 | | | 13,709,788 |
BASF AG | | Germany | | 145,200 | | | 8,195,888 |
Bayer AG, Br. | | Germany | | 418,290 | | | 12,346,097 |
Syngenta AG | | Switzerland | | 196,100 | | | 13,208,110 |
| | | | | | |
|
|
| | | | | | | | 47,459,883 |
| | | | | | |
|
|
Commercial Services & Supplies 1.7% | | | | | | | |
Brambles Industries PLC | | United Kingdom | | 1,784,500 | | | 6,500,882 |
Securitas AB | | Sweden | | 503,790 | | | 6,791,604 |
Waste Management Inc. | | United States | | 297,408 | | | 8,803,277 |
| | | | | | |
|
|
| | | | | | | | 22,095,763 |
| | | | | | |
|
|
Computers & Peripherals .3% | | | | | | | |
Hewlett-Packard Co. | | United States | | 144,590 | | | 3,321,232 |
| | | | | | |
|
|
Containers & Packaging .3% | | | | | | | |
Temple-Inland Inc. | | United States | | 59,950 | | | 3,757,067 |
| | | | | | |
|
|
Diversified Financials 2.5% | | | | | | | |
Morgan Stanley | | United States | | 100,000 | | | 5,787,000 |
Nomura Holdings Inc. | | Japan | | 899,000 | | | 15,309,088 |
Swire Pacific Ltd., A | | Hong Kong | | 1,748,800 | | | 10,789,778 |
| | | | | | |
|
|
| | | | | | | | 31,885,866 |
| | | | | | |
|
|
Diversified Telecommunication Services 7.1% | | | | | | | |
BCE Inc. | | Canada | | 344,317 | | | 7,700,338 |
KT Corp., ADR | | South Korea | | 688,360 | | | 13,127,025 |
Nippon Telegraph & Telephone Corp. | | Japan | | 3,501 | | | 16,889,213 |
Portugal Telecom SGPS SA | | Portugal | | 543,450 | | | 5,470,145 |
SBC Communications Inc. | | United States | | 441,280 | | | 11,504,170 |
TDC AS | | Denmark | | 430,274 | | | 15,525,332 |
TG-8
FRANKLIN TEMPLETON VARIABLE INSURANCE PRODUCTS TRUST
TEMPLETON GROWTH SECURITIES FUND
Statement of Investments, December 31, 2003 (cont.)
| | | | | | | |
| | | COUNTRY | | SHARES | | VALUE |
|
Common Stocks (cont.) | | | | | | | |
Diversified Telecommunication Services (cont) | | | | | | | |
aTelefonica SA | | Spain | | 540,160 | | $ | 7,930,704 |
Telefonos de Mexico SA de CV (Telmex), L, ADR | | Mexico | | 368,216 | | | 12,162,174 |
| | | | | | |
|
|
| | | | | | | | 90,309,101 |
| | | | | | |
|
|
Electric Utilities 4.2% | | | | | | | |
E.On AG | | Germany | | 323,600 | | | 21,196,453 |
Endesa SA | | Spain | | 600,000 | | | 11,541,372 |
Hong Kong Electric Holdings Ltd. | | Hong Kong | | 2,680,498 | | | 10,599,630 |
Iberdrola SA, Br. | | Spain | | 331,200 | | | 6,546,297 |
Korea Electric Power Corp. | | South Korea | | 229,100 | | | 4,114,763 |
| | | | | | |
|
|
| | | | | | | | 53,998,515 |
| | | | | | |
|
|
Electronic Equipment & Instruments 1.6% | | | | | | | |
aCelestica Inc. | | Canada | | 445,040 | | | 6,706,753 |
Hitachi Ltd. | | Japan | | 2,191,500 | | | 13,209,937 |
| | | | | | |
|
|
| | | | | | | | 19,916,690 |
| | | | | | |
|
|
Energy Equipment & Services .9% | | | | | | | |
aNoble Corp. | | United States | | 327,600 | | | 11,721,528 |
| | | | | | |
|
|
Food & Drug Retailing 3.3% | | | | | | | |
Albertson’s Inc. | | United States | | 537,800 | | | 12,181,170 |
J Sainsbury PLC | | United Kingdom | | 3,133,140 | | | 17,541,568 |
aKroger Co. | | United States | | 654,190 | | | 12,109,057 |
| | | | | | |
|
|
| | | | | | | | 41,831,795 |
| | | | | | |
|
|
Food Products 5.5% | | | | | | | |
Cadbury Schweppes PLC | | United Kingdom | | 1,880,000 | | | 13,806,949 |
General Mills Inc. | | United States | | 205,670 | | | 9,316,851 |
H.J. Heinz Co. | | United States | | 278,585 | | | 10,148,852 |
Nestle SA | | Switzerland | | 80,399 | | | 20,087,561 |
Unilever NV | | Netherlands | | 263,257 | | | 17,217,300 |
| | | | | | |
|
|
| | | | | | | | 70,577,513 |
| | | | | | |
|
|
Gas Utilities .5% | | | | | | | |
TransCanada Corp. | | Canada | | 300,000 | | | 6,472,432 |
| | | | | | |
|
|
Health Care Providers & Services .6% | | | | | | | |
AmerisourceBergen Corp. | | United States | | 3,400 | | | 190,910 |
CIGNA Corp. | | United States | | 126,750 | | | 7,288,125 |
HCA Inc. | | United States | | 3,500 | | | 150,360 |
| | | | | | |
|
|
| | | | | | | | 7,629,395 |
| | | | | | |
|
|
Hotels Restaurants & Leisure 1.2% | | | | | | | |
Accor SA | | France | | 213,300 | | | 9,658,767 |
Carnival Corp. | | United States | | 157,373 | | | 6,252,429 |
| | | | | | |
|
|
| | | | | | | | 15,911,196 |
| | | | | | |
|
|
Household Durables 1.5% | | | | | | | |
Koninklijke Philips Electronics NV | | Netherlands | | 315,570 | | | 9,214,740 |
Sony Corp. | | Japan | | 299,100 | | | 10,354,213 |
| | | | | | |
|
|
| | | | | | | | 19,568,953 |
| | | | | | |
|
|
TG-9
FRANKLIN TEMPLETON VARIABLE INSURANCE PRODUCTS TRUST
TEMPLETON GROWTH SECURITIES FUND
Statement of Investments, December 31, 2003 (cont.)
| | | | | | | |
| | | COUNTRY | | SHARES | | VALUE |
|
Common Stocks (cont.) | | | | | | | |
Industrial Conglomerates 1.9% | | | | | | | |
Hutchison Whampoa Ltd. | | Hong Kong | | 1,068,000 | | $ | 7,875,599 |
Smiths Group PLC | | United Kingdom | | 850,100 | | | 10,059,184 |
Tyco International Ltd. | | United States | | 262,920 | | | 6,967,380 |
| | | | | | |
|
|
| | | | | | | | 24,902,163 |
| | | | | | |
|
|
Insurance 4.4% | | | | | | | |
Ace Ltd. | | Bermuda | | 302,000 | | | 12,508,840 |
AXA SA | | France | | 348,340 | | | 7,456,269 |
Swiss Reinsurance Co. | | Switzerland | | 223,730 | | | 15,105,280 |
Willis Group Holdings Ltd. | | United States | | 270,398 | | | 9,212,460 |
XL Capital Ltd., A | | Bermuda | | 155,300 | | | 12,043,515 |
| | | | | | |
|
|
| | | | | | | | 56,326,364 |
| | | | | | |
|
|
IT Consulting & Services 1.4% | | | | | | | |
Electronic Data Systems Corp. | | United States | | 525,302 | | | 12,890,911 |
Satyam Computers Services Ltd. | | India | | 686,066 | | | 5,523,865 |
| | | | | | |
|
|
| | | | | | | | 18,414,776 |
| | | | | | |
|
|
Machinery | | | | | | | |
Volvo AB, B | | Sweden | | 993 | | | 30,362 |
| | | | | | |
|
|
Media 3.5% | | | | | | | |
Pearson PLC | | United Kingdom | | 1,063,752 | | | 11,844,646 |
Reed Elsevier NV | | Netherlands | | 1,005,800 | | | 12,496,380 |
Reuters Group PLC | | United Kingdom | | 2,141,933 | | | 9,010,835 |
aTime Warner Inc. | | United States | | 300,000 | | | 5,397,000 |
Wolters Kluwer NV | | Netherlands | | 349,853 | | | 5,471,969 |
| | | | | | |
|
|
| | | | | | | | 44,220,830 |
| | | | | | |
|
|
Metals & Mining 1.8% | | | | | | | |
Barrick Gold Corp. | | Canada | | 348,800 | | | 7,921,248 |
BHP Billiton PLC | | United Kingdom | | 1,065,996 | | | 9,312,509 |
POSCO | | South Korea | | 39,792 | | | 5,443,639 |
| | | | | | |
|
|
| | | | | | | | 22,677,396 |
| | | | | | |
|
|
Multi-Utilities 1.3% | | | | | | | |
National Grid Transco PLC | | United Kingdom | | 2,334,378 | | | 16,726,066 |
| | | | | | |
|
|
Multiline Retail .4% | | | | | | | |
Marks & Spencer Group PLC | | United Kingdom | | 1,099,900 | | | 5,690,394 |
| | | | | | |
|
|
Oil & Gas 5.8% | | | | | | | |
BP PLC | | United Kingdom | | 2,873,817 | | | 23,304,973 |
Eni SpA | | Italy | | 1,081,305 | | | 20,404,040 |
Repsol YPF SA | | Spain | | 424,530 | | | 8,278,549 |
Shell Transport & Trading Co. PLC | | United Kingdom | | 2,982,593 | | | 22,184,841 |
| | | | | | |
|
|
| | | | | | | | 74,172,403 |
| | | | | | |
|
|
Paper & Forest Products 3.2% | | | | | | | |
Bowater Inc. | | United States | | 191,800 | | | 8,882,258 |
International Paper Co. | | United States | | 240,000 | | | 10,346,400 |
Stora Enso OYJ, R | | Finland | | 763,800 | | | 10,289,334 |
UPM-Kymmene Corp. | | Finland | | 624,400 | | | 11,908,335 |
| | | | | | |
|
|
| | | | | | | | 41,426,327 |
| | | | | | |
|
|
TG-10
FRANKLIN TEMPLETON VARIABLE INSURANCE PRODUCTS TRUST
TEMPLETON GROWTH SECURITIES FUND
Statement of Investments, December 31, 2003 (cont.)
| | | | | | | | |
| | | COUNTRY | | SHARES | | | VALUE |
|
Common Stocks (cont.) | | | | | | | | |
Pharmaceuticals 8.8% | | | | | | | | |
Abbott Laboratories | | United States | | 283,510 | | | $ | 13,211,566 |
Aventis SA | | France | | 308,743 | | | | 20,406,323 |
Bristol-Myers Squibb Co. | | United States | | 737,730 | | | | 21,099,078 |
GlaxoSmithKline PLC | | United Kingdom | | 815,888 | | | | 18,695,273 |
Novartis AG | | Switzerland | | 297,700 | | | | 13,515,953 |
Pfizer Inc. | | United States | | 420,000 | | | | 14,838,600 |
aShire Pharmaceuticals Group PLC | | United Kingdom | | 1,111,940 | | | | 10,798,723 |
| | | | | | | |
|
|
| | | | | | | | | 112,565,516 |
| | | | | | | |
|
|
Real Estate 1.3% | | | | | | | | |
Cheung Kong Holdings Ltd. | | Hong Kong | | 2,166,499 | | | | 17,231,866 |
| | | | | | | |
|
|
Semiconductors & Semiconductor Equipment .8% | | | | | | | | |
Samsung Electronics Co. Ltd. | | South Korea | | 26,320 | | | | 9,962,501 |
| | | | | | | |
|
|
Software 1.7% | | | | | | | | |
aCheck Point Software Technologies Ltd. | | Israel | | 390,510 | | | | 6,568,378 |
Nintendo Co. Ltd. | | Japan | | 160,000 | | | | 14,929,551 |
| | | | | | | |
|
|
| | | | | | | | | 21,497,929 |
| | | | | | | |
|
|
Specialty Retail .4% | | | | | | | | |
aToys R Us Inc. | | United States | | 375,000 | | | | 4,740,000 |
| | | | | | | |
|
|
Wireless Telecommunication Services 2.7% | | | | | | | | |
aAT&T Wireless Services Inc. | | United States | | 1,522,000 | | | | 12,160,780 |
China Mobile (Hong Kong) Ltd., fgn. | | China | | 3,598,500 | | | | 11,054,694 |
SK Telecom Co. Ltd. | | South Korea | | 61,223 | | | | 10,225,243 |
SK Telecom Co. Ltd., ADR | | South Korea | | 54,400 | | | | 1,015,038 |
| | | | | | | |
|
|
| | | | | | | | | 34,455,755 |
| | | | | | | |
|
|
Total Common Stocks (Cost $968,463,184) | | | | | | | | 1,100,197,427 |
| | | | | | | |
|
|
Preferred Stocks 1.2% | | | | | | | | |
Cia Vale do Rio Doce, ADR, pfd., A | | Brazil | | 138,500 | | | | 7,134,135 |
Petroleo Brasileiro SA, ADR, pfd. | | Brazil | | 173,100 | | | | 4,614,846 |
Volkswagen AG, pfd. | | Germany | | 108,300 | | | | 3,947,868 |
| | | | | | | |
|
|
Total Preferred Stocks (Cost $10,732,153) | | | | | | | | 15,696,849 |
| | | | | | | |
|
|
Convertible Bond (Cost $325,173) .1% | | | | PRINCIPAL
AMOUNTc
|
| | | |
AXA SA, cvt., zero cpn., 12/21/04 | | France | | 21,771 | EUR | | | 439,100 |
| | | | | | | |
|
|
Total Investments before Repurchase Agreements (Cost $979,520,510) | | | | | | | | 1,116,333,376 |
| | | | | | | |
|
|
Repurchase Agreements 11.8% | | | | | | | | |
b BZW Securities Inc. 0.84%, 1/02/04 (Maturity Value $70,003,267)
Collateralized by U.S. Treasury Bills, Notes and Bonds, and U.S. Government Agency Securities | | United States | | 70,000,000 | | | | 70,000,000 |
b Federal Home Loan Bank .75%, 1/02/04 (Maturity Value $11,470,000)
Collateralized by U.S. Treasury Bills, Notes and Bonds, and U.S. Government Agency Securities | | United States | | 11,470,000 | | | | 11,469,522 |
b Paribas Corp .93%, 1/02/04 (Maturity Value $70,003,617)
Collateralized by U.S. Treasury Bills, Notes and Bonds, and Government Agency Securities | | United States | | 70,000,000 | | | | 70,000,000 |
TG-11
FRANKLIN TEMPLETON VARIABLE INSURANCE PRODUCTS TRUST
TEMPLETON GROWTH SECURITIES FUND
Statement of Investments, December 31, 2003 (cont.)
| | | | | | | |
| | | COUNTRY | | SHARES | | VALUE |
|
Repurchase Agreements (cont.) | | | | | | | |
Total Repurchase Agreements (Cost $151,469,522) | | | | | | $ | 151,469,522 |
| | | | | | |
|
|
Total Investments (Cost $1,130,990,032) 99.0% | | | | | | | 1,267,802,898 |
Other Assets, less Liabilities 1.0% | | | | | | | 13,194,830 |
| | | | | | |
|
|
Net Assets 100.0% | | | | | | $ | 1,280,997,728 |
| | | | | | |
|
|
Currency Abbreviations:
EUR - Euro
| b | See Note 1(c) regarding repurchase agreements. |
| c | The principal amount is stated in U.S. dollars unless otherwise indicated. |
See notes to financial statements.
TG-12
FRANKLIN TEMPLETON VARIABLE INSURANCE PRODUCTS TRUST
TEMPLETON GROWTH SECURITIES FUND
Financial Statements
Statement of Assets and Liabilities
December 31, 2003
| | | |
Assets: | | | |
Investments in securities: | | | |
Cost | | $ | 979,520,510 |
| | |
|
|
Value | | | 1,116,333,376 |
Repurchase agreements, at value and cost | | | 151,469,522 |
Cash | | | 76,092 |
Foreign currency, at value (cost $6,829,852) | | | 7,061,422 |
Receivables: | | | |
Investment securities sold | | | 4,086,363 |
Capital shares sold | | | 1,340,813 |
Dividends and Interest | | | 2,685,276 |
| | |
|
|
Total assets | | | 1,283,052,864 |
| | |
|
|
Liabilities: | | | |
Payables: | | | |
Investment securities purchased | | | 195,143 |
Capital shares redeemed | | | 373,015 |
Affiliates | | | 1,020,837 |
Deferred tax liability (Note 1g) | | | 258,124 |
Other liabilities | | | 208,017 |
| | |
|
|
Total liabilities | | | 2,055,136 |
| | |
|
|
Net assets, at value | | $ | 1,280,997,728 |
| | |
|
|
Net assets consist of: | | | |
Undistributed net investment income | | $ | 16,602,943 |
Net unrealized appreciation (depreciation) | | | 136,894,643 |
Accumulated net realized gain (loss) | | | (78,853,936) |
Capital shares | | | 1,206,354,078 |
| | |
|
|
Net assets, at value | | $ | 1,280,997,728 |
| | |
|
|
Class 1: | | | |
Net assets, at value | | $ | 769,339,086 |
| | |
|
|
Shares outstanding | | | 68,049,173 |
| | |
|
|
Net asset value and offering price per share | | $ | 11.31 |
| | |
|
|
Class 2: | | | |
Net assets, at value | | $ | 511,658,642 |
| | |
|
|
Shares outstanding | | | 45,705,756 |
| | |
|
|
Net asset value and offering price per share | | $ | 11.19 |
| | |
|
|
See notes to financial statements.
TG-13
FRANKLIN TEMPLETON VARIABLE INSURANCE PRODUCTS TRUST
TEMPLETON GROWTH SECURITIES FUND
Financial Statements (continued)
Statement of Operations
for the year ended December 31, 2003
| | | | |
Investment income: | | | | |
(net of foreign taxes and fees of $2,469,013) | | | | |
Dividends | | | $ 24,724,072 | |
Interest | | | 1,037,496 | |
| | |
|
|
|
Total investment income | | | 25,761,568 | |
| | |
|
|
|
Expenses: | | | | |
Management fees (Note 3) | | | 7,964,686 | |
Distribution fees - Class 2 (Note 3) | | | 768,510 | |
Transfer agent fees | | | 5,244 | |
Other | | | 634,281 | |
| | |
|
|
|
Total expenses | | | 9,372,721 | |
| | |
|
|
|
Net investment income | | | 16,388,847 | |
| | |
|
|
|
Realized and unrealized gains (losses): | | | | |
Net realized gain (loss) from: | | | | |
Investments (net of foreign taxes of $84,349) (Note 1g) | | | (17,384,016 | ) |
Foreign currency transactions | | | 252,727 | |
| | |
|
|
|
Net realized gain (loss) | | | (17,131,289 | ) |
Net unrealized appreciation (depreciation) on: | | | | |
Investments | | | 296,364,236 | |
Translation of assets and liabilities denominated in foreign currencies | | | 693,277 | |
Deferred taxes (Note 1g) | | | (258,124 | ) |
| | |
|
|
|
Net unrealized appreciation (depreciation) | | | 296,799,389 | |
| | |
|
|
|
Net realized and unrealized gain (loss) | | | 279,668,100 | |
| | |
|
|
|
Net increase (decrease) in net assets resulting from operations | | $ | 296,056,947 | |
| | |
|
|
|
See notes to financial statements.
TG-14
FRANKLIN TEMPLETON VARIABLE INSURANCE PRODUCTS TRUST
TEMPLETON GROWTH SECURITIES FUND
Financial Statements (continued)
Statements of Changes in Net Assets
for the years ended December 31, 2003 and 2002
| | | | | | | | |
| | | 2003 | | | 2002 | |
| | |
| |
Increase (decrease) in net assets: | | | | | | | | |
Operations: | | | | | | | | |
Net investment income | | $ | 16,388,847 | | | $ | 16,151,877 | |
Net realized gain (loss) from investments and foreign currency transactions | | | (17,131,289 | ) | | | (59,721,285 | ) |
Net unrealized appreciation (depreciation) on investments and translation of assets and liabilities denominated in foreign currencies, and deferred taxes | | | 296,799,389 | | | | (148,198,002 | ) |
| | |
| |
Net increase (decrease) in net assets resulting from operations | | | 296,056,947 | | | | (191,767,410 | ) |
Distributions to shareholders from: | | | | | | | | |
Net investment income: | | | | | | | | |
Class 1 | | | (11,363,488 | ) | | | (20,070,527 | ) |
Class 2 | | | (4,553,762 | ) | | | (3,259,082 | ) |
Net realized gains: | | | | | | | | |
Class 1 | | | — | | | | (18,428,918 | ) |
Class 2 | | | — | | | | (3,204,573 | ) |
| | |
| |
Total distributions to shareholders | | | (15,917,250) | | | | (44,963,100 | ) |
Capital share transactions: (Note 2) | | | | | | | | |
Class 1 | | | (80,154,599 | ) | | | (102,174,647 | ) |
Class 2 | | | 225,420,705 | | | | 113,847,109 | |
| | |
| |
Total capital share transactions | | | 145,266,106 | | | | 11,672,462 | |
Net increase (decrease) in net assets | | | 425,405,803 | | | | (225,058,048 | ) |
Net assets: | | | | | | | | |
Beginning of year | | | 855,591,925 | | | | 1,080,649,973 | |
| | |
| |
End of year | | $ | 1,280,997,728 | | | $ | 855,591,925 | |
| | |
| |
Undistributed net investment income included in net assets: | | | | | | | | |
End of year | | | $16,602,943 | | | $ | 15,907,519 | |
| | |
| |
See notes to financial statements.
TG-15
FRANKLIN TEMPLETON VARIABLE INSURANCE PRODUCTS TRUST
TEMPLETON GROWTH SECURITIES FUND
Notes to Financial Statements
1. ORGANIZATION AND SIGNIFICANT ACCOUNTING POLICIES
Franklin Templeton Variable Insurance Products Trust (the Trust) is registered under the Investment Company Act of 1940 as an open-end investment company consisting of twenty-two separate series (the Funds). Templeton Growth Securities Fund (the Fund) included in this report is diversified. Shares of the Fund are sold only to insurance company separate accounts to fund the benefits of variable life insurance policies or variable annuity contracts. The Fund’s investment objective is capital growth.
The following summarizes the Fund’s significant accounting policies.
a. Security Valuation
Securities listed or traded on a recognized national exchange or NASDAQ are valued at the last reported sales price. Over-the-counter securities and listed securities for which no sale is reported are valued within the range of the latest quoted bid and asked prices. Foreign securities are valued at the close of trading of the foreign exchange or the NYSE, whichever is earlier. If events occur that materially affect the values of securities after the prices or foreign exchange rates are determined, or if market quotations are not readily available, the securities will be valued at fair value as determined following procedures approved by the Board of Trustees.
b. Foreign Currency Translation
Portfolio securities and other assets and liabilities denominated in foreign currencies are translated into U.S. dollars based on the exchange rate of such currencies against U.S. dollars on the date of valuation. Purchases and sales of securities and income items denominated in foreign currencies are translated into U.S. dollars at the exchange rate in effect on the transaction date.
The Fund does not separately report the effect of changes in foreign exchange rates from changes in market prices on securities held. Such changes are included in net realized and unrealized gain or loss from investments.
Realized foreign exchange gains or losses arise from sales of foreign currencies, currency gains or losses realized between the trade and settlement dates on securities transactions and the difference between the recorded amounts of dividends, interest, and foreign withholding taxes and the U.S. dollar equivalent of the amounts actually received or paid. Net unrealized foreign exchange gains and losses arise from changes in foreign exchange rates on foreign denominated assets and liabilities other than investments in securities held at the end of the reporting period.
c. Repurchase Agreements
The Fund may enter into repurchase agreements, which are accounted for as a loan by the Fund to the seller, collateralized by securities which are delivered to the Fund’s custodian. The market value, including accrued interest, of the initial collateralization is required to be at least 102% of the dollar amount invested by the Fund, with the value of the underlying securities marked to market daily to maintain coverage of at least 100%. At December 31, 2003, all repurchase agreements held by the Fund had been entered into on that date.
d. Foreign Currency Contracts
When the Fund purchases or sells foreign securities it may enter into foreign exchange contracts to minimize foreign exchange risk from the trade date to the settlement date of the transactions. A foreign exchange contract is an agreement between two parties to exchange different currencies at an agreed upon exchange rate on a specified date. Realized and unrealized gains and losses are included in the Statement of Operations.
The risks of these contracts include movement in the values of the foreign currencies relative to the U.S. dollar and the possible inability of the counterparties to fulfill their obligations under the contracts.
TG-16
FRANKLIN TEMPLETON VARIABLE INSURANCE PRODUCTS TRUST
TEMPLETON GROWTH SECURITIES FUND
Notes to Financial Statements (continued)
1. ORGANIZATION AND SIGNIFICANT ACCOUNTING POLICIES (cont.)
e. Income Taxes
No provision has been made for income taxes because the Fund’s policy is to qualify as a regulated investment company under the Internal Revenue Code and to distribute substantially all of its taxable income.
f. Security Transactions, Investment Income, Expenses and Distributions
Security transactions are accounted for on trade date. Realized gains and losses on security transactions are determined on a specific identification basis. Certain income from foreign securities is recorded as soon as information is available to the Fund. Interest income and estimated expenses are accrued daily. Dividend income and distributions to shareholders are recorded on the ex-dividend date.
Common expenses incurred by the Trust are allocated among the Funds based on the ratio of net assets of each Fund to the combined net assets. Other expenses are charged to each Fund on a specific identification basis.
Realized and unrealized gains and losses and net investment income, other than class specific expenses, are allocated daily to each class of shares based upon the relative proportion of net assets of each class.
g. Deferred Taxes
The Fund is subject to a tax imposed on net realized gains of securities of certain foreign countries. The Fund records an estimated deferred tax liability for net unrealized gains on these securities as reflected in the accompanying financial statements.
h. Accounting Estimates
The preparation of financial statements in accordance with accounting principles generally accepted in the United States of America requires management to make estimates and assumptions that affect the reported amounts of assets and liabilities at the date of the financial statements and the amounts of income and expense during the reporting period. Actual results could differ from those estimates.
i. Guarantees and Indemnifications
Under the Trust’s organizational documents, its officers and trustees are indemnified against certain liability arising out of the performance of their duties to the Trust. Additionally, in the normal course of business, the Trust enters into contracts with service providers that contain general indemnification clauses. The Trust’s maximum exposure under these arrangements is unknown as this would involve future claims that may be made against the Trust that have not yet occurred. However, based on experience, the Trust expects the risk of loss to be remote.
2. SHARES OF BENEFICIAL INTEREST
The Fund offers two classes of shares: Class 1 and Class 2. Each class of shares differs by its distribution fees, voting rights on matters affecting a single class and its exchange privilege.
TG-17
FRANKLIN TEMPLETON VARIABLE INSURANCE PRODUCTS TRUST
TEMPLETON GROWTH SECURITIES FUND
Notes to Financial Statements (continued)
2. SHARES OF BENEFICIAL INTEREST (cont.)
At December 31, 2003, there were an unlimited number of shares authorized ($.01 par value). Transactions in the Fund’s shares were as follows:
| | | | | | | | | | | | | | |
| | | Year Ended December 31,
| |
| | | 2003
| | | 2002
| |
| Class 1 Shares: | | Shares
| | | Amount
| | | Shares
| | | Amount
| |
Shares sold | | 1,110,988 | | | $ | 10,553,604 | | | 27,335,041 | | | $ | 291,949,245 | |
Shares issued in reinvestment of distributions | | 1,181,236 | | | | 11,363,488 | | | 3,694,764 | | | | 38,499,445 | |
Shares redeemed | | (11,030,466 | ) | | | (102,071,691 | ) | | (41,405,187 | ) | | | (432,623,337 | ) |
| | |
| |
Net increase (decrease) | | (8,738,242 | ) | | $ | (80,154,599 | ) | | (10,375,382 | ) | | $ | (102,174,647 | ) |
| | |
| |
| Class 2 Shares: | | | | | | | | | | | | |
Shares sold | | 30,448,582 | | | $ | 289,636,811 | | | 21,239,772 | | | $ | 207,175,310 | |
Shares issued in reinvestment of distributions | | 477,333 | | | | 4,553,762 | | | 624,508 | | | | 6,463,655 | |
Shares redeemed | | (7,334,303 | ) | | | (68,769,868 | ) | | (10,095,406 | ) | | | (99,791,856 | ) |
| | |
| |
Net increase (decrease) | | 23,591,612 | | | $ | 225,420,705 | | | 11,768,874 | | | $ | 113,847,109 | |
| | |
| |
3. TRANSACTIONS WITH AFFILIATES
Certain officers and trustees of the Fund are also officers and/or directors of the following entities:
| | |
| Entity | | Affiliation |
|
Franklin Templeton Services LLC (FT Services) | | Administrative manager |
Templeton Asset Management Ltd. (TAML) | | Investment manager |
Templeton Global Advisors Ltd. (TGAL) | | Investment manager |
Franklin/Templeton Distributors Inc. (Distributors) | | Principal underwriter |
Franklin/Templeton Investor Services LLC (Investor Services) | | Transfer agent |
The Fund pays an investment management fee to TGAL based on the average daily net assets of the Fund as follows:
| | |
| Annualized Fee Rate | | Net Assets |
|
| 1.00% | | First $100 million |
| .90% | | Over $100 million, up to and including $250 million |
.80%
.75% | | Over $250 million, up to and including $500 million Over $500 million |
Under an agreement with TGAL, FT Services provides administrative services to the Fund. The fee is paid by TGAL based on the average daily net assets, and is not an additional expense of the Fund.
Under a subadvisory agreement, TAML, an affiliate of TGAL, provides subadvisory services to the Fund and receives from TGAL fees based on the average daily net assets of the Fund.
The Fund reimburses Distributors up to .25% per year of its average daily net assets of Class 2 shares for costs incurred in marketing the Fund’s shares.
Investor Services, under terms of an agreement, performs shareholder servicing for the Fund and is not paid by the Fund for the services.
TG-18
FRANKLIN TEMPLETON VARIABLE INSURANCE PRODUCTS TRUST
TEMPLETON GROWTH SECURITIES FUND
Notes to Financial Statements (continued)
4. INCOME TAXES
At December 31, 2003, the Fund had tax basis capital losses of $78,798,487, which may be carried over to offset future capital gains. Such losses expire as follows:
| | | |
Capital loss carryovers expiring in: | | | |
2010 | | $ | 52,333,376 |
2011 | | | 26,465,111 |
| | |
|
| | | $ | 78,798,487 |
| | |
|
At December 31, 2003, the Fund had deferred currency losses occurring subsequent to October 31, 2003 of $55,449. For tax purposes, such losses will be reflected in the year ending December 31, 2004.
The tax character of distributions paid during the years ended December 31, 2003 and 2002, was as follows:
| | | | | | |
| | | 2003
| | 2002
|
Distributions paid from: | | | | | | |
Ordinary income | | $ | 15,917,250 | | $ | 33,239,449 |
Long term capital gain | | | — | | | 11,723,651 |
| | |
|
| | | $ | 15,917,250 | | $ | 44,963,100 |
| | |
|
At December 31, 2003, the cost of investments, net unrealized appreciation (depreciation), undistributed ordinary income and undistributed long term capital gains for income tax purposes were as follows:
| | | | |
Cost of investments | | $ | 1,130,978,446 | |
| | |
|
|
|
Unrealized appreciation | | $ | 195,803,036 | |
Unrealized depreciation | | | (58,978,584 | ) |
| | |
|
|
|
Net unrealized appreciation (depreciation) | | $ | 136,824,452 | |
| | |
|
|
|
Undistributed ordinary income | | $ | 16,591,356 | |
Undistributed long term capital gains | | | — | |
| | |
|
|
|
Distributable earnings | | $ | 16,591,356 | |
| | |
|
|
|
Net investment income (loss) differs for financial statements and tax purposes primarily due to differing treatment of foreign currency transactions.
Net realized gains (losses) differ for financial statement and tax purposes primarily due to differing treatment of wash sales and foreign currency transactions.
5. INVESTMENT TRANSACTIONS
Purchases and sales of securities (excluding short-term securities) for the period ended December 31, 2003 aggregated $355,356,084 and $327,926,441, respectively.
6. REGULATORY MATTERS
On February 4, 2004, the Securities Division of the Office of the Secretary of the Commonwealth of Massachusetts filed an administrative complaint against Franklin Resources, Inc. and certain of its subsidiaries (the “Company”), alleging violations of the Massachusetts Uniform Securities Act. The complaint arises from activity that occurred in 2001 during which time an officer of a Company subsidiary was negotiating an agreement with an investor relating to investments in a mutual fund and a hedge fund.
TG-19
FRANKLIN TEMPLETON VARIABLE INSURANCE PRODUCTS TRUST
TEMPLETON GROWTH SECURITIES FUND
Notes to Financial Statements (continued)
6. REGULATORY MATTERS (cont.)
The Company, in addition to other entities within Franklin Templeton Investments, has been named in shareholder class actions related to the matter described above. The Company believes that the claims made in the lawsuit are without merit and it intends to defend vigorously against the allegations. The Company and the Fund may be named in similar civil actions related to the matter described above.
In addition, as part of ongoing investigations by the U.S. Securities and Exchange Commission (the “SEC”), the U.S. Attorney for the Northern District of California, the New York Attorney General, the California Attorney General, the U.S. Attorney for the District of Massachusetts, the Florida Department of Financial Services, and the Commissioner of Securities and the Attorney General of the State of West Virginia, relating to certain practices in the mutual fund industry, including late trading, market timing and sales compensation arrangements, the Company and its subsidiaries, as well as certain current or former executives and employees of the Company, have received requests for information and/or subpoenas to testify or produce documents. The Company and its current employees are providing documents and information in response to these requests and subpoenas. In addition, the Company has responded to requests for similar kinds of information from regulatory authorities in some of the foreign countries where the Company conducts its global asset management business.
The Staff of the SEC has informed the Company that it intends to recommend that the Commission authorize an action against an affiliate of the Fund’s adviser and a senior executive officer relating to the frequent trading issues that are the subject of the SEC’s investigation. These issues were previously disclosed as being under investigation by government authorities and the subject of an internal inquiry by the Company in its Annual Report on Form 10-K and on its public website. The Company currently is in discussions with the SEC Staff in an effort to resolve the issues raised in their investigation. Such discussions are preliminary and the Fund’s management has been advised that the Company cannot predict the likelihood of whether those discussions will result in a settlement and, if so, the terms of such settlement. The impact, if any, of these matters on the Fund is uncertain at this time. If the Company finds that it bears responsibility for any unlawful or improper conduct, it has committed to making the Fund or its shareholders whole, as appropriate.
TG-20
FRANKLIN TEMPLETON VARIABLE INSURANCE PRODUCTS TRUST
TEMPLETON GROWTH SECURITIES FUND
Independent Auditors’ Report
To the Board of Trustees and Shareholders
of Franklin Templeton Variable Insurance Products Trust
In our opinion, the accompanying statement of assets and liabilities, including the statement of investments, and the related statements of operations and of changes in net assets and the financial highlights present fairly, in all material respects, the financial position of the Templeton Growth Securities Fund (the Fund) (one of the funds constituting the Franklin Templeton Variable Insurance Products Trust) at December 31, 2003, the results of its operations for the year then ended, the changes in its net assets for each of the two years in the period then ended and the financial highlights for each of the periods presented, in conformity with accounting principles generally accepted in the United States of America. These financial statements and financial highlights (hereafter referred to as “financial statements”) are the responsibility of the Fund’s management; our responsibility is to express an opinion on these financial statements based on our audits. We conducted our audits of these financial statements in accordance with auditing standards generally accepted in the United States of America, which require that we plan and perform the audits to obtain reasonable assurance about whether the financial statements are free of material misstatement. An audit includes examining, on a test basis, evidence supporting the amounts and disclosures in the financial statements, assessing the accounting principles used and significant estimates made by management, and evaluating the overall financial statement presentation. We believe that our audits, which included confirmation of securities at December 31, 2003 by correspondence with the custodian and brokers, provide a reasonable basis for our opinion.
PricewaterhouseCoopers LLP
San Francisco, California
February 5, 2004, except for Note 6 as to which the date is February 12, 2004
TG-21
FRANKLIN TEMPLETON VARIABLE INSURANCE PRODUCTS TRUST
TEMPLETON GROWTH SECURITIES FUND
Tax Designation (unaudited)
Under Section 854(b)(2) of the Code, the Fund hereby designates 28.40% of the ordinary income dividends as income qualifying for the dividends received deduction for the fiscal year ended December 31, 2003.
At December 31, 2003, more than 50% of the Fund’s total assets were invested in securities of foreign issuers. In most instances, foreign taxes were withheld from dividends paid to the Fund on these investments. The Fund elects to treat foreign taxes paid under Section 853 of the Internal Revenue Code. This election will allow shareholders of record in June 2004, to treat their proportionate share of foreign taxes paid by the Funds as having been paid directly by them. The shareholder shall consider these amounts as foreign taxes paid in the tax year in which they receive the Fund distribution.
The foreign tax information will be disclosed in the June 30, 2004, semi-annual report of the Fund.
TG-22
INDEX DESCRIPTIONS
The indexes are unmanaged and include reinvested distributions.
Consumer Price Index (CPI) is a measure of the average changes in price for a fixed basket of goods and services regularly bought by U.S. consumers; published by the Bureau of Labor Statistics.
Credit Suisse First Boston (CSFB) High Yield Index is designed to mirror the investable universe of the U.S. dollar denominated high yield debt market.
Dow Jones Industrial Average (the Dow) is price-weighted based on the average market price of 30 blue chip stocks of companies that are generally industry leaders. The average is found by adding the prices of the 30 stocks and dividing by a denominator that has been adjusted for stock splits and other corporate actions.
J.P. Morgan Emerging Markets Bond Index Global (EMBIG) tracks total returns for U.S. dollar-denominated debt instruments issued by emerging markets sovereign and quasi-sovereign entities: Brady bonds, loans and Eurobonds.
J.P. Morgan EMU Government Bond Index is a euro-aggregated index weighted by market capitalization. The index includes only liquid bullet euro-denominated fixed-rate debt, which has been issued by participating governments. No callable, puttable or convertible features are allowed. Bonds must have at least 12 months remaining maturity. The EMU bond index is fully invested. All coupons received are immediately invested back into the entire index until the next index rebalancing.
J.P. Morgan Global Government Bond Index (JPM GGBI) tracks total returns of government bonds in developed countries globally. The bonds included in the index are weighted according to their market capitalization. The index is unhedged and expressed in terms of $US.
J.P. Morgan U.S. Government Bond Total Return Index includes only actively traded fixed-rate bonds with a remaining maturity of one year or longer. The index is based on the gross price (net price plus accrued interest) of bonds in the index. The index is expressed in terms of $US.
Lehman Brothers Intermediate U.S. Government Bond Index includes securities issued by the U.S. Treasury or agency. These include public obligations of the U.S. Treasury with remaining maturity of one year or more and publicly issued debt of U.S. governmental agencies, quasi-federal corporations, and corporate or foreign debt. All issues included must have one to ten years to final maturity and must be rated investment grade (Baa3 or better) by Moody’s Investors Service. They must also be dollar-denominated and non-convertible. Total return includes price appreciation/depreciation and income as a percentage of the original investment. The index is rebalanced monthly by market capitalization.
Lehman Brothers Mortgage-Backed Securities (MBS) Index covers the mortgage-backed pass-through securities of Ginnie Mae (GNMA), Fannie Mae (FNMA) and Freddie Mac (FHLMC). The securities must have a weighted average maturity of at least one year, have at least $200 million par amount outstanding and be fixed rate. The index excludes buydowns, graduated equity mortgages and project loans. Non-agency (whole loan), 20-year securities, ARM securities and CMOs are also excluded.
IND-1
Lehman Brothers U.S. Treasury Index includes public obligations of the U.S. Treasury with a remaining maturity of one year or more. All issues must have at least one year to final maturity regardless of call features, have at least $200 million par amount outstanding and rated investment grade (Baa3 or better) by Moody’s Investors Service. They must also be dollar-denominated, non-convertible and publicly issued. The index excludes Treasury bills (because of the maturity constraint), flower bonds, targeted investor notes, and state and local government series bonds, STRIPS and Treasury Inflation-Protection Securities.
Lehman Brothers U.S. Aggregate Index represents securities that are SEC-registered, taxable and dollar denominated. The index covers the U.S. investment grade fixed-rate bond market, with index components for government and corporate securities, mortgage pass-through securities and asset-backed securities. All issues included must have at least one year to final maturity and must be rated investment grade (Baa3 or better) by Moody’s Investors Service. They must also be dollar-denominated and non-convertible. Total return includes price appreciation/depreciation and income as a percentage of the original investment. The index is rebalanced monthly by market capitalization.
Lehman Brothers U.S. Government/Credit Index includes securities issued by the U.S. Treasury or agency and publicly issued U.S. corporate and specified foreign debentures and secured notes that meet the specified maturity, liquidity and quality requirements. These include public obligations of the U.S. Treasury with remaining maturity of one year or more and publicly issued debt of U.S. governmental agencies, quasi-federal corporations, and corporate or foreign debt. The credit portion includes both corporate and non-corporate sectors. The corporate sectors are industrial, utility, and finance, which includes both U.S. and non-U.S. corporations. The non-corporate sectors are sovereign, supranational, foreign agency, and foreign local government. All issues included must have at least one year to final maturity and must be rated investment grade (Baa3 or better) by Moody’s Investors Service. They must also be dollar-denominated and non-convertible. Total return includes price appreciation/depreciation and income as a percentage of the original investment. The index is rebalanced monthly by market capitalization.
Lipper Multi-Sector Income Funds Objective Average is an equally weighted average calculation of performance figures for all funds within the Lipper Multi-Sector Income Funds classification in the Lipper Open-End underlying funds universe. Lipper Multi-Sector Income Funds are defined as funds that seek current income by allocating assets among different fixed income securities sectors (not primarily in one sector except for defensive purposes), including U.S. and foreign governments, with a significant portion rated below investment grade. For the one-year period ended 12/31/03, there were 112 funds in this category. Lipper calculations do not include contract fees, expenses or sales charges, and may have been different if such charges had been considered.
IND-2
Lipper VIP Equity Income Funds Objective Average is an equally weighted average calculation of performance figures for all funds within the Lipper Equity Income Funds classification in the Lipper VIP underlying funds universe. Lipper Equity Income Funds are defined as funds that seek relatively high current income and growth of income through investing at least 60% of their portfolios in equity securities. For the one-year period ended 12/31/03, there were 56 funds in this category. Lipper calculations do not include contract fees, expenses or sales charges, and may have been different if such charges had been considered.
Lipper VIP General U.S. Government Funds Objective Average is an equally weighted average calculation of performance figures for all funds within the Lipper U.S. Government Funds classification in the Lipper VIP underlying funds universe. Lipper U.S. Government Funds are defined as funds that invest primarily in U.S. government and Agency issues. For the one-year period ended 12/31/03, there were 48 funds in this category. Lipper calculations do not include contract fees, expenses or sales charges, and may have been different if such charges had been considered.
Lipper VIP Income Funds Objective Average is an equally weighted average calculation of performance figures for all funds within the Lipper Income Funds classification in the Lipper VIP underlying funds universe. Lipper Income Funds seek a high level of current income by investing in income-producing stocks, bonds and money market instruments. For the one-year period ended 12/31/03, there were 14 funds in this category. Lipper calculations do not include contract fees, expenses or sales charges, and may have been different if such charges had been considered.
Lipper VIP Multi-Cap Value Funds Objective Average is an equally weighted average calculation of performance figures for all funds within the Lipper Multi-Cap Value Funds classification in the Lipper VIP underlying funds universe. Lipper Multi-Cap Value Funds are defined as funds that invest in a variety of market capitalization ranges without concentrating 75% of their equity assets in any one market capitalization range over an extended period of time. For the one-year period ended 12/31/03, there were 107 funds in this category. Lipper calculations do not include contract fees, expenses or sales charges, and may have been different if such charges had been considered.
Lipper VIP Target Maturity Funds Objective Average is an equally weighted average calculation of performance figures for all funds within the Lipper Target Maturity Funds classification in the Lipper VIP underlying funds universe. Lipper Target Maturity Funds are defined as funds that invest principally in zero coupon U.S. Treasury securities or in coupon-bearing U.S. government securities targeted to mature in a specific year. For the one-year period ended 12/31/03, there were 9 funds in this category. Lipper calculations do not include contract fees, expenses or sales charges, and may have been different if such charges had been considered.
Lipper VIP Utility Funds Objective Average is an equally weighted average calculation of performance figures for all funds within the Lipper Utility Funds classification in the Lipper VIP underlying funds universe. Lipper Utility Funds are defined as funds that invest primarily in utility shares. For the one-year period ended 12/31/03, there were 25 funds in this category. Lipper calculations do not include contract fees, expenses or sales charges, and may have been different if such charges had been considered.
IND-3
Merrill Lynch 2-, 5- and 10-Year Zero Coupon Bond Indexes include zero coupon bonds that pay no interest and are issued at a discount from redemption price.
Morgan Stanley Capital International (MSCI) All Country (AC) World Free Index is market capitalization-weighted and measures total returns of equity securities available to foreign (non-local) investors in developed and emerging markets globally.
Morgan Stanley Capital International (MSCI) Emerging Markets Free Index is market capitalization-weighted and measures total returns of equity securities available to foreign (non-local) investors in emerging markets globally.
Morgan Stanley Capital International (MSCI) Europe Australasia Far East (EAFE) Index is market capitalization-weighted and measures total returns of equity securities in developed markets in Europe, Australasia and the Far East.
Morgan Stanley Capital International (MSCI) Japan Index is market capitalization-weighted and measures total returns of equity securities in Japan.
Morgan Stanley Capital International (MSCI) Korea Index is market capitalization-weighted and measures total returns of equity securities in Korea.
Morgan Stanley Capital International (MSCI) World Financial Index is market capitalization-weighted and measures total returns of financial securities in developed markets globally.
Morgan Stanley Capital International (MSCI) World Index is market capitalization-weighted and measures total returns of equity securities in developed markets globally.
Mortgage Bankers Association Refinancing Index covers all mortgage applications to refinance an existing mortgage. It is the best overall gauge of mortgage refinancing activity.
Nasdaq Telecommunications Index is a capitalization-weighted index designed to measure performance of all Nasdaq stocks in the telecommunications sector. The index was developed with a base value of 100 as of February 5, 1971.
National Association of Securities Dealers Automated Quotations (Nasdaq) Composite Index measures all domestic and international common stocks listed on The Nasdaq Stock Market. The index is market value-weighted and includes over 3,000 companies.
Russell 1000® Growth Index is market capitalization-weighted and measures performance of those Russell 1000 Index companies with higher price-to-book ratios and higher forecasted growth values.
Russell 1000 Index is market capitalization-weighted and measures performance of the 1,000 largest companies in the Russell 3000 Index, which represented approximately 92% of total market capitalization of the Russell 3000 Index, as of 12/31/03.
Russell 1000 Value Index is market capitalization-weighted and measures performance of those Russell 1000 Index companies with lower price-to-book ratios and lower forecasted growth values.
IND-4
Russell 2000® Index is market capitalization-weighted and measures performance of the 2,000 smallest companies in the Russell 3000 Index, which represented approximately 8% of total market capitalization of the Russell 3000 Index, as of 12/31/03.
Russell 2000 Value Index is market capitalization-weighted and measures performance of those Russell 2000 Index companies with lower price-to-book ratios and lower forecasted growth values.
Russell 2500™ Growth Index is market capitalization-weighted and measures performance of those Russell 2500 Index companies with higher price-to-book ratios and higher forecasted growth values.
Russell 3000® Growth Index is market capitalization-weighted and measures performance of those Russell 3000 Index companies with higher price-to-book ratios and higher forecasted growth values.
Russell 3000 Index is market capitalization-weighted and measures performance of the 3,000 largest U.S. companies based on total market capitalization, which represented approximately 98% of the investable U.S. equity market, as of 12/31/03.
Russell 3000 Value Index is market capitalization-weighted and measures performance of those Russell 3000 Index companies with lower price-to-book ratios and lower forecasted growth values.
Russell Midcap® Value Index is market capitalization-weighted and measures performance of those Russell Midcap companies with lower price-to-book ratios and lower forecasted growth values.
Standard & Poor’s 500 Composite Index (S&P 500) consists of 500 stocks chosen for market size, liquidity and industry group representation. Each stock’s weight in the index is proportionate to its market value. The S&P 500 is one of the most widely used benchmarks of U.S. equity performance.
S&P/International Finance Corporation Investable (IFCI) Composite Index is a market capitalization weighted index designed to measure the performance of emerging market stocks. It tracks approximately 2,000 securities in countries such as Brazil, Mexico, China and South Korea. Performance represents total return in $US.
Wilshire Real Estate Securities Index is a broad measure of the performance of publicly traded real estate securities, such as real estate investment trusts and real estate operating companies. The index is capitalization-weighted and rebalanced monthly, and returns are calculated on a buy-and-hold basis.
IND-5
Board Members and Officers
Independent Board Members
| | | | | | | | |
| Name, Age and Address | | Position | | Length of
Time Served | | Number of
Portfolios in Fund
Complex Overseen
by Board Member* | | Other Directorships Held |
|
| | | | |
FRANK H. ABBOTT, III (82) One Franklin Parkway San Mateo, CA 94403-1906 | | Trustee | | Since 1988 | | 113 | | None |
|
Principal Occupation During Past 5 Years: President and Director, Abbott Corporation (an investment company). |
|
| | | | |
HARRIS J. ASHTON (71) One Franklin Parkway San Mateo, CA 94403-1906 | | Trustee | | Since 1988 | | 142 | | Director, Bar-S Foods (meat packing company). |
|
Principal Occupation During Past 5 Years: Director of various companies; and formerly, Director, RBC Holdings, Inc. (bank holding company) (until 2002); and President, Chief Executive Officer and Chairman of the Board, General Host Corporation (nursery and craft centers) (until 1998). |
|
| | | | |
ROBERT F. CARLSON (75) One Franklin Parkway San Mateo, CA 94403-1906 | | Trustee | | Since 1998 | | 52 | | None |
|
Principal Occupation During Past 5 Years: Senior Member and past President, Board of Administration, California Public Employees Retirement Systems (CALPERS); and formerly, member and Chairman of the Board, Sutter Community Hospitals; member, Corporate Board, Blue Shield of California; and Chief Counsel, California Department of Transportation. |
|
| | | | |
S. JOSEPH FORTUNATO (71) One Franklin Parkway San Mateo, CA 94403-1906 | | Trustee | | Since 1989 | | 143 | | None |
|
Principal Occupation During Past 5 Years: Attorney; and formerly, member of the law firm of Pitney, Hardin, Kipp & Szuch. |
|
| | | | |
FRANK W.T. LAHAYE (74) One Franklin Parkway San Mateo, CA 94403-1906 | | Trustee | | Since 1988 | | 115 | | Director, The California Center for Land Recycling (redevelopment). |
|
Principal Occupation During Past 5 Years: General Partner, Las Olas L.P. (Asset Management); and formerly, Chairman, Peregrine Venture Management Company (venture capital). |
|
| | | | |
GORDON S. MACKLIN (75) One Franklin Parkway San Mateo, CA 94403-1906 | | Trustee | | Since 1993 | | 142 | | Director, White Mountains Insurance Group, Ltd. (holding company); Martek Biosciences Corporation; MedImmune, Inc. (biotechnology); Overstock.com (Internet services); and Spacehab, Inc. (aerospace services); and formerly, Director, MCI Communication Corporation (subsequently known as MCI WorldCom, Inc. and WorldCom, Inc.) (communications services) (1988-2002). |
|
Principal Occupation During Past 5 Years: Deputy Chairman, White Mountains Insurance Group, Ltd. (holding company); and formerly, Chairman, White River Corporation (financial services) (1993-1998) and Hambrecht & Quist Group (investment banking) (1987-1992); and President, National Association of Securities Dealers, Inc. (1970-1987). |
|
BOD-1
Interested Board Members and Officers
| | | | | | | | |
| Name, Age and Address | | Position | | Length of
Time Served | | Number of
Portfolios in Fund
Complex Overseen
by Board Member* | | Other Directorships Held |
|
| | | | |
**CHARLES B. JOHNSON (70) One Franklin Parkway San Mateo, CA 94403-1906 | | Trustee and Chairman of the Board | | Since 1988 | | 142 | | None |
|
Principal Occupation During Past 5 Years: Chairman of the Board, Member—Office of the Chairman and Director, Franklin Resources, Inc.; Vice President, Franklin Templeton Distributors, Inc.; Director, Fiduciary Trust Company International; and officer and/or director or trustee, as the case may be, of some of the other subsidiaries of Franklin Resources, Inc. and of 46 of the investment companies in Franklin Templeton Investments. |
|
| | | | |
**RUPERT H. JOHNSON, JR. (63) One Franklin Parkway San Mateo, CA 94403-1906 | | Trustee, President and Chief Executive Officer—Investment Management | | Trustee since 1988 and President and Chief Executive Officer—Investment Management since 2002 | | 125 | | None |
|
Principal Occupation During Past 5 Years: Vice Chairman, Member—Office of the Chairman and Director, Franklin Resources, Inc.; Vice President and Director, Franklin Templeton Distributors, Inc.; Director, Franklin Advisers, Inc. and Franklin Investment Advisory Services, Inc.; Senior Vice President, Franklin Advisory Services, LLC; and officer and/or director or trustee, as the case may be, of some of the other subsidiaries of Franklin Resources, Inc. and of 49 of the investment companies in Franklin Templeton Investments. |
|
| | | | |
**CHRISTOPHER H. PINKERTON (45) One Franklin Parkway San Mateo, CA 94403-1906 | | Trustee | | Since 2001 | | 22 | | None |
|
Principal Occupation During Past 5 Years: President, Chairman and Chief Executive Officer, USAllianz Investor Services, LLC and USAllianz Advisors; President and Chief Executive Officer, USAllianz Investment Advisor and USAllianz VIP Trust; Senior Vice President, Variable Products Division, Allianz Life Insurance Company of North America; fellow, Life Management Institute; and formerly, Vice President of Marketing, Nationwide Financial Services (until 1999). |
|
| | | | |
HARMON E. BURNS (58) One Franklin Parkway San Mateo, CA 94403-1906 | | Vice President | | Since 1988 | | Not
Applicable | | None |
|
Principal Occupation During Past 5 Years: Vice Chairman, Member—Office of the Chairman and Director, Franklin Resources, Inc.; Vice President and Director, Franklin Templeton Distributors, Inc.; Executive Vice President, Franklin Advisers, Inc.; Director, Franklin Investment Advisory Services, Inc.; and officer and/or director or trustee, as the case may be, of some of the other subsidiaries of Franklin Resources, Inc. and of 49 of the investment companies in Franklin Templeton Investments. |
|
| | | | |
MARTIN L. FLANAGAN (43) One Franklin Parkway San Mateo, CA 94403-1906 | | Vice President | | Since 1995 | | Not
Applicable | | None |
|
Principal Occupation During Past 5 Years: Co-President and Chief Executive Officer, Franklin Resources, Inc.; Senior Vice President and Chief Financial Officer, Franklin Mutual Advisers, LLC; Executive Vice President, Chief Financial Officer and Director, Templeton Worldwide, Inc.; Executive Vice President and Chief Operating Officer, Templeton Investment Counsel, LLC; President and Director, Franklin Advisers, Inc.; Executive Vice President, Franklin Investment Advisory Services, Inc. and Franklin Templeton Investor Services, LLC; Chief Financial Officer, Franklin Advisory Services, LLC; Chairman, Franklin Templeton Services, LLC; and officer and/or director or trustee, as the case may be, of some of the other subsidiaries of Franklin Resources, Inc. and of 49 of the investment companies in Franklin Templeton Investments. |
|
BOD-2
| | | | | | | | |
| Name, Age and Address | | Position | | Length of
Time Served | | Number of
Portfolios in Fund
Complex Overseen
by Board Member* | | Other Directorships Held |
|
| | | | |
JIMMY D. GAMBILL (56) 500 East Broward Blvd. Suite 2100 Fort Lauderdale, FL 33394-3091 | | Senior Vice President and Chief Executive Officer—Finance and Administration | | Since 2002 | | Not
Applicable | | None |
|
Principal Occupation During Past 5 Years: President, Franklin Templeton Services, LLC; Senior Vice President, Templeton Worldwide, Inc.; and officer of 51 of the investment companies in Franklin Templeton Investments. |
|
| | | | |
DAVID P. GOSS (56) One Franklin Parkway San Mateo, CA 94403-1906 | | Vice President | | Since 2000 | | Not
Applicable | | None |
|
Principal Occupation During Past 5 Years: Associate General Counsel, Franklin Resources, Inc.; officer and director of one of the subsidiaries of Franklin Resources, Inc.; officer of 51 of the investment companies in Franklin Templeton Investments; and formerly, President, Chief Executive Officer and Director, Property Resources Equity Trust (until 1999) and Franklin Select Realty Trust (until 2000). |
|
| | | | |
BARBARA J. GREEN (56) One Franklin Parkway San Mateo, CA 94403-1906 | | Vice President | | Since 2000 | | Not
Applicable | | None |
|
Principal Occupation During Past 5 Years: Vice President, Deputy General Counsel and Secretary, Franklin Resources, Inc.; Secretary and Senior Vice President, Templeton Worldwide, Inc.; Secretary, Franklin Advisers, Inc., Franklin Advisory Services, LLC, Franklin Investment Advisory Services, Inc., Franklin Mutual Advisers, LLC, Franklin Templeton Alternative Strategies, Inc., Franklin Templeton Investor Services, LLC, Franklin Templeton Services, LLC, Franklin Templeton Distributors, Inc., Templeton Investment Counsel, LLC, and Templeton/Franklin Investment Services, Inc.; and officer of some of the other subsidiaries of Franklin Resources, Inc. and of 51 of the investment companies in Franklin Templeton Investments; and formerly, Deputy Director, Division of Investment Management, Executive Assistant and Senior Advisor to the Chairman, Counselor to the Chairman, Special Counsel and Attorney Fellow, U.S. Securities and Exchange Commission (1986-1995); Attorney, Rogers & Wells (until 1986); and Judicial Clerk, U.S. District Court (District of Massachusetts) (until 1979). |
|
| | | | |
MICHAEL O. MAGDOL (66) 600 Fifth Avenue Rockefeller Center New York, NY 10048-0772 | | Vice President—AML Compliance | | Since 2002 | | Not
Applicable | | Director, FTI Banque, Arch Chemicals, Inc. and Lingnan Foundation. |
|
Principal Occupation During Past 5 Years: Vice Chairman, Chief Banking Officer and Director, Fiduciary Trust Company International; and officer and/or director, as the case may be, of some of the other subsidiaries of Franklin Resources, Inc. and of 48 of the investment companies in Franklin Templeton Investments. |
|
| | | | |
KIMBERLEY H. MONASTERIO (40) One Franklin Parkway San Mateo, CA 94403-1906 | | Treasurer and Chief Financial Officer | | Treasurer since 2000 and Chief Financial Officer since 2002 | | Not
Applicable | | None |
|
Principal Occupation During Past 5 Years: Senior Vice President, Franklin Templeton Services, LLC; and officer of 51 of the investment companies in Franklin Templeton Investments. |
|
BOD-3
| | | | | | | | |
| Name, Age and Address | | Position | | Length of
Time Served | | Number of
Portfolios in Fund
Complex Overseen
by Board Member* | | Other Directorships Held |
|
| | | | |
MURRAY L. SIMPSON (66) One Franklin Parkway San Mateo, CA 94403-1906 | | Vice President and Secretary | | Since 2000 | | Not
Applicable | | None |
|
Principal Occupation During Past 5 Years: Executive Vice President and General Counsel, Franklin Resources, Inc.; officer and/or director, as the case may be, of some of the subsidiaries of Franklin Resources, Inc. and of 51 of the investment companies in Franklin Templeton Investments; and formerly, Chief Executive Officer and Managing Director, Templeton Franklin Investment Services (Asia) Limited (until 2000); and Director, Templeton Asset Management Ltd. (until 1999). |
|
| *We | base the number of portfolios on each separate series of the U.S. registered investment companies within the Franklin Templeton Investments fund complex. These portfolios have a common investment adviser or affiliated investment advisers. |
| **Charles | B. Johnson and Rupert H. Johnson, Jr. are considered interested persons of the Trust under the federal securities laws due to their positions as officers and directors and major shareholders of Franklin Resources, Inc., which is the parent company of the Trusts’ adviser and distributor. Mr. Pinkerton is considered an interested person of the Trust because of the share ownership of Allianz Life in the Trust. |
Note: Charles B. Johnson and Rupert H. Johnson, Jr. are brothers.
The Sarbanes-Oxley Act of 2002 and Rules adopted by the Securities and Exchange Commission require the Fund to disclose whether the Fund’s Audit Committee includes at least one member who is an audit committee financial expert within the meaning of such Act and Rules. The Fund’s Board of Directors have determined that there is at least one such financial expert on the Audit Committee and has designated Frank W.T. LaHaye as its audit committee financial expert. The Board believes that Mr. LaHaye qualifies as such an expert in view of his extensive business background and experience, including service as President and Director of McCormick Selph Associates from 1954 through 1965; Director and Chairman of Teledyne Canada Ltd. from 1966 through 1971; Director and Chairman of Quarterdeck Corporation from 1982 through 1998; and services as a Director of various other public companies including U.S. Telephone Inc. (1981-1984), Fisher Imaging Inc. (1991-1998) and Digital Transmissions Systems (1995-1999). In addition, Mr. LaHaye served from 1981 to 2000 as a Director and Chairman of Peregrine Venture Management Co., a venture capital firm, and has been a Member and Chairman of the Fund’s Audit Committee since its inception. As a result of such background and experience, the Board of Directors believes that Mr. LaHaye has acquired an understanding of generally accepted accounting principles and financial statements, the general application of such principles in connection with the accounting estimates, accruals and reserves, and analyzing and evaluating financial statements that present a breadth and level of complexity of accounting issues generally comparable to those of the Fund, as well as an understanding of internal controls and procedures for financial reporting and an understanding of audit committee functions. Mr. LaHaye is an independent Director as that term is defined under the relevant Securities and Exchange Commission Rules and Releases.
The Statement of Additional Information (SAI) Includes additional information about the board members and is available, without charge, upon request. Contract owners may call 1-800/321-8563 or their insurance companies to request the SAI.
BOD-4
FRANKLIN TEMPLETON VARIABLE INSURANCE PRODUCTS TRUST
Proxy Voting Policies and Procedures
The Fund has established Proxy Voting Policies and Procedures (“Policies”) that the Fund uses to determine how to vote proxies relating to portfolio securities. Shareholders may view the Fund’s complete Policies online at franklintempleton.com. Alternatively, shareholders may request copies of the Policies free of charge by calling the Proxy Group collect at 1-954/847-2268 or by sending a written request to: Franklin Templeton Companies, LLC, 500 East Broward Boulevard, Suite 1500, Fort Lauderdale, FL 33394, Attention: Proxy Group.
PV-1

The Phoenix
Edge
Series Fund
V A R I A B L E P R O D U C T S F U N D – A N N U A L R E P O R T
December 31, 2003
MESSAGE FROM THE CHAIRMAN
Dear Shareholder:
| | |
 | | When we think about 2003, we’ll remember a year in which financial services underwent significant change. National news reflected regulatory attention to the business conduct of a few mutual fund companies. As a result, certain industry-wide practices came under increased scrutiny. |
| | Your Fund’s Board of Trustees recognizes the seriousness of these issues. As a result, it has expanded its review of policies and procedures to insure compliance with applicable rules and regulations. Additionally, the Board had taken a review of its own structure and governance protocols to insure that our practices are not only compliant with regulatory standards, but, whenever practical, also conform to best practices that value your interests and help you invest wisely. |
I hope that you’ll take time to review the activities and performance information included in this annual report. We’ve witnessed new life in the equity markets, and I am encouraged that our overall economy has begun a more rewarding period. Now is an opportune time for you to review your investments with your financial advisor to be sure your portfolio is best positioned to achieve long-term success.
Keep in mind that finding the best balance of performance and protection requires discipline and diversification1. Your investment in The Phoenix-Edge Series Fund may help you in this effort.
To learn more about your investments and investing, visit Phoenixwm.PHL.com.
|
| Sincerely, |
|

|
Philip R. McLoughlin Chairman, The Phoenix Edge Series Fund |
January 1, 2004
| 1 | Diversification does not guarantee against a loss, and there is no guarantee that a diversified portfolio will outperform a non-diversified portfolio. |
Mutual funds are not insured by the FDIC; are not deposits or other obligations of a bank and are not guaranteed by a bank; and are subject to investment risks, including possible loss of the principal invested.
1
Table of Contents
This report is not authorized for distribution to prospective investors in The Phoenix Edge Series Fund unless preceded or accompanied by any effective Prospectus which includes information concerning charges, Fund’s record and other pertinent information.
| | | | |
| Not FDIC Insured | | No Bank Guarantee | | May Lose Value |
2
3
PHOENIX-GOODWIN MONEY MARKET SERIES
SCHEDULE OF INVESTMENTS
DECEMBER 31, 2003
| | | | | | | | | | | | |
FACE VALUE (000)
| | DESCRIPTION
| | | | INTEREST RATE
| | | MATURITY DATE
| | VALUE
|
| FEDERAL AGENCY SECURITIES—24.0% | | | | | | | | | | |
| $ 1,500 | | Fannie Mae (c) (d) | | | | 1.03 | % | | 1/2/04 | | $ | 1,500,000 |
| 5,000 | | Fannie Mae (c) (d) | | | | 1.18 | | | 1/2/04 | | | 4,999,874 |
| 2,500 | | Fannie Mae (c) (d) | | | | 1.55 | | | 1/27/04 | | | 2,500,000 |
| 5,000 | | Fannie Mae (c) (d) | | | | 1.25 | | | 2/4/04 | | | 5,000,000 |
| 2,500 | | Fannie Mae (c) (d) | | | | 1.55 | | | 2/12/04 | | | 2,500,000 |
| 3,500 | | FHLB (c) | | | | 3.75 | | | 2/13/04 | | | 3,510,599 |
| 1,500 | | FHLB (c) | | | | 5.25 | | | 2/13/04 | | | 1,507,130 |
| 2,500 | | FHLB (c) (d) | | | | 1.25 | | | 3/11/04 | | | 2,500,000 |
| 2,500 | | FHLB (c) (d) | | | | 1.05 | | | 3/24/04 | | | 2,500,000 |
| 2,500 | | Fannie Mae (c) (d) | | | | 1.35 | | | 4/9/04 | | | 2,500,000 |
| 3,865 | | FHLB (c) | | | | 4.88 | | | 4/16/04 | | | 3,906,470 |
| 2,500 | | FHLB (c) | | | | 3.38 | | | 5/14/04 | | | 2,519,364 |
| 2,500 | | FHLB (c) (d) | | | | 1.60 | | | 6/8/04 | | | 2,500,000 |
| 2,500 | | Fannie Mae (c) | | | | 6.50 | | | 8/15/04 | | | 2,580,645 |
| 2,500 | | FHLB (c) | | | | 3.63 | | | 10/15/04 | | | 2,544,958 |
| 2,500 | | FHLB Discount Note | | | | 1.31 | | | 11/10/04 | | | 2,471,435 |
| 2,500 | | FHLB (c) | | | | 1.51 | | | 12/8/04 | | | 2,500,000 |
| | | | | | | | | | | |
|
|
| TOTAL FEDERAL AGENCY SECURITIES | | | | | | | | | | 48,040,475 |
| | | | | | | | | | | |
|
|
| | | | | | | | | | REST DATE
| | |
| FEDERAL AGENCY SECURITIES—VARIABLE(b)—3.0% | | | | | | | | | | |
| 103 | | SBA (Final Maturity 1/25/21) | | | | 1.50 | | | 1/1/04 | | | 103,339 |
| 607 | | SBA (Final Maturity 10/25/22) | | | | 1.50 | | | 1/1/04 | | | 606,678 |
| 1,300 | | SBA (Final Maturity 11/25/21) | | | | 1.63 | | | 1/1/04 | | | 1,299,183 |
| 331 | | SBA (Final Maturity 2/25/23) | | | | 1.50 | | | 1/1/04 | | | 330,807 |
| 430 | | SBA (Final Maturity 2/25/23) | | | | 1.50 | | | 1/1/04 | | | 430,199 |
| 853 | | SBA (Final Maturity 3/25/24) | | | | 1.38 | | | 1/1/04 | | | 853,309 |
| 147 | | SBA (Final Maturity 5/25/21) | | | | 1.50 | | | 1/1/04 | | | 146,506 |
| 1,319 | | SBA (Final Maturity 9/25/23) | | | | 1.38 | | | 1/1/04 | | | 1,319,080 |
| | | | | | | | | | | |
|
|
| TOTAL FEDERAL AGENCY SECURITIES—VARIABLE | | | | | | | | | | 5,089,101 |
| | | | | | | | | | | |
|
|
| | | | | STANDARD & POOR’S RATING (Unaudited)
| | | | | MATURITY DATE
| | |
| COMMERCIAL PAPER—62.0% | | | | | | | | | | |
| 1,350 | | Emerson Electric Co. | | A-1 | | 0.95 | | | 1/2/04 | | | 1,349,964 |
| 500 | | Preferred Receivables Funding Corp. | | A-1 | | 1.12 | | | 1/5/04 | | | 499,938 |
| 3,500 | | ABSC Capital Corp. | | A-1 | | 1.12 | | | 1/6/04 | | | 3,499,456 |
| 3,145 | | Pitney Bowes, Inc. | | A-1+ | | 1.03 | | | 1/6/04 | | | 3,144,550 |
| 800 | | Preferred Receivables Funding Corp. | | A-1 | | 1.10 | | | 1/6/04 | | | 799,878 |
| 2,000 | | Corporate Asset Funding Co. | | A-1+ | | 1.08 | | | 1/7/04 | | | 1,999,640 |
| 3,000 | | ABSC Capital Corp. | | A-1 | | 1.12 | | | 1/9/04 | | | 2,999,253 |
| 1,900 | | Oil Insurance Ltd. | | A-1 | | 1.10 | | | 1/12/04 | | | 1,899,361 |
| 1,685 | | Preferred Receivables Funding Corp. | | A-1 | | 1.08 | | | 1/12/04 | | | 1,684,444 |
| 3,500 | | SPARC, LLC | | A-1 | | 1.11 | | | 1/13/04 | | | 3,498,705 |
| 1,820 | | Corporate Asset Funding Co. | | A-1+ | | 1.08 | | | 1/14/04 | | | 1,819,290 |
| 3,945 | | Receivables Capital Corp. | | A-1+ | | 1.08 | | | 1/14/04 | | | 3,943,462 |
| 402 | | Receivables Capital Corp. | | A-1+ | | 1.08 | | | 1/15/04 | | | 401,831 |
| 3,500 | | ABSC Capital Corp. | | A-1 | | 1.13 | | | 1/20/04 | | | 3,497,913 |
| 2,500 | | Govco, Inc. | | A-1+ | | 1.10 | | | 1/20/04 | | | 2,498,549 |
| 1,400 | | Deluxe Corp. | | A-1 | | 1.10 | | | 1/21/04 | | | 1,399,144 |
| 1,115 | | CIT Group, Inc. | | A-1 | | 1.12 | | | 1/22/04 | | | 1,114,272 |
| 2,195 | | Preferred Receivables Funding Corp. | | A-1 | | 1.08 | | | 1/22/04 | | | 2,193,617 |
| 2,585 | | Corporate Asset Funding Co. | | A-1+ | | 1.08 | | | 1/23/04 | | | 2,583,294 |
| 1,425 | | Deluxe Corp. | | A-1 | | 1.06 | | | 1/23/04 | | | 1,424,077 |
| 2,500 | | Harley Davidson, Inc. | | A-1 | | 1.00 | | | 1/23/04 | | | 2,498,472 |
| 1,795 | | Asset Securitization Corp. | | A-1 | | 1.08 | | | 1/26/04 | | | 1,793,654 |
| 1,500 | | Govco, Inc. | | A-1+ | | 1.06 | | | 1/26/04 | | | 1,498,896 |
| 3,500 | | Govco, Inc. | | A-1+ | | 1.10 | | | 1/26/04 | | | 3,497,326 |
See Notes to Financial Statements
4
PHOENIX-GOODWIN MONEY MARKET SERIES
| | | | | | | | | | | | | |
FACE VALUE (000)
| | DESCRIPTION
| | STANDARD
& POOR’S RATING (Unaudited)
| | INTEREST RATE
| | | MATURITY DATE
| | VALUE
| |
| COMMERCIAL PAPER—continued | | | | | | | | | | | |
| $ 2,620 | | CIT Group, Inc . | | A-1 | | 1.10 | % | | 1/29/04 | | $ | 2,617,758 | |
| 3,500 | | Merrill Lynch & Co., Inc. | | A-1 | | 1.04 | | | 1/30/04 | | | 3,497,068 | |
| 1,275 | | ABN AMRO North American Finance, Inc. | | A-1+ | | 1.08 | | | 2/3/04 | | | 1,273,738 | |
| 3,150 | | Corporate Asset Funding Co | | A-1+ | | 1.09 | | | 2/4/04 | | | 3,146,757 | |
| 4,520 | | SPARC, LLC | | A-1 | | 1.10 | | | 2/4/04 | | | 4,515,304 | |
| 2,500 | | Household Finance Corp. | | A-1 | | 1.09 | | | 2/5/04 | | | 2,497,351 | |
| 2,000 | | SPARC, LLC | | A-1 | | 1.10 | | | 2/5/04 | | | 1,997,861 | |
| 2,620 | | Govco, Inc. | | A-1+ | | 1.05 | | | 2/9/04 | | | 2,617,020 | |
| 2,500 | | Pfizer, Inc. | | A-1+ | | 1.05 | | | 2/9/04 | | | 2,497,156 | |
| 3,690 | | Deluxe Corp. | | A-1 | | 1.07 | | | 2/10/04 | | | 3,685,613 | |
| 785 | | Oil Insurance Ltd. | | A-1 | | 1.07 | | | 2/11/04 | | | 784,043 | |
| 3,370 | | Oil Insurance Ltd. | | A-1 | | 1.10 | | | 2/11/04 | | | 3,365,778 | |
| 3,185 | | Oil Insurance Ltd. | | A-1 | | 1.11 | | | 2/13/04 | | | 3,180,777 | |
| 3,000 | | Du Pont (E.I.) de Nemours & Co. | | A-1+ | | 1.07 | | | 2/17/04 | | | 2,995,809 | |
| 3,500 | | Deluxe Corp. | | A-1 | | 1.10 | | | 2/18/04 | | | 3,494,867 | |
| 1,295 | | CIT Group, Inc. | | A-1 | | 1.09 | | | 2/20/04 | | | 1,293,040 | |
| 3,000 | | CIT Group, Inc. | | A-1 | | 1.13 | | | 2/20/04 | | | 2,995,292 | |
| 3,000 | | General Electric Capital Corp. | | A-1+ | | 1.07 | | | 2/24/04 | | | 2,995,185 | |
| 1,400 | | General Electric Capital Corp. | | A-1+ | | 1.09 | | | 2/24/04 | | | 1,397,711 | |
| 6,630 | | Cargill, Inc. | | A-1 | | 1.07 | | | 3/5/04 | | | 6,617,388 | |
| 1,000 | | General Electric Capital Corp. | | A-1+ | | 1.05 | | | 3/15/04 | | | 997,842 | |
| 3,000 | | Archer Daniels Midland Co. | | A-1 | | 1.10 | | | 3/16/04 | | | 2,993,125 | |
| 3,600 | | Private Export Funding Corp. | | A-1+ | | 1.07 | | | 3/30/04 | | | 3,590,477 | |
| 3,635 | | Archer Daniels Midland Co. | | A-1 | | 1.11 | | | 4/13/04 | | | 3,623,456 | |
| 3,585 | | Archer Daniels Midland Co. | | A-1 | | 1.17 | | | 4/13/04 | | | 3,572,999 | |
| 2,000 | | CIT Group, Inc. | | A-1 | | 1.11 | | | 4/15/04 | | | 1,993,525 | |
| | | | | | | | | | | |
|
|
|
| TOTAL COMMERCIAL PAPER | | | | | | | | | | 125,775,926 | |
| | | | | | | | | | | |
|
|
|
| MEDIUM TERM NOTES(c)—11.0% | | | | | | | | | | | |
| 2,850 | | Private Export Funding Corp. | | AAA | | 5.73 | | | 1/15/04 | | | 2,854,691 | |
| 1,500 | | Associates Corporation of North America | | AA- | | 6.20 | | | 1/26/04 | | | 1,504,808 | |
| 2,500 | | Merrill Lynch & Co., Inc. (b) | | A+ | | 1.39 | | | 2/9/04 | | | 2,501,097 | |
| 1,905 | | Associates Corporation of North America | | AA- | | 5.50 | | | 2/15/04 | | | 1,914,910 | |
| 1,706 | | Citicorp | | A+ | | 7.13 | | | 3/15/04 | | | 1,725,835 | |
| 500 | | Du Pont (E.I.) de Nemours & Co. | | AA- | | 8.13 | | | 3/15/04 | | | 506,770 | |
| 4,060 | | Heller Financial, Inc. | | AAA | | 6.00 | | | 3/19/04 | | | 4,101,648 | |
| 400 | | Associates Corporation of North America | | AA- | | 5.80 | | | 4/20/04 | | | 405,367 | |
| 535 | | General Electric Capital Corp. | | AAA | | 5.38 | | | 4/23/04 | | | 541,907 | |
| 1,045 | | Citigroup Global Markets (b) | | AA- | | 1.50 | | | 5/4/04 | | | 1,047,336 | |
| 1,000 | | Associates Corporation of North America | | AA- | | 7.64 | | | 5/26/04 | | | 1,025,353 | |
| 4,516 | | Bank of America Corp. | | A | | 7.75 | | | 8/15/04 | | | 4,693,033 | |
| | | | | | | | | | | |
|
|
|
| TOTAL MEDIUM TERM NOTES | | | | | | | | | | 22,822,755 | |
| | | | | | | | | | | |
|
|
|
| TOTAL INVESTMENTS—100.0% | | | | | | | | | | | |
| (Identified cost $201,728,257) | | | | | | | | | | 201,728,257 | (a) |
| Other assets and liabilities, net—0.0% | | | | | | | | | | 915,836 | |
| | | | | | | | | | | |
|
|
|
| NET ASSETS—100.0% | | | | | | | | | $ | 202,644,093 | |
| | | | | | | | | | | |
|
|
|
| (a) | Federal Income Tax Information: At December 31, 2003, the aggregate cost of securities was the same for book and tax purposes. |
| (b) | Variable or step coupon security; interest rate shown reflects the rate currently in effect. |
| (c) | The interest rate shown is the coupon rate. |
| (d) | Callable. The maturity date shown is the call date. |
See Notes to Financial Statements
5
PHOENIX-GOODWIN MONEY MARKET SERIES
STATEMENT OF ASSETS AND LIABILITIES
December 31, 2003
| | | | |
Assets | | | | |
Investment securities at value (Identified cost $ 201,728,257) | | $ | 201,728,257 | |
Receivables | | | | |
Fund shares sold | | | 1,866,895 | |
Interest | | | 724,588 | |
Investment securities sold | | | 49,172 | |
Prepaid expenses | | | 3,943 | |
| | |
|
|
|
Total assets | | | 204,372,855 | |
| | |
|
|
|
Liabilities | | | | |
Cash overdraft | | | 93,836 | |
Payables | | | | |
Fund shares repurchased | | | 1,465,414 | |
Investment advisory fee | | | 68,824 | |
Financial agent fee | | | 13,904 | |
Administration fee | | | 13,249 | |
Trustees’ fee | | | 2,360 | |
Accrued expenses | | | 71,175 | |
| | |
|
|
|
Total liabilities | | | 1,728,762 | |
| | |
|
|
|
Net Assets | | $ | 202,644,093 | |
| | |
|
|
|
Net Assets Consist of: | | | | |
Capital paid in on shares of beneficial interest | | $ | 202,644,093 | |
| | |
|
|
|
Net Assets | | $ | 202,644,093 | |
| | |
|
|
|
Shares of beneficial interest outstanding, $1 par value, unlimited authorization | | | 20,264,467 | |
| | |
|
|
|
Net asset value and offering price per share | | $ | 10.00 | |
| | |
|
|
|
| |
STATEMENT OF OPERATIONS | | | | |
Year Ended December 31, 2003 | | | | |
| |
Investment Income | | | | |
Interest | | $ | 2,882,768 | |
| | |
|
|
|
Total investment income | | | 2,882,768 | |
| | |
|
|
|
Expenses | | | | |
Investment advisory fee | | | 905,657 | |
Financial agent fee | | | 180,109 | |
Administration fee | | | 174,344 | |
Custodian | | | 45,802 | |
Professional | | | 13,231 | |
Trustees | | | 5,931 | |
Miscellaneous | | | 3,799 | |
| | |
|
|
|
Total expenses | | | 1,328,873 | |
Custodian fees paid indirectly | | | (1,062 | ) |
| | |
|
|
|
Net expenses | | | 1,327,811 | |
| | |
|
|
|
Net investment income | | $ | 1,554,957 | |
| | |
|
|
|
See Notes to Financial Statements
6
PHOENIX-GOODWIN MONEY MARKET SERIES
STATEMENT OF CHANGES IN NET ASSETS
| | | | | | | | |
| | | Year Ended 12/31/03
| | | Year Ended 12/31/02
| |
From Operations | | | | | | | | |
Net investment income (loss) | | $ | 1,554,957 | | | $ | 3,513,897 | |
| | |
|
|
| |
|
|
|
Increase (decrease) in net assets resulting from operations | | | 1,554,957 | | | | 3,513,897 | |
| | |
|
|
| |
|
|
|
From Distributions to Shareholders | | | | | | | | |
Net investment income | | | (1,554,957 | ) | | | (3,513,897 | ) |
| | |
|
|
| |
|
|
|
Decrease in net assets from distributions to shareholders | | | (1,554,957 | ) | | | (3,513,897 | ) |
| | |
|
|
| |
|
|
|
From Share Transactions | | | | | | | | |
Proceeds from sales of shares (44,435,831 and 68,436,483 shares, respectively) | | | 444,358,309 | | | | 684,364,835 | |
Net asset value of shares issued from reinvestment of distributions (155,502 and 351,390 shares, respectively) | | | 1,554,957 | | | | 3,513,897 | |
Cost of shares repurchased (49,902,770 and 69,274,867 shares, respectively) | | | (499,027,882 | ) | | | (692,748,766 | ) |
| | |
|
|
| |
|
|
|
Increase (decrease) in net assets from share transactions | | | (53,114,616 | ) | | | (4,870,034 | ) |
| | |
|
|
| |
|
|
|
Net increase (decrease) in net assets | | | (53,114,616 | ) | | | (4,870,034 | ) |
Net Assets | | | | | | | | |
Beginning of period | | | 255,758,709 | | | | 260,628,743 | |
| | |
|
|
| |
|
|
|
End of period | | $ | 202,644,093 | | | $ | 255,758,709 | |
| | |
|
|
| |
|
|
|
FINANCIAL HIGHLIGHTS
(Selected data for a share outstanding throughout the indicated period)
| | | | | | | | | | | | | | | | | | | | |
| | | Year Ended December 31,
| |
| | | 2003
| | | 2002
| | | 2001
| | | 2000
| | | 1999
| |
Net asset value, beginning of period | | $ | 10.00 | | | $ | 10.00 | | | $ | 10.00 | | | $ | 10.00 | | | $ | 10.00 | |
Income from investment operations | | | | | | | | | | | | | | | | | | | | |
Net investment income | | | 0.07 | | | | 0.14 | | | | 0.38 | | | | 0.59 | | | | 0.47 | |
Net realized gain | | | — | | | | — | | | | — | (3) | | | — | | | | — | |
| | |
|
|
| |
|
|
| |
|
|
| |
|
|
| |
|
|
|
Total from investment operations | | | 0.07 | | | | 0.14 | | | | 0.38 | | | | 0.59 | | | | 0.47 | |
| | |
|
|
| |
|
|
| |
|
|
| |
|
|
| |
|
|
|
Less distributions | | | | | | | | | | | | | | | | | | | | |
Dividends from net investment income | | | (0.07 | ) | | | (0.14 | ) | | | (0.38 | ) | | | (0.59 | ) | | | (0.47 | ) |
Distributions from net realized gains | | | — | | | | — | | | | — | (3) | | | — | | | | — | |
| | |
|
|
| |
|
|
| |
|
|
| |
|
|
| |
|
|
|
Total distributions | | | (0.07 | ) | | | (0.14 | ) | | | (0.38 | ) | | | (0.59 | ) | | | (0.47 | ) |
| | |
|
|
| |
|
|
| |
|
|
| |
|
|
| |
|
|
|
Net asset value, end of period | | $ | 10.00 | | | $ | 10.00 | | | $ | 10.00 | | | $ | 10.00 | | | $ | 10.00 | |
| | |
|
|
| |
|
|
| |
|
|
| |
|
|
| |
|
|
|
Total return | | | 0.68 | % | | | 1.42 | % | | | 3.82 | % | | | 6.03 | % | | | 4.82 | % |
Ratios/supplemental data: | | | | | | | | | | | | | | | | | | | | |
Net assets, end of period (thousands) | | $ | 202,644 | | | $ | 255,759 | | | $ | 260,629 | | | $ | 179,968 | | | $ | 235,584 | |
Ratio to average net assets of: | | | | | | | | | | | | | | | | | | | | |
Operating expenses (1) | | | 0.59 | %(2) | | | 0.56 | %(2) | | | 0.55 | %(2) | | | 0.55 | % | | | 0.55 | % |
Net investment income | | | 0.69 | % | | | 1.41 | % | | | 3.63 | % | | | 5.83 | % | | | 4.73 | % |
| (1) | If the investment adviser had not waived fees and reimbursed expenses, the ratio of operating expenses to average net assets would have been 0.60%, 0.58% and 0.57% for the periods ended December 31, 2001, 2000 and 1999, respectively. |
| (2) | The ratio of operating expenses to average net assets excludes the effect of expense offsets for custodian fees; if expense offsets were included, the ratio would not significantly differ. |
| (3) | Amount is less than $0.01. |
See Notes to Financial Statements
7
THE PHOENIX EDGE SERIES FUND
NOTES TO FINANCIAL STATEMENTS
December 31, 2003
Note 1—Organization
The Phoenix Edge Series Fund (the “Fund”) is organized as a Massachusetts business trust and is registered under the Investment Company Act of 1940, as amended, as an open-end management investment company. The Fund is organized with series which are available only to the subaccounts of the Phoenix Life Variable Accumulation Account, Phoenix Life Variable Universal Life Account, PHL Variable Accumulation Account, PHLVIC Variable Universal Life Account, Phoenix Life and Annuity Variable Universal Life Account, and Phoenix Life Separate Accounts B, C and D.
The Fund is comprised of 33 series (each a “series”) each having a distinct investment objective as outlined below:
| | |
Fund Name
| | Investment Objective
|
| Phoenix-Aberdeen International Series (“Aberdeen International”) | | High total return consistent with reasonable risk. |
| |
| Phoenix-AIM Mid-Cap Equity Series (“AIM Mid-Cap Equity”) | | Long-term growth of capital. |
| |
| Phoenix-Alliance/Bernstein Enhanced Index Series (“Alliance/Bernstein Enhanced Index”) (formerly Phoenix-J.P. Morgan Research Enhanced Index Series) | | High total return. |
| |
| Phoenix-Alliance/Bernstein Growth + Value Series (“Alliance/Bernstein Growth + Value”) | | Long-term capital growth. |
| |
| Phoenix-Duff & Phelps Real Estate Securities Series (“Duff & Phelps Real Estate Securities”) | | Capital appreciation and income with approximately equal emphasis. |
| |
| Phoenix-Engemann Capital Growth Series (“Engemann Capital Growth”) | | Intermediate and long-term capital appreciation with income as a secondary consideration. |
| |
| Phoenix-Engemann Small & Mid-Cap Growth Series (“Engemann Small & Mid-Cap Growth”) | | Long-term growth of capital. |
| |
| Phoenix-Goodwin Money Market Series (“Goodwin Money Market”) | | As high a level of current income as is consistent with the preservation of capital and maintenance of liquidity. |
| |
| Phoenix-Goodwin Multi-Sector Fixed Income Series (“Goodwin Multi-Sector Fixed Income”) | | Long-term total return. |
| |
| Phoenix-Goodwin Multi-Sector Short Term Bond Series (“Goodwin Multi-Sector Short Term Bond”) | | To provide high current income while attempting to limit changes in the series’ net asset value per share caused by interest rate changes. |
| |
| Phoenix-Janus Flexible Income Series (“Janus Flexible Income”) | | Maximum total return consistent with preservation of capital. |
| |
| Phoenix-Kayne Rising Dividends Series (“Kayne Rising Dividends”) (formerly Phoenix-Kayne Large-Cap Core Series) | | Long-term capital appreciation with dividend income as a secondary consideration. |
| |
| Phoenix-Kayne Small-Cap Quality Value Series (“Kayne Small-Cap Quality Value”) | | Long-term capital appreciation with dividend income as a secondary consideration. |
| |
| Phoenix-Lazard International Equity Select Series (“Lazard International Equity Select”) | | Long-term capital appreciation. |
| |
| Phoenix-Lazard Small-Cap Value Series (“Lazard Small-Cap Value”) | | Long-term capital appreciation. |
| |
| Phoenix-Lazard U.S. Multi-Cap Series (“Lazard U.S. Multi-Cap”) | | Long-term capital appreciation. |
| |
| Phoenix-Lord Abbett Bond-Debenture Series (“Lord Abbett Bond-Debenture”) | | High current income and long-term capital appreciation to produce a high total return. |
| |
| Phoenix-Lord Abbett Large-Cap Value Series (“Lord Abbett Large-Cap Value”) | | Capital appreciation with income as a secondary consideration. |
| |
| Phoenix-Lord Abbett Mid-Cap Value Series (“Lord Abbett Mid-Cap Value”) | | Capital appreciation. |
| |
| Phoenix-MFS Investors Growth Stock Series (“MFS Investors Growth Stock”) (formerly Phoenix-Janus Growth Stock Series) | | Long-term growth of capital and future income rather than current income. |
| |
| Phoenix-MFS Investors Trust Series (“MFS Investors Trust”) | | Long-term growth of capital; secondarily to provide reasonable current income. |
| |
| Phoenix-MFS Value Series (“MFS Value”) | | Capital appreciation and reasonable income. |
| |
| Phoenix-Northern Dow 30 Series (“Northern Dow 30”) (formerly Phoenix-Deutsche Dow 30 Series) | | Track the total return of the Dow Jones Industrial Average(SM) before series expenses. |
| |
| Phoenix-Northern Nasdaq-100 Index® Series (“Northern Nasdaq-100 Index®”) (formerly Phoenix-Deutsche Nasdaq-100 Index ® Series) | | Track the total return of the NASDAQ-100 Index® before series expenses. |
8
THE PHOENIX EDGE SERIES FUND
NOTES TO FINANCIAL STATEMENTS (Continued)
December 31, 2003
| | |
Fund Name
| | Investment Objective
|
| Phoenix-Oakhurst Growth and Income Series (“Oakhurst Growth and Income”) | | Dividend growth, current income and capital appreciation. |
| |
| Phoenix-Oakhurst Strategic Allocation Series (“Oakhurst Strategic Allocation”) | | High total return over an extended period of time consistent with prudent investment risk. |
| |
| Phoenix-Oakhurst Value Equity Series (“Oakhurst Value Equity”) (formerly Phoenix-Hollister Value Equity Series) | | Long-term capital appreciation with current income as a secondary consideration. |
| |
| Phoenix-Sanford Bernstein Global Value Series (“Sanford Bernstein Global Value”) | | Long-term capital growth through investment in equity securities of foreign and U.S. companies. |
| |
| Phoenix-Sanford Bernstein Mid-Cap Value Series (“Sanford Bernstein Mid-Cap Value”) | | Long-term capital appreciation with current income as a secondary consideration. |
| |
| Phoenix-Sanford Bernstein Small-Cap Value Series (“Sanford Bernstein Small-Cap Value”) | | Long-term capital appreciation by investing primarily in small-capitalization stocks that appear to be undervalued with current income as a secondary consideration. |
| |
| Phoenix-Seneca Mid-Cap Growth Series (“Seneca Mid-Cap Growth”) | | Capital appreciation. |
| |
| Phoenix-Seneca Strategic Theme Series (“Seneca Strategic Theme”) | | Long-term capital appreciation. |
| |
| Phoenix-State Street Research Small-Cap Growth Series (“State Street Research Small-Cap Growth”) | | Long-term capital growth. |
Note 2—Significant Accounting Policies
The following is a summary of significant accounting policies consistently followed by the Fund in the preparation of its financial statements. The preparation of financial statements in conformity with accounting principles generally accepted in the United States of America requires management to make estimates and assumptions that affect the reported amounts of assets, liabilities, disclosure of contingent assets and liabilities, revenues and expenses. Actual results could differ from those estimates.
A. Security Valuation
Equity securities are valued at the official closing price (typically last sale) on the exchange on which the securities are primarily traded, or if no closing price is available, at the last bid price. Debt securities are valued on the basis of broker quotations or valuations provided by a pricing service, which in determining value utilizes information with respect to recent sales, market transactions in comparable securities, quotations from dealers, and various relationships between securities. Short-term investments having a remaining maturity of 60 days or less are valued at amortized cost, which approximates market. As required, some investments are valued at fair value as determined in good faith by or under the direction of the Trustees.
Goodwin Money Market uses the amortized cost method of security valuation absent extraordinary or unusual market conditions. In the opinion of the Trustees, this represents the fair value of the securities. The Trustees monitor the deviations between the net asset value per share as determined by using available market quotations and its net asset value per share using amortized cost. If the deviation exceeds 1/2 of 1%, the Board of Trustees will consider what action, if any, should be initiated to provide fair valuation. Using this method, the series attempts to maintain a constant net asset value of $10 per share.
Certain securities held by the Fund were valued on the basis of a price provided by a principal market maker. The prices provided by the principal market makers may differ from the value that would be realized if the securities were sold. At December 31, 2003, the total value of these securities represented approximately the following percentage of net assets:
| | | |
Series
| | Percentage of Net Assets
| |
Goodwin Multi-Sector Fixed Income | | 1.9 | % |
Goodwin Multi-Sector Short Term Bond | | 3.1 | |
B. Security Transactions and Related Income
Security transactions are recorded on the trade date. Dividend income is recorded on the ex-dividend date, or in the case of certain foreign securities, as soon as the series is notified. Interest income is recorded on the accrual basis. Each series amortizes premiums and accretes discounts using the effective interest method. Realized gains and losses are determined on the identified cost basis.
C. REIT Investments
With respect to Duff & Phelps Real Estate Securities, dividend income is recorded based on the income included in distributions received from the REIT investments using published REIT reclassifications including some management estimates when actuals are not available. Distributions received in excess of this estimated amount are recorded as a reduction of the cost of investments or reclassified to capital gains. The actual amounts of income, return of capital, and capital gains are only determined by each REIT after its fiscal year-end, and may differ from the estimated amounts.
9
THE PHOENIX EDGE SERIES FUND
NOTES TO FINANCIAL STATEMENTS (Continued)
December 31, 2003
D. Income Taxes
Each series is treated as a separate taxable entity. It is the policy of each series to comply with the requirements of the Internal Revenue Code (the “Code”) applicable to regulated investment companies, and to distribute substantially all of its taxable income to its shareholders. In addition, each series intends to distribute an amount sufficient to avoid imposition of any excise tax under Section 4982 of the Code. Therefore, no provision for federal income taxes or excise taxes has been made.
E. Distributions to Shareholders
Distributions are recorded by each series on the ex-dividend date. Income and capital gain distributions are determined in accordance with income tax regulations, which may differ from accounting principles generally accepted in the United States of America. These differences may include the treatment of non-taxable dividends, market premium and discount, non-deductible expenses, expiring capital loss carryovers, foreign currency gain or loss, gain or loss on futures contracts, partnerships, operating losses and losses deferred due to wash sales. Permanent book and tax basis differences relating to shareholder distributions will result in reclassifications to capital paid in on shares of beneficial interest.
F. Foreign Currency Translation
Foreign securities and other assets and liabilities are valued using the foreign currency exchange rate effective at the end of the reporting period. Cost of investments is translated at the currency exchange rate effective at the trade date. The gain or loss resulting from a change in currency exchange rates between the trade and settlement dates of a portfolio transaction is treated as a gain or loss on foreign currency. Likewise, the gain or loss resulting from a change in currency exchange rates between the date income is accrued and paid is treated as a gain or loss on foreign currency. The series do not separate that portion of the results of operations arising from changes in exchange rates and that portion arising from changes in the market prices of securities.
G. Forward Currency Contracts
Certain series may enter into forward currency contracts in conjunction with the planned purchase or sale of foreign denominated securities in order to hedge the U.S. dollar cost or proceeds. Forward currency contracts involve, to varying degrees, elements of market risk in excess of the amount recognized in the Statement of Assets and Liabilities. Risks arise from the possible movements in foreign exchange rates or if the counterparty does not perform under the contract.
A forward currency contract involves an obligation to purchase or sell a specific currency at a future date, which may be any number of days from the date of the contract agreed upon by the parties, at a price set at the time of the contract. These contracts are traded directly between currency traders and their customers. The contract is marked-to-market daily and the change in market value is recorded by each series as unrealized gain (or loss). When the contract is closed or offset with the same counterparty, the series records a realized gain (or loss) equal to the change in the value of the contract when it was opened and the value at the time it was closed or offset.
H. Futures Contracts
A futures contract is an agreement between two parties to buy and sell a security at a set price on future date. Certain series may enter into financial futures contracts as a hedge against anticipated changes in the market value of the portfolio securities. Upon entering into a futures contract, the series is required to pledge to the broker an amount of cash and/or securities equal to the “initial margin” requirements of the futures exchange on which the contract is traded. Pursuant to the contract, the series agrees to receive from or pay to the broker an amount of cash equal to the daily fluctuation in value of the contract. Such receipts or payments are known as variation margin and are recorded by the series as unrealized gains or losses. When the contract is closed, the series records a realized gain or loss equal to the difference between the value of the contract at the time it was opened and the value at the time it was closed. The potential risk to the series is that the change in value of the futures contract may not correspond to the change in value of the hedged instruments.
I. Expenses
Expenses incurred by the Fund with respect to any two or more series are allocated in proportion to the net assets of each series, except where allocation of direct expense to each series or an alternative allocation method can be more fairly made.
J. When-Issued and Delayed Delivery Transactions
Certain series may engage in when-issued or delayed delivery transactions. The series records when-issued securities on the trade date and maintains collateral for the securities purchased. Securities purchased on a when-issued or delayed delivery basis begin earning interest on the settlement date.
K. Loan Agreements
Certain series may invest in direct debt instruments, which are interests in amounts owed by a corporate, governmental, or other borrower to lenders or lending syndicates. A series’ investments in loans may be in the form of participation in loans or assignments of all or a portion of loans from third parties. A loan is often administered by a bank or other financial institution (the lender) that acts as agent for all holders. The agent administers the terms of the loan, as specified in the loan agreement. When investing in a loan participation, the series has the right to receive payments of principal, interest and any fees to which it is entitled only from the lender selling the loan agreement and only upon receipt by the lender of payments from the borrower. The series generally has no right to enforce compliance with the terms of the loan agreement with the borrower. As a result, the series may be subject to the credit risk of both the borrower and the lender that is selling the loan agreement. When the series purchases assignments from lenders it acquires direct rights against the borrower on the loan. Direct indebtedness of emerging countries involves a risk that the government entities responsible for the repayment of the debt may be unable, or unwilling to pay the principal and interest when due.
10
THE PHOENIX EDGE SERIES FUND
NOTES TO FINANCIAL STATEMENTS (Continued)
December 31, 2003
L. Repurchase Agreements
A repurchase agreement is a transaction where a series acquires a security for cash and obtains a simultaneous commitment from the seller to repurchase the security at an agreed upon price and date. Each series, through its custodian, takes possession of securities collateralizing the repurchase agreement. The collateral is marked-to-market daily to ensure that the market value of the underlying assets remains sufficient to protect the series in the event of default by the seller. If the seller defaults and the value of the collateral declines, or if the seller enters insolvency proceedings, realization of collateral may be delayed or limited.
M. Debt Index Securities, Targeted Return Index Securities and Traded Custody Receipts
Certain series invest in securities that represent an interest in a diversified portfolio (the “basket”) of debt instruments (the underlying securities). Under the term of the baskets, the series has direct ownership in each underlying security equal to its pro rata interest in the basket. In the event of default of any underlying security, the notional amount on which interest is earned is reduced by the par amount of the defaulted security, and the pro rata interest of such security is distributed to the series.
Debt index securities are comprised of a basket of credit default swaps referencing a diversified pool of high yield or emerging market debt instruments. Certain baskets may be purchased on a funded or unfunded basis such that the series receives interest payments based upon the notional amount or par amount of the basket. In connection with these investments collateral are set aside by the series’ custodian. In the event of default of any of the underlying notional securities within the unfunded basket, the series will be required to pay the counterparty an amount equal to its pro rata share of the notional amount of the defaulted security and similarly the series will then receive its pro rata interest of the defaulted security or equivalent cash amount. In a funded transaction, in the event of default of any par securities in the funded basket, the series would be required to receive its pro rata interest of the defaulted security or equivalent cash amount.
Targeted return index securities are trusts in which each certificate holder owns a pro rata share of the corporate bonds that comprise the Lehman Brothers U.S. Credit Index, which is a component of the Lehman Brothers U.S. Aggregate Index.
Traded custody receipts are custody receipts, which represent an ownership interest in an equal par-weighted portfolio of benchmark U.S. corporate bonds.
N. Foreign Security Country Determination
A combination of the following criteria is used to assign the countries at risk listed in the Schedule of Investments: country of incorporation, actual building address, primary exchange on which the security is traded and country in which the greatest percentage of company revenue is generated.
Note 3—Investment Advisory Fees and Related Party Transactions
The advisors to the Fund are Phoenix Investment Counsel, Inc. (“PIC”), Phoenix Variable Advisors, Inc. (“PVA”), and Duff & Phelps Investment Management Co. (“DPIM”). As compensation for their services to the Fund, the advisors are entitled to a fee based upon the following annual rates as a percentage of the average daily net assets of each separate series listed below:
| | | | | | | | | | | |
Series
| | Advisor
| | Rate for first $250 million
| | | Rate for next $250 million
| | | Rate for over $500 million
| |
Aberdeen International | | PIC | | 0.75 | % | | 0.70 | % | | 0.65 | % |
AIM Mid-Cap Equity | | PVA | | 0.85 | | | 0.85 | | | 0.85 | |
Alliance/Bernstein Enhanced Index | | PVA | | 0.45 | | | 0.45 | | | 0.45 | |
Alliance/Bernstein Growth + Value | | PVA | | 0.85 | | | 0.85 | | | 0.85 | |
Engemann Capital Growth | | PIC | | 0.70 | | | 0.65 | | | 0.60 | |
Engemann Small & Mid-Cap Growth | | PIC | | 0.90 | | | 0.90 | | | 0.90 | |
Goodwin Money Market | | PIC | | 0.40 | | | 0.35 | | | 0.30 | |
Goodwin Multi-Sector Fixed Income | | PIC | | 0.50 | | | 0.45 | | | 0.40 | |
Goodwin Multi-Sector Short Term Bond | | PIC | | 0.50 | (2) | | 0.45 | (2) | | 0.40 | (2) |
Janus Flexible Income | | PVA | | 0.80 | | | 0.80 | | | 0.80 | |
Kayne Rising Dividends | | PIC | | 0.70 | | | 0.70 | | | 0.70 | |
Kayne Small-Cap Quality Value | | PIC | | 0.90 | | | 0.90 | | | 0.90 | |
Lazard International Equity Select | | PVA | | 0.90 | | | 0.90 | | | 0.90 | |
Lazard Small-Cap Value | | PVA | | 0.90 | | | 0.90 | | | 0.90 | |
Lazard U.S. Multi-Cap | | PVA | | 0.80 | | | 0.80 | | | 0.80 | |
Lord Abbett Bond-Debenture | | PVA | | 0.75 | | | 0.75 | | | 0.75 | |
Lord Abbett Large-Cap Value | | PVA | | 0.75 | | | 0.75 | | | 0.75 | |
Lord Abbett Mid-Cap Value | | PVA | | 0.85 | | | 0.85 | | | 0.85 | |
MFS Investors Growth Stock | | PVA | | 0.75 | (1) | | 0.75 | (1) | | 0.75 | (1) |
MFS Investors Trust | | PVA | | 0.75 | | | 0.75 | | | 0.75 | |
MFS Value | | PVA | | 0.75 | | | 0.75 | | | 0.75 | |
Northern Dow 30 | | PVA | | 0.35 | | | 0.35 | | | 0.35 | |
Northern Nasdaq-100 Index® | | PVA | | 0.35 | | | 0.35 | | | 0.35 | |
Oakhurst Growth and Income | | PIC | | 0.70 | | | 0.65 | | | 0.60 | |
Oakhurst Strategic Allocation | | PIC | | 0.60 | | | 0.55 | | | 0.50 | |
Oakhurst Value Equity | | PIC | | 0.70 | | | 0.65 | | | 0.60 | |
11
THE PHOENIX EDGE SERIES FUND
NOTES TO FINANCIAL STATEMENTS (Continued)
December 31, 2003
| | | | | | | | |
Series (continued)
| | Advisor
| | Rate for first $250 million
| | Rate for next $250 million
| | Rate for over $500 million
|
Sanford Bernstein Global Value | | PVA | | 0.90 | | 0.90 | | 0.90 |
Sanford Bernstein Mid-Cap Value | | PVA | | 1.05 | | 1.05 | | 1.05 |
Sanford Bernstein Small-Cap Value | | PVA | | 1.05 | | 1.05 | | 1.05 |
Seneca Mid-Cap Growth | | PIC | | 0.80 | | 0.80 | | 0.80 |
Seneca Strategic Theme | | PIC | | 0.75 | | 0.70 | | 0.65 |
State Street Research Small-Cap Growth | | PVA | | 0.85 | | 0.85 | | 0.85 |
| | | | |
| | | | | Rate for first $1 Billion
| | Rate for next $1 Billion
| | Rate for over $2 Billion
|
Duff & Phelps Real Estate Securities | | DPIM | | 0.75 | | 0.70 | | 0.65 |
| (1) | Prior to February 14, 2003, the rate was 0.85. |
| (2) | Effective June 2, 2003, the advisor voluntarily agreed to waive its entire management fee of 0.50% for the Multi-Sector Short Term Bond Fund through May 31, 2004. |
Pursuant to a subadvisory agreement with the Fund, certain advisors delegate certain investment decisions and research functions with respect to the following series to the subadvisor indicated, for which each is paid a fee by the respective advisor.
| | |
Series
| | Subadvisor
|
| Aberdeen International | | Aberdeen Fund Managers, Inc. (“Aberdeen”) |
| |
| AIM Mid-Cap Equity | | AIM Capital Management, Inc. (“AIM”) |
| |
| Alliance/Bernstein Enhanced Index | | Alliance Capital Management L.P. (“Alliance”) |
| |
| Alliance/Bernstein Growth + Value | | Alliance Capital Management L.P. (“Alliance”) |
| |
| Engemann Capital Growth | | Engemann Asset Management (“Engemann”) |
| |
| Engemann Small & Mid-Cap Growth | | Engemann Asset Management (“Engemann”) |
| |
| Janus Flexible Income | | Janus Capital Management LLC (“Janus”) |
| |
| Kayne Rising Dividends | | Kayne Anderson Rudnick Investment Management, LLC (“Kayne”) |
| |
| Kayne Small-Cap Quality Value | | Kayne Anderson Rudnick Investment Management, LLC (“Kayne”) |
| |
| Lazard International Equity Select | | Lazard Asset Management LLC (“Lazard”) |
| |
| Lazard Small-Cap Value | | Lazard Asset Management LLC (“Lazard”) |
| |
| Lazard U.S. Multi-Cap | | Lazard Asset Management LLC (“Lazard”) |
| |
| Lord Abbett Bond-Debenture | | Lord, Abbett & Co. LLC (“Lord Abbett”) |
| |
| Lord Abbett Large-Cap Value | | Lord, Abbett & Co. LLC (“Lord Abbett”) |
| |
| Lord Abbett Mid-Cap Value | | Lord, Abbett & Co. LLC (“Lord Abbett”) |
| |
| MFS Investors Growth Stock | | Massachusetts Financial Services Company, Inc. (“MFS”) |
| |
| MFS Investors Trust | | Massachusetts Financial Services Company, Inc. (“MFS”) |
| |
| MFS Value | | Massachusetts Financial Services Company, Inc. (“MFS”) |
| |
| Northern Dow 30 | | Northern Trust Investments, N.A. (“Northern”) |
| |
| Northern Nasdaq-100 Index® | | Northern Trust Investments, N.A. (“Northern”) |
| |
| Sanford Bernstein Global Value | | Alliance Capital Management L.P. (“Alliance”) |
| |
| Sanford Bernstein Mid-Cap Value | | Alliance Capital Management L.P. (“Alliance”) |
| |
| Sanford Bernstein Small Cap Value | | Alliance Capital Management L.P. (“Alliance”) |
| |
| Seneca Mid-Cap Growth | | Seneca Capital Management LLC (“Seneca”) |
| |
| Seneca Strategic Theme | | Seneca Capital Management LLC (“Seneca”) |
| |
| State Street Research Small-Cap Growth | �� | State Street Research & Management Company (“State Street”) |
PIC and PVA employ subadvisors to furnish portfolio management services to the series, subject to Investment Subadvisory Agreements, the terms of which are described below.
PIC is an indirect wholly owned subsidiary of Phoenix Investment Partners, Ltd. DPIM is a subsidiary of Phoenix Investment Partners, Ltd. Engemann Asset Management is a wholly owned subsidiary of Pasadena Capital Corporation, which in turn is a wholly owned subsidiary of Phoenix Investment Partners, Ltd. A majority of the equity interest of Kayne Anderson Rudnick Investment Management, LLC and Seneca Capital Management LLC are owned by Phoenix Investment Partners, Ltd. Phoenix Investment Partners, Ltd. in turn is an indirect wholly owned subsidiary of The Phoenix Companies, Inc. (“PNX”).
PIC has engaged Aberdeen as a subadvisor to the Aberdeen International. Aberdeen provides the day-to-day portfolio management for this series. For implementing certain portfolio transactions and providing other services to this series, PIC pays a monthly fee to Aberdeen based on an annual percentage of the average daily net assets of this series of 0.375% on the first $250 million, 0.35% of such value between $250 million to $500 million and 0.325% of such value in excess of $500 million. Aberdeen is a wholly owned subsidiary of Aberdeen Asset Management PLC, of which PNX owns approximately 15%.
Pursuant to a subadvisory agreement between PVA and AIM, AIM is the subadvisor and furnishes portfolio management services to AIM Mid-Cap Equity. For the services provided, PVA pays a monthly fee to AIM based on an annual percentage of 0.50% of the average daily net assets of this series.
12
THE PHOENIX EDGE SERIES FUND
NOTES TO FINANCIAL STATEMENTS (Continued)
December 31, 2003
Pursuant to a subadvisory agreement between PVA and Alliance, Alliance is the subadvisor and furnishes portfolio management services to Alliance/Bernstein Enhanced Index and Alliance/Bernstein Growth + Value. Alliance will manage the portion of these series’ assets invested in value stocks through its Bernstein Investment Research and Management unit (the “Bernstein Unit”). PVA pays a monthly fee to Alliance based on an annual percentage of the average daily net assets of these series as follows:
| | | | | | | | | | | | | | | |
Series
| | Rate For First $50 Million
| | | Rate For Next $ 150 Million
| | | Rate For over $200 Million
| | | | | | | |
Alliance/Bernstein Enhanced Index | | 0.225 | % | | 0.180 | % | | 0.135 | % | | | | | | |
| | | | | |
| | | Rate For First $20 Million
| | | Rate For Next $20 Million
| | | Rate For Next $20 Million
| | | Rate for Next $40 Million
| | | Rate for over $100 Million
| |
Alliance/Bernstein Growth + Value | | 0.90 | % | | 0.75 | % | | 0.60 | % | | 0.40 | % | | 0.30 | % |
On February 1, 2003, Alliance Capital Management L.P. (“Alliance”) replaced J.P. Morgan Investment Management, Inc. as subadvisor for the Phoenix-J.P. Morgan Research Enhanced Index Series. The series was subsequently renamed Phoenix-Alliance/Bernstein Enhanced Index Series.
Pursuant to subadvisory agreements between PVA and Alliance, Alliance, through its Bernstein Unit, is the subadvisor and furnishes portfolio management services, including effecting the purchase and sales of securities and providing related advisory services, to the Sanford Bernstein Global Value, Sanford Bernstein Mid-Cap Value and Sanford Bernstein Small-Cap Value Series. For the services provided, PVA pays a monthly fee to Alliance based on an annual percentage of the average daily net assets of these Series as follows:
| | | | | | | | | | | | | | | |
Series
| | Rate For First $25 Million
| | | Rate For Next $25 Million
| | | Rate For Next $25 Million
| | | Rate for Next $100 Million
| | | Rate for over $175 Million
| |
Sanford Bernstein Global Value (1) | | 0.65 | % | | 0.50 | % | | 0.45 | % | | 0.40 | % | | 0.30 | % |
Sanford Bernstein Mid-Cap Value (1) | | 0.80 | | | 0.60 | | | 0.60 | | | 0.60 | | | 0.60 | |
| | | | | |
| | | Rate For First $10 Million
| | | Rate For Next $10 Million
| | | Rate For over $20 Million
| | | | | | | |
Sanford Bernstein Small-Cap Value (1) | | 1.00 | % | | 0.875 | % | | 0.75 | % | | | | | | |
| (1) | The series are subadvised by the Bernstein Unit and receives a 10% reduction in fees for all or a portion of these series’ assets when certain assets of the series exceed $10 million. A 10% reduction in fees is based upon the aggregate fees for Sanford Bernstein Global Value and Sanford Bernstein Small-Cap Value. As of December 31, 2003, the reduction is for Sanford Bernstein Global Value and Sanford Bernstein Small-Cap Value. |
Pursuant to subadvisory agreements between PIC and Engemann with respect to Engemann Capital Growth and Engemann Small & Mid-Cap Growth, Engemann is the subadvisor and furnishes portfolio management services, including effecting the purchase and sales of securities and providing related advisory services, to these series. For the services provided, PIC pays a monthly fee to Engemann for Engemann Capital Growth based on an annual percentage of the average daily net assets of 0.10% up to $3 billion and 0.30% of such value in excess of $3 billion; and for Small & Mid-Cap Growth based on an annual percentage of the average daily net assets of 0.45%.
Pursuant to a subadvisory agreement between PVA and Janus, Janus is the subadvisor and furnishes portfolio management services, including effecting the purchase and sales of securities and providing related advisory services, to Janus Flexible Income. For the services provided, PVA pays a monthly fee to Janus based on an annual percentage of the average daily net assets of this series of 0.55% up to $100 million, 0.50% of such value between $100 million and $500 million and 0.45% on such value in excess of $500 million.
Pursuant to a subadvisory agreement between PIC and Kayne, Kayne is the subadvisor and furnishes portfolio management services to Kayne Rising Dividends and Kayne Small-Cap Quality Value. For the services provided, PIC pays a monthly fee to Kayne for the Kayne Rising Dividends based on an annual percentage of the average daily net assets of 0.30% up to $800 million and 0.25% of such value in excess of $800 million; and for the Kayne Small-Cap Quality based on an annual percentage of the average daily net assets of 0.50% up to $200 million and 0.45% of such value in excess of $200 million.
Pursuant to a subadvisory agreement between PVA and Lazard, Lazard is the subadvisor and furnishes portfolio management services to Lazard International Equity Select, Lazard Small-Cap Value and Lazard U.S. Multi-Cap. For the services provided, PVA pays a monthly fee to Lazard for the Lazard International Equity Select based on an annual percentage of the average daily net assets of 0.45% up to $500 million and 0.40% of such value in excess of $500 million; for the Lazard Small-Cap Value based on an annual percentage of the average daily net assets of 0.55% up to $250 million, 0.50% of such value between $250 million and $500 million and 0.45% of such value in excess of $500 million; and for the Lazard U.S. Multi-Cap based on an annual percentage of the average daily net assets of 0.38% up to $250 million and 0.35% of such value in excess of $250 million.
Pursuant to a subadvisory agreement between PVA and Lord Abbett, Lord Abbett is the subadvisor and furnishes portfolio management services to Lord Abbett Bond-Debenture, Lord Abbett Large-Cap Value and Lord Abbett Mid-Cap Value. For the services provided, PVA pays a monthly fee to Lord Abbett for Lord Abbett Bond-Debenture based on an annual percentage of average daily net assets of 0.35% up to $250 million, 0.30% of such value between $250 million and $1 billion and 0.25% of such value in excess of $1 billion; for the Lord Abbett Large-Cap Value based on an annual percentage of the average daily net assets of 0.35% up to $600 million, 0.30% of such value between $600 million and $1.2 billion and 0.25% of such value in excess of $1.2 billion; and for the Lord Abbett Mid-Cap Value based on an annual percentage of the average daily net assets of 0.45% up to $200 million, 0.40% of such value between $200 million and $500 million and 0.375% of such value in excess of $500 million. Lord Abbett has voluntarily agreed to waive 0.05% of the subadvisory fee for Lord Abbett Mid-Cap Value received from PVA on the first $200 million until February 9, 2004.
13
THE PHOENIX EDGE SERIES FUND
NOTES TO FINANCIAL STATEMENTS (Continued)
December 31, 2003
Pursuant to a subadvisory agreement between PVA and MFS, MFS is the subadvisor and furnishes portfolio management services to the MFS Investors Growth Stock, MFS Investors Trust, and MFS Value. For the services provided, PVA pays a monthly fee to MFS based on an annual percentage of the combined average daily net assets of all three of these Series of 0.375% up to $500 million, 0.35% on such value between $500 million and $900 million, 0.325% on such value between $900 million and $1.5 billion and 0.25% on such value in excess of $1.5 billion. As of August 1, 2003, these rates became 0.40%, 0.375%, 0.35% and 0.25%, respectively.
On February 1, 2003, Northern replaced Deutsche Asset Management, Inc. (“DAMI”), as subadvisor for Phoenix-Deutsche Dow 30 Series and Phoenix-Deutsche Nasdaq-100 Index® Series. The series were subsequently renamed Phoenix-Northern Dow 30 Series and Phoenix-Northern Nasdaq-100 Index® Series, respectively.
Pursuant to a subadvisory agreement between PVA and Northern, Northern is the subadvisor and provides portfolio management services, including effecting the purchase and sales of securities and providing related advisory services, to the Northern Trust Dow 30 and Northern Nasdaq-100 Index®. For the services provided, PVA pays a monthly fee to Northern based on an annual percentage of 0.10% of the average daily net assets of each of these series, with a minimum annual fee for each series of $100,000.
Pursuant to a subadvisory agreement between the Fund, PIC and Seneca with respect to Seneca Mid-Cap Growth, and pursuant to a subadvisory agreement between PIC and Seneca with respect to Seneca Strategic Theme, Seneca is the subadvisor and furnishes portfolio management services, including effecting the purchase and sales of securities and providing related advisory services, to the Seneca Mid-Cap Growth and Seneca Strategic Theme. For the services provided, PIC pays a monthly fee to Seneca for the Seneca Mid-Cap Growth based on an annual percentage of the average daily net assets of 0.40%; and for the Seneca Strategic Theme based on an annual percentage of the average daily net assets of 0.10% up to $201 million, 0.375% of such value between $201 million and $1 billion, 0.35% of such value between $1 billion and $2 billion and 0.325% on such value in excess of $2 billion.
Pursuant to a subadvisory agreement between PVA and State Street, State Street is the subadvisor and furnishes portfolio management services to State Street Research Small-Cap Growth. For the services provided, PVA pays a monthly fee to State Street based on an annual percentage of 0.45% the average daily net assets of this series.
The advisors have agreed to reimburse the Fund for certain operating expenses (excluding management fees, interest, taxes, brokerage fees and commissions) for all series. For the period ended December 31, 2003, the portion of these expenses to be paid by each series is listed in the following table. All expense reimbursement arrangements may be discontinued at any time.
| | | |
Series
| | Maximum Operating
Expense
| |
Aberdeen International | | 0.40 | % |
AIM Mid-Cap Equity | | 0.25 | |
Alliance/Bernstein Enhanced Index | | 0.20 | |
Alliance/Bernstein Growth + Value | | 0.25 | |
Duff & Phelps Real Estate Securities | | 0.35 | |
Engemann Capital Growth | | 0.25 | |
Engemann Small & Mid-Cap Growth | | 0.35 | |
Goodwin Money Market | | 0.25 | |
Goodwin Multi-Sector Fixed Income | | 0.25 | |
Goodwin Multi-Sector Short Term Bond | | 0.20 | |
Janus Flexible Income | | 0.25 | |
Kayne Rising Dividends | | 0.15 | |
Kayne Small-Cap Quality Value | | 0.15 | |
Lazard International Equity Select | | 0.15 | |
Lazard Small-Cap Value | | 0.15 | |
Lazard U.S. Multi-Cap | | 0.15 | |
Lord Abbett Bond-Debenture | | 0.15 | |
Lord Abbett Large-Cap Value | | 0.15 | |
Lord Abbett Mid-Cap Value | | 0.15 | |
MFS Investors Growth Stock | | 0.25 | |
MFS Investors Trust | | 0.25 | |
MFS Value | | 0.25 | |
Northern Dow 30 | | 0.25 | |
Northern Nasdaq-100 Index® | | 0.25 | |
Oakhurst Growth & Income | | 0.25 | |
Oakhurst Strategic Allocation | | 0.25 | |
Oakhurst Value Equity | | 0.25 | |
Sanford Bernstein Global Value | | 0.25 | |
Sanford Bernstein Mid-Cap Value | | 0.25 | |
Sanford Bernstein Small-Cap Value | | 0.25 | |
Seneca Mid-Cap Growth | | 0.35 | |
Seneca Strategic Theme | | 0.35 | |
State Street Research Small-Cap Growth | | 0.15 | |
14
THE PHOENIX EDGE SERIES FUND
NOTES TO FINANCIAL STATEMENTS (Continued)
December 31, 2003
As Financial Agent to the Fund and to each series, Phoenix Equity Planning Corporation (“PEPCO”), an indirect majority-owned subsidiary of PNX, receives a financial agent fee equal to the sum of (1) the documented cost of fund accounting and related services provided by PFPC Inc. (subagent to PEPCO), plus (2) the documented cost to PEPCO to provide tax services and oversight of subagent’s performance. For the period ended December 31, 2003, the Fund paid PEPCO $2,736,214. Effective January 1, 2003, the fee schedule of PFPC Inc. ranges from 0.065% to 0.03% of the average daily net asset values of all the Phoenix-affiliated Funds serviced by PFPC Inc. Prior to that date, the fee schedule ranged from 0.085% to 0.0125%. Certain minimum fees may apply.
Pursuant to an Administration Agreement, Phoenix Life Insurance Company (“PLIC”), an indirect wholly-owned subsidiary of PNX, receives a service fee at the annual rate of 0.077% of the average daily net assets of each series for providing certain stock transfer and accounting services for each series. For the period ended December 31, 2003, the Fund paid PLIC $1,736,270. Effective January 1, 2004, the service fee is 0.08% of the average daily net assets of each series.
For the period ended December 31, 2003, the Fund paid PXP Securities Corp., a wholly owned subsidiary of PNX, brokerage commissions in connection with portfolio transactions effected on behalf of it as follows:
| | | |
| | | Commissions paid to
PXP Securities Corp.
|
Oakhurst Growth and Income | | $ | 1,916 |
Oakhurst Strategic Allocation | | | 110,848 |
Oakhurst Value Equity | | | 81,476 |
Seneca Strategic Theme | | | 37,822 |
|
At December 31, 2003, Phoenix and affiliates held shares in The Phoenix Edge Series Fund which had the following aggregate value: |
| |
AIM Mid-Cap Equity | | $ | 3,553,065 |
Alliance/Bernstein Growth + Value | | | 2,459,420 |
Goodwin Multi-Sector Short Term Bond | | | 10,242,190 |
Kayne Rising Dividends | | | 564,992 |
Kayne Small-Cap Quality Value | | | 596,953 |
Lazard International Equity Select | | | 1,221,852 |
Lazard Small-Cap Value | | | 4,009,560 |
Lazard U.S. Multi-Cap | | | 2,543,758 |
Lord Abbett Bond-Debenture | | | 2,461,718 |
Lord Abbett Mid-Cap Value | | | 1,223,633 |
MFS Investors Growth Stock | | | 6,001,523 |
MFS Investors Trust | | | 2,954,166 |
Northern Nasdaq-100 Index® | | | 1,883,540 |
Sanford Bernstein Global Value | | | 7,432,754 |
State Street Research Small-Cap Growth | | | 2,280,179 |
Note 4—Purchases and Sales of Securities
Purchases and sales of securities during the period ended December 31, 2003, (excluding U.S. Government securities, short-term securities, futures contracts, swaps and forward currency contracts) aggregated to the following:
| | | | | | |
| | | Purchases
| | Sales
|
Aberdeen International | | $ | 47,736,947 | | $ | 58,397,464 |
AIM Mid-Cap Equity | | | 5,530,849 | | | 3,476,825 |
Alliance/Bernstein Enhanced Index | | | 53,450,668 | | | 47,197,557 |
Alliance/Bernstein Growth + Value | | | 4,303,230 | | | 1,817,435 |
Duff & Phelps Real Estate Securities | | | 21,401,694 | | | 18,112,125 |
Engemann Capital Growth | | | 229,557,902 | | | 293,476,865 |
Engemann Small & Mid-Cap Growth | | | 11,451,572 | | | 7,270,823 |
Goodwin Multi-Sector Fixed Income | | | 285,297,663 | | | 263,116,546 |
Goodwin Multi-Sector Short Term Bond | | | 25,974,635 | | | 6,823,998 |
Janus Flexible Income | | | 37,308,601 | | | 31,089,136 |
Kayne Rising Dividends | | | 11,667,133 | | | 1,240,217 |
Kayne Small-Cap Quality Value | | | 3,542,206 | | | 941,609 |
Lazard International Equity Select | | | 22,041,052 | | | 1,024,755 |
Lazard Small-Cap Value | | | 8,108,472 | | | 3,427,699 |
Lazard U.S. Multi-Cap | | | 3,466,372 | | | 2,134,330 |
Lord Abbett Bond-Debenture | | | 12,497,583 | | | 3,878,297 |
Lord Abbett Large-Cap Value | | | 29,095,762 | | | 3,861,178 |
Lord Abbett Mid-Cap Value | | | 8,261,183 | | | 991,759 |
MFS Investors Growth Stock | | | 148,554,913 | | | 148,647,653 |
MFS Investors Trust | | | 6,856,792 | | | 4,818,543 |
MFS Value | | | 24,991,719 | | | 17,671,987 |
15
THE PHOENIX EDGE SERIES FUND
NOTES TO FINANCIAL STATEMENTS (Continued)
December 31, 2003
| | | | | | |
Securities (continued)
| | Purchases
| | Sales
|
Northern Dow 30 | | $ | 9,950,929 | | $ | 6,892,198 |
Northern Nasdaq-100 Index® | | | 11,880,740 | | | 2,523,920 |
Oakhurst Growth and Income | | | 53,831,179 | | | 47,463,587 |
Oakhurst Strategic Allocation | | | 358,220,503 | | | 368,620,093 |
Oakhurst Value Equity | | | 299,186,117 | | | 294,854,324 |
Sanford Bernstein Global Value | | | 5,206,228 | | | 2,431,714 |
Sanford Bernstein Mid-Cap Value | | | 19,625,150 | | | 18,923,788 |
Sanford Bernstein Small-Cap Value | | | 12,630,877 | | | 12,634,720 |
Seneca Mid-Cap Growth | | | 89,921,273 | | | 91,750,863 |
Seneca Strategic Theme | | | 75,736,665 | | | 84,956,925 |
State Street Research Small-Cap Growth | | | 19,622,856 | | | 11,955,792 |
There were no purchases or sales of such securities in Goodwin Money Market.
Purchases and sales of long-term U.S. Government securities during the period ended December 31, 2003, aggregated the following:
| | | | | | |
| | | Purchases
| | Sales
|
Goodwin Multi-Sector Fixed Income | | $ | 13,021,694 | | $ | 26,873,932 |
Goodwin Multi-Sector Short Term Bond | | | 1,734,067 | | | 430,188 |
Janus Flexible Income | | | 43,171,079 | | | 43,342,609 |
Lord Abbett Bond-Debenture | | | 359,405 | | | 183,864 |
MFS Investors Growth Stock | | | — | | | 66,695 |
Oakhurst Strategic Allocation | | | 15,507,248 | | | 21,815,664 |
Note 5—Forward Currency Contracts
As of December 31, 2003, Janus Flexible Income has entered into the following forward currency contracts which contractually obligate the series to receive currency at the specified date:
| | | | | | | | | | | | |
Contract to Receive
| | In Exchange for
| | Settlement Date
| | Value
| | | Net
Unrealized
Appreciation
(Depreciation)
| |
USD $1,049,695 | | EUR 915,000 | | 3/26/04 | | $ | (1,147,258 | ) | | $ | (97,563 | ) |
USD United States Dollar | | | | | | | | | | | | |
EUR Euro | | | | | | | | | | | | |
Note 6—Futures Contracts
At December 31, 2003, the following series had entered into futures contracts as follows:
| | | | | | | | | | | | | |
| | | Expiration
Date
| | Number
of
Contracts
| | Value of
Contracts
when
Opened
| | Market
Value of
Contracts
| | Net
Unrealized
Appreciation
(Depreciation)
|
Northern Dow 30 Dow Jones Industrial Average Index | | March ’04 | | 8 | | $ | 805,900 | | $ | 833,200 | | $ | 27,300 |
Northern Nasdaq-100 Index® Nasdaq-100 Index | | March ’04 | | 23 | | | 656,144 | | | 676,660 | | | 20,516 |
Sanford Bernstein Global Value FTSE 100 Index | | March ’04 | | 1 | | | 75,616 | | | 77,848 | | | 2,232 |
DJ Eur STOXX 50 Index | | March ’04 | | 2 | | | 65,452 | | | 67,596 | | | 2,144 |
Note 7—Credit Risk and Concentrations
In countries with limited or developing markets, investments may present greater risks than in more developed markets and the prices of such investments may be volatile. The consequences of political, social or economic changes in these markets may have disruptive effects on the market prices of these investments and the income they generate, as well as a series’ ability to repatriate such amounts.
Certain series may invest a high percentage of their assets in specific sectors of the market in their pursuit of a greater investment return. Fluctuations in these sectors of concentration may have a greater impact on a series, positive or negative, than if a series did not concentrate its investments in such sectors.
High yield/high risk securities typically entail greater price volatility and/or principal and interest rate risk. There is a greater chance that an issuer will not be able to make principal and interest payments on time. Analysis of the creditworthiness of issuers of high yield securities may be complex, and as a result, it may be more difficult for the adviser and/or subadviser to accurately predict risk.
16
THE PHOENIX EDGE SERIES FUND
NOTES TO FINANCIAL STATEMENTS (Continued)
December 31, 2003
Note 8—Restricted Securities
At December 31, 2003, the Fund held the following restricted securities:
| | | | | |
| | | Acquisition Date
| | Acquisition Cost
|
Janus Flexible Income | | | | | |
Candescent Technologies Corp. Cv.144A 8%, 5/1/03 | | 3/6/00 | | $ | 40,000 |
Oakhurst Strategic Allocation | | | | | |
ITW Cupids Financial Trust I 144A 6.55%, 12/31/11 | | 4/18/02 | | | 1,996,980 |
State Street Research Small-Cap Growth | | | | | |
Amedisys, Inc. | | 11/20/03 | | | 73,200 |
Each series will bear any costs, including those involved in registration under the Securities Act of 1933, in connection with the disposition of such securities.
Note 9—Federal Income Tax Information
The following series have capital loss carryovers which may be used to offset future capital gains.
| | | | | | | | | | | | | | | | | | | | | | | | |
| | | Expiration Year
|
| | | 2005
| | 2006
| | 2007
| | 2008
| | 2009
| | 2010
| | 2011
| | Total
|
Aberdeen International | | $ | 1,280,431 | | $ | — | | $ | — | | $ | 295,786 | | $ | 26,725,829 | | $ | 21,729,527 | | $ | 19,740,631 | | $ | 69,772,204 |
AIM Mid-Cap Equity | | | — | | | — | | | — | | | — | | | — | | | 41,525 | | | — | | | 41,525 |
Alliance/Bernstein Enhanced Index | | | — | | | — | | | — | | | — | | | 5,915,199 | | | 15,534,573 | | | 7,723,071 | | | 29,172,843 |
Alliance/Bernstein Growth + Value | | | — | | | — | | | — | | | — | | | — | | | 462,448 | | | 303,453 | | | 765,901 |
Engemann Capital Growth . | | | 30,157 | | | 590,466 | | | 5,141,805 | | | 11,718,126 | | | 287,550,532 | | | 73,263,809 | | | 5,973,373 | | | 384,268,268 |
Engemann Small & Mid-Cap Growth | | | — | | | — | | | — | | | 302,334 | | | 1,838,456 | | | 4,227,881 | | | 744,060 | | | 7,112,731 |
Goodwin Multi-Sector Fixed Income | | | — | | | — | | | 5,353,161 | | | 6,659,630 | | | 4,980,791 | | | 7,850,329 | | | — | | | 24,843,911 |
Goodwin Multi-Sector Short Term Bond | | | — | | | — | | | — | | | — | | | — | | | — | | | 18,992 | | | 18,992 |
MFS Investors Growth Stock | | | — | | | — | | | 574,679 | | | 6,196,948 | | | 18,423,160 | | | 18,330,727 | | | 11,077,954 | | | 54,603,468 |
MFS Investors Trust | | | — | | | — | | | — | | | — | | | — | | | 326,812 | | | 6,486 | | | 333,298 |
MFS Value | | | — | | | — | | | — | | | — | | | — | | | 159,310 | | | — | | | 159,310 |
Northern Dow 30 | | | — | | | — | | | — | | | — | | | — | | | 537,400 | | | — | | | 537,400 |
Northern Nasdaq-100 Index® | | | — | | | — | | | — | | | 35,822 | | | 775,525 | | | 542,317 | | | 931,918 | | | 2,285,582 |
Oakhurst Growth and Income | | | — | | | — | | | — | | | — | | | 3,195,522 | | | 11,717,280 | | | 5,419,237 | | | 20,332,039 |
Oakhurst Strategic Allocation | | | — | | | — | | | — | | | — | | | 5,639,688 | | | 13,194,113 | | | — | | | 18,833,801 |
Oakhurst Value Equity | | | — | | | — | | | — | | | — | | | — | | | 16,820,901 | | | — | | | 16,820,901 |
Sanford Bernstein Global Value | | | — | | | — | | | — | | | — | | | — | | | 441,697 | | | 174,094 | | | 615,791 |
Seneca Mid-Cap Growth | | | — | | | — | | | — | | | — | | | 20,367,702 | | | 16,035,347 | | | — | | | 36,403,049 |
Seneca Strategic Theme | | | — | | | — | | | — | | | — | | | 73,480,758 | | | 27,319,632 | | | — | | | 100,800,390 |
Included in the Aberdeen International amounts are $2,547,074, which were acquired in connection with the merger of the Aberdeen New Asia Series on February 7, 2003.
Included in the Engemann Capital Growth’s amounts are $23,491,846, which were acquired in connection with the merger of the Engemann Nifty Fifty Series on April 5, 2002.
Included in the MFS Investors Growth Stock’s amounts (formerly Janus Growth Series) are $4,002,162; $3,586,175; and $974,489, respectively, which were acquired in connection with the mergers of the Janus Core Equity Series on March 22, 2002; Van Kampen Focus Equity Series on February 14, 2003; and MFS Investors Growth Stock Series on February 14, 2003.
A series may not realize the benefit of these losses to the extent it does not realize gains on investments prior to the expiration of the capital loss carryovers.
The following series utilized losses deferred in prior years against current year capital gains as follows:
| | | |
AIM Mid-Cap Equity | | $ | 73,907 |
Goodwin Multi-Sector Fixed Income | | | 10,470,349 |
Kayne Rising Dividends | | | 1,272 |
Lazard International Equity Select | | | 6,382 |
Lazard Small-Cap Value | | | 34,138 |
Lazard U.S. Multi-Cap | | | 29,286 |
Lord Abbett Large-Cap Value | | | 1,853 |
Lord Abbett Mid-Cap Value | | | 2,674 |
MFS Value . | | | 329,628 |
Northern Dow 30 | | | 299,421 |
Oakhurst Strategic Allocation | | | 6,056,008 |
Oakhurst Value Equity | | | 6,696,639 |
Seneca Mid-Cap Growth | | | 1,071,201 |
Seneca Strategic Theme | | | 544,422 |
17
THE PHOENIX EDGE SERIES FUND
NOTES TO FINANCIAL STATEMENTS (Continued)
December 31, 2003
Under current tax law, foreign currency and capital losses realized after October 31 may be deferred and treated as occurring on the first day of the following tax year. For the period ended December 31, 2003, the following series deferred and/or recognized post-October losses as follows:
| | | | | | |
| | | Deferred
| | Recognized
|
Aberdeen International | | $ | 1,072 | | $ | 7,050,819 |
AIM Mid-Cap Equity | | | — | | | 11,759 |
Alliance/Bernstein Enhanced Index | | | 125,036 | | | 975,620 |
Alliance/Bernstein Growth + Value | | | 6,532 | | | 82,093 |
Duff & Phelps Real Estate Securities | | | — | | | 20,836 |
Engemann Small & Mid-Cap Growth | | | 202,986 | | | 277,556 |
Goodwin Multi-Sector Short Term Bond | | | 14,000 | | | — |
Janus Flexible Income | | | 38,279 | | | 66,201 |
Kayne Rising Dividends | | | — | | | 9,406 |
Kayne Small-Cap Quality Value | | | 4,558 | | | — |
Lazard U.S. Multi-Cap | | | — | | | 8,434 |
Lord Abbett Bond-Debenture | | | 6,140 | | | — |
Lord Abbett Large-Cap Value | | | — | | | 2,380 |
Lord Abbett Mid-Cap Value | | | 42,552 | | | 10,110 |
MFS Investors Growth Stock | | | 142,496 | | | 1,290,411 |
MFS Investors Trust | | | 12,736 | | | 54,961 |
MFS Value | | | — | | | 147,026 |
Northern Dow 30 | | | — | | | 109,524 |
Northern Nasdaq-100 Index® | | | 506,649 | | | 1,111,085 |
Oakhurst Growth and Income | | | 178,131 | | | 4,643,917 |
Oakhurst Strategic Allocation | | | 102,568 | | | 5,839,939 |
Oakhurst Value Equity . | | | 236,249 | | | 1,409,807 |
Sanford Bernstein Global Value | | | 55,774 | | | 87,304 |
Seneca Mid-Cap Growth | | | — | | | 1,917,533 |
Seneca Strategic Theme | | | — | | | 2,226,969 |
|
As of December 31, 2003, the components of distributable earnings on a tax basis (excluding unrealized appreciation (depreciation) which is disclosed in the respective schedules of investments) were as follows: |
| | |
| | | Undistributed
Ordinary
Income
| | Undistributed
Long-Term
Capital Gains
|
Aberdeen International | | $ | 475,063 | | $ | — |
AIM Mid-Cap Equity | | | — | | | — |
Alliance/Bernstein Enhanced Index | | | 126,805 | | | — |
Alliance/Bernstein Growth + Value | | | — | | | — |
Duff & Phelps Real Estate Securities | | | 229,711 | | | 573,404 |
Engemann Capital Growth | | | 416,400 | | | — |
Engemann Small & Mid-Cap Growth | | | — | | | — |
Goodwin Money Market | | | — | | | — |
Goodwin Multi-Sector Fixed Income | | | 755,101 | | | — |
Goodwin Multi-Sector Short Term Bond | | | — | | | — |
Janus Flexible Income | | | 181,704 | | | 91,888 |
Kayne Rising Dividends | | | — | | | — |
Kayne Small-Cap Quality Value | | | 16,151 | | | — |
Lazard International Equity Select | | | — | | | — |
Lazard Small-Cap Value | | | 35,340 | | | 14,224 |
Lazard U.S. Multi-Cap . | | | 7,623 | | | 27,342 |
Lord Abbett Bond-Debenture | | | 2,347 | | | — |
Lord Abbett Large-Cap Value | | | 79,676 | | | 19,511 |
Lord Abbett Mid-Cap Value | | | — | | | — |
MFS Investors Growth Stock | | | — | | | — |
MFS Investors Trust | | | 4,428 | | | — |
MFS Value | | | — | | | — |
Northern Dow 30 | | | 45,147 | | | — |
Northern Nasdaq-100 Index® | | | — | | | — |
Oakhurst Growth and Income | | | 199,110 | | | — |
Oakhurst Strategic Allocation | | | 374,989 | | | — |
Oakhurst Value Equity | | | 82,342 | | | — |
Sanford Bernstein Global Value | | | — | | | — |
Sanford Bernstein Mid-Cap Value | | | 238,261 | | | 791,797 |
Sanford Bernstein Small-Cap Value | | | 284,700 | | | — |
Seneca Mid-Cap Growth | | | — | | | — |
Seneca Strategic Theme | | | — | | | — |
State Street Research Small-Cap Growth | | | 254,538 | | | 30,955 |
18
THE PHOENIX EDGE SERIES FUND
NOTES TO FINANCIAL STATEMENTS (Continued)
December 31, 2003
The differences between the book and tax basis components of distributable earnings relate principally to the timing of recognition of income and gains for federal income tax purposes. Short-term gains distributions reported in the Statements of Changes in Net Assets, if any, are reported as ordinary income for federal tax purposes.
Note 10—Reclassification of Capital Accounts
For financial reporting purposes, book basis capital accounts are adjusted to reflect the tax character of permanent book/tax differences. Permanent reclassifications can arise from differing treatment of certain income and gain transactions, nondeductible current year net operating losses, expiring capital loss carryovers and investments in passive foreign investment companies. The reclassifications have no impact on the net assets or net asset values of the series. As of December 31, 2003, the following series recorded reclassifications to increase (decrease) the accounts listed below:
| | | | | | | | | | | | |
| | | Undistributed
Net Investment
Income (Loss)
| | | Accumulated
Net Realized
Gain (Loss)
| | | Capital Paid In
on Shares of
Beneficial Interest
| |
Aberdeen International | | $ | 51,526 | | | $ | (2,671,451 | ) | | $ | 2,619,925 | |
AIM Mid-Cap Equity | | | 5,779 | | | | — | | | | (5,779 | ) |
Alliance/Bernstein Enhanced Index . | | | (14,606 | ) | | | 13,517 | | | | 1,089 | |
Alliance/Bernstein Growth + Value | | | (190 | ) | | | — | | | | 190 | |
Duff & Phelps Real Estate Securities | | | 16,240 | | | | (16,240 | ) | | | — | |
Engemann Small & Mid-Cap Growth | | | 154,046 | | | | — | | | | (154,046 | ) |
Goodwin Multi-Sector Fixed Income | | | 95,493 | | | | (30,875 | ) | | | (64,618 | ) |
Goodwin Multi-Sector Short Term Bond | | | 651 | | | | 4,341 | | | | (4,992 | ) |
Janus Flexible Income | | | (35,661 | ) | | | 36,496 | | | | (835 | ) |
Kayne Rising Dividends | | | (619 | ) | | | — | | | | 619 | |
Lazard International Equity Select | | | 7,849 | | | | — | | | | (7,849 | ) |
Lazard Small-Cap Value | | | (6,922 | ) | | | 2,190 | | | | 4,732 | |
Lazard U.S. Multi-Cap | | | (37 | ) | | | — | | | | 37 | |
Lord Abbett Bond-Debenture | | | 5,123 | | | | (3,768 | ) | | | (1,355 | ) |
Lord Abbett Mid-Cap Value | | | (987 | ) | | | 1,395 | | | | (408 | ) |
MFS Investors Growth Stock | | | 64,164 | | | | (6,179,876 | ) | | | 6,115,712 | |
MFS Investors Trust | | | (203 | ) | | | 203 | | | | — | |
MFS Value | | | (839 | ) | | | 463 | | | | 376 | |
Northern Nasdaq-100 Index® | | | 50,930 | | | | 1 | | | | (50,931 | ) |
Oakhurst Growth and Income | | | (10,951 | ) | | | 8,716 | | | | 2,235 | |
Oakhurst Strategic Allocation | | | 43,398 | | | | (43,398 | ) | | | — | |
Oakhurst Value Equity | | | (33,226 | ) | | | 37,567 | | | | (4,341 | ) |
Sanford Bernstein Global Value | | | 13,477 | | | | (11,159 | ) | | | (2,318 | ) |
Sanford Bernstein Mid-Cap Value | | | (95,765 | ) | | | 131,344 | | | | (35,579 | ) |
Sanford Bernstein Small-Cap Value | | | (50,772 | ) | | | 57,364 | | | | (6,592 | ) |
Seneca Mid-Cap Growth | | | 362,367 | | | | — | | | | (362,367 | ) |
Seneca Strategic Theme | | | 227,324 | | | | — | | | | (227,324 | ) |
State Street Research Small-Cap Growth | | | 51,539 | | | | (51,539 | ) | | | — | |
Note 11—Mergers
On February 7, 2003, Aberdeen International acquired all of the net assets of Aberdeen New Asia pursuant to an Agreement and Plan of Reorganization approved by Aberdeen New Asia shareholders on January 7, 2003. The acquisition was accomplished by a tax-free exchange of 1,885,115 shares of Aberdeen International valued at $14,391,123 for 1,913,078 shares of Aberdeen New Asia outstanding on February 7, 2003. Aberdeen New Asia’s net assets on that date of $14,391,123, including $618,515 of net unrealized depreciation were combined with those of Aberdeen International. The aggregate net assets of Aberdeen International immediately after the merger were $116,991,498.
On February 14, 2003, Janus Growth acquired all of the net assets of MFS Investors Growth Stock (“Growth Stock”) and Van Kampen Focus Equity (“Focus Equity”) pursuant to an Agreement and Plan of reorganization approved by Growth Stock and Focus Equity shareholders on February 14, 2003. The acquisition was accomplished by a tax-free exchange of 2,496,714 shares of Janus Growth outstanding on February 14, 2003 for 782,923 shares of Growth Stock valued at $5,807,615 and 1,169,922 shares of Focus Equity valued at $6,179,826. Growth Stock’s net assets of $5,807,615, including $135,964 of net unrealized depreciation and Focus Equity’s net assets of $6,179,826, including $380,781 of net unrealized depreciation were combined with those of Janus Growth. The aggregate net assets of Janus Growth immediately after the merger were $63,057,943. Immediately following the merger, Janus Growth was renamed MFS Investors Growth Stock. Immediately prior to the Special Meeting of Shareholders, Phoenix Variable Advisors, Inc. (“PVA”), as authorized pursuant to an exemptive order from the Securities and Exchange Commission, replaced Janus Capital Management LLC with MFS Investment Management (“MFS”) as subadvisor to the series. PVA and MFS have also agreed that they would serve as advisor and subadvisor, respectively, to the series for the same management fees as currently charged to the former Phoenix-MFS Investors Growth Stock Series. Accordingly, the annual expenses and expense cap reimbursements for the series are the same as those of the former Phoenix-MFS Investors Growth Stock Series. MFS is going to manage the series in a manner comparable with the former Phoenix-MFS Investors Growth Stock Series. As part of the reorganizations, the series has been renamed Phoenix-MFS Investors Growth Stock Series.
19
THE PHOENIX EDGE SERIES FUND
NOTES TO FINANCIAL STATEMENTS (Continued)
December 31, 2003
On March 22, 2002, Janus Growth (“Growth”) acquired all of the net assets of Janus Core Equity (“Core Equity”) pursuant to an Agreement and Plan of Reorganization approved by Core Equity shareholders on March 18, 2002. The acquisition was accomplished by a tax-free exchange of 3,141,426 shares of Growth valued at $22,032,065 for 2,467,046 shares of Core Equity outstanding on March 22, 2002. Core Equity’s net assets on that date of $22,032,065, including $1,473,521 of net unrealized appreciation were combined with those of Growth. The aggregate net assets of Growth immediately after the merger were $90,807,708.
On April 5, 2002, Engemann Capital Growth (“Capital Growth”) acquired all of the net assets of Engemann Nifty Fifty (“Nifty Fifty”) pursuant to an Agreement and Plan of Reorganization approved by Nifty Fifty shareholders on March 18, 2002. The acquisition was accomplished by a tax-free exchange of 2,949,789 shares of Capital Growth valued at $39,773,479 for 4,885,261 shares of Nifty Fifty outstanding on April 5, 2002. Nifty Fifty’s net assets on that date of $39,773,479, including $7,975,458 of net unrealized depreciation were combined with those of Capital Growth. The aggregate net assets of Capital Growth immediately after the merger were $862,917,192.
On April 5, 2002, Oakhurst Strategic Allocation (“Strategic Allocation”) acquired all of the net assets of Oakhurst Balanced (“Balanced”) pursuant to an Agreement and Plan of Reorganization approved by Balanced shareholders on March 18, 2002. The acquisition was accomplished by a tax-free exchange of 17,438,879 shares of Strategic Allocation valued at $236,890,944 for 19,697,824 shares of Balanced outstanding on April 5, 2002. Balanced’s net assets on that date of $236,890,944, including $25,034,492 of net unrealized appreciation were combined with those of Strategic Allocation. The aggregate net assets of Strategic Allocation immediately after the merger were $582,665,031.
Note 12—Manager of Managers
The Fund and PVA have received an exemptive order from the Securities and Exchange Commission (“SEC”) granting exemptions from certain provisions of the Investment Company Act of 1940, as amended, pursuant to which PVA will, subject to supervision and approval of the Fund’s Board of Trustees, be permitted to enter into and materially amend subadvisory agreements without such agreements being approved by the shareholders of the applicable series of the Fund. The Fund and PVA will therefore have the right to hire, terminate, or replace subadvisors without shareholder approval, including, without limitation, the replacement or reinstatement of any subadvisor with respect to which a subadvisory agreement has automatically terminated as a result of an assignment. PVA will continue to have the ultimate responsibility to oversee the subadvisors and recommend their hiring, termination and replacement.
Note 13—Mixed and Shared Funding
Shares of the Fund are not directly offered to the public. Shares of the Fund are currently offered through separate accounts to fund variable accumulation annuity contracts and variable universal life insurance policies issued by Phoenix Life Insurance Company (“Phoenix”), PHL Variable Insurance Company (“PHL Variable”), and Phoenix Life and Annuity Company (“PLAC”). Shares of the Fund may be offered to separate accounts of other insurance companies in the future.
The interests of variable annuity contract owners and variable life policy owners could diverge based on differences in federal and state regulatory requirements, tax laws, investment management or other unanticipated developments. The Fund’s Trustees currently do not foresee any such differences or disadvantages at this time. However, the Fund’s Trustees intend to monitor for any material conflicts and will determine what action, if any, should be taken in response to such conflicts. If such a conflict should occur, one or more separate accounts may be required to withdraw its investment in the Fund or shares of another fund may be substituted.
Note 14—Proposed Reorganization
On November 11, 2003, The Board of Trustees of The Fund approved a Plan of Reorganization to merge Janus Flexible Income into Goodwin Multi-Sector Fixed Income.
If the shareholders approve the Plan of Reorganization Janus Flexible Income will transfer all or substantially all of its assets and its liabilities to Goodwin Multi-Sector Fixed Income. In exchange, shareholders of Janus Flexible Income will receive a proportional number of shares in Goodwin Multi-Sector Fixed Income. The shareholders of Janus Flexible Income must approve the Plan of Reorganization before any transaction can take place. The next meeting of the shareholders of Janus Flexible Income will be held on March 17, 2004, at which time, this matter will be submitted for a shareholder vote.
Note 15—Other
Effective July 31, 2003, the name of the subadvisor of Northern Dow 30 and Northern Nasdaq-100 Index® changed to Northern Trust Investments N.A. from Northern Trust Investments, Inc.
On October 23, 2003, the Executive Committee of the Board of Trustees of the Fund approved replacement of the “Hollister” division of PIC with the “Oakhurst” division of PIC with respect to investment management of Oakhurst Value Equity. The Executive Committee also approved a name change for the Phoenix-Hollister Value Equity Series to the Phoenix-Oakhurst Value Equity Series. The Board of Trustees ratified the Executive Committee’s decision at the Board of Trustees meeting on November 11, 2003. This series’ investment objectives, principal investment strategies and principal risks will remain the same. The fees and expenses associated with the series will not be affected as a result of this change.
The Board of Trustees of the Fund has approved a name change for the Phoenix-Kayne Large-Cap Core Series to the Phoenix-Kayne Rising Dividends Series. This series’ investment objectives, principal investment strategies and principal risks will remain the same. The fees and expenses associated with the series will not be affected as a result of this change. This change was completed on November 3, 2003.
20
THE PHOENIX EDGE SERIES FUND
NOTES TO FINANCIAL STATEMENTS (Continued)
December 31, 2003
Effective December 31, 2003, the name of the subadvisor of Engemann Capital Growth and Engemann Small & Mid-Cap Growth changed to Engemann Asset Management from Roger Engemann & Associates, Inc.
Note 16—Proxy Voting Procedures
The advisers and subadvisers to each of the Phoenix-affiliated Funds vote proxies relating to portfolio securities in accordance with procedures that have been approved by the Boards of Trustees of the Fund. You may obtain a description of these procedures, free of charge, by calling toll-free 800-541-0171. This information is also available through the Securities and Exchange Commission’s website at http://www.sec.gov.
Tax Information Notice (Unaudited)
For the fiscal year ended December 31, 2003, the following series designated long-term capital gain dividends as follows:
| | | |
Duff & Phelps Real Estate Securities | | $ | 2,709,205 |
Janus Flexible Income | | | 506,397 |
Kayne Rising Dividends | | | 4,744 |
Lazard International Equity Select | | | 197 |
Lazard Small-Cap Value | | | 52,651 |
Lazard U.S. Multi-Cap | | | 71,565 |
Lord Abbett Bond-Debenture | | | 17,646 |
Lord Abbett Large-Cap Value | | | 19,511 |
Lord Abbett Mid-Cap Value | | | 2,585 |
Sanford Bernstein Mid-Cap Value | | | 2,821,361 |
State Street Research Small-Cap Growth | | | 74,219 |
21
REPORT OF INDEPENDENT AUDITORS
[GRAPHIC]
To the Board of Trustees and Shareholders of
The Phoenix Edge Series Fund
In our opinion, the accompanying statements of assets and liabilities, including the schedules of investments, and the related statements of operations and of changes in net assets and the financial highlights present fairly, in all material respects, the financial position of each of the series constituting The Phoenix Edge Series Fund (hereafter referred to as the “Fund”) at December 31, 2003, the results of each of their operations, the changes in each of their net assets, and the financial highlights for the periods indicated, in conformity with accounting principles generally accepted in the United States of America. These financial statements and financial highlights (hereafter referred to as “financial statements”) are the responsibility of the Fund’s management; our responsibility is to express an opinion on these financial statements based on our audits. We conducted our audits of these financial statements in accordance with auditing standards generally accepted in the United States of America, which require that we plan and perform the audit to obtain reasonable assurance about whether the financial statements are free of material misstatement. An audit includes examining, on a test basis, evidence supporting the amounts and disclosures in the financial statements, assessing the accounting principles used and significant estimates made by management, and evaluating the overall financial statement presentation. We believe that our audits, which included confirmation of securities at December 31, 2003, by correspondence with the custodian and brokers, provide a reasonable basis for our opinion.
|
|
/s/ PricewaterhouseCoopers LLP |
Boston, Massachusetts February 13, 2004 |
22
FUND MANAGEMENT
Information pertaining to the Trustees and officers of the Trust is set forth below. The statement of additional information (SAI) includes additional information about the Trustees and is available without charge, upon request, by calling (800) 541-0171.
| | | | | | | | |
Name, (DOB), Address and Position(s) with Trust
| | Length of Time Served
| | Principal Occupation(s) During Past 5 Years
| | Number of Portfolios in Fund Complex Overseen by Trustee
| | Other Trusteeships/ Directorships Held by Trustee
|
|
| DISINTERESTED TRUSTEES |
| | | | |
Frank M. Ellmer, CPA 704 SW Lake Charles Circle Port St. Lucie, FL 34986 4/11/40 Trustee | | Served since 1999 | | Retired; previously Partner, Ernst & Young LLP (1962-1999). | | 33 | | None |
| | | | |
John A. Fabian 497 Hensler Lane Oradell, NJ 07649 2/5/34 Trustee | | Served since 1999 | | Retired | | 33 | | None |
| | | | |
Roger A. Gelfenbien 37 Stonegate Drive Wethersfield, CT 06109 5/14/43 Trustee | | Served since 2000 | | Retired; previously Consultant, Accenture (1978-1999). | | 33 | | Director, Webster Bank (4/2003-present). Chairman Board of Trustees at The University of Connecticut (1997-2003). Director, USAllianz Variable Insurance Product Trust, 23 funds (1999-present). |
| | | | |
Eunice S. Groark 38 Saddle Ridge Drive Bloomfield, CT 06002 2/1/38 Trustee | | Served since 1999 | | Self-employed; previously Visiting Professor in Government, Wesleyan University (1997-1999); Columnist, Journal-Inquirer (1995-2000). | | 33 | | Director, Peoples’ Bank (1995-present). |
| | | | |
Frank E. Grzelecki 38 Gerrish Lane New Canaan, CT 06840 6/19/37 Trustee | | Served since 2000 | | Retired; previously Managing Director, Saugatuck Associates, Inc. (1999-2000); Vice Chairman, (1997-1998). | | 33 | | Director, Barnes Group, Inc. (1997-present). |
| | | | |
John R. Mallin McCarter & English, LLP City Place 1 185 Asylum St. Hartford, CT 06103 7/28/50 Trustee | | Served since 1999 | | Principal/Attorney McCarter & English, LLP (2003-present); Principal/Attorney, Cummings & Lockwood, LLC (1996-2003). | | 33 | | None |
23
FUND MANAGEMENT
| | | | | | | | |
Name, (DOB), Address and Position(s) with Trust
| | Length of Time Served
| | Principal Occupation(s) During Past 5 Years
| | Number of Portfolios in Fund Complex Overseen by Trustee
| | Other Trusteeships/ Directorships Held by Trustee
|
|
| INTERESTED TRUSTEES |
| | | | |
Philip R. McLoughlin 56 Prospect Street Hartford, CT 06115-0480 10/23/46 Trustee/Chairman/President | | Served since 2003 | | Consultant, Phoenix Investment Partners Ltd. (2002-present). Director, PXRE Corporation (Delaware) (1985-present), World Trust Fund (1991-present). Chairman (1997-2002), Director (1995-2002), Vice Chairman (1995-1997) and Chief Executive Officer (1995-2002), Phoenix Investment Partners, Ltd. Director and Executive Vice President, The Phoenix Companies, Inc. (2000-2002). Director (1994-2002) and Executive Vice President, Investments (1987-2002), Phoenix Life Insurance Company. Director (1983-2002) and Chairman (1995-2002), Phoenix Investment Counsel, Inc. Director (1982-2002) and President (1990-2000), Phoenix Equity Planning Corporation. Chairman and President, Phoenix/Zweig Advisers LLC (2001-2002). Director (2001-2002) and President (April 2002 - September 2002), Phoenix Investment Management Company. Director and Executive Vice President, Phoenix Life and Annuity Company (1996-2002). Director (1995-2000) and Executive Vice President (1994-2002), PHL Variable Insurance Company. Director, Phoenix National Trust Holding Company (2001-2002). Director (1985-2002) and Vice President (1986 - 2002), PM Holdings, Inc. Director, W.S. Griffith Associates, Inc. (1995-2002). Director (1992 - 2002) and President (1993 -1994), W.S. Griffith Securities, Inc. | | 78 | | N/A |
| | | | |
Michael J. Gilotti One American Row Hartford, CT 06102 5/25/47 Trustee/Executive Vice President | | Executive Vice President – Served since 1999; Trustee – Served since 2002 | | Various positions including Executive Vice President, Phoenix Life Insurance Company (1999-present). Director, Bank and Broker/Dealer Operations, Aetna (1994-1999). Director, Phoenix Variable Advisors, Inc. (2000-present). Director, Senior Vice President, Phoenix Life and Annuity Company (2002-present). Director, Senior Vice President, PHL Variable Insurance Company (2002-present). Director, Main Street Management Company (2000-present). | | 33 | | None |
24
FUND MANAGEMENT
| | | | | | | | |
Name, (DOB), Address and Position(s) with Trust
| | Length of Time Served
| | Principal Occupation(s) During Past 5 Years
| | Number of Portfolios in Fund Complex Overseen by Trustee
| | Other Trusteeships/ Directorships Held by Trustee
|
|
| OFFICER(S) WHO ARE NOT TRUSTEES |
| | | | |
Nancy G. Curtiss 56 Prospect Street Hartford, CT 06115 11/24/52 Vice President, Treasurer and Principal Accounting Officer | | Served since
1994 | | Treasurer, The Phoenix Edge Series Fund (1994 - present), Phoenix Funds (1994-present), Phoenix Duff & Phelps Institutional Mutual Funds (1996-present), Phoenix-Aberdeen Series Fund (1996-present) and Phoenix-Seneca Funds (2000-present). Vice President and Treasurer (1994-present), Phoenix Equity Planning Corporation. | | N/A | | N/A |
| | | | |
Doreen A. Bonner One American Row Hartford, CT 06102 2/21/56 Vice President and Compliance Officer | | Served since
1999 | | Vice President and Compliance Officer, The Phoenix Edge Series Fund (1999-present). Director (manager type), Individual Market Development, Phoenix Life Insurance Company (1997-present). Vice President and Compliance Officer, Phoenix Variable Advisors, Inc. (1999-present). Vice President and Compliance Officer, Phoenix Investment Counsel, Inc. (1/2003-present). | | N/A | | N/A |
| | | | |
Richard J. Wirth One American Row Hartford, CT 06102 11/14/58 Vice President, Secretary and Chief Legal Officer | | Served since
2001 | | Vice President, Secretary and Chief Legal Officer, The Phoenix Edge Series Fund (2001-present). Various positions including Vice President and Insurance and Investment Products Counsel, Phoenix Life Insurance Company (1993-present). | | N/A | | N/A |
25
THE PHOENIX EDGE SERIES FUND
101 Munson Street
Greenfield, Massachusetts 01301
| | |
Board of Trustees Frank M. Ellmer, CPA John A. Fabian Roger A. Gelfenbien Michael J. Gilotti Eunice S. Groark Frank E. Grzelecki John R. Mallin Philip R. McLoughlin Executive Officers Philip R. McLoughlin, Chairman and President Michael J. Gilotti, Executive Vice President Nancy G. Curtiss, Vice President, Treasurer, and Principal Accounting Officer Doreen A. Bonner, Vice President and Compliance Officer Richard J. Wirth, Vice President, Counsel and Secretary | | Investment Advisors Phoenix Investment Counsel, Inc. 56 Prospect Street Hartford, Connecticut 06115-0480 Duff & Phelps Investment Management Co. 55 East Monroe Street, Suite 3600 Chicago, Illinois 60603 Phoenix Variable Advisors, Inc. One American Row Hartford, Connecticut 06102-5056 Custodians JP Morgan Chase Bank 270 Park Avenue New York, New York 10017-2070 Brown Brothers Harriman & Co. 40 Water Street Boston, Massachusetts 02109 State Street Bank and Trust Company 225 Franklin Street Boston, Massachusetts 02110 Independent Auditors PricewaterhouseCoopers LLP 125 High Street Boston, Massachusetts 02110 |

(a) The Registrant has adopted a code of ethics that applies to its principal executive officers and principal financial and accounting officer.
(c) N/A
(d) N/A
(f) Pursuant to Item 10(a), the Registrant is attaching as an exhibit a copy of its code of ethics that applies to its principal executive officers financial and accounting officer.
FRANKLIN TEMPLETON INVESTMENTS
CODE OF ETHICS
AND
POLICY STATEMENT ON INSIDER TRADING
TABLE OF CONTENTS
Page 1
CODE OF ETHICS
Franklin Resources, Inc. and all of its subsidiaries, and the funds in the Franklin Templeton Group of Funds (the “Funds”) (collectively, “Franklin Templeton Investments”) will follow this Code of Ethics (the “Code”) and Policy Statement on Insider Trading (the “Insider Trading Policy”), including any supplemental memoranda. Additionally, the subsidiaries listed in Appendix C of this Code, together with Franklin Resources, Inc., the Funds, the Fund’s investment advisers and principal underwriter, have adopted the Code and Insider Trading Policy.
PART 1 - STATEMENT OF PRINCIPLES
Franklin Templeton Investments’ policy is that the interests of shareholders and clients are paramount and come before the interests of any director, officer or employee of Franklin Templeton Investments.1
Personal investing activities of ALL directors, officers and employees of Franklin Templeton Investments should be conducted in a manner to avoid actual OR potential conflicts of interest with Franklin Templeton Investments, Fund shareholders, and other clients of any Franklin Templeton adviser.
Directors, officers and employees of Franklin Templeton Investments shall use their positions with Franklin Templeton Investments and any investment opportunities they learn of because of their positions with Franklin Templeton Investments, in a manner consistent with their fiduciary duties for the benefit of Fund shareholders, and clients.
PART 2 - PURPOSES, AND CONSEQUENCES OF NON-COMPLIANCE
It is important that you read and understand this document, because its overall purpose is to help all of us comply with the law and to preserve and protect the outstanding reputation of Franklin Templeton Investments. This document was adopted to comply with Securities and Exchange Commission rules under the Investment Company Act of 1940 (“1940 Act”), the Investment Advisers Act of 1940 (“Advisers Act”), the Insider Trading and Securities Fraud Enforcement Act of 1988 (“ITSFEA”), industry practice and the recommendations contained in the ICI’s Report of the Advisory Group on Personal Investing. Any violation of the Code or Insider Trading Policy, including engaging in a prohibited transaction or failing to file required reports, may result in disciplinary action, and, when appropriate, termination of employment and/or referral to appropriate governmental agencies.
Page 2
PART 3 - COMPLIANCE REQUIREMENTS FOR ALL ACCESS PERSONS
| 3.1 | WHO IS COVERED BY THE CODE AND HOW DOES IT WORK? |
The principles contained in the Code must be observed by ALL directors, officers and employees2 of Franklin Templeton Investments. However, there are different categories of restrictions on personal investing activities. The category in which you have been placed generally depends on your job function, although unique circumstances may result in you being placed in a different category.
The Code covers the following categories of employees who are described below:
| (1) | ACCESS PERSONS: Access Persons are those employees who have “ACCESS TO INFORMATION” concerning recommendations made to a Fund or client with regard to the purchase or sale of a security. Examples of “ACCESS TO INFORMATION” would include having access to trading systems, portfolio accounting systems, research databases or settlement information. Access Persons would typically include employees, including Futures Associates, in the following departments: |
| | • | information services & technology; |
| | • | legal and legal compliance |
| | • | and anyone else designated by the Director, Global Compliance |
In addition, you are an Access Person if you are any of the following:
| | • | an officer or and directors of funds; |
| | • | an officer or director of an investment advisor or broker-dealer subsidiary in Franklin Templeton Investments; |
| | • | a person that controls those entities; and |
| | • | any Franklin Resources’ Proprietary Account (“Proprietary Account”)3 |
| (2) | PORTFOLIO PERSONS: Portfolio Persons are a subset of Access Persons and are those employees of Franklin Templeton Investments, who, in connection with his or her regular functions or duties, makes or participates in the decision to purchase or sell a security by a Fund in Franklin Templeton Investments, or any other client or if his or her functions relate to the making of any recommendations about those purchases or sales. Portfolio Persons include: |
| | • | employees serving in equivalent capacities (such as Futures Associates); |
| | • | employees supervising the activities of Portfolio Persons; and anyone else |
| | • | designated by the Director, Global Compliance |
| (3) | NON-ACCESS PERSONS: If you are an employee of Franklin Templeton Investments AND you do not fit into any of the above categories, you are a Non-Access Person. Because you do not normally receive confidential information about Fund portfolios, you are subject only to the prohibited transaction provisions described in 3.4 of this Code and the Franklin Resources, Inc.’s Standards of Business Conduct contained in the Employee Handbook. |
Page 3
Please contact the Legal Compliance Department if you are unsure as to what category you fall in or whether you should be considered to be an Access Person or Portfolio Person.
The Code works by prohibiting some transactions and requiring pre-clearance and reporting of most others. NON-ACCESS PERSONS do not have to pre-clear their security transactions, and, in most cases, do not have to report their transactions. “INDEPENDENT DIRECTORS” need not pre-clear or report any securities transaction unless you knew, or should have known that, during the 15-day period before or after the transaction, the security was purchased or sold or considered for purchase or sale by a Fund or Franklin Resources for a Fund. (SEE Section 5.2.B below.) HOWEVER, PERSONAL INVESTING ACTIVITIES OF ALL EMPLOYEES AND INDEPENDENT DIRECTORS ARE TO BE CONDUCTED IN COMPLIANCE WITH THE PROHIBITED TRANSACTIONS PROVISIONS CONTAINED IN 3.4 BELOW. If you have any questions regarding your personal securities activity, contact the Legal Compliance Department.
| 3.2 | WHAT ACCOUNTS AND TRANSACTIONS ARE COVERED? |
The Code covers all of your personal securities accounts and transactions, as well as transactions by any of Franklin Resource’s Proprietary Accounts. It also covers all securities and accounts in which you have “beneficial ownership.”4 A transaction by or for the account of your spouse, or any other family member living in your home is considered to be the same as a transaction by you. Also, a transaction for any account in which you have any economic interest (other than the account of an unrelated client for which advisory fees are received) AND have or share investment control is generally considered the same as a transaction by you. For example, if you invest in a corporation that invests in securities and you have or share control over its investments, that corporation’s securities transactions are considered yours.
However, you are not deemed to have a pecuniary interest in any securities held by a partnership, corporation, trust or similar entity unless you control, or share control of such entity, or have, or share control over its investments. For example, securities transactions of a trust or foundation in which you do not have an economic interest (i.e., you are not the trustor or beneficiary) but of which you are a trustee are not considered yours unless you have voting or investment control of its assets. Accordingly, each time the words “you” or “your” are used in this document, they apply not only to your personal transactions and accounts, but also to all transactions and accounts in which you have any direct or indirect beneficial interest. If it is not clear whether a particular account or transaction is covered, ask a Preclearance Officer for guidance.
| 3.3 | WHAT SECURITIES ARE EXEMPT FROM THE CODE OF ETHICS? |
You do not need to pre-clear OR report transactions of the following securities:
| | (1) | securities that are direct obligations of the U. S. Government (i.e., issued or guaranteed by the U.S. Government, such as Treasury bills, notes and bonds, including U.S. Savings Bonds and derivatives thereof); |
| | (2) | high quality short-term instruments, including but not limited to bankers’ acceptances, bank certificates of deposit, commercial paper and repurchase agreements; |
| | (3) | shares of registered open-end investment companies (“mutual funds”); and |
Page 4
| | (4) | commodity futures (excluding futures on individual securities), currencies, currency forwards and derivatives thereof. |
Such transactions are also exempt from: (i) the prohibited transaction provisions contained in Part 3.4 such as front-running; (ii) the additional compliance requirements applicable to portfolio persons contained in Part 4; and (iii) the applicable reporting requirements contained in Part 5.
| 3.4 | PROHIBITED TRANSACTIONS FOR ALL ACCESS PERSONS |
Certain transactions described below have been determined by the courts and the SEC to be prohibited by law. The Code reiterates that these types of transactions are a violation of the Statement of Principals and are prohibited. Preclearance, which is a cornerstone of our compliance efforts, cannot detect transactions which are dependent upon INTENT, or which by their nature, occur before any order has been placed for a fund or client. A Preclearance Officer, who is there to assist you with compliance with the Code, CANNOT guarantee any transaction or transactions comply with the Code or the law. The fact that your transaction receives preclearance, shows evidence of good faith, but depending upon all the facts, may not provide a full and complete defense to any accusation of violation of the Code or of the law. For example, if you executed a transaction for which you received approval, or if the transaction was exempt from preclearance (e.g., a transaction for 100 shares or less), would not preclude a subsequent finding that front-running or scalping occurred because such activity are dependent upon your intent. Intent cannot be detected during preclearance, but only after a review of all the facts.
In the final analysis, compliance remains the responsibility of EACH individual effecting personal securities transactions.
| | B. | FRONT-RUNNING: TRADING AHEAD OF A FUND OR CLIENT |
You cannot front-run any trade of a Fund or client. The term “front-run” means knowingly trading before a contemplated transaction by a Fund or client of any Franklin Templeton adviser, whether or not your trade and the Fund’s or client’s trade take place in the same market. Thus, you may not:
| | (1) | purchase a security if you intend, or know of Franklin Templeton Investments’ intention, to purchase that security or a related security on behalf of a Fund or client, or |
| | (2) | sell a security if you intend, or know of Franklin Templeton Investments’ intention, to sell that security or a related security on behalf of a Fund or client. |
You cannot purchase a security (or its economic equivalent) with the intention of recommending that the security be purchased for a Fund, or client, or sell short a security (or its economic equivalent) with the intention of recommending that the security be sold for a Fund or client. Scalping is prohibited whether or not you realize a profit from such transaction.
| | D. | TRADING PARALLEL TO A FUND OR CLIENT |
You cannot buy a security if you know that the same or a related security is being bought contemporaneously by a Fund or client, or sell a security if you know that the same or a related security is being sold contemporaneously by a Fund or client.
Page 5
| | E. | TRADING AGAINST A FUND OR CLIENT |
You cannot:
| | (1) | buy a security if you know that a Fund or client is selling the same or a related security, or has sold the security, until seven (7) calendar days after the Fund’s or client’s order has either been executed or withdrawn, or |
| | (2) | sell a security if you know that a Fund or client is buying the same or a related security, or has bought the security until seven (7) calendar days after the Fund’s or client’s order has either been executed or withdrawn. |
Refer to Section I.A., “Pre-Clearance Standards,” of Appendix A of the Code for more details regarding the preclearance of personal securities transactions.
| | F. | USING PROPRIETARY INFORMATION FOR PERSONAL TRANSACTIONS |
You cannot buy or sell a security based on Proprietary Information 5 without disclosing the information and receiving written authorization. If you wish to purchase or sell a security about which you obtained such information, you must report all of the information you obtained regarding the security to the Appropriate Analyst(s)6, or to the Director, Global Compliance for dissemination to the Appropriate Analyst(s).
You will be permitted to purchase or sell such security if the Appropriate Analyst(s) confirms to the Preclearance Desk that there is no intention to engage in a transaction regarding the security within seven (7) calendar days on behalf of an Associated Client7 and you subsequently preclear such security in accordance with Part 6 below.
| | G. | CERTAIN TRANSACTIONS IN SECURITIES OF FRANKLIN RESOURCES, INC., AND AFFILIATED CLOSED-END FUNDS, AND REAL ESTATE INVESTMENT TRUST |
If you are an employee of Franklin Resources, Inc. or any of its affiliates, including Franklin Templeton Investments, you cannot effect a short sale of the securities, including “short sales against the box” of Franklin Resources, Inc., or any of the Franklin or Templeton closed-end funds, or any other security issued by Franklin Resources, Inc. or its affiliates. This prohibition would also apply to effecting economically equivalent transactions, including, but not limited to purchasing and selling call or put options and “swap” transactions or other derivatives. Officers and directors of Franklin Templeton Investments who may be covered by Section 16 of the Securities Exchange Act of 1934, are reminded that their obligations under that section are in addition to their obligations under this Code.
As an employee of Franklin Templeton Investments, you may not serve as a director, trustee, or in a similar capacity for any public or private company (excluding not-for-profit companies, charitable groups, and eleemosynary organizations) unless you receive approval from Franklin Resources, Inc. Presidents (excluding the vote of any member who is seeking such approval for himself) and it is determined that your service is consistent with the interests of the clients of Franklin Templeton Investments. You must notify the Legal Compliance Department in writing of your interest in serving as a director, which includes the justification for such directorship. Legal Compliance will process the request through Franklin Resources, Inc. Presidents.
Legal Compliance will advise you of Franklin Resources, Inc. Presidents decision. If approved, the Legal Compliance Department will furnish procedures applicable to serving as an outside director to you.
Page 6
PART 4 - ADDITIONAL COMPLIANCE REQUIREMENTS APPLICABLE TO PORTFOLIO PERSONS8
| 4.1 | REQUIREMENT TO DISCLOSE INTEREST AND METHOD OF DISCLOSURE |
As a Portfolio Person, you must promptly disclose your direct or indirect beneficial interest in a security whenever you learn that the security is under consideration for purchase or sale by an Associated Client in the Franklin Templeton Group and you;
| | (1) | Have or share investment control of the Associated Client; |
| | (2) | Make any recommendation or participate in the determination of which recommendation shall be made on behalf of the Associated Client; or |
| | (3) | Have functions or duties that relate to the determination of which recommendation shall be made to the Associated Client. |
In such instances, you must initially disclose that beneficial interest orally to the primary portfolio manager (or other Appropriate Analyst) of the Associated Client(s) considering the security, the Director of Research and Trading or the Director, Global Compliance. Following that oral disclosure, you must send a written acknowledgment of that interest on Schedule E (or on a form containing substantially similar information) to the primary portfolio manager (or other Appropriate Analyst), with a copy to the Legal Compliance Department.
| 4.2 | SHORT SALES OF SECURITIES |
You cannot sell short ANY security held by your Associated Clients, including “short sales against the box”. Additionally, Portfolio Persons associated with the Templeton Group of Funds and clients cannot sell short any security on the Templeton “Bargain List”. This prohibition would also apply to effecting economically equivalent transactions, including, but not limited to, sales of uncovered call options, purchases of put options while not owning the underlying security and short sales of bonds that are convertible into equity positions.
Portfolio Persons cannot profit from the purchase and sale or sale and purchase within sixty calendar days of any security, including derivatives. Portfolio Persons are responsible for transactions that may occur in margin and option accounts and all such transactions must comply with this restriction.8 This restriction does NOT apply to:
| | (1) | trading within a shorter period if you do not realize a profit and if you do not violate any other provisions of this Code; AND |
| | (2) | profiting on the purchase and sale or sale and purchase within sixty calendar days of the following securities: |
| | ¨ | securities that are direct obligations of the U.S. Government, such as Treasury bills, notes and bonds, and U.S. Savings Bonds and derivatives thereof; |
| | ¨ | high quality short-term instruments (“money market instruments”) including but not limited to (i) bankers’ acceptances, (ii) U.S. bank certificates of deposit; (iii) commercial paper; and (iv) repurchase agreements; |
Page 7
| | ¨ | shares of registered open-end investment companies including Exchange Traded Funds (EFT) and Holding Company Depository Receipts (Hldrs); |
| | ¨ | commodity futures, currencies, currency forwards and derivatives thereof. |
Calculation of profits during the 60-calendar day holding period generally will be based on “last-in, first-out” (“LIFO”). Portfolio Persons may elect to calculate their 60 calendar day profits on either a LIFO or FIFO (“first-in, first-out”) basis when there has not been any activity in such security by their Associated Clients during the previous 60 calendar days.
| 4.4 | SECURITIES SOLD IN A PUBLIC OFFERING |
Portfolio Persons cannot buy securities in any initial public offering, or a secondary offering by an issuer, INCLUDING initial public offerings of securities made by closed-end funds and real estate investment trusts advised by Franklin Templeton Investments. Purchases of open-end mutual funds are excluded from this prohibition.
| 4.5 | INTERESTS IN PARTNERSHIPS AND SECURITIES ISSUED IN PRIVATE PLACEMENTS |
Portfolio Persons cannot acquire limited partnership interests or other securities in private placements unless they:
| | (1) | complete the Private Placement Checklist (Schedule H); |
| | (2) | provide supporting documentation (e.g., a copy of the offering memorandum); and |
| | (3) | obtain approval of the appropriate Chief Investment Officer; and |
| | (4) | submit all documents to the Legal Compliance Department |
Approval will only be granted after the Director of Global Compliance consults with an executive officer of Franklin Resources, Inc.
PART 5 - REPORTING REQUIREMENTS FOR ALL ACCESS PERSONS
| 5.1 | REPORTING OF BENEFICIAL OWNERSHIP AND SECURITIES TRANSACTIONS |
Compliance with the following personal securities transaction reporting procedures is essential to enable us to meet our responsibilities to Funds and other clients and to comply with regulatory requirements. You are expected to comply with both the letter and spirit of these requirements, including completing and filing all reports required under the Code in a timely manner.
| 5.2 | INITIAL HOLDINGS AND BROKERAGE ACCOUNT REPORTS |
A. ALL ACCESS PERSONS (EXCEPT INDEPENDENT DIRECTORS)
Every employee (new or transfer) of Franklin Templeton Investments who becomes an Access Person, must file:
| | (1) | An Acknowledgement Form; |
| | (2) | Schedule C: Initial, Annual & Updated Disclosure of Securities Holdings; and |
| | (3) | Schedule F: Initial, Annual & Updated Disclosure of Securities Accounts |
The Acknowledgement Form, Schedule C and Schedule F MUST be completed and returned to the Legal Compliance Department within 10 CALENDAR DAYS of the date the employee becomes an access person.
Page 8
| 5.3 | QUARTERLY TRANSACTION REPORTS |
| | A. | ALL ACCESS PERSONS (EXCEPT INDEPENDENT DIRECTORS) |
You MUST report ALL securities transactions by; (i) providing the Legal Compliance Department with copies of ALL broker’s confirmations and statements within 10 calendar days after the end of the calendar quarter (which may be sent under separate cover by the broker) showing ALL transactions and holdings in securities AND (ii) certifying by January 30th of each year that you have disclosed all such brokerage accounts on Schedule F to the Legal Compliance Department. The brokerage statements and confirmations must include all transactions in securities in which you have, or by reason of the transaction acquire any direct or indirect beneficial ownership, including transactions in a discretionary account and transactions for any account in which you have any economic interest AND have or share investment control. Also, if you acquire securities by any other method which is not being reported to the Legal Compliance Department by a duplicate confirmation statement at or near the time of the acquisition, you must report that acquisition to the Legal Compliance Department on Schedule B within 10 calendar days after you are notified of the acquisition. Such acquisitions include, among other things, securities acquired by gift, inheritance, vesting,9 stock splits, merger or reorganization of the issuer of the security.
You must file these documents with the Legal Compliance Department not later than 10 calendar days after the end of each quarter, but you need not show or report transactions for any account over which you had no direct or indirect influence or control.10 Failure to timely report transactions is a violation of Rule 17j-1 as well as the Code, and may be reported to the Fund’s Board of Directors and may also result, among other things, in denial of future personal security transaction requests.
If you are a director of a Fund within Franklin Templeton Investments but you are not an “interested person” of the Fund, you are not required to file transaction reports unless you knew or should have known that, during the 15-day period before or after a transaction, the security was purchased or sold, or considered for purchase or sale, by a Fund or by Franklin Templeton Investments on behalf of a Fund.
| 5.4 | ANNUAL REPORTS - ALL ACCESS PERSONS |
| | A. | SECURITIES ACCOUNTS REPORTS (EXCEPT INDEPENDENT DIRECTORS) |
As an access person, you must file a report of all personal securities accounts on Schedule F, with the Legal Compliance Department, annually by January 30th. You must report the name and description of each securities account in which you have a direct or indirect beneficial interest, including securities accounts of a spouse and minor children. You must also report any account in which you have any economic interest AND have or share investment control (e.g., trusts, foundations, etc.) other than an account for a Fund in, or a client of, Franklin Templeton Investments.
| | B. | SECURITIES HOLDINGS REPORTS (EXCEPT INDEPENDENT DIRECTORS) |
You must file a report of personal securities holdings on Schedule C, with the Legal Compliance Department, by January 30th of each year. This report should include ALL of your securities holdings, including any security acquired by a transaction, gift, inheritance, vesting, merger or reorganization of the issuer of the security, in which you have any direct or indirect beneficial ownership, including securities holdings in a discretionary account and for any account in which you have any economic interest AND have or share investment control. Your securities holding information must be current as of a date no more than 30 days before the report is submitted. You may attach copies of
Page 9
year-end brokerage statements to the Schedule C in lieu of listing each security position on the schedule.
| | C. | CERTIFICATION OF COMPLIANCE WITH THE CODE OF ETHICS (INCLUDING INDEPENDENT DIRECTORS) |
All access persons, including independent directors, will be asked to certify that they will comply with FRANKLIN TEMPLETON INVESTMENTS’ CODE OF ETHICS AND POLICY STATEMENT ON INSIDER TRADING by filing the Acknowledgment Form with the Legal Compliance Department within 10 business days of receipt of the Code. Thereafter, you will be asked to certify that you have complied with the Code during the preceding year by filing a similar Acknowledgment Form by January 30 of each year.
| 5.5 | BROKERAGE ACCOUNTS AND CONFIRMATIONS OF SECURITIES TRANSACTIONS (EXCEPT INDEPENDENT DIRECTORS) |
If you are an access person, in Franklin Templeton Investments, before or at a time contemporaneous with opening a brokerage account with a registered broker-dealer, or a bank, or placing an initial order for the purchase or sale of securities with that broker-dealer or bank, you must:
| | (1) | notify the Legal Compliance Department, in writing, by completing Schedule D or by providing substantially similar information; and |
| | (2) | notify the institution with which the account is opened, in writing, of your association with Franklin Templeton Investments. |
The Compliance Department will request the institution in writing to send to it duplicate copies of confirmations and statements for all transactions effected in the account simultaneously with their mailing to you.
If you have an existing account on the effective date of this Code or upon becoming an access person, you must comply within 10 days with conditions (1) and (2) above.
PART 6 - PRE-CLEARANCE REQUIREMENTS
| 6.1 | PRIOR APPROVAL OF SECURITIES TRANSACTIONS |
Unless you are covered by Paragraph C or D below, you cannot buy or sell any security, without first contacting a Preclearance Officer by fax, phone, or e-mail and obtaining his or her approval. Approval is good until the close of the business day following the day clearance is granted but may be extended in special circumstances, shortened or rescinded, as explained in Appendix A.
| | B. | SECURITIES NOT REQUIRING PRECLEARANCE |
The securities enumerated below do not require preclearance under the Code. However, all other provisions of the Code apply, including, but not limited to: (i) the prohibited transaction provisions contained in Part 3.4 such as front-running; (ii) the additional compliance requirements applicable to portfolio persons contained in Part 4, (iii) the applicable reporting requirements contained in Part 5; and (iv) insider trading prohibitions. You need NOT pre-clear transactions in the following securities:
| | (1) | FRANKLIN RESOURCES, INC., AND ITS AFFILIATES. Purchases and sales of securities of Franklin Resources, Inc., closed-end funds of the Franklin Templeton Group, or real estate investment trusts advised by Franklin Properties Inc., as these securities cannot be purchased on behalf of our advisory clients.11 |
Page 10
| | • | Transactions of 500 shares or less of any security, regardless of where it is traded in any 30 day period; or |
| | • | Transactions of 1000 shares or less of the top 50 securities by volume during the previous calendar quarter on the NYSE or NASDAQ NMS (does not include Small Cap or OTC) in any 30 day period. |
| | • | Transactions in municipal bonds with a face value of $100,000 or less. |
HOWEVER, YOU MAY NOT EXECUTE ANY TRANSACTION, REGARDLESS OF QUANTITY, IF YOU LEARN THAT THE FUNDS ARE ACTIVE IN THE SECURITY. IT WILL BE PRESUMED THAT YOU HAVE KNOWLEDGE OF FUND ACTIVITY IN THE SECURITY IF, AMONG OTHER THINGS, YOU ARE DENIED APPROVAL TO GO FORWARD WITH A TRANSACTION REQUEST.
| | (3) | DIVIDEND REINVESTMENT PLANS: Transactions made pursuant to dividend reinvestment plans (“DRIPs”) do not require preclearance regardless of quantity or Fund activity. |
| | (4) | GOVERNMENT OBLIGATIONS. Transactions in securities issued or guaranteed by the governments of the United States, Canada, the United Kingdom, France, Germany, Switzerland, Italy and Japan, or their agencies or instrumentalities, or derivatives thereof. |
| | (5) | PAYROLL DEDUCTION PLANS. Securities purchased by an employee’s spouse pursuant to a payroll deduction program, provided the access person has previously notified the Compliance Department in writing that the spouse will be participating in the payroll deduction program. |
| | (6) | EMPLOYER STOCK OPTION PROGRAMS. Transactions involving the exercise and/or purchase by an access person or an access person’s spouse of securities pursuant to a program sponsored by a corporation employing the access person or spouse. |
| | (7) | PRO RATA DISTRIBUTIONS. Purchases effected by the exercise of rights issued pro rata to all holders of a class of securities or the sale of rights so received. |
| | (8) | TENDER OFFERS. Transactions in securities pursuant to a bona fide tender offer made for any and all such securities to all similarly situated shareholders in conjunction with mergers, acquisitions, reorganizations and/or similar corporate actions. However, tenders pursuant to offers for less than all outstanding securities of a class of securities of an issuer must be precleared. |
| | (9) | NOT ELIGIBLE FOR FUNDS AND CLIENTS. Transactions in any securities that are prohibited investments for all Funds and clients advised by the entity employing the access person. |
| | (10) | NO INVESTMENT CONTROL. Transactions effected for an account or entity over which you do not have or share investment control (i.e., an account where someone else exercises complete investment control). |
| | (11) | NO BENEFICIAL OWNERSHIP. Transactions in which you do not acquire or dispose of direct or indirect beneficial ownership (i.e., an account where in you have no financial interest). |
| | (12) | ETFS AND HOLDRS. Transactions in Exchange-Traded Funds and Holding Company Depository Receipts (Holdrs). |
Page 11
Although an access person’s securities transaction may be exempt from preclearing, such transactions must comply with the prohibited transaction provisions of Section 3.4 above. Additionally, you may not trade any securities as to which you have “inside information” (see attached FRANKLIN TEMPLETON INVESTMENTS’ POLICY STATEMENT ON INSIDER TRADING). If you have any questions, contact a Preclearance Officer before engaging in the transaction. If you have any doubt whether you have or might acquire direct or indirect beneficial ownership or have or share investment control over an account or entity in a particular transaction, or whether a transaction involves a security covered by the Code, you should consult with a Preclearance Officer before engaging in the transaction.
You need not pre-clear transactions in any discretionary account for which a registered broker-dealer, a registered investment adviser, or other investment manager acting in a similar fiduciary capacity, which is not affiliated with Franklin Templeton Investments, exercises sole investment discretion, if the following conditions are met:12
| | (1) | The terms of each account relationship (“Agreement”) must be in writing and filed with a Preclearance Officer prior to any transactions. |
| | (2) | Any amendment to each Agreement must be filed with a Preclearance Officer prior to its effective date. |
| | (3) | The Portfolio Person certifies to the Compliance Department at the time such account relationship commences, and annually thereafter, as contained in Schedule G of the Code that such Portfolio Person does not have direct or indirect influence or control over the account, other than the right to terminate the account. |
| | (4) | Additionally, any discretionary account that you open or maintain with a registered broker-dealer, a registered investment adviser, or other investment manager acting in a similar fiduciary capacity must provide duplicate copies of confirmations and statements for all transactions effected in the account simultaneously with their delivery to you., If your discretionary account acquires securities which are not reported to a Preclearance Officer by a duplicate confirmation, such transaction must be reported to a Preclearance Officer on Schedule B within 10 days after you are notified of the acquisition.13 |
However, if you make ANY request that the discretionary account manager enter into or refrain from a specific transaction or class of transactions, you must first consult with a Preclearance Officer and obtain approval prior to making such request.
| | D. | DIRECTORS WHO ARE NOT ADVISORY PERSONS OR ADVISORY REPRESENTATIVES |
You need not pre-clear any securities if:
| | (1) | You are a director of a Fund in Franklin Templeton Investments and a director of the fund’s advisor; |
| | (2) | You are not an “advisory person”14 of a Fund in Franklin Templeton Investments; and |
| | (3) | You are not an employee of any Fund, |
Page 12
or
| | (1) | You are a director of a Fund in the Franklin Templeton Group; |
| | (2) | You are not an “advisory representative”15 of Franklin Resources or any subsidiary; and |
| | (3) | You are not an employee of any Fund, |
unless you know or should know that, during the 15-day period before the transaction, the security was purchased or sold, or considered for purchase or sale, by a Fund or by Franklin Resources on behalf of a Fund or other client.
Directors, other than independent Directors, qualifying under this paragraph are required to comply with all applicable provisions of the Code including reporting their initial holdings and brokerage accounts in accordance with 5.2, personal securities transactions and accounts in accordance with 5.3 and 5.5, and annual reports in accordance with 5.4 of the Code.
| | E. | LIMITED EXCEPTION FOR CERTAIN PROPRIETARY ACCOUNTS |
Franklin Templeton Investments may sponsor private partnerships and other pooled investment accounts (“affiliated accounts”) intended for distribution to unaffiliated persons. At the outset of operations of such affiliated accounts, Franklin Templeton Investments will likely have a significant ownership interest, thereby causing the affiliated account to be a Proprietary Account. Though considered a Proprietary Account for all other purposes of this Code, an affiliated account need not pre-clear any securities transaction during the first full 12 month period after its commencement of operations.
PART 7 - PENALTIES FOR VIOLATIONS OF THE CODE
The Code is designed to assure compliance with applicable law and to maintain shareholder confidence in Franklin Templeton Investments.
In adopting this Code, it is the intention of the Boards of Directors/Trustees, to attempt to achieve 100% compliance with all requirements of the Code - but it is recognized that this may not be possible. Incidental failures to comply with the Code are not necessarily a violation of the law or the Franklin Templeton Investment’s Statement of Principles. Such isolated or inadvertent violations of the Code not resulting in a violation of law or the Statement of Principles will be referred to the Director, Global Compliance and/or management personnel, and disciplinary action commensurate with the violation, if warranted, will be imposed. Additionally, if you violate any of the enumerated prohibited transactions contained in Parts 3 and 4 of the Code, you will be expected to give up ANY profits realized from these transactions to Franklin Resources for the benefit of the affected Funds or other clients. If Franklin Resources cannot determine which Fund(s) or client(s) were affected, the proceeds will be donated to a charity chosen by Franklin Resources. Please refer to the following page for guidance of the types of sanctions that would likely be imposed for isolated or inadvertent violations of the Code.
However, failure to disgorge profits when requested or a pattern of violations that individually do not violate the law or Statement of Principles, but which taken together demonstrate a lack of respect for the Code of Ethics, may result in more significant disciplinary action including termination of employment. A violation of the Code resulting in a violation of the law will be severely sanctioned, with disciplinary action including, but not limited to, referral of the matter to the board of directors of the affected Fund, termination of employment or referral of the matter to the appropriate regulatory agency for civil and/or criminal investigation.
Page 13
CODE OF ETHICS SANCTION GUIDELINES
| | |
VIOLATION
| | SANCTION IMPOSED
|
| |
• Failure to preclear but otherwise would have been approved (i.e., no conflict with the fund’s transactions). | | Reminder Memo |
| |
• Failure to preclear but otherwise would have been approved (i.e., no conflict with the fund’s transactions) twice within 12 calendar months - | | 30 Day Personal Securities Trading Suspension |
| |
• Failure to preclear and the transaction would have been disapproved: | | |
| |
• Failure to preclear but otherwise would have been approved (i.e., no conflict with the fund’s transactions) three times or more within 12 calendar months | | Greater Than 30 Day Personal Securities Trading Suspension (e.g., 60 or 90 Days) |
| |
• Failure to preclear and the transaction would have been disapproved twice or more within 12 calendar months | | |
| |
• Profiting from short-swing trades (profiting on purchase & sale/sale & purchase within 60 days | | Profits are donated to The United Way (or charity of employee’s choice) |
| |
• Repeated violations of the Code of after Ethics even if each individual violation might be considered deminimis | | Fines levied discussion with the General Counsel and and appropriate CIO. |
PART 8 - A REMINDER ABOUT THE FRANKLIN TEMPLETON INVESTMENTS INSIDER TRADING POLICY
The Code of Ethics is primarily concerned with transactions in securities held or to be acquired by any of the Funds or Franklin Resources’ clients, regardless of whether those transactions are based on inside information or actually harm a Fund or a client.
The Insider Trading Policy (attached to this document) deals with the problem of insider trading in securities that could result in harm to a Fund, a client, or members of the public, and applies to all directors, officers and employees of any entity in the Franklin Templeton Investments. Although the requirements of the Code and the Insider Trading Policy are similar, you must comply with both.
PART 9 - FOREIGN COUNTRY SUPPLEMENTS (CANADA)
The Investment Funds Institute of Canada (“IFIC”) has implemented a new Model Code of Ethics for Personal Investing (the “IFIC Code”) to be adopted by all IFIC members. Certain provisions in the IFIC Code differ from the provisions of Franklin Templeton Investments Code of Ethics (the “FT Code”). This Supplementary Statement of Requirements for Canadian Employees (the “Canadian Supplement”) describes certain further specific requirements that govern the
Page 14
activities of Franklin Templeton Investments Corp. (“FTIC”). It is important to note that the Canadian Supplement does not replace the FT Code but adds certain restrictions on trading activities, which must be read in conjunction with the Code.
All capitalized terms in this Canadian Supplement, unless defined in this Canadian Supplement, have the meaning set forth in the FT Code.
INITIAL PUBLIC AND SECONDARY OFFERINGS
Access Persons cannot buy securities in any initial public offering, or a secondary offering by an issuer. Public offerings of securities made by Franklin Templeton Investments, including open-end and closed-end mutual funds, real estate investment trusts and securities of Franklin Resources, Inc, are excluded from this prohibition.
NOTE: THE FT CODE PRESENTLY PROHIBITS PORTFOLIO PERSONS FROM BUYING SECURITIES IN ANY INITIAL PUBLIC OFFERING, OR A SECONDARY OFFERING BY AN ISSUER (SEE SECTION 4.5 OF THE FT CODE). THIS PROVISION EXTENDS SECTION 4.5 OF THE FT CODE TO ALL ACCESS PERSONS.
INTERESTS IN PARTNERSHIPS AND SECURITIES ISSUED IN PRIVATE PLACEMENTS
Access Persons and Portfolio Persons cannot acquire limited partnership interests or other securities in private placements unless they obtain approval of the Compliance Officer after he or she consults with an executive officer of Franklin Resources, Inc. Purchases of limited partnership interests or other securities in private placements will not be approved, unless in addition to the requirements for the approval of other trades and such other requirements as the executive officer of Franklin Resources, Inc. may require, the Compliance Officer is satisfied that the issuer is a “private company” as defined in the SECURITIES ACT (Ontario) and the Access Person has no reason to believe that the issuer will make a public offering of its securities in the foreseeable future.
NOTE: THE FT CODE PRESENTLY PROHIBITS AS A GENERAL RULE PORTFOLIO PERSONS FROM BUYING LIMITED PARTNERSHIP INTERESTS OR OTHER SECURITIES IN PRIVATE PLACEMENTS (SEE SECTION 4.6 OF THE FT CODE). THIS SECTION EXTENDS THE AMBIT OF THE PROHIBITION TO ACCESS PERSONS AND LIMITS THE EXCEPTION TO THE GENERAL RULE CONTAINED IN SECTION 4.6 OF THE FT CODE.
ADDITIONAL REQUIREMENTS TO OBTAIN APPROVAL FOR PERSONAL TRADES Prior to an Access Person obtaining approval for a personal trade he or she must advise the Compliance Officer that he or she:
| • | Does not possess material non-public information relating to the security; |
| • | Is not aware of any proposed trade or investment program relating to that security by any of the Franklin Templeton Group of Funds; |
| • | Believes that the proposed trade has not been offered because of the Access Person’s position in Franklin Templeton Investments and is available to any market participant on the same terms; |
| • | Believes that the proposed trade does not contravene any of the prohibited activities set out in Section 3.4 of the FT Code, and in the case of Portfolio Persons does not violate any of the additional requirements set out in Part 4 of the FT Code; and |
| • | Will provide any other information requested by the Compliance Officer concerning the proposed personal trade. |
Page 15
An Access Person may contact the Compliance Officer by fax, phone or e-mail to obtain his or her approval.
NOTE: THE METHOD OF OBTAINING APPROVAL IS PRESENTLY SET OUT IN SECTION 6.1A OF THE FT CODE AND PROVIDES THAT AN ACCESS PERSON MAY CONTACT THE COMPLIANCE OFFICER BY FAX, PHONE OR E-MAIL. THE ADDITIONAL REQUIREMENT DESCRIBED ABOVE MAKES IT CLEAR THAT AN ACCESS PERSON MAY CONTINUE TO CONTACT THE COMPLIANCE OFFICER IN THE SAME MANNER AS BEFORE. THE ACCESS PERSON WILL HAVE DEEMED TO HAVE CONFIRMED COMPLIANCE WITH THE ABOVE REQUIREMENTS PRIOR TO OBTAINING APPROVAL FROM THE COMPLIANCE OFFICER.
APPOINTMENT OF INDEPENDENT REVIEW PERSON
FTIC shall appoint an independent review person who will be responsible for approval of all personal trading rules and other provisions of the FT Code with respect to FTIC and for monitoring the administration of the FT Code from time to time with respect to FTIC employees. The Compliance Officer will provide a written report to the Independent Review Person, at least annually, summarizing:
| • | Compliance with the FT Code for the period under review |
| • | Violations of the FT Code for the period under review |
| • | Sanctions imposed by Franklin Templeton Investments for the period under review |
| • | Changes in procedures recommended by the FT Code |
| • | Any other information requested by the Independent Review Person |
APPENDIX A: COMPLIANCE PROCEDURES AND DEFINITIONS
This appendix sets forth the additional responsibilities and obligations of Compliance Officers, and the Legal/Administration and Legal/Compliance Departments, under Franklin Templeton Investments’ Code of Ethics and Policy Statement on Insider Trading.
| I. | RESPONSIBILITIES OF EACH DESIGNATED COMPLIANCE OFFICER |
| | A. | PRE-CLEARANCE STANDARDS |
The Director, Global Compliance, or a Preclearance Officer, shall only permit an access person to go forward with a proposed security/16/ transaction if he or she determines that, considering all of the facts and circumstances, the transaction does not violate the provisions of Rule 17j-1, or of this Code and there is no likelihood of harm to a client.
Unless there are special circumstances that make it appropriate to disapprove a personal securities transaction request, a Preclearance Officer shall consider only those securities transactions of the “Associated Clients” of the access person, including open and executed orders and recommendations, in determining whether to approve such a request. “Associated Clients” are those Funds or clients whose trading information would be available to the access person during the course of his or her regular functions or duties. Currently, there are three groups of Associated Clients: (i) the Franklin Mutual Series Funds and clients advised by Franklin Mutual Advisers, LLC (“Mutual Clients”); (ii) the Franklin Group of Funds and the clients advised by the various Franklin investment advisers (“Franklin Clients”); and (iii) the Templeton Group of Funds and the clients advised by the various Templeton investment advisers (“Templeton Clients”). Thus, persons who have access to the trading information of Mutual Clients generally will be precleared solely against the securities transactions of the Mutual Clients, including open and executed orders and recommendations. Similarly, persons who have access to the trading information of Franklin
Page 16
Clients or Templeton Clients generally will be precleared solely against the securities transactions of Franklin Clients or Templeton Clients, as appropriate.
Certain officers of Franklin Templeton Investments, as well as legal, compliance, fund accounting, investment operations and other personnel who generally have access to trading information of the funds and clients of Franklin Templeton Investments during the course of their regular functions and duties, will have their personal securities transactions precleared against executed transactions, open orders and recommendations of the entire Franklin Templeton Investments.
| | (a) | SECURITIES TRANSACTIONS BY FUNDS OR CLIENTS |
No clearance shall be given for any transaction in any security on any day during which an Associated Client of the access person has executed a buy or sell order in that security, until seven (7) calendar days after the order has been executed. Notwithstanding a transaction in the previous seven days, clearance may be granted to sell if all Associated Clients have disposed of the security.
| | (b) | SECURITIES UNDER CONSIDERATION |
OPEN ORDERS
No clearance shall be given for any transaction in any security on any day which an Associated Client of the access person has a pending buy or sell order for such security, until seven (7) calendar days after the order has been executed.
RECOMMENDATIONS
No clearance shall be given for any transaction in any security on any day on which a recommendation for such security was made by a Portfolio Person, until seven (7) calendar days after the recommendation was made and no orders have subsequently been executed or are pending.
In considering requests by Portfolio Personnel for approval of limited partnerships and other private placement securities transactions, the Director, Global Compliance shall consult with an executive officer of Franklin Resources, Inc. In deciding whether to approve the transaction, the Director, Global Compliance and the executive officer shall take into account, among other factors, whether the investment opportunity should be reserved for a Fund or other client, and whether the investment opportunity is being offered to the Portfolio Person by virtue of his or her position with Franklin Templeton Investments. If the Portfolio Person receives clearance for the transaction, an investment in the same issuer may only be made for a Fund or client if an executive officer of Franklin Resources, Inc., who has been informed of the Portfolio Person’s pre-existing investment and who has no interest in the issuer, approves the transaction.
If a Preclearance Officer approves a proposed securities transaction, the order for the transaction must be placed and effected by the close of the next business day following the day approval was granted. The Director, Global Compliance may, in his or her discretion, extend the clearance period up to seven calendar days, beginning on the date of the approval, for a securities
Page 17
transaction of any access person who demonstrates that special circumstances make the extended clearance period necessary and appropriate.17 The Director, Global Compliance may, in his or her discretion, after consultation with a member of senior management for Franklin Resources, Inc., renew the approval for a particular transaction for up to an additional seven calendar days upon a similar showing of special circumstances by the access person. The Director, Global Compliance may shorten or rescind any approval or renewal of approval under this paragraph if he or she determines it is appropriate to do so.
| | B. | WAIVERS BY THE DIRECTOR, GLOBAL COMPLIANCE |
The Director, Global Compliance may, in his or her discretion, after consultation with an executive officer of Franklin Resources, Inc., waive compliance by any access person with the provisions of the Code, if he or she finds that such a waiver:
| | (1) | is necessary to alleviate undue hardship or in view of unforeseen circumstances or is otherwise appropriate under all the relevant facts and circumstances; |
| | (2) | will not be inconsistent with the purposes and objectives of the Code; |
| | (3) | will not adversely affect the interests of advisory clients of Franklin Templeton Investments, the interests of Franklin Templeton Investments or its affiliates; and |
| | (4) | will not result in a transaction or conduct that would violate provisions of applicable laws or regulations. |
Any waiver shall be in writing, shall contain a statement of the basis for it, and the Director, Global Compliance, shall promptly send a copy to the General Counsel of Franklin Resources, Inc.
| | C. | CONTINUING RESPONSIBILITIES OF THE LEGAL COMPLIANCE DEPARTMENT |
A Preclearance Officer shall make a record of all requests for pre-clearance regarding the purchase or sale of a security, including the date of the request, the name of the access person, the details of the proposed transaction, and whether the request was approved or denied. A Preclearance Officer shall keep a record of any waivers given, including the reasons for each exception and a description of any potentially conflicting Fund or client transactions.
A Preclearance Officer shall also collect the signed initial acknowledgments of receipt and the annual acknowledgments from each access person of receipt of a copy of the Code and Insider Trading Policy, as well as reports, as applicable, on Schedules B, C, D, E and F of the Code. In addition, a Preclearance Officer shall request copies of all confirmations, and other information with respect to an account opened and maintained with the broker-dealer by any access person of the Franklin Templeton Group. A Preclearance Officer shall preserve those acknowledgments and reports, the records of consultations and waivers, and the confirmations, and other information for the period required by applicable regulation.
A Preclearance Officer shall review brokerage transaction confirmations, account statements, Schedules B, C, D, E, F and Private Placement Checklists of Access Persons for compliance with the Code. The reviews shall include, but are not limited to;
| | (1) | Comparison of brokerage confirmations, Schedule Bs, and/or brokerage statements to preclearance request worksheets or, if a private placement, the Private Placement Checklist; |
Page 18
| | (2) | Comparison of brokerage statements and/or Schedule Cs to current securities holding information; |
| | (3) | Comparison of Schedule F to current securities account information; |
| | (4) | Conducting periodic “back-testing” of access person transactions, Schedule Es and/or Schedule Gs in comparison to fund and client transactions; |
A Preclearance Officer shall evidence review by initialing and dating the appropriate document. Any apparent violations of the Code detected by a Preclearance Officer during his or her review shall be promptly brought to the attention of the Director, Global Compliance.
| | D. | PERIODIC RESPONSIBILITIES OF THE LEGAL COMPLIANCE DEPARTMENT |
The Legal Compliance Department shall consult with the General Counsel and the Human Resources Department, as the case may be, to assure that:
| | (1) | Adequate reviews and audits are conducted to monitor compliance with the reporting, pre-clearance, prohibited transaction and other requirements of the Code. |
| | (2) | Adequate reviews and audits are conducted to monitor compliance with the reporting, pre-clearance, prohibited transaction and other requirements of the Code. |
| | (3) | All access persons and new employees of the Franklin Templeton Group are adequately informed and receive appropriate education and training as to their duties and obligations under the Code. |
| | (4) | There are adequate educational, informational and monitoring efforts to ensure that reasonable steps are taken to prevent and detect unlawful insider trading by access persons and to control access to inside information. |
| | (5) | Written compliance reports are submitted to the Board of Directors of Franklin Resources, Inc., and the Board of each relevant Fund at least annually. Such reports will describe any issues arising under the Code or procedures since the last report, including, but not limited to, information about material violations of the Code or procedures and sanctions imposed in response to the material violations. |
| | (6) | The Legal Compliance Department will certify at least annually to the Fund’s board of directors that Franklin Templeton Investments has adopted procedures reasonably necessary to prevent Access Persons from violating the Code, and |
| | (7) | Appropriate records are kept for the periods required by law. |
| | E. | APPROVAL BY FUND’S BOARD OF DIRECTORS |
The Board of Directors/Trustees must base its approval of the Code on a determination that the Code contains provisions reasonably necessary to prevent access persons from engaging in any conduct prohibited by rule 17j-1.
At the time a new fund is organized, the Legal Compliance Department will provide the Fund’s board of directors, a certification that the investment adviser and principal underwriter has adopted procedures reasonably necessary to
Page 19
prevent Access Persons from violating the Code. Such certification will state that the Code contains provisions reasonably necessary to prevent Access Persons from violating the Code.
| | (3) | Material Changes to the Code of Ethics |
The Legal Compliance Department will provide the Fund’s board of directors a written description of all material changes to the Code no later than six months after adoption of the material change by Franklin Templeton Investments.
| II. | COMPILATION OF DEFINITIONS OF IMPORTANT TERMS |
For purposes of the Code of Ethics and Insider Trading Policy, the terms below have the following meanings:
1934 ACT - The Securities Exchange Act of 1934, as amended.
1940 ACT - The Investment Company Act of 1940, as amended.
ACCESSPERSON - Each director, trustee, general partner or officer, and any other person that directly or indirectly controls (within the meaning of Section 2(a)(9) of the 1940 Act) the Franklin Templeton Group or a person, including an Advisory Representative, who has access to information concerning recommendations made to a Fund or client with regard to the purchase or sale of a security.
ADVISORY REPRESENTATIVE - Any officer or director of Franklin Resources; any employee who makes any recommendation, who participates in the determination of which recommendation shall be made, or whose functions or duties relate to the determination of which recommendation shall be made; any employee who, in connection with his or her duties, obtains any information concerning which securities are being recommended prior to the effective dissemination of such recommendations or of the information concerning such recommendations; and any of the following persons who obtain information concerning securities recommendations being made by Franklin Resources prior to the effective dissemination of such recommendations or of the information concerning such recommendations: (i) any person in a control relationship to Franklin Resources, (ii) any affiliated person of such controlling person, and (iii) any affiliated person of such affiliated person.
AFFILIATED PERSON - it meaning as Section 2(a)(3) of the Investment Company Act of 1940. An “affiliated person” of an investment company includes directors, officers, employees, and the investment adviser. In addition, it includes any person owning 5% of the company’s voting securities, any person in which the investment company owns 5% or more of the voting securities, and any person directly or indirectly controlling, controlled by, or under common control with the company.
APPROPRIATE ANALYST – With respect to any access person, any securities analyst or portfolio manager making investment recommendations or investing funds on behalf of an Associated Client and who may be reasonably expected to recommend or consider the purchase or sale of a security.
ASSOCIATED CLIENT – A Fund or client whose trading information would be available to the access person during the course of his or her regular functions or duties.
BENEFICIAL OWNERSHIP – Has the same meaning as in Rule 16a-1(a)(2) under the 1934 Act. Generally, a person has a beneficial ownership in a security if he or she, directly or indirectly, through any contract, arrangement, understanding, relationship or otherwise, has or shares a direct or indirect pecuniary interest in the security. There is a presumption of a pecuniary interest in a security held or acquired by a member of a person’s immediate family sharing the same household.
Page 20
EXCHANGE TRADED FUNDS AND HOLDING COMPANY DEPOSITORY RECEIPTS - An Exchange - Traded Fund or “ETF” is a basket of securities that is designed to generally track an index—broad stock or bond market, stock industry sector, or international stock. Holding Company Depository Receipts “Holdrs” are securities that represent an investor’s ownership in the common stock or American Depository Receipts of specified companies in a particular industry, sector or group.
FUNDS - Investment companies in the Franklin Templeton Group of Funds.
HELD OR TO BE ACQUIRED - A security is “held or to be acquired” if within the most recent 15 days it (i) is or has been held by a Fund, or (ii) is being or has been considered by a Fund or its investment adviser for purchase by the Fund.
PORTFOLIO PERSON - Any employee of Franklin Templeton Investments, who, in connection with his or her regular functions or duties, makes or participates in the decision to purchase or sell a security by a Fund in Franklin Templeton Investments, or any other client or if his or her functions relate to the making of any recommendations about those purchases or sales. Portfolio Persons include portfolio managers, research analysts, traders, persons serving in equivalent capacities (such as Management Trainees), persons supervising the activities of Portfolio Persons, and anyone else designated by the Director, Global Compliance
PROPRIETARY ACCOUNTS - Any corporate account or other account including, but not limited to, a limited partnership, a corporate hedge fund, a limited liability company or any other pooled investment vehicle in which Franklin Resources or its affiliates, owns 25 percent or more of the outstanding capital or is entitled to 25% or more of the profits or losses in the account (excluding any asset based investment management fees based on average periodic net assets in accounts).
SECURITY - Any stock, note, bond, evidence of indebtedness, participation or interest in any profit-sharing plan or limited or general partnership, investment contract, certificate of deposit for a security, fractional undivided interest in oil or gas or other mineral rights, any put, call, straddle, option, or privilege on any security (including a certificate of deposit), guarantee of, or warrant or right to subscribe for or purchase any of the foregoing, and in general any interest or instrument commonly known as a security, except commodity futures, currency and currency forwards. For the purpose of this Code, “security” does not include:
| | (1) | Direct obligations of the Government of the United States; |
| | (2) | Bankers’ acceptances, bank certificates of deposit, commercial paper and high quality short-term debt instruments, including repurchase agreements; and |
| | (3) | Shares issued by open-end funds. |
SEE Section III of Appendix A for a summary of different requirements for different types of securities.
| III. | SECURITIES EXEMPT FROM THE PROHIBITED, REPORTING, AND PRE-CLEARANCE PROVISIONS |
| | A. | PROHIBITED TRANSACTIONS |
Securities that are EXEMPT from the prohibited transaction provisions of Section 3.4 include:
| | (1) | securities that are direct obligations of the U.S. Government, such as Treasury bills, notes and bonds, and U.S. Savings Bonds and derivatives thereof; |
Page 21
| | (2) | high quality short-term instruments (“money market instruments”) including but not limited to (i) bankers’ acceptances, (ii) U.S. bank certificates of deposit; (iii) commercial paper; and (iv) repurchase agreements; |
| | (3) | shares of registered open-end investment companies; |
| | (4) | commodity futures, currencies, currency forwards and derivatives thereof; |
| | (5) | securities that are prohibited investments for all Funds and clients advised by the entity employing the access person; and |
| | (6) | transactions in securities issued or guaranteed by the governments or their agencies or instrumentalities of Canada, the United Kingdom, France, Germany, Switzerland, Italy and Japan and derivatives thereof. |
| | B. | REPORTING AND PRECLEARANCE |
Securities that are EXEMPT from both the reporting requirements of Section 5 and preclearance requirements of Section 6 of the Code include:
| | (1) | securities that are direct obligations of the U.S. Government, such as Treasury bills, notes and bonds, and U.S. Savings Bonds and derivatives thereof; |
| | (2) | high quality short-term instruments (“money market instruments”) including but not limited to (i) bankers’ acceptances, (ii) U.S. bank certificates of deposit; (iii) commercial paper; and (iv) repurchase agreements; |
| | (3) | shares of registered open-end investment companies; and |
| | (4) | commodity futures, currencies, currency forwards and derivatives thereof. |
Rule 17j-1 under the Investment Company Act of 1940 (“1940 Act”) makes it unlawful for any affiliated person of Franklin Templeton Investments in connection with the purchase or sale of a security, including any option to purchase or sell, and any security convertible into or exchangeable for, any security that is “held or to be acquired” by a Fund in Franklin Templeton Investments:
| | A. | To employ any device, scheme or artifice to defraud a Fund; |
| | B. | To make to a Fund any untrue statement of a material fact or omit to state to a Fund a material fact necessary in order to make the statements made, in light of the circumstances under which they are made, not misleading; |
| | C. | To engage in any act, practice, or course of business which operates or would operate as a fraud or deceit upon a Fund; or |
| | D. | To engage in any manipulative practice with respect to a Fund. |
A security is “held or to be acquired” if within the most recent 15 days it (i) is or has been held by a Fund, or (ii) is being or has been considered by a Fund or its investment adviser for purchase by the Fund.
Page 22
APPENDIX B: ACKNOWLEGMENT FORM AND SCHEDULES
ACKNOWLEDGMENT FORM
CODE OF ETHICS AND POLICY STATEMENT ON INSIDER TRADING
TO: DIRECTOR OF GLOBAL COMPLIANCE, LEGAL COMPLIANCE DEPARTMENT
I HEREBY ACKNOWLEDGE RECEIPT OF A COPY OF FRANKLIN TEMPLETON INVESTMENTS CODE OF ETHICS AND POLICY STATEMENT ON INSIDER TRADING, Amended and Restated, May 2003, WHICH I HAVE READ AND UNDERSTAND. I WILL COMPLY FULLY WITH ALL PROVISIONS OF THE CODE AND THE INSIDER TRADING POLICY TO THE EXTENT THEY APPLY TO ME DURING THE PERIOD OF MY EMPLOYMENT. ADDITIONALLY, I AUTHORIZE ANY BROKER-DEALER, BANK OR INVESTMENT ADVISER WITH WHOM I HAVE SECURITIES ACCOUNTS AND ACCOUNTS IN WHICH I HAVE BENEFICIAL OWNERSHIP, TO PROVIDE BROKERAGE CONFIRMATIONS AND STATEMENTS AS REQUIRED FOR COMPLIANCE WITH THE CODE. I FURTHER UNDERSTAND AND ACKNOWLEDGE THAT ANY VIOLATION OF THE CODE OR INSIDER TRADING POLICY, INCLUDING ENGAGING IN A PROHIBITED TRANSACTION OR FAILURE TO FILE REPORTS AS REQUIRED (SEE SCHEDULES B, C, D, E, F AND G), MAY SUBJECT ME TO DISCIPLINARY ACTION, INCLUDING TERMINATION OF EMPLOYMENT.
Instructions:
| | 1. | Complete all sections of this form. |
| | 2. | Print the completed form, sign, and date. |
| | 3. | Submit completed form to Legal Compliance via: |
Inter-office Mail to: Preclearance
L-Comp SM-920/2
U.S. Mail to: Franklin Templeton Investments
Attn: Legal-Compliance/Preclearance
P.O. Box 25050
San Mateo, CA 94402-5050
Telephone: (650) 312-3693 Fax: (650) 312-5646
E-mail: Preclear, Legal (internal address);
Lpreclear@frk.com (external address)
| | |
|
| EMPLOYEE’S NAME: | | SIGNATURE |
| | | |
|
| TITLE: | | |
| | | |
|
| DEPARTMENT: | | |
| | | |
|
| LOCATION: | | |
| | | |
|
INITIAL DISCLOSURE DATE OR YEAR END: | | |
| | | |
|
Page 23
SCHEDULE A: LEGAL AND COMPLIANCE OFFICERS AND PRECLEARANCE DESK TELEPHONE & FAX NUMBERS18
LEGAL OFFICER
MURRAY L. SIMPSON
EXECUTIVE VICE PRESIDENT & GENERAL COUNSEL
FRANKLIN TEMPLETON INVESTMENTS
ONE FRANKLIN PARKWAY
SAN MATEO, CA 94403-1906
(650) 525 -7331
COMPLIANCE OFFICERS
| | |
| DIRECTOR, GLOBAL COMPLIANCE | | PRECLEARANCE OFFICERS |
| |
| James M. Davis | | Stephanie Harwood, Supervisor |
| Franklin Templeton Investments | | Lisa Del Carlo |
| One Franklin Parkway | | Darlene Nisby |
| San Mateo, CA 94403-1906 | | Legal Compliance Department |
| (650) 312-2832 | | Franklin Templeton Investments |
| | | One Franklin Parkway |
| | | San Mateo, CA 94403-1906 |
| | | (650) 312-3693 (telephone) |
| | | (650) 312-5646 (facsimile) |
| | | Preclear, Legal (internal e-mail address) |
| | | Lpreclear@frk.com (external e-mail address) |
SCHEDULE B - TRANSACTIONS REPORT
This report of personal securities transactions not reported by duplicate confirmations and brokerage statements pursuant to Section 5.3 of the Code is required pursuant to Rule 204-2(a) of the Investment Advisers Act of 1940 or Rule 17j-1(c) of the Investment Company Act of 1940. The report must be completed and submitted to the Compliance Department no later than 10 calendar days after the end of the calendar quarter. Refer to Section 5.3 of the Code of Ethics for further instructions.
Instructions:
| | 1. | Complete all sections of this form. |
| | 2. | Print completed form, sign, and date. |
| | 3. | Submit completed form to Legal Compliance via: |
Inter-office Mail to: Preclearance
L-Comp SM-920/2
U.S. Mail to: Franklin Templeton Investments
Attn: Legal-Compliance/Preclearance
P.O. Box 25050
San Mateo, CA 94402-5050
Telephone: (650) 312-3693 Fax: (650) 312-5646
E-mail: Preclear, Legal (internal address); Lpreclear@frk.com
(external address)
Page 24
| | | | | | | | | | |
PRE-CLEARED THROUGH
COMPLIANCE TRADE
BUY, SELL DEPARTMENT
DATE OR OTHER (DATE
OR N/A)
| | SECURITY NAME
DESCRIPTION AND
TYPE OF SECURITY
(COMMON, BOND,
OPTION, ETC.)
| | QUANTITY
| | PRICE
| | PRINCIPAL AMOUNT
| | BROKER-DEALER OR
BANK AND
ACCOUNT NUMBER
|
| | | | | | | | | | | |
| | | | | | | | | | | |
| | | | | | | | | | | |
| | | | | | | | | | | |
| | | | | | | | | | | |
| | | | | | | | | | | |
| | | | | | | | | | | |
| | | | | | | | | | | |
THE REPORT OR RECORDING OF ANY TRANSACTIONS ABOVE SHALL NOT BE CONSTRUED AS AN ADMISSION THAT I HAVE ANY DIRECT OR INDIRECT OWNERSHIP IN THE SECURITIES.
| | |
|
| EMPLOYEE’S NAME: | | |
| | | |
|
| QUARTER ENDING: | | |
| | | |
|
SCHEDULE C - INITIAL, ANNUAL, & UPDATED DISCLOSURE OF ACCESS PERSONS SECURITIES HOLDINGS
This report shall set forth the security name or description and security class of each security holding in which you have a direct or indirect beneficial interest, including holdings by a spouse, minor children, trusts, foundations, and any account for which trading authority has been delegated to you, other than authority to trade for a Fund in or a client of Franklin Templeton Investments. In lieu of listing each security position below, you may instead attach copies of brokerage statements, sign below and return Schedule C and brokerage statements to the Legal Compliance Department within 10 days if an initial report or by January 30th of each year if an annual report. Refer to Sections 5.2.A and 5.4.A of the Code for additional filing instructions.
Page 25
Instructions:
| | 1. | Complete all sections of this form. |
| | 2. | Print completed form, sign, and date. |
| | 3. | Submit completed form to Legal Compliance via: |
Inter-office Mail to: Preclearance
L-Comp SM-920/2
U.S. Mail to: Franklin Templeton Investments
Attn: Legal-Compliance/Preclearance
P.O. Box 25050
San Mateo, CA 94402-5050
Telephone: (650) 312-3693 Fax: (650) 312-5646
E-mail: Preclear, Legal (internal address); Lpreclear@frk.com
(external address)
Securities that are EXEMPT from being reported on Schedule C include: (i) securities that are direct obligations of the U.S. Government, such as Treasury bills, notes and bonds, and U.S. Savings Bonds and derivatives thereof; (ii) high quality short-term instruments (“money market instruments”) including but not limited to bankers’ acceptances, U.S. bank certificates of deposit; commercial paper; and repurchase agreements; (iii) shares of registered open-end investment companies; and (iv) commodity futures, currencies, currency forwards and derivatives thereof.
| ¨ | I DID NOT HAVE ANY PERSONAL SECURITIES HOLDINGS FOR YEAR ENDED: (OR CURRENT DATE IF INITIAL DISCLOSURE) |
| ¨ | I HAVE ATTACHED STATEMENTS CONTAINING ALL MY PERSONAL SECURITIES HOLDINGS FOR YEAR ENDED: (OR CURRENT DATE IF INITIAL DISCLOSURE) |
| ¨ | I HAVE LISTED BELOW ALL MY PERSONAL SECURITIES HOLDINGS FOR YEAR ENDED: (OR CURRENT DATE IF INITIAL DISCLOSURE) |
| | | | | | |
Security Description,
including interest rate and
Account
maturity (if appropriate)
Number
| | Security Type
(Stock, Bond,
Option, etc.)
| | Quantity &
Principal
Amount
| | Name of Broker-
Dealer or Bank
|
TO THE BEST OF MY KNOWLEDGE I HAVE DISCLOSED ALL OF MY SECURITIES ACCOUNTS AND/OR INVESTMENTS IN WHICH I HAVE A DIRECT OR INDIRECT BENEFICIAL INTEREST, INCLUDING SECURITY ACCOUNTS OF A SPOUSE, MINOR CHILDREN, TRUSTS, FOUNDATIONS, AND ANY ACCOUNT FOR WHICH TRADING AUTHORITY HAS BEEN DELEGATED AN UNAFFILIATED PARTY.
| | | | | | |
|
| EMPLOYEE’S NAME: | | Print: | | Signature: | | Date: |
YEAR ENDED OR CURRENT
DATE IF INITIAL
DISCLOSURE:
Page 26
SCHEDULE D – NOTIFICATION OF SECURITIES ACCOUNT
All Franklin registered representatives and Access Persons, PRIOR TO OPENING A BROKERAGE ACCOUNT OR PLACING AN INITIAL ORDER, are required to notify the Legal Compliance Preclearance Department and the executing broker-dealer in writing. This includes accounts in which the registered representative or access person has or will have a financial interest in (e.g., a spouse’s account) or discretionary authority (e.g., a trust account for a minor child).
UPON RECEIPT OF THE NOTIFICATION OF SECURITIES ACCOUNT FORM, THE LEGAL COMPLIANCE PRECLEARANCE DEPARTMENT WILL CONTACT THE BROKER-DEALER IDENTIFIED BELOW AND REQUEST THAT DUPLICATE CONFIRMATIONS AND STATEMENTS OF YOUR BROKERAGE ACCOUNT ARE SENT TO FRANKLIN TEMPLETON INVESTMENTS.
Instructions:
| | 1. | Complete all sections of this form. |
| | 2. | Print the completed form, sign, and date. |
| | 3. | Submit completed form to Legal Compliance via: |
Inter-office Mail to: Preclearance
L-Comp SM-920/2
U.S. Mail to: Franklin Templeton Investments
Attn: Legal-Compliance/Preclearance
P.O. Box 25050
San Mateo, CA 94402-5050
Telephone: (650) 312-3693 Fax: (650) 312-5646
E-mail: Preclear, Legal (internal address); Lpreclear@frk.com
(external address)
| | |
|
| EMPLOYEE INFORMATION: | | |
| | | |
|
| EMPLOYEE’S NAME: | | |
| | | |
|
| EXTENSION: | | |
| | | |
|
| DEPARTMENT: | | |
| | | |
|
| INTEROFFICE MAIL CODE: | | |
| | | |
| | | | | | |
|
ARE YOU A REGISTERED REPRESENTATIVE? (NASD LICENSED, I.E. SERIES 6, 7) | | ¨ Yes | | ¨ No |
|
| ARE YOU AN ACCESS PERSON? | | ¨ Yes | | ¨ No |
| | |
|
| ACCOUNT INFORMATION: | | |
| | | |
|
ACCOUNT NAME: (IF OTHER THAN EMPLOYEE, STATE RELATIONSHIP I.E., SPOUSE) | | |
|
| ACCOUNT# OR SOCIAL SECURITY #: | | |
| | | |
|
| FIRM NAME: | | |
| | | |
|
| ATTENTION (OPTIONAL): | | |
| | | |
|
| FIRM ADDRESS: | | |
| | | |
|
| CITY/STATE/ZIP CODE: | | |
| | | |
Page 27
SCHEDULE E – NOTIFICATION OF DIRECT OR INDIRECT BENEFICIAL INTEREST
If you have any beneficial ownership in a security and you recommend to the Appropriate Analyst that the security be considered for purchase or sale by an Associated Client, or if you carry out a purchase or sale of that security for an Associated Client, you must disclose your beneficial ownership to the Legal-Compliance Department and the Appropriate Analyst in writing on Schedule E (or an equivalent form containing similar information) before the purchase or sale, or before or simultaneously with the recommendation.
Instructions:
| | 1. | Complete all sections of this form. |
| | 2. | Print completed form, sign, and date. |
| | 3. | Submit completed form to Legal Compliance via: |
Inter-office Mail to: Preclearance
L-Comp SM-920/2
U.S. Mail to: Franklin Templeton Investments
Attn: Legal-Compliance/Preclearance
P.O. Box 25050
San Mateo, CA 94402-5050
Telephone: (650) 312-3693 Fax: (650) 312-5646
E-mail: Preclear, Legal (internal address); Lpreclear@frk.com
(external address)
| | | | | | | | | | | | |
OF DATE OF
SECURITY PERSON
DESCRIPTION
NOTIFIED
| | OWNERSHIP
TYPE: (DIRECT OR
VERBAL
INDIRECT
NOTIFICATION)
| | YEAR
ACQUIRED
| | METHOD OF
ACQUISITION
(PURCHASE
/GIFT/OTHER)
| | DATE AND
METHOD
LEARNED
THAT SECURITY’S
UNDER
CONSIDERATION
BY FUNDS
| | PRIMARY
MANAGER OR
PORTFOLIO
ANALYST
| | NAME
|
| | | | |
EMPLOYEE’S NAME: |
| | | | | |
| | | |
|
| SIGNATURE | | | | DATE |
Page 28
SCHEDULE F – INITIAL, ANNUAL, & UPDATED DISCLOSURE OF SECURITIES ACCOUNTS
This report shall set forth the name and description of each securities account in which you have a direct or indirect beneficial interest, including securities accounts of a spouse, minor children, trusts, foundations, and any account for which trading authority has been delegated to you, other than authority to trade for a Fund in or a client of the Franklin Templeton Group. In lieu of listing each securities account below, you may instead attach copies of the brokerage statements, sign below and return Schedule F and brokerage statements to the Compliance Department.
Instructions:
| | 1. | Complete all sections of this form. |
| | 2. | Print completed form, sign, and date. |
| | 3. | Submit completed form to Legal Compliance via: |
Inter-office Mail to: Preclearance
L-Comp SM-920/2
U.S. Mail to: Franklin Templeton Investments
Attn: Legal-Compliance/Preclearance
P.O. Box 25050
San Mateo, CA 94402-5050
Telephone: (650) 312-3693 Fax: (650) 312-5646
E-mail: Preclear, Legal (internal address); Lpreclear@frk.com
(external address)
| | | | | | |
ACCOUNT NAME(S) (REGISTRATION
SHOWN ACCOUNT ON
STATEMENT) NUMBER
| | NAME OF
BROKERAGE FIRM,
BANK OR
INVESTMENT
ADVISER
| | ADDRESS OF BROKERAGE
FIRM, BANK OR
INVESTMENT
ADVISER (STREET/CITY
/STATE/ZIP CODE)
| | NAME OF
ACCOUNT
EXECUTIVE/
REPRESENTATIVE
|
Page 29
TO THE BEST OF MY KNOWLEDGE I HAVE DISCLOSED ALL OF MY SECURITIES ACCOUNTS IN WHICH I HAVE A DIRECT OR INDIRECT BENEFICIAL INTEREST, INCLUDING SECURITY ACCOUNTS OF A SPOUSE, MINOR CHILDREN, TRUSTS, FOUNDATIONS, AND ANY ACCOUNT FOR WHICH TRADING AUTHORITY HAS BEEN DELEGATED TO ME.
| | | | |
|
| EMPLOYEE’S NAME: | | | | |
| |
|
YEAR ENDED OR CURRENT DATE IF INITIAL DISCLOSURE: | | | | |
| |
|
| | |
| | | | | |
| | | |
|
| SIGNATURE | | | | DATE |
SCHEDULE G - INITIAL AND ANNUAL CERTIFICATION OF DISCRETIONARY AUTHORITY
This report shall set forth the account name or description in which you have a direct or indirect beneficial interest, including holdings by a spouse, minor children, trusts, foundations, and as to which trading authority has been delegated by you to an unaffiliated registered broker-dealer, registered investment adviser, or other investment manager acting in a similar fiduciary capacity, who exercises sole investment discretion.
Instructions:
| | 1. | Complete all sections of this form. |
| | 2. | Print completed form, sign, and date. |
| | 3. | Submit completed form to Legal Compliance via: |
Inter-office Mail to: Preclearance
L-Comp SM-920/2
U.S. Mail to: Franklin Templeton Investments
Attn: Legal-Compliance/Preclearance
P.O. Box 25050
San Mateo, CA 94402-5050
Telephone: (650) 312-3693 Fax: (650) 312-5646
E-mail: Preclear, Legal (internal address); Lpreclear@frk.com
(external address)
| | | | | | |
NAME(S) SHOWN ON ACCOUNT OR INVESTMENT
| | NAME DESCRIPTION OF BROKERAGE FIRM, BANK,
INVESTMENT ADVISER OR INVESTMENT
| | TYPE OF OWNERSHIP: DIRECT OWNERSHIP (DO) INDIRECT OWNERSHIP (IO)
| | ACCOUNT NUMBER (IF APPLICABLE)
|
Page 30
TO THE BEST OF MY KNOWLEDGE I HAVE DISCLOSED ALL OF MY SECURITIES ACCOUNTS AND/OR INVESTMENTS IN WHICH I HAVE A DIRECT OR INDIRECT BENEFICIAL INTEREST, INCLUDING SECURITY ACCOUNTS OF A SPOUSE, MINOR CHILDREN, TRUSTS, FOUNDATIONS, AND ANY ACCOUNT FOR WHICH TRADING AUTHORITY HAS BEEN DELEGATED AN UNAFFILIATED PARTY. FURTHER, I CERTIFY THAT I DO NOT HAVE ANY DIRECT OR INDIRECT INFLUENCE OR CONTROL OVER THE ACCOUNTS LISTED ABOVE.
| | | | |
| | | | | |
|
| EMPLOYEE’S NAME: | | | | |
| |
|
| YEAR ENDED: | | | | |
| |
|
| | |
| | | | | |
| | | |
|
| SIGNATURE | | | | DATE |
SCHEDULE H: CHECKLIST FOR INVESTMENTS IN PARTNERSHIPS AND SECURITIES ISSUED IN PRIVATE PLACEMENTS MADE BY PORTFOLIO PERSONS
In considering requests by portfolio personnel for approval of limited partnerships and other private placement securities transactions, the Compliance officer shall consult with an executive officer of Franklin Resources, Inc. In deciding whether to approve the transaction, the Compliance officer and the executive officer shall take into account, among other factors, whether the is being offered to the access person by virtue of his or her position with Franklin Templeton Investments. IF THE ACCESS PERSON RECEIVES CLEARANCE FOR THE TRANSACTION, NO INVESTMENT IN THE SAME ISSUER MAY BE MADE FOR A FUND OR CLIENT UNLESS AN EXECUTIVE OFFICER OF FRANKLIN RESOURCES, INC., WITH NO INTEREST IN THE ISSUER, APPROVES THE TRANSACTION.
Instructions:
| | 1. | Complete all sections of this form. |
| | 2. | Print the completed form, sign, and date. |
| | 3. | Submit completed form to Legal Compliance via: |
Inter-office Mail to: Preclearance
L-Comp SM-920/2
U.S. Mail to: Franklin Templeton Investments
Attn: Legal-Compliance/Preclearance
P.O. Box 25050
San Mateo, CA 94402-5050
Telephone: (650) 312-3693 Fax: (650) 312-5646
E-mail: Preclear, Legal (internal address); Lpreclear@frk.com
(external address)
IN ORDER TO EXPEDITE YOUR REQUEST, PLEASE PROVIDE THE FOLLOWING INFORMATION:
| | | | |
|
| NAME/DESCRIPTION OF PROPOSED INVESTMENT: | | | | |
| |
|
| PROPOSED INVESTMENT AMOUNT: | | | | |
| |
|
Page 31
| 1) | PLEASE ATTACH PAGES OF THE OFFERING MEMORANDUM (OR OTHER DOCUMENTS) SUMMARIZING THE INVESTMENT OPPORTUNITY, INCLUDING: |
| | i) | Name of the partnership/hedge fund/issuer; |
| | ii) | Name of the general partner, location & telephone number; |
| | iii) | Summary of the offering; including the total amount the offering/issuer; |
| | iv) | Percentage your investment will represent of the total offering; |
| | v) | Plan of distribution; and |
| | vi) | Investment objective and strategy, |
| 2) | PLEASE RESPOND TO THE FOLLOWING QUESTIONS: |
| | a) | Was this investment opportunity presented to you in your capacity as a portfolio manager? If no, please explain the relationship, if any, you have to the issuer or principals of the issuer. |
| | b) | Is this investment opportunity suitable for any fund/client that you advise?/19/ If yes, why isn’t the investment being made on behalf of the fund/client? If no, why isn’t the investment opportunity suitable for the fund/clients? |
| | c) | Do any of the fund/clients that you advise presently hold securities of the issuer of this proposed investment (e.g., common stock, preferred stock, corporate debt, loan participations, partnership interests, etc.)? If yes, please provide the names of the funds/clients and security description. |
| | d) | Do you presently have or will you have any managerial role with the company/issuer as a result of your investment? If yes, please explain in detail your responsibilities, including any compensation you will receive. |
| | e) | Will you have any investment control or input to the investment decision making process? |
| | f) | Will you receive reports of portfolio holdings? If yes, when and how frequently will these be provided? |
| 3) | REMINDER: PERSONAL SECURITIES TRANSACTIONS THAT DO NOT GENERATE BROKERAGE CONFIRMATIONS (E.G., INVESTMENTS PRIVATE PLACEMENTS) MUST BE REPORTED TO THE LEGAL-COMPLIANCE DEPARTMENT ON THE SCHEDULE B FORM WITHIN 10 CALENDAR DAYS AFTER YOU ARE NOTIFIED. |
| | | | |
| | | | | |
PORTFOLIO PERSON’S NAME | |
SIGNATURE | |
DATE |
| | |
| APPROVED BY: | | | | |
CHIEF INVESTMENT OFFICER’S NAME | |
SIGNATURE | |
DATE |
| | | | | |
|
| LEGAL COMPLIANCE USE ONLY |
|
| | | | | | |
| DATE RECEVIED : | | | | DATE ENTERED IN LOTUS NOTES: | | |
Page 32
DATE FORWARDED TO FRI OFFICER:
| | | | |
| APPROVED BY: | | | | |
| | |
| | | | | |
| | | |
|
| JAMES M. DAVIS, DIRECTOR, GLOBAL COMPLIANCE | | | | DATE |
| | |
| | | | | |
| | | |
|
| MURRAY L. SIMPSON, EVP-GENERAL COUNSEL | | | | DATE |
| | | | |
DATE ENTERED IN EXAMINER: | | PRECLEAED: | | ¨ ¨ |
| | | | | YES NO
(ATTACH E-MAIL) |
APPENDIX C: INVESTMENT ADVISOR AND BROKER-DEALER AND OTHER
SUBSIDIARIES OF FRANKLIN RESOURCES, INC. - MAY 2003
| | | | |
Franklin Advisers, Inc. FIA | | IA | | Closed Joint-Stock Company Templeton (Russia) |
| | |
Franklin Advisory Services, LLC FBD | | IA | | Templeton Unit Trust Management Ltd. (UK) |
| | |
Franklin Investment Advisory FIA Services, Inc. | | IA | | Orion Fund Management Ltd. |
| | |
Franklin Private Client Group, Inc. IA | | IA | | Templeton Global Advisors Ltd. (Bahamas) |
| | |
| | | | | |
| | |
Franklin Mutual Advisers, LLC FIA/FBD | | IA | | Templeton Asset Management (India) Pvt. Ltd. |
| | |
Franklin Properties, Inc. FBD | | REA | | Templeton Italia SIM S.P.A. (Italy) |
| | |
Franklin/Templeton Distributors, FBD Inc. | | BD | | Franklin Templeton Investment Services Gmbh (Germany) |
| | |
Templeton (Switzerland), Ltd. Trust Co | | FBD | | Fiduciary Trust International of the South |
| | |
Franklin Templeton International BM Services S.A. (Luxembourg) | | FBD | | Franklin Templeton Services, LLC |
Page 33
| | | | |
| | |
Franklin Templeton Investments IA/FIA Australia Limited | | FIA | | Franklin Templeton Investments Corp. (Ontario) |
| | |
Franklin/Templeton Investor IA Services, LLC | | TA | | Templeton Global Advisors Limited (Bahamas) |
| | |
Franklin Templeton Alternative IA/FIA Strategies, LLC | | IA | | Templeton Asset Management Ltd. (Singapore) |
| | |
FTI Institutional, LLC Trust Co. | | IA | | Fiduciary Trust Company International |
| | |
Franklin Templeton Asset IA Strategies LLC | | IA | | Fiduciary International, Inc |
| | |
Fiduciary Financial Services, Corp. IA | | BD | | Fiduciary Investment Management International Inc. |
| | |
Franklin Templeton Asset FIA Management S.A. (France) | | FIA | | Fiduciary Trust International Australia Limited |
| | |
Franklin Templeton Investments FIA (Asia) Limited (Hong Kong) | | FBD/IA | | Fiduciary Trust International Asia Limited (Hong Kong) |
| | |
Franklin Templeton Investment IA/FIA Management Limited (UK) | | IA/FIA | | Fiduciary Trust International Limited (UK) |
| | |
Franklin Templeton Investments FIA Corp. (Canada) | | IA/FIA | | Fiduciary Trust International Investment Management, Inc. (Japan) |
| | |
Templeton/Franklin Investment Services, Inc | | IA/BD | | |
| | |
Templeton Investment Counsel, LLC | | IA | | |
| | |
Templeton Asset Management, Ltd. | | IA/FIA | | |
| | |
Franklin Templeton Investments Japan Ltd. | | FIA | | |
| | | | |
Codes: | | IA: | | US registered investment adviser |
| | | BD: | | US registered broker-dealer |
| | | FIA: | | Foreign equivalent investment adviser |
| | | FBD: | | Foreign equivalent broker-dealer |
| | | TA: | | US registered transfer agent |
| | | BM: | | Business manager to the funds |
| | | REA: | | Real estate adviser |
| | | Trust: | | Trust company |
Page 34
POLICY STATEMENT ON INSIDER TRADING
Pursuant to the Insider Trading and Securities Fraud Enforcement Act of 1988, it is the policy of Franklin Templeton Investments to forbid any officer, director, employee, consultant acting in a similar capacity, or other person associated with Franklin Templeton Investments from trading, either personally or on behalf of clients, including all client assets managed by the entities in Franklin Templeton Investments, on material non-public information or communicating material non-public information to others in violation of the law. This conduct is frequently referred to as “insider trading.” Franklin Templeton Investment’s Policy Statement on Insider Trading applies to every officer, director, employee or other person associated with Franklin Templeton Investments and extends to activities within and outside their duties with Franklin Templeton Investments. Every officer, director and employee must read and retain this policy statement. Any questions regarding Franklin Templeton Investments Policy Statement on Insider Trading or the Compliance Procedures should be referred to the Legal Department.
The term “insider trading” is not defined in the federal securities laws, but generally is used to refer to the use of material non-public information to trade in securities (whether or not one is an “insider”) or to communications of material non-public information to others.
While the law concerning insider trading is not static, it is generally understood that the law prohibits:
| | (1) | trading by an insider, while in possession of material non-public information; or |
| | (2) | trading by a non-insider, while in possession of material non-public information, where the information either was disclosed to the non-insider in violation of an insider’s duty to keep it confidential or was misappropriated; or |
| | (3) | communicating material non-public information to others. |
The elements of insider trading and the penalties for such unlawful conduct are discussed below. If, after reviewing this policy statement, you have any questions, you should consult the Legal Department.
The concept of “insider” is broad. It includes officers, directors and employees of a company. In addition, a person can be a “temporary insider” if he or she enters into a special confidential relationship in the conduct of a company’s affairs and as a result is given access to information solely for the company’s purposes. A temporary insider can include, among others, a company’s outside attorneys, accountants, consultants, bank lending officers, and the employees of such organizations. In addition, an investment adviser may become a temporary insider of a company it advises or for which it performs other services. According to the U.S. Supreme Court, the company must expect the outsider to keep the disclosed non-public information confidential and the relationship must at least imply such a duty before the outsider will be considered an insider.
Page 35
| | C. | WHAT IS MATERIAL INFORMATION? |
Trading on inside information is not a basis for liability unless the information is material. “Material information” generally is defined as information for which there is a substantial likelihood that a reasonable investor would consider it important in making his or her investment decisions, or information that is reasonably certain to have a substantial effect on the price of the company’s securities. Information that officers, directors and employees should consider material includes, but is not limited to: dividend changes, earnings estimates, changes in previously released earnings estimates, significant merger or acquisition proposals or agreements, major litigation, liquidation problems, and extraordinary management developments.
Material information does not have to relate to a company’s business. For example, in CARPENTER V. U.S., 108 U.S. 316 (1987), the Supreme Court considered as material certain information about the contents of a forthcoming newspaper column that was expected to affect the market price of a security. In that case, a WALL STREET JOURNAL reporter was found criminally liable for disclosing to others the dates that reports on various companies would appear in the WALL STREET JOURNAL and whether those reports would be favorable or not.
| | D. | WHAT IS NON-PUBLIC INFORMATION? |
Information is non-public until it has been effectively communicated to the marketplace. One must be able to point to some fact to show that the information is generally public. For example, information found in a report filed with the Securities and Exchange Commission (“SEC”), or appearing in Dow Jones, Reuters Economic Services, THE WALL STREET JOURNAL or other publications of general circulation would be considered public.
In 1980, the Supreme Court found that there is no general duty to disclose before trading on material non-public information, but that such a duty arises only where there is a fiduciary relationship. That is, there must be a relationship between the parties to the transaction such that one party has a right to expect that the other party will not disclose any material non-public information or refrain from trading. CHIARELLA V. U.S., 445 U.S. 22 (1980).
In DIRKS V. SEC, 463 U.S. 646 (1983), the Supreme Court stated alternate theories under which non-insiders can acquire the fiduciary duties of insiders. They can enter into a confidential relationship with the company through which they gain information (E.G., attorneys, accountants), or they can acquire a fiduciary duty to the company’s shareholders as “tippees” if they are aware or should have been aware that they have been given confidential information by an insider who has violated his fiduciary duty to the company’s shareholders.
However, in the “tippee” situation, a breach of duty occurs only if the insider personally benefits, directly or indirectly, from the disclosure. The benefit does not have to be pecuniary but can be a gift, a reputational benefit that will translate into future earnings, or even evidence of a relationship that suggests a quid pro quo.
| | 2. | MISAPPROPRIATION THEORY |
Another basis for insider trading liability is the “misappropriation” theory, under which liability is established when trading occurs on material non-public information that was stolen or misappropriated from any other person. In U.S. V. CARPENTER, SUPRA, the Court found, in 1987, a columnist defrauded THE WALL STREET JOURNAL when he stole information from the WALL STREET JOURNAL and used it for trading in the securities markets. It should be noted that the misappropriation theory can be used to reach a variety of individuals not previously thought to be encompassed under the fiduciary duty theory.
Page 36
| | F. | PENALTIES FOR INSIDER TRADING |
Penalties for trading on or communicating material non-public information are severe, both for individuals involved in such unlawful conduct and their employers. A person can be subject to some or all of the penalties below even if he or she does not personally benefit from the violation. Penalties include:
| | • | disgorgement of profits; |
| | • | fines for the person who committed the violation of up to three times the profit gained or loss avoided, whether or not the person actually benefited; and |
| | • | fines for the employer or other controlling person of up to the greater of $1,000,000 or three times the amount of the profit gained or loss avoided. |
In addition, any violation of this policy statement can result in serious sanctions by the Franklin Templeton Group, including dismissal of any person involved.
| | G. | INSIDER TRADING PROCEDURES |
Each access person, Compliance Officer, the Risk Management Department, and the Legal Department, as the case may be, shall comply with the following procedures.
| | 1. | IDENTIFYING INSIDE INFORMATION |
Before trading for yourself or others, including investment companies or private accounts managed by the Franklin Templeton Group, in the securities of a company about which you may have potential inside information, ask yourself the following questions:
| | • | Is the information material? |
| | • | Is this information that an investor would consider important in making his or her investment decisions? |
| | • | Is this information that would substantially affect the market price of the securities if generally disclosed? |
| | • | Is the information non-public? |
| | • | To whom has this information been provided? |
| | • | Has the information been effectively communicated to the marketplace (e.g., published in REUTERS, THE WALL STREET JOURNAL or other publications of general circulation)? |
If, after consideration of these questions, you believe that the information may be material and non-public, or if you have questions as to whether the information is material and non-public, you should take the following steps:
| | (i) | Report the matter immediately to the designated Compliance Officer, or if he or she is not available, to the Legal Department. |
| | (ii) | Do not purchase or sell the securities on behalf of yourself or others, including investment companies or private accounts managed by Franklin Templeton Investments. |
Page 37
| | (iii) | Do not communicate the information inside or outside Franklin Templeton Investments , other than to the Compliance Officer or the Legal Department. |
| | (iv) | The Compliance Officer shall immediately contact the Legal Department for advice concerning any possible material, non-public information. |
| | (v) | After the Legal Department has reviewed the issue and consulted with the Compliance Officer, you will be instructed either to continue the prohibitions against trading and communication noted in (ii) and (iii), or you will be allowed to trade and communicate the information. |
| | (vi) | In the event the information in your possession is determined by the Legal Department or the Compliance Officer to be material and non-public, it may not be communicated to anyone, including persons within Franklin Templeton Investments, except as provided in (i) above. In addition, care should be taken so that the information is secure. For example, files containing the information should be sealed and access to computer files containing material non-public information should be restricted to the extent practicable. |
| | 2. | RESTRICTING ACCESS TO OTHER SENSITIVE INFORMATION |
All Franklin Templeton Investments personnel also are reminded of the need to be careful to protect from disclosure other types of sensitive information that they may obtain or have access to as a result of their employment or association with Franklin Templeton Investments.
| | (I) | GENERAL ACCESS CONTROL PROCEDURES |
Franklin Templeton Investments has established a process by which access to company files that may contain sensitive or non-public information such as the Bargain List and the Source of Funds List is carefully limited. Since most of the Franklin Templeton Group files, which contain sensitive information, are stored in computers, personal identification numbers, passwords and/or code access numbers are distributed to Franklin Templeton Investments computer access persons only. This activity is monitored on an ongoing basis. In addition, access to certain areas likely to contain sensitive information is normally restricted by access codes.
Regulation FD under the Securities Exchange Act of 1934, as amended (the “1934 Act”), prohibits certain persons associated with Franklin Resources, Inc., its affiliates, subsidiaries (collectively, “FTI”) and closed-end fund advised by an investment advisory subsidiary of Resources (“FTI Closed-End Funds”) and persons associated with the FTI investment adviser to the FTI Closed-End Funds, from selectively disclosing material nonpublic information about Resources and the FTI Closed-End Funds to certain securities market professionals and shareholders. Regulation FD is designed to promote the full and fair disclosure of information by issuers such as Resources and the FTI Closed-End Funds.
The scope of Regulation FD is limited. Regulation FD applies to Resources and FTI Closed-End Funds, but does not apply to open-end investment companies managed by the FTI investment advisers. The rule also does not apply to all communications about the Resources or FTI Closed-End Funds with outside persons. Rather, Regulation FD applies only to communications to securities market professionals and to any shareholder of the Resources or FTI Closed-End Funds under circumstances in which it is reasonably foreseeable that such shareholder
Page 38
will trade on the basis of the information. In addition, Regulation FD does not apply to all employees and officers. It only applies to certain senior officials of Resources and the FTI Closed-End Funds and those persons who regularly communicate with securities market professionals or with shareholders. Consequently, Regulation FD and the Franklin Templeton Investments Fair Disclosure Policies and Procedures (the “Policies and Procedures”) will not apply to a variety of legitimate, ordinary-course business communications or to disclosures made to the media. Irrespective of Regulation FD, all Franklin personnel must comply with the “Franklin Templeton Investment Policy Statement on Insider Trading” and should be aware that disclosure of material nonpublic information to another person may constitute a form of illegal insider trading called “tipping.”
| B. | FTI’S CORPORATE POLICY FOR REGULATION FD |
Franklin Templeton Investments is committed to complying with Regulation FD by making fair disclosure of information about Resources or FTI Closed-End Funds without advantage to any particular securities market professional, shareholder or investor. It is not the intention of these Policies and Procedures, however, to interfere with legitimate, ordinary-course business communications or disclosures made to the media or governmental agencies. FTI believes it is in its best interest to maintain an active and open dialogue with securities market professionals, shareholders and investors regarding Resources and the FTI Closed-End Funds. FTI will continue to provide current and potential shareholders access to key information reasonably required for making an informed decision on whether to invest in shares of Resources or FTI Closed-End Funds. FTI personnel will make appropriate announcements and conduct interviews about Resources and FTI Closed-End Funds with the media, in accordance with Corporate Communication’s policies and procedures regarding such announcements or interviews.
| C. | GENERAL PROVISIONS OF REGULATION FD |
WHENEVER:
| | (1) | AN ISSUER, OR PERSON ACTING ON ITS BEHALF (i.e. any senior official or any other officer, employee or agent of an issuer (or issuer’s investment adviser) who regularly communicates with securities professionals or shareholders, or any employee directed to make a disclosure by a member of senior management) |
| | (2) | DISCLOSES MATERIAL NON-PUBLIC INFORMATION |
| | (3) | TO CERTAIN SPECIFIED PERSONS (generally, securities market professionals or holders of the issuer’s securities who may trade on the basis of the information) |
THEN:
| | (4) | the issuer must make public disclosure of that same information: |
| | • | simultaneously (for intentional disclosures), or |
| | • | promptly (for non-intentional disclosures). |
In the case of non-intentional disclosures, “promptly” means no later than 24 hours (or the commencement of the next day’s trading on the NYSE, whichever is later), after a senior official learns of the disclosure and knows, or is reckless in not knowing, that the information is both material and non-public.
Page 39
| D. | PERSONS TO WHOM SELECTIVE DISCLOSURE MAY NOT BE MADE: |
| | (1) | BROKER-DEALERS and their associated persons; |
| | (2) | INVESTMENT ADVISERS, certain institutional investment managers and their associated persons, |
| | (3) | INVESTMENT COMPANIES, hedge funds and their affiliated persons, and |
| | (4) | HOLDERS OF THE ISSUER’S SECURITIES, under circumstances where it is reasonably foreseeable that such person would purchase or sell securities on the basis of the information. |
The Regulation is designed to cover sell-side analysts, buy-side analysts, institutional investment managers, and other market professionals who may be likely to trade on the basis of selectively disclosed information.
| E. | EXCLUSIONS FROM REGULATION FD |
SELECTIVE DISCLOSURES MAY BE MADE TO THE FOLLOWING AND NOT VIOLATE REGULATION FD:
| (1) | communications to “temporary insiders” who owe a duty of trust or confidence to the issuer (i.e. attorneys, investment bankers, or accountants); |
| (2) | any person who expressly agrees to maintain the information in confidence (i.e., disclosures by a public company to private investors in private offerings); |
| (3) | an entity whose primary business is the issuance of a credit rating, if the information is disclosed for the sole purpose of developing such ratings and the entity’s ratings are publicly available; and |
| (4) | communications made in connection with most offerings of securities registered under the Securities Act of 1933. |
| F. | METHODS OF PUBLIC DISCLOSURE: |
An issuer’s disclosure obligation may be met by any method reasonably designed to provide broad, non-exclusionary distribution of the information to the public. Acceptable methods of public disclosure include:
| | • | Furnishing or filing with the SEC a Form 8-K (not applicable to closed-end investment companies); |
| | • | press releases distributed through a widely circulated news or wire service; or |
| | • | announcements made through press conferences or conference calls that interested members of the public may attend or listen to either in person, by telephonic transmission, or by other electronic transmission (including use of the Internet), of which the public has adequate notice and means of access. |
Posting of new information on an issuer’s own website is NOT by itself a sufficient method of public disclosure. It may be used in combination with other methods.
Page 40
Appropriate training will be provided to certain employees identified as follows:
| | • | Corporate Communications Department |
| | • | Portfolio managers of FTI Closed-End Funds and their assistants; |
| | • | Managers and supervisors of Customer Services Representatives. |
As part of this training, each employee will be notified that they should not communicate on substantive matters involving Franklin Resources Inc., or the FTI Closed-End Funds except in accordance with these Policies and Procedures.
All inquiries regarding these Policie and Procedures should be addressed to Barbara Green, Deputy General Counel (650-525-7188, or Jim Davis, Director, Global Compliance (650-312-2832).
| I. | FREQUENTLY ASKED QUESTIONS: |
| | (1) | WHEN IS DISCLOSURE CONSIDERED INTENTIONAL WITHIN THE MEANING OF REGULATION FD? |
Under Regulation FD, selective disclosure is considered intentional when the issuer (or person acting on its behalf) knows, or is reckless in not knowing, that the information disclosed is BOTH material and non-public. For example, non-intentional selective disclosures may occur when company officials inadvertently disclose material information in response to questions from analysts or shareholders or when a decision is made to selectively disclose information that the company does not view as material but the market moves in response to the disclosure.
| | (2) | WHAT IS NON-PUBLIC INFORMATION? |
Information is non-public if it has not been disseminated in a manner making it available to investors generally.
| | (3) | WHAT IS MATERIAL INFORMATION? |
Regulation FD deems information material if “there is a substantial likelihood that a reasonable shareholder would consider it important” in making an investment decision or if there a substantial likelihood that a fact would be viewed by a reasonable investor as having “significantly altered the ‘total mix’ of information made available.”
| | (4) | ARE THERE SPECIFIC TYPES OF INFORMATION THAT ARE CONSIDERED MATERIAL? |
There is no bright line test to determine materiality. However, below is a list of items that should be reviewed carefully to determine whether they are material.
| | • | An impending departure of a portfolio manager who is primarily responsible for day-to-day management of a Closed-End Fund; |
| | • | A plan to convert a Closed-End Fund from a closed-end investment company to an open-end investment company; |
| | • | A plan to merge a Closed-End Fund into another investment company; |
| | • | Impending purchases or sales of particular portfolio securities; |
Page 41
| | • | Information about Resources related to earnings or earnings forecasts; |
| | • | Mergers, acquisitions, tender offers, joint ventures, or material change in assets; |
| | • | Changes in control or in management; |
| | • | Change in auditors or auditor notification that the issuer may no longer rely on an auditor’s audit report; |
| | • | Events regarding Resources or an FTI Closed-End Fund’s securities - e.g., repurchase plans, stock splits or changes in dividends, calls of securities for redemption, changes to the rights of security holders, public or private sales of additional securities; and |
| | • | Bankruptcies or receiverships. |
| | (5) | ARE ALL ISSUER COMMUNICATIONS COVERED BY THE RULE? |
No. Regulation FD applies only to communications by the issuer’s senior management, its investor relations professionals and others who regularly communicate with securities market professionals and security holders when those communications are made to securities market professionals and security holders under circumstances in which it is reasonably foreseeable that the holders will trade on the basis of the information. Regulation FD isn’t intended to apply to persons who are engaged in ordinary-course business communications with the issuer or to interfere with disclosures to the media. However, the traditional disclosure concerns (such as “tipping” material non-public information and leaking disclosure into the market) still apply.
| | (6) | ARE COMMUNICATIONS TO THE MEDIA COVERED BY REGULATION FD? |
No. However, an interview with a reporter is not the best way to disseminate material information to the public and is not a method of public disclosure mentioned by the SEC as a means to satisfy Regulation FD.
(7) ARE ONE-ON-ONE DISCUSSIONS WITH ANALYSTS PERMITTED?
Yes. Regulation FD is not intended to undermine the role of analysts in “sifting through and extracting information that may not be significant to the ordinary investor to reach material conclusions.” However, persons covered by Regulation FD must be cautious not to selectively provide material non-public information in one-on-one discussions. (This may be confusing to some - perhaps this should be deleted).
| | (8) | MAY ISSUERS PROVIDE GUIDANCE ON EARNINGS? |
Not selectively. Although many issuers have historically provided earnings guidance, the SEC observed in Regulation FD’s adopting release that an issuer that has a private conversation with an analyst in which the issuer provides direct or indirect guidance as to whether earnings will be higher than, lower than or even the same as forecasted will likely violate the rule. Regulation FD may be violated simply by confirming in a non-public manner an earnings forecast that is already public, because such confirmation may be material.
Page 42
| J. | SUPPLEMENTAL INFORMATION—SEC’S DIVISION OF COPORATE FINANCE |
| | (1) | INTERPRETATIONS ISSUED OCTOBER 2000 |
| 1. | CAN AN ISSUER EVER CONFIRM SELECTIVELY A FORECAST IT HAS PREVIOUSLY MADE TO THE PUBLIC WITHOUT TRIGGERING THE RULE’S PUBLIC REPORTING REQUIREMENTS? |
Yes. In assessing the materiality of an issuer’s confirmation of its own forecast, the issuer should consider whether the confirmation conveys any information above and beyond the original forecast and whether that additional information is itself material. That may depend on, among other things, the amount of time that has elapsed between the original forecast and the confirmation (or the amount of time elapsed since the last public confirmation, if applicable). For example, a confirmation of expected quarterly earnings made near the end of a quarter might convey information about how the issuer actually performed. In that respect, the inference a reasonable investor may draw from such a confirmation may differ significantly from the inference he or she may have drawn from the original forecast early in the quarter. The materiality of a confirmation also may depend on, among other things, intervening events. For example, if it is clear that the issuer’s forecast is highly dependent on a particular customer and the customer subsequently announces that it is ceasing operations, a confirmation by the issuer of a prior forecast may be material.
We note that a statement by an issuer that it has “not changed,” or that it is “still comfortable with,” a prior forecast is no different than a confirmation of a prior forecast. Moreover, under certain circumstances, an issuer’s reference to a prior forecast may imply that the issuer is confirming the forecast. If, when asked about a prior forecast, the issuer does not want to confirm it, the issuer may simply wish to say “no comment.” If an issuer wishes to refer back to the prior estimate without implicitly confirming it, the issuer should make clear that the prior estimate was as of the date it was given and is not being updated as of the time of the subsequent statement.
| 2. | DOES REGULATION FD CREATE A DUTY TO UPDATE? |
No. Regulation FD does not change existing law with respect to any duty to update.
| 3. | IF AN ISSUER WANTS TO MAKE PUBLIC DISCLOSURE OF MATERIAL NONPUBLIC INFORMATION UNDER REGULATION FD BY MEANS OF A CONFERENCE CALL, WHAT INFORMATION MUST THE ISSUER PROVIDE IN THE NOTICE AND HOW FAR IN ADVANCE SHOULD NOTICE BE GIVEN? |
An adequate advance notice under Regulation FD must include the date, time, and call-in information for the conference call. Issuers also should consider the following non-exclusive factors in determining what constitutes adequate advance notice of a conference call:
| | • | TIMING: Public notice should be provided a reasonable period of time ahead of the conference call. For example, for a quarterly earnings announcement that the issuer makes on a regular basis, notice of several days would be reasonable. We recognize, however, that the period of notice may be shorter when unexpected events occur and the information is critical or time sensitive. |
| | • | AVAILABILITY: If a transcript or re-play of the conference call will be available after it has occurred, for instance via the issuer’s website, we encourage issuers to indicate in the notice how, and for how long, such a record will be available to the public. |
Page 43
| 4. | CAN AN ISSUER SATISFY REGULATION FD’S PUBLIC DISCLOSURE REQUIREMENT BY DISCLOSING MATERIAL NONPUBLIC INFORMATION AT A SHAREHOLDER MEETING THAT IS OPEN TO ALL SHAREHOLDERS, BUT NOT TO THE PUBLIC? |
No. If a shareholder meeting is not accessible by the public, an issuer’s selective disclosure of material nonpublic information at the meeting would not satisfy Regulation FD’s public disclosure requirement.
| 5. | COULD AN EXCHANGE ACT FILING OTHER THAN A FORM 8-K, SUCH AS A FORM 10-Q OR PROXY STATEMENT, CONSTITUTE PUBLIC DISCLOSURE? |
Yes. In general, including information in a document publicly filed on EDGAR with the SEC within the time frames that Regulation FD requires would satisfy the rule. In considering whether that disclosure is sufficient, however, companies must take care to bring the disclosure to the attention of readers of the document, must not bury the information, and must not make the disclosure in a piecemeal fashion throughout the filing.
| 6. | FOR PURPOSES OF REGULATION FD, MUST AN ISSUER WAIT SOME PERIOD OF TIME AFTER MAKING A FILING OR FURNISHING A REPORT ON EDGAR THAT COMPLIES WITH THE EXCHANGE ACT BEFORE MAKING DISCLOSURE OF THE SAME INFORMATION TO A SELECT AUDIENCE? |
Prior to making disclosure to a select audience, the issuer need only confirm that the filing or furnished report has received a filing date (as determined in accordance with Rules 12 and 13 of Regulation S-T) that is no later than the date of the selective disclosure.
| 7. | CAN AN ISSUER EVER REVIEW AND COMMENT ON AN ANALYST’S MODEL PRIVATELY WITHOUT TRIGGERING REGULATION FD’S DISCLOSURE REQUIREMENTS? |
Yes. It depends on whether, in so doing, the issuer communicates material nonpublic information. For example, an issuer ordinarily would not be conveying material nonpublic information if it corrected historical facts that were a matter of public record. An issuer also would not be conveying such information if it shared seemingly inconsequential data which, pieced together with public information by a skilled analyst with knowledge of the issuer and the industry, helps form a mosaic that reveals material nonpublic information. It would not violate Regulation FD to reveal this type of data even if, when added to the analyst’s own fund of knowledge, it is used to construct his or her ultimate judgments about the issuer. An issuer may not, however, use the discussion of an analyst’s model as a vehicle for selectively communicating - either expressly or in code - material nonpublic information.
| 8. | DURING A NONPUBLIC MEETING WITH ANALYSTS, AN ISSUER’S CEO PROVIDES MATERIAL NONPUBLIC INFORMATION ON A SUBJECT SHE HAD NOT PLANNED TO COVER. ALTHOUGH THE CEO HAD NOT PLANNED TO DISCLOSE THIS INFORMATION WHEN SHE ENTERED THE MEETING, AFTER HEARING THE DIRECTION OF THE DISCUSSION, SHE DECIDED TO PROVIDE IT, KNOWING THAT THE INFORMATION WAS MATERIAL AND NONPUBLIC. WOULD THIS BE CONSIDERED AN INTENTIONAL DISCLOSURE THAT VIOLATED REGULATION FD BECAUSE NO SIMULTANEOUS PUBLIC DISCLOSURE WAS MADE? |
Yes. A disclosure is “intentional” under Regulation FD when the person making it either knows, or is reckless in not knowing, that the information he or she is communicating is both material and nonpublic. In this example, the CEO knew that the information was material and nonpublic, so the disclosure was “intentional” under Regulation FD, even though she did not originally plan to make it.
| 9. | MAY AN ISSUER PROVIDE MATERIAL NONPUBLIC INFORMATION TO ANALYSTS AS LONG AS THE ANALYSTS EXPRESSLY AGREE TO MAINTAIN CONFIDENTIALITY UNTIL THE INFORMATION IS PUBLIC? |
Yes.
Page 44
| 10. | IF AN ISSUER GETS AN AGREEMENT TO MAINTAIN MATERIAL NONPUBLIC INFORMATION IN CONFIDENCE, MUST IT ALSO GET THE ADDITIONAL STATEMENT THAT THE RECIPIENT AGREES NOT TO TRADE ON THE INFORMATION IN ORDER TO RELY ON THE EXCLUSION IN RULE 100(B)(2)(II) OF REGULATION FD? |
No. An express agreement to maintain the information in confidence is sufficient. If a recipient of material nonpublic information subject to such a confidentiality agreement trades or advises others to trade, he or she could face insider trading liability.
| 11. | IF AN ISSUER WISHES TO RELY ON THE CONFIDENTIALITY AGREEMENT EXCLUSION OF REGULATION FD, IS IT SUFFICIENT TO GET AN ACKNOWLEDGMENT THAT THE RECIPIENT OF THE MATERIAL NONPUBLIC INFORMATION WILL NOT USE THE INFORMATION IN VIOLATION OF THE FEDERAL SECURITIES LAWS? |
No. The recipient must expressly agree to keep the information confidential.
| 12. | MUST ROAD SHOW MATERIALS IN CONNECTION WITH A REGISTERED PUBLIC OFFERING BE DISCLOSED UNDER REGULATION FD? |
Any disclosure made “in connection with” a registered public offering of the type excluded from Regulation FD is not subject to Regulation FD. That includes road shows in those offerings. All other road shows are subject to Regulation FD in the absence of another applicable exclusion from Regulation FD. For example, a disclosure in a road show in an unregistered offering is subject to Regulation FD. Also, a disclosure in a road show made while the issuer is not in registration and is not otherwise engaged in a securities offering is subject to Regulation FD. If, however, those who receive road show information expressly agree to keep the material nonpublic information confidential, disclosure to them is not subject to Regulation FD.
| 13. | CAN AN ISSUER DISCLOSE MATERIAL NONPUBLIC INFORMATION TO ITS EMPLOYEES (WHO MAY ALSO BE SHAREHOLDERS) WITHOUT MAKING PUBLIC DISCLOSURE OF THE INFORMATION? |
Yes. Rule 100(b)(1) states that Regulation FD applies to disclosures made to “any person outside the issuer.” Regulation FD does not apply to communications of confidential information to employees of the issuer. An issuer’s officers, directors, and other employees are subject to duties of trust and confidence and face insider trading liability if they trade or tip.
| 14. | IF AN ISSUER HAS A POLICY THAT LIMITS WHICH SENIOR OFFICIALS ARE AUTHORIZED TO SPEAK TO PERSONS ENUMERATED IN RULE 100(B)(1)(I) - (B)(1)(IV), WILL DISCLOSURES BY SENIOR OFFICIALS NOT AUTHORIZED TO SPEAK UNDER THE POLICY BE SUBJECT TO REGULATION FD? |
No. Selective disclosures of material nonpublic information by senior officials not authorized to speak to enumerated persons are made in breach of a duty of trust or confidence to the issuer and are not covered by Regulation FD. Such disclosures may, however, trigger liability under existing insider trading law.
| 15. | A PUBLICLY TRADED COMPANY HAS DECIDED TO CONDUCT A PRIVATE PLACEMENT OF SHARES AND THEN SUBSEQUENTLY REGISTER THE RESALE BY THOSE SHAREHOLDERS ON A FORM S-3 REGISTRATION STATEMENT. THE COMPANY AND ITS INVESTMENT BANKERS CONDUCT MINI-ROAD SHOWS OVER A THREE-DAY PERIOD DURING THE PRIVATE PLACEMENT. DOES THE RESALE REGISTRATION STATEMENT FILED AFTER COMPLETION OF |
Page 45
| | THE PRIVATE PLACEMENT AFFECT WHETHER DISCLOSURE AT THE ROAD SHOWS IS COVERED BY REGULATION FD? |
No. The road shows are made in connection with an offering by the issuer that is not registered (i.e., the private placement), regardless of whether a registration statement is later filed for an offering by those who purchased in the private placement.
| | ( 2) | ADDITIONAL INTERPRETATIONS ISSUED DECEMBER 2000 |
| 16. | DOES THE MERE PRESENCE OF THE PRESS AT AN OTHERWISE NON-PUBLIC MEETING ATTENDED BY PERSONS OUTSIDE THE ISSUER DESCRIBED IN PARAGRAPH (B)(1) OF RULE 100 UNDER REGULATION FD RENDER THE MEETING PUBLIC FOR PURPOSES OF REGULATION FD? |
Regulation FD states that a company can make public disclosure by filing or furnishing a Form 8-K or by disseminating information through another method (or combination of methods) that is reasonably designed to provide broad, non-exclusionary distribution of the information to the public. Some companies may attempt to satisfy the latter method for public dissemination by merely having the press in attendance at a meeting to which the public is not invited or otherwise present. If it is attended by persons outside the issuer described in paragraph (b)(1) of Rule 100 under Regulation FD and if it is not otherwise public, the meeting will not necessarily be deemed public for purposes of Regulation FD by the mere presence of the press at the meeting. Whether or not the meeting would be deemed public would depend, among other things, on when, what and how widely the press reports on the meeting.
| 17. | IS REGULATION FD INTENDED TO REPLACE THE PRACTICE OF USING A PRESS RELEASE TO DISSEMINATE EARNINGS INFORMATION IN ADVANCE OF A CONFERENCE CALL OR WEBCAST AT WHICH EARNINGS INFORMATION WILL BE DISCUSSED? |
No. In adopting Regulation FD, the Commission specifically indicated that it did not intend the regulation to alter or supplant the rules of self-regulatory organizations with respect to the use of press releases to announce material developments. In this regard, the Commission specifically endorsed a model for the planned disclosure of material information, such as earnings, in which the conference call or webcast is preceded by a press release containing the earnings information.
SUPPLEMENTAL MEMORANDUM
CHINESE WALL PROCEDURES
Under The Chinese Wall, access persons from Advisory Groups (as defined in Appendix A) are prohibited from having access to investment information of an Advisory Group other than his or her own Advisory Group with the following exception: Access persons to Floating Rate may have access to Investment Information of Franklin Templeton, but access persons to Franklin Templeton may not have access to Floating Rate.
The Chinese Wall applies to all access persons, including part-time employees, and consultants, and are in addition to those obligations prescribed by Franklin Templeton Code of Ethics (the “Code of Ethics”).
Page 46
Questions regarding these procedures should be directed to the attention of Jim Davis, Legal Compliance Department, at 650-312-2832 or e-mailed to:
jdavis@frk.com.
GENERAL PROCEDURES
CONFIDENTIALITY. Access persons within one Advisory Group (e.g., Franklin Templeton) may not disclose Investment Information to access persons of the other Advisory Group (e.g., Franklin Mutual). Any communication of Investment Information outside an Advisory Group should be limited to persons (such as Accounting, Investment Operations, Legal and Compliance personnel) who have a valid “need to know” such information and each of whom is specifically prohibited from disclosing Investment Information from one to another except when necessary for regulatory purposes. Nothing contained herein is designed to prohibit the proper exchange of accounting, operational, legal or compliance information among such persons in the normal course of performing his or her duties.
DISCUSSIONS. Access persons within one Advisory Group should avoid discussing Investment Information in the presence of persons who do not have a need to know the information. Extreme caution should be taken with discussions in public places such as hallways, elevators, taxis, airplanes, airports, restaurants, and social gatherings. Avoid discussing confidential information on speakerphones. Mobile telephones should be used with great care because they are not secure.
ACCESS. Access persons should limit physical access to areas where confidential or proprietary information may be present or discussed. Only persons with a valid business reason for being in such an area should be permitted. In this regard, meetings with personnel who are not members of the same Advisory Group should be conducted in conference rooms rather than employee offices. Work on confidential projects should take place in areas that are physically separate and secure.
OUTSIDE INQUIRIES. Any person not specifically authorized to respond to press or other outside inquiries concerning a particular matter should refer all calls relating to the matter to the attention of Holly Gibson-Brady, Director, Corporate Communications, Franklin Templeton Investments, in San Mateo, California, at (650) 312-4701.
DOCUMENTS AND DATABASES. Confidential documents should not be stored in common office areas where unauthorized persons may read them. Such documents should be stored in secure locations and not left exposed overnight on desks or in workrooms.
Confidential databases and other confidential information accessible by computer should be protected by passwords or otherwise secured against access by unauthorized persons.
FAXING PROCEDURES. Confidential documents should not be faxed to locations where they may be read by unauthorized persons, including to other FRI offices outside the Advisory Group, unless steps have been taken to remove or redact any confidential information included in such documents. Prior to faxing a document that includes confidential information, the sender should confirm that the recipient is attending the machine that receives such documents.
THE CHINESE WALL
GENERAL. FRI has adopted the Chinese Wall to separate investment management activities conducted by certain investment advisory subsidiaries of FRI. The Chinese Wall may be amended or supplemented from time to time by memoranda circulated by the Legal Compliance Department.
Page 47
CHINESE WALL RESTRICTIONS. Except in accordance with the Wall-crossing procedures described below or in accordance with such other procedures as may be developed by the Legal Compliance Department for a particular department or division:
| • | No access person in any Advisory Group (as defined in Appendix A) should disclose Investment Information to any access person in the any other Advisory Group, or give such access persons access to any file or database containing such Investment Information; and |
| • | No access person in any Advisory Group should obtain or make any effort to obtain Investment Information within the any other Advisory Group from any person. |
An access person who obtains Investment Information of an Advisory Group other than his or her own in a manner other than in accordance with the Chinese Wall procedures described herein, should immediately notify an appropriate supervisory person in his or her department who, in turn, should consult with the Legal Compliance Department concerning what, if any, action should be taken. Unless expressly advised to the contrary by the Legal Compliance Department, such employee should refrain from engaging in transactions in the related securities or other securities of the related issuer for any account and avoid further disclosure of the information.
CROSSING PROCEDURES. Disclosure of Investment Information of one Advisory Group to an access person in another Advisory Group on a “need to know” basis in the performance of his or her duties, should be made only if absolutely necessary. In such instance, the disclosure of such information may be made only in accordance with the specific procedures set forth below.
An access person within one Advisory Group must obtain prior approval from the Legal Compliance Department before making any disclosure of Investment Information to an access person within the other Advisory Group.
Before approval is granted, the Legal Compliance Department must be notified in writing by an Executive Officer within the Advisory Group (the “Originating Group”) which proposes to cross the Chinese Wall of (1) the identity of the Advisory Group access person(s) who are proposed to cross the Chinese Wall, (2) the identity of the access person(s) in the other Advisory Group (the “Receiving Group”) who are proposed to receive the Investment Information, (3) the applicable issuer(s), (4) the nature of the information to be discussed, and (5) the reason for crossing the Chinese Wall. The form of notice is attached to this Memorandum as Appendix B.
The Legal Compliance Department will notify an Executive Officer within the Receiving Group of the identity of the access person(s) who are proposed to cross the Chinese Wall. The Legal Compliance Department may not disclose any additional information to such person.
If approval is obtained from an Executive Officer within the Receiving Group, the Legal Compliance Department will notify the requesting Executive Officer in the Originating Group that the proposed Wall-crosser(s) may be contacted. Personnel from the Legal Compliance Department or their designees must attend all meetings where Wall-crossing communications are made. Communications permitted by these crossing procedures should be conducted in a manner not to be overheard or received by persons not authorized to receive confidential information.
The Legal Compliance Department will maintain a record of Wall-crossings.
Page 48
An access person who has crossed the Chinese Wall under these procedures must maintain the confidentiality of the Investment Information received and may use it only for the purposes for which it was disclosed.
Any questions or issues arising in connection with these crossing procedures will be resolved between the appropriate Executive Officers(s), the Legal Compliance Department and the Legal Department.
APPENDIX A
FRANKLIN TEMPLETON INVESTMENT’S ADVISORY GROUPS (12/02)
| 1. | FRANKLIN/TEMPLETON ADVISORY GROUP |
Franklin Advisers, Inc.
Franklin Advisory Services, LLC
Franklin Investment Advisory Services, Inc.
Franklin Private Client Group, Inc.
Franklin Templeton Investments Corp (Canada)
Franklin Templeton Investment Management, Limited (UK)
Franklin Templeton Investments Japan, Ltd.
Franklin Templeton Investments Australia Limited
FTI Institutional, LLC
Franklin Templeton Asset Strategies, LLC
Franklin Templeton Investments (Asia) Limited
Franklin Templeton Asset Management S.A., (France)
Templeton/Franklin Investment Services, Inc.
Templeton Investment Counsel, LLC
Templeton Asset Management, Limited.
Templeton Global Advisors Limited (Bahamas)
Templeton Asset Management (India) Pvt. Ltd.
Fiduciary Trust Company International (NY)
Fiduciary International, Inc.
Fiduciary Investment Management International, Inc.
Fiduciary Trust International Asia Limited (Hong Kong)
Fiduciary Trust International Australia Limited
Fiduciary Trust International Limited (UK)
Fiduciary Trust International Investment Management, Inc. (Japan)
Page 49
Fiduciary Trust International of California
Fiduciary Trust International of the South (Florida)
FTI -Banque Fiduciary Trust (Switzerland)
| 2. | FRANKLIN FLOATING RATE TRUST ADVISORY GROUP |
| 3. | FRANKLIN MUTUAL ADVISORY GROUP |
APPENDIX B
M E M O R A N D U M
TO: The Legal Compliance Department - San Mateo
FROM:
RE: Chinese Wall Crossing
DATE:
The following access person(s)
Name Title Department
within the Advisory Group are proposing to cross the Chinese Wall and communicate certain Investment Information to the access persons within the Advisory Group identified below.
Name Title Department
Such access person(s) will cross the Chinese Wall with respect to the following issuer:
The following is a description of the nature of the information to be discussed by such access person(s):
Page 50
Modified on
Code of Ethics Revised 12-03-02 Readonly.doc
| | | | |
APPROVED: | | | | |
| | |
| | |
| | | EXECUTIVE OFFICER (ORIGINATING GROUP) | | |
| | |
| | | | | |
| | |
| | |
| | | Executive Officer (Receiving Group) | | |
| 1 | “Director” includes trustee. |
| 2 | The term “employee or employees” includes futures associates, as well as regular employees of Franklin Templeton Investments. |
| 3 | SEE Appendix A. II., for definition of “Proprietary Accounts.” |
| 4 | Generally, a person has “beneficial ownership” in a security if he or she, directly or indirectly, through any contract, arrangement, understanding, relationship or otherwise, has or shares a direct or indirect pecuniary interest in the security. There is a presumption of a pecuniary interest in a security held or acquired by a member of a person’s immediate family sharing the same household. |
| 5 | Proprietary Information: Information that is obtained or developed during the ordinary course of employment with Franklin Templeton Investments, whether by you or someone else, and is not available to persons outside of Franklin Templeton Investments. Examples of such Proprietary Information include, among other things, internal research reports, research materials supplied to Franklin Templeton Investments by vendors and broker-dealers not generally available to the public, minutes of departmental/research meetings and conference calls, and communications with company officers (including confidentiality agreements). Examples of non-Proprietary Information include mass media publications (e.g., The Wall Street Journal, Forbes, and Fortune), certain specialized publications available to the public (e.g., Morningstar, Value Line, Standard and Poors), and research reports available to the general public. |
| 6 | The Director, Global Compliance is designated on Schedule A. The “Appropriate Analyst” means any securities analyst or portfolio manager, other than you, |
Page 51
| | making recommendations or investing funds on behalf of any associated client, who may be reasonably expected to recommend or consider the purchase or sale of the security in question. |
| 7 | Associated Client: A Fund or client who’s trading information would be available to the access person during the course of his or her regular functions or duties. |
| 8 | This restriction applies equally to transactions occurring in margin and option accounts, which may not be due to direct actions by the Portfolio Person. For example, a stock held less than 60 days that is sold to meet a margin call or the underlying stock of a covered call option held less than 60 days that is called away, would be a violation of this restriction if these transactions resulted in a profit for the Portfolio Person. |
| 9 | You are not required to separately report the vesting of shares or options of Franklin Resources, Inc., received pursuant to a deferred compensation plan as such information is already maintained. |
| 10 | See Sections 3.2 and 4.6 of the Code. Also, confirmations and statements of transactions in open-end mutual funds, including mutual funds sponsored by Franklin Templeton Investments are not required. See Section 3.3 above for a list of other securities that need not be reported. If you have any beneficial ownership in a discretionary account, transactions in that account are treated as yours and must be reported by the manager of that account (see Section 6.1.C below). |
| 11 | Officers, directors and certain other key management personnel who perform significant policy-making functions of Franklin Resources, Inc., the closed-end funds, and/or real estate investment trusts may have ownership reporting requirements in addition to these reporting requirements. Contact the Legal Compliance Department for additional information. SEE also the “Insider Trading Policy” attached. |
| 12 | Please note that these conditions apply to any discretionary account in existence prior to the effective date of this Code or prior to your becoming an access person. Also, the conditions apply to transactions in any discretionary account, including pre-existing accounts, in which you have any direct or indirect beneficial ownership, even if it is not in your name. |
| 13 | Any pre-existing agreement must be promptly amended to comply with this condition. The required reports may be made in the form of an account statement if they are filed by the applicable deadline. |
| 14 | An “advisory person” of a registered investment company or an investment adviser is any employee, who in connection with his or her regular functions or duties, makes, participates in, or obtains information regarding the purchase or sale of a security by an advisory client, or whose functions relate to the making of any recommendations with respect to such purchases or sales. Advisory person also includes any natural person in a control relationship to such company or investment adviser who obtains information concerning recommendations made to such company with regard to the purchase or sale of a security. |
| 15 | Generally, an “advisory representative” is any person who makes any recommendation, who participates in the determination of which recommendation shall be made, or whose functions or duties relate to the determination of which recommendation shall be made, or who, in connection with his duties, obtains any information concerning which securities are being recommended prior to the effective dissemination of such recommendations or of the information concerning such recommendations. See Section II of Appendix A for the legal definition of “Advisory Representative.” |
Page 52
| 16 | Security includes any option to purchase or sell, and any security that is exchangeable for or convertible into, any security that is held or to be acquired by a fund. |
| 17 | Special circumstances include but are not limited to, for example, differences in time zones, delays due to travel, and the unusual size of proposed trades or limit orders. Limit orders must expire within the applicable clearance period. |
| 19 | If an investment opportunity is presented to you in your capacity as a portfolio manager AND the investment opportunity is suitable for the fund/ client, it must first be offered to the fund/client before any personal securities transaction can be effected. |
Page 53
| Item 3. | | Audit Committee Financial Expert. |
(a) (1) The registrant has an audit committee financial expert serving on its audit committee.
(2) The audit committee financial expert is Frank W.T. LaHaye, and he is “independent” as defined under the relevant Securities and Exchange Commission Rules and Releases.
| Item 4. | | Principal Accountant Fees and Services |
(a) Audit Fees
The aggregate fees paid to the principal accountant for professional services rendered by the principal accountant for the audit of the registrant’s annual financial statements or for services that are normally provided by the principal accountant in connection with statutory and regulatory filings or engagements were $430,529 for the fiscal year ended December 31, 2003 and $446,500 for the fiscal year ended December 31, 2002.
(b) Audit-Related Fees
The aggregate fees paid to the principal accountant for assurance and related services rendered by the principal accountant to the registrant that are reasonably related to the performance of the audit of the registrant’s financial statements and are not reported under paragraph (a) of Item 4 were $0 for the fiscal year ended December 31, 2003 and $5,998 for the fiscal year ended December 31, 2002. The services for which these fees were paid included payments for internal control examination pursuant to the Statement of Auditing Standards No. 70 and other attestation services.
The aggregate fees paid to the principal accountant for assurance and related services rendered by the principal accountant to the registrant’s investment adviser and any entity controlling, controlled by or under common control with the investment adviser that provides ongoing services to the registrant that are reasonably related to the performance of the audit of the their financial statements were $337,344 for the fiscal year ended December 31, 2003 and $357,762 for the fiscal year ended December 31, 2002. The services for which these fees were paid included payments for internal control examination pursuant to the Statement of Auditing Standards No. 70 and other attestation services.
(c) Tax Fees
There were no fees paid to the principal accountant for professional services rendered by the principal accountant to the registrant for tax compliance, tax advice and tax planning.
The aggregate fees paid to the principal accountant for professional services rendered by the principal accountant to the registrant’s investment adviser and any entity controlling, controlled by or under common control with the investment adviser that provides ongoing services to the registrant for tax compliance, tax advice and tax planning were $2,760 for the fiscal year ended December 31, 2003 and $84,424 for the fiscal year ended December 31, 2002. The services for which these fees were paid included payments for tax compliance and advice.
(d) All Other Fees
There were no fees paid to the principal accountant for products and services rendered by the principal accountant to the registrant, other than the services reported in paragraphs (a)-(c) of Item 4.
There were no fees paid to the principal accountant for products and services rendered by the principal accountant to the registrant’s investment adviser and any entity controlling, controlled by or under
common control with the investment adviser that provides ongoing services to the registrant, other than the services reported in paragraphs (a)-(c) of Item 4.
(e) (1) The Fund’s audit committee is directly responsible for approving the services to be provided by the auditors, including:
(i) pre-approval of all audit and audit related services;
(ii) pre-approval of all non-audit related services to be provided to the Fund by the auditors;
(iii) pre-approval of all non-audit related services to be provided to the Fund by the auditors to the Fund’s investment adviser or to any entity that controls, is controlled by or is under common control with the Fund’s investment adviser and that provides ongoing services to the Fund where the non-audit services relate directly to the operations or financial reporting of the Fund; and
(iv) establishment by the audit committee, if deemed necessary or appropriate, as an alternative to committee pre-approval of services to be provided by the auditors, as required by paragraphs (ii) and (iii) above, of policies and procedures to permit such services to be pre-approved by other means, such as through establishment of guidelines or by action of a designated member or members of the committee; provided the policies and procedures are detailed as to the particular service and the committee is informed of each service and such policies and procedures do not include delegation of audit committee responsibilities, as contemplated under the Securities Exchange Act of 1934, to management; subject, in the case of (ii) through (iv), to any waivers, exceptions or exemptions that may be available under applicable law or rules.
(e) (2) None of the services provided to the registrant described in paragraphs (b)-(d) of Item 4 were pre-approved by the audit committee pursuant to paragraph (c)(7)(i)(C) of Rule 2-01 of regulation S-X.
(f) No disclosures are required by this Item 4(f).
(g) The aggregate non-audit fees paid to the principal accountant for services rendered by the principal accountant to the registrant and the registrant’s investment adviser and any entity controlling, controlled by or under common control with the investment adviser that provides ongoing services to the registrant were $340,104 for the fiscal year ended December 31, 2003 and $448,184 for the fiscal year ended December 31, 2002.
(h) No disclosures are required by this Item 4(h).
| Item 5. | | Audit Committee of Listed Registrants. N/A |
| Item 7. | | Disclosure of Proxy Voting Policies and Procedures for Closed-End Management Investment Companies. N/A |
| Item 9. | | Controls and Procedures. |
(a) Evaluation of Disclosure Controls and Procedures. The Registrant maintains disclosure controls and procedures that are designed to ensure that information required to be disclosed in the Registrant’s
filings under the Securities Exchange Act of 1934 and the Investment Company Act of 1940 is recorded, processed, summarized and reported within the periods specified in the rules and forms of the Securities and Exchange Commission. Such information is accumulated and communicated to the Registrant’s management, including its principal executive officer and principal financial officer, as appropriate, to allow timely decisions regarding required disclosure. The Registrant’s management, including the principal executive officer and the principal financial officer, recognizes that any set of controls and procedures, no matter how well designed and operated, can provide only reasonable assurance of achieving the desired control objectives.
Within 90 days prior to the filing date of this Shareholder Report on Form N-CSR, the Registrant had carried out an evaluation, under the supervision and with the participation of the Registrant’s management, including the Registrant’s principal executive officer and the Registrant’s principal financial officer, of the effectiveness of the design and operation of the Registrant’s disclosure controls and procedures. Based on such evaluation, the Registrant’s principal executive officer and principal financial officer concluded that the Registrant’s disclosure controls and procedures are effective.
(b) Changes in Internal Controls. There have been no significant changes in the Registrant’s internal controls or in other factors that could significantly affect the internal controls subsequent to the date of their evaluation in connection with the preparation of this Shareholder Report on Form N-CSR.
(A) Code of Ethics for Principal Executive and Senior Financial Officers.
(B) (1) Certifications pursuant to Section 302 of the Sarbanes-Oxley Act of 2002 of Jimmy D. Gambill, Chief Executive Officer - Finance and Administration, and Kimberley H. Monasterio, Chief Financial Officer
(B) (2) Certifications pursuant to Section 906 of the Sarbanes-Oxley Act of 2002 of Jimmy D. Gambill, Chief Executive Officer - Finance and Administration, and Kimberley H. Monasterio, Chief Financial Officer
SIGNATURES
Pursuant to the requirements of the Securities Exchange Act of 1934 and the Investment Company Act of 1940, the registrant has duly caused this report to be signed on its behalf by the undersigned, thereunto duly authorized.
| | |
| FRANKLIN TEMPLETON VARIABLE INSURANCE PRODUCTS TRUST |
| |
| By | | /s/ Jimmy D. Gambill |
| | |
|
| | | Jimmy D. Gambill |
| | | Chief Executive Officer - Finance and Administration |
| Date | | February 27, 2004 |
Pursuant to the requirements of the Securities Exchange Act of 1934 and the Investment Company Act of 1940, this report has been signed below by the following persons on behalf of the registrant and in the capacities and on the dates indicated.
| | |
| |
| By | | /s/ Jimmy D. Gambill |
| | |
|
| | | Jimmy D. Gambill |
| | | Chief Executive Officer - Finance and Administration |
| Date | | February 27, 2004 |
| | |
| Company Name |
| |
| By | | /s/ Kimberley H. Monasterio |
| | |
|
| | | Kimberley H. Monasterio |
| | | Chief Financial Officer |
| Date | | February 27, 2004 |