UNITED STATES
SECURITIES AND EXCHANGE COMMISSION
Washington, D.C. 20549
FORM N-CSR
CERTIFIED SHAREHOLDER REPORT OF REGISTERED MANAGEMENT
INVESTMENT COMPANIES
Investment Company Act file number 811-05583
Franklin Templeton Variable Insurance Products Trust
(Exact name of registrant as specified in charter)
| | |
| One Franklin Parkway, San Mateo, CA | | 94403-1906 |
| (Address of principal executive offices) | | (Zip code) |
Murray L. Simpson, One Franklin Parkway, San Mateo, CA 94403-1906
(Name and address of agent for service)
Registrant’s telephone number, including area code: (650) 312-2100
Date of fiscal year end: 12/31
Date of reporting period: 12/31/04
| Item 1. | Reports to Stockholders. |

FRANKLIN TEMPLETON VARIABLE INSURANCE PRODUCTS TRUST ANNUAL REPORT
TABLEOF CONTENTS
*Not part of the annual report
NOT FDIC INSURED | MAY LOSE VALUE | NO BANK GUARANTEE
MASTER CLASS-2
IMPORTANT NOTESTOPERFORMANCE INFORMATION
Performance data is historical and cannot predict or guarantee future results. Principal value and investment return will fluctuate with market conditions, and you may have a gain or loss when you withdraw your money. Inception dates of the funds may have preceded the effective dates of the subaccounts, contracts, or their availability in all states.
When reviewing the index comparisons, please keep in mind that indexes have a number of inherent performance differentials over the funds. First, unlike the funds, which must hold a minimum amount of cash to maintain liquidity, indexes do not have a cash component. Second, the funds are actively managed and, thus, are subject to management fees to cover salaries of securities analysts or portfolio managers in addition to other expenses. Indexes are unmanaged and do not include any commissions or other expenses typically associated with investing in securities. Third, indexes often contain a different mix of securities than the fund to which they are compared. Additionally, please remember that indexes are simply a measure of performance and cannot be invested in directly.
i
SUPPLEMENT DATED FEBRUARY 9, 2005
TOTHE PROSPECTUSES DATED MAY 1, 2004,OF:
FRANKLIN GLOBAL COMMUNICATIONS SECURITIES FUND
FRANKLIN GROWTH AND INCOME SECURITIES FUND
FRANKLIN HIGH INCOME FUND
FRANKLIN INCOME SECURITIES FUND
FRANKLIN LARGE CAP GROWTH SECURITIES FUND
FRANKLIN MONEY MARKET FUND
FRANKLIN REAL ESTATE FUND
FRANKLIN RISING DIVIDENDS SECURITIES FUND
FRANKLIN SMALL CAP FUND
FRANKLIN SMALL CAP VALUE SECURITIES FUND
FRANKLIN STRATEGIC INCOME SECURITIES FUND
FRANKLIN U.S. GOVERNMENT FUND
FRANKLIN ZERO COUPON FUND 2005
FRANKLIN ZERO COUPON FUND 2010
MUTUAL DISCOVERY SECURITIES FUND
MUTUAL SHARES SECURITIES FUND
TEMPLETON DEVELOPING MARKETS SECURITIES FUND
TEMPLETON FOREIGN SECURITIES FUND
TEMPLETON GLOBAL ASSET ALLOCATION FUND
TEMPLETON GLOBAL INCOME SECURITIES FUND
TEMPLETON GROWTH SECURITIES FUND
(FRANKLIN TEMPLETON VARIABLE INSURANCE PRODUCTS TRUST)
The prospectuses for shares of Class 1, Class 2 and Class 3 are amended by replacing the “Regulatory Update” section under “Additional Information, All Funds” (or under “Additional Information”) with the following:
On February 4, 2004, the Securities Division of the Office of the Secretary of the Commonwealth of Massachusetts filed an administrative complaint against Franklin Resources, Inc. and certain of its subsidiaries (the Company) claiming violations of the Massachusetts Uniform Securities Act (Massachusetts Act) with respect to an alleged arrangement to permit market timing (the Massachusetts Proceeding). On September 20, 2004, Franklin Resources, Inc. announced that an agreement had been reached by two of its subsidiaries, Franklin Advisers, Inc. (Advisers) and Franklin Templeton Alternative Strategies, Inc. (FTAS), with the Securities Division of the Office of the Secretary of the Commonwealth of Massachusetts (the State of Massachusetts) related to the Massachusetts Proceeding. Under the terms of the settlement consent order issued by the State of Massachusetts, Advisers and FTAS have consented to the entry of a cease and desist order and agreed to pay a $5 million administrative fine to the State of Massachusetts. The administrative complaint addressed one instance of market timing that was also a subject of the August 2, 2004 settlement that Advisers reached with the Securities and Exchange Commission described below.
SUPP-1
On November 19, 2004, the Company reached a second agreement with the State of Massachusetts regarding an administrative complaint filed on October 25, 2004. The second complaint alleged that the Company’s Form 8-K filing describing the original settlement failed to state the company had admitted the Statements of Fact portion of the settlement order when it stated, “Franklin did not admit or deny engaging in any wrongdoing.”
As a result of the November 19, 2004 settlement with the State of Massachusetts, the Company filed a new Form 8-K. The terms of the original settlement did not change and there was no monetary fine associated with this second settlement.
On November 17, 2004, the Company announced that Franklin Templeton Distributors, Inc. (Distributors) (the principal underwriter of shares of the Franklin Templeton mutual funds) reached an agreement with the California Attorney General’s Office (CAGO), resolving the issues resulting from the CAGO’s investigation concerning marketing support payments to securities dealers who sell fund shares. Under the terms of the settlement with the CAGO, Distributors has agreed to pay $2 million as a civil penalty, $14 million to Franklin Templeton funds and $2 million to the CAGO.
The Company, in addition to most of the mutual funds within Franklin Templeton Investments, has been named in shareholder class actions related to the matter described above that were filed in the United States District Courts in California, Florida, Nevada, New Jersey and New York. These parties, as well as certain of the mutual funds’ trustees/directors, have also been named in a shareholder class action filed in March 2004 in the United States District Court in New Jersey. This lawsuit alleges violations of certain provisions of the federal securities laws and state common law fiduciary obligations in connection with Rule 12b-1 fees and brokerage commissions paid by the mutual funds. These lawsuits seek damages of unspecified amounts. The Company believes that the claims made in the lawsuits are without merit and it intends to defend vigorously against the allegations. It is anticipated that additional similar civil actions related to the matters described above may be filed in the future.
On August 2, 2004, Franklin Resources, Inc. announced that Advisers (adviser to many of the funds within Franklin Templeton Investments, and an affiliate of the adviser to the other funds) had reached a settlement with the U.S. Securities and Exchange Commission (SEC) that resolved an SEC investigation of market timing activity in the Franklin Templeton Investments funds. As part of the settlement, on August 2, 2004, the SEC issued an “Order instituting administrative and cease-and-desist proceedings pursuant to sections 203(e) and 203(k) of the Investment Advisers Act of 1940 and sections 9(b) and 9(f) of the Investment Company Act of 1940, making findings and imposing remedial sanctions and a cease and desist order” (the August Order). The SEC’s August Order concerns the activities of a limited number of third parties that ended in 2000 and those that are the subject of the Massachusetts Proceeding described above.
SUPP-2
Under the terms of the SEC’s August Order, Advisers, while neither admitting nor denying any of the findings therein, has agreed to pay $50 million, of which $20 million is a civil penalty, to be distributed to fund shareholders in accordance with a plan to be developed by an Independent Distribution Consultant. Because the distribution methodology has not yet been developed, it is presently not possible to say which particular funds will be determined to have been affected or which particular groups of fund shareholders will receive distributions or in what proportion and amounts. In the August Order, the SEC notes that the Company has generally sought to detect, discourage and prevent market timing in its funds and began to increase its efforts to control market timing in 1999. The August Order also requires Advisers to, among other things:
| • | | Enhance and periodically review compliance policies and procedures, and establish a corporate ombudsman; |
| • | | Establish a new internal position whose responsibilities shall include compliance matters related to conflicts of interests; and |
| • | | Retain an Independent Distribution Consultant to develop a plan to distribute the $50 million settlement to fund shareholders. |
On December 13, 2004, the Company announced that it reached an agreement with the SEC, resolving the issues resulting from the SEC’s investigation concerning marketing support payments to securities dealers who sell fund shares. The settlement agreement relates to an order (December Order) the SEC issued instituting administrative and cease-and-desist proceedings, making findings, and imposing remedial sanctions against Distributors and Advisers. In connection with this settlement, Advisers and Distributors also agreed to implement certain measures and undertakings relating to marketing support payments to broker-dealers for the promotion or sale of Fund shares, and to make additional disclosures in the Funds’ Prospectuses and Statements of Additional Information.
Under the terms of the SEC’s December Order, Advisers and Distributors, while neither admitting nor denying any of the findings therein, agreed to pay $20 million as a civil penalty, and $1 as restitution to be distributed to Franklin Templeton funds in accordance with a plan to be developed by an Independent Distribution Consultant. Because the distribution methodology has not yet been developed, it is presently not possible to say which particular funds will be determined to have been affected or will receive distributions or in what proportion and amounts.
These issues were previously disclosed by the Company as being under investigation by government authorities and the subject of an internal inquiry by the Company in its regulatory filings and on its public website. Any further updates on these matters will be disclosed on the Company’s website at franklintempleton.com under “Statement on Current Industry Issues.”
Please keep this supplement for future reference.
SUPP-3
FRANKLIN GLOBAL COMMUNICATIONS SECURITIES FUND
We are pleased to bring you Franklin Global Communications Securities Fund’s annual report for the fiscal year ended December 31, 2004.
Performance Summary as of 12/31/04
Average annual total return of Class 2 shares* represents the average annual change in value, assuming reinvestment of dividends and capital gains. Average returns smooth out variations in returns, which can be significant; they are not the same as year-by-year results.
Periods ended 12/31/04
| | | | | | |
| | | 1-Year | | 5-Year | | 10-Year |
Average Annual Total Return | | +14.18% | | -12.79% | | +3.35% |
*Because Class 2 shares were not offered until 1/6/99, standardized Class 2 Fund performance for prior periods represents the historical results of Class 1 shares. For periods beginning on 1/6/99, Class 2’s results reflect an additional 12b-1 fee expense, which also affects future performance. Since 1/6/99 (effective date), the average annual total return of Class 2 shares was -6.20%.
Total Return Index Comparison for Hypothetical $10,000 Investment (1/1/95–12/31/04)
The graph below shows the change in value of a hypothetical $10,000 investment in the Fund over the indicated period and includes reinvestment of any income or distributions. The Fund’s performance* is compared to the performance of the Standard & Poor’s 500 Composite Index (S&P 500). One cannot invest directly in an index, nor is an index representative of the Fund’s portfolio. Please see Important Notes to Performance Information preceding the Fund Summaries.
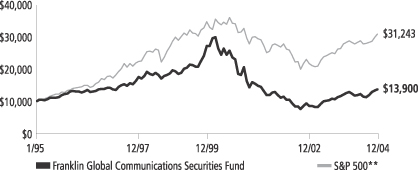
**Source: Standard & Poor’s Micropal. Please see Index Descriptions following the Fund Summaries.
Franklin Global Communications Securities Fund – Class 2
Performance reflects the Fund’s Class 2 operating expenses, but does not include any contract fees, expenses or sales charges. If they had been included, performance would be lower. These charges and deductions, particularly for variable life policies, can have a significant effect on contract values and insurance benefits. See the contract prospectus for a complete description of these expenses, including sales charges.
Performance data quoted represent past performance, which does not guarantee future results. Investment return and principal value will fluctuate, and you may have a gain or loss when you sell your shares. Current performance may differ from figures shown.
FGC-1
Fund Expenses
As an investor in a variable insurance contract (“Contract”) that indirectly provides for investment in an underlying mutual fund, you can incur transaction and/or ongoing expenses at both the Fund level and the Contract level.
| • | | Transaction expenses can include sales charges (loads) on purchases, redemption fees, surrender fees, transfer fees and premium taxes. |
| • | | Ongoing expenses can include management fees, distribution and service (12b-1) fees, contract fees, annual maintenance fees, mortality and expense risk fees and other fees and expenses. All mutual funds and Contracts have some types of ongoing expenses. |
The expenses shown in the table below are meant to highlight ongoing expenses at the Fund level only and do not include ongoing expenses at the Contract level, or transaction expenses at either the Fund or Contract levels. While the Fund does not have transaction expenses, if the transaction and ongoing expenses at the Contract level were included, the expenses shown below would be higher. You should consult your Contract prospectus or disclosure document for more information.
The table shows Fund-level ongoing expenses and can help you understand these expenses and compare them with those of other mutual funds offered through the Contract. The table assumes a $1,000 investment held for the six months indicated. Please refer to the Fund prospectus for additional information on operating expenses.
Actual Fund Expenses
The first line (Actual) for each share class listed in the table below provides actual account values and expenses. The “Ending Account Value” is derived from the Fund’s actual return, which includes the effect of ongoing Fund expenses, but does not include the effect of ongoing Contract expenses.
You can estimate the Fund-level expenses you incurred during the period, by following these steps. Of course, your account value and expenses will differ from those in this illustration:
| 1. | Divide your account value by $1,000. |
If an account had an $8,600 value, then $8,600 ÷ $1,000 = 8.6.
| 2. | Multiply the result by the number under the heading “Fund-Level Expenses Incurred During Period.” |
If Fund-Level Expenses Incurred During Period were $7.50, then 8.6 × $7.50 = $64.50.
Franklin Global Communications Securities Fund – Class 2
FGC-6
In this illustration, the estimated expenses incurred this period at the Fund level are $64.50.
Hypothetical Example for Comparison with Other Mutual Funds
Information in the second line (Hypothetical) for each class in the table can help you compare ongoing expenses of the Fund with those of other mutual funds offered through the Contract. This information may not be used to estimate the actual ending account balance or expenses you incurred during the period. The hypothetical “Ending Account Value” is based on the actual expense ratio for each class and an assumed 5% annual rate of return before expenses, which does not represent the Fund’s actual return. The figure under the heading “Fund-Level Expenses Incurred During Period” shows the hypothetical expenses your account would have incurred under this scenario. You can compare this figure with the 5% hypothetical examples that appear in shareholder reports of other funds offered through a Contract.
| | | | | | | | | |
| Class 2 | | Beginning
Account
Value 6/30/04 | | Ending
Account
Value 12/31/04 | | Fund-Level
Expenses Incurred
During Period*
6/30/04-12/31/04 |
Actual | | $ | 1,000 | | $ | 1,128.80 | | $ | 4.82 |
Hypothetical (5% return before expenses) | | $ | 1,000 | | $ | 1,020.61 | | $ | 4.57 |
*Expenses are equal to the annualized expense ratio for the Fund’s Class 2 shares (0.90%), which does not include any ongoing expenses of the Contract for which the Fund is an investment option, multiplied by the average account value over the period, multiplied by 184/366 to reflect the one-half year period.
FGC-7
Fund Goals and Main Investments: Franklin Global Communications Securities Fund seeks capital appreciation and current income. The Fund invests predominantly in investments of U.S. and foreign communications companies, which are companies that are primarily engaged in providing the distribution, content and equipment related to the creation, transmission or processing of information.
Performance Overview
You can find the Fund’s one-year total return in the Performance Summary. The Fund outperformed its benchmark, the S&P 500, which returned 10.87% for the period under review.1 Given that the Fund invests in only a few sectors found within the S&P 500, the Fund’s results versus the S&P 500 are not directly comparable.
Economic and Market Overview
During the year ended December 31, 2004, the domestic economy expanded solidly and broadly across most industries, sectors and regions as gross domestic product (GDP) rose an estimated 4.4%.2 However, surging energy and other commodity prices had a dampening effect. Although consumer confidence remained below pre-recession levels, consumer spending supported strong auto sales, increased durable goods consumption and a healthy housing market. Similarly, business spending rose substantially even as business confidence wavered. With improving balance sheets and stronger profit margins, many companies entered an upgrade cycle and invested in new technologies, driving equipment spending up 9.5% in the second half of 2004.2 The labor market firmed as employers hired 2.2 million workers in 2004, and unemployment dropped from 5.7% to 5.4% during the year.3 More than one-half of the jobs lost during the recession have been recovered; however, most new jobs were part-time or temporary. Given concerns over rising benefits costs and lingering uncertainties about economic recovery, many companies turned to temporary employment or opted for continued hiring freezes. At year-end, elevated household debt levels and the deepening federal budget and trade deficits were three top concerns for the economy as it headed into 2005.
1. Source: Standard & Poor’s Micropal. One cannot invest directly in an index, nor is an index representative of the Fund’s portfolio. Please see Index Descriptions following the Fund Summaries.
2. Source: Bureau of Economic Analysis.
3. Source: Bureau of Labor Statistics.
Fund Risks: Stocks offer the potential for long-term gains but can be subject to short-term up-and-down price movements. By concentrating in the industries of the utilities sector and by investing predominantly in communications companies, the Fund carries much greater risk of adverse developments affecting that sector, and among those companies, than a fund that invests more broadly. Foreign investing involves special risks including currency fluctuations, economic instability, and social and political developments. The Fund’s prospectus also includes a description of the main investment risks.
FGC-2
The U.S. dollar weakened throughout 2004 and hit an all-time low against the euro and a multi-year low versus the yen. The widening trade and current account deficits and possibility for higher import prices contributed to inflationary pressures. The core inflation rate rose 2.2% in 2004, or 3.3% including volatile food and energy costs. Aiming to keep inflation tame, the Federal Reserve Board (Fed) raised the federal funds target rate five times between June and December, from 1.00% to 2.25%, the highest level in more than three years. The Fed said it will respond to changes in economic prospects as needed to fulfill its obligation to maintain price stability, noting in December that it perceived “the upside and downside risks to the attainment of both sustainable growth and price stability for the next few quarters to be roughly equal.”4
Despite a generally robust economy and improving corporate fundamentals, investors had to digest a wide range of information in 2004, including rising inflation, the dollar’s value, a contentious presidential election and ongoing concerns about terrorism, war and reconstruction in Iraq. Domestic equity markets rallied in early 2004 and then fluctuated; however, they were essentially flat through early November. Disappointing earnings from a number of blue chip companies applied downward pressure, but initial public offering (IPO) activity was strong and investor sentiment improved late in the period despite the mixed signals. After the elections concluded, the markets enjoyed another strong rally through year-end. The blue chip stocks of the Dow Jones Industrial Average gained 5.31% for the year under review, while the broader S&P 500 rose 10.87% and the technology-heavy NASDAQ Composite Index increased 9.15%.5
Investment Strategy
We are research driven, fundamental investors pursuing a disciplined blend of growth and value strategies. Relying on a team of analysts to provide in-depth industry expertise, we look for companies that will position the Fund to benefit from potential future technological advances and increasing worldwide demand in the communications industries. As bottom-up investors focusing primarily on individual securities, we will focus on the market price of a company’s securities
4. Source: Federal Reserve. Press Release, 12/14/04.
5. Source: Standard & Poor’s Micropal. Please see Index Descriptions following the Fund Summaries.
FGC-3
relative to our evaluation of the company’s potential long-term earnings, asset value and cash flow. Among the factors we also consider are a company’s historical value measures, including price/earnings ratio, profit margins and liquidation value.
Manager’s Discussion
During the year under review, many of the Fund’s holdings of domestic and global wireless telecommunications companies benefited from strong global trends in cellular and wireless data devices. The wireless sector experienced strong growth globally, driven by many positive factors that we seek in our investments.
Notable performers during the period included Research in Motion, Yahoo!, America Movil and Western Wireless. Research in Motion provides wireless email equipment and service under the Blackberry brand and is the dominant provider in a rapidly growing domestic and international market. Consistent with our strategy, we purchased the stock due to the company’s leading market position and prospects for future growth we felt were strong.
Yahoo! is a global Internet media company offering an online guide to the Web, aggregated information content, communication services and commerce. We purchased shares based on the company’s strong secular growth and leading position as an Internet gatekeeper. Online advertising has become more mainstream in the past year and gained credibility with large, national advertisers, a secular growth trend we believe may continue.
America Movil is Mexico’s leading wireless service provider and has operations in Brazil, Argentina, Ecuador, Venezuela and the U.S. Following our strategy, we believe it is well positioned to take advantage of the rapid growth in cellular phone subscribers throughout Latin America.
Western Wireless has a balanced business franchise in two fast-growing areas: rural domestic wireless and international wireless. Its rural operations have tended to attract less competition than urban markets and experienced stable growth. The firm’s international operations recently underwent dramatic expansion in several markets including Austria and Ireland. Based on our strategy, we selected the company for what we consider strong management, excellent potential growth opportunities and reasonable valuation.
In general, if the value of the U.S. dollar goes up compared with a foreign currency, an investment traded in that foreign currency will go
Top 10 Holdings
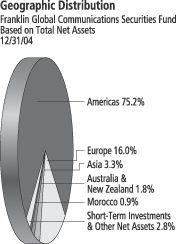
Franklin Global Communications Securities Fund 12/31/04
| | |
Company
Sector/Industry,
Country | | % of Total
Net Assets |
| |
America Movil SA de CV,
L, ADR | | 5.6% |
| Wireless Communications, Mexico | | |
| |
| Nokia Corp., ADR | | 4.3% |
| Telecommunications Equipment, Finland | | |
| |
| Grupo Televisa SA, ADR | | 3.9% |
| Broadcasting, Mexico | | |
| |
| Sprint Corp. | | 3.8% |
| Major Telecommunications, U.S. | | |
| |
| Vodafone Group PLC, ADR | | 3.5% |
| Wireless Communications, U.K. | | |
| |
| Research in Motion Ltd. | | 2.8% |
| Telecommunications Equipment, Canada | | |
| |
| Western Wireless Corp., A | | 2.6% |
| Wireless Communications, U.S. | | |
| |
| Nextel Communications Inc., A | | 2.5% |
| Wireless Communications, U.S. | | |
| |
| VeriSign Inc. | | 2.4% |
| Internet Software & Services, U.S. | | |
| |
| NII Holdings Inc., B | | 2.4% |
| Wireless Communications, U.S. | | |
The dollar value, number of shares or principal amount, and names of all portfolio holdings are listed in the Fund’s Statement of Investments.
FGC-4
down in value because it will be worth fewer U.S. dollars. This can have a negative effect on Fund performance. Conversely, when the U.S. dollar weakens in relation to a foreign currency, an investment traded in that foreign currency will increase in value, which can contribute to Fund performance. For the 12 months ended December 31, 2004, the U.S. dollar declined in value relative to most non-U.S. currencies. At the end of the period, the Fund’s portfolio was invested significantly in securities with non-U.S. currency exposure, which resulted in a positive effect on Fund performance. However, one cannot expect the same result in future periods.
Some consumer services companies in the broadcasting industry detracted from Fund performance, suffering from a slower than expected advertising recovery. Radio broadcasting companies Clear Channel Communications and Entercom Communications hurt the Fund’s performance, and we sold the stocks by period-end. Despite positive economic signs, the radio advertising market had not yet benefited from the recovery to the extent that many expected.
In the computer communications industry, Cisco Systems detracted from Fund performance. The company is the leading supplier of data networking equipment and provides equipment for Voice over Internet Protocol (VoIP) telephony services. We sold our holding largely due to analysts’ concerns over rising inventories and weak sales growth momentum.
Thank you for your participation in Franklin Global Communications Securities Fund. We look forward to serving your future investment needs.
The foregoing information reflects our analysis, opinions and portfolio holdings as of December 31, 2004, the end of the reporting period. The way we implement our main investment strategies and the resulting portfolio holdings may change depending on factors such as market and economic conditions. These opinions may not be relied upon as investment advice or an offer for a particular security. The information is not a complete analysis of every aspect of any market, country, industry, security or the Fund. Statements of fact are from sources considered reliable, but the adviser makes no representation or warranty as to their completeness or accuracy. Although historical performance is no guarantee of future results, these insights may help you understand our investment management philosophy.
FGC-5
Fund Expenses
As an investor in a variable insurance contract (“Contract”) that indirectly provides for investment in an underlying mutual fund, you can incur transaction and/or ongoing expenses at both the Fund level and the Contract level.
| • | | Transaction expenses can include sales charges (loads) on purchases, redemption fees, surrender fees, transfer fees and premium taxes. |
| • | | Ongoing expenses can include management fees, distribution and service (12b-1) fees, contract fees, annual maintenance fees, mortality and expense risk fees and other fees and expenses. All mutual funds and Contracts have some types of ongoing expenses. |
The expenses shown in the table below are meant to highlight ongoing expenses at the Fund level only and do not include ongoing expenses at the Contract level, or transaction expenses at either the Fund or Contract levels. While the Fund does not have transaction expenses, if the transaction and ongoing expenses at the Contract level were included, the expenses shown below would be higher. You should consult your Contract prospectus or disclosure document for more information.
The table shows Fund-level ongoing expenses and can help you understand these expenses and compare them with those of other mutual funds offered through the Contract. The table assumes a $1,000 investment held for the six months indicated. Please refer to the Fund prospectus for additional information on operating expenses.
Actual Fund Expenses
The first line (Actual) for each share class listed in the table below provides actual account values and expenses. The “Ending Account Value” is derived from the Fund’s actual return, which includes the effect of ongoing Fund expenses, but does not include the effect of ongoing Contract expenses.
You can estimate the Fund-level expenses you incurred during the period, by following these steps. Of course, your account value and expenses will differ from those in this illustration:
| 1. | Divide your account value by $1,000. |
If an account had an $8,600 value, then $8,600 ÷ $1,000 = 8.6.
| 2. | Multiply the result by the number under the heading “Fund-Level Expenses Incurred During Period.” |
If Fund-Level Expenses Incurred During Period were $7.50, then 8.6 × $7.50 = $64.50.
Franklin Global Communications Securities Fund – Class 2
FGC-6
In this illustration, the estimated expenses incurred this period at the Fund level are $64.50.
Hypothetical Example for Comparison with Other Mutual Funds
Information in the second line (Hypothetical) for each class in the table can help you compare ongoing expenses of the Fund with those of other mutual funds offered through the Contract. This information may not be used to estimate the actual ending account balance or expenses you incurred during the period. The hypothetical “Ending Account Value” is based on the actual expense ratio for each class and an assumed 5% annual rate of return before expenses, which does not represent the Fund’s actual return. The figure under the heading “Fund-Level Expenses Incurred During Period” shows the hypothetical expenses your account would have incurred under this scenario. You can compare this figure with the 5% hypothetical examples that appear in shareholder reports of other funds offered through a Contract.
| | | | | | | | | |
| Class 2 | | Beginning
Account
Value 6/30/04 | | Ending
Account
Value 12/31/04 | | Fund-Level
Expenses Incurred
During Period*
6/30/04-12/31/04 |
Actual | | $ | 1,000 | | $ | 1,128.80 | | $ | 4.82 |
Hypothetical (5% return before expenses) | | $ | 1,000 | | $ | 1,020.61 | | $ | 4.57 |
*Expenses are equal to the annualized expense ratio for the Fund’s Class 2 shares (0.90%), which does not include any ongoing expenses of the Contract for which the Fund is an investment option, multiplied by the average account value over the period, multiplied by 184/366 to reflect the one-half year period.
FGC-7
FRANKLIN TEMPLETON VARIABLE INSURANCE PRODUCTS TRUST
FRANKLIN GLOBAL COMMUNICATIONS SECURITIES FUND
Financial Highlights
| | | | | | | | | | | | | | | | | | | | |
| | | Class 1
| |
| | | Year Ended December 31,
| |
| | | 2004 | | | 2003 | | | 2002 | | | 2001 | | | 2000 | |
| | |
|
|
|
Per share operating performance | | | | | | | | | | | | | | | | | | | | |
(for a share outstanding throughout the year) | | | | | | | | | | | | | | | | | | | | |
Net asset value, beginning of year | | $ | 6.32 | | | $ | 4.53 | | | $ | 6.87 | | | $ | 12.88 | | | $ | 24.86 | |
| | |
|
|
|
Income from investment operations: | | | | | | | | | | | | | | | | | | | | |
Net investment incomea | | | .05 | | | | .06 | | | | .04 | | | | .04 | | | | .11 | |
Net realized and unrealized gains (losses) | | | .87 | | | | 1.78 | | | | (2.33 | ) | | | (3.55 | ) | | | (6.77 | ) |
| | |
|
|
|
Total from investment operations | | | .92 | | | | 1.84 | | | | (2.29 | ) | | | (3.51 | ) | | | (6.66 | ) |
| | |
|
|
|
Less distributions from: | | | | | | | | | | | | | | | | | | | | |
Net investment income | | | (.07 | ) | | | (.05 | ) | | | (.05 | ) | | | (.01 | ) | | | (.50 | ) |
Net realized gains | | | — | | | | — | | | | — | | | | (2.49 | ) | | | (4.82 | ) |
| | |
|
|
|
Total distributions | | | (.07 | ) | | | (.05 | ) | | | (.05 | ) | | | (2.50 | ) | | | (5.32 | ) |
| | |
|
|
|
Net asset value, end of year | | $ | 7.17 | | | $ | 6.32 | | | $ | 4.53 | | | $ | 6.87 | | | $ | 12.88 | |
| | |
|
|
|
| | | | | |
Total returnb | | | 14.66% | | | | 40.46% | | | | (33.28)% | | | | (29.24)% | | | | (32.85)% | |
Ratios/supplemental data | | | | | | | | | | | | | | | | | | | | |
Net assets, end of year (000’s) | | $ | 142,898 | | | $ | 149,480 | | | $ | 130,255 | | | $ | 265,055 | | | $ | 523,288 | |
Ratios to average net assets: | | | | | | | | | | | | | | | | | | | | |
Expenses | | | .64% | | | | .64% | | | | .60% | | | | .55% | | | | .52% | |
Net investment income | | | .85% | | | | 1.08% | | | | .83% | | | | .46% | | | | .54% | |
Portfolio turnover rate | | | 178.52% | | | | 96.60% | | | | 97.75% | | | | 105.36% | | | | 117.99% | |
| a | Based on average daily shares outstanding. |
| b | Total return does not include any fees, charges or expenses imposed by the variable annuity and life insurance contracts for which the Franklin Templeton Variable Insurance Products Trust serves as an underlying investment vehicle. Total return is not annualized for periods less than one year. |
See notes to financial statements.
FGC-8
FRANKLIN TEMPLETON VARIABLE INSURANCE PRODUCTS TRUST
FRANKLIN GLOBAL COMMUNICATIONS SECURITIES FUND
Financial Highlights (continued)
| | | | | | | | | | | | | | | | | | | | |
| | | Class 2
| |
| | | Year Ended December 31,
| |
| | | 2004 | | | 2003 | | | 2002 | | | 2001 | | | 2000 | |
| | |
|
|
|
Per share operating performance | | | | | | | | | | | | | | | | | | | | |
(for a share outstanding throughout the year) | | | | | | | | | | | | | | | | | | | | |
Net asset value, beginning of year | | $ | 6.28 | | | $ | 4.51 | | | $ | 6.84 | | | $ | 12.86 | | | $ | 24.78 | |
| | |
|
|
|
Income from investment operations: | | | | | | | | | | | | | | | | | | | | |
Net investment incomea | | | .04 | | | | .05 | | | | .03 | | | | .02 | | | | .05 | |
Net realized and unrealized gains (losses) | | | .84 | | | | 1.77 | | | | (2.32 | ) | | | (3.54 | ) | | | (6.72 | ) |
| | |
|
|
|
Total from investment operations | | | .88 | | | | 1.82 | | | | (2.29 | ) | | | (3.52 | ) | | | (6.67 | ) |
| | |
|
|
|
Less distributions from: | | | | | | | | | | | | | | | | | | | | |
Net investment income | | | (.06 | ) | | | (.05 | ) | | | (.04 | ) | | | (.01 | ) | | | (.43 | ) |
Net realized gains | | | — | | | | — | | | | — | | | | (2.49 | ) | | | (4.82 | ) |
| | |
|
|
|
Total distributions | | | (.06 | ) | | | (.05 | ) | | | (.04 | ) | | | (2.50 | ) | | | (5.25 | ) |
| | |
|
|
|
Net asset value, end of year | | $ | 7.10 | | | $ | 6.28 | | | $ | 4.51 | | | $ | 6.84 | | | $ | 12.86 | |
| | |
|
|
|
| | | | | |
Total returnb | | | 14.18% | | | | 40.44% | | | | (33.52)% | | | | (29.40)% | | | | (32.97)% | |
Ratios/supplemental data | | | | | | | | | | | | | | | | | | | | |
Net assets, end of year (000’s) | | $ | 23,704 | | | $ | 10,719 | | | $ | 1,490 | | | $ | 312 | | | $ | 499 | |
Ratios to average net assets: | | | | | | | | | | | | | | | | | | | | |
Expenses | | | .89% | | | | .89% | | | | .85% | | | | .80% | | | | .77% | |
Net investment income | | | .60% | | | | .83% | | | | .58% | | | | .21% | | | | .29% | |
Portfolio turnover rate | | | 178.52% | | | | 96.60% | | | | 97.75% | | | | 105.36% | | | | 117.99% | |
| a | Based on average daily shares outstanding. |
| b | Total return does not include any fees, charges or expenses imposed by the variable annuity and life insurance contracts for which the Franklin Templeton Variable Insurance Products Trust serves as an underlying investment vehicle. Total return is not annualized for periods less than one year. |
See notes to financial statements.
FGC-9
FRANKLIN TEMPLETON VARIABLE INSURANCE PRODUCTS TRUST
FRANKLIN GLOBAL COMMUNICATIONS SECURITIES FUND
Statement of Investments, December 31, 2004
| | | | | | | |
| | | COUNTRY | | SHARES | | VALUE |
Common Stocks 96.0% | | | | | | | |
Aerospace & Defense .6% | | | | | | | |
aEssex Corp. | | United States | | 47,500 | | $ | 961,875 |
| | | | | | |
|
|
Broadcasting 10.4% | | | | | | | |
aCumulus Media Inc., A | | United States | | 116,300 | | | 1,753,804 |
aEntravision Communications Corp. | | United States | | 102,600 | | | 856,710 |
Grupo Televisa SA, ADR | | Mexico | | 106,200 | | | 6,425,100 |
aRadio One Inc., D | | United States | | 156,100 | | | 2,516,332 |
aUnivision Communications Inc., A | | United States | | 75,500 | | | 2,209,885 |
aWestwood One Inc. | | United States | | 79,100 | | | 2,130,163 |
aXM Satellite Radio Holdings Inc., A | | United States | | 39,300 | | | 1,478,466 |
| | | | | | |
|
|
| | | | | | | | 17,370,460 |
| | | | | | |
|
|
Computer Communications 3.1% | | | | | | | |
aAvaya Inc. | | United States | | 73,700 | | | 1,267,640 |
aF5 Networks Inc. | | United States | | 46,000 | | | 2,241,120 |
aFinisar Corp. | | United States | | 343,300 | | | 782,724 |
aJuniper Networks Inc. | | United States | | 30,400 | | | 826,576 |
| | | | | | |
|
|
| | | | | | | | 5,118,060 |
| | | | | | |
|
|
Computer Peripherals 2.3% | | | | | | | |
aAdvanced Digital Information Corp. | | United States | | 165,800 | | | 1,661,316 |
aEMC Corp. | | United States | | 56,600 | | | 841,642 |
aSynaptics Inc. | | United States | | 40,300 | | | 1,232,374 |
| | | | | | |
|
|
| | | | | | | | 3,735,332 |
| | | | | | |
|
|
Electronic Components .5% | | | | | | | |
aOmniVision Technologies Inc. | | United States | | 47,200 | | | 866,120 |
| | | | | | |
|
|
Electronic Equipment/Instruments 1.6% | | | | | | | |
aJDS Uniphase Corp. | | United States | | 258,100 | | | 818,177 |
Tektronix Inc. | | United States | | 63,200 | | | 1,909,272 |
| | | | | | |
|
|
| | | | | | | | 2,727,449 |
| | | | | | |
|
|
Internet Software/Services 10.9% | | | | | | | |
aAsk Jeeves Inc. | | United States | | 141,100 | | | 3,774,425 |
aGoogle Inc., A | | United States | | 5,600 | | | 1,081,360 |
aInfoSpace Inc. | | United States | | 16,900 | | | 803,595 |
aJAMDAT Mobile Inc. | | United States | | 68,400 | | | 1,412,460 |
aOpenTV Corp., A | | United States | | 207,900 | | | 798,336 |
aRealNetworks Inc. | | United States | | 187,100 | | | 1,238,602 |
aSINA Corp. | | China | | 25,700 | | | 823,942 |
aVeriSign Inc. | | United States | | 121,100 | | | 4,059,272 |
aWebsense Inc. | | United States | | 19,100 | | | 968,752 |
aYahoo! Inc. | | United States | | 86,200 | | | 3,248,016 |
| | | | | | |
|
|
| | | | | | | | 18,208,760 |
| | | | | | |
|
|
Major Telecommunications 11.6% | | | | | | | |
Alltel Corp. | | United States | | 26,200 | | | 1,539,512 |
PT Telekomunikasi Indonesia TBK, B | | Indonesia | | 4,051,000 | | | 2,105,691 |
Portugal Telecom SGPS SA, ADR | | Portugal | | 110,404 | | | 1,359,073 |
Sprint Corp. | | United States | | 252,000 | | | 6,262,200 |
Telecom Corp. of New Zealand Ltd. | | New Zealand | | 665,447 | | | 2,938,620 |
Telefonica SA, ADR | | Spain | | 49,156 | | | 2,777,314 |
Telus Corp. | | Canada | | 20,000 | | | 593,077 |
Verizon Communications Inc. | | United States | | 40,800 | | | 1,652,808 |
| | | | | | |
|
|
| | | | | | | | 19,228,295 |
| | | | | | |
|
|
FGC-10
FRANKLIN TEMPLETON VARIABLE INSURANCE PRODUCTS TRUST
FRANKLIN GLOBAL COMMUNICATIONS SECURITIES FUND
Statement of Investments, December 31, 2004 (cont.)
| | | | | | | |
| | | COUNTRY | | SHARES | | VALUE |
Common Stocks (cont.) | | | | | | | |
Media Conglomerates 6.2% | | | | | | | |
aNews Corp. Ltd., A | | United States | | 46,800 | | $ | 873,288 |
aTime Warner Inc. | | United States | | 128,300 | | | 2,494,152 |
Viacom Inc., B | | United States | | 93,900 | | | 3,417,021 |
The Walt Disney Co. | | United States | | 128,400 | | | 3,569,520 |
| | | | | | |
|
|
| | | | | | | | 10,353,981 |
| | | | | | |
|
|
Movies/Entertainment .1% | | | | | | | |
aDreamworks Animation Inc., A | | United States | | 3,300 | | | 123,783 |
| | | | | | |
|
|
Packaged Software .5% | | | | | | | |
aSymantec Corp. | | United States | | 32,000 | | | 824,320 |
| | | | | | |
|
|
Publishing: Newspapers .7% | | | | | | | |
Gannett Co. Inc. | | United States | | 15,100 | | | 1,233,670 |
| | | | | | |
|
|
Semiconductors | | | | | | | |
aFreescale Semiconductor Inc., B | | United States | | 39 | | | 716 |
| | | | | | |
|
|
Specialty Telecommunications 3.9% | | | | | | | |
aAmerican Tower Corp., A | | United States | | 176,000 | | | 3,238,400 |
Citizens Communications Co. | | United States | | 114,000 | | | 1,572,060 |
aCrown Castle International Corp. | | United States | | 96,390 | | | 1,603,929 |
| | | | | | |
|
|
| | | | | | | | 6,414,389 |
| | | | | | |
|
|
Telecommunications Equipment 16.4% | | | | | | | |
aAlcatel SA, ADR | | France | | 161,500 | | | 2,524,245 |
aComverse Technology Inc. | | United States | | 76,800 | | | 1,877,760 |
aMaroc Telecom | | Morocco | | 124,800 | | | 1,424,263 |
Motorola Inc. | | United States | | 215,000 | | | 3,698,000 |
Nokia Corp., ADR | | Finland | | 457,900 | | | 7,175,293 |
aNortel Networks Corp. | | Canada | | 458,600 | | | 1,600,514 |
QUALCOMM Inc. | | United States | | 38,800 | | | 1,645,120 |
aResearch in Motion Ltd. | | Canada | | 57,400 | | | 4,730,908 |
aTrimble Navigation Ltd. | | United States | | 51,500 | | | 1,701,560 |
aViaSat Inc. | | United States | | 41,100 | | | 997,497 |
| | | | | | |
|
|
| | | | | | | | 27,375,160 |
| | | | | | |
|
|
Wireless Communications 27.2% | | | | | | | |
aAlamosa Holdings Inc. | | United States | | 111,000 | | | 1,384,170 |
America Movil SA de CV, L, ADR | | Mexico | | 179,000 | | | 9,370,650 |
aEuropolitan Holdings AB | | Sweden | | 273,500 | | | 1,934,841 |
aInPhonic Inc. | | United States | | 52,300 | | | 1,437,204 |
Mobile Telesystems Ojsc, ADR | | Russia | | 12,200 | | | 1,689,822 |
aNextel Communications Inc., A | | United States | | 137,000 | | | 4,110,000 |
aNextel Partners Inc., A | | United States | | 88,300 | | | 1,725,382 |
aNII Holdings Inc., B | | United States | | 84,000 | | | 3,985,800 |
SK Telecom Co. Ltd., ADR | | South Korea | | 113,900 | | | 2,534,275 |
Turkcell Iletisim Hizmetleri AS, ADR | | Turkey | | 193,281 | | | 3,498,386 |
aUbiquiTel Inc. | | United States | | 269,100 | | | 1,915,992 |
aU.S. Unwired Inc., A | | United States | | 339,900 | | | 1,631,520 |
Vodafone Group PLC, ADR | | United Kingdom | | 210,400 | | | 5,760,752 |
a Western Wireless Corp., A | | United States | | 148,600 | | | 4,353,980 |
| | | | | | |
|
|
| | | | | | | | 45,332,774 |
| | | | | | |
|
|
Total Common Stocks (Cost $123,402,306) | | | | | | | 159,875,144 |
| | | | | | |
|
|
FGC-11
FRANKLIN TEMPLETON VARIABLE INSURANCE PRODUCTS TRUST
FRANKLIN GLOBAL COMMUNICATIONS SECURITIES FUND
Statement of Investments, December 31, 2004 (cont.)
| | | | | | | | |
| | | COUNTRY | | SHARES | | VALUE |
Preferred Stocks 1.2% | | | | | | | | |
Major Telecommunications .6% | | | | | | | | |
Telecomunicacoes De Sao Paulo SA, ADR, pfd. | | Brazil | | | 48,500 | | $ | 942,355 |
Specialty Telecommunications .6% | | | | | | | | |
Tele Norte Leste Participacoes SA, ADR, pfd. | | Brazil | | | 59,200 | | | 998,704 |
| | | | | | | |
|
|
Total Preferred Stocks (Cost $1,647,337) | | | | | | | | 1,941,059 |
| | | | | | | |
|
|
Total Long Term Investments (Cost $125,049,643) | | | | | | | | 161,816,203 |
| | | | | | | |
|
|
| | | |
| | | | | PRINCIPAL
AMOUNT
| | |
Short Term Investment (Cost $4,707,141) 2.8% | | | | | | | | |
Repurchase Agreement | | | | | | | | |
bJoint Repurchase Agreement, 1.915%, 1/03/05 (Maturity Value $4,707,892) | | United States | | $ | 4,707,141 | | | 4,707,141 |
ABN AMRO Bank, N.V., New York Branch (Maturity Value $464,810) Banc of America Securities LLC (Maturity Value $174,286) Barclays Capital Inc. (Maturity Value $214,962) Bear, Stearns & Co. Inc. (Maturity Value $366,039) BNP Paribas Securities Corp. (Maturity Value $464,810) Deutsche Bank Securities Inc. (Maturity Value $232,429) Goldman, Sachs & Co. (Maturity Value $464,810) Greenwich Capital Markets Inc. (Maturity Value $464,810) Lehman Brothers Inc. (Maturity Value $466,506) Merrill Lynch Government Securities Inc. (Maturity Value $464,810) Morgan Stanley & Co. Inc. (Maturity Value $464,810) UBS Securities LLC (Maturity Value $464,810) | | | | | | | | |
Collateralized by U.S. Government Agency Securities, 0.00 - 7.125%, 1/05/05 - 9/15/09; cU.S. Treasury Bills, 3/24/05 - 3/31/05; U.S. Treasury Bonds, 9.375 - 12.00%, 5/15/05 - 2/15/06; and U.S. Treasury Notes, 1.50 - 7.00%, 2/28/05 - 6/15/09 | | | | | | | | |
| | | | | | | |
|
|
Total Investments (Cost $129,756,784) 100.0% | | | | | | | | 166,523,344 |
Other Assets, less Liabilities | | | | | | | | 78,505 |
| | | | | | | |
|
|
Net Assets 100.0% | | | | | | | $ | 166,601,849 |
| | | | | | | |
|
|
Portfolio Abbreviation:
ADR - American Depository Receipt
| b | See Note 1(c) regarding joint repurchase agreement. |
| c | Securitiy is traded on a discount basis with no stated coupon rate. |
See notes to financial statements.
FGC-12
FRANKLIN TEMPLETON VARIABLE INSURANCE PRODUCTS TRUST
FRANKLIN GLOBAL COMMUNICATIONS SECURITIES FUND
Financial Statements
Statement of Assets and Liabilities
December 31, 2004
| | | | |
Assets: | | | | |
Investments in securities: | | | | |
Cost - Unaffiliated issuers | | $ | 125,049,643 | |
Cost - Repurchase agreements | | | 4,707,141 | |
| | |
|
|
|
Total cost of investments | | $ | 129,756,784 | |
| | |
|
|
|
Value - Unaffiliated issuers | | $ | 161,816,203 | |
Value - Repurchase agreements | | | 4,707,141 | |
| | |
|
|
|
Total value of investments | | | 166,523,344 | |
| | |
|
|
|
Receivables: | | | | |
Capital shares sold | | | 1,827 | |
Dividends | | | 215,681 | |
| | |
|
|
|
Total assets | | | 166,740,852 | |
| | |
|
|
|
Liabilities: | | | | |
Payables: | | | | |
Capital shares redeemed | | | 6,646 | |
Affiliates | | | 84,981 | |
Reports to shareholders | | | 22,951 | |
Professional fees | | | 21,230 | |
Other liabilities | | | 3,195 | |
| | |
|
|
|
Total liabilities | | | 139,003 | |
| | |
|
|
|
Net assets, at value | | $ | 166,601,849 | |
| | |
|
|
|
Net assets consist of: | | | | |
Undistributed net investment income | | $ | 2,164,024 | |
Net unrealized appreciation (depreciation) | | | 36,766,581 | |
Accumulated net realized gain (loss) | | | (263,037,284 | ) |
Capital shares | | | 390,708,528 | |
| | |
|
|
|
Net assets, at value | | $ | 166,601,849 | |
| | |
|
|
|
Class 1: | | | | |
Net assets, at value | | $ | 142,897,624 | |
| | |
|
|
|
Shares outstanding | | | 19,938,891 | |
| | |
|
|
|
Net asset value and offering price per share | | $ | 7.17 | |
| | |
|
|
|
Class 2: | | | | |
Net assets, at value | | $ | 23,704,225 | |
| | |
|
|
|
Shares outstanding | | | 3,338,231 | |
| | |
|
|
|
Net asset value and offering price per share | | $ | 7.10 | |
| | |
|
|
|
See notes to financial statements.
FGC-13
FRANKLIN TEMPLETON VARIABLE INSURANCE PRODUCTS TRUST
FRANKLIN GLOBAL COMMUNICATIONS SECURITIES FUND
Financial Statements (continued)
Statement of Operations
for the year ended December 31, 2004
| | | | |
Investment income: | | | | |
Dividends (net of foreign taxes of $119,424) | | | $ 2,263,932 | |
Interest | | | 58,213 | |
| | |
|
|
|
Total investment income | | | 2,322,145 | |
| | |
|
|
|
Expenses: | | | | |
Management fees (Note 3) | | | 902,686 | |
Distribution fees - Class 2 (Note 3) | | | 38,702 | |
Transfer agent fees | | | 1,654 | |
Custodian fees (Note 4) | | | 6,431 | |
Reports to shareholders | | | 54,774 | |
Professional fees | | | 22,843 | |
Trustees’ fees and expenses | | | 995 | |
Other | | | 7,391 | |
| | |
|
|
|
Total expenses | | | 1,035,476 | |
Expense reductions (Note 4) | | | (132 | ) |
| | |
|
|
|
Net expenses | | | 1,035,344 | |
| | |
|
|
|
Net investment income | | | 1,286,801 | |
| | |
|
|
|
Realized and unrealized gains (losses): | | | | |
Net realized gain (loss) from: | | | | |
Investments | | | 3,543,980 | |
Foreign currency transactions | | | 61,915 | |
| | |
|
|
|
Net realized gain (loss) | | | 3,605,895 | |
| | |
|
|
|
Net change in unrealized appreciation (depreciation) on: | | | | |
Investments | | | 16,204,418 | |
Translation of assets and liabilities denominated in foreign currencies | | | (5,625 | ) |
| | |
|
|
|
Net change in unrealized appreciation (depreciation) | | | 16,198,793 | |
| | |
|
|
|
Net realized and unrealized gain (loss) | | | 19,804,688 | |
| | |
|
|
|
Net increase (decrease) in net assets resulting from operations | | $ | 21,091,489 | |
| | |
|
|
|
See notes to financial statements.
FGC-14
FRANKLIN TEMPLETON VARIABLE INSURANCE PRODUCTS TRUST
FRANKLIN GLOBAL COMMUNICATIONS SECURITIES FUND
Financial Statements (continued)
Statements of Changes in Net Assets
for the years ended December 31, 2004 and 2003
| | | | | | | | |
| | | 2004 | | | 2003 | |
| | |
| |
Increase (decrease) in net assets: | | | | | | | | |
Operations: | | | | | | | | |
Net investment income | | $ | 1,286,801 | | | $ | 1,488,977 | |
Net realized gain (loss) from investments and foreign currency transactions | | | 3,605,895 | | | | 766,036 | |
Net change in unrealized appreciation (depreciation) on investments and translation of assets and liabilities denominated in foreign currencies | | | 16,198,793 | | | | 45,613,944 | |
| | |
| |
Net increase (decrease) in net assets resulting from operations | | | 21,091,489 | | | | 47,868,957 | |
Distributions to shareholders from: | | | | | | | | |
Net investment income: | | | | | | | | |
Class 1 | | | (1,418,784 | ) | | | (1,238,199 | ) |
Class 2 | | | (135,885 | ) | | | (30,287 | ) |
| | |
| |
Total distributions to shareholders | | | (1,554,669 | ) | | | (1,268,486) | |
Capital share transactions: (Note 2) | | | | | | | | |
Class 1 | | | (23,869,093 | ) | | | (25,751,370 | ) |
Class 2 | | | 10,735,851 | | | | 7,603,913 | |
| | |
| |
Total capital share transactions | | | (13,133,242 | ) | | | (18,147,457 | ) |
Net increase (decrease) in net assets | | | 6,403,578 | | | | 28,453,014 | |
Net assets: | | | | | | | | |
Beginning of year | | | 160,198,271 | | | | 131,745,257 | |
| | |
| |
End of year | | $ | 166,601,849 | | | $ | 160,198,271 | |
| | |
| |
Undistributed net investment income included in net assets: | | | | | | | | |
End of year | | $ | 2,164,024 | | | $ | 1,434,605 | |
| | |
| |
See notes to financial statements.
FGC-15
FRANKLIN TEMPLETON VARIABLE INSURANCE PRODUCTS TRUST
FRANKLIN GLOBAL COMMUNICATIONS SECURITIES FUND
Notes to Financial Statements
1. ORGANIZATION AND SIGNIFICANT ACCOUNTING POLICIES
Franklin Templeton Variable Insurance Products Trust (the Trust) is registered under the Investment Company Act of 1940 as an open-end investment company, consisting of twenty-one separate series (the Funds). Franklin Global Communications Securities Fund (the Fund) included in this report is diversified. The financial statements of the remaining funds in the series are presented separately. Shares of the Fund are sold only to insurance company separate accounts to fund the benefits of variable life insurance policies or variable annuity contracts. As of December 31, 2004, 99% of the Fund’s shares were sold through one insurance company. The Fund’s investment objective is growth and income.
The following summarizes the Fund’s significant accounting policies.
a. Security Valuation
Securities listed on a securities exchange or on the NASDAQ National Market System are valued at the last quoted sale price or the official closing price of the day, respectively. Over-the-counter securities and listed securities for which there is no reported sale are valued within the range of the most recent quoted bid and ask prices. Securities that trade in multiple markets or on multiple exchanges are valued according to the broadest and most representative market. Repurchase agreements are valued at cost.
Foreign securities are valued as of the close of trading on the foreign stock exchange on which the security is primarily traded, or the NYSE, whichever is earlier. The value is then converted into its U.S. dollar equivalent at the foreign exchange rate in effect at the close of the NYSE on the day that the value of the foreign security is determined. If no sale is reported at that time, the foreign security will be valued within the range of the most recent quoted bid and ask prices.
The Trust has procedures to determine the fair value of individual securities and other assets for which market prices are not readily available or which may not be reliably priced. Some methods for valuing these securities may include: fundamental analysis, matrix pricing, discounts from market prices of similar securities, or discounts applied due to the nature and duration of restrictions on the disposition of the securities. Occasionally, events occur between the time at which trading in a security is completed and the close of the NYSE that might call into question the availability (including the reliability) of the value of a portfolio security held by the Fund. If such an event occurs, the securities may be valued using fair value procedures, which may include the use of independent pricing services. All security valuation procedures are approved by the Trust’s Board of Trustees.
b. Foreign Currency Translation
Portfolio securities and other assets and liabilities denominated in foreign currencies are translated into U.S. dollars based on the exchange rate of such currencies against U.S. dollars on the date of valuation. Purchases and sales of securities, income and expense items denominated in foreign currencies are translated into U.S. dollars at the exchange rate in effect on the transaction date. Occasionally events may impact the availability or reliability of foreign exchange rates used to convert the U.S. dollar equivalent value. If such an event occurs, the foreign exchange rate will be valued at fair value using procedures established and approved by the Trust’s Board of Trustees.
The Fund does not separately report the effect of changes in foreign exchange rates from changes in market prices on securities held. Such changes are included in net realized and unrealized gain or loss from investments on the Statement of Operations.
Realized foreign exchange gains or losses arise from sales of foreign currencies, currency gains or losses realized between the trade and settlement dates on securities transactions and the difference between the recorded amounts of dividends, interest, and foreign withholding taxes and the U.S. dollar equivalent of the amounts actually received or paid. Net unrealized foreign exchange gains and losses arise from changes in foreign exchange rates on foreign denominated assets and liabilities other than investments in securities held at the end of the reporting period.
FGC-16
FRANKLIN TEMPLETON VARIABLE INSURANCE PRODUCTS TRUST
FRANKLIN GLOBAL COMMUNICATIONS SECURITIES FUND
Notes to Financial Statements (continued)
1. ORGANIZATION AND SIGNIFICANT ACCOUNTING POLICIES (cont.)
c. Joint Repurchase Agreement
The Fund may enter into a joint repurchase agreement whereby its uninvested cash balance is deposited into a joint cash account to be used to invest in one or more repurchase agreements. The value and face amount of the joint repurchase agreement are allocated to the Fund based on its pro-rata interest. A repurchase agreement is accounted for as a loan by the Fund to the seller, collateralized by securities which are delivered to the Fund’s custodian. The market value, including accrued interest, of the initial collateralization is required to be at least 102% of the dollar amount invested by the Fund, with the value of the underlying securities marked to market daily to maintain coverage of at least 100%. At December 31, 2004, all repurchase agreements held by the Fund had been entered into on that date.
d. Foreign Currency Contracts
When the Fund purchases or sells foreign securities it may enter into foreign exchange contracts to minimize foreign exchange risk from the trade date to the settlement date of the transactions. A foreign exchange contract is an agreement between two parties to exchange different currencies at an agreed upon exchange rate on a specified date. Realized and unrealized gains and losses on these contracts are included in the Statement of Operations.
The risks of these contracts include movement in the values of the foreign currencies relative to the U.S. dollar and the possible inability of the counterparties to fulfill their obligations under the contracts.
e. Income Taxes
No provision has been made for U.S. income taxes because the Fund’s policy is to qualify as a regulated investment company under Sub Chapter M of the Internal Revenue Code and to distribute substantially all of its taxable income. Fund distributions to shareholders are determined on an income tax basis and may differ from net investment income and realized gains for financial reporting purposes.
f. Security Transactions, Investment Income, Expenses and Distributions
Security transactions are accounted for on trade date. Realized gains and losses on security transactions are determined on a specific identification basis. Interest income and estimated expenses are accrued daily. Dividend income and distributions to shareholders are recorded on the ex-dividend date.
Common expenses incurred by the Trust are allocated among the funds based on the ratio of net assets of each fund to the combined net assets. Other expenses are charged to each fund on a specific identification basis.
Realized and unrealized gains and losses and net investment income, other than class specific expenses, are allocated daily to each class of shares based upon the relative proportion of net assets of each class.
g. Accounting Estimates
The preparation of financial statements in accordance with accounting principles generally accepted in the United States of America requires management to make estimates and assumptions that affect the reported amounts of assets and liabilities at the date of the financial statements and the amounts of income and expenses during the reporting period. Actual results could differ from those estimates.
FGC-17
FRANKLIN TEMPLETON VARIABLE INSURANCE PRODUCTS TRUST
FRANKLIN GLOBAL COMMUNICATIONS SECURITIES FUND
Notes to Financial Statements (continued)
1. ORGANIZATION AND SIGNIFICANT ACCOUNTING POLICIES (cont.)
h. Guarantees and Indemnifications
Under the Trust’s organizational documents, its officers and trustees are indemnified by the Trust against certain liability arising out of the performance of their duties to the Trust. Additionally, in the normal course of business, the Trust enters into contracts with service providers that contain general indemnification clauses. The Trust’s maximum exposure under these arrangements is unknown as this would involve future claims that may be made against the Trust that have not yet occurred. However, based on experience, the Trust expects the risk of loss to be remote.
2. SHARES OF BENEFICIAL INTEREST
The Fund offers two classes of shares: Class 1 and Class 2. Each class of shares differs by its distribution fees, voting rights on matters affecting a single class and its exchange privilege.
At December 31, 2004, there were an unlimited number of shares authorized ($.01 par value). Transactions in the Fund’s shares were as follows:
| | | | | | | | | | | | | | |
| | | Year Ended December 31,
| |
| | | 2004
| | | 2003
| |
| Class 1 Shares: | | Shares
| | | Amount
| | | Shares
| | | Amount
| |
Shares sold | | 36,176 | | | $ | 234,808 | | | 135,529 | | | $ | 698,512 | |
Shares issued in reinvestment of distributions | | 231,827 | | | | 1,418,784 | | | 230,149 | | | | 1,238,199 | |
Shares redeemed | | (3,966,244 | ) | | | (25,522,685 | ) | | (5,451,344 | ) | | | (27,688,081 | ) |
| | |
| |
Net increase (decrease) | | (3,698,241 | ) | | $ | (23,869,093 | ) | | (5,085,666 | ) | | $ | (25,751,370 | ) |
| | |
| |
| Class 2 Shares: | | | | | | | | | | | | |
Shares sold | | 2,205,007 | | | $ | 14,315,821 | | | 1,509,954 | | | $ | 8,281,081 | |
Shares issued in reinvestment of distributions | | 22,350 | | | | 135,885 | | | 5,671 | | | | 30,287 | |
Shares redeemed | | (596,789 | ) | | | (3,715,855 | ) | | (138,375 | ) | | | (707,455 | ) |
| | |
| |
Net increase (decrease) | | 1,630,568 | | | $ | 10,735,851 | | | 1,377,250 | | | $ | 7,603,913 | |
| | |
| |
3. TRANSACTIONS WITH AFFILIATES
Certain officers and trustees of the Fund are also officers and/or directors of the following entities:
| | |
| Entity | | Affiliation |
Franklin Advisers Inc. (Advisers) | | Investment manager |
Franklin Templeton Services LLC (FT Services) | | Administrative manager |
Franklin Templeton Distributors Inc. (Distributors) | | Principal underwriter |
Franklin Templeton Investor Services LLC (Investor Services) | | Transfer agent |
a. Management Fees
The Fund pays an investment management fee to Advisers based on the average daily net assets of the Fund as follows:
| | |
| Annualized Fee Rate | | Net Assets |
| .625% | | First $100 million |
| .500% | | Over $100 million, up to and including $250 million |
| .450% | | Over $250 million, up to and including $10 billion |
FGC-18
FRANKLIN TEMPLETON VARIABLE INSURANCE PRODUCTS TRUST
FRANKLIN GLOBAL COMMUNICATIONS SECURITIES FUND
Notes to Financial Statements (continued)
3. TRANSACTIONS WITH AFFILIATES (cont.)
a. Management Fees (cont.)
Fees are further reduced on net assets over $10 billion.
b. Administrative Fees
Under an agreement with Advisers, FT Services provides administrative services to the Fund. The fee is paid by Advisers based on the average daily net assets of the Fund, and is not an additional expense of the Fund.
c. Distribution Fees
The Fund reimburses Distributors up to .25% per year of its average daily net asset of Class 2, for costs incurred in marketing the Fund’s shares under a Rule 12b-1 plan.
d. Transfer Agent Fees
Investor Services, under terms of an agreement, performs shareholder servicing for the Fund and is not paid by the Fund for the services.
4. EXPENSE OFFSET ARRANGEMENT
The Fund has entered into an arrangement with its custodian whereby credits realized as a result of uninvested cash balances are used to reduce a portion of the Fund’s custodian expenses. During the year ended December 31, 2004, the custodian fees were reduced as noted in the Statement of Operations.
5. INCOME TAXES
At December 31, 2004, the Fund had tax basis capital losses which may be carried over to offset future capital gains. Such losses expire as follows:
| | | |
Capital loss carryovers expiring in: | | | |
2009 | | $ | 153,666,768 |
2010 | | | 108,979,162 |
| | |
|
| | | $ | 262,645,930 |
| | |
|
At December 31, 2004, the Fund had deferred currency losses occurring subsequent to October 31, 2004 of $2,223. For tax purposes, such losses will be reflected in the year ending December 31, 2005.
The tax character of distributions paid during the years ended December 31, 2004 and 2003, was as follows:
| | | | | | |
| | | 2004
| | 2003
|
Distributions paid from ordinary income | | $ | 1,554,669 | | $ | 1,268,486 |
| | |
|
| |
|
|
Net investment income (loss) differs for financial statement and tax purposes primarily due to differing treatments of foreign currency transactions and passive foreign investment company shares.
Net realized gains (losses) differ for financial statement and tax purposes primarily due to differing treatments of wash sales, foreign currency transactions and passive foreign investment company shares.
FGC-19
FRANKLIN TEMPLETON VARIABLE INSURANCE PRODUCTS TRUST
FRANKLIN GLOBAL COMMUNICATIONS SECURITIES FUND
Notes to Financial Statements (continued)
5. INCOME TAXES (cont.)
At December 31, 2004, the cost of investments, net unrealized appreciation (depreciation), and undistributed ordinary income for income tax purposes were as follows:
| | | | |
Cost of investments | | $ | 131,872,781 | |
| | |
|
|
|
Unrealized appreciation | | $ | 36,233,002 | |
Unrealized depreciation | | | (1,582,439 | ) |
| | |
|
|
|
Net unrealized appreciation (depreciation) | | $ | 34,650,563 | |
| | |
|
|
|
Distributable earnings – undistributed ordinary income | | $ | 3,890,891 | |
| | |
|
|
|
6. INVESTMENT TRANSACTIONS
Purchases and sales of investments (excluding short-term securities) for the year ended December 31, 2004, aggregated $269,393,710 and $273,103,964, respectively.
7. REGULATORY MATTERS
Investigations
As part of various investigations by a number of federal, state, and foreign regulators and governmental entities, including the Securities and Exchange Commission (“SEC”), the California Attorney General’s Office (“CAGO”), and the National Association of Securities Dealers, Inc. (“NASD”), relating to certain practices in the mutual fund industry, including late trading, market timing and marketing support payments to securities dealers who sell fund shares, Franklin Resources, Inc. and certain of its subsidiaries (as used in this section, together, the “Company”), as well as certain current or former executives and employees of the Company, received subpoenas and/or requests for documents, information and/or testimony. The Company and its current employees provided documents and information in response to those requests and subpoenas.
Settlements
Beginning in August 2004, the Company entered into settlements with certain regulators investigating the mutual fund industry practices noted above. The Company believes that settlement of each of the matters described in this section is in the best interest of the Company and shareholders of the Franklin, Templeton, and Mutual Series mutual funds (the “funds”).
On August 2, 2004, Franklin Resources, Inc. announced that its subsidiary, Franklin Advisers, Inc., reached an agreement with the SEC that resolved the issues resulting from the SEC investigation into market timing activity. In connection with that agreement, the SEC issued an “Order Instituting Administrative and Cease-and-Desist Proceedings Pursuant to Sections 203(e) and 203(k) of the Investment Advisers Act of 1940 and Sections 9(b) and 9(f) of the Investment Company Act of 1940, Making Findings and Imposing Remedial Sanctions and a Cease-and-Desist Order” (the “Order”). The SEC’s Order concerned the activities of a limited number of third parties that ended in 2000 and those that were the subject of the first Massachusetts administrative complaint described below.
Under the terms of the SEC’s Order, pursuant to which Franklin Advisers, Inc. neither admitted nor denied any of the findings contained therein, Franklin Advisers, Inc. agreed to pay $50 million, of which $20 million is a civil penalty, to be distributed to shareholders of certain funds in accordance with a plan to be developed by an independent distribution consultant. At this time, it is unclear which funds or which shareholders of any particular fund will receive distributions. The Order also required Franklin Advisers, Inc. to, among other things, enhance and periodically review compliance policies and procedures.
FGC-20
FRANKLIN TEMPLETON VARIABLE INSURANCE PRODUCTS TRUST
FRANKLIN GLOBAL COMMUNICATIONS SECURITIES FUND
Notes to Financial Statements (continued)
7. REGULATORY MATTERS (cont.)
Settlements (cont.)
On September 20, 2004, Franklin Resources, Inc. announced that two of its subsidiaries, Franklin Advisers, Inc. and Franklin Templeton Alternative Strategies, Inc. (“FTAS”), reached an agreement with the Securities Division of the Office of the Secretary of the Commonwealth of Massachusetts (the “State of Massachusetts”) related to its administrative complaint filed on February 4, 2004, concerning one instance of market timing that was also a subject of the August 2, 2004 settlement that Franklin Advisers, Inc. reached with the SEC, as described above.
Under the terms of the settlement consent order issued by the State of Massachusetts, Franklin Advisers, Inc. and FTAS consented to the entry of a cease-and-desist order and agreed to pay a $5 million administrative fine to the State of Massachusetts (the “Massachusetts Consent Order”). The Massachusetts Consent Order included two different sections: “Statements of Fact” and “Violations of Massachusetts Securities Laws.” Franklin Advisers, Inc. and FTAS admitted the facts in the Statements of Fact.
On October 25, 2004, the State of Massachusetts filed a second administrative complaint, alleging that Franklin Resources, Inc.’s Form 8-K filing (in which it described the Massachusetts Consent Order and stated that “Franklin did not admit or deny engaging in any wrongdoing”) failed to state that Franklin Advisers, Inc. and FTAS admitted the Statements of Fact portion of the Massachusetts Consent Order (the “Second Complaint”). Franklin Resources, Inc. reached a second agreement with the State of Massachusetts on November 19, 2004, resolving the Second Complaint. As a result of the November 19, 2004 settlement, Franklin Resources, Inc. filed a new Form 8-K. The terms of the Massachusetts Consent Order did not change and there was no monetary fine associated with this second settlement.
On November 17, 2004, Franklin Resources, Inc. announced that Franklin/Templeton Distributors, Inc. (“FTDI”) reached an agreement with the CAGO, resolving the issues resulting from the CAGO’s investigation concerning sales and marketing support payments. Under the terms of the settlement, FTDI neither admitted nor denied the allegations in the CAGO’s complaint and agreed to pay $2 million to the State of California as a civil penalty, $14 million to the funds, to be allocated by an independent distribution consultant to be paid for by FTDI, and $2 million to the CAGO for its investigative costs.
On December 13, 2004, Franklin Resources, Inc. announced that its subsidiaries FTDI and Franklin Advisers, Inc. reached an agreement with the SEC, resolving the issues resulting from the SEC’s investigation concerning marketing support payments to securities dealers who sell fund shares. In connection with that agreement, the SEC issued an “Order Instituting Administrative and Cease-and-Desist Proceedings, Making Findings, and Imposing Remedial Sanctions Pursuant to Sections 203(e) and 203(k) of the Investment Advisers Act of 1940, Sections 9(b) and 9(f) of the Investment Company Act of 1940, and Section 15(b) of the Securities Exchange Act of 1934” (the “Second Order”).
Under the terms of the Second Order, in which FTDI and Franklin Advisers, Inc. neither admitted nor denied the findings contained therein, they agreed to pay the funds a penalty of $20 million and disgorgement of $1 (one dollar). FTDI and Franklin Advisers, Inc. also agreed to implement certain measures and undertakings relating to marketing support payments to broker-dealers for the promotion or sale of fund shares, including making additional disclosures in the funds’ Prospectuses and Statements of Additional Information. The Second Order further requires the appointment of an independent distribution consultant, at the Company’s expense, who shall develop a plan for the distribution of the penalty and disgorgement to the funds.
Other Legal Proceedings
The Trust, in addition to the Company and other funds, and certain current and former officers, employees, and directors have been named in multiple lawsuits in different federal courts in Nevada, California, Illinois, New York and Florida, alleging violations of various federal securities laws and seeking, among other relief, monetary damages, restitution, removal of fund trustees, directors, advisers, administrators, and distributors, rescission of management contracts and 12b-1 Plans, and/or attorneys’ fees and costs. Specifically, the lawsuits claim breach of duty with respect to alleged arrangements to permit market
FGC-21
FRANKLIN TEMPLETON VARIABLE INSURANCE PRODUCTS TRUST
FRANKLIN GLOBAL COMMUNICATIONS SECURITIES FUND
Notes to Financial Statements (continued)
7. REGULATORY MATTERS (cont.)
Other Legal Proceedings (cont.)
timing and/or late trading activity, or breach of duty with respect to the valuation of the portfolio securities of certain Templeton funds managed by Franklin Resources, Inc. subsidiaries, resulting in alleged market timing activity. The majority of these lawsuits duplicate, in whole or in part, the allegations asserted in the February 4, 2004 Massachusetts administrative complaint and the findings in the SEC’s August 2, 2004 Order, as described above. The lawsuits are styled as class actions, or derivative actions on behalf of either the named funds or Franklin Resources, Inc.
In addition, the Company, as well as certain current and former officers, employees, and directors, have been named in multiple lawsuits alleging violations of various securities laws and pendent state law claims relating to the disclosure of directed brokerage payments and/or payment of allegedly excessive advisory, commission, and distribution fees, and seeking, among other relief, monetary damages, restitution, rescission of advisory contracts, including recovery of all fees paid pursuant to those contracts, an accounting of all monies paid to the named advisers, declaratory relief, injunctive relief, and/or attorneys’ fees and costs. These lawsuits are styled as class actions or derivative actions brought on behalf of certain funds.
The Company and fund management strongly believes that the claims made in each of the lawsuits identified above are without merit and intends to vigorously defend against them. The Company cannot predict with certainty, however, the eventual outcome of the remaining governmental investigations or private lawsuits, nor whether they will have a material negative impact on the Company. Public trust and confidence are critical to the Company’s business and any material loss of investor and/or client confidence could result in a significant decline in assets under management by the Company, which would have an adverse effect on the Company’s future financial results. If the Company finds that it bears responsibility for any unlawful or inappropriate conduct that caused losses to the Trust, it is committed to making the Trust or its shareholders whole, as appropriate. The Company is committed to taking all appropriate actions to protect the interests of its funds’ shareholders.
FGC-22
FRANKLIN TEMPLETON VARIABLE INSURANCE PRODUCTS TRUST
FRANKLIN GLOBAL COMMUNICATIONS SECURITIES FUND
Report of Independent Registered Public Accounting Firm
To the Trustees and Shareholders of
Franklin Templeton Variable Insurance Products Trust
In our opinion, the accompanying statement of assets and liabilities, including the statement of investments, and the related statements of operations and of changes in net assets and the financial highlights present fairly, in all material respects, the financial position of Franklin Global Communications Securities Fund (the Fund) (one of the funds constituting Franklin Templeton Variable Insurance Products Trust) at December 31, 2004, the results of its operations for the year then ended, the changes in its net assets for each of the two years in the period then ended and the financial highlights for each of the five years in the period then ended, in conformity with accounting principles generally accepted in the United States of America. These financial statements and financial highlights (hereafter referred to as “financial statements”) are the responsibility of the Fund’s management; our responsibility is to express an opinion on these financial statements based on our audits. We conducted our audits of these financial statements in accordance with the standards of the Public Company Accounting Oversight Board (United States). Those standards require that we plan and perform the audits to obtain reasonable assurance about whether the financial statements are free of material misstatement. An audit includes examining, on a test basis, evidence supporting the amounts and disclosures in the financial statements, assessing the accounting principles used and significant estimates made by management, and evaluating the overall financial statement presentation. We believe that our audits, which included confirmation of securities at December 31, 2004 by correspondence with the custodian, provide a reasonable basis for our opinion.
PricewaterhouseCoopers LLP
San Francisco, California
February 9, 2005
FGC-23
FRANKLIN TEMPLETON VARIABLE INSURANCE PRODUCTS TRUST
FRANKLIN GLOBAL COMMUNICATIONS SECURITIES FUND
Tax Designation (unaudited)
Under Section 854(b)(2) of the Internal Revenue Code, the Fund hereby designates 74.13% of the ordinary income dividends as income qualifying for the dividends received deduction for the fiscal year ended December 31, 2004.
FGC-24
FRANKLIN GROWTHAND INCOME SECURITIES FUND
This annual report for Franklin Growth and Income Securities Fund covers the fiscal year ended December 31, 2004.
Performance Summary as of 12/31/04
Average annual total return of Class 2 shares* represents the average annual change in value, assuming reinvestment of dividends and capital gains. Average returns smooth out variations in returns, which can be significant; they are not the same as year-by-year results.
Periods ended 12/31/04
| | | | | | |
| | | 1-Year | | 5-Year | | 10-Year |
Average Annual Total Return | | +10.61% | | +6.17% | | +11.06% |
*Because Class 2 shares were not offered until 1/6/99, standardized Class 2 Fund performance for prior periods represents the historical results of Class 1 shares. For periods beginning on 1/6/99, Class 2’s results reflect an additional 12b-1 fee expense, which also affects future performance. Since 1/6/99 (effective date), the average annual total return of Class 2 shares was +4.98%.
Total Return Index Comparison
for Hypothetical $10,000 Investment (1/1/95–12/31/04)
The graph below shows the change in value of a hypothetical $10,000 investment in the Fund over the indicated period and includes reinvestment of any income or distributions. The Fund’s performance* is compared to the performance of the Russell 1000® Value Index and the Lipper VIP Equity Income Funds Objective Average, as well as the Consumer Price Index (CPI). One cannot invest directly in an index, nor is an index representative of the Fund’s portfolio. Please see Important Notes to Performance Information preceding the Fund Summaries.
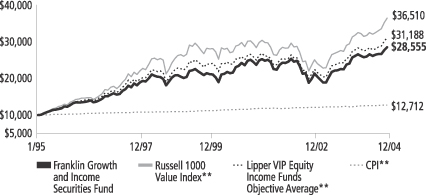
**Sources: Standard & Poor’s Micropal; Lipper Inc. Please see Index Descriptions following the Fund Summaries.
Franklin Growth
and Income Securities
Fund – Class 2
Performance reflects the Fund’s Class 2 operating expenses, but does not include any contract fees, expenses or sales charges. If they had been included, performance would be lower. These charges and deductions, particularly for variable life policies, can have a significant effect on contract values and insurance benefits. See the contract prospectus for a complete description of these expenses, including sales charges.
Performance data quoted represent past performance, which does not guarantee future results. Investment return and principal value will fluctuate, and you may have a gain or loss when you sell your shares. Current performance may differ from figures shown.
FGI-1
Fund Goals and Main Investments: Franklin Growth and Income Securities Fund seeks capital appreciation, with current income as a secondary goal. The Fund invests primarily in common stocks with current dividend yields above the average of the Standard & Poor’s 500 Composite Index (S&P 500).1
Performance Overview
You can find the Fund’s one-year total return in the Performance Summary. The Fund underperformed its benchmark, the Russell 1000 Value Index, which returned 16.49%, and its peers, as measured by the Lipper VIP Equity Income Funds Objective Average, which returned 13.64% for the year under review.2 However, the Fund performed generally in line with the broad stock market, as measured by the Standard & Poor’s Composite Index (S&P 500), which returned 10.87%.3
Economic and Market Overview
During the year ended December 31, 2004, the domestic economy expanded solidly and broadly across most industries, sectors and regions as gross domestic product (GDP) rose an estimated 4.4%.4 However, surging energy and other commodity prices had a dampening effect. Although consumer confidence remained below pre-recession levels, consumer spending supported strong auto sales, increased durable goods consumption and a healthy housing market. Similarly, business spending rose substantially even as business confidence wavered. With improving balance sheets and stronger profit margins, many companies entered an upgrade cycle and invested in new technologies, driving equipment spending up 9.5% in the second half of 2004.4 The labor market firmed as employers hired 2.2 million workers in 2004, and unemployment dropped from 5.7% to 5.4% during the year.5 More than one-half of the jobs lost during the recession have been recovered; however, most new jobs were part-time or temporary. Given concerns over rising benefits costs and lingering uncertainties about economic recovery, many companies turned to temporary employment or opted for continued hiring freezes. At year-end, elevated household debt levels and the deepening federal budget and trade deficits were three top concerns for the economy as it headed into 2005.
1. Please see Index Descriptions following the Fund Summaries.
2. Sources: Standard & Poor’s Micropal; Lipper Inc. One cannot invest directly in an index, nor is an index representative of the Fund’s portfolio. Please see Index Descriptions following the Fund Summaries.
3. Source: Standard & Poor’s Micropal. One cannot invest directly in an index, nor is an index representative of the Fund’s portfolio. Please see Index Descriptions following the Fund Summaries.
4. Source: Bureau of Economic Analysis.
5. Source: Bureau of Labor Statistics.
Fund Risks: Stocks offer the potential for long-term gains but can be subject to short-term up-and-down price movements. Foreign investing involves special risks including currency fluctuations, economic instability, and social and political developments. Bonds and other debt obligations are affected by changes in interest rates and the creditworthiness of their issuers. High yield, lower-rated (junk) bonds generally have greater price swings and higher default risks. The Fund’s prospectus also includes a description of the main investment risks.
FGI-2
The U.S. dollar weakened throughout 2004 and hit an all-time low against the euro and a multi-year low versus the yen. The widening trade and current account deficits and possibility for higher import prices contributed to inflationary pressures. The core inflation rate rose to 2.2% in 2004, or 3.3% including volatile food and energy costs. Aiming to keep inflation tame, the Federal Reserve Board (Fed) raised the federal funds target rate five times between June and December, from 1.00% to 2.25%, the highest level in more than three years. The Fed said it will respond to changes in economic prospects as needed to fulfill its obligation to maintain price stability, noting in December that it perceived “the upside and downside risks to the attainment of both sustainable growth and price stability for the next few quarters to be roughly equal.”6
Despite a generally robust economy and improving corporate fundamentals, investors had to digest a wide range of information in 2004, including rising inflation, the dollar’s value, a contentious presidential election and ongoing concerns about terrorism, war and reconstruction in Iraq. Domestic equity markets rallied in early 2004 and then fluctuated; however, they were essentially flat through early November. Disappointing earnings from a number of blue chip companies applied downward pressure, but initial public offering (IPO) activity was strong and investor sentiment improved late in the period despite the mixed signals. After the elections concluded, the markets enjoyed another strong rally through year-end. The blue chip stocks of the Dow Jones Industrial Average gained 5.31% for the year under review, while the broader S&P 500 rose 10.87% and the technology-heavy NASDAQ Composite Index increased 9.15%.7
Investment Strategy
We are research driven, fundamental investors, pursuing a disciplined value-oriented strategy. As bottom-up investors focusing primarily on individual securities, we look at the market price of a company’s securities relative to our evaluation of the company’s potential long-term earnings, asset value and cash flow, with a special emphasis on current dividend yield. We believe that high relative dividend yield is frequently a good indicator of value.
6. Source: Federal Reserve. Press Release, 12/14/04.
7. Source: Standard & Poor’s Micropal. Please see Index Descriptions following the Fund Summaries.
FGI-3
Manager’s Discussion
During the year ended December 31, 2004, the Fund’s performance relative to the Russell 1000 Value Index was affected by stock selection and investment weightings in various sectors. Performance of certain holdings during fourth quarter 2004 drove much of the year’s relative results.
The Fund’s underweighted position relative to the index and strong stock selection in consumer services produced the greatest positive overall effect on relative returns. Fund holding Mandalay Resort Group, a hotel and casino operator, boosted our returns in this sector. These shares appreciated 54% as MGM Mirage agreed to acquire the company during the reporting period. We subsequently took profits in Mandalay as the stock reached our price target.
Despite an underweighted position, our retail trade sector return surpassed that of the index’s due to strong stock selection. Fund holding J.C. Penney, a retailer that sold its troubled drugstore chain, Eckerd, during the period, appreciated 38%. We sold this holding when the shares met our price target. Our position in Toys R Us convertible preferred stock also rose more than 40% as the company benefited from an announced restructuring of its assets.
Favorable allocation and stock selection among our electronic technology stocks also contributed positively to relative and absolute returns. Our investments in Rockwell Automation (up 40% during the period) and Raytheon (up 32%) outperformed the index’s sector performance. We took profits in Motorola (up 30%) and General Dynamics (up 9%), and redeployed the proceeds into shares of Lockheed Martin, a company we believe has promising prospects and that was trading at what we considered an attractive valuation.
The finance sector was the main hindrance to relative returns during the year. Our underweighted exposure to this underperforming sector helped relative returns, but our stock picking restrained them. The Fund underperformed partly because we did not own shares of Countrywide Financial, a stock whose value was up over 47% during the period, but whose dividend yield was well below our typical threshold. However, our finance sector returns were particularly hurt by our Marsh & McLennan holding. Marsh & McLennan’s shares fell 46% during fourth quarter 2004 when New York State Attorney General Eliot Spitzer announced that he would investigate the company as well as various business practices within the insurance brokerage industry. The company subsequently reported disappointing earnings and
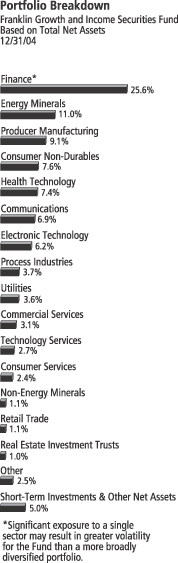
FGI-4
delayed a decision on the payment of its dividend. Shares of another insurance broker holding, Arthur J. Gallagher, also fell after the announcement. We sold both holdings during the reporting period.
The Fund’s overweighted health technology position, primarily in major pharmaceutical companies, also impaired returns. However, our stock selection resulted in performance better than that of the overall sector. Pharmaceutical holdings Merck (down 27%) and Pfizer (down 22%) were the group’s worst performers. The companies’ shares fell after each disclosed cardiovascular safety findings regarding a particular class of profitable painkillers. Merck went so far as to recall their arthritis drug, Vioxx, sending their shares down sharply after the announcement. Poor performance from Merck and Pfizer overshadowed positive contributions from three other Fund positions, GlaxoSmithKline, Johnson & Johnson, and new holding Hillenbrand Industries. These companies’ shares appreciated 20%, 23%, and 12%, respectively during the year. Despite near-term pricing and patent protection issues, we believed the industry’s long-term growth prospects remained attractive. Also, many industry leaders were selling at their lowest relative valuations and highest dividend yields in over 10 years. Thus, we continued to maintain an overweighted investment position in the sector versus the index.
Despite a favorable ruling during the period for regional telephone companies regarding access charges for their lines, our communications sector investments experienced weak relative returns while the communications sector itself only slightly outperformed the overall index. The benefit of our sector overweighting was overshadowed by performance of three companies, one we held and the other two we did not. AT&T, a stock we held and sold earlier in the year, performed poorly (down 25% for the period we owned it in 2004) as earnings estimates fell on declining revenue trends. Two stocks we did not own due to our dividend requirements, AT&T Wireless and Sprint, were up 87% and 56% for the year. Although recent earnings were disappointing for many major telephone companies, their near-term prospects appeared to us to be improving. Many of these companies typically generate attractive cash earnings and, thus, can offer dividend yields in the 4% to 5% range. Therefore, consistent with our strategy, we continued to maintain an overweighted allocation in this sector.
During the year under review, we sold selected investments in the finance, retail trade and consumer durable sectors. Conversely, we added to our holdings in health technology and energy minerals. We also
FGI-5
initiated several new positions. For example, Union Pacific is a transportation company that we believe may benefit from a stronger economy and improved internal operations. Along this same theme, we initiated positions in two producer manufacturers, PACCAR and 3M, and a specialty chemicals operator, Lyondell Chemical. We also purchased shares of Europe-based Unilever and GlaxoSmithKline on share price weakness. Based on our analysis, both companies’ stocks offered above-average dividend yields and lower valuations than comparable domestic companies. We sold some of our Sara Lee holdings and redeployed the proceeds into another consumer staple operator, General Mills, seeking to take advantage of what we considered depressed valuation. We added iStar Financial, a real estate investment trust, when the shares declined on interest rate fears. Also, within energy minerals, we redeployed profits from the sale of PetroChina into Kerr-McGee, an integrated oil and gas company that offered a 3.6% dividend yield at the time of purchase. Other recent acquisitions included yellow pages advertiser Dex Media and media conglomerate Viacom.
During the period, we remained underweighted in finance and utilities stocks due to an uncertain interest rate environment. Our overweighted position in producer manufacturing, electronic technology and technology services reflected our belief that global economic growth was positive for investment spending. We also believed that global economic growth could drive demand for energy minerals and oil-related (industrial services) stocks. Therefore, consistent with our strategy, we maintained a sizable investment in these energy-related stocks.
Top 10 Holdings
Franklin Growth and Income Securities Fund
12/31/04
| | |
Company
Sector/Industry | | % of Total
Net Assets |
| |
| General Electric Co. | | 4.3% |
| Producer Manufacturing | | |
| |
| Bank of America Corp. | | 4.1% |
| Finance | | |
| |
| Citigroup Inc. | | 4.0% |
| Finance | | |
| |
| ChevronTexaco Corp. | | 3.0% |
| Energy Minerals | | |
| |
| BP PLC, ADR (U.K.) | | 2.8% |
| Energy Minerals | | |
| |
| Altria Group Inc. | | 2.5% |
| Consumer Non-Durables | | |
| |
| Shell Transport & Trading Co. PLC, ADR (U.K.) | | 2.2% |
| Energy Minerals | | |
| |
| FNMA | | 2.1% |
| Finance | | |
| |
| SBC Communications Inc. | | 2.1% |
| Communications | | |
| |
R.R. Donnelley &
Sons Co. | | 2.0% |
| Commercial Services | | |
The dollar value, number of shares or principal amount, and names of all portfolio holdings are listed in the Fund’s Statement of Investments.
FGI-6
Companies have again begun to focus on dividends as evidenced by impressive average annual dividend gains of more than 11% in 2004. Some of the Fund’s holdings, such as Microsoft and Lockheed Martin, increased their dividends by more than 50% during the year. As the Fund’s investment strategy focuses primarily on dividend-paying securities, we attempted to position the Fund to benefit from this corporate trend.
Thank you for your participation in Franklin Growth and Income Securities Fund. We look forward to serving your future investment needs.
The foregoing information reflects our analysis, opinions and portfolio holdings as of December 31, 2004, the end of the reporting period. The way we implement our main investment strategies and the resulting portfolio holdings may change depending on factors such as market and economic conditions. These opinions may not be relied upon as investment advice or an offer for a particular security. The information is not a complete analysis of every aspect of any market, country, industry, security or the Fund. Statements of fact are from sources considered reliable, but the adviser makes no representation or warranty as to their completeness or accuracy. Although historical performance is no guarantee of future results, these insights may help you understand our investment management philosophy.
FGI-7
Fund Expenses
As an investor in a variable insurance contract (“Contract”) that indirectly provides for investment in an underlying mutual fund, you can incur transaction and/or ongoing expenses at both the Fund level and the Contract level.
| • | | Transaction expenses can include sales charges (loads) on purchases, redemption fees, surrender fees, transfer fees and premium taxes. |
| • | | Ongoing expenses can include management fees, distribution and service (12b-1) fees, contract fees, annual maintenance fees, mortality and expense risk fees and other fees and expenses. All mutual funds and Contracts have some types of ongoing expenses. |
The expenses shown in the table below are meant to highlight ongoing expenses at the Fund level only and do not include ongoing expenses at the Contract level, or transaction expenses at either the Fund or Contract levels. While the Fund does not have transaction expenses, if the transaction and ongoing expenses at the Contract level were included, the expenses shown below would be higher. You should consult your Contract prospectus or disclosure document for more information.
The table shows Fund-level ongoing expenses and can help you understand these expenses and compare them with those of other mutual funds offered through the Contract. The table assumes a $1,000 investment held for the six months indicated. Please refer to the Fund prospectus for additional information on operating expenses.
Actual Fund Expenses
The first line (Actual) for each share class listed in the table below provides actual account values and expenses. The “Ending Account Value” is derived from the Fund’s actual return, which includes the effect of ongoing Fund expenses, but does not include the effect of ongoing Contract expenses.
You can estimate the Fund-level expenses you incurred during the period, by following these steps. Of course, your account value and expenses will differ from those in this illustration:
| 1. | Divide your account value by $1,000. |
If an account had an $8,600 value, then $8,600 ÷ $1,000 = 8.6.
| 2. | Multiply the result by the number under the heading “Fund-Level Expenses Incurred During Period.” |
If Fund-Level Expenses Incurred During Period were $7.50, then 8.6 × $7.50 = $64.50.
Franklin Growth and Income Securities Fund – Class 2
FGI-8
In this illustration, the estimated expenses incurred this period at the Fund level are $64.50.
Hypothetical Example for Comparison with Other Mutual Funds
Information in the second line (Hypothetical) for each class in the table can help you compare ongoing expenses of the Fund with those of other mutual funds offered through the Contract. This information may not be used to estimate the actual ending account balance or expenses you incurred during the period. The hypothetical “Ending Account Value” is based on the actual expense ratio for each class and an assumed 5% annual rate of return before expenses, which does not represent the Fund’s actual return. The figure under the heading “Fund-Level Expenses Incurred During Period” shows the hypothetical expenses your account would have incurred under this scenario. You can compare this figure with the 5% hypothetical examples that appear in shareholder reports of other funds offered through a Contract.
| | | | | | | | | |
| Class 2 | | Beginning
Account
Value 6/30/04 | | Ending
Account
Value 12/31/04 | | Fund-Level
Expenses Incurred
During Period*
6/30/04-12/31/04 |
Actual | | $ | 1,000 | | $ | 1,070.00 | | $ | 4.06 |
Hypothetical (5% return before expenses) | | $ | 1,000 | | $ | 1,021.22 | | $ | 3.96 |
*Expenses are equal to the annualized expense ratio for the Fund’s Class 2 shares (0.78%), which does not include any ongoing expenses of the Contract for which the Fund is an investment option, multiplied by the average account value over the period, multiplied by 184/366 to reflect the one-half year period.
FGI-9
FRANKLIN TEMPLETON VARIABLE INSURANCE PRODUCTS TRUST
FRANKLIN GROWTHAND INCOME SECURITIES FUND
Financial Highlights
| | | | | | | | | | | | | | | | | | | | |
| | | Class 1
| |
| | | Year Ended December 31,
| |
| | | 2004 | | | 2003 | | | 2002 | | | 2001 | | | 2000 | |
| | |
|
|
|
Per share operating performance | | | | | | | | | | | | | | | | | | | | |
(for a share outstanding throughout the year) | | | | | | | | | | | | | | | | | | | | |
Net asset value, beginning of year | | $ | 14.44 | | | $ | 11.82 | | | $ | 15.27 | | | $ | 17.16 | | | $ | 17.78 | |
| | |
|
|
|
Income from investment operations: | | | | | | | | | | | | | | | | | | | | |
Net investment incomea | | | .40 | | | | .36 | | | | .39 | | | | .37 | c | | | .45 | |
Net realized and unrealized gains (losses) | | | 1.14 | | | | 2.66 | | | | (2.58 | ) | | | (.70 | )c | | | 2.26 | |
| | |
|
|
|
Total from investment operations | | | 1.54 | | | | 3.02 | | | | (2.19 | ) | | | (.33 | ) | | | 2.71 | |
| | |
|
|
|
Less distributions from: | | | | | | | | | | | | | | | | | | | | |
Net investment income | | | (.38 | ) | | | (.40 | ) | | | (.42 | ) | | | (.05 | ) | | | (1.17 | ) |
Net realized gains | | | — | | | | — | | | | (.84 | ) | | | (1.51 | ) | | | (2.16 | ) |
| | |
|
|
|
Total distributions | | | (.38 | ) | | | (.40 | ) | | | (1.26 | ) | | | (1.56 | ) | | | (3.33 | ) |
| | |
|
|
|
Net asset value, end of year | | $ | 15.60 | | | $ | 14.44 | | | $ | 11.82 | | | $ | 15.27 | | | $ | 17.16 | |
| | |
|
|
|
| | | | | |
Total returnb | | | 10.91% | | | | 26.06% | | | | (15.53)% | | | | (2.02)% | | | | 17.99% | |
Ratios/supplemental data | | | | | | | | | | | | | | | | | | | | |
Net assets, end of year (000’s) | | $ | 471,596 | | | $ | 505,393 | | | $ | 455,680 | | | $ | 646,851 | | | $ | 810,837 | |
Ratios to average net assets: | | | | | | | | | | | | | | | | | | | | |
Expenses | | | .52% | | | | .53% | | | | .53% | | | | .51% | | | | .50% | |
Net investment income | | | 2.77% | | | | 2.92% | | | | 2.85% | | | | 2.31% | c | | | 2.75% | |
Portfolio turnover rate | | | 40.15% | | | | 43.18% | | | | 96.61% | | | | 119.78% | | | | 66.82% | |
| a | Based on average daily shares outstanding. |
| b | Total return does not include any fees, charges or expenses imposed by the variable annuity and life insurance contracts for which the Franklin Templeton Variable Insurance Products Trust serves as an underlying investment vehicle. Total return is not annualized for periods less than one year. |
| c | Effective January 1, 2001, the Fund adopted the provisions of the AICPA Audit and Accounting Guide for Investment Companies and began amortizing all premium and discount on fixed-income securities, as required. The effect of this change was as follows: |
| | |
Net investment income per share | | $(.026) |
Net realized and unrealized gains (losses) per share | | .026 |
Ratio of net investment income to average net assets | | (.17)% |
Per share data and ratios for prior periods have not been restated to reflect this change in accounting policy.
See notes to financial statements.
FGI-10
FRANKLIN TEMPLETON VARIABLE INSURANCE PRODUCTS TRUST
FRANKLIN GROWTHAND INCOME SECURITIES FUND
Financial Highlights (continued)
| | | | | | | | | | | | | | | | | | | | |
| | | Class 2
| |
| | | Year Ended December 31,
| |
| | | 2004 | | | 2003 | | | 2002 | | | 2001 | | | 2000 | |
| | |
|
|
|
Per share operating performance | | | | | | | | | | | | | | | | | | | | |
(for a share outstanding throughout the year) | | | | | | | | | | | | | | | | | | | | |
Net asset value, beginning of year | | $ | 14.31 | | | $ | 11.74 | | | $ | 15.20 | | | $ | 17.13 | | | $ | 17.73 | |
| | |
|
|
|
Income from investment operations: | | | | | | | | | | | | | | | | | | | | |
Net investment incomea | | | .37 | | | | .33 | | | | .34 | | | | .33 | c | | | .40 | |
Net realized and unrealized gains (losses) | | | 1.12 | | | | 2.63 | | | | (2.54 | ) | | | (.70 | )c | | | 2.27 | |
| | |
|
|
|
Total from investment operations | | | 1.49 | | | | 2.96 | | | | (2.20 | ) | | | (.37 | ) | | | 2.67 | |
| | |
|
|
|
Less distributions from: | | | | | | | | | | | | | | | | | | | | |
Net investment income | | | (.37 | ) | | | (.39 | ) | | | (.42 | ) | | | (.05 | ) | | | (1.11 | ) |
Net realized gains | | | — | | | | — | | | | (.84 | ) | | | (1.51 | ) | | | (2.16 | ) |
| | |
|
|
|
Total distributions | | | (.37 | ) | | | (.39 | ) | | | (1.26 | ) | | | (1.56 | ) | | | (3.27 | ) |
| | |
|
|
|
Net asset value, end of year | | $ | 15.43 | | | $ | 14.31 | | | $ | 11.74 | | | $ | 15.20 | | | $ | 17.13 | |
| | |
|
|
|
| | | | | |
Total returnb | | | 10.61% | | | | 25.70% | | | | (15.72)% | | | | (2.28)% | | | | 17.79% | |
Ratios/supplemental data | | | | | | | | | | | | | | | | | | | | |
Net assets, end of year (000’s) | | $ | 263,146 | | | $ | 136,824 | | | $ | 38,379 | | | $ | 11,789 | | | $ | 2,311 | |
Ratios to average net assets: | | | | | | | | | | | | | | | | | | | | |
Expenses | | | .77% | | | | .78% | | | | .78% | | | | .76% | | | | .75% | |
Net investment income | | | 2.52% | | | | 2.67% | | | | 2.60% | | | | 2.13% | c | | | 2.46% | |
Portfolio turnover rate | | | 40.15% | | | | 43.18% | | | | 96.61% | | | | 119.78% | | | | 66.82% | |
| a | Based on average daily shares outstanding. |
| b | Total return does not include any fees, charges or expenses imposed by the variable annuity and life insurance contracts for which the Franklin Templeton Variable Insurance Products Trust serves as an underlying investment vehicle. Total return is not annualized for periods less than one year. |
| c | Effective January 1, 2001, the Fund adopted the provisions of the AICPA Audit and Accounting Guide for Investment Companies and began amortizing all premium and discount on fixed-income securities, as required. The effect of this change was as follows: |
| | |
Net investment income per share | | $(.026) |
Net realized and unrealized gains (losses) per share | | .026 |
Ratio of net investment income to average net assets | | (.17)% |
Per share data and ratios for prior periods have not been restated to reflect this change in accounting policy.
See notes to financial statements.
FGI-11
FRANKLIN TEMPLETON VARIABLE INSURANCE PRODUCTS TRUST
FRANKLIN GROWTHAND INCOME SECURITIES FUND
Statement of Investments, December 31, 2004
| | | | | |
| | | SHARES | | VALUE |
Common Stocks 90.6% | | | | | |
Commercial Services 3.1% | | | | | |
Dex Media Inc. | | 299,900 | | $ | 7,485,504 |
R.R. Donnelley & Sons Co. | | 425,600 | | | 15,019,424 |
| | | | |
|
|
| | | | | | 22,504,928 |
| | | | |
|
|
Communications 6.9% | | | | | |
Alltel Corp. | | 131,100 | | | 7,703,436 |
BellSouth Corp. | | 385,800 | | | 10,721,382 |
SBC Communications Inc. | | 584,572 | | | 15,064,420 |
Telus Corp. (Canada) | | 85,100 | | | 2,524,765 |
Verizon Communications Inc. | | 370,722 | | | 15,017,948 |
| | | | |
|
|
| | | | | | 51,031,951 |
| | | | |
|
|
Consumer Non-Durables 7.6% | | | | | |
Altria Group Inc. | | 306,200 | | | 18,708,820 |
British American Tobacco PLC (United Kingdom) | | 421,000 | | | 7,252,630 |
Coca-Cola Co. | | 208,300 | | | 8,671,529 |
General Mills Inc. | | 83,900 | | | 4,170,669 |
Kimberly-Clark Corp. | | 80,400 | | | 5,291,124 |
Sara Lee Corp. | | 148,100 | | | 3,575,134 |
Unilever NV, N.Y. shs (Netherlands) | | 128,000 | | | 8,538,880 |
| | | | |
|
|
| | | | | | 56,208,786 |
| | | | |
|
|
Consumer Services 2.4% | | | | | |
Dow Jones & Co. Inc. | | 168,800 | | | 7,268,528 |
Viacom Inc., B | | 191,100 | | | 6,954,129 |
The Walt Disney Co. | | 131,800 | | | 3,664,040 |
| | | | |
|
|
| | | | | | 17,886,697 |
| | | | |
|
|
Electronic Technology 6.2% | | | | | |
Diebold Inc. | | 34,400 | | | 1,917,112 |
Hewlett-Packard Co. | | 317,100 | | | 6,649,587 |
Lockheed Martin Corp. | | 94,200 | | | 5,232,810 |
Nokia Corp., ADR (Finland) | | 487,800 | | | 7,643,826 |
Raytheon Co. | | 322,500 | | | 12,522,675 |
Rockwell Automation Inc. | | 231,700 | | | 11,480,735 |
| | | | |
|
|
| | | | | | 45,446,745 |
| | | | |
|
|
Energy Minerals 11.0% | | | | | |
BP PLC, ADR (United Kingdom) | | 354,400 | | | 20,696,960 |
ChevronTexaco Corp. | | 421,116 | | | 22,112,801 |
ExxonMobil Corp. | | 282,744 | | | 14,493,457 |
Kerr-McGee Corp. | | 118,800 | | | 6,865,452 |
Shell Transport & Trading Co. PLC, ADR (United Kingdom) | | 319,500 | | | 16,422,300 |
| | | | |
|
|
| | | | | | 80,590,970 |
| | | | |
|
|
Finance 23.7% | | | | | |
Bank of America Corp. | | 637,012 | | | 29,933,194 |
Citigroup Inc. | | 610,900 | | | 29,433,162 |
Fannie Mae | | 72,200 | | | 5,141,362 |
Fifth Third Bancorp | | 173,100 | | | 8,184,168 |
JPMorgan Chase & Co. | | 330,170 | | | 12,879,932 |
KeyCorp | | 106,400 | | | 3,606,960 |
Montpelier Re Holdings Ltd. (Bermuda) | | 96,300 | | | 3,702,735 |
FGI-12
FRANKLIN TEMPLETON VARIABLE INSURANCE PRODUCTS TRUST
FRANKLIN GROWTHAND INCOME SECURITIES FUND
Statement of Investments, December 31, 2004 (cont.)
| | | | | |
| | | SHARES | | VALUE |
Common Stocks (cont.) | | | | | |
Finance (cont.) | | | | | |
Morgan Stanley | | 227,200 | | $ | 12,614,144 |
Old Republic International Corp. | | 191,600 | | | 4,847,480 |
Prudential Financial Inc. | | 116,060 | | | 6,378,657 |
St. Paul Travelers Cos. Inc. | | 300,100 | | | 11,124,707 |
U.S. Bancorp | | 407,500 | | | 12,762,900 |
Wachovia Corp. | | 202,700 | | | 10,662,020 |
Washington Mutual Inc. | | 262,800 | | | 11,111,184 |
Wells Fargo & Co. | | 193,500 | | | 12,026,025 |
| | | | |
|
|
| | | | | | 174,408,630 |
| | | | |
|
|
Health Technology 6.9% | | | | | |
Abbott Laboratories | | 41,600 | | | 1,940,640 |
Bristol-Myers Squibb Co. | | 204,000 | | | 5,226,480 |
GlaxoSmithKline PLC, ADR (United Kingdom) | | 197,400 | | | 9,354,786 |
Hillenbrand Industries Inc. | | 69,500 | | | 3,860,030 |
Johnson & Johnson | | 29,200 | | | 1,851,864 |
Merck & Co. Inc. | | 282,600 | | | 9,082,764 |
Pall Corp. | | 183,500 | | | 5,312,325 |
Pfizer Inc. | | 292,300 | | | 7,859,947 |
Wyeth | | 142,700 | | | 6,077,593 |
| | | | |
|
|
| | | | | | 50,566,429 |
| | | | |
|
|
Industrial Services .8% | | | | | |
Waste Management Inc. | | 191,000 | | | 5,718,540 |
| | | | |
|
|
Non-Energy Minerals 1.1% | | | | | |
Alcoa Inc. | | 266,300 | | | 8,367,146 |
| | | | |
|
|
Process Industries 3.7% | | | | | |
Cabot Corp. | | 99,800 | | | 3,860,264 |
Dow Chemical Co. | | 237,800 | | | 11,773,478 |
E.I. du Pont de Nemours & Co. | | 155,700 | | | 7,637,085 |
Lyondell Chemical Co. | | 134,100 | | | 3,878,172 |
| | | | |
|
|
| | | | | | 27,148,999 |
| | | | |
|
|
Producer Manufacturing 9.1% | | | | | |
3M Co. | | 69,200 | | | 5,679,244 |
Avery Dennison Corp. | | 69,200 | | | 4,149,924 |
General Electric Co. | | 866,000 | | | 31,609,000 |
Honeywell International Inc. | | 281,900 | | | 9,982,079 |
PACCAR Inc. | | 73,900 | | | 5,947,472 |
Pitney Bowes Inc. | | 204,400 | | | 9,459,632 |
| | | | |
|
|
| | | | | | 66,827,351 |
| | | | |
|
|
Real Estate Investment Trusts 1.0% | | | | | |
iStar Financial Inc. | | 159,600 | | | 7,223,495 |
| | | | |
|
|
Technology Services 2.7% | | | | | |
Automatic Data Processing Inc. | | 123,200 | | | 5,463,920 |
Microsoft Corp. | | 397,200 | | | 10,609,212 |
Paychex Inc. | | 110,400 | | | 3,762,432 |
| | | | |
|
|
| | | | | | 19,835,564 |
| | | | |
|
|
FGI-13
FRANKLIN TEMPLETON VARIABLE INSURANCE PRODUCTS TRUST
FRANKLIN GROWTHAND INCOME SECURITIES FUND
Statement of Investments, December 31, 2004 (cont.)
| | | | | | |
| | | SHARES | | VALUE |
Common Stocks (cont.) | | | | | | |
Transportation .8% | | | | | | |
Union Pacific Corp. | | | 83,900 | | $ | 5,642,275 |
| | | | | |
|
|
Utilities 3.6% | | | | | | |
Dominion Resources Inc. | | | 81,800 | | | 5,541,132 |
NiSource Inc. | | | 484,600 | | | 11,039,188 |
PPL Corp. | | | 80,200 | | | 4,273,056 |
Scottish Power PLC (United Kingdom) | | | 729,500 | | | 5,646,491 |
| | | | | |
|
|
| | | | | | | 26,499,867 |
| | | | | |
|
|
Total Common Stocks (Cost $525,994,472) | | | | | | 665,908,373 |
| | | | | |
|
|
Convertible Preferred Stocks 4.4% | | | | | | |
Consumer Durables .9% | | | | | | |
Ford Motor Co. Capital Trust II, 6.50%, cvt. pfd. | | | 129,100 | | | 6,815,189 |
| | | | | |
|
|
Finance 1.9% | | | | | | |
Capital One Financial Corp., 6.25%, cvt. pfd. | | | 64,400 | | | 3,630,550 |
FNMA, 5.375%, cvt. pfd. | | | 95 | | | 10,056,938 |
| | | | | |
|
|
| | | | | | | 13,687,488 |
| | | | | |
|
|
Health Technology .5% | | | | | | |
Schering-Plough Corp., 6.00%, cvt. pfd. | | | 68,100 | | | 3,820,410 |
| | | | | |
|
|
Retail Trade 1.1% | | | | | | |
Toys R Us Inc., 6.25%, cvt. pfd. | | | 147,600 | | | 7,822,800 |
| | | | | |
|
|
Total Convertible Preferred Stocks (Cost $28,645,816) | | | | | | 32,145,887 |
| | | | | |
|
|
Total Long Term Investments (Cost $554,640,288) | | | | | | 698,054,260 |
| | | | | |
|
|
| | |
| | | PRINCIPAL
AMOUNT
| | |
Short Term Investments (Cost $25,667,745) 3.5% | | | | | | |
Repurchase Agreement | | | | | | |
aJoint Repurchase Agreement, 1.915%, 1/03/05 (Maturity Value $25,671,841) | | $ | 25,667,745 | | | 25,667,745 |
ABN AMRO Bank, N.V., New York Branch (Maturity Value $2,534,581) Banc of America Securities LLC (Maturity Value $950,370) Barclays Capital Inc. (Maturity Value $1,172,176) Bear, Stearns & Co. Inc. (Maturity Value $1,995,986) BNP Paribas Securities Corp. (Maturity Value $2,534,581) Deutsche Bank Securities Inc. (Maturity Value $1,267,419) Goldman, Sachs & Co. (Maturity Value $2,534,581) Greenwich Capital Markets Inc. (Maturity Value $2,534,581) Lehman Brothers Inc. (Maturity Value $2,543,823) Merrill Lynch Government Securities Inc. (Maturity Value $2,534,581) Morgan Stanley & Co. Inc. (Maturity Value $2,534,581) UBS Securities LLC (Maturity Value $2,534,581) | | | | | | |
Collateralized by U.S. Government Agency Securities, 0.00% - 7.125%, 1/01/05 - 9/15/09; bU.S. Treasury Bills, 3/24/05 - 3/31/05, U.S. Treasury Bonds, 9.375% - 12.00%, 5/15/05 - 2/15/06 and U.S. Treasury Notes, 1.50% - 7.00%, 2/28/05 - 6/15/09 | | | | | | |
| | | | | |
|
|
Total Investments (Cost $580,308,033) 98.5% | | | | | | 723,722,005 |
Other Assets, less Liabilities 1.5% | | | | | | 11,019,206 |
| | | | | |
|
|
Net Assets 100.0% | | | | | $ | 734,741,211 |
| | | | | |
|
|
Portfolio Abbreviation:
ADR - American Depository Receipt
| a | See Note 1(c) regarding joint repurchase agreement. |
| b | Security is traded on a discount basis with no stated coupon rate. |
See notes to financial statements.
FGI-14
FRANKLIN TEMPLETON VARIABLE INSURANCE PRODUCTS TRUST
FRANKLIN GROWTHAND INCOME SECURITIES FUND
Financial Statements
Statement of Assets and Liabilities
December 31, 2004
| | | |
Assets: | | | |
Investments in securities: | | | |
Cost - Unaffiliated issuers | | $ | 554,640,288 |
Cost - Repurchase agreement | | | 25,667,745 |
| | |
|
|
Total cost of investments | | | 580,308,033 |
| | |
|
|
Value - Unaffiliated issuers | | | 698,054,260 |
Value - Repurchase agreement | | | 25,667,745 |
| | |
|
|
Total value of investments | | | 723,722,005 |
| | |
|
|
Receivables: | | | |
Investment securities sold | | | 9,844,307 |
Capital shares sold | | | 291,847 |
Dividends | | | 1,566,773 |
| | |
|
|
Total assets | | | 735,424,932 |
| | |
|
|
Liabilities: | | | |
Payables: | | | |
Capital shares redeemed | | | 272,700 |
Affiliates | | | 350,517 |
Other liabilities | | | 60,504 |
| | |
|
|
Total liabilities | | | 683,721 |
| | |
|
|
Net assets, at value | | $ | 734,741,211 |
| | |
|
|
Net assets consist of: | | | |
Undistributed net investment income | | $ | 17,939,158 |
Net unrealized appreciation (depreciation) | | | 143,414,082 |
Accumulated net realized gain (loss) | | | 1,804,759 |
Capital shares | | | 571,583,212 |
| | |
|
|
Net assets, at value | | $ | 734,741,211 |
| | |
|
|
Class 1: | | | |
Net assets, at value | | $ | 471,595,615 |
| | |
|
|
Shares outstanding | | | 30,236,216 |
| | |
|
|
Net asset value and offering price per share | | $ | 15.60 |
| | |
|
|
Class 2: | | | |
Net assets, at value | | $ | 263,145,596 |
| | |
|
|
Shares outstanding | | | 17,048,851 |
| | |
|
|
Net asset value and offering price per share | | $ | 15.43 |
| | |
|
|
See notes to financial statements.
FGI-15
FRANKLIN TEMPLETON VARIABLE INSURANCE PRODUCTS TRUST
FRANKLIN GROWTHAND INCOME SECURITIES FUND
Financial Statements (continued)
Statement of Operations
for the year ended December 31, 2004
| | | | |
Investment income: | | | | |
Dividends | | | $21,773,903 | |
Interest | | | 394,757 | |
| | |
|
|
|
Total investment income | | | 22,168,660 | |
| | |
|
|
|
Expenses: | | | | |
Management fees (Note 3) | | | 3,279,684 | |
Distribution fees - Class 2 (Note 3) | | | 487,650 | |
Transfer agent fees | | | 7,000 | |
Custodian fees (Note 4) | | | 16,249 | |
Reports to shareholders | | | 156,461 | |
Professional fees | | | 32,512 | |
Trustees’ fees and expenses | | | 4,173 | |
Other | | | 28,096 | |
| | |
|
|
|
Total expenses | | | 4,011,825 | |
Expense reductions (Note 4) | | | (2 | ) |
| | |
|
|
|
Net expenses | | | 4,011,823 | |
| | |
|
|
|
Net investment income | | | 18,156,837 | |
| | |
|
|
|
Realized and unrealized gains (losses): | | | | |
Net realized gain (loss) from: | | | | |
Investments | | | 35,598,905 | |
Foreign currency transactions | | | (30,270 | ) |
| | |
|
|
|
Net realized gain (loss) | | | 35,568,635 | |
Net change in unrealized appreciation (depreciation) on: | | | | |
Investments | | | 16,806,929 | |
Translation of assets and liabilities denominated in foreign currencies | | | 110 | |
| | |
|
|
|
Net change in unrealized appreciation (depreciation) | | | 16,807,039 | |
| | |
|
|
|
Net realized and unrealized gain (loss) | | | 52,375,674 | |
| | |
|
|
|
Net increase (decrease) in net assets resulting from operations | | $ | 70,532,511 | |
| | |
|
|
|
See notes to financial statements.
FGI-16
FRANKLIN TEMPLETON VARIABLE INSURANCE PRODUCTS TRUST
FRANKLIN GROWTHAND INCOME SECURITIES FUND
Financial Statements (continued)
Statements of Changes in Net Assets
for the years ended December 31, 2004 and 2003
| | | | | | | | |
| | | 2004 | | | 2003 | |
| | |
| | |
| |
Increase (decrease) in net assets: | | | | | | | | |
Operations: | | | | | | | | |
Net investment income | | $ | 18,156,837 | | | $ | 15,446,674 | |
Net realized gain (loss) from investments and foreign currency transactions | | | 35,568,635 | | | | (8,118,887 | ) |
Net change in unrealized appreciation (depreciation) on investments and translation of assets and liabilities denominated in foreign currencies | | | 16,807,039 | | | | 121,978,025 | |
| | |
| | |
| |
Net increase (decrease) in net assets resulting from operations | | | 70,532,511 | | | | 129,305,812 | |
Distributions to shareholders from net investment income: | | | | | | | | |
Class 1 | | | (12,401,222 | ) | | | (14,899,120 | ) |
Class 2 | | | (4,840,001 | ) | | | (2,173,929 | ) |
| | |
| | |
| |
Total distributions to shareholders | | | (17,241,223 | ) | | | (17,073,049 | ) |
Capital share transactions: (Note 2) | | | | | | | | |
Class 1 | | | (70,034,212 | ) | | | (42,683,749 | ) |
Class 2 | | | 109,267,049 | | | | 78,608,309 | |
| | |
| | |
| |
Total capital share transactions | | | 39,232,837 | | | | 35,924,560 | |
Net increase (decrease) in net assets | | | 92,524,125 | | | | 148,157,323 | |
Net assets: | | | | | | | | |
Beginning of year | | | 642,217,086 | | | | 494,059,763 | |
| | |
| | |
| |
End of year | | $ | 734,741,211 | | | $ | 642,217,086 | |
| | |
| | |
| |
Undistributed net investment income included in net assets: | | | | | | | | |
End of year | | $ | 17,939,158 | | | $ | 15,635,006 | |
| | |
| | |
| |
See notes to financial statements.
FGI-17
FRANKLIN TEMPLETON VARIABLE INSURANCE PRODUCTS TRUST
FRANKLIN GROWTHAND INCOME SECURITIES FUND
Notes to Financial Statements
1. ORGANIZATION AND SIGNIFICANT ACCOUNTING POLICIES
Franklin Templeton Variable Insurance Products Trust (the Trust) is registered under the Investment Company Act of 1940 as an open-end investment company, consisting of twenty-one separate series (the Funds). The Franklin Growth and Income Securities Fund (the Fund) included in this report is diversified. The financial statements of the remaining funds in the series are presented separately. Shares of the Fund are sold only to insurance company separate accounts to fund the benefits of variable life insurance policies or variable annuity contracts. As of December 31, 2004, over 82% of the Fund’s shares were sold through one insurance company. The Fund’s investment objective is capital appreciation.
The following summarizes the Fund’s significant accounting policies.
a. Security Valuation
Securities listed on a securities exchange or on the NASDAQ National Market System are valued at the last quoted sale price or the official closing price of the day, respectively. Over-the-counter securities and listed securities for which there is no reported sale are valued within the range of the most recent quoted bid and ask prices. Securities that trade in multiple markets or on multiple exchanges are valued according to the broadest and most representative market. Repurchase agreements are valued at cost.
Foreign securities are valued as of the close of trading on the foreign stock exchange on which the security is primarily traded, or the NYSE, whichever is earlier. The value is then converted into its U.S. dollar equivalent at the foreign exchange rate in effect at the close of the NYSE on the day that the value of the foreign security is determined. If no sale is reported at that time, the foreign security will be valued within the range of the most recent quoted bid and ask prices.
The Trust has procedures to determine the fair value of individual securities and other assets for which market prices are not readily available or which may not be reliably priced. Some methods for valuing these securities may include: fundamental analysis, matrix pricing, discounts from market prices of similar securities, or discounts applied due to the nature and duration of restrictions on the disposition of the securities. Occasionally, events occur between the time at which trading in a security is completed and the close of the NYSE that might call into question the availability (including the reliability) of the value of a portfolio security held by the Fund. If such an event occurs, the securities may be valued using fair value procedures, which may include the use of independent pricing services. All security valuation procedures are approved by the Trust’s Board of Trustees.
b. Foreign Currency Translation
Portfolio securities and other assets and liabilities denominated in foreign currencies are translated into U.S. dollars based on the exchange rate of such currencies against U.S. dollars on the date of valuation. Purchases and sales of securities, income and expense items denominated in foreign currencies are translated into U.S. dollars at the exchange rate in effect on the transaction date. Occasionally events may impact the availability or reliability of foreign exchange rates used to convert the U.S. dollar equivalent value. If such an event occurs, the foreign exchange rate will be valued at fair value using procedures established and approved by the Trust’s Board of Trustees.
The Fund does not separately report the effect of changes in foreign exchange rates from changes in market prices on securities held. Such changes are included in net realized and unrealized gain or loss from investments on the Statement of Operations.
Realized foreign exchange gains or losses arise from sales of foreign currencies, currency gains or losses realized between the trade and settlement dates on securities transactions and the difference between the recorded amounts of dividends, interest, and foreign withholding taxes and the U.S. dollar equivalent of the amounts actually received or paid. Net unrealized foreign exchange gains and losses arise from changes in foreign exchange rates on foreign denominated assets and liabilities other than investments in securities held at the end of the reporting period.
FGI-18
FRANKLIN TEMPLETON VARIABLE INSURANCE PRODUCTS TRUST
FRANKLIN GROWTHAND INCOME SECURITIES FUND
Notes to Financial Statements (continued)
1. ORGANIZATION AND SIGNIFICANT ACCOUNTING POLICIES (cont.)
c. Joint Repurchase Agreement
The Fund may enter into a joint repurchase agreement whereby its uninvested cash balance is deposited into a joint cash account to be used to invest in one or more repurchase agreements. The value and face amount of the joint repurchase agreement are allocated to the Fund based on its pro-rata interest. A repurchase agreement is accounted for as a loan by the Fund to the seller, collateralized by securities which are delivered to the Fund’s custodian. The market value, including accrued interest, of the initial collateralization is required to be at least 102% of the dollar amount invested by the Fund, with the value of the underlying securities marked to market daily to maintain coverage of at least 100%. At December 31, 2004, all repurchase agreements held by the Fund had been entered into on that date.
d. Foreign Currency Contracts
When the Fund purchases or sells foreign securities it may enter into foreign exchange contracts to minimize foreign exchange risk from the trade date to the settlement date of the transactions. A foreign exchange contract is an agreement between two parties to exchange different currencies at an agreed upon exchange rate on a specified date. Realized and unrealized gains and losses on these contracts are included in the Statement of Operations.
The risks of these contracts include movement in the values of the foreign currencies relative to the U.S. dollar and the possible inability of the counterparties to fulfill their obligations under the contracts.
e. Income Taxes
No provision has been made for U.S. income taxes because the Fund’s policy is to qualify as a regulated investment company under Sub Chapter M of the Internal Revenue Code and to distribute substantially all of its taxable income. Fund distributions to shareholders are determined on an income tax basis and may differ from net investment income and realized gains for financial reporting purposes.
f. Security Transactions, Investment Income, Expenses and Distributions
Security transactions are accounted for on trade date. Realized gains and losses on security transactions are determined on a specific identification basis. Interest income and estimated expenses are accrued daily. Dividend income and distributions to shareholders are recorded on the ex-dividend date.
Common expenses incurred by the Trust are allocated among the funds based on the ratio of net assets of each fund to the combined net assets. Other expenses are charged to each fund on a specific identification basis.
Distributions received by the Fund from securities may be a return of capital (ROC). Such distributions reduce the cost basis of the securities, and any distributions in excess of the cost basis are recognized as capital gains.
Realized and unrealized gains and losses and net investment income, other than class specific expenses, are allocated daily to each class of shares based upon the relative proportion of net assets of each class.
g. Accounting Estimates
The preparation of financial statements in accordance with accounting principles generally accepted in the United States of America requires management to make estimates and assumptions that affect the reported amounts of assets and liabilities at the date of the financial statements and the amounts of income and expenses during the reporting period. Actual results could differ from those estimates.
FGI-19
FRANKLIN TEMPLETON VARIABLE INSURANCE PRODUCTS TRUST
FRANKLIN GROWTHAND INCOME SECURITIES FUND
Notes to Financial Statements (continued)
1. ORGANIZATION AND SIGNIFICANT ACCOUNTING POLICIES (cont.)
h. Guarantees and Indemnifications
Under the Trust’s organizational documents, its officers and trustees are indemnified by the Trust against certain liability arising out of the performance of their duties to the Trust. Additionally, in the normal course of business, the Trust enters into contracts with service providers that contain general indemnification clauses. The Trust’s maximum exposure under these arrangements is unknown as this would involve future claims that may be made against the Trust that have not yet occurred. However, based on experience, the Trust expects the risk of loss to be remote.
2. SHARES OF BENEFICIAL INTEREST
The Fund offers two classes of shares: Class 1 and Class 2. Each class of shares differs by its distribution fees, voting rights on matters affecting a single class and its exchange privilege.
At December 31, 2004, there were an unlimited number of shares authorized ($.01 par value). Transactions in the Fund’s shares were as follows:
| | | | | | | | | | | | | | |
| | | Year Ended December 31,
| |
| | | 2004 | | | 2003 | |
| | |
|
|
| Class 1 Shares: | | Shares | | | Amount | | | Shares | | | Amount | |
| | |
|
|
Shares sold | | 65,089 | | | $ | 960,180 | | | 2,360,924 | | | $ | 28,273,066 | |
Shares issued in reinvestment of distributions | | 860,001 | | | | 12,401,222 | | | 1,175,936 | | | | 14,899,120 | |
Shares redeemed | | (5,688,684 | ) | | | (83,395,614 | ) | | (7,072,721 | ) | | | (85,855,935 | ) |
| | |
| |
Net increase (decrease) | | (4,763,594 | ) | | $ | (70,034,212 | ) | | (3,535,861 | ) | | $ | (42,683,749 | ) |
| | |
| |
| Class 2 Shares: | | | | | | | | | | | | |
Shares sold | | 7,972,875 | | | $ | 116,185,316 | | | 6,534,882 | | | $ | 81,389,712 | |
Shares issued in reinvestment of distributions | | 338,698 | | | | 4,840,001 | | | 172,808 | | | | 2,173,929 | |
Shares redeemed | | (820,856 | ) | | | (11,758,268 | ) | | (417,670 | ) | | | (4,955,332 | ) |
| | |
| |
Net increase (decrease) | | 7,490,717 | | | $ | 109,267,049 | | | 6,290,020 | | | $ | 78,608,309 | |
| | |
| |
3. TRANSACTIONS WITH AFFILIATES
Certain officers and trustees of the Fund are also officers and/or directors of the following entities:
| | |
| Entity | | Affiliation |
Franklin Advisers Inc. (Advisers) | | Investment manager |
Franklin Templeton Services LLC (FT Services) | | Administrative manager |
Franklin Templeton Distributors Inc. (Distributors) | | Principal underwriter |
Franklin Templeton Investor Services LLC (Investor Services) | | Transfer agent |
a. Management Fees
The Fund pays an investment management fee to Advisers based on the average daily net assets of the Fund as follows:
| | |
| Annualized Fee Rate | | Net Assets |
| .625% | | First $100 million |
| .500% | | Over $100 million, up to and including $250 million |
| .450% | | Over $250 million, up to and including $10 billion |
Fees are further reduced on net assets over $10 billion.
FGI-20
FRANKLIN TEMPLETON VARIABLE INSURANCE PRODUCTS TRUST
FRANKLIN GROWTHAND INCOME SECURITIES FUND
Notes to Financial Statements (continued)
3. TRANSACTIONS WITH AFFILIATES (cont.)
b. Administrative Fees
Under an agreement with Advisers, FT Services provides administrative services to the Fund. The fee is paid by Advisers based on the average daily net assets of the Fund, and is not an additional expense of the Fund.
c. Distribution Fees
The Fund reimburses Distributors up to .25% per year of its average daily net asset of Class 2, for costs incurred in marketing the Fund’s shares under a Rule 12b-1 plan.
d. Transfer Agent Fees
Investor Services, under terms of an agreement, performs shareholder servicing for the Fund and is not paid by the Fund for the services.
4. EXPENSE OFFSET ARRANGEMENT
The Fund has entered into an arrangement with its custodian whereby credits realized as a result of uninvested cash balances are used to reduce a portion of the Fund’s custodian expenses. During the year ended December 31, 2004, the custodian fees were reduced as noted in the Statement of Operations.
5. INCOME TAXES
The tax character of distributions paid during the years ended December 31, 2004 and 2003, was as follows:
| | | | | | |
| | | 2004
| | 2003
|
Distributions paid from ordinary income | | $ | 17,241,223 | | $ | 17,073,049 |
Net investment income (loss) differs for financial statement and tax purposes primarily due to differing treatments of foreign currency transactions.
Net realized gains (losses) differ for financial statement and tax purposes primarily due to differing treatments of wash sales and foreign currency transactions.
At December 31, 2004, the cost of investments, net unrealized appreciation (depreciation), undistributed ordinary income and undistributed long term capital gains for income tax purposes were as follows:
| | | | |
Cost of investments | | $ | 583,959,734 | |
| | |
|
|
|
Unrealized appreciation | | $ | 146,038,792 | |
Unrealized depreciation | | | (6,276,521 | ) |
| | |
|
|
|
Net unrealized appreciation (depreciation) | | $ | 139,762,271 | |
| | |
|
|
|
Undistributed ordinary income | | $ | 18,218,617 | |
Undistributed long term capital gains | | | 5,257,316 | |
| | |
|
|
|
Distributable earnings | | $ | 23,475,933 | |
| | |
|
|
|
FGI-21
FRANKLIN TEMPLETON VARIABLE INSURANCE PRODUCTS TRUST
FRANKLIN GROWTHAND INCOME SECURITIES FUND
Notes to Financial Statements (continued)
6. INVESTMENT TRANSACTIONS
Purchases and sales of investments (excluding short-term securities) for the year ended December 31, 2004, aggregated $281,061,870 and $258,989,700, respectively.
7. REGULATORY MATTERS
Investigations
As part of various investigations by a number of federal, state, and foreign regulators and governmental entities, including the Securities and Exchange Commission (“SEC”), the California Attorney General’s Office (“CAGO”), and the National Association of Securities Dealers, Inc. (“NASD”), relating to certain practices in the mutual fund industry, including late trading, market timing and marketing support payments to securities dealers who sell fund shares, Franklin Resources, Inc. and certain of its subsidiaries (as used in this section, together, the “Company”), as well as certain current or former executives and employees of the Company, received subpoenas and/or requests for documents, information and/or testimony. The Company and its current employees provided documents and information in response to those requests and subpoenas.
Settlements
Beginning in August 2004, the Company entered into settlements with certain regulators investigating the mutual fund industry practices noted above. The Company believes that settlement of each of the matters described in this section is in the best interest of the Company and shareholders of the Franklin, Templeton, and Mutual Series mutual funds (the “funds”).
On August 2, 2004, Franklin Resources, Inc. announced that its subsidiary, Franklin Advisers, Inc., reached an agreement with the SEC that resolved the issues resulting from the SEC investigation into market timing activity. In connection with that agreement, the SEC issued an “Order Instituting Administrative and Cease-and-Desist Proceedings Pursuant to Sections 203(e) and 203(k) of the Investment Advisers Act of 1940 and Sections 9(b) and 9(f) of the Investment Company Act of 1940, Making Findings and Imposing Remedial Sanctions and a Cease-and-Desist Order” (the “Order”). The SEC’s Order concerned the activities of a limited number of third parties that ended in 2000 and those that were the subject of the first Massachusetts administrative complaint described below.
Under the terms of the SEC’s Order, pursuant to which Franklin Advisers, Inc. neither admitted nor denied any of the findings contained therein, Franklin Advisers, Inc. agreed to pay $50 million, of which $20 million is a civil penalty, to be distributed to shareholders of certain funds in accordance with a plan to be developed by an independent distribution consultant. At this time, it is unclear which funds or which shareholders of any particular fund will receive distributions. The Order also required Franklin Advisers, Inc. to, among other things, enhance and periodically review compliance policies and procedures.
On September 20, 2004, Franklin Resources, Inc. announced that two of its subsidiaries, Franklin Advisers, Inc. and Franklin Templeton Alternative Strategies, Inc. (“FTAS”), reached an agreement with the Securities Division of the Office of the Secretary of the Commonwealth of Massachusetts (the “State of Massachusetts”) related to its administrative complaint filed on February 4, 2004, concerning one instance of market timing that was also a subject of the August 2, 2004 settlement that Franklin Advisers, Inc. reached with the SEC, as described above.
Under the terms of the settlement consent order issued by the State of Massachusetts, Franklin Advisers, Inc. and FTAS consented to the entry of a cease-and-desist order and agreed to pay a $5 million administrative fine to the State of Massachusetts (the “Massachusetts Consent Order”). The Massachusetts Consent Order included two different sections: “Statements of Fact” and “Violations of Massachusetts Securities Laws.” Franklin Advisers, Inc. and FTAS admitted the facts in the Statements of Fact.
On October 25, 2004, the State of Massachusetts filed a second administrative complaint, alleging that Franklin Resources, Inc.’s Form 8-K filing (in which it described the Massachusetts Consent Order and stated that “Franklin did not admit or deny
FGI-22
FRANKLIN TEMPLETON VARIABLE INSURANCE PRODUCTS TRUST
FRANKLIN GROWTHAND INCOME SECURITIES FUND
Notes to Financial Statements (continued)
7. REGULATORY MATTERS (cont.)
Settlements (cont.)
engaging in any wrongdoing”) failed to state that Franklin Advisers, Inc. and FTAS admitted the Statements of Fact portion of the Massachusetts Consent Order (the “Second Complaint”). Franklin Resources, Inc. reached a second agreement with the State of Massachusetts on November 19, 2004, resolving the Second Complaint. As a result of the November 19, 2004 settlement, Franklin Resources, Inc. filed a new Form 8-K. The terms of the Massachusetts Consent Order did not change and there was no monetary fine associated with this second settlement.
On November 17, 2004, Franklin Resources, Inc. announced that Franklin/Templeton Distributors, Inc. (“FTDI”) reached an agreement with the CAGO, resolving the issues resulting from the CAGO’s investigation concerning sales and marketing support payments. Under the terms of the settlement, FTDI neither admitted nor denied the allegations in the CAGO’s complaint and agreed to pay $2 million to the State of California as a civil penalty, $14 million to the funds, to be allocated by an independent distribution consultant to be paid for by FTDI, and $2 million to the CAGO for its investigative costs.
On December 13, 2004, Franklin Resources, Inc. announced that its subsidiaries FTDI and Franklin Advisers, Inc. reached an agreement with the SEC, resolving the issues resulting from the SEC’s investigation concerning marketing support payments to securities dealers who sell fund shares. In connection with that agreement, the SEC issued an “Order Instituting Administrative and Cease-and-Desist Proceedings, Making Findings, and Imposing Remedial Sanctions Pursuant to Sections 203(e) and 203(k) of the Investment Advisers Act of 1940, Sections 9(b) and 9(f) of the Investment Company Act of 1940, and Section 15(b) of the Securities Exchange Act of 1934” (the “Second Order”).
Under the terms of the Second Order, in which FTDI and Franklin Advisers, Inc. neither admitted nor denied the findings contained therein, they agreed to pay the funds a penalty of $20 million and disgorgement of $1 (one dollar). FTDI and Franklin Advisers, Inc. also agreed to implement certain measures and undertakings relating to marketing support payments to broker-dealers for the promotion or sale of fund shares, including making additional disclosures in the funds’ Prospectuses and Statements of Additional Information. The Second Order further requires the appointment of an independent distribution consultant, at the Company’s expense, who shall develop a plan for the distribution of the penalty and disgorgement to the funds.
Other Legal Proceedings
The Trust, in addition to the Company and other funds, and certain current and former officers, employees, and directors have been named in multiple lawsuits in different federal courts in Nevada, California, Illinois, New York and Florida, alleging violations of various federal securities laws and seeking, among other relief, monetary damages, restitution, removal of fund trustees, directors, advisers, administrators, and distributors, rescission of management contracts and 12b-1 Plans, and/or attorneys’ fees and costs. Specifically, the lawsuits claim breach of duty with respect to alleged arrangements to permit market timing and/or late trading activity, or breach of duty with respect to the valuation of the portfolio securities of certain Templeton funds managed by Franklin Resources, Inc. subsidiaries, resulting in alleged market timing activity. The majority of these lawsuits duplicate, in whole or in part, the allegations asserted in the February 4, 2004 Massachusetts administrative complaint and the findings in the SEC’s August 2, 2004 Order, as described above. The lawsuits are styled as class actions, or derivative actions on behalf of either the named funds or Franklin Resources, Inc.
In addition, the Company, as well as certain current and former officers, employees, and directors, have been named in multiple lawsuits alleging violations of various securities laws and pendent state law claims relating to the disclosure of directed brokerage payments and/or payment of allegedly excessive advisory, commission, and distribution fees, and seeking, among other relief, monetary damages, restitution, rescission of advisory contracts, including recovery of all fees paid pursuant to those contracts, an accounting of all monies paid to the named advisers, declaratory relief, injunctive relief, and/or attorneys’ fees and costs. These lawsuits are styled as class actions or derivative actions brought on behalf of certain funds.
FGI-23
FRANKLIN TEMPLETON VARIABLE INSURANCE PRODUCTS TRUST
FRANKLIN GROWTHAND INCOME SECURITIES FUND
Notes to Financial Statements (continued)
7. REGULATORY MATTERS (cont.)
Other Legal Proceedings (cont.)
The Company and fund management strongly believes that the claims made in each of the lawsuits identified above are without merit and intends to vigorously defend against them. The Company cannot predict with certainty, however, the eventual outcome of the remaining governmental investigations or private lawsuits, nor whether they will have a material negative impact on the Company. Public trust and confidence are critical to the Company’s business and any material loss of investor and/or client confidence could result in a significant decline in assets under management by the Company, which would have an adverse effect on the Company’s future financial results. If the Company finds that it bears responsibility for any unlawful or inappropriate conduct that caused losses to the Trust, it is committed to making the Trust or its shareholders whole, as appropriate. The Company is committed to taking all appropriate actions to protect the interests of its funds’ shareholders.
FGI-24
FRANKLIN TEMPLETON VARIABLE INSURANCE PRODUCTS TRUST
FRANKLIN GROWTHAND INCOME SECURITIES FUND
Report of Independent Registered Public Accounting Firm
To the Trustees and Shareholders of Franklin Templeton Variable Insurance Products Trust
In our opinion, the accompanying statement of assets and liabilities, including the statement of investments, and the related statements of operations and of changes in net assets and the financial highlights present fairly, in all material respects, the financial position of Franklin Growth and Income Securities Fund (the Fund) (one of the funds constituting Franklin Templeton Variable Insurance Products Trust) at December 31, 2004, the results of its operations for the year then ended, the changes in its net assets for each of the two years in the period then ended and the financial highlights for each of the five years in the period then ended, in conformity with accounting principles generally accepted in the United States of America. These financial statements and financial highlights (hereafter referred to as “financial statements”) are the responsibility of the Fund’s management; our responsibility is to express an opinion on these financial statements based on our audits. We conducted our audits of these financial statements in accordance with the standards of the Public Company Accounting Oversight Board (United States). Those standards require that we plan and perform the audits to obtain reasonable assurance about whether the financial statements are free of material misstatement. An audit includes examining, on a test basis, evidence supporting the amounts and disclosures in the financial statements, assessing the accounting principles used and significant estimates made by management, and evaluating the overall financial statement presentation. We believe that our audits, which included confirmation of securities at December 31, 2004 by correspondence with the custodian, provide a reasonable basis for our opinion.
PricewaterhouseCoopers LLP
San Francisco, California
February 9, 2005
FGI-25
FRANKLIN TEMPLETON VARIABLE INSURANCE PRODUCTS TRUST
FRANKLIN GROWTHAND INCOME SECURITIES FUND
Tax Designation (unaudited)
Under Section 854(b)(2) of the Internal Revenue Code, the Fund hereby designates 100% of the ordinary income dividends as income qualifying for the dividends received deduction for the fiscal year ended December 31, 2004.
Under Section 852(b)(3)(C) of the Code, the Fund hereby designates $5,257,316 as a capital gain dividend for the fiscal year ended December 31, 2004.
FGI-26
FRANKLIN HIGH INCOME FUND
This annual report for Franklin High Income Fund covers the fiscal year ended December 31, 2004.
Performance Summary as of 12/31/04
Average annual total return of Class 2 shares* represents the average annual change in value, assuming reinvestment of dividends and capital gains. Average returns smooth out variations in returns, which can be significant; they are not the same as year-by-year results.
Periods ended 12/31/04
| | | | | | |
| | | 1-Year | | 5-Year | | 10-Year |
Average Annual Total Return | | +9.87% | | +3.27% | | +6.03% |
*Because Class 2 shares were not offered until 1/6/99, standardized Class 2 Fund performance for prior periods represents the historical results of Class 1 shares. For periods beginning on 1/6/99, Class 2’s results reflect an additional 12b-1 fee expense, which also affects future performance. Since 1/6/99 (effective date), the average annual total return of Class 2 shares was +2.56%.
Total Return Index Comparison for Hypothetical $10,000 Investment (1/1/95–12/31/04)
The graph below shows the change in value of a hypothetical $10,000 investment in the Fund over the indicated period and includes reinvestment of any income or distributions. The Fund’s performance* is compared to the performance of the Credit Suisse First Boston (CSFB) High Yield Index. One cannot invest directly in an index, nor is an index representative of the Fund’s portfolio. Please see Important Notes to Performance Information preceding the Fund Summaries.
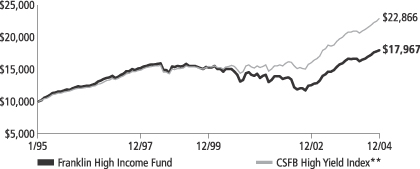
**Source: Credit Suisse First Boston. Please see Index Descriptions following the Fund Summaries.
Franklin High Income Fund – Class 2
Performance reflects the Fund’s Class 2 operating expenses, but does not include any contract fees, expenses or sales charges. If they had been included, performance would be lower. These charges and deductions, particularly for variable life policies, can have a significant effect on contract values and insurance benefits. See the contract prospectus for a complete description of these expenses, including sales charges.
Performance data quoted represent past performance, which does not guarantee future results. Investment return and principal value will fluctuate, and you may have a gain or loss when you sell your shares. Current performance may differ from figures shown.
FH-1
Fund Goals and Main Investments: Franklin High Income Fund seeks a high level of current income, with capital appreciation as a secondary goal. The Fund invests mainly in debt securities, including lower-rated “junk bonds,” offering high yield and expected total return. The Fund may also invest in foreign securities, including emerging markets.
Performance Overview
You can find the Fund’s one-year total return in the Performance Summary. The Fund underperformed its benchmark, the CSFB High Yield Index, which returned 11.95% for the year under review.1 However, it outperformed its peers, as measured by the 9.84% return of the Lipper VIP High Current Yield Funds Objective Average.1
Economic and Market Overview
During the year under review, there was much focus on the employment picture and its resulting effects on the consumer. Although nonfarm payroll statistics were mixed, stronger employment growth fundamentals were reflected in several sources. One was the National Federation of Independent Businesses (NFIB) survey, which was notable because small businesses historically have created about two-thirds of all new jobs.2 During the period under review, more jobs combined with income tax reductions helped increase consumers’ disposable income and allowed them to continue spending, in turn boosting economic growth.
Increases in business spending also contributed to economic growth. After steadily declining in 2001 and 2002, business spending posted strong results during 2004. For example, nonresidential investment spending rose 10.3% for the year.3 Historically low interest rates during the reporting period allowed many businesses the opportunity to refinance their old debt at more attractive levels. This helped enhance business operating performance, and corporate profits reflected this data. Many corporate debt investments also benefited from this improvement. Productivity continued to grow, which helped businesses generate more goods and services without substantially raising inflation.
1. Sources: Standard & Poor’s Micropal: Lipper Inc. One cannot invest directly in an index, nor is an index representative of the Fund’s portfolio. Please see Index Descriptions following the Fund Summaries.
2. Source: Dennis, William J., Jr., NFIB Research Foundation, “The Public Reviews Small Business,” 8/04.
3. Source: Bureau of Economic Analysis.
Fund Risks: Bonds and other debt obligations are affected by changes in interest rates and the creditworthiness of their issuers. High yield, lower-rated (junk) bonds generally have greater price swings and higher default risks. Foreign investing involves special risks including currency fluctuations, economic instability, and social and political developments. Emerging markets involve heightened risks. The Fund’s prospectus also includes a description of the main investment risks.
FH-2
Energy prices rose substantially during the year, and then declined toward the end, as oil ended the year at approximately $43 a barrel. In an effort to keep inflation in check, the Federal Reserve Board raised the federal funds target rate to 2.25% from 1.00% during the reporting period. However, the core Consumer Price Index, a measure of inflation excluding food and energy costs, rose a relatively modest 2.2% for the 12 months ended December 31, 2004, and helped contribute to the continued low interest rate level during the period.4 Many analysts had expected the 10-year U.S. Treasury yield to increase significantly; however, it ended the year relatively flat. This yield began the year at 4.27%, rose to a high of 4.89% and declined to 4.24% on December 31, 2004.
After posting double-digit gains in 2003, the high yield bond market began to weaken in the second quarter of 2004 as investors reacted to growing interest rate concerns. However, the strengthening U.S. economy and improving corporate earnings provided a positive backdrop for corporate credit fundamentals. In addition, investor cash flows into the high yield asset class increased significantly during the second half of the year. These combined factors appeared to outweigh interest rate speculation, and the high yield market eventually moved back into positive territory for 2004.
Investment Strategy
The primary criteria we use for selecting securities are yield and expected return. We search for securities we believe offer opportunities for income today and growth tomorrow. We generally perform independent analysis of the corporate debt securities being considered for the Fund’s portfolio, rather than relying principally on the ratings assigned by rating agencies. In our analysis, we consider a variety of factors: a security’s relative value based on such factors as anticipated cash flow, interest or dividend coverage, asset coverage and earnings prospects; the experience and strength of a company’s management; the company’s sensitivity to changes in interest rates and business conditions; the company’s debt maturity schedules and borrowing requirements; and the company’s changing financial condition and market recognition of the change.
Manager’s Discussion
For much of the year, the Fund maintained a slightly higher-risk positioning versus the CSFB High Yield Index (as gauged by beta coefficient, a common measure of relative volatility). Given the high yield
4. Source: Bureau of Labor Statistics.
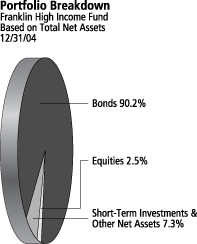
FH-3
bond market’s positive returns, this strategy was beneficial, although certain industry positions and specific portfolio holdings still caused Fund returns to slightly underperform the index.
Our security selection process relies mainly on bottom-up analysis, but we also use our fundamental research process to garner a macroeconomic view. With that in mind, in 2004 we over- and underweighted certain industries relative to the benchmark in an effort to enhance returns. For instance, we overweighted the Fund’s exposure to the chemical and industrial sectors. Both areas outperformed the CSFB High Yield Index during the year, aiding the Fund’s absolute and relative performance. Conversely, we kept the retail sector underweighted throughout the year. Retail underperformed the benchmark, so the Fund’s positioning had a positive impact on relative returns.
Despite these examples of positive portfolio positioning, certain holdings and industry weightings had a negative impact. For example, the Fund’s weightings versus the index’s in textiles and utilities were a drag on returns. Although textiles was less than 1% of the index, it turned in one of the year’s best performances within the high yield bond market. The Fund’s lack of textile industry exposure in 2004 had a negative effect on our relative performance. Utilities also generated one of the top sector returns within the index. Although the Fund did have some exposure to utilities, it was typically underweighted versus the index, thereby hindering relative performance.
Finally, certain individual security holdings also had a negative impact. For instance, our investment in Dobson Communications, a wireless service provider, substantially underperformed the index as the company’s liquidity tightened and its operating results disappointed investors during the year. Since we held a higher weighting in Dobson than the index, it therefore negatively influenced Fund returns more so than the index’s.
Thank you for your participation in Franklin High Income Fund. We look forward to serving your future investment needs.
The foregoing information reflects our analysis, opinions and portfolio holdings as of December 31, 2004, the end of the reporting period. The way we implement our main investment strategies and the resulting portfolio holdings may change depending on factors such as market and economic conditions. These opinions may not be relied upon as investment advice or an offer for a particular security. The information is not a complete analysis of every aspect of any market, country, industry, security or the Fund. Statements of fact are from sources considered reliable, but the adviser makes no representation or warranty as to their completeness or accuracy. Although historical performance is no guarantee of future results, these insights may help you understand our investment management philosophy.
Top 10 Sectors/Industries
Franklin High Income Fund Based on Total Net Assets 12/31/04
| | |
| Consumer Services | | 16.2% |
| |
| Process Industries | | 12.6% |
| |
| Communications | | 10.5% |
| |
| Utilities | | 9.4% |
| |
| Producer Manufacturing | | 6.7% |
| |
| Electronic Technology | | 5.9% |
| |
| Industrial Services | | 5.7% |
| |
| Health Services | | 5.4% |
| |
| Energy Minerals | | 4.3% |
| |
| Consumer Durables | | 3.4% |
The dollar value, number of shares or principal amount, and names of all portfolio holdings are listed in the Fund’s Statement of Investments.
FH-4
Fund Expenses
As an investor in a variable insurance contract (“Contract”) that indirectly provides for investment in an underlying mutual fund, you can incur transaction and/or ongoing expenses at both the Fund level and the Contract level.
| • | | Transaction expenses can include sales charges (loads) on purchases, redemption fees, surrender fees, transfer fees and premium taxes. |
| • | | Ongoing expenses can include management fees, distribution and service (12b-1) fees, contract fees, annual maintenance fees, mortality and expense risk fees and other fees and expenses. All mutual funds and Contracts have some types of ongoing expenses. |
The expenses shown in the table below are meant to highlight ongoing expenses at the Fund level only and do not include ongoing expenses at the Contract level, or transaction expenses at either the Fund or Contract levels. While the Fund does not have transaction expenses, if the transaction and ongoing expenses at the Contract level were included, the expenses shown below would be higher. You should consult your Contract prospectus or disclosure document for more information.
The table shows Fund-level ongoing expenses and can help you understand these expenses and compare them with those of other mutual funds offered through the Contract. The table assumes a $1,000 investment held for the six months indicated. Please refer to the Fund prospectus for additional information on operating expenses.
Actual Fund Expenses
The first line (Actual) for each share class listed in the table below provides actual account values and expenses. The “Ending Account Value” is derived from the Fund’s actual return, which includes the effect of ongoing Fund expenses, but does not include the effect of ongoing Contract expenses.
You can estimate the Fund-level expenses you incurred during the period, by following these steps. Of course, your account value and expenses will differ from those in this illustration:
| 1. | Divide your account value by $1,000. |
If an account had an $8,600 value, then $8,600 ÷ $1,000 = 8.6.
| 2. | Multiply the result by the number under the heading “Fund-Level Expenses Incurred During Period.” |
If Fund-Level Expenses Incurred During Period were $7.50, then 8.6 × $7.50 = $64.50.
Franklin High Income Fund – Class 2
FH-5
In this illustration, the estimated expenses incurred this period at the Fund level are $64.50.
Hypothetical Example for Comparison with Other Mutual Funds
Information in the second line (Hypothetical) for each class in the table can help you compare ongoing expenses of the Fund with those of other mutual funds offered through the Contract. This information may not be used to estimate the actual ending account balance or expenses you incurred during the period. The hypothetical “Ending Account Value” is based on the actual expense ratio for each class and an assumed 5% annual rate of return before expenses, which does not represent the Fund’s actual return. The figure under the heading “Fund-Level Expenses Incurred During Period” shows the hypothetical expenses your account would have incurred under this scenario. You can compare this figure with the 5% hypothetical examples that appear in shareholder reports of other funds offered through a Contract.
| | | | | | | | | |
| Class 2 | | Beginning
Account
Value 6/30/04 | | Ending
Account
Value 12/31/04 | | Fund-Level
Expenses Incurred
During Period*
6/30/04-12/31/04 |
Actual | | $ | 1,000 | | $ | 1,090.00 | | $ | 4.62 |
Hypothetical (5% return before expenses) | | $ | 1,000 | | $ | 1,020.71 | | $ | 4.47 |
*Expenses are equal to the annualized expense ratio for the Fund’s Class 2 shares (0.88%), which does not include any ongoing expenses of the Contract for which the Fund is an investment option, multiplied by the average account value over the period, multiplied by 184/366 to reflect the one-half year period.
FH-6
FRANKLIN TEMPLETON VARIABLE INSURANCE PRODUCTS TRUST
FRANKLIN HIGH INCOME FUND
Financial Highlights
| | | | | | | | | | | | | | | | | | | | |
| | | Class 1
| |
| | | Year Ended December 31,
| |
| | | 2004 | | | 2003 | | | 2002 | | | 2001 | | | 2000 | |
| | |
|
|
|
Per share operating performance | | | | | | | | | | | | | | | | | | | | |
(for a share outstanding throughout the year) | | | | | | | | | | | | | | | | | | | | |
Net asset value, beginning of year | | $ | 6.81 | | | $ | 5.67 | | | $ | 7.44 | | | $ | 8.54 | | | $ | 9.86 | |
| | |
|
|
|
Income from investment operations: | | | | | | | | | | | | | | | | | | | | |
Net investment incomea | | | .49 | | | | .51 | | | | .63 | | | | .87 | c | | | 1.08 | |
Net realized and unrealized gains (losses) | | | .15 | | | | 1.21 | | | | (1.30 | ) | | | (.50 | )c | | | (2.36 | ) |
| | |
|
|
|
Total from investment operations | | | .64 | | | | 1.72 | | | | (.67 | ) | | | .37 | | | | (1.28 | ) |
| | |
|
|
|
Less distributions from net investment income | | | (.46 | ) | | | (.58 | ) | | | (1.10 | ) | | | (1.47 | ) | | | (.04 | ) |
| | |
|
|
|
Net asset value, end of year | | $ | 6.99 | | | $ | 6.81 | | | $ | 5.67 | | | $ | 7.44 | | | $ | 8.54 | |
| | |
|
|
|
| | | | | |
Total returnb | | | 10.04% | | | | 31.50% | | | | (9.55)% | | | | 4.26% | | | | (13.00)% | |
Ratios/supplemental data | | | | | | | | | | | | | | | | | | | | |
Net assets, end of year (000’s) | | $ | 109,569 | | | $ | 136,218 | | | $ | 111,746 | | | $ | 151,924 | | | $ | 189,986 | |
Ratios to average net assets: | | | | | | | | | | | | | | | | | | | | |
Expenses | | | .62% | | | | .62% | | | | .63% | | | | .62% | | | | .57% | |
Net investment income | | | 7.17% | | | | 8.19% | | | | 9.92% | | | | 10.63% | c | | | 11.43% | |
Portfolio turnover rate | | | 59.87% | | | | 52.01% | | | | 56.01% | | | | 30.03% | | | | 20.37% | |
| a | Based on average daily shares outstanding. |
| b | Total return does not include any fees, charges or expenses imposed by the variable annuity and life insurance contracts for which the Franklin Templeton Variable Insurance Products Trust serves as an underlying investment vehicle. Total return is not annualized for periods less than one year. |
| c | Effective January 1, 2001, the Fund adopted the provisions of the AICPA Audit and Accounting Guide for Investment Companies and began amortizing all premium and discount on fixed-income securities, as required. The effect of this change was as follows: |
| | |
Net investment income per share | | $(.004) |
New realized and unrealized gains (losses) per share | | .004 |
Ratio of net investment income to average net assets | | (.05)% |
Per share data and ratios for prior periods have not been restated to reflect this change in accounting policy.
FH-7
See notes to financial statements.
FRANKLIN TEMPLETON VARIABLE INSURANCE PRODUCTS TRUST
FRANKLIN HIGH INCOME FUND
Financial Highlights (continued)
| | | | | | | | | | | | | | | | | | | | |
| | | Class 2
| |
| | | Year Ended December 31,
| |
| | | 2004 | | | 2003 | | | 2002 | | | 2001 | | | 2000 | |
| | |
|
|
|
Per share operating performance | | | | | | | | | | | | | | | | | | | | |
(for a share outstanding throughout the year) | | | | | | | | | | | | | | | | | | | | |
Net asset value, beginning of year | | $ | 6.73 | | | $ | 5.62 | | | $ | 7.41 | | | $ | 8.50 | | | $ | 9.83 | |
| | |
|
|
|
Income from investment operations: | | | | | | | | | | | | | | | | | | | | |
Net investment incomea | | | .46 | | | | .48 | | | | .56 | | | | .84 | c | | | 1.04 | |
Net realized and unrealized gains (losses) | | | .16 | | | | 1.21 | | | | (1.25 | ) | | | (.48 | )c | | | (2.33 | ) |
| | |
|
|
|
Total from investment operations | | | .62 | | | | 1.69 | | | | (.69 | ) | | | .36 | | | | (1.29 | ) |
| | |
|
|
|
Less distributions from net investment income | | | (.45 | ) | | | (.58 | ) | | | (1.10 | ) | | | (1.45 | ) | | | (.04 | ) |
| | |
|
|
|
Net asset value, end of year | | $ | 6.90 | | | $ | 6.73 | | | $ | 5.62 | | | $ | 7.41 | | | $ | 8.50 | |
| | |
|
|
|
| | | | | |
Total returnb | | | 9.87% | | | | 31.18% | | | | (9.96)% | | | | 4.18% | | | | (13.15)% | |
Ratios/supplemental data | | | | | | | | | | | | | | | | | | | | |
Net assets, end of year (000’s) | | $ | 122,579 | | | $ | 58,681 | | | $ | 7,326 | | | $ | 832 | | | $ | 432 | |
Ratios to average net assets: | | | | | | | | | | | | | | | | | | | | |
Expenses | | | .87% | | | | .87% | | | | .88% | | | | .87% | | | | .82% | |
Net investment income | | | 6.92% | | | | 7.94% | | | | 9.67% | | | | 10.39% | c | | | 11.16% | |
Portfolio turnover rate | | | 59.87% | | | | 52.01% | | | | 56.01% | | | | 30.03% | | | | 20.37% | |
| a | Based on average daily shares outstanding. |
| b | Total return does not include any fees, charges or expenses imposed by the variable annuity and life insurance contracts for which the Franklin Templeton Variable Insurance Products Trust serves as an underlying investment vehicle. Total return is not annualized for periods less than one year. |
| c | Effective January 1, 2001, the Fund adopted the provisions of the AICPA Audit and Accounting Guide for Investment Companies and began amortizing all premium and discount on fixed-income securities, as required. The effect of this change was as follows: |
| | |
Net investment income per share | | $(.004) |
New realized and unrealized gains (losses) per share | | .004 |
Ratio of net investment income to average net assets | | (.05)% |
Per share data and ratios for prior periods have not been restated to reflect this change in accounting policy.
See notes to financial statements.
FH-8
FRANKLIN TEMPLETON VARIABLE INSURANCE PRODUCTS TRUST
FRANKLIN HIGH INCOME FUND
Statement of Investments, December 31, 2004
| | | | | | | | |
| | | COUNTRY | | PRINCIPAL
AMOUNTh | | VALUE |
| | | | | | | | | |
Bonds 90.2% | | | | | | | | |
Commercial Services 2.8% | | | | | | | | |
Corrections Corp. of America, senior note, 9.875%, 5/01/09 | | United States | | $ | 1,000,000 | | $ | 1,115,000 |
Corrections Corp. of America, senior note, 7.50%, 5/01/11 | | United States | | | 500,000 | | | 536,875 |
JohnsonDiversey Holdings Inc., senior disc. note, zero cpn. to 5/17/07, 10.67% thereafter, 5/15/13 | | United States | | | 3,000,000 | | | 2,610,000 |
aKey3Media Group Inc., senior sub. note, 11.25%, 6/15/11 | | United States | | | 2,000,000 | | | 2,500 |
Lamar Media Corp., senior sub. note, 7.25%, 1/01/13 | | United States | | | 2,000,000 | | | 2,170,000 |
| | | | | | | |
|
|
| | | | | | | | | 6,434,375 |
| | | | | | | |
|
|
Communications 9.9% | | | | | | | | |
Crown Castle International Corp., senior note, 9.375%, 8/01/11 | | United States | | | 1,000,000 | | | 1,125,000 |
Dobson Cellular Systems Inc., secured note, 144A, 9.875%, 11/01/12 | | United States | | | 2,000,000 | | | 1,980,000 |
Inmarsat Finance PLC, senior note, 7.625%, 6/30/12 | | United Kingdom | | | 2,000,000 | | | 2,090,000 |
MCI Inc., senior note, 7.688%, 5/01/09 | | United States | | | 2,500,000 | | | 2,593,750 |
Nextel Communications Inc., senior note, 7.375%, 8/01/15 | | United States | | | 2,000,000 | | | 2,210,000 |
Nextel Partners Inc., senior note, 8.125%, 7/01/11 | | United States | | | 1,000,000 | | | 1,115,000 |
PanAmSat Corp., senior note, 144A, 9.00%, 8/15/14 | | United States | | | 1,400,000 | | | 1,569,750 |
Qwest Communications International Inc., senior note, 144A, 7.50%, 2/15/14 | | United States | | | 1,500,000 | | | 1,522,500 |
Qwest Corp., 6.875%, 9/15/33 | | United States | | | 1,000,000 | | | 925,000 |
Rogers Wireless Communications Inc., senior secured note, 144A, 7.25%, 12/15/12 | | Canada | | | 2,200,000 | | | 2,343,000 |
Rural Cellular Corp., senior secured note, 8.25%, 3/15/12 | | United States | | | 1,000,000 | | | 1,062,500 |
Time Warner Telecom Holdings Inc., senior note, 9.25%, 2/15/14 | | United States | | | 1,600,000 | | | 1,640,000 |
Time Warner Telecom Inc., senior note, 10.125%, 2/01/11 | | United States | | | 900,000 | | | 888,750 |
Triton PCS Inc., senior note, 8.50%, 6/01/13 | | United States | | | 2,000,000 | | | 1,940,000 |
| | | | | | | |
|
|
| | | | | | | | | 23,005,250 |
| | | | | | | |
|
|
Consumer Durables 3.4% | | | | | | | | |
D.R. Horton Inc., senior note, 8.50%, 4/15/12 | | United States | | | 2,000,000 | | | 2,240,000 |
General Motors Corp., senior deb., 8.25%, 7/15/23 | | United States | | | 2,000,000 | | | 2,088,352 |
Sealy Mattress Co., senior sub. note, 8.25%, 6/15/14 | | United States | | | 2,000,000 | | | 2,130,000 |
William Lyon Homes Inc., senior note, 144A, 7.625%, 12/15/12 | | United States | | | 1,400,000 | | | 1,373,750 |
| | | | | | | |
|
|
| | | | | | | | | 7,832,102 |
| | | | | | | |
|
|
Consumer Non-Durables 3.3% | | | | | | | | |
Church & Dwight Co. Inc., senior sub note, 144A, 6.00%, 12/15/12 | | United States | | | 2,000,000 | | | 2,045,000 |
Del Monte Corp., senior sub. note, 8.625%, 12/15/12 | | United States | | | 2,500,000 | | | 2,812,500 |
Smithfield Foods Inc., senior note, 7.00%, 8/01/11 | | United States | | | 300,000 | | | 321,750 |
Smithfield Foods Inc., senior note, 7.75%, 5/15/13 | | United States | | | 1,700,000 | | | 1,899,750 |
Smithfield Foods Inc., senior note, 144A, 7.00%, 8/01/11 | | United States | | | 500,000 | | | 536,250 |
| | | | | | | |
|
|
| | | | | | | | | 7,615,250 |
| | | | | | | |
|
|
Consumer Services 16.2% | | | | | | | | |
aAdelphia Communications Corp., senior note, 10.25%, 6/15/11 | | United States | | | 1,700,000 | | | 1,729,750 |
Aztar Corp., senior sub. note, 7.875%, 6/15/14 | | United States | | | 1,900,000 | | | 2,104,250 |
Boyd Gaming Corp., senior sub. note, 7.75%, 12/15/12 | | United States | | | 300,000 | | | 328,875 |
Boyd Gaming Corp., senior sub. note, 6.75%, 4/15/14 | | United States | | | 1,700,000 | | | 1,789,250 |
Cablevision Systems Corp., senior note, 144A, 8.00%, 4/15/12 | | United States | | | 2,500,000 | | | 2,681,250 |
aCallahan NordRhein-Westfalen, senior note, 14.00%, 7/15/10 | | Germany | | | 2,750,000 | | | 184,800 |
CanWest Media Inc., senior note, B, 7.625%, 4/15/13 | | Canada | | | 2,000,000 | | | 2,187,500 |
Charter Communications Holdings II, senior note, 10.25%, 9/15/10 | | United States | | | 2,500,000 | | | 2,662,500 |
Dex Media Inc., B, 8.00%, 11/15/13 | | United States | | | 500,000 | | | 543,750 |
Dex Media West LLC, senior sub. note, 9.875%, 8/15/13 | | United States | | | 1,500,000 | | | 1,736,250 |
FH-9
FRANKLIN TEMPLETON VARIABLE INSURANCE PRODUCTS TRUST
FRANKLIN HIGH INCOME FUND
Statement of Investments, December 31, 2004 (cont.)
| | | | | | | | |
| | | COUNTRY | | PRINCIPAL
AMOUNTh | | VALUE |
| | | | | | | | | |
Bonds (cont.) | | | | | | | | |
Consumer Services (cont.) | | | | | | | | |
DIRECTV Holdings LLC, senior note, 8.375%, 3/15/13 | | United States | | $ | 2,000,000 | | $ | 2,252,500 |
Emmis Operating Co., senior sub. note, 6.875%, 5/15/12 | | United States | | | 2,000,000 | | | 2,102,500 |
LIN Television Corp., senior sub. note, 6.50%, 5/15/13 | | United States | | | 2,015,000 | | | 2,083,006 |
Marquee Inc., senior note, 144A, 8.625%, 8/15/12 | | United States | | | 1,300,000 | | | 1,443,000 |
Nexstar Finance Inc., senior sub. note, 7.00%, 1/15/14 | | United States | | | 2,000,000 | | | 1,990,000 |
Park Place Entertainment Corp., senior sub. note, 7.875%, 3/15/10 | | United States | | | 2,000,000 | | | 2,262,500 |
Pinnacle Entertainment Inc., senior sub. note, 8.75%, 10/01/13 | | United States | | | 1,100,000 | | | 1,196,250 |
Pinnacle Entertainment Inc., senior sub. note, B, 9.25%, 2/15/07 | | United States | | | 399,000 | | | 407,978 |
Rainbow National Services LLC, senior sub. deb., 144A, 10.375%, 9/01/14 | | United States | | | 2,000,000 | | | 2,265,000 |
Royal Caribbean Cruises Ltd., senior note, 8.00%, 5/15/10 | | United States | | | 800,000 | | | 908,000 |
Royal Caribbean Cruises Ltd., senior note, 6.875%, 12/01/13 | | United States | | | 1,200,000 | | | 1,302,000 |
Station Casinos Inc., senior note, 6.00%, 4/01/12 | | United States | | | 300,000 | | | 307,125 |
Station Casinos Inc., senior sub. note, 6.50%, 2/01/14 | | United States | | | 300,000 | | | 309,750 |
Station Casinos Inc., senior sub. note, 6.875%, 3/01/16 | | United States | | | 1,400,000 | | | 1,464,750 |
Yell Finance BV, senior disc. note, zero cpn. to 8/01/06, 13.50% thereafter, 8/01/11 | | United Kingdom | | | 1,282,000 | | | 1,265,975 |
| | | | | | | |
|
|
| | | | | | | | | 37,508,509 |
| | | | | | | |
|
|
Electronic Technology 5.9% | | | | | | | | |
Argo-Tech Corp., senior note, 9.25%, 6/01/11 | | United States | | | 1,700,000 | | | 1,874,250 |
Communications & Power Industries, senior sub. note, 8.00%, 2/01/12 | | United States | | | 1,800,000 | | | 1,917,000 |
Flextronics International Ltd., senior sub. note, 6.50%, 5/15/13 | | Singapore | | | 1,500,000 | | | 1,545,000 |
L-3 Communications Corp., senior sub. note, 144A, 5.875%, 1/15/15 | | United States | | | 2,000,000 | | | 2,005,000 |
Nortel Networks Corp., 6.875%, 9/01/23 | | Canada | | | 1,500,000 | | | 1,417,500 |
Solectron Corp., senior note, 9.625%, 2/15/09 | | United States | | | 2,000,000 | | | 2,210,000 |
Xerox Corp., senior note, 7.125%, 6/15/10 | | United States | | | 2,500,000 | | | 2,712,500 |
| | | | | | | |
|
|
| | | | | | | | | 13,681,250 |
| | | | | | | |
|
|
Energy Minerals 4.3% | | | | | | | | |
Chesapeake Energy Corp., senior note, 144A, 6.375%, 6/15/15 | | United States | | | 2,500,000 | | | 2,581,250 |
Markwest Energy Partners LP, senior note, 144A, 6.875%, 11/01/14 | | United States | | | 2,000,000 | | | 2,040,000 |
Peabody Energy Corp., senior note, B, 6.875%, 3/15/13 | | United States | | | 2,500,000 | | | 2,718,750 |
Plains Exploration & Production Co., senior note, 7.125%, 6/15/14 | | United States | | | 2,500,000 | | | 2,737,500 |
| | | | | | | |
|
|
| | | | | | | | | 10,077,500 |
| | | | | | | |
|
|
Finance .4% | | | | | | | | |
Western Financial Bank-FSB, sub. deb., 9.625%, 5/15/12 | | United States | | | 800,000 | | | 916,000 |
| | | | | | | |
|
|
Health Services 4.2% | | | | | | | | |
HCA Inc., senior note, 8.75%, 9/01/10 | | United States | | | 2,500,000 | | | 2,860,952 |
Tenet Healthcare Corp., senior note, 7.375%, 2/01/13 | | United States | | | 2,500,000 | | | 2,437,500 |
United Surgical Partners International Inc., senior sub. note, 10.00%, 12/15/11 | | United States | | | 2,000,000 | | | 2,290,000 |
Vanguard Health Holding Co. II LLC, senior sub. note, 144A, 9.00%, 10/01/14 | | United States | | | 2,000,000 | | | 2,150,000 |
| | | | | | | |
|
|
| | | | | | | | | 9,738,452 |
| | | | | | | |
|
|
Industrial Services 5.4% | | | | | | | | |
Allied Waste North America Inc., senior secured note, 6.50%, 11/15/10 | | United States | | | 2,400,000 | | | 2,364,000 |
El Paso Corp., 7.875%, 6/15/12 | | United States | | | 2,000,000 | | | 2,102,500 |
Grant Prideco Escrow, senior note, 9.00%, 12/15/09 | | United States | | | 2,000,000 | | | 2,225,000 |
Hanover Equipment Trust 01, senior secured note, B, 8.75%, 9/01/11 | | United States | | | 2,000,000 | | | 2,180,000 |
SESI LLC, senior note, 8.875%, 5/15/11 | | United States | | | 1,500,000 | | | 1,650,000 |
Universal Compression Inc., senior note, 7.25%, 5/15/10 | | United States | | | 2,000,000 | | | 2,145,000 |
| | | | | | | |
|
|
| | | | | | | | | 12,666,500 |
| | | | | | | |
|
|
FH-10
FRANKLIN TEMPLETON VARIABLE INSURANCE PRODUCTS TRUST
FRANKLIN HIGH INCOME FUND
Statement of Investments, December 31, 2004 (cont.)
| | | | | | | | |
| | | COUNTRY | | PRINCIPAL
AMOUNTh | | VALUE |
| | | | | | | | | |
Bonds (cont.) | | | | | | | | |
Non-Energy Minerals .7% | | | | | | | | |
Ispat Inland ULC, senior secured note, 9.75%, 4/01/14 | | United States | | $ | 1,276,000 | | $ | 1,581,602 |
| | | | | | | |
|
|
Process Industries 12.2% | | | | | | | | |
BCP Caylux Holding, senior sub. note, 144A, 9.625%, 6/15/14 | | United States | | | 2,500,000 | | | 2,831,250 |
Boise Cascade LLC, senior sub. note, 144A, 7.125%, 10/15/14 | | United States | | | 1,300,000 | | | 1,381,250 |
Crown European Holdings SA, senior secured note, 10.875%, 3/01/13 | | United States | | | 2,500,000 | | | 2,968,750 |
Georgia-Pacific Corp., 8.125%, 5/15/11 | | United States | | | 2,000,000 | | | 2,310,000 |
HMP Equity Holdings Corp., senior disc. note, zero cpn., 5/15/08 | | United States | | | 2,200,000 | | | 1,465,750 |
Huntsman ICI Holdings LLC, senior disc. note, zero cpn., 12/31/09 | | United States | | | 2,000,000 | | | 1,130,000 |
Jefferson Smurfit Corp., senior note, 7.50%, 6/01/13 | | United States | | | 2,000,000 | | | 2,145,000 |
Lyondell Chemical Co., senior secured note, 10.50%, 6/01/13 | | United States | | | 2,000,000 | | | 2,390,000 |
MDP Acquisitions PLC, senior note, 9.625%, 10/01/12 | | Irish Republic | | | 2,000,000 | | | 2,240,000 |
Nalco Co., senior sub. note, 8.875%, 11/15/13 | | United States | | | 2,000,000 | | | 2,205,000 |
Owens-Illinois Inc., senior note, 7.80%, 5/15/18 | | United States | | | 2,000,000 | | | 2,090,000 |
Pliant Corp., senior sub. note, 13.00%, 6/01/10 | | United States | | | 2,000,000 | | | 1,950,000 |
a,bPolysindo International Finance Co. BV, secured note, 9.375%, 7/30/07 | | Indonesia | | | 4,250,000 | | | 403,750 |
Rhodia SA, senior note, 10.25%, 6/01/10 | | France | | | 2,000,000 | | | 2,260,000 |
a,b,c,dTjiwi Kimia Finance Mauritius, senior note, 10.00%, 8/01/04 | | Indonesia | | | 2,000,000 | | | 603,480 |
| | | | | | | |
|
|
| | | | | | | | | 28,374,230 |
| | | | | | | |
|
|
Producer Manufacturing 6.7% | | | | | | | | |
Case New Holland Inc., senior note, 144A, 9.25%, 8/01/11 | | United States | | | 2,500,000 | | | 2,793,750 |
Fimep SA, senior note, 10.50%, 2/15/13 | | France | | | 2,000,000 | | | 2,380,000 |
aGoss Graphic Systems Inc., senior sub. note, 12.25%, 11/19/05 | | United States | | | 1,912,374 | | | — |
Invensys PLC, senior note, 144A, 9.875%, 3/15/11 | | United Kingdom | | | 2,500,000 | | | 2,700,000 |
Norcraft Cos. LP, senior sub. note, 9.00%, 11/01/11 | | United States | | | 2,000,000 | | | 2,170,000 |
THL Buildco Inc., senior sub. note, 144A, 8.50%, 9/01/14 | | United States | | | 1,100,000 | | | 1,155,000 |
TRW Automotive Inc., senior note, 9.375%, 2/15/13 | | United States | | | 1,959,000 | | | 2,282,235 |
Westinghouse Air Brake Technologies Corp., senior note, 6.875%, 7/31/13 | | United States | | | 2,000,000 | | | 2,110,000 |
| | | | | | | |
|
|
| | | | | | | | | 15,590,985 |
| | | | | | | |
|
|
Real Estate Development .8% | | | | | | | | |
Forest City Enterprises Inc., senior note, 7.625%, 6/01/15 | | United States | | | 1,700,000 | | | 1,810,500 |
| | | | | | | |
|
|
Real Estate Investment Trusts 1.4% | | | | | | | | |
Host Marriott LP, senior note, 144A, 7.00%, 8/15/12 | | United States | | | 2,000,000 | | | 2,125,000 |
Meristar Hospitality Corp., senior note, 10.50%, 6/15/09 | | United States | | | 1,000,000 | | | 1,095,000 |
| | | | | | | |
|
|
| | | | | | | | | 3,220,000 |
| | | | | | | |
|
|
Retail Trade .8% | | | | | | | | |
Rite Aid Corp., senior note, 144A, 6.125%, 12/15/08 | | United States | | | 2,000,000 | | | 1,890,000 |
| | | | | | | |
|
|
Transportation 2.4% | | | | | | | | |
CP Ships Ltd., senior note, 10.375%, 7/15/12 | | Canada | | | 1,500,000 | | | 1,738,125 |
Great Lakes Dredge & Dock Corp., senior sub. note, 7.75%, 12/15/13 | | United States | | | 2,000,000 | | | 1,830,000 |
Laidlaw International Inc., senior note, 10.75%, 6/15/11 | | United States | | | 1,700,000 | | | 1,993,250 |
| | | | | | | |
|
|
| | | | | | | | | 5,561,375 |
| | | | | | | |
|
|
Utilities 9.4% | | | | | | | | |
Allegheny Energy Supply Co. LLC, 144A, 8.25%, 4/15/12 | | United States | | | 2,500,000 | | | 2,806,250 |
Aquila Inc., senior note, 14.875%, 7/01/12 | | United States | | | 2,000,000 | | | 2,812,500 |
Calpine Corp., senior secured note, 144A, 8.50%, 7/15/10 | | United States | | | 1,700,000 | | | 1,466,250 |
Calpine Corp., senior secured note, 144A, 8.75%, 7/15/13 | | United States | | | 800,000 | | | 664,000 |
FH-11
FRANKLIN TEMPLETON VARIABLE INSURANCE PRODUCTS TRUST
FRANKLIN HIGH INCOME FUND
Statement of Investments, December 31, 2004 (cont.)
| | | | | | | | |
| | | COUNTRY | | PRINCIPAL
AMOUNTh | | VALUE |
Bonds (cont.) | | | | | | | | |
Utilities (cont.) | | | | | | | | |
Centerpoint Energy Inc., senior note, B, 7.25%, 9/01/10 | | United States | | $ | 2,300,000 | | $ | 2,568,295 |
CMS Energy Corp., senior note, 7.50%, 1/15/09 | | United States | | | 2,000,000 | | | 2,140,000 |
Dynegy Holdings Inc., senior secured note, 144A, 10.125%, 7/15/13 | | United States | | | 2,500,000 | | | 2,875,000 |
El Paso Natural Gas Co., senior note, 7.625%, 8/01/10 | | United States | | | 2,500,000 | | | 2,750,000 |
Midwest Generation LLC, senior secured note, 8.75%, 5/01/34 | | United States | | | 2,300,000 | | | 2,622,000 |
Texas Genco LLC, senior note, 144A, 6.875%, 12/15/14 | | United States | | | 1,000,000 | | | 1,038,750 |
| | | | | | | |
|
|
| | | | | | | | | 21,743,045 |
| | | | | | | |
|
|
Total Bonds (Cost $206,610,145) | | | | | | | | 209,246,925 |
| | | | | | | |
|
|
| | | |
| | | | | Shares/
Warrants
| | |
Common Stocks and Warrants 1.3% | | | | | | | | |
Communications .6% | | | | | | | | |
eCall-Net Enterprises Inc., B | | Canada | | | 47,553 | | | 115,554 |
eDobson Communications Corp. | | United States | | | 70,446 | | | 121,167 |
eICO Global Communications Holdings Ltd. | | United States | | | 300,767 | | | 153,391 |
eInternational Wireless Communications Holdings Inc. | | United States | | | 377,088 | | | 45,251 |
b,ePoland Telecom Finance, wts., 144A, 12/01/07 | | Poland | | | 8,000 | | | — |
eUSA Mobility Inc. | | United States | | | 26,589 | | | 938,842 |
| | | | | | | |
|
|
| | | | | | | | | 1,374,205 |
| | | | | | | |
|
|
Consumer Services | | | | | | | | |
eJack In The Box Inc. | | United States | | | 210 | | | 7,743 |
| | | | | | | |
|
|
Electronic Technology | | | | | | | | |
eLoral Space & Communications Ltd., wts., 1/15/07 | | United States | | | 1,500 | | | — |
| | | | | | | |
|
|
Industrial Services .3% | | | | | | | | |
eTransocean Inc., wts., 144A, 5/01/09 | | United States | | | 1,500 | | | 693,000 |
| | | | | | | |
|
|
Process Industries .4% | | | | | | | | |
eHMP Equity Holdings Corp., wts., 144A, 5/15/11 | | United States | | | 2,200 | | | 1,035,100 |
| | | | | | | |
|
|
Producer Manufacturing | | | | | | | | |
eGoss Holdings Inc., B | | United States | | | 44,604 | | | — |
| | | | | | | |
|
|
Total Common Stocks and Warrants (Cost $6,741,008) | | | | | | | | 3,110,048 |
| | | | | | | |
|
|
Preferred Stocks 1.2% | | | | | | | | |
Health Services 1.2% | | | | | | | | |
Fresenius Medical Care Capital Trust II, 7.875%, 2/01/08, pfd. | | Germany | | | 2,500 | | | 2,718,750 |
| | | | | | | |
|
|
Process Industries | | | | | | | | |
a,b,c,dAsia Pulp & Paper Co. Ltd., 12.00%, pfd., Perpetual | | Indonesia | | | 4,500,000 | | | 49,095 |
| | | | | | | |
|
|
Total Preferred Stocks (Cost $7,028,301) | | | | | | | | 2,767,845 |
| | | | | | | |
|
|
Convertible Preferred Stock (Cost $246,000) | | | | | | | | |
Communications | | | | | | | | |
Dobson Communications Corp., 6.00%, cvt. pfd. | | United States | | | 1,500 | | | 98,250 |
| | | | | | | |
|
|
Total Long Term Investments (Cost $220,625,454) | | | | | | | | 215,223,068 |
| | | | | | | |
|
|
FH-12
FRANKLIN TEMPLETON VARIABLE INSURANCE PRODUCTS TRUST
FRANKLIN HIGH INCOME FUND
Statement of Investments, December 31, 2004 (cont.)
| | | | | | | | |
| | | COUNTRY | | PRINCIPAL
AMOUNTh | | VALUE |
Short Term Investments (Cost $14,004,131) 6.0% | | | | | | | | |
Repurchase Agreement | | | | | | | | |
fJoint Repurchase Agreement, 1.915%, 1/03/05 (Maturity Value $14,006,366) | | United States | | $ | 14,004,131 | | $ | 14,004,131 |
ABN AMRO Bank, N.V., New York Branch (Maturity Value $1,382,849) Banc of America Securities LLC (Maturity Value $518,512) Barclays Capital Inc. (Maturity Value $639,531) Bear, Stearns & Co. Inc. (Maturity Value $1,088,995) BNP Paribas Securities Corp. (Maturity Value $1,382,849) Deutsche Bank Securities Inc. (Maturity Value $691,494) Goldman, Sachs & Co. (Maturity Value $1,382,849) Greenwich Capital Markets Inc. (Maturity Value $1,382,849) Lehman Brothers Inc. (Maturity Value $1,387,891) Merrill Lynch Government Securities Inc. (Maturity Value $1,382,849) Morgan Stanley & Co. Inc. (Maturity Value $1,382,849) UBS Securities LLC (Maturity Value $1,382,849) | | | | | | | | |
Collateralized by U.S. Government Agency Securities, 0.00 - 7.125%, 1/05/05 - 9/15/09; gU.S. Treasury Bills, 3/24/05 - 3/31/05; U.S. Treasury Bonds, 9.375 - 12.00%, 5/15/05 - 2/15/06; and U.S. Treasury Notes, 1.50 - 7.00%, 2/28/05 - 6/15/09 | | | | | | | | |
| | | | | | | |
|
|
Total Investments (Cost $234,629,585) 98.7% | | | | | | | | 229,227,199 |
Other Assets, less Liabilities 1.3% | | | | | | | | 2,920,290 |
| | | | | | | |
|
|
Net Assets 100.0% | | | | | | | $ | 232,147,489 |
| | | | | | | |
|
|
| a | Defaulted securities. See Note 7. |
| b | See Note 8 regarding restricted securities. |
| c | Subject to certain terms and conditions, the Fund has agreed to sell its holdings in Asia Pulp & Paper Co. Ltd. and its subsidiaries in November 2006. |
| d | See Note 9 regarding other considerations. |
| f | See Note 1(c) regarding joint repurchase agreement. |
| g | Security is traded on a discount basis with no stated coupon rate. |
| h | The principal amount is stated in U.S. dollars unless otherwise indicated. |
See notes to financial statements.
FH-13
FRANKLIN TEMPLETON VARIABLE INSURANCE PRODUCTS TRUST
FRANKLIN HIGH INCOME FUND
Financial Statements
Statement of Assets and Liabilities
December 31, 2004
| | | | |
Assets: | | | | |
Investments in securities: | | | | |
Cost - Unaffiliated issuers | | $ | 220,625,454 | |
Cost - Repurchase agreement | | | 14,004,131 | |
| | |
|
|
|
Total cost of investments | | | 234,629,585 | |
| | |
|
|
|
Value - Unaffiliated issuers | | | 215,223,068 | |
Value - Repurchase agreement | | | 14,004,131 | |
| | |
|
|
|
Total value of investments | | | 229,227,199 | |
| | |
|
|
|
Receivables: | | | | |
Capital shares sold | | | 891,921 | |
Interest | | | 3,704,885 | |
| | |
|
|
|
Total assets | | | 233,824,005 | |
| | |
|
|
|
Liabilities: | | | | |
Payables: | | | | |
Investment securities purchased | | | 1,383,038 | |
Capital shares redeemed | | | 124,466 | |
Affiliates | | | 130,318 | |
Other liabilities | | | 38,694 | |
| | |
|
|
|
Total liabilities | | | 1,676,516 | |
| | |
|
|
|
Net assets, at value | | $ | 232,147,489 | |
| | |
|
|
|
Net assets consist of: | | | | |
Undistributed net investment income | | $ | 11,254,148 | |
Net unrealized appreciation (depreciation) | | | (5,402,386 | ) |
Accumulated net realized gain (loss) | | | (123,717,638 | ) |
Capital shares | | | 350,013,365 | |
| | |
|
|
|
Net assets, at value | | $ | 232,147,489 | |
| | |
|
|
|
Class 1: | | | | |
Net assets, at value | | $ | 109,568,703 | |
| | |
|
|
|
Shares outstanding | | | 15,666,711 | |
| | |
|
|
|
Net asset value and offering price per share | | $ | 6.99 | |
| | |
|
|
|
Class 2: | | | | |
Net assets, at value | | $ | 122,578,786 | |
| | |
|
|
|
Shares outstanding | | | 17,765,604 | |
| | |
|
|
|
Net asset value and offering price per share | | $ | 6.90 | |
| | |
|
|
|
See notes to financial statements.
FH-14
FRANKLIN TEMPLETON VARIABLE INSURANCE PRODUCTS TRUST
FRANKLIN HIGH INCOME FUND
Financial Statements (continued)
Statement of Operations
for the year ended December 31, 2004
| | | | |
Investment income: | | | | |
Dividends | | $ | 368,526 | |
Interest | | | 14,589,332 | |
| | |
|
|
|
Total investment income | | | 14,957,858 | |
| | |
|
|
|
Expenses: | | | | |
Management fees (Note 3) | | | 1,085,462 | |
Distribution fees - Class 2 (Note 3) | | | 193,552 | |
Transfer agent fees | | | 1,910 | |
Custodian fees (Note 4) | | | 8,269 | |
Reports to shareholders | | | 55,141 | |
Professional fees | | | 17,357 | |
Trustees’ fees and expenses | | | 1,157 | |
Other | | | 16,767 | |
| | |
|
|
|
Total expenses | | | 1,379,615 | |
Expense reductions (Note 4) | | | (402 | ) |
| | |
|
|
|
Net expenses | | | 1,379,213 | |
| | |
|
|
|
Net investment income | | | 13,578,645 | |
| | |
|
|
|
Realized and unrealized gains (losses): | | | | |
Net realized gain (loss) from investments | | | (9,175,443 | ) |
Net change in unrealized appreciation (depreciation) on investments | | | 14,134,775 | |
| | |
|
|
|
Net realized and unrealized gain (loss) | | | 4,959,332 | |
| | |
|
|
|
Net increase (decrease) in net assets resulting from operations | | $ | 18,537,977 | |
| | |
|
|
|
See notes to financial statements
FH-15
FRANKLIN TEMPLETON VARIABLE INSURANCE PRODUCTS TRUST
FRANKLIN HIGH INCOME FUND
Financial Statements (continued)
Statements of Changes in Net Assets
for the years ended December 31, 2004 and 2003
| | | | | | | | |
| | | 2004 | | | 2003 | |
| | |
| |
Increase (decrease) in net assets: | | | | | | | | |
Operations: | | | | | | | | |
Net investment income | | $ | 13,578,645 | | | $ | 12,064,982 | |
Net realized gain (loss) from investments | | | (9,175,443 | ) | | | (13,030,110 | ) |
Net change in unrealized appreciation (depreciation) on investments | | | 14,134,775 | | | | 41,254,872 | |
| | |
| |
Net increase (decrease) in net assets resulting from operations | | | 18,537,977 | | | | 40,289,744 | |
Distributions to shareholders from: | | | | | | | | |
Net investment income: | | | | | | | | |
Class 1 | | | (7,299,767 | ) | | | (11,192,157 | ) |
Class 2 | | | (4,002,774 | ) | | | (2,049,901 | ) |
| | |
| |
Total distributions to shareholders | | | (11,302,541 | ) | | | (13,242,058 | ) |
Capital share transactions: (Note 2) | | | | | | | | |
Class 1 | | | (30,236,750 | ) | | | 2,030,563 | |
Class 2 | | | 60,249,257 | | | | 46,749,559 | |
| | |
| |
Total capital share transactions | | | 30,012,507 | | | | 48,780,122 | |
Net increase (decrease) in net assets | | | 37,247,943 | | | | 75,827,808 | |
Net assets: | | | | | | | | |
Beginning of year | | | 194,899,546 | | | | 119,071,738 | |
| | |
| |
End of year | | $ | 232,147,489 | | | $ | 194,899,546 | |
| | |
| |
Undistributed net investment income included in net assets: | | | | | | | | |
End of year | | $ | 11,254,148 | | | $ | 8,905,397 | |
| | |
| |
See notes to financial statements.
FH-16
FRANKLIN TEMPLETON VARIABLE INSURANCE PRODUCTS TRUST
FRANKLIN HIGH INCOME FUND
Notes to Financial Statements
1. ORGANIZATION AND SIGNIFICANT ACCOUNTING POLICIES
Franklin Templeton Variable Insurance Products Trust (the Trust) is registered under the Investment Company Act of 1940 as an open-end investment company, consisting of twenty-one separate series (the Funds). The Franklin High Income Fund (the Fund) included in this report is diversified. The financial statements of the remaining funds in the series are presented separately. Shares of the Fund are sold only to insurance company separate accounts to fund the benefits of variable life insurance policies or variable annuity contracts. As of December 31, 2004, over 96% of the Fund’s shares were sold through one insurance company. The Fund’s investment objective is current income.
The following summarizes the Fund’s significant accounting policies.
a. Security Valuation
Securities listed on a securities exchange or on the NASDAQ National Market System are valued at the last quoted sale price or the official closing price of the day, respectively. Over-the-counter securities and listed securities for which there is no reported sale are valued within the range of the most recent quoted bid and ask prices. Securities that trade in multiple markets or on multiple exchanges are valued according to the broadest and most representative market. Repurchase agreements are valued at cost.
Corporate debt securities generally trade in the over-the-counter market rather than on a securities exchange. The Trust may utilize independent pricing services, quotations from bond dealers, and information with respect to bond and note transactions, to assist in determining a current market value for each security. The Trust’s pricing services may use valuation models or matrix pricing which considers information with respect to comparable bond and note transactions, quotations from bond dealers, or by reference to other securities that are considered comparable in such characteristics as rating, interest rate and maturity date, option adjusted spread models, prepayment projections, interest rate spreads and yield curves, to determine current value.
Foreign securities are valued as of the close of trading on the foreign stock exchange on which the security is primarily traded, or the NYSE, whichever is earlier. The value is then converted into its U.S. dollar equivalent at the foreign exchange rate in effect at the close of the NYSE on the day that the value of the foreign security is determined. If no sale is reported at that time, the foreign security will be valued within the range of the most recent quoted bid and ask prices.
The Trust has procedures to determine the fair value of individual securities and other assets for which market prices are not readily available or which may not be reliably priced. Some methods for valuing these securities may include: fundamental analysis, matrix pricing, discounts from market prices of similar securities, or discounts applied due to the nature and duration of restrictions on the disposition of the securities. Occasionally, events occur between the time at which trading in a security is completed and the close of the NYSE that might call into question the availability (including the reliability) of the value of a portfolio security held by the Fund. If such an event occurs, the securities may be valued using fair value procedures, which may include the use of independent pricing services. All security valuation procedures are approved by the Trust’s Board of Trustees.
b. Foreign Currency Translation
Portfolio securities and other assets and liabilities denominated in foreign currencies are translated into U.S. dollars based on the exchange rate of such currencies against U.S. dollars on the date of valuation. Purchases and sales of securities, income and expense items denominated in foreign currencies are translated into U.S. dollars at the exchange rate in effect on the transaction date. Occasionally, events may impact the availability or reliability of foreign exchange rates used to convert the U.S. dollar equivalent value. If such an event occurs, the foreign exchange rate will be valued at fair value using procedures established and approved by the Fund’s Board of Trustees.
The Fund does not separately report the effect of changes in foreign exchange rates from changes in market prices on securities held. Such changes are included in net realized and unrealized gain or loss from investments on the Statement of Operations.
FH-17
FRANKLIN TEMPLETON VARIABLE INSURANCE PRODUCTS TRUST
FRANKLIN HIGH INCOME FUND
Notes to Financial Statements (continued)
1. ORGANIZATION AND SIGNIFICANT ACCOUNTING POLICIES (cont.)
b. Foreign Currency Translation (cont.)
Realized foreign exchange gains or losses arise from sales of foreign currencies, currency gains or losses realized between the trade and settlement dates on securities transactions and the difference between the recorded amounts of dividends, interest, and foreign withholding taxes and the U.S. dollar equivalent of the amounts actually received or paid. Net unrealized foreign exchange gains and losses arise from changes in foreign exchange rates on foreign denominated assets and liabilities other than investments in securities held at the end of the reporting period.
c. Joint Repurchase Agreement
The Fund may enter into a joint repurchase agreement whereby its uninvested cash balance is deposited into a joint cash account to be used to invest in one or more repurchase agreements. The value and face amount of the joint repurchase agreement are allocated to the Fund based on its pro-rata interest. A repurchase agreement is accounted for as a loan by the Fund to the seller, collateralized by securities which are delivered to the Fund’s custodian. The market value, including accrued interest, of the initial collateralization is required to be at least 102% of the dollar amount invested by the Fund, with the value of the underlying securities marked to market daily to maintain coverage of at least 100%. At December 31, 2004, all repurchase agreements held by the Fund had been entered into on that date.
d. Income Taxes
No provision has been made for U.S. income taxes because the Fund’s policy is to qualify as a regulated investment company under Sub Chapter M of the Internal Revenue Code and to distribute substantially all of its taxable income. Fund distributions to shareholders are determined on an income tax basis and may differ from net investment income and realized gains for financial reporting purposes.
e. Security Transactions, Investment Income, Expenses and Distributions
Security transactions are accounted for on trade date. Realized gains and losses on security transactions are determined on a specific identification basis. Interest income and estimated expenses are accrued daily. Discounts and premiums on securities purchased are amortized over the lives of the respective securities. Dividend income and distributions to shareholders are recorded on the ex-dividend date.
Common expenses incurred by the Trust are allocated among the funds based on the ratio of net assets of each fund to the combined net assets. Other expenses are charged to each fund on a specific identification basis.
Realized and unrealized gains and losses and net investment income, other than class specific expenses, are allocated daily to each class of shares based upon the relative proportion of net assets of each class.
f. Accounting Estimates
The preparation of financial statements in accordance with accounting principles generally accepted in the United States of America requires management to make estimates and assumptions that affect the reported amounts of assets and liabilities at the date of the financial statements and the amounts of income and expenses during the reporting period. Actual results could differ from those estimates.
g. Guarantees and Indemnifications
Under the Trust’s organizational documents, its officers and trustees are indemnified by the Trust against certain liability arising out of the performance of their duties to the Trust. Additionally, in the normal course of business, the Trust enters into contracts
FH-18
FRANKLIN TEMPLETON VARIABLE INSURANCE PRODUCTS TRUST
FRANKLIN HIGH INCOME FUND
Notes to Financial Statements (continued)
1. ORGANIZATION AND SIGNIFICANT ACCOUNTING POLICIES (cont.)
g. Guarantees and Indemnifications (cont.)
with service providers that contain general indemnification clauses. The Trust’s maximum exposure under these arrangements is unknown as this would involve future claims that may be made against the Trust that have not yet occurred. However, based on experience, the Trust expects the risk of loss to be remote.
2. SHARES OF BENEFICIAL INTEREST
The Fund offers two classes of shares: Class 1 and Class 2. Each class of shares differs by its distribution fees, voting rights on matters affecting a single class and its exchange privilege.
At December 31, 2004, there were an unlimited number of shares authorized ($.01 par value). Transactions in the Fund’s shares were as follows:
| | | | | | | | | | | | | | |
| | | Year Ended December 31,
| |
| | | 2004
| | | 2003
| |
| Class 1 Shares: | | Shares
| | | Amount
| | | Shares
| | | Amount
| |
Shares sold | | 5,050,244 | | | $ | 34,436,752 | | | 11,487,433 | | | $ | 71,330,100 | |
Shares issued in reinvestment of distributions | | 1,149,570 | | | | 7,299,767 | | | 1,828,784 | | | | 11,192,157 | |
Shares redeemed | | (10,531,991 | ) | | | (71,973,269 | ) | | (13,033,894 | ) | | | (80,491,694 | ) |
| | |
| |
Net increase (decrease) | | (4,332,177 | ) | | $ | (30,236,750 | ) | | 282,323 | | | $ | 2,030,563 | |
| | |
| |
| Class 2 Shares: | | | | | | | | | | | | |
Shares sold | | 17,073,978 | | | $ | 113,972,411 | | | 9,104,383 | | | $ | 56,921,673 | |
Shares issued in reinvestment of distributions | | 637,384 | | | | 4,002,774 | | | 338,268 | | | | 2,049,901 | |
Shares redeemed | | (8,658,975 | ) | | | (57,725,928 | ) | | (2,032,596 | ) | | | (12,222,015 | ) |
| | |
| |
Net increase (decrease) | | 9,052,387 | | | $ | 60,249,257 | | | 7,410,055 | | | $ | 46,749,559 | |
| | |
| |
3. TRANSACTIONS WITH AFFILIATES
Certain officers and trustees of the Fund are also officers and/or directors of the following entities:
| | |
| Entity | | Affiliation |
Franklin Advisers Inc. (Advisers) | | Investment manager |
Franklin Templeton Services LLC (FT Services) | | Administrative manager |
Franklin Templeton Distributors Inc. (Distributors) | | Principal underwriter |
Franklin Templeton Investor Services LLC (Investor Services) | | Transfer agent |
a. Management Fees
The Fund pays an investment management fee to Advisers based on the average daily net assets of the Fund as follows:
| | |
| Annualized Fee Rate | | Net Assets |
| .625% | | First $100 million |
| .500% | | Over $100 million, up to and including $250 million |
| .450% | | Over $250 million, up to and including $10 billion |
Fees are further reduced on net assets over $10 billion.
FH-19
FRANKLIN TEMPLETON VARIABLE INSURANCE PRODUCTS TRUST
FRANKLIN HIGH INCOME FUND
Notes to Financial Statements (continued)
3. TRANSACTIONS WITH AFFILIATES (cont.)
b. Administrative Fees
Under an agreement with Advisers, FT Services provides administrative services to the Fund. The fee is paid by Advisers based on the average daily net assets of the Fund, and is not an additional expense of the Fund.
c. Distribution Fees
The Fund reimburses Distributors up to .25% per year of its average daily net assets of Class 2, for costs incurred in marketing the Fund’s shares under a Rule 12b-1 plan.
d. Transfer Agent Fees
Investor Services, under terms of an agreement, performs shareholder servicing for the Fund and is not paid by the Fund for the services.
4. EXPENSE OFFSET ARRANGEMENT
The Fund has entered into an arrangement with its custodian whereby credits realized as a result of uninvested cash balances are used to reduce a portion of the Fund’s custodian expenses. During the year ended December 31, 2004, the custodian fees were reduced as noted in the Statement of Operations.
5. INCOME TAXES
At December 31, 2004, the Fund had tax basis capital losses which may be carried over to offset future capital gains. Such losses expire as follows:
| | | |
Capital loss carryovers expiring in: | | | |
2007 | | $ | 2,294,320 |
2008 | | | 26,944,467 |
2009 | | | 14,152,532 |
2010 | | | 46,366,314 |
2011 | | | 24,711,916 |
2012 | | | 9,009,590 |
| | |
|
| | | $ | 123,479,139 |
| | |
|
The tax character of distributions paid during the years ended December 31, 2004 and 2003, was as follows:
| | | | | | |
| | | 2004
| | 2003
|
Distributions paid from ordinary income | | $ | 11,302,541 | | $ | 13,242,058 |
Net investment income (loss) differs for financial statement and tax purposes primarily due to differing treatments of defaulted securities and bond discounts and premiums.
Net realized gains (losses) differ for financial statement and tax purposes primarily due to differing treatments of wash sales, defaulted securities and bond discounts and premiums.
FH-20
FRANKLIN TEMPLETON VARIABLE INSURANCE PRODUCTS TRUST
FRANKLIN HIGH INCOME FUND
Notes to Financial Statements (continued)
5. INCOME TAXES (cont.)
At December 31, 2004, the cost of investments, net unrealized appreciation (depreciation), and undistributed ordinary income for income tax purposes were as follows:
| | | | |
Cost of investments | | $ | 235,376,723 | |
| | |
|
|
|
Unrealized appreciation | | $ | 16,149,120 | |
Unrealized depreciation | | | (22,298,644 | ) |
| | |
|
|
|
Net unrealized appreciation (depreciation) | | $ | (6,149,524 | ) |
| | |
|
|
|
Distributable earnings-undistributed ordinary income | | $ | 12,350,459 | |
| | |
|
|
|
6. INVESTMENT TRANSACTIONS
Purchases and sales of investments (excluding short-term securities) for the year ended December 31, 2004, aggregated $135,657,813 and $108,656,530, respectively.
7. CREDIT RISK AND DEFAULTED SECURITIES
The Fund has 90.7% of its portfolio invested in below investment grade and comparable quality unrated high yield securities, which tend to be more sensitive to economic conditions than higher rated securities. The risk of loss due to default by the issuer may be significantly greater for the holders of high yielding securities because such securities are generally unsecured and are often subordinated to other creditors of the issuer.
The Fund held defaulted securities and/or other securities for which the income has been deemed uncollectible. At December 31, 2004, the value of these securities was $2,973,375, representing 1.3% of the Fund’s net assets. The Fund discontinues accruing income on securities for which income has been deemed uncollectible and provides an estimate for losses on interest receivable. For information as to specific securities, see the accompanying Statement of Investments.
8. RESTRICTED SECURITIES
At December 31, 2004, investments in securities included issues that are restricted and illiquid. Restricted securities are often purchased in private placement transactions, are not registered under the Securities Act of 1933, may have contractual restrictions on resale, and are valued under methods approved by the Board of Trustees as reflecting fair value. A security may also be considered illiquid if it lacks a readily available market or if its valuation has not changed for a certain period of time. At December 31, 2004, the Fund held investments in restricted and illiquid securities that were valued under approved methods by the Trustees, as follows:
| | | | | | | | | | | |
Principal/
Shares/
Warrants | | Issuer | | Acquisition
Date | | Cost | | Value |
| | 4,500,000 | | Asia Pulp & Paper Co. Ltd., 12.00%, pfd., Perpetual | | 2/21/97 | | $ | 4,500,000 | | $ | 49,095 |
| | 8,000 | | Poland Telecom Finance, wts., 144A, 12/01/07 | | 11/24/97 | | | 48,000 | | | — |
| $ | 4,250,000 | | Polysindo International Finance Co. BV secured note, 9.375%, 7/30/07 | | 7/23/97 | | | 4,250,000 | | | 403,750 |
| $ | 2,000,000 | | Tjiwi Kimia Finance Mauritius, senior note, 10.00%, 8/01/04 | | 7/29/97 | | | 1,994,593 | | | 603,480 |
| | | | | | | | | | |
|
|
| | | | Total Restricted Securities (.5% of Net Assets) | | | | | | | $ | 1,056,325 |
| | | | | | | | | | |
|
|
FH-21
FRANKLIN TEMPLETON VARIABLE INSURANCE PRODUCTS TRUST
FRANKLIN HIGH INCOME FUND
Notes to Financial Statements (continued)
9. OTHER CONSIDERATIONS
Advisers, as the Fund’s Manager, may serve as a member of various bondholders’ steering committees, on credit committees, or may represent the Funds in certain corporate restructuring negotiations. At December 31, 2004, the Manager serves in one or more of these capacities for Asia Pulp & Paper Co. Ltd. and Tjiwi Kimia Finance Mauritius. As a result of this involvement, Advisers may be in possession of certain material non-public information. If the Fund’s Manager, while in possession of such information, seeks to sell any of its holdings in these securities it will comply with all applicable federal securities laws.
10. REGULATORY MATTERS
Investigations
As part of various investigations by a number of federal, state, and foreign regulators and governmental entities, including the Securities and Exchange Commission (“SEC”), the California Attorney General’s Office (“CAGO”), and the National Association of Securities Dealers, Inc. (“NASD”), relating to certain practices in the mutual fund industry, including late trading, market timing and marketing support payments to securities dealers who sell fund shares, Franklin Resources, Inc. and certain of its subsidiaries (as used in this section, together, the “Company”), as well as certain current or former executives and employees of the Company, received subpoenas and/or requests for documents, information and/or testimony. The Company and its current employees provided documents and information in response to those requests and subpoenas.
Settlements
Beginning in August 2004, the Company entered into settlements with certain regulators investigating the mutual fund industry practices noted above. The Company believes that settlement of each of the matters described in this section is in the best interest of the Company and shareholders of the Franklin, Templeton, and Mutual Series mutual funds (the “funds”).
On August 2, 2004, Franklin Resources, Inc. announced that its subsidiary, Franklin Advisers, Inc., reached an agreement with the SEC that resolved the issues resulting from the SEC investigation into market timing activity. In connection with that agreement, the SEC issued an “Order Instituting Administrative and Cease-and-Desist Proceedings Pursuant to Sections 203(e) and 203(k) of the Investment Advisers Act of 1940 and Sections 9(b) and 9(f) of the Investment Company Act of 1940, Making Findings and Imposing Remedial Sanctions and a Cease-and-Desist Order” (the “Order”). The SEC’s Order concerned the activities of a limited number of third parties that ended in 2000 and those that were the subject of the first Massachusetts administrative complaint described below.
Under the terms of the SEC’s Order, pursuant to which Franklin Advisers, Inc. neither admitted nor denied any of the findings contained therein, Franklin Advisers, Inc. agreed to pay $50 million, of which $20 million is a civil penalty, to be distributed to shareholders of certain funds in accordance with a plan to be developed by an independent distribution consultant. At this time, it is unclear which funds or which shareholders of any particular fund will receive distributions. The Order also required Franklin Advisers, Inc. to, among other things, enhance and periodically review compliance policies and procedures.
On September 20, 2004, Franklin Resources, Inc. announced that two of its subsidiaries, Franklin Advisers, Inc. and Franklin Templeton Alternative Strategies, Inc. (“FTAS”), reached an agreement with the Securities Division of the Office of the Secretary of the Commonwealth of Massachusetts (the “State of Massachusetts”) related to its administrative complaint filed on February 4, 2004, concerning one instance of market timing that was also a subject of the August 2, 2004 settlement that Franklin Advisers, Inc. reached with the SEC, as described above.
Under the terms of the settlement consent order issued by the State of Massachusetts, Franklin Advisers, Inc. and FTAS consented to the entry of a cease-and-desist order and agreed to pay a $5 million administrative fine to the State of Massachusetts (the “Massachusetts Consent Order”). The Massachusetts Consent Order included two different sections: “Statements of Fact” and “Violations of Massachusetts Securities Laws.” Franklin Advisers, Inc. and FTAS admitted the facts in the Statements of Fact.
FH-22
FRANKLIN TEMPLETON VARIABLE INSURANCE PRODUCTS TRUST
FRANKLIN HIGH INCOME FUND
Notes to Financial Statements (continued)
10. REGULATORY MATTERS (cont.)
Settlements (cont.)
On October 25, 2004, the State of Massachusetts filed a second administrative complaint, alleging that Franklin Resources, Inc.’s Form 8-K filing (in which it described the Massachusetts Consent Order and stated that “Franklin did not admit or deny engaging in any wrongdoing”) failed to state that Franklin Advisers, Inc. and FTAS admitted the Statements of Fact portion of the Massachusetts Consent Order (the “Second Complaint”). Franklin Resources, Inc. reached a second agreement with the State of Massachusetts on November 19, 2004, resolving the Second Complaint. As a result of the November 19, 2004 settlement, Franklin Resources, Inc. filed a new Form 8-K. The terms of the Massachusetts Consent Order did not change and there was no monetary fine associated with this second settlement.
On November 17, 2004, Franklin Resources, Inc. announced that Franklin/Templeton Distributors, Inc. (“FTDI”) reached an agreement with the CAGO, resolving the issues resulting from the CAGO’s investigation concerning sales and marketing support payments. Under the terms of the settlement, FTDI neither admitted nor denied the allegations in the CAGO’s complaint and agreed to pay $2 million to the State of California as a civil penalty, $14 million to the funds, to be allocated by an independent distribution consultant to be paid for by FTDI, and $2 million to the CAGO for its investigative costs.
On December 13, 2004, Franklin Resources, Inc. announced that its subsidiaries FTDI and Franklin Advisers, Inc. reached an agreement with the SEC, resolving the issues resulting from the SEC’s investigation concerning marketing support payments to securities dealers who sell fund shares. In connection with that agreement, the SEC issued an “Order Instituting Administrative and Cease-and-Desist Proceedings, Making Findings, and Imposing Remedial Sanctions Pursuant to Sections 203(e) and 203(k) of the Investment Advisers Act of 1940, Sections 9(b) and 9(f) of the Investment Company Act of 1940, and Section 15(b) of the Securities Exchange Act of 1934” (the “Second Order”).
Under the terms of the Second Order, in which FTDI and Franklin Advisers, Inc. neither admitted nor denied the findings contained therein, they agreed to pay the funds a penalty of $20 million and disgorgement of $1 (one dollar). FTDI and Franklin Advisers, Inc. also agreed to implement certain measures and undertakings relating to marketing support payments to broker-dealers for the promotion or sale of fund shares, including making additional disclosures in the funds’ Prospectuses and Statements of Additional Information. The Second Order further requires the appointment of an independent distribution consultant, at the Company’s expense, who shall develop a plan for the distribution of the penalty and disgorgement to the funds.
Other Legal Proceedings
The Trust, in addition to the Company and other funds, and certain current and former officers, employees, and directors have been named in multiple lawsuits in different federal courts in Nevada, California, Illinois, New York and Florida, alleging violations of various federal securities laws and seeking, among other relief, monetary damages, restitution, removal of fund trustees, directors, advisers, administrators, and distributors, rescission of management contracts and 12b-1 Plans, and/or attorneys’ fees and costs. Specifically, the lawsuits claim breach of duty with respect to alleged arrangements to permit market timing and/or late trading activity, or breach of duty with respect to the valuation of the portfolio securities of certain Templeton funds managed by Franklin Resources, Inc. subsidiaries, resulting in alleged market timing activity. The majority of these lawsuits duplicate, in whole or in part, the allegations asserted in the February 4, 2004 Massachusetts administrative complaint and the findings in the SEC’s August 2, 2004 Order, as described above. The lawsuits are styled as class actions, or derivative actions on behalf of either the named funds or Franklin Resources, Inc.
In addition, the Company, as well as certain current and former officers, employees, and directors, have been named in multiple lawsuits alleging violations of various securities laws and pendent state law claims relating to the disclosure of directed brokerage payments and/or payment of allegedly excessive advisory, commission, and distribution fees, and seeking, among other relief, monetary damages, restitution, rescission of advisory contracts, including recovery of all fees paid pursuant to those contracts, an
FH-23
FRANKLIN TEMPLETON VARIABLE INSURANCE PRODUCTS TRUST
FRANKLIN HIGH INCOME FUND
Notes to Financial Statements (continued)
10. REGULATORY MATTERS (cont.)
Other Legal Proceedings (cont.)
accounting of all monies paid to the named advisers, declaratory relief, injunctive relief, and/or attorneys’ fees and costs. These lawsuits are styled as class actions or derivative actions brought on behalf of certain funds.
The Company and fund management strongly believes that the claims made in each of the lawsuits identified above are without merit and intends to vigorously defend against them. The Company cannot predict with certainty, however, the eventual outcome of the remaining governmental investigations or private lawsuits, nor whether they will have a material negative impact on the Company. Public trust and confidence are critical to the Company’s business and any material loss of investor and/or client confidence could result in a significant decline in assets under management by the Company, which would have an adverse effect on the Company’s future financial results. If the Company finds that it bears responsibility for any unlawful or inappropriate conduct that caused losses to the Trust, it is committed to making the Trust or its shareholders whole, as appropriate. The Company is committed to taking all appropriate actions to protect the interests of its funds’ shareholders.
FH-24
FRANKLIN TEMPLETON VARIABLE INSURANCE PRODUCTS TRUST
FRANKLIN HIGH INCOME FUND
Report of Independent Registered Public Accounting Firm
To the Trustees and Shareholders of
Franklin Templeton Variable Insurance Products Trust
In our opinion, the accompanying statement of assets and liabilities, including the statement of investments, and the related statements of operations and of changes in net assets and the financial highlights present fairly, in all material respects, the financial position of Franklin High Income Fund (the Fund) (one of the funds constituting Franklin Templeton Variable Insurance Products Trust) at December 31, 2004, the results of its operations for the year then ended, the changes in its net assets for each of the two years in the period then ended and the financial highlights for each of the five years in the period then ended, in conformity with accounting principles generally accepted in the United States of America. These financial statements and financial highlights (hereafter referred to as “financial statements”) are the responsibility of the Fund’s management; our responsibility is to express an opinion on these financial statements based on our audits. We conducted our audits of these financial statements in accordance with the standards of the Public Company Accounting Oversight Board (United States). Those standards require that we plan and perform the audits to obtain reasonable assurance about whether the financial statements are free of material misstatement. An audit includes examining, on a test basis, evidence supporting the amounts and disclosures in the financial statements, assessing the accounting principles used and significant estimates made by management, and evaluating the overall financial statement presentation. We believe that our audits, which included confirmation of securities at December 31, 2004 by correspondence with the custodian and brokers, provide a reasonable basis for our opinion.
PricewaterhouseCoopers LLP
San Francisco, California
February 9, 2005
FH-25
FRANKLIN INCOME SECURITIES FUND
We are pleased to bring you Franklin Income Securities Fund’s annual report for the fiscal year ended December 31, 2004.
Performance Summary as of 12/31/04
Average annual total return of Class 2 shares* represents the average annual change in value, assuming reinvestment of dividends and capital gains. Average returns smooth out variations in returns, which can be significant; they are not the same as year-by-year results.
Periods ended 12/31/04
| | | | | | |
| | | 1-Year | | 5-Year | | 10-Year |
Average Annual Total Return | | +13.85% | | +12.40% | | +11.03% |
*Because Class 2 shares were not offered until 1/6/99, standardized Class 2 Fund performance for prior periods represents the historical results of Class 1 shares. For periods beginning on 1/6/99, Class 2’s results reflect an additional 12b-1 fee expense, which also affects future performance. Since 1/6/99 (effective date), the average annual total return of Class 2 shares was +9.71%.
Total Return Index Comparison for Hypothetical $10,000 Investment (1/1/95–12/31/04)
The graph below shows the change in value of a hypothetical $10,000 investment in the Fund over the indicated period and includes reinvestment of any income or distributions. The Fund’s performance* is compared to the performance of the Standard & Poor’s 500 Composite Index (S&P 500), the Lehman Brothers (LB) U.S. Aggregate Index and the Lipper VIP Income Funds Objective Average. One cannot invest directly in an index, nor is an index representative of the Fund’s portfolio. Please see Important Notes to Performance Information preceding the Fund Summaries.
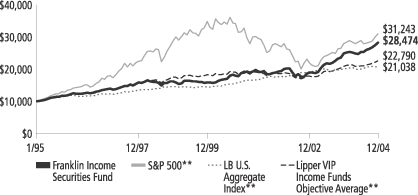
**Sources: Standard & Poor’s Micropal; Lipper Inc. Please see Index Descriptions following the Fund Summaries.
Franklin Income Securities Fund – Class 2
Performance reflects the Fund’s Class 2 operating expenses, but does not include any contract fees, expenses or sales charges. If they had been included, performance would be lower. These charges and deductions, particularly for variable life policies, can have a significant effect on contract values and insurance benefits. See the contract prospectus for a complete description of these expenses, including sales charges.
Performance data quoted represent past performance, which does not guarantee future results. Investment return and principal value will fluctuate, and you may have a gain or loss when you sell your shares. Current performance may differ from figures shown.
FI-1
Fund Goals and Main Investments: Franklin Income Securities Fund seeks to maximize income while maintaining prospects for capital appreciation. The Fund invests in debt and equity securities, including lower-rated “junk bonds.”
Performance Overview
You can find the Fund’s one-year total return in the Performance Summary. Compared with its benchmarks for the same period, the Fund outperformed the S&P 500, the LB U.S. Aggregate Index and the Lipper VIP Income Funds Objective Average, which had total returns of 10.87%, 4.34% and 8.47%, respectively.1
Economic and Market Overview
During the year ended December 31, 2004, the domestic economy expanded solidly and broadly across most industries, sectors and regions as gross domestic product (GDP) rose an estimated 4.4%.2 However, surging energy and other commodity prices had a dampening effect. Although consumer confidence remained below pre-recession levels, consumer spending supported strong auto sales, increased durable goods consumption and a healthy housing market. Similarly, business spending rose substantially even as business confidence wavered. With improving balance sheets and stronger profit margins, many companies entered an upgrade cycle and invested in new technologies, driving equipment spending up 9.5% in the second half of 2004.2 The labor market firmed as employers hired 2.2 million workers in 2004, and unemployment dropped from 5.7% to 5.4% during the year.3 More than one-half of the jobs lost during the recession have been recovered; however, most new jobs were part-time or temporary. Given concerns over rising benefits costs and lingering uncertainties about economic recovery, many companies turned to temporary employment or opted for continued hiring freezes. At year-end, elevated household debt levels and the deepening federal budget and trade deficits were three top concerns for the economy as it headed into 2005.
The U.S. dollar weakened throughout 2004 and hit an all-time low against the euro and a multi-year low versus the yen. The widening trade and current account deficits and possibility for higher import
1. Sources: Standard & Poor’s Micropal; Lipper Inc. One cannot invest directly in an index, nor is an index representative of the Fund’s portfolio. Please see Index Descriptions following the Fund Summaries.
2. Source: Bureau of Economic Analysis.
3. Source: Bureau of Labor Statistics.
Fund Risks: Bonds and other debt obligations are affected by changes in interest rates and the creditworthiness of their issuers. High yield, lower-rated (junk) bonds generally have greater price swings and higher default risks. Stocks offer the potential for long-term gains but can be subject to short-term up-and-down price movements. Foreign investing involves special risks including currency fluctuations, economic instability, and social and political developments. Emerging markets involve heightened risks. The Fund’s prospectus also includes a description of the main investment risks.
FI-2
prices contributed to inflationary pressures. The core inflation rate rose 2.2% in 2004, or 3.3% including volatile food and energy costs. Aiming to keep inflation tame, the Federal Reserve Board (Fed) raised the federal funds target rate five times between June and December, from 1.00% to 2.25%, the highest level in more than three years. The Fed said it will respond to changes in economic prospects as needed to fulfill its obligation to maintain price stability, noting in December that it perceived “the upside and downside risks to the attainment of both sustainable growth and price stability for the next few quarters to be roughly equal.”4
Despite a generally robust economy and improving corporate fundamentals, investors had to digest a wide range of information in 2004, including rising inflation, the dollar’s value, a contentious presidential election and ongoing concerns about terrorism, war and reconstruction in Iraq. Domestic equity markets rallied in early 2004 and then fluctuated; however, they were essentially flat through early November. Disappointing earnings from a number of blue chip companies applied downward pressure, but initial public offering (IPO) activity was strong and investor sentiment improved late in the period despite the mixed signals. After the elections concluded, the markets enjoyed another strong rally through year-end. The blue chip stocks of the Dow Jones Industrial Average gained 5.31% for the year under review, while the broader S&P 500 rose 10.87% and the technology-heavy NASDAQ Composite Index increased 9.15%.5
Investment Strategy
We search for undervalued or out-of-favor securities we believe offer opportunities for income today and growth tomorrow. We perform independent analysis of the debt securities being considered for the Fund’s portfolio, rather than relying principally on ratings assigned by rating agencies. In analyzing debt and equity securities, we consider a variety of factors, including: a security’s relative value based on such factors as anticipated cash flow, interest or dividend coverage, asset coverage, and earnings prospects; the experience and strength of a company’s management; a company’s sensitivity to changes in interest rates and business conditions; a company’s debt maturity schedules and borrowing requirements; and a company’s changing financial condition and market recognition of the change.
4. Source: Federal Reserve. Press Release, 12/14/04.
5. Source: Standard & Poor’s Micropal. Please see Index Descriptions following the Fund Summaries.
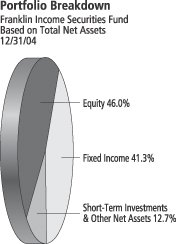
FI-3
Manager’s Discussion
Overall interest rate levels remained low during the year under review, and we continued to emphasize opportunities in high-dividend paying common stocks, convertible securities and corporate bonds. Government and government agency securities played a lesser role in the portfolio, as our concerns over increasing inflationary pressures and the potential for subsequently higher interest rates led us to emphasize corporate securities, which are affected by sector- and company-specific fundamental conditions.
Investment grade and non-investment grade corporate bonds performed well as improving fundamentals, stable financial markets and the overall decline in interest rates contributed to the sector’s strong results. Consequently, the yield difference between U.S. Treasury securities and non-investment grade corporate bonds tightened over the course of the year. In line with the Fund’s investment strategy, we took profits in securities that appreciated and that we believed no longer offered the combination of attractive current yield and the potential for longer-term appreciation. During the Fund’s fiscal year, we took profits from several corporate bond holdings including Amkor Technology, Echostar Communications, IMC Global, Tyco International and Venetian Casino. Despite strong sector performance, we continued to look for opportunities to add to holdings that we believed still offered the combination of yield with the potential for long-term capital appreciation. Based on our strategy, we added to holdings in Tenet Healthcare, Qwest Communications and Dynegy Holdings.
Utilities continued to represent the Fund’s largest stock sector weighting at period-end, due to our assessment that the sector’s combination of dividend yield and generally stable earnings growth profile from regulated utility operations is attractive. This overweighting emphasized companies with regulated utility businesses we regarded as attractive, and our positions in FirstEnergy, Exelon and Ameren aided Fund performance. In addition, employing our multi-asset class approach with in-depth fundamental analysis, we identified opportunities in the utilities sector and held positions in convertible securities of Aquila, as well as corporate bond investments in El Paso, TXU and Pacific Gas & Electric. With more companies in the utilities industry pursuing a “back-to-basics” approach focusing on core regulated businesses, many companies including Exelon and Dominion significantly increased their dividends, which helped drive the Fund’s strong relative performance.
Top Five Stock Holdings
Franklin Income Securities Fund 12/31/04
| | |
Company
Sector/Industry | | % of Total
Net Assets |
| |
| Merck & Co. Inc. | | 3.0% |
| Health Technology | | |
| |
| Pfizer Inc. | | 2.1% |
| Health Technology | | |
| |
| Ameren Corp. | | 1.6% |
| Electric Utilities | | |
| |
| Ford Motor Co. Capital Trust II | | 1.6% |
| Consumer Durables | | |
| |
| Dominion Resources Inc. | | 1.3% |
| Electric Utilities | | |
The dollar value, number of shares or principal amount, and names of all portfolio holdings are listed in the Fund’s Statement of Investments.
FI-4
FirstEnergy also announced an increase in dividends that will pay out in 2005.
For most of the past year global oil prices rose, fueled by economic growth in the U.S. and abroad as well as geopolitical turmoil in several major oil-producing regions. At period-end we held positions in international integrated oil companies including BP, ChevronTexaco and Royal Dutch Petroleum. These positions aided Fund performance given the rise in share prices resulting from market expectations of increased earnings and cash flow from higher commodity prices.
Health technology investments, particularly stocks of major pharmaceu-tical companies, underperformed the overall market and negatively impacted Fund performance. The health technology industry faced challenges to existing products from generic manufacturers and overall pressure to keep costs down in the face of possible drug importation legislation. However, we found the long-term value of our health technology holdings, including Pfizer, Merck, Wyeth, Bristol-Myers Squibb, Schering-Plough and Johnson & Johnson, compelling and their dividend yields attractive in the near term.
Thank you for your participation in Franklin Income Securities Fund. We look forward to serving your future investment needs.
The foregoing information reflects our analysis, opinions and portfolio holdings as of December 31, 2004, the end of the reporting period. The way we implement our main investment strategies and the resulting portfolio holdings may change depending on factors such as market and economic conditions. These opinions may not be relied upon as investment advice or an offer for a particular security. The information is not a complete analysis of every aspect of any market, country, industry, security or the Fund. Statements of fact are from sources considered reliable, but the adviser makes no representation or warranty as to their completeness or accuracy. Although historical performance is no guarantee of future results, these insights may help you understand our investment management philosophy.
Top Five Bond Holdings
Franklin Income Securities Fund 12/31/04
| | |
Issuer
Sector/Industry | | % of Total
Net Assets |
| |
| Charter Communications Holdings LLC | | 2.3% |
| Consumer Services | | |
| |
| FHLMC | | 2.2% |
| U.S. Government Agencies & Mortgages | | |
| |
| Calpine Corp. | | 1.8% |
| Alternative Power Generation | | |
| |
| El Paso Energy | | 1.8% |
| Industrial Services | | |
| |
| Dynegy Holdings Inc. | | 1.6% |
| Alternative Power Generation | | |
FI-5
Fund Expenses
As an investor in a variable insurance contract (“Contract”) that indirectly provides for investment in an underlying mutual fund, you can incur transaction and/or ongoing expenses at both the Fund level and the Contract level.
| • | | Transaction expenses can include sales charges (loads) on purchases, redemption fees, surrender fees, transfer fees and premium taxes. |
| • | | Ongoing expenses can include management fees, distribution and service (12b-1) fees, contract fees, annual maintenance fees, mortality and expense risk fees and other fees and expenses. All mutual funds and Contracts have some types of ongoing expenses. |
The expenses shown in the table below are meant to highlight ongoing expenses at the Fund level only and do not include ongoing expenses at the Contract level, or transaction expenses at either the Fund or Contract levels. While the Fund does not have transaction expenses, if the transaction and ongoing expenses at the Contract level were included, the expenses shown below would be higher. You should consult your Contract prospectus or disclosure document for more information.
The table shows Fund-level ongoing expenses and can help you understand these expenses and compare them with those of other mutual funds offered through the Contract. The table assumes a $1,000 investment held for the six months indicated. Please refer to the Fund prospectus for additional information on operating expenses.
Actual Fund Expenses
The first line (Actual) for each share class listed in the table below provides actual account values and expenses. The “Ending Account Value” is derived from the Fund’s actual return, which includes the effect of ongoing Fund expenses, but does not include the effect of ongoing Contract expenses.
You can estimate the Fund-level expenses you incurred during the period, by following these steps. Of course, your account value and expenses will differ from those in this illustration:
| 1. | Divide your account value by $1,000. |
If an account had an $8,600 value, then $8,600 ÷ $1,000 = 8.6.
| 2. | Multiply the result by the number under the heading “Fund-Level Expenses Incurred During Period.” |
If Fund-Level Expenses Incurred During Period were $7.50, then 8.6 × $7.50 = $64.50.
Franklin Income Securities Fund – Class 2
FI-6
In this illustration, the estimated expenses incurred this period at the Fund level are $64.50.
Hypothetical Example for Comparison with Other Mutual Funds
Information in the second line (Hypothetical) for each class in the table can help you compare ongoing expenses of the Fund with those of other mutual funds offered through the Contract. This information may not be used to estimate the actual ending account balance or expenses you incurred during the period. The hypothetical “Ending Account Value” is based on the actual expense ratio for each class and an assumed 5% annual rate of return before expenses, which does not represent the Fund’s actual return. The figure under the heading “Fund-Level Expenses Incurred During Period” shows the hypothetical expenses your account would have incurred under this scenario. You can compare this figure with the 5% hypothetical examples that appear in shareholder reports of other funds offered through a Contract.
| | | | | | | | | |
| Class 2 | | Beginning
Account
Value 6/30/04 | | Ending
Account
Value 12/31/04 | | Fund-Level
Expenses Incurred
During Period*
6/30/04-12/31/04 |
Actual | | $ | 1,000 | | $ | 1,117.70 | | $ | 3.94 |
Hypothetical (5% return before expenses) | | $ | 1,000 | | $ | 1,021.42 | | $ | 3.76 |
*Expenses are equal to the annualized expense ratio for the Fund’s Class 2 shares (0.74%), which does not include any ongoing expenses of the Contract for which the Fund is an investment option, multiplied by the average account value over the period, multiplied by 184/366 to reflect the one-half year period.
FI-7
FRANKLIN TEMPLETON VARIABLE INSURANCE PRODUCTS TRUST
FRANKLIN INCOME SECURITIES FUND
Financial Highlights
| | | | | | | | | | | | | | | | | | | | |
| | | Class 1
| |
| | | Year Ended December 31,
| |
| | | 2004 | | | 2003 | | | 2002 | | | 2001 | | | 2000 | |
| | |
|
|
|
Per share operating performance | | | | | | | | | | | | | | | | | | | | |
(for a share outstanding throughout the year) | | | | | | | | | | | | | | | | | | | | |
Net asset value, beginning of year | | $ | 14.40 | | | $ | 11.48 | | | $ | 12.96 | | | $ | 14.70 | | | $ | 14.69 | |
| | |
|
|
|
Income from investment operations: | | | | | | | | | | | | | | | | | | | | |
Net investment incomea | | | .83 | | | | .81 | | | | .90 | | | | 1.09 | d | | | 1.17 | |
Net realized and unrealized gains (losses) | | | 1.14 | | | | 2.79 | | | | (.89 | ) | | | (.92 | )d | | | 1.40 | |
| | |
|
|
|
Total from investment operations | | | 1.97 | | | | 3.60 | | | | .01 | | | | .17 | | | | 2.57 | |
| | |
|
|
|
Less distributions from: | | | | | | | | | | | | | | | | | | | | |
Net investment income | | | (.48 | ) | | | (.68 | ) | | | (1.23 | ) | | | (1.03 | ) | | | (1.85 | ) |
Net realized gains | | | — | | | | — | | | | (.26 | ) | | | (.88 | ) | | | (.71 | ) |
| | |
|
|
|
Total distributions | | | (.48 | ) | | | (.68 | ) | | | (1.49 | ) | | | (1.91 | ) | | | (2.56 | ) |
| | |
|
|
|
Net asset value, end of year | | $ | 15.89 | | | $ | 14.40 | | | $ | 11.48 | | | $ | 12.96 | | | $ | 14.70 | |
| | |
|
|
|
| | | | | |
Total returnb | | | 14.13% | | | | 32.10% | | | | (.37)% | | | | .98% | | | | 19.77% | |
Ratios/supplemental data | | | | | | | | | | | | | | | | | | | | |
Net assets, end of year (000’s) | | $ | 530,742 | | | $ | 537,950 | | | $ | 427,036 | | | $ | 527,047 | | | $ | 647,370 | |
Ratios to average net assets: | | | | | | | | | | | | | | | | | | | | |
Expenses | | | .49% | | | | .51% | | | | .53% | | | | .53% | | | | .50% | |
Net investment income | | | 5.71% | | | | 6.33% | | | | 7.40% | | | | 7.90% | d | | | 8.21% | |
Portfolio turnover rate | | | 44.02% | | | | 47.03% | | | | 62.00% | | | | 32.52% | | | | 23.92% | |
Portfolio turnover rate excluding mortgage dollar rollsc | | | 43.76% | | | | 45.50% | | | | 62.00% | | | | 32.52% | | | | 23.92% | |
| a | Based on average daily shares outstanding. |
| b | Total return does not include any fees, charges or expenses imposed by the variable annuity and life insurance contracts for which the Franklin Templeton Variable Insurance Products Trust serves as an underlying investment vehicle. Total return is not annualized for periods less than one year. |
| c | See Note 1(e) regarding mortgage dollar rolls. |
| d | Effective January 1, 2001, the Fund adopted the provisions of the AICPA Audit and Accounting Guide for Investment Companies and began recording all paydown gains and losses as part of investment income and amortizing all premium and discount on fixed-income securities, as required. The effect of this change was as follows: |
| | |
Net investment income per share | | $.008 |
Net realized and unrealized gains/losses per share | | (.008) |
Ratio of net investment income to average net assets | | .06% |
Per share data and ratios for prior periods have not been restated to reflect this change in the accounting policy.
See notes to financial statements.
FI-8
FRANKLIN TEMPLETON VARIABLE INSURANCE PRODUCTS TRUST
FRANKLIN INCOME SECURITIES FUND
Financial Highlights (continued)
| | | | | | | | | | | | | | | | | | | | |
| | | Class 2
| |
| | | Year Ended December 31,
| |
| | | 2004 | | | 2003 | | | 2002 | | | 2001 | | | 2000 | |
| | |
|
|
|
Per share operating performance | | | | | | | | | | | | | | | | | | | | |
(for a share outstanding throughout the year) | | | | | | | | | | | | | | | | | | | | |
Net asset value, beginning of year | | $ | 14.23 | | | $ | 11.38 | | | $ | 12.88 | | | $ | 14.66 | | | $ | 14.65 | |
| | |
|
|
|
Income from investment operations: | | | | | | | | | | | | | | | | | | | | |
Net investment incomea | | | .80 | | | | .76 | | | | .84 | | | | 1.03 | d | | | 1.14 | |
Net realized and unrealized gains (losses) | | | 1.11 | | | | 2.77 | | | | (.86 | ) | | | (.90 | )d | | | 1.39 | |
| | |
|
|
|
Total from investment operations | | | 1.91 | | | | 3.53 | | | | (.02 | ) | | | .13 | | | | 2.53 | |
| | |
|
|
|
Less distributions from: | | | | | | | | | | | | | | | | | | | | |
Net investment income | | | (.47 | ) | | | (.68 | ) | | | (1.22 | ) | | | (1.03 | ) | | | (1.81 | ) |
Net realized gains | | | — | | | | — | | | | (.26 | ) | | | (.88 | ) | | | (.71 | ) |
| | |
|
|
|
Total distributions | | | (.47 | ) | | | (.68 | ) | | | (1.48 | ) | | | (1.91 | ) | | | (2.52 | ) |
| | |
|
|
|
Net asset value, end of year | | $ | 15.67 | | | $ | 14.23 | | | $ | 11.38 | | | $ | 12.88 | | | $ | 14.66 | |
| | |
|
|
|
| | | | | |
Total returnb | | | 13.85% | | | | 31.72% | | | | (.61)% | | | | .76% | | | | 19.43% | |
Ratios/supplemental data | | | | | | | | | | | | | | | | | | | | |
Net assets, end of year (000’s) | | $ | 1,631,184 | | | $ | 621,001 | | | $ | 70,130 | | | $ | 9,067 | | | $ | 2,534 | |
Ratios to average net assets: | | | | | | | | | | | | | | | | | | | | |
Expenses | | | .74% | | | | .76% | | | | .78% | | | | .78% | | | | .75% | |
Net investment income | | | 5.46% | | | | 6.08% | | | | 7.15% | | | | 7.68% | d | | | 7.99% | |
Portfolio turnover rate | | | 44.02% | | | | 47.03% | | | | 62.00% | | | | 32.52% | | | | 23.92% | |
Portfolio turnover rate excluding mortgage dollar rollsc | | | 43.76% | | | | 45.50% | | | | 62.00% | | | | 32.52% | | | | 23.92% | |
| a | Based on average shares outstanding. |
| b | Total return does not include any fees, charges or expenses imposed by the variable annuity and life insurance contracts for which the Franklin Templeton Variable Insurance Products Trust serves as an underlying investment vehicle. Total return is not annualized for periods less than one year. |
| c | See Note 1(e) regarding mortgage dollar rolls. |
| d | Effective January 1, 2001, the Fund adopted the provisions of the AICPA Audit and Accounting Guide for Investment Companies and began recording all paydown gains and losses as part of investment income and amortizing all premium and discount on fixed-income securities, as required. The effect of this change was as follows: |
| | |
Net investment income per share | | $.008 |
Net realized and unrealized gains/losses per share | | (.008) |
Ratio of net investment income to average net assets | | .06% |
Per share data and ratios for prior periods have not been restated to reflect this change in the accounting policy.
See notes to financial statements.
FI-9
FRANKLIN TEMPLETON VARIABLE INSURANCE PRODUCTS TRUST
FRANKLIN INCOME SECURITIES FUND
Statement of Investments, December 31, 2004
| | | | | | | |
| | | COUNTRY | | SHARES | | VALUE |
Common Stocks 36.8% | | | | | | | |
Commercial Services .7% | | | | | | | |
Dex Media Inc. | | United States | | 600,000 | | $ | 14,976,000 |
| | | | | | |
|
|
Communications 1.8% | | | | | | | |
AT&T Corp. | | United States | | 200,000 | | | 3,812,000 |
aMCI Inc. | | United States | | 46,203 | | | 931,452 |
SBC Communications Inc. | | United States | | 600,000 | | | 15,462,000 |
Telus Corp. | | Canada | | 97,200 | | | 2,809,080 |
Telus Corp. (CAD) | | Canada | | 140,900 | | | 4,255,137 |
Verizon Communications Inc. | | United States | | 308,400 | | | 12,493,284 |
| | | | | | |
|
|
| | | | | | | | 39,762,953 |
| | | | | | |
|
|
Consumer Durables .7% | | | | | | | |
General Motors Corp. | | United States | | 370,000 | | | 14,822,200 |
| | | | | | |
|
|
Consumer Non-Durables 1.8% | | | | | | | |
Altria Group Inc. | | United States | | 200,000 | | | 12,220,000 |
General Mills Inc. | | United States | | 400,000 | | | 19,884,000 |
Loews Corp. - Carolina Group | | United States | | 227,900 | | | 6,597,705 |
| | | | | | |
|
|
| | | | | | | | 38,701,705 |
| | | | | | |
|
|
Electric Utilities 12.2% | | | | | | | |
Alliant Energy Corp. | | United States | | 400,000 | | | 11,440,000 |
Ameren Corp. | | United States | | 700,000 | | | 35,098,000 |
American Electric Power Co. Inc. | | United States | | 600,000 | | | 20,604,000 |
CenterPoint Energy Inc. | | United States | | 200,000 | | | 2,260,000 |
Cinergy Corp. | | United States | | 500,000 | | | 20,815,000 |
Dominion Resources Inc. | | United States | | 400,000 | | | 27,096,000 |
DTE Energy Co. | | United States | | 260,000 | | | 11,213,800 |
Energy East Corp. | | United States | | 300,000 | | | 8,004,000 |
Exelon Corp. | | United States | | 331,200 | | | 14,595,984 |
FirstEnergy Corp. | | United States | | 500,000 | | | 19,755,016 |
Hawaiian Electric Industries Inc. | | United States | | 120,000 | | | 3,498,000 |
Pepco Holdings Inc. | | United States | | 300,000 | | | 6,396,000 |
Pinnacle West Capital Corp. | | United States | | 100,000 | | | 4,441,000 |
PPL Corp. | | United States | | 150,000 | | | 7,992,000 |
Progress Energy Inc. | | United States | | 300,000 | | | 13,572,000 |
Public Service Enterprise Group Inc. | | United States | | 443,200 | | | 22,944,464 |
Puget Energy Inc. | | United States | | 350,000 | | | 8,645,000 |
Southern Co. | | United States | | 500,000 | | | 16,760,000 |
TECO Energy Inc. | | United States | | 200,000 | | | 3,068,000 |
Xcel Energy Inc. | | United States | | 260,000 | | | 4,732,000 |
| | | | | | |
|
|
| | | | | | | | 262,930,264 |
| | | | | | |
|
|
Energy Minerals 3.4% | | | | | | | |
BP PLC, ADR | | United Kingdom | | 225,000 | | | 13,140,000 |
Canadian Oil Sands Trust | | Canada | | 350,000 | | | 19,730,271 |
ChevronTexaco Corp. | | United States | | 400,000 | | | 21,004,000 |
aMission Resources Corp. | | United States | | 158,300 | | | 924,472 |
Royal Dutch Petroleum Co., N.Y. shs. | | Netherlands | | 313,800 | | | 18,005,844 |
aYukos Corp., ADR | | Russia | | 58,000 | | | 165,300 |
| | | | | | |
|
|
| | | | | | | | 72,969,887 |
| | | | | | |
|
|
Finance 3.2% | | | | | | | |
Bank of America Corp. | | United States | | 333,180 | | | 15,656,128 |
FI-10
FRANKLIN TEMPLETON VARIABLE INSURANCE PRODUCTS TRUST
FRANKLIN INCOME SECURITIES FUND
Statement of Investments, December 31, 2004 (cont.)
| | | | | | | |
| | | COUNTRY | | SHARES | | VALUE |
Common Stocks (cont.) | | | | | | | |
Finance (cont.) | | | | | | | |
Comerica Inc. | | United States | | 120,000 | | $ | 7,322,400 |
Fifth Third Bancorp | | United States | | 500,000 | | | 23,640,000 |
JPMorgan Chase & Co. | | United States | | 350,000 | | | 13,653,500 |
Marsh & McLennan Cos. Inc. | | United States | | 200,000 | | | 6,580,000 |
MBNA Corp. | | United States | | 100,000 | | | 2,819,000 |
| | | | | | |
|
|
| | | | | | | | 69,671,028 |
| | | | | | |
|
|
Gas Utilities 3.2% | | | | | | | |
Atmos Energy Corp. | | United States | | 610,000 | | | 16,683,500 |
KeySpan Corp. | | United States | | 250,000 | | | 9,862,500 |
NiSource Inc. | | United States | | 700,000 | | | 15,946,000 |
ONEOK Inc. | | United States | | 650,000 | | | 18,473,000 |
Sempra Energy | | United States | | 200,000 | | | 7,336,000 |
| | | | | | |
|
|
| | | | | | | | 68,301,000 |
| | | | | | |
|
|
Health Technology 6.9% | | | | | | | |
Bristol-Myers Squibb Co. | | United States | | 800,000 | | | 20,496,000 |
Johnson & Johnson | | United States | | 150,000 | | | 9,513,000 |
Merck & Co. Inc. | | United States | | 2,000,000 | | | 64,280,000 |
Pfizer Inc. | | United States | | 1,700,000 | | | 45,713,000 |
Wyeth | | United States | | 200,000 | | | 8,518,000 |
| | | | | | |
|
|
| | | | | | | | 148,520,000 |
| | | | | | |
|
|
Non-Energy Minerals .5% | | | | | | | |
AngloGold Ashanti Ltd., ADR | | South Africa | | 171,300 | | | 6,226,755 |
Barrick Gold Corp. | | Canada | | 200,000 | | | 4,844,000 |
| | | | | | |
|
|
| | | | | | | | 11,070,755 |
| | | | | | |
|
|
Process Industries .4% | | | | | | | |
Dow Chemical Co. | | United States | | 175,000 | | | 8,664,250 |
| | | | | | |
|
|
Producer Manufacturing .4% | | | | | | | |
General Electric Co. | | United States | | 250,000 | | | 9,125,000 |
| | | | | | |
|
|
Real Estate Investment Trusts 1.6% | | | | | | | |
Developers Diversified Realty Corp. | | United States | | 325,000 | | | 14,420,250 |
Glenborough Realty Trust Inc. | | United States | | 750,000 | | | 15,960,000 |
iStar Financial Inc. | | United States | | 118,500 | | | 5,363,310 |
| | | | | | |
|
|
| | | | | | | | 35,743,560 |
| | | | | | |
|
|
Total Common Stocks (Cost $660,785,471) | | | | | | | 795,258,602 |
| | | | | | |
|
|
Preferred Stock (Cost $7,620,963) | | | | | | | |
Process Industries | | | | | | | |
b,c,d,eAsia Pulp & Paper Co. Ltd., 12.00%, pfd. Perpetual | | Indonesia | | 10,073,000 | | | 109,897 |
| | | | | | |
|
|
Convertible Preferred Stocks 9.2% | | | | | | | |
Communications .5% | | | | | | | |
ALLTEL Corp., 7.75%, cvt. pfd. | | United States | | 200,000 | | | 10,578,000 |
| | | | | | |
|
|
Consumer Durables 1.6% | | | | | | | |
Ford Motor Co. Capital Trust II, 6.50%, cvt. pfd. | | United States | | 650,000 | | | 34,313,500 |
| | | | | | |
|
|
Electric Utilities .5% | | | | | | | |
Aquila Inc., 6.75%, cvt. pfd. | | United States | | 312,500 | | | 10,828,125 |
| | | | | | |
|
|
FI-11
FRANKLIN TEMPLETON VARIABLE INSURANCE PRODUCTS TRUST
FRANKLIN INCOME SECURITIES FUND
Statement of Investments, December 31, 2004 (cont.)
| | | | | | | | |
| | | COUNTRY | | SHARES | | VALUE |
Convertible Preferred Stocks (cont.) | | | | | | | | |
Electronic Technology 1.2% | | | | | | | | |
Goldman Sachs Group into Applied Materials Inc., 7.35%, cvt. pfd. | | United States | | | 500,000 | | $ | 8,409,500 |
Lehman Brothers Holdings into Solectron Corp., 7.00%, cvt. pfd. | | United States | | | 300,000 | | | 6,369,000 |
Morgan Stanley Into Intel Corp., 6.50%, cvt. pfd. | | United States | | | 500,000 | | | 10,855,000 |
| | | | | | | |
|
|
| | | | | | | | | 25,633,500 |
| | | | | | | |
|
|
Energy Minerals .3% | | | | | | | | |
Chesapeake Energy Corp., 4.125%, cvt. pfd., 144A | | United States | | | 5,000 | | | 5,818,750 |
Unocal Corp., 6.25%, cvt. pfd. | | United States | | | 25,001 | | | 1,290,676 |
| | | | | | | |
|
|
| | | | | | | | | 7,109,426 |
| | | | | | | |
|
|
Finance 2.2% | | | | | | | | |
FNMA, 5.375%, cvt. pfd. | | United States | | | 200 | | | 21,172,500 |
Genworth Financial Inc., 6.00%, cvt. pfd., A | | United States | | | 250,000 | | | 8,086,500 |
Travelers Property Casualty Corp., junior sub. note, 4.50%, cvt. pfd. | | United States | | | 225,000 | | | 5,181,750 |
Unumprovident Corp., 8.25%, cvt. pfd. | | United States | | | 450,000 | | | 13,654,350 |
| | | | | | | |
|
|
| | | | | | | | | 48,095,100 |
| | | | | | | |
|
|
Health Technology 1.0% | | | | | | | | |
Citigroup Global Markets into Wye Elks, 6.00%, cvt. pfd. | | United States | | | 100,000 | | | 4,137,500 |
Schering-Plough Corp., 6.00%, cvt. pfd. | | United States | | | 300,000 | | | 16,830,000 |
| | | | | | | |
|
|
| | | | | | | | | 20,967,500 |
| | | | | | | |
|
|
Industrial Services .4% | | | | | | | | |
Allied Waste Industries Inc., 6.25%, cvt. pfd. | | United States | | | 77,500 | | | 4,085,025 |
Lehman Brothers Holdings Inc. into Weatherford International, 6.00%, cvt. pfd. | | United States | | | 100,000 | | | 4,959,000 |
| | | | | | | |
|
|
| | | | | | | | | 9,044,025 |
| | | | | | | |
|
|
Real Estate Investment Trusts 1.5% | | | | | | | | |
Felcor Lodging Trust Inc., 7.80%, cvt. pfd., A | | United States | | | 300,000 | | | 7,608,000 |
Glenborough Realty Trust Inc., 7.75%, cvt. pfd., A | | United States | | | 141,048 | | | 3,582,619 |
Host Marriott Corp., 6.75%, cvt. pfd. | | United States | | | 175,500 | | | 9,946,112 |
Lexington Corp Properties Trust, cvt. pfd. | | United States | | | 200,000 | | | 10,170,000 |
| | | | | | | |
|
|
| | | | | | | | | 31,306,731 |
| | | | | | | |
|
|
Total Convertible Preferred Stocks (Cost $177,352,465) | | | | | | | | 197,875,907 |
| | | | | | | |
|
|
| | | |
| | | | | PRINCIPAL
AMOUNTf
| | |
Bonds 28.7% | | | | | | | | |
Alternative Power Generation 4.4% | | | | | | | | |
Calpine Canada Energy Finance, senior note, 8.50%, 5/01/08 | | Canada | | $ | 25,000,000 | | | 20,625,000 |
Calpine Corp., senior note, 8.625%, 8/15/10 | | United States | | | 12,700,000 | | | 9,779,000 |
Calpine Corp., senior note, 8.50%, 2/15/11 | | United States | | | 16,900,000 | | | 12,970,750 |
Calpine Corp., senior secured note, 144A, 8.75%, 7/15/13 | | United States | | | 20,000,000 | | | 16,600,000 |
Dynegy Holdings Inc., senior note, 6.875%, 4/01/11 | | United States | | | 15,000,000 | | | 14,512,500 |
Dynegy Holdings Inc., senior note, 8.75%, 2/15/12 | | United States | | | 11,085,000 | | | 11,666,962 |
Dynegy Holdings Inc., senior secured note, 144A, 10.125%, 7/15/13 | | United States | | | 8,000,000 | | | 9,200,000 |
| | | | | | | |
|
|
| | | | | | | | | 95,354,212 |
| | | | | | | |
|
|
Communications 2.5% | | | | | | | | |
Qwest Capital Funding, 7.00%, 8/03/09 | | United States | | | 10,000,000 | | | 9,925,000 |
Qwest Capital Funding, 7.25%, 2/15/11 | | United States | | | 20,000,000 | | | 19,700,000 |
Qwest Communications International Inc., senior note, 144A, 7.50%, 2/15/14 | | United States | | | 6,000,000 | | | 6,090,000 |
Qwest Corp., 6.875%, 9/15/33 | | United States | | | 5,400,000 | | | 4,995,000 |
Time Warner Telecom Inc., senior note, 10.125%, 2/01/11 | | United States | | | 2,900,000 | | | 2,863,750 |
Time Warner Telecom Holdings Inc., senior note, 9.25%, 2/15/14 | | United States | | | 11,000,000 | | | 11,275,000 |
| | | | | | | |
|
|
| | | | | | | | | 54,848,750 |
| | | | | | | |
|
|
FI-12
FRANKLIN TEMPLETON VARIABLE INSURANCE PRODUCTS TRUST
FRANKLIN INCOME SECURITIES FUND
Statement of Investments, December 31, 2004 (cont.)
| | | | | | | | |
| | | COUNTRY | | PRINCIPAL
AMOUNTf | | VALUE |
Bonds (cont.) | | | | | | | | |
Consumer Durables 1.0% | | | | | | | | |
Ford Motor Co., 7.45%, 7/16/31 | | United States | | $ | 10,000,000 | | $ | 10,086,450 |
General Motors Corp., senior deb., 8.375%, 7/15/33 | | United States | | | 10,000,000 | | | 10,389,520 |
| | | | | | | |
|
|
| | | | | | | | | 20,475,970 |
| | | | | | | |
|
|
Consumer Services 2.3% | | | | | | | | |
Cablevision Systems Corp., senior note, 144A, 8.00%, 4/15/12 | | United States | | | 19,400,000 | | | 20,806,500 |
Charter Communications Holdings LLC, senior note, 8.625%, 4/01/09 | | United States | | | 5,000,000 | | | 4,362,500 |
Charter Communications Holdings LLC, senior note, 10.75%, 10/01/09 | | United States | | | 20,000,000 | | | 18,300,000 |
Charter Communications Holdings LLC, senior disc. note, 9.92%, 4/01/11 | | United States | | | 5,000,000 | | | 4,287,500 |
Young Broadcasting Inc., senior sub. note, 10.00%, 3/01/11 | | United States | | | 1,427,000 | | | 1,530,457 |
| | | | | | | |
|
|
| | | | | | | | | 49,286,957 |
| | | | | | | |
|
|
Electric Utilities 4.1% | | | | | | | | |
Allegheny Energy Supply Co. LLC, 144A, 8.25%, 4/15/12 | | United States | | | 10,000,000 | | | 11,225,000 |
Aquila Inc., senior note, 14.875%, 7/01/12 | | United States | | | 16,000,000 | | | 22,500,000 |
Edison Mission Energy, senior note, 7.73%, 6/15/09 | | United States | | | 10,000,000 | | | 10,800,000 |
FirstEnergy Corp., 6.45%, 11/15/11 | | United States | | | 4,000,000 | | | 4,351,940 |
Midwest Generation LLC, senior secured note, 8.75%, 5/01/34 | | United States | | | 3,700,000 | | | 4,218,000 |
Pacific Gas & Electric Co., 6.05%, 3/01/34 | | United States | | | 14,400,000 | | | 15,008,184 |
TXU Corp., 144A, 5.55%, 11/15/14 | | United States | | | 10,000,000 | | | 9,952,760 |
TXU Corp., 144A, 6.55%, 11/15/34 | | United States | | | 10,000,000 | | | 9,935,370 |
| | | | | | | |
|
|
| | | | | | | | | 87,991,254 |
| | | | | | | |
|
|
Electronic Technology 1.1% | | | | | | | | |
Lucent Technologies, 6.45%, 3/15/29 | | United States | | | 10,400,000 | | | 9,464,000 |
PanAmSat Corp., 6.875%, 1/15/28 | | United States | | | 2,500,000 | | | 2,365,625 |
Xerox Corp., senior note, 6.875%, 8/15/11 | | United States | | | 11,200,000 | | | 11,984,000 |
| | | | | | | |
|
|
| | | | | | | | | 23,813,625 |
| | | | | | | |
|
|
Energy Minerals .7% | | | | | | | | |
Chesapeake Energy Corp., senior note, 144A, 6.375%, 6/15/15 | | United States | | | 6,900,000 | | | 7,124,250 |
Mission Resources Corp., senior note, 9.875%, 4/01/11 | | United States | | | 8,000,000 | | | 8,580,000 |
| | | | | | | |
|
|
| | | | | | | | | 15,704,250 |
| | | | | | | |
|
|
Finance 1.6% | | | | | | | | |
E*TRADE Financial Corp., senior note, 144A, 8.00%, 6/15/11 | | United States | | | 15,000,000 | | | 16,200,000 |
Ford Motor Credit Co., 7.00%, 10/01/13 | | United States | | | 8,000,000 | | | 8,494,960 |
General Motors Acceptance Corp., 6.75%, 12/01/14 | | United States | | | 10,000,000 | | | 10,031,570 |
| | | | | | | |
|
|
| | | | | | | | | 34,726,530 |
| | | | | | | |
|
|
Health Services 2.0% | | | | | | | | |
HCA Inc., 6.375%, 1/15/15 | | United States | | | 5,000,000 | | | 5,029,460 |
HealthSouth Corp., senior note, 7.625%, 6/01/12 | | United States | | | 3,900,000 | | | 3,939,000 |
Tenet Healthcare Corp., senior note, 6.375%, 12/01/11 | | United States | | | 25,000,000 | | | 23,312,500 |
Tenet Healthcare Corp., senior note, 7.375%, 2/01/13 | | United States | | | 10,000,000 | | | 9,750,000 |
| | | | | | | |
|
|
| | | | | | | | | 42,030,960 |
| | | | | | | |
|
|
Industrial Services 3.3% | | | | | | | | |
Allied Waste North America Inc., senior secured note, 6.125%, 2/15/14 | | United States | | | 10,000,000 | | | 9,450,000 |
Allied Waste North America Inc., senior note, B, 7.375%, 4/15/14 | | United States | | | 13,000,000 | | | 12,512,500 |
El Paso Energy senior note, 6.75%, 5/15/09 | | United States | | | 15,000,000 | | | 15,300,000 |
El Paso Energy senior note, 7.375%, 12/15/12 | | United States | | | 4,000,000 | | | 4,070,000 |
FI-13
FRANKLIN TEMPLETON VARIABLE INSURANCE PRODUCTS TRUST
FRANKLIN INCOME SECURITIES FUND
Statement of Investments, December 31, 2004 (cont.)
| | | | | | | | |
| | | COUNTRY | | PRINCIPAL
AMOUNTf | | VALUE |
Bonds (cont.) | | | | | | | | |
Industrial Services (cont.) | | | | | | | | |
El Paso Energy senior note, MTN, 7.80%, 8/01/31 | | United States | | $ | 20,000,000 | | $ | 19,300,000 |
El Paso Production Holdings, 7.75%, 6/01/13 | | United States | | | 10,000,000 | | | 10,525,000 |
| | | | | | | |
|
|
| | | | | | | | | 71,157,500 |
| | | | | | | |
|
|
Non-Energy Minerals .5% | | | | | | | | |
Ispat Inland ULC, senior secured note, 9.75%, 4/01/14 | | United States | | | 9,433,000 | | | 11,692,204 |
| | | | | | | |
|
|
Process Industries 2.1% | | | | | | | | |
Equistar Chemicals LP, senior note, 10.125%, 9/01/08 | | United States | | | 3,600,000 | | | 4,167,000 |
Lyondell Chemical Co., senior secured note, 10.50%, 6/01/13 | | United States | | | 11,500,000 | | | 13,742,500 |
Rhodia SA, senior note, 10.25%, 6/01/10 | | France | | | 25,000,000 | | | 28,250,000 |
| | | | | | | |
|
|
| | | | | | | | | 46,159,500 |
| | | | | | | |
|
|
Producer Manufacturing 1.1% | | | | | | | | |
Case New Holland Inc., senior note, 144A, 6.00%, 6/01/09 | | United States | | | 15,000,000 | | | 14,700,000 |
Invensys PLC, senior note, 144A, 9.875%, 3/15/11 | | United Kingdom | | | 9,000,000 | | | 9,720,000 |
| | | | | | | |
|
|
| | | | | | | | | 24,420,000 |
| | | | | | | |
|
|
Real Estate Investment Trusts .8% | | | | | | | | |
HMH Properties Inc., senior secured note, 7.875%, 8/01/08 | | United States | | | 896,000 | | | 925,120 |
Host Marriott LP, senior note, 7.125%, 11/01/13 | | United States | | | 5,000,000 | | | 5,368,750 |
Meristar Hospitality Corp., 9.125%, 1/15/11 | | United States | | | 10,000,000 | | | 10,850,000 |
| | | | | | | |
|
|
| | | | | | | | | 17,143,870 |
| | | | | | | |
|
|
Technology Services .5% | | | | | | | | |
Electronic Data Systems Corp., B, 6.50%, 8/01/13 | | United States | | | 10,000,000 | | | 10,576,290 |
| | | | | | | |
|
|
Transportation .7% | | | | | | | | |
American Airlines, 9.71%, 1/02/07 | | United States | | | 6,184,173 | | | 5,828,119 |
Delta Air Lines, 7.70%, 12/15/05 | | United States | | | 11,000,000 | | | 10,230,000 |
| | | | | | | |
|
|
| | | | | | | | | 16,058,119 |
| | | | | | | |
|
|
Total Bonds (Cost $568,762,524) | | | | | | | | 621,439,991 |
| | | | | | | |
|
|
Convertible Bonds 3.6% | | | | | | | | |
Communications .4% | | | | | | | | |
Nextel Communications Inc., cvt., 5.25%, 1/15/10 | | United States | | | 9,000,000 | | | 9,258,750 |
| | | | | | | |
|
|
Consumer Services 1.2% | | | | | | | | |
Six Flags Inc., cvt., 4.50%, 5/15/15 | | United States | | | 22,000,000 | | | 24,860,000 |
| | | | | | | |
|
|
Electronic Technology .5% | | | | | | | | |
Conexant Systems Inc., cvt., 4.00%, 2/01/07 | | United States | | | 7,000,000 | | | 6,335,000 |
SCI Systems Inc., cvt., sub. note, 3.00%, 3/15/07 | | United States | | | 5,100,000 | | | 4,947,000 |
| | | | | | | |
|
|
| | | | | | | | | 11,282,000 |
| | | | | | | |
|
|
Health Technology .2% | | | | | | | | |
Enzon Pharmaceuticals Inc., cvt., 4.50%, 7/01/08 | | United States | | | 5,000,000 | | | 4,725,000 |
| | | | | | | |
|
|
Industrial Services .5% | | | | | | | | |
Hanover Compressor Co., cvt., 4.75%, 3/15/08 | | United States | | | 10,000,000 | | | 9,750,000 |
| | | | | | | |
|
|
Real Estate Investment Trusts .8% | | | | | | | | |
Host Marriott LP, cvt., 144A, 3.25%, 3/15/24 | | United States | | | 10,000,000 | | | 11,520,400 |
FI-14
FRANKLIN TEMPLETON VARIABLE INSURANCE PRODUCTS TRUST
FRANKLIN INCOME SECURITIES FUND
Statement of Investments, December 31, 2004 (cont.)
| | | | | | | | |
| | | COUNTRY | | PRINCIPAL
AMOUNTf | | VALUE |
Convertible Bonds (cont.) | | | | | | | | |
Real Estate Investment Trusts (cont.) | | | | | | | | |
Meristar Hospitality Corp., cvt., 9.50%, 4/01/10 | | United States | | $ | 4,500,000 | | $ | 5,953,500 |
| | | | | | | |
|
|
| | | | | | | | | 17,473,900 |
| | | | | | | |
|
|
Total Convertible Bonds (Cost $69,561,078) | | | | | | | | 77,349,650 |
| | | | | | | |
|
|
Zero Coupon/Step-Up Bonds 5.1% | | | | | | | | |
Commercial Services .3% | | | | | | | | |
JohnsonDiversey Holdings Inc., senior disc. note, zero cpn. to 5/17/07, 10.67% thereafter, 5/15/13 | | United States | | | 8,800,000 | | | 7,656,000 |
| | | | | | | |
|
|
Consumer Services 2.8% | | | | | | | | |
Charter Communications Holdings LLC, senior disc. note, zero cpn. to 1/15/05, 11.75% thereafter, 1/15/10 | | United States | | | 2,000,000 | | | 1,875,000 |
Charter Communications Holdings LLC, senior disc. note, zero cpn. to 1/15/06, 13.50% thereafter, 1/15/11 | | United States | | | 25,500,000 | | | 21,547,500 |
Dex Media Inc., senior disc. note, zero cpn. to 11/15/08, 9.00% thereafter, 11/15/13 | | United States | | | 12,500,000 | | | 9,859,375 |
Dex Media Inc., zero cpn. to 11/15/08, 9.00% thereafter, 11/15/13 | | United States | | | 10,000,000 | | | 7,887,500 |
Quebecor Media Inc., senior disc. note, zero cpn. to 7/15/06, 13.75% thereafter, 7/15/11 | | Canada | | | 3,300,000 | | | 3,283,500 |
Telenet Group Holding NV, senior note, 144A, zero cpn. to 12/15/08, 11.50% thereafter, 6/15/14 | | Belgium | | | 20,000,000 | | | 15,300,000 |
| | | | | | | |
|
|
| | | | | | | | | 59,752,875 |
| | | | | | | |
|
|
Finance 1.0% | | | | | | | | |
Nalco Finance Holdings, senior note, zero cpn. to 8/01/09, 9.00% thereafter, 2/01/14 | | United States | | | 28,473,000 | | | 21,212,385 |
| | | | | | | |
|
|
Industrial Services .2% | | | | | | | | |
Hanover Compressor Co., sub. note, zero cpn., 3/31/07 | | United States | | | 5,000,000 | | | 4,375,000 |
| | | | | | | |
|
|
Process Industries .8% | | | | | | | | |
Huntsman ICI Holdings LLC, senior disc. note, zero cpn., 12/31/09 | | United States | | | 30,000,000 | | | 16,950,000 |
| | | | | | | |
|
|
Total Zero Coupon/Step-Up Bonds (Cost $99,181,359) | | | | | | | | 109,946,260 |
| | | | | | | |
|
|
Agency Bonds 3.5% | | | | | | | | |
Federal Home Loan Mortgage Corp. (FHLMC) Fixed Rate 2.2% | | | | | | | | |
FHLMC Gold 30 Year, 5.00%, 7/01/33 - 11/01/33 | | United States | | | 45,273,277 | | | 45,067,543 |
FHLMC Gold 30 Year, 6.00%, 3/01/33 - 11/01/33 | | United States | | | 2,566,197 | | | 2,655,033 |
| | | | | | | |
|
|
| | | | | | | | | 47,722,576 |
| | | | | | | |
|
|
Federal National Mortgage Association (FNMA) Fixed Rate .4% | | | | | | | | |
FNMA 30 Year, 6.50%, 5/01/31 - 8/01/32 | | United States | | | 8,806,469 | | | 9,351,455 |
| | | | | | | |
|
|
Government National Mortgage Association (GNMA) Fixed Rate .9% | | | | | | | | |
GNMA I SF 30 Year, 5.00%, 3/15/34 | | United States | | | 14,086,168 | | | 14,086,168 |
GNMA I SF 25 Year, 6.00%, 1/15/29 | | United States | | | 172,895 | | | 179,747 |
GNMA I SF 27 Year, 6.00%, 12/15/31 | | United States | | | 90,544 | | | 94,027 |
GNMA I SF 28 Year, 6.00%, 5/15/32 - 11/15/32 | | United States | | | 4,354,085 | | | 4,519,325 |
| | | | | | | |
|
|
| | | | | | | | | 18,879,267 |
| | | | | | | |
|
|
Total Agency Bonds (Cost $74,994,384) | | | | | | | | 75,953,298 |
| | | | | | | |
|
|
Municipal Bonds .4% | | | | | | | | |
California State GO, 5.125%, 4/01/25 | | United States | | | 5,000,000 | | | 5,233,750 |
California State GO, 5.00%, 2/01/33 | | United States | | | 4,400,000 | | | 4,476,912 |
| | | | | | | |
|
|
Total Municipal Bonds (Cost $9,270,198) | | | | | | | | 9,710,662 |
| | | | | | | |
|
|
Total Investments before Repurchase Agreement (Cost $1,667,528,442) | | | | | | | | 1,887,644,267 |
| | | | | | | |
|
|
FI-15
FRANKLIN TEMPLETON VARIABLE INSURANCE PRODUCTS TRUST
FRANKLIN INCOME SECURITIES FUND
Statement of Investments, December 31, 2004 (cont.)
| | | | | | |
| | | PRINCIPAL
AMOUNTf | | VALUE |
Repurchase Agreement (Cost $243,826,397) 11.3% | | | | | | |
gJoint Repurchase Agreement, 1.915%, 1/03/05 (Maturity Value $243,865,308) | | $ | 243,826,397 | | $ | 243,826,397 |
ABN AMRO Bank, N.V., New York Branch (Maturity Value $24,076,822) Banc of America Securities LLC (Maturity Value $9,027,893) Barclays Capital Inc. (Maturity Value $11,134,890) Bear, Stearns & Co. Inc. (Maturity Value $18,960,528) BNP Paribas Securities Corp. (Maturity Value $24,076,822) Deutsche Bank Securities Inc. (Maturity Value $12,039,630) Goldman, Sachs & Co. (Maturity Value $24,076,822) Greenwich Capital Markets Inc. (Maturity Value $24,076,822) Lehman Brothers Inc. (Maturity Value $24,164,613) Merrill Lynch Government Securities Inc. (Maturity Value $24,076,822) Morgan Stanley & Co. Inc. (Maturity Value $24,076,822) UBS Securities LLC (Maturity Value $24,076,822)
| | | | | | |
Collateralized by U.S. Government Agency Securities, 0.00 - 7.125%, 1/05/05 - 9/15/09;
hU.S. Treasury Bills, 3/25/05 - 3/31/05; U.S. Treasury Bonds, 9.375 - 12.00%, 5/15/05 - 2/15/06; and U.S. Treasury Notes, 1.50 - 7.00%, 2/28/05 - 6/15/09 | | | | | | |
| | | | | |
|
|
Total Investments (Cost $1,911,354,839) 98.6% | | | | | | 2,131,470,664 |
Other Assets, less Liabilities 1.4% | | | | | | 30,455,079 |
| | | | | |
|
|
Net Assets 100.0% | | | | | $ | 2,161,925,743 |
| | | | | |
|
|
Portfolio Abbreviations:
ADR - American Depository Receipt
MTN - Medium Term Notes
| b | Defaulted securities. See Note 7. |
| c | See Note 8 regarding restricted securities. |
| d | See Note 9 regarding other considerations. |
| e | Subject to certain terms and conditions, the Fund has agreed to sell its holdings in Asia Pulp & Paper and its subsidiaries in November 2006. |
| f | The principal amount is stated in U.S. dollars unless otherwise indicated. |
| g | See Note 1(c) regarding joint repurchase agreement. |
| h | Security is traded on a discount basis with a zero coupon. |
FI-16
FRANKLIN TEMPLETON VARIABLE INSURANCE PRODUCTS TRUST
FRANKLIN INCOME SECURITIES FUND
Financial Statements
Statement of Assets and Liabilities
December 31, 2004
| | | | |
Assets: | | | | |
Investments in securities: | | | | |
Cost - Unaffiliated issuers | | $ | 1,667,528,442 | |
Cost - Repurchase agreements | | | 243,826,397 | |
| | |
|
|
|
Total cost of investments | | | 1,911,354,839 | |
| | |
|
|
|
Value - Unaffiliated issuers | | | 1,887,644,267 | |
Value - Repurchase agreements | | | 243,826,397 | |
| | |
|
|
|
Total value of investments | | | 2,131,470,664 | |
| | |
|
|
|
Cash | | | 24,122 | |
Receivables: | | | | |
Investment securities sold | | | 20,726,573 | |
Capital shares sold | | | 4,796,466 | |
Dividends and Interest | | | 17,652,995 | |
| | |
|
|
|
Total assets | | | 2,174,670,820 | |
| | |
|
|
|
Liabilities: | | | | |
Payables: | | | | |
Investment securities purchased | | | 5,397,415 | |
Funds advanced by custodian | | | 5,041,840 | |
Capital shares redeemed | | | 1,056,276 | |
Affiliates | | | 1,144,819 | |
Other liabilities | | | 104,727 | |
| | |
|
|
|
Total liabilities | | | 12,745,077 | |
| | |
|
|
|
Net assets, at value | | $ | 2,161,925,743 | |
| | |
|
|
|
Net assets consist of: | | | | |
Undistributed net investment income | | $ | 87,092,537 | |
Net unrealized appreciation (depreciation) | | | 220,116,038 | |
Accumulated net realized gain (loss) | | | (3,555,695 | ) |
Capital shares | | | 1,858,272,863 | |
| | |
|
|
|
Net assets, at value | | $ | 2,161,925,743 | |
| | |
|
|
|
Class 1: | | | | |
Net assets, at value | | $ | 530,742,214 | |
| | |
|
|
|
Shares outstanding | | | 33,408,097 | |
| | |
|
|
|
Net asset value and offering price per share | | $ | 15.89 | |
| | |
|
|
|
Class 2: | | | | |
Net assets, at value | | $ | 1,631,183,529 | |
| | |
|
|
|
Shares outstanding | | | 104,071,595 | |
| | |
|
|
|
Net asset value and offering price per share | | $ | 15.67 | |
| | |
|
|
|
See notes to financial statements.
FI-17
FRANKLIN TEMPLETON VARIABLE INSURANCE PRODUCTS TRUST
FRANKLIN INCOME SECURITIES FUND
Financial Statements (continued)
Statement of Operations
for the year ended December 31, 2004
| | | | |
Investment income: | | | | |
Dividends | | $ | 30,644,214 | |
Interest | | | 66,631,992 | |
| | |
|
|
|
Total investment income | | | 97,276,206 | |
| | |
|
|
|
Expenses: | | | | |
Management fees (Note 3) | | | 7,292,644 | |
Distribution fees - Class 2 (Note 3) | | | 2,618,946 | |
Transfer agent fees | | | 12,991 | |
Custodian fees (Note 4) | | | 32,780 | |
Reports to shareholders | | | 222,942 | |
Professional fees | | | 72,581 | |
Trustees’ fees and expenses | | | 8,890 | |
Other | | | 75,863 | |
| | |
|
|
|
Total expenses | | | 10,337,637 | |
Expense reductions (Note 4) | | | (825 | ) |
| | |
|
|
|
Net expenses | | | 10,336,812 | |
| | |
|
|
|
Net investment income | | | 86,939,394 | |
| | |
|
|
|
Realized and unrealized gains (losses): | | | | |
Net realized gain (loss) from: | | | | |
Investments | | | 40,715,718 | |
Foreign currency transactions | | | 57,115 | |
| | |
|
|
|
Net realized gain (loss) | | | 40,772,833 | |
| | |
|
|
|
Net change in unrealized appreciation (depreciation) on: | | | | |
Investments | | | 104,785,863 | |
Translation of assets and liabilities denominated in foreign currencies | | | 213 | |
| | |
|
|
|
Net change in unrealized appreciation (depreciation) | | | 104,786,076 | |
| | |
|
|
|
Net realized and unrealized gain (loss) | | | 145,558,909 | |
| | |
|
|
|
Net increase (decrease) in net assets resulting from operations | | $ | 232,498,303 | |
| | |
|
|
|
See notes to financial statements.
FI-18
FRANKLIN TEMPLETON VARIABLE INSURANCE PRODUCTS TRUST
FRANKLIN INCOME SECURITIES FUND
Financial Statements (continued)
Statements of Changes in Net Assets
for the years ended December 31, 2004 and 2003
| | | | | | | | |
| | | 2004 | | | 2003 | |
| | |
| |
Increase (decrease) in net assets: | | | | | | | | |
Operations: | | | | | | | | |
Net investment income | | $ | 86,939,394 | | | $ | 48,057,468 | |
Net realized gain (loss) from investments and foreign currency transactions | | | 40,772,833 | | | | (19,627,154 | ) |
Net change in unrealized appreciation (depreciation) on investments and translation of assets and liabilities denominated in foreign currencies | | | 104,786,076 | | | | 195,311,896 | |
| | |
| |
Net increase (decrease) in net assets resulting from operations | | | 232,498,303 | | | | 223,742,210 | |
Distributions to shareholders from: | | | | | | | | |
Net investment income: | | | | | | | | |
Class 1 | | | (16,732,026 | ) | | | (25,944,365 | ) |
Class 2 | | | (31,567,787 | ) | | | (12,475,273 | ) |
| | |
| |
Total distributions to shareholders | | | (48,299,813 | ) | | | (38,419,638 | ) |
Capital share transactions: (Note 2) | | | | | | | | |
Class 1 | | | (58,818,294 | ) | | | (330,826 | ) |
Class 2 | | | 877,594,642 | | | | 476,792,986 | |
| | |
| |
Total capital share transactions | | | 818,776,348 | | | | 476,462,160 | |
Net increase (decrease) in net assets | | | 1,002,974,838 | | | | 661,784,732 | |
Net assets: | | | | | | | | |
Beginning of year | | | 1,158,950,905 | | | | 497,166,173 | |
| | |
| |
End of year | | $ | 2,161,925,743 | | | $ | 1,158,950,905 | |
| | |
| |
Undistributed net investment income included in net assets: | | | | | | | | |
End of year | | $ | 87,092,537 | | | $ | 41,582,064 | |
| | |
| |
See notes to financial statements.
FI-19
FRANKLIN TEMPLETON VARIABLE INSURANCE PRODUCTS TRUST
FRANKLIN INCOME SECURITIES FUND
Notes to Financial Statements
1. ORGANIZATION AND SIGNIFICANT ACCOUNTING POLICIES
Franklin Templeton Variable Insurance Products Trust (the Trust) is registered under the Investment Company Act of 1940 as an open-end investment company, consisting of twenty-one separate series (the Funds). The Franklin Income Securities Fund (the Fund) included in this report is diversified. The financial statements of the remaining funds in the series are presented separately. Shares of the Fund are sold only to insurance company separate accounts to fund the benefits of variable life insurance policies or variable annuity contracts. As of December 31, 2004, over 60% of the Fund’s shares were sold through one insurance company. The Fund’s investment objective is growth and income.
The following summarizes the Fund’s significant accounting policies.
a. Security Valuation
Securities listed on a securities exchange or on the NASDAQ National Market System are valued at the last quoted sale price or the official closing price of the day, respectively. Over-the-counter securities and listed securities for which there is no reported sale, are valued within the range of the most recent quoted bid and ask prices. Securities that trade in multiple markets or on multiple exchanges are valued according to the broadest and most representative market. Repurchase agreements are valued at cost.
Corporate debt securities, mortgage pass-through securities, other mortgage-backed securities, collateralized mortgage obligations and asset-backed securities generally trade in the over-the-counter market rather than on a securities exchange. The Trust may utilize independent pricing services, quotations from bond dealers, and information with respect to bond and note transactions, to assist in determining a current market value for each security. The Trust’s pricing services may use valuation models or matrix pricing which considers information with respect to comparable bond and note transactions, quotations from bond dealers, or by reference to other securities that are considered comparable in such characteristics as rating, interest rate and maturity date, option adjusted spread models, prepayment projections, interest rate spreads and yield curves, to determine current value.
Foreign securities are valued as of the close of trading on the foreign stock exchange on which the security is primarily traded, or the NYSE, whichever is earlier. The value is then converted into its U.S. dollar equivalent at the foreign exchange rate in effect at the close of the NYSE on the day that the value of the foreign security is determined. If no sale is reported at that time, the foreign security will be valued within the range of the most recent quoted bid and ask prices.
The Trust has procedures to determine the fair value of individual securities and other assets for which market prices are not readily available or which may not be reliably priced. Some methods for valuing these securities may include: fundamental analysis, matrix pricing, discounts from market prices of similar securities, or discounts applied due to the nature and duration of restrictions on the disposition of the securities. Occasionally events occur between the time at which trading in a security is completed and the close of the NYSE that might call into question the availability (including the reliability) of the value of a portfolio security held by the Fund. If such an event occurs, the securities may be valued using fair value procedures, which may include the use of independent pricing services. All security valuation procedures are approved by the Trust’s Board of Trustees.
b. Foreign Currency Translation
Portfolio securities and other assets and liabilities denominated in foreign currencies are translated into U.S. dollars based on the exchange rate of such currencies against U.S. dollars on the date of valuation. Purchases and sales of securities, income and expense items denominated in foreign currencies are translated into U.S. dollars at the exchange rate in effect on the transaction date. Occasionally events may impact the availability or reliability of foreign exchange rates used to convert the U.S. dollar
equivalent value. If such an event occurs, the foreign exchange rate will be valued at fair value using procedures established and approved by the Trust’s Board of Trustees.
The Fund does not separately report the effect of changes in foreign exchange rates from changes in market prices on securities held. Such changes are included in net realized and unrealized gain or loss from investments on the Statement of Operations.
FI-20
FRANKLIN TEMPLETON VARIABLE INSURANCE PRODUCTS TRUST
FRANKLIN INCOME SECURITIES FUND
Notes to Financial Statements (continued)
1. ORGANIZATION AND SIGNIFICANT ACCOUNTING POLICIES (cont.)
b. Foreign Currency Translation (cont.)
Realized foreign exchange gains or losses arise from sales of foreign currencies, currency gains or losses realized between the trade and settlement dates on securities transactions and the difference between the recorded amounts of dividends, interest, and foreign withholding taxes and the U.S. dollar equivalent of the amounts actually received or paid. Net unrealized foreign exchange gains and losses arise from changes in foreign exchange rates on foreign denominated assets and liabilities other than investments in securities held at the end of the reporting period.
c. Joint Repurchase Agreement
The Fund may enter into a joint repurchase agreement whereby its uninvested cash balance is deposited into a joint cash account to be used to invest in one or more repurchase agreements. The value and face amount of the joint repurchase agreement are allocated to the Fund based on its pro-rata interest. A repurchase agreement is accounted for as a loan by the Fund to the seller, collateralized by securities which are delivered to the Fund’s custodian. The market value, including accrued interest, of the initial collateralization is required to be at least 102% of the dollar amount invested by the Fund, with the value of the underlying securities marked to market daily to maintain coverage of at least 100%. At December 31, 2004, all repurchase agreements held by the Fund had been entered into on that date.
d. Foreign Currency Contracts
When the Fund purchases or sells foreign securities it may enter into foreign exchange contracts to minimize foreign exchange risk from the trade date to the settlement date of the transactions. A foreign exchange contract is an agreement between two parties to exchange different currencies at an agreed upon exchange rate on a specified date. Realized and unrealized gains and losses on these contracts are included in the Statement of Operations.
The risks of these contracts include movement in the values of the foreign currencies relative to the U.S. dollar and the possible inability of the counterparties to fulfill their obligations under the contracts.
e. Mortgage Dollar Rolls
The Fund enters into mortgage dollar rolls, typically on a TBA basis. Dollar rolls are agreements between the Fund and a financial institution to simultaneously sell and repurchase a mortgage-backed security at a future date. Gains or losses are realized at the time of the sale and the difference between the repurchase price and sale price is recorded as an unrealized gain to the Fund. The risks of mortgage dollar roll transactions include the potential inability of the counterparties to fulfill their obligations.
f. Income Taxes
No provision has been made for U.S. income taxes because the Fund’s policy is to qualify as a regulated investment company under Subchapter M of the Internal Revenue Code and to distribute substantially all of its taxable income. Fund distributions to shareholders are determined on an income tax basis and may differ from net investment income and realized gains for financial reporting purposes.
g. Security Transactions, Investment Income, Expenses and Distributions
Security transactions are accounted for on trade date. Realized gains and losses on security transactions are determined on a specific identification basis. Interest income and estimated expenses are accrued daily. Discounts and premiums on securities purchased are amortized over the lives of the respective securities. Dividend income and distributions to shareholders are recorded on the ex-dividend date.
FI-21
FRANKLIN TEMPLETON VARIABLE INSURANCE PRODUCTS TRUST
FRANKLIN INCOME SECURITIES FUND
Notes to Financial Statements (continued)
1. ORGANIZATION AND SIGNIFICANT ACCOUNTING POLICIES (cont.)
g. Security Transactions, Investment Income, Expenses and Distributions (cont.)
Common expenses incurred by the Trust are allocated among the funds based on the ratio of net assets of each fund to the combined net assets. Other expenses are charged to each fund on a specific identification basis.
Distributions received by the Fund from securities may be a return of capital (ROC). Such distributions reduce the cost basis of the securities, and any distributions in excess of the cost basis are recognized as capital gains.
Realized and unrealized gains and losses and net investment income, other than class specific expenses, are allocated daily to each class of shares based upon the relative proportion of net assets of each class.
h. Accounting Estimates
The preparation of financial statements in accordance with accounting principles generally accepted in the United States of America requires management to make estimates and assumptions that affect the reported amounts of assets and liabilities at the date of the financial statements and the amounts of income and expenses during the reporting period. Actual results could differ from those estimates.
i. Guarantees and Indemnifications
Under the Trust’s organizational documents, its officers and trustees are indemnified by the Trust against certain liability arising out of the performance of their duties to the Trust. Additionally, in the normal course of business, the Trust enters into contracts with service providers that contain general indemnification clauses. The Trust’s maximum exposure under these arrangements is unknown as this would involve future claims that may be made against the Trust that have not yet occurred. However, based on experience, the Trust expects the risk of loss to be remote.
2. SHARES OF BENEFICIAL INTEREST
The Fund offers two classes of shares: Class 1 and Class 2. Each class of shares differs by its distribution fees, voting rights on matters affecting a single class and its exchange privilege.
At December 31, 2004, there were an unlimited number of shares authorized ($.01 par value). Transactions in the Fund’s shares were as follows:
| | | | | | | | | | | | | | |
| | | Year Ended December 31,
| |
| | | 2004
| | | 2003
| |
| Class 1 Shares: | | Shares
| | | Amount
| | | Shares
| | | Amount
| |
Shares sold | | 303,699 | | | $ | 4,435,674 | | | 4,419,445 | | | $ | 52,203,669 | |
Shares issued in reinvestment of distributions | | 1,195,145 | | | | 16,732,026 | | | 2,030,076 | | | | 25,944,365 | |
Shares redeemed | | (5,457,232 | ) | | | (79,985,994 | ) | | (6,284,305 | ) | | | (78,478,860 | ) |
| | |
| |
Net increase (decrease) | | (3,958,388 | ) | | $ | (58,818,294 | ) | | 165,216 | | | $ | (330,826 | ) |
| | |
| |
FI-22
FRANKLIN TEMPLETON VARIABLE INSURANCE PRODUCTS TRUST
FRANKLIN INCOME SECURITIES FUND
Notes to Financial Statements (continued)
2. SHARES OF BENEFICIAL INTEREST (cont.)
| | | | | | | | | | | | | | |
| | | Year Ended December 31,
| |
| | | 2004
| | | 2003
| |
| | | Shares
| | | Amount
| | | Shares
| | | Amount
| |
| Class 2 Shares: | | | | | | | | | | | | |
Shares sold | | 59,725,308 | | | $ | 868,489,933 | | | 37,243,295 | | | $ | 474,085,976 | |
Shares issued in reinvestment of distributions | | 2,282,559 | | | | 31,567,787 | | | 985,408 | | | | 12,475,273 | |
Shares redeemed | | (1,563,918 | ) | | | (22,463,078 | ) | | (763,349 | ) | | | (9,768,263 | ) |
| | |
| |
Net increase (decrease) | | 60,443,949 | | | $ | 877,594,642 | | | 37,465,354 | | | $ | 476,792,986 | |
| | |
| |
3. TRANSACTIONS WITH AFFILIATES
Certain officers and trustees of the Fund are also officers and/or directors of the following entities:
| | |
| Entity | | Affiliation |
Franklin Advisers Inc. (Advisers) | | Investment manager |
Franklin Templeton Services LLC (FT Services) | | Administrative manager |
Franklin Templeton Distributors Inc. (Distributors) | | Principal underwriter |
Franklin Templeton Investor Services LLC (Investor Services) | | Transfer agent |
a. Management Fees
The Fund pays an investment management fee to Advisers based on the average daily net assets of the Fund as follows:
| | |
| Annualized Fee Rate | | Net Assets |
| .625% | | First $100 million |
| .500% | | Over $100 million, up to and including $250 million |
| .450% | | Over $250 million, up to and including $10 billion |
Fees are further reduced on net assets over $10 billion.
b. Administrative Fees
Under an agreement with Advisers, FT Services provides administrative services to the Fund. The fee is paid by Advisers based on the average daily net assets of the Fund, and is not an additional expense of the Fund.
c. Distribution Fees
The Fund reimburses Distributors up to .25% per year of its average daily net asset of Class 2, for costs incurred in marketing the Fund’s shares under a Rule 12b-1 plan.
d. Transfer Agent Fees
Investor Services, under terms of an agreement, performs shareholder servicing for the Fund and is not paid by the Fund for the services.
4. EXPENSE OFFSET ARRANGEMENT
The Fund has entered into an arrangement with its custodian whereby credits realized as a result of uninvested cash balances are used to reduce a portion of the Fund’s custodian expenses. During the year ended December 31, 2004, the custodian fees were reduced as noted in the Statement of Operations.
FI-23
FRANKLIN TEMPLETON VARIABLE INSURANCE PRODUCTS TRUST
FRANKLIN INCOME SECURITIES FUND
Notes to Financial Statements (continued)
5. INCOME TAXES
At December 31, 2004, the Fund had deferred capital losses occurring subsequent to October 31, 2004 of $10,729,680. For tax purposes, such losses will be reflected in the year ending December 31, 2005.
The tax character of distributions paid during the years ended December 31, 2004 and 2003, was as follows:
| | | | | | |
| | | 2004
| | 2003
|
Distributions paid from ordinary Income | | $ | 48,299,813 | | $ | 38,419,638 |
Net investment income (loss) differs for financial statement and tax purposes primarily due to differing treatments of defaulted securities, foreign currency transactions, mortgage dollar rolls, paydown losses, and bond discounts and premiums.
Net realized gains (losses) differ for financial statement and tax purposes primarily due to differing treatments of wash sales, foreign currency transactions, mortgage dollar rolls, paydown losses, bond discounts and premiums and payment in-kind bonds.
At December 31, 2004, the cost of investments, net unrealized appreciation (depreciation) and undistributed ordinary income for income tax purposes were as follows:
| | | | |
Cost of investments | | $ | 1,912,637,777 | |
| | |
|
|
|
Unrealized appreciation | | $ | 242,638,218 | |
Unrealized depreciation | | | (23,805,331 | ) |
| | |
|
|
|
Net unrealized appreciation (depreciation) | | $ | 218,832,887 | |
| | |
|
|
|
Distributable earnings - undistributed ordinary income | | $ | 96,178,302 | |
| | |
|
|
|
6. INVESTMENT TRANSACTIONS
Purchases and sales of investments (excluding short-term securities) for the year ended December 31, 2004, aggregated $1,318,032,219 and $627,358,796 respectively.
7. CREDIT RISK AND DEFAULTED SECURITIES
The Fund has 36.1% of its portfolio invested in below investment grade and comparable quality unrated high yield securities, which tend to be more sensitive to economic conditions than higher rated securities. The risk of loss due to default by the issuer may be significantly greater for the holders of high yielding securities because such securities are generally unsecured and are often subordinated to other creditors of the issuer.
The Fund held defaulted securities and/or other securities for which the income has been deemed uncollectible. At December 31, 2004, the value of these securities was $109,897, representing .01% of the Fund’s net assets. The Fund discontinues accruing income on securities for which income has been deemed uncollectible and provides an estimate for losses on interest receivable. For information as to specific securities, see the accompanying Statement of Investments.
8. RESTRICTED SECURITIES
At December 31, 2004, investments in securities included issues that are restricted and illiquid. Restricted securities are often purchased in private placement transactions, are not registered under the Securities Act of 1933, may have contractual
restrictions on resale, and are valued under methods approved by the Board of Trustees as reflecting fair value. A security may also be considered illiquid if it lacks a readily available market or if its valuation has not changed for a certain period of time. At
FI-24
FRANKLIN TEMPLETON VARIABLE INSURANCE PRODUCTS TRUST
FRANKLIN INCOME SECURITIES FUND
Notes to Financial Statements (continued)
8. RESTRICTED SECURITIES (cont.)
December 31, 2004, the Fund held investments in restricted and illiquid securities that were valued under approved methods by the Trustees, as follows:
| | | | | | | | | | |
Shares
| | Issuer
| | Acquisition
Date
| | Cost
| | Value
|
10,073,000 | | Asia Pulp & Paper Co. Ltd., 12.00%, Perpetual, pfd. (.01% of Net Assets) | | 2/14/97 | | $ | 7,620,963 | | $ | 109,897 |
| | | | | | | | | |
|
|
9. OTHER CONSIDERATIONS
Advisers, as the Fund’s Manager, may serve as a member of various bondholders’ steering committees, on credit committees, or may represent the Funds in certain corporate restructuring negotiations. At December 31, 2004, the Manager serves in one or more of these capacities for Asia Pulp & Paper Co. Ltd. As a result of this involvement, Advisers may be in possession of certain material non-public information. If the Fund’s Manager, while in possession of such information, seeks to sell any of its holdings in these securities it will comply with all applicable federal securities laws.
10. REGULATORY MATTERS
Investigations
As part of various investigations by a number of federal, state, and foreign regulators and governmental entities, including the Securities and Exchange Commission (“SEC”), the California Attorney General’s Office (“CAGO”), and the National Association of Securities Dealers, Inc. (“NASD”), relating to certain practices in the mutual fund industry, including late trading, market timing and marketing support payments to securities dealers who sell fund shares, Franklin Resources, Inc. and certain of its subsidiaries (as used in this section, together, the “Company”), as well as certain current or former executives and employees of the Company, received subpoenas and/or requests for documents, information and/or testimony. The Company and its current employees provided documents and information in response to those requests and subpoenas.
Settlements
Beginning in August 2004, the Company entered into settlements with certain regulators investigating the mutual fund industry practices noted above. The Company believes that settlement of each of the matters described in this section is in the best interest of the Company and shareholders of the Franklin, Templeton, and Mutual Series mutual funds (the “funds”).
On August 2, 2004, Franklin Resources, Inc. announced that its subsidiary, Franklin Advisers, Inc., reached an agreement with the SEC that resolved the issues resulting from the SEC investigation into market timing activity. In connection with that agreement, the SEC issued an “Order Instituting Administrative and Cease-and-Desist Proceedings Pursuant to Sections 203(e) and 203(k) of the Investment Advisers Act of 1940 and Sections 9(b) and 9(f) of the Investment Company Act of 1940, Making Findings and Imposing Remedial Sanctions and a Cease-and-Desist Order” (the “Order”). The SEC’s Order concerned the activities of a limited number of third parties that ended in 2000 and those that were the subject of the first Massachusetts administrative complaint described below.
Under the terms of the SEC’s Order, pursuant to which Franklin Advisers, Inc. neither admitted nor denied any of the findings contained therein, Franklin Advisers, Inc. agreed to pay $50 million, of which $20 million is a civil penalty, to be distributed to shareholders of certain funds in accordance with a plan to be developed by an independent distribution consultant. At this time, it is unclear which funds or which shareholders of any particular fund will receive distributions. The Order also required Franklin Advisers, Inc. to, among other things, enhance and periodically review compliance policies and procedures.
FI-25
FRANKLIN TEMPLETON VARIABLE INSURANCE PRODUCTS TRUST
FRANKLIN INCOME SECURITIES FUND
Notes to Financial Statements (continued)
10. REGULATORY MATTERS (cont.)
Settlements (cont.)
On September 20, 2004, Franklin Resources, Inc. announced that two of its subsidiaries, Franklin Advisers, Inc. and Franklin Templeton Alternative Strategies, Inc. (“FTAS”), reached an agreement with the Securities Division of the Office of the Secretary of the Commonwealth of Massachusetts (the “State of Massachusetts”) related to its administrative complaint filed on February 4, 2004, concerning one instance of market timing that was also a subject of the August 2, 2004 settlement that Franklin Advisers, Inc. reached with the SEC, as described above.
Under the terms of the settlement consent order issued by the State of Massachusetts, Franklin Advisers, Inc. and FTAS consented to the entry of a cease-and-desist order and agreed to pay a $5 million administrative fine to the State of Massachusetts (the “Massachusetts Consent Order”). The Massachusetts Consent Order included two different sections: “Statements of Fact” and “Violations of Massachusetts Securities Laws.” Franklin Advisers, Inc. and FTAS admitted the facts in the Statements of Fact.
On October 25, 2004, the State of Massachusetts filed a second administrative complaint, alleging that Franklin Resources, Inc.’s Form 8-K filing (in which it described the Massachusetts Consent Order and stated that “Franklin did not admit or deny engaging in any wrongdoing”) failed to state that Franklin Advisers, Inc. and FTAS admitted the Statements of Fact portion of the Massachusetts Consent Order (the “Second Complaint”). Franklin Resources, Inc. reached a second agreement with the State of Massachusetts on November 19, 2004, resolving the Second Complaint. As a result of the November 19, 2004 settlement, Franklin Resources, Inc. filed a new Form 8-K. The terms of the Massachusetts Consent Order did not change and there was no monetary fine associated with this second settlement.
On November 17, 2004, Franklin Resources, Inc. announced that Franklin/Templeton Distributors, Inc. (“FTDI”) reached an agreement with the CAGO, resolving the issues resulting from the CAGO’s investigation concerning sales and marketing support payments. Under the terms of the settlement, FTDI neither admitted nor denied the allegations in the CAGO’s complaint and agreed to pay $2 million to the State of California as a civil penalty, $14 million to the funds, to be allocated by an independent distribution consultant to be paid for by FTDI, and $2 million to the CAGO for its investigative costs.
On December 13, 2004, Franklin Resources, Inc. announced that its subsidiaries FTDI and Franklin Advisers, Inc. reached an agreement with the SEC, resolving the issues resulting from the SEC’s investigation concerning marketing support payments to securities dealers who sell fund shares. In connection with that agreement, the SEC issued an “Order Instituting Administrative and Cease-and-Desist Proceedings, Making Findings, and Imposing Remedial Sanctions Pursuant to Sections 203(e) and 203(k) of the Investment Advisers Act of 1940, Sections 9(b) and 9(f) of the Investment Company Act of 1940, and Section 15(b) of the Securities Exchange Act of 1934” (the “Second Order”).
Under the terms of the Second Order, in which FTDI and Franklin Advisers, Inc. neither admitted nor denied the findings contained therein, they agreed to pay the funds a penalty of $20 million and disgorgement of $1 (one dollar). FTDI and Franklin Advisers, Inc. also agreed to implement certain measures and undertakings relating to marketing support payments to broker-dealers for the promotion or sale of fund shares, including making additional disclosures in the funds’ Prospectuses and Statements of Additional Information. The Second Order further requires the appointment of an independent distribution consultant, at the Company’s expense, who shall develop a plan for the distribution of the penalty and disgorgement to the funds.
Other Legal Proceedings
The Trust, in addition to the Company and other funds, and certain current and former officers, employees, and directors have been named in multiple lawsuits in different federal courts in Nevada, California, Illinois, New York and Florida, alleging violations of various federal securities laws and seeking, among other relief, monetary damages, restitution, removal of fund trustees, directors, advisers, administrators, and distributors, rescission of management contracts and 12b-1 Plans, and/or attorneys’ fees and costs. Specifically, the lawsuits claim breach of duty with respect to alleged arrangements to permit market
FI-26
FRANKLIN TEMPLETON VARIABLE INSURANCE PRODUCTS TRUST
FRANKLIN INCOME SECURITIES FUND
Notes to Financial Statements (continued)
10. REGULATORY MATTERS (cont.)
Other Legal Proceedings (cont.)
timing and/or late trading activity, or breach of duty with respect to the valuation of the portfolio securities of certain Templeton funds managed by Franklin Resources, Inc. subsidiaries, resulting in alleged market timing activity. The majority of these
lawsuits duplicate, in whole or in part, the allegations asserted in the February 4, 2004 Massachusetts administrative complaint and the findings in the SEC’s August 2, 2004 Order, as described above. The lawsuits are styled as class actions, or derivative actions on behalf of either the named funds or Franklin Resources, Inc.
In addition, the Company, as well as certain current and former officers, employees, and directors, have been named in multiple lawsuits alleging violations of various securities laws and pendent state law claims relating to the disclosure of directed brokerage payments and/or payment of allegedly excessive advisory, commission, and distribution fees, and seeking, among other relief, monetary damages, restitution, rescission of advisory contracts, including recovery of all fees paid pursuant to those contracts, an accounting of all monies paid to the named advisers, declaratory relief, injunctive relief, and/or attorneys’ fees and costs. These lawsuits are styled as class actions or derivative actions brought on behalf of certain funds.
The Company and fund management strongly believes that the claims made in each of the lawsuits identified above are without merit and intends to vigorously defend against them. The Company cannot predict with certainty, however, the eventual outcome of the remaining governmental investigations or private lawsuits, nor whether they will have a material negative impact on the Company. Public trust and confidence are critical to the Company’s business and any material loss of investor and/or client confidence could result in a significant decline in assets under management by the Company, which would have an adverse effect on the Company’s future financial results. If the Company finds that it bears responsibility for any unlawful or inappropriate conduct that caused losses to the Trust, it is committed to making the Trust or its shareholders whole, as appropriate. The Company is committed to taking all appropriate actions to protect the interests of its funds’ shareholders.
FI-27
FRANKLIN TEMPLETON VARIABLE INSURANCE PRODUCTS TRUST
FRANKLIN INCOME SECURITIES FUND
Report of Independent Registered Public Accounting Firm
To the Trustees and Shareholders of Franklin Templeton Variable Insurance Products Trust:
In our opinion, the accompanying statement of assets and liabilities, including the statement of investments, and the related statements of operations and of changes in net assets and the financial highlights present fairly, in all material respects, the financial position of the Franklin Income Securities Fund (the Fund) (one of the funds constituting Franklin Templeton Variable Insurance Products Trust) at December 31, 2004, the results of each of its operations for the year then ended, the changes in its net assets for each of the two years in the period then ended and the financial highlights for each of the five years in the period then ended, in conformity with accounting principles generally accepted in the United States of America. These financial statements and financial highlights (hereafter referred to as “financial statements”) are the responsibility of the Fund’s management; our responsibility is to express an opinion on these financial statements based on our audits. We conducted our audits of these financial statements in accordance with the standards of the Public Company Accounting Oversight Board (United States). Those standards require that we plan and perform the audits to obtain reasonable assurance about whether the financial statements are free of material misstatement. An audit includes examining, on a test basis, evidence supporting the amounts and disclosures in the financial statements, assessing the accounting principles used and significant estimates made by management, and evaluating the overall financial statement presentation. We believe that our audits, which included confirmation of securities at December 31, 2004 by correspondence with the custodian and brokers, provide a reasonable basis for our opinion.
PricewaterhouseCoopers LLP
San Francisco, California
February 9, 2005
FI-28
FRANKLIN TEMPLETON VARIABLE INSURANCE PRODUCTS TRUST
FRANKLIN INCOME SECURITIES FUND
Tax Designation (unaudited)
Under Section 852(b)(2) of the Internal Revenue Code, the Fund hereby designates 43.81% of the ordinary income dividends received deduction for the fiscal year ended December 31, 2004.
FI-29
FRANKLIN LARGE CAP GROWTH SECURITIES FUND
This annual report for Franklin Large Cap Growth Securities Fund covers the fiscal year ended December 31, 2004.
Performance Summary as of 12/31/04
Average annual total return of Class 2 shares* represents the average annual change in value, assuming reinvestment of dividends and capital gains. Average returns smooth out variations in returns, which can be significant; they are not the same as year-by-year results.
Periods ended 12/31/04
| | | | | | |
| | | 1-Year | | 5-Year | | Since
Inception
(5/1/96) |
Average Annual Total Return | | +7.93% | | -0.34% | | +8.85% |
*Because Class 2 shares were not offered until 1/6/99, standardized Class 2 Fund performance for prior periods represents the historical results of Class 1 shares. For periods beginning on 1/6/99, Class 2’s results reflect an additional 12b-1 fee expense, which also affects future performance. Since 1/6/99 (effective date), the average annual total return of Class 2 shares was +3.93%.
Total Return Index Comparison for Hypothetical $10,000 Investment (5/1/96–12/31/04)
The graph below shows the change in value of a hypothetical $10,000 investment in the Fund over the indicated period and includes reinvestment of any income or distributions. The Fund’s performance* is compared to the performance of the Standard & Poor’s 500 Composite Index (S&P 500) and the Russell 1000® Growth Index. One cannot invest directly in an index, nor is an index representative of the Fund’s portfolio. Please see Important Notes to Performance Information preceding the Fund Summaries.
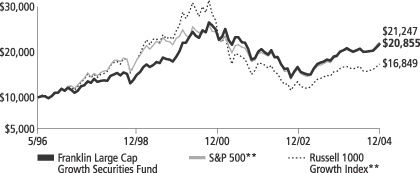
**Source: Standard & Poor’s Micropal. Please see Index Descriptions following the Fund Summaries.
Franklin Large Cap Growth Securities Fund Class 2
Performance reflects the Fund’s Class 2 operating expenses, but does not include any contract fees, expenses or sales charges. If they had been included, performance would be lower. These charges and deductions, particularly for variable life policies, can have a significant effect on contract values and insurance benefits. See the contract prospectus for a complete description of these expenses, including sales charges.
Performance data quoted represent past performance, which does not guarantee future results. Investment return and principal value will fluctuate, and you may have a gain or loss when you sell your shares. Current performance may differ from figures shown.
FL-1
Fund Goal and Main Investments: Franklin Large Cap Growth Securities Fund seeks capital appreciation. The Fund invests predominantly in investments of large-cap companies with market capitalization values within those of the top 50% of companies in the Russell 1000 Index at the time of purchase.1 The Fund may hold significant positions in the technology sector (including health technology, electronic technology and technology services), and in communications and financial services companies. The Fund may also invest in foreign securities.
Performance Overview
You can find the Fund’s one-year total return in the Performance Summary. The Fund’s return was mixed compared with its benchmarks, as it underperformed the S&P 500’s 10.87% total return and outperformed the Russell 1000 Growth Index’s 6.30% total return for the year under review.2
Economic and Market Overview
During the year ended December 31, 2004, the domestic economy expanded solidly and broadly across most industries, sectors and regions as gross domestic product (GDP) rose an estimated 4.4%.3 However, surging energy and other commodity prices had a dampening effect. Although consumer confidence remained below pre-recession levels, consumer spending supported strong auto sales, increased durable goods consumption and a healthy housing market. Similarly, business spending rose substantially even as business confidence wavered. With improving balance sheets and stronger profit margins, many companies entered an upgrade cycle and invested in new technologies, driving equipment spending up 9.5% in the second half of 2004.3 The labor market firmed as employers hired 2.2 million workers in 2004, and unemployment dropped from 5.7% to 5.4% during the year.4 More than one-half of the jobs lost during the recession have been recovered; however, most were part-time or temporary. Given concerns over rising benefits costs and lingering uncertainties about economic recovery, many companies turned to temporary employment or opted for continued hiring freezes. At year-end, elevated household debt levels and the deepening federal budget and trade deficits were three top concerns for the economy as it headed into 2005.
1. Please see Index Descriptions following the Fund Summaries.
2. Source: Standard & Poor’s Micropal. One cannot invest directly in an index, nor is an index representative of the Fund’s portfolio. Please see Index Descriptions following the Fund Summaries.
3. Source: Bureau of Economic Analysis.
4. Source: Bureau of Labor Statistics.
Fund Risks: Stocks offer the potential for long-term gains but can be subject to short-term up-and-down price movements. Large-capitalization stocks tend to go through cycles of doing better — or worse — than the stock market in general, and, in the past, these periods have lasted for several years. By focusing on particular sectors from time to time, the Fund carries greater risk of adverse developments in a sector than a fund that always invests in a wide variety of sectors. Foreign investing involves special risks including currency fluctuations, economic instability, and social and political developments. The Fund’s prospectus also includes a description of the main investment risks.
FL-2
The U.S. dollar weakened throughout 2004 and hit an all-time low against the euro and a multi-year low versus the yen. The widening trade and current account deficits and possibility for higher import prices contributed to inflationary pressures. The core inflation rate rose to 2.2% in 2004, or 3.3% including volatile food and energy costs. Aiming to keep inflation tame, the Federal Reserve Board (Fed) raised the federal funds target rate five times between June and December, from 1.00% to 2.25%, the highest level in more than three years. The Fed said it will respond to changes in economic prospects as needed to fulfill its obligation to maintain price stability, noting in December that it perceived “the upside and downside risks to the attainment of both sustainable growth and price stability for the next few quarters to be roughly equal.”5
Despite a generally robust economy and improving corporate fundamentals, investors had to digest a wide range of information in 2004, including rising inflation, the dollar’s value, a contentious presidential election and ongoing concerns about terrorism, war and reconstruction in Iraq. Domestic equity markets rallied in early 2004 and then fluctuated; however, they were essentially flat through early November. Disappointing earnings from a number of blue chip companies applied downward pressure, but initial public offering (IPO) activity was strong and investor sentiment improved late in the period despite the mixed signals. After the elections concluded, the markets enjoyed another strong rally through year-end. The blue chip stocks of the Dow Jones Industrial Average gained 5.31% for the year under review, while the broader S&P 500 rose 10.87% and the technology-heavy NASDAQ Composite Index increased 9.15%.6
Investment Strategy
We are research driven, fundamental investors pursuing a growth strategy. As bottom-up investors focusing primarily on individual securities, we choose companies that we believe are positioned for growth in revenues, earnings or assets. In choosing investments, we focus on large-cap companies that have exhibited above average growth, strong financial records, or compelling valuations. In addition, we also consider management expertise, industry leadership, growth in market share and sustainable competitive advantage.
5. Source: Federal Reserve. Press Release, 12/14/04.
6. Source: Standard & Poor’s Micropal. Please see Index Descriptions following the Fund Summaries.
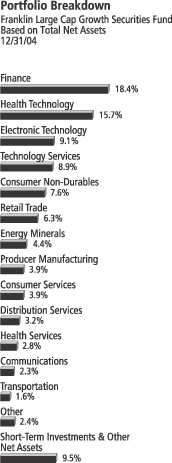
FL-3
Manager’s Discussion
Looking back on the key factors impacting the Fund’s calendar year 2004 returns, we would like to remind our shareholders that our investment strategy is primarily bottom-up and driven by individual stock selection. We do recognize, however, that our investors may have an interest in a top-down sector discussion of key performance drivers.
On a sector basis, the top positive contributor to Fund performance in 2004 was our position in health technology, where we also experienced favorable returns due to stock selection. The Fund’s holdings in biotechnology firm Biogen Idec, medical instruments maker Guidant, and pharmaceuticals companies King Pharmaceuticals and Forest Laboratories benefited Fund performance, and were all overweighted compared with the S&P 500. These positions more than made up for the negative impacts of our overweighted investments in Pfizer, Merck and Boston Scientific, each of which underperformed the index.
The Fund also benefited from exposure to distribution services stocks. For example, we purchased shares of medical products distributor Cardinal Health and food distributor SYSCO in the second half of the year following sharp, temporary pullbacks in each stock’s share price. Other significant positive contributors to the Fund’s performance relative to the S&P 500 included overweighted positions in transportation logistics company Expeditors International of Washington, aerospace and defense contractor Lockheed-Martin, truck manufacturer PACCAR, and finance-related companies Countrywide Financial and Lehman Brothers.
Despite the Fund’s good results, some of our investments hindered total returns during the year under review. One of the Fund’s most significant detractors to overall performance stemmed from our stock selection in the consumer services sector. An overweighted position compared with the S&P 500 in media-related company Univision Communications had a negative impact, as did a lack of holdings in Internet service and commerce providers such as Yahoo! and eBay. Performance was also held back by our overweighted positions in finance, specifically Marsh & McLennan and Fifth Third Bancorp, as well as our decision not to hold energy-related companies ChevronTexaco and ConocoPhillips.
Some of the most notable changes in Fund positioning during 2004 included a significant increase in portfolio exposure to the distribution services sector, both in absolute terms and relative to the S&P 500. This was driven, in part, by our decision to purchase shares of medical
Top 10 Holdings
Franklin Large Cap Growth Securities Fund 12/31/04
| | |
Company
Sector/Industry | | % of Total
Net Assets |
| |
| Microsoft Corp. | | 2.2% |
| Technology Services | | |
| |
| ExxonMobil Corp. | | 1.9% |
| Energy Minerals | | |
| |
| Wal-Mart Stores Inc. | | 1.9% |
| Retail Trade | | |
| |
| Pfizer Inc. | | 1.8% |
| Health Technology | | |
| |
| General Electric Co. | | 1.7% |
| Producer Manufacturing | | |
| |
| Boston Scientific Corp. | | 1.7% |
| Health Technology | | |
| |
| Amgen Inc. | | 1.7% |
| Health Technology | | |
| |
| Forest Laboratories Inc. | | 1.5% |
| Health Technology | | |
| |
| Citigroup Inc. | | 1.5% |
| Finance | | |
| |
| Intel Corp. | | 1.5% |
| Electronic Technology | | |
The dollar value, number of shares or principal amount, and names of all portfolio holdings are listed in the Fund’s Statement of Investments.
FL-4
products distributors AmerisourceBergen, McKesson and Cardinal Health, as well as food distributor SYSCO. We also modestly increased the Fund’s finance sector weighting with purchases of investment banker Lehman Brothers, asset manager Federated Investors, credit card company American Express and insurance products provider AFLAC.
Meanwhile, we reduced the Fund’s retail sector exposure with sales of Walgreen’s, Kohl’s, Dillard’s and Rent-A-Center. Whereas we began 2004 with an overweighted stake in retail, these stock sales resulted in a reduced exposure relative to the S&P 500 by year-end.
At period-end, health technology comprised roughly 16% of the Fund’s total net assets versus approximately 10% in the S&P 500. This was primarily composed of overweighted positions in various large capitalization and specialty pharmaceutical companies, including Pfizer, Merck, Wyeth, Johnson & Johnson, Eli Lilly and Forest Labs, as well as medical device makers Medtronic, Boston Scientific and Pall. Although we recognize significant ongoing challenges facing the pharmaceuticals industry, in line with our investment strategy we believed these factors were abundantly reflected in the valuations we believe remain attractive within many of the industry’s underlying stocks.
Thank you for your participation in Franklin Large Cap Growth Securities Fund. We look forward to serving your future investment needs.
The foregoing information reflects our analysis, opinions and portfolio holdings as of December 31, 2004, the end of the reporting period. The way we implement our main investment strategies and the resulting portfolio holdings may change depending on factors such as market and economic conditions. These opinions may not be relied upon as investment advice or an offer for a particular security. The information is not a complete analysis of every aspect of any market, country, industry, security or the Fund. Statements of fact are from sources considered reliable, but the adviser makes no representation or warranty as to their completeness or accuracy. Although historical performance is no guarantee of future results, these insights may help you understand our investment management philosophy.
FL-5
Fund Expenses
As an investor in a variable insurance contract (“Contract”) that indirectly provides for investment in an underlying mutual fund, you can incur transaction and/or ongoing expenses at both the Fund level and the Contract level.
| • | | Transaction expenses can include sales charges (loads) on purchases, redemption fees, surrender fees, transfer fees and premium taxes. |
| • | | Ongoing expenses can include management fees, distribution and service (12b-1) fees, contract fees, annual maintenance fees, mortality and expense risk fees and other fees and expenses. All mutual funds and Contracts have some types of ongoing expenses. |
The expenses shown in the table below are meant to highlight ongoing expenses at the Fund level only and do not include ongoing expenses at the Contract level, or transaction expenses at either the Fund or Contract levels. While the Fund does not have transaction expenses, if the transaction and ongoing expenses at the Contract level were included, the expenses shown below would be higher. You should consult your Contract prospectus or disclosure document for more information.
The table shows Fund-level ongoing expenses and can help you understand these expenses and compare them with those of other mutual funds offered through the Contract. The table assumes a $1,000 investment held for the six months indicated. Please refer to the Fund prospectus for additional information on operating expenses.
Actual Fund Expenses
The first line (Actual) for each share class listed in the table below provides actual account values and expenses. The “Ending Account Value” is derived from the Fund’s actual return, which includes the effect of ongoing Fund expenses, but does not include the effect of ongoing Contract expenses.
You can estimate the Fund-level expenses you incurred during the period, by following these steps. Of course, your account value and expenses will differ from those in this illustration:
| 1. | Divide your account value by $1,000. |
If an account had an $8,600 value, then $8,600 ÷ $1,000 = 8.6.
| 2. | Multiply the result by the number under the heading “Fund-Level Expenses Incurred During Period.” |
If Fund-Level Expenses Incurred During Period were $7.50, then 8.6 × $7.50 = $64.50.
Franklin Large Cap Growth Securities Fund Class 2
FL-6
In this illustration, the estimated expenses incurred this period at the Fund level are $64.50.
Hypothetical Example for Comparison with Other Mutual Funds
Information in the second line (Hypothetical) for each class in the table can help you compare ongoing expenses of the Fund with those of other mutual funds offered through the Contract. This information may not be used to estimate the actual ending account balance or expenses you incurred during the period. The hypothetical “Ending Account Value” is based on the actual expense ratio for each class and an assumed 5% annual rate of return before expenses, which does not represent the Fund’s actual return. The figure under the heading “Fund-Level Expenses Incurred During Period” shows the hypothetical expenses your account would have incurred under this scenario. You can compare this figure with the 5% hypothetical examples that appear in shareholder reports of other funds offered through a Contract.
| | | | | | | | | |
| Class 2 | | Beginning
Account
Value 6/30/04 | | Ending
Account
Value 12/31/04 | | Fund-Level
Expenses Incurred
During Period*
6/30/04-12/31/04 |
Actual | | $ | 1,000 | | $ | 1,043.40 | | $ | 5.34 |
Hypothetical (5% return before expenses) | | $ | 1,000 | | $ | 1,019.91 | | $ | 5.28 |
*Expenses are equal to the annualized expense ratio for the Fund’s Class 2 shares (1.04%), which does not include any ongoing expenses of the Contract for which the Fund is an investment option, multiplied by the average account value over the period, multiplied by 184/366 to reflect the one-half year period.
FL-7
FRANKLIN TEMPLETON VARIABLE INSURANCE PRODUCTS TRUST
FRANKLIN LARGE CAP GROWTH SECURITIES FUND
Financial Highlights
| | | | | | | | | | | | | | | | | | | | |
| | | Class 1
| |
| | | Year Ended December 31,
| |
| | | 2004 | | | 2003 | | | 2002 | | | 2001 | | | 2000 | |
| | |
|
|
|
Per share operating performance | | | | | | | | | | | | | | | | | | | | |
(for a share outstanding throughout the year) | | | | | | | | | | | | | | | | | | | | |
Net asset value, beginning of year | | $ | 14.01 | | | $ | 11.10 | | | $ | 14.52 | | | $ | 21.03 | | | $ | 21.07 | |
| | |
|
|
|
Income from investment operations: | | | | | | | | | | | | | | | | | | | | |
Net investment incomea | | | .13 | | | | .10 | | | | .09 | | | | .10 | | | | .09 | |
Net realized and unrealized gains (losses) | | | 1.02 | | | | 2.90 | | | | (3.41 | ) | | | (2.13 | ) | | | 1.14 | |
| | |
|
|
|
Total from investment operations | | | 1.15 | | | | 3.00 | | | | (3.32 | ) | | | (2.03 | ) | | | 1.23 | |
| | |
|
|
|
Less distributions from: | | | | | | | | | | | | | | | | | | | | |
Net investment income | | | (.08 | ) | | | (.09 | ) | | | (.10 | ) | | | (.11 | ) | | | (.11 | ) |
Net realized gains | | | — | | | | — | | | | — | | | | (4.37 | ) | | | (1.16 | ) |
| | |
|
|
|
Total distributions | | | (.08 | ) | | | (.09 | ) | | | (.10 | ) | | | (4.48 | ) | | | (1.27 | ) |
| | |
|
|
|
Net asset value, end of year | | $ | 15.08 | | | $ | 14.01 | | | $ | 11.10 | | | $ | 14.52 | | | $ | 21.03 | |
| | |
|
|
|
| | | | | |
Total returnb | | | 8.23% | | | | 27.14% | | | | (22.94)% | | | | (11.26)% | | | | 5.75% | |
Ratios/supplemental data | | | | | | | | | | | | | | | | | | | | |
Net assets, end of year (000’s) | | $ | 169,107 | | | $ | 191,028 | | | $ | 175,917 | | | $ | 300,135 | | | $ | 431,384 | |
Ratios to average net assets: | | | | | | | | | | | | | | | | | | | | |
Expenses | | | .79% | | | | .79% | | | | .80% | | | | .78% | | | | .78% | |
Net investment income | | | .99% | | | | .86% | | | | .73% | | | | .56% | | | | .43% | |
Portfolio turnover rate | | | 38.48% | | | | 35.28% | | | | 59.65% | | | | 75.67% | | | | 70.16% | |
| a | Based on average daily shares outstanding. |
| b | Total return does not include any fees, charges or expenses imposed by the variable annuity and life insurance contracts for which the Franklin Templeton Variable Insurance Products Trust serves as an underlying investment vehicle. Total return is not annualized for periods less than one year. |
See notes to financial statements.
FL-8
FRANKLIN TEMPLETON VARIABLE INSURANCE PRODUCTS TRUST
FRANKLIN LARGE CAP GROWTH SECURITIES FUND
Financial Highlights (continued)
| | | | | | | | | | | | | | | | | | | | |
| | | Class 2
| |
| | | Year Ended December 31,
| |
| | | 2004 | | | 2003 | | | 2002 | | | 2001 | | | 2000 | |
| | |
|
|
|
Per share operating performance | | | | | | | | | | | | | | | | | | | | |
(for a share outstanding throughout the year) | | | | | | | | | | | | | | | | | | | | |
Net asset value, beginning of year | | $ | 13.87 | | | $ | 11.00 | | | $ | 14.43 | | | $ | 20.93 | | | $ | 21.01 | |
| | |
|
|
|
Income from investment operations: | | | | | | | | | | | | | | | | | | | | |
Net investment incomea | | | .11 | | | | .08 | | | | .07 | | | | .05 | | | | .03 | |
Net realized and unrealized gains (losses) | | | .99 | | | | 2.87 | | | | (3.40 | ) | | | (2.12 | ) | | | 1.13 | |
| | |
|
|
|
Total from investment operations | | | 1.10 | | | | 2.95 | | | | (3.33 | ) | | | (2.07 | ) | | | 1.16 | |
| | |
|
|
|
Less distributions from: | | | | | | | | | | | | | | | | | | | | |
Net investment income | | | (.07 | ) | | | (.08 | ) | | | (.10 | ) | | | (.06 | ) | | | (.08 | ) |
Net realized gains | | | — | | | | — | | | | — | | | | (4.37 | ) | | | (1.16 | ) |
| | |
|
|
|
Total distributions | | | (0.07 | ) | | | (.08 | ) | | | (.10 | ) | | | (4.43 | ) | | | (1.24 | ) |
| | |
|
|
|
Net asset value, end of year | | $ | 14.90 | | | $ | 13.87 | | | $ | 11.00 | | | $ | 14.43 | | | $ | 20.93 | |
| | |
|
|
|
| | | | | |
Total returnb | | | 7.93% | | | | 26.95% | | | | (23.19)% | | | | (11.43)% | | | | 5.46% | |
Ratios/supplemental data | | | | | | | | | | | | | | | | | | | | |
Net assets, end of year (000’s) | | $ | 340,465 | | | $ | 128,029 | | | $ | 30,289 | | | $ | 5,290 | | | $ | 1,081 | |
Ratios to average net assets: | | | | | | | | | | | | | | | | | | | | |
Expenses | | | 1.04% | | | | 1.04% | | | | 1.05% | | | | 1.03% | | | | 1.03% | |
Net investment income | | | .74% | | | | .61% | | | | .48% | | | | .30% | | | | .17% | |
Portfolio turnover rate | | | 38.48% | | | | 35.28% | | | | 59.65% | | | | 75.67% | | | | 70.16% | |
| a | Based on average daily shares outstanding. |
| b | Total return does not include any fees, charges or expenses imposed by the variable annuity and life insurance contracts for which the Franklin Templeton Variable Insurance Products Trust serves as an underlying investment vehicle. Total return is not annualized for periods less than one year. |
See notes to financial statements.
FL-9
FRANKLIN TEMPLETON VARIABLE INSURANCE PRODUCTS TRUST
FRANKLIN LARGE CAP GROWTH SECURITIES FUND
Statement of Investments, December 31, 2004
| | | | | |
| | | SHARES | | VALUE |
Common Stocks 90.5% | | | | | |
Communications 2.3% | | | | | |
BellSouth Corp. | | 80,900 | | $ | 2,248,211 |
aNextel Communications Inc., A | | 70,000 | | | 2,100,000 |
Sprint Corp. | | 165,000 | | | 4,100,250 |
Verizon Communications Inc. | | 80,000 | | | 3,240,800 |
| | | | |
|
|
| | | | | | 11,689,261 |
| | | | |
|
|
Consumer Durables .6% | | | | | |
aElectronic Arts Inc. | | 48,900 | | | 3,016,152 |
| | | | |
|
|
Consumer Non-Durables 7.6% | | | | | |
Altria Group Inc. | | 98,500 | | | 6,018,350 |
Anheuser-Busch Cos. Inc. | | 118,900 | | | 6,031,797 |
Coca-Cola Co. | | 155,500 | | | 6,473,465 |
Colgate-Palmolive Co. | | 103,800 | | | 5,310,408 |
aDean Foods Inc. | | 60,000 | | | 1,977,000 |
Loews Corp. - Carolina Group | | 77,100 | | | 2,232,045 |
PepsiCo Inc. | | 86,600 | | | 4,520,520 |
Procter & Gamble Co. | | 54,000 | | | 2,974,320 |
Unilever PLC, ADR (United Kingdom) | | 77,000 | | | 3,043,040 |
| | | | |
|
|
| | | | | | 38,580,945 |
| | | | |
|
|
Consumer Services 3.9% | | | | | |
aApollo Group Inc., A | | 35,000 | | | 2,824,850 |
Clear Channel Communications Inc. | | 71,800 | | | 2,404,582 |
Dow Jones & Co. Inc. | | 31,200 | | | 1,343,472 |
aeBay Inc. | | 12,700 | | | 1,476,756 |
aUnivision Communications Inc., A | | 230,783 | | | 6,755,019 |
Viacom Inc., B | | 139,300 | | | 5,069,127 |
| | | | |
|
|
| | | | | | 19,873,806 |
| | | | |
|
|
Distribution Services 3.2% | | | | | |
AmerisourceBergen Corp. | | 48,500 | | | 2,845,980 |
Cardinal Health Inc. | | 55,700 | | | 3,238,955 |
McKesson Corp. | | 127,800 | | | 4,020,588 |
SYSCO Corp. | | 167,600 | | | 6,397,292 |
| | | | |
|
|
| | | | | | 16,502,815 |
| | | | |
|
|
Electronic Technology 9.1% | | | | | |
aApplied Materials Inc. | | 85,000 | | | 1,453,500 |
aCisco Systems Inc. | | 220,000 | | | 4,246,000 |
aDell Inc. | | 85,000 | | | 3,581,900 |
Diebold Inc. | | 58,200 | | | 3,243,486 |
Hewlett-Packard Co. | | 124,000 | | | 2,600,280 |
Intel Corp. | | 320,400 | | | 7,494,156 |
Intersil Corp., A | | 248,100 | | | 4,153,194 |
Linear Technology Corp. | | 65,000 | | | 2,519,400 |
Lockheed Martin Corp. | | 78,000 | | | 4,332,900 |
Nokia Corp., ADR (Finland) | | 410,800 | | | 6,437,236 |
QUALCOMM Inc. | | 68,000 | | | 2,883,200 |
aSeagate Technology | | 200,000 | | | 3,454,000 |
| | | | |
|
|
| | | | | | 46,399,252 |
| | | | |
|
|
FL-10
FRANKLIN TEMPLETON VARIABLE INSURANCE PRODUCTS TRUST
FRANKLIN LARGE CAP GROWTH SECURITIES FUND
Statement of Investments, December 31, 2004 (cont.)
| | | | | |
| | | SHARES | | VALUE |
Common Stocks (cont.) | | | | | |
Energy Minerals 4.4% | | | | | |
Anadarko Petroleum Corp. | | 55,000 | | $ | 3,564,550 |
Devon Energy Corp. | | 112,000 | | | 4,359,040 |
ExxonMobil Corp. | | 190,000 | | | 9,739,400 |
Royal Dutch Petroleum Co., N.Y. shs. (Netherlands) | | 84,000 | | | 4,819,920 |
| | | | |
|
|
| | | | | | 22,482,910 |
| | | | |
|
|
Finance 18.4% | | | | | |
AFLAC Inc. | | 153,000 | | | 6,095,520 |
American Express Co. | | 35,000 | | | 1,972,950 |
American International Group Inc. | | 75,000 | | | 4,925,250 |
Bank of America Corp. | | 106,400 | | | 4,999,736 |
Bank of New York Co. Inc. | | 166,400 | | | 5,561,088 |
aBerkshire Hathaway Inc., B | | 974 | | | 2,859,664 |
aCapitalSource Inc. | | 60,000 | | | 1,540,200 |
CIT Group Holdings Inc. | | 55,000 | | | 2,520,100 |
Citigroup Inc. | | 161,000 | | | 7,756,980 |
Countrywide Financial Corp. | | 135,998 | | | 5,033,286 |
Fannie Mae | | 38,000 | | | 2,705,980 |
Federated Investors Inc., B | | 119,100 | | | 3,620,640 |
Fifth Third Bancorp | | 141,100 | | | 6,671,208 |
Freddie Mac | | 69,700 | | | 5,136,890 |
Goldman Sachs Group Inc. | | 35,500 | | | 3,693,420 |
JPMorgan Chase & Co. | | 55,440 | | | 2,162,714 |
Lehman Brothers Holdings Inc. | | 46,500 | | | 4,067,820 |
Marsh & McLennan Cos. Inc. | | 225,800 | | | 7,428,820 |
MBNA Corp. | | 125,000 | | | 3,523,750 |
Old Republic International Corp. | | 150,000 | | | 3,795,000 |
Washington Mutual Inc. | | 76,000 | | | 3,213,280 |
Wells Fargo & Co. | | 75,000 | | | 4,661,250 |
| | | | |
|
|
| | | | | | 93,945,546 |
| | | | |
|
|
Health Services 2.8% | | | | | |
HCA Inc. | | 69,900 | | | 2,793,204 |
aHealth Net Inc., A | | 208,000 | | | 6,004,960 |
aTenet Healthcare Corp. | | 161,600 | | | 1,774,368 |
aWellpoint Inc. | | 30,000 | | | 3,450,000 |
| | | | |
|
|
| | | | | | 14,022,532 |
| | | | |
|
|
Health Technology 15.7% | | | | | |
Abbott Laboratories | | 50,000 | | | 2,332,500 |
aAdolor Corp. | | 63,600 | | | 630,912 |
aAmgen Inc. | | 132,100 | | | 8,474,215 |
aBiogen Idec Inc. | | 25,000 | | | 1,665,250 |
aBoston Scientific Corp. | | 238,700 | | | 8,485,785 |
Eli Lilly & Co. | | 107,700 | | | 6,111,975 |
aForest Laboratories Inc. | | 174,200 | | | 7,814,612 |
Guidant Corp. | | 63,600 | | | 4,585,560 |
Johnson & Johnson Inc. | | 111,400 | | | 7,064,988 |
Medtronic Inc. | | 103,300 | | | 5,130,911 |
Merck & Co. Inc. | | 172,200 | | | 5,534,508 |
Pall Corp. | | 134,300 | | | 3,887,985 |
Pfizer Inc. | | 343,000 | | | 9,223,270 |
FL-11
FRANKLIN TEMPLETON VARIABLE INSURANCE PRODUCTS TRUST
FRANKLIN LARGE CAP GROWTH SECURITIES FUND
Statement of Investments, December 31, 2004 (cont.)
| | | | | |
| | | SHARES | | VALUE |
Common Stocks (cont.) | | | | | |
Health Technology (cont.) | | | | | |
Shire Pharmaceuticals Group PLC, ADR (United Kingdom) | | 59,600 | | $ | 1,904,220 |
aTaro Pharmaceutical Industries Ltd. (Isreal) | | 9,400 | | | 319,882 |
Wyeth | | 154,600 | | | 6,584,414 |
| | | | |
|
|
| | | | | | 79,750,987 |
| | | | |
|
|
Industrial Services .7% | | | | | |
Schlumberger Ltd. | | 50,000 | | | 3,347,500 |
| | | | |
|
|
Process Industries .4% | | | | | |
Dow Chemical Co. | | 40,200 | | | 1,990,302 |
| | | | |
|
|
Producer Manufacturing 3.9% | | | | | |
3M Co. | | 34,200 | | | 2,806,794 |
General Electric Co. | | 240,000 | | | 8,760,000 |
PACCAR Inc. | | 47,000 | | | 3,782,560 |
United Technologies Corp. | | 46,800 | | | 4,836,780 |
| | | | |
|
|
| | | | | | 20,186,134 |
| | | | |
|
|
Retail Trade 6.3% | | | | | |
aAutoZone Inc. | | 27,800 | | | 2,538,418 |
aDollar Tree Stores Inc. | | 219,100 | | | 6,283,788 |
Family Dollar Stores Inc. | | 158,700 | | | 4,956,201 |
Lowe’s Cos. Inc. | | 65,000 | | | 3,743,350 |
Ross Stores Inc. | | 88,200 | | | 2,546,334 |
aTuesday Morning Corp. | | 89,200 | | | 2,732,196 |
Wal-Mart Stores Inc. | | 181,000 | | | 9,560,420 |
| | | | |
|
|
| | | | | | 32,360,707 |
| | | | |
|
|
Technology Services 8.9% | | | | | |
aAccenture Ltd., A (Bermuda) | | 244,900 | | | 6,612,300 |
aAffiliated Computer Services Inc., A | | 81,000 | | | 4,875,390 |
Automatic Data Processing Inc. | | 100,000 | | | 4,435,000 |
Computer Associates International Inc. | | 76,400 | | | 2,372,984 |
aComputer Sciences Corp. | | 35,000 | | | 1,972,950 |
First Data Corp. | | 82,200 | | | 3,496,788 |
International Business Machines Corp. | | 51,000 | | | 5,027,580 |
Microsoft Corp. | | 420,000 | | | 11,218,200 |
Paychex Inc. | | 159,400 | | | 5,432,352 |
| | | | |
|
|
| | | | | | 45,443,544 |
| | | | |
|
|
Transportation 1.6% | | | | | |
Expeditors International of Washington Inc. | | 90,000 | | | 5,029,200 |
Southwest Airlines Co. | | 192,900 | | | 3,140,412 |
| | | | |
|
|
| | | | | | 8,169,612 |
| | | | |
|
|
Utilities .7% | | | | | |
NiSource Inc. | | 160,000 | | | 3,644,800 |
| | | | |
|
|
Total Long Term Investments (Cost $398,102,588) | | | | | 461,406,805 |
| | | | |
|
|
FL-12
FRANKLIN TEMPLETON VARIABLE INSURANCE PRODUCTS TRUST
FRANKLIN LARGE CAP GROWTH SECURITIES FUND
Statement of Investments, December 31, 2004 (cont.)
| | | | | | | |
| | | PRINCIPAL
AMOUNT | | VALUE | |
Short term Investment (Cost $52,742,138) 10.4% | | | | | | | |
bRepurchase Agreement | | | | | | | |
Joint Repurchase Agreement, 1.915%, 1/03/05 (Maturity Value $52,750,555) | | $ | 52,742,138 | | $ | 52,742,138 | |
ABN AMRO Bank, N.V., New York Branch (Maturity Value $5,208,062) Banc of America Securities LLC (Maturity Value $1,952,825) Barclays Capital Inc. (Maturity Value $2,408,590) Bear, Stearns & Co. Inc. (Maturity Value $4,101,358) BNP Paribas Securities Corp. (Maturity Value $5,208,062) Deutsche Bank Securities Inc. (Maturity Value $2,604,295) Goldman, Sachs & Co. (Maturity Value $5,208,062) Greenwich Capital Markets Inc. (Maturity Value $5,208,062) Lehman Brothers Inc. (Maturity Value $5,227,053) Merrill Lynch Government Securities Inc. (Maturity Value $5,208,062) Morgan Stanley & Co. Inc. (Maturity Value $5,208,062) UBS Securities LLC (Maturity Value $5,208,062) | | | | | | | |
Collateralized by U.S. Government Agency Securities, 0.00 - 7.125%, 1/05/05 - 9/15/09; cU.S. Treasury Bills, 3/24/05 - 3/31/05; U.S. Treasury Bonds, 9.375 - 12.00%, 5/15/05 - 2/15/06; and U.S. Treasury Notes,
1.50 - 7.00%, 2/28/05 - 6/15/09 | | | | | | | |
| | | | | |
|
|
|
Total Investments (Cost $450,844,726) 100.9% | | | | | | 514,148,943 | |
Other Assets, less Liabilities (.9)% | | | | | | (4,577,254 | ) |
| | | | | |
|
|
|
Net Assets 100.0% | | | | | $ | 509,571,689 | |
| | | | | |
|
|
|
Portfolio Abbreviation:
ADR - American Depository Receipt
| b | See Note 1(b) regarding joint repurchase agreement. |
| c | Security is traded on a discount basis with no stated coupon rate. |
See notes to financial statements.
FL-13
FRANKLIN TEMPLETON VARIABLE INSURANCE PRODUCTS TRUST
FRANKLIN LARGE CAP GROWTH SECURITIES FUND
Financial Statements
Statement of Assets and Liabilities
December 31, 2004
| | | |
Assets: | | | |
Investments in securities: | | | |
Cost - Unaffiliated issuers | | $ | 398,102,588 |
Cost - Repurchase agreement | | | 52,742,138 |
| | |
|
|
Total cost of investments | | | 450,844,726 |
| | |
|
|
Value - Unaffiliated issuers | | | 461,406,805 |
Value - Repurchase agreement | | | 52,742,138 |
| | |
|
|
Total value of investments | | | 514,148,943 |
Cash | | | 1,718 |
Receivables: | | | |
Investment securities sold | | | 1,150,046 |
Capital shares sold | | | 1,190,018 |
Dividends | | | 438,660 |
| | |
|
|
Total assets | | | 516,929,385 |
| | |
|
|
Liabilities: | | | |
Payables: | | | |
Investment securities purchased | | | 6,871,118 |
Capital shares redeemed | | | 58,104 |
Affiliates | | | 381,251 |
Other liabilities | | | 47,223 |
| | |
|
|
Total liabilities | | | 7,357,696 |
| | |
|
|
Net assets, at value | | $ | 509,571,689 |
| | |
|
|
Net assets consist of: | | | |
Undistributed net investment income | | $ | 3,350,478 |
Net unrealized appreciation (depreciation) | | | 63,304,217 |
Accumulated net realized gain (loss) | | | (36,699,149) |
Capital shares | | | 479,616,143 |
| | |
|
|
Net assets, at value | | $ | 509,571,689 |
| | |
|
|
Class 1: | | | |
Net assets, at value | | $ | 169,106,908 |
| | |
|
|
Shares outstanding | | | 11,212,160 |
| | |
|
|
Net asset value and offering price per share | | $ | 15.08 |
| | |
|
|
Class 2: | | | |
Net assets, at value | | $ | 340,464,781 |
| | |
|
|
Shares outstanding | | | 22,847,333 |
| | |
|
|
Net asset value and offering price per share | | $ | 14.90 |
| | |
|
|
See notes to financial statements.
FL-14
FRANKLIN TEMPLETON VARIABLE INSURANCE PRODUCTS TRUST
FRANKLIN LARGE CAP GROWTH SECURITIES FUND
Financial Statements (continued)
Statement of Operations
for the year ended December 31, 2004
| | | | |
Investment income: | | | | |
Dividends | | $ | 6,575,412 | |
Interest | | | 412,975 | |
| | |
|
|
|
Total investment income | | | 6,988,387 | |
| | |
|
|
|
Expenses: | | | | |
Management fees (Note 3) | | | 2,946,875 | |
Distribution fees - Class 2 (Note 3) | | | 543,076 | |
Transfer agent fees | | | 5,453 | |
Custodian fees (Note 4) | | | 8,478 | |
Reports to shareholders | | | 90,640 | |
Professional fees | | | 23,699 | |
Trustees’ fees and expenses | | | 2,324 | |
Other | | | 16,380 | |
| | |
|
|
|
Total expenses | | | 3,636,925 | |
Expense reductions (Note 4) | | | (5 | ) |
| | |
|
|
|
Net expenses | | | 3,636,920 | |
| | |
|
|
|
Net investment income | | | 3,351,467 | |
| | |
|
|
|
Realized and unrealized gains (losses): | | | | |
Net realized gain (loss) from investments | | | 14,563,139 | |
Net change in unrealized appreciation (depreciation) on investments | | | 16,039,304 | |
| | |
|
|
|
Net realized and unrealized gain (loss) | | | 30,602,443 | |
| | |
|
|
|
Net increase (decrease) in net assets resulting from operations | | $ | 33,953,910 | |
| | |
|
|
|
See notes to financial statements.
FL-15
FRANKLIN TEMPLETON VARIABLE INSURANCE PRODUCTS TRUST
FRANKLIN LARGE CAP GROWTH SECURITIES FUND
Financial Statements (continued)
Statements of Changes in Net Assets
for the years ended December 31, 2004 and 2003
| | | | | | | | |
| | | 2004 | | | 2003 | |
| | |
| |
Increase (decrease) in net assets: | | | | | | | | |
Operations: | | | | | | | | |
Net investment income | | $ | 3,351,467 | | | $ | 1,927,708 | |
Net realized gain (loss) from investments | | | 14,563,139 | | | | 1,479,180 | |
Net change in unrealized appreciation (depreciation) on investments | | | 16,039,304 | | | | 56,887,471 | |
| | |
| |
Net increase (decrease) in net assets resulting from operations | | | 33,953,910 | | | | 60,294,359 | |
Distributions to shareholders from net investment income: | | | | | | | | |
Class 1 | | | (963,792 | ) | | | (1,331,195 | ) |
Class 2 | | | (964,498 | ) | | | (427,106 | ) |
| | |
| |
Total distributions to shareholders | | | (1,928,290 | ) | | | (1,758,301 | ) |
Capital share transactions: (Note 2) | | | | | | | | |
Class 1 | | | (34,434,485 | ) | | | (26,198,818 | ) |
Class 2 | | | 192,923,391 | | | | 80,514,244 | |
| | |
| |
Total capital share transactions | | | 158,488,906 | | | | 54,315,426 | |
Net increase (decrease) in net assets | | | 190,514,526 | | | | 112,851,484 | |
Net assets: | | | | | | | | |
Beginning of year | | | 319,057,163 | | | | 206,205,679 | |
| | |
| |
End of year | | $ | 509,571,689 | | | $ | 319,057,163 | |
| | |
| |
Undistributed net investment income included in net assets: | | | | | | | | |
End of year | | $ | 3,350,478 | | | $ | 1,927,301 | |
| | |
| |
See notes to financial statements.
FL-16
FRANKLIN TEMPLETON VARIABLE INSURANCE PRODUCTS TRUST
FRANKLIN LARGE CAP GROWTH SECURITIES FUND
Notes to Financial Statements
1. ORGANIZATION AND SIGNIFICANT ACCOUNTING POLICIES
Franklin Templeton Variable Insurance Products Trust (the Trust) is registered under the Investment Company Act of 1940 as an open-end investment company, consisting of twenty-one separate series (the Funds). The Franklin Large Cap Growth Securities Fund (the Fund) included in this report is diversified. The financial statements of the remaining funds in the series are presented separately. Shares of the Fund are sold only to insurance company separate accounts to fund the benefits of variable life insurance policies or variable annuity contracts. As of December 31, 2004, over 67% of the Fund’s shares were sold through one insurance company. The Fund’s investment objective is capital growth.
The following summarizes the Fund’s significant accounting policies.
a. Security Valuation
Securities listed on a securities exchange or on the NASDAQ National Market System are valued at the last quoted sale price or the official closing price of the day, respectively. Over-the-counter securities and listed securities for which there is no reported sale are valued within the range of the most recent quoted bid and ask prices. Securities that trade in multiple markets or on multiple exchanges are valued according to the broadest and most representative market. Repurchase agreements are valued at cost.
The Trust has procedures to determine the fair value of individual securities and other assets for which market prices are not readily available or which may not be reliably priced. Some methods for valuing these securities may include: fundamental analysis, matrix pricing, discounts from market prices of similar securities, or discounts applied due to the nature and duration of restrictions on the disposition of the securities. Occasionally, events occur between the time at which trading in a security is completed and the close of the NYSE that might call into question the availability (including the reliability) of the value of a portfolio security held by the Fund. If such an event occurs, the securities may be valued using fair value procedures, which may include the use of independent pricing services. All security valuation procedures are approved by the Trust’s Board of Trustees.
b. Joint Repurchase Agreement
The Fund may enter into a joint repurchase agreement whereby its uninvested cash balance is deposited into a joint cash account to be used to invest in one or more repurchase agreements. The value and face amount of the joint repurchase agreement are allocated to the Fund based on its pro-rata interest. A repurchase agreement is accounted for as a loan by the Fund to the seller, collateralized by securities which are delivered to the Fund’s custodian. The market value, including accrued interest, of the initial collateralization is required to be at least 102% of the dollar amount invested by the Fund, with the value of the underlying securities marked to market daily to maintain coverage of at least 100%. At December 31, 2004, all repurchase agreements held by the Fund had been entered into on that date.
c. Income Taxes
No provision has been made for U.S. income taxes because the Fund’s policy is to qualify as a regulated investment company under Sub Chapter M of the Internal Revenue Code and to distribute substantially all of its taxable income. Fund distributions to shareholders are determined on an income tax basis and may differ from net investment income and realized gains for financial reporting purposes.
d. Security Transactions, Investment Income, Expenses and Distributions
Security transactions are accounted for on trade date. Realized gains and losses on security transactions are determined on a specific identification basis. Interest income and estimated expenses are accrued daily. Dividend income and distributions to shareholders are recorded on the ex-dividend date.
FL-17
FRANKLIN TEMPLETON VARIABLE INSURANCE PRODUCTS TRUST
FRANKLIN LARGE CAP GROWTH SECURITIES FUND
Notes to Financial Statements (continued)
1. ORGANIZATION AND SIGNIFICANT ACCOUNTING POLICIES (cont.)
d. Security Transactions, Investment Income, Expenses and Distributions (cont.)
Common expenses incurred by the Trust are allocated among the funds based on the ratio of net assets of each fund to the combined net assets. Other expenses are charged to each fund on a specific identification basis.
Realized and unrealized gains and losses and net investment income, other than class specific expenses, are allocated daily to each class of shares based upon the relative proportion of net assets of each class.
e. Accounting Estimates
The preparation of financial statements in accordance with accounting principles generally accepted in the United States of America requires management to make estimates and assumptions that affect the reported amounts of assets and liabilities at the date of the financial statements and the amounts of income and expenses during the reporting period. Actual results could differ from those estimates.
f. Guarantees and Indemnifications
Under the Trust’s organizational documents, its officers and trustees are indemnified by the Trust against certain liability arising out of the performance of their duties to the Trust. Additionally, in the normal course of business, the Trust enters into contracts with service providers that contain general indemnification clauses. The Trust’s maximum exposure under these arrangements is unknown as this would involve future claims that may be made against the Trust that have not yet occurred. However, based on experience, the Trust expects the risk of loss to be remote.
2. SHARES OF BENEFICIAL INTEREST
The Fund offers two classes of shares: Class 1 and Class 2. Each class of shares differs by its distribution fees, voting rights on matters affecting a single class and its exchange privilege.
At December 31, 2004, there were an unlimited number of shares authorized ($.01 par value). Transactions in the Fund’s shares were as follows:
| | | | | | | | | | | | | | |
| | | Year Ended December 31,
| |
| | | 2004 | | | 2003 | |
| | |
| |
| Class 1 Shares: | | Shares | | | Amount | | | Shares | | | Amount | |
| | |
| |
Shares sold | | 241,760 | | | $ | 3,462,584 | | | 688,775 | | | $ | 8,672,422 | |
Shares issued in reinvestment of distributions | | 67,210 | | | | 963,792 | | | 105,567 | | | | 1,331,195 | |
Shares redeemed | | (2,728,506 | ) | | | (38,860,861 | ) | | (3,017,447 | ) | | | (36,202,435 | ) |
| | |
| |
Net increase (decrease) | | (2,419,536 | ) | | $ | (34,434,485 | ) | | (2,223,105 | ) | | $ | (26,198,818 | ) |
| | |
| |
| Class 2 Shares: | | | | | | | | | | | | |
Shares sold | | 15,438,375 | | | $ | 218,356,580 | | | 6,995,198 | | | $ | 86,731,493 | |
Shares issued in reinvestment of distributions | | 67,970 | | | | 964,498 | | | 34,168 | | | | 427,106 | |
Shares redeemed | | (1,890,421 | ) | | | (26,397,687 | ) | | (550,967 | ) | | | (6,644,355 | ) |
| | |
| |
Net increase (decrease) | | 13,615,924 | | | $ | 192,923,391 | | | 6,478,399 | | | $ | 80,514,244 | |
| | |
| |
FL-18
FRANKLIN TEMPLETON VARIABLE INSURANCE PRODUCTS TRUST
FRANKLIN LARGE CAP GROWTH SECURITIES FUND
Notes to Financial Statements (continued)
3. TRANSACTIONS WITH AFFILIATES
Certain officers and trustees of the Fund are also officers and/or directors of the following entities:
| | |
| Entity | | Affiliation |
Franklin Advisers Inc. (Advisers) | | Investment manager |
Franklin Templeton Services LLC (FT Services) | | Administrative manager |
Franklin Templeton Distributors Inc. (Distributors) | | Principal underwriter |
Franklin Templeton Investor Services LLC (Investor Services) | | Transfer agent |
a. Management Fees
The Fund pays an investment management fee to Advisers based on the average daily net assets of the Fund as follows:
| | |
| Annualized Fee Rate | | Net Assets |
| .750% | | First $500 million |
| .625% | | Over $500 million, up to and including $1 billion |
| .500% | | Over $1 billion |
b. Administrative Fees
Under an agreement with Advisers, FT Services provides administrative services to the Fund. The fee is paid by Advisers based on the average daily net assets of the Fund, and is not an additional expense of the Fund.
c. Distribution Fees
The Fund reimburses Distributors up to .25% per year of its average daily net asset of Class 2, for costs incurred in marketing the Fund’s shares under a Rule 12b-1 plan.
d. Transfer Agent Fees
Investor Services, under terms of an agreement, performs shareholder servicing for the Fund and is not paid by the Fund for the services.
4. EXPENSE OFFSET ARRANGEMENT
The Fund has entered into an arrangement with its custodian whereby credits realized as a result of uninvested cash balances are used to reduce a portion of the Fund’s custodian expenses. During the year ended December 31, 2004, the custodian fees were reduced as noted in the Statement of Operations.
5. INCOME TAXES
At December 31, 2004, the Fund had tax basis capital losses which may be carried over to offset future capital gains. Such losses expire as follows:
| | | |
| Capital loss carryovers expiring in: | | |
2010 | | $ | 31,717,867 |
2011 | | | 1,580,921 |
| | |
|
|
| | | $ | 33,298,788 |
| | |
|
|
FL-19
FRANKLIN TEMPLETON VARIABLE INSURANCE PRODUCTS TRUST
FRANKLIN LARGE CAP GROWTH SECURITIES FUND
Notes to Financial Statements (continued)
5. INCOME TAXES (cont.)
The tax character of distributions paid during the years ended December 31, 2004 and 2003, was as follows:
| | | | | | |
| | | 2004 | | 2003 |
| | |
|
Distributions paid from ordinary income | | $ | 1,928,290 | | $ | 1,758,301 |
Net realized gains (losses) differ for financial statement and tax purposes primarily due to differing treatment of wash sales.
At December 31, 2004, the cost of investments, net unrealized appreciation (depreciation), and undistributed ordinary income for income tax purposes were as follows:
| | | | |
Cost of investments | | $ | 454,245,085 | |
| | |
|
|
|
Unrealized appreciation | | $ | 71,623,854 | |
Unrealized depreciation | | | (11,719,996 | ) |
| | |
|
|
|
Net unrealized appreciation (depreciation) | | $ | 59,903,858 | |
| | |
|
|
|
Distributable earnings – undistributed ordinary income | | $ | 3,350,478 | |
| | |
|
|
|
6. INVESTMENT TRANSACTIONS
Purchases and sales of investments (excluding short-term securities) for the year ended December 31, 2004, aggregated $269,105,184 and $141,924,078, respectively.
7. REGULATORY MATTERS
Investigations
As part of various investigations by a number of federal, state, and foreign regulators and governmental entities, including the Securities and Exchange Commission (“SEC”), the California Attorney General’s Office (“CAGO”), and the National Association of Securities Dealers, Inc. (“NASD”), relating to certain practices in the mutual fund industry, including late trading, market timing and marketing support payments to securities dealers who sell fund shares, Franklin Resources, Inc. and certain of its subsidiaries (as used in this section, together, the “Company”), as well as certain current or former executives and employees of the Company, received subpoenas and/or requests for documents, information and/or testimony. The Company and its current employees provided documents and information in response to those requests and subpoenas.
Settlements
Beginning in August 2004, the Company entered into settlements with certain regulators investigating the mutual fund industry practices noted above. The Company believes that settlement of each of the matters described in this section is in the best interest of the Company and shareholders of the Franklin, Templeton, and Mutual Series mutual funds (the “funds”).
On August 2, 2004, Franklin Resources, Inc. announced that its subsidiary, Franklin Advisers, Inc., reached an agreement with the SEC that resolved the issues resulting from the SEC investigation into market timing activity. In connection with that agreement, the SEC issued an “Order Instituting Administrative and Cease-and-Desist Proceedings Pursuant to Sections 203(e) and 203(k) of the Investment Advisers Act of 1940 and Sections 9(b) and 9(f) of the Investment Company Act of 1940, Making Findings and Imposing Remedial Sanctions and a Cease-and-Desist Order” (the “Order”). The SEC’s Order concerned the activities of a limited number of third parties that ended in 2000 and those that were the subject of the first Massachusetts administrative complaint described below.
FL-20
FRANKLIN TEMPLETON VARIABLE INSURANCE PRODUCTS TRUST
FRANKLIN LARGE CAP GROWTH SECURITIES FUND
Notes to Financial Statements (continued)
7. REGULATORY MATTERS (cont.)
Settlements (cont.)
Under the terms of the SEC’s Order, pursuant to which Franklin Advisers, Inc. neither admitted nor denied any of the findings contained therein, Franklin Advisers, Inc. agreed to pay $50 million, of which $20 million is a civil penalty, to be distributed to shareholders of certain funds in accordance with a plan to be developed by an independent distribution consultant. At this time, it is unclear which funds or which shareholders of any particular fund will receive distributions. The Order also required Franklin Advisers, Inc. to, among other things, enhance and periodically review compliance policies and procedures.
On September 20, 2004, Franklin Resources, Inc. announced that two of its subsidiaries, Franklin Advisers, Inc. and Franklin Templeton Alternative Strategies, Inc. (“FTAS”), reached an agreement with the Securities Division of the Office of the Secretary of the Commonwealth of Massachusetts (the “State of Massachusetts”) related to its administrative complaint filed on February 4, 2004, concerning one instance of market timing that was also a subject of the August 2, 2004 settlement that Franklin Advisers, Inc. reached with the SEC, as described above.
Under the terms of the settlement consent order issued by the State of Massachusetts, Franklin Advisers, Inc. and FTAS consented to the entry of a cease-and-desist order and agreed to pay a $5 million administrative fine to the State of Massachusetts (the “Massachusetts Consent Order”). The Massachusetts Consent Order included two different sections: “Statements of Fact” and “Violations of Massachusetts Securities Laws.” Franklin Advisers, Inc. and FTAS admitted the facts in the Statements of Fact.
On October 25, 2004, the State of Massachusetts filed a second administrative complaint, alleging that Franklin Resources, Inc.’s Form 8-K filing (in which it described the Massachusetts Consent Order and stated that “Franklin did not admit or deny engaging in any wrongdoing”) failed to state that Franklin Advisers, Inc. and FTAS admitted the Statements of Fact portion of the Massachusetts Consent Order (the “Second Complaint”). Franklin Resources, Inc. reached a second agreement with the State of Massachusetts on November 19, 2004, resolving the Second Complaint. As a result of the November 19, 2004 settlement, Franklin Resources, Inc. filed a new Form 8-K. The terms of the Massachusetts Consent Order did not change and there was no monetary fine associated with this second settlement.
On November 17, 2004, Franklin Resources, Inc. announced that Franklin/Templeton Distributors, Inc. (“FTDI”) reached an agreement with the CAGO, resolving the issues resulting from the CAGO’s investigation concerning sales and marketing support payments. Under the terms of the settlement, FTDI neither admitted nor denied the allegations in the CAGO’s complaint and agreed to pay $2 million to the State of California as a civil penalty, $14 million to the funds, to be allocated by an independent distribution consultant to be paid for by FTDI, and $2 million to the CAGO for its investigative costs.
On December 13, 2004, Franklin Resources, Inc. announced that its subsidiaries FTDI and Franklin Advisers, Inc. reached an agreement with the SEC, resolving the issues resulting from the SEC’s investigation concerning marketing support payments to securities dealers who sell fund shares. In connection with that agreement, the SEC issued an “Order Instituting Administrative and Cease-and-Desist Proceedings, Making Findings, and Imposing Remedial Sanctions Pursuant to Sections 203(e) and 203(k) of the Investment Advisers Act of 1940, Sections 9(b) and 9(f) of the Investment Company Act of 1940, and Section 15(b) of the Securities Exchange Act of 1934” (the “Second Order”).
Under the terms of the Second Order, in which FTDI and Franklin Advisers, Inc. neither admitted nor denied the findings contained therein, they agreed to pay the funds a penalty of $20 million and disgorgement of $1 (one dollar). FTDI and Franklin Advisers, Inc. also agreed to implement certain measures and undertakings relating to marketing support payments to broker-dealers for the promotion or sale of fund shares, including making additional disclosures in the funds’ Prospectuses and Statements of Additional Information. The Second Order further requires the appointment of an independent distribution consultant, at the Company’s expense, who shall develop a plan for the distribution of the penalty and disgorgement to the funds.
FL-21
FRANKLIN TEMPLETON VARIABLE INSURANCE PRODUCTS TRUST
FRANKLIN LARGE CAP GROWTH SECURITIES FUND
Notes to Financial Statements (continued)
7. REGULATORY MATTERS (cont.)
Other Legal Proceedings
The Trust, in addition to the Company and other funds, and certain current and former officers, employees, and directors have been named in multiple lawsuits in different federal courts in Nevada, California, Illinois, New York and Florida, alleging violations of various federal securities laws and seeking, among other relief, monetary damages, restitution, removal of fund trustees, directors, advisers, administrators, and distributors, rescission of management contracts and 12b-1 Plans, and/or attorneys’ fees and costs. Specifically, the lawsuits claim breach of duty with respect to alleged arrangements to permit market timing and/or late trading activity, or breach of duty with respect to the valuation of the portfolio securities of certain Templeton funds managed by Franklin Resources, Inc. subsidiaries, resulting in alleged market timing activity. The majority of these lawsuits duplicate, in whole or in part, the allegations asserted in the February 4, 2004 Massachusetts administrative complaint and the findings in the SEC’s August 2, 2004 Order, as described above. The lawsuits are styled as class actions, or derivative actions on behalf of either the named funds or Franklin Resources, Inc.
In addition, the Company, as well as certain current and former officers, employees, and directors, have been named in multiple lawsuits alleging violations of various securities laws and pendent state law claims relating to the disclosure of directed brokerage payments and/or payment of allegedly excessive advisory, commission, and distribution fees, and seeking, among other relief, monetary damages, restitution, rescission of advisory contracts, including recovery of all fees paid pursuant to those contracts, an accounting of all monies paid to the named advisers, declaratory relief, injunctive relief, and/or attorneys’ fees and costs. These lawsuits are styled as class actions or derivative actions brought on behalf of certain funds.
The Company and fund management strongly believes that the claims made in each of the lawsuits identified above are without merit and intends to vigorously defend against them. The Company cannot predict with certainty, however, the eventual outcome of the remaining governmental investigations or private lawsuits, nor whether they will have a material negative impact on the Company. Public trust and confidence are critical to the Company’s business and any material loss of investor and/or client confidence could result in a significant decline in assets under management by the Company, which would have an adverse effect on the Company’s future financial results. If the Company finds that it bears responsibility for any unlawful or inappropriate conduct that caused losses to the Trust, it is committed to making the Trust or its shareholders whole, as appropriate. The Company is committed to taking all appropriate actions to protect the interests of its funds’ shareholders.
FL-22
FRANKLIN TEMPLETON VARIABLE INSURANCE PRODUCTS TRUST
FRANKLIN LARGE CAP GROWTH SECURITIES FUND
Report of Independent Registered Public Accounting Firm
To the Trustees and Shareholders of Franklin Templeton Variable Insurance Products Trust
In our opinion, the accompanying statement of assets and liabilities, including the statement of investments, and the related statements of operations and of changes in net assets and the financial highlights present fairly, in all material respects, the financial position of Franklin Large Cap Growth Securities Fund (the Fund) (one of the funds constituting Franklin Templeton Variable Insurance Products Trust) at December 31, 2004, the results of its operations for the year then ended, the changes in its net assets for each of the two years in the period then ended and the financial highlights for each of the five years in the period then ended, in conformity with accounting principles generally accepted in the United States of America. These financial statements and financial highlights (hereafter referred to as “financial statements”) are the responsibility of the Fund’s management; our responsibility is to express an opinion on these financial statements based on our audits. We conducted our audits of these financial statements in accordance with the standards of the Public Company Accounting Oversight Board (United States). Those standards require that we plan and perform the audits to obtain reasonable assurance about whether the financial statements are free of material misstatement. An audit includes examining, on a test basis, evidence supporting the amounts and disclosures in the financial statements, assessing the accounting principles used and significant estimates made by management, and evaluating the overall financial statement presentation. We believe that our audits, which included confirmation of securities at December 31, 2004 by correspondence with the custodian and brokers, provide a reasonable basis for our opinion.
PricewaterhouseCoopers LLP
San Francisco, California
February 9, 2005
FL-23
FRANKLIN TEMPLETON VARIABLE INSURANCE PRODUCTS TRUST
FRANKLIN LARGE CAP GROWTH SECURITIES FUND
Tax Designation
Under Section 854(b)(2) of the Internal Revenue Code, the Fund hereby designates 100% of the ordinary income dividends as income qualifying for the dividends received deduction for the fiscal year ended December 31, 2004.
FL-24
FRANKLIN MONEY MARKET FUND
Fund Goals and Main Investments: Franklin Money Market Fund seeks high current income, consistent with liquidity and capital preservation. The Fund also seeks to maintain a stable share price of $1.00. The Fund invests in U.S. dollar-denominated money market debt instruments.
This annual report for Franklin Money Market Fund covers the fiscal year ended December 31, 2004.
Economic and Market Overview
During the year under review, there was much focus on the employment picture and its resulting effects on the consumer. Although nonfarm payroll statistics were mixed, stronger employment growth fundamentals were reflected in several sources. One was the National Federation of Independent Businesses (NFIB) survey, which was notable because small businesses historically have created about two-thirds of all new jobs.1 During the period under review, more jobs combined with income tax reductions helped increase consumers’ disposable income and allowed them to continue spending, in turn boosting economic growth.
Increases in business spending also contributed to economic growth. After steadily declining in 2001 and 2002, business spending posted strong results during 2004. For example, nonresidential investment spending rose 10.3% for the year.2 Historically low interest rates during the reporting period allowed many businesses the opportunity to refinance their old debt at more attractive levels. This helped enhance business operating performance, and corporate profits reflected this data. Many corporate debt investments also benefited from this improvement. Productivity continued to grow, which helped businesses generate more goods and services without substantially raising inflation.
Energy prices rose substantially during the year, and then declined toward the end, as oil ended the year at approximately $43 a barrel. In an effort to keep inflation in check, the Federal Reserve Board raised the federal funds target rate to 2.25% from 1.00% during the reporting period. However, the core Consumer Price Index, a measure of inflation excluding food and energy costs, rose a relatively modest 2.2% for the 12 months ended December 31, 2004, and helped contribute to the continued low interest rate level during the period.3 Many analysts had
1. Source: Dennis, William J., Jr., NFIB Research Foundation, “The Public Reviews Small Business,” 8/04.
2. Source: Bureau of Economic Analysis.
3. Source: Bureau of Labor Statistics.
An investment in the Fund is not insured or guaranteed by the Federal Deposit Insurance Corporation or any other government agency or institution. Although the Fund seeks to preserve the value of your investment at $1.00 per share, it is possible to lose money by investing in the Fund.
Fund Risks: Bonds and other debt obligations are affected by changes in interest rates and the creditworthiness of their issuers. The Fund’s prospectus also includes a description of the main investment risks.
FM-1
expected the 10-year U.S. Treasury yield to increase significantly; however, it ended the year relatively flat. This yield began the year at 4.27%, rose to a high of 4.89% and declined to 4.24% on December 31, 2004.
Investment Strategy
In selecting investments, we use a conservative investment approach, focusing on the highest quality and the most liquid of eligible money market securities. We assess the relative value of each security meeting our credit criteria to find the best combination of assets we believe will maximize the Fund’s yield relative to our expectations of the investment environment. We monitor short-term interest rates, economic conditions, and Federal Reserve Board monetary policy to determine the portfolio maturity we believe will provide high overall return.
Manager’s Discussion
Consistent with our strategy, we continued to invest mainly in high-quality money market securities. For example, on December 31, 2004, more than 89% of the portfolio was invested in securities with AA long-term credit ratings by independent credit rating agencies Standard & Poor’s and Moody’s Investors Service, with the balance rated A.4
Thank you for your participation in Franklin Money Market Fund. We look forward to serving your future investment needs.
4. These do not indicate ratings of the Fund.
The foregoing information reflects our analysis, opinions and portfolio holdings as of December 31, 2004, the end of the reporting period. The way we implement our main investment strategies and the resulting portfolio holdings may change depending on factors such as market and economic conditions. These opinions may not be relied upon as investment advice or an offer for a particular security. The information is not a complete analysis of every aspect of any market, country, industry, security or the Fund. Statements of fact are from sources considered reliable, but the adviser makes no representation or warranty as to their completeness or accuracy. Although historical performance is no guarantee of future results, these insights may help you understand our investment management philosophy.
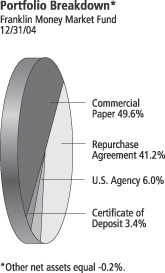
The dollar value, number of shares or principal amount, and names of all portfolio holdings are listed in the Fund’s Statement of Investments.
FM-2
Fund Expenses
As an investor in a variable insurance contract (“Contract”) that indirectly provides for investment in an underlying mutual fund, you can incur transaction and/or ongoing expenses at both the Fund level and the Contract level.
| • | | Transaction expenses can include sales charges (loads) on purchases, redemption fees, surrender fees, transfer fees and premium taxes. |
| • | | Ongoing expenses can include management fees, distribution and service (12b-1) fees, contract fees, annual maintenance fees, mortality and expense risk fees and other fees and expenses. All mutual funds and Contracts have some types of ongoing expenses. |
The expenses shown in the table below are meant to highlight ongoing expenses at the Fund level only and do not include ongoing expenses at the Contract level, or transaction expenses at either the Fund or Contract levels. While the Fund does not have transaction expenses, if the transaction and ongoing expenses at the Contract level were included, the expenses shown below would be higher. You should consult your Contract prospectus or disclosure document for more information.
The table shows Fund-level ongoing expenses and can help you understand these expenses and compare them with those of other mutual funds offered through the Contract. The table assumes a $1,000 investment held for the six months indicated. Please refer to the Fund prospectus for additional information on operating expenses.
Actual Fund Expenses
The first line (Actual) for each share class listed in the table below provides actual account values and expenses. The “Ending Account Value” is derived from the Fund’s actual return, which includes the effect of ongoing Fund expenses, but does not include the effect of ongoing Contract expenses.
You can estimate the Fund-level expenses you incurred during the period, by following these steps. Of course, your account value and expenses will differ from those in this illustration:
| 1. | Divide your account value by $1,000. |
If an account had an $8,600 value, then $8,600 ÷ $1,000 = 8.6.
| 2. | Multiply the result by the number under the heading “Fund-Level Expenses Incurred During Period.” |
If Fund-Level Expenses Incurred During Period were $7.50, then 8.6 × $7.50 = $64.50.
Franklin Money Market Fund – Class 2
FM-3
In this illustration, the estimated expenses incurred this period at the Fund level are $64.50.
Hypothetical Example for Comparison with Other Mutual Funds
Information in the second line (Hypothetical) for each class in the table can help you compare ongoing expenses of the Fund with those of other mutual funds offered through the Contract. This information may not be used to estimate the actual ending account balance or expenses you incurred during the period. The hypothetical “Ending Account Value” is based on the actual expense ratio for each class and an assumed 5% annual rate of return before expenses, which does not represent the Fund’s actual return. The figure under the heading “Fund-Level Expenses Incurred During Period” shows the hypothetical expenses your account would have incurred under this scenario. You can compare this figure with the 5% hypothetical examples that appear in shareholder reports of other funds offered through a Contract.
| | | | | | | | | |
| Class 2 | | Beginning Account Value 6/30/04 | | Ending Account Value 12/31/04 | | Fund-Level Expenses Incurred During Period* 6/30/04-12/31/04 |
Actual | | $ | 1,000 | | $ | 1,003.70 | | $ | 4.78 |
Hypothetical (5% return before expenses) | | $ | 1,000 | | $ | 1,020.36 | | $ | 4.82 |
*Expenses are equal to the annualized expense ratio for the Fund’s Class 1 shares (0.95%), which does not include any ongoing expenses of the Contract for which the Fund is an investment option, multiplied by the average account value over the period, multiplied by 184/366 to reflect the one-half year period.
FM-4
FRANKLIN TEMPLETON VARIABLE INSURANCE PRODUCTS TRUST
FRANKLIN MONEY MARKET FUND
Financial Highlights
| | | | | | | | | | | | | | | | | | | | |
| | | Class 1
| |
| | | Year Ended December 31, | |
| | |
|
|
|
| | | 2004 | | | 2003 | | | 2002 | | | 2001 | | | 2000 | |
| | |
|
|
|
Per share operating performance | | | | | | | | | | | | | | | | | | | | |
(for a share outstanding throughout the year) | | | | | | | | | | | | | | | | | | | | |
Net asset value, beginning of year | | $ | 1.00 | | | $ | 1.00 | | | $ | 1.00 | | | $ | 1.00 | | | $ | 1.00 | |
| | |
|
|
|
Income from investment operations - net investment income | | | .01 | | | | .01 | | | | .01 | | | | .04 | | | | .06 | |
Less distributions from net investment income | | | (.01 | ) | | | (.01 | ) | | | (.01 | ) | | | (.04 | ) | | | (.06 | ) |
| | |
|
|
|
Net asset value, end of year | | $ | 1.00 | | | $ | 1.00 | | | $ | 1.00 | | | $ | 1.00 | | | $ | 1.00 | |
| | |
|
|
|
| | | | | |
Total returna | | | .73% | | | | .52% | | | | 1.33% | | | | 3.91% | | | | 5.95% | |
Ratios/supplemental data | | | | | | | | | | | | | | | | | | | | |
Net assets, end of year (000’s) | | $ | 59,026 | | | $ | 81,734 | | | $ | 119,819 | | | $ | 200,911 | | | $ | 274,580 | |
Ratios to average net assets: | | | | | | | | | | | | | | | | | | | | |
Expenses | | | .68% | | | | .66% | | | | .63% | | | | .56% | | | | .55% | |
Net investment income | | | .67% | | | | .56% | | | | 1.37% | | | | 3.89% | | | | 5.75% | |
| a | Total return does not include any fees, charges or expenses imposed by the variable annuity and life insurance contracts for which the Franklin Templeton Variable Insurance Products Trust serves as an underlying investment vehicle. Total return is not annualized for periods less than one year. |
FM-5
See notes to financial statements.
FRANKLIN TEMPLETON VARIABLE INSURANCE PRODUCTS TRUST
FRANKLIN MONEY MARKET FUND
Financial Highlights (continued)
| | | | | | | | | | | | | | | | | | | | |
| | | Class 2
| |
| | | Year Ended December 31, | |
| | |
|
|
|
| | | 2004 | | | 2003 | | | 2002 | | | 2001 | | | 2000 | |
| | |
|
|
|
Per share operating performance | | | | | | | | | | | | | | | | | | | | |
(for a share outstanding throughout the year) | | | | | | | | | | | | | | | | | | | | |
Net asset value, beginning of year | | $ | 1.00 | | | $ | 1.00 | | | $ | 1.00 | | | $ | 1.00 | | | $ | 1.00 | |
| | |
|
|
|
Income from investment operations - net investment income | | | — | b | | | — | b | | | .01 | | | | .04 | | | | .06 | |
Less distributions from net investment income | | | — | b | | | — | b | | | (.01 | ) | | | (.04 | ) | | | (.06 | ) |
| | |
|
|
|
Net asset value, end of year | | $ | 1.00 | | | $ | 1.00 | | | $ | 1.00 | | | $ | 1.00 | | | $ | 1.00 | |
| | |
|
|
|
| | | | | |
Total returna | | | .44% | | | | .27% | | | | 1.08% | | | | 3.65% | | | | 5.69% | |
Ratios/supplemental data | | | | | | | | | | | | | | | | | | | | |
Net assets, end of year (000’s) | | $ | 887 | | | $ | 590 | | | $ | 479 | | | $ | 952 | | | $ | 21,609 | |
Ratios to average net assets: | | | | | | | | | | | | | | | | | | | | |
Expenses | | | .93% | | | | .91% | | | | .88% | | | | .81% | | | | .79% | |
Net investment income | | | .42% | | | | .31% | | | | 1.12% | | | | 3.52% | | | | 5.59% | |
| a | Total return does not include any fees, charges or expenses imposed by the variable annuity and life insurance contracts for which the Franklin Templeton Variable Insurance Products Trust serves as an underlying investment vehicle. Total return is not annualized for periods less than one year. |
| b | Includes net investment income and distributions from net investment income in the amount of $.004 and $.003 for the year ended December 31, 2004 and the year ended December 31, 2003, respectively. |
See notes to financial statements.
FM-6
FRANKLIN TEMPLETON VARIABLE INSURANCE PRODUCTS TRUST
FRANKLIN MONEY MARKET FUND
Statement of Investments, December 31, 2004
| | | | | | | |
| | | Principal
Amount | | Value | |
Certificates of Deposit 3.4% | | | | | | | |
Banque Nationale De Paris, 2.255%, 8/16/05 | | $ | 1,000,000 | | $ | 999,907 | |
Landesbank Hessen Thueringen G, 1.2725%, 2/14/05 | | | 1,000,000 | | | 999,239 | |
| | | | | |
|
|
|
Total Certificates of Deposit (Cost $1,999,146) | | | | | | 1,999,146 | |
| | | | | |
|
|
|
Commercial Paper 49.6% | | | | | | | |
aANZ (Delaware) Inc., 2/14/05 | | | 350,000 | | | 349,025 | |
aBP Capital Markets PLC, 1/03/05 - 1/07/05 | | | 2,500,000 | | | 2,499,445 | |
aBarclays U.S. Funding Corp., 1/03/05 - 3/07/05 | | | 1,000,000 | | | 997,415 | |
aCitigroup Global Markets Holdings Inc., 1/13/05 - 1/21/05 | | | 2,500,000 | | | 2,497,478 | |
aCommonwealth Bank of Australia, 1/10/05 - 3/02/05 | | | 2,300,000 | | | 2,294,992 | |
aDanske Corp., 1/03/05 - 1/12/05 | | | 650,000 | | | 649,782 | |
aGeneral Electric Capital Corp., 1/04/05 - 3/16/05 | | | 2,650,000 | | | 2,642,858 | |
aGoldman Sachs Group Inc., 1/04/05 - 1/21/05 | | | 1,500,000 | | | 1,498,674 | |
aHBOS Treasury Services, 1/11/05 - 3/08/05 (United Kingdom) | | | 2,550,000 | | | 2,544,498 | |
aInternationale NED U.S. Funding, 2/01/05 | | | 1,000,000 | | | 998,398 | |
aMerrill Lynch & Co. Inc., 1/03/05 - 1/27/05 | | | 2,500,000 | | | 2,497,503 | |
aMorgan Stanley Dean Witter & Co., 1/05/05 - 1/14/05 | | | 2,500,000 | | | 2,498,640 | |
aRoyal Bank of Scotland PLC, 1/11/05 | | | 500,000 | | | 499,699 | |
aShell Finance UK PLC, 1/03/05 - 2/01/05 | | | 1,823,000 | | | 1,821,657 | |
aSiemens Capital Corp., 1/28/05 - 1/31/05 | | | 1,500,000 | | | 1,497,325 | |
aUBS AG Finance Delaware Inc., 1/18/05 - 2/28/05 | | | 1,650,000 | | | 1,645,999 | |
aWestpac Capital Corp., 1/06/05 - 3/03/05 | | | 2,304,000 | | | 2,299,019 | |
| | | | | |
|
|
|
Total Commercial Paper (Cost $29,732,407) | | | | | | 29,732,407 | |
| | | | | |
|
|
|
U.S. Government Agency Securities 6.0% | | | | | | | |
Fannie Mae, 1.33% - 1.89%, 1/07/05 - 1/26/05 | | | 1,400,000 | | | 1,399,260 | |
Federal Home Loan Bank, 2.28%, 2/18/05 - 4/01/05 | | | 1,500,000 | | | 1,498,487 | |
Freddie Mac, 1.89% - 2.35%, 1/25/05 - 3/01/05 | | | 700,000 | | | 698,608 | |
| | | | | |
|
|
|
Total U.S. Government Agency Securities (Cost $3,596,355) | | | | | | 3,596,355 | |
| | | | | |
|
|
|
Total Investments before Repurchase Agreements (Cost $35,327,908) | | | | | | 35,327,908 | |
| | | | | |
|
|
|
Repurchase Agreements 41.2% | | | | | | | |
bABN Amro Bank, 2.00%, 1/03/05 (Maturity Value $12,357,059) | | | 12,355,000 | | | 12,355,000 | |
Collateralized by U.S. Government Agency Securities, 6.625%, 9/15/09 | | | | | | | |
bUBS Securities LLC, 1.80%, 1/03/05 (Maturity Value $12,351,853) | | | 12,350,000 | | | 12,350,000 | |
Collateralized by U.S. Government Agency Securities, 6.625%, 9/15/09 | | | | | | | |
| | | | | |
|
|
|
Total Repurchase Agreements (Cost $24,705,000) | | | | | | 24,705,000 | |
| | | | | |
|
|
|
Total Investments (Cost $60,032,908) 100.2% | | | | | | 60,032,908 | |
Other Assets, less Liabilities (.2)% | | | | | | (120,133 | ) |
| | | | | |
|
|
|
Net Assets 100.0% | | | | | $ | 59,912,775 | |
| | | | | |
|
|
|
| a | Security is traded on a discount basis with no stated coupon rate. |
| b | See Note 1(b) regarding repurchase agreements. |
FM-7
See notes to financial statements.
FRANKLIN TEMPLETON VARIABLE INSURANCE PRODUCTS TRUST
FRANKLIN MONEY MARKET FUND
Financial Statements
Statement of Assets and Liabilities
December 31, 2004
| | | |
Assets: | | | |
Investments in securities, at amortized cost (Note 1) | | $ | 35,327,908 |
Repurchase agreements, at value and cost | | | 24,705,000 |
| | |
|
|
Total investments | | | 60,032,908 |
| | |
|
|
Cash | | | 4,766 |
Interest receivable | | | 24,963 |
| | |
|
|
Total assets | | | 60,062,637 |
| | |
|
|
Liabilities: | | | |
Payables: | | | |
Capital shares redeemed | | | 104,183 |
Affiliates | | | 32,351 |
Professional fees | | | 10,890 |
Other liabilities | | | 2,438 |
| | |
|
|
Total liabilities | | | 149,862 |
| | |
|
|
Net assets, at value | | $ | 59,912,775 |
| | |
|
|
Class 1: | | | |
Net assets, at value | | $ | 59,026,205 |
| | |
|
|
Shares outstanding | | | 59,026,205 |
| | |
|
|
Net asset value per share | | $ | 1.00 |
| | |
|
|
Class 2: | | | |
Net assets, at value | | $ | 886,570 |
| | |
|
|
Shares outstanding | | | 886,570 |
| | |
|
|
Net asset value per share | | $ | 1.00 |
| | |
|
|
See notes to financial statements.
FM-8
FRANKLIN TEMPLETON VARIABLE INSURANCE PRODUCTS TRUST
FRANKLIN MONEY MARKET FUND
Financial Statements (continued)
Statement of Operations
for the year ended December 31, 2004
| | | | |
Investment income: | | | | |
Interest | | $ | 978,897 | |
| | |
|
|
|
| |
Expenses: | | | | |
Management fees (Note 3) | | | 454,071 | |
Distribution fees - Class 2 (Note 3) | | | 1,750 | |
Transfer agent fees | | | 731 | |
Custodian fees (Note 4) | | | 1,675 | |
Reports to shareholders | | | 24,739 | |
Professional fees | | | 7,063 | |
Trustees’ fees and expenses | | | 510 | |
Other | | | 4,470 | |
| | |
|
|
|
Total expenses | | | 495,009 | |
Expense reductions (Note 4) | | | (679 | ) |
| | |
|
|
|
Net expenses | | | 494,330 | |
| | |
|
|
|
Net investment income | | | 484,567 | |
| | |
|
|
|
Net increase (decrease) in net assets resulting from operations | | $ | 484,567 | |
| | |
|
|
|
See notes to financial statements.
FM-9
FRANKLIN TEMPLETON VARIABLE INSURANCE PRODUCTS TRUST
Franklin Money Market Fund
Financial Statements (continued)
Statements of Changes in Net Assets
for the years ended December 31, 2004 and 2003
| | | | | | | | |
| | | 2004 | | | 2003 | |
| | |
| |
Increase (decrease) in net assets: | | | | | | | | |
Operations: | | | | | | | | |
Net investment income | | $ | 484,567 | | | $ | 554,124 | |
Net realized gain (loss) from investments | | | — | | | | 577 | |
| | |
| |
Net increase (decrease) in net assets resulting from operations | | | 484,567 | | | | 554,701 | |
Distributions to shareholders from net investment income:a | | | | | | | | |
Class 1 | | | (481,257 | ) | | | (553,446 | ) |
Class 2 | | | (3,310 | ) | | | (1,255 | ) |
| | |
| |
Total distributions to shareholders | | | (484,567 | ) | | | (554,701 | ) |
Capital share transactions: (Note 2) | | | | | | | | |
Class 1 | | | (22,708,015 | ) | | | (38,084,738 | ) |
Class 2 | | | 296,950 | | | | 110,815 | |
| | |
| |
Total capital share transactions | | | (22,411,065 | ) | | | (37,973,923 | ) |
| | |
| |
Net increase (decrease) in net assets | | | (22,411,065 | ) | | | (37,973,923 | ) |
Net assets: (there is no undistributed net investment income at beginning or end of year) | | | | | | | | |
Beginning of year | | | 82,323,840 | | | | 120,297,763 | |
| | |
| |
End of year | | $ | 59,912,775 | | | $ | 82,323,840 | |
| | |
| |
| a | Distributions were increased by net realized gains of $577 from security transactions for the year ended December 31, 2003. |
See notes to financial statements.
FM-10
FRANKLIN TEMPLETON VARIABLE INSURANCE PRODUCTS TRUST
FRANKLIN MONEY MARKET FUND
Notes to Financial Statements
1. ORGANIZATION AND SIGNIFICANT ACCOUNTING POLICIES
Franklin Templeton Variable Insurance Products Trust (the Trust) is registered under the Investment Company Act of 1940 as an open-end investment company, consisting of twenty-one separate series (the Funds). Franklin Money Market Fund (the Fund) included in this report is diversified. The financial statements of the remaining funds in the series are presented separately. Shares of the Fund are sold only to insurance company separate accounts to fund the benefits of variable life insurance policies or variable annuity contracts. As of December 31, 2004, over 97% of the Fund’s shares were sold through one insurance company. The Fund’s investment objective is to obtain a high level of current income while seeking capital preservation and liquidity.
The following summarizes the Fund’s significant accounting policies.
a. Security Valuation
Securities are valued at amortized cost which approximates value. Repurchase agreements are valued at cost.
b. Repurchase Agreements
The Fund may enter into repurchase agreements, which are accounted for as a loan by the Fund to the seller, collateralized by securities which are delivered to the Fund’s custodian. The market value, including accrued interest, of the initial collateralization is required to be at least 102% of the dollar amount invested by the Fund, with the value of the underlying securities marked to market daily to maintain coverage of at least 100%. At December 31, 2004, all repurchase agreements held by the Fund had been entered into on that date.
c. Income Taxes
No provision has been made for U.S. income taxes because the Fund’s policy is to qualify as a regulated investment company under Subchapter M of the Internal Revenue Code and to distribute substantially all of its taxable income. Fund distributions to shareholders are determined on an income tax basis and may differ from net investment income and realized gains for financial reporting purposes.
d. Security Transactions, Investment Income, Expenses and Distributions
Security transactions are accounted for on trade date. Realized gains and losses on security transactions are determined on a specific identification basis. Interest income and estimated expenses are accrued daily. Dividends from net investment income and capital gains or losses are normally declared daily. Such distributions are reinvested in additional shares of the Fund.
Common expenses incurred by the Trust are allocated among the funds based on the ratio of net assets of each fund to the combined net assets. Other expenses are charged to each fund on a specific identification basis.
Net investment income, other than class specific expenses, is allocated daily to each class of shares based upon the relative value of the settled shares of each class. Realized and unrealized gains and losses are allocated daily to each class of shares based upon the relative proportion of net assets of each class.
e. Accounting Estimates
The preparation of financial statements in accordance with accounting principles generally accepted in the United States of America requires management to make estimates and assumptions that affect the reported amounts of assets and liabilities at the date of the financial statements and the amounts of income and expenses during the reporting period. Actual results could differ from those estimates.
FM-11
FRANKLIN TEMPLETON VARIABLE INSURANCE PRODUCTS TRUST
FRANKLIN MONEY MARKET FUND
Notes to Financial Statements (continued)
1. ORGANIZATION AND SIGNIFICANT ACCOUNTING POLICIES (cont.)
f. Guarantees and Indemnifications
Under the Trust’s organizational documents, its officers and trustees are indemnified by the Trust against certain liability arising out of the performance of their duties to the Trust. Additionally, in the normal course of business, the Trust enters into contracts with service providers that contain general indemnification clauses. The Trust’s maximum exposure under these arrangements is unknown as this would involve future claims that may be made against the Trust that have not yet occurred. However, based on experience, the Trust expects the risk of loss to be remote.
2. SHARES OF BENEFICIAL INTEREST
The Fund offers two classes of shares: Class 1 and Class 2. Each class of shares differs by its distribution fees, voting rights on matters affecting a single class and its exchange privilege.
At December 31, 2004, there were an unlimited number of shares authorized ($.01 par value). Transactions in the Fund’s shares were as follows:
| | | | | | | | |
| | | Year Ended December 31,
| |
| | | 2004
| | | 2003
| |
| Class 1 Shares: | | | | | | |
Shares sold | | $ | 6,053,803 | | | $ | — | |
Shares issued in reinvestment of distributions | | | 503,485 | | | | 531,271 | |
Shares redeemed | | | (29,265,303 | ) | | | (38,616,009 | ) |
| | |
|
|
|
Net increase (decrease) | | $ | (22,708,015 | ) | | $ | (38,084,738 | ) |
| | |
|
|
|
| Class 2 Shares: | | | | | | |
Shares sold | | $ | 324,223 | | | $ | 242,800 | |
Shares issued in reinvestment of distributions | | | 3,234 | | | | 1,323 | |
Shares redeemed | | | (30,507 | ) | | | (133,308 | ) |
| | |
|
|
|
Net increase (decrease) | | $ | 296,950 | | | $ | 110,815 | |
| | |
|
|
|
3. TRANSACTIONS WITH AFFILIATES
Certain officers and trustees of the Fund are also officers and/or directors of the following entities:
| | |
| Entity | | Affiliation |
Franklin Advisers Inc. (Advisers) | | Investment manager |
Franklin Templeton Services LLC (FT Services) | | Administrative manager |
Franklin Templeton Distributors Inc. (Distributors) | | Principal underwriter |
Franklin Templeton Investor Services LLC (Investor Services) | | Transfer agent |
a. Management Fees
The Fund pays an investment management fee to Advisers based on the average daily net assets of the Fund as follows:
| | |
| Annualized Fee Rate | | Net Assets |
| .625% | | First $100 million |
| .500% | | Over $100 million, up to and including $250 million |
| .450% | | Over $250 million, up to and including $10 billion |
Fees are further reduced on net assets over $10 billion.
FM-12
FRANKLIN TEMPLETON VARIABLE INSURANCE PRODUCTS TRUST
FRANKLIN MONEY MARKET FUND
Notes to Financial Statements (continued)
3. TRANSACTIONS WITH AFFILIATES (cont.)
b. Administrative Fees
Under an agreement with Advisers, FT Services provides administrative services to the Fund. The fee is paid by Advisers based on the average daily net assets of the Fund, and is not an additional expense of the Fund.
c. Distribution Fees
The Fund reimburses Distributors up to .25% per year of its average daily net asset of Class 2, for costs incurred in marketing the Fund’s shares under a Rule 12b-1 plan.
d. Transfer Agent Fees
Investor Services, under terms of an agreement, performs shareholder servicing for the Fund and is not paid by the Fund for the services.
4. EXPENSE OFFSET ARRANGEMENT
The Fund has entered into an arrangement with its custodian whereby credits realized as a result of uninvested cash balances are used to reduce a portion of the Fund’s custodian expenses. During the year ended December 31, 2004, the custodian fees were reduced as noted in the Statement of Operations.
5. INCOME TAXES
At December 31, 2004, the Fund had tax basis capital losses of $724 which may be carried over to offset future capital gains. Such losses expire as follows:
| | | |
Capital loss carryovers expiring in: | | | |
2008 | | $ | 280 |
2010 | | | 444 |
| | |
|
|
| | | | $724 |
| | |
|
|
At December 31, 2004, the cost of investments and undistributed ordinary income for income tax purposes were as follows:
| | | |
Cost of investments | | $ | 60,032,908 |
Undistributed ordinary income | | $ | 7,868 |
6. REGULATORY MATTERS
Investigations
As part of various investigations by a number of federal, state, and foreign regulators and governmental entities, including the Securities and Exchange Commission (“SEC”), the California Attorney General’s Office (“CAGO”), and the National Association of Securities Dealers, Inc. (“NASD”), relating to certain practices in the mutual fund industry, including late trading, market timing and marketing support payments to securities dealers who sell fund shares, Franklin Resources, Inc. and certain of its subsidiaries (as used in this section, together, the “Company”), as well as certain current or former executives and employees of the Company, received subpoenas and/or requests for documents, information and/or testimony. The Company and its current employees provided documents and information in response to those requests and subpoenas.
FM-13
FRANKLIN TEMPLETON VARIABLE INSURANCE PRODUCTS TRUST
FRANKLIN MONEY MARKET FUND
Notes to Financial Statements (continued)
6. REGULATORY MATTERS (cont.)
Settlements
Beginning in August 2004, the Company entered into settlements with certain regulators investigating the mutual fund industry practices noted above. The Company believes that settlement of each of the matters described in this section is in the best interest of the Company and shareholders of the Franklin, Templeton, and Mutual Series mutual funds (the “funds”).
On August 2, 2004, Franklin Resources, Inc. announced that its subsidiary, Franklin Advisers, Inc., reached an agreement with the SEC that resolved the issues resulting from the SEC investigation into market timing activity. In connection with that agreement, the SEC issued an “Order Instituting Administrative and Cease-and-Desist Proceedings Pursuant to Sections 203(e) and 203(k) of the Investment Advisers Act of 1940 and Sections 9(b) and 9(f) of the Investment Company Act of 1940, Making Findings and Imposing Remedial Sanctions and a Cease-and-Desist Order” (the “Order”). The SEC’s Order concerned the activities of a limited number of third parties that ended in 2000 and those that were the subject of the first Massachusetts administrative complaint described below.
Under the terms of the SEC’s Order, pursuant to which Franklin Advisers, Inc. neither admitted nor denied any of the findings contained therein, Franklin Advisers, Inc. agreed to pay $50 million, of which $20 million is a civil penalty, to be distributed to shareholders of certain funds in accordance with a plan to be developed by an independent distribution consultant. At this time, it is unclear which funds or which shareholders of any particular fund will receive distributions. The Order also required Franklin Advisers, Inc. to, among other things, enhance and periodically review compliance policies and procedures.
On September 20, 2004, Franklin Resources, Inc. announced that two of its subsidiaries, Franklin Advisers, Inc. and Franklin Templeton Alternative Strategies, Inc. (“FTAS”), reached an agreement with the Securities Division of the Office of the Secretary of the Commonwealth of Massachusetts (the “State of Massachusetts”) related to its administrative complaint filed on February 4, 2004, concerning one instance of market timing that was also a subject of the August 2, 2004 settlement that Franklin Advisers, Inc. reached with the SEC, as described above.
Under the terms of the settlement consent order issued by the State of Massachusetts, Franklin Advisers, Inc. and FTAS consented to the entry of a cease-and-desist order and agreed to pay a $5 million administrative fine to the State of Massachusetts (the “Massachusetts Consent Order”). The Massachusetts Consent Order included two different sections: “Statements of Fact” and “Violations of Massachusetts Securities Laws.” Franklin Advisers, Inc. and FTAS admitted the facts in the Statements of Fact.
On October 25, 2004, the State of Massachusetts filed a second administrative complaint, alleging that Franklin Resources, Inc.’s Form 8-K filing (in which it described the Massachusetts Consent Order and stated that “Franklin did not admit or deny engaging in any wrongdoing”) failed to state that Franklin Advisers, Inc. and FTAS admitted the Statements of Fact portion of the Massachusetts Consent Order (the “Second Complaint”). Franklin Resources, Inc. reached a second agreement with the State of Massachusetts on November 19, 2004, resolving the Second Complaint. As a result of the November 19, 2004 settlement, Franklin Resources, Inc. filed a new Form 8-K. The terms of the Massachusetts Consent Order did not change and there was no monetary fine associated with this second settlement.
On November 17, 2004, Franklin Resources, Inc. announced that Franklin/Templeton Distributors, Inc. (“FTDI”) reached an agreement with the CAGO, resolving the issues resulting from the CAGO’s investigation concerning sales and marketing support payments. Under the terms of the settlement, FTDI neither admitted nor denied the allegations in the CAGO’s complaint and agreed to pay $2 million to the State of California as a civil penalty, $14 million to the funds, to be allocated by an independent distribution consultant to be paid for by FTDI, and $2 million to the CAGO for its investigative costs.
On December 13, 2004, Franklin Resources, Inc. announced that its subsidiaries FTDI and Franklin Advisers, Inc. reached an agreement with the SEC, resolving the issues resulting from the SEC’s investigation concerning marketing support payments to securities dealers who sell fund shares. In connection with that agreement, the SEC issued an “Order Instituting Administrative and Cease-and-Desist Proceedings, Making Findings, and Imposing Remedial Sanctions Pursuant to Sections 203(e) and 203(k)
FM-14
FRANKLIN TEMPLETON VARIABLE INSURANCE PRODUCTS TRUST
FRANKLIN MONEY MARKET FUND
Notes to Financial Statements (continued)
6. REGULATORY MATTERS (cont.)
Settlements (cont.)
of the Investment Advisers Act of 1940, Sections 9(b) and 9(f) of the Investment Company Act of 1940, and Section 15(b) of the Securities Exchange Act of 1934” (the “Second Order”).
Under the terms of the Second Order, in which FTDI and Franklin Advisers, Inc. neither admitted nor denied the findings contained therein, they agreed to pay the funds a penalty of $20 million and disgorgement of $1 (one dollar). FTDI and Franklin Advisers, Inc. also agreed to implement certain measures and undertakings relating to marketing support payments to broker-dealers for the promotion or sale of fund shares, including making additional disclosures in the funds’ Prospectuses and Statements of Additional Information. The Second Order further requires the appointment of an independent distribution consultant, at the Company’s expense, who shall develop a plan for the distribution of the penalty and disgorgement to the funds.
Other Legal Proceedings
The Trust, in addition to the Company and other funds, and certain current and former officers, employees, and directors have been named in multiple lawsuits in different federal courts in Nevada, California, Illinois, New York and Florida, alleging violations of various federal securities laws and seeking, among other relief, monetary damages, restitution, removal of fund trustees, directors, advisers, administrators, and distributors, rescission of management contracts and 12b-1 Plans, and/or attorneys’ fees and costs. Specifically, the lawsuits claim breach of duty with respect to alleged arrangements to permit market timing and/or late trading activity, or breach of duty with respect to the valuation of the portfolio securities of certain Templeton funds managed by Franklin Resources, Inc. subsidiaries, resulting in alleged market timing activity. The majority of these lawsuits duplicate, in whole or in part, the allegations asserted in the February 4, 2004 Massachusetts administrative complaint and the findings in the SEC’s August 2, 2004 Order, as described above. The lawsuits are styled as class actions, or derivative actions on behalf of either the named funds or Franklin Resources, Inc.
In addition, the Company, as well as certain current and former officers, employees, and directors, have been named in multiple lawsuits alleging violations of various securities laws and pendent state law claims relating to the disclosure of directed brokerage payments and/or payment of allegedly excessive advisory, commission, and distribution fees, and seeking, among other relief, monetary damages, restitution, rescission of advisory contracts, including recovery of all fees paid pursuant to those contracts, an accounting of all monies paid to the named advisers, declaratory relief, injunctive relief, and/or attorneys’ fees and costs. These lawsuits are styled as class actions or derivative actions brought on behalf of certain funds.
The Company and fund management strongly believes that the claims made in each of the lawsuits identified above are without merit and intends to vigorously defend against them. The Company cannot predict with certainty, however, the eventual outcome of the remaining governmental investigations or private lawsuits, nor whether they will have a material negative impact on the Company. Public trust and confidence are critical to the Company’s business and any material loss of investor and/or client confidence could result in a significant decline in assets under management by the Company, which would have an adverse effect on the Company’s future financial results. If the Company finds that it bears responsibility for any unlawful or inappropriate conduct that caused losses to the Trust, it is committed to making the Trust or its shareholders whole, as appropriate. The Company is committed to taking all appropriate actions to protect the interests of its funds’ shareholders.
FM-15
FRANKLIN TEMPLETON VARIABLE INSURANCE PRODUCTS TRUST
FRANKLIN MONEY MARKET FUND
Report of Independent Registered Public Accounting Firm
To the Trustees and Shareholders of Franklin Templeton Variable Insurance Products Trust
In our opinion, the accompanying statement of assets and liabilities, including the statement of investments, and the related statements of operations and of changes in net assets and the financial highlights present fairly, in all material respects, the financial position of Franklin Money Market Fund (the Fund) (one of the funds constituting Franklin Templeton Variable Insurance Products Trust) at December 31, 2004, the results of its operations for the year then ended, the changes in its net assets for each of the two years in the period then ended and the financial highlights for each of the five years in the period then ended, in conformity with accounting principles generally accepted in the United States of America. These financial statements and financial highlights (hereafter referred to as “financial statements”) are the responsibility of the Fund’s management; our responsibility is to express an opinion on these financial statements based on our audits. We conducted our audits of these financial statements in accordance with the standards of the Public Company Accounting Oversight Board (United States). Those standards require that we plan and perform the audits to obtain reasonable assurance about whether the financial statements are free of material misstatement. An audit includes examining, on a test basis, evidence supporting the amounts and disclosures in the financial statements, assessing the accounting principles used and significant estimates made by management, and evaluating the overall financial statement presentation. We believe that our audits, which included confirmation of securities at December 31, 2004 by correspondence with the custodian and brokers, provide a reasonable basis for our opinion.
PricewaterhouseCoopers LLP
San Francisco, California
February 9, 2005
FM-16
FRANKLIN REAL ESTATE FUND
This annual report for Franklin Real Estate Fund covers the fiscal year ended December 31, 2004.
Performance Summary as of 12/31/04
Average Annual Total return of Class 2 shares* represents the average annual change in value, assuming reinvestment of dividends and capital gains. Average returns smooth out variations in returns, which can be significant; they are not the same as year-by-year results.
Periods ended 12/31/04
| | | | | | |
| | | 1-Year | | 5-Year | | 10-Year |
Average Annual Total Return | | +31.80% | | +20.99% | | +14.30% |
*Because Class 2 shares were not offered until 1/6/99, standardized Class 2 Fund performance for prior periods represents the historical results of Class 1 shares. For periods beginning on 1/6/99, Class 2’s results reflect an additional 12b-1 fee expense, which also affects future performance. Since 1/6/99 (effective date), the average annual total return of Class 2 shares was +15.71%.
Total Return Index Comparison
for Hypothetical $10,000 Investment (1/1/95–12/31/04)
The graph below shows the change in value of a hypothetical $10,000 investment in the Fund over the indicated period and includes reinvestment of any income or distributions. The Fund’s performance* is compared to the performance of the Standard & Poor’s 500 Composite Index (S&P 500) and the Dow Jones Wilshire Real Estate Securities Index. One cannot invest directly in an index, nor is an index representative of the Fund’s portfolio. Please see Important Notes to Performance Information preceding the Fund Summaries.
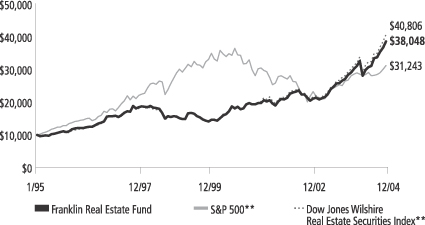
**Source: Standard & Poor’s Micropal. Please see Index Descriptions following the Fund Summaries.
Franklin Real Estate Fund – Class 2
Performance reflects the Fund’s Class 2 operating expenses, but does not include any contract fees, expenses or sales charges. If they had been included, performance would be lower. These charges and deductions, particularly for variable life policies, can have a significant effect on contract values and insurance benefits. See the contract prospectus for a complete description of these expenses, including sales charges.
Performance data quoted represent past performance, which does not guarantee future results. Investment return and principal value will fluctuate, and you may have a gain or loss when you sell your shares. Current performance may differ from figures shown.
FRE-1
Fund Goals and Main Investments: Franklin Real Estate Fund seeks capital appreciation, with current income as a secondary goal. The Fund invests predominantly in investments of companies operating in the real estate sector, primarily real estate investment trusts (REITs) and companies that derive at least half of their assets or revenues from residential, commercial or industrial real estate. The Fund generally invests in small to medium capitalization companies.1
Performance Overview
You can find the Fund’s one-year total return in the Performance Summary. The Fund significantly outperformed the benchmark S&P 500, which returned 10.87% for the period under review, while underperforming the Dow Jones Wilshire Real Estate Securities Index’s 34.81% return for the same period.2
Economic and Market Overview
During the year ended December 31, 2004, the domestic economy expanded solidly and broadly across most industries, sectors and regions as gross domestic product (GDP) rose an estimated 4.4%.3 However, surging energy and other commodity prices had a dampening effect. Although consumer confidence remained below pre-recession levels, consumer spending supported strong auto sales, increased durable goods consumption and a healthy housing market. Similarly, business spending rose substantially even as business confidence wavered. With improving balance sheets and stronger profit margins, many companies entered an upgrade cycle and invested in new technologies, driving
equipment spending up 9.5% in the second half of 2004.3 The labor market firmed as employers hired 2.2 million workers in 2004, and unemployment dropped from 5.7% to 5.4% during the year.4 More than one-half of the jobs lost during the recession have been recovered; however, most new jobs were part-time or temporary. Given concerns over rising benefits costs and lingering uncertainties about economic recovery, many companies turned to temporary employment or opted for continued hiring freezes. At year-end, elevated household debt levels and the deepening federal budget and trade deficits were three top concerns for the economy as it headed into 2005.
1. Equity REITs are real estate companies that own and manage income-producing properties such as apartments or hotels. The income, primarily rent from these properties, is generally passed on to investors in the form of dividends. These companies provide experienced property management teams and generally concentrate on a specific geographic region and property type.
2. Source: Standard & Poor’s Micropal. One cannot invest directly in an index, nor is an index representative of the Fund’s portfolio. Please see Index Descriptions following the Fund Summaries.
3. Source: Bureau of Economic Analysis.
4. Source: Bureau of Labor Statistics.
Fund Risks: Stocks offer the potential for long-term gains but can be subject to short-term up-and-down price movements. By concentrating on the industries of the real estate sector, the Fund carries much greater risk of adverse developments affecting that sector than a fund that invests more broadly. Smaller and midsize company securities can increase the risk of greater price fluctuation. The Fund’s prospectus also includes a description of the main investment risks.
FRE-2
The U.S. dollar weakened throughout 2004 and hit an all-time low against the euro and a multi-year low versus the yen. The widening trade and current account deficits and possibility for higher import prices contributed to inflationary pressures. The core inflation rate rose to 2.2% in 2004, or 3.3% including volatile food and energy costs. Aiming to keep inflation tame, the Federal Reserve Board (Fed) raised the federal funds target rate five times between June and December, from 1.00% to 2.25%, the highest level in more than three years. The Fed said it will respond to changes in economic prospects as needed to fulfill its obligation to maintain price stability, noting in December that it perceived “the upside and downside risks to the attainment of both sustainable growth and price stability for the next few quarters to be roughly equal.”5
Despite a generally robust economy and improving corporate fundamentals, investors had to digest a wide range of information in 2004, including rising inflation, the dollar’s value, a contentious presidential election and ongoing concerns about terrorism, war and reconstruction in Iraq. Domestic equity markets rallied in early 2004 and then fluctuated; however, they were essentially flat through early November. Disappointing earnings from a number of blue chip companies applied downward pressure, but initial public offering (IPO) activity was strong and investor sentiment improved late in the period despite the mixed signals. After the elections concluded, the markets enjoyed another strong rally through year-end. The blue chip stocks of the Dow Jones Industrial Average gained 5.31% for the year under review, while the broader S&P 500 rose 10.87% and the technology-heavy NASDAQ Composite Index increased 9.15%.6
Real estate stocks posted solid performance during the year and easily outpaced the major stock market indexes. Private real estate markets continued to be relatively stable throughout 2004. Large transactions took place due to demand for quality real estate properties from REITs, pension funds and other private investors. Real estate stocks, however, encountered significant volatility as a strong advance in the first three months of the period reversed into a market-wide sell-off in April. The sell-off came on the heels of strong job numbers and premature fears of sharp interest rate increases. There was much debate as to how rising
5. Source: Federal Reserve. Press Release, 12/14/04.
6. Source: Standard & Poor’s Micropal. Please see Index Descriptions following the Fund Summaries.
FRE-3
interest rates would affect these stocks, with no clear conclusions drawn. In the latter half of the year, however, interest rates remained relatively low and improving real estate fundamentals began to drive better performance across the sector as the economy continued to gradually recover. Furthermore, as equity markets were flat throughout much of the year, we believe investors were drawn to REITs as they recognized the importance of dividend income as a contributor to total return. Another factor that impacted improving REIT performance in 2004’s second half was the increased level of high profile consolidations, particularly in the retail mall sector.
Investment Strategy
We are research driven, fundamental investors pursuing a disciplined strategy. As bottom-up investors focusing primarily on individual securities, we focus on the market price of a company’s security relative to our evaluation of its potential long-term earnings, asset value and cash flow. Using both qualitative and quantitative analysis, we evaluate security characteristics, the strength and quality of management, and underlying properties. In addition, we may consider other factors, such as the supply and demand outlook for various property types and regional markets.
Manager’s Discussion
Two of the Fund’s largest positions throughout much of the year under review, equity REITs Simon Properties and The Rouse Company, delivered strong performance. Simon Properties continued to experience growth in its core retail franchise due to its high-quality portfolio of shopping malls. At period-end, Simon was also in the process of acquiring Chelsea Properties. The Rouse Company’s solid performance was partly due to its acquisition at a significant premium by General Growth Properties. When analyzing a potential investment for the Fund, we consider a company’s attractiveness as an acquisition target. We think the Rouse transaction illustrates this valuable attribute. Our holdings in real estate developer The St. Joe Company also performed well during the reporting period. St. Joe continued to distinguish itself through its development capabilities and focus on creating shareholder value.
On the other hand, iStar Financial was a relatively weak performer during the reporting period compared with other real estate securities, even though it returned almost 25% in 2004. The company was in transition during 2004 as it received an investment grade debt rating and bolstered its loan origination platform. PS Business Parks, another equity
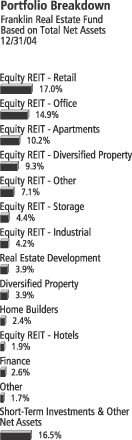
FRE-4
REIT, was also a disappointment, primarily because the company’s 2004 cash flow growth was lower than expected. Nevertheless, the company’s share price still managed to appreciate more than 12% in 2004. Although we would have liked to see stronger growth from PS Business Parks, we believed management positioned the company to make strategic acquisitions going forward. In line with our investment strategy, we retained our investment in the company at year-end.
Thank you for your participation in Franklin Real Estate Fund. We look forward to serving your future investment needs.
The foregoing information reflects our analysis, opinions and portfolio holdings as of December 31, 2004, the end of the reporting period. The way we implement our main investment strategies and the resulting portfolio holdings may change depending on factors such as market and economic conditions. These opinions may not be relied upon as investment advice or an offer for a particular security. The information is not a complete analysis of every aspect of any market, country, industry, security or the Fund. Statements of fact are from sources considered reliable, but the adviser makes no representation or warranty as to their completeness or accuracy. Although historical performance is no guarantee of future results, these insights may help you understand our investment management philosophy.
Top 10 Holdings
Franklin Real Estate Fund 12/31/04
| | |
Company
Security Type | | % of Total
Net Assets |
| |
| Simon Property Group Inc. | | 4.5% |
| Equity REIT – Retail | | |
| |
| Vornado Realty Trust | | 3.6% |
| Equity REIT – Diversified Property | | |
| |
| The Macerich Co. | | 3.3% |
| Equity REIT – Retail | | |
| |
| General Growth Properties Inc. | | 3.1% |
| Equity REIT – Retail | | |
| |
| Avalonbay Communities Inc. | | 3.0% |
| Equity REIT – Apartments | | |
| |
| Equity Residential | | 2.9% |
| Equity REIT – Apartments | | |
| |
| Boston Properties Inc. | | 2.7% |
| Equity REIT – Office | | |
| |
| ProLogis | | 2.7% |
| Equity REIT – Industrial | | |
| |
| The St. Joe Co. | | 2.6% |
| Real Estate Development | | |
| |
| Capital Automotive | | 2.4% |
| Equity REIT – Diversified Property | | |
The dollar value, number of shares or principal amount, and names of all portfolio holdings are listed in the Fund’s Statement of Investments.
FRE-5
Fund Expenses
As an investor in a variable insurance contract (“Contract”) that indirectly provides for investment in an underlying mutual fund, you can incur transaction and/or ongoing expenses at both the Fund level and the Contract level.
| • | | Transaction expenses can include sales charges (loads) on purchases, redemption fees, surrender fees, transfer fees and premium taxes. |
| • | | Ongoing expenses can include management fees, distribution and service (12b-1) fees, contract fees, annual maintenance fees, mortality and expense risk fees and other fees and expenses. All mutual funds and Contracts have some types of ongoing expenses. |
The expenses shown in the table below are meant to highlight ongoing expenses at the Fund level only and do not include ongoing expenses at the Contract level, or transaction expenses at either the Fund or Contract levels. While the Fund does not have transaction expenses, if the transaction and ongoing expenses at the Contract level were included, the expenses shown below would be higher. You should consult your Contract prospectus or disclosure document for more information.
The table shows Fund-level ongoing expenses and can help you understand these expenses and compare them with those of other mutual funds offered through the Contract. The table assumes a $1,000 investment held for the six months indicated. Please refer to the Fund prospectus for additional information on operating expenses.
Actual Fund Expenses
The first line (Actual) for each share class listed in the table below provides actual account values and expenses. The “Ending Account Value” is derived from the Fund’s actual return, which includes the effect of ongoing Fund expenses, but does not include the effect of ongoing Contract expenses.
You can estimate the Fund-level expenses you incurred during the period, by following these steps. Of course, your account value and expenses will differ from those in this illustration:
| 1. | Divide your account value by $1,000. |
If an account had an $8,600 value, then $8,600 ÷ $1,000 = 8.6.
| 2. | Multiply the result by the number under the heading “Fund-Level Expenses Incurred During Period.” |
If Expenses Incurred During Period were $7.50, then 8.6 × $7.50 = $64.50.
Franklin Real Estate Fund – Class 2
FRE-6
In this illustration, the estimated expenses incurred this period at the Fund level are $64.50.
Hypothetical Example for Comparison with Other Mutual Funds
Information in the second line (Hypothetical) for each class in the table can help you compare ongoing expenses of the Fund with those of other mutual funds offered through the Contract. This information may not be used to estimate the actual ending account balance or expenses you incurred during the period. The hypothetical “Ending Account Value” is based on the actual expense ratio for each class and an assumed 5% annual rate of return before expenses, which does not represent the Fund’s actual return. The figure under the heading “Fund-Level Expenses Incurred During Period” shows the hypothetical expenses your account would have incurred under this scenario. You can compare this figure with the 5% hypothetical examples that appear in shareholder reports of other funds offered through a Contract.
| | | | | | | | | |
| Class 2 | | Beginning
Account
Value 6/30/04 | | Ending
Account
Value 12/31/04 | | Fund-Level
Expenses Incurred
During Period*
6/30/04-12/31/04 |
Actual | | $ | 1,000 | | $ | 1,250.60 | | $ | 4.24 |
Hypothetical (5% return before expenses) | | $ | 1,000 | | $ | 1,021.37 | | $ | 3.81 |
*Expenses are equal to the annualized expense ratio for the Fund’s Class 2 shares (0.75%), which does not include any ongoing expenses of the Contract for which the Fund is an investment option, multiplied by the average account value over the period, multiplied by 184/366 to reflect the one-half year period.
FRE-7
FRANKLIN TEMPLETON VARIABLE INSURANCE PRODUCTS TRUST
FRANKLIN REAL ESTATE FUND
Financial Highlights
| | | | | | | | | | | | | | | | | | | | |
| | | Class 1
| |
| | | Year Ended December 31,
| |
| | | 2004 | | | 2003 | | | 2002 | | | 2001 | | | 2000 | |
| | |
|
|
|
Per share operating performance | | | | | | | | | | | | | | | | | | | | |
(for a share outstanding throughout the year) | | | | | | | | | | | | | | | | | | | | |
Net asset value, beginning of year | | $ | 23.91 | | | $ | 18.05 | | | $ | 18.14 | | | $ | 17.47 | | | $ | 14.92 | |
| | |
|
|
|
Income from investment operations: | | | | | | | | | | | | | | | | | | | | |
Net investment incomea | | | .75 | | | | .74 | | | | .75 | | | | .74 | | | | .84 | |
Net realized and unrealized gains (losses) | | | 6.78 | | | | 5.67 | | | | (.30 | ) | | | .65 | | | | 3.55 | |
| | |
|
|
|
Total from investment operations | | | 7.53 | | | | 6.41 | | | | .45 | | | | 1.39 | | | | 4.39 | |
| | |
|
|
|
Less distributions from: | | | | | | | | | | | | | | | | | | | | |
Net investment income | | | (.53 | ) | | | (.55 | ) | | | (.54 | ) | | | (.72 | ) | | | (1.15 | ) |
Net realized gains | | | (.04 | ) | | | — | | | | — | | | | — | | | | (.69 | ) |
| | |
|
|
|
Total distributions | | | (.57 | ) | | | (.55 | ) | | | (.54 | ) | | | (.72 | ) | | | (1.84 | ) |
| | |
|
|
|
Net asset value, end of year | | $ | 30.87 | | | $ | 23.91 | | | $ | 18.05 | | | $ | 18.14 | | | $ | 17.47 | |
| | |
|
|
|
| | | | | |
Total returnb | | | 32.19% | | | | 36.08% | | | | 2.25% | | | | 8.19% | | | | 31.95% | |
Ratios/supplemental data | | | | | | | | | | | | | | | | | | | | |
Net assets, end of year (000’s) | | $ | 152,451 | | | $ | 134,468 | | | $ | 112,991 | | | $ | 134,058 | | | $ | 153,203 | |
Ratios to average net assets: | | | | | | | | | | | | | | | | | | | | |
Expenses | | | .50% | | | | .53% | | | | .57% | | | | .59% | | | | .60% | |
Net investment income | | | 3.00% | | | | 3.62% | | | | 4.23% | | | | 4.25% | | | | 5.29% | |
Portfolio turnover rate | | | 39.42% | | | | 15.44% | | | | 18.13% | | | | 34.21% | | | | 16.41% | |
| a | Based on average daily shares outstanding. |
| b | Total return does not include any fees, charges or expenses imposed by the variable annuity and life insurance contracts for which the Franklin Templeton Variable Insurance Products Trust serves as an underlying investment vehicle. Total return is not annualized for periods less than one year. |
See notes to financial statements.
FRE-8
FRANKLIN TEMPLETON VARIABLE INSURANCE PRODUCTS TRUST
FRANKLIN REAL ESTATE FUND
Financial Highlights (continued)
| | | | | | | | | | | | | | | | | | | | |
| | | Class 2
| |
| | | Year Ended December 31,
| |
| | | 2004 | | | 2003 | | | 2002 | | | 2001 | | | 2000 | |
| | |
|
|
|
Per share operating performance | | | | | | | | | | | | | | | | | | | | |
(for a share outstanding throughout the year) | | | | | | | | | | | | | | | | | | | | |
Net asset value, beginning of year | | $ | 23.65 | | | $ | 17.88 | | | $ | 17.99 | | | $ | 17.38 | | | $ | 14.88 | |
| | |
|
|
|
Income from investment operations: | | | | | | | | | | | | | | | | | | | | |
Net investment incomea | | | .72 | | | | .74 | | | | .76 | | | | .80 | | | | .93 | |
Net realized and unrealized gains (losses) | | | 6.65 | | | | 5.55 | | | | (.35 | ) | | | .52 | | | | 3.41 | |
| | |
|
|
|
Total from investment operations | | | 7.37 | | | | 6.29 | | | | .41 | | | | 1.32 | | | | 4.34 | |
| | |
|
|
|
Less distributions from: | | | | | | | | | | | | | | | | | | | | |
Net investment income | | | (.49 | ) | | | (.52 | ) | | | (.52 | ) | | | (.71 | ) | | | (1.15 | ) |
Net realized gains | | | (.04 | ) | | | — | | | | — | | | | — | | | | (.69 | ) |
| | |
|
|
|
Total distributions | | | (.53 | ) | | | (.52 | ) | | | (.52 | ) | | | (.71 | ) | | | (1.84 | ) |
| | |
|
|
|
Net asset value, end of year | | $ | 30.49 | | | $ | 23.65 | | | $ | 17.88 | | | $ | 17.99 | | | $ | 17.38 | |
| | |
|
|
|
| | | | | |
Total returnb | | | 31.80% | | | | 35.75% | | | | 2.07% | | | | 7.88% | | | | 31.59% | |
Ratios/supplemental data | | | | | | | | | | | | | | | | | | | | |
Net assets, end of year (000’s) | | $ | 1,005,647 | | | $ | 522,415 | | | $ | 249,116 | | | $ | 95,891 | | | $ | 23,743 | |
Ratios to average net assets: | | | | | | | | | | | | | | | | | | | | |
Expenses | | | .75% | | | | .78% | | | | .82% | | | | .84% | | | | .85% | |
Net investment income | | | 2.75% | | | | 3.37% | | | | 3.98% | | | | 4.60% | | | | 5.75% | |
Portfolio turnover rate | | | 39.42% | | | | 15.44% | | | | 18.13% | | | | 34.21% | | | | 16.41% | |
| a | Based on average daily shares outstanding. |
| b | Total return does not include any fees, charges or expenses imposed by the variable annuity and life insurance contracts for which the Franklin Templeton Variable Insurance Products Trust serves as an underlying investment vehicle. Total return is not annualized for periods less than one year. |
See notes to financial statements.
FRE-9
FRANKLIN TEMPLETON VARIABLE INSURANCE PRODUCTS TRUST
FRANKLIN REAL ESTATE FUND
Statement of Investments, December 31, 2004
| | | | | |
| | | SHARES | | VALUE |
Common Stocks 83.5% | | | | | |
Diversified Financial Services .8% | | | | | |
Brascan Corp., A (Canada) | | 265,600 | | $ | 9,563,580 |
| | | | |
|
Diversified Property 3.9% | | | | | |
Brookfield Properties Corp. (Canada) | | 185,560 | | | 6,939,944 |
Catellus Development Corp. | | 516,833 | | | 15,815,090 |
Forest City Enterprises Inc., A | | 397,100 | | | 22,853,105 |
| | | | |
|
|
| | | | | | 45,608,139 |
| | | | |
|
|
Equity REIT – Apartments 10.2% | | | | | |
Amli Residential Properties Trust | | 88,900 | | | 2,844,800 |
Avalonbay Communities Inc. | | 460,400 | | | 34,668,120 |
Boardwalk Real Estate Investment Trust (Canada) | | 1,503,500 | | | 22,746,401 |
Equity Residential | | 934,600 | | | 33,813,828 |
aGMH Communities Trust | | 1,700,000 | | | 23,970,000 |
| | | | |
|
|
| | | | | | 118,043,149 |
| | | | |
|
|
Equity REIT – Diversified Property 9.3% | | | | | |
Bedford Property Investors Inc. | | 232,280 | | | 6,599,075 |
Capital Automotive | | 779,200 | | | 27,681,080 |
Duke Realty Corp. | | 116,248 | | | 3,968,707 |
Glenborough Realty Trust Inc. | | 12,900 | | | 274,512 |
Lexington Corporate Properties Trust | | 349,600 | | | 7,893,968 |
Liberty Property Trust | | 445,100 | | | 19,228,320 |
Vornado Realty Trust | | 555,200 | | | 42,267,376 |
| | | | |
|
|
| | | | | | 107,913,038 |
| | | | |
|
|
Equity REIT – Health Care .4% | | | | | |
Health Care Property Investors Inc. | | 162,500 | | | 4,499,625 |
| | | | |
|
|
Equity REIT – Hotels 1.9% | | | | | |
Host Marriott Corp. | | 651,900 | | | 11,277,870 |
LaSalle Hotel Properties | | 325,400 | | | 10,357,482 |
| | | | |
|
|
| | | | | | 21,635,352 |
| | | | |
|
|
Equity REIT – Industrial 4.2% | | | | | |
ProLogis | | 718,600 | | | 31,136,938 |
PS Business Parks Inc. | | 390,500 | | | 17,611,550 |
| | | | |
|
|
| | | | | | 48,748,488 |
| | | | |
|
|
Equity REIT – Office 14.9% | | | | | |
American Financial Realty Trust | | 202,000 | | | 3,268,360 |
Arden Realty Inc. | | 313,900 | | | 11,840,308 |
Boston Properties Inc. | | 490,450 | | | 31,717,401 |
Brandywine Realty Trust | | 422,000 | | | 12,402,580 |
Corporate Office Properties Trust | | 611,300 | | | 17,941,655 |
Cousins Properties Inc. | | 191,400 | | | 5,793,678 |
CRT Properties Inc. | | 425,800 | | | 10,159,588 |
aDigital Realty Trust Inc. | | 1,535,500 | | | 20,683,185 |
Kilroy Realty Corp. | | 255,200 | | | 10,909,800 |
Parkway Properties Inc. | | 122,000 | | | 6,191,500 |
Reckson Associates Realty Corp. | | 139,900 | | | 4,590,119 |
SL Green Realty Corp. | | 379,500 | | | 22,978,725 |
Trizec Properties Inc. | | 726,500 | | | 13,745,380 |
| | | | |
|
|
| | | | | | 172,222,279 |
| | | | |
|
|
FRE-10
FRANKLIN TEMPLETON VARIABLE INSURANCE PRODUCTS TRUST
FRANKLIN REAL ESTATE FUND
Statement of Investments, December 31, 2004 (cont.)
| | | | | |
| | | SHARES | | VALUE |
Common Stocks (cont.) | | | | | |
Equity REIT – Other 7.1% | | | | | |
Capital Trust Inc., A | | 329,000 | | $ | 10,103,590 |
Entertainment Properties Trust | | 535,700 | | | 23,865,435 |
Manufactured Home Communities Inc. | | 146,600 | | | 5,240,950 |
iStar Financial Inc. | | 591,400 | | | 26,766,764 |
b,cProvident Senior Living Trust, 144A | | 1,084,000 | | | 16,260,000 |
| | | | |
|
|
| | | | | | 82,236,739 |
| | | | |
|
|
Equity REIT – Retail 17.0% | | | | | |
Developers Diversified Realty Corp. | | 147,200 | | | 6,531,264 |
Federal Realty Investment Trust | | 87,500 | | | 4,519,375 |
General Growth Properties Inc. | | 977,700 | | | 35,353,632 |
Glimcher Realty Trust | | 202,000 | | | 5,597,420 |
Kimco Realty Corp. | | 101,600 | | | 5,891,784 |
Kite Realty Group Trust | | 850,000 | | | 12,988,000 |
The Macerich Co. | | 609,400 | | | 38,270,320 |
Ramco-Gershenson Properties Trust | | 257,100 | | | 8,291,475 |
Regency Centers Corp. | | 284,300 | | | 15,750,220 |
Simon Property Group Inc. | | 804,645 | | | 52,036,395 |
Tanger Factory Outlet Centers Inc. | | 213,600 | | | 5,651,856 |
Taubman Centers Inc. | | 215,700 | | | 6,460,215 |
| | | | |
|
|
| | | | | | 197,341,956 |
| | | | |
|
|
Equity REIT – Storage 4.4% | | | | | |
Extra Space Storage Inc. | | 1,250,000 | | | 16,662,500 |
Public Storage Inc. | | 281,200 | | | 15,676,900 |
bU-Store-It Trust | | 1,057,000 | | | 18,338,950 |
| | | | |
|
|
| | | | | | 50,678,350 |
| | | | |
|
|
Finance 2.6% | | | | | |
Chartermac LP | | 630,700 | | | 15,414,308 |
Eurocastle Investment Ltd. (United Kingdom) | | 200,000 | | | 4,451,148 |
Newcastle Investment Corp. | | 333,600 | | | 10,601,808 |
| | | | |
|
|
| | | | | | 30,467,264 |
| | | | |
|
|
Home Builders 2.4% | | | | | |
Lennar Corp., A | | 402,600 | | | 22,819,368 |
The Ryland Group Inc. | | 94,200 | | | 5,420,268 |
| | | | |
|
|
| | | | | | 28,239,636 |
| | | | |
|
|
Hotels & Travel .5% | | | | | |
bLa Quinta Corp. | | 597,500 | | | 5,431,275 |
| | | | |
|
|
Real Estate Development 3.9% | | | | | |
bKillam Properties Inc. (Canada) | | 2,602,300 | | | 4,448,005 |
LNR Property Corp. | | 161,000 | | | 10,128,510 |
The St. Joe Co. | | 466,300 | | | 29,936,460 |
| | | | |
|
|
| | | | | | 44,512,975 |
| | | | |
|
|
Total Long Term Investments (Cost $659,894,121) | | | | | 967,141,845 |
| | | | |
|
|
FRE-11
FRANKLIN TEMPLETON VARIABLE INSURANCE PRODUCTS TRUST
FRANKLIN REAL ESTATE FUND
Statement of Investments, December 31, 2004 (cont.)
| | | | | | |
| | | PRINCIPAL
AMOUNT | | VALUE |
Repurchase Agreement (Cost $188,481,712) 16.3% | | | | | | |
dJoint Repurchase Agreement, 1.915%, 1/03/05 (Maturity Value $188,511,791) | | $ | 188,481,712 | | $ | 188,481,712 |
ABN AMRO Bank, N.V., New York Branch (Maturity Value $18,611,769)
Banc of America Securities LLC (Maturity Value $6,978,707)
Barclays Capital Inc. (Maturity Value $8,607,449)
Bear, Stearns & Co. Inc. (Maturity Value $14,656,792)
BNP Paribas Securities Corp. (Maturity Value $18,611,769)
Deutsche Bank Securities Inc. (Maturity Value $9,306,826)
Goldman, Sachs & Co. (Maturity Value $18,611,769)
Greenwich Capital Markets Inc. (Maturity Value $18,611,769)
Lehman Brothers Inc. (Maturity Value $18,679,634)
Merrill Lynch Government Securities Inc. (Maturity Value $18,611,769)
Morgan Stanley & Co. Inc. (Maturity Value $18,611,769)
UBS Securities LLC (Maturity Value $18,611,769) | | | | | | |
Collateralized by U.S. Government Agency Securities, 0.00 - 7.125% 1/05/05 - 9/15/09;
eU.S. Treasury Bills, 3/24/05 - 3/31/05; U.S. Treasury Bonds, 9.375 - 12.00%, 5/15/05 - 2/15/06 and U.S. Treasury Notes, 1.50 - 7.00%, 2/28/05 - 6/15/09 | | | | | | |
| | | | | |
|
|
Total Investments (Cost $848,375,833) 99.8% | | | | | | 1,155,623,557 |
Other Assets, less Liabilities .2% | | | | | | 2,474,541 |
| | | | | |
|
|
Net Assets 100.0% | | | | | $ | 1,158,098,098 |
| | | | | |
|
|
Portfolio Abbreviation:
REIT - Real Estate Investment Trust
| a | See Note 8 regarding holdings of 5% voting securities. |
| c | See Note 7 regarding restricted securities. |
| d | See Note 1(c) regarding joint repurchase agreement. |
| e | Security is traded on a discount basis with a zero coupon rate. |
See notes to financial statements.
FRE-12
FRANKLIN TEMPLETON VARIABLE INSURANCE PRODUCTS TRUST
FRANKLIN REAL ESTATE FUND
Financial Statements
Statement of Assets and Liabilities
December 31, 2004
| | | |
Assets: | | | |
Investments in securities: | | | |
Cost - Unaffiliated issuers | | $ | 621,068,121 |
Cost - Non-controlled affiliated issuers (Note 7) | | | 38,826,000 |
Cost - Repurchase agreements | | | 188,481,712 |
| | |
|
|
Total cost of investments | | | 848,375,833 |
| | |
|
|
Value - Unaffiliated issuers | | | 922,488,660 |
Value - Non-controlled affiliated issuers (Note 7) | | | 44,653,185 |
Value - Repurchase agreements | | | 188,481,712 |
| | |
|
|
Total value of investments | | | 1,155,623,557 |
| | |
|
|
Cash | | | 5,702 |
Receivables: | | | |
Capital shares sold | | | 684,734 |
Dividends | | | 5,319,126 |
| | |
|
|
Total assets | | | 1,161,633,119 |
| | |
|
|
Liabilities: | | | |
Payables: | | | |
Investment securities purchased | | | 2,725,489 |
Capital shares redeemed | | | 97,293 |
Affiliates | | | 654,244 |
Other liabilities | | | 57,995 |
| | |
|
|
Total liabilities | | | 3,535,021 |
| | |
|
|
Net assets, at value | | $ | 1,158,098,098 |
| | |
|
|
Net assets consist of: | | | |
Undistributed net investment income | | $ | 27,198,442 |
Net unrealized appreciation (depreciation) | | | 307,247,724 |
Accumulated net realized gain (loss) | | | 71,118,929 |
Capital shares | | | 752,533,003 |
| | |
|
|
Net assets, at value | | $ | 1,158,098,098 |
| | |
|
|
Class 1: | | | |
Net assets, at value | | $ | 152,450,931 |
| | |
|
|
Shares outstanding | | | 4,937,746 |
| | |
|
|
Net asset value and offering price per share | | $ | 30.87 |
| | |
|
|
Class 2: | | | |
Net assets, at value | | $ | 1,005,647,167 |
| | |
|
|
Shares outstanding | | | 32,987,841 |
| | |
|
|
Net asset value and offering price per share | | $ | 30.49 |
| | |
|
|
See notes to financial statements.
FRE-13
FRANKLIN TEMPLETON VARIABLE INSURANCE PRODUCTS TRUST
FRANKLIN REAL ESTATE FUND
Financial Statements (continued)
Statement of Operations
for the year ended December 31, 2004
| | | | |
Investment income: | | | | |
Dividends: | | | | |
Unaffiliated issuers | | $ | 28,103,658 | |
Non-controlled affiliated issuers (Note 7) | | | 512,026 | |
Interest | | | 1,005,378 | |
| | |
|
|
|
Total investment income | | | 29,621,062 | |
| | |
|
|
|
Expenses: | | | | |
Management fees (Note 3) | | | 4,039,591 | |
Distribution fees - Class 2 (Note 3) | | | 1,768,198 | |
Transfer agent fees | | | 7,840 | |
Custodian fees (Note 4) | | | 18,959 | |
Reports to shareholders | | | 112,731 | |
Professional fees | | | 35,728 | |
Trustees’ fees and expenses | | | 4,972 | |
Other | | | 34,559 | |
| | |
|
|
|
Total expenses | | | 6,022,578 | |
Expense reductions (Note 4) | | | (499 | ) |
| | |
|
|
|
Net expenses | | | 6,022,079 | |
| | |
|
|
|
Net investment income | | | 23,598,983 | |
| | |
|
|
|
Realized and unrealized gains (losses): | | | | |
Net realized gain (loss) from: | | | | |
Investments | | | 75,215,156 | |
Foreign currency transactions | | | (120,180 | ) |
| | |
|
|
|
Net realized gain (loss) | | | 75,094,976 | |
Net change in unrealized appreciation (depreciation) on investments | | | 153,300,436 | |
| | |
|
|
|
Net realized and unrealized gain (loss) | | | 228,395,412 | |
| | |
|
|
|
Net increase (decrease) in net assets resulting from operations | | $ | 251,994,395 | |
| | |
|
|
|
See notes to financial statements.
FRE-14
FRANKLIN TEMPLETON VARIABLE INSURANCE PRODUCTS TRUST
FRANKLIN REAL ESTATE FUND
Financial Statements (continued)
Statements of Changes in Net Assets
for the years ended December 31, 2004 and 2003
| | | | | | | | |
| | | 2004 | | | 2003 | |
| | |
| |
Increase (decrease) in net assets: | | | | | | | | |
Operations: | | | | | | | | |
Net investment income | | $ | 23,598,983 | | | $ | 17,275,865 | |
Net realized gain (loss) from investments and foreign currency transactions | | | 75,094,976 | | | | 821,285 | |
Net change in unrealized appreciation (depreciation) on investments | | | 153,300,436 | | | | 132,680,180 | |
| | |
| |
Net increase (decrease) in net assets resulting from operations | | | 251,994,395 | | | | 150,777,330 | |
Distributions to shareholders from: | | | | | | | | |
Net investment income: | | | | | | | | |
Class 1 | | | (2,724,809 | ) | | | (3,177,591 | ) |
Class 2 | | | (12,878,960 | ) | | | (8,704,406 | ) |
Net realized gains: | | | | | | | | |
Class 1 | | | (192,406 | ) | | | — | |
Class 2 | | | (972,343 | ) | | | — | |
| | |
| |
Total distributions to shareholders | | | (16,768,518) | | | | (11,881,997 | ) |
Capital share transactions: (Note 2) | | | | | | | | |
Class 1 | | | (17,653,568 | ) | | | (12,667,903 | ) |
Class 2 | | | 283,643,067 | | | | 168,547,853 | |
| | |
| |
Total capital share transactions | | | 265,989,499 | | | | 155,879,950 | |
Net increase (decrease) in net assets | | | 501,215,376 | | | | 294,775,283 | |
Net assets: | | | | | | | | |
Beginning of year | | | 656,882,722 | | | | 362,107,439 | |
| | |
| |
End of year | | $ | 1,158,098,098 | | | $ | 656,882,722 | |
| | |
| |
Undistributed net investment income included in net assets: | | | | | | | | |
End of year | | $ | 27,198,442 | | | $ | 19,252,857 | |
| | |
| |
See notes to financial statements.
FRE-15
FRANKLIN TEMPLETON VARIABLE INSURANCE PRODUCTS TRUST
FRANKLIN REAL ESTATE FUND
Notes to Financial Statements
1. ORGANIZATION AND SIGNIFICANT ACCOUNTING POLICIES
Franklin Templeton Variable Insurance Products Trust (the Trust) is registered under the Investment Company Act of 1940 as an open-end investment company, consisting of twenty-one separate series (the Funds). Franklin Real Estate Fund (the Fund) included in this report is diversified. The financial statements of the remaining funds in the series are presented separately. Shares of the Fund are sold only to insurance company separate accounts to fund the benefits of variable life insurance policies or variable annuity contracts. As of December 31, 2004, over 55% of the Fund’s shares were sold through one insurance company. The Fund’s investment objective is growth and income.
The following summarizes the Fund’s significant accounting policies.
a. Security Valuation
Securities listed on a securities exchange or on the NASDAQ National Market System are valued at the last quoted sale price or the official closing price of the day, respectively. Over-the-counter securities and listed securities for which there is no reported sale, are valued within the range of the most recent quoted bid and ask prices. Securities that trade in multiple markets or on multiple exchanges are valued according to the broadest and most representative market. Repurchase agreements are valued at cost.
Foreign securities are valued as of the close of trading on the foreign stock exchange on which the security is primarily traded, or the NYSE, whichever is earlier. The value is then converted into its U.S. dollar equivalent at the foreign exchange rate in effect at the close of the NYSE on the day that the value of the foreign security is determined. If no sale is reported at that time, the foreign security will be valued within the range of the most recent quoted bid and ask prices.
The Trust has procedures to determine the fair value of individual securities and other assets for which market prices are not readily available or which may not be reliably priced. Some methods for valuing these securities may include: fundamental analysis, matrix pricing, discounts from market prices of similar securities, or discounts applied due to the nature and duration of restrictions on the disposition of the securities. Occasionally, events occur between the time at which trading in a security is completed and the close of the NYSE that might call into question the availability (including the reliability) of the value of a portfolio security held by the Fund. If such an event occurs, the securities may be valued using fair value procedures, which may include the use of independent pricing services. All security valuation procedures are approved by the Trust’s Board of Trustees.
b. Foreign Currency Translation
Portfolio securities and other assets and liabilities denominated in foreign currencies are translated into U.S. dollars based on the exchange rate of such currencies against U.S. dollars on the date of valuation. Purchases and sales of securities, income and expense items denominated in foreign currencies are translated into U.S. dollars at the exchange rate in effect on the transaction date. Occasionally events may impact the availability or reliability of foreign exchange rates used to convert the U.S. dollar equivalent value. If such an event occurs, the foreign exchange rate will be valued at fair value using procedures established and approved by the Trust’s Board of Trustees.
The Fund does not separately report the effect of changes in foreign exchange rates from changes in market prices on securities held. Such changes are included in net realized and unrealized gain or loss from investments on the Statement of Operations.
Realized foreign exchange gains or losses arise from sales of foreign currencies, currency gains or losses realized between the trade and settlement dates on securities transactions and the difference between the recorded amounts of dividends, interest, and foreign withholding taxes and the U.S. dollar equivalent of the amounts actually received or paid. Net unrealized foreign exchange gains and losses arise from changes in foreign exchange rates on foreign denominated assets and liabilities other than investments in securities held at the end of the reporting period.
FRE-16
FRANKLIN TEMPLETON VARIABLE INSURANCE PRODUCTS TRUST
FRANKLIN REAL ESTATE FUND
Notes to Financial Statements (continued)
1. ORGANIZATION AND SIGNIFICANT ACCOUNTING POLICIES (cont.)
c. Joint Repurchase Agreement
The Fund may enter into a joint repurchase agreement whereby its uninvested cash balance is deposited into a joint cash account to be used to invest in one or more repurchase agreements. The value and face amount of the joint repurchase agreement are allocated to the Fund based on its pro-rata interest. A repurchase agreement is accounted for as a loan by the Fund to the seller, collateralized by securities which are delivered to the Fund’s custodian. The market value, including accrued interest, of the initial collateralization is required to be at least 102% of the dollar amount invested by the Fund, with the value of the underlying securities marked to market daily to maintain coverage of at least 100%. At December 31, 2004, all repurchase agreements held by the Fund had been entered into on that date.
d. Foreign Currency Contracts
When the Fund purchases or sells foreign securities it may enter into foreign exchange contracts to minimize foreign exchange risk from the trade date to the settlement date of the transactions. A foreign exchange contract is an agreement between two parties to exchange different currencies at an agreed upon exchange rate on a specified date. Realized and unrealized gains and losses on these contracts are included in the Statement of Operations.
The risks of these contracts include movement in the values of the foreign currencies relative to the U.S. dollar and the possible inability of the counterparties to fulfill their obligations under the contracts.
e. Income Taxes
No provision has been made for U.S. income taxes because the Fund’s policy is to qualify as a regulated investment company under Subchapter M of the Internal Revenue Code and to distribute substantially all of its taxable income. Fund distributions to shareholders are determined on an income tax basis and may differ from net investment income and realized gains for financial reporting purposes.
f. Security Transactions, Investment Income, Expenses and Distributions
Security transactions are accounted for on trade date. Realized gains and losses on security transactions are determined on a specific identification basis. Interest income and estimated expenses are accrued daily. Dividend income and distributions to shareholders are recorded on the ex-dividend date.
Common expenses incurred by the Trust are allocated among the funds based on the ratio of net assets of each fund to the combined net assets. Other expenses are charged to each fund on a specific identification basis.
Distributions received by the Fund from securities may be a return of capital (ROC). Such distributions reduce the cost basis of the securities, and any distributions in excess of the cost basis are recognized as capital gains.
Realized and unrealized gains and losses and net investment income, other than class specific expenses, are allocated daily to each class of shares based upon the relative proportion of net assets of each class.
g. Accounting Estimates
The preparation of financial statements in accordance with accounting principles generally accepted in the United States of America requires management to make estimates and assumptions that affect the reported amounts of assets and liabilities at the date of the financial statements and the amounts of income and expenses during the reporting period. Actual results could differ from those estimates.
FRE-17
FRANKLIN TEMPLETON VARIABLE INSURANCE PRODUCTS TRUST
FRANKLIN REAL ESTATE FUND
Notes to Financial Statements (continued)
1. ORGANIZATION AND SIGNIFICANT ACCOUNTING POLICIES (cont.)
h. Guarantees and Indemnifications
Under the Trust’s organizational documents, its officers and trustees are indemnified by the Trust against certain liability arising out of the performance of their duties to the Trust. Additionally, in the normal course of business, the Trust enters into contracts with service providers that contain general indemnification clauses. The Trust’s maximum exposure under these arrangements is unknown as this would involve future claims that may be made against the Trust that have not yet occurred. However, based on experience, the Trust expects the risk of loss to be remote.
2. SHARES OF BENEFICIAL INTEREST
The Fund offers two classes of shares: Class 1 and Class 2. Each class of shares differs by its distribution fees, voting rights on matters affecting a single class and its exchange privilege.
At December 31, 2004, there were an unlimited number of shares authorized ($.01 par value). Transactions in the Fund’s shares were as follows:
| | | | | | | | | | | | | | |
| | | Year Ended December 31,
| |
| | | 2004
| | | 2003
| |
| Class 1 Shares: | | Shares
| | | Amount
| | | Shares
| | | Amount
| |
Shares sold | | 139,440 | | | $ | 3,663,084 | | | 108,708 | | | $ | 2,250,887 | |
Shares issued in reinvestment of distributions | | 121,906 | | | | 2,917,215 | | | 159,198 | | | | 3,177,591 | |
Shares redeemed | | (946,492 | ) | | | (24,233,867 | ) | | (904,315 | ) | | | (18,096,381 | ) |
| | |
| |
Net increase (decrease) | | (685,146 | ) | | $ | (17,653,568 | ) | | (636,409 | ) | | $ | (12,667,903 | ) |
| | |
| |
| Class 2 Shares: | | | | | | | | | | | | |
Shares sold | | 13,898,522 | | | $ | 362,200,904 | | | 8,352,474 | | | $ | 172,419,233 | |
Shares issued in reinvestment of distributions | | 585,431 | | | | 13,851,303 | | | 440,506 | | | | 8,704,406 | |
Shares redeemed | | (3,590,120 | ) | | | (92,409,140 | ) | | (635,445 | ) | | | (12,575,786 | ) |
| | |
| |
Net increase (decrease) | | 10,893,833 | | | $ | 283,643,067 | | | 8,157,535 | | | $ | 168,547,853 | |
| | |
| |
3. TRANSACTIONS WITH AFFILIATES
Certain officers and trustees of the Fund are also officers and/or directors of the following entities:
| | |
| Entity | | Affiliation |
Franklin Advisers Inc. (Advisers) | | Investment manager |
Franklin Templeton Services LLC (FT Services) | | Administrative manager |
Franklin Templeton Distributors Inc. (Distributors) | | Principal underwriter |
Franklin Templeton Investor Services LLC (Investor Services) | | Transfer agent |
a. Management Fees
The Fund pays an investment management fee to Advisers based on the average daily net assets of the Fund as follows:
| | |
| Annualized Fee Rate | | Net Assets |
| .625% | | First $100 million |
| .500% | | Over $100 million, up to and including $250 million |
| .450% | | Over $250 million, up to and including $10 billion |
Fees are further reduced on net assets over $10 billion.
FRE-18
FRANKLIN TEMPLETON VARIABLE INSURANCE PRODUCTS TRUST
FRANKLIN REAL ESTATE FUND
Notes to Financial Statements (continued)
3. TRANSACTIONS WITH AFFILIATES (cont.)
b. Administrative Fees
Under an agreement with Advisers, FT Services provides administrative services to the Fund. The fee is paid by Advisers based on the average daily net assets of the Fund, and is not an additional expense of the Fund.
c. Distribution Fees
The Fund reimburses Distributors up to .25% per year of its average daily net asset of Class 2, for costs incurred in marketing the Fund’s shares under a Rule 12b-1 plan.
d. Transfer Agent Fees
Investor Services, under terms of an agreement, performs shareholder servicing for the Fund and is not paid by the Fund for the services.
4. EXPENSE OFFSET ARRANGEMENT
The Fund has entered into an arrangement with its custodian whereby credits realized as a result of uninvested cash balances are used to reduce a portion of the Fund’s custodian expenses. During the year ended December 31, 2004, the custodian fees were reduced as noted in the Statement of Operations.
5. INCOME TAXES
At December 31, 2004, the Fund had deferred currency losses occurring subsequent to October 31, 2004 of $47,140. For tax purposes, such losses will be reflected in the year ending December 31, 2005.
The tax character of distributions paid during the years ended December 31, 2004 and 2003, was as follows:
| | | | | | |
| | | 2004
| | 2003
|
Distributions paid from: | | | | | | |
Ordinary income | | $ | 16,084,110 | | $ | 11,881,997 |
Long term capital gain | | | 684,408 | | | — |
| | |
|
| | | | 16,768,518 | | | 11,881,997 |
| | |
|
Net investment income (loss) differs for financial statement and tax purposes primarily due to differing treatment of foreign security transactions.
Net realized gains (losses) differ for financial statement and tax purposes primarily due to differing treatments of wash sales and foreign security transactions.
FRE-19
FRANKLIN TEMPLETON VARIABLE INSURANCE PRODUCTS TRUST
FRANKLIN REAL ESTATE FUND
Notes to Financial Statements (continued)
5. INCOME TAXES (cont.)
At December 31, 2004, the cost of investments, net unrealized appreciation (depreciation), undistributed ordinary income and undistributed long term capital gains for income tax purposes were as follows:
| | | |
Cost of investments | | $ | 848,579,962 |
| | |
|
|
Unrealized appreciation | | $ | 307,043,595 |
Unrealized depreciation | | | — |
| | |
|
|
Net unrealized appreciation (depreciation) | | $ | 307,043,595 |
| | |
|
|
Undistributed ordinary income | | $ | 48,110,871 |
Undistributed long term capital gains | | | 50,457,768 |
| | |
|
|
Distributable earnings | | $ | 98,568,639 |
| | |
|
|
6. INVESTMENT TRANSACTIONS
Purchases and sales of investments (excluding short-term securities) for the year ended December 31, 2004, aggregated $471,461,106 and $309,171,254, respectively.
7. RESTRICTED SECURITIES
At December 31, 2004, investments in securities included issues that are restricted and illiquid. Restricted securities are often purchased in private placement transactions, are not registered under the Securities Act of 1933, may have contractual restrictions on resale, and are valued under methods approved by the Board of Trustees as reflecting fair value. A security may also be considered illiquid if it lacks a readily available market or if its valuation has not changed for a certain period of time. At December 31, 2004, the Fund held investments in restricted and illiquid securities that were valued under approved methods by the Trustees, as follows:
| | | | | | | | | | |
| Shares | | Issuer | | Acquisition
Date | | Cost | | Value |
| 1,084,000 | | Provident Senior Living Trust, 144A (1.40% of Net Assets) | | 8/3/04 | | $ | 16,260,000 | | $ | 16,260,000 |
| | | | | | |
|
|
8. HOLDINGS OF 5% VOTING SECURITIES OF PORTFOLIO COMPANIES
The Investment Company Act of 1940 defines “affiliated companies” to include investments in portfolio companies in which a fund owns 5% or more of the outstanding voting securities. Investments in “affiliated companies” for the Fund at December 31, 2004 were as shown below.
| | | | | | | | | | | | | | | | | |
| Name of Issuer | | Number
of Shares
Held at
Beginning
of Year | | Gross
Additions | | Gross
Reductions | | Number
of Shares
Held at
End of
Year | | Value at
End of Year | | Investment
Income | | Realized
Gain (Loss) |
Digital Realty Trust, Inc | | — | | 1,535,500 | | — | | 1,535,500 | | $ | 20,683,185 | | $ | 240,026 | | $ | — |
GMH Communities Trust | | — | | 1,700,000 | | — | | 1,700,000 | | | 23,970,000 | | | 272,000 | | | — |
| | | | | | | | | | |
|
| Total Affiliated Securities (3.86% of Net Assets) | | $ | 44,653,185 | | $ | 512,026 | | $ | — |
| | | | | | | | | | |
|
FRE-20
FRANKLIN TEMPLETON VARIABLE INSURANCE PRODUCTS TRUST
FRANKLIN REAL ESTATE FUND
Notes to Financial Statements (continued)
9. REGULATORY MATTERS
Investigations
As part of various investigations by a number of federal, state, and foreign regulators and governmental entities, including the Securities and Exchange Commission (“SEC”), the California Attorney General’s Office (“CAGO”), and the National Association of Securities Dealers, Inc. (“NASD”), relating to certain practices in the mutual fund industry, including late trading, market timing and marketing support payments to securities dealers who sell fund shares, Franklin Resources, Inc. and certain of its subsidiaries (as used in this section, together, the “Company”), as well as certain current or former executives and employees of the Company, received subpoenas and/or requests for documents, information and/or testimony. The Company and its current employees provided documents and information in response to those requests and subpoenas.
Settlements
Beginning in August 2004, the Company entered into settlements with certain regulators investigating the mutual fund industry practices noted above. The Company believes that settlement of each of the matters described in this section is in the best interest of the Company and shareholders of the Franklin, Templeton, and Mutual Series mutual funds (the “funds”).
On August 2, 2004, Franklin Resources, Inc. announced that its subsidiary, Franklin Advisers, Inc., reached an agreement with the SEC that resolved the issues resulting from the SEC investigation into market timing activity. In connection with that agreement, the SEC issued an “Order Instituting Administrative and Cease-and-Desist Proceedings Pursuant to Sections 203(e) and 203(k) of the Investment Advisers Act of 1940 and Sections 9(b) and 9(f) of the Investment Company Act of 1940, Making Findings and Imposing Remedial Sanctions and a Cease-and-Desist Order” (the “Order”). The SEC’s Order concerned the activities of a limited number of third parties that ended in 2000 and those that were the subject of the first Massachusetts administrative complaint described below.
Under the terms of the SEC’s Order, pursuant to which Franklin Advisers, Inc. neither admitted nor denied any of the findings contained therein, Franklin Advisers, Inc. agreed to pay $50 million, of which $20 million is a civil penalty, to be distributed to shareholders of certain funds in accordance with a plan to be developed by an independent distribution consultant. At this time, it is unclear which funds or which shareholders of any particular fund will receive distributions. The Order also required Franklin Advisers, Inc. to, among other things, enhance and periodically review compliance policies and procedures.
On September 20, 2004, Franklin Resources, Inc. announced that two of its subsidiaries, Franklin Advisers, Inc. and Franklin Templeton Alternative Strategies, Inc. (“FTAS”), reached an agreement with the Securities Division of the Office of the Secretary of the Commonwealth of Massachusetts (the “State of Massachusetts”) related to its administrative complaint filed on February 4, 2004, concerning one instance of market timing that was also a subject of the August 2, 2004 settlement that Franklin Advisers, Inc. reached with the SEC, as described above.
Under the terms of the settlement consent order issued by the State of Massachusetts, Franklin Advisers, Inc. and FTAS consented to the entry of a cease-and-desist order and agreed to pay a $5 million administrative fine to the State of Massachusetts (the “Massachusetts Consent Order”). The Massachusetts Consent Order included two different sections: “Statements of Fact” and “Violations of Massachusetts Securities Laws.” Franklin Advisers, Inc. and FTAS admitted the facts in the Statements of Fact.
On October 25, 2004, the State of Massachusetts filed a second administrative complaint, alleging that Franklin Resources, Inc.’s Form 8-K filing (in which it described the Massachusetts Consent Order and stated that “Franklin did not admit or deny engaging in any wrongdoing”) failed to state that Franklin Advisers, Inc. and FTAS admitted the Statements of Fact portion of the Massachusetts Consent Order (the “Second Complaint”). Franklin Resources, Inc. reached a second agreement with the State of Massachusetts on November 19, 2004, resolving the Second Complaint. As a result of the November 19, 2004 settlement, Franklin Resources, Inc. filed a new Form 8-K. The terms of the Massachusetts Consent Order did not change and there was no monetary fine associated with this second settlement.
FRE-21
FRANKLIN TEMPLETON VARIABLE INSURANCE PRODUCTS TRUST
FRANKLIN REAL ESTATE FUND
Notes to Financial Statements (continued)
9. REGULATORY MATTERS (cont.)
Settlements (cont.)
On November 17, 2004, Franklin Resources, Inc. announced that Franklin/Templeton Distributors, Inc. (“FTDI”) reached an agreement with the CAGO, resolving the issues resulting from the CAGO’s investigation concerning sales and marketing support payments. Under the terms of the settlement, FTDI neither admitted nor denied the allegations in the CAGO’s complaint and agreed to pay $2 million to the State of California as a civil penalty, $14 million to the funds, to be allocated by an independent distribution consultant to be paid for by FTDI, and $2 million to the CAGO for its investigative costs.
On December 13, 2004, Franklin Resources, Inc. announced that its subsidiaries FTDI and Franklin Advisers, Inc. reached an agreement with the SEC, resolving the issues resulting from the SEC’s investigation concerning marketing support payments to securities dealers who sell fund shares. In connection with that agreement, the SEC issued an “Order Instituting Administrative and Cease-and-Desist Proceedings, Making Findings, and Imposing Remedial Sanctions Pursuant to Sections 203(e) and 203(k) of the Investment Advisers Act of 1940, Sections 9(b) and 9(f) of the Investment Company Act of 1940, and Section 15(b) of the Securities Exchange Act of 1934” (the “Second Order”).
Under the terms of the Second Order, in which FTDI and Franklin Advisers, Inc. neither admitted nor denied the findings contained therein, they agreed to pay the funds a penalty of $20 million and disgorgement of $1 (one dollar). FTDI and Franklin Advisers, Inc. also agreed to implement certain measures and undertakings relating to marketing support payments to broker-dealers for the promotion or sale of fund shares, including making additional disclosures in the funds’ Prospectuses and Statements of Additional Information. The Second Order further requires the appointment of an independent distribution consultant, at the Company’s expense, who shall develop a plan for the distribution of the penalty and disgorgement to the funds.
Other Legal Proceedings
The Trust, in addition to the Company and other funds, and certain current and former officers, employees, and directors have been named in multiple lawsuits in different federal courts in Nevada, California, Illinois, New York and Florida, alleging violations of various federal securities laws and seeking, among other relief, monetary damages, restitution, removal of fund trustees, directors, advisers, administrators, and distributors, rescission of management contracts and 12b-1 Plans, and/or attorneys’ fees and costs. Specifically, the lawsuits claim breach of duty with respect to alleged arrangements to permit market timing and/or late trading activity, or breach of duty with respect to the valuation of the portfolio securities of certain Templeton funds managed by Franklin Resources, Inc. subsidiaries, resulting in alleged market timing activity. The majority of these lawsuits duplicate, in whole or in part, the allegations asserted in the February 4, 2004 Massachusetts administrative complaint and the findings in the SEC’s August 2, 2004 Order, as described above. The lawsuits are styled as class actions, or derivative actions on behalf of either the named funds or Franklin Resources, Inc.
In addition, the Company, as well as certain current and former officers, employees, and directors, have been named in multiple lawsuits alleging violations of various securities laws and pendent state law claims relating to the disclosure of directed brokerage payments and/or payment of allegedly excessive advisory, commission, and distribution fees, and seeking, among other relief, monetary damages, restitution, rescission of advisory contracts, including recovery of all fees paid pursuant to those contracts, an accounting of all monies paid to the named advisers, declaratory relief, injunctive relief, and/or attorneys’ fees and costs. These lawsuits are styled as class actions or derivative actions brought on behalf of certain funds.
The Company and fund management strongly believes that the claims made in each of the lawsuits identified above are without merit and intends to vigorously defend against them. The Company cannot predict with certainty, however, the eventual outcome of the remaining governmental investigations or private lawsuits, nor whether they will have a material negative impact on the Company. Public trust and confidence are critical to the Company’s business and any material loss of investor and/or client confidence could result in a significant decline in assets under management by the Company, which would have an adverse effect on the Company’s future financial results. If the Company finds that it bears responsibility for any unlawful or inappropriate conduct that caused losses to the Trust, it is committed to making the Trust or its shareholders whole, as appropriate. The Company is committed to taking all appropriate actions to protect the interests of its funds’ shareholders.
FRE-22
FRANKLIN TEMPLETON VARIABLE INSURANCE PRODUCTS TRUST
FRANKLIN REAL ESTATE FUND
Report of Independent Registered Public Accounting Firm
To the Trustees and Shareholders of Franklin Templeton Variable Insurance Products Trust
In our opinion, the accompanying statement of assets and liabilities, including the statement of investments, and the related statements of operations and of changes in net assets and the financial highlights present fairly, in all material respects, the financial position of Franklin Real Estate Fund (the Fund) (one of the funds constituting Franklin Templeton Variable Insurance Products Trust) at December 31, 2004, the results of its operations for the year then ended, the changes in its net assets for each of the two years in the period then ended and the financial highlights for each of the five years in the period then ended, in conformity with accounting principles generally accepted in the United States of America. These financial statements and financial highlights (hereafter referred to as “financial statements”) are the responsibility of the Fund’s management; our responsibility is to express an opinion on these financial statements based on our audits. We conducted our audits of these financial statements in accordance with the standards of the Public Company Accounting Oversight Board (United States). Those standards require that we plan and perform the audits to obtain reasonable assurance about whether the financial statements are free of material misstatement. An audit includes examining, on a test basis, evidence supporting the amounts and disclosures in the financial statements, assessing the accounting principles used and significant estimates made by management, and evaluating the overall financial statement presentation. We believe that our audits, which included confirmation of securities at December 31, 2004 by correspondence with the custodian and brokers, provide a reasonable basis for our opinion.
PricewaterhouseCoopers LLP
San Francisco, California
February 9, 2005
FRE-23
FRANKLIN TEMPLETON VARIABLE INSURANCE PRODUCTS TRUST
FRANKLIN REAL ESTATE FUND
Tax Designation (unaudited)
Under Section 852(b)(3)(c) of the Internal Revenue Code (Code), the Fund hereby designates $50,458,214 as a capital gain dividend for the fiscal year ended December 31, 2004.
Under Section 854(b)(2) of the Code, the Fund hereby designates 3.92% of the ordinary income dividends as income qualifying for the dividends received deduction for the fiscal year ended December 31, 2004.
FRE-24
FRANKLIN RISING DIVIDENDS SECURITIES FUND
This annual report for Franklin Rising Dividends Securities Fund covers the fiscal year ended December 31, 2004.
Performance Summary as of 12/31/04
Average annual total return of Class 2 shares* represents the average annual change in value, assuming reinvestment of dividends and capital gains. Average returns smooth out variations in returns, which can be significant; they are not the same as year-by-year results.
Periods ended 12/31/04
| | | | | | |
| | | 1-Year | | 5-Year | | 10-Year |
Average Annual Total Return | | +11.00% | | +13.28% | | +14.43% |
*Because Class 2 shares were not offered until 1/6/99, standardized Class 2 Fund performance for prior periods represents the historical results of Class 1 shares. For periods beginning on 1/6/99, Class 2’s results reflect an additional 12b-1 fee expense, which also affects future performance. Since 1/6/99 (effective date), the average annual total return of Class 2 shares was +8.88%.
Total Return Index Comparison
for Hypothetical $10,000 Investment (1/1/95–12/31/04)
The graph below shows the change in value of a hypothetical $10,000 investment in the Fund over the indicated period and includes reinvestment of any income or distributions. The Fund’s performance* is compared to the performance of the Russell Midcap® Value Index and the Standard & Poor’s 500 Composite Index (S&P 500). One cannot invest directly in an index, nor is an index representative of the Fund’s portfolio. Please see Important Notes to Performance Information preceding the Fund Summaries.
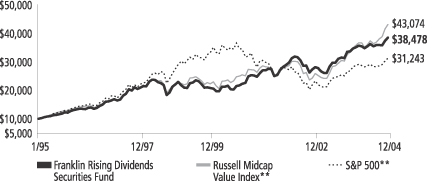
**Source: Standard & Poor’s Micropal. Please see Index Descriptions following the Fund Summaries.
Franklin Rising Dividends Securities Fund – Class 2
Performance reflects the Fund’s Class 2 operating expenses, but does not include any contract fees, expenses or sales charges. If they had been included, performance would be lower. These charges and deductions, particularly for variable life policies, can have a significant effect on contract values and insurance benefits. See the contract prospectus for a complete description of these expenses, including sales charges.
Performance data quoted represent past performance, which does not guarantee future results. Investment return and principal value will fluctuate, and you may have a gain or loss when you sell your shares. Current performance may differ from figures shown.
FRD-1
Fund Goal and Main Investments: Franklin Rising Dividends Securities Fund seeks long-term capital appreciation. Preservation of capital, while not a goal, is also an important consideration. The Fund invests at least 65% of its assets in securities of companies that have increased dividends over the past 10 years.
Performance Overview
You can find the Fund’s one-year total return in the Performance Summary. The Fund underperformed its benchmark, the Russell Midcap Value Index, which returned 23.71% for the year under review.1 The Fund performed comparably to the 10.87% one-year return of the S&P 500.1 Please note that the Fund employs a bottom-up stock selection process, and the managers invest in securities without regard to benchmark comparisons.
Economic and Market Overview
During the year ended December 31, 2004, the domestic economy expanded solidly and broadly across most industries, sectors and regions as gross domestic product (GDP) rose an estimated 4.4%.2 However, surging energy and other commodity prices had a dampening effect. Although consumer confidence remained below pre-recession levels, consumer spending supported strong auto sales, increased durable goods consumption and a healthy housing market. Similarly, business spending rose substantially even as business confidence wavered. With improving balance sheets and stronger profit margins, many companies entered an upgrade cycle and invested in new technologies, driving equipment spending up 9.5% in the second half of 2004.2 The labor market firmed as employers hired 2.2 million workers in 2004, and unemployment dropped from 5.7% to 5.4% during the year.3 More than one-half of the jobs lost during the recession have been recovered; however, most new jobs were part-time or temporary. Given concerns over rising benefits costs and lingering uncertainties about economic recovery, many companies turned to temporary employment or opted for continued hiring freezes. At year-end, elevated household debt levels and the deepening federal budget and trade deficits were three top concerns for the economy as it headed into 2005.
The U.S. dollar weakened throughout 2004 and hit an all-time low against the euro and a multi-year low versus the yen. The widening trade and current account deficits and possibility for higher import
1. Source: Standard & Poor’s Micropal. One cannot invest directly in an index, nor is an index representative of the Fund’s portfolio. Please see Index Descriptions following the Fund Summaries.
2. Source: Bureau of Economic Analysis.
3. Source: Bureau of Labor Statistics.
Fund Risks: Stocks offer the potential for long-term gains but can be subject to short-term up-and-down price movements. Small and midsize company securities can increase the risk of greater price fluctuation. By having significant investments in particular sectors from time to time, the Fund may experience more volatility than a fund with a more broadly diversified portfolio. The Fund’s prospectus also includes a description of the main investment risks.
FRD-2
prices contributed to inflationary pressures. The core inflation rate rose to 2.2% in 2004, or 3.3% including volatile food and energy costs. Aiming to keep inflation tame, the Federal Reserve Board (Fed) raised the federal funds target rate five times between June and December, from 1.00% to 2.25%, the highest level in more than three years. The Fed said it will respond to changes in economic prospects as needed to fulfill its obligation to maintain price stability, noting in December that it perceived “the upside and downside risks to the attainment of both sustainable growth and price stability for the next few quarters to be roughly equal.”4
Despite a generally robust economy and improving corporate fundamentals, investors had to digest a wide range of information in 2004, including rising inflation, the dollar’s value, a contentious presidential election and ongoing concerns about terrorism, war and reconstruction in Iraq. Domestic equity markets rallied in early 2004 and then fluctuated; however, they were essentially flat through early November. Disappointing earnings from a number of blue chip companies applied downward pressure, but initial public offering (IPO) activity was strong and investor sentiment improved late in the period despite the mixed signals. After the elections concluded, the markets enjoyed another strong rally through year-end. The blue chip stocks of the Dow Jones Industrial Average gained 5.31% for the year under review, while the broader S&P 500 rose 10.87% and the technology-heavy NASDAQ Composite Index increased 9.15%.5
Investment Strategy
We are a research driven, fundamental investment adviser, pursuing a disciplined value-oriented strategy. As bottom-up investors concentrating primarily on individual securities, we seek fundamentally sound companies that meet our screening criteria: consistent, substantial dividend increases; reinvested earnings; and strong balance sheets. We attempt to acquire such stocks at attractive prices, often when they are
out of favor with other investors. In following these criteria, we do not necessarily focus on companies whose securities pay a high dividend but rather on companies that consistently raise their dividends.
4. Source: Federal Reserve. Press Release, 12/14/04.
5. Source: Standard & Poor’s Micropal. Please see Index Descriptions following the Fund Summaries.
FRD-3
Manager’s Discussion
Significant positive contributors to the Fund’s return during the year ended December 31, 2004, were Nucor, National Commerce Financial and West Pharmaceutical Services. Strong customer demand for steel enabled Nucor to raise its selling prices and thus improve its profitability during the period. Nucor has 31 consecutive years of dividend increases. SunTrust Banks acquired National Commerce Financial, a southeastern regional bank. The Fund retained shares of SunTrust that it received in exchange for National Commerce. National Commerce had 29 consecutive years of dividend increases while SunTrust has increased its dividend for 18 years in a row. West Pharmaceutical Services, a market leader in closure systems and syringe components for use with injectable drugs, agreed to sell a substantial majority interest in its money-losing drug-delivery business. West has increased its dividend 12 years in a row.
Three stocks that declined during the period were Family Dollar Stores, Superior Industries International and Pfizer. Family Dollar had disappointing sales and earnings results over the last several quarters, partly due to its inability to meet its plan for new store openings. Nevertheless, the company increased its dividend for the 28th year in a row. Operational problems as well as increased selling price pressure caused Superior to lower its earnings expectations for 2004. Superior has what we feel is a strong balance sheet and it has increased its dividend for 21 successive years. Pfizer’s market price, as well as those of other large pharmaceutical companies, had been under pressure for a variety of reasons including approaching patent expirations, generic competition, drug reimportation, and most recently, increased product safety concerns. Strong cash flow, however, enabled Pfizer to raise its dividend in each of the last 38 years.
New positions we added to the portfolio during the 12 months under review were United Technologies and Freddie Mac. United Technologies provides high-technology products and support services to customers in the aerospace and building industries worldwide. Freddie Mac is a stockholder-owned, but government sponsored, entity created to support the home mortgage finance system. Freddie Mac has increased its dividend for 14 years in a row.
The Fund eliminated several positions during the reporting period. We sold Universal, which had a long-term dividend growth rate below our guidelines, following strong appreciation during the period. The Fund
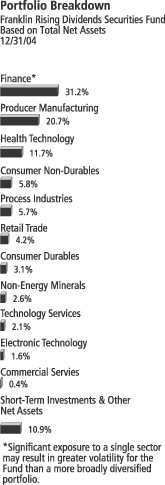
FRD-4
also liquidated Limited Brands, which did not have the history of consistent annual dividends that we prefer. We divested our Royal Dutch Petroleum holding after the company announced that it had previously overstated its oil reserves. We also sold Fresh Brands because the company cut its dividend as a result of operating problems. Lastly, we sold our remaining position in Altria Group as investors perceived less litigation risk for the company, and its stock price rose.
Our 10 largest positions on December 31, 2004, represented 36.7% of the Fund’s total net assets. It is interesting to note how these 10 companies would, in aggregate, respond to the Fund’s screening criteria based on a simple average of statistical measures. On average, these 10 companies have raised their dividends 25 years in a row and by 246% in the past 10 years. Their most recent year-over-year dividend increases averaged 11% with a yield of 1.8% on December 31, 2004, and a dividend payout ratio of 29%, based on estimates of calendar year 2004 operating earnings. The average price/earnings ratio was 16.8 times 2004 estimates versus 18.4 for that of the unmanaged S&P 500 on the same date.5
Thank you for your participation in Franklin Rising Dividends Securities Fund. We look forward to serving your future investment needs.
The foregoing information reflects our analysis, opinions and portfolio holdings as of December 31, 2004, the end of the reporting period. The way we implement our main investment strategies and the resulting portfolio holdings may change depending on factors such as market and economic conditions. These opinions may not be relied upon as investment advice or an offer for a particular security. The information is not a complete analysis of every aspect of any market, country, industry, security or the Fund. Statements of fact are from sources considered reliable, but the adviser makes no representation or warranty as to their completeness or accuracy. Although historical performance is no guarantee of future results, these insights may help you understand our investment management philosophy.
Top 10 Holdings
Franklin Rising Dividends Securities Fund
12/31/04
| | |
Company Sector/Industry | | % of Total
Net Assets |
| |
| Family Dollar Stores Inc. | | 4.2% |
| Retail Trade | | |
| |
| General Electric Co. | | 4.0% |
| Producer Manufacturing | | |
| |
| American International Group Inc. | | 4.0% |
| Finance | | |
| |
| Pfizer Inc. | | 3.9% |
| Health Technology | | |
| |
Hillenbrand
Industries Inc. | | 3.8% |
| Health Technology | | |
| |
| Carlisle Cos. Inc. | | 3.8% |
| Producer Manufacturing | | |
| |
| Praxair Inc. | | 3.5% |
| Process Industries | | |
| |
| Fannie Mae | | 3.3% |
| Finance | | |
| |
| Old Republic International Corp. | | 3.1% |
| Finance | | |
| |
| State Street Corp. | | 3.1% |
| Finance | | |
The dollar value, number of shares or principal amount, and names of all portfolio holdings are listed in the Fund’s Statement of Investments.
FRD-5
Fund Expenses
As an investor in a variable insurance contract (“Contract”) that indirectly provides for investment in an underlying mutual fund, you can incur transaction and/or ongoing expenses at both the Fund level and the Contract level.
| • | | Transaction expenses can include sales charges (loads) on purchases, redemption fees, surrender fees, transfer fees and premium taxes. |
| • | | Ongoing expenses can include management fees, distribution and service (12b-1) fees, contract fees, annual maintenance fees, mortality and expense risk fees and other fees and expenses. All mutual funds and Contracts have some types of ongoing expenses. |
The expenses shown in the table below are meant to highlight ongoing expenses at the Fund level only and do not include ongoing expenses at the Contract level, or transaction expenses at either the Fund or Contract levels. While the Fund does not have transaction expenses, if the transaction and ongoing expenses at the Contract level were included, the expenses shown below would be higher. You should consult your Contract prospectus or disclosure document for more information.
The table shows Fund-level ongoing expenses and can help you understand these expenses and compare them with those of other mutual funds offered through the Contract. The table assumes a $1,000 investment held for the six months indicated. Please refer to the Fund prospectus for additional information on operating expenses.
Actual Fund Expenses
The first line (Actual) for each share class listed in the table below provides actual account values and expenses. The “Ending Account Value” is derived from the Fund’s actual return, which includes the effect of ongoing Fund expenses, but does not include the effect of ongoing Contract expenses.
You can estimate the Fund-level expenses you incurred during the period, by following these steps. Of course, your account value and expenses will differ from those in this illustration:
| 1. | Divide your account value by $1,000. |
If an account had an $8,600 value, then $8,600 ÷ $1,000 = 8.6.
| 2. | Multiply the result by the number under the heading “Fund-Level Expenses Incurred During Period.” |
If Fund-Level Expenses Incurred During Period were $7.50, then
8.6 × $7.50 = $64.50.
Franklin Rising Dividends Securities Fund – Class 2
FRD-6
In this illustration, the estimated expenses incurred this period at the Fund level are $64.50.
Hypothetical Example for Comparison with Other Mutual Funds
Information in the second line (Hypothetical) for each class in the table can help you compare ongoing expenses of the Fund with those of other mutual funds offered through the Contract. This information may not be used to estimate the actual ending account balance or expenses you incurred during the period. The hypothetical “Ending Account Value” is based on the actual expense ratio for each class and an assumed 5% annual rate of return before expenses, which does not represent the Fund’s actual return. The figure under the heading “Fund-Level Expenses Incurred During Period” shows the hypothetical expenses your account would have incurred under this scenario. You can compare this figure with the 5% hypothetical examples that appear in shareholder reports of other funds offered through a Contract.
| | | | | | | | | |
| Class 2 | | Beginning
Account
Value 6/30/04 | | Ending
Account
Value 12/31/04 | | Fund-Level
Expenses Incurred
During Period*
6/30/04-12/31/04 |
Actual | | $ | 1,000 | | $ | 1,061.20 | | $ | 4.82 |
Hypothetical (5% return before expenses) | | $ | 1,000 | | $ | 1,020.46 | | $ | 4.72 |
*Expenses are equal to the annualized expense ratio for the Fund’s Class 2 shares (0.93%), which does not include any ongoing expenses of the Contract for which the Fund is an investment option, multiplied by the average account value over the period, multiplied by 184/366 to reflect the one-half year period.
FRD-7
FRANKLIN TEMPLETON VARIABLE INSURANCE PRODUCTS TRUST
FRANKLIN RISING DIVIDENDS SECURITIES FUND
Financial Highlights
| | | | | | | | | | | | | | | | | | | | |
| | | Class 1
| |
| | | Year Ended December 31,
| |
| | | 2004 | | | 2003 | | | 2002 | | | 2001 | | | 2000 | |
| | |
|
|
|
Per share operating performance | | | | | | | | | | | | | | | | | | | | |
(for a share outstanding throughout the year) | | | | | | | | | | | | | | | | | | | | |
Net asset value, beginning of year | | $ | 16.28 | | | $ | 13.57 | | | $ | 14.19 | | | $ | 13.23 | | | $ | 13.61 | |
| | |
|
|
|
Income from investment operations: | | | | | | | | | | | | | | | | | | | | |
Net investment incomea | | | .26 | | | | .19 | | | | .16 | | | | .18 | | | | .20 | |
Net realized and unrealized gains (losses) | | | 1.55 | | | | 3.10 | | | | (.30 | ) | | | 1.60 | | | | 2.18 | |
| | |
|
|
|
Total from investment operations | | | 1.81 | | | | 3.29 | | | | (.14 | ) | | | 1.78 | | | | 2.38 | |
| | |
|
|
|
Less distributions from: | | | | | | | | | | | | | | | | | | | | |
Net investment income | | | (.12 | ) | | | (.14 | ) | | | (.19 | ) | | | (.01 | ) | | | (.50 | ) |
Net realized gains | | | (.22 | ) | | | (.44 | ) | | | (.29 | ) | | | (.81 | ) | | | (2.26 | ) |
| | |
|
|
|
Total distributions | | | (.34 | ) | | | (.58 | ) | | | (.48 | ) | | | (.82 | ) | | | (2.76 | ) |
| | |
|
|
|
Net asset value, end of year | | $ | 17.75 | | | $ | 16.28 | | | $ | 13.57 | | | $ | 14.19 | | | $ | 13.23 | |
| | |
|
|
|
| | | | | |
Total returnb | | | 11.25% | | | | 24.88% | | | | (1.32)% | | | | 13.90% | | | | 21.05% | |
Ratios/supplemental data | | | | | | | | | | | | | | | | | | | | |
Net assets, end of year (000’s) | | $ | 326,883 | | | $ | 326,663 | | | $ | 292,881 | | | $ | 347,336 | | | $ | 363,485 | |
Ratios to average net assets: | | | | | | | | | | | | | | | | | | | | |
Expenses | | | .69% | | | | .76% | | | | .78% | | | | .76% | | | | .78% | |
Net investment income | | | 1.56% | | | | 1.39% | | | | 1.11% | | | | 1.36% | | | | 1.66% | |
Portfolio turnover rate | | | 2.78% | | | | 9.54% | | | | 14.06% | | | | 11.78% | | | | 12.26% | |
| a | Based on average daily shares outstanding. |
| b | Total return does not include any fees, charges or expenses imposed by the variable annuity and life insurance contracts for which the Franklin Templeton Variable Insurance Products Trust serves as an underlying investment vehicle. Total return is not annualized for periods less than one year. |
See notes to financial statements.
FRD-8
FRANKLIN TEMPLETON VARIABLE INSURANCE PRODUCTS TRUST
FRANKLIN RISING DIVIDENDS SECURITIES FUND
Financial Highlights (continued)
| | | | | | | | | | | | | | | | | | | | |
| | | Class 2
| |
| | | Year Ended December 31,
| |
| | | 2004 | | | 2003 | | | 2002 | | | 2001 | | | 2000 | |
| | |
|
|
|
Per share operating performance | | | | | | | | | | | | | | | | | | | | |
(for a share outstanding throughout the year) | | | | | | | | | | | | | | | | | | | | |
Net asset value, beginning of year | | $ | 16.09 | | | $ | 13.44 | | | $ | 14.09 | | | $ | 13.18 | | | $ | 13.56 | |
| | |
|
|
|
Income from investment operations: | | | | | | | | | | | | | | | | | | | | |
Net investment incomea | | | .22 | | | | .17 | | | | .13 | | | | .15 | | | | .17 | |
Net realized and unrealized gains (losses) | | | 1.53 | | | | 3.05 | | | | (.31 | ) | | | 1.58 | | | | 2.17 | |
| | |
|
|
|
Total from investment operations | | | 1.75 | | | | 3.22 | | | | (.18 | ) | | | 1.73 | | | | 2.34 | |
| | |
|
|
|
Less distributions from: | | | | | | | | | | | | | | | | | | | | |
Net investment income | | | (.11 | ) | | | (.13 | ) | | | (.18 | ) | | | (.01 | ) | | | (.46 | ) |
Net realized gains | | | (.22 | ) | | | (.44 | ) | | | (.29 | ) | | | (.81 | ) | | | (2.26 | ) |
| | |
|
|
|
Total distributions | | | (.33 | ) | | | (.57 | ) | | | (.47 | ) | | | (.82 | ) | | | (2.72 | ) |
| | |
|
|
|
Net asset value, end of year | | $ | 17.51 | | | $ | 16.09 | | | $ | 13.44 | | | $ | 14.09 | | | $ | 13.18 | |
| | |
|
|
|
| | | | | |
Total returnb | | | 11.00% | | | | 24.59% | | | | (1.58)% | | | | 13.57% | | | | 20.71% | |
Ratios/supplemental data | | | | | | | | | | | | | | | | | | | | |
Net assets, end of year (000’s) | | $ | 997,800 | | | $ | 343,675 | | | $ | 63,879 | | | $ | 11,831 | | | $ | 1,041 | |
Ratios to average net assets: | | | | | | | | | | | | | | | | | | | | |
Expenses | | | .94% | | | | 1.01% | | | | 1.03% | | | | 1.01% | | | | 1.03% | |
Net investment income | | | 1.31% | | | | 1.14% | | | | .86% | | | | 1.13% | | | | 1.44% | |
Portfolio turnover rate | | | 2.78% | | | | 9.54% | | | | 14.06% | | | | 11.78% | | | | 12.26% | |
| a | Based on average daily shares outstanding. |
| b | Total return does not include any fees, charges or expenses imposed by the variable annuity and life insurance contracts for which the Franklin Templeton Variable Insurance Products Trust serves as an underlying investment vehicle. Total return is not annualized for periods less than one year. |
See notes to financial statements.
FRD-9
FRANKLIN TEMPLETON VARIABLE INSURANCE PRODUCTS TRUST
FRANKLIN RISING DIVIDENDS SECURITIES FUND
Statement of Investments, December 31, 2004
| | | | | |
| | | SHARES | | VALUE |
Common Stocks 89.1% | | | | | |
Commercial Services .4% | | | | | |
ABM Industries Inc. | | 274,500 | | $ | 5,413,140 |
| | | | |
|
|
Consumer Durables 3.1% | | | | | |
Leggett & Platt Inc. | | 1,162,700 | | | 33,055,561 |
Russ Berrie & Co. Inc. | | 362,400 | | | 8,277,216 |
| | | | |
|
|
| | | | | | 41,332,777 |
| | | | |
|
|
Consumer Non-Durables 5.8% | | | | | |
Alberto-Culver Co. | | 610,450 | | | 29,649,556 |
Lancaster Colony Corp. | | 117,800 | | | 5,050,086 |
Procter & Gamble Co. | | 691,400 | | | 38,082,312 |
Superior Uniform Group Inc. | | 237,100 | | | 3,544,645 |
| | | | |
|
|
| | | | | | 76,326,599 |
| | | | |
|
|
Electronic Technology 1.6% | | | | | |
Cohu Inc. | | 106,800 | | | 1,982,208 |
Diebold Inc. | | 340,200 | | | 18,959,346 |
| | | | |
|
|
| | | | | | 20,941,554 |
| | | | |
|
|
Finance 31.2% | | | | | |
AFLAC Inc. | | 869,600 | | | 34,644,864 |
American International Group Inc. | | 797,055 | | | 52,342,602 |
Arthur J. Gallagher & Co. | | 573,000 | | | 18,622,500 |
Erie Indemnity Co., A | | 276,800 | | | 14,551,376 |
Fannie Mae | | 607,500 | | | 43,260,075 |
Freddie Mac | | 285,200 | | | 21,019,240 |
Mercantile Bankshares Corp. | | 220,525 | | | 11,511,405 |
Mercury General Corp. | | 154,200 | | | 9,239,664 |
Old Republic International Corp. | | 1,621,150 | | | 41,015,095 |
Peoples Bancorp Inc. | | 159,979 | | | 4,388,224 |
RLI Corp. | | 252,512 | | | 10,496,924 |
State Street Corp. | | 831,400 | | | 40,838,368 |
SunTrust Banks Inc. | | 442,104 | | | 32,662,643 |
TrustCo Bank Corp. NY | | 328,588 | | | 4,531,228 |
U.S. Bancorp | | 1,199,749 | | | 37,576,139 |
Washington Mutual Inc. | | 760,200 | | | 32,141,256 |
Wilmington Trust Corp. | | 112,800 | | | 4,077,720 |
| | | | |
|
|
| | | | | | 412,919,323 |
| | | | |
|
|
Health Technology 11.7% | | | | | |
Becton Dickinson & Co. | | 430,200 | | | 24,435,360 |
Hillenbrand Industries Inc. | | 914,300 | | | 50,780,222 |
Pfizer Inc. | | 1,908,300 | | | 51,314,187 |
West Pharmaceutical Services Inc. | | 1,125,600 | | | 28,173,768 |
| | | | |
|
|
| | | | | | 154,703,537 |
| | | | |
|
|
Non-Energy Minerals 2.6% | | | | | |
Nucor Corp. | | 669,600 | | | 35,046,864 |
| | | | |
|
|
Process Industries 5.7% | | | | | |
Bemis Co. Inc. | | 512,200 | | | 14,899,898 |
Donaldson Co. Inc. | | 289,800 | | | 9,441,684 |
FRD-10
FRANKLIN TEMPLETON VARIABLE INSURANCE PRODUCTS TRUST
FRANKLIN RISING DIVIDENDS SECURITIES FUND
Statement of Investments, December 31, 2004 (cont.)
| | | | | |
| | | SHARES | | VALUE |
Common Stocks (cont.) | | | | | |
Process Industries (cont.) | | | | | |
Myers Industries Inc. | | 454,901 | | $ | 5,822,733 |
Praxair Inc. | | 1,039,600 | | | 45,898,340 |
| | | | |
|
|
| | | | | | 76,062,655 |
| | | | |
|
|
Producer Manufacturing 20.7% | | | | | |
Baldor Electric Co. | | 59,233 | | | 1,630,685 |
Brady Corp., A | | 157,400 | | | 9,848,518 |
Carlisle Cos. Inc. | | 776,700 | | | 50,423,364 |
CIRCOR International Inc. | | 60,200 | | | 1,394,232 |
Dover Corp. | | 573,700 | | | 24,060,978 |
General Electric Co. | | 1,439,600 | | | 52,545,400 |
Graco Inc. | | 351,112 | | | 13,114,033 |
Kaydon Corp. | | 109,600 | | | 3,618,992 |
Roper Industries Inc. | | 663,600 | | | 40,326,972 |
Superior Industries International Inc. | | 509,400 | | | 14,798,070 |
Teleflex Inc. | | 502,800 | | | 26,115,432 |
United Technologies Corp. | | 355,400 | | | 36,730,590 |
| | | | |
|
|
| | | | | | 274,607,266 |
| | | | |
|
|
Retail Trade 4.2% | | | | | |
Family Dollar Stores Inc. | | 1,776,100 | | | 55,467,603 |
| | | | |
|
|
Technology Services 2.1% | | | | | |
Reynolds & Reynolds Co., A | | 1,054,700 | | | 27,960,097 |
| | | | |
|
|
Total Common Stocks (Cost $908,959,911) | | | | | 1,180,781,415 |
| | | | |
|
|
Short Term Investment (Cost $141,299,425) 10.7% | | | | | |
Money Fund | | | | | |
aFranklin Institutional Fiduciary Trust Money Market Portfolio | | 141,299,425 | | | 141,299,425 |
| | | | |
|
|
Total Investments (Cost $1,050,259,336) 99.8% | | | | | 1,322,080,840 |
Other Assets, less Liabilities .2% | | | | | 2,601,985 |
| | | | |
|
|
Net Assets 100.0% | | | | $ | 1,324,682,825 |
| | | | |
|
|
| a | See Note 7 regarding investments in the Franklin Institutional Fiduciary Trust Money Market Portfolio. |
See notes to financial statements.
FRD-11
FRANKLIN TEMPLETON VARIABLE INSURANCE PRODUCTS TRUST
FRANKLIN RISING DIVIDENDS SECURITIES FUND
Financial Statements
Statement of Assets and Liabilities
December 31, 2004
| | | |
Assets: | | | |
Investments in securities: | | | |
Cost - Unaffiliated issuers | | $ | 908,959,911 |
Cost - Sweep Money Fund (Note 7) | | | 141,299,425 |
| | |
|
|
Total cost of investments | | | 1,050,259,336 |
| | |
|
|
Value - Unaffiliated issuers | | | 1,180,781,415 |
Value - Sweep Money Fund (Note 7) | | | 141,299,425 |
| | |
|
|
Total value of investments | | | 1,322,080,840 |
| | |
|
|
Cash | | | 28,572 |
Receivables: | | | |
Investment securities sold | | | 384,464 |
Capital shares sold | | | 2,804,075 |
Dividends | | | 1,737,642 |
| | |
|
|
Total assets | | | 1,327,035,593 |
| | |
|
|
Liabilities: | | | |
Payables: | | | |
Investment securities purchased | | | 912,675 |
Capital shares redeemed | | | 483,608 |
Affiliates | | | 866,653 |
Other liabilities | | | 89,832 |
| | |
|
|
Total liabilities | | | 2,352,768 |
| | |
|
|
Net assets, at value | | $ | 1,324,682,825 |
| | |
|
|
Net assets consist of: | | | |
Undistributed net investment income | | $ | 12,882,816 |
Net unrealized appreciation (depreciation) | | | 271,821,504 |
Accumulated net realized gain (loss) | | | 8,817,100 |
Capital shares | | | 1,031,161,405 |
| | |
|
|
Net assets, at value | | $ | 1,324,682,825 |
| | |
|
|
Class 1: | | | |
Net assets, at value | | $ | 326,883,228 |
| | |
|
|
Shares outstanding | | | 18,415,204 |
| | |
|
|
Net asset value and offering price per share | | $ | 17.75 |
| | |
|
|
Class 2: | | | |
Net assets, at value | | $ | 997,799,597 |
| | |
|
|
Shares outstanding | | | 56,990,982 |
| | |
|
|
Net asset value and offering price per share | | $ | 17.51 |
| | |
|
|
See notes to financial statements.
FRD-12
FRANKLIN TEMPLETON VARIABLE INSURANCE PRODUCTS TRUST
FRANKLIN RISING DIVIDENDS SECURITIES FUND
Financial Statements (continued)
Statement of Operations
for the year ended December 31, 2004
| | | | |
Investment income: | | | | |
Dividends: | | | | |
Unaffiliated issuers | | $ | 20,827,407 | |
Sweep Money Fund (Note 7) | | | 733,691 | |
| | |
|
|
|
Total investment income | | | 21,561,098 | |
| | |
|
|
|
Expenses: | | | | |
Management fees (Note 3) | | | 6,316,757 | |
Distribution fees - Class 2 (Note 3) | | | 1,593,963 | |
Transfer agent fees | | | 10,317 | |
Custodian fees (Note 4) | | | 19,705 | |
Reports to shareholders | | | 163,852 | |
Professional fees | | | 37,568 | |
Trustees’ fees and expenses | | | 5,450 | |
Other | | | 41,348 | |
| | |
|
|
|
Total expenses | | | 8,188,960 | |
Expense reductions (Note 4) | | | (133 | ) |
| | |
|
|
|
Net expenses | | | 8,188,827 | |
| | |
|
|
|
Net investment income | | | 13,372,271 | |
| | |
|
|
|
Realized and unrealized gains (losses): | | | | |
Net realized gain (loss) from investments | | | 9,288,374 | |
Net change in unrealized appreciation (depreciation) on investments | | | 91,427,021 | |
| | |
|
|
|
Net realized and unrealized gain (loss) | | | 100,715,395 | |
| | |
|
|
|
Net increase (decrease) in net assets resulting from operations | | $ | 114,087,666 | |
| | |
|
|
|
See notes to financial statements.
FRD-13
FRANKLIN TEMPLETON VARIABLE INSURANCE PRODUCTS TRUST
FRANKLIN RISING DIVIDENDS SECURITIES FUND
Financial Statements (continued)
Statements of Changes in Net Assets
for the years ended December 31, 2004 and 2003
| | | | | | | | |
| | | 2004 | | | 2003 | |
| | |
| |
Increase (decrease) in net assets: | | | | | | | | |
Operations: | | | | | | | | |
Net investment income | | $ | 13,372,271 | | | $ | 5,815,600 | |
Net realized gain (loss) from investments | | | 9,288,374 | | | | 12,013,697 | |
Net change in unrealized appreciation (depreciation) on investments | | | 91,427,021 | | | | 89,189,068 | |
| | |
| |
Net increase (decrease) in net assets resulting from operations | | | 114,087,666 | | | | 107,018,365 | |
Distributions to shareholders from: | | | | | | | | |
Net investment income: | | | | | | | | |
Class 1 | | | (2,310,932 | ) | | | (2,869,400 | ) |
Class 2 | | | (3,992,759 | ) | | | (1,134,822 | ) |
Net realized gains: | | | | | | | | |
Class 1 | | | (4,151,975 | ) | | | (8,730,599 | ) |
Class 2 | | | (7,861,547 | ) | | | (3,701,357 | ) |
| | |
| |
Total distributions to shareholders | | | (18,317,213 | ) | | | (16,436,178 | ) |
Capital share transactions: (Note 2) | | | | | | | | |
Class 1 | | | (27,430,346 | ) | | | (20,625,618 | ) |
Class 2 | | | 586,005,320 | | | | 243,621,232 | |
| | |
| |
Total capital share transactions | | | 558,574,974 | | | | 222,995,614 | |
Net increase (decrease) in net assets | | | 654,345,427 | | | | 313,577,801 | |
Net assets: | | | | | | | | |
Beginning of year | | | 670,337,398 | | | | 356,759,597 | |
| | |
| |
End of year | | $ | 1,324,682,825 | | | $ | 670,337,398 | |
| | |
| |
Undistributed net investment income included in net assets: | | | | | | | | |
End of year | | $ | 12,882,816 | | | $ | 5,814,236 | |
| | |
| |
See notes to financial statements.
FRD-14
FRANKLIN TEMPLETON VARIABLE INSURANCE PRODUCTS TRUST
FRANKLIN RISING DIVIDENDS SECURITIES FUND
Notes to Financial Statements
1. ORGANIZATION AND SIGNIFICANT ACCOUNTING POLICIES
Franklin Templeton Variable Insurance Products Trust (the Trust) is registered under the Investment Company Act of 1940 as an open-end investment company, consisting of twenty-one separate series (the Funds). Franklin Rising Dividends Securities Fund (the Fund) included in this report is diversified. The financial statements of the remaining funds in the series are presented separately. Shares of the Fund are sold only to insurance company separate accounts to fund the benefits of variable life insurance policies or variable annuity contracts. As of December 31, 2004, over 51% of the Fund’s shares were sold through one insurance company. The Fund’s investment objective is long-term capital appreciation.
The following summarizes the Fund’s significant accounting policies.
a. Security Valuation
Securities listed on a securities exchange or on the NASDAQ National Market System are valued at the last quoted sale price or the official closing price of the day, respectively. Over-the-counter securities and listed securities for which there is no reported sale, are valued within the range of the most recent quoted bid and ask prices. Securities that trade in multiple markets or on multiple exchanges are valued according to the broadest and most representative market. Investments in open-end mutual funds are valued at the closing net asset value.
The Trust has procedures to determine the fair value of individual securities and other assets for which market prices are not readily available or which may not be reliably priced. Some methods for valuing these securities may include: fundamental analysis, matrix pricing, discounts from market prices of similar securities, or discounts applied due to the nature and duration of restrictions on the disposition of the securities. Occasionally, events occur between the time at which trading in a security is completed and the close of the NYSE that might call into question the availability (including the reliability) of the value of a portfolio security held by the Fund. If such an event occurs, the securities may be valued using fair value procedures, which may include the use of independent pricing services. All security valuation procedures are approved by the Trust’s Board of Trustees.
b. Income Taxes
No provision has been made for U.S. income taxes because the Fund’s policy is to qualify as a regulated investment company under Subchapter M of the Internal Revenue Code and to distribute substantially all of its taxable income. Fund distributions to shareholders are determined on an income tax basis and may differ from net investment income and realized gains for financial reporting purposes.
c. Security Transactions, Investment Income, Expenses and Distributions
Security transactions are accounted for on trade date. Realized gains and losses on security transactions are determined on a specific identification basis. Interest income and estimated expenses are accrued daily. Dividend income and distributions to shareholders are recorded on the ex-dividend date.
Common expenses incurred by the Trust are allocated among the funds based on the ratio of net assets of each fund to the combined net assets. Other expenses are charged to each fund on a specific identification basis.
Realized and unrealized gains and losses and net investment income, other than class specific expenses, are allocated daily to each class of shares based upon the relative proportion of net assets of each class.
d. Accounting Estimates
The preparation of financial statements in accordance with accounting principles generally accepted in the United States of America requires management to make estimates and assumptions that affect the reported amounts of assets and liabilities at the date of the financial statements and the amounts of income and expenses during the reporting period. Actual results could differ from those estimates.
FRD-15
FRANKLIN TEMPLETON VARIABLE INSURANCE PRODUCTS TRUST
FRANKLIN RISING DIVIDENDS SECURITIES FUND
Notes to Financial Statements (continued)
1. ORGANIZATION AND SIGNIFICANT ACCOUNTING POLICIES (cont.)
e. Guarantees and Indemnifications
Under the Trust’s organizational documents, its officers and trustees are indemnified by the Trust against certain liability arising out of the performance of their duties to the Trust. Additionally, in the normal course of business, the Trust enters into contracts with service providers that contain general indemnification clauses. The Trust’s maximum exposure under these arrangements is unknown as this would involve future claims that may be made against the Trust that have not yet occurred. However, based on experience, the Trust expects the risk of loss to be remote.
2. SHARES OF BENEFICIAL INTEREST
The Fund offers two classes of shares: Class 1 and Class 2. Each class of shares differs by its distribution fees, voting rights on matters affecting a single class and its exchange privilege.
At December 31, 2004, there were an unlimited number of shares authorized ($.01 par value). Transactions in the Fund’s shares were as follows:
| | | | | | | | | | | | | | |
| | | Year Ended December 31,
| |
| | | 2004
| | | 2003
| |
| Class 1 Shares: | | Shares
| | | Amount
| | | Shares
| | | Amount
| |
Shares sold | | 912,042 | | | $ | 15,156,388 | | | 574,822 | | | $ | 8,584,713 | |
Shares issued in reinvestment of distributions | | 392,167 | | | | 6,462,907 | | | 820,948 | | | | 11,599,999 | |
Shares redeemed | | (2,956,896 | ) | | | (49,049,641 | ) | | (2,908,584 | ) | | | (40,810,330 | ) |
| | |
| |
Net increase (decrease) | | (1,652,687 | ) | | $ | (27,430,346 | ) | | (1,512,814 | ) | | $ | (20,625,618 | ) |
| | |
| |
| Class 2 Shares: | | | | | | | | | | | | |
Shares sold | | 35,974,710 | | | $ | 591,488,279 | | | 16,604,956 | | | $ | 243,911,817 | |
Shares issued in reinvestment of distributions | | 728,151 | | | | 11,854,306 | | | 345,935 | | | | 4,836,178 | |
Shares redeemed | | (1,073,616 | ) | | | (17,337,265 | ) | | (340,952 | ) | | | (5,126,763 | ) |
| | |
| |
Net increase (decrease) | | 35,629,245 | | | $ | 586,005,320 | | | 16,609,939 | | | $ | 243,621,232 | |
| | |
| |
3. TRANSACTIONS WITH AFFILIATES
Certain officers and trustees of the Fund are also officers and/or directors of the following entities:
| | |
| Entity | | Affiliation |
Franklin Advisory Services LLC (Advisory Services) | | Investment manager |
Franklin Templeton Services LLC (FT Services) | | Administrative manager |
Franklin Templeton Distributors Inc. (Distributors) | | Principal underwriter |
Franklin Templeton Investor Services LLC (Investor Services) | | Transfer agent |
a. Management Fees
The Fund pays an investment management fee to Advisory Services based on the average daily net assets of the Fund as follows:
| | |
| Annualized Fee Rate | | Net Assets |
| .750% | | First $500 million |
| .625% | | Over $500 million, up to and including $1 billion |
| .500% | | Over $1 billion |
FRD-16
FRANKLIN TEMPLETON VARIABLE INSURANCE PRODUCTS TRUST
FRANKLIN RISING DIVIDENDS SECURITIES FUND
Notes to Financial Statements (continued)
3. TRANSACTIONS WITH AFFILIATES (cont.)
b. Administrative Fees
Under an agreement with Advisory Services, FT Services provides administrative services to the Fund. The fee is paid by Advisory Services based on the average daily net assets of the Fund, and is not an additional expense of the Fund.
c. Distribution Fees
The Fund reimburses Distributors up to .25% per year of its average daily net assets of Class 2, for costs incurred in marketing the Fund’s shares under a Rule 12b-1 plan.
d. Transfer Agent Fees
Investor Services, under terms of an agreement, performs shareholder servicing for the Fund and is not paid by the Fund for the services.
4. EXPENSE OFFSET ARRANGEMENT
The Fund has entered into an arrangement with its custodian whereby credits realized as a result of uninvested cash balances are used to reduce a portion of the Fund’s custodian expenses. During the year ended December 31, 2004, the custodian fees were reduced as noted in the Statement of Operations.
5. INCOME TAXES
The tax character of distributions paid during the years ended December 31, 2004 and 2003, was as follows:
| | | | | | |
| | | 2004
| | 2003
|
Distributions paid from: | | | | | | |
Ordinary income | | $ | 6,303,691 | | $ | 4,040,358 |
Long term capital gain | | | 12,013,522 | | | 12,395,820 |
| | |
|
| | | $ | 18,317,213 | | $ | 16,436,178 |
| | |
|
Net realized gains (losses) differ for financial statement and tax purposes primarily due to differing treatment of wash sales.
At December 31, 2004, the cost of investments, net unrealized appreciation (depreciation), undistributed ordinary income and undistributed long term capital gains for income tax purposes were as follows:
| | | | |
Cost of investments | | $ | 1,050,727,380 | |
| | |
|
|
|
Unrealized appreciation | | $ | 285,132,769 | |
Unrealized depreciation | | | (13,779,309 | ) |
| | |
|
|
|
Net unrealized appreciation (depreciation) | | $ | 271,353,460 | |
| | |
|
|
|
Undistributed ordinary income | | $ | 12,882,828 | |
Undistributed long term capital gains | | | 9,285,132 | |
| | |
|
|
|
Distributable earnings | | $ | 22,167,960 | |
| | |
|
|
|
FRD-17
FRANKLIN TEMPLETON VARIABLE INSURANCE PRODUCTS TRUST
FRANKLIN RISING DIVIDENDS SECURITIES FUND
Notes to Financial Statements (continued)
6. INVESTMENT TRANSACTIONS
Purchases and sales of investments (excluding short-term securities) for the year ended December 31, 2004, aggregated $479,618,797 and $24,939,822, respectively.
7. INVESTMENTS IN FRANKLIN INSTITUTIONAL FIDUCIARY TRUST MONEY MARKET PORTFOLIO
The Fund may invest in the Franklin Institutional Fiduciary Trust Money Market Portfolio (the Sweep Money Fund), an open-end investment company managed by Franklin Advisers Inc. (an affiliate of the investment manager). Management fees paid by the Fund are reduced on assets invested in the Sweep Money Fund, in an amount not to exceed the management fees paid by the Sweep Money Fund.
8. REGULATORY MATTERS
Investigations
As part of various investigations by a number of federal, state, and foreign regulators and governmental entities, including the Securities and Exchange Commission (“SEC”), the California Attorney General’s Office (“CAGO”), and the National Association of Securities Dealers, Inc. (“NASD”), relating to certain practices in the mutual fund industry, including late trading, market timing and marketing support payments to securities dealers who sell fund shares, Franklin Resources, Inc. and certain of its subsidiaries (as used in this section, together, the “Company”), as well as certain current or former executives and employees of the Company, received subpoenas and/or requests for documents, information and/or testimony. The Company and its current employees provided documents and information in response to those requests and subpoenas.
Settlements
Beginning in August 2004, the Company entered into settlements with certain regulators investigating the mutual fund industry practices noted above. The Company believes that settlement of each of the matters described in this section is in the best interest of the Company and shareholders of the Franklin, Templeton, and Mutual Series mutual funds (the “funds”).
On August 2, 2004, Franklin Resources, Inc. announced that its subsidiary, Franklin Advisers, Inc., reached an agreement with the SEC that resolved the issues resulting from the SEC investigation into market timing activity. In connection with that agreement, the SEC issued an “Order Instituting Administrative and Cease-and-Desist Proceedings Pursuant to Sections 203(e) and 203(k) of the Investment Advisers Act of 1940 and Sections 9(b) and 9(f) of the Investment Company Act of 1940, Making Findings and Imposing Remedial Sanctions and a Cease-and-Desist Order” (the “Order”). The SEC’s Order concerned the activities of a limited number of third parties that ended in 2000 and those that were the subject of the first Massachusetts administrative complaint described below.
Under the terms of the SEC’s Order, pursuant to which Franklin Advisers, Inc. neither admitted nor denied any of the findings contained therein, Franklin Advisers, Inc. agreed to pay $50 million, of which $20 million is a civil penalty, to be distributed to shareholders of certain funds in accordance with a plan to be developed by an independent distribution consultant. At this time, it is unclear which funds or which shareholders of any particular fund will receive distributions. The Order also required Franklin Advisers, Inc. to, among other things, enhance and periodically review compliance policies and procedures.
On September 20, 2004, Franklin Resources, Inc. announced that two of its subsidiaries, Franklin Advisers, Inc. and Franklin Templeton Alternative Strategies, Inc. (“FTAS”), reached an agreement with the Securities Division of the Office of the Secretary of the Commonwealth of Massachusetts (the “State of Massachusetts”) related to its administrative complaint filed on February 4, 2004, concerning one instance of market timing that was also a subject of the August 2, 2004 settlement that Franklin Advisers, Inc. reached with the SEC, as described above.
FRD-18
FRANKLIN TEMPLETON VARIABLE INSURANCE PRODUCTS TRUST
FRANKLIN RISING DIVIDENDS SECURITIES FUND
Notes to Financial Statements (continued)
8. REGULATORY MATTERS (cont.)
Settlements (cont.)
Under the terms of the settlement consent order issued by the State of Massachusetts, Franklin Advisers, Inc. and FTAS consented to the entry of a cease-and-desist order and agreed to pay a $5 million administrative fine to the State of Massachusetts (the “Massachusetts Consent Order”). The Massachusetts Consent Order included two different sections: “Statements of Fact” and “Violations of Massachusetts Securities Laws.” Franklin Advisers, Inc. and FTAS admitted the facts in the Statements of Fact.
On October 25, 2004, the State of Massachusetts filed a second administrative complaint, alleging that Franklin Resources, Inc.’s Form 8-K filing (in which it described the Massachusetts Consent Order and stated that “Franklin did not admit or deny engaging in any wrongdoing”) failed to state that Franklin Advisers, Inc. and FTAS admitted the Statements of Fact portion of the Massachusetts Consent Order (the “Second Complaint”). Franklin Resources, Inc. reached a second agreement with the State of Massachusetts on November 19, 2004, resolving the Second Complaint. As a result of the November 19, 2004 settlement, Franklin Resources, Inc. filed a new Form 8-K. The terms of the Massachusetts Consent Order did not change and there was no monetary fine associated with this second settlement.
On November 17, 2004, Franklin Resources, Inc. announced that Franklin/Templeton Distributors, Inc. (“FTDI”) reached an agreement with the CAGO, resolving the issues resulting from the CAGO’s investigation concerning sales and marketing support payments. Under the terms of the settlement, FTDI neither admitted nor denied the allegations in the CAGO’s complaint and agreed to pay $2 million to the State of California as a civil penalty, $14 million to the funds, to be allocated by an independent distribution consultant to be paid for by FTDI, and $2 million to the CAGO for its investigative costs.
On December 13, 2004, Franklin Resources, Inc. announced that its subsidiaries FTDI and Franklin Advisers, Inc. reached an agreement with the SEC, resolving the issues resulting from the SEC’s investigation concerning marketing support payments to securities dealers who sell fund shares. In connection with that agreement, the SEC issued an “Order Instituting Administrative and Cease-and-Desist Proceedings, Making Findings, and Imposing Remedial Sanctions Pursuant to Sections 203(e) and 203(k) of the Investment Advisers Act of 1940, Sections 9(b) and 9(f) of the Investment Company Act of 1940, and Section 15(b) of the Securities Exchange Act of 1934” (the “Second Order”).
Under the terms of the Second Order, in which FTDI and Franklin Advisers, Inc. neither admitted nor denied the findings contained therein, they agreed to pay the funds a penalty of $20 million and disgorgement of $1 (one dollar). FTDI and Franklin Advisers, Inc. also agreed to implement certain measures and undertakings relating to marketing support payments to broker-dealers for the promotion or sale of fund shares, including making additional disclosures in the funds’ Prospectuses and Statements of Additional Information. The Second Order further requires the appointment of an independent distribution consultant, at the Company’s expense, who shall develop a plan for the distribution of the penalty and disgorgement to the funds.
Other Legal Proceedings
The Trust, in addition to the Company and other funds, and certain current and former officers, employees, and directors have been named in multiple lawsuits in different federal courts in Nevada, California, Illinois, New York and Florida, alleging violations of various federal securities laws and seeking, among other relief, monetary damages, restitution, removal of fund trustees, directors, advisers, administrators, and distributors, rescission of management contracts and 12b-1 Plans, and/or attorneys’ fees and costs. Specifically, the lawsuits claim breach of duty with respect to alleged arrangements to permit market timing and/or late trading activity, or breach of duty with respect to the valuation of the portfolio securities of certain Templeton funds managed by Franklin Resources, Inc. subsidiaries, resulting in alleged market timing activity. The majority of these lawsuits duplicate, in whole or in part, the allegations asserted in the February 4, 2004 Massachusetts administrative complaint and the findings in the SEC’s August 2, 2004 Order, as described above. The lawsuits are styled as class actions, or derivative actions on behalf of either the named funds or Franklin Resources, Inc.
FRD-19
FRANKLIN TEMPLETON VARIABLE INSURANCE PRODUCTS TRUST
FRANKLIN RISING DIVIDENDS SECURITIES FUND
Notes to Financial Statements (continued)
8. REGULATORY MATTERS (cont.)
Other Legal Proceedings (cont.)
In addition, the Company, as well as certain current and former officers, employees, and directors, have been named in multiple lawsuits alleging violations of various securities laws and pendent state law claims relating to the disclosure of directed brokerage payments and/or payment of allegedly excessive advisory, commission, and distribution fees, and seeking, among other relief, monetary damages, restitution, rescission of advisory contracts, including recovery of all fees paid pursuant to those contracts, an accounting of all monies paid to the named advisers, declaratory relief, injunctive relief, and/or attorneys’ fees and costs. These lawsuits are styled as class actions or derivative actions brought on behalf of certain funds.
The Company and fund management strongly believes that the claims made in each of the lawsuits identified above are without merit and intends to vigorously defend against them. The Company cannot predict with certainty, however, the eventual outcome of the remaining governmental investigations or private lawsuits, nor whether they will have a material negative impact on the Company. Public trust and confidence are critical to the Company’s business and any material loss of investor and/or client confidence could result in a significant decline in assets under management by the Company, which would have an adverse effect on the Company’s future financial results. If the Company finds that it bears responsibility for any unlawful or inappropriate conduct that caused losses to the Trust, it is committed to making the Trust or its shareholders whole, as appropriate. The Company is committed to taking all appropriate actions to protect the interests of its funds’ shareholders.
FRD-20
FRANKLIN TEMPLETON VARIABLE INSURANCE PRODUCTS TRUST
FRANKLIN RISING DIVIDENDS SECURITIES FUND
Report of Independent Registered Public Accounting Firm
To the Trustees and Shareholders of
Franklin Templeton Variable Insurance Products Trust
In our opinion, the accompanying statement of assets and liabilities, including the statement of investments, and the related statements of operations and of changes in net assets and the financial highlights present fairly, in all material respects, the financial position of Franklin Rising Dividends Securities Fund (the Fund) (one of the funds constituting Franklin Templeton Variable Insurance Products Trust) at December 31, 2004, the results of its operations for the year then ended, the changes in its net assets for each of the two years in the period then ended and the financial highlights for each of the five years in the period ended, in conformity with accounting principles generally accepted in the United States of America. These financial statements and financial highlights (hereafter referred to as “financial statements”) are the responsibility of the Fund’s management; our responsibility is to express an opinion on these financial statements based on our audits. We conducted our audits of these financial statements in accordance with the standards of the Public Company Accounting Oversight Board (United States). Those standards require that we plan and perform the audits to obtain reasonable assurance about whether the financial statements are free of material misstatement. An audit includes examining, on a test basis, evidence supporting the amounts and disclosures in the financial statements, assessing the accounting principles used and significant estimates made by management, and evaluating the overall financial statement presentation. We believe that our audits, which included confirmation of securities at December 31, 2004 by correspondence with the custodian and brokers, provide a reasonable basis for our opinion.
PricewaterhouseCoopers LLP
San Francisco, California
February 9, 2005
FRD-21
FRANKLIN TEMPLETON VARIABLE INSURANCE PRODUCTS TRUST
FRANKLIN RISING DIVIDENDS SECURITIES FUND
Tax Designation (unaudited)
Under Section 852(b)(3)(C) of the Internal Revenue Code (Code), the Fund hereby designates $9,288,362 as a capital gain dividend for the fiscal year ended December 31, 2004.
Under Section 854(b)(2) of the Code, the Fund hereby designates 100% of the ordinary income dividends as income qualifying for the dividends received deduction for the fiscal year ended December 31, 2004.
FRD-22
DECEMBER 31, 2004
FRANKLIN TEMPLETON
VARIABLE INSURANCE PRODUCTS TRUST
ANNUAL
REPORT
SEE INSIDEFOR IMPORTANT NOTICE REGARDING CHANGEIN INVESTMENT POLICYAND NAMEOF ONE FUND.
FRANKLIN® TEMPLETON®
INVESTMENTS
Franklin • Templeton • Mutual Series
FRANKLIN SMALL CAP FUND
We are pleased to bring you Franklin Small Cap Fund’s annual report for the fiscal year ended December 31, 2004.
Performance Summary as of 12/31/04
Average annual total return of Class 2 shares* represents the average annual change in value, assuming reinvestment of dividends and capital gains. Average returns smooth out variations in returns, which can be significant; they are not the same as year-by-year results.
Periods ended 12/31/04
| | | | | | |
| | | 1-Year | | 5-Year | | Since
Inception
(11/1/95) |
Average Annual Total Return | | +11.47% | | -4.65% | | +9.90% |
*Because Class 2 shares were not offered until 1/6/99, standardized Class 2 Fund performance for prior periods represents the historical results of Class 1 shares. For periods beginning on 1/6/99, Class 2’s results reflect an additional 12b-1 fee expense, which also affects future performance. Since 1/6/99 (effective date), the average annual total return of Class 2 shares was +6.89%.
Total Return Index Comparison for Hypothetical $10,000 Investment (11/1/95–12/31/04)
The graph below shows the change in value of a hypothetical $10,000 investment in the Fund over the indicated period and includes reinvestment of any income or distributions. The Fund’s performance* is compared to the performance of the Standard & Poor’s 500 Composite Index (S&P 500) and the Russell 2500® Growth Index. One cannot invest directly in an index, nor is an index representative of the Fund’s portfolio. Please see Important Notes to Performance Information preceding the Fund Summaries.
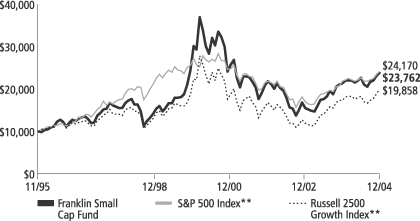
**Source: Standard & Poor’s Micropal. Please see Index Descriptions following the Fund Summaries.
Franklin Small Cap Fund Class 2
Performance reflects the Fund’s Class 2 operating expenses, but does not include any contract fees, expenses or sales charges. If they had been included, performance would be lower. These charges and deductions, particularly for variable life policies, can have a significant effect on contract values and insurance benefits. See the contract prospectus for a complete description of these expenses, including sales charges.
Performance data quoted represent past performance, which does not guarantee future results. Investment return and principal value will fluctuate, and you may have a gain or loss when you sell your shares. Current performance may differ from figures shown.
FSC-1
Fund Goal and Main Investments: Franklin Small Cap Fund seeks long-term capital growth. The Fund invests predominantly in investments of U.S. small-capitalization companies with market capitalization values not exceeding: (i) $1.5 billion; or (ii) the highest market capitalization value in the Russell 2000® Index; whichever is greater, at the time of purchase.1
Performance Overview
You can find the Fund’s one-year total return in the Performance Summary. The Fund had mixed results compared with its benchmarks, outperforming the S&P 500’s 10.87% total return while underperforming the Russell 2500 Growth Index’s 14.59% total return for the same period.2
Economic and Market Overview
During the year ended December 31, 2004, the domestic economy expanded solidly and broadly across most industries, sectors and regions as gross domestic product (GDP) rose an estimated 4.4%.3 However, surging energy and other commodity prices had a dampening effect. Although consumer confidence remained below pre-recession levels, consumer spending supported strong auto sales, increased durable goods consumption and a healthy housing market. Similarly, business spending rose substantially even as business confidence wavered. With improving balance sheets and stronger profit margins, many companies entered an upgrade cycle and invested in new technologies, driving equipment spending up 9.5% in the second half of 2004.3 The labor market firmed as employers hired 2.2 million workers in 2004, and unemployment dropped from 5.7% to 5.4% during the year.4 More than one-half of the jobs lost during the recession have been recovered; however, most new jobs were part-time or temporary. Given concerns over rising benefits costs and lingering uncertainties about economic recovery, many companies turned to temporary employment or opted for continued hiring freezes. At year-end, elevated household debt levels and the deepening federal budget and trade deficits were three top concerns for the economy as it headed into 2005.
The U.S. dollar weakened throughout 2004 and hit an all-time low against the euro and a multi-year low versus the yen. The widening trade and current account deficits and possibility for higher import
1. Please see Index Descriptions following the Fund Summaries.
2. Source: Standard & Poor’s Micropal. One cannot invest directly in an index, nor is an index representative of the Fund’s portfolio. Please see Index Descriptions following the Fund Summaries.
3. Source: Bureau of Economic Analysis.
4. Source: Bureau of Labor Statistics.
Fund Risks: Stocks offer the potential for long-term gains but can be subject to short-term up-and-down price movements. Smaller or relatively new or unseasoned companies can be particularly sensitive to changing economic conditions, and the prospects for growth are less certain than those of larger, more established companies. The Fund’s significant exposure to the technology sector, which has been among the most volatile market sectors, may result in the Fund’s experiencing greater volatility than a fund with a more broadly diversified portfolio. The Fund’s prospectus also includes a description of the main investment risks.
FSC-2
prices contributed to inflationary pressures. The core inflation rate rose to 2.2% in 2004, or 3.3% including volatile food and energy costs. Aiming to keep inflation tame, the Federal Reserve Board (Fed) raised the federal funds target rate five times between June and December, from 1.00% to 2.25%, the highest level in more than three years. The Fed said it will respond to changes in economic prospects as needed to fulfill its obligation to maintain price stability, noting in December that it perceived “the upside and downside risks to the attainment of both sustainable growth and price stability for the next few quarters to be roughly equal.”5
Despite a generally robust economy and improving corporate fundamentals, investors had to digest a wide range of information in 2004, including rising inflation, the dollar’s value, a contentious presidential election and ongoing concerns about terrorism, war and reconstruction in Iraq. Domestic equity markets rallied in early 2004 and then fluctuated; however, they were essentially flat through early November. Disappointing earnings from a number of blue chip companies applied downward pressure, but initial public offering (IPO) activity was strong and investor sentiment improved late in the period despite the mixed signals. After the elections concluded, the markets enjoyed another strong rally through year-end. The blue chip stocks of the Dow Jones Industrial Average gained 5.31% for the year under review, while the broader S&P 500 rose 10.87% and the technology-heavy NASDAQ Composite Index increased 9.15%.6
Investment Strategy
We are research driven, fundamental investors, pursuing a growth strategy. As bottom-up investors focusing primarily on individual securities, we choose companies that we believe are positioned for rapid growth in revenues, earnings or assets. We rely on a team of analysts to provide in-depth industry expertise, and we use qualitative and quantitative analyses to evaluate companies for distinct and sustainable competitive advantages. Advantages, such as a particular marketing or product niche, proven technology and industry leadership, are all factors we believe point to strong long-term growth potential.
5. Source: Federal Reserve. Press Release, 12/14/04.
6. Source: Standard & Poor’s Micropal. Please see Index Descriptions following the Fund Summaries.
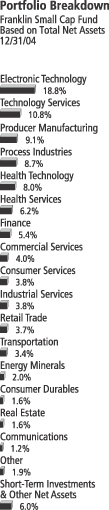
FSC-3
Manager’s Discussion
The Fund’s performance benefited most from an overweighted position in process industries compared with the benchmark Russell 2500 Growth Index. Our individual stock selection within the sector also provided strong results, particularly our investments in the chemical and agricultural commodities industries. Stock selection within the consumer services sector was our best contributor to total returns in 2004, especially Station Casinos, Argosy Gaming and Four Seasons Hotels. Stock selection and an overweighted position in health services stocks contributed significantly to the Fund’s results. Within the health services sector, our investments in managed care companies fared particularly well.
Despite the Fund’s solid returns in 2004, some sectors, industries and individual securities constrained our results. For example, our stock selection within the health technology sector, specifically among biotechnology and medical specialties industry stocks, detracted from the Fund’s relative performance. Stock selection in retail trade, namely retailers Hot Topic and Cost Plus, also negatively impacted the Fund. Additionally, our stock selection in commercial services, and in particular our holdings in advertising/marketing and personnel services companies, hampered the Fund.
Thank you for your participation in Franklin Small Cap Fund. We look forward to serving your future investment needs.
Effective May 1, 2005, Franklin Small Cap Fund’s name will change to “Franklin Small-Mid Cap Growth Securities Fund” and its main investment strategy will change to, under normal market conditions, investing at least 80% of its total net assets in investments of small and mid-capitalization companies.
The foregoing information reflects our analysis, opinions and portfolio holdings as of December 31, 2004, the end of the reporting period. The way we implement our main investment strategies and the resulting portfolio holdings may change depending on factors such as market and economic conditions. These opinions may not be relied upon as investment advice or an offer for a particular security. The information is not a complete analysis of every aspect of any market, country, industry, security or the Fund. Statements of fact are from sources considered reliable, but the adviser makes no representation or warranty as to their completeness or accuracy. Although historical performance is no guarantee of future results, these insights may help you understand our investment management philosophy.
Top 10 Holdings
Franklin Small Cap Fund 12/31/04
| | |
Company
Sector/Industry | | % of Total
Net Assets |
| |
| Cabot Corp. | | 1.9% |
| Process Industries | | |
| |
| Mettler-Toledo International Inc. (Switzerland) | | 1.9% |
| Producer Manufacturing | | |
| |
| Flowserve Corp. | | 1.9% |
| Producer Manufacturing | | |
| |
| Hyperion Solutions Corp. | | 1.9% |
| Technology Services | | |
| |
| Varian Inc. | | 1.5% |
| Electronic Technology | | |
| |
| Tektronix Inc. | | 1.5% |
| Electronic Technology | | |
| |
| Nova Chemicals Corp. (Canada) | | 1.5% |
| Process Industries | | |
| |
| Varian Semiconductor Equipment Associates Inc. | | 1.5% |
| Electronic Technology | | |
| |
| Semtech Corp. | | 1.5% |
| Electronic Technology | | |
| |
| Avocent Corp. | | 1.4% |
| Electronic Technology | | |
The dollar value, number of shares or principal amount, and names of all portfolio holdings are listed in the Fund’s Statement of Investments.
FSC-4
Fund Expenses
As an investor in a variable insurance contract (“Contract”) that indirectly provides for investment in an underlying mutual fund, you can incur transaction and/or ongoing expenses at both the Fund level and the Contract level.
| • | | Transaction expenses can include sales charges (loads) on purchases, redemption fees, surrender fees, transfer fees and premium taxes. |
| • | | Ongoing expenses can include management fees, distribution and service (12b-1) fees, contract fees, annual maintenance fees, mortality and expense risk fees and other fees and expenses. All mutual funds and Contracts have some types of ongoing expenses. |
The expenses shown in the table below are meant to highlight ongoing expenses at the Fund level only and do not include ongoing expenses at the Contract level, or transaction expenses at either the Fund or Contract levels. While the Fund does not have transaction expenses, if the transaction and ongoing expenses at the Contract level were included, the expenses shown below would be higher. You should consult your Contract prospectus or disclosure document for more information.
The table shows Fund-level ongoing expenses and can help you understand these expenses and compare them with those of other mutual funds offered through the Contract. The table assumes a $1,000 investment held for the six months indicated. Please refer to the Fund prospectus for additional information on operating expenses.
Actual Fund Expenses
The first line (Actual) for each share class listed in the table below provides actual account values and expenses. The “Ending Account Value” is derived from the Fund’s actual return, which includes the effect of ongoing Fund expenses, but does not include the effect of ongoing Contract expenses.
You can estimate the Fund-level expenses you incurred during the period, by following these steps. Of course, your account value and expenses will differ from those in this illustration:
| 1. | Divide your account value by $1,000. |
If an account had an $8,600 value, then $8,600 ÷ $1,000 = 8.6.
| 2. | Multiply the result by the number under the heading “Fund-Level Expenses Incurred During Period.” |
If Fund-Level Expenses Incurred During Period were $7.50, then 8.6 × $7.50 = $64.50.
Franklin Small Cap Fund Class 2
FSC-5
In this illustration, the estimated expenses incurred this period at the Fund level are $64.50.
Hypothetical Example for Comparison with Other Mutual Funds
Information in the second line (Hypothetical) for each class in the table can help you compare ongoing expenses of the Fund with those of other mutual funds offered through the Contract. This information may not be used to estimate the actual ending account balance or expenses you incurred during the period. The hypothetical “Ending Account Value” is based on the actual expense ratio for each class and an assumed 5% annual rate of return before expenses, which does not represent the Fund’s actual return. The figure under the heading “Fund-Level Expenses Incurred During Period” shows the hypothetical expenses your account would have incurred under this scenario. You can compare this figure with the 5% hypothetical examples that appear in shareholder reports of other funds offered through a Contract.
| | | | | | | | | |
| Class 2 | | Beginning
Account
Value 6/30/04 | | Ending
Account
Value 12/31/04 | | Fund-Level
Expenses Incurred
During Period*
6/30/04-12/31/04 |
Actual | | $ | 1,000 | | $ | 1,046.90 | | $ | 5.04 |
Hypothetical (5% return before expenses) | | $ | 1,000 | | $ | 1,020.21 | | $ | 4.98 |
*Expenses are equal to the annualized expense ratio for the Fund’s Class 2 shares (0.98%), which does not include any ongoing expenses of the Contract for which the Fund is an investment option, multiplied by the average account value over the period, multiplied by 184/366 to reflect the one-half year period.
FSC-6
Important Notice Regarding Change in Investment Policy and Name
SUPPLEMENT
dated December 28, 2004
to the prospectus of
FRANKLIN SMALL CAP FUND (THE FUND)
(Franklin Templeton Variable Insurance Products Trust)
dated May 1, 2004, as supplemented August 15, 2004 and October 4, 2004
Effective May 1, 2005, the Fund’s main investment strategies will change, and its name will change to “Franklin Small-Mid Cap Growth Securities Fund.” This will provide the Fund’s manager with more flexibility in managing its portfolio. These changes have been approved by the Board of Trustees of the Fund.
Effective May 1, 2005, the prospectus of the Fund is amended as follows:
| I. | All references to “Franklin Small Cap Fund” are changed to “Franklin Small-Mid Cap Growth Securities Fund.” |
| II. | On page FSC-1, the paragraphs below replace the first and second paragraphs under the heading “MAIN INVESTMENTS”: |
Under normal market conditions, the Fund invests at least 80% of its net assets in investments of small capitalization (small cap) companies and mid capitalization (mid cap) companies. Shareholders will be given at least 60 days’ advance notice of any change to this 80% policy.
For this Fund mid cap companies are companies with market capitalizations not exceeding $8.5 billion at the time of purchase. For this Fund small cap companies are companies with market capitalizations not exceeding: (i) $1.5 billion; or (ii) the highest market capitalization in the Russell 2000 Index, whichever is greater, at the time of purchase. The Russell 2000 Index consists of 2,000 small companies that have publicly traded securities, and its largest company had a market capitalization of $2.9 billion as of October 31, 2004. Market capitalization is defined as share price multiplied by the number of common stock shares outstanding. In most instances, the manager intends to continue to hold an investment for further capital growth opportunities even if, through market appreciation, the company’s market capitalization exceeds the small or mid cap measures described above. The Fund may invest significantly in the technology sector (including electronic technology, technology services, and health technology).
| III. | On page FSC-1, the box at the bottom of the page is revised to read as follows: |
The Fund invests predominantly in small-cap and mid-cap companies.
Please keep this supplement for future reference.
FSC-7
FRANKLIN TEMPLETON VARIABLE INSURANCE PRODUCTS TRUST
FRANKLIN SMALL CAP FUND
Financial Highlights
| | | | | | | | | | | | | | | | | | | | |
| | | Class 1
| |
| | | Year Ended December 31,
| |
| | | 2004 | | | 2003 | | | 2002 | | | 2001 | | | 2000 | |
| | |
|
|
|
Per share operating performance | | | | | | | | | | | | | | | | | | | | |
(for a share outstanding throughout the year) | | | | | | | | | | | | | | | | | | | | |
Net asset value, beginning of year | | $ | 17.60 | | | $ | 12.79 | | | $ | 17.97 | | | $ | 21.25 | | | $ | 26.87 | |
| | |
|
|
|
Income from investment operations: | | | | | | | | | | | | | | | | | | | | |
Net investment income (loss)a | | | (.06 | ) | | | (.03 | ) | | | (.02 | ) | | | .09 | | | | .11 | |
Net realized and unrealized gains (losses) | | | 2.12 | | | | 4.84 | | | | (5.09 | ) | | | (3.28 | ) | | | (3.81 | ) |
| | |
|
|
|
Total from investment operations | | | 2.06 | | | | 4.81 | | | | (5.11 | ) | | | (3.19 | ) | | | (3.70 | ) |
| | |
|
|
|
Less distributions from: | | | | | | | | | | | | | | | | | | | | |
Net investment income | | | — | | | | — | | | | (.07 | ) | | | (.09 | ) | | | — | |
Net realized gains | | | — | | | | — | | | | — | | | | — | | | | (1.92 | ) |
| | |
|
|
|
Total distributions | | | — | | | | — | | | | (.07 | ) | | | (.09 | ) | | | (1.92 | ) |
| | |
|
|
|
Net asset value, end of year | | $ | 19.66 | | | $ | 17.60 | | | $ | 12.79 | | | $ | 17.97 | | | $ | 21.25 | |
| | |
|
|
|
| | | | | |
Total returnb | | | 11.70% | | | | 37.61% | | | | (28.52)% | | | | (15.02)% | | | | (14.60)% | |
Ratios/supplemental data | | | | | | | | | | | | | | | | | | | | |
Net assets, end of year (000’s) | | $ | 184,513 | | | $ | 197,551 | | | $ | 164,350 | | | $ | 266,694 | | | $ | 387,474 | |
Ratios to average net assets: | | | | | | | | | | | | | | | | | | | | |
Expenses | | | .74% | | | | .76% | | | | .79% | | | | .76% | | | | .75% | |
Net investment income (loss) | | | (.33)% | | | | (.24)% | | | | (.16)% | | | | .50% | | | | .42% | |
Portfolio turnover rate | | | 32.55% | | | | 45.00% | | | | 29.59% | | | | 37.94% | | | | 19.49% | |
| a | Based on average daily shares outstanding. |
| b | Total return does not include any fees, charges or expenses imposed by the variable annuity and life insurance contracts for which the Franklin Templeton Variable Insurance Products Trust serves as an underlying investment vehicle. Total return is not annualized for periods less than one year. |
See notes to financial statements.
FSC-8
FRANKLIN TEMPLETON VARIABLE INSURANCE PRODUCTS TRUST
FRANKLIN SMALL CAP FUND
Financial Highlights (continued)
| | | | | | | | | | | | | | | | | | | | |
| | | Class 2
| |
| | | Year Ended December 31,
| |
| | | 2004 | | | 2003 | | | 2002 | | | 2001 | | | 2000 | |
| | |
|
|
|
Per share operating performance | | | | | | | | | | | | | | | | | | | | |
(for a share outstanding throughout the year) | | | | | | | | | | | | | | | | | | | | |
Net asset value, beginning of year | | $ | 17.43 | | | $ | 12.70 | | | $ | 17.85 | | | $ | 21.14 | | | $ | 26.80 | |
| | |
|
|
|
Income from investment operations: | | | | | | | | | | | | | | | | | | | | |
Net investment income (loss)a | | | (.10 | ) | | | (.07 | ) | | | (.06 | ) | | | .03 | | | | .12 | |
Net realized and unrealized gains (losses) | | | 2.10 | | | | 4.80 | | | | (5.05 | ) | | | (3.25 | ) | | | (3.86 | ) |
| | |
|
|
|
Total from investment operations | | | 2.00 | | | | 4.73 | | | | (5.11 | ) | | | (3.22 | ) | | | (3.74 | ) |
| | |
|
|
|
Less distributions from: | | | | | | | | | | | | | | | | | | | | |
Net investment income | | | — | | | | — | | | | (.04 | ) | | | (.07 | ) | | | — | |
Net realized gains | | | — | | | | — | | | | — | | | | — | | | | (1.92 | ) |
| | |
|
|
|
Total distributions | | | — | | | | — | | | | (.04 | ) | | | (.07 | ) | | | (1.92 | ) |
| | |
|
|
|
Net asset value, end of year | | $ | 19.43 | | | $ | 17.43 | | | $ | 12.70 | | | $ | 17.85 | | | $ | 21.14 | |
| | |
|
|
|
| | | | | |
Total returnb | | | 11.47% | | | | 37.24% | | | | (28.68)% | | | | (15.25)% | | | | (14.76)% | |
Ratios/supplemental data | | | | | | | | | | | | | | | | | | | | |
Net assets, end of year (000’s) | | $ | 1,142,048 | | | $ | 909,946 | | | $ | 415,952 | | | $ | 401,663 | | | $ | 301,420 | |
Ratios to average net assets: | | | | | | | | | | | | | | | | | | | | |
Expenses | | | .99% | | | | 1.01% | | | | 1.04% | | | | 1.01% | | | | 1.00% | |
Net investment income (loss) | | | (.58)% | | | | (.49)% | | | | (.41)% | | | | .19% | | | | .49% | |
Portfolio turnover rate | | | 32.55% | | | | 45.00% | | | | 29.59% | | | | 37.94% | | | | 19.49% | |
| a | Based on average daily shares outstanding. |
| b | Total return does not include any fees, charges or expenses imposed by the variable annuity and life insurance contracts for which the Franklin Templeton Variable Insurance Products Trust serves as an underlying investment vehicle. Total return is not annualized for periods less than one year. |
See notes to financial statements.
FSC-9
FRANKLIN TEMPLETON VARIABLE INSURANCE PRODUCTS TRUST
FRANKLIN SMALL CAP FUND
Statement of Investments, December 31, 2004
| | | | | |
| | | SHARES | | VALUE |
Common Stocks 94.0% | | | | | |
Commercial Services 4.0% | | | | | |
aAquantive Inc. | | 258,200 | | $ | 2,308,308 |
Brinks Co. | | 250,200 | | | 9,887,904 |
CDI Corp. | | 277,500 | | | 5,932,950 |
Corporate Executive Board Co. | | 233,600 | | | 15,637,184 |
aLearning Tree International Inc. | | 52,000 | | | 696,800 |
aLECG Corp. | | 93,100 | | | 1,736,315 |
aMaximus Inc. | | 298,700 | | | 9,295,544 |
National Financial Partners Corp. | | 190,200 | | | 7,379,760 |
aValueClick Inc. | | 3,200 | | | 42,656 |
| | | | |
|
|
| | | | | | 52,917,421 |
| | | | |
|
|
Communications 1.2% | | | | | |
aNII Holdings Inc., B | | 341,600 | | | 16,208,920 |
| | | | |
|
|
Consumer Durables 1.6% | | | | | |
Briggs & Stratton Corp. | | 209,900 | | | 8,727,642 |
Polaris Industries Inc. | | 69,500 | | | 4,727,390 |
Winnebago Industries Inc. | | 209,300 | | | 8,175,258 |
| | | | |
|
|
| | | | | | 21,630,290 |
| | | | |
|
|
Consumer Non-Durables .6% | | | | | |
aNBTY Inc. | | 139,000 | | | 3,337,390 |
Nu Skin Enterprises Inc., A | | 183,400 | | | 4,654,692 |
| | | | |
|
|
| | | | | | 7,992,082 |
| | | | |
|
|
Consumer Services 3.8% | | | | | |
aCumulus Media Inc., A | | 4,807 | | | 72,490 |
aEntravision Communications Corp. | | 798,000 | | | 6,663,300 |
Four Seasons Hotels Inc. (Canada) | | 93,900 | | | 7,680,081 |
Jackson Hewitt Tax Service Inc. | | 411,800 | | | 10,397,950 |
aRadio One Inc. | | 39,500 | | | 635,950 |
aRadio One Inc., D | | 565,900 | | | 9,122,308 |
aScholastic Corp. | | 128,400 | | | 4,745,664 |
Station Casinos Inc. | | 200,900 | | | 10,985,212 |
| | | | |
|
|
| | | | | | 50,302,955 |
| | | | |
|
|
Distribution Services .4% | | | | | |
aAndrx Group | | 102,600 | | | 2,239,758 |
aPerformance Food Group Co. | | 85,900 | | | 2,311,569 |
| | | | |
|
|
| | | | | | 4,551,327 |
| | | | |
|
|
Electronic Technology 18.8% | | | | | |
aActel Corp. | | 591,000 | | | 10,366,140 |
aAvocent Corp. | | 473,500 | | | 19,186,220 |
aCoherent Inc. | | 358,400 | | | 10,909,696 |
aElectro Scientific Industries Inc. | | 811,033 | | | 16,026,012 |
aExar Corp. | | 733,800 | | | 10,412,622 |
aF5 Networks Inc. | | 298,200 | | | 14,528,304 |
aFLIR Systems Inc. | | 283,800 | | | 18,103,602 |
aIntegrated Circuit Systems Inc. | | 584,500 | | | 12,227,740 |
aLasercard Corp. | | 212,100 | | | 2,224,929 |
aLogitech International SA, ADR (Switzerland) | | 156,000 | | | 9,477,000 |
FSC-10
FRANKLIN TEMPLETON VARIABLE INSURANCE PRODUCTS TRUST
FRANKLIN SMALL CAP FUND
Statement of Investments, December 31, 2004 (cont.)
| | | | | |
| | | SHARES | | VALUE |
Common Stocks (cont.) | | | | | |
Electronic Technology (cont.) | | | | | |
MTS Systems Corp. | | 157,200 | | $ | 5,314,932 |
National Instruments Corp. | | 557,700 | | | 15,197,325 |
aSemtech Corp. | | 897,600 | | | 19,630,512 |
aSilicon Laboratories Inc. | | 216,800 | | | 7,655,208 |
Tektronix Inc. | | 667,100 | | | 20,153,091 |
aTrimble Navigation Ltd. | | 495,650 | | | 16,376,276 |
aVarian Inc. | | 493,800 | | | 20,250,738 |
aVarian Semiconductor Equipment Associates Inc. | | 538,700 | | | 19,851,095 |
aVitesse Semiconductor Corp. | | 362,200 | | | 1,278,566 |
| | | | |
|
|
| | | | | | 249,170,008 |
| | | | |
|
|
Energy Minerals 2.0% | | | | | |
Chesapeake Energy Corp. | | 358,000 | | | 5,907,000 |
aDenbury Resources Inc. | | 341,600 | | | 9,376,920 |
aSpinnaker Exploration Co. | | 308,600 | | | 10,822,602 |
| | | | |
|
|
| | | | | | 26,106,522 |
| | | | |
|
|
Finance 5.4% | | | | | |
East West Bancorp Inc. | | 243,500 | | | 10,217,260 |
Federal Agriculture Mortgage Corp., C | | 72,800 | | | 1,696,240 |
aFinancial Federal Corp. | | 209,100 | | | 8,196,720 |
aFranklin Bank Corp. | | 25,400 | | | 463,550 |
Greater Bay Bancorp | | 219,300 | | | 6,114,084 |
aNCO Group Inc. | | 557,800 | | | 14,419,130 |
Radian Group Inc. | | 93,376 | | | 4,971,338 |
aSilicon Valley Bancshares | | 173,600 | | | 7,780,752 |
UCBH Holdings Inc. | | 137,600 | | | 6,304,832 |
Umpqua Holdings Corp. | | 240,700 | | | 6,068,047 |
Waddell & Reed Financial Inc., A | | 238,900 | | | 5,707,321 |
| | | | |
|
|
| | | | | | 71,939,274 |
| | | | |
|
|
Health Services 6.2% | | | | | |
aApria Healthcare Group Inc. | | 209,000 | | | 6,886,550 |
aCentene Corp. | | 139,700 | | | 3,960,495 |
aCoventry Health Care Inc. | | 200,200 | | | 10,626,616 |
aMolina Healthcare Inc. | | 241,600 | | | 11,205,408 |
aPharmaceutical Product Development Inc. | | 438,200 | | | 18,093,278 |
Select Medical Corp. | | 564,300 | | | 9,931,680 |
aSierra Health Services Inc. | | 343,600 | | | 18,935,796 |
aSymbion Inc. | | 105,500 | | | 2,329,440 |
| | | | |
|
|
| | | | | | 81,969,263 |
| | | | |
|
|
Health Technology 8.0% | | | | | |
aAdolor Corp. | | 840,000 | | | 8,332,800 |
aAlkermes Inc. | | 120,600 | | | 1,699,254 |
aAmerican Medical Systems Holdings Ltd. | | 122,700 | | | 5,130,087 |
aAngiotech Pharmaceuticals Inc. (Canada) | | 411,000 | | | 7,582,950 |
aConceptus Inc. | | 320,000 | | | 2,596,800 |
aDigene Corp. | | 229,500 | | | 6,001,425 |
aFirst Horizon Pharmaceutical Corp. | | 383,300 | | | 8,773,737 |
aImpax Laboratories Inc. | | 520,600 | | | 8,267,128 |
aInterMune Inc. | | 391,500 | | | 5,191,290 |
aKosan Biosciences Inc. | | 547,500 | | | 3,794,175 |
FSC-11
FRANKLIN TEMPLETON VARIABLE INSURANCE PRODUCTS TRUST
FRANKLIN SMALL CAP FUND
Statement of Investments, December 31, 2004 (cont.)
| | | | | |
| | | SHARES | | VALUE |
Common Stocks (cont.) | | | | | |
Health Technology (cont.) | | | | | |
aLumenis Ltd. (Israel) | | 71 | | $ | 138 |
aMedicines Co. | | 270,500 | | | 7,790,400 |
aNPS Pharmaceuticals Inc. | | 135,200 | | | 2,471,456 |
aPharmion Corp. | | 141,900 | | | 5,989,599 |
aSteris Corp. | | 525,300 | | | 12,460,116 |
aTaro Pharmaceutical Industries Ltd. | | 189,500 | | | 6,448,685 |
aThoratec Corp. | | 328,000 | | | 3,417,760 |
aVarian Medical Systems Inc. | | 241,500 | | | 10,442,460 |
| | | | |
|
|
| | | | | | 106,390,260 |
| | | | |
|
|
Industrial Services 3.8% | | | | | |
aOil States International Inc. | | 800,200 | | | 15,435,858 |
aPride International Inc. | | 291,200 | | | 5,981,248 |
aRowan Cos. Inc. | | 242,600 | | | 6,283,340 |
aSuperior Energy Services Inc. | | 755,100 | | | 11,636,091 |
aVarco International Inc. | | 79,700 | | | 2,323,255 |
aWaste Connections Inc. | | 236,100 | | | 8,086,425 |
| | | | |
|
|
| | | | | | 49,746,217 |
| | | | |
|
|
Non-Energy Minerals .2% | | | | | |
aMeridian Gold Inc. | | 156,700 | | | 2,972,599 |
| | | | |
|
|
Process Industries 8.7% | | | | | |
Bunge Ltd. | | 255,900 | | | 14,588,859 |
Cabot Corp. | | 648,400 | | | 25,080,112 |
aFMC Corp. | | 390,700 | | | 18,870,810 |
aGraftech International Ltd. | | 893,900 | | | 8,456,294 |
Minerals Technologies Inc. | | 215,000 | | | 14,340,500 |
Nova Chemicals Corp. (Canada) | | 422,300 | | | 19,974,790 |
Valspar Corp. | | 120,100 | | | 6,006,201 |
Westlake Chemical Corp. | | 233,100 | | | 7,785,540 |
| | | | |
|
|
| | | | | | 115,103,106 |
| | | | |
|
|
Producer Manufacturing 9.1% | | | | | |
aFlowserve Corp. | | 901,900 | | | 24,838,326 |
Gentex Corp. | | 273,200 | | | 10,113,864 |
Gibraltar Industries Inc. | | 283,400 | | | 6,693,908 |
Kennametal Inc. | | 370,800 | | | 18,454,716 |
The Manitowoc Co. Inc. | | 195,600 | | | 7,364,340 |
aMettler-Toledo International Inc. (Switzerland) | | 487,200 | | | 24,998,232 |
Oshkosh Truck Corp. | | 246,300 | | | 16,841,994 |
Superior Industries International Inc. | | 286,800 | | | 8,331,540 |
aWilson Greatbatch Technologies Inc. | | 161,900 | | | 3,629,798 |
| | | | |
|
|
| | | | | | 121,266,718 |
| | | | |
|
|
Real Estate 1.6% | | | | | |
Glenborough Realty Trust Inc. | | 59,400 | | | 1,264,032 |
aMeriStar Hospitality Corp. | | 1,726,184 | | | 14,413,636 |
SL Green Realty Corp. | | 95,900 | | | 5,806,745 |
| | | | |
|
|
| | | | | | 21,484,413 |
| | | | |
|
|
Real Estate Development .7% | | | | | |
aJones Lang LaSalle Inc. | | 249,800 | | | 9,345,018 |
| | | | |
|
|
FSC-12
FRANKLIN TEMPLETON VARIABLE INSURANCE PRODUCTS TRUST
FRANKLIN SMALL CAP FUND
Statement of Investments, December 31, 2004 (cont.)
| | | | | |
| | | SHARES | | VALUE |
Common Stocks (cont.) | | | | | |
Retail Trade 3.7% | | | | | |
aCost Plus Inc. | | 249,900 | | $ | 8,029,287 |
Fred’s Inc. | | 572,400 | | | 9,959,760 |
aGymboree Corp. | | 292,500 | | | 3,749,850 |
aHot Topic Inc. | | 490,750 | | | 8,435,993 |
aJ. Jill Group Inc. | | 344,000 | | | 5,122,160 |
aTuesday Morning Corp. | | 429,400 | | | 13,152,522 |
| | | | |
|
|
| | | | | | 48,449,572 |
| | | | |
|
|
Technology Services 10.8% | | | | | |
aAffiliated Computer Services Inc., A | | 198,200 | | | 11,929,658 |
aAsk Jeeves Inc. | | 476,200 | | | 12,738,350 |
aAspen Technology Inc. | | 261,100 | | | 1,621,431 |
aBearingPoint Inc. | | 1,127,800 | | | 9,056,234 |
aBorland Software Corp. | | 651,000 | | | 7,603,680 |
aEntrust Inc. | | 901,100 | | | 3,415,169 |
aFileNET Corp. | | 583,500 | | | 15,030,960 |
Global Payments Inc. | | 222,700 | | | 13,036,858 |
aHyperion Solutions Corp. | | 530,800 | | | 24,745,896 |
aInfoSpace Inc. | | 219,300 | | | 10,427,715 |
aNetIQ Corp. | | 507,800 | | | 6,200,238 |
aQuest Software Inc. | | 512,500 | | | 8,174,375 |
aRSA Security Inc. | | 433,300 | | | 8,691,998 |
aVerity Inc. | | 814,300 | | | 10,683,616 |
| | | | |
|
|
| | | | | | 143,356,178 |
| | | | |
|
|
Transportation 3.4% | | | | | |
C.H. Robinson Worldwide Inc. | | 234,600 | | | 13,024,992 |
Expeditors International of Washington Inc. | | 133,500 | | | 7,459,980 |
aForward Air Corp. | | 212,200 | | | 9,485,340 |
aLandstar System Inc. | | 133,600 | | | 9,838,304 |
Overnite Corp. | | 139,200 | | | 5,183,807 |
| | | | |
|
|
| | | | | | 44,992,423 |
| | | | |
|
|
Total Common Stocks (Cost $955,244,596) | | | | | 1,245,894,566 |
| | | | |
|
|
Short Term Investment (Cost $78,683,675) 5.9% | | | | | |
bFranklin Institutional Fiduciary Trust Money Market Portfolio | | 78,683,675 | | | 78,683,675 |
| | | | |
|
|
Total Investments (Cost $1,033,928,271) 99.9% | | | | | 1,324,578,241 |
Other Assets, less Liabilities .1% | | | | | 1,981,888 |
| | | | |
|
|
Net Assets 100.0% | | | | $ | 1,326,560,129 |
| | | | |
|
|
Portfolio Abbreviation
ADR - American Depository Receipt
| b | See Note 7 regarding investments in Franklin Institutional Fiduciary Trust Money Market Portfolio. |
See notes to financial statements.
FSC-13
FRANKLIN TEMPLETON VARIABLE INSURANCE PRODUCTS TRUST
FRANKLIN SMALL CAP FUND
Financial Statements
Statement of Assets and Liabilities
December 31, 2004
| | | |
Assets: | | | |
Investments in securities: | | | |
Cost - Unaffiliated issuers | | $ | 955,244,596 |
Cost - Sweep Money Fund (Note 7) | | | 78,683,675 |
| | |
|
|
Total cost of investments | | | 1,033,928,271 |
| | |
|
|
Value - Unaffiliated issuers | | | 1,245,894,566 |
Value - Sweep Money Fund (Note 7) | | | 78,683,675 |
| | |
|
|
Total value of investments | | | 1,324,578,241 |
| | |
|
|
Cash | | | 29,865 |
Receivables: | | | |
Investment securities sold | | | 4,941,180 |
Capital shares sold | | | 1,322,154 |
Dividends | | | 321,165 |
Other assets | | | 34,534 |
| | |
|
|
Total assets | | | 1,331,227,139 |
| | |
|
|
Liabilities: | | | |
Payables: | | | |
Investment securities purchased | | | 3,309,617 |
Capital shares redeemed | | | 261,336 |
Affiliates | | | 1,004,920 |
Other liabilities | | | 91,137 |
| | |
|
|
Total liabilities | | | 4,667,010 |
| | |
|
|
Net assets, at value | | $ | 1,326,560,129 |
| | |
|
|
Net assets consist of: | | | |
Net unrealized appreciation (depreciation) | | $ | 290,649,970 |
Accumulated net realized gain (loss) | | | (97,069,748) |
Capital shares | | | 1,132,979,907 |
| | |
|
|
Net assets, at value | | $ | 1,326,560,129 |
| | |
|
|
Class 1: | | | |
Net assets, at value | | $ | 184,512,594 |
| | |
|
|
Shares outstanding | | | 9,383,198 |
| | |
|
|
Net asset value and offering price per share | | | $19.66 |
| | |
|
|
Class 2: | | | |
Net assets, at value | | $ | 1,142,047,535 |
| | |
|
|
Shares outstanding | | | 58,784,189 |
| | |
|
|
Net asset value and offering price per share | | $ | 19.43 |
| | |
|
|
See notes to financial statements.
FSC-14
FRANKLIN TEMPLETON VARIABLE INSURANCE PRODUCTS TRUST
FRANKLIN SMALL CAP FUND
Financial Statements (continued)
Statement of Operations
for the year ended December 31, 2004
| | | | |
Investment Income: | | | | |
Dividends: | | | | |
Unaffiliated issuers | | $ | 3,763,745 | |
Sweep Money Fund (Note 7) | | | 1,098,041 | |
| | |
|
|
|
Total investment income | | | 4,861,786 | |
| | |
|
|
|
Expenses: | | | | |
Management fees (Note 3) | | | 5,363,654 | |
Administrative fees (Note 3) | | | 2,953,149 | |
Distribution fees - Class 2 (Note 3) | | | 2,490,311 | |
Transfer agent fees | | | 23,825 | |
Custodian fees (Note 4) | | | 24,109 | |
Reports to shareholders | | | 271,839 | |
Professional fees | | | 63,244 | |
Trustees’ fees and expenses | | | 7,340 | |
Other | | | 52,746 | |
| | |
|
|
|
Total expenses | | | 11,250,217 | |
Expense reductions (Note 4) | | | (516 | ) |
| | |
|
|
|
Net expenses | | | 11,249,701 | |
| | |
|
|
|
Net investment income (loss) | | | (6,387,915 | ) |
| | |
|
|
|
Realized and unrealized gains (losses): | | | | |
Net realized gain (loss) from: | | | | |
Investments | | | 48,595,207 | |
Foreign currency transactions | | | 471 | |
| | |
|
|
|
Net realized gain (loss) | | | 48,595,678 | |
Net change in unrealized appreciation (depreciation) on investments | | | 90,306,666 | |
| | |
|
|
|
Net realized and unrealized gain (loss) | | | 138,902,344 | |
| | |
|
|
|
Net increase (decrease) in net assets resulting from operations | | $ | 132,514,429 | |
| | |
|
|
|
See notes to financial statements.
FSC-15
FRANKLIN TEMPLETON VARIABLE INSURANCE PRODUCTS TRUST
FRANKLIN SMALL CAP FUND
Financial Statements (continued)
Statements of Changes in Net Assets
for the years ended December 31, 2004 and 2003
| | | | | | | | |
| | | 2004 | | | 2003 | |
| | |
| |
Increase (decrease) in net assets: | | | | | | | | |
Operations: | | | | | | | | |
Net investment income (loss) | | $ | (6,387,915 | ) | | $ | (3,414,732 | ) |
Net realized gain (loss) from investments and foreign currency transactions | | | 48,595,678 | | | | (18,542,039 | ) |
Net change in unrealized appreciation (depreciation) on investments | | | 90,306,666 | | | | 280,516,980 | |
| | |
| |
Net increase (decrease) in net assets resulting from operations | | | 132,514,429 | | | | 258,560,209 | |
Capital share transactions: (Note 2) | | | | | | | | |
Class 1 | | | (33,128,594 | ) | | | (22,075,723 | ) |
Class 2 | | | 119,677,068 | | | | 290,711,064 | |
| | |
| |
Total capital share transactions | | | 86,548,474 | | | | 268,635,341 | |
Net increase (decrease) in net assets | | | 219,062,903 | | | | 527,195,550 | |
Net assets (there is no undistributed net investment income at beginning or end of year): | | | | | | | | |
Beginning of year | | | 1,107,497,226 | | | | 580,301,676 | |
| | |
| |
End of year | | $ | 1,326,560,129 | | | $ | 1,107,497,226 | |
| | |
| |
See notes to financial statements.
FSC-16
FRANKLIN TEMPLETON VARIABLE INSURANCE PRODUCTS TRUST
FRANKLIN SMALL CAP FUND
Notes to Financial Statements
1. ORGANIZATION AND SIGNIFICANT ACCOUNTING POLICIES
Franklin Templeton Variable Insurance Products Trust (the Trust) is registered under the Investment Company Act of 1940 as an open-end investment company, consisting of twenty-one separate series (the Funds). The Franklin Small Cap Fund (the Fund) included in this report is diversified. The financial statements of the remaining funds in the series are presented separately. Shares of the Fund are sold only to insurance company separate accounts to fund the benefits of variable life insurance policies or variable annuity contracts. The Fund’s investment objective is capital growth.
The following summarizes the Fund’s significant accounting policies.
a. Security Valuation
Securities listed on a securities exchange or on the NASDAQ National Market System are valued at the last quoted sale price or the official closing price of the day, respectively. Over-the-counter securities and listed securities for which there is no reported sale are valued within the range of the most recent quoted bid and ask prices. Securities that trade in multiple markets or on multiple exchanges are valued according to the broadest and most representative market. Investments in open-end mutual funds are valued at the closing net asset value.
Foreign securities are valued as of the close of trading on the foreign stock exchange on which the security is primarily traded, or the NYSE, whichever is earlier. The value is then converted into its U.S. dollar equivalent at the foreign exchange rate in effect at the close of the NYSE on the day that the value of the foreign security is determined. If no sale is reported at that time, the foreign security will be valued within the range of the most recent quoted bid and ask prices.
The Trust has procedures to determine the fair value of individual securities and other assets for which market prices are not readily available or which may not be reliably priced. Some methods for valuing these securities may include: fundamental analysis, matrix pricing, discounts from market prices of similar securities, or discounts applied due to the nature and duration of restrictions on the disposition of the securities. Occasionally, events occur between the time at which trading in a security is completed and the close of the NYSE that might call into question the availability (including the reliability) of the value of a portfolio security held by the Fund. If such an event occurs, the securities may be valued using fair value procedures, which may include the use of independent pricing services. All security valuation procedures are approved by the Trust’s Board of Trustees.
b. Foreign Currency Translation
Portfolio securities and other assets and liabilities denominated in foreign currencies are translated into U.S. dollars based on the exchange rate of such currencies against U.S. dollars on the date of valuation. Purchases and sales of securities, income and expense items denominated in foreign currencies are translated into U.S. dollars at the exchange rate in effect on the transaction date. Occasionally events may impact the availability or reliability of foreign exchange rates used to convert the U.S. dollar equivalent value. If such an event occurs, the foreign exchange rate will be valued at fair value using procedures established by the Trust’s Board of Trustees.
The Fund does not separately report the effect of changes in foreign exchange rates from changes in market prices on securities held. Such changes are included in net realized and unrealized gain or loss from investments on the Statement of Operations.
Realized foreign exchange gains or losses arise from sales of foreign currencies, currency gains or losses realized between the trade and settlement dates on securities transactions and the difference between the recorded amounts of dividends, interest, and foreign withholding taxes and the U.S. dollar equivalent of the amounts actually received or paid. Net unrealized foreign exchange gains and losses arise from changes in foreign exchange rates on foreign denominated assets and liabilities other than investments in securities held at the end of the reporting period.
FSC-17
FRANKLIN TEMPLETON VARIABLE INSURANCE PRODUCTS TRUST
FRANKLIN SMALL CAP FUND
Notes to Financial Statements (continued)
1. ORGANIZATION AND SIGNIFICANT ACCOUNTING POLICIES (cont.)
c. Income Taxes
No provision has been made for U.S. income taxes because the Fund’s policy is to qualify as a regulated investment company under Sub Chapter M of the Internal Revenue Code and to distribute substantially all of its taxable income. Fund distributions to shareholders are determined on an income tax basis and may differ from net investment income and realized gains for financial reporting purposes.
d. Security Transactions, Investment Income, Expenses and Distributions
Security transactions are accounted for on trade date. Realized gains and losses on security transactions are determined on a specific identification basis. Interest income and estimated expenses are accrued daily. Dividend income and distributions to shareholders are recorded on the ex-dividend date.
Common expenses incurred by the Trust are allocated among the funds based on the ratio of net assets of each fund to the combined net assets. Other expenses are charged to each fund on a specific identification basis.
Distributions received by the Fund from securities may be a return of capital (ROC). Such distributions reduce the cost basis of the securities, and any distributions in excess of the cost basis are recognized as capital gains.
Realized and unrealized gains and losses and net investment income, other than class specific expenses, are allocated daily to each class of shares based upon the relative proportion of net assets of each class.
e. Accounting Estimates
The preparation of financial statements in accordance with accounting principles generally accepted in the United States of America requires management to make estimates and assumptions that affect the reported amounts of assets and liabilities at the date of the financial statements and the amounts of income and expenses during the reporting period. Actual results could differ from those estimates.
f. Guarantees and Indemnifications
Under the Trust’s organizational documents, its officers and trustees are indemnified by the Trust against certain liability arising out of the performance of their duties to the Trust. Additionally, in the normal course of business, the Trust enters into contracts with service providers that contain general indemnification clauses. The Trust’s maximum exposure under these arrangements is unknown as this would involve future claims that may be made against the Trust that have not yet occurred. However, based on experience, the Trust expects the risk of loss to be remote.
FSC-18
FRANKLIN TEMPLETON VARIABLE INSURANCE PRODUCTS TRUST
FRANKLIN SMALL CAP FUND
Notes to Financial Statements (continued)
2. SHARES OF BENEFICIAL INTEREST
The Fund offers two classes of shares: Class 1 and 2. Each class of shares differs by its distribution fees, voting rights on matters affecting a single class and its exchange privilege.
At December 31, 2004, there were an unlimited number of shares authorized ($.01 par value). Transactions in the Fund’s shares were as follows:
| | | | | | | | | | | | | | |
| | | Year Ended December 31,
| |
| | | 2004
| | | 2003
| |
| Class 1 Shares: | | Shares
| | | Amount
| | | Shares
| | | Amount
| |
Shares sold | | 348,616 | | | $ | 6,338,379 | | | 763,219 | | | $ | 11,952,567 | |
Shares issued on merger (Note 8) | | 236,316 | | | | 4,196,977 | | | 131,849 | | | | 1,739,071 | |
Shares redeemed | | (2,428,515 | ) | | | (43,663,950 | ) | | (2,513,508 | ) | | | (35,767,361 | ) |
| | |
| |
Net increase (decrease) | | (1,843,583 | ) | | $ | (33,128,594 | ) | | (1,618,440 | ) | | $ | (22,075,723 | ) |
| | |
| |
| Class 2 Shares: | | | | | | | | | | | | |
Shares sold | | 15,698,216 | | | $ | 281,993,369 | | | 24,892,963 | | | $ | 372,062,375 | |
Shares issued on merger (Note 8) | | 130 | | | | 2,283 | | | 986,724 | | | | 12,916,332 | |
Shares redeemed | | (9,126,486 | ) | | | (162,318,584 | ) | | (6,409,960 | ) | | | (94,267,643 | ) |
| | |
| |
Net increase (decrease) | | 6,571,860 | | | $ | 119,677,068 | | | 19,469,727 | | | $ | 290,711,064 | |
| | |
| |
3. TRANSACTIONS WITH AFFILIATES
Certain officers and trustees of the Trust are also officers and/or directors of the following entities:
| | |
| Entity | | Affiliation |
Franklin Advisers Inc. (Advisers) | | Investment manager |
Franklin Templeton Services LLC (FT Services) | | Administrative manager |
Franklin Templeton Distributors Inc. (Distributors) | | Principal underwriter |
Franklin Templeton Investor Services LLC (Investor Services) | | Transfer agent |
a. Management Fees
The Fund pays an investment management fee to Advisers based on the average daily net assets of the Fund as follows:
| | |
| Annualized Fee Rate | | Net Assets |
| .55% | | First $500 million |
| .45% | | Over $500 million, up to and including $1 billion |
| .40% | | Over $1 billion, up to and including $1.5 billion |
Fees are further reduced on net assets over $1.5 billion.
b. Administrative Fees
The Fund pays an administrative fee to FT Services of .25% per year of the average daily net assets of the Fund.
c. Distribution Fees
The Fund reimburses Distributors up to .25% per year of its average daily net assets of Class 2, for costs incurred in marketing the Fund’s shares under a Rule 12b-1 plan. Under the distribution plan, costs exceeding the maximum for the current plan year cannot be reimbursed in subsequent periods.
FSC-19
FRANKLIN TEMPLETON VARIABLE INSURANCE PRODUCTS TRUST
FRANKLIN SMALL CAP FUND
Notes to Financial Statements (continued)
3. TRANSACTIONS WITH AFFILIATES (cont.)
d. Transfer Agent Fees
Investor Services, under terms of an agreement, performs shareholder servicing for the Fund and is not paid by the Fund for the services.
4. EXPENSE OFFSET ARRANGEMENT
The Fund has entered into an arrangement with its custodian whereby credits realized as a result of uninvested cash balances are used to reduce a portion of the Fund’s custodian expenses. During the year ended December 31, 2004, custodian fees were reduced as noted in the Statement of Operations.
5. INCOME TAXES
At December 31, 2004, the Fund had tax basis capital losses which may be carried over to offset future capital gains. Such losses expire as follows:
| | | |
Capital loss carryovers expiring in: | | | |
2010 | | $ | 76,337,237 |
2011 | | | 20,558,560 |
| | |
|
|
| | | $ | 96,895,797 |
| | |
|
|
Net investment income (loss) differs for financial statement and tax purposes primarily due to differing treatments for foreign currency transactions.
Net realized gains (losses) differ for financial statement and tax purposes primarily due to differing treatments of wash sales and foreign currency transactions.
At December 31, 2004, the cost of investments and net unrealized appreciation (depreciation) for income tax purposes were as follows:
| | | | |
Cost of investments | | $ | 1,034,102,221 | |
| | |
|
|
|
Unrealized appreciation | | $ | 333,793,030 | |
Unrealized depreciation | | | (43,317,010 | ) |
| | |
|
|
|
Net unrealized appreciation (depreciation) | | $ | 290,476,020 | |
| | |
|
|
|
6. INVESTMENT TRANSACTIONS
Purchases and sales of investments (excluding short-term securities) for the year ended December 31, 2004, aggregated $489,864,988 and $353,677,705, respectively.
7. INVESTMENTS IN FRANKLIN INSTITUTIONAL FIDUCIARY TRUST MONEY MARKET PORTFOLIO
The Fund may invest in the Franklin Institutional Fiduciary Trust Money Market Portfolio (the Sweep Money Fund), an open-end investment company managed by Advisers. Management fees paid by the Fund are reduced on assets invested in the Sweep Money Fund, in an amount not to exceed the management fees paid by the Sweep Money Fund.
FSC-20
FRANKLIN TEMPLETON VARIABLE INSURANCE PRODUCTS TRUST
FRANKLIN SMALL CAP FUND
Notes to Financial Statements (continued)
8. MERGER OF FRANKLIN TECHNOLOGY SECURITIES FUND AND FRANKLIN AGGRESSIVE GROWTH SECURITIES FUND
On April 30, 2004, the Franklin Templeton Variable Insurance Products Trust (FTVIP) – Franklin Small Cap Fund (Small Cap) acquired the net assets of the FTVIP – Franklin Aggressive Growth Securities Fund (Growth) pursuant to a plan of reorganization. The merger was accomplished by a taxable exchange, and accounted for as a purchase.
The selected financial information and shares outstanding immediately before and after the acquisition were as follows:
| | | | | | | | | | | | | | | | |
| | | Class 1
| | Class 2
|
| Fund Name | | Net Assets | | NAV | | Shares | | Net Assets | | NAV | | Shares |
Growth | | $ | 4,196,977 | | $ | 5.45 | | 770,120 | | $ | 2,283 | | $ | 5.40 | | 423 |
Small Cap | | $ | 183,706,326 | | $ | 17.76 | | 10,344,058 | | $ | 965,432,629 | | $ | 17.58 | | 54,931,676 |
Small Cap – post merger | | $ | 187,903,303 | | $ | 17.76 | | 10,580,374 | | $ | 965,434,912 | | $ | 17.58 | | 54,931,806 |
On May 1, 2003, the Franklin Templeton Variable Insurance Products Trust (FTVIP) – Franklin Small Cap Fund (Small Cap) acquired the net assets of the FTVIP – Franklin Technology Securities Fund (Technology) pursuant to a plan of reorganization. The merger was accomplished by a taxable exchange, and accounted for as a purchase.
The selected financial information and shares outstanding immediately before and after the acquisition were as follows:
| | | | | | | | | | | | | | | | |
| | | Class 1
| | Class 2
|
| Fund Name | | Net Assets | | NAV | | Shares | | Net Assets | | NAV | | Shares |
Technology | | $ | 1,739,071 | | $ | 3.30 | | 527,220 | | $ | 12,916,332 | | $ | 3.28 | | 3,942,678 |
Small Cap | | $ | 158,617,460 | | $ | 13.19 | | 12,023,169 | | $ | 483,814,924 | | $ | 13.09 | | 36,965,893 |
Small Cap – post merger | | $ | 160,356,531 | | $ | 13.19 | | 12,155,018 | | $ | 496,731,256 | | $ | 13.09 | | 37,952,617 |
9. REGULATORY MATTERS
Investigations
As part of various investigations by a number of federal, state, and foreign regulators and governmental entities, including the Securities and Exchange Commission (“SEC”), the California Attorney General’s Office (“CAGO”), and the National Association of Securities Dealers, Inc. (“NASD”), relating to certain practices in the mutual fund industry, including late trading, market timing and marketing support payments to securities dealers who sell fund shares, Franklin Resources, Inc. and certain of its subsidiaries (as used in this section, together, the “Company”), as well as certain current or former executives and employees of the Company, received subpoenas and/or requests for documents, information and/or testimony. The Company and its current employees provided documents and information in response to those requests and subpoenas.
Settlements
Beginning in August 2004, the Company entered into settlements with certain regulators investigating the mutual fund industry practices noted above. The Company believes that settlement of each of the matters described in this section is in the best interest of the Company and shareholders of the Franklin, Templeton, and Mutual Series mutual funds (the “funds”).
On August 2, 2004, Franklin Resources, Inc. announced that its subsidiary, Franklin Advisers, Inc., reached an agreement with the SEC that resolved the issues resulting from the SEC investigation into market timing activity. In connection with that agreement, the SEC issued an “Order Instituting Administrative and Cease-and-Desist Proceedings Pursuant to Sections 203(e) and 203(k) of the Investment Advisers Act of 1940 and Sections 9(b) and 9(f) of the Investment Company Act of 1940, Making Findings and Imposing Remedial Sanctions and a Cease-and-Desist Order” (the “Order”). The SEC’s Order concerned the activities of a limited number of third parties that ended in 2000 and those that were the subject of the first Massachusetts administrative complaint described below.
FSC-21
FRANKLIN TEMPLETON VARIABLE INSURANCE PRODUCTS TRUST
FRANKLIN SMALL CAP FUND
Notes to Financial Statements (continued)
9. REGULATORY MATTERS (cont.)
Settlements (cont.)
Under the terms of the SEC’s Order, pursuant to which Franklin Advisers, Inc. neither admitted nor denied any of the findings contained therein, Franklin Advisers, Inc. agreed to pay $50 million, of which $20 million is a civil penalty, to be distributed to shareholders of certain funds in accordance with a plan to be developed by an independent distribution consultant. At this time, it is unclear which funds or which shareholders of any particular fund will receive distributions. The Order also required Franklin Advisers, Inc. to, among other things, enhance and periodically review compliance policies and procedures.
On September 20, 2004, Franklin Resources, Inc. announced that two of its subsidiaries, Franklin Advisers, Inc. and Franklin Templeton Alternative Strategies, Inc. (“FTAS”), reached an agreement with the Securities Division of the Office of the Secretary of the Commonwealth of Massachusetts (the “State of Massachusetts”) related to its administrative complaint filed on February 4, 2004, concerning one instance of market timing that was also a subject of the August 2, 2004 settlement that Franklin Advisers, Inc. reached with the SEC, as described above.
Under the terms of the settlement consent order issued by the State of Massachusetts, Franklin Advisers, Inc. and FTAS consented to the entry of a cease-and-desist order and agreed to pay a $5 million administrative fine to the State of Massachusetts (the “Massachusetts Consent Order”). The Massachusetts Consent Order included two different sections: “Statements of Fact” and “Violations of Massachusetts Securities Laws.” Franklin Advisers, Inc. and FTAS admitted the facts in the Statements of Fact.
On October 25, 2004, the State of Massachusetts filed a second administrative complaint, alleging that Franklin Resources, Inc.’s Form 8-K filing (in which it described the Massachusetts Consent Order and stated that “Franklin did not admit or deny engaging in any wrongdoing”) failed to state that Franklin Advisers, Inc. and FTAS admitted the Statements of Fact portion of the Massachusetts Consent Order (the “Second Complaint”). Franklin Resources, Inc. reached a second agreement with the State of Massachusetts on November 19, 2004, resolving the Second Complaint. As a result of the November 19, 2004 settlement, Franklin Resources, Inc. filed a new Form 8-K. The terms of the Massachusetts Consent Order did not change and there was no monetary fine associated with this second settlement.
On November 17, 2004, Franklin Resources, Inc. announced that Franklin/Templeton Distributors, Inc. (“FTDI”) reached an agreement with the CAGO, resolving the issues resulting from the CAGO’s investigation concerning sales and marketing support payments. Under the terms of the settlement, FTDI neither admitted nor denied the allegations in the CAGO’s complaint and agreed to pay $2 million to the State of California as a civil penalty, $14 million to the funds, to be allocated by an independent distribution consultant to be paid for by FTDI, and $2 million to the CAGO for its investigative costs.
On December 13, 2004, Franklin Resources, Inc. announced that its subsidiaries FTDI and Franklin Advisers, Inc. reached an agreement with the SEC, resolving the issues resulting from the SEC’s investigation concerning marketing support payments to securities dealers who sell fund shares. In connection with that agreement, the SEC issued an “Order Instituting Administrative and Cease-and-Desist Proceedings, Making Findings, and Imposing Remedial Sanctions Pursuant to Sections 203(e) and 203(k) of the Investment Advisers Act of 1940, Sections 9(b) and 9(f) of the Investment Company Act of 1940, and Section 15(b) of the Securities Exchange Act of 1934” (the “Second Order”).
Under the terms of the Second Order, in which FTDI and Franklin Advisers, Inc. neither admitted nor denied the findings contained therein, they agreed to pay the funds a penalty of $20 million and disgorgement of $1 (one dollar). FTDI and Franklin Advisers, Inc. also agreed to implement certain measures and undertakings relating to marketing support payments to broker-dealers for the promotion or sale of fund shares, including making additional disclosures in the funds’ Prospectuses and Statements of Additional Information. The Second Order further requires the appointment of an independent distribution consultant, at the Company’s expense, who shall develop a plan for the distribution of the penalty and disgorgement to the funds.
FSC-22
FRANKLIN TEMPLETON VARIABLE INSURANCE PRODUCTS TRUST
FRANKLIN SMALL CAP FUND
Notes to Financial Statements (continued)
9. REGULATORY MATTERS (cont.)
Other Legal Proceedings
The Trust, in addition to the Company and other funds, and certain current and former officers, employees, and directors have been named in multiple lawsuits in different federal courts in Nevada, California, Illinois, New York and Florida, alleging violations of various federal securities laws and seeking, among other relief, monetary damages, restitution, removal of fund trustees, directors, advisers, administrators, and distributors, rescission of management contracts and 12b-1 Plans, and/or attorneys’ fees and costs. Specifically, the lawsuits claim breach of duty with respect to alleged arrangements to permit market timing and/or late trading activity, or breach of duty with respect to the valuation of the portfolio securities of certain Templeton funds managed by Franklin Resources, Inc. subsidiaries, resulting in alleged market timing activity. The majority of these lawsuits duplicate, in whole or in part, the allegations asserted in the February 4, 2004 Massachusetts administrative complaint and the findings in the SEC’s August 2, 2004 Order, as described above. The lawsuits are styled as class actions, or derivative actions on behalf of either the named funds or Franklin Resources, Inc.
In addition, the Company, as well as certain current and former officers, employees, and directors, have been named in multiple lawsuits alleging violations of various securities laws and pendent state law claims relating to the disclosure of directed brokerage payments and/or payment of allegedly excessive advisory, commission, and distribution fees, and seeking, among other relief, monetary damages, restitution, rescission of advisory contracts, including recovery of all fees paid pursuant to those contracts, an accounting of all monies paid to the named advisers, declaratory relief, injunctive relief, and/or attorneys’ fees and costs. These lawsuits are styled as class actions or derivative actions brought on behalf of certain funds.
The Company and fund management strongly believes that the claims made in each of the lawsuits identified above are without merit and intends to vigorously defend against them. The Company cannot predict with certainty, however, the eventual outcome of the remaining governmental investigations or private lawsuits, nor whether they will have a material negative impact on the Company. Public trust and confidence are critical to the Company’s business and any material loss of investor and/or client confidence could result in a significant decline in assets under management by the Company, which would have an adverse effect on the Company’s future financial results. If the Company finds that it bears responsibility for any unlawful or inappropriate conduct that caused losses to the Trust, it is committed to making the Trust or its shareholders whole, as appropriate. The Company is committed to taking all appropriate actions to protect the interests of its funds’ shareholders.
FSC-23
FRANKLIN TEMPLETON VARIABLE INSURANCE PRODUCTS TRUST
FRANKLIN SMALL CAP FUND
Report of Independent Registered Public Accounting Firm
To the Trustees and Shareholders of Franklin Templeton Variable Insurance Products Trust
In our opinion, the accompanying statement of assets and liabilities, including the statement of investments, and the related statements of operations and of changes in net assets and the financial highlights present fairly, in all material respects, the financial position of Franklin Small Cap Fund (one of the funds constituting Franklin Templeton Variable Insurance Products Trust) at December 31, 2004, the results of its operations for the year then ended, the changes in its net assets for each of the two years in the period then ended and the financial highlights for each of the five years in the period then ended, in conformity with accounting principles generally accepted in the United States of America. These financial statements and financial highlights (hereafter referred to as “financial statements”) are the responsibility of the Fund’s management; our responsibility is to express an opinion on these financial statements based on our audits. We conducted our audits of these financial statements in accordance the standards of the Public Company Accounting Oversight Board (United States). Those standards require that we plan and perform the audits to obtain reasonable assurance about whether the financial statements are free of material misstatement. An audit includes examining, on a test basis, evidence supporting the amounts and disclosures in the financial statements, assessing the accounting principles used and significant estimates made by management, and evaluating the overall financial statement presentation. We believe that our audits, which included confirmation of securities at December 31, 2004 by correspondence with the custodian and brokers, provide a reasonable basis for our opinion.
PricewaterhouseCoopers LLP
San Francisco, California
February 9, 2005
FSC-24
FRANKLIN SMALL CAP VALUE SECURITIES FUND
We are pleased to bring you Franklin Small Cap Value Securities Fund’s annual report for the fiscal year ended December 31, 2004.
Performance Summary as of 12/31/04
Average annual total return of Class 2 shares* represents the average annual change in value, assuming reinvestment of dividends and capital gains. Average returns smooth out variations in returns, which can be significant; they are not the same as year-by-year results.
Periods ended 12/31/04
| | | | | | |
| | | 1-Year | | 5-Year | | Since
Inception
(5/1/98) |
Average Annual Total Return | | +23.75% | | +16.11% | | +7.96% |
*Because Class 2 shares were not offered until 1/6/99, standardized Class 2 Fund performance for prior periods represents the historical results of Class 1 shares. For periods beginning on 1/6/99, Class 2’s results reflect an additional 12b-1 fee expense, which also affects future performance. Since 1/6/99 (effective date), the average annual total return of Class 2 shares was +13.12%.
Total Return Index Comparison for Hypothetical $10,000 Investment (5/1/98–12/31/04)
The graph below shows the change in value of a hypothetical $10,000 investment in the Fund over the indicated period and includes reinvestment of any income or distributions. The Fund’s performance* is compared to the performance of the Russell® 2000 Value Index. One cannot invest directly in an index, nor is an index representative of the Fund’s portfolio. Please see Important Notes to Performance Information preceding the Fund Summaries.

**Source: Standard & Poor’s Micropal. Please see Index Descriptions following the Fund Summaries.
Franklin Small Cap Value Securities Fund – Class 2
Performance reflects the Fund’s Class 2 operating expenses, but does not include any contract fees, expenses or sales charges. If they had been included, performance would be lower. These charges and deductions, particularly for variable life policies, can have a significant effect on contract values and insurance benefits. See the contract prospectus for a complete description of these expenses, including sales charges.
Performance data quoted represent past performance, which does not guarantee future results. Investment return and principal value will fluctuate, and you may have a gain or loss when you sell your shares. Current performance may differ from figures shown.
FSV-1
Fund Goal and Main Investments: Franklin Small Cap Value Securities Fund seeks long-term total return. The Fund invests mainly in equity securities of U.S. small capitalization companies that the Fund’s manager believes are undervalued.
Performance Overview
You can find the Fund’s one-year total return in the Performance Summary. The Fund outperformed its benchmark, the Russell 2000 Value Index, which returned 22.25%.1 Please note that the Fund employs a bottom-up stock selection process, and the managers invest in securities without regard to benchmark comparisons.
Economic and Market Overview
During the year ended December 31, 2004, the domestic economy expanded solidly and broadly across most industries, sectors and regions as gross domestic product (GDP) rose an estimated 4.4%.2 However, surging energy and other commodity prices had a dampening effect. Although consumer confidence remained below pre-recession levels, consumer spending supported strong auto sales, increased durable goods consumption and a healthy housing market. Similarly, business spending rose substantially even as business confidence wavered. With improving balance sheets and stronger profit margins, many companies entered an upgrade cycle and invested in new technologies, driving equipment spending up 9.5% in the second half of 2004.2 The labor market firmed as employers hired 2.2 million workers in 2004, and unemployment dropped from 5.7% to 5.4% during the year.3 More than one-half of the jobs lost during the recession have been recovered; however, most new jobs were part-time or temporary. Given concerns over rising benefits costs and lingering uncertainties about economic recovery, many companies turned to temporary employment or opted for continued hiring freezes. At year-end, elevated household debt levels and the deepening federal budget and trade deficits were three top concerns for the economy as it headed into 2005.
The U.S. dollar weakened throughout 2004 and hit an all-time low against the euro and a multi-year low versus the yen. The widening trade and current account deficits and possibility for higher import prices contributed to inflationary pressures. The core inflation rate rose
1. Source: Standard & Poor’s Micropal. One cannot invest directly in an index, nor is an index representative of the Fund’s portfolio. Please see Index Descriptions following the Fund Summaries.
2. Source: Bureau of Economic Analysis.
3. Source: Bureau of Labor Statistics.
Fund Risks: Stocks offer the potential for long-term gains but can be subject to short-term up-and-down price movements. Small or relatively new or unseasoned companies can be particularly sensitive to changing economic conditions, the prospects for growth are less certain than those of larger, more established companies and their securities are more volatile. The Fund’s prospectus also includes a description of the main investment risks.
FSV-2
to 2.2% in 2004, or 3.3% including volatile food and energy costs. Aiming to keep inflation tame, the Federal Reserve Board (Fed) raised the federal funds target rate five times between June and December, from 1.00% to 2.25%, the highest level in more than three years. The Fed said it will respond to changes in economic prospects as needed to fulfill its obligation to maintain price stability, noting in December that it perceived “the upside and downside risks to the attainment of both sustainable growth and price stability for the next few quarters to be roughly equal.”4
Despite a generally robust economy and improving corporate fundamentals, investors had to digest a wide range of information in 2004, including rising inflation, the dollar’s value, a contentious presidential election and ongoing concerns about terrorism, war and reconstruction in Iraq. Domestic equity markets rallied in early 2004 and then fluctuated; however, they were essentially flat through early November. Disappointing earnings from a number of blue chip companies applied downward pressure, but initial public offering (IPO) activity was strong and investor sentiment improved late in the period despite the mixed signals. After the elections concluded, the markets enjoyed another strong rally through year-end. The blue chip stocks of the Dow Jones Industrial Average gained 5.31% for the year under review, while the broader Standard & Poor’s 500 Composite Index (S&P 500) rose 10.87% and the technology-heavy NASDAQ Composite Index increased 9.15%.5
Investment Strategy
We are a research driven, fundamental investment adviser, pursuing a disciplined, value-oriented strategy for the Fund. As a bottom-up adviser concentrating primarily on individual securities, we focus on the market price of a company’s securities relative to our evaluation of the company’s potential long-term earnings, asset value or cash flow. We seek bargains among the “under-researched and unloved,” out-of-favor companies that offer, in our opinion, attractive long-term potential that might include current growth companies that are being ignored by the market, former growth companies that have stumbled recently, dropping sharply in price but that still have significant growth potential, or companies that are potential turnaround or takeover targets.
4. Source: Federal Reserve. Press Release, 12/14/04.
5. Source: Standard & Poor’s Micropal. Please see Index Descriptions following the Fund Summaries.
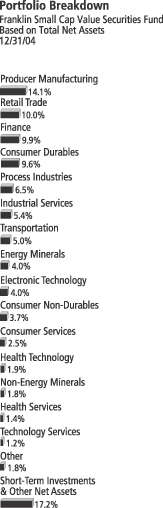
FSV-3
Manager’s Discussion
The Fund benefited from a variety of different sectors during the year under review. The transportation sector was a top contributor, mainly due to three marine transportation stocks: OMI, Teekay Shipping and Overseas Shipholding Group, which returned 89%, 48% and 62%, respectively, in 2004 as leasing rates for oil tankers rose along with higher oil demand from China and other countries. OMI was also our single largest contributor to Fund performance. On an absolute return basis, however, the best performer was retailer American Eagle Outfitters, whose share price rose 187% in 2004 largely due to strong consumer sales and controlled inventory levels that led to higher margins.
Despite the Fund’s solid performance, some of its stocks declined. For example, several of our investments in the consumer durables sector were disappointments, including gift distributor Russ Berrie & Company (down 33%) and furniture manufacturer La-Z-Boy (down 27%). Russ Berrie, whose stock sold off sharply following poor results throughout much of the year, declined mainly due to weak customer acceptance of the company’s 2004 product offerings. La-Z-Boy’s poor performance was primarily due to narrowing profit margins stemming from the increased overhead of higher steel and lumber prices. Furthermore, the company was operating within a highly competitive and promotional furniture marketplace, an environment that further reduced profit margins. Superior Industries’ stock fell more than 30% after announcing declining net income resulting from intense global competition and several operating issues at the company’s recently expanded manufacturing facilities. Additionally, in October Superior announced a major cut in its initial 2005 sales projections, to 2% from 5%. Much of this downward revision stemmed from automakers’ demands for Superior to lower prices.
The Fund experienced significant net inflows during the year, and we used a portion of the proceeds to invest in 15 new positions. Consistent with our value strategy, we added A.O. Smith, which manufactures electric motors and water heaters. At period-end, we considered A.O. Smith attractively valued at 19 times 2005 earnings estimates and less than 1.5 times book value. We also initiated a position in Westlake Chemical, a family-controlled producer of olefins (raw materials for the plastics and petrochemical industries), vinyls, PVC and PVC pipe that recently met our investment criteria and traded at 12.5 times 2005 earnings estimates at period-end. Additionally, we increased several
Top 10 Holdings
Franklin Small Cap Value Securities Fund 12/31/04
| | |
Company Sector/Industry | | % of Total
Net Assets |
| |
| Thor Industries Inc. | | 2.1% |
| Consumer Durables | | |
| |
| Montpelier Re Holdings Ltd. (Bermuda) | | 1.9% |
| Finance | | |
| |
| York International Corp. | | 1.9% |
| Producer Manufacturing | | |
| |
| West Marine Inc. | | 1.8% |
| Retail Trade | | |
| |
| RPM International Inc. | | 1.7% |
| Process Industries | | |
| |
| Peabody Energy Corp. | | 1.7% |
| Energy Minerals | | |
| |
| Briggs & Stratton Corp. | | 1.6% |
| Consumer Durables | | |
| |
| SkyWest Inc. | | 1.6% |
| Transportation | | |
| |
| Pier 1 Imports Inc. | | 1.5% |
| Retail Trade | | |
| |
| Mueller Industries Inc. | | 1.5% |
| Producer Manufacturing | | |
The dollar value, number of shares or principal amount, and names of all portfolio holdings are listed in the Fund’s Statement of Investments.
FSV-4
existing positions we believed were attractively valued, most notably Pier 1 Imports, the well-known decorative home furnishings retailer, and Montpelier Re Holdings, a Bermuda-based reinsurance company.
During the year, 15 positions were eliminated from the portfolio. One, Allstream, was due to a takeover. Allstream, which we purchased early in the Fund’s fiscal year, announced in March 2004 that Manitoba Telecom Services had bid for the company at a 19% premium over the prior day’s closing price. We decided to sell our Allstream holdings as open-market prices came in line with our estimation of the shares’ fair value. Fund holdings were involved in another buyout announcement during the period when the world’s second-largest leaf-tobacco dealer, DIMON, bid for a smaller leaf-tobacco processor and Fund holding, Standard Commercial. The November 2004 merger and subsequent stock deal pushed Standard’s share price up to a 13.8% premium over the prior day’s closing price. The remaining liquidations from the Fund’s portfolio included stocks that reached our price targets, or those whose underlying fundamentals had deteriorated.
Thank you for your participation in Franklin Small Cap Value Securities Fund. We look forward to serving your future investment needs.
The foregoing information reflects our analysis, opinions and portfolio holdings as of December 31, 2004, the end of the reporting period. The way we implement our main investment strategies and the resulting portfolio holdings may change depending on factors such as market and economic conditions. These opinions may not be relied upon as investment advice or an offer for a particular security. The information is not a complete analysis of every aspect of any market, country, industry, security or the Fund. Statements of fact are from sources considered reliable, but the adviser makes no representation or warranty as to their completeness or accuracy. Although historical performance is no guarantee of future results, these insights may help you understand our investment management philosophy.
FSV-5
Fund Expenses
As an investor in a variable insurance contract (“Contract”) that indirectly provides for investment in an underlying mutual fund, you can incur transaction and/or ongoing expenses at both the Fund level and the Contract level.
| • | | Transaction expenses can include sales charges (loads) on purchases, redemption fees, surrender fees, transfer fees and premium taxes. |
| • | | Ongoing expenses can include management fees, distribution and service (12b-1) fees, contract fees, annual maintenance fees, mortality and expense risk fees and other fees and expenses. All mutual funds and Contracts have some types of ongoing expenses. |
The expenses shown in the table below are meant to highlight ongoing expenses at the Fund level only and do not include ongoing expenses at the Contract level, or transaction expenses at either the Fund or Contract levels. While the Fund does not have transaction expenses, if the transaction and ongoing expenses at the Contract level were included, the expenses shown below would be higher. You should consult your Contract prospectus or disclosure document for more information.
The table shows Fund-level ongoing expenses and can help you understand these expenses and compare them with those of other mutual funds offered through the Contract. The table assumes a $1,000 investment held for the six months indicated. Please refer to the Fund prospectus for additional information on operating expenses.
Actual Fund Expenses
The first line (Actual) for each share class listed in the table below provides actual account values and expenses. The “Ending Account Value” is derived from the Fund’s actual return, which includes the effect of ongoing Fund expenses, but does not include the effect of ongoing Contract expenses.
You can estimate the Fund-level expenses you incurred during the period, by following these steps. Of course, your account value and expenses will differ from those in this illustration:
| 1. | Divide your account value by $1,000. |
If an account had an $8,600 value, then $8,600 ÷ $1,000 = 8.6.
| 2. | Multiply the result by the number under the heading “Fund-Level Expenses Incurred During Period.” |
If Fund-Level Expenses Incurred During Period were $7.50, then
8.6 × $7.50 = $64.50.
Franklin Small Cap Value Securities Fund – Class 2
FSV-6
In this illustration, the estimated expenses incurred this period at the Fund level are $64.50.
Hypothetical Example for Comparison with Other Mutual Funds
Information in the second line (Hypothetical) for each class in the table can help you compare ongoing expenses of the Fund with those of other mutual funds offered through the Contract. This information may not be used to estimate the actual ending account balance or expenses you incurred during the period. The hypothetical “Ending Account Value” is based on the actual expense ratio for each class and an assumed 5% annual rate of return before expenses, which does not represent the Fund’s actual return. The figure under the heading “Fund-Level Expenses Incurred During Period” shows the hypothetical expenses your account would have incurred under this scenario. You can compare this figure with the 5% hypothetical examples that appear in shareholder reports of other funds offered through a Contract.
| | | | | | | | | |
| Class 2 | | Beginning
Account
Value 6/30/04 | | Ending
Account
Value 12/31/04 | | Fund-Level
Expenses Incurred
During Period*
6/30/04-12/31/04 |
Actual | | $ | 1,000 | | $ | 1,134.10 | | $ | 4.94 |
Hypothetical (5% return before expenses) | | $ | 1,000 | | $ | 1,020.51 | | $ | 4.67 |
*Expenses are equal to the annualized expense ratio for the Fund’s Class 2 shares (0.92%), which does not include any ongoing expenses of the Contract for which the Fund is an investment option, multiplied by the average account value over the period, multiplied by 184/366 to reflect the one-half year period.
FSV-7
FRANKLIN TEMPLETON VARIABLE INSURANCE PRODUCTS TRUST
FRANKLIN SMALL CAP VALUE SECURITIES FUND
Financial Highlights
| | | | | | | | | | | | | | | | | | | | |
| | | Class 1
| |
| | | Year Ended December 31,
| |
| | | 2004 | | | 2003 | | | 2002 | | | 2001 | | | 2000 | |
| | |
|
|
|
Per share operating performance | | | | | | | | | | | | | | | | | | | | |
(for a share outstanding throughout the year) | | | | | | | | | | | | | | | | | | | | |
Net asset value, beginning of year | | $ | 12.81 | | | $ | 9.70 | | | $ | 10.97 | | | $ | 9.86 | | | $ | 7.90 | |
| | |
|
|
|
Income from investment operations: | | | | | | | | | | | | | | | | | | | | |
Net investment incomea | | | .21 | | | | .06 | | | | .07 | | | | .11 | | | | .10 | |
Net realized and unrealized gains (losses) | | | 2.87 | | | | 3.08 | | | | (1.01 | ) | | | 1.29 | | | | 1.89 | |
| | |
|
|
|
Total from investment operations | | | 3.08 | | | | 3.14 | | | | (.94 | ) | | | 1.40 | | | | 1.99 | |
| | |
|
|
|
Less distributions from: | | | | | | | | | | | | | | | | | | | | |
Net investment income | | | (.04 | ) | | | (.03 | ) | | | (.05 | ) | | | (.05 | ) | | | (.03 | ) |
Net realized gains | | | — | | | | — | | | | (.28 | ) | | | (.24 | ) | | | — | |
| | |
|
|
|
Total distributions | | | (.04 | ) | | | (.03 | ) | | | (.33 | ) | | | (.29 | ) | | | (.03 | ) |
| | |
|
|
|
Net asset value, end of year | | $ | 15.85 | | | $ | 12.81 | | | $ | 9.70 | | | $ | 10.97 | | | $ | 9.86 | |
| | |
|
|
|
| | | | | |
Total returnb | | | 24.09% | | | | 32.47% | | | | (9.05)% | | | | 14.21% | | | | 25.23% | |
Ratios/supplemental data | | | | | | | | | | | | | | | | | | | | |
Net assets, end of year (000’s) | | $ | 50,401 | | | $ | 37,108 | | | $ | 28,720 | | | $ | 32,604 | | | $ | 19,455 | |
Ratios to average net assets: | | | | | | | | | | | | | | | | | | | | |
Expenses | | | .67% | | | | .74% | | | | .76% | | | | .77% | | | | .84% | |
Net investment income | | | 1.59% | | | | .63% | | | | .63% | | | | 1.07% | | | | 1.13% | |
Portfolio turnover rate | | | 9.50% | | | | 12.52% | | | | 5.11% | | | | 40.54% | | | | 42.47% | |
| a | Based on average daily shares outstanding. |
| b | Total return does not include any fees, charges or expenses imposed by the variable annuity and life insurance contracts for which the Franklin Templeton Variable Insurance Products Trust serves as an underlying investment vehicle. Total return is not annualized for periods less than one year. |
See notes to financial statements.
FSV-8
FRANKLIN TEMPLETON VARIABLE INSURANCE PRODUCTS TRUST
FRANKLIN SMALL CAP VALUE SECURITIES FUND
Financial Highlights (continued)
| | | | | | | | | | | | | | | | | | | | |
| | | Class 2
| |
| | | Year Ended December 31,
| |
| | | 2004 | | | 2003 | | | 2002 | | | 2001 | | | 2000 | |
| | |
|
|
|
Per share operating performance | | | | | | | | | | | | | | | | | | | | |
(for a share outstanding throughout the year) | | | | | | | | | | | | | | | | | | | | |
Net asset value, beginning of year | | $ | 12.67 | | | $ | 9.61 | | | $ | 10.89 | | | $ | 9.81 | | | $ | 7.88 | |
| | |
|
|
|
Income from investment operations: | | | | | | | | | | | | | | | | | | | | |
Net investment incomea | | | .18 | | | | .04 | | | | .04 | | | | .08 | | | | .08 | |
Net realized and unrealized gains (losses) | | | 2.82 | | | | 3.04 | | | | (1.00 | ) | | | 1.28 | | | | 1.88 | |
| | |
|
|
|
Total from investment operations | | | 3.00 | | | | 3.08 | | | | (.96 | ) | | | 1.36 | | | | 1.96 | |
| | |
|
|
|
Less distributions from: | | | | | | | | | | | | | | | | | | | | |
Net investment income | | | (.02 | ) | | | (.02 | ) | | | (.04 | ) | | | (.04 | ) | | | (.03 | ) |
Net realized gains | | | — | | | | — | | | | (.28 | ) | | | (.24 | ) | | | — | |
| | |
|
|
|
Total distributions | | | (.02 | ) | | | (.02 | ) | | | (.32 | ) | | | (.28 | ) | | | (.03 | ) |
| | |
|
|
|
Net asset value, end of year | | $ | 15.65 | | | $ | 12.67 | | | $ | 9.61 | | | $ | 10.89 | | | $ | 9.81 | |
| | |
|
|
|
| | | | | |
Total returnb | | | 23.75% | | | | 32.12% | | | | (9.26)% | | | | 13.79% | | | | 25.02% | |
Ratios/supplemental data | | | | | | | | | | | | | | | | | | | | |
Net assets, end of year (000’s) | | $ | 748,762 | | | $ | 333,625 | | | $ | 125,302 | | | $ | 34,282 | | | $ | 7,209 | |
Ratios to average net assets: | | | | | | | | | | | | | | | | | | | | |
Expenses | | | .92% | | | | .99% | | | | 1.01% | | | | 1.02% | | | | 1.09% | |
Net investment income | | | 1.34% | | | | .38% | | | | .38% | | | | .81% | | | | .90% | |
Portfolio turnover rate | | | 9.50% | | | | 12.52% | | | | 5.11% | | | | 40.54% | | | | 42.47% | |
| a | Based on average daily shares outstanding. |
| b | Total return does not include any fees, charges or expenses imposed by the variable annuity and life insurance contracts for which the Franklin Templeton Variable Insurance Products Trust serves as an underlying investment vehicle. Total return is not annualized for periods less than one year. |
See notes to financial statements.
FSV-9
FRANKLIN TEMPLETON VARIABLE INSURANCE PRODUCTS TRUST
FRANKLIN SMALL CAP VALUE SECURITIES FUND
Statement of Investments, December 31, 2004
| | | | | |
| | | SHARES | | VALUE |
Common Stocks 82.6% | | | | | |
Commercial Services .3% | | | | | |
ABM Industries Inc. | | 120,000 | | $ | 2,366,400 |
| | | | |
|
|
Consumer Durables 9.6% | | | | | |
Apogee Enterprises Inc. | | 510,000 | | | 6,839,100 |
Bassett Furniture Industries Inc. | | 190,000 | | | 3,728,750 |
Briggs & Stratton Corp. | | 315,000 | | | 13,097,700 |
D.R. Horton Inc. | | 21,375 | | | 861,626 |
Hooker Furniture Corp. | | 201,971 | | | 4,584,742 |
La-Z-Boy Inc. | | 405,000 | | | 6,224,850 |
M/I Homes Inc. | | 180,000 | | | 9,919,800 |
Monaco Coach Corp. | | 359,000 | | | 7,384,630 |
Russ Berrie & Co. Inc. | | 320,600 | | | 7,322,504 |
Thor Industries Inc. | | 446,400 | | | 16,539,120 |
| | | | |
|
|
| | | | | | 76,502,822 |
| | | | |
|
|
Consumer Non-Durables 3.7% | | | | | |
Brown Shoe Co. Inc. | | 340,000 | | | 10,142,200 |
Lancaster Colony Corp. | | 60,000 | | | 2,572,200 |
Oshkosh B’Gosh Inc., A | | 200,000 | | | 4,280,000 |
Russell Corp. | | 229,600 | | | 4,472,608 |
Standard Commercial Corp. | | 48,500 | | | 943,810 |
aTimberland Co., A | | 109,000 | | | 6,831,030 |
| | | | |
|
|
| | | | | | 29,241,848 |
| | | | |
|
|
Consumer Services 2.5% | | | | | |
aAztar Corp. | | 185,000 | | | 6,460,200 |
Intrawest Corp. (Canada) | | 285,000 | | | 6,552,150 |
aLa Quinta Corp. | | 725,900 | | | 6,598,431 |
| | | | |
|
|
| | | | | | 19,610,781 |
| | | | |
|
|
Electronic Technology 4.0% | | | | | |
aAvocent Corp. | | 243,200 | | | 9,854,464 |
Cohu Inc. | | 510,000 | | | 9,465,600 |
Diebold Inc. | | 70,000 | | | 3,901,100 |
aOmniVision Technologies Inc. | | 475,000 | | | 8,716,250 |
| | | | |
|
|
| | | | | | 31,937,414 |
| | | | |
|
|
Energy Minerals 4.0% | | | | | |
Arch Coal Inc. | | 194,000 | | | 6,894,760 |
Consol Energy Inc. | | 235,000 | | | 9,646,750 |
Holly Corp. | | 80,000 | | | 2,229,600 |
Peabody Energy Corp. | | 165,000 | | | 13,350,150 |
| | | | |
|
|
| | | | | | 32,121,260 |
| | | | |
|
|
Finance 9.9% | | | | | |
American National Insurance Co. | | 62,100 | | | 6,468,336 |
aArchipelago Holdings Inc. | | 225,500 | | | 4,730,990 |
Arthur J. Gallagher & Co. | | 255,000 | | | 8,287,500 |
Chemical Financial Corp. | | 2,300 | | | 98,716 |
aDollar Thrifty Automotive Group Inc. | | 210,000 | | | 6,342,000 |
First Indiana Corp. | | 101,000 | | | 2,273,510 |
Hancock Holding Co. | | 47,500 | | | 1,589,350 |
Harleysville Group Inc. | | 19,500 | | | 465,465 |
FSV-10
FRANKLIN TEMPLETON VARIABLE INSURANCE PRODUCTS TRUST
FRANKLIN SMALL CAP VALUE SECURITIES FUND
Statement of Investments, December 31, 2004 (cont.)
| | | | | |
| | | SHARES | | VALUE |
Common Stocks (cont.) | | | | | |
Finance (cont.) | | | | | |
IPC Holdings Ltd. (Bermuda) | | 220,000 | | $ | 9,572,200 |
Montpelier Re Holdings Ltd. (Bermuda) | | 395,000 | | | 15,187,750 |
Peoples Bancorp Inc. | | 214,300 | | | 5,878,249 |
The PMI Group Inc. | | 65,000 | | | 2,713,750 |
Presidential Life Corp. | | 104,300 | | | 1,768,928 |
Protective Life Corp. | | 78,100 | | | 3,334,089 |
RLI Corp. | | 170,000 | | | 7,066,900 |
StanCorp Financial Group Inc. | | 45,000 | | | 3,712,500 |
| | | | |
|
|
| | | | | | 79,490,233 |
| | | | |
|
|
Health Services 1.4% | | | | | |
aPharmaceutical Product Development Inc. | | 274,215 | | | 11,322,337 |
| | | | |
|
|
Health Technology 1.9% | | | | | |
aSTERIS Corp. | | 416,900 | | | 9,888,868 |
West Pharmaceutical Services Inc. | | 210,000 | | | 5,256,300 |
| | | | |
|
|
| | | | | | 15,145,168 |
| | | | |
|
|
Industrial Services 5.4% | | | | | |
aAtwood Oceanics Inc. | | 85,000 | | | 4,428,500 |
aEMCOR Group Inc. | | 100,000 | | | 4,518,000 |
aGlobal Industries Ltd. | | 680,000 | | | 5,637,200 |
aLone Star Technologies Inc. | | 275,000 | | | 9,201,500 |
aOffshore Logistics Inc. | | 157,800 | | | 5,123,766 |
aOil States International Inc. | | 245,000 | | | 4,726,050 |
aRowan Cos. Inc. | | 269,100 | | | 6,969,690 |
aShaw Group Inc. | | 143,000 | | | 2,552,550 |
| | | | |
|
|
| | | | | | 43,157,256 |
| | | | |
|
|
Non-Energy Minerals 1.8% | | | | | |
Reliance Steel & Aluminum Co. | | 200,000 | | | 7,792,000 |
United States Steel Corp. | | 130,000 | | | 6,662,500 |
| | | | |
|
|
| | | | | | 14,454,500 |
| | | | |
|
|
Process Industries 6.5% | | | | | |
AptarGroup Inc. | | 117,500 | | | 6,201,650 |
Bunge Ltd. | | 195,000 | | | 11,116,950 |
Cabot Corp. | | 299,000 | | | 11,565,320 |
Glatfelter | | 226,200 | | | 3,456,336 |
Myers Industries Inc. | | 64,020 | | | 819,456 |
RPM International Inc. | | 705,000 | | | 13,860,300 |
Westlake Chemical Corp. | | 146,900 | | | 4,906,460 |
| | | | |
|
|
| | | | | | 51,926,472 |
| | | | |
|
|
Producer Manufacturing 13.9% | | | | | |
A.O. Smith Corp. | | 145,900 | | | 4,368,246 |
American Woodmark Corp. | | 21,200 | | | 926,016 |
Carlisle Cos. Inc. | | 56,700 | | | 3,680,964 |
CIRCOR International Inc. | | 320,000 | | | 7,411,200 |
CNH Global NV (Netherlands) | | 160,000 | | | 3,099,200 |
aGenlyte Group Inc. | | 50,000 | | | 4,284,000 |
Graco Inc. | | 144,000 | | | 5,378,400 |
JLG Industries Inc. | | 195,000 | | | 3,827,850 |
See notes to financial statements.
FSV-11
FRANKLIN TEMPLETON VARIABLE INSURANCE PRODUCTS TRUST
FRANKLIN SMALL CAP VALUE SECURITIES FUND
Statement of Investments, December 31, 2004 (cont.)
| | | | | | |
| | | SHARES | | VALUE |
Common Stocks (cont.) | | | | | | |
Producer Manufacturing (cont.) | | | | | | |
aMettler-Toledo International Inc. (Switzerland) | | | 195,000 | | $ | 10,005,450 |
Mueller Industries Inc. | | | 365,000 | | | 11,753,000 |
aPowell Industries Inc. | | | 87,700 | | | 1,621,573 |
Roper Industries Inc. | | | 135,500 | | | 8,234,335 |
Stewart & Stevenson Services Inc. | | | 78,000 | | | 1,577,940 |
Superior Industries International Inc. | | | 344,000 | | | 9,993,200 |
Teleflex Inc. | | | 175,000 | | | 9,089,500 |
Thomas Industries Inc. | | | 70,000 | | | 2,794,400 |
Timken Co. | | | 44,800 | | | 1,165,696 |
Watts Water Technologies Inc., A | | | 215,000 | | | 6,931,600 |
York International Corp. | | | 435,000 | | | 15,024,900 |
| | | | | |
|
|
| | | | | | | 111,167,470 |
| | | | | |
|
|
Real Estate Investment Trusts .9% | | | | | | |
Arbor Realty Trust Inc. | | | 300,000 | | | 7,362,000 |
| | | | | |
|
|
Retail Trade 10.0% | | | | | | |
American Eagle Outfitters Inc. | | | 62,500 | | | 2,943,750 |
Casey’s General Stores Inc. | | | 430,000 | | | 7,804,500 |
Christopher & Banks Corp. | | | 585,000 | | | 10,793,250 |
Dillards Inc., A | | | 282,000 | | | 7,577,340 |
aGymboree Corp. | | | 11,700 | | | 149,994 |
aHot Topic Inc. | | | 364,400 | | | 6,264,036 |
aLinens ‘n Things Inc. | | | 225,000 | | | 5,580,000 |
aThe Men’s Wearhouse Inc. | | | 330,000 | | | 10,546,800 |
Pier 1 Imports Inc. | | | 600,000 | | | 11,820,000 |
aWest Marine Inc. | | | 580,000 | | | 14,355,000 |
aZale Corp. | | | 58,000 | | | 1,732,460 |
| | | | | |
|
|
| | | | | | | 79,567,130 |
| | | | | |
|
|
Technology Services 1.2% | | | | | | |
Reynolds & Reynolds Co., A | | | 348,000 | | | 9,225,480 |
| | | | | |
|
|
Transportation 5.0% | | | | | | |
aKansas City Southern | | | 275,000 | | | 4,875,750 |
OMI Corp. | | | 273,300 | | | 4,605,105 |
Overseas Shipholding Group Inc. | | | 89,000 | | | 4,912,800 |
SkyWest Inc. | | | 625,000 | | | 12,537,500 |
Teekay Shipping Corp. (Bahamas) | | | 230,000 | | | 9,685,300 |
Tidewater Inc. | | | 105,000 | | | 3,739,050 |
| | | | | |
|
|
| | | | | | | 40,355,505 |
| | | | | |
|
|
Utilities .6% | | | | | | |
aSierra Pacific Resources Co. | | | 480,000 | | | 5,040,000 |
| | | | | |
|
|
Total Common Stocks (Cost $480,730,550) | | | | | | 659,994,076 |
| | | | | |
|
|
| | |
| | | PRINCIPAL
AMOUNT
| | |
Bonds (Cost $1,656,112) .2% | | | | | | |
Producer Manufacturing | | | | | | |
Mueller Industries Inc., 6.00%, 11/1/14 | | $ | 1,681,000 | | | 1,655,785 |
| | | | | |
|
|
Total Long Term Investments (Cost $482,386,662) | | | | | | 661,649,861 |
| | | | | |
|
|
FSV-12
FRANKLIN TEMPLETON VARIABLE INSURANCE PRODUCTS TRUST
FRANKLIN SMALL CAP VALUE SECURITIES FUND
Statement of Investments, December 31, 2004 (cont.)
| | | | | | |
| | | SHARES | | VALUE | |
Short Term Investment (Cost $137,572,961) 17.2% | | | | | | |
bFranklin Institutional Fiduciary Trust Money Market Portfolio | | 137,572,961 | | $ | 137,572,961 | |
| | | | |
|
|
|
Total Investments (Cost $619,959,623) 100.0% | | | | | 799,222,822 | |
Other Assets, less Liabilities | | | | | (60,137 | ) |
| | | | |
|
|
|
Net Assets 100.0% | | | | $ | 799,162,685 | |
| | | | |
|
|
|
| b | See Note 7 regarding investments in Franklin Institutional Fiduciary Trust Money Market Portfolio. |
See notes to financial statements.
FSV-13
FRANKLIN TEMPLETON VARIABLE INSURANCE PRODUCTS TRUST
FRANKLIN SMALL CAP VALUE SECURITIES FUND
Financial Statements
Statement of Assets and Liabilities
December 31, 2004
| | | |
Assets: | | | |
Investments in securities: | | | |
Cost - Unaffiliated issuers | | $ | 482,386,662 |
Cost - Sweep Money Fund (Note 7) | | | 137,572,961 |
| | |
|
|
Total cost of investments | | | 619,959,623 |
| | |
|
|
Value - Unaffiliated issuers | | | 661,649,861 |
Value - Sweep Money Fund (Note 7) | | | 137,572,961 |
| | |
|
|
Total value of investments | | | 799,222,822 |
| | |
|
|
Cash | | | 273 |
Receivables: | | | |
Capital shares sold | | | 970,630 |
Dividends and Interest | | | 549,121 |
| | |
|
|
Total assets | | | 800,742,846 |
| | |
|
|
Liabilities: | | | |
Payables: | | | |
Investment securities purchased | | | 283,626 |
Capital shares redeemed | | | 710,139 |
Affiliates | | | 543,106 |
Other liabilities | | | 43,290 |
| | |
|
|
Total liabilities | | | 1,580,161 |
| | |
|
|
Net assets, at value | | $ | 799,162,685 |
| | |
|
|
Net assets consist of: | | | |
Undistributed net investment income | | $ | 7,216,675 |
Net unrealized appreciation (depreciation) | | | 179,263,199 |
Accumulated net realized gain (loss) | | | 5,886,336 |
Capital shares | | | 606,796,475 |
| | |
|
|
Net assets, at value | | $ | 799,162,685 |
| | |
|
|
Class 1: | | | |
Net assets, at value | | $ | 50,400,827 |
| | |
|
|
Shares outstanding | | | 3,180,108 |
| | |
|
|
Net asset value and offering price per share | | $ | 15.85 |
| | |
|
|
Class 2: | | | |
Net assets, at value | | $ | 748,761,858 |
| | |
|
|
Shares outstanding | | | 47,831,396 |
| | |
|
|
Net asset value and offering price per share | | $ | 15.65 |
| | |
|
|
See notes to financial statements.
FSV-14
FRANKLIN TEMPLETON VARIABLE INSURANCE PRODUCTS TRUST
FRANKLIN SMALL CAP VALUE SECURITIES FUND
Financial Statements (continued)
Statement of Operations
for the year ended December 31, 2004
| | | | |
Investment Income: | | | | |
Dividends: (net of foreign taxes of $10,740) | | | | |
Unaffiliated issuers | | $ | 11,237,373 | |
Sweep Money Fund (Note 7) | | | 744,287 | |
Interest | | | 17,978 | |
| | |
|
|
|
Total investment income | | | 11,999,638 | |
| | |
|
|
|
Expenses: | | | | |
Management fees (Note 3) | | | 2,627,669 | |
Administrative fees (Note 3) | | | 744,127 | |
Distribution fees - Class 2 (Note 3) | | | 1,227,967 | |
Transfer agent fees | | | 10,931 | |
Custodian fees (Note 4) | | | 10,587 | |
Reports to shareholders | | | 108,347 | |
Professional fees | | | 30,557 | |
Trustees’ fees and expenses | | | 2,985 | |
Other | | | 23,503 | |
| | |
|
|
|
Total expenses | | | 4,786,673 | |
Expense reductions (Note 4) | | | (507 | ) |
| | |
|
|
|
Net expenses | | | 4,786,166 | |
| | |
|
|
|
Net investment income | | | 7,213,472 | |
| | |
|
|
|
Realized and unrealized gains (losses): | | | | |
Net realized gain (loss) from: | | | | |
Investments | | | 10,181,755 | |
Foreign currency transactions | | | 5,364 | |
| | |
|
|
|
Net realized gain (loss) | | | 10,187,119 | |
Net change in unrealized appreciation (depreciation) on investments | | | 109,967,549 | |
| | |
|
|
|
Net realized and unrealized gain (loss) | | | 120,154,668 | |
| | |
|
|
|
Net increase (decrease) in net assets resulting from operations | | $ | 127,368,140 | |
| | |
|
|
|
See notes to financial statements.
FSV-15
FRANKLIN TEMPLETON VARIABLE INSURANCE PRODUCTS TRUST
FRANKLIN SMALL CAP VALUE SECURITIES FUND
Financial Statements (continued)
Statements of Changes in Net Assets
for the years ended December 31, 2004 and 2003
| | | | | | | | |
| | | 2004 | | | 2003 | |
| | |
| |
Increase (decrease) in net assets: | | | | | | | | |
Operations: | | | | | | | | |
Net investment income | | $ | 7,213,472 | | | $ | 950,559 | |
Net realized gain (loss) from investments and foreign currency transactions | | | 10,187,119 | | | | (2,905,825 | ) |
Net change in unrealized appreciation (depreciation) on investments | | | 109,967,549 | | | | 79,386,021 | |
| | |
| |
Net increase (decrease) in net assets resulting from operations | | | 127,368,140 | | | | 77,430,755 | |
Distributions to shareholders from: | | | | | | | | |
Net investment income: | | | | | | | | |
Class 1 | | | (113,146 | ) | | | (92,314 | ) |
Class 2 | | | (836,847 | ) | | | (419,082 | ) |
| | |
| |
Total distributions to shareholders | | | (949,993 | ) | | | (511,396) | |
Capital share transactions: (Note 2) | | | | | | | | |
Class 1 | | | 4,172,805 | | | | (270,231 | ) |
Class 2 | | | 297,839,236 | | | | 140,061,392 | |
| | |
| |
Total capital share transactions | | | 302,012,041 | | | | 139,791,161 | |
Net increase (decrease) in net assets | | | 428,430,188 | | | | 216,710,520 | |
Net assets: | | | | | | | | |
Beginning of year | | | 370,732,497 | | | | 154,021,977 | |
| | |
| |
End of year | | $ | 799,162,685 | | | $ | 370,732,497 | |
| | |
| |
Undistributed net investment income included in net assets: | | | | | | | | |
End of year | | $ | 7,216,675 | | | $ | 947,707 | |
| | |
| |
See notes to financial statements.
FSV-16
FRANKLIN TEMPLETON VARIABLE INSURANCE PRODUCTS TRUST
FRANKLIN SMALL CAP VALUE SECURITIES FUND
Notes to Financial Statements
1. ORGANIZATION AND SIGNIFICANT ACCOUNTING POLICIES
Franklin Templeton Variable Insurance Products Trust (the Trust) is registered under the Investment Company Act of 1940 as an open-end investment company, consisting of twenty-one separate series (the Funds). The Franklin Small Cap Value Securities Fund (the Fund) included in this report is non-diversified. The financial statements of the remaining Funds in the series are presented separately. Shares of the Fund are sold only to insurance company separate accounts to fund the benefits of variable life insurance policies or variable annuity contracts. The Fund’s investment objective is total return.
The following summarizes the Fund’s significant accounting policies.
a. Security Valuation
Securities listed on a securities exchange or on the NASDAQ National Market System are valued at the last quoted sale price or the official closing price of the day, respectively. Over-the-counter securities and listed securities for which there is no reported sale are valued within the range of the most recent quoted bid and ask prices. Securities that trade in multiple markets or on multiple exchanges are valued according to the broadest and most representative market. Investments in open-end mutual funds are valued at the closing net asset value.
Corporate debt securities generally trade in the over-the-counter market rather than on a securities exchange. The Trust may utilize independent pricing services, quotations from bond dealers, and information with respect to bond and note transactions, to assist in determining a current market value for each security. The Trust’s pricing services may use valuation models or matrix pricing which considers information with respect to comparable bond and note transactions, quotations from bond dealers, or by reference to other securities that are considered comparable in such characteristics as rating, interest rate and maturity date, option adjusted spread models, prepayment projections, interest rate spreads and yield curves, to determine current value.
Foreign securities are valued as of the close of trading on the foreign stock exchange on which the security is primarily traded, or the NYSE, whichever is earlier. The value is then converted into its U.S. dollar equivalent at the foreign exchange rate in effect at the close of the NYSE on the day that the value of the foreign security is determined. If no sale is reported at that time, the foreign security will be valued within the range of the most recent quoted bid and ask prices.
The Trust has procedures to determine the fair value of individual securities and other assets for which market prices are not readily available or which may not be reliably priced. Some methods for valuing these securities may include: fundamental analysis, matrix pricing, discounts from market prices of similar securities, or discounts applied due to the nature and duration of restrictions on the disposition of the securities. Occasionally, events occur between the time at which trading in a security is completed and the close of the NYSE that might call into question the availability (including the reliability) of the value of a portfolio security held by the Fund. If such an event occurs, the securities may be valued using fair value procedures, which may include the use of independent pricing services. All security valuation procedures are approved by the Trust’s Board of Trustees.
b. Foreign Currency Translation
Portfolio securities and other assets and liabilities denominated in foreign currencies are translated into U.S. dollars based on the exchange rate of such currencies against U.S. dollars on the date of valuation. Purchases and sales of securities, income and expense items denominated in foreign currencies are translated into U.S. dollars at the exchange rate in effect on the transaction date. Occasionally events may impact the availability or reliability of foreign exchange rates used to convert the U.S. dollar equivalent value. If such an event occurs, the foreign exchange rate will be valued at fair value using procedures established and approved by the Trust’s Board of Trustees.
The Fund does not separately report the effect of changes in foreign exchange rates from changes in market prices on securities held. Such changes are included in net realized and unrealized gain or loss from investments on the Statement of Operations.
Realized foreign exchange gains or losses arise from sales of foreign currencies, currency gains or losses realized between the trade and settlement dates on securities transactions and the difference between the recorded amounts of dividends, interest, and
FSV-17
FRANKLIN TEMPLETON VARIABLE INSURANCE PRODUCTS TRUST
FRANKLIN SMALL CAP VALUE SECURITIES FUND
Notes to Financial Statements (continued)
1. ORGANIZATION AND SIGNIFICANT ACCOUNTING POLICIES (cont.)
foreign withholding taxes and the U.S. dollar equivalent of the amounts actually received or paid. Net unrealized foreign exchange gains and losses arise from changes in foreign exchange rates on foreign denominated assets and liabilities other than investments in securities held at the end of the reporting period.
c. Income Taxes
No provision has been made for U.S. income taxes because the Fund’s policy is to qualify as a regulated investment company under Sub Chapter M of the Internal Revenue Code and to distribute substantially all of its taxable income. Fund distributions to shareholders are determined on an income tax basis and may differ from net investment income and realized gains for financial reporting purposes.
d. Security Transactions, Investment Income, Expenses and Distributions
Security transactions are accounted for on trade date. Realized gains and losses on security transactions are determined on a specific identification basis. Interest income and estimated expenses are accrued daily. Discounts and premiums on securities purchased are amortized over the lives of the respective securities. Dividend income and distributions to shareholders are recorded on the ex-dividend date.
Common expenses incurred by the Trust are allocated among the funds based on the ratio of net assets of each fund to the combined net assets. Other expenses are charged to each fund on a specific identification basis.
Distributions received by the Fund from securities may be a return of capital (ROC). Such distributions reduce the cost basis of the securities, and any distributions in excess of the cost basis are recognized as capital gains.
Realized and unrealized gains and losses and net investment income, other than class specific expenses, are allocated daily to each class of shares based upon the relative proportion of net assets of each class.
e. Accounting Estimates
The preparation of financial statements in accordance with accounting principles generally accepted in the United States of America requires management to make estimates and assumptions that affect the reported amounts of assets and liabilities at the date of the financial statements and the amounts of income and expenses during the reporting period. Actual results could differ from those estimates.
f. Guarantees and Indemnifications
Under the Trust’s organizational documents, its officers and trustees are indemnified by the Trust against certain liability arising out of the performance of their duties to the Trust. Additionally, in the normal course of business, the Trust enters into contracts with service providers that contain general indemnification clauses. The Trust’s maximum exposure under these arrangements is unknown as this would involve future claims that may be made against the Trust that have not yet occurred. However, based on experience, the Trust expects the risk of loss to be remote.
FSV-18
FRANKLIN TEMPLETON VARIABLE INSURANCE PRODUCTS TRUST
FRANKLIN SMALL CAP VALUE SECURITIES FUND
Notes to Financial Statements (continued)
2. SHARES OF BENEFICIAL INTEREST
The Fund offers two classes of shares: Class 1 and Class 2. Each class of shares differs by its distribution fees, voting rights on matters affecting a single class and its exchange privilege.
At December 31, 2004, there were an unlimited number of shares authorized ($.01 par value). Transactions in the Fund’s shares were as follows:
| | | | | | | | | | | | | | |
| | | Year Ended December 31,
| |
| | | 2004
| | | 2003
| |
| Class 1 Shares: | | Shares
| | | Amount
| | | Shares
| | | Amount
| |
Shares sold | | 846,922 | | | $ | 11,790,300 | | | 535,888 | | | $ | 5,992,067 | |
Shares issued in reinvestment of distributions | | 8,375 | | | | 113,146 | | | 8,652 | | | | 92,314 | |
Shares redeemed | | (571,134 | ) | | | (7,730,641 | ) | | (608,775 | ) | | | (6,354,612 | ) |
| | |
| |
Net increase (decrease) | | 284,163 | | | $ | 4,172,805 | | | (64,235 | ) | | $ | (270,231 | ) |
| | |
| |
| Class 2 Shares: | | | | | | | | | | | | |
Shares sold | | 25,921,172 | | | $ | 357,649,617 | | | 16,349,327 | | | $ | 172,717,267 | |
Shares issued in reinvestment of distributions | | 62,638 | | | | 836,847 | | | 39,648 | | | | 419,082 | |
Shares redeemed | | (4,475,396 | ) | | | (60,647,228 | ) | | (3,103,212 | ) | | | (33,074,957 | ) |
| | |
| |
Net increase (decrease) | | 21,508,414 | | | $ | 297,839,236 | | | 13,285,763 | | | $ | 140,061,392 | |
| | |
| |
3. TRANSACTIONS WITH AFFILIATES
Certain officers and trustees of the Fund are also officers and/or directors of the following entities:
| | |
| Entity | | Affiliation |
Franklin Advisory Services LLC (Advisory Services) | | Investment manager |
Franklin Templeton Services LLC (FT Services) | | Administrative manager |
Franklin Templeton Distributors Inc. (Distributors) | | Principal underwriter |
Franklin Templeton Investor Services LLC (Investor Services) | | Transfer agent |
a. Management Fees
The Fund pays an investment management fee to Advisory Services based on the average daily net assets of the Fund as follows:
| | |
| Annualized Fee Rate | | Net Assets |
| .600% | | First $200 million |
| .500% | | Over $200 million, up to and including $1.3 billion |
| .400% | | Over $1.3 billion |
b. Administrative Fees
The Fund pays an administrative fee to FT Services based on the average daily net assets of the Fund as follows:
| | |
| Annualized Fee Rate | | Net Assets |
| .150% | | First $200 million |
| .135% | | Over $200 million, up to and including $700 million |
| .100% | | Over $700 million, up to and including $1.2 billion |
Fees are further reduced on net assets over $1.2 billion.
FSV-19
FRANKLIN TEMPLETON VARIABLE INSURANCE PRODUCTS TRUST
FRANKLIN SMALL CAP VALUE SECURITIES FUND
Notes to Financial Statements (continued)
3. TRANSACTIONS WITH AFFILIATES (cont.)
c. Distribution Fees
The Fund reimburses Distributors up to .25% per year of its average daily net assets of Class 2, for costs incurred in marketing the Fund’s shares under a Rule 12b-1 plan. Under the distribution plan, costs exceeding the maximum for the current plan year cannot be reimbursed in subsequent periods.
d. Transfer Agent Fees
Investor Services, under terms of an agreement, performs shareholder servicing for the Fund and is not paid by the Fund for the services.
4. EXPENSE OFFSET ARRANGEMENT
The Fund has entered into an arrangement with its custodian whereby credits realized as a result of uninvested cash balances are used to reduce a portion of the Fund’s custodian expenses. During the year ended December 31, 2004, the custodian fees were reduced as noted in the Statement of Operations.
5. INCOME TAXES
The tax character of distributions paid during the years ended December 31, 2004 and 2003, was as follows:
| | | | | | |
| | | 2004
| | 2003
|
Distributions paid from ordinary income | | $ | 949,993 | | $ | 511,396 |
Net investment income differs for financial statement and tax purposes primarily due to differing treatments of foreign currency transactions and bond discounts and premiums.
Net realized gains (losses) differ for financial statement and tax purposes primarily due to differing treatments of wash sales, foreign currency transactions and bond discounts and premiums.
At December 31, 2004, the cost of investments, net unrealized appreciation (depreciation), undistributed ordinary income and undistributed long term capital gains for income tax purposes were as follows:
| | | | |
Cost of investments | | $ | 620,100,377 | |
| | |
|
|
|
Unrealized appreciation | | $ | 185,012,167 | |
Unrealized depreciation | | | (5,889,722 | ) |
| | |
|
|
|
Net unrealized appreciation (depreciation) | | $ | 179,122,445 | |
| | |
|
|
|
Undistributed ordinary income | | $ | 7,216,348 | |
Undistributed long term capital gains | | | 6,027,417 | |
| | |
|
|
|
Distributable earnings | | $ | 13,243,765 | |
| | |
|
|
|
FSV-20
FRANKLIN TEMPLETON VARIABLE INSURANCE PRODUCTS TRUST
FRANKLIN SMALL CAP VALUE SECURITIES FUND
Notes to Financial Statements (continued)
6. INVESTMENT TRANSACTIONS
Purchases and sales of investments (excluding short-term securities) for the year ended December 31, 2004 aggregated $255,075,550 and $44,621,814, respectively.
7. INVESTMENT IN AFFILIATED MONEY MARKET PORTFOLIO
The Fund may invest in the Franklin Institutional Fiduciary Trust Money Market Portfolio (the Sweep Money Fund), an open-end investment company managed by Franklin Advisers Inc. (an affiliate of the investment manager.) Management fees paid by the Fund are reduced on assets invested in the Sweep Money Fund, in an amount not to exceed the management fees paid by the Sweep Money Fund.
8. REGULATORY MATTERS
Investigations
As part of various investigations by a number of federal, state, and foreign regulators and governmental entities, including the Securities and Exchange Commission (“SEC”), the California Attorney General’s Office (“CAGO”), and the National Association of Securities Dealers, Inc. (“NASD”), relating to certain practices in the mutual fund industry, including late trading, market timing and marketing support payments to securities dealers who sell fund shares, Franklin Resources, Inc. and certain of its subsidiaries (as used in this section, together, the “Company”), as well as certain current or former executives and employees of the Company, received subpoenas and/or requests for documents, information and/or testimony. The Company and its current employees provided documents and information in response to those requests and subpoenas.
Settlements
Beginning in August 2004, the Company entered into settlements with certain regulators investigating the mutual fund industry practices noted above. The Company believes that settlement of each of the matters described in this section is in the best interest of the Company and shareholders of the Franklin, Templeton, and Mutual Series mutual funds (the “funds”).
On August 2, 2004, Franklin Resources, Inc. announced that its subsidiary, Franklin Advisers, Inc., reached an agreement with the SEC that resolved the issues resulting from the SEC investigation into market timing activity. In connection with that agreement, the SEC issued an “Order Instituting Administrative and Cease-and-Desist Proceedings Pursuant to Sections 203(e) and 203(k) of the Investment Advisers Act of 1940 and Sections 9(b) and 9(f) of the Investment Company Act of 1940, Making Findings and Imposing Remedial Sanctions and a Cease-and-Desist Order” (the “Order”). The SEC’s Order concerned the activities of a limited number of third parties that ended in 2000 and those that were the subject of the first Massachusetts administrative complaint described below.
Under the terms of the SEC’s Order, pursuant to which Franklin Advisers, Inc. neither admitted nor denied any of the findings contained therein, Franklin Advisers, Inc. agreed to pay $50 million, of which $20 million is a civil penalty, to be distributed to shareholders of certain funds in accordance with a plan to be developed by an independent distribution consultant. At this time, it is unclear which funds or which shareholders of any particular fund will receive distributions. The Order also required Franklin Advisers, Inc. to, among other things, enhance and periodically review compliance policies and procedures.
On September 20, 2004, Franklin Resources, Inc. announced that two of its subsidiaries, Franklin Advisers, Inc. and Franklin Templeton Alternative Strategies, Inc. (“FTAS”), reached an agreement with the Securities Division of the Office of the Secretary of the Commonwealth of Massachusetts (the “State of Massachusetts”) related to its administrative complaint filed on February 4, 2004, concerning one instance of market timing that was also a subject of the August 2, 2004 settlement that Franklin Advisers, Inc. reached with the SEC, as described above.
FSV-21
FRANKLIN TEMPLETON VARIABLE INSURANCE PRODUCTS TRUST
FRANKLIN SMALL CAP VALUE SECURITIES FUND
Notes to Financial Statements (continued)
8. REGULATORY MATTERS (cont.)
Settlements (cont.)
Under the terms of the settlement consent order issued by the State of Massachusetts, Franklin Advisers, Inc. and FTAS consented to the entry of a cease-and-desist order and agreed to pay a $5 million administrative fine to the State of Massachusetts (the “Massachusetts Consent Order”). The Massachusetts Consent Order included two different sections: “Statements of Fact” and “Violations of Massachusetts Securities Laws.” Franklin Advisers, Inc. and FTAS admitted the facts in the Statements of Fact.
On October 25, 2004, the State of Massachusetts filed a second administrative complaint, alleging that Franklin Resources, Inc.’s Form 8-K filing (in which it described the Massachusetts Consent Order and stated that “Franklin did not admit or deny engaging in any wrongdoing”) failed to state that Franklin Advisers, Inc. and FTAS admitted the Statements of Fact portion of the Massachusetts Consent Order (the “Second Complaint”). Franklin Resources, Inc. reached a second agreement with the State of Massachusetts on November 19, 2004, resolving the Second Complaint. As a result of the November 19, 2004 settlement, Franklin Resources, Inc. filed a new Form 8-K. The terms of the Massachusetts Consent Order did not change and there was no monetary fine associated with this second settlement.
On November 17, 2004, Franklin Resources, Inc. announced that Franklin/Templeton Distributors, Inc. (“FTDI”) reached an agreement with the CAGO, resolving the issues resulting from the CAGO’s investigation concerning sales and marketing support payments. Under the terms of the settlement, FTDI neither admitted nor denied the allegations in the CAGO’s complaint and agreed to pay $2 million to the State of California as a civil penalty, $14 million to the funds, to be allocated by an independent distribution consultant to be paid for by FTDI, and $2 million to the CAGO for its investigative costs.
On December 13, 2004, Franklin Resources, Inc. announced that its subsidiaries FTDI and Franklin Advisers, Inc. reached an agreement with the SEC, resolving the issues resulting from the SEC’s investigation concerning marketing support payments to securities dealers who sell fund shares. In connection with that agreement, the SEC issued an “Order Instituting Administrative and Cease-and-Desist Proceedings, Making Findings, and Imposing Remedial Sanctions Pursuant to Sections 203(e) and 203(k) of the Investment Advisers Act of 1940, Sections 9(b) and 9(f) of the Investment Company Act of 1940, and Section 15(b) of the Securities Exchange Act of 1934” (the “Second Order”).
Under the terms of the Second Order, in which FTDI and Franklin Advisers, Inc. neither admitted nor denied the findings contained therein, they agreed to pay the funds a penalty of $20 million and disgorgement of $1 (one dollar). FTDI and Franklin Advisers, Inc. also agreed to implement certain measures and undertakings relating to marketing support payments to broker-dealers for the promotion or sale of fund shares, including making additional disclosures in the funds’ Prospectuses and Statements of Additional Information. The Second Order further requires the appointment of an independent distribution consultant, at the Company’s expense, who shall develop a plan for the distribution of the penalty and disgorgement to the funds.
Other Legal Proceedings
The Trust, in addition to the Company and other funds, and certain current and former officers, employees, and directors have been named in multiple lawsuits in different federal courts in Nevada, California, Illinois, New York and Florida, alleging violations of various federal securities laws and seeking, among other relief, monetary damages, restitution, removal of fund trustees, directors, advisers, administrators, and distributors, rescission of management contracts and 12b-1 Plans, and/or attorneys’ fees and costs. Specifically, the lawsuits claim breach of duty with respect to alleged arrangements to permit market timing and/or late trading activity, or breach of duty with respect to the valuation of the portfolio securities of certain Templeton funds managed by Franklin Resources, Inc. subsidiaries, resulting in alleged market timing activity. The majority of these lawsuits duplicate, in whole or in part, the allegations asserted in the February 4, 2004 Massachusetts administrative complaint and the findings in the SEC’s August 2, 2004 Order, as described above. The lawsuits are styled as class actions, or derivative actions on behalf of either the named funds or Franklin Resources, Inc.
FSV-22
FRANKLIN TEMPLETON VARIABLE INSURANCE PRODUCTS TRUST
FRANKLIN SMALL CAP VALUE SECURITIES FUND
Notes to Financial Statements (continued)
8. REGULATORY MATTERS (cont.)
Other Legal Proceedings (cont.)
In addition, the Company, as well as certain current and former officers, employees, and directors, have been named in multiple lawsuits alleging violations of various securities laws and pendent state law claims relating to the disclosure of directed brokerage payments and/or payment of allegedly excessive advisory, commission, and distribution fees, and seeking, among other relief, monetary damages, restitution, rescission of advisory contracts, including recovery of all fees paid pursuant to those contracts, an accounting of all monies paid to the named advisers, declaratory relief, injunctive relief, and/or attorneys’ fees and costs. These lawsuits are styled as class actions or derivative actions brought on behalf of certain funds.
The Company and fund management strongly believes that the claims made in each of the lawsuits identified above are without merit and intends to vigorously defend against them. The Company cannot predict with certainty, however, the eventual outcome of the remaining governmental investigations or private lawsuits, nor whether they will have a material negative impact on the Company. Public trust and confidence are critical to the Company’s business and any material loss of investor and/or client confidence could result in a significant decline in assets under management by the Company, which would have an adverse effect on the Company’s future financial results. If the Company finds that it bears responsibility for any unlawful or inappropriate conduct that caused losses to the Trust, it is committed to making the Trust or its shareholders whole, as appropriate. The Company is committed to taking all appropriate actions to protect the interests of its funds’ shareholders.
FSV-23
FRANKLIN TEMPLETON VARIABLE INSURANCE PRODUCTS TRUST
FRANKLIN SMALL CAP VALUE SECURITIES FUND
Report of Independent Registered Public Accounting Firm
To the Trustees and Shareholders of
Franklin Templeton Variable Insurance Products Trust
In our opinion, the accompanying statement of assets and liabilities, including the statement of investments, and the related statements of operations and of changes in net assets and the financial highlights present fairly, in all material respects, the financial position of Franklin Small Cap Value Securities Fund (the Fund) (one of the funds constituting Franklin Templeton Variable Insurance Products Trust) at December 31, 2004, the results of its operations for the year then ended, the changes in its net assets for each of the two years in the period then ended and the financial highlights for each of the five years in the period then ended, in conformity with accounting principles generally accepted in the United States of America. These financial statements and financial highlights (hereafter referred to as “financial statements”) are the responsibility of the Fund’s management; our responsibility is to express an opinion on these financial statements based on our audits. We conducted our audits of these financial statements in accordance with the standards of the Public Company Accounting Oversight Board (United States). Those standards require that we plan and perform the audits to obtain reasonable assurance about whether the financial statements are free of material misstatement. An audit includes examining, on a test basis, evidence supporting the amounts and disclosures in the financial statements, assessing the accounting principles used and significant estimates made by management, and evaluating the overall financial statement presentation. We believe that our audits, which included confirmation of securities at December 31, 2004 by correspondence with the custodian and brokers, provide a reasonable basis for our opinion.
PricewaterhouseCoopers LLP
San Francisco, California
February 9, 2005
FSV-24
FRANKLIN TEMPLETON VARIABLE INSURANCE PRODUCTS TRUST
FRANKLIN SMALL CAP VALUE SECURITIES FUND
Tax Designation (unaudited)
Under Section 854(b)(2) of the Internal Revenue Code (Code), the Fund hereby designates 100% of the ordinary income dividends as income qualifying for the dividends received deduction for the fiscal year ended December 31, 2004.
Under Section 852(b)(3)(C) of the Code, the Fund hereby designates $6,027,417 as a capital gain dividend for the fiscal year ended December 31, 2004.
FSV-25
FRANKLIN STRATEGIC INCOME SECURITIES FUND
We are pleased to bring you Franklin Strategic Income Securities Fund’s annual report for the fiscal year ended December 31, 2004.
Performance Summary as of 12/31/04
Average annual total return of Class 2 shares* represents the average annual change in value, assuming reinvestment of dividends and capital gains. Average returns smooth out variations in returns, which can be significant; they are not the same as year-by-year results.
Periods ended 12/31/04
| | | | | | |
| | | 1-Year | | 5-Year | | Since
Inception
(7/1/99) |
Average Annual Total Return | | +9.80% | | +8.56% | | +8.25% |
*Because Class 2 shares were not offered until 5/15/01, standardized Class 2 Fund performance for prior periods represents the historical results of Class 1 shares. For periods beginning on 5/15/01, Class 2’s results reflect an additional 12b-1 fee expense, which also affects future performance. Since 5/15/01 (effective date), the average annual total return of Class 2 shares was +9.74%.
Total Return Index Comparison for Hypothetical $10,000 Investment (7/1/99–12/31/04)
The graph below shows the change in value of a hypothetical $10,000 investment in the Fund over the indicated period and includes reinvestment of any income or distributions. The Fund’s performance* is compared to the performance of the Lehman Brothers (LB) U.S. Aggregate Index and the Lipper Multi-Sector Income Funds Objective Average. One cannot invest directly in an index, nor is an index representative of the Fund’s portfolio. Please see Important Notes to Performance Information preceding the Fund Summaries.
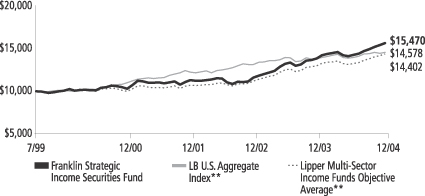
**Sources: Standard & Poor’s Micropal; Lipper Inc. Please see Index Descriptions following the Fund Summaries.
Franklin Strategic Income Securities Fund – Class 2
Performance reflects the Fund’s Class 2 operating expenses, but does not include any contract fees, expenses or sales charges. If they had been included, performance would be lower. These charges and deductions, particularly for variable life policies, can have a significant effect on contract values and insurance benefits. See the contract prospectus for a complete description of these expenses, including sales charges.
Performance data quoted represent past performance, which does not guarantee future results. Investment return and principal value will fluctuate, and you may have a gain or loss when you sell your shares. Current performance may differ from figures shown.
FSI-1
Fund Goals and Main Investments: Franklin Strategic Income Securities Fund seeks a high level of current income, with capital appreciation over the long term as a secondary goal. The Fund invests mainly in U.S. and foreign debt securities, including those in emerging markets.
Performance Overview
You can find the Fund’s one-year total return in the Performance Summary. Compared with its benchmarks for the same period, the Fund outperformed the LB U.S. Aggregate Index’s 4.34% return, and the Lipper Multi-Sector Income Funds Objective Average’s 8.35% return.1
Economic and Market Overview
During the year under review, there was much focus on the employment picture and its resulting effects on the consumer. Although nonfarm payroll statistics were mixed, stronger employment growth fundamentals were reflected in several sources. One was the National Federation of Independent Businesses (NFIB) survey, which was notable because small businesses historically have created about two-thirds of all new jobs.2 During the period under review, more jobs combined with income tax reductions helped increase consumers’ disposable income and allowed them to continue spending, in turn boosting economic growth.
Increases in business spending also contributed to economic growth. After steadily declining in 2001 and 2002, business spending posted strong results during 2004. For example, nonresidential investment spending rose 10.3% for the year.3 Historically low interest rates during the reporting period allowed many businesses the opportunity to refinance their old debt at more attractive levels. This helped enhance business operating performance, and corporate profits reflected this data. Many corporate debt investments also benefited from this improvement. Productivity continued to grow, which helped businesses generate more goods and services without substantially raising inflation.
1. Sources: Standard & Poor’s Micropal; Lipper, Inc. One cannot invest directly in an index, nor is an index representative of the Fund’s portfolio. Please see Index Descriptions following the Fund Summaries.
2. Source: Dennis, William J., Jr., NFIB Research Foundation, “The Public Reviews Small Business,” 8/04.
3. Source: Bureau of Economic Analysis.
Fund Risks: Bonds and other debt obligations are affected by changes in interest rates and the creditworthiness of their issuers. High yield, lower-rated (junk) bonds generally have greater price swings and higher default risks. Foreign investing involves special risks including currency fluctuations, economic instability, and social and political developments. Emerging markets involve heightened risks. The Fund’s prospectus also includes a description of the main investment risks.
FSI-2
Energy prices rose substantially during the year, and then declined toward the end, as oil ended the year at approximately $43 a barrel. In an effort to keep inflation in check, the Federal Reserve Board raised the federal funds target rate to 2.25% from 1.00% during the reporting period. However, the core Consumer Price Index, a measure of inflation excluding food and energy costs, rose a relatively modest 2.2% for the 12 months ended December 31, 2004, and helped contribute to the continued low interest rate level during the period.4 Many analysts had expected the 10-year U.S. Treasury yield to increase significantly; however, it ended the year relatively flat. This yield began the year at 4.27%, rose to a high of 4.89% and declined to 4.24% on December 31, 2004. In this environment, Treasury-sensitive fixed-income sectors posted positive total returns.
Global economic growth over the past year solidified, led by the U.S. and Asia, although it slowed somewhat since the first quarter. Although inflation rates remained relatively low, inflationary pressures began to build in some regions partly due to elevated oil and commodity prices. Despite strong growth, global bond markets generated positive returns as global treasury yield curves flattened and most major currencies appreciated relative to the U.S. dollar.
Investment Strategy
We allocate our investments among the various types of debt available based on our assessment of changing economic, global market, industry, and issuer conditions. We use a top-down analysis of macroeconomic trends, combined with a bottom-up fundamental analysis of market sectors, industries and issuers to take advantage of varying sector reactions to economic events. For example, we evaluate business cycles, yield curves, country risk, and the relative interest rates among currencies, and values between and within markets. In selecting debt securities, we conduct our own analysis of the security’s intrinsic value rather than simply relying on the coupon rate or rating.
Manager’s Discussion
Two of the best performing sectors of 2004 were high yield corporate bonds and dollar-denominated emerging market debt, largely due to improving credit fundamentals. Non-dollar global government bonds also fared well as a result of significant, ongoing U.S. dollar weakness.
FSI-3
The Fund’s outperformance relative to its benchmarks was driven by our heavy weightings in the high yield corporate and non-dollar government bond sectors. For high yield bonds, the supportive fundamental credit trends that emerged in 2003 continued in 2004, with default rates moving lower, operating results showing year-over-year improvements, and corporate liquidity remaining strong. As a result, high yield corporate bond spreads over Treasuries, a common valuation metric in that market, declined from 4.9% on December 31, 2003, to 3.5% by period-end, driving the asset class’s solid performance.
High yield bonds represented the Fund’s largest sector weighting throughout the period, given our favorable view on corporate credit fundamentals. Emerging market bonds rebounded from a spring 2004 sell-off and posted strong results through period-end. In general, relative political stability, access to capital markets (the ability to raise money by issuing debt) and, for certain countries, higher revenues from rising oil prices, also caused yield spreads to narrow for this sector compared to Treasuries. The Fund maintained a more moderate exposure to U.S. dollar-denominated emerging market bonds during this reporting period than in the previous period, however, considering spreads that were near historically tight levels.
Non-dollar government bonds represented the Fund’s second-largest sector exposure in 2004. The growing U.S. fiscal and current account deficits required increasing levels of domestic and foreign funding to cover the shortfalls, and investors grew more concerned about the potential risk of foreign governments and institutions pulling back on their level of investment in U.S. securities. Therefore, the U.S. dollar’s continuing weakness versus various foreign currencies led to relatively robust returns from international foreign currency government bonds (in both developed and developing markets). Consequently, the Fund’s non-dollar foreign government bond positions, in developed countries such as in Europe, Australia and New Zealand as well as in certain emerging markets such as Hungary, Poland and South Korea, provided relatively solid returns during the year under review.
Within the Fund’s portfolio, we held lower weightings in the more interest-rate sensitive fixed income sectors such as U.S. government bonds and mortgage-backed securities, as we found investment opportunities we felt were more attractive among other sectors. However, we held a somewhat larger exposure to mortgage- and other asset-backed securities than U.S. government securities because we favored the additional yield the former offered over the latter. We also initiated
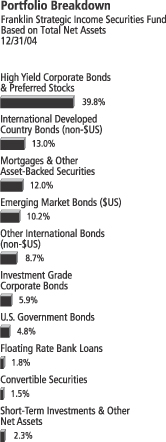
The dollar value, number of shares or principal amount, and names of all portfolio holdings are listed in the Fund’s Statement of Investments.
FSI-4
positions in floating-rate instruments within the emerging market and bank loan sectors as we sought to take advantage of any future short-term interest rate increases that could enhance total return potential for these types of investments.
Thank you for your participation in Franklin Strategic Income Securities Fund. We look forward to serving your future investment needs.
The foregoing information reflects our analysis, opinions and portfolio holdings as of December 31, 2004, the end of the reporting period. The way we implement our main investment strategies and the resulting portfolio holdings may change depending on factors such as market and economic conditions. These opinions may not be relied upon as investment advice or an offer for a particular security. The information is not a complete analysis of every aspect of any market, country, industry, security or the Fund. Statements of fact are from sources considered reliable, but the adviser makes no representation or warranty as to their completeness or accuracy. Although historical performance is no guarantee of future results, these insights may help you understand our investment management philosophy.
FSI-5
Fund Expenses
As an investor in a variable insurance contract (“Contract”) that indirectly provides for investment in an underlying mutual fund, you can incur transaction and/or ongoing expenses at both the Fund level and the Contract level.
| • | | Transaction expenses can include sales charges (loads) on purchases, redemption fees, surrender fees, transfer fees and premium taxes. |
| • | | Ongoing expenses can include management fees, distribution and service (12b-1) fees, contract fees, annual maintenance fees, mortality and expense risk fees and other fees and expenses. All mutual funds and Contracts have some types of ongoing expenses. |
The expenses shown in the table below are meant to highlight ongoing expenses at the Fund level only and do not include ongoing expenses at the Contract level, or transaction expenses at either the Fund or Contract levels. While the Fund does not have transaction expenses, if the transaction and ongoing expenses at the Contract level were included, the expenses shown below would be higher. You should consult your Contract prospectus or disclosure document for more information.
The table shows Fund-level ongoing expenses and can help you understand these expenses and compare them with those of other mutual funds offered through the Contract. The table assumes a $1,000 investment held for the six months indicated. Please refer to the Fund prospectus for additional information on operating expenses.
Actual Fund Expenses
The first line (Actual) for each share class listed in the table below provides actual account values and expenses. The “Ending Account Value” is derived from the Fund’s actual return, which includes the effect of ongoing Fund expenses, but does not include the effect of ongoing Contract expenses.
You can estimate the Fund-level expenses you incurred during the period, by following these steps. Of course, your account value and expenses will differ from those in this illustration:
| 1. | Divide your account value by $1,000. |
If an account had an $8,600 value, then $8,600 ÷ $1,000 = 8.6.
| 2. | Multiply the result by the number under the heading “Fund-Level Expenses Incurred During Period.” |
If Expenses Incurred During Period were $7.50, then 8.6 × $7.50 = $64.50.
Franklin Strategic Income Securities Fund – Class 2
FSI-6
In this illustration, the estimated expenses incurred this period at the Fund level are $64.50.
Hypothetical Example for Comparison with Other Mutual Funds
Information in the second line (Hypothetical) for each class in the table can help you compare ongoing expenses of the Fund with those of other mutual funds offered through the Contract. This information may not be used to estimate the actual ending account balance or expenses you incurred during the period. The hypothetical “Ending Account Value” is based on the actual expense ratio for each class and an assumed 5% annual rate of return before expenses, which does not represent the Fund’s actual return. The figure under the heading “Fund-Level Expenses Incurred During Period” shows the hypothetical expenses your account would have incurred under this scenario. You can compare this figure with the 5% hypothetical examples that appear in shareholder reports of other funds offered through a Contract.
| | | | | | | | | |
| Class 2 | | Beginning
Account
Value 6/30/04 | | Ending
Account
Value 12/31/04 | | Fund-Level
Expenses Incurred
During Period*
6/30/04-12/31/04 |
Actual | | $ | 1,000 | | $ | 1,097.90 | | $ | 4.85 |
Hypothetical (5% return before expenses) | | $ | 1,000 | | $ | 1,020.51 | | $ | 4.67 |
*Expenses are equal to the annualized expense ratio for the Fund’s Class 2 shares (0.92%), which does not include any ongoing expenses of the Contract for which the Fund is an investment option, multiplied by the average account value over the period, multiplied by 184/366 to reflect the one-half year period.
FSI-7
FRANKLIN TEMPLETON VARIABLE INSURANCE PRODUCTS TRUST
FRANKLIN STRATEGIC INCOME SECURITIES FUND
Financial Highlights
| | | | | | | | | | | | | | | | | | | | |
| | | Class 1
| |
| | | Year Ended December 31,
| |
| | | 2004 | | | 2003 | | | 2002 | | | 2001 | | | 2000 | |
| | |
|
|
|
Per share operating performance | | | | | | | | | | | | | | | | | | | | |
(for a share outstanding throughout the year) | | | | | | | | | | | | | | | | | | | | |
Net asset value, beginning of year | | $ | 12.16 | | | $ | 10.37 | | | $ | 9.87 | | | $ | 9.89 | | | $ | 9.96 | |
| | |
|
|
|
Income from investment operations: | | | | | | | | | | | | | | | | | | | | |
Net investment incomea | | | .67 | | | | .65 | | | | .73 | | | | .76 | e | | | .82 | |
Net realized and unrealized gains (losses) | | | .51 | | | | 1.44 | | | | (.23 | ) | | | (.32 | )e | | | (.33 | ) |
| | |
|
|
|
Total from investment operations | | | 1.18 | | | | 2.09 | | | | .50 | | | | .44 | | | | .49 | |
| | |
|
|
|
Less distributions from: | | | | | | | | | | | | | | | | | | | | |
Net investment income | | | (.40 | ) | | | (.30 | ) | | | — | d | | | (.46 | ) | | | (.56 | ) |
Net realized gains | | | (.02 | ) | | | — | | | | — | | | | — | | | | — | |
| | |
|
|
|
Total distributions | | | (.42 | ) | | | (.30 | ) | | | — | | | | (.46 | ) | | | (.56 | ) |
| | |
|
|
|
Net asset value, end of year | | $ | 12.92 | | | $ | 12.16 | | | $ | 10.37 | | | $ | 9.87 | | | $ | 9.89 | |
| | |
|
|
|
| | | | | |
Total returnb | | | 10.01% | | | | 20.36% | | | | 5.12% | | | | 4.51% | | | | 4.95% | |
Ratios/supplemental data | | | | | | | | | | | | | | | | | | | | |
Net assets, end of year (000’s) | | $ | 571,067 | | | $ | 359,947 | | | $ | 102,751 | | | $ | 43,778 | | | $ | 11,437 | |
Ratios to average net assets: | | | | | | | | | | | | | | | | | | | | |
Expenses | | | .66% | | | | .65% | | | | .66% | | | | .71% | | | | .99% | |
Expenses, net of waiver and payments by affiliate | | | .66% | | | | .65% | | | | .66% | | | | .71% | | | | .75% | |
Net investment income | | | 5.45% | | | | 5.69% | | | | 7.37% | | | | 7.48% | e | | | 8.13% | |
Portfolio turnover rate | | | 50.21% | | | | 49.87% | | | | 45.78% | | | | 35.21% | | | | 29.19% | |
Portfolio turnover rate excluding mortgage dollar rollsc | | | 38.39% | | | | 32.74% | | | | 40.50% | | | | 30.32% | | | | 29.19% | |
| a | Based on average daily shares outstanding. |
| b | Total return does not include any fees, charges or expenses imposed by the variable annuity and life insurance contracts for which the Franklin Templeton Variable Insurance Products Trust serves as an underlying investment vehicle. Total return is not annualized for periods less than one year. |
| c | See Note 1(e) regarding mortgage dollar rolls. |
| d | Includes distributions of net investment income in the amount of $.005. |
| e | Effective January 1, 2001, the Fund adopted the provisions of the AICPA Audit and Accounting Guide for Investment Companies and began recording all paydown gains and losses as part of the investment income and amortizing all premium and discount on fixed-income securities, as required. The effect of this change was as follows: |
| | |
Net investment income per share | | $(.018) |
Net realized and unrealized losses per share | | .018 |
Ratio of net investment income to average net assets | | (.18)% |
Per share data and ratios for prior periods have not been restated to reflect this change in accounting policy.
See notes to financial statements.
FSI-8
FRANKLIN TEMPLETON VARIABLE INSURANCE PRODUCTS TRUST
FRANKLIN STRATEGIC INCOME SECURITIES FUND
Financial Highlights (continued)
| | | | | | | | | | | | | | | | |
| | | Class 2
| |
| | | Year Ended December 31,
| |
| | | 2004 | | | 2003 | | | 2002 | | | 2001e | |
| | |
|
|
|
Per share operating performance | | | | | | | | | | | | | | | | |
(for a share outstanding throughout the year) | | | | | | | | | | | | | | | | |
Net asset value, beginning of year | | $ | 12.05 | | | $ | 10.29 | | | $ | 9.82 | | | $ | 10.14 | |
| | |
|
|
|
Income from investment operations: | | | | | | | | | | | | | | | | |
Net investment incomea | | | .63 | | | | .62 | | | | .70 | | | | .45 | f |
Net realized and unrealized gains (losses) | | | .51 | | | | 1.43 | | | | (.23 | ) | | | (.31 | )f |
| | |
|
|
|
Total from investment operations | | | 1.14 | | | | 2.05 | | | | .47 | | | | .14 | |
| | |
|
|
|
Less distributions from: | | | | | | | | | | | | | | | | |
Net investment income | | | (.39 | ) | | | (.29 | ) | | | — | d | | | (.46 | ) |
Net realized gains | | | (.02 | ) | | | — | | | | — | | | | — | |
| | |
|
|
|
Total distributions | | | (.41 | ) | | | (.29 | ) | | | — | | | | (.46 | ) |
| | |
|
|
|
Net asset value, end of year | | $ | 12.78 | | | $ | 12.05 | | | $ | 10.29 | | | $ | 9.82 | |
| | |
|
|
|
| | | | |
Total returnb | | | 9.80% | | | | 20.10% | | | | 4.81% | | | | 1.38% | |
Ratios/supplemental data | | | | | | | | | | | | | | | | |
Net assets, end of year (000’s) | | $ | 4,657 | | | $ | 1,841 | | | $ | 210 | | | $ | 48 | |
Ratios to average net assets: | | | | | | | | | | | | | | | | |
Expenses | | | .91% | | | | .90% | | | | .91% | | | | .96% | g |
Net investment income | | | 5.20% | | | | 5.44% | | | | 7.12% | | | | 7.05% | g,f |
Portfolio turnover rate | | | 50.21% | | | | 49.87% | | | | 45.78% | | | | 35.21% | |
Portfolio turnover rate excluding mortgage dollar rollsc | | | 38.39% | | | | 32.74% | | | | 40.50% | | | | 30.32% | |
| a | Based on average daily shares outstanding. |
| b | Total return does not include any fees, charges or expenses imposed by the variable annuity and life insurance contracts for which the Franklin Templeton Variable Insurance Products Trust serves as an underlying investment vehicle. Total return is not annualized for periods less than one year. |
| c | See Note 1(e) regarding mortgage dollar rolls. |
| d | Includes distributions of net investment income in the amount of $.003. |
| e | For the period May 15, 2001 (effective date) to December 31, 2001. |
| f | Effective January 1, 2001, the Fund adopted the provisions of the AICPA Audit and Accounting Guide for Investment Companies and began recording all paydown gains and losses as part of the investment income and amortizing all premium and discount on fixed-income securities, as required. The effect of this change was as follows: |
| | |
Net investment income per share | | $(.018) |
Net realized and unrealized losses per share | | .018 |
Ratio of net investment income to average net assets | | (.18)% |
Per share data and ratios for prior periods have not been restated to reflect this change in accounting policy.
See notes to financial statements.
FSI-9
FRANKLIN TEMPLETON VARIABLE INSURANCE PRODUCTS TRUST
FRANKLIN STRATEGIC INCOME SECURITIES FUND
Statement of Investments, December 31, 2004
| | | | | | | | |
| | | COUNTRY | | SHARES | | VALUE |
Preferred Stock (Cost $3,179,348) .6% | | | | | | | | |
Health Services | | | | | | | | |
Fresenius Medical Care Capital Trust II, 7.875%, 2/01/08 | | Germany | | | 3,100 | | $ | 3,371,250 |
| | | | | | | |
|
|
Convertible Preferred Stocks 1.0% | | | | | | | | |
Consumer Durables .2% | | | | | | | | |
Ford Motor Co. Capital Trust II, 6.50%, cvt. pfd. | | United States | | | 25,000 | | | 1,319,750 |
| | | | | | | |
|
|
Electronic Technology .3% | | | | | | | | |
Northrop Grumman Corp., 7.00%, cvt. pfd., B | | United States | | | 13,000 | | | 1,716,130 |
| | | | | | | |
|
|
Industrial Services .2% | | | | | | | | |
Allied Waste Industries Inc., 6.25%, cvt. pfd. | | United States | | | 17,000 | | | 896,070 |
| | | | | | | |
|
|
Utilities .3% | | | | | | | | |
FPL Group Inc., 8.50%, cvt. pfd. | | United States | | | 29,000 | | | 1,783,790 |
| | | | | | | |
|
|
Total Convertible Preferred Stocks (Cost $5,227,948) | | | | | | | | 5,715,740 |
| | | | | | | |
|
|
aSenior Floating Rate Interests 1.8% | | | | | | | | |
bConstellation Brands Inc., Term Loan B, FRN, 4.25 - 4.75%, 12/22/11 | | United States | | | 3,100,000 | | | 3,145,725 |
Jean Coutu Group PJC Inc., Term Loan B, FRN, 4.44%, 7/28/11 | | United States | | | 1,500,000 | | | 1,524,375 |
bPacificare Health Systems Inc., Term Loan B, FRN, 4.063 - 4.25%, 12/13/10 | | United States | | | 1,900,000 | | | 1,902,970 |
R. H. Donnelley Inc., Term Loan D, FRN, 4.09 - 4.31%, 6/30/11 | | United States | | | 1,895,250 | | | 1,916,768 |
Regal Cinemas Inc., Term Loan B, FRN, 4.56%, 11/10/10 | | United States | | | 1,895,226 | | | 1,915,837 |
| | | | | | | |
|
|
Total Senior Floating Rate Interests (Cost $10,376,744) | | | | | | | | 10,405,675 |
| | | | | | | |
|
|
| | | |
| | | | | PRINCIPAL
AMOUNTe
| | |
Bonds 45.1% | | | | | | | | |
Commercial Services 1.0% | | | | | | | | |
JohnsonDiversey Holdings Inc., senior disc. note, zero cpn. to 5/17/07,
10.67% thereafter, 5/15/13 | | United States | | $ | 1,200,000 | | | 1,044,000 |
JohnsonDiversey Inc., senior sub. note, B, 9.625%, 5/15/12 | | United States | | | 1,700,000 | | | 1,908,250 |
Lamar Media Corp., senior sub. note, 7.25%, 1/01/13 | | United States | | | 2,400,000 | | | 2,604,000 |
| | | | | | | |
|
|
| | | | | | | | | 5,556,250 |
| | | | | | | |
|
|
Communications 5.8% | | | | | | | | |
Centennial Communications Corp., senior note, 8.125%, 2/01/14 | | United States | | | 900,000 | | | 929,250 |
Dobson Cellular Systems Inc., secured note, 144A, 9.875%, 11/01/12 | | United States | | | 2,500,000 | | | 2,475,000 |
Inmarsat Finance PLC, senior note, 7.625%, 6/30/12 | | United Kingdom | | | 2,500,000 | | | 2,612,500 |
Intelsat Ltd., senior note, 6.50%, 11/01/13 | | Bermuda | | | 1,500,000 | | | 1,367,218 |
MCI Inc., senior note, 6.908%, 5/01/07 | | United States | | | 831,000 | | | 852,814 |
MCI Inc., senior note, 7.688%, 5/01/09 | | United States | | | 1,200,000 | | | 1,245,000 |
MCI Inc., senior note, 8.735%, 5/01/14 | | United States | | | 712,000 | | | 767,180 |
Millicom International Cellular SA, senior note, 144A, 10.00%, 12/01/13 | | Luxembourg | | | 2,400,000 | | | 2,523,000 |
Nextel Communications Inc., senior note, 7.375%, 8/01/15 | | United States | | | 3,500,000 | | | 3,867,500 |
Nextel Partners Inc., senior note, 12.50%, 11/15/09 | | United States | | | 280,000 | | | 318,500 |
PanAmSat Corp., senior note, 144A, 9.00%, 8/15/14 | | United States | | | 1,800,000 | | | 2,018,250 |
Qwest Communications International Inc., senior note, 144A, 7.50%, 2/15/14 | | United States | | | 3,100,000 | | | 3,146,500 |
Rogers Wireless Communications Inc., senior secured note, 144A, 7.25%, 12/15/12 | | Canada | | | 2,800,000 | | | 2,982,000 |
Time Warner Telecom Holdings Inc., senior note, 9.25%, 2/15/14 | | United States | | | 1,800,000 | | | 1,845,000 |
Time Warner Telecom Inc., senior note, 10.125%, 2/01/11 | | United States | | | 700,000 | | | 691,250 |
Triton PCS Inc., senior note, 8.50%, 6/01/13 | | United States | | | 2,200,000 | | | 2,134,000 |
Verizon New York Inc., senior deb., A, 6.875%, 4/01/12 | | United States | | | 3,100,000 | | | 3,484,710 |
| | | | | | | |
|
|
| | | | | | | | | 33,259,672 |
| | | | | | | |
|
|
FSI-10
FRANKLIN TEMPLETON VARIABLE INSURANCE PRODUCTS TRUST
FRANKLIN STRATEGIC INCOME SECURITIES FUND
Statement of Investments, December 31, 2004 (cont.)
| | | | | | | | | |
| | | COUNTRY | | PRINCIPAL
AMOUNTe | | | VALUE |
Bonds (cont.) | | | | | | | | | |
Consumer Durables 1.2% | | | | | | | | | |
D.R. Horton Inc., senior note, 8.50%, 4/15/12 | | United States | | $ | 3,100,000 | | | $ | 3,472,000 |
Ford Motor Credit Co., 7.25%, 10/25/11 | | United States | | | 1,300,000 | | | | 1,396,032 |
General Motors Corp., 7.20%, 1/15/11 | | United States | | | 1,000,000 | | | | 1,026,885 |
William Lyon Homes Inc., senior note, 144A, 7.625%, 12/15/12 | | United States | | | 1,200,000 | | | | 1,177,500 |
| | | | | | | | |
|
|
| | | | | | | | | | 7,072,417 |
| | | | | | | | |
|
|
Consumer Non-Durables 1.2% | | | | | | | | | |
Church & Dwight Co. Inc., senior sub note, 144A, 6.00%, 12/15/12 | | United States | | | 1,500,000 | | | | 1,533,750 |
Smithfield Foods Inc., senior note, 7.00%, 8/01/11 | | United States | | | 1,400,000 | | | | 1,501,500 |
Smithfield Foods Inc., senior note, 7.75%, 5/15/13 | | United States | | | 1,700,000 | | | | 1,899,750 |
Tyson Foods Inc., senior note, 8.25%, 10/01/11 | | United States | | | 1,800,000 | | | | 2,140,248 |
| | | | | | | | |
|
|
| | | | | | | | | | 7,075,248 |
| | | | | | | | |
|
|
Consumer Services 10.9% | | | | | | | | | |
Advanstar Communications Inc., senior secured note, 10.75%, 8/15/10 | | United States | | | 2,200,000 | | | | 2,494,250 |
Boyd Gaming Corp., senior sub. note, 6.75%, 4/15/14 | | United States | | | 2,500,000 | | | | 2,631,250 |
Cablevision Systems Corp., senior note, 144A, 8.00%, 4/15/12 | | United States | | | 1,000,000 | | | | 1,072,500 |
CanWest Media Inc., senior note, B, 7.625%, 4/15/13 | | Canada | | | 1,200,000 | | | | 1,312,500 |
CanWest Media Inc., senior sub. note, 10.625%, 5/15/11 | | Canada | | | 700,000 | | | | 789,250 |
Cendant Corp., senior note, 7.375%, 4/15/13 | | United States | | | 2,400,000 | | | | 2,780,700 |
cCentury Communications Corp., senior disc. note, B, zero cpn., 1/15/08 | | United States | | | 700,000 | | | | 493,500 |
Charter Communications Holdings II, senior note, 10.25%, 9/15/10 | | United States | | | 2,400,000 | | | | 2,556,000 |
Charter Communications Holdings LLC, senior disc. note, 9.92%, 4/01/11 | | United States | | | 700,000 | | | | 600,250 |
Clear Channel Communications Inc., senior note, 5.75%, 1/15/13 | | United States | | | 3,100,000 | | | | 3,208,215 |
Cox Communications Inc., 144A, 5.45%, 12/15/14 | | United States | | | 3,100,000 | | | | 3,105,778 |
CSC Holdings Inc., senior deb., 7.625%, 7/15/18 | | United States | | | 2,100,000 | | | | 2,231,250 |
Dex Media East LLC, senior sub. note, B, 12.125%, 11/15/12 | | United States | | | 668,000 | | | | 817,465 |
Dex Media West LLC, senior sub. note, 9.875%, 8/15/13 | | United States | | | 2,300,000 | | | | 2,662,250 |
DIRECTV Holdings LLC, senior note, 8.375%, 3/15/13 | | United States | | | 2,500,000 | | | | 2,815,625 |
EchoStar DBS Corp., senior note, 6.375%, 10/01/11 | | United States | | | 1,700,000 | | | | 1,746,750 |
Emmis Operating Co., senior sub. note, 6.875%, 5/15/12 | | United States | | | 2,500,000 | | | | 2,628,125 |
Harrah’s Operating Co. Inc., senior note, 5.50%, 7/01/10 | | United States | | | 2,800,000 | | | | 2,901,766 |
Lighthouse International Co. SA, senior note, 144A, 8.00%, 4/30/14 | | Italy | | | 2,200,000 | EUR | | | 3,089,888 |
LIN Television Corp., senior note, 8.00%, 1/15/08 | | United States | | | 1,000,000 | | | | 1,046,250 |
LIN Television Corp., senior sub. note, 6.50%, 5/15/13 | | United States | | | 1,500,000 | | | | 1,550,625 |
Marquee Inc., senior note, 144A, 8.625%, 8/15/12 | | United States | | | 1,800,000 | | | | 1,998,000 |
Park Place Entertainment Corp., senior sub. note, 9.375%, 2/15/07 | | United States | | | 2,000,000 | | | | 2,210,000 |
Pinnacle Entertainment Inc., senior sub. note, 8.75%, 10/01/13 | | United States | | | 1,600,000 | | | | 1,740,000 |
Pinnacle Entertainment Inc., senior sub. note, B, 9.25%, 2/15/07 | | United States | | | 94,000 | | | | 96,115 |
Quebecor Media Inc., senior disc. note, zero cpn. to 7/15/06, 13.75% thereafter, 7/15/11 | | Canada | | | 1,900,000 | | | | 1,890,500 |
Rainbow National Services LLC, senior sub. deb., 144A, 10.375%, 9/01/14 | | United States | | | 2,500,000 | | | | 2,831,250 |
Royal Caribbean Cruises Ltd., senior deb., 7.25%, 3/15/18 | | United States | | | 3,100,000 | | | | 3,425,500 |
Station Casinos Inc., senior note, 6.00%, 4/01/12 | | United States | | | 800,000 | | | | 819,000 |
Station Casinos Inc., senior sub. note, 6.50%, 2/01/14 | | United States | | | 400,000 | | | | 413,000 |
Station Casinos Inc., senior sub. note, 6.875%, 3/01/16 | | United States | | | 1,500,000 | | | | 1,569,375 |
Time Warner Inc., senior note, 6.75%, 4/15/11 | | United States | | | 2,800,000 | | | | 3,153,685 |
| | | | | | | | |
|
|
| | | | | | | | | | 62,680,612 |
| | | | | | | | |
|
|
Electronic Technology 1.7% | | | | | | | | | |
L-3 Communications Corp., senior sub. note, 144A, 5.875%, 1/15/15 | | United States | | | 3,100,000 | | | | 3,107,750 |
Solectron Corp., senior note, 9.625%, 2/15/09 | | United States | | | 2,800,000 | | | | 3,094,000 |
Xerox Corp., senior note, 7.125%, 6/15/10 | | United States | | | 3,100,000 | | | | 3,363,500 |
| | | | | | | | |
|
|
| | | | | | | | | | 9,565,250 |
| | | | | | | | |
|
|
FSI-11
FRANKLIN TEMPLETON VARIABLE INSURANCE PRODUCTS TRUST
FRANKLIN STRATEGIC INCOME SECURITIES FUND
Statement of Investments, December 31, 2004 (cont.)
| | | | | | | | |
| | | COUNTRY | | PRINCIPAL
AMOUNTe | | VALUE |
Bonds (cont.) | | | | | | | | |
Energy Minerals 1.8% | | | | | | | | |
Chesapeake Energy Corp., senior note, 144A, 6.375%, 6/15/15 | | United States | | $ | 3,100,000 | | $ | 3,200,750 |
Markwest Energy Partners LP, senior note, 144A, 6.875%, 11/01/14 | | United States | | | 1,500,000 | | | 1,530,000 |
Peabody Energy Corp., senior note, B, 6.875%, 3/15/13 | | United States | | | 2,700,000 | | | 2,936,250 |
Plains Exploration & Production Co., senior note, 7.125%, 6/15/14 | | United States | | | 2,700,000 | | | 2,956,500 |
| | | | | | | |
|
|
| | | | | | | | | 10,623,500 |
| | | | | | | |
|
|
Finance .6% | | | | | | | | |
JP Morgan Chase & Co., sub. note, 5.75%, 1/02/13 | | United States | | | 3,100,000 | | | 3,290,247 |
| | | | | | | |
|
|
Health Services 2.0% | | | | | | | | |
HCA Inc., senior note, 8.75%, 9/01/10 | | United States | | | 3,100,000 | | | 3,547,581 |
Tenet Healthcare Corp., senior note, 6.375%, 12/01/11 | | United States | | | 3,100,000 | | | 2,890,750 |
United Surgical Partners International Inc., senior sub. note, 10.00%, 12/15/11 | | United States | | | 1,600,000 | | | 1,832,000 |
Vanguard Health Holding Co. II LLC, senior sub. note, 144A, 9.00%, 10/01/14 | | United States | | | 2,800,000 | | | 3,010,000 |
| | | | | | | |
|
|
| | | | | | | | | 11,280,331 |
| | | | | | | |
|
|
Industrial Services 1.7% | | | | | | | | |
Allied Waste North America Inc., senior secured note, 6.50%, 11/15/10 | | United States | | | 2,400,000 | | | 2,364,000 |
Grant Prideco Escrow, senior note, 9.00%, 12/15/09 | | United States | | | 2,500,000 | | | 2,781,250 |
Hanover Equipment Trust 01, senior secured note, B, 8.75%, 9/01/11 | | United States | | | 2,600,000 | | | 2,834,000 |
URS Corp., senior note, 11.50%, 9/15/09 | | United States | | | 1,900,000 | | | 2,194,500 |
| | | | | | | |
|
|
| | | | | | | | | 10,173,750 |
| | | | | | | |
|
|
Non-Energy Minerals .7% | | | | | | | | |
Glencore Funding LLC, 144A, 6.00%, 4/15/14 | | United States | | | 2,500,000 | | | 2,422,922 |
Ispat Inland ULC, senior secured note, 9.75%, 4/01/14 | | United States | | | 1,478,000 | | | 1,831,981 |
| | | | | | | |
|
|
| | | | | | | | | 4,254,903 |
| | | | | | | |
|
|
Process Industries 5.1% | | | �� | | | | | |
BCP Caylux Holding, senior sub. note, 144A, 9.625%, 6/15/14 | | United States | | | 2,700,000 | | | 3,057,750 |
Boise Cascade LLC, senior sub. note, 144A, 7.125%, 10/15/14 | | United States | | | 1,800,000 | | | 1,912,500 |
Crown European Holdings SA, senior secured note, 10.875%, 3/01/13 | | United States | | | 2,800,000 | | | 3,325,000 |
Georgia-Pacific Corp., senior note, 9.375%, 2/01/13 | | United States | | | 3,100,000 | | | 3,627,000 |
Huntsman ICI Holdings LLC, senior disc. note, zero cpn., 12/31/09 | | United States | | | 4,200,000 | | | 2,373,000 |
Lubrizol Corp., senior note, 4.625%, 10/01/09 | | United States | | | 2,800,000 | | | 2,798,625 |
Lyondell Chemical Co., senior secured note, B, 9.875%, 5/01/07 | | United States | | | 903,000 | | | 950,408 |
Nalco Co., senior sub. note, 8.875%, 11/15/13 | | United States | | | 2,900,000 | | | 3,197,250 |
Owens-Brockway Glass Container Inc., senior note, 144A, 6.75%, 12/01/14 | | United States | | | 2,400,000 | | | 2,436,000 |
Rhodia SA, senior note, 10.25%, 6/01/10 | | France | | | 2,700,000 | | | 3,051,000 |
Stone Container Corp., senior note, 8.375%, 7/01/12 | | United States | | | 2,400,000 | | | 2,628,000 |
| | | | | | | |
|
|
| | | | | | | | | 29,356,533 |
| | | | | | | |
|
|
Producer Manufacturing 3.1% | | | | | | | | |
Case New Holland Inc., senior note, 144A, 9.25%, 8/01/11 | | United States | | | 3,100,000 | | | 3,464,250 |
Cummins Inc., senior note, 9.50%, 12/01/10 | | United States | | | 1,900,000 | | | 2,166,000 |
Fimep SA, senior note, 10.50%, 2/15/13 | | France | | | 2,100,000 | | | 2,499,000 |
Invensys PLC, senior note, 144A, 9.875%, 3/15/11 | | United Kingdom | | | 2,200,000 | | | 2,376,000 |
Milacron Escrow Corp., senior secured note, 11.50%, 5/15/11 | | United States | | | 2,100,000 | | | 2,236,500 |
THL Buildco Inc., senior sub. note, 144A, 8.50%, 9/01/14 | | United States | | | 800,000 | | | 840,000 |
TRW Automotive Inc., senior note, 9.375%, 2/15/13 | | United States | | | 3,459,000 | | | 4,029,735 |
| | | | | | | |
|
|
| | | | | | | | | 17,611,485 |
| | | | | | | |
|
|
FSI-12
FRANKLIN TEMPLETON VARIABLE INSURANCE PRODUCTS TRUST
FRANKLIN STRATEGIC INCOME SECURITIES FUND
Statement of Investments, December 31, 2004 (cont.)
| | | | | | | | |
| | | COUNTRY | | PRINCIPAL
AMOUNTe | | VALUE |
Bonds (cont.) | | | | | | | | |
Real Estate Development .4% | | | | | | | | |
Forest City Enterprises Inc., senior note, 7.625%, 6/01/15 | | United States | | $ | 2,200,000 | | $ | 2,343,000 |
| | | | | | | |
|
|
Real Estate Investment Trusts 1.0% | | | | | | | | |
Boston Properties Inc., senior note, 5.00%, 6/01/15 | | United States | | | 2,300,000 | | | 2,247,367 |
Host Marriott LP, senior note, 9.25%, 10/01/07 | | United States | | | 2,500,000 | | | 2,800,000 |
Host Marriott LP, senior note, 144A, 7.00%, 8/15/12 | | United States | | | 600,000 | | | 637,500 |
| | | | | | | |
|
|
| | | | | | | | | 5,684,867 |
| | | | | | | |
|
|
Retail Trade .4% | | | | | | | | |
Rite Aid Corp., senior note, 9.25%, 6/01/13 | | United States | | | 2,500,000 | | | 2,537,500 |
| | | | | | | |
|
|
Technology Services .4% | | | | | | | | |
UGS Corp., senior sub. note, 144A, 10.00%, 6/01/12 | | United States | | | 2,200,000 | | | 2,513,500 |
| | | | | | | |
|
|
Transportation .9% | | | | | | | | |
CP Ships Ltd., senior note, 10.375%, 7/15/12 | | Canada | | | 2,200,000 | | | 2,549,250 |
Laidlaw International Inc., senior note, 10.75%, 6/15/11 | | United States | | | 2,100,000 | | | 2,462,250 |
| | | | | | | |
|
|
| | | | | | | | | 5,011,500 |
| | | | | | | |
|
|
Utilities 5.2% | | | | | | | | |
Allegheny Energy Supply Co. LLC, 144A, 8.25%, 4/15/12 | | United States | | | 2,800,000 | | | 3,143,000 |
Calpine Corp., senior secured note, 144A, 8.50%, 7/15/10 | | United States | | | 3,400,000 | | | 2,932,500 |
Centerpoint Energy Inc., senior note, 6.85%, 6/01/15 | | United States | | | 1,900,000 | | | 2,107,098 |
Centerpoint Energy Inc., senior note, B, 7.25%, 9/01/10 | | United States | | | 1,200,000 | | | 1,339,980 |
Dynegy Holdings Inc., senior secured note, 144A, 10.125%, 7/15/13 | | United States | | | 3,100,000 | | | 3,565,000 |
El Paso Corp., senior note, 7.875%, 6/15/12 | | United States | | | 1,500,000 | | | 1,576,875 |
El Paso Natural Gas Co., senior note, 7.625%, 8/01/10 | | United States | | | 2,800,000 | | | 3,080,000 |
Midwest Generation LLC, senior secured note, 8.75%, 5/01/34 | | United States | | | 2,300,000 | | | 2,622,000 |
Pacific Gas & Electric Co., first mortgage, 4.20%, 3/01/11 | | United States | | | 2,800,000 | | | 2,772,182 |
Texas Genco LLC, senior note, 144A, 6.875%, 12/15/14 | | United States | | | 1,200,000 | | | 1,246,500 |
TXU Corp., 144A, 5.55%, 11/15/14 | | United States | | | 3,100,000 | | | 3,085,356 |
Utilicorp United Inc., senior note, 9.95%, 2/01/11 | | United States | | | 2,200,000 | | | 2,502,500 |
| | | | | | | |
|
|
| | | | | | | | | 29,972,991 |
| | | | | | | |
|
|
Total Bonds (Cost $245,853,832) | | | | | | | | 259,863,556 |
| | | | | | | |
|
|
Convertible Bonds .5% | | | | | | | | |
Electronic Technology | | | | | | | | |
Fairchild Semiconductor Corp., cvt., 5.00%, 11/01/08 | | United States | | | 1,300,000 | | | 1,317,875 |
Liberty Media Corp. into Motorola, cvt., senior deb., 3.50%, 1/15/31 | | United States | | | 1,800,000 | | | 1,707,750 |
| | | | | | | |
|
|
Total Convertible Bonds (Cost $2,627,172) | | | | | | | | 3,025,625 |
| | | | | | | |
|
|
Asset-Backed Securities 1.4% | | | | | | | | |
Centex Home Equity Loan Trust, 1999-1, A4, 6.39%, 10/25/27 | | United States | | | 89,710 | | | 90,235 |
Chase Funding Mortgage Loan Asset-Backed Certificates, 2003-6, 1A4, 4.499%, 8/25/30 | | United States | | | 2,200,000 | | | 2,196,000 |
Countrywide Asset-Backed Certificates, 2004-7, AF4, 4.774%, 8/25/32 | | United States | | | 440,000 | | | 440,158 |
Green Tree Financial Corp., 1993-4, B1, 7.20%, 1/15/19 | | United States | | | 4,585 | | | 4,587 |
Keystone Owner Trust, 1997-P3, M2, 144A, 7.98%, 12/25/24 | | United States | | | 81,542 | | | 81,406 |
Morgan Stanley Auto Loan Trust, 2003-HB1, D, 144A, 5.50%, 4/15/11 | | United States | | | 609,291 | | | 604,219 |
Residential Asset Mortgage Products Inc., 2004-RS3, AI3, 4.237%, 6/25/31 | | United States | | | 2,300,000 | | | 2,275,203 |
Residential Asset Securities Corp., 2002-KS8, A4, 4.58%, 11/25/30 | | United States | | | 1,000,000 | | | 1,010,680 |
Residential Asset Securities Corp., 2004-KS1, AI4, 4.213%, 4/25/32 | | United States | | | 500,000 | | | 492,381 |
Wells Fargo Home Equity Trust, 2004-2, A15, 4.89%, 11/25/28 | | United States | | | 1,070,000 | | | 1,077,340 |
| | | | | | | |
|
|
Total Asset-Backed Securities (Cost $8,262,055) | | | | | | | | 8,272,209 |
| | | | | | | |
|
|
FSI-13
FRANKLIN TEMPLETON VARIABLE INSURANCE PRODUCTS TRUST
FRANKLIN STRATEGIC INCOME SECURITIES FUND
Statement of Investments, December 31, 2004 (cont.)
| | | | | | | | |
| | | COUNTRY | | PRINCIPAL
AMOUNTe | | VALUE |
U.S. Government and Agency Securities 15.4% | | | | | | | | |
Federal Home Loan Mortgage Corp. (FHLMC) Fixed Rate 5.8% | | | | | | | | |
FHLMC Gold 15 Year, 4.50%, 10/01/18 - 9/01/19 | | United States | | $ | 6,007,187 | | $ | 5,993,473 |
FHLMC Gold 15 Year, 5.00%, 12/01/17 - 9/01/19 | | United States | | | 7,524,726 | | | 7,647,873 |
FHLMC Gold 15 Year, 5.50%, 7/01/17 - 7/01/19 | | United States | | | 1,934,736 | | | 2,000,514 |
FHLMC Gold 15 Year, 6.00%, 5/01/17 | | United States | | | 79,133 | | | 82,914 |
FHLMC Gold 15 Year, 6.50%, 5/01/16 | | United States | | | 41,559 | | | 44,037 |
FHLMC Gold 30 Year, 5.00%, 4/01/34 | | United States | | | 4,796,076 | | | 4,767,453 |
FHLMC Gold 30 Year, 5.50%, 3/01/33 - 9/01/34 | | United States | | | 5,532,602 | | | 5,627,274 |
FHLMC Gold 30 Year, 6.00%, 4/01/33 - 8/01/34 | | United States | | | 5,476,518 | | | 5,661,745 |
FHLMC Gold 30 Year, 6.50%, 12/01/23 - 7/01/32 | | United States | | | 724,568 | | | 762,251 |
FHLMC Gold 30 Year, 7.00%, 9/01/21 - 6/01/32 | | United States | | | 485,806 | | | 516,288 |
FHLMC Gold 30 Year, 7.50%, 3/01/30 - 7/01/31 | | United States | | | 42,638 | | | 45,715 |
| | | | | | | |
|
|
| | | | | | | | | 33,149,537 |
| | | | | | | |
|
|
Federal National Mortgage Association (FNMA) Fixed Rate 2.5% | | | | | | | | |
FNMA 15 Year, 4.50%, 6/01/19 | | United States | | | 971,824 | | | 969,644 |
FNMA 15 Year, 5.00%, 10/01/17 - 6/01/18 | | United States | | | 1,682,080 | | | 1,711,192 |
FNMA 15 Year, 5.50%, 10/01/16 - 12/01/17 | | United States | | | 184,266 | | | 190,709 |
FNMA 15 Year, 6.00%, 4/01/16 - 7/01/16 | | United States | | | 82,348 | | | 86,370 |
FNMA 15 Year, 7.00%, 5/01/12 | | United States | | | 10,673 | | | 11,320 |
FNMA 30 Year, 5.00%, 4/01/34 - 5/01/34 | | United States | | | 1,285,391 | | | 1,276,896 |
FNMA 30 Year, 5.50%, 8/01/33 - 12/01/34 | | United States | | | 5,391,725 | | | 5,478,648 |
bFNMA 30 Year, 6.00%, 6/01/34 - 1/01/29 | | United States | | | 2,852,936 | | | 2,950,517 |
FNMA 30 Year, 6.50%, 6/01/28 - 9/01/32 | | United States | | | 1,358,453 | | | 1,427,002 |
FNMA 30 Year, 7.00%, 2/01/29 - 1/01/32 | | United States | | | 48,059 | | | 51,010 |
FNMA 30 Year, 7.50%, 9/01/31 | | United States | | | 100,033 | | | 107,211 |
| | | | | | | |
|
|
| | | | | | | | | 14,260,519 |
| | | | | | | |
|
|
Government National Mortgage Association (GNMA) Fixed Rate 2.3% | | | | | | | | |
GNMA I SF 30 Year, 5.00%, 11/15/33 - 7/15/34 | | United States | | | 3,419,057 | | | 3,425,123 |
GNMA I SF 30 Year, 5.50%, 12/15/32 - 9/15/34 | | United States | | | 4,263,247 | | | 4,358,861 |
GNMA I SF 30 Year, 6.00%, 1/15/33 | | United States | | | 457,511 | | | 474,617 |
GNMA I SF 30 Year, 6.50%, 11/15/31 - 2/15/32 | | United States | | | 54,325 | | | 57,253 |
GNMA I SF 30 Year, 7.00%, 10/15/28 - 6/15/32 | | United States | | | 223,302 | | | 237,665 |
GNMA I SF 30 Year, 7.50%, 9/15/30 | | United States | | | 8,000 | | | 8,595 |
GNMA I SF 30 Year, 8.00%, 6/15/26 | | United States | | | 4,460 | | | 4,854 |
GNMA II SF 30 Year, 5.00%, 9/15/33 - 11/20/33 | | United States | | | 910,887 | | | 911,787 |
GNMA II SF 30 Year, 6.00%, 11/20/34 | | United States | | | 1,394,726 | | | 1,445,214 |
GNMA II SF 30 Year, 6.50%, 4/15/31 - 2/20/34 | | United States | | | 921,744 | | | 969,938 |
GNMA II SF 30 Year, 7.00%, 2/20/32 | | United States | | | 1,057,765 | | | 1,120,770 |
GNMA II SF 30 Year, 7.50%, 1/20/28 - 4/20/32 | | United States | | | 253,467 | | | 271,216 |
| | | | | | | |
|
|
| | | | | | | | | 13,285,893 |
| | | | | | | |
|
|
Other U.S. Government and Agencies Securities 4.8% | | | | | | | | |
FHLMC, 2.375%, 2/15/07 | | United States | | | 300,000 | | | 294,629 |
FHLMC, 2.375%, 4/15/06 | | United States | | | 1,700,000 | | | 1,685,456 |
FHLMC, 2.875%, 12/15/06 | | United States | | | 1,430,000 | | | 1,420,633 |
FHLMC, 4.50%, 1/15/13 | | United States | | | 1,580,000 | | | 1,595,862 |
FHLMC, 4.50%, 1/15/14 | | United States | | | 1,000,000 | | | 1,001,439 |
FHLMC, 5.50%, 9/15/11 | | United States | | | 300,000 | | | 322,763 |
FHLMC, 7.00%, 3/15/10 | | United States | | | 300,000 | | | 342,992 |
FNMA, 4.25%, 5/15/09 | | United States | | | 260,000 | | | 264,809 |
FSI-14
FRANKLIN TEMPLETON VARIABLE INSURANCE PRODUCTS TRUST
FRANKLIN STRATEGIC INCOME SECURITIES FUND
Statement of Investments, December 31, 2004 (cont.)
| | | | | | | | | |
| | | COUNTRY | | PRINCIPAL
AMOUNTe | | | VALUE |
U.S. Government and Agency Securities (cont.) | | | | | | | | | |
Other U.S. Government and Agencies Securities (cont.) | | | | | | | | | |
FNMA, 4.375%, 3/15/13 | | United States | | $ | 1,600,000 | | | $ | 1,598,347 |
FNMA, 5.00%, 1/15/07 | | United States | | | 900,000 | | | | 930,810 |
FNMA, 5.25%, 1/15/09 | | United States | | | 250,000 | | | | 264,164 |
FNMA, 5.25%, 6/15/06 | | United States | | | 900,000 | | | | 926,866 |
FNMA, 6.00%, 5/15/11 | | United States | | | 500,000 | | | | 550,831 |
FNMA, 6.00%, 12/15/05 | | United States | | | 500,000 | | | | 514,118 |
FNMA, 6.625%, 11/15/10 | | United States | | | 350,000 | | | | 396,026 |
U.S. Treasury Bond, 4.875%, 2/15/12 | | United States | | | 2,000,000 | | | | 2,114,532 |
U.S. Treasury Bond, 6.125%, 11/15/27 | | United States | | | 150,000 | | | | 175,236 |
U.S. Treasury Note, 1.625%, 10/31/05 | | United States | | | 700,000 | | | | 694,231 |
U.S. Treasury Note, 2.00%, 5/15/06 | | United States | | | 1,000,000 | | | | 988,516 |
U.S. Treasury Note, 3.00%, 11/15/07 | | United States | | | 1,500,000 | | | | 1,491,212 |
U.S. Treasury Note, 3.125%, 9/15/08 | | United States | | | 1,500,000 | | | | 1,485,528 |
U.S. Treasury Note, 3.25%, 1/15/09 | | United States | | | 4,900,000 | | | | 4,859,041 |
U.S. Treasury Note, 3.375%, 10/15/09 | | United States | | | 340,000 | | | | 336,759 |
U.S. Treasury Note, 4.00%, 11/15/12 | | United States | | | 150,000 | | | | 149,795 |
U.S. Treasury Note, 4.375%, 8/15/12 | | United States | | | 1,570,000 | | | | 1,607,963 |
U.S. Treasury Note, 4.75%, 5/15/14 | | United States | | | 1,000,000 | | | | 1,042,422 |
U.S. Treasury Note, 5.625%, 5/15/08 | | United States | | | 600,000 | | | | 643,735 |
| | | | | | | | |
|
|
| | | | | | | | | | 27,698,715 |
| | | | | | | | |
|
|
Total U.S. Government and Agency Securities (Cost $88,015,931) | | | | | | | | | 88,394,664 |
| | | | | | | | |
|
|
Foreign Government and Agency Securities 31.9% | | | | | | | | | |
New South Wales Treasury Corp., 6.50%, 5/01/06 | | Australia | | | 3,783,000 | AUD | | | 3,007,626 |
New South Wales Treasury Corp., 8.00%, 3/01/08 | | Australia | | | 2,501,000 | AUD | | | 2,105,534 |
New South Wales Treasury Corp., 6.00%, 5/01/12 | | Australia | | | 1,570,000 | AUD | | | 1,263,546 |
Queensland Treasury Corp., 6.00%, 7/14/09 | | Australia | | | 3,820,000 | AUD | | | 3,065,748 |
Queensland Treasury Corp., 6.00%, 8/14/13 | | Australia | | | 1,220,000 | AUD | | | 988,233 |
Queensland Treasury Corp., 6.00%, 10/14/15 | | Australia | | | 1,280,000 | AUD | | | 1,038,007 |
Republic of Austria, 4.00%, 7/15/09 | | Austria | | | 1,010,000 | EUR | | | 1,427,807 |
Republic of Austria, 5.00%, 7/15/12 | | Austria | | | 40,000 | EUR | | | 59,911 |
Republic of Austria, 4.65%, 1/15/18 | | Austria | | | 1,500,000 | EUR | | | 2,191,825 |
Kingdom of Belgium, 4.75%, 9/28/06 | | Belgium | | | 420,000 | EUR | | | 592,145 |
Kingdom of Belgium, 7.50%, 7/29/08 | | Belgium | | | 146,000 | EUR | | | 229,128 |
Kingdom of Belgium, 5.00%, 9/28/12 | | Belgium | | | 790,000 | EUR | | | 1,181,216 |
Republic of Brazil, L, FRN, 3.125%, 4/15/12 | | Brazil | | | 202,943 | | | | 194,318 |
Republic of Brazil, FRN, 3.125%, 4/15/12 | | Brazil | | | 3,220,614 | | | | 3,087,422 |
Republic of Bulgaria, 144A, 8.25%, 1/15/15 | | Bulgaria | | | 1,178,000 | | | | 1,479,862 |
Republic of Bulgaria, Reg S, 8.25%, 1/15/15 | | Bulgaria | | | 270,000 | | | | 339,525 |
Government of Canada, 3.00%, 6/01/06 | | Canada | | | 7,660,000 | CAD | | | 6,406,081 |
Government of Canada, 3.25%, 12/01/06 | | Canada | | | 4,250,000 | CAD | | | 3,560,595 |
Government of Canada, 5.25%, 6/01/12 | | Canada | | | 160,000 | CAD | | | 142,993 |
Republic of Colombia, 10.50%, 7/09/10 | | Colombia | | | 150,000 | | | | 175,500 |
Republic of Colombia, 10.00%, 1/23/12 | | Colombia | | | 320,000 | | | | 368,800 |
Republic of Colombia, 10.75%, 1/15/13 | | Colombia | | | 930,000 | | | | 1,113,675 |
Republic of Colombia, 11.75%, 2/25/20 | | Colombia | | | 1,110,000 | | | | 1,420,967 |
Kingdom of Denmark, 5.00%, 8/15/05 | | Denmark | | | 1,729,000 | DKK | | | 320,496 |
Kingdom of Denmark, 3.00%, 11/15/06 | | Denmark | | | 4,400,000 | DKK | | | 809,475 |
Kingdom of Denmark, 6.00%, 11/15/09 | | Denmark | | | 2,390,000 | DKK | | | 491,959 |
Kingdom of Denmark, 5.00%, 11/15/13 | | Denmark | | | 5,890,000 | DKK | | | 1,182,695 |
Government of Finland, 5.00%, 7/04/07 | | Finland | | | 610,000 | EUR | | | 874,978 |
FSI-15
FRANKLIN TEMPLETON VARIABLE INSURANCE PRODUCTS TRUST
FRANKLIN STRATEGIC INCOME SECURITIES FUND
Statement of Investments, December 31, 2004 (cont.)
| | | | | | | | |
| | | COUNTRY | | PRINCIPAL
AMOUNTe | | | VALUE |
Foreign Government and Agency Securities (cont.) | | | | | | | | |
Government of Finland, 5.75%, 2/23/11 | | Finland | | 50,000 | EUR | | $ | 77,326 |
Government of Finland, 5.375%, 7/04/13 | | Finland | | 1,625,000 | EUR | | | 2,500,059 |
Government of France, 3.00%, 7/12/08 | | France | | 1,260,000 | EUR | | | 1,720,926 |
Government of France, 4.00%, 4/25/09 | | France | | 1,130,000 | EUR | | | 1,598,530 |
Government of France, 4.00%, 10/25/09 | | France | | 943,000 | EUR | | | 1,335,876 |
Federal Republic of Germany, 3.75%, 1/04/09 | | Germany | | 1,070,000 | EUR | | | 1,498,526 |
Hellenic Republic, 4.65%, 4/19/07 | | Greece | | 190,000 | EUR | | | 269,259 |
Hellenic Republic, 6.50%, 10/22/19 | | Greece | | 300,000 | EUR | | | 513,011 |
Government of Hungary, 8.50%, 10/12/05 | | Hungary | | 483,800,000 | HUF | | | 2,669,609 |
Indonesia Government, 11.00%, 10/15/14 | | Indonesia | | 1,800,000,000 | IDR | | | 201,113 |
Indonesia Recapital Bond, 14.00%, 6/15/09 | | Indonesia | | 5,750,000,000 | IDR | | | 709,884 |
Indonesia Recapital Bond, 13.15%, 3/15/10 | | Indonesia | | 13,925,000,000 | IDR | | | 1,684,651 |
Indonesia Recapital Bond, 14.25%, 6/15/13 | | Indonesia | | 1,980,000,000 | IDR | | | 258,099 |
Indonesia Recapital Bond, 14.275%, 12/15/13 | | Indonesia | | 19,319,000,000 | IDR | | | 2,523,488 |
Government of Italy, 4.50%, 5/01/09 | | Italy | | 160,000 | EUR | | | 230,343 |
Government of Italy, 5.50%, 11/01/10 | | Italy | | 43,000 | EUR | | | 65,385 |
Government of Italy, 7.75%, 11/01/06 | | Italy | | 300,000 | EUR | | | 444,797 |
Government of Italy, 6.75%, 2/01/07 | | Italy | | 130,000 | EUR | | | 191,123 |
United Mexican States, 8.625%, 3/12/08 | | Mexico | | 480,000 | | | | 546,168 |
United Mexican States, FRN, 2.753%, 1/13/09 | | Mexico | | 540,000 | | | | 548,100 |
United Mexican States, 10.375%, 2/17/09 | | Mexico | | 134,000 | | | | 164,025 |
United Mexican States, 9.875%, 2/01/10 | | Mexico | | 1,912,000 | | | | 2,357,142 |
United Mexican States, 8.375%, 1/14/11 | | Mexico | | 4,040,000 | | | | 4,753,323 |
United Mexican States, 8.125%, 12/30/19 | | Mexico | | 800,000 | | | | 942,500 |
Government of Netherlands, 5.75%, 2/15/07 | | Netherlands | | 90,000 | EUR | | | 130,166 |
Government of Netherlands, 3.75%, 7/15/09 | | Netherlands | | 80,000 | EUR | | | 111,985 |
Government of Netherlands, 5.00%, 7/15/12 | | Netherlands | | 250,000 | EUR | | | 373,701 |
Government of Netherlands, 4.25%, 7/15/13 | | Netherlands | | 90,000 | EUR | | | 128,254 |
Government of New Zealand, 6.50%, 2/15/06 | | New Zealand | | 2,270,000 | NZD | | | 1,632,670 |
Government of New Zealand, 8.00%, 11/15/06 | | New Zealand | | 2,710,000 | NZD | | | 2,006,726 |
Government of New Zealand, 7.00%, 7/15/09 | | New Zealand | | 4,590,000 | NZD | | | 3,422,741 |
Government of New Zealand, 6.00%, 11/15/11 | | New Zealand | | 1,600,000 | NZD | | | 1,149,926 |
Government of New Zealand, 6.50%, 4/15/13 | | New Zealand | | 4,010,000 | NZD | | | 2,976,014 |
Kingdom of Norway, 6.75%, 1/15/07 | | Norway | | 8,725,000 | NOK | | | 1,559,809 |
Norwegian Treasury Bill, 6/15/05 | | Norway | | 1,400,000 | NOK | | | 229,031 |
Norwegian Treasury Bill, 9/21/05 | | Norway | | 16,600,000 | NOK | | | 2,700,037 |
Republic of Panama, 8.875%, 9/30/27 | | Panama | | 95,000 | | | | 105,925 |
Republic of Panama, 9.375%, 4/01/29 | | Panama | | 75,000 | | | | 88,406 |
Republic of Peru, 9.125%, 1/15/08 | | Peru | | 10,000 | | | | 11,425 |
Republic of Peru, 9.875%, 2/06/15 | | Peru | | 410,000 | | | | 506,350 |
Republic of Peru, FRN, 5.00%, 3/07/17 | | Peru | | 178,640 | | | | 172,115 |
Republic of Philippines, 9.875%, 3/16/10 | | Philippines | | 630,000 | | | | 686,637 |
Republic of Philippines, 9.00%, 2/15/13 | | Philippines | | 4,310,000 | | | | 4,420,552 |
Republic of Poland, 8.50%, 11/12/06 | | Poland | | 11,400,000 | PLN | | | 3,930,304 |
Republic of Poland, 8.50%, 5/12/07 | | Poland | | 5,300,000 | PLN | | | 1,849,418 |
Republic of Poland, 6.00%, 5/24/09 | | Poland | | 23,370,000 | PLN | | | 7,715,785 |
Russian Federation, 144A, 8.25%, 3/31/10 | | Russia | | 900,000 | | | | 996,750 |
Russian Federation, 144A, 12.75%, 6/24/28 | | Russia | | 140,000 | | | | 230,233 |
Russian Federation, Reg S, 5.00% to 3/31/07, 7.50% thereafter, 3/31/30 | | Russia | | 15,215,000 | | | | 15,753,611 |
Russian Federation, Reg S, 11.00%, 7/24/18 | | Russia | | 840,000 | | | | 1,179,223 |
Russian Federation, Reg S, 12.75%, 6/24/28 | | Russia | | 240,000 | | | | 394,686 |
Republic of South Africa, 7.375%, 4/25/12 | | South Africa | | 30,000 | | | | 34,350 |
Republic of South Africa, 8.50%, 6/23/17 | | South Africa | | 200,000 | | | | 252,062 |
FSI-16
FRANKLIN TEMPLETON VARIABLE INSURANCE PRODUCTS TRUST
FRANKLIN STRATEGIC INCOME SECURITIES FUND
Statement of Investments, December 31, 2004 (cont.)
| | | | | | | | |
| | | COUNTRY | | PRINCIPAL
AMOUNTe | | | VALUE |
Foreign Government and Agency Securities (cont.) | | | | | | | | |
Korea Treasury Bond, 4.50%, 3/05/06 | | South Korea | | 3,500,000,000 | KRW | | $ | 3,477,202 |
Korea Treasury Bond, 4.50%, 9/03/06 | | South Korea | | 1,000,000,000 | KRW | | | 999,345 |
Korea Treasury Bond, 6.90%, 1/16/07 | | South Korea | | 2,040,000,000 | KRW | | | 2,139,296 |
Korea Treasury Bond, 4.75%, 3/12/08 | | South Korea | | 8,200,000,000 | KRW | | | 8,370,305 |
Government of Spain, 4.80%, 10/31/06 | | Spain | | 100,000 | EUR | | | 141,359 |
Government of Spain, 5.15%, 7/30/09 | | Spain | | 210,000 | EUR | | | 311,096 |
Government of Spain, 5.00%, 7/30/12 | | Spain | | 350,000 | EUR | | | 523,490 |
Government of Spain, 3.25%, 1/31/05 | | Spain | | 573,000 | EUR | | | 778,183 |
Government of Spain, 10.15%, 1/31/06 | | Spain | | 58,000 | EUR | | | 85,191 |
Government of Spain, 6.00%, 1/31/08 | | Spain | | 260,000 | EUR | | | 386,524 |
Kingdom of Sweden, 6.00%, 2/09/05 | | Sweden | | 12,890,000 | SEK | | | 1,947,382 |
Kingdom of Sweden, 3.50%, 4/20/06 | | Sweden | | 31,050,000 | SEK | | | 4,744,770 |
Kingdom of Sweden, 8.00%, 8/15/07 | | Sweden | | 10,100,000 | SEK | | | 1,719,042 |
Kingdom of Sweden, 6.50%, 5/05/08 | | Sweden | | 2,400,000 | SEK | | | 401,248 |
Kingdom of Sweden, 5.00%, 1/28/09 | | Sweden | | 13,685,000 | SEK | | | 2,205,051 |
Kingdom of Sweden, 5.50%, 10/08/12 | | Sweden | | 21,390,000 | SEK | | | 3,592,774 |
Government of Thailand, 6.00%, 3/05/05 | | Thailand | | 63,500,000 | THB | | | 1,646,632 |
Government of Thailand, 8.50%, 10/14/05 | | Thailand | | 275,700,000 | THB | | | 7,459,162 |
Government of Thailand, 8.00%, 12/08/06 | | Thailand | | 146,050,000 | THB | | | 4,123,450 |
Government of Thailand, 4.125%, 2/12/08 | | Thailand | | 17,000,000 | THB | | | 449,098 |
Government of Thailand, 8.50%, 12/08/08 | | Thailand | | 14,000,000 | THB | | | 425,555 |
Republic of Ukraine, 144A, 6.875%, 3/04/11 | | Ukraine | | 1,730,000 | | | | 1,779,738 |
Republic of Ukraine, 144A, 7.65%, 6/11/13 | | Ukraine | | 3,800,000 | | | | 4,072,650 |
Republic of Ukraine, FRN, 5.33%, 8/05/09 | | Ukraine | | 1,275,000 | | | | 1,352,711 |
Republic of Ukraine, Reg S, 11.00%, 3/15/07 | | Ukraine | | 513,348 | | | | 552,593 |
Republic of Ukraine, Reg S, 6.875%, 3/04/11 | | Ukraine | | 390,000 | | | | 401,213 |
Republic of Ukraine, Reg S, 7.65%, 6/11/13 | | Ukraine | | 2,150,000 | | | | 2,304,263 |
Republic of Venezuela, FRN, 3.09%, 4/20/11 | | Venezuela | | 3,330,000 | | | | 3,036,544 |
Republic of Venezuela, 10.75%, 9/19/13 | | Venezuela | | 540,000 | | | | 648,000 |
Republic of Venezuela, 9.25%, 9/15/27 | | Venezuela | | 1,377,000 | | | | 1,456,178 |
Republic of Vietnam, 4.00%, 3/12/16 | | Vietnam | | 750,000 | | | | 697,500 |
| | | | | | | |
|
|
Total Foreign Government and Agency Securities (Cost $160,299,232) | | | | | | | | 183,899,767 |
| | | | | | | |
|
|
Total Long Term Investments (Cost $523,842,262) | | | | | | | | 562,948,486 |
| | | | | | | |
|
|
| | | |
| | | | | SHARES
| | | |
Short-Term Investment (Cost $10,582,117) 1.9% | | | | | | | | |
Money Fund | | | | | | | | |
dFranklin Institutional Fiduciary Trust Money Market Portfolio | | United States | | 10,582,117 | | | | 10,582,117 |
| | | | | | | |
|
|
Total Investments (Cost $534,424,379) 99.6% | | | | | | | | 573,530,603 |
Other Assets, less Liabilities .4% | | | | | | | | 2,193,266 |
| | | | | | | |
|
|
Net Assets 100.0% | | | | | | | $ | 575,723,869 |
| | | | | | | |
|
|
FSI-17
FRANKLIN TEMPLETON VARIABLE INSURANCE PRODUCTS TRUST
FRANKLIN STRATEGIC INCOME SECURITIES FUND
Statement of Investments, December 31, 2004 (cont.)
Currency Abbreviation:
AUD - Australian Dollar
CAD - Canadian Dollar
DKK - Danish Krone
EUR - Euro
HUF - Hungarian Forint
IDR - Indonesian Rupiah
KRW - South Korean Won
NOK - Norwegian Krone
NZD - New Zealand Dollar
PLN - Polish Zloty
SEK - Swedish Krona
THB - Thai Baht
Portfolio Abbreviation:
FRN - Floating Rate Note
SF - Single Family
| a | See Note 1(f) regarding senior floating rate interests. |
| b | See Note 1(c) regarding securities purchased on a when-issued, delayed delivery, or to-be-announced basis. |
| c | Defaulted securities. See Note 8. |
| d | See Note 7 regarding investments in Franklin Institutional Fiduciary Trust Money Market Portfolio. |
| e | The principal amount is stated in U.S. dollars unless otherwise indicated. |
See notes to financial statements.
FSI-18
FRANKLIN TEMPLETON VARIABLE INSURANCE PRODUCTS TRUST
FRANKLIN STRATEGIC INCOME SECURITIES FUND
Financial Statements
Statement of Assets and Liabilities
December 31, 2004
| | | |
Assets: | | | |
Investments in securities: | | | |
Cost - Unaffiliated issuers | | $ | 523,842,262 |
Cost - Sweep Money Fund (Note 7) | | | 10,582,117 |
| | |
|
|
Total cost of investments | | | 534,424,379 |
| | |
|
|
Value - Unaffiliated issuers | | | 562,948,486 |
Value - Sweep Money Fund (Note 7) | | | 10,582,117 |
| | |
|
|
Total value of investments | | | 573,530,603 |
| | |
|
|
Cash | | | 33,140 |
Receivables: | | | |
Investment securities sold | | | 4,774 |
Capital shares sold | | | 1,118,493 |
Dividends and Interest | | | 8,952,922 |
| | |
|
|
Total assets | | | 583,639,932 |
| | |
|
|
Liabilities: | | | |
Payables: | | | |
Investment securities purchased | | | 7,563,872 |
Capital shares redeemed | | | 895 |
Affiliates | | | 288,705 |
Other liabilities | | | 62,591 |
| | |
|
|
Total liabilities | | | 7,916,063 |
| | |
|
|
Net assets, at value | | $ | 575,723,869 |
| | |
|
|
Net assets consist of: | | | |
Undistributed net investment income | | $ | 25,793,329 |
Net unrealized appreciation (depreciation) | | | 39,268,305 |
Accumulated net realized gain (loss) | | | 4,900,044 |
Capital shares | | | 505,762,191 |
| | |
|
|
Net assets, at value | | $ | 575,723,869 |
| | |
|
|
Class 1: | | | |
Net assets, at value | | $ | 571,067,023 |
| | |
|
|
Shares outstanding | | | 44,194,076 |
| | |
|
|
Net asset value and offering price per share | | $ | 12.92 |
| | |
|
|
Class 2: | | | |
Net assets, at value | | $ | 4,656,846 |
| | |
|
|
Shares outstanding | | | 364,483 |
| | |
|
|
Net asset value and offering price per share | | $ | 12.78 |
| | |
|
|
See notes to financial statements.
FSI-19
FRANKLIN TEMPLETON VARIABLE INSURANCE PRODUCTS TRUST
FRANKLIN STRATEGIC INCOME SECURITIES FUND
Financial Statements (continued)
Statement of Operations
for the year ended December 31, 2004
| | | | |
Investment income: | | | | |
Dividends: | | | | |
Unaffiliated issuers | | $ | 576,737 | |
Sweep Money Fund (Note 7) | | | 220,323 | |
Interest | | | 27,699,163 | |
| | |
|
|
|
Total investment income | | | 28,496,223 | |
| | |
|
|
|
Expenses: | | | | |
Management fees (Note 3) | | | 1,893,753 | |
Administrative fees (Note 3) | | | 931,045 | |
Distribution fees - Class 2 (Note 3) | | | 8,162 | |
Transfer agent fees | | | 3,974 | |
Custodian fees (Note 4) | | | 105,086 | |
Reports to shareholders | | | 69,869 | |
Professional fees | | | 23,672 | |
Trustees’ fees and expenses | | | 2,667 | |
Other | | | 43,709 | |
| | |
|
|
|
Total expenses | | | 3,081,937 | |
Expense reductions (Note 4) | | | (377 | ) |
| | |
|
|
|
Net expenses | | | 3,081,560 | |
| | |
|
|
|
Net investment income | | | 25,414,663 | |
| | |
|
|
|
Realized and unrealized gains (losses): | | | | |
Net realized gain (loss) from: | | | | |
Investments | | | 7,278,726 | |
Foreign currency transactions | | | 20,718 | |
| | |
|
|
|
Net realized gain (loss) | | | 7,299,444 | |
| | |
|
|
|
Net change in unrealized appreciation (depreciation) on: | | | | |
Investments | | | 14,901,983 | |
Translation of assets and liabilities denominated in foreign currencies | | | 69,021 | |
| | |
|
|
|
Net change in unrealized appreciation (depreciation) | | | 14,971,004 | |
| | |
|
|
|
Net realized and unrealized gain (loss) | | | 22,270,448 | |
| | |
|
|
|
Net increase (decrease) in net assets resulting from operations | | $ | 47,685,111 | |
| | |
|
|
|
See notes to financial statements.
FSI-20
FRANKLIN TEMPLETON VARIABLE INSURANCE PRODUCTS TRUST
FRANKLIN STRATEGIC INCOME SECURITIES FUND
Financial Statements (continued)
Statements of Changes in Net Assets
for the years ended December 31, 2004 and 2003
| | | | | | | | |
| | | 2004 | | | 2003 | |
| | |
| |
Increase (decrease) in net assets: | | | | | | | | |
Operations: | | | | | | | | |
Net investment income | | $ | 25,414,663 | | | $ | 12,510,205 | |
Net realized gain (loss) from investments and foreign currency transactions | | | 7,299,444 | | | | 3,838,610 | |
Net change in unrealized appreciation (depreciation) on investments and translation of assets and liabilities denominated in foreign currencies | | | 14,971,004 | | | | 23,167,485 | |
| | |
| |
Net increase (decrease) in net assets resulting from operations | | | 47,685,111 | | | | 39,516,300 | |
Distributions to shareholders from: | | | | | | | | |
Net investment income: | | | | | | | | |
Class 1 | | | (14,618,436 | ) | | | (5,519,539 | ) |
Class 2 | | | (104,257 | ) | | | (8,268 | ) |
Net realized gains: | | | | | | | | |
Class 1 | | | (589,602 | ) | | | — | |
Class 2 | | | (4,270 | ) | | | — | |
| | |
| |
Total distributions to shareholders | | | (15,316,565 | ) | | | (5,527,807 | ) |
Capital share transactions: (Note 2) | | | | | | | | |
Class 1 | | | 178,968,891 | | | | 223,318,963 | |
Class 2 | | | 2,598,363 | | | | 1,519,523 | |
| | |
| |
Total capital share transactions | | | 181,567,254 | | | | 224,838,486 | |
Net increase (decrease) in net assets | | | 213,935,800 | | | | 258,826,979 | |
Net assets: | | | | | | | | |
Beginning of year | | | 361,788,069 | | | | 102,961,090 | |
| | |
| |
End of year | | $ | 575,723,869 | | | $ | 361,788,069 | |
| | |
| |
Undistributed net investment income included in net assets: | | | | | | | | |
End of year | | $ | 25,793,329 | | | $ | 12,709,647 | |
| | |
| |
See notes to financial statements.
FSI-21
FRANKLIN TEMPLETON VARIABLE INSURANCE PRODUCTS TRUST
FRANKLIN STRATEGIC INCOME SECURITIES FUND
Notes to Financial Statements
1. ORGANIZATION AND SIGNIFICANT ACCOUNTING POLICIES
Franklin Templeton Variable Insurance Products Trust (the Trust) is registered under the Investment Company Act of 1940 as an open-end investment company, consisting of twenty-one separate series (the Funds). The Franklin Strategic Income Securities Fund (the Fund) included in this report is non-diversified. The financial statements of the remaining funds in the series are presented separately. Shares of the Fund are sold only to insurance company separate accounts to fund the benefits of variable life insurance policies or variable annuity contracts. As of December 31, 2004, over 99% of the Fund’s shares were sold through one insurance company. The Fund’s investment objective is to obtain a high level of current income while seeking capital appreciation.
The following summarizes the Fund’s significant accounting policies.
a. Security Valuation
Securities listed on a securities exchange or on the NASDAQ National Market System are valued at the last quoted sale price or the official closing price of the day, respectively. Over-the-counter securities and listed securities for which there is no reported sale, are valued within the range of the most recent quoted bid and ask prices. Securities that trade in multiple markets or on multiple exchanges are valued according to the broadest and most representative market. Investments in open-end mutual funds are valued at the closing net asset value.
Corporate debt securities, U.S. government securities, mortgage pass-through securities, other mortgage-backed securities, collateralized mortgage obligations and asset-backed securities generally trade in the over-the-counter market rather than on a securities exchange. The Trust may utilize independent pricing services, quotations from bond dealers, and information with respect to bond and note transactions, to assist in determining a current market value for each security. The Trust’s pricing services may use valuation models or matrix pricing which considers information with respect to comparable bond and note transactions, quotations from bond dealers, or by reference to other securities that are considered comparable in such characteristics as rating, interest rate and maturity date, option adjusted spread models, prepayment projections, interest rate spreads and yield curves, to determine current value.
Senior secured corporate loans with floating or variable interest rates generally trade in the over-the-counter market rather than on a securities exchange. The Trust may utilize independent pricing services, quotations from loan dealers and other financial institutions, and information with respect to bond and note transactions, to assist in determining a current market value for each security. The Trust’s pricing services use independent market quotations from loan dealers or financial institutions and may incorporate valuation methodologies that consider multiple bond characteristics such as dealer quotes, issuer type, coupon, maturity, weighted average maturity, interest rate spreads and yield curves, cash flow and credit risk/quality analysis to determine current value.
Foreign securities are valued as of the close of trading on the foreign stock exchange on which the security is primarily traded, or the NYSE, whichever is earlier. The value is then converted into its U.S. dollar equivalent at the foreign exchange rate in effect at the close of the NYSE on the day that the value of the foreign security is determined. If no sale is reported at that time, the foreign security will be valued within the range of the most recent quoted bid and ask prices.
The Trust has procedures to determine the fair value of individual securities and other assets for which market prices are not readily available or which may not be reliably priced. Some methods for valuing these securities may include: fundamental analysis, matrix pricing, discounts from market prices of similar securities, or discounts applied due to the nature and duration of restrictions on the disposition of the securities. Occasionally events occur between the time at which trading in a security is
completed and the close of the NYSE that might call into question the availability (including the reliability) of the value of a portfolio security held by the fund. If such an event occurs the securities may be valued using fair value procedures, which may include the use of independent pricing services. All security valuation procedures are approved by the Trust’s Board of Trustees.
FSI-22
FRANKLIN TEMPLETON VARIABLE INSURANCE PRODUCTS TRUST
FRANKLIN STRATEGIC INCOME SECURITIES FUND
Notes to Financial Statements (continued)
1. ORGANIZATION AND SIGNIFICANT ACCOUNTING POLICIES (cont.)
b. Foreign Currency Translation
Portfolio securities and other assets and liabilities denominated in foreign currencies are translated into U.S. dollars based on the exchange rate of such currencies against U.S. dollars on the date of valuation. Purchases and sales of securities, income and expense items denominated in foreign currencies are translated into U.S. dollars at the exchange rate in effect on the transaction date. Occasionally events may impact the availability or reliability of foreign exchange rates used to convert the U.S. dollar equivalent value. If such an event occurs, the foreign exchange rate will be valued at fair value using procedures established and approved by the Trust’s Board of Trustees.
The Fund does not separately report the effect of changes in foreign exchange rates from changes in market prices on securities held. Such changes are included in net realized and unrealized gain or loss from investments on the Statement of Operations.
Realized foreign exchange gains or losses arise from sales of foreign currencies, currency gains or losses realized between the trade and settlement dates on securities transactions and the difference between the recorded amounts of dividends, interest, and foreign withholding taxes and the U.S. dollar equivalent of the amounts actually received or paid. Net unrealized foreign exchange gains and losses arise from changes in foreign exchange rates on foreign denominated assets and liabilities other than investments in securities held at the end of the reporting period.
c. Securities Purchased on a When-Issued, Delayed Delivery, or TBA Basis
The Fund may purchase securities on a when-issued, delayed delivery, or to-be-announced (TBA) basis, with payment and delivery scheduled for a future date. These transactions are subject to market fluctuations and are subject to the risk that the value at delivery may be more or less than the trade date purchase price. Although the Fund will generally purchase these securities with the intention of holding the securities, it may sell the securities before the settlement date. Sufficient assets have been segregated for these securities.
d. Foreign Currency Contracts
When the Fund purchases or sells foreign securities it may enter into foreign exchange contracts to minimize foreign exchange risk from the trade date to the settlement date of the transactions. A foreign exchange contract is an agreement between two parties to exchange different currencies at an agreed upon exchange rate on a specified date. Realized and unrealized gains and losses on these contracts are included in the Statement of Operations.
The risks of these contracts include movement in the values of the foreign currencies relative to the U.S. dollar and the possible inability of the counterparties to fulfill their obligations under the contracts.
e. Mortgage Dollar Rolls
The Fund enters into mortgage dollar rolls, typically on a TBA basis. Dollar rolls are agreements between the Fund and a financial institution to simultaneously sell and repurchase a mortgage-backed security at a future date. Gains or losses are realized at the time of the sale and the difference between the repurchase price and sale price is recorded as an unrealized gain to the Fund. The risks of mortgage dollar roll transactions include the potential inability of the counterparties to fulfill their obligations.
f. Senior Floating Rate Interests
Senior secured corporate loans pay interest at rates which are periodically reset by reference to a base lending rate plus a spread. These base lending rates are generally the prime rate offered by a designated U.S. bank or the London InterBank Offered Rate (LIBOR).
FSI-23
FRANKLIN TEMPLETON VARIABLE INSURANCE PRODUCTS TRUST
FRANKLIN STRATEGIC INCOME SECURITIES FUND
Notes to Financial Statements (continued)
1. ORGANIZATION AND SIGNIFICANT ACCOUNTING POLICIES (cont.)
g. Income Taxes
No provision has been made for U.S. income taxes because the Fund’s policy is to qualify as a regulated investment company under Subchapter M of the Internal Revenue Code and to distribute substantially all of its taxable income. Fund distributions to shareholders are determined on an income tax basis and may differ from net investment income and realized gains for financial reporting purposes.
h. Security Transactions, Investment Income, Expenses and Distributions
Security transactions are accounted for on trade date. Realized gains and losses on security transactions are determined on a specific identification basis. Interest income and estimated expenses are accrued daily. Discounts and premiums on securities purchased are amortized over the lives of the respective securities. Dividend income and distributions to shareholders are recorded on the ex-dividend date.
Common expenses incurred by the Trust are allocated among the funds based on the ratio of net assets of each fund to the combined net assets. Other expenses are charged to each fund on a specific identification basis.
Realized and unrealized gains and losses and net investment income, other than class specific expenses, are allocated daily to each class of shares based upon the relative proportion of net assets of each class.
i. Accounting Estimates
The preparation of financial statements in accordance with accounting principles generally accepted in the United States of America requires management to make estimates and assumptions that affect the reported amounts of assets and liabilities at the date of the financial statements and the amounts of income and expenses during the reporting period. Actual results could differ from those estimates.
j. Guarantees and Indemnifications
Under the Trust’s organizational documents, its officers and trustees are indemnified by the Trust against certain liability arising out of the performance of their duties to the Trust. Additionally, in the normal course of business, the Trust enters into contracts with service providers that contain general indemnification clauses. The Trust’s maximum exposure under these arrangements is unknown as this would involve future claims that may be made against the Trust that have not yet occurred. However, based on experience, the Trust expects the risk of loss to be remote.
FSI-24
FRANKLIN TEMPLETON VARIABLE INSURANCE PRODUCTS TRUST
FRANKLIN STRATEGIC INCOME SECURITIES FUND
Notes to Financial Statements (continued)
2. SHARES OF BENEFICIAL INTEREST
The Fund offers two classes of shares: Class 1 and Class 2. Each class of shares differs by its distribution fees, voting rights on matters affecting a single class and its exchange privilege.
At December 31, 2004, there were an unlimited number of shares authorized ($.01 par value). Transactions in the Fund’s shares were as follows:
| | | | | | | | | | | | | | |
| | | Year Ended December 31,
| |
| | | 2004
| | | 2003
| |
| Class 1 Shares: | | Shares
| | | Amount
| | | Shares
| | | Amount
| |
Shares sold | | 13,655,449 | | | $ | 168,180,688 | | | 19,399,863 | | | $ | 219,913,794 | |
Shares issued in reinvestment of distributions | | 1,305,411 | | | | 15,208,038 | | | 479,960 | | | | 5,519,538 | |
Shares redeemed | | (365,831 | ) | | | (4,419,835 | ) | | (188,670 | ) | | | (2,114,369 | ) |
| | |
| |
Net increase (decrease) | | 14,595,029 | | | $ | 178,968,891 | | | 19,691,153 | | | $ | 223,318,963 | |
| | |
| |
| Class 2 Shares: | | | | | | | | | | | | |
Shares sold | | 271,535 | | | $ | 3,332,844 | | | 181,906 | | | $ | 2,090,164 | |
Shares issued in reinvestment of distributions | | 9,404 | | | | 108,527 | | | 724 | | | | 8,268 | |
Shares redeemed | | (69,205 | ) | | | (843,008 | ) | | (50,283 | ) | | | (578,909 | ) |
| | |
| |
Net increase (decrease) | | 211,734 | | | $ | 2,598,363 | | | 132,347 | | | $ | 1,519,523 | |
| | |
| |
3. TRANSACTIONS WITH AFFILIATES
Certain officers and trustees of the Fund are also officers and/or directors of the following entities:
| | |
| Entity | | Affiliation |
Franklin Advisers Inc. (Advisers) | | Investment manager |
Franklin Templeton Services LLC (FT Services) | | Administrative manager |
Franklin Templeton Distributors Inc. (Distributors) | | Principal underwriter |
Franklin Templeton Investor Services LLC (Investor Services) | | Transfer agent |
a. Management Fees
The Fund pays an investment management fee to Advisers based on the average daily net assets of the Fund as follows:
| | |
| Annualized Fee Rate | | Net Assets |
| .425% | | First $500 million |
| .325% | | Over $500 million, up to and including $1 billion |
| .280% | | Over $1 billion, up to and including $1.5 billion |
Fees are further reduced on net assets over $1.5 billion.
b. Administrative Fees
The Fund pays an administrative fee to FT Services of .20% per year of the average daily net assets of the Fund.
FSI-25
FRANKLIN TEMPLETON VARIABLE INSURANCE PRODUCTS TRUST
FRANKLIN STRATEGIC INCOME SECURITIES FUND
Notes to Financial Statements (continued)
3. TRANSACTIONS WITH AFFILIATES (cont.)
c. Distribution Fees
The Fund reimburses Distributors up to .25% per year of its average daily net assets of Class 2 for costs incurred in marketing the Fund’s shares under a Rule 12b-1 plan.
d. Transfer Agent Fees
Investor Services, under terms of an agreement, performs shareholder servicing for the Fund and is not paid by the Fund for the services.
4. EXPENSE OFFSET ARRANGEMENT
The Fund has entered into an arrangement with its custodian whereby credits realized as a result of uninvested cash balances are used to reduce a portion of the Fund’s custodian expenses. During the year ended December 31, 2004, the custodian fees were reduced as noted in the Statement of Operations.
5. INCOME TAXES
At December 31, 2004, the Fund had deferred capital losses occurring subsequent to October 31, 2004 of $166,730. For tax purposes, such losses will be reflected in the year ending December 31, 2005.
At December 31, 2004, the Fund had deferred ordinary income losses occurring subsequent to October 31, 2004 of $136,543. For tax purposes, such losses will be reflected in the year ending December 31, 2005.
The tax character of distributions paid during the years ended December 31, 2004 and 2003, was as follows:
| | | | | | |
| | | 2004
| | 2003
|
Distributions paid from: | | | | | | |
Ordinary income | | $ | 15,056,746 | | $ | 5,527,807 |
Long term capital gain | | | 259,819 | | | — |
| | |
|
| | | $ | 15,316,565 | | $ | 5,527,807 |
| | |
|
Net investment income (loss) differs for financial statement and tax purposes primarily due to differing treatments of defaulted securities, foreign currency transactions, mortgage dollar rolls, paydown losses, and bond discounts and premiums.
Net realized gains (losses) differ for financial statement and tax purposes primarily due to differing treatments of wash sales, foreign currency transactions, mortgage dollar rolls, paydown losses, and bond discounts and premiums.
At December 31, 2004, the cost of investments, net unrealized appreciation (depreciation), undistributed ordinary income and undistributed long term capital gains for income tax purposes were as follows:
| | | | |
Cost of investments | | $ | 536,953,684 | |
| | |
|
|
|
Unrealized appreciation | | $ | 38,378,003 | |
Unrealized depreciation | | | (1,801,084 | ) |
| | |
|
|
|
Net unrealized appreciation (depreciation) | | $ | 36,576,919 | |
| | |
|
|
|
Undistributed ordinary income | | $ | 31,412,155 | |
Undistributed long term capital gains | | | 2,113,798 | |
| | |
|
|
|
Distributable earnings | | $ | 33,525,953 | |
| | |
|
|
|
FSI-26
FRANKLIN TEMPLETON VARIABLE INSURANCE PRODUCTS TRUST
FRANKLIN STRATEGIC INCOME SECURITIES FUND
Notes to Financial Statements (continued)
6. INVESTMENT TRANSACTIONS
Purchases and sales of investments (excluding short-term securities) for the year ended December 31, 2004, aggregated $415,239,713 and $223,902,663 respectively.
7. INVESTMENTS IN FRANKLIN INSTITUTIONAL FIDUCIARY TRUST MONEY MARKET PORTFOLIO
The Fund may invest in the Franklin Institutional Fiduciary Trust Money Market Portfolio (the Sweep Money Fund), an open-end investment company managed by Advisers. Management fees paid by the Fund are reduced on assets invested in the Sweep Money Fund, in an amount not to exceed the management fees paid by the Sweep Money Fund.
8. CREDIT RISK AND DEFAULTED SECURITIES
The Fund has 52.3% of its portfolio invested in below investment grade and comparable quality unrated high yield securities, which tend to be more sensitive to economic conditions than higher rated securities. The risk of loss due to default by the issuer may be significantly greater for the holders of high yielding securities because such securities are generally unsecured and are often subordinated to other creditors of the issuer.
The Fund held defaulted securities and/or other securities for which the income has been deemed uncollectible. At December 31, 2004, the value of these securities was $493,500, representing .09% of the Fund’s net assets. The Fund discontinues accruing income on securities for which income has been deemed uncollectible and provides an estimate for losses on interest receivable. For information as to specific securities, see the accompanying Statement of Investments.
9. REGULATORY MATTERS
Investigations
As part of various investigations by a number of federal, state, and foreign regulators and governmental entities, including the Securities and Exchange Commission (“SEC”), the California Attorney General’s Office (“CAGO”), and the National Association of Securities Dealers, Inc. (“NASD”), relating to certain practices in the mutual fund industry, including late trading, market timing and marketing support payments to securities dealers who sell fund shares, Franklin Resources, Inc. and certain of its subsidiaries (as used in this section, together, the “Company”), as well as certain current or former executives and employees of the Company, received subpoenas and/or requests for documents, information and/or testimony. The Company and its current employees provided documents and information in response to those requests and subpoenas.
Settlements
Beginning in August 2004, the Company entered into settlements with certain regulators investigating the mutual fund industry practices noted above. The Company believes that settlement of each of the matters described in this section is in the best interest of the Company and shareholders of the Franklin, Templeton, and Mutual Series mutual funds (the “funds”).
On August 2, 2004, Franklin Resources, Inc. announced that its subsidiary, Franklin Advisers, Inc., reached an agreement with the SEC that resolved the issues resulting from the SEC investigation into market timing activity. In connection with that agreement, the SEC issued an “Order Instituting Administrative and Cease-and-Desist Proceedings Pursuant to Sections 203(e) and 203(k) of the Investment Advisers Act of 1940 and Sections 9(b) and 9(f) of the Investment Company Act of 1940, Making Findings and Imposing Remedial Sanctions and a Cease-and-Desist Order” (the “Order”). The SEC’s Order concerned the activities of a limited number of third parties that ended in 2000 and those that were the subject of the first Massachusetts administrative complaint described below.
FSI-27
FRANKLIN TEMPLETON VARIABLE INSURANCE PRODUCTS TRUST
FRANKLIN STRATEGIC INCOME SECURITIES FUND
Notes to Financial Statements (continued)
9. REGULATORY MATTERS (cont.)
Settlements (cont.)
Under the terms of the SEC’s Order, pursuant to which Franklin Advisers, Inc. neither admitted nor denied any of the findings contained therein, Franklin Advisers, Inc. agreed to pay $50 million, of which $20 million is a civil penalty, to be distributed to shareholders of certain funds in accordance with a plan to be developed by an independent distribution consultant. At this time, it is unclear which funds or which shareholders of any particular fund will receive distributions. The Order also required Franklin Advisers, Inc. to, among other things, enhance and periodically review compliance policies and procedures.
On September 20, 2004, Franklin Resources, Inc. announced that two of its subsidiaries, Franklin Advisers, Inc. and Franklin Templeton Alternative Strategies, Inc. (“FTAS”), reached an agreement with the Securities Division of the Office of the Secretary of the Commonwealth of Massachusetts (the “State of Massachusetts”) related to its administrative complaint filed on February 4, 2004, concerning one instance of market timing that was also a subject of the August 2, 2004 settlement that Franklin Advisers, Inc. reached with the SEC, as described above.
Under the terms of the settlement consent order issued by the State of Massachusetts, Franklin Advisers, Inc. and FTAS consented to the entry of a cease-and-desist order and agreed to pay a $5 million administrative fine to the State of Massachusetts (the “Massachusetts Consent Order”). The Massachusetts Consent Order included two different sections: “Statements of Fact” and “Violations of Massachusetts Securities Laws.” Franklin Advisers, Inc. and FTAS admitted the facts in the Statements of Fact.
On October 25, 2004, the State of Massachusetts filed a second administrative complaint, alleging that Franklin Resources, Inc.’s Form 8-K filing (in which it described the Massachusetts Consent Order and stated that “Franklin did not admit or deny engaging in any wrongdoing”) failed to state that Franklin Advisers, Inc. and FTAS admitted the Statements of Fact portion of the Massachusetts Consent Order (the “Second Complaint”). Franklin Resources, Inc. reached a second agreement with the State of Massachusetts on November 19, 2004, resolving the Second Complaint. As a result of the November 19, 2004 settlement, Franklin Resources, Inc. filed a new Form 8-K. The terms of the Massachusetts Consent Order did not change and there was no monetary fine associated with this second settlement.
On November 17, 2004, Franklin Resources, Inc. announced that Franklin/Templeton Distributors, Inc. (“FTDI”) reached an agreement with the CAGO, resolving the issues resulting from the CAGO’s investigation concerning sales and marketing support payments. Under the terms of the settlement, FTDI neither admitted nor denied the allegations in the CAGO’s complaint and agreed to pay $2 million to the State of California as a civil penalty, $14 million to the funds, to be allocated by an independent distribution consultant to be paid for by FTDI, and $2 million to the CAGO for its investigative costs.
On December 13, 2004, Franklin Resources, Inc. announced that its subsidiaries FTDI and Franklin Advisers, Inc. reached an agreement with the SEC, resolving the issues resulting from the SEC’s investigation concerning marketing support payments to securities dealers who sell fund shares. In connection with that agreement, the SEC issued an “Order Instituting Administrative and Cease-and-Desist Proceedings, Making Findings, and Imposing Remedial Sanctions Pursuant to Sections 203(e) and 203(k) of the Investment Advisers Act of 1940, Sections 9(b) and 9(f) of the Investment Company Act of 1940, and Section 15(b) of the Securities Exchange Act of 1934” (the “Second Order”).
Under the terms of the Second Order, in which FTDI and Franklin Advisers, Inc. neither admitted nor denied the findings contained therein, they agreed to pay the funds a penalty of $20 million and disgorgement of $1 (one dollar). FTDI and Franklin Advisers, Inc. also agreed to implement certain measures and undertakings relating to marketing support payments to broker-dealers for the promotion or sale of fund shares, including making additional disclosures in the funds’ Prospectuses and Statements of Additional Information. The Second Order further requires the appointment of an independent distribution consultant, at the Company’s expense, who shall develop a plan for the distribution of the penalty and disgorgement to the funds.
FSI-28
FRANKLIN TEMPLETON VARIABLE INSURANCE PRODUCTS TRUST
FRANKLIN STRATEGIC INCOME SECURITIES FUND
Notes to Financial Statements (continued)
9. REGULATORY MATTERS (cont.)
Other Legal Proceedings
The Trust, in addition to the Company and other funds, and certain current and former officers, employees, and directors have been named in multiple lawsuits in different federal courts in Nevada, California, Illinois, New York and Florida, alleging violations of various federal securities laws and seeking, among other relief, monetary damages, restitution, removal of fund trustees, directors, advisers, administrators, and distributors, rescission of management contracts and 12b-1 Plans, and/or attorneys’ fees and costs. Specifically, the lawsuits claim breach of duty with respect to alleged arrangements to permit market timing and/or late trading activity, or breach of duty with respect to the valuation of the portfolio securities of certain Templeton funds managed by Franklin Resources, Inc. subsidiaries, resulting in alleged market timing activity. The majority of these lawsuits duplicate, in whole or in part, the allegations asserted in the February 4, 2004 Massachusetts administrative complaint and the findings in the SEC’s August 2, 2004 Order, as described above. The lawsuits are styled as class actions, or derivative actions on behalf of either the named funds or Franklin Resources, Inc.
In addition, the Company, as well as certain current and former officers, employees, and directors, have been named in multiple lawsuits alleging violations of various securities laws and pendent state law claims relating to the disclosure of directed brokerage payments and/or payment of allegedly excessive advisory, commission, and distribution fees, and seeking, among other relief, monetary damages, restitution, rescission of advisory contracts, including recovery of all fees paid pursuant to those contracts, an accounting of all monies paid to the named advisers, declaratory relief, injunctive relief, and/or attorneys’ fees and costs. These lawsuits are styled as class actions or derivative actions brought on behalf of certain funds.
The Company and fund management strongly believes that the claims made in each of the lawsuits identified above are without merit and intends to vigorously defend against them. The Company cannot predict with certainty, however, the eventual outcome of the remaining governmental investigations or private lawsuits, nor whether they will have a material negative impact on the Company. Public trust and confidence are critical to the Company’s business and any material loss of investor and/or client confidence could result in a significant decline in assets under management by the Company, which would have an adverse effect on the Company’s future financial results. If the Company finds that it bears responsibility for any unlawful or inappropriate conduct that caused losses to the Trust, it is committed to making the Trust or its shareholders whole, as appropriate. The Company is committed to taking all appropriate actions to protect the interests of its funds’ shareholders.
FSI-29
FRANKLIN TEMPLETON VARIABLE INSURANCE PRODUCTS TRUST
FRANKLIN STRATEGIC INCOME SECURITIES FUND
Report of Independent Registered Public Accounting Firm
To the Trustees and Shareholders of
Franklin Templeton Variable Insurance Products Trust:
In our opinion, the accompanying statement of assets and liabilities, including the statement of investments, and the related statements of operations and of changes in net assets and the financial highlights present fairly, in all material respects, the financial position of the Franklin Strategic Income Securities Fund (the Fund) (one of the funds constituting Franklin Templeton Variable Insurance Products Trust) at December 31, 2004, the results of each of its operations for the year then ended, the changes in its net assets for each of the two years in the period then ended and the financial highlights for each of the periods presented, in conformity with accounting principles generally accepted in the United States of America. These financial statements and financial highlights (hereafter referred to as “financial statements”) are the responsibility of the Fund’s management; our responsibility is to express an opinion on these financial statements based on our audits. We conducted our audits of these financial statements in accordance with the standards of the Public Company Accounting Oversight Board (United States). Those standards require that we plan and perform the audits to obtain reasonable assurance about whether the financial statements are free of material misstatement. An audit includes examining, on a test basis, evidence supporting the amounts and disclosures in the financial statements, assessing the accounting principles used and significant estimates made by management, and evaluating the overall financial statement presentation. We believe that our audits, which included confirmation of securities at December 31, 2004 by correspondence with the custodian and brokers, provide a reasonable basis for our opinion.
PricewaterhouseCoopers LLP
San Francisco, California
February 9, 2005
FSI-30
FRANKLIN TEMPLETON VARIABLE INSURANCE PRODUCTS TRUST
FRANKLIN STRATEGIC INCOME SECURITIES FUND
Tax Designation (unaudited)
Under Section 852(b)(3)(C) of the Internal Revenue Code (Code), the Fund hereby designates $2,115,877 as a capital gain dividend for the fiscal year ended December 31, 2004.
FSI-31
FRANKLIN U.S. GOVERNMENT FUND
This annual report for Franklin U.S. Government Fund covers the fiscal year ended December 31, 2004.
Performance Summary as of 12/31/04
Average annual total return of Class 2 shares* represents the average annual change in value, assuming reinvestment of dividends and capital gains. Average returns smooth out variations in returns, which can be significant; they are not the same as year-by-year results.
Periods ended 12/31/04
| | | | | | | | |
| | | 1-Year | | 5-Year | | 10-Year | | |
Average Annual Total Return | | +3.48% | | +6.79% | | +7.16% | | |
*Because Class 2 shares were not offered until 1/6/99, standardized Class 2 Fund performance for prior periods represents the historical results of Class 1 shares. For periods beginning on 1/6/99, Class 2’s results reflect an additional 12b-1 fee expense, which also affects future performance. Since 1/6/99 (effective date), the average annual total return of Class 2 shares was +5.44%.
Total Return Index Comparison for Hypothetical $10,000 Investment (1/1/95–12/31/04)
The graph below shows the change in value of a hypothetical $10,000 investment in the Fund over the indicated period and includes reinvestment of any income or distributions. The Fund’s performance* is compared to the performance of the Lehman Brothers (LB) U.S. Intermediate Government Bond Index and the Lipper VIP General U.S. Government Funds Objective Average, as well as the Consumer Price Index (CPI). One cannot invest directly in an index, nor is an index representative of the Fund’s portfolio. Please see Important Notes to Performance Information preceding the Fund Summaries.
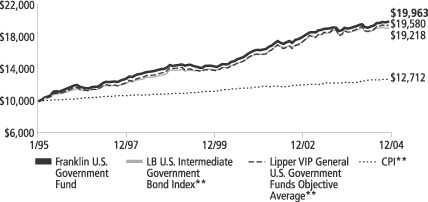
**Sources: Standard & Poor’s Micropal; Lipper Inc. Please see Index Descriptions following the Fund Summaries.
Franklin U.S. Government Fund – Class 2
Performance reflects the Fund’s Class 2 operating expenses, but does not include any contract fees, expenses or sales charges. If they had been included, performance would be lower. These charges and deductions, particularly for variable life policies, can have a significant effect on contract values and insurance benefits. See the contract prospectus for a complete description of these expenses, including sales charges.
Performance data quoted represent past performance, which does not guarantee future results. Investment return and principal value will fluctuate, and you may have a gain or loss when you sell your shares. Current performance may differ from figures shown.
FUS-1
Fund Goal and Main Investments: Franklin U.S. Government Fund seeks income. The Fund invests predominantly in U.S. government securities, primarily fixed and variable rate mortgage-backed securities.
Performance Overview
You can find the Fund’s one-year total return in the Performance Summary. Compared with its benchmarks for the same period, the Fund outperformed the LB U.S. Intermediate Government Bond Index’s 2.33% return, but underperformed the Lipper VIP General U.S. Government Funds Objective Average’s 3.92% return for the same period.1
Economic and Market Overview
During the year under review, there was much focus on the employment picture and its resulting effects on the consumer. Although nonfarm payroll statistics were mixed, stronger employment growth fundamentals were reflected in several sources. One was the National Federation of Independent Businesses (NFIB) survey, which was notable because small businesses historically have created about two-thirds of all new jobs.2 During the period under review, more jobs combined with income tax reductions helped increase consumers’ disposable income and allowed them to continue spending, in turn boosting economic growth.
Increases in business spending also contributed to economic growth. After steadily declining in 2001 and 2002, business spending posted strong results during 2004. For example, nonresidential investment spending rose 10.3% for the year.3 Historically low interest rates during the reporting period allowed many businesses the opportunity to refinance their old debt at more attractive levels. This helped enhance business operating performance, and corporate profits reflected this data. Many corporate debt investments also benefited from this improvement. Productivity continued to grow, which helped businesses generate more goods and services without substantially raising inflation.
Energy prices rose substantially during the year, and then declined toward the end, as oil ended the year at approximately $43 a barrel. In an effort to keep inflation in check, the Federal Reserve Board raised the federal funds target rate to 2.25% from 1.00% during the reporting
1. Sources: Standard & Poor’s Micropal; Lipper Inc. One cannot invest directly in an index, nor is an index representative of the Fund’s portfolio. Please see Index Descriptions following the Fund Summaries.
2. Source: Dennis, William J., Jr., NFIB Research Foundation, “The Public Reviews Small Business,” 8/04.
3. Source: Bureau of Economic Analysis.
Fund Risks: Interest rate movements and mortgage prepayment rates may impact the Fund’s share price and yield. U.S. government securities owned by the Fund, but not shares of the Fund, are guaranteed by the U.S. government, its agencies or instrumentalities as to the timely payment of principal and interest. The Fund’s prospectus also includes a description of the main investment risks.
FUS-2
period. However, the core Consumer Price Index, a measure of inflation excluding food and energy costs, rose a relatively modest 2.2% for the 12 months ended December 31, 2004, and helped contribute to the continued low interest rate level during the period.4 Many analysts had expected the 10-year U.S. Treasury yield to increase significantly; however, it ended the year relatively flat. This yield began the year at 4.27%, rose to a high of 4.89% and declined to 4.24% on December 31, 2004.
Investment Strategy
We seek to buy, and hold, high-quality income securities. Using this straightforward approach, we seek to produce current income with a high degree of credit safety from a conservatively managed portfolio of U.S. government securities. Analyzing securities using proprietary and non-proprietary research, we seek to identify attractive investment opportunities.
Manager’s Discussion
Based on our research, we believe mortgage-backed securities and agency securities offer attractive risk-adjusted returns. In the mortgage-backed securities sector, we used our research seeking to uncover areas of the markets where we thought mortgage risk may have offered value. We looked at instruments across the coupon spectrum. In the agency arena, we maintained our positions as we thought they remained attractive core holdings, based on our strategy. The income premium provided by these debentures can help the sector achieve strong risk-adjusted returns across cycles.
Thank you for your participation in Franklin U.S. Government Fund. We look forward to serving your future investment needs.
4. Source: Bureau of Labor Statistics.
The foregoing information reflects our analysis, opinions and portfolio holdings as of December 31, 2004, the end of the reporting period. The way we implement our main investment strategies and the resulting portfolio holdings may change depending on factors such as market and economic conditions. These opinions may not be relied upon as investment advice or an offer for a particular security. The information is not a complete analysis of every aspect of any market, country, industry, security or the Fund. Statements of fact are from sources considered reliable, but the adviser makes no representation or warranty as to their completeness or accuracy. Although historical performance is no guarantee of future results, these insights may help you understand our investment management philosophy.
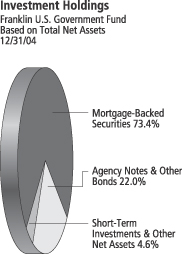
The dollar value, number of shares or principal amount, and names of all portfolio holdings are listed in the Fund’s Statement of Investments.
FUS-3
Fund Expenses
As an investor in a variable insurance contract (“Contract”) that indirectly provides for investment in an underlying mutual fund, you can incur transaction and/or ongoing expenses at both the Fund level and the Contract level.
| • | | Transaction expenses can include sales charges (loads) on purchases, redemption fees, surrender fees, transfer fees and premium taxes. |
| • | | Ongoing expenses can include management fees, distribution and service (12b-1) fees, contract fees, annual maintenance fees, mortality and expense risk fees and other fees and expenses. All mutual funds and Contracts have some types of ongoing expenses. |
The expenses shown in the table below are meant to highlight ongoing expenses at the Fund level only and do not include ongoing expenses at the Contract level, or transaction expenses at either the Fund or Contract levels. While the Fund does not have transaction expenses, if the transaction and ongoing expenses at the Contract level were included, the expenses shown below would be higher. You should consult your Contract prospectus or disclosure document for more information.
The table shows Fund-level ongoing expenses and can help you understand these expenses and compare them with those of other mutual funds offered through the Contract. The table assumes a $1,000 investment held for the six months indicated. Please refer to the Fund prospectus for additional information on operating expenses.
Actual Fund Expenses
The first line (Actual) for each share class listed in the table below provides actual account values and expenses. The “Ending Account Value” is derived from the Fund’s actual return, which includes the effect of ongoing Fund expenses, but does not include the effect of ongoing Contract expenses.
You can estimate the Fund-level expenses you incurred during the period, by following these steps. Of course, your account value and expenses will differ from those in this illustration:
| 1. | Divide your account value by $1,000. |
If an account had an $8,600 value, then $8,600 ÷ $1,000 = 8.6.
| 2. | Multiply the result by the number under the heading “Fund-Level Expenses Incurred During Period.” |
If Fund-Level Expenses Incurred During Period were $7.50, then 8.6 × $7.50 = $64.50.
Franklin U.S. Government Fund – Class 2
FUS-4
In this illustration, the estimated expenses incurred this period at the Fund level are $64.50.
Hypothetical Example for Comparison with Other Mutual Funds
Information in the second line (Hypothetical) for each class in the table can help you compare ongoing expenses of the Fund with those of other mutual funds offered through the Contract. This information may not be used to estimate the actual ending account balance or expenses you incurred during the period. The hypothetical “Ending Account Value” is based on the actual expense ratio for each class and an assumed 5% annual rate of return before expenses, which does not represent the Fund’s actual return. The figure under the heading “Fund-Level Expenses Incurred During Period” shows the hypothetical expenses your account would have incurred under this scenario. You can compare this figure with the 5% hypothetical examples that appear in shareholder reports of other funds offered through a Contract.
| | | | | | | | | |
| Class 2 | | Beginning
Account
Value 6/30/04 | | Ending
Account
Value 12/31/04 | | Fund-Level
Expenses Incurred
During Period*
6/30/04-12/31/04 |
Actual | | $ | 1,000 | | $ | 1,031.30 | | $ | 4.14 |
Hypothetical (5% return before expenses) | | $ | 1,000 | | $ | 1,021.06 | | $ | 4.12 |
*Expenses are equal to the annualized expense ratio for the Fund’s Class 2 shares (0.81%), which does not include any ongoing expenses of the Contract for which the Fund is an investment option, multiplied by the average account value over the period, multiplied by 184/366 to reflect the one-half year period.
FUS-5
FRANKLIN TEMPLETON VARIABLE INSURANCE PRODUCTS TRUST
FRANKLIN U.S. GOVERNMENT FUND
Financial Highlights
| | | | | | | | | | | | | | | | | | | | |
| | | Class 1
| |
| | | Year Ended December 31,
| |
| | | 2004 | | | 2003 | | | 2002 | | | 2001 | | | 2000 | |
| | |
|
|
|
Per share operating performance | | | | | | | | | | | | | | | | | | | | |
(for a share outstanding throughout the year) | | | | | | | | | | | | | | | | | | | | |
Net asset value, beginning of year | | $ | 13.22 | | | $ | 13.61 | | | $ | 13.16 | | | $ | 13.16 | | | $ | 11.78 | |
| | |
|
|
|
Income from investment operations: | | | | | | | | | | | | | | | | | | | | |
Net investment incomea | | | .51 | | | | .51 | | | | .71 | | | | .80 | d | | | .79 | |
Net realized and unrealized gains (losses) | | | (.05 | ) | | | (.18 | ) | | | .57 | | | | .17 | d | | | .60 | |
| | |
|
|
|
Total from investment operations | | | .46 | | | | .33 | | | | 1.28 | | | | .97 | | | | 1.39 | |
| | |
|
|
|
Less distributions from net investment income | | | (.69 | ) | | | (.72 | ) | | | (.83 | ) | | | (.97 | ) | | | (.01 | ) |
| | |
|
|
|
Net asset value, end of year | | $ | 12.99 | | | $ | 13.22 | | | $ | 13.61 | | | $ | 13.16 | | | $ | 13.16 | |
| | |
|
|
|
| | | | | |
Total returnb | | | 3.71% | | | | 2.43% | | | | 10.08% | | | | 7.62% | | | | 11.82% | |
Ratios/supplemental data | | | | | | | | | | | | | | | | | | | | |
Net assets, end of year (000’s) | | $ | 259,833 | | | $ | 311,864 | | | $ | 382,663 | | | $ | 392,453 | | | $ | 424,513 | |
Ratios to average net assets: | | | | | | | | | | | | | | | | | | | | |
Expenses | | | .54% | | | | .53% | | | | .54% | | | | .53% | | | | .52% | |
Net investment income | | | 3.90% | | | | 3.79% | | | | 5.34% | | | | 6.06% | d | | | 6.48% | |
Portfolio turnover rate | | | 75.93% | | | | 72.09% | | | | 86.86% | | | | 35.94% | | | | 6.28% | |
Portfolio turnover rate excluding mortgage dollar rollsc | | | 33.63% | | | | 23.26% | | | | 38.47% | | | | 29.09% | | | | — | |
| a | Based on average daily shares outstanding. |
| b | Total return does not include any fees, charges or expenses imposed by the variable annuity and life insurance contracts for which the Franklin Templeton Variable Insurance Products Trust serves as an underlying investment vehicle. Total return is not annualized for periods less than one year. |
| c | See Note 1(d) regarding mortgage dollar rolls. |
| d | Effective January 1, 2001, the Fund adopted the provisions of the AICPA Audit and Accounting Guide for Investment Companies and began recording all paydown gains and losses as part of investment income, as required. The effect of this change was as follows: |
| | |
Net investment income per share | | $.016 |
Net realized and unrealized gains per share | | (.016) |
Ratio of net investment income to average net assets | | .12% |
Per share data and ratios for prior periods have not been restated to reflect this change in accounting policy.
FUS-6
FRANKLIN TEMPLETON VARIABLE INSURANCE PRODUCTS TRUST
FRANKLIN U.S. GOVERNMENT FUND
Financial Highlights (continued)
| | | | | | | | | | | | | | | | | | | | |
| | | Class 2
| |
| | | Year Ended December 31,
| |
| | | 2004 | | | 2003 | | | 2002 | | | 2001 | | | 2000 | |
| | |
|
|
|
Per share operating performance | | | | | | | | | | | | | | | | | | | | |
(for a share outstanding throughout the year) | | | | | | | | | | | | | | | | | | | | |
Net asset value, beginning of year | | $ | 13.08 | | | $ | 13.49 | | | $ | 13.08 | | | $ | 13.11 | | | $ | 11.78 | |
| | |
|
|
|
Income from investment operations: | | | | | | | | | | | | | | | | | | | | |
Net investment incomea | | | .47 | | | | .46 | | | | .66 | | | | .75 | d | | | .77 | |
Net realized and unrealized gains (losses) | | | (.04 | ) | | | (.16 | ) | | | .57 | | | | .18 | d | | | .57 | |
| | |
|
|
|
Total from investment operations | | | .43 | | | | .30 | | | | 1.23 | | | | .93 | | | | 1.34 | |
| | |
|
|
|
Less distributions from net investment income | | | (.67 | ) | | | (.71 | ) | | | (.82 | ) | | | (.96 | ) | | | (.01 | ) |
| | |
|
|
|
Net asset value, end of year | | $ | 12.84 | | | $ | 13.08 | | | $ | 13.49 | | | $ | 13.08 | | | $ | 13.11 | |
| | |
|
|
|
| | | | | |
Total returnb | | | 3.48% | | | | 2.21% | | | | 9.77% | | | | 7.37% | | | | 11.39% | |
Ratios/supplemental data | | | | | | | | | | | | | | | | | | | | |
Net assets, end of year (000’s) | | $ | 332,373 | | | $ | 240,047 | | | $ | 136,875 | | | $ | 23,356 | | | $ | 3,961 | |
Ratios to average net assets: | | | | | | | | | | | | | | | | | | | | |
Expenses | | | .79% | | | | .78% | | | | .79% | | | | .78% | | | | .77% | |
Net investment income | | | 3.65% | | | | 3.54% | | | | 5.09% | | | | 5.69% | d | | | 6.22% | |
Portfolio turnover rate | | | 75.93% | | | | 72.09% | | | | 86.86% | | | | 35.94% | | | | 6.28% | |
Portfolio turnover rate excluding mortgage dollar rollsc | | | 33.63% | | | | 23.26% | | | | 38.47% | | | | 29.09% | | | | — | |
| a | Based on average daily shares outstanding. |
| b | Total return does not include any fees, charges or expenses imposed by the variable annuity and life insurance contracts for which the Franklin Templeton Variable Insurance Products Trust serves as an underlying investment vehicle. Total return is not annualized for periods less than one year. |
| c | See Note 1(d) regarding mortgage dollar rolls. |
| d | Effective January 1, 2001, the Fund adopted the provisions of the AICPA Audit and Accounting Guide for Investment Companies and began recording all paydown gains and losses as part of investment income, as required. The effect of this change was as follows: |
| | |
Net investment income per share | | $.016 |
Net realized and unrealized gains per share | | (.016) |
Ratio of net investment income to average net assets | | .12% |
Per share data and ratios for prior periods have not been restated to reflect this change in accounting policy.
See notes to financial statements.
FUS-7
FRANKLIN TEMPLETON VARIABLE INSURANCE PRODUCTS TRUST
FRANKLIN U.S. GOVERNMENT FUND
Statement of Investments, December 31, 2004
| | | | | | |
| | | PRINCIPAL
AMOUNT | | VALUE |
Mortgage-Backed Securities 73.4% | | | | | | |
Federal Home Loan Mortgage Corp. (FHLMC) Fixed Rate 12.8% | | | | | | |
FHLMC Gold 15 Year, 6.50%, 6/01/08 - 7/01/08 | | $ | 372,712 | | $ | 390,706 |
FHLMC Gold 30 Year, 5.00%, 9/01/33 - 4/01/34 | | | 14,520,015 | | | 14,445,803 |
FHLMC Gold 30 Year, 5.50%, 7/01/33 - 7/01/34 | | | 7,720,085 | | | 7,850,961 |
FHLMC Gold 30 Year, 5.50%, 11/01/34 | | | 14,862,091 | | | 15,112,439 |
FHLMC Gold 30 Year, 6.00%, 1/01/24 - 8/01/34 | | | 20,028,739 | | | 20,714,589 |
FHLMC Gold 30 Year, 6.50%, 11/01/23 - 7/01/32 | | | 6,194,431 | | | 6,517,894 |
FHLMC Gold 30 Year, 7.00%, 4/01/24 - 10/01/32 | | | 3,834,651 | | | 4,073,318 |
FHLMC Gold 30 Year, 7.50%, 11/01/22 - 5/01/24 | | | 291,558 | | | 314,918 |
FHLMC Gold 30 Year, 8.00%, 7/01/21 - 5/01/22 | | | 113,777 | | | 123,955 |
FHLMC Gold 30 Year, 8.50%, 7/01/21 - 2/01/22 | | | 64,656 | | | 71,342 |
FHLMC Gold 30 Year, 8.50%, 7/01/31 | | | 5,612,949 | | | 6,132,786 |
FHLMC PC 30 Year, 8.00%, 1/01/17 - 9/01/17 | | | 35,754 | | | 38,895 |
FHLMC PC 30 Year, 8.50%, 9/01/20 | | | 7,822 | | | 8,626 |
| | | | | |
|
|
| | | | | | | 75,796,232 |
| | | | | |
|
|
Federal Home Loan Mortgage Corp. (FHLMC) Adjustable Rate .2% | | | | | | |
FHLMC Cap 12.522%, Margin 2.105% + CMT, Resets Annually, 3.575%, 6/01/22 | | | 642,574 | | | 660,977 |
FHLMC Cap 13.458%, Margin 2.195% + CMT, Resets Annually, 3.752%, 2/01/19 | | | 719,809 | | | 742,628 |
| | | | | |
|
|
| | | | | | | 1,403,605 |
| | | | | |
|
|
Federal National Mortgage Association (FNMA) Fixed Rate 6.5% | | | | | | |
FNMA 15 Year, 5.50%, 6/01/16 - 11/01/17 | | | 3,688,884 | | | 3,817,980 |
FNMA 15 Year, 6.00%, 8/01/17 - 9/01/17 | | | 4,195,231 | | | 4,399,921 |
FNMA 15 Year, 7.00%, 5/01/24 | | | 122,419 | | | 130,487 |
FNMA 30 Year, 5.00%, 3/01/34 | | | 2,862,105 | | | 2,842,053 |
FNMA 30 Year, 5.50%, 4/01/33 - 5/01/34 | | | 14,320,405 | | | 14,555,159 |
FNMA 30 Year, 6.00%, 1/01/24 - 11/01/31 | | | 77,313 | | | 80,306 |
aFNMA 30 Year, 6.00%, 1/01/29 | | | 6,268,129 | | | 6,481,634 |
FNMA 30 Year, 6.50%, 1/01/24 - 8/01/32 | | | 2,316,112 | | | 2,436,592 |
FNMA 30 Year, 7.00%, 9/01/31 | | | 584,766 | | | 620,091 |
FNMA 30 Year, 7.50%, 4/01/23 - 8/01/25 | | | 323,437 | | | 347,955 |
FNMA 30 Year, 8.00%, 7/01/16 - 2/01/25 | | | 874,268 | | | 952,361 |
FNMA 30 Year, 8.50%, 10/01/19 - 8/01/21 | | | 32,911 | | | 36,358 |
FNMA 30 Year, 9.00%, 10/01/26 | | | 1,447,937 | | | 1,614,112 |
| | | | | |
|
|
| | | | | | | 38,315,009 |
| | | | | |
|
|
Federal National Mortgage Association (FNMA) Adjustable Rate 1.0% | | | | | | |
FNMA Cap 12.490%, Margin 2.00% + CMT, Resets Annually, 4.312%, 2/01/19 | | | 520,055 | | | 525,987 |
FNMA Cap 12.819%, Margin 2.127% + CMT, Resets Annually, 3.93%, 9/01/18 | | | 979,138 | | | 1,003,935 |
FNMA Cap 13.313%, Margin 2.126% + CMT, Resets Annually, 4.411%, 7/01/19 | | | 898,478 | | | 910,686 |
FNMA Cap 13.644%, Margin 2.011% + CMT, Resets Annually, 3.747%, 1/01/18 | | | 2,963,890 | | | 3,044,432 |
FNMA Cap 15.156%, Margin 2.284% + 3CMT, Resets Tri-Annually, 5.455%, 3/01/20 | | | 289,644 | | | 299,579 |
| | | | | |
|
|
| | | | | | | 5,784,619 |
| | | | | |
|
|
Government National Mortgage Association (GNMA) Fixed Rate 52.9% | | | | | | |
GNMA PL 30 Year, 7.25%, 5/15/22 - 8/15/22 | | | 556,029 | | | 571,315 |
GNMA I SF 30 Year, 5.00%, 7/15/33 - 8/15/34 | | | 22,653,876 | | | 22,701,103 |
GNMA I SF 30 Year, 5.00%, 9/15/33 | | | 6,202,258 | | | 6,217,583 |
GNMA I SF 30 Year, 5.50%, 11/15/28 - 9/15/34 | | | 62,555,633 | | | 63,969,472 |
aGNMA I SF 30 Year, 5.50%, 1/15/33 | | | 6,000,000 | | | 6,123,750 |
GNMA I SF 30 Year, 5.50%, 6/15/33 | | | 7,665,748 | | | 7,839,136 |
GNMA I SF 30 Year, 6.00%, 11/15/23 - 3/15/34 | | | 24,496,244 | | | 25,445,040 |
FUS-8
FRANKLIN TEMPLETON VARIABLE INSURANCE PRODUCTS TRUST
FRANKLIN U.S. GOVERNMENT FUND
Statement of Investments, December 31, 2004 (cont.)
| | | | | | |
| | | PRINCIPAL
AMOUNT | | VALUE |
Mortgage-Backed Securities (cont.) | | | | | | |
Government National Mortgage Association (GNMA) Fixed Rate (cont.) | | | | | | |
GNMA I SF 30 Year, 6.50%, 5/15/23 - 2/15/33 | | $ | 29,031,921 | | $ | 30,631,311 |
GNMA I SF 30 Year, 7.00%, 3/15/22 - 1/15/32 | | | 8,764,662 | | | 9,346,838 |
GNMA I SF 30 Year, 7.25%, 11/15/25 | | | 47,779 | | | 51,260 |
GNMA I SF 30 Year, 7.50%, 2/15/17 - 3/15/32 | | | 4,145,389 | | | 4,472,639 |
GNMA I SF 30 Year, 8.00%, 4/15/05 - 6/15/24 | | | 1,795,177 | | | 1,964,881 |
GNMA I SF 30 Year, 8.25%, 4/15/25 | | | 155,708 | | | 169,864 |
GNMA I SF 30 Year, 8.50%, 6/15/22 - 12/15/24 | | | 493,830 | | | 542,555 |
GNMA I SF 30 Year, 9.00%, 4/15/16 - 7/15/20 | | | 282,842 | | | 317,532 |
GNMA I SF 30 Year, 9.50%, 7/15/16 - 6/15/21 | | | 577,738 | | | 651,755 |
GNMA I SF 30 Year, 10.00%, 8/15/17 - 8/15/21 | | | 612,586 | | | 685,152 |
GNMA II SF 30 Year, 5.00%, 9/20/33 | | | 21,075,435 | | | 21,100,261 |
GNMA II SF 30 Year, 5.00%, 10/20/33 | | | 2,731,461 | | | 2,733,948 |
GNMA II SF 30 Year, 5.00%, 11/20/33 | | | 6,284,894 | | | 6,290,616 |
GNMA II SF 30 Year, 5.50%, 5/20/34 - 8/20/34 | | | 1,943,966 | | | 1,983,773 |
GNMA II SF 30 Year, 5.50%, 6/20/34 | | | 7,699,535 | | | 7,862,775 |
GNMA II SF 30 Year, 5.50%, 11/20/34 | | | 7,197,982 | | | 7,350,776 |
GNMA II SF 30 Year, 5.50%, 12/20/34 | | | 11,753,759 | | | 12,003,260 |
GNMA II SF 30 Year, 6.00%, 11/20/23 - 11/20/34 | | | 6,969,040 | | | 7,224,693 |
GNMA II SF 30 Year, 6.00%, 6/20/34 | | | 11,680,747 | | | 12,103,585 |
GNMA II SF 30 Year, 6.00%, 7/20/34 | | | 7,604,608 | | | 7,879,664 |
GNMA II SF 30 Year, 6.00%, 9/20/34 | | | 15,688,222 | | | 16,256,299 |
GNMA II SF 30 Year, 6.50%, 12/20/27 - 4/20/34 | | | 10,838,433 | | | 11,406,698 |
GNMA II SF 30 Year, 7.00%, 8/20/29 - 11/20/32 | | | 14,265,203 | | | 15,117,936 |
GNMA II SF 30 Year, 7.50%, 11/20/16 - 5/20/33 | | | 1,783,112 | | | 1,916,283 |
GNMA II SF 30 Year, 8.00%, 7/20/16 - 8/20/26 | | | 140,361 | | | 152,521 |
GNMA II SF 30 Year, 9.50%, 4/20/25 | | | 27,402 | | | 30,767 |
| | | | | |
|
|
| | | | | | | 313,115,041 |
| | | | | |
|
|
Total Mortgage-Backed Securities (Cost $427,694,357) | | | | | | 434,414,506 |
| | | | | |
|
|
Other U.S. Government and Agency Securities 22.0% | | | | | | |
Federal Farm Credit Bank, 4.45%, 8/27/10 | | | 15,000,000 | | | 15,307,695 |
Federal Farm Credit Bank, 4.50%, 7/09/07 | | | 10,000,000 | | | 10,275,120 |
Federal Home Loan Bank, 2.25%, 5/15/06 | | | 25,000,000 | | | 24,724,200 |
Federal Home Loan Bank, 2.625%, 5/15/07 | | | 15,000,000 | | | 14,765,880 |
Federal Home Loan Bank, 4.875%, 5/15/07 | | | 5,000,000 | | | 5,173,325 |
FICO, Strip, Series 12, zero cpn., 12/06/14 | | | 13,569,000 | | | 8,521,766 |
FICO, Strip, Series 16, zero cpn., 10/05/10 | | | 4,745,000 | | | 3,766,600 |
Housing and Urban Development, 96-A, 7.625%, 8/01/14 | | | 5,000,000 | | | 5,128,720 |
Housing and Urban Development, 96-A, 7.66%, 8/01/15 | | | 5,000,000 | | | 5,127,870 |
Small Business Administration, 4.35%, 6/25/19 | | | 726,044 | | | 746,605 |
Small Business Administration, 4.625%, 3/25/18 | | | 1,012,031 | | | 1,054,047 |
Small Business Administration, 6.00%, 9/01/18 | | | 5,307,436 | | | 5,597,244 |
Small Business Administration, 6.45%, 12/01/15 | | | 1,790,134 | | | 1,885,891 |
Small Business Administration, 6.70%, 12/01/16 | | | 1,954,119 | | | 2,077,106 |
Small Business Administration, 6.85%, 7/01/17 | | | 2,070,188 | | | 2,212,618 |
Tennessee Valley Authority, 5.88%, 4/01/36 | | | 10,000,000 | | | 11,009,960 |
Tennessee Valley Authority, Strip, zero cpn., 4/15/42 | | | 6,000,000 | | | 4,492,128 |
U.S. Treasury Note, 4.75%, 5/15/14 | | | 8,000,000 | | | 8,339,376 |
| | | | | |
|
|
Total Other U.S. Government and Agency Securities (Cost $124,853,027) | | | | | | 130,206,151 |
| | | | | |
|
|
Total Long Term Investments (Cost $552,547,384) | | | | | | 564,620,657 |
| | | | | |
|
|
FUS-9
FRANKLIN TEMPLETON VARIABLE INSURANCE PRODUCTS TRUST
FRANKLIN U.S. GOVERNMENT FUND
Statement of Investments, December 31, 2004 (cont.)
| | | | | | | |
| | | PRINCIPAL
AMOUNT | | VALUE | |
Short Term Investments (Cost $36,287,504) 6.1% | | | | | | | |
Repurchase Agreement | | | | | | | |
bJoint Repurchase Agreement, 1.915%, 1/03/05, (Maturity Value $36,293,296) | | $ | 36,287,504 | | $ | 36,287,504 | |
ABN AMRO Bank, N.V., New York Branch (Maturity Value $3,583,237) Banc of America Securities LLC (Maturity Value $1,343,578) Barclays Capital Inc. (Maturity Value $1,657,152) Bear, Stearns & Co. Inc. (Maturity Value $2,821,804) BNP Paribas Securities Corp. (Maturity Value $3,583,237) Deutsche Bank Securities Inc. (Maturity Value $1,791,800) Goldman, Sachs & Co. (Maturity Value $3,583,237) Greenwich Capital Markets Inc. (Maturity Value $3,583,237) Lehman Brothers Inc. (Maturity Value $3,596,303) Merrill Lynch Government Securities Inc. (Maturity Value $3,583,237) Morgan Stanley & Co. Inc. (Maturity Value $3,583,237) UBS Securities LLC (Maturity Value $3,583,237) | | | | | | | |
Collateralized by U.S. Government Agency Securities, 0.00 - 7.125%, 1/05/05 - 9/15/09;
cU.S. Treasury Bills, 3/24/05 - 3/31/05; U.S. Treasury Bonds, 9.375 - 12.00%, 5/15/05 - 2/15/06; and
U.S. Treasury Notes, 1.50 - 7.00%, 2/28/05 - 6/15/09 | | | | | | | |
| | | | | |
|
|
|
Total Investments (Cost $588,834,888) 101.5% | | | | | | 600,908,161 | |
Other Assets, less Liabilities (1.5)% | | | | | | (8,702,442 | ) |
| | | | | |
|
|
|
Net Assets 100.0% | | | | | $ | 592,205,719 | |
| | | | | |
|
|
|
Portfolio Abbreviations:
3CMT - 3 Year Constant Maturity Treasury Index
CMT - 1 Year Constant Maturity Index
FICO - Financing Corporation
PC - Participation Certificates
PL - Project Loan
SF - Single Family
| a | See Note 1(c) regarding securities purchased on a to-be-announced basis. |
| b | See Note 1(b) regarding joint repurchase agreement. |
| c | Security is traded on a discount basis with no stated coupon rate. |
See notes to financial statements.
FUS-10
FRANKLIN TEMPLETON VARIABLE INSURANCE PRODUCTS TRUST
FRANKLIN U.S. GOVERNMENT FUND
Financial Statements
Statements of Assets and Liabilities
December 31, 2004
| | | | |
Assets: | | | | |
Investments in securities: | | | | |
Cost - Unaffiliated issuers | | $ | 552,547,384 | |
Cost - Repurchase agreements | | | 36,287,504 | |
| | |
|
|
|
Total cost of investments | | | 588,834,888 | |
| | |
|
|
|
Value - Unaffiliated issuers | | | 564,620,657 | |
Value - Repurchase agreements | | | 36,287,504 | |
| | |
|
|
|
Total value of investments | | | 600,908,161 | |
| | |
|
|
|
Receivables: | | | | |
Investment securities sold | | | 61,720 | |
Capital shares sold | | | 1,143,994 | |
Interest | | | 3,233,064 | |
| | |
|
|
|
Total assets | | | 605,346,939 | |
| | |
|
|
|
Liabilities: | | | | |
Payables: | | | | |
Investment securities purchased | | | 12,619,450 | |
Capital shares redeemed | | | 108,513 | |
Affiliates | | | 316,213 | |
Other liabilities | | | 97,044 | |
| | |
|
|
|
Total liabilities | | | 13,141,220 | |
| | |
|
|
|
Net assets, at value | | $ | 592,205,719 | |
| | |
|
|
|
Net assets consist of: | | | | |
Undistributed net investment income | | $ | 23,168,032 | |
Net unrealized appreciation (depreciation) | | | 12,073,273 | |
Accumulated net realized gain (loss) | | | (14,327,850 | ) |
Capital shares | | | 571,292,264 | |
| | |
|
|
|
Net assets, at value | | $ | 592,205,719 | |
| | |
|
|
|
Class 1: | | | | |
Net assets, at value | | $ | 259,832,893 | |
| | |
|
|
|
Shares outstanding | | | 19,996,793 | |
| | |
|
|
|
Net asset value and offering price per share | | $ | 12.99 | |
| | |
|
|
|
Class 2: | | | | |
Net assets, at value | | $ | 332,372,826 | |
| | |
|
|
|
Shares outstanding | | | 25,887,171 | |
| | |
|
|
|
Net asset value and offering price per share | | $ | 12.84 | |
| | |
|
|
|
See notes to financial statements.
FUS-11
FRANKLIN TEMPLETON VARIABLE INSURANCE PRODUCTS TRUST
FRANKLIN U.S. GOVERNMENT FUND
Financial Statements (continued)
Statements of Operations
for the year ended December 31, 2004
| | | | |
Investment income: | | | | |
Interest | | $ | 24,914,665 | |
| | |
|
|
|
Expenses: | | | | |
Management fees (Note 3) | | | 2,777,945 | |
Distribution fees - Class 2 (Note 3) | | | 701,151 | |
Transfer agent fees | | | 6,081 | |
Custodian fees (Note 4) | | | 13,451 | |
Reports to shareholders | | | 172,513 | |
Professional fees | | | 29,353 | |
Trustees’ fees and expenses | | | 3,518 | |
Other | | | 33,110 | |
| | |
|
|
|
Total expenses | | | 3,737,122 | |
Expense reductions (Note 4) | | | (181 | ) |
| | |
|
|
|
Net expenses | | | 3,736,941 | |
| | |
|
|
|
Net investment income | | | 21,177,724 | |
| | |
|
|
|
Realized and unrealized gains (losses): | | | | |
Net realized gain (loss) from investments | | | 1,888,065 | |
Net unrealized appreciation (depreciation) on investments | | | (3,219,589 | ) |
| | |
|
|
|
Net realized and unrealized gain (loss) | | | (1,331,524 | ) |
| | |
|
|
|
Net increase (decrease) in net assets resulting from operations | | $ | 19,846,200 | |
| | |
|
|
|
See notes to financial statements.
FUS-12
FRANKLIN TEMPLETON VARIABLE INSURANCE PRODUCTS TRUST
FRANKLIN U.S. GOVERNMENT FUND
Financial Statements (continued)
Statements of Changes in Net Assets
for the years ended December 31, 2004 and 2003
| | | | | | | | |
| | | 2004 | | | 2003 | |
| | |
| |
Increase (decrease) in net assets: | | | | | | | | |
Operations: | | | | | | | | |
Net investment income | | $ | 21,177,724 | | | $ | 20,386,898 | |
Net realized gain (loss) from investments | | | 1,888,065 | | | | 3,046,596 | |
Net change in unrealized appreciation (depreciation) on investments | | | (3,219,589 | ) | | | (10,903,820 | ) |
| | |
| |
Net increase (decrease) in net assets resulting from operations | | | 19,846,200 | | | | 12,529,674 | |
Distributions to shareholders from: | | | | | | | | |
Net investment income: | | | | | | | | |
Class 1 | | | (14,507,038 | ) | | | (18,596,320 | ) |
Class 2 | | | (13,738,794 | ) | | | (10,519,204 | ) |
| | |
| |
Total distributions to shareholders | | | (28,245,832 | ) | | | (29,115,524 | ) |
Capital share transactions: (Note 2) | | | | | | | | |
Class 1 | | | (47,652,579 | ) | | | (60,577,726 | ) |
Class 2 | | | 96,329,567 | | | | 109,553,750 | |
| | |
| |
Total capital share transactions | | | 48,676,988 | | | | 48,976,024 | |
Net increase (decrease) in net assets | | | 40,277,356 | | | | 32,390,174 | |
Net assets: | | | | | | | | |
Beginning of year | | | 551,928,363 | | | | 519,538,189 | |
| | |
| |
End of year | | $ | 592,205,719 | | | $ | 551,928,363 | |
| | |
| |
Undistributed net investment income included in net assets: | | | | | | | | |
End of year | | $ | 23,168,032 | | | $ | 25,304,961 | |
| | |
| |
See notes to financial statements.
FUS-13
FRANKLIN TEMPLETON VARIABLE INSURANCE PRODUCTS TRUST
FRANKLIN U.S. GOVERNMENT FUND
Notes to Financial Statements
1. ORGANIZATION AND SIGNIFICANT ACCOUNTING POLICIES
Franklin Templeton Variable Insurance Products Trust (the Trust) is registered under the Investment Company Act of 1940 as an open-end investment company, consisting of twenty-one separate series (the Funds). The Franklin U.S. Government Fund (the Fund) included in this report is diversified. The financial statements of the remaining Funds in the series are presented separately. Shares of the Fund are sold only to insurance company separate accounts to fund the benefits of variable life insurance policies or variable annuity contracts. As of December 31, 2004 over 88% of the Fund’s shares were sold through one insurance company. The Fund’s investment objective is current income.
The following summarizes the Fund’s significant accounting policies.
a. Security Valuation
Securities listed on a securities exchange or on the NASDAQ National Market System are valued at the last quoted sale price or the official closing price of the day, respectively. Over-the-counter securities and listed securities for which there is no reported sale are valued within the range of the most recent quoted bid and ask prices. Securities that trade in multiple markets or on multiple exchanges are valued according to the broadest and most representative market. Repurchase agreements are valued at cost.
U.S. Government securities, Mortgage pass-through securities, other mortgage-backed securities, collateralized mortgage obligations and asset-backed securities generally trade in the over-the-counter market rather than on a securities exchange. The Trust may utilize independent pricing services, quotations from bond dealers, and information with respect to bond and note transactions, to assist in determining a current market value for each security. The Trust’s pricing services may use valuation models or matrix pricing which considers information with respect to comparable bond and note transactions, quotations from bond dealers, or by reference to other securities that are considered comparable in such characteristics as rating, interest rate and maturity date, option adjusted spread models, prepayment projections, interest rate spreads and yield curves, to determine current value.
The Trust has procedures to determine the fair value of individual securities and other assets for which market prices are not readily available or which may not be reliably priced. Some methods for valuing these securities may include: fundamental analysis, matrix pricing, discounts from market prices of similar securities, or discounts applied due to the nature and duration of restrictions on the disposition of the securities. Occasionally, events occur between the time at which trading in a security is completed and the close of the NYSE that might call into question the availability (including the reliability) of the value of a portfolio security held by the Fund. If such an event occurs, the securities may be valued using fair value procedures, which may include the use of independent pricing services. All security valuation procedures are approved by the Trust’s Board of Trustees.
b. Joint Repurchase Agreement
The Fund may enter into a joint repurchase agreement whereby its uninvested cash balance is deposited into a joint cash account to be used to invest in one or more repurchase agreements. The value and face amount of the joint repurchase agreement are allocated to the Fund based on its pro-rata interest. A repurchase agreement is accounted for as a loan by the Fund to the seller, collateralized by securities which are delivered to the Fund’s custodian. The market value, including accrued interest, of the initial collateralization is required to be at least 102% of the dollar amount invested by the Fund, with the value of the underlying securities marked to market daily to maintain coverage of at least 100%. At December 31, 2004, all repurchase agreements held by the Fund had been entered into on that date.
c. Securities Purchased on a TBA Basis
The Fund may purchase securities on a to-be-announced (TBA) basis, with payment and delivery scheduled for a future date. These transactions are subject to market fluctuations and are subject to the risk that the value at delivery may be more or less than the trade date purchase price. Although the Fund will generally purchase these securities with the intention of holding the securities, it may sell the securities before the settlement date. Sufficient assets have been segregated for these securities.
FUS-14
FRANKLIN TEMPLETON VARIABLE INSURANCE PRODUCTS TRUST
FRANKLIN U.S. GOVERNMENT FUND
Notes to Financial Statements (continued)
1. ORGANIZATION AND SIGNIFICANT ACCOUNTING POLICIES (cont.)
d. Mortgage Dollar Rolls
The Fund enters into mortgage dollar rolls, typically on a TBA basis. Dollar rolls are agreements between the Fund and a financial institution to simultaneously sell and repurchase a mortgage-backed security at a future date. Gains or losses are realized at the time of the sale and the difference between the repurchase price and sale price is recorded as an unrealized gain to the Fund. The risks of mortgage dollar roll transactions include the potential inability of the counterparty to fulfill its obligations.
e. Income Taxes
No provision has been made for U.S. income taxes because the Fund’s policy is to qualify as a regulated investment company under Sub Chapter M of the Internal Revenue Code and to distribute substantially all of its taxable income. Fund distributions to shareholders are determined on an income tax basis and may differ from net investment income and realized gains for financial reporting purposes.
f. Security Transactions, Investment Income, Expenses and Distributions
Security transactions are accounted for on trade date. Realized gains and losses on security transactions are determined on a specific identification basis. Interest income and estimated expenses are accrued daily. Discounts and premiums on securities purchased are amortized over the lives of the respective securities. Distributions to shareholders are recorded on the ex-dividend date.
Common expenses incurred by the Trust are allocated among the Funds based on the ratio of net assets of each fund to the combined net assets. Other expenses are charged to each fund on a specific identification basis.
Realized and unrealized gains and losses and net investment income, other than class specific expenses, are allocated daily to each class of shares based upon the relative proportion of net assets of each class.
g. Accounting Estimates
The preparation of financial statements in accordance with accounting principles generally accepted in the United States of America requires management to make estimates and assumptions that affect the reported amounts of assets and liabilities at the date of the financial statements and the amounts of income and expenses during the reporting period. Actual results could differ from those estimates.
h. Guarantees and Indemnifications
Under the Trust’s organizational documents, its officers and trustees are indemnified against certain liability arising out of the performance of their duties to the Trust. Additionally, in the normal course of business, the Trust enters into contracts with service providers that contain general indemnification clauses. The Trust’s maximum exposure under these arrangements is unknown as this would involve future claims that may be made against the Trust that have not yet occurred. However, based on experience, the Trust expects the risk of loss to be remote.
FUS-15
FRANKLIN TEMPLETON VARIABLE INSURANCE PRODUCTS TRUST
FRANKLIN U.S. GOVERNMENT FUND
Notes to Financial Statements (continued)
2. SHARES OF BENEFICIAL INTEREST
The Fund offers two classes of shares: Class 1 and Class 2. Each class of shares differs by its distribution fees, voting rights on matters affecting a single class and its exchange privilege.
At December 31, 2004, there were an unlimited number of shares authorized ($.01 par value). Transactions in the Fund’s shares were as follows:
| | | | | | | | | | | | | | |
| | | Year Ended December 31,
| |
| | | 2004
| | | 2003
| |
| Class 1 Shares: | | Shares
| | | Amount
| | | Shares
| | | Amount
| |
Shares sold | | 265,352 | | | $ | 3,467,554 | | | 429,090 | | | $ | 5,692,469 | |
Shares issued in reinvestment of distributions | | 1,161,492 | | | | 14,507,038 | | | 1,410,949 | | | | 18,596,320 | |
Shares redeemed | | (5,017,887 | ) | | | (65,627,171 | ) | | (6,372,407 | ) | | | (84,866,515 | ) |
| | |
| |
Net increase (decrease) | | (3,591,043 | ) | | $ | (47,652,579 | ) | | (4,532,368 | ) | | $ | (60,577,726 | ) |
| | |
| |
| Class 2 Shares: | | | | | | | | | | | | |
Shares sold | | 8,471,419 | | | $ | 108,971,934 | | | 10,564,288 | | | $ | 140,491,586 | |
Shares issued in reinvestment of distributions | | 1,111,553 | | | | 13,738,794 | | | 806,069 | | | | 10,519,204 | |
Shares redeemed | | (2,048,963 | ) | | | (26,381,161 | ) | | (3,162,095 | ) | | | (41,457,040 | ) |
| | |
| |
Net increase (decrease) | | 7,534,009 | | | $ | 96,329,567 | | | 8,208,262 | | | $ | 109,553,750 | |
| | |
| |
3. TRANSACTIONS WITH AFFILIATES
Certain officers and trustees of the Fund are also officers and/or directors of the following entities:
| | |
| Entity | | Affiliation |
Franklin Advisers Inc. (Advisers) | | Investment manager |
Franklin Templeton Services LLC (FT Services) | | Administrative manager |
Franklin/Templeton Distributors Inc. (Distributors) | | Principal underwriter |
Franklin/Templeton Investor Services LLC (Investor Services) | | Transfer agent |
a. Management Fees
The Fund pays an investment management fee to Advisers based on the average daily net assets of the Fund as follows:
| | |
| Annualized Fee Rate | | Net Assets |
| .625% | | First $100 million |
| .500% | | Over $100 million, up to and including $250 million |
| .450% | | Over $250 million, up to and including $10 billion |
Fees are further reduced on net assets over $10 billion.
b. Administrative Fees
Under an agreement with Advisers, FT Services provides administrative services to the Fund. The fee is paid by Advisers based on the average daily net assets, and is not an additional expense of the Fund.
c. Distribution Fees
The Fund reimburses Distributors up to .25% per year of its average daily net asset of Class 2, for costs incurred in marketing the Fund’s shares under a Rule 12b-1 plan.
d. Transfer Agent Fees
Investor Services, under terms of an agreement, performs shareholder servicing for the Fund and is not paid by the Fund for the services.
FUS-16
FRANKLIN TEMPLETON VARIABLE INSURANCE PRODUCTS TRUST
FRANKLIN U.S. GOVERNMENT FUND
Notes to Financial Statements (continued)
4. EXPENSE OFFSET ARRANGEMENT
The Fund has entered into an arrangement with its custodian whereby credits realized as a result of uninvested cash balances are used to reduce a portion of the Fund’s custodian expenses. During the period ended December 31, 2004, the custodian fees were reduced as noted in the Statement of Operations.
5. INCOME TAXES
At December 31, 2004, the Fund had tax basis capital losses of $13,812,268, which may be carried over to offset future capital gains. Such losses expire as follows:
| | | |
Capital loss carryovers expiring in: | | | |
2005 | | $ | 169,754 |
2008 | | | 5,752,213 |
2011 | | | 4,558,723 |
2012 | | | 3,331,578 |
| | |
|
|
| | | $ | 13,812,268 |
| | |
|
|
At December 31, 2004, the Fund has deferred capital losses occurring subsequent to October 31, 2004 of $503,647. For tax purposes, such losses will be reflected in the year ending December 31, 2005.
The tax character of distributions paid during the years ended December 31, 2004 and 2003, was as follows:
| | | | | | |
| | | 2004 | | 2003 |
| | |
|
Distributions paid from ordinary income | | $ | 28,245,832 | | $ | 29,115,524 |
Net investment income (loss) differs for financial statement and tax purposes primarily due to differing treatments of mortgage dollar rolls, paydown losses and bond discounts and premiums.
Net realized gains (losses) differ for financial statement and tax purposes primarily due to differing treatments of wash sales, mortgage dollar rolls, paydown losses and bond discounts and premiums.
At December 31, 2004, the cost of investments, net unrealized appreciation (depreciation) and undistributed ordinary income for income tax purposes were as follows:
| | | | |
Cost of investments | | $ | 589,651,405 | |
| | |
|
|
|
Unrealized appreciation | | $ | 12,890,661 | |
Unrealized depreciation | | | (1,633,905 | ) |
| | |
|
|
|
Net unrealized appreciation (depreciation) | | $ | 11,256,756 | |
| | |
|
|
|
Distributable earnings - undistributed ordinary income | | $ | 23,972,618 | |
| | |
|
|
|
6. INVESTMENT TRANSACTIONS
Purchases and sales of investments (excluding short-term securities) for the year ended December 31, 2004 aggregated $430,399,250 and $415,319,368, respectively.
FUS-17
FRANKLIN TEMPLETON VARIABLE INSURANCE PRODUCTS TRUST
FRANKLIN U.S. GOVERNMENT FUND
Notes to Financial Statements (continued)
7. REGULATORY MATTERS
Investigations
As part of various investigations by a number of federal, state, and foreign regulators and governmental entities, including the Securities and Exchange Commission (“SEC”), the California Attorney General’s Office (“CAGO”), and the National Association of Securities Dealers, Inc. (“NASD”), relating to certain practices in the mutual fund industry, including late trading, market timing and marketing support payments to securities dealers who sell fund shares, Franklin Resources, Inc. and certain of its subsidiaries (as used in this section, together, the “Company”), as well as certain current or former executives and employees of the Company, received subpoenas and/or requests for documents, information and/or testimony. The Company and its current employees provided documents and information in response to those requests and subpoenas.
Settlements
Beginning in August 2004, the Company entered into settlements with certain regulators investigating the mutual fund industry practices noted above. The Company believes that settlement of each of the matters described in this section is in the best interest of the Company and shareholders of the Franklin, Templeton, and Mutual Series mutual funds (the “funds”).
On August 2, 2004, Franklin Resources, Inc. announced that its subsidiary, Franklin Advisers, Inc., reached an agreement with the SEC that resolved the issues resulting from the SEC investigation into market timing activity. In connection with that agreement, the SEC issued an “Order Instituting Administrative and Cease-and-Desist Proceedings Pursuant to Sections 203(e) and 203(k) of the Investment Advisers Act of 1940 and Sections 9(b) and 9(f) of the Investment Company Act of 1940, Making Findings and Imposing Remedial Sanctions and a Cease-and-Desist Order” (the “Order”). The SEC’s Order concerned the activities of a limited number of third parties that ended in 2000 and those that were the subject of the first Massachusetts administrative complaint described below.
Under the terms of the SEC’s Order, pursuant to which Franklin Advisers, Inc. neither admitted nor denied any of the findings contained therein, Franklin Advisers, Inc. agreed to pay $50 million, of which $20 million is a civil penalty, to be distributed to shareholders of certain funds in accordance with a plan to be developed by an independent distribution consultant. At this time, it is unclear which funds or which shareholders of any particular fund will receive distributions. The Order also required Franklin Advisers, Inc. to, among other things, enhance and periodically review compliance policies and procedures.
On September 20, 2004, Franklin Resources, Inc. announced that two of its subsidiaries, Franklin Advisers, Inc. and Franklin Templeton Alternative Strategies, Inc. (“FTAS”), reached an agreement with the Securities Division of the Office of the Secretary of the Commonwealth of Massachusetts (the “State of Massachusetts”) related to its administrative complaint filed on February 4, 2004, concerning one instance of market timing that was also a subject of the August 2, 2004 settlement that Franklin Advisers, Inc. reached with the SEC, as described above.
Under the terms of the settlement consent order issued by the State of Massachusetts, Franklin Advisers, Inc. and FTAS consented to the entry of a cease-and-desist order and agreed to pay a $5 million administrative fine to the State of Massachusetts (the “Massachusetts Consent Order”). The Massachusetts Consent Order included two different sections: “Statements of Fact” and “Violations of Massachusetts Securities Laws.” Franklin Advisers, Inc. and FTAS admitted the facts in the Statements of Fact.
On October 25, 2004, the State of Massachusetts filed a second administrative complaint, alleging that Franklin Resources, Inc.’s Form 8-K filing (in which it described the Massachusetts Consent Order and stated that “Franklin did not admit or deny engaging in any wrongdoing”) failed to state that Franklin Advisers, Inc. and FTAS admitted the Statements of Fact portion of the Massachusetts Consent Order (the “Second Complaint”). Franklin Resources, Inc. reached a second agreement with the State of Massachusetts on November 19, 2004, resolving the Second Complaint. As a result of the November 19, 2004 settlement, Franklin Resources, Inc. filed a new Form 8-K. The terms of the Massachusetts Consent Order did not change and there was no monetary fine associated with this second settlement.
FUS-18
FRANKLIN TEMPLETON VARIABLE INSURANCE PRODUCTS TRUST
FRANKLIN U.S. GOVERNMENT FUND
Notes to Financial Statements (continued)
7. REGULATORY MATTERS (cont.)
Settlements (cont.)
On November 17, 2004, Franklin Resources, Inc. announced that Franklin/Templeton Distributors, Inc. (“FTDI”) reached an agreement with the CAGO, resolving the issues resulting from the CAGO’s investigation concerning sales and marketing support payments. Under the terms of the settlement, FTDI neither admitted nor denied the allegations in the CAGO’s complaint and agreed to pay $2 million to the State of California as a civil penalty, $14 million to the funds, to be allocated by an independent distribution consultant to be paid for by FTDI, and $2 million to the CAGO for its investigative costs.
On December 13, 2004, Franklin Resources, Inc. announced that its subsidiaries FTDI and Franklin Advisers, Inc. reached an agreement with the SEC, resolving the issues resulting from the SEC’s investigation concerning marketing support payments to securities dealers who sell fund shares. In connection with that agreement, the SEC issued an “Order Instituting Administrative and Cease-and-Desist Proceedings, Making Findings, and Imposing Remedial Sanctions Pursuant to Sections 203(e) and 203(k) of the Investment Advisers Act of 1940, Sections 9(b) and 9(f) of the Investment Company Act of 1940, and Section 15(b) of the Securities Exchange Act of 1934” (the “Second Order”).
Under the terms of the Second Order, in which FTDI and Franklin Advisers, Inc. neither admitted nor denied the findings contained therein, they agreed to pay the funds a penalty of $20 million and disgorgement of $1 (one dollar). FTDI and Franklin Advisers, Inc. also agreed to implement certain measures and undertakings relating to marketing support payments to broker-dealers for the promotion or sale of fund shares, including making additional disclosures in the funds’ Prospectuses and Statements of Additional Information. The Second Order further requires the appointment of an independent distribution consultant, at the Company’s expense, who shall develop a plan for the distribution of the penalty and disgorgement to the funds.
Other Legal Proceedings
The Trust, in addition to the Company and other funds, and certain current and former officers, employees, and directors have been named in multiple lawsuits in different federal courts in Nevada, California, Illinois, New York and Florida, alleging violations of various federal securities laws and seeking, among other relief, monetary damages, restitution, removal of fund trustees, directors, advisers, administrators, and distributors, rescission of management contracts and 12b-1 Plans, and/or attorneys’ fees and costs. Specifically, the lawsuits claim breach of duty with respect to alleged arrangements to permit market timing and/or late trading activity, or breach of duty with respect to the valuation of the portfolio securities of certain Templeton funds managed by Franklin Resources, Inc. subsidiaries, resulting in alleged market timing activity. The majority of these lawsuits duplicate, in whole or in part, the allegations asserted in the February 4, 2004 Massachusetts administrative complaint and the findings in the SEC’s August 2, 2004 Order, as described above. The lawsuits are styled as class actions, or derivative actions on behalf of either the named funds or Franklin Resources, Inc.
In addition, the Company, as well as certain current and former officers, employees, and directors, have been named in multiple lawsuits alleging violations of various securities laws and pendent state law claims relating to the disclosure of directed brokerage payments and/or payment of allegedly excessive advisory, commission, and distribution fees, and seeking, among other relief, monetary damages, restitution, rescission of advisory contracts, including recovery of all fees paid pursuant to those contracts, an accounting of all monies paid to the named advisers, declaratory relief, injunctive relief, and/or attorneys’ fees and costs. These lawsuits are styled as class actions or derivative actions brought on behalf of certain funds.
The Company and fund management strongly believes that the claims made in each of the lawsuits identified above are without merit and intends to vigorously defend against them. The Company cannot predict with certainty, however, the eventual outcome of the remaining governmental investigations or private lawsuits, nor whether they will have a material negative impact on the Company. Public trust and confidence are critical to the Company’s business and any material loss of investor and/or client confidence could result in a significant decline in assets under management by the Company, which would have an adverse effect on the Company’s future financial results. If the Company finds that it bears responsibility for any unlawful or inappropriate conduct that caused losses to the Trust, it is committed to making the Trust or its shareholders whole, as appropriate. The Company is committed to taking all appropriate actions to protect the interests of its funds’ shareholders.
FUS-19
FRANKLIN TEMPLETON VARIABLE INSURANCE PRODUCTS TRUST
FRANKLIN U.S. GOVERNMENT FUND
Report of Independent Registered Public Accounting Firm
To the Trustees and Shareholders of Franklin Templeton Variable Insurance Products Trust
In our opinion, the accompanying statement of assets and liabilities, including the statement of investments, and the related statements of operations and of changes in net assets and the financial highlights present fairly, in all material respects, the financial position of Franklin U.S. Government Fund (the Fund) (one of the funds constituting Franklin Templeton Variable Insurance Products Trust) at December 31, 2004, the results of its operations for the year then ended, the changes in its net assets for each of the two years in the period then ended and the financial highlights for each of the five years in the period then ended, in conformity with accounting principles generally accepted in the United States of America. These financial statements and financial highlights (hereafter referred to as “financial statements”) are the responsibility of the Fund’s management; our responsibility is to express an opinion on these financial statements based on our audits. We conducted our audits of these financial statements in accordance with the standards of the Public Company Accounting Oversight Board (United States). Those standards which require that we plan and perform the audits to obtain reasonable assurance about whether the financial statements are free of material misstatement. An audit includes examining, on a test basis, evidence supporting the amounts and disclosures in the financial statements, assessing the accounting principles used and significant estimates made by management, and evaluating the overall financial statement presentation. We believe that our audits, which included confirmation of securities at December 31, 2004 by correspondence with the custodian and brokers, provide a reasonable basis for our opinion.
PricewaterhouseCoopers LLP
San Francisco, California
February 9, 2005
FUS-20
FRANKLIN ZERO COUPON FUND 2010
This annual report for Franklin Zero Coupon Fund 2010 covers the fiscal year ended December 31, 2004.
Performance Summary as of 12/31/04
Average annual total return of Class 2 shares* represents the average annual change in value, assuming reinvestment of dividends and capital gains. Average returns smooth out variations in returns, which can be significant; they are not the same as year-by-year results.
Periods ended 12/31/04
| | | | | | |
| | | 1-Year | | 5-Year | | 10-Year |
Average Annual Total Return | | +4.45% | | +10.22% | | +10.22% |
*Because Class 2 shares were not offered until 5/12/03, standardized Class 2 Fund performance for prior periods represents the historical results of Class 1 shares. For periods beginning on 5/12/03, Class 2’s results reflect an additional 12b-1 fee expense, which also affects future performance. Since 5/12/03 (effective date), the average annual total return of Class 2 shares was +1.92%.
Total Return Index Comparison
for Hypothetical $10,000 Investment (1/1/95–12/31/04)
The graph below shows the change in value of a hypothetical $10,000 investment in the Fund over the indicated period and includes reinvestment of any income or distributions. The Fund’s performance* is compared to the performance of the Merrill Lynch 10-Year and 5-Year Zero Coupon Bond Indexes, as well as the Consumer Price Index (CPI). The 5-Year Index is replacing the 10-Year Index, reflecting the portfolio’s changing composition as it moves toward its 2010 target date. One cannot invest directly in an index, nor is an index representative of the Fund’s portfolio. Please see Important Notes to Performance Information preceding the Fund Summaries.
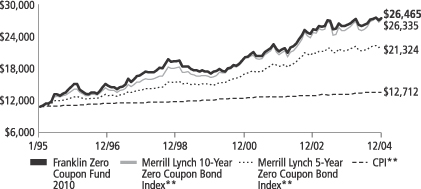
**Source: Standard & Poor’s Micropal. Please see Index Descriptions following the Fund Summaries.
Franklin Zero Coupon Fund 2010 – Class 2
Performance reflects the Fund’s Class 2 operating expenses, but does not include any contract fees, expenses or sales charges. If they had been included, performance would be lower. These charges and deductions, particularly for variable life policies, can have a significant effect on contract values and insurance benefits. See the contract prospectus for a complete description of these expenses, including sales charges.
Performance data quoted represent past performance, which does not guarantee future results. Investment return and principal value will fluctuate, and you may have a gain or loss when you sell your shares. Current performance may differ from figures shown.
FZ10-1
Fund Goal and Main Investments: Franklin Zero Coupon Fund 2010 seeks as high an investment return as is consistent with capital preservation. The Fund invests predominantly in zero coupon debt securities, primarily U.S. Treasury-issued stripped securities and stripped securities issued by the U.S. government or its agencies and authorities. The Fund may not be appropriate for those who intend to redeem units before the maturity date.
Performance Overview
You can find the Fund’s one-year total return in the Performance Summary. Compared with its benchmarks for the same period, the Fund underperformed the Merrill Lynch 10-Year Zero Coupon Bond Index’s 7.03% total return, but outperformed the Merrill Lynch 5-Year Zero Coupon Bond Index’s 3.22% total return.1
Economic and Market Overview
During the year under review, there was much focus on the employment picture and its resulting effects on the consumer. Although nonfarm payroll statistics were mixed, stronger employment growth fundamentals were reflected in several sources. One was the National Federation of Independent Businesses (NFIB) survey, which was notable because small businesses historically have created about two-thirds of all new jobs.2 During the period under review, more jobs combined with income tax reductions helped increase consumers’ disposable income and allowed them to continue spending, in turn boosting economic growth.
Increases in business spending also contributed to economic growth. After steadily declining in 2001 and 2002, business spending posted strong results during 2004. For example, nonresidential investment spending rose 10.3% for the year.3 Historically low interest rates during the reporting period allowed many businesses the opportunity to refinance their old debt at more attractive levels. This helped enhance business operating performance, and corporate profits reflected this data. Many corporate debt investments also benefited from this improvement. Productivity continued to grow, which helped businesses generate more goods and services without substantially raising inflation.
Energy prices rose substantially during the year, and then declined toward the end, as oil ended the year at approximately $43 a barrel. In an effort to keep inflation in check, the Federal Reserve Board raised the
1. Source: Standard & Poor’s Micropal. One cannot invest directly in an index, nor is an index representative of the Fund’s portfolio. Please see Index Descriptions following the Fund Summaries.
2. Source: Dennis, William J., Jr., NFIB Research Foundation, “The Public Reviews Small Business,” 8/04.
3. Source: Bureau of Economic Analysis.
Fund Risks: Because zero coupon securities do not pay interest, their market value can fall more dramatically than interest-paying securities of similar maturities when interest rates rise. The Fund’s prospectus also includes a description of the main investment risks.
FZ10-2
federal funds target rate to 2.25% from 1.00% during the reporting period. However, the core Consumer Price Index, a measure of inflation excluding food and energy costs, rose a relatively modest 2.2% for the 12 months ended December 31, 2004, and helped contribute to the continued low interest rate level during the period.4 Many analysts had expected the 10-year U.S. Treasury yield to increase significantly; however, it ended the year relatively flat. This yield began the year at 4.27%, rose to a high of 4.89% and declined to 4.24% on December 31, 2004.
Investment Strategy
In selecting investments for the Fund, we seek to keep the Fund’s average duration to within 12 months of its maturity Target Date. Duration is a measure of the length of an investment, taking into account the timing and amount of any interest payments and the principal repayment. Duration is also a measure of a bond’s price sensitivity to interest rates.
Manager’s Discussion
Zero coupon bond prices rose modestly for the year although intermediate-term Treasury note yields declined slightly. Franklin Zero Coupon Fund 2010 reflected this general market trend.
Thank you for your participation in Franklin Zero Coupon Fund 2010. We look forward to serving your future investment needs.
4. Source: Bureau of Labor Statistics.
The foregoing information reflects our analysis, opinions and portfolio holdings as of December 31, 2004, the end of the reporting period. The way we implement our main investment strategies and the resulting portfolio holdings may change depending on factors such as market and economic conditions. These opinions may not be relied upon as investment advice or an offer for a particular security. The information is not a complete analysis of every aspect of any market, country, industry, security or the Fund. Statements of fact are from sources considered reliable, but the adviser makes no representation or warranty as to their completeness or accuracy. Although historical performance is no guarantee of future results, these insights may help you understand our investment management philosophy.
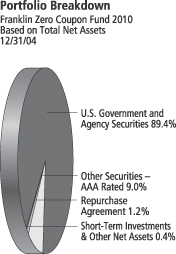
The dollar value, number of shares or principal amount, and names of all portfolio holdings are listed in the Fund’s Statement of Investments.
FZ10-3
Fund Expenses
As an investor in a variable insurance contract (“Contract”) that indirectly provides for investment in an underlying mutual fund, you can incur transaction and/or ongoing expenses at both the Fund level and the Contract level.
| • | | Transaction expenses can include sales charges (loads) on purchases, redemption fees, surrender fees, transfer fees and premium taxes. |
| • | | Ongoing expenses can include management fees, distribution and service (12b-1) fees, contract fees, annual maintenance fees, mortality and expense risk fees and other fees and expenses. All mutual funds and Contracts have some types of ongoing expenses. |
The expenses shown in the table below are meant to highlight ongoing expenses at the Fund level only and do not include ongoing expenses at the Contract level, or transaction expenses at either the Fund or Contract levels. While the Fund does not have transaction expenses, if the transaction and ongoing expenses at the Contract level were included, the expenses shown below would be higher. You should consult your Contract prospectus or disclosure document for more information.
The table shows Fund-level ongoing expenses and can help you understand these expenses and compare them with those of other mutual funds offered through the Contract. The table assumes a $1,000 investment held for the six months indicated. Please refer to the Fund prospectus for additional information on operating expenses.
Actual Fund Expenses
The first line (Actual) for each share class listed in the table below provides actual account values and expenses. The “Ending Account Value” is derived from the Fund’s actual return, which includes the effect of ongoing Fund expenses, but does not include the effect of ongoing Contract expenses.
You can estimate the Fund-level expenses you incurred during the period, by following these steps. Of course, your account value and expenses will differ from those in this illustration:
| 1. | Divide your account value by $1,000. |
If an account had an $8,600 value, then $8,600 ÷ $1,000 = 8.6.
| 2. | Multiply the result by the number under the heading “Fund-Level Expenses Incurred During Period.” |
If Fund-Level Expenses Incurred During Period were $7.50, then 8.6 × $7.50 = $64.50.
Franklin Zero Coupon Fund 2010 – Class 2
FZ10-4
In this illustration, the estimated expenses incurred this period at the Fund level are $64.50.
Hypothetical Example for Comparison with Other Mutual Funds
Information in the second line (Hypothetical) for each class in the table can help you compare ongoing expenses of the Fund with those of other mutual funds offered through the Contract. This information may not be used to estimate the actual ending account balance or expenses you incurred during the period. The hypothetical “Ending Account Value” is based on the actual expense ratio for each class and an assumed 5% annual rate of return before expenses, which does not represent the Fund’s actual return. The figure under the heading “Fund-Level Expenses Incurred During Period” shows the hypothetical expenses your account would have incurred under this scenario. You can compare this figure with the 5% hypothetical examples that appear in shareholder reports of other funds offered through a Contract.
| | | | | | | | | |
| Class 2 | | Beginning
Account
Value 6/30/04 | | Ending
Account
Value 12/31/04 | | Fund-Level
Expenses Incurred
During Period*
6/30/04-12/31/04 |
Actual | | $ | 1,000 | | $ | 1,047.20 | | $ | 4.73 |
Hypothetical (5% return before expenses) | | $ | 1,000 | | $ | 1,020.51 | | $ | 4.67 |
*Expenses are equal to the annualized expense ratio for the Fund’s Class 2 shares (0.92%), which does not include any ongoing expenses of the Contract for which the Fund is an investment option, multiplied by the average account value over the period, multiplied by 184/366 to reflect the one-half year period.
FZ10-5
SUPPLEMENT DATED FEBRUARY 9, 2005
TOTHE PROSPECTUS DATED MAY 1, 2004OF
FRANKLIN ZERO COUPON FUND: MATURINGIN DECEMBER 2010, CLASS 2
(Franklin Templeton Variable Insurance Products Trust)
The Class 2 prospectus for the Franklin Zero Coupon Fund: maturing in 2010 is amended as follows:
| I. | The Annual Fund Operating Expenses table and Example are restated as follows: |
ANNUAL FUND OPERATING EXPENSES
(expenses deducted from Fund assets)
| | |
| | | Class 2 |
Management fees1 | | 0.62% |
Distribution and service (12b-1) fees2 | | 0.25% |
Other expenses | | 0.06% |
| | |
|
Total annual Fund operating expenses | | 0.93% |
| | |
|
1. The Fund’s administration fees are paid indirectly through the management fee.
2. While the maximum amount payable under the Fund’s Class 2 rule 12b-1 plan is 0.35% per year of the Fund’s average net assets, the Fund’s Board of Trustees has set the current rate at 0.25% per year through May 1, 2005.
Example
This example can help you compare the cost of investing in the Fund with the cost of investing in other mutual funds. It assumes:
| | • | | You invest $10,000 for the periods shown; |
| | • | | Your investment has a 5% return each year; and |
| | • | | The Fund’s operating expenses remain the same. |
Although your actual costs may be higher or lower, based on these assumptions your costs would be:
| | | | | | | | | | | | |
| | | 1 Year | | 3 Years | | 5 Years | | 10 Years |
Class 2 | | $ | 95 | | $ | 296 | | $ | 515 | | $ | 1,143 |
| II. | Under “Financial Highlights,” the following “Ratios to average net assets (%)” for the year ended December 31, 2003, are restated: |
| | |
Expenses | | .934 |
Net investment income | | 4.684 |
4. Annualized.
Please keep this supplement for future reference
FZ10-6
FRANKLIN TEMPLETON VARIABLE INSURANCE PRODUCTS TRUST
FRANKLIN ZERO COUPON FUND – 2010
Financial Highlights
| | | | | | | | | | | | | | | | | | | | |
| | | Class 1
| |
| | | Year Ended December 31,
| |
| | | 2004 | | | 2003 | | | 2002 | | | 2001 | | | 2000 | |
| | |
|
|
|
Per share operating performance | | | | | | | | | | | | | | | | | | | | |
(for a share outstanding throughout the year) | | | | | | | | | | | | | | | | | | | | |
Net asset value, beginning of year | | $ | 16.55 | | | $ | 16.61 | | | $ | 15.33 | | | $ | 16.50 | | | $ | 14.15 | |
| | |
|
|
|
Income from investment operations: | | | | | | | | | | | | | | | | | | | | |
Net investment incomea | | | .81 | | | | .82 | | | | .87 | | | | .92 | | | | .94 | |
Net realized and unrealized gains (losses) | | | (.08 | ) | | | (.20 | ) | | | 2.03 | | | | (.06 | ) | | | 1.67 | |
| | |
|
|
|
Total from investment operations | | | .73 | | | | .62 | | | | 2.90 | | | | .86 | | | | 2.61 | |
| | |
|
|
|
Less distributions from: | | | | | | | | | | | | | | | | | | | | |
Net investment income | | | (.79 | ) | | | (.68 | ) | | | (.95 | ) | | | (1.21 | ) | | | (.02 | ) |
Net realized gains | | | — | | | | — | | | | (.67 | ) | | | (.82 | ) | | | (.24 | ) |
| | |
|
|
|
Total distributions | | | (.79 | ) | | | (.68 | ) | | | (1.62 | ) | | | (2.03 | ) | | | (.26 | ) |
| | |
|
|
|
Net asset value, end of year | | $ | 16.49 | | | $ | 16.55 | | | $ | 16.61 | | | $ | 15.33 | | | $ | 16.50 | |
| | |
|
|
|
| | | | | |
Total returnb | | | 4.72% | | | | 3.59% | | | | 20.10% | | | | 5.62% | | | | 18.72% | |
Ratios/supplemental data | | | | | | | | | | | | | | | | | | | | |
Net assets, end of year (000’s) | | $ | 78,978 | | | $ | 72,833 | | | $ | 68,489 | | | $ | 51,002 | | | $ | 56,720 | |
Ratios to average net assets: | | | | | | | | | | | | | | | | | | | | |
Expenses | | | .68% | | | | .68%c | | | | .68% | | | | .68% | | | | .65% | |
Net investment income | | | 4.91% | | | | 4.93%c | | | | 5.48% | | | | 5.73% | | | | 6.28% | |
Portfolio turnover rate | | | 11.74% | | | | 38.37% | | | | 19.03% | | | | 23.68% | | | | 34.39% | |
| a | Based on average daily shares outstanding. |
| b | Total return does not include any fees, charges or expenses imposed by the variable annuity and life insurance contracts for which the Franklin Templeton Variable Insurance Products Trust serves as an underlying investment vehicle. Total return is not annualized for periods less than one year. |
| cExpense | and Net investment income ratios have been corrected. As of December 31, 2003, the Expense ratio and Net investment income ratio previously presented were .65% and 4.77%, respectively. |
See notes to financial statements.
FZ10-7
FRANKLIN TEMPLETON VARIABLE INSURANCE PRODUCTS TRUST
FRANKLIN ZERO COUPON FUND – 2010
Financial Highlights (continued)
| | | | | | | | |
| | | Class 2
| |
| | | Year Ended December 31,
| |
| | | 2004 | | | 2003c | |
| | |
|
|
|
Per share operating performance | | | | | | | | |
(for a share outstanding throughout the year) | | | | | | | | |
Net asset value, beginning of year | | $ | 16.52 | | | $ | 17.39 | |
| | |
|
|
|
Income from investment operations: | | | | | | | | |
Net investment incomea | | | .77 | | | | .49 | |
Net realized and unrealized gains (losses) | | | (.08 | ) | | | (.68 | ) |
| | |
|
|
|
Total from investment operations | | | .69 | | | | (.19 | ) |
| | |
|
|
|
Less distributions from net investment income | | | (.78 | ) | | | (.68 | ) |
| | |
|
|
|
Net asset value, end of year | | $ | 16.43 | | | $ | 16.52 | |
| | |
|
|
|
| | |
Total returnb | | | 4.45% | | | | 3.40% | |
Ratios/supplemental data | | | | | | | | |
Net assets, end of year (000’s) | | $ | 14,251 | | | $ | 11,649 | |
Ratios to average net assets: | | | | | | | | |
Expenses | | | .93% | | | | .93% | d,e |
Net investment income | | | 4.66% | | | | 4.68% | d,e |
Portfolio turnover rate | | | 11.74% | | | | 38.37% | |
| a | Based on average daily shares outstanding. |
| b | Total return does not include any fees, charges or expenses imposed by the variable annuity and life insurance contracts for which the Franklin Templeton Variable Insurance Products Trust serves as an underlying investment vehicle. Total return is not annualized for periods less than one year. |
| c | For the period May 12, 2003 (effective date) to December 31, 2003. |
| eExpense | and Net investment income ratios have been corrected. As of December 31, 2003, the Expense ratio and Net investment income ratio previously presented were .90% and 4.52%, respectively. |
See notes to financial statements.
FZ10-8
FRANKLIN TEMPLETON VARIABLE INSURANCE PRODUCTS TRUST
FRANKLIN ZERO COUPON FUND - 2010
Statement of Investments, December 31, 2004
| | | | | | |
| | | PRINCIPAL
AMOUNT | | VALUE |
U.S. Government and Agency Securities 89.4% | | | | | | |
FHLMC, Strip, 7/15/10 | | $ | 11,150,000 | | $ | 8,929,968 |
FHLMC, Strip, 1/15/11 | | | 10,629,000 | | | 8,274,964 |
FICO, Strip, 19, 6/06/10 | | | 9,800,000 | | | 7,913,647 |
FICO, Strip, A, 8/08/10 | | | 7,000,000 | | | 5,597,410 |
FNMA, Strip, 8/12/09 | | | 1,975,000 | | | 1,644,950 |
FNMA, Strip, 8/01/10 | | | 8,250,000 | | | 6,416,297 |
FNMA, Strip, 8/12/10 | | | 1,230,000 | | | 973,845 |
REFCO, Strip, 10/15/10 | | | 10,000,000 | | | 7,985,780 |
Tennessee Valley Authority, Strip, 1/01/10 | | | 412,000 | | | 329,792 |
Tennessee Valley Authority, Strip, 4/15/10 | | | 12,000,000 | | | 9,669,708 |
Tennessee Valley Authority, Strip, 10/15/10 | | | 1,320,000 | | | 1,036,665 |
Tennessee Valley Authority, Strip, 1/15/11 | | | 10,669,000 | | | 8,242,357 |
Tennessee Valley Authority, Strip, 10/15/11 | | | 7,295,000 | | | 5,402,152 |
U.S. Treasury, Strip, 2/15/11 | | | 13,871,000 | | | 10,926,020 |
| | | | | |
|
|
Total U.S. Government and Agency Securities (Cost $74,355,864) | | | | | | 83,343,555 |
| | | | | |
|
|
Other Securities - AAA Rated 9.0% | | | | | | |
International Bank for Reconstruction & Development, 2/15/11 | | | 1,392,000 | | | 1,057,756 |
International Bank for Reconstruction & Development, 2/15/12 | | | 2,800,000 | | | 2,011,752 |
International Bank for Reconstruction & Development, 2/15/13 | | | 3,287,000 | | | 2,229,566 |
International Bank for Reconstruction & Development, 8/15/13 | | | 4,100,000 | | | 2,699,370 |
International Bank for Reconstruction & Development, Series 2, 2/15/11 | | | 500,000 | | | 379,941 |
| | | | | |
|
|
Total Other Securities - AAA Rated (Cost $7,055,987) | | | | | | 8,378,385 |
| | | | | |
|
|
Total Investments before Repurchase Agreement (Cost $81,411,851) | | | | | | 91,721,940 |
| | | | | |
|
|
aRepurchase Agreement (Cost $1,125,553) 1.2% | | | | | | |
Joint Repurchase Agreement, 1.915%, 1/03/05 (Maturity Value $1,125,733) | | | 1,125,553 | | | 1,125,553 |
ABN AMRO Bank, N.V., New York Branch (Maturity Value $111,144)
Banc of America Securities LLC (Maturity Value $41,674)
Barclays Capital Inc. (Maturity Value $51,401)
Bear, Stearns & Co. Inc. (Maturity Value $87,525)
BNP Paribas Securities Corp. (Maturity Value $111,144)
Deutsche Bank Securities Inc. (Maturity Value $55,576)
Goldman, Sachs & Co. (Maturity Value $111,144)
Greenwich Capital Markets Inc. (Maturity Value $111,144)
Lehman Brothers Inc. (Maturity Value $111,549)
Merrill Lynch Government Securities Inc. (Maturity Value $111,144)
Morgan Stanley & Co. Inc. (Maturity Value $111,144)
UBS Securities LLC (Maturity Value $111,144) | | | | | | |
Collateralized by U.S. Government Agency Securities, 0.00 - 7.125%, 1/01/05 - 9/15/09; | | | | | | |
bU.S. Treasury Bills, 3/24/05 - 3/31/05; U.S. Treasury Bonds, 9.375 - 12.00%, 5/15/05 - 2/15/06; and U.S. Treasury Notes, 1.50 - 7.00%, 2/28/05 - 6/15/09 | | | | | | |
| | | | | |
|
|
Total Investments (Cost $82,537,404) 99.6% | | | | | | 92,847,493 |
Other Assets, less Liabilities .4% | | | | | | 382,217 |
| | | | | |
|
|
Net Assets 100.0% | | | | | $ | 93,229,710 |
| | | | | |
|
|
Portfolio Abbreviations:
FHLMC - Federal Home Loan Mortgage Corporation
FICO - The Financing Corporation
FNMA - Federal National Mortgage Association
REFCO - The Resolution Funding Corporation
| a | See Note 1(b) regarding joint repurchase agreement. |
| b | Security is traded on a discount basis with no stated coupon rate. |
FZ10-9
FRANKLIN TEMPLETON VARIABLE INSURANCE PRODUCTS TRUST
FRANKLIN ZERO COUPON FUND – 2010
Financial Statements
Statements of Assets and Liabilities
December 31, 2004
| | | |
Assets: | | | |
Investments in securities: | | | |
Cost - Unaffiliated issuers | | $ | 81,411,851 |
Cost - Repurchase agreements | | | 1,125,553 |
| | |
|
|
Total cost of investments | | | 82,537,404 |
| | |
|
|
Value - Unaffiliated issuers | | | 91,721,940 |
Value - Repurchase agreements | | | 1,125,553 |
| | |
|
|
Total value of investments | | | 92,847,493 |
| | |
|
|
Receivables for capital shares sold | | | 456,696 |
| | |
|
|
Total assets | | | 93,304,189 |
| | |
|
|
Liabilities: | | | |
Payables: | | | |
Capital shares redeemed | | | 3,036 |
Affiliates | | | 51,569 |
Reports to shareholders | | | 4,761 |
Professional fees | | | 13,054 |
Other liabilities | | | 2,059 |
| | |
|
|
Total liabilities | | | 74,479 |
| | |
|
|
Net assets, at value | | $ | 93,229,710 |
| | |
|
|
Net assets consist of: | | | |
Undistributed net investment income | | $ | 3,957,547 |
Net unrealized appreciation (depreciation) | | | 10,310,089 |
Accumulated net realized gain (loss) | | | 8,448 |
Capital shares | | | 78,953,626 |
| | |
|
|
Net assets, at value | | $ | 93,229,710 |
| | |
|
|
Class 1: | | | |
Net assets, at value | | $ | 78,978,324 |
| | |
|
|
Shares outstanding | | | 4,790,018 |
| | |
|
|
Net asset value and offering price per share | | $ | 16.49 |
| | |
|
|
Class 2: | | | |
Net assets, at value | | $ | 14,251,386 |
| | |
|
|
Shares outstanding | | | 867,414 |
| | |
|
|
Net asset value and offering price per share | | | $16.43 |
| | |
|
|
See notes to financial statements.
FZ10-10
FRANKLIN TEMPLETON VARIABLE INSURANCE PRODUCTS TRUST
FRANKLIN ZERO COUPON FUND – 2010
Financial Statements (continued)
Statements of Operations
for the year ended December 31, 2004
| | | | |
Investment income: | | | | |
Interest | | $ | 4,910,871 | |
| | |
|
|
|
Expenses: | | | | |
Management fees (Note 3) | | | 549,307 | |
Distribution fees - Class 2 (Note 3) | | | 33,554 | |
Transfer agent fees | | | 2,023 | |
Custodian fees (Note 4) | | | 1,975 | |
Reports to shareholders | | | 27,604 | |
Professional fees | | | 11,642 | |
Trustees’ fees and expenses | | | 549 | |
Other | | | 2,700 | |
| | |
|
|
|
Total expenses | | | 629,354 | |
Expense reductions (Note 4) | | | (66 | ) |
| | |
|
|
|
Net expenses | | | 629,288 | |
| | |
|
|
|
Net investment income | | | 4,281,583 | |
| | |
|
|
|
Realized and unrealized gains (losses): | | | | |
Net realized gain (loss) from investments | | | 600,301 | |
Net change in unrealized appreciation (depreciation) on investments | | | (834,509 | ) |
| | |
|
|
|
Net realized and unrealized gain (loss) | | | (234,208 | ) |
| | |
|
|
|
Net increase (decrease) in net assets resulting from operations | | $ | 4,047,375 | |
| | |
|
|
|
See notes to financial statements.
FZ10-11
FRANKLIN TEMPLETON VARIABLE INSURANCE PRODUCTS TRUST
FRANKLIN ZERO COUPON FUND – 2010
Financial Statements (continued)
Statements of Changes in Net Assets
for the years ended December 31, 2004 and 2003
| | | | | | | | |
| | | 2004 | | | 2003 | |
| | |
| | |
| |
Increase (decrease) in net assets: | | | | | | | | |
Operations: | | | | | | | | |
Net investment income | | $ | 4,281,583 | | | $ | 3,890,007 | |
Net realized gain (loss) from investments | | | 600,301 | | | | (141,473 | ) |
Net change in unrealized appreciation (depreciation) on investments | | | (834,509 | ) | | | (1,454,844 | ) |
| | |
| | |
| |
Net increase (decrease) in net assets resulting from operations | | | 4,047,375 | | | | 2,293,690 | |
Distributions to shareholders from: | | | | | | | | |
Net investment income: | | | | | | | | |
Class 1 | | | (3,530,602 | ) | | | (3,089,057 | ) |
Class 2 | | | (683,572 | ) | | | (3,871 | ) |
| | |
| | |
| |
Total distributions to shareholders | | | (4,214,174 | ) | | | (3,092,928 | ) |
Capital share transactions: (Note 2) | | | | | | | | |
Class 1 | | | 6,152,916 | | | | 5,013,338 | |
Class 2 | | | 2,761,404 | | | | 11,778,876 | |
| | |
| | |
| |
Total capital share transactions | | | 8,914,320 | | | | 16,792,214 | |
Net increase (decrease) in net assets | | | 8,747,521 | | | | 15,992,976 | |
Net assets: | | | | | | | | |
Beginning of year | | | 84,482,189 | | | | 68,489,213 | |
| | |
| | |
| |
End of year | | $ | 93,229,710 | | | $ | 84,482,189 | |
| | |
| | |
| |
Undistributed net investment income included in net assets: | | | | | | | | |
End of year | | $ | 3,957,547 | | | $ | 3,892,403 | |
| | |
| | |
| |
See notes to financial statements.
FZ10-12
FRANKLIN TEMPLETON VARIABLE INSURANCE PRODUCTS TRUST
FRANKLIN ZERO COUPON FUND – 2010
Notes to Financial Statements
1. ORGANIZATION AND SIGNIFICANT ACCOUNTING POLICIES
Franklin Templeton Variable Insurance Products Trust (the Trust) is registered under the Investment Company Act of 1940 as an open-end investment company, consisting of twenty-one separate series (the Funds). The Franklin Zero Coupon Fund-2010 (the Fund) included in this report is diversified. The financial statements of the remaining funds in the series are presented separately. Shares of the Fund are sold only to insurance company separate accounts to fund the benefits of variable life insurance policies or variable annuity contracts. As of December 31, 2004, over 84% of the Fund’s shares were sold through one insurance company. The Fund’s investment objective is current income.
The following summarizes the Fund’s significant accounting policies.
a. Security Valuation
Securities listed on a securities exchange or on the NASDAQ National Market System are valued at the last quoted sale price or the official closing price of the day, respectively. Over-the-counter securities and listed securities for which there is no reported sale are valued within the range of the most recent quoted bid and ask prices. Securities that trade in multiple markets or on multiple exchanges are valued according to the broadest and most representative market. Repurchase agreements are valued at cost.
U.S. Government securities generally trade in the over-the-counter market rather than on a securities exchange. The Trust may utilize independent pricing services, quotations from bond dealers, and information with respect to bond and note transactions, to assist in determining a current market value for each security. The Trust’s pricing services may use valuation models or matrix pricing which considers information with respect to comparable bond and note transactions, quotations from bond dealers, or by reference to other securities that are considered comparable in such characteristics as rating, interest rate and maturity date, option adjusted spread models, prepayment projections, interest rate spreads and yield curves, to determine current value.
The Trust has procedures to determine the fair value of individual securities and other assets for which market prices are not readily available or which may not be reliably priced. Some methods for valuing these securities may include: fundamental analysis, matrix pricing, discounts from market prices of similar securities, or discounts applied due to the nature and duration of restrictions on the disposition of the securities. Occasionally, events occur between the time at which trading in a security is completed and the close of the NYSE that might call into question the availability (including the reliability) of the value of a portfolio security held by the Fund. If such an event occurs, the securities may be valued using fair value procedures, which may include the use of independent pricing services. All security valuation procedures are approved by the Trust’s Board of Trustees.
b. Joint Repurchase Agreements
The Fund may enter into a joint repurchase agreement whereby its uninvested cash balance is deposited into a joint cash account to be used to invest in one or more repurchase agreements. The value and face amount of the joint repurchase agreement are allocated to the Fund based on its pro-rata interest. A repurchase agreement is accounted for as a loan by the Fund to the seller, collateralized by securities which are delivered to the Fund’s custodian. The market value, including accrued interest, of the initial collateralization is required to be at least 102% of the dollar amount invested by the Fund, with the value of the underlying securities marked to market daily to maintain coverage of at least 100%. At December 31, 2004, all repurchase agreements held by the Fund had been entered into on that date.
c. Income Taxes
No provision has been made for U.S. income taxes because the Fund’s policy is to qualify as a regulated investment company under Sub Chapter M of the Internal Revenue Code and to distribute substantially all of its taxable income. Fund distributions to shareholders are determined on an income tax basis and may differ from net investment income and realized gains for financial reporting purposes.
FZ10-13
FRANKLIN TEMPLETON VARIABLE INSURANCE PRODUCTS TRUST
FRANKLIN ZERO COUPON FUND – 2010
Notes to Financial Statements (continued)
1. ORGANIZATION AND SIGNIFICANT ACCOUNTING POLICIES (cont.)
d. Security Transactions, Investment Income, Expenses and Distributions
Security transactions are accounted for on trade date. Realized gains and losses on security transactions are determined on a specific identification basis. Interest income and estimated expenses are accrued daily. Discounts and premiums on securities purchased are amortized over the lives of the respective securities. Distributions to shareholders are recorded on the ex-dividend date.
Common expenses incurred by the Trust are allocated among the funds based on the ratio of net assets of each fund to the combined net assets. Other expenses are charged to each fund on a specific identification basis.
Realized and unrealized gains and losses and net investment income, other than class specific expenses, are allocated daily to each class of shares based upon the relative proportion of net assets of each class.
e. Accounting Estimates
The preparation of financial statements in accordance with accounting principles generally accepted in the United States of America requires management to make estimates and assumptions that affect the reported amounts of assets and liabilities at the date of the financial statements and the amounts of income and expenses during the reporting period. Actual results could differ from those estimates.
f. Guarantees and Indemnifications
Under the Trust’s organizational documents, its officers and trustees are indemnified by the Trust against certain liability arising out of the performance of their duties to the Trust. Additionally, in the normal course of business, the Trust enters into contracts with service providers that contain general indemnification clauses. The Trust’s maximum exposure under these arrangements is unknown as this would involve future claims that may be made against the Trust that have not yet occurred. However, based on experience, the Trust expects the risk of loss to be remote.
2. SHARES OF BENEFICIAL INTEREST
The Fund offers two classes of shares: Class 1 and Class 2. Each class of shares differs by its distribution fees, voting rights on matters affecting a single class and its exchange privilege.
At December 31, 2004, there were an unlimited number of shares authorized ($.01 par value). Transactions in the Fund’s shares were as follows:
| | | | | | | | | | | | | | |
| | | Year Ended December 31,
| |
| | | 2004
| | | 2003
| |
| Class 1 Shares: | | Shares
| | | Amount
| | | Shares
| | | Amount
| |
Shares sold | | 973,868 | | | $ | 16,002,484 | | | 1,372,218 | | | $ | 23,091,741 | |
Shares issued in reinvestment of distributions | | 226,611 | | | | 3,530,602 | | | 180,120 | | | | 3,089,057 | |
Shares redeemed | | (812,206 | ) | | | (13,380,170 | ) | | (1,273,553 | ) | | | (21,167,460 | ) |
| | |
| |
Net increase (decrease) | | 388,273 | | | $ | 6,152,916 | | | 278,785 | | | $ | 5,013,338 | |
| | |
| |
| Class 2 Shares: | | | | | | | | | | | | |
Shares sold | | 780,969 | | | $ | 13,083,577 | | | 1,043,127 | | | $ | 17,281,578 | |
Shares issued in reinvestment of distributions | | 43,960 | | | | 683,572 | | | 226 | | | | 3,871 | |
Shares redeemed | | (662,743 | ) | | | (11,005,745 | ) | | (338,125 | ) | | | (5,506,573 | ) |
| | |
| |
Net increase (decrease) | | 162,186 | | | $ | 2,761,404 | | | 705,228 | | | $ | 11,778,876 | |
| | |
| |
FZ10-14
FRANKLIN TEMPLETON VARIABLE INSURANCE PRODUCTS TRUST
FRANKLIN ZERO COUPON FUND – 2010
Notes to Financial Statements (continued)
3. TRANSACTIONS WITH AFFILIATES
Certain officers and trustees of the Fund are also officers and/or directors of the following entities:
| | |
| Entity | | Affiliation |
Franklin Advisers Inc. (Advisers) | | Investment manager |
Franklin Templeton Services LLC (FT Services) | | Administrative manager |
Franklin Templeton Distributors Inc. (Distributors) | | Principal underwriter |
Franklin Templeton Investor Services LLC (Investor Services) | | Transfer agent |
a. Management Fees
The Fund pays an investment management fee to Advisers based on the average daily net assets of the Fund as follows:
| | |
| Annualized Fee Rate | | Net Assets |
| .625% | | First $100 million |
| .500% | | Over $100 million, up to and including $250 million |
| .450% | | Over $250 million, up to and including $10 billion |
Fees are further reduced on net assets over $10 billion.
b. Administrative Fees
Under an agreement with Advisers, FT Services provides administrative services to the Fund. The fee is paid by Advisers based on the average daily net assets of the Fund, and is not an additional expense of the Fund.
c. Distribution Fees
The Fund reimburses Distributors up to .25% per year of its average daily net asset of Class 2, for costs incurred in marketing the Fund’s shares under a Rule 12b-1 plan.
d. Transfer Agent Fees
Investor Services, under terms of an agreement, performs shareholder servicing for the Fund and is not paid by the Fund for the services.
4. EXPENSE OFFSET ARRANGEMENT
The Fund has entered into an arrangement with its custodian whereby credits realized as a result of uninvested cash balances are used to reduce a portion of the Fund’s custodian expenses. During the year ended December 31, 2004, the custodian fees were reduced as noted in the Statement of Operations.
5. INCOME TAXES
The tax character of distributions paid during the years ended December 31, 2004 and 2003, was as follows:
| | | | | | |
| | | 2004
| | 2003
|
Distributions paid from ordinary income | | $ | 4,214,174 | | $ | 3,092,928 |
FZ10-15
FRANKLIN TEMPLETON VARIABLE INSURANCE PRODUCTS TRUST
FRANKLIN ZERO COUPON FUND – 2010
Notes to Financial Statements (continued)
5. INCOME TAXES (cont.)
Net investment income differs for financial statement and tax purposes primarily due to differing treatments of bond discounts and premiums.
Net realized gains (losses) differ for financial statement and tax purposes primarily due to differing treatments of wash sales and bond discounts.
At December 31, 2004, the cost of investments, net unrealized appreciation (depreciation), undistributed ordinary income and undistributed long term capital gains for income tax purposes were as follows:
| | | |
Cost of investments | | $ | 82,597,104 |
| | |
|
|
Unrealized appreciation | | $ | 10,250,389 |
Unrealized depreciation | | | — |
| | |
|
|
Net unrealized appreciation (depreciation) | | $ | 10,250,389 |
| | |
|
|
Undistributed ordinary income | | $ | 3,956,932 |
Undistributed long term capital gains | | | 68,760 |
| | |
|
|
Distributable earnings | | $ | 4,025,692 |
| | |
|
|
6. INVESTMENT TRANSACTIONS
Purchases and sales of investments (excluding short-term securities) for the year ended December 31, 2004, aggregated $13,944,652 and $10,250,770, respectively.
7. REGULATORY MATTERS
Investigations
As part of various investigations by a number of federal, state, and foreign regulators and governmental entities, including the Securities and Exchange Commission (“SEC”), the California Attorney General’s Office (“CAGO”), and the National Association of Securities Dealers, Inc. (“NASD”), relating to certain practices in the mutual fund industry, including late trading, market timing and marketing support payments to securities dealers who sell fund shares, Franklin Resources, Inc. and certain of its subsidiaries (as used in this section, together, the “Company”), as well as certain current or former executives and employees of the Company, received subpoenas and/or requests for documents, information and/or testimony. The Company and its current employees provided documents and information in response to those requests and subpoenas.
Settlements
Beginning in August 2004, the Company entered into settlements with certain regulators investigating the mutual fund industry practices noted above. The Company believes that settlement of each of the matters described in this section is in the best interest of the Company and shareholders of the Franklin, Templeton, and Mutual Series mutual funds (the “funds”).
On August 2, 2004, Franklin Resources, Inc. announced that its subsidiary, Franklin Advisers, Inc., reached an agreement with the SEC that resolved the issues resulting from the SEC investigation into market timing activity. In connection with that agreement, the SEC issued an “Order Instituting Administrative and Cease-and-Desist Proceedings Pursuant to Sections 203(e) and 203(k) of the Investment Advisers Act of 1940 and Sections 9(b) and 9(f) of the Investment Company Act of 1940, Making Findings and Imposing Remedial Sanctions and a Cease-and-Desist Order” (the “Order”). The SEC’s Order concerned the activities of a limited number of third parties that ended in 2000 and those that were the subject of the first Massachusetts administrative complaint described below.
FZ10-16
FRANKLIN TEMPLETON VARIABLE INSURANCE PRODUCTS TRUST
FRANKLIN ZERO COUPON FUND – 2010
Notes to Financial Statements (continued)
7. REGULATORY MATTERS (cont.)
Settlements (cont.)
Under the terms of the SEC’s Order, pursuant to which Franklin Advisers, Inc. neither admitted nor denied any of the findings contained therein, Franklin Advisers, Inc. agreed to pay $50 million, of which $20 million is a civil penalty, to be distributed to shareholders of certain funds in accordance with a plan to be developed by an independent distribution consultant. At this time, it is unclear which funds or which shareholders of any particular fund will receive distributions. The Order also required Franklin Advisers, Inc. to, among other things, enhance and periodically review compliance policies and procedures.
On September 20, 2004, Franklin Resources, Inc. announced that two of its subsidiaries, Franklin Advisers, Inc. and Franklin Templeton Alternative Strategies, Inc. (“FTAS”), reached an agreement with the Securities Division of the Office of the Secretary of the Commonwealth of Massachusetts (the “State of Massachusetts”) related to its administrative complaint filed on February 4, 2004, concerning one instance of market timing that was also a subject of the August 2, 2004 settlement that Franklin Advisers, Inc. reached with the SEC, as described above.
Under the terms of the settlement consent order issued by the State of Massachusetts, Franklin Advisers, Inc. and FTAS consented to the entry of a cease-and-desist order and agreed to pay a $5 million administrative fine to the State of Massachusetts (the “Massachusetts Consent Order”). The Massachusetts Consent Order included two different sections: “Statements of Fact” and “Violations of Massachusetts Securities Laws.” Franklin Advisers, Inc. and FTAS admitted the facts in the Statements of Fact.
On October 25, 2004, the State of Massachusetts filed a second administrative complaint, alleging that Franklin Resources, Inc.’s Form 8-K filing (in which it described the Massachusetts Consent Order and stated that “Franklin did not admit or deny engaging in any wrongdoing”) failed to state that Franklin Advisers, Inc. and FTAS admitted the Statements of Fact portion of the Massachusetts Consent Order (the “Second Complaint”). Franklin Resources, Inc. reached a second agreement with the State of Massachusetts on November 19, 2004, resolving the Second Complaint. As a result of the November 19, 2004 settlement, Franklin Resources, Inc. filed a new Form 8-K. The terms of the Massachusetts Consent Order did not change and there was no monetary fine associated with this second settlement.
On November 17, 2004, Franklin Resources, Inc. announced that Franklin/Templeton Distributors, Inc. (“FTDI”) reached an agreement with the CAGO, resolving the issues resulting from the CAGO’s investigation concerning sales and marketing support payments. Under the terms of the settlement, FTDI neither admitted nor denied the allegations in the CAGO’s complaint and agreed to pay $2 million to the State of California as a civil penalty, $14 million to the funds, to be allocated by an independent distribution consultant to be paid for by FTDI, and $2 million to the CAGO for its investigative costs.
On December 13, 2004, Franklin Resources, Inc. announced that its subsidiaries FTDI and Franklin Advisers, Inc. reached an agreement with the SEC, resolving the issues resulting from the SEC’s investigation concerning marketing support payments to securities dealers who sell fund shares. In connection with that agreement, the SEC issued an “Order Instituting Administrative and Cease-and-Desist Proceedings, Making Findings, and Imposing Remedial Sanctions Pursuant to Sections 203(e) and 203(k) of the Investment Advisers Act of 1940, Sections 9(b) and 9(f) of the Investment Company Act of 1940, and Section 15(b) of the Securities Exchange Act of 1934” (the “Second Order”).
Under the terms of the Second Order, in which FTDI and Franklin Advisers, Inc. neither admitted nor denied the findings contained therein, they agreed to pay the funds a penalty of $20 million and disgorgement of $1 (one dollar). FTDI and Franklin Advisers, Inc. also agreed to implement certain measures and undertakings relating to marketing support payments to broker-dealers for the promotion or sale of fund shares, including making additional disclosures in the funds’ Prospectuses and Statements of Additional Information. The Second Order further requires the appointment of an independent distribution consultant, at the Company’s expense, who shall develop a plan for the distribution of the penalty and disgorgement to the funds.
FZ10-17
FRANKLIN TEMPLETON VARIABLE INSURANCE PRODUCTS TRUST
FRANKLIN ZERO COUPON FUND – 2010
Notes to Financial Statements (continued)
7. REGULATORY MATTERS (cont.)
Other Legal Proceedings
The Trust, in addition to the Company and other funds, and certain current and former officers, employees, and directors have been named in multiple lawsuits in different federal courts in Nevada, California, Illinois, New York and Florida, alleging violations of various federal securities laws and seeking, among other relief, monetary damages, restitution, removal of fund trustees, directors, advisers, administrators, and distributors, rescission of management contracts and 12b-1 Plans, and/or attorneys’ fees and costs. Specifically, the lawsuits claim breach of duty with respect to alleged arrangements to permit market timing and/or late trading activity, or breach of duty with respect to the valuation of the portfolio securities of certain Templeton funds managed by Franklin Resources, Inc. subsidiaries, resulting in alleged market timing activity. The majority of these lawsuits duplicate, in whole or in part, the allegations asserted in the February 4, 2004 Massachusetts administrative complaint and the findings in the SEC’s August 2, 2004 Order, as described above. The lawsuits are styled as class actions, or derivative actions on behalf of either the named funds or Franklin Resources, Inc.
In addition, the Company, as well as certain current and former officers, employees, and directors, have been named in multiple lawsuits alleging violations of various securities laws and pendent state law claims relating to the disclosure of directed brokerage payments and/or payment of allegedly excessive advisory, commission, and distribution fees, and seeking, among other relief, monetary damages, restitution, rescission of advisory contracts, including recovery of all fees paid pursuant to those contracts, an accounting of all monies paid to the named advisers, declaratory relief, injunctive relief, and/or attorneys’ fees and costs. These lawsuits are styled as class actions or derivative actions brought on behalf of certain funds.
The Company and fund management strongly believes that the claims made in each of the lawsuits identified above are without merit and intends to vigorously defend against them. The Company cannot predict with certainty, however, the eventual outcome of the remaining governmental investigations or private lawsuits, nor whether they will have a material negative impact on the Company. Public trust and confidence are critical to the Company’s business and any material loss of investor and/or client confidence could result in a significant decline in assets under management by the Company, which would have an adverse effect on the Company’s future financial results. If the Company finds that it bears responsibility for any unlawful or inappropriate conduct that caused losses to the Trust, it is committed to making the Trust or its shareholders whole, as appropriate. The Company is committed to taking all appropriate actions to protect the interests of its funds’ shareholders.
FZ10-18
FRANKLIN TEMPLETON VARIABLE INSURANCE PRODUCTS TRUST
FRANKLIN ZERO COUPON FUND – 2010
Report of Independent Registered Public Accounting Firm
To the Trustees and Shareholders of
Franklin Templeton Variable Insurance Products Trust
In our opinion, the accompanying statement of assets and liabilities, including the statement of investments, and the related statements of operations and of changes in net assets and the financial highlights present fairly, in all material respects, the financial position of the Franklin Zero Coupon Fund – 2010 (the Fund) (one of the funds constituting Franklin Templeton Variable Insurance Products Trust) at December 31, 2004, the results of its operations for the year then ended, the changes in its net assets for each of the two years in the period then ended and the financial highlights for each of the periods presented, in conformity with accounting principles generally accepted in the United States of America. These financial statements and financial highlights (hereafter referred to as “financial statements”) are the responsibility of the Fund’s management; our responsibility is to express an opinion on these financial statements based on our audits. We conducted our audits of these financial statements in accordance with the standards of the Public Company Accounting Oversight Board (United States). Those standards require that we plan and perform the audits to obtain reasonable assurance about whether the financial statements are free of material misstatement. An audit includes examining, on a test basis, evidence supporting the amounts and disclosures in the financial statements, assessing the accounting principles used and significant estimates made by management, and evaluating the overall financial statement presentation. We believe that our audits, which included confirmation of securities at December 31, 2004 by correspondence with the custodian, provide a reasonable basis for our opinion.
PricewaterhouseCoopers LLP
San Francisco, California
February 9, 2005
FZ10-19
FRANKLIN TEMPLETON VARIABLE INSURANCE PRODUCTS TRUST
FRANKLIN ZERO COUPON FUND – 2010
Tax Designation (unaudited)
Under Section 852(b)(3)(C) of the Internal Revenue Code, the Fund hereby designates $68,760 as a capital gain dividend for the fiscal year ended December 31, 2004.
FZ10-20
MUTUAL DISCOVERY SECURITIES FUND
We are pleased to bring you Mutual Discovery Securities Fund’s annual report for the fiscal year ended December 31, 2004.
Performance Summary as of 12/31/04
Average annual total return of Class 2 shares* represents the average annual change in value, assuming reinvestment of dividends and capital gains. Average returns smooth out variations in returns, which can be significant; they are not the same as year-by-year results.
Periods ended 12/31/04
| | | | | | |
| | | 1-Year | | 5-Year | | Since
Inception
(11/8/96) |
Average Annual Total Return | | +18.19% | | +8.82% | | +10.04% |
*Because Class 2 shares were not offered until 1/6/99, standardized Class 2 Fund performance for prior periods represents the historical results of Class 1 shares. For periods beginning on 1/6/99, Class 2’s results reflect an additional 12b-1 fee expense, which also affects future performance. Since 1/6/99 (effective date), the average annual total return of Class 2 shares was +10.59%.
Total Return Index Comparison for Hypothetical $10,000 Investment (11/8/96–12/31/04)
The graph below shows the change in value of a hypothetical $10,000 investment in the Fund over the indicated period and includes reinvestment of any income or distributions. The Fund’s performance* is compared to the performance of the Standard & Poor’s 500 Composite Index (S&P 500) and the Morgan Stanley Capital International (MSCI) World Index. One cannot invest directly in an index, nor is an index representative of the Fund’s portfolio. Please see Important Notes to Performance Information preceding the Fund Summaries.
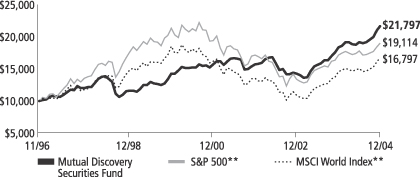
**Source: Standard & Poor’s Micropal. Please see Index Descriptions following the Fund Summaries.
Mutual Discovery Securities Fund – Class 2
Performance reflects the Fund’s Class 2 operating expenses, but does not include any contract fees, expenses or sales charges. If they had been included, performance would be lower. These charges and deductions, particularly for variable life policies, can have a significant effect on contract values and insurance benefits. See the contract prospectus for a complete description of these expenses, including sales charges.
Performance data quoted represent past performance, which does not guarantee future results. Investment return and principal value will fluctuate, and you may have a gain or loss when you sell your shares. Current performance may differ from figures shown.
MD-1
Fund Goal and Main Investments: Mutual Discovery Securities Fund seeks capital appreciation. The Fund invests mainly in U.S. and foreign equity securities (including securities convertible, or that the manager expects to become convertible, into common or preferred stock) of companies that the Fund’s manager believes are available at market prices less than their value based on certain recognized or objective criteria. The Fund may also invest a significant portion in small capitalization companies.
Performance Overview
You can find the Fund’s one-year total return in the Performance Summary. The Fund outperformed its benchmarks, the S&P 500 and MSCI World Index, which returned 10.87% and 15.25% for the same period.1
Economic and Market Overview
The global economic recovery continued in 2004, led by growth in China and the U.S. As of December 31, 2004, U.S. gross domestic product (GDP) had increased for 13 consecutive quarters.2 In China, GDP grew 9.5% in 2004.3
The 12-nation euro zone lagged other regions in the current recovery. However, the European Central Bank projected euro zone growth may be between 1.6% and 2.0% in 2004, compared with only 0.5% in 2003. In Japan, the economy struggled to emerge from a decade-long deflationary period. Although the country’s consumer and business confidence reached their highest levels since 1991, economic growth slowed in response to higher oil prices and reduced external demand. In addition, the U.S. dollar declined approximately 4% versus the yen and 7% versus the euro during 2004.4 This hurt Japanese and European exports into the U.S., as it made their goods more expensive in the world’s biggest market. However, the greenback’s protracted decline should also benefit the U.S. current account deficit by making U.S. goods more competitive in international markets.
Oil prices increased during most of 2004, reaching $56 dollars per barrel in October, but declined to end the year at $43. Higher oil prices triggered investor worries about inflation, decreased spending — due
1. Source: Standard & Poor’s Micropal. One cannot invest directly in an index, nor is an index representative of the Fund’s portfolio. Please see Index Descriptions following the Fund Summaries.
2. Source: Bureau of Economic Analysis.
3. Source: National Bureau of Statistics of China.
4. Source: FactSet Research Systems Inc.
Fund Risks: Stocks offer the potential for long-term gains but can be subject to short-term up-and-down price movements. Investments in companies involved in mergers, liquidations, reorganizations and distressed bankruptcy, which may include defaulted debt, involve higher credit and other risks. Foreign investing involves special risks including currency fluctuations, economic instability, and social and political developments. Smaller and midsize company securities involve special risks such as relatively small revenues, limited product lines, and small market shares. The Fund’s prospectus also includes a description of the main investment risks.
MD-2
to cautionary consumer and business sentiment — and slower economic and corporate profit growth. As of December 31, 2004, the 12-month moving average price of oil was about $41 per barrel.5
In this environment, the MSCI World Index’s total return was 15.25% in U.S. dollars for the 12-month period ended December 31, 2004.6 Emerging markets, as measured by the MSCI Emerging Markets Index, had a one-year total return of 25.95% in U.S. dollars.6 In local currencies, these indexes had notably lower total returns of 11.83% and 16.45% for the same period.6 In 2004, most of the world’s currencies strengthened in relation to the U.S. dollar, which benefited U.S.-based investors of non-U.S. developed and emerging market equities.
Investment Strategy
At Mutual Series, we follow a distinctive, three-pronged investment approach, which combines the purchase of undervalued equities with investments in distressed debt and risk arbitrage. We build the bulk of the portfolio by investing in undervalued common stock — stocks where we believe we are buying assets at a substantial discount to intrinsic or business value. We focus on situations where we believe there is limited downside risk, and the potential for substantial long-term appreciation; we believe successful investing is as much about avoiding and containing losses as it is about generating gains. We augment the Fund’s equity portfolio with investments in distressed securities and bankruptcy situations. As with equities, we undertake our own rigorous fundamental analysis of each situation and focus our efforts on situations where we believe there is limited risk and substantial upside potential. Lastly, the Fund may invest in arbitrage situations, another highly specialized field. In arbitrage investing, we generally seek to invest in companies in the process of being acquired, or undergoing mergers. When buying those shares at a discount to the announced deal value, the Fund seeks to earn a return as that discount narrows and the transaction is completed.
We seek to migrate the Fund’s investments toward the areas where we find the most compelling opportunities at any given moment. Typically, more of the Fund’s assets will be invested in equities, while distressed investing and arbitrage will each represent a much smaller portion of the Fund. We may also hold a significant portion of the Fund’s assets in cash or high-quality, short-term debt instruments when other investment
5. Source: U.S. Department of Energy.
6. Source: Standard & Poor’s Micropal. Please see Index Descriptions following the Fund Summaries.
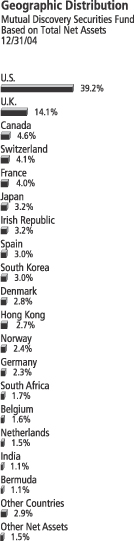
MD-3
opportunities are not sufficiently compelling. Mutual Discovery Securities Fund will seek out opportunities around the world, with an emphasis on developed markets — markets where we believe the political risks are low and potential returns are attractive. We will generally seek to hedge the Fund’s currency exposure when we believe it is advantageous to do so, in order to focus our efforts on analyzing business fundamentals and assessing the value of the company’s assets and liabilities.
Manager’s Discussion
Notwithstanding positive overall performance from our distressed debt and risk arbitrage investments, the Fund’s equity portfolio was the strongest contributor to performance in 2004. Three of our best performing stock investments were Altadis, a Franco-Spanish
tobacco company; Orkla, a Norwegian conglomerate; and White Mountains Insurance Group, a U.S. property and casualty insurer.
In 2004, tobacco companies operating in Europe, such as Altadis, encountered a challenging sales environment, especially in France after the government imposition of two substantial tax increases by early 2004 that pressured volumes and contributed to reduced consumption of about 25% in volume. Despite challenges in France and elsewhere, Altadis shares performed well as management returned cash to shareholders through dividends and share repurchases. In addition, the company announced two acquisitions and a cost-restructuring program, all of which could enable management to continue to increase cash flow and create shareholder value. As a result of these and other factors, Altadis shares appreciated about 65% in 2004. Despite this strong performance, the stock still traded at a significant discount to its European peers and our calculation of the stock’s intrinsic value. In addition, some analysts believe the industry is ready for more consolidation.
Oslo-based Orkla is one of Norway’s largest conglomerates with operations in food, media, chemicals and beverages. In early 2004, Orkla’s management announced it would divest the company’s beverage operations, a 40% stake in the Danish company Carlsberg Breweries. We believed the negotiated price for Carlsberg was favorable, and the market rewarded management’s decision to return part of the proceeds to shareholders in the form of a special dividend. The equity market anticipates Orkla to further divest non-core assets and return the proceeds to shareholders. The company reported better-than-expected quarterly results in 2004 as its restructuring program progressed ahead of expectations and as some new product launches experienced success.
Top 10 Sectors/Industries
Mutual Discovery Securities Fund Based on Equity Securities 12/31/04
| | |
| | | % of Total
Net Assets |
| |
| Tobacco | | 14.7% |
| |
| Insurance | | 8.3% |
| |
| Metals & Mining | | 7.5% |
| |
| Media | | 7.1% |
| |
| Diversified Financial Services | | 6.0% |
| |
| Food Products | | 5.9% |
| |
| Beverages | | 4.1% |
| |
| Commercial Banks | | 4.0% |
| |
| Chemicals | | 3.1% |
| |
| Pharmaceuticals | | 2.6% |
MD-4
Largely as a result, the stock’s discount to its intrinsic value narrowed, and including the special dividend, Orkla shares returned 73% in 2004.
We believe that White Mountains, a significant contributor to Fund performance during the fiscal year, was an excellent example of how substantial shareholder value can be created when well-capitalized companies are run by strong managers. With the company’s solid balance sheet, White Mountains’ management team has made several acquisitions, enabling the company to profitably increase its bottom line while extending its exposure to lines of business we think are attractive. In addition to exercising discipline with acquisitions, management remained committed to a conservative underwriting strategy. This strategy enabled White Mountains to continue to report solid underwriting results for 2004 despite record industry-wide insurance claims from the Atlantic hurricane season. During the year under review, the markets began to better appreciate White Mountains’ consistent results, strong balance sheet, and disciplined acquisition and underwriting practices, as well as its shareholder-oriented management team. White Mountains’ stock rose about 41% in 2004.
In general, if the value of the U.S. dollar goes up compared with a foreign currency, an investment traded in that foreign currency will go down in value because it will be worth fewer U.S. dollars. This can have a negative effect on Fund performance. Conversely, when the U.S. dollar weakens in relation to a foreign currency, an investment traded in that foreign currency will increase in value, which can contribute to Fund performance. For the 12 months ended December 31, 2004, the U.S. dollar declined in value relative to most non-U.S. currencies. At the end of the period, the Fund’s portfolio was invested substantially in securities with non-U.S. currency exposure, which resulted in a positive effect on Fund performance. However, one cannot expect the same result in future periods.
Detractors from Fund performance during the fiscal year included Eurotunnel, the operator of the English Channel tunnel; MG Technologies, a German industrial firm; and Impala Platinum, a South African mining company. Eurotunnel’s debt securities declined during 2004 largely due to uncertainties surrounding the ultimate resolution of the company’s financial situation, as well as continuing mediocre operating results after the board and management team were replaced in April 2004. MG Technologies’ stock fell in value mainly due to a failed attempt to dispose of an asset, a division’s slower-than-expected turnaround, and the chief executive officer’s resignation. Impala Platinum underperformed
Top 10 Holdings
Mutual Discovery Securities Fund 12/31/04
| | |
Company
Sector/Industry,
Country | | % of Total
Net Assets |
| |
| Berkshire Hathaway Inc., A & B | | 3.4% |
| Insurance, U.S. | | |
| |
| British American Tobacco PLC | | 3.2% |
| Tobacco, U.K. | | |
| |
| Imperial Tobacco Group PLC | | 2.7% |
| Tobacco, U.K. | | |
| |
| Altadis SA | | 2.7% |
| Tobacco, Spain | | |
| |
| Orkla ASA | | 2.4% |
| Food Products, Norway | | |
| |
| Anglo American PLC | | 1.9% |
| Metals & Mining, U.K. | | |
| |
| Allied Irish Banks PLC | | 1.7% |
| Commercial Banks, Irish Republic | | |
| |
| Schindler Holding AG, ord. & Reg D | | 1.7% |
| Machinery, Switzerland | | |
| |
| KT&G Corp., ord. & GDR, 144A | | 1.7% |
| Tobacco, South Korea | | |
| |
| Newmont Mining Corp. | | 1.5% |
| Metals & Mining, U.S. | | |
The dollar value, number of shares or principal amount, and names of all portfolio holdings are listed in the Fund’s Statement of Investments.
MD-5
during the period because of the strengthening South African currency and a slower-than-expected approval process for a mine in Zimbabwe.
Thank you for your participation in Mutual Discovery Securities Fund. We look forward to serving your future investment needs.
The foregoing information reflects our analysis, opinions and portfolio holdings as of December 31, 2004, the end of the reporting period. The way we implement our main investment strategies and the resulting portfolio holdings may change depending on factors such as market and economic conditions. These opinions may not be relied upon as investment advice or an offer for a particular security. The information is not a complete analysis of every aspect of any market, country, industry, security or the Fund. Statements of fact are from sources considered reliable, but the adviser makes no representation or warranty as to their completeness or accuracy. Although historical performance is no guarantee of future results, these insights may help you understand our investment management philosophy.
MD-6
Fund Expenses
As an investor in a variable insurance contract (“Contract”) that indirectly provides for investment in an underlying mutual fund, you can incur transaction and/or ongoing expenses at both the Fund level and the Contract level.
| • | | Transaction expenses can include sales charges (loads) on purchases, redemption fees, surrender fees, transfer fees and premium taxes. |
| • | | Ongoing expenses can include management fees, distribution and service (12b-1) fees, contract fees, annual maintenance fees, mortality and expense risk fees and other fees and expenses. All mutual funds and Contracts have some types of ongoing expenses. |
The expenses shown in the table below are meant to highlight ongoing expenses at the Fund level only and do not include ongoing expenses at the Contract level, or transaction expenses at either the Fund or Contract levels. While the Fund does not have transaction expenses, if the transaction and ongoing expenses at the Contract level were included, the expenses shown below would be higher. You should consult your Contract prospectus or disclosure document for more information.
The table shows Fund-level ongoing expenses and can help you understand these expenses and compare them with those of other mutual funds offered through the Contract. The table assumes a $1,000 investment held for the six months indicated. Please refer to the Fund prospectus for additional information on operating expenses.
Actual Fund Expenses
The first line (Actual) for each share class listed in the table below provides actual account values and expenses. The “Ending Account Value” is derived from the Fund’s actual return, which includes the effect of ongoing Fund expenses, but does not include the effect of ongoing Contract expenses.
You can estimate the Fund-level expenses you incurred during the period, by following these steps. Of course, your account value and expenses will differ from those in this illustration:
| 1. | Divide your account value by $1,000. |
If an account had an $8,600 value, then $8,600 ÷ $1,000 = 8.6.
| 2. | Multiply the result by the number under the heading “Fund-Level Expenses Incurred During Period.” |
If Fund-Level Expenses Incurred During Period were $7.50, then 8.6 × $7.50 = $64.50.
Mutual Discovery Securities Fund – Class 2
MD-7
In this illustration, the estimated expenses incurred this period at the Fund level are $64.50.
Hypothetical Example for Comparison with Other Mutual Funds
Information in the second line (Hypothetical) for each class in the table can help you compare ongoing expenses of the Fund with those of other mutual funds offered through the Contract. This information may not be used to estimate the actual ending account balance or expenses you incurred during the period. The hypothetical “Ending Account Value” is based on the actual expense ratio for each class and an assumed 5% annual rate of return before expenses, which does not represent the Fund’s actual return. The figure under the heading “Fund-Level Expenses Incurred During Period” shows the hypothetical expenses your account would have incurred under this scenario. You can compare this figure with the 5% hypothetical examples that appear in shareholder reports of other funds offered through a Contract.
| | | | | | | | | |
| Class 2 | | Beginning
Account
Value 6/30/04 | | Ending
Account
Value 12/31/04 | | Fund-Level
Expenses Incurred
During Period*
6/30/04-12/31/04 |
Actual | | $ | 1,000 | | $ | 1,130.80 | | $ | 6.80 |
Hypothetical (5% return before expenses) | | $ | 1,000 | | $ | 1,018.75 | | $ | 6.44 |
*Expenses are equal to the annualized expense ratio for the Fund’s Class 2 shares (1.27%), which does not include any ongoing expenses of the Contract for which the Fund is an investment option, multiplied by the average account value over the period, multiplied by 184/366 to reflect the one-half year period.
MD-8
FRANKLIN TEMPLETON VARIABLE INSURANCE PRODUCTS TRUST
MUTUAL DISCOVERY SECURITIES FUND
Financial Highlights
| | | | | | | | | | | | | | | | | | | | |
| | | Class 1
| |
| | | Year Ended December 31,
| |
| | | 2004 | | | 2003 | | | 2002 | | | 2001 | | | 2000 | |
| | |
|
|
|
Per share operating performance | | | | | | | | | | | | | | | | | | | | |
(for a share outstanding throughout the year) | | | | | | | | | | | | | | | | | | | | |
Net asset value, beginning of year | | $ | 14.04 | | | $ | 11.06 | | | $ | 12.56 | | | $ | 14.55 | | | $ | 13.57 | |
| | |
|
|
|
Income from investment operations: | | | | | | | | | | | | | | | | | | | | |
Net investment incomea | | | .26 | | | | .19 | | | | .19 | | | | .24 | | | | .26 | |
Net realized and unrealized gains (losses) | | | 2.31 | | | | 3.01 | | | | (1.28 | ) | | | (.08 | ) | | | 1.14 | |
| | |
|
|
|
Total from investment operations | | | 2.57 | | | | 3.20 | | | | (1.09 | ) | | | .16 | | | | 1.40 | |
| | |
|
|
|
Less distributions from: | | | | | | | | | | | | | | | | | | | | |
Net investment income | | | (.17 | ) | | | (.22 | ) | | | (.19 | ) | | | (.30 | ) | | | (.42 | ) |
Net realized gains | | | — | | | | — | | | | (.22 | ) | | | (1.85 | ) | | | — | |
| | |
|
|
|
Total distributions | | | (.17 | ) | | | (.22 | ) | | | (.41 | ) | | | (2.15 | ) | | | (.42 | ) |
| | |
|
|
|
Net asset value, end of year | | $ | 16.44 | | | $ | 14.04 | | | $ | 11.06 | | | $ | 12.56 | | | $ | 14.55 | |
| | |
|
|
|
| | | | | |
Total returnb | | | 18.55% | | | | 29.19% | | | | (9.06)% | | | | .39% | | | | 10.45% | |
Ratios/supplemental data | | | | | | | | | | | | | | | | | | | | |
Net assets, end of year (000’s) | | $ | 137,703 | | | $ | 134,332 | | | $ | 122,011 | | | $ | 164,527 | | | $ | 191,051 | |
Ratios to average net assets:* | | | | | | | | | | | | | | | | | | | | |
ExpensesC | | | 1.01% | | | | 1.04% | | | | 1.03% | | | | 1.02% | | | | 1.02% | |
Net investment income | | | 1.71% | | | | 1.48% | | | | 1.55% | | | | 1.76% | | | | 1.80% | |
Portfolio turnover rate | | | 29.81% | | | | 41.52% | | | | 47.46% | | | | 64.58% | | | | 74.77% | |
*Ratios to average net assets, excluding dividend expense on securities sold short: | | | | | | | | | | | | | | | | | | | | |
Expenses | | | 1.00% | | | | 1.01% | | | | 1.02% | | | | 1.00% | | | | .98% | |
| a | Based on average daily shares outstanding. |
| b | Total return does not include any fees, charges or expenses imposed by the variable annuity and life insurance contracts for which the Franklin Templeton Variable Insurance Products Trust serves as an underlying investment vehicle. Total return is not annualized for periods less than one year. |
| c | Includes dividend expense on securities sold short which varies from period to period. See below for expense ratios that reflect only operating expenses. |
See notes to financial statements.
MD-9
FRANKLIN TEMPLETON VARIABLE INSURANCE PRODUCTS TRUST
MUTUAL DISCOVERY SECURITIES FUND
Financial Highlights (continued)
| | | | | | | | | | | | | | | | | | | | |
| | | Class 2
| |
| | | Year Ended December 31,
| |
| | | 2004 | | | 2003 | | | 2002 | | | 2001 | | | 2000 | |
| | |
|
|
|
Per share operating performance | | | | | | | | | | | | | | | | | | | | |
(for a share outstanding throughout the year) | | | | | | | | | | | | | | | | | | | | |
Net asset value, beginning of year | | $ | 13.90 | | | $ | 10.97 | | | $ | 12.50 | | | $ | 14.50 | | | $ | 13.54 | |
| | |
|
|
|
Income from investment operations: | | | | | | | | | | | | | | | | | | | | |
Net investment incomea | | | .21 | | | | .13 | | | | .16 | | | | .13 | | | | .22 | |
Net realized and unrealized gains (losses) | | | 2.30 | | | | 3.02 | | | | (1.29 | ) | | | .01 | | | | 1.14 | |
| | |
|
|
|
Total from investment operations | | | 2.51 | | | | 3.15 | | | | (1.13 | ) | | | .14 | | | | 1.36 | |
| | |
|
|
|
Less distributions from: | | | | | | | | | | | | | | | | | | | | |
Net investment income | | | (.16 | ) | | | (.22 | ) | | | (.18 | ) | | | (.29 | ) | | | (.40 | ) |
Net realized gains | | | — | | | | — | | | | (.22 | ) | | | (1.85 | ) | | | — | |
| | |
|
|
|
Total distributions | | | (.16 | ) | | | (.22 | ) | | | (.40 | ) | | | (2.14 | ) | | | (.40 | ) |
| | |
|
|
|
Net asset value, end of year | | $ | 16.25 | | | $ | 13.90 | | | $ | 10.97 | | | $ | 12.50 | | | $ | 14.50 | |
| | |
|
|
|
| | | | | |
Total returnb | | | 18.19% | | | | 28.99% | | | | (9.40)% | | | | .24% | | | | 10.21% | |
Ratios/supplemental data | | | | | | | | | | | | | | | | | | | | |
Net assets, end of year (000’s) | | $ | 403,560 | | | $ | 160,371 | | | $ | 37,241 | | | $ | 5,681 | | | $ | 1,035 | |
Ratios to average net assets:* | | | | | | | | | | | | | | | | | | | | |
Expensesc | | | 1.26% | | | | 1.29% | | | | 1.28% | | | | 1.27% | | | | 1.27% | |
Net investment income | | | 1.46% | | | | 1.23% | | | | 1.30% | | | | 1.03% | | | | 1.59% | |
Portfolio turnover rate | | | 29.81% | | | | 41.52% | | | | 47.46% | | | | 64.58% | | | | 74.77% | |
*Ratios to average net assets, excluding dividend expense on securities sold short: | | | | | | | | | | | | | | | | | | | | |
Expenses | | | 1.25% | | | | 1.26% | | | | 1.27% | | | | 1.25% | | | | 1.23% | |
| a | Based on average daily shares outstanding. |
| b | Total return does not include any fees, charges or expenses imposed by the variable annuity and life insurance contracts for which the Franklin Templeton Variable Insurance Products Trust serves as an underlying investment vehicle. Total return is not annualized for periods less than one year. |
| c | Includes dividend expense on securities sold short which varies from period to period. See below for expense ratios that reflect only operating expenses. |
See notes to financial statements.
MD-10
FRANKLIN TEMPLETON VARIABLE INSURANCE PRODUCTS TRUST
MUTUAL DISCOVERY SECURITIES FUND
Statement of Investments, December 31, 2004
| | | | | | | |
| | | COUNTRY | | SHARES/
WARRANTS/
CONTRACTS | | VALUE |
Common Stocks and Other Equity Interests 83.6% | | | | | | | |
Aerospace & Defense .3% | | | | | | | |
Northrop Grumman Corp. | | United States | | 25,000 | | $ | 1,359,000 |
| | | | | | |
|
|
Airlines .6% | | | | | | | |
aAce Aviation Holdings Inc. | | Canada | | 101,665 | | | 3,013,464 |
a,bAir Canada Inc., Contingent Distribution | | Canada | | 15,269,146 | | | — |
| | | | | | |
|
|
| | | | | | | | 3,013,464 |
| | | | | | |
|
|
Automobiles .2% | | | | | | | |
Hero Honda Motors Ltd. | | India | | 90,500 | | | 1,195,019 |
| | | | | | |
|
|
Beverages 4.1% | | | | | | | |
Brown-Forman Corp., A | | United States | | 7,400 | | | 375,624 |
Brown-Forman Corp., B | | United States | | 21,560 | | | 1,049,541 |
Carlsberg AS, A | | Denmark | | 7,100 | | | 326,368 |
Carlsberg AS, B | | Denmark | | 122,525 | | | 6,190,897 |
Coca-Cola Enterprises Inc. | | United States | | 72,700 | | | 1,515,795 |
Diageo PLC | | United Kingdom | | 395,140 | | | 5,635,322 |
Fomento Economico Mexicano SA de CV (Femsa), ADR | | Mexico | | 60,300 | | | 3,172,383 |
Heineken Holding NV, A | | Netherlands | | 121,263 | | | 3,661,308 |
| | | | | | |
|
|
| | | | | | | | 21,927,238 |
| | | | | | |
|
|
Capital Markets 1.5% | | | | | | | |
Guinness Peat Group PLC | | New Zealand | | 1,656,369 | | | 2,580,903 |
Irish Life & Permanent PLC | | Ireland | | 185,900 | | | 3,438,388 |
cLeucadia National Corp. | | United States | | 34,780 | | | 2,295,689 |
| | | | | | |
|
|
| | | | | | | | 8,314,980 |
| | | | | | |
|
|
Chemicals 3.1% | | | | | | | |
Givaudan AG | | Switzerland | | 6,750 | | | 4,444,883 |
Linde AG | | Germany | | 53,800 | | | 3,351,732 |
aMG Technologies AG | | Germany | | 339,100 | | | 4,003,379 |
Solvay SA | | Belgium | | 43,070 | | | 4,734,123 |
| | | | | | |
|
|
| | | | | | | | 16,534,117 |
| | | | | | |
|
|
Commercial Banks 4.0% | | | | | | | |
Allied Irish Banks PLC | | Ireland | | 445,000 | | | 9,227,053 |
Bank of Ireland | | Ireland | | 273,870 | | | 4,522,244 |
BNP Paribas SA | | France | | 46,200 | | | 3,341,557 |
aCerberus NCB Acquisition LP Ltd., wts., 8/29/13 | | Japan | | 671,524 | | | 335,762 |
Danske Bank | | Denmark | | 101,550 | | | 3,107,360 |
a,cElephant Capital Holdings Ltd. | | Japan | | 755 | | | 1,003,996 |
Kansai Urban Banking Corp. | | Japan | | 37,400 | | | 69,381 |
aNippon Investment LLC | | Japan | | 477,000 | | | — |
| | | | | | |
|
|
| | | | | | | | 21,607,353 |
| | | | | | |
|
|
Commercial Services & Supplies .4% | | | | | | | |
aComdisco Holding Co., Inc. | | United States | | 3 | | | 67 |
bComdisco, Contingent Distribution | | United States | | 2,066,357 | | | — |
aFursys Inc. | | South Korea | | 28,670 | | | 387,732 |
Republic Services Inc. | | United States | | 49,700 | | | 1,666,938 |
a,bSafety Kleen Corp., Contingent Distribution | | United States | | 31,000 | | | — |
| | | | | | |
|
|
| | | | | | | | 2,054,737 |
| | | | | | |
|
|
MD-11
FRANKLIN TEMPLETON VARIABLE INSURANCE PRODUCTS TRUST
MUTUAL DISCOVERY SECURITIES FUND
Statement of Investments, December 31, 2004 (cont.)
| | | | | | | |
| | | COUNTRY | | SHARES/
WARRANTS/
CONTRACTS | | VALUE |
Common Stocks and Other Equity Interests (cont.) | | | | | | | |
Computers & Peripherals | | | | | | | |
aDecisionOne Corp. | | United States | | 5,288 | | $ | — |
| | | | | | |
|
|
Construction Materials .7% | | | | | | | |
Ciments Francais SA | | France | | 22,650 | | | 2,114,639 |
aHanil Cement Manufacturing Co. Ltd. | | South Korea | | 4,280 | | | 248,068 |
RMC Group PLC | | United Kingdom | | 89,100 | | | 1,451,993 |
| | | | | | |
|
|
| | | | | | | | 3,814,700 |
| | | | | | |
|
|
Distributors .3% | | | | | | | |
Compania de Distribucion Integral Logista SA | | Spain | | 30,900 | | | 1,672,639 |
| | | | | | |
|
|
Diversified Financial Services 6.1% | | | | | | | |
Brascan Corp., A | | Canada | | 139,050 | | | 5,002,716 |
Deutsche Bourse AG | | Germany | | 32,900 | | | 1,976,893 |
Euronext | | Netherlands | | 87,100 | | | 2,655,834 |
Jardine Matheson Holdings Ltd. | | France | | 399,500 | | | 6,352,050 |
Jardine Strategic Holdings Ltd. | | France | | 913,500 | | | 7,490,700 |
London Stock Exchange PLC | | United Kingdom | | 500 | | | 5,585 |
a,bMarconi Corp., Contingent Distribution | | United Kingdom | | 1,739,100 | | | — |
Pargesa Holdings SA | | Switzerland | | 1,147 | | | 4,028,272 |
Remgro Ltd. | | South Africa | | 330,113 | | | 5,498,581 |
| | | | | | |
|
|
| | | | | | | | 33,010,631 |
| | | | | | |
|
|
Diversified Telecommunication Services 1.9% | | | | | | | |
a,c,dAboveNet Inc. | | United States | �� | 16,706 | | | 400,333 |
a,b,dAboveNet Inc., Contingent Distribution | | United States | | 2,312,000 | | | — |
a,c,dAboveNet Inc., wts., 9/08/08 | | United States | | 550 | | | 3,520 |
a,c,dAboveNet Inc., wts., 9/08/10 | | United States | | 647 | | | 2,588 |
aBelgacom SA | | Belgium | | 45,400 | | | 1,959,127 |
Chunghwa Telecom Co. Ltd., ADR | | Taiwan | | 104,845 | | | 2,206,987 |
bGlobal Crossing Holdings Ltd., Contingent Distribution | | United States | | 2,236,777 | | | 2,797 |
Koninklijke KPN NV | | Netherlands | | 174,400 | | | 1,654,258 |
aMCI Inc. | | United States | | 45,234 | | | 911,917 |
Sprint Corp. | | United States | | 14,800 | | | 367,780 |
a,bTelewest Communications PLC, Contingent Distribution | | United Kingdom | | 2,862,312 | | | — |
a,bTelewest Finance Ltd, Contingent Distribution | | United Kingdom | | 274,000 | | | — |
aTelewest Global Inc. | | United Kingdom | | 156,135 | | | 2,744,853 |
| | | | | | |
|
|
| | | | | | | | 10,254,160 |
| | | | | | |
|
|
Electric Utilities .4% | | | | | | | |
E.ON AG | | Germany | | 22,150 | | | 2,019,265 |
| | | | | | |
|
|
Food & Staples Retailing .1% | | | | | | | |
aKroger Co. | | United States | | 42,600 | | | 747,204 |
| | | | | | |
|
|
Food Products 6.2% | | | | | | | |
Cadbury Schweppes PLC | | United Kingdom | | 402,627 | | | 3,748,207 |
CSM NV | | Netherlands | | 700 | | | 21,772 |
Farmer Brothers Co. | | United States | | 61,700 | | | 1,495,608 |
General Mills Inc. | | United States | | 57,700 | | | 2,868,267 |
Groupe Danone | | France | | 61,450 | | | 5,666,188 |
aLotte Confectionary Co. Ltd. | | South Korea | | 2,812 | | | 2,154,092 |
MD-12
FRANKLIN TEMPLETON VARIABLE INSURANCE PRODUCTS TRUST
MUTUAL DISCOVERY SECURITIES FUND
Statement of Investments, December 31, 2004 (cont.)
| | | | | | | |
| | | COUNTRY | | SHARES/
WARRANTS/
CONTRACTS | | VALUE |
Common Stocks and Other Equity Interests (cont.) | | | | | | | |
Food Products (cont.) | | | | | | | |
Nestle SA | | Switzerland | | 17,360 | | $ | 4,534,527 |
Orkla ASA | | Norway | | 404,070 | | | 13,259,229 |
| | | | | | |
|
|
| | | | | | | | 33,747,890 |
| | | | | | |
|
|
Gas Utilities .5% | | | | | | | |
Tokyo Gas Co. Ltd. | | Japan | | 621,500 | | | 2,548,623 |
| | | | | | |
|
|
Health Care Equipment & Supplies .2% | | | | | | | |
kGuidant Corp. | | United States | | 16,400 | | | 1,182,440 |
| | | | | | |
|
|
Health Care Providers & Services .5% | | | | | | | |
aAlderwoods Group Inc. | | United States | | 8,628 | | | 98,186 |
a,dKindred Healthcare Inc. | | United States | | 57,508 | | | 1,636,246 |
a,dKindred Healthcare Inc., Jan. 26.00 Calls, 1/01/12 | | United States | | 28 | | | 110 |
a,dKindred Healthcare Inc., Jan. 9.07 Calls, 1/01/13 | | United States | | 14 | | | 292 |
a,dKindred Healthcare Inc., Jul. 23.75 Calls, 7/17/11 | | United States | | 138 | | | 856 |
a,dKindred Healthcare Inc., wts., Series A, 4/20/06 | | United States | | 5,258 | | | 156,247 |
a,dKindred Healthcare Inc., wts., Series B, 4/20/06 | | United States | | 13,145 | | | 344,662 |
Select Medical Corp. | | United States | | 16,300 | | | 286,880 |
| | | | | | |
|
|
| | | | | | | | 2,523,479 |
| | | | | | |
|
|
Hotels Restaurants & Leisure .2% | | | | | | | |
aCae-sars Entertainment Inc. | | United States | | 5,700 | | | 114,798 |
aFHC Delaware Inc. | | United States | | 49,920 | | | 392,870 |
Mandalay Resort Group | | United States | | 7,100 | | | 500,054 |
| | | | | | |
|
|
| | | | | | | | 1,007,722 |
| | | | | | |
|
|
Household Products .7% | | | | | | | |
aAmorepacific Corp. | | South Korea | | 9,800 | | | 2,456,627 |
KAO Corp. | | Japan | | 49,500 | | | 1,266,256 |
| | | | | | |
|
|
| | | | | | | | 3,722,883 |
| | | | | | |
|
|
Industrial Conglomerates .1% | | | | | | | |
Swire Pacific Ltd., B | | France | | 457,200 | | | 679,377 |
| | | | | | |
|
|
Insurance 8.3% | | | | | | | |
aAlleghany Corp. | | United States | | 3,686 | | | 1,051,432 |
aBerkshire Hathaway Inc., A | | United States | | 45 | | | 3,955,500 |
aBerkshire Hathaway Inc., B | | United States | | 4,860 | | | 14,268,960 |
Catlin Group | | United Kingdom | | 357,000 | | | 2,245,897 |
E-L Financial Corp. Ltd. | | Canada | | 8,478 | | | 2,387,638 |
Hartford Financial Services Group Inc. | | United States | | 40,800 | | | 2,827,848 |
a,cImagine Group Holdings Ltd. | | Bermuda | | 451,787 | | | 4,626,990 |
IPC Holdings Ltd. | | Bermuda | | 15,500 | | | 674,405 |
Montpelier Re Holdings Ltd. | | Bermuda | | 4,857 | | | 186,752 |
Old Republic International Corp. | | United States | | 112,900 | | | 2,856,370 |
a,cOlympus Re Holdings Ltd. | | Bermuda | | 2,140 | | | 366,325 |
Prudential Financial Inc. | | United States | | 24,900 | | | 1,368,504 |
St. Paul Travelers Cos. Inc. | | United States | | 52,299 | | | 1,938,724 |
White Mountains Insurance Group Inc. | | United States | | 9,696 | | | 6,263,616 |
| | | | | | |
|
|
| | | | | | | | 45,018,961 |
| | | | | | |
|
|
MD-13
FRANKLIN TEMPLETON VARIABLE INSURANCE PRODUCTS TRUST
MUTUAL DISCOVERY SECURITIES FUND
Statement of Investments, December 31, 2004 (cont.)
| | | | | | | |
| | | COUNTRY | | SHARES/
WARRANTS/
CONTRACTS | | VALUE |
Common Stocks and Other Equity Interests (cont.) | | | | | | | |
Leisure Equipment & Products .6% | | | | | | | |
Agfa Gevaert NV | | Belgium | | 61,990 | | $ | 2,099,645 |
Mattel Inc. | | United States | | 52,300 | | | 1,019,327 |
Shimano Inc. | | Japan | | 2,400 | | | 68,541 |
| | | | | | |
|
|
| | | | | | | | 3,187,513 |
| | | | | | |
|
|
Machinery 1.7% | | | | | | | |
Schindler Holding AG | | Switzerland | | 18,900 | | | 7,483,999 |
Schindler Holding AG, Reg D | | Switzerland | | 4,100 | | | 1,709,908 |
| | | | | | |
|
|
| | | | | | | | 9,193,907 |
| | | | | | |
|
|
Marine 1.0% | | | | | | | |
A P Moller - Maersk A/S | | Denmark | | 680 | | | 5,606,559 |
| | | | | | |
|
|
Media 7.1% | | | | | | | |
Astral Media Inc., A | | Canada | | 70,900 | | | 1,925,978 |
British Sky Broadcasting Group PLC | | United Kingdom | | 162,100 | | | 1,748,632 |
Clear Channel Communications Inc. | | United States | | 92,000 | | | 3,081,080 |
aComcast Corp., A | | United States | | 14,800 | | | 486,032 |
E.W. Scripps Co., A | | United States | | 16,400 | | | 791,792 |
EchoStar Communications Corp., A | | United States | | 64,300 | | | 2,137,332 |
Hollinger International Inc. | | United States | | 95,634 | | | 1,349,587 |
aJC Decaux SA | | France | | 40,325 | | | 1,175,407 |
aLiberty Media Corp., A | | United States | | 525,146 | | | 5,766,103 |
aNews Corp. Ltd., A | | United States | | 148,400 | | | 2,769,144 |
aNTL Inc. | | United Kingdom | | 83,631 | | | 6,101,718 |
Omnicom Group Inc. | | United States | | 16,700 | | | 1,408,144 |
SES Global, FDR | | Luxembourg | | 381,600 | | | 4,945,286 |
aTVMAX Holdings Inc. | | United States | | 8,935 | | | 8,935 |
Viacom Inc., B | | United States | | 31,700 | | | 1,153,563 |
Washington Post Co., B | | United States | | 3,821 | | | 3,756,119 |
| | | | | | |
|
|
| | | | | | | | 38,604,852 |
| | | | | | |
|
|
Metals & Mining 7.2% | | | | | | | |
Anglo American PLC | | United Kingdom | | 430,667 | | | 10,184,302 |
aApollo Gold Corp. | | Canada | | 65,400 | | | 56,165 |
Barrick Gold Corp. | | Canada | | 37,500 | | | 908,250 |
Freeport McMoran Copper & Gold Inc., B | | United States | | 58,200 | | | 2,224,986 |
aGammon Lake Resources Inc. | | Canada | | 164,100 | | | 879,779 |
aGammon Lake Resources Inc., wts., 4/30/05 | | Canada | | 200,200 | | | 1,073,320 |
aGlamis Gold Ltd. | | Canada | | 46,700 | | | 800,560 |
Gold Fields Ltd. | | South Africa | | 16,900 | | | 207,335 |
Harmony Gold Mining Ltd., ADR | | South Africa | | 39,400 | | | 365,238 |
Hindalco Industries Inc. | | India | | 35,900 | | | 1,184,327 |
Impala Platinum Holdings Ltd. | | South Africa | | 34,700 | | | 2,934,034 |
a,cInternational Steel Group | | United States | | 128,899 | | | 4,966,736 |
aKinross Gold Corp. | | Canada | | 49,400 | | | 348,047 |
aLionOre Mining International Ltd. | | Canada | | 315,200 | | | 1,802,870 |
Newmont Mining Corp. | | United States | | 186,000 | | | 8,260,260 |
Noranda Inc. | | Canada | | 85,300 | | | 1,497,826 |
Placer Dome Inc. | | Canada | | 29,600 | | | 557,275 |
MD-14
FRANKLIN TEMPLETON VARIABLE INSURANCE PRODUCTS TRUST
MUTUAL DISCOVERY SECURITIES FUND
Statement of Investments, December 31, 2004 (cont.)
| | | | | | | |
| | | COUNTRY | | SHARES/
WARRANTS/
CONTRACTS | | VALUE |
Common Stocks and Other Equity Interests (cont.) | | | | | | | |
Metals & Mining (cont.) | | | | | | | |
aRandgold & Exploration Co. Ltd., ADR | | South Africa | | 10,500 | | $ | 18,480 |
aWheaton River Minerals Ltd. | | Canada | | 82,098 | | | 266,963 |
aWheaton River Minerals Ltd., wts., 5/30/07 | | Canada | | 20,700 | | | 40,731 |
kWMC Resources Ltd. | | Australia | | 96,000 | | | 542,538 |
| | | | | | |
|
|
| | | | | | | | 39,120,022 |
| | | | | | |
|
|
Multi-Utilities & Unregulated Power .3% | | | | | | | |
aNorthwestern Corp. | | United States | | 17,927 | | | 501,956 |
a,bNorthwestern Corp., Contingent Distribution | | United States | | 550,000 | | | 43,061 |
aNRG Energy Inc. | | United States | | 27,079 | | | 976,198 |
| | | | | | |
|
|
| | | | | | | | 1,521,215 |
| | | | | | |
|
|
Oil & Gas 2.5% | | | | | | | |
aAnchor Resources LLC | | United States | | 3,410 | | | — |
Bharat Petroleum Corp. Ltd. | | India | | 18,300 | | | 194,149 |
BP PLC | | United Kingdom | | 158,600 | | | 1,546,486 |
BP PLC, ADR | | United Kingdom | | 9,000 | | | 525,600 |
Canadian Oil Sands Trust | | Canada | | 28,700 | | | 1,617,882 |
Eni SpA | | Italy | | 67,710 | | | 1,692,474 |
aGeneral Maritime Corp. | | United States | | 1,500 | | | 59,925 |
Oil & Natural Gas Corp. Ltd. | | India | | 75,500 | | | 1,430,660 |
Suncor Energy Inc. | | Canada | | 74,700 | | | 2,640,830 |
Total SA, B | | France | | 12,324 | | | 2,687,492 |
Total SA, B, ADR | | France | | 9,670 | | | 1,062,153 |
| | | | | | |
|
|
| | | | | | | | 13,457,651 |
| | | | | | |
|
|
Paper & Forest Products 1.4% | | | | | | | |
Potlatch Corp. | | United States | | 154,200 | | | 7,799,436 |
| | | | | | |
|
|
Personal Products .2% | | | | | | | |
Beiersdorf AG | | Germany | | 7,943 | | | 926,101 |
| | | | | | |
|
|
Pharmaceuticals 2.7% | | | | | | | |
Fujisawa Pharmaceutical Co. Ltd. | | Japan | | 134,400 | | | 3,680,844 |
Pfizer Inc. | | United States | | 44,700 | | | 1,201,983 |
aPfizer Inc., Mar. 25.00 Puts, 3/19/05 | | United States | | 255 | | | 17,850 |
Sanofi-Aventis | | France | | 53,293 | | | 4,252,332 |
Takeda Pharmaceutical Co. Ltd. | | Japan | | 51,785 | | | 2,608,969 |
Wyeth | | United States | | 60,800 | | | 2,589,472 |
Yamanouchi Pharmaceutical Co. Ltd. | | Japan | | 3,000 | | | 116,872 |
| | | | | | |
|
|
| | | | | | | | 14,468,322 |
| | | | | | |
|
|
Real Estate 1.5% | | | | | | | |
aCanary Wharf Group PLC | | United Kingdom | | 185,900 | | | 1,056,209 |
iStar Financial Inc. | | United States | | 121,700 | | | 5,508,142 |
a,cSecurity Capital European Realty | | Luxembourg | | 570 | | | 4,104 |
a,cTorre Mayor Investments, LP | | Mexico | | 10 | | | 650,000 |
Ventas Inc. | | United States | | 33,500 | | | 918,235 |
| | | | | | |
|
|
| | | | | | | | 8,136,690 |
| | | | | | |
|
|
MD-15
FRANKLIN TEMPLETON VARIABLE INSURANCE PRODUCTS TRUST
MUTUAL DISCOVERY SECURITIES FUND
Statement of Investments, December 31, 2004 (cont.)
| | | | | | | | | |
| | | COUNTRY | | SHARES/
WARRANTS/
CONTRACTS | | | VALUE |
Common Stocks and Other Equity Interests (cont.) | | | | | | | | | |
Road & Rail 1.3% | | | | | | | | | |
CSX Corp. | | United States | | | 37,500 | | | $ | 1,503,000 |
cFlorida East Coast Industries Inc. | | United States | | | 124,400 | | | | 5,329,918 |
| | | | | | | | |
|
|
| | | | | | | | | | 6,832,918 |
| | | | | | | | |
|
|
Semiconductors & Semiconductor Equipment .3% | | | | | | | | | |
Samsung Electronics Co. Ltd. | | South Korea | | | 4,200 | | | | 1,827,763 |
| | | | | | | | |
|
|
Software .5% | | | | | | | | | |
Nintendo Co. Ltd. | | Japan | | | 15,100 | | | | 1,897,452 |
a,kSymantec Corp. | | United States | | | 15,600 | | | | 401,856 |
a,kVeritas Software Corp. | | United States | | | 15,800 | | | | 451,090 |
| | | | | | | | |
|
|
| | | | | | | | | | 2,750,398 |
| | | | | | | | |
|
|
Thrifts & Mortgage Finance .2% | | | | | | | | | |
Hudson City Bancorp Inc. | | United States | | | 32,400 | | | | 1,192,968 |
| | | | | | | | |
|
|
Tobacco 14.7% | | | | | | | | | |
Altadis SA | | Spain | | | 320,515 | | | | 14,657,433 |
Altria Group Inc. | | United States | | | 97,831 | | | | 5,977,474 |
British American Tobacco PLC | | United Kingdom | | | 995,275 | | | | 17,145,751 |
Gallaher Group PLC | | United Kingdom | | | 359,700 | | | | 5,464,750 |
Imperial Tobacco Group PLC | | United Kingdom | | | 537,817 | | | | 14,731,177 |
ITC Ltd. | | India | | | 65,968 | | | | 1,997,801 |
Japan Tobacco Inc. | | Japan | | | 328 | | | | 3,746,924 |
KT & G Corp. | | South Korea | | | 191,050 | | | | 5,711,937 |
KT & G Corp., GDR, 144A | | South Korea | | | 235,090 | | | | 3,455,823 |
Reynolds American Inc. | | United States | | | 87,900 | | | | 6,908,940 |
| | | | | | | | |
|
|
| | | | | | | | | | 79,798,010 |
| | | | | | | | |
|
|
Wireless Telecommunication Services | | | | | | | | | |
aVast Solutions Inc., B1 | | United States | | | 6,567 | | | | — |
| | | | | | | | |
|
|
Total Common Stocks and Other Equity Interests (Cost $334,527,007) | | | | | | | | | 452,380,207 |
| | | | | | | | |
|
|
Preferred Stocks .4% | | | | | | | | | |
Diversified Telecommunication Services | | | | | | | | | |
PTV Inc., 10.00%, A, pfd. | | United Kingdom | | | 4,289 | | | | 19,429 |
| | | | | | | | |
|
|
Electric Utilities | | | | | | | | | |
aMontana Power Co., 8.45%, pfd. | | United States | | | 2,880 | | | | 23,760 |
| | | | | | | | |
|
|
Food Products .1% | | | | | | | | | |
Unilever NV, pfd. | | Netherlands | | | 43,200 | | | | 293,698 |
| | | | | | | | |
|
|
Metals & Mining .3% | | | | | | | | | |
aEsmark Inc., Series A, 10.00%, cvt. pfd. | | United States | | | 1,572 | | | | 1,572,400 |
| | | | | | | | |
|
|
Total Preferred Stocks (Cost $1,888,298) | | | | | | | | | 1,909,287 |
| | | | | | | | |
|
|
| | | |
| | | | | PRINCIPAL
AMOUNTg
| | | |
Corporate Bonds & Notes 1.1% | | | | | | | | | |
Anchor Resources LLC, 12.00%, 12/17/06 | | United States | | $ | 1,595 | | | | 1,595 |
Calpine Generating Co., 144A, 11.169%, 4/01/11 | | United States | | | 690,000 | | | | 677,925 |
Eurotunnel PLC, FRN, | | | | | | | | | |
6.347%, 12/31/18, Tier 2 | | United Kingdom | | | 199,114 | GBP | | | 275,177 |
6.347%, 12/31/25, Tier 3 | | United Kingdom | | | 1,217,624 | GBP | | | 981,616 |
MD-16
FRANKLIN TEMPLETON VARIABLE INSURANCE PRODUCTS TRUST
MUTUAL DISCOVERY SECURITIES FUND
Statement of Investments, December 31, 2004 (cont.)
| | | | | | | | |
| | | COUNTRY | | PRINCIPAL
AMOUNTg | | | VALUE |
Corporate Bonds & Notes (cont.) | | | | | | | | |
Eurotunnel SA, FRN, | | | | | | | | |
3.449%, 12/31/18, Tier 2 (LIBOR) | | France | | 39,763 | EUR | | $ | 38,850 |
3.449%, 12/31/25, Tier 3 (LIBOR) | | France | | 1,476,585 | EUR | | | 841,564 |
3.453%, 12/31/18, Tier 2 (PIBOR) | | France | | 17,565 | EUR | | | 17,162 |
3.453%, 12/31/25, Tier 3 (PIBOR) | | France | | 331,700 | EUR | | | 189,049 |
Guadalupe Power Partners LP,
Power Sale Agreement, 6.00%, 9/21/06 | | United States | | 12,700 | | | | 11,176 |
Term Loan, 4.313%, 9/21/06 | | United States | | 93,983 | | | | 82,705 |
Motor Coach Industries International Inc., FRN, 15.40%, 10/01/08 | | United States | | 1,900,113 | | | | 1,900,113 |
Reliant Energy Channelview LP Inc.,
Revolver, 5.50%, 8/15/07 | | United States | | 22,100 | | | | 18,785 |
Term Loan A, 3.813%, 11/26/17 | | United States | | 233,319 | | | | 198,321 |
Seton House Finance Ltd., zero cpn., 2/07/12 | | United
Kingdom | | 2,553,000 | EUR | | | 883,427 |
TVMax Holdings Inc., PIK, | | | | | | | | |
11.50%, 6/30/05 | | United States | | 7,259 | | | | 7,259 |
14.00%, 6/30/05 | | United States | | 33,916 | | | | 33,916 |
| | | | | | | |
|
|
Total Corporate Bonds & Notes (Cost $6,513,320) | | | | | | | | 6,158,640 |
| | | | | | | |
|
|
Bonds & Notes in Reorganization 2.1% | | | | | | | | |
a,eAdelphia Communications Corp., | | | | | | | | |
9.25%, 10/01/02 | | United States | | 2,490,000 | | | | 2,396,625 |
8.125%, 7/15/03 | | United States | | 219,000 | | | | 206,955 |
7.50%, 1/15/04 | | United States | | 80,000 | | | | 74,400 |
10.50%, 7/15/04 | | United States | | 124,000 | | | | 122,760 |
9.875%, 3/01/05 | | United States | | 85,000 | | | | 81,812 |
10.25%, 11/01/06 | | United States | | 248,000 | | | | 242,420 |
9.875%, 3/01/07 | | United States | | 12,000 | | | | 11,550 |
8.375%, 2/01/08 | | United States | | 235,000 | | | | 222,662 |
7.75%, 1/15/09 | | United States | | 210,000 | | | | 197,400 |
7.875%, 5/01/09 | | United States | | 141,000 | | | | 131,835 |
9.375%, 11/15/09 | | United States | | 56,000 | | | | 55,580 |
10.875%, 10/01/10 | | United States | | 231,000 | | | | 229,845 |
senior note, B, 9.50%, 2/15/04 | | United States | | 13,844 | | | | 13,013 |
a,eAiken Cnty S C Indl Rev Beloit, 6.00%, 12/01/11 | | United States | | 20,000 | | | | 100 |
a,eArmstrong Holdings Inc., | | | | | | | | |
6.50%, 8/15/05 | | United States | | 79,000 | | | | 57,472 |
9.75%, 4/15/08 | | United States | | 146,000 | | | | 106,215 |
Revolver, 10/29/03 | | United States | | 171,450 | | | | 118,300 |
Trade Claim | | United States | | 459,700 | | | | 321,790 |
a,eCentury Communications Corp., | | | | | | | | |
9.50%, 3/01/05 | | United States | | 52,000 | | | | 63,180 |
8.875%, 1/15/07 | | United States | | 71,000 | | | | 85,555 |
8.75%, 10/01/07 | | United States | | 119,000 | | | | 140,420 |
8.375%, 12/15/07 | | United States | | 20,000 | | | | 23,900 |
Series B, zero cpn., 1/15/08 | | United States | | 212,000 | | | | 149,460 |
zero cpn., 3/15/03 | | United States | | 353,000 | | | | 375,945 |
eDecisionOne Corp., Term Loan | | United States | | 159,204 | | | | 39,801 |
a,eHarnischfeger Industries Inc., | | | | | | | | |
8.90%, 3/01/22 | | United States | | 162,000 | | | | 1,507 |
8.70%, 6/15/22 | | United States | | 159,000 | | | | 1,511 |
7.25%, 12/15/25 | | United States | | 232,000 | | | | 2,181 |
6.875%, 2/15/27 | | United States | | 216,000 | | | | 1,987 |
Stipulated Bank Claim | | United States | | 250,450 | | | | 2,279 |
MD-17
FRANKLIN TEMPLETON VARIABLE INSURANCE PRODUCTS TRUST
MUTUAL DISCOVERY SECURITIES FUND
Statement of Investments, December 31, 2004 (cont.)
| | | | | | | | | |
| | | COUNTRY | | PRINCIPAL
AMOUNTg | | VALUE | |
Bonds & Notes in Reorganization (cont.) | | | | | | | | | |
a,eMirant Americas Generation Inc., | | | | | | | | | |
7.625%, 5/01/06 | | United States | | $ | 70,000 | | $ | 75,600 | |
8.30%, 5/01/11 | | United States | | | 259,000 | | | 275,188 | |
9.125%, 5/01/31 | | United States | | | 215,000 | | | 225,213 | |
a,eMirant Corp., | | | | | | | | | |
Tranche C Revolver | | United States | | | 313,706 | | | 216,457 | |
4 Year Revolver, 7/17/05 | | United States | | | 199,654 | | | 150,739 | |
364 Day Revolver | | United States | | | 573,400 | | | 398,513 | |
a,eOwens Corning, Revolver | | United States | | | 2,358,094 | | | 2,098,704 | |
a,ePort Seattle Wash Rev Ref-Beloit Proj., 6.00%, 12/01/17 | | United States | | | 10,000 | | | 50 | |
a,eSafety Kleen Services, 9.25%, 6/01/08 | | United States | | | 3,000 | | | 11 | |
a,eTeco Panda, | | | | | | | | | |
Bank Claim | | United States | | | 126,760 | | | 76,056 | |
Bank Claim #2 | | United States | | | 877,600 | | | 552,888 | |
Bank Claim #3 | | United States | | | 5,653 | | | 5,653 | |
Debt Service Reserve L/C Loan | | United States | | | 24,800 | | | 15,624 | |
Project L/C Loan Facility | | United States | | | 119,520 | | | 75,298 | |
eTrump Atlantic, | | | | | | | | | |
11.25%, 5/01/06 | | United States | | | 1,397,000 | | | 1,339,374 | |
Series B, 11.25%, 5/01/06 | | United States | | | 419,000 | | | 401,716 | |
Series B, 144A, 11.25%, 5/01/06 | | United States | | | 25,000 | | | 23,969 | |
| | | | | | | |
|
|
|
Total Bonds & Notes in Reorganization (Cost $9,869,260) | | | | | | | | 11,409,513 | |
| | | | | | | |
|
|
|
| | | | | UNITS/
PRINCIPAL
AMOUNTg
| | | |
Companies in Liquidation | | | | | | | | | |
aBrunos Inc., Liquidating Unit | | United States | | | 2,247 | | | 4,943 | |
aUnited Cos. Financial Corp., | | | | | | | | | |
Bank Claim | | United States | | | 4,727 | | | — | |
Revolver | | United States | | | 1,199,266 | | | — | |
| | | | | | | |
|
|
|
Total Companies in Liquidation (Cost $–) | | | | | | | | 4,943 | |
| | | | | | | |
|
|
|
Government Agencies (Cost $64,597,583) 11.9% | | | | | | | | | |
f,hFederal Home Loan Bank, 1/03/05 - 11/25/05 | | United States | | $ | 64,845,000 | | | 64,578,021 | |
| | | | | | | |
|
|
|
Total Investments (Cost $417,395,468) 99.1% | | | | | | | | 536,440,611 | |
Options Written | | | | | | | | (18,464 | ) |
Securities Sold Short (.6)% | | | | | | | | (3,417,773 | ) |
Net Unrealized Loss on Forward Exchange Contracts (1.2)% | | | | | | | | (6,300,192 | ) |
Other Assets, less Liabilities 2.7% | | | | | | | | 14,558,370 | |
| | | | | | | |
|
|
|
Net Assets 100.0% | | | | | | | $ | 541,262,552 | |
| | | | | | | |
|
|
|
Options Written | | | | | | | | | |
| | | |
| ISSUER | | COUNTRY | | CONTRACTS | | VALUE | |
Health Care Equipment & Supplies | | | | | | | | | |
iGuidant Corp., Jan. 70.00 Calls, 01/22/05 | | United States | | | 17 | | $ | 3,995 | |
| | | | | | | |
|
|
|
Metals & Mining | | | | | | | | | |
iWMC Resources Ltd., Jan. 7.00 Calls, 1/27/05 | | Australia | | | 25 | | | 6,556 | |
iWMC Resources Ltd., Jan. 7.25 Calls, 1/27/05 | | Australia | | | 12 | | | 1,737 | |
| | | | | | | |
|
|
|
| | | | | | | | | 8,293 | |
| | | | | | | |
|
|
|
MD-18
FRANKLIN TEMPLETON VARIABLE INSURANCE PRODUCTS TRUST
MUTUAL DISCOVERY SECURITIES FUND
Statement of Investments, December 31, 2004 (cont.)
Options Written (cont.)
| | | | | | | |
| | | |
| ISSUER | | COUNTRY | | CONTRACTS | | VALUE |
Software | | | | | | | |
iSymantec Corp., Jan. 25.00 Calls, 1/22/05 | | United States | | 24 | | $ | 3,600 |
iSymantec Corp., Jan. 27.50 Calls, 1/22/05 | | United States | | 16 | | | 656 |
iVeritas Software Corp., Jan. 30.00 Calls, 1/22/05 | | United States | | 32 | | | 1,920 |
| | | | | | |
|
|
| | | | | | | | 6,176 |
| | | | | | |
|
|
Total Options Written (Premiums received $17,185) | | | | | | $ | 18,464 |
| | | | | | |
|
|
Securities Sold Short | | | | | | | |
Communications Equipment | | | | | | | |
jTellabs Inc. | | United States | | 5,711 | | $ | 49,057 |
| | | | | | |
|
|
Diversified Financial Services .1% | | | | | | | |
jNasdaq 100 | | United States | | 16,200 | | | 646,704 |
| | | | | | |
|
|
Food Products .4% | | | | | | | |
jKraft Foods Inc., A | | United States | | 64,580 | | | 2,299,694 |
| | | | | | |
|
|
Hotels Restaurants & Leisure | | | | | | | |
jHarrah’s Entertainment Inc. | | United States | | 1,573 | | | 105,218 |
| | | | | | |
|
|
Pharmaceuticals .1% | | | | | | | |
jJohnson & Johnson | | United States | | 5,000 | | | 317,100 |
| | | | | | |
|
|
Total Securities Sold Short (Proceeds $3,179,545) | | | | | | $ | 3,417,773 |
| | | | | | |
|
|
Currency Abbreviations:
EUR - Euro
GBP - British Pound
Portfolio Abbreviations:
ADR - American Depository Receipt
FRN - Floating Rate Note
GDR - Global Depository Receipt
PIK - Payment-in-Kind
| b | Contingent Distributions represent the right to receive additional distributions, if any, during the reorganization of the underlying company. Shares represent total underlying principal of debt securities. |
| c | See Note 10 regarding restricted securities. |
| d | See Note 11 regarding other considerations. |
| e | See Note 9 regarding defaulted securities. |
| f | See Note 1(g) regarding securities segregated with broker for securities sold short. |
| g | The principal amount is stated in U.S. dollars unless otherwise indicated. |
| h | Security is traded on a discount basis with no stated coupon rate. |
| i | See Note 1(f) regarding written options. |
| j | See Note 1(g) regarding securities sold short. |
| k | A portion of security held in connection with open option contracts. |
See notes to financial statements.
MD-19
FRANKLIN TEMPLETON VARIABLE INSURANCE PRODUCTS TRUST
MUTUAL DISCOVERY SECURITIES FUND
Financial Statements
Statement of Assets and Liabilities
December 31, 2004
| | | |
Assets: | | | |
Investments in securities: | | | |
Cost | | $ | 417,395,468 |
| | |
|
|
Value - (includes securities segregated with broker for securities sold short in the amount of $1,461,491) | | | 536,440,611 |
Cash | | | 4,180,866 |
Foreign currency, at value (cost $2,704,928) | | | 2,816,210 |
Receivables: | | | |
Investment securities sold | | | 2,724,147 |
Capital shares sold | | | 1,201,000 |
Dividends and interest | | | 1,064,965 |
Unrealized gain on forward exchange contracts (Note 8) | | | 663,855 |
Due from broker - synthetic equity swaps | | | 161,331 |
Cash on deposit with brokers for securities sold short | | | 4,290,243 |
| | |
|
|
Total assets | | | 553,543,228 |
| | |
|
|
Liabilities: | | | |
Payables: | | | |
Investment securities purchased | | | 1,040,187 |
Capital shares redeemed | | | 201,582 |
Affiliates | | | 498,538 |
Options written, at value (premiums received $17,185) | | | 18,464 |
Securities sold short, at value (proceeds $3,179,545) | | | 3,417,773 |
Unrealized loss on forward exchange contracts (Note 8) | | | 6,964,047 |
Deferred tax | | | 49,461 |
Other liabilities | | | 90,624 |
| | |
|
|
Total liabilities | | | 12,280,676 |
| | |
|
|
Net assets, at value | | $ | 541,262,552 |
| | |
|
|
Net assets consist of: | | | |
Undistributed net investment income | | $ | 4,937,934 |
Net unrealized appreciation (depreciation) | | | 112,607,500 |
Accumulated net realized gain (loss) | | | (243,788) |
Capital shares | | | 423,960,906 |
| | |
|
|
Net assets, at value | | $ | 541,262,552 |
| | |
|
|
Class 1: | | | |
Net assets, at value | | $ | 137,702,932 |
| | |
|
|
Shares outstanding | | | 8,375,203 |
| | |
|
|
Net asset value per share | | $ | 16.44 |
| | |
|
|
Class 2: | | | |
Net assets, at value | | $ | 403,559,620 |
| | |
|
|
Shares outstanding | | | 24,831,666 |
| | |
|
|
Net asset value per share | | $ | 16.25 |
| | |
|
|
See notes to financial statements.
MD-20
FRANKLIN TEMPLETON VARIABLE INSURANCE PRODUCTS TRUST
MUTUAL DISCOVERY SECURITIES FUND
Financial Statements (continued)
Statement of Operations
For the year ended December 31, 2004
| | | | |
Investment Income: | | | | |
Dividends (net of foreign taxes of $772,095) | | $ | 8,333,910 | |
Interest | | | 2,293,403 | |
| | |
|
|
|
Total investment income | | | 10,627,313 | |
| | |
|
|
|
Expenses: | | | | |
Management fees (Note 3) | | | 3,125,329 | |
Administrative fees (Note 3) | | | 556,946 | |
Distribution fees - Class 2 (Note 3) | | | 647,232 | |
Custodian fees (Notes 4) | | | 64,849 | |
Reports to shareholders | | | 80,900 | |
Professional fees | | | 50,281 | |
Trustees’ fees and expenses | | | 2,200 | |
Dividends on securities sold short | | | 49,367 | |
Other | | | 23,941 | |
| | |
|
|
|
Total expenses | | | 4,601,045 | |
Expense reductions (Note 4) | | | (2,323 | ) |
| | |
|
|
|
Net expenses | | | 4,598,722 | |
| | |
|
|
|
Net investment income (loss) | | | 6,028,591 | |
| | |
|
|
|
Realized and unrealized gains (losses): | | | | |
Net realized gain (loss) from: | | | | |
Investments | | | 18,548,206 | |
Written options | | | 74,757 | |
Foreign currency transactions | | | (9,938,879 | ) |
Securities sold short | | | (133,922 | ) |
| | |
|
|
|
Net realized gain (loss) | | | 8,550,162 | |
| | |
|
|
|
Net change in unrealized appreciation (depreciation) on: | | | | |
Investments | | | 58,743,784 | |
Translation of assets and liabilities denominated in foreign currencies | | | (485,086 | ) |
Deferred taxes | | | 13,463 | |
| | |
|
|
|
Net change in unrealized appreciation (depreciation) | | | 58,272,161 | |
| | |
|
|
|
Net realized and unrealized gain (loss) | | | 66,822,323 | |
| | |
|
|
|
Net increase (decrease) in net assets resulting from operations | | $ | 72,850,914 | |
| | |
|
|
|
See notes to financial statements.
MD-21
FRANKLIN TEMPLETON VARIABLE INSURANCE PRODUCTS TRUST
MUTUAL DISCOVERY SECURITIES FUND
Financial Statements (continued)
Statement of Changes in Net Assets
For the years ended December 31, 2004 and 2003
| | | | | | | | |
| | | 2004 | | | 2003 | |
| | |
| |
Increase (decrease) in net assets: | | | | | | | | |
Operations: | | | | | | | | |
Net investment income | | $ | 6,028,591 | | | $ | 2,757,580 | |
Net realized gain (loss) from investments, written options, foreign currency transactions, and securities sold short | | | 8,550,162 | | | | 1,258,094 | |
Net change in unrealized appreciation (depreciation) on investments, translation of assets and liabilities denominated in foreign currencies, and deferred taxes | | | 58,272,161 | | | | 52,662,672 | |
| | |
| |
Net increase (decrease) in net assets resulting from operations | | | 72,850,914 | | | | 56,678,346 | |
Distributions to shareholders from: | | | | | | | | |
Net investment income: | | | | | | | | |
Class 1 | | | (1,514,244 | ) | | | (2,214,822 | ) |
Class 2 | | | (2,636,191 | ) | | | (1,329,275 | ) |
| | |
| |
Total distributions to shareholders | | | (4,150,435) | | | | (3,544,097 | ) |
Capital share transactions: (Note 2) | | | | | | | | |
Class 1 | | | (17,489,472 | ) | | | (16,943,099 | ) |
Class 2 | | | 195,348,144 | | | | 99,261,086 | |
| | |
| |
Total capital share transactions | | | 177,858,672 | | | | 82,317,987 | |
Net increase (decrease) in net assets | | | 246,559,151 | | | | 135,452,236 | |
Net assets: | | | | | | | | |
Beginning of year | | | 294,703,401 | | | | 159,251,165 | |
| | |
| |
End of year | | $ | 541,262,552 | | | $ | 294,703,401 | |
| | |
| |
Undistributed net investment income included in net assets: | | | | | | | | |
End of year | | $ | 4,937,934 | | | $ | 2,414,242 | |
| | |
| |
See notes to financial statements.
MD-22
FRANKLIN TEMPLETON VARIABLE INSURANCE PRODUCTS TRUST
MUTUAL DISCOVERY SECURITIES FUND
Notes to Financial Statements
1. ORGANIZATION AND SIGNIFICANT ACCOUNTING POLICIES
Franklin Templeton Variable Insurance Products Trust (the Trust) is registered under the Investment Company Act of 1940 as an open-end investment company, consisting of twenty-one separate series (the Funds). The Mutual Discovery Securities Fund (the Fund) included in this report is diversified. The financial statements of the remaining funds in the series are presented separately. Shares of the Fund are sold only to insurance company separate accounts to fund the benefits of variable life insurance policies or variable annuity contracts. As of December 31, 2004, over 73% of the Fund’s shares were sold through one insurance company. The Fund’s investment objective is capital growth.
The following summarizes the Fund’s significant accounting policies.
a. Security Valuation
Securities listed on a securities exchange or on the NASDAQ National Market System, are valued at the last quoted sale price or the official closing price of the day, respectively. Over-the-counter securities and listed securities for which there is no reported sale are valued within the range of the most recent quoted bid and ask prices. Securities that trade in multiple markets or on multiple exchanges are valued according to the broadest and most representative market.
Corporate debt securities and U.S. Government securities generally trade in the over-the-counter market rather than on a securities exchange. The Trust may utilize independent pricing services, quotations from bond dealers, and information with respect to bond and note transactions, to assist in determining a current market value for each security. The Trust’s pricing services may use valuation models or matrix pricing which considers information with respect to comparable bond and note transactions, quotations from bond dealers, or by reference to other securities that are considered comparable in such characteristics as rating, interest rate and maturity date, option adjusted spread models, prepayment projections, interest rate spreads and yield curves, to determine current value.
Foreign securities are valued as of the close of trading on the foreign stock exchange on which the security is primarily traded, or the NYSE, whichever is earlier. The value is then converted into its U.S. dollar equivalent at the foreign exchange rate in effect at the close of the NYSE on the day that the value of the foreign security is determined. If no sale is reported at that time, the foreign security will be valued within the range of the most recent quoted bid and ask prices.
The Trust has procedures to determine the fair value of individual securities and other assets for which market prices are not readily available or which may not be reliably priced. Some methods for valuing these securities may include: fundamental analysis, matrix pricing, discounts from market prices of similar securities, or discounts applied due to the nature and duration of restrictions on the disposition of the securities. Due to the inherent uncertainty of valuations of such securities, the fair values may differ significantly from the values that would have been used had a ready market for such investments existed. Occasionally, events occur between the time at which trading in a security is completed and the close of the NYSE that might call into question the availability (including the reliability) of the value of a portfolio security held by the Fund. If such an event occurs, the securities may be valued using fair value procedures, which may include the use of independent pricing services. All security valuation procedures are approved by the Trust’s Board of Trustees.
b. Foreign Currency Translation
Portfolio securities and other assets and liabilities denominated in foreign currencies are translated into U.S. dollars based on the exchange rate of such currencies against U.S. dollars on the date of valuation. Purchases and sales of securities, income and expense items denominated in foreign currencies are translated into U.S. dollars at the exchange rate in effect on the transaction date. Occasionally events may impact the availability or reliability of foreign exchange rates used to convert the U.S. dollar equivalent value. If such an event occurs, the foreign exchange rate will be valued at fair value using procedures established and approved by the Trust’s Board of Trustees.
MD-23
FRANKLIN TEMPLETON VARIABLE INSURANCE PRODUCTS TRUST
MUTUAL DISCOVERY SECURITIES FUND
Notes to Financial Statements (continued)
1. ORGANIZATION AND SIGNIFICANT ACCOUNTING POLICIES (cont.)
b. Foreign Currency Translation (cont.)
The Fund does not separately report the effect of changes in foreign exchange rates from changes in market prices on securities held. Such changes are included in net realized and unrealized gain or loss from investments on the Statement of Operations.
Realized foreign exchange gains or losses arise from sales of foreign currencies, currency gains or losses realized between the trade and settlement dates on securities transactions and the difference between the recorded amounts of dividends, interest, and foreign withholding taxes and the U.S. dollar equivalent of the amounts actually received or paid. Net unrealized foreign exchange gains and losses arise from changes in foreign exchange rates on foreign denominated assets and liabilities other than investments in securities held at the end of the reporting period.
c. Securities Purchased on a When-Issued, Delayed Delivery, or TBA Basis
The Fund may purchase securities on a when-issued, delayed delivery, or to-be-announced (TBA) basis, with payment and delivery scheduled for a future date. These transactions are subject to market fluctuations and are subject to the risk that the value at delivery may be more or less than the trade date purchase price. Although the Fund will generally purchase these securities with the intention of holding the securities, it may sell the securities before the settlement date.
d. Foreign Currency Contracts
The Fund may enter into forward exchange contracts to hedge against fluctuations in foreign exchange rates. A forward exchange contract is an agreement between two parties to exchange different currencies at an agreed upon exchange rate at a future date. These contracts are valued daily by the Fund and any equity therein is included in the Statement of Assets and Liabilities. Realized and unrealized gains and losses on these contracts are included in the Statement of Operations.
When the Fund purchases or sells foreign securities it may enter into foreign exchange contracts to minimize foreign exchange risk from the trade date to the settlement date of the transactions. Realized and unrealized gains and losses on these contracts are included in the Statement of Operations.
The risks of these contracts include movement in the values of the foreign currencies relative to the U.S. dollar and the possible inability of the counterparties to fulfill their obligations under the contracts.
e. Synthetic Equity Swaps
The Fund may engage in synthetic equity swaps. Synthetic equity swaps are contracts entered into between a broker and the Fund under which the parties agree to make payments to each other so as to replicate the economic consequences that would apply had a purchase or sale of the underlying security taken place. Upon entering into synthetic equity swaps, the Fund is required to pledge to the broker an amount of cash and/or other assets equal to a certain percentage of the contract amount (“initial margin”). Subsequent payments known as “variation margin”, are made or received by the Fund periodically, depending on fluctuations in the value of the underlying security. When the contract is closed, the Fund records a realized gain or loss equal to the difference between the value of the contract at the time it was opened and the value at the time it was closed. The risks of entering into synthetic equity swaps include unfavorable price movements in the underlying securities or the inability of the counterparties to fulfill their obligations under the contract.
f. Options Contracts
The Fund may purchase or write options. Options are contracts entitling the holder to purchase or sell a specified number of shares or units of a particular security at a specified price. Options purchased are recorded as investments; options written (sold) are recorded as liabilities. Upon closing of an option, other than by exercise, which results in a cash settlement, the difference
MD-24
MUTUAL SHARES SECURITIES FUND
We are pleased to bring you Mutual Shares Securities Fund’s annual report for the fiscal year ended December 31, 2004.
Performance Summary as of 12/31/04
Average annual total return of Class 2 shares* represents the average annual change in value, assuming reinvestment of dividends and capital gains. Average returns smooth out variations in returns, which can be significant; they are not the same as year-by-year results.
Periods ended 12/31/04
| | | | | | |
| | | 1-Year | | 5-Year | | Since
Inception
(11/8/96) |
Average Annual Total Return | | +12.63% | | +8.55% | | +9.46% |
*Because Class 2 shares were not offered until 1/6/99, standardized Class 2 Fund performance for prior periods represents the historical results of Class 1 shares. For periods beginning on 1/6/99, Class 2’s results reflect an additional 12b-1 fee expense, which also affects future performance. Since 1/6/99 (effective date), the average annual total return of Class 2 shares was +8.80%.
Total Return Index Comparison for Hypothetical $10,000 Investment (11/8/96–12/31/04)
The graph below shows the change in value of a hypothetical $10,000 investment in the Fund over the indicated period and includes reinvestment of any income or distributions. The Fund’s performance* is compared to the performance of the Standard & Poor’s 500 Composite Index (S&P 500). One cannot invest directly in an index, nor is an index representative of the Fund’s portfolio. Please see Important Notes to Performance Information preceding the Fund Summaries.
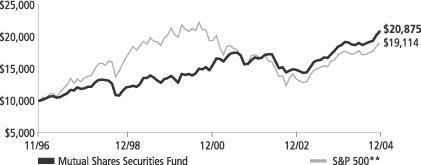
**Source: Standard & Poor’s Micropal. Please see Index Descriptions following the Fund Summaries.
Mutual Shares Securities Fund – Class 2
Performance reflects the Fund’s Class 2 operating expenses, but does not include any contract fees, expenses or sales charges. If they had been included, performance would be lower. These charges and deductions, particularly for variable life policies, can have a significant effect on contract values and insurance benefits. See the contract prospectus for a complete description of these expenses, including sales charges.
Performance data quoted represent past performance, which does not guarantee future results. Investment return and principal value will fluctuate, and you may have a gain or loss when you sell your shares. Current performance may differ from figures shown.
MS-1
Fund Goals and Main Investments: Mutual Shares Securities Fund seeks capital appreciation, with income as a secondary goal. The Fund invests mainly in equity securities (including securities convertible, or that the manager expects to become convertible, into common or preferred stock) of companies that the Fund’s manager believes are available at market prices less than their value based on certain recognized or objective criteria. The Fund may also invest a significant portion in small capitalization companies and a portion in foreign securities.
Performance Overview
You can find the Fund’s one-year total return in the Performance Summary. The Fund outperformed its benchmark, the S&P 500, which returned 10.87% for the period under review.1
Economic and Market Overview
During the year ended December 31, 2004, the domestic economy expanded solidly and broadly across most industries, sectors and regions as gross domestic product (GDP) rose an estimated 4.4%.2 However, surging energy and other commodity prices had a dampening effect. Although consumer confidence remained below pre-recession levels, consumer spending supported strong auto sales, increased durable goods consumption and a healthy housing market. Similarly, business spending rose substantially even as business confidence wavered. The labor market firmed as employers hired 2.2 million workers in 2004, and unemployment dropped from 5.7% to 5.4% during the year.3
The U.S. dollar weakened throughout 2004 and hit an all-time low against the euro and a multi-year low versus the yen. The widening trade and current account deficits and possibility for higher import prices contributed to inflationary pressures. The core inflation rate rose to 2.2% in 2004, or 3.3% including volatile food and energy costs. Aiming to keep inflation tame, the Federal Reserve Board raised the federal funds target rate five times between June and December, from 1.00% to 2.25%, the highest level in more than three years.
Domestic equity markets rallied in early 2004 and then fluctuated; however, they were essentially flat through early November. After the
1. Source: Standard & Poor’s Micropal. One cannot invest directly in an index, nor is an index representative of the Fund’s portfolio. Please see Index Descriptions following the Fund Summaries.
2. Source: Bureau of Economic Analysis.
3. Source: Bureau of Labor Statistics.
Fund Risks: Stocks offer the potential for long-term gains but can be subject to short-term up-and-down price movements. Investments in companies involved in mergers, liquidations, reorganizations and distressed bankruptcy, which may include defaulted debt, involve higher credit and other risks. Foreign investing involves special risks including currency fluctuations, economic instability, and social and political developments. Smaller and midsize company securities involve special risks such as relatively small revenues, limited product lines, and small market shares. The Fund’s prospectus also includes a description of the main investment risks.
MS-2
elections concluded, the markets enjoyed another strong rally through year-end. The blue chip stocks of the Dow Jones Industrial Average gained 5.31% for the year under review, while the broader S&P 500 rose 10.87% and the technology-heavy NASDAQ Composite Index increased 9.15%.4
Outside the U.S., the global economic recovery continued in 2004, led by growth in China. The 12-nation euro zone lagged other regions in the current recovery. However, the European Central Bank projected euro zone growth may be between 1.6% and 2.0% in 2004, compared with only 0.5% in 2003. In Japan, the economy struggled to emerge from a decade-long deflationary period. Although the country’s consumer and business confidence reached their highest levels since 1991, economic growth slowed in response to higher oil prices and reduced external demand. The U.S. dollar decline hurt Japanese and European exports to the U.S., as it made their goods more expensive in the world’s biggest market.
For the 12-month period ended December 31, 2004, the Morgan Stanley Capital International (MSCI) World Index’s total return was 15.25% in U.S. dollars.4 Emerging markets, as measured by the MSCI Emerging Markets Index, had a total return of 25.95% in U.S. dollars.4 In local currencies, these indexes had notably lower total returns of 11.83% and 16.45% for the same period.4 During the period, most of the world’s currencies strengthened in relation to the U.S. dollar, which benefited U.S.-based investors of non-U.S. developed and emerging market equities.
Investment Strategy
At Mutual Series, we are committed to our distinctive three-pronged approach to investing. The first prong of our investment strategy, and the component that typically comprises the largest portion of our portfolio, is investing in undervalued stocks. When selecting undervalued equities, we prefer to invest in fundamentally strong companies, with healthy balance sheets, high-quality assets, substantial free cash flow and shareholder-oriented management teams whose stocks are trading at material discounts to our assessment of the companies’ intrinsic or business value. While most of our undervalued equity investments are made in publicly traded companies, we may invest occasionally in privately held companies as well.
4. Source: Standard & Poor’s Micropal. Please see Index Descriptions following the Fund Summaries.
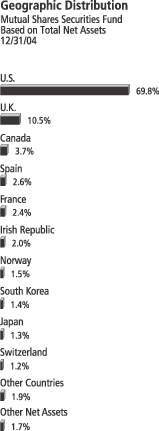
MS-3
Our second investment prong is bankruptcy or distressed investing, a highly specialized field which is complex and can take many forms. The most common distressed investment the Fund undertakes is the purchase of debt of financially troubled or bankrupt companies generally at a substantial discount to face value. After the financially distressed company is reorganized, often in bankruptcy court, the old bonds are typically replaced with new securities issued by the financially stronger company.
The third prong of our investment strategy is participating in arbitrage situations, another highly specialized field. When companies announce mergers or takeovers, commonly referred to as “deals,” the target company may trade at a discount to the bid it ultimately accepts. One form of arbitrage involves purchasing the target company’s stock when it is trading below the value we believe it is likely to receive in a deal. In keeping with our commitment to a conservative investment approach, we primarily focus our arbitrage efforts on announced deals, generally eschewing rumored deals or other situations we consider to be risky.
Manager’s Discussion
All three prongs of our investment strategy contributed to the Fund’s performance during the year under review, with the equity portion providing the greatest contribution. Three of the Fund’s best performing stock investments were White Mountains Insurance Group, a property and casualty insurer; Altadis, a Franco-Spanish tobacco company; and British American Tobacco (BAT), the world’s second-largest tobacco company with about 15% of the global market.
We believe that White Mountains, one of the largest contributors to Fund performance during the fiscal year, was an excellent example of how substantial shareholder value can be created when well-capitalized companies are run by strong managers. With the company’s solid balance sheet, White Mountains’ management team has made several acquisitions, enabling the company to profitably grow its bottom line while extending its exposure to lines of business we think are attractive. In addition to exercising discipline with acquisitions, management remained committed to a conservative underwriting strategy. This strategy enabled White Mountains to continue to report solid underwriting results for 2004 despite record industry-wide insurance claims from the Atlantic hurricane season. During the year under review, the markets began to better appreciate White Mountains’ consistent results, strong balance sheet, and disciplined acquisition and underwriting practices, as well as its shareholder-oriented management team. White Mountains’ stock rose about 41% in 2004.
Top 10 Sectors/Industries
Mutual Shares Securities Fund
Based on Equity Securities 12/31/04
| | |
| | | % of Total
Net Assets |
| |
| Insurance | | 13.8% |
| |
| Tobacco | | 11.4% |
| |
| Media | | 8.1% |
| |
| Metals & Mining | | 6.3% |
| |
| Food Products | | 4.2% |
| |
| Commercial Banks | | 3.4% |
| |
| Pharmaceuticals | | 3.3% |
| |
| Oil & Gas | | 2.7% |
| |
| Beverages | | 2.4% |
| |
| Road & Rail | | 1.8% |
MS-4
In 2004, tobacco companies operating in Europe, such as Altadis, encountered a challenging sales environment, especially in France after the government imposition of two substantial tax increases by early 2004 that pressured volumes and contributed to reduced consumption of about 25% in volume. Despite challenges in France and elsewhere, Altadis shares performed well as management returned cash to shareholders through dividends and share repurchases. In addition, the company announced two acquisitions and a cost-restructuring program. As a result of these and other factors, Altadis shares appreciated about 65% in 2004. Despite this strong performance, the stock still traded at a significant discount to its European peers and our calculation of the stock’s intrinsic value. In addition, some analysts believe the industry is ready for more consolidation.
BAT shares appreciated after the U.S. Federal Trade Commission, in June 2004, approved the merger of Brown & Williamson, BAT’s U.S. subsidiary, with R.J. Reynolds Tobacco Holdings to form Reynolds American. The company estimates that the proposed combination will generate cost savings of at least $500 million within 24 months of the deal’s close. Other factors that contributed to the stock’s appreciation included the reportedly successful integration of ETI, the former Italian tobacco monopoly acquired in 2003, the implementation of a cost-saving plan, and the continuation of the company’s share repurchase program.
In general, if the value of the U.S. dollar goes up compared with a foreign currency, an investment traded in that foreign currency will go down in value because it will be worth fewer U.S. dollars. This can have a negative effect on Fund performance. Conversely, when the U.S. dollar weakens in relation to a foreign currency, an investment traded in that foreign currency will increase in value, which can contribute to Fund performance. For the 12 months ended December 31, 2004, the U.S. dollar declined in value relative to most non-U.S. currencies. At the end of the period, the Fund’s portfolio was invested significantly in securities with non-U.S. currency exposure, which resulted in a positive effect on Fund performance. However, one cannot expect the same result in future periods.
Although many of the Fund’s investments performed well in 2004, some holdings underperformed. Positions that declined in value included Eurotunnel, a distressed investment in the operator of the English Channel tunnel; Abovenet, another distressed investment in an operator of optical network data centers; and Sovereign Bancorp, one of
Top 10 Holdings
Mutual Shares Securities Fund 12/31/04
| | |
Company
Sector/Industry,
Country | | % of Total
Net Assets |
| |
| Berkshire Hathaway Inc., A & B | | 5.2% |
| Insurance, U.S. | | |
| |
| British American Tobacco PLC, ord. & ADR | | 3.2% |
| Tobacco, U.K. | | |
| |
| White Mountains Insurance Group Inc. | | 3.1% |
| Insurance, U.S. | | |
| |
| Altadis SA | | 2.6% |
| Tobacco, Spain | | |
| |
| Newmont Mining Corp. | | 2.2% |
| Metals & Mining, U.S. | | |
| |
| Reynolds American Inc. | | 2.0% |
| Tobacco, U.S. | | |
| |
| Diageo PLC | | 1.7% |
| Beverages, U.K. | | |
| |
| Liberty Media Corp., A | | 1.7% |
| Media, U.S. | | |
| |
| Florida East Coast Industries Inc. | | 1.6% |
| Road & Rail, U.S. | | |
| |
| Orkla ASA | | 1.5% |
| Food Products, Norway | | |
The dollar value, number of shares or principal amount, and names of all portfolio holdings are listed in the Fund’s Statement of Investments.
MS-5
the largest financial institutions serving New England and the Mid-Atlantic states.
Eurotunnel’s debt securities declined during 2004 largely due to uncertainties surrounding the ultimate resolution of the company’s financial situation, as well as continuing mediocre operating results after the company’s board and management team were replaced in April 2004.
Abovenet made distributions under a plan of reorganization in late 2003. As one of the company’s largest creditors, the Mutual Series funds were appointed a seat on the board and collectively received more than 20% of the company’s stock in reorganization. The underperformance of our Abovenet investment during the period largely reflects a liquidity discount.
Sovereign Bancorp shares declined in 2004 after some investors were disappointed that the company continued to expand its northeast U.S. banking franchise through acquisitions rather than focusing on improving the company’s core profitability. However, we believe Sovereign Bancorp’s management has created one of the premier banking franchises in the northeast U.S., and may be a prime acquisition candidate.
The foregoing information reflects our analysis, opinions and portfolio holdings as of December 31, 2004, the end of the reporting period. The way we implement our main investment strategies and the resulting portfolio holdings may change depending on factors such as market and economic conditions. These opinions may not be relied upon as investment advice or an offer for a particular security. The information is not a complete analysis of every aspect of any market, country, industry, security or the Fund. Statements of fact are from sources considered reliable, but the adviser makes no representation or warranty as to their completeness or accuracy. Although historical performance is no guarantee of future results, these insights may help you understand our investment management philosophy.
MS-6
Fund Expenses
As an investor in a variable insurance contract (“Contract”) that indirectly provides for investment in an underlying mutual fund, you can incur transaction and/or ongoing expenses at both the Fund level and the Contract level.
| • | | Transaction expenses can include sales charges (loads) on purchases, redemption fees, surrender fees, transfer fees and premium taxes. |
| • | | Ongoing expenses can include management fees, distribution and service (12b-1) fees, contract fees, annual maintenance fees, mortality and expense risk fees and other fees and expenses. All mutual funds and Contracts have some types of ongoing expenses. |
The expenses shown in the table below are meant to highlight ongoing expenses at the Fund level only and do not include ongoing expenses at the Contract level, or transaction expenses at either the Fund or Contract levels. While the Fund does not have transaction expenses, if the transaction and ongoing expenses at the Contract level were included, the expenses shown below would be higher. You should consult your Contract prospectus or disclosure document for more information.
The table shows Fund-level ongoing expenses and can help you understand these expenses and compare them with those of other mutual funds offered through the Contract. The table assumes a $1,000 investment held for the six months indicated. Please refer to the Fund prospectus for additional information on operating expenses.
Actual Fund Expenses
The first line (Actual) for each share class listed in the table below provides actual account values and expenses. The “Ending Account Value” is derived from the Fund’s actual return, which includes the effect of ongoing Fund expenses, but does not include the effect of ongoing Contract expenses.
You can estimate the Fund-level expenses you incurred during the period, by following these steps. Of course, your account value and expenses will differ from those in this illustration:
| 1. | Divide your account value by $1,000. |
If an account had an $8,600 value, then $8,600 ÷ $1,000 = 8.6.
| 2. | Multiply the result by the number under the heading “Fund-Level Expenses Incurred During Period.” |
If Fund-Level Expenses Incurred During Period were $7.50, then 8.6 × $7.50 = $64.50.
Mutual Shares Securities Fund – Class 2
MS-7
In this illustration, the estimated expenses incurred this period at the Fund level are $64.50.
Hypothetical Example for Comparison with Other Mutual Funds
Information in the second line (Hypothetical) for each class in the table can help you compare ongoing expenses of the Fund with those of other mutual funds offered through the Contract. This information may not be used to estimate the actual ending account balance or expenses you incurred during the period. The hypothetical “Ending Account Value” is based on the actual expense ratio for each class and an assumed 5% annual rate of return before expenses, which does not represent the Fund’s actual return. The figure under the heading “Fund-Level Expenses Incurred During Period” shows the hypothetical expenses your account would have incurred under this scenario. You can compare this figure with the 5% hypothetical examples that appear in shareholder reports of other funds offered through a Contract.
| | | | | | | | | |
| Class 2 | | Beginning
Account
Value 6/30/04 | | Ending
Account
Value 12/31/04 | | Fund-Level
Expenses Incurred
During Period*
6/30/04-12/31/04 |
Actual | | $ | 1,000 | | $ | 1,092.60 | | $ | 5.37 |
Hypothetical (5% return before expenses) | | $ | 1,000 | | $ | 1,020.01 | | $ | 5.18 |
*Expenses are equal to the annualized expense ratio for the Fund’s Class 2 shares (1.02%), which does not include any ongoing expenses of the Contract for which the Fund is an investment option, multiplied by the average account value over the period, multiplied by 184/366 to reflect the one-half year period.
MS-8
FRANKLIN TEMPLETON VARIABLE INSURANCE PRODUCTS TRUST
MUTUAL SHARES SECURITIES FUND
Financial Highlights
| | | | | | | | | | | | | | | | | | | | |
| | | Class 1
| |
| | | Year Ended December 31,
| |
| | | 2004 | | | 2003 | | | 2002 | | | 2001 | | | 2000 | |
| | |
|
|
|
Per share operating performance | | | | | | | | | | | | | | | | | | | | |
(for a share outstanding throughout the year) | | | | | | | | | | | | | | | | | | | | |
Net asset value, beginning of year | | $ | 15.00 | | | $ | 12.09 | | | $ | 14.08 | | | $ | 14.24 | | | $ | 13.23 | |
| | |
|
|
|
Income from investment operations: | | | | | | | | | | | | | | | | | | | | |
Net investment incomea | | | .21 | | | | .18 | | | | .20 | | | | .21 | | | | .30 | |
Net realized and unrealized gains (losses) | | | 1.71 | | | | 2.88 | | | | (1.78 | ) | | | .86 | | | | 1.42 | |
| | |
|
|
|
Total from investment operations | | | 1.92 | | | | 3.06 | | | | (1.58 | ) | | | 1.07 | | | | 1.72 | |
| | |
|
|
|
Less distributions from: | | | | | | | | | | | | | | | | | | | | |
Net investment income | | | (.14 | ) | | | (.15 | ) | | | (.12 | ) | | | (.29 | ) | | | (.38 | ) |
Net realized gains | | | — | | | | — | | | | (.29 | ) | | | (.94 | ) | | | (.33 | ) |
| | |
|
|
|
Total distributions | | | (.14 | ) | | | (.15 | ) | | | (.41 | ) | | | (1.23 | ) | | | (.71 | ) |
| | |
|
|
|
Net asset value, end of year | | $ | 16.78 | | | $ | 15.00 | | | $ | 12.09 | | | $ | 14.08 | | | $ | 14.24 | |
| | |
|
|
|
| | | | | |
Total returnb | | | 12.88% | | | | 25.48% | | | | (11.59)% | | | | 7.31% | | | | 13.62% | |
Ratios/supplemental data | | | | | | | | | | | | | | | | | | | | |
Net assets, end of year (000’s) | | $ | 287,324 | | | $ | 312,386 | | | $ | 288,928 | | | $ | 399,336 | | | $ | 407,063 | |
Ratios to average net assets:* | | | | | | | | | | | | | | | | | | | | |
Expensesc | | | .75% | | | | .80% | | | | .80% | | | | .79% | | | | .80% | |
Net investment income | | | 1.40% | | | | 1.33% | | | | 1.57% | | | | 1.42% | | | | 2.23% | |
Portfolio turnover rate | | | 31.50% | | | | 55.71% | | | | 49.80% | | | | 54.73% | | | | 66.67% | |
*Ratios to average net assets, excluding dividend expense on securities sold short: | | | | | | | | | | | | | | | | | | | | |
Expenses | | | .73% | | | | .76% | | | | .79% | | | | .78% | | | | .77% | |
| a | Based on average daily shares outstanding. |
| b | Total return does not include any fees, charges or expenses imposed by the variable annuity and life insurance contracts for which the Franklin Templeton Variable Insurance Products Trust serves as an underlying investment vehicle. Total return is not annualized for periods less than one year. |
| c | Includes dividend expense on securities sold short which varies from period to period. See below for expense ratios that reflect only operating expenses. |
See notes to financial statements.
MS-9
FRANKLIN TEMPLETON VARIABLE INSURANCE PRODUCTS TRUST
MUTUAL SHARES SECURITIES FUND
Financial Highlights (continued)
| | | | | | | | | | | | | | | | | | | | |
| | | Class 2
| |
| | | Year Ended December 31,
| |
| | | 2004 | | | 2003 | | | 2002 | | | 2001 | | | 2000 | |
| | |
|
|
|
Per share operating performance | | | | | | | | | | | | | | | | | | | | |
(for a share outstanding throughout the year) | | | | | | | | | | | | | | | | | | | | |
Net asset value, beginning of period | | $ | 14.90 | | | $ | 12.02 | | | $ | 14.03 | | | $ | 14.22 | | | $ | 13.25 | |
| | |
|
|
|
Income from investment operations: | | | | | | | | | | | | | | | | | | | | |
Net investment incomea | | | .18 | | | | .14 | | | | .16 | | | | .15 | | | | .26 | |
Net realized and unrealized gains (losses) | | | 1.68 | | | | 2.88 | | | | (1.77 | ) | | | .88 | | | | 1.41 | |
| | |
|
|
|
Total from investment operations | | | 1.86 | | | | 3.02 | | | | (1.61 | ) | | | 1.03 | | | | 1.67 | |
| | |
|
|
|
Less distributions from: | | | | | | | | | | | | | | | | | | | | |
Net investment income | | | (.12 | ) | | | (.14 | ) | | | (.11 | ) | | | (.28 | ) | | | (.37 | ) |
Net realized gains | | | — | | | | — | | | | (.29 | ) | | | (.94 | ) | | | (.33 | ) |
| | |
|
|
|
Total distributions | | | (.12 | ) | | | (.14 | ) | | | (.40 | ) | | | (1.22 | ) | | | (.70 | ) |
| | |
|
|
|
Net asset value, end of year | | $ | 16.64 | | | $ | 14.90 | | | $ | 12.02 | | | $ | 14.03 | | | $ | 14.22 | |
| | |
|
|
|
| | | | | |
Total returnb | | | 12.63% | | | | 25.15% | | | | (11.81)% | | | | 7.04% | | | | 13.25% | |
Ratios/supplemental data | | | | | | | | | | | | | | | | | | | | |
Net assets, end of year (000’s) | | $ | 2,464,374 | | | $ | 1,469,745 | | | $ | 589,738 | | | $ | 262,621 | | | $ | 37,087 | |
Ratios to average net assets:* | | | | | | | | | | | | | | | | | | | | |
Expensesc | | | 1.00% | | | | 1.05% | | | | 1.05% | | | | 1.04% | | | | 1.05% | |
Net investment income | | | 1.15% | | | | 1.08% | | | | 1.32% | | | | 1.04% | | | | 1.96% | |
Portfolio turnover rate | | | 31.50% | | | | 55.71% | | | | 49.80% | | | | 54.73% | | | | 66.67% | |
*Ratios to average net assets, excluding dividend expense on securities sold short: | | | | | | | | | | | | | | | | | | | | |
Expenses | | | .98% | | | | 1.01% | | | | 1.04% | | | | 1.03% | | | | 1.02% | |
| a | Based on average daily shares outstanding. |
| b | Total return does not include any fees, charges or expenses imposed by the variable annuity and life insurance contracts for which the Franklin Templeton Variable Insurance Products Trust serves as an underlying investment vehicle. Total return is not annualized for periods less than one year. |
| c | Includes dividend expense on securities sold short which varies from period to period. See below for expense ratios that reflect only operating expenses. |
See notes to financial statements.
MS-10
FRANKLIN TEMPLETON VARIABLE INSURANCE PRODUCTS TRUST
MUTUAL SHARES SECURITIES FUND
Statement of Investments, December 31, 2004
| | | | | | | |
| | | COUNTRY | | SHARES/
WARRANTS/
CONTRACTS | | VALUE |
Common Stocks and Other Equity Interests 68.7% | | | | | | | |
Aerospace & Defense .5% | | | | | | | |
Gencorp Inc. | | United States | | 207,200 | | $ | 3,847,704 |
Northrop Grumman Corp. | | United States | | 185,100 | | | 10,062,036 |
| | | | | | |
|
|
| | | | | | | | 13,909,740 |
| | | | | | |
|
|
Airlines .6% | | | | | | | |
aAce Aviation Holdings Inc. | | Canada | | 549,650 | | | 16,292,216 |
a,bAir Canada Inc., Contingent Distribution | | Canada | | 89,884,400 | | | — |
| | | | | | |
|
|
| | | | | | | | 16,292,216 |
| | | | | | |
|
|
Beverages 2.4% | | | | | | | |
Brown-Forman Corp., A | | United States | | 7,600 | | | 385,776 |
Brown-Forman Corp., B | | United States | | 85,930 | | | 4,183,072 |
Coca-Cola Enterprises Inc. | | United States | | 408,900 | | | 8,525,565 |
Diageo PLC | | United Kingdom | | 3,297,474 | | | 47,027,202 |
Heineken Holding NV, A | | Netherlands | | 159,881 | | | 4,827,333 |
| | | | | | |
|
|
| | | | | | | | 64,948,948 |
| | | | | | |
|
|
Capital Markets .9% | | | | | | | |
Bear Stearns Cos. Inc. | | United States | | 127,020 | | | 12,995,416 |
cLeucadia National Corp. | | United States | | 184,830 | | | 12,199,889 |
| | | | | | |
|
|
| | | | | | | | 25,195,305 |
| | | | | | |
|
|
Commercial Banks 3.4% | | | | | | | |
Allied Irish Banks PLC | | Ireland | | 1,892,200 | | | 39,234,674 |
Bank of Ireland | | Ireland | | 1,105,984 | | | 18,262,423 |
BNP Paribas SA | | France | | 123,900 | | | 8,961,448 |
a,cCentennial Bank Holdings Inc. | | United States | | 806,100 | | | 8,464,050 |
aCerberus NCB Acquisition LP Ltd., wts., 8/29/13 | | Japan | | 4,132,594 | | | 2,066,297 |
Danske Bank | | Denmark | | 294,580 | | | 9,013,944 |
a,cElephant Capital Holdings Ltd. | | Japan | | 4,653 | | | 6,188,139 |
Kansai Urban Banking Corp. | | Japan | | 90,027 | | | 167,010 |
aNippon Investment LLC | | Japan | | 1,148,000 | | | — |
| | | | | | |
|
|
| | | | | | | | 92,357,985 |
| | | | | | |
|
|
Commercial Services & Supplies .9% | | | | | | | |
aComdisco Holding Co., Inc. | | United States | | 10 | | | 223 |
bComdisco, Contingent Distribution | | United States | | 8,175,255 | | | — |
Republic Services Inc. | | United States | | 706,000 | | | 23,679,240 |
a,bSafety Kleen Corp., Contingent Distribution | | United States | | 63,000 | | | — |
| | | | | | |
|
|
| | | | | | | | 23,679,463 |
| | | | | | |
|
|
Computers & Peripherals | | | | | | | |
aDecisionOne Corp. | | United States | | 26,349 | | | — |
| | | | | | |
|
|
Construction Materials .2% | | | | | | | |
Martin Marietta Materials Inc. | | United States | | 129,600 | | | 6,954,336 |
| | | | | | |
|
|
Distributors .3% | | | | | | | |
aUnited Stationers Inc. | | United States | | 186,800 | | | 8,630,160 |
| | | | | | |
|
|
MS-11
FRANKLIN TEMPLETON VARIABLE INSURANCE PRODUCTS TRUST
MUTUAL SHARES SECURITIES FUND
Statement of Investments, December 31, 2004 (cont.)
| | | | | | | |
| | | COUNTRY | | SHARES/
WARRANTS/
CONTRACTS | | VALUE |
Common Stocks and Other Equity Interests (cont.) | | | | | | | |
Diversified Financial Services .9% | | | | | | | |
Brascan Corp., A | | Canada | | 670,950 | | $ | 24,139,319 |
London Stock Exchange PLC | | United Kingdom | | 2,600 | | | 29,045 |
a,bMarconi Corp., Contingent Distribution | | United Kingdom | | 9,945,700 | | | — |
| | | | | | |
|
|
| | | | | | | | 24,168,364 |
| | | | | | |
|
|
Diversified Telecommunication Services 1.2% | | | | | | | |
a,c,dAboveNet Inc. | | United States | | 56,216 | | | 1,347,127 |
a,b,dAboveNet Inc., Contingent Distribution | | United States | | 8,697,000 | | | — |
a,c,dAboveNet Inc., wts., 9/08/08 | | United States | | 2,231 | | | 14,278 |
a,c,dAboveNet Inc., wts., 9/08/10 | | United States | | 2,625 | | | 10,500 |
a,bGlobal Crossing Holdings Ltd., Contingent Distribution | | United States | | 9,005,048 | | | 11,256 |
Koninklijke KPN NV | | Netherlands | | 726,800 | | | 6,894,008 |
aMCI Inc. | | United States | | 367,819 | | | 7,415,231 |
Sprint Corp. | | United States | | 76,200 | | | 1,893,570 |
a,bTelewest Communications PLC, Contingent Distribution | | United Kingdom | | 14,051,600 | | | — |
a,bTelewest Finance Ltd., Contingent Distribution | | United Kingdom | | 1,475,000 | | | — |
aTelewest Global Inc. | | United Kingdom | | 863,016 | | | 15,171,821 |
| | | | | | |
|
|
| | | | | | | | 32,757,791 |
| | | | | | |
|
|
Electric Utilities .3% | | | | | | | |
E.ON AG | | Germany | | 78,800 | | | 7,183,662 |
| | | | | | |
|
|
Food & Staples Retailing .3% | | | | | | | |
aKroger Co. | | United States | | 403,800 | | | 7,082,652 |
| | | | | | |
|
|
Food Products 4.6% | | | | | | | |
Cadbury Schweppes PLC | | United Kingdom | | 1,900,794 | | | 17,695,211 |
General Mills Inc. | | United States | | 287,200 | | | 14,276,712 |
Groupe Danone | | France | | 208,038 | | | 19,182,791 |
Nestle SA | | Switzerland | | 127,590 | | | 33,327,209 |
Orkla ASA | | Norway | | 1,288,060 | | | 42,266,642 |
| | | | | | |
|
|
| | | | | | | | 126,748,565 |
| | | | | | |
|
|
Health Care Equipment & Supplies .7% | | | | | | | |
kGuidant Corp. | | United States | | 84,700 | | | 6,106,870 |
Hillenbrand Industries Inc. | | United States | | 240,100 | | | 13,335,154 |
| | | | | | |
|
|
| | | | | | | | 19,442,024 |
| | | | | | |
|
|
Health Care Providers & Services .2% | | | | | | | |
aAlderwoods Group Inc. | | United States | | 21,648 | | | 246,354 |
a,dKindred Healthcare Inc. | | United States | | 140,068 | | | 3,985,285 |
a,dKindred Healthcare Inc., Jan. 26.00 Calls, 1/01/12 | | United States | | 68 | | | 269 |
a,dKindred Healthcare Inc., Jan. 9.07 Calls, 1/01/13 | | United States | | 34 | | | 710 |
a,dKindred Healthcare Inc., Jul. 23.75 Calls, 7/17/11 | | United States | | 339 | | | 2,102 |
a,dKindred Healthcare Inc., wts., Series A, 4/20/06 | | United States | | 12,897 | | | 383,247 |
a,dKindred Healthcare Inc., wts., Series B, 4/20/06 | | United States | | 32,243 | | | 845,411 |
Select Medical Corp. | | United States | | 80,700 | | | 1,420,320 |
| | | | | | |
|
|
| | | | | | | | 6,883,698 |
| | | | | | |
|
|
Hotels Restaurants & Leisure .2% | | | | | | | |
aCaesars Entertainment Inc. | | United States | | 105,400 | | | 2,122,756 |
aFHC Delaware Inc. | | United States | | 139,062 | | | 1,094,418 |
Mandalay Resort Group | | United States | | 38,400 | | | 2,704,512 |
| | | | | | |
|
|
| | | | | | | | 5,921,686 |
| | | | | | |
|
|
MS-12
FRANKLIN TEMPLETON VARIABLE INSURANCE PRODUCTS TRUST
MUTUAL SHARES SECURITIES FUND
Statement of Investments, December 31, 2004 (cont.)
| | | | | | | |
| | | COUNTRY | | SHARES/
WARRANTS/
CONTRACTS | | VALUE |
Common Stocks and Other Equity Interests (cont.) | | | | | | | |
Insurance 13.8% | | | | | | | |
aAlleghany Corp. | | United States | | 21,997 | | $ | 6,274,644 |
aBerkshire Hathaway Inc., A | | United States | | 151 | | | 13,272,900 |
aBerkshire Hathaway Inc., B | | United States | | 44,367 | | | 130,261,512 |
aConseco Inc. | | United States | | 775,900 | | | 15,479,205 |
Hartford Financial Services Group Inc. | | United States | | 557,800 | | | 38,661,118 |
Montpelier Re Holdings Ltd. | | Bermuda | | 36,947 | | | 1,420,612 |
Nationwide Financial Services Inc., A | | United States | | 799,700 | | | 30,572,531 |
Old Republic International Corp. | | United States | | 1,259,300 | | | 31,860,290 |
a,cOlympus Re Holdings Ltd. | | Bermuda | | 16,280 | | | 2,786,811 |
Prudential Financial Inc. | | United States | | 191,900 | | | 10,546,824 |
St. Paul Travelers Cos. Inc. | | United States | | 393,683 | | | 14,593,829 |
White Mountains Insurance Group Inc. | | United States | | 130,649 | | | 84,399,254 |
| | | | | | |
|
|
| | | | | | | | 380,129,530 |
| | | | | | |
|
|
Leisure Equipment & Products .2% | | | | | | | |
Mattel Inc. | | United States | | 316,000 | | | 6,158,840 |
| | | | | | |
|
|
Machinery .6% | | | | | | | |
Federal Signal Corp. | | United States | | 877,100 | | | 15,489,586 |
| | | | | | |
|
|
Media 8.1% | | | | | | | |
Clear Channel Communications Inc. | | United States | | 641,100 | | | 21,470,439 |
aComcast Corp., A | | United States | | 83,000 | | | 2,725,720 |
Dow Jones & Co. Inc. | | United States | | 211,000 | | | 9,085,660 |
E.W. Scripps Co., A | | United States | | 216,432 | | | 10,449,337 |
EchoStar Communications Corp., A | | United States | | 574,200 | | | 19,086,408 |
aFox Entertainment Group Inc., A | | United States | | 46,200 | | | 1,444,212 |
Hollinger International Inc. | | United States | | 610,420 | | | 8,614,247 |
aLiberty Media Corp., A | | United States | | 4,245,690 | | | 46,617,676 |
Meredith Corp. | | United States | | 169,459 | | | 9,184,678 |
aNews Corp. Ltd., A | | United States | | 546,400 | | | 10,195,824 |
aNTL Inc. | | United Kingdom | | 355,166 | | | 25,912,911 |
Omnicom Group Inc. | | United States | | 118,300 | | | 9,975,056 |
aTVMAX Holdings Inc. | | United States | | 35,609 | | | 35,609 |
Viacom Inc., B | | United States | | 177,800 | | | 6,470,142 |
Washington Post Co., B | | United States | | 41,469 | | | 40,764,856 |
| | | | | | |
|
|
| | | | | | | | 222,032,775 |
| | | | | | |
|
|
Metals & Mining 6.0% | | | | | | | |
Anglo American PLC | | United Kingdom | | 1,235,057 | | | 29,206,308 |
Anglo American PLC, ADR | | United Kingdom | | 200 | | | 4,758 |
Barrick Gold Corp. | | Canada | | 58,000 | | | 1,404,760 |
Compania de Minas Buenaventura SA, ADR | | Peru | | 64,500 | | | 1,477,050 |
Freeport McMoran Copper & Gold Inc., B | | United States | | 658,800 | | | 25,185,924 |
aGlamis Gold Ltd. | | Canada | | 258,500 | | | 4,431,367 |
Gold Fields Ltd. | | South Africa | | 53,500 | | | 656,355 |
Harmony Gold Mining Ltd., ADR | | South Africa | | 204,700 | | | 1,897,569 |
a,cInternational Steel Group | | United States | | 639,453 | | | 24,639,403 |
Newmont Mining Corp. | | United States | | 1,335,800 | | | 59,322,878 |
Noranda Inc. | | Canada | | 373,900 | | | 6,565,501 |
Placer Dome Inc. | | Canada | | 152,600 | | | 2,872,979 |
MS-13
FRANKLIN TEMPLETON VARIABLE INSURANCE PRODUCTS TRUST
MUTUAL SHARES SECURITIES FUND
Statement of Investments, December 31, 2004 (cont.)
| | | | | | | |
| | | COUNTRY | | SHARES/
WARRANTS/
CONTRACTS | | VALUE |
Common Stocks and Other Equity Interests (cont.) | | | | | | | |
Metals & Mining (cont.) | | | | | | | |
aRandgold & Exploration Co. Ltd., ADR | | South Africa | | 53,100 | | $ | 93,456 |
aWheaton River Minerals Ltd. | | Canada | | 1,158,700 | | | 3,767,816 |
aWheaton River Minerals Ltd., wts., 5/30/07 | | Canada | | 221,465 | | | 435,784 |
kWMC Resources Ltd. | | Australia | | 501,100 | | | 2,831,938 |
| | | | | | |
|
|
| | | | | | | | 164,793,846 |
| | | | | | |
|
|
Multi-Utilities & Unregulated Power .4% | | | | | | | |
aNorthwestern Corp. | | United States | | 109,132 | | | 3,055,696 |
a,bNorthwestern Corp., Contingent Distribution | | United States | | 3,348,000 | | | 262,123 |
aNRG Energy Inc. | | United States | | 222,249 | | | 8,012,076 |
| | | | | | |
|
|
| | | | | | | | 11,329,895 |
| | | | | | |
|
|
Oil & Gas 2.7% | | | | | | | |
aAnchor Resources LLC | | United States | | 6,820 | | | — |
BP PLC | | United Kingdom | | 803,000 | | | 7,829,936 |
BP PLC, ADR | | United Kingdom | | 5,100 | | | 297,840 |
aGeneral Maritime Corp. | | United States | | 8,000 | | | 319,600 |
Oil & Natural Gas Corp. Ltd. | | India | | 399,700 | | | 7,573,968 |
aOpti Canada | | Canada | | 1,859,675 | | | 30,127,557 |
Suncor Energy Inc. | | Canada | | 330,000 | | | 11,666,319 |
Total SA, B | | France | | 76,970 | | | 16,784,833 |
| | | | | | |
|
|
| | | | | | | | 74,600,053 |
| | | | | | |
|
|
Personal Products .1% | | | | | | | |
Beiersdorf AG | | Germany | | 33,441 | | | 3,899,000 |
| | | | | | |
|
|
Pharmaceuticals 3.4% | | | | | | | |
Fujisawa Pharmaceutical Co. Ltd. | | Japan | | 455,500 | | | 12,474,883 |
Pfizer Inc. | | United States | | 230,500 | | | 6,198,145 |
aPfizer Inc., Mar. 25.00 Puts, 3/19/05 | | United States | | 1,298 | | | 90,860 |
Sanofi-Aventis | | France | | 173,657 | | | 13,856,364 |
Takeda Pharmaceutical Co. Ltd. | | Japan | | 257,915 | | | 12,993,960 |
Valeant Pharmaceuticals International | | United States | | 1,067,000 | | | 28,115,450 |
Wyeth | | United States | | 462,300 | | | 19,689,357 |
Yamanouchi Pharmaceutical Co. Ltd. | | Japan | | 14,000 | | | 545,401 |
| | | | | | |
|
|
| | | | | | | | 93,964,420 |
| | | | | | |
|
|
Real Estate .7% | | | | | | | |
aAlexander's Inc. | | United States | | 7,800 | | | 1,677,000 |
aCanary Wharf Group PLC | | United Kingdom | | 1,535,898 | | | 8,726,358 |
a,cSecurity Capital European Realty | | Luxembourg | | 1,120 | | | 8,064 |
St. Joe Co. | | United States | | 112,200 | | | 7,203,240 |
Ventas Inc. | | United States | | 59,000 | | | 1,617,190 |
| | | | | | |
|
|
| | | | | | | | 19,231,852 |
| | | | | | |
|
|
Road & Rail 1.8% | | | | | | | |
CSX Corp. | | United States | | 203,600 | | | 8,160,288 |
cFlorida East Coast Industries Inc. | | United States | | 1,001,113 | | | 42,892,687 |
| | | | | | |
|
|
| | | | | | | | 51,052,975 |
| | | | | | |
|
|
Semiconductors & Semiconductor Equipment .4% | | | | | | | |
Samsung Electronics Co. Ltd. | | South Korea | | 28,700 | | | 12,489,712 |
| | | | | | |
|
|
MS-14
FRANKLIN TEMPLETON VARIABLE INSURANCE PRODUCTS TRUST
MUTUAL SHARES SECURITIES FUND
Statement of Investments, December 31, 2004 (cont.)
| | | | | | | | | |
| | | COUNTRY | | SHARES/
WARRANTS/
CONTRACTS | | | VALUE |
Common Stocks and Other Equity Interests (cont.) | | | | | | | | | |
Software .2% | | | | | | | | | |
a,kSymantec Corp. | | United States | | | 80,000 | | | $ | 2,060,800 |
a,kVeritas Software Corp. | | United States | | | 80,900 | | | | 2,309,695 |
| | | | | | | | |
|
|
| | | | | | | | | | 4,370,495 |
| | | | | | | | |
|
|
Thrifts & Mortgage Finance 1.3% | | | | | | | | | |
Fieldstone Investment Corp. | | United States | | | 449,300 | | | | 7,750,425 |
Hudson City Bancorp Inc. | | United States | | | 227,700 | | | | 8,383,914 |
Sovereign Bancorp Inc. | | United States | | | 816,600 | | | | 18,414,330 |
| | | | | | | | |
|
|
| | | | | | | | | | 34,548,669 |
| | | | | | | | |
|
|
Tobacco 11.4% | | | | | | | | | |
Altadis SA | | Spain | | | 1,573,026 | | | | 71,935,863 |
Altria Group Inc. | | United States | | | 556,137 | | | | 33,979,971 |
British American Tobacco PLC | | United Kingdom | | | 5,141,275 | | | | 88,569,510 |
British American Tobacco PLC, ADR | | United Kingdom | | | 4,300 | | | | 148,995 |
Imperial Tobacco Group PLC | | United Kingdom | | | 1,467,747 | | | | 40,202,598 |
KT & G Corp. | | South Korea | | | 399,840 | | | | 11,954,258 |
KT & G Corp., GDR, 144A | | South Korea | | | 871,300 | | | | 12,808,110 |
Reynolds American Inc. | | United States | | | 684,800 | | | | 53,825,280 |
| | | | | | | | |
|
|
| | | | | | | | | | 313,424,585 |
| | | | | | | | |
|
|
Wireless Telecommunication Services | | | | | | | | | |
aVast Solutions Inc., B1 | | United States | | | 4,380 | | | | — |
aVast Solutions Inc., B2 | | United States | | | 4,380 | | | | — |
aVast Solutions Inc., B3 | | United States | | | 4,380 | | | | — |
| | | | | | | | |
|
|
| | | | | | | | | | — |
| | | | | | | | |
|
|
Total Common Stocks and Other Equity Interests (Cost $1,409,919,478) | | | | | | | | | 1,889,672,828 |
| | | | | | | | |
|
|
Preferred Stocks .4% | | | | | | | | | |
Diversified Telecommunication Services | | | | | | | | | |
PTV Inc., 10.00%, A, pfd. | | United Kingdom | | | 17,300 | | | | 78,369 |
| | | | | | | | |
|
|
Electric Utilities | | | | | | | | | |
aMontana Power Co., 8.45%, pfd. | | United States | | | 17,650 | | | | 145,613 |
| | | | | | | | |
|
|
Food Products .1% | | | | | | | | | |
Unilever NV, pfd. | | Netherlands | | | 261,750 | | | | 1,779,525 |
| | | | | | | | |
|
|
Metals & Mining .3% | | | | | | | | | |
aEsmark Inc., Series A, 10.00% cvt. pfd. | | United States | | | 8,637 | | | | 8,637,200 |
| | | | | | | | |
|
|
Total Preferred Stocks (Cost $10,527,130) | | | | | | | | | 10,640,707 |
| | | | | | | | |
|
|
| | | |
| | | | | PRINCIPAL
AMOUNTf
| | | |
Corporate Bonds & Notes 1.0% | | | | | | | | | |
Anchor Resources LLC, 12.00%, 12/17/06 | | United States | | $ | 3,191 | | | | 3,191 |
Calpine Generating Co., 144A, 11.169%, 4/01/11 | | United States | | | 4,041,000 | | | | 3,970,283 |
Eurotunnel PLC, | | | | | | | | | |
FRN, 6.347%, 12/31/18, Tier 2 | | United Kingdom | | | 584,056 | GBP | | | 807,172 |
FRN, 6.347%, 12/31/25, Tier 3 | | United Kingdom | | | 8,091,440 | GBP | | | 6,523,100 |
Participating Loan Note, 1.00%, 4/30/40 | | United Kingdom | | | 58,000 | GBP | | | 12,803 |
MS-15
FRANKLIN TEMPLETON VARIABLE INSURANCE PRODUCTS TRUST
MUTUAL SHARES SECURITIES FUND
Statement of Investments, December 31, 2004 (cont.)
| | | | | | | | |
| | | COUNTRY | | PRINCIPAL
AMOUNTf | | | VALUE |
Corporate Bonds & Notes (cont.) | | | | | | | | |
Eurotunnel SA, FRN, | | | | | | | | |
3.449%, 12/31/18, Tier 2 (LIBOR) | | France | | 60,952 | EUR | | $ | 59,552 |
3.449%, 12/31/25, Tier 3 (LIBOR) | | France | | 9,159,534 | EUR | | | 5,220,382 |
3.453%, 12/31/18, Tier 2 (PIBOR) | | France | | 45,056 | EUR | | | 44,021 |
3.453%, 12/31/25, Tier 3 (PIBOR) | | France | | 2,036,795 | EUR | | | 1,160,851 |
Guadalupe Power Partners LP, | | | | | | | | |
Power Sale Agreement, 6.00%, 9/21/06 | | United States | | 75,100 | | | | 66,088 |
Term Loan, 4.313%, 9/21/06 | | United States | | 555,239 | | | | 488,610 |
Motor Coach Industries International Inc., FRN, 15.40%, 10/01/08 | | United States | | 11,023,904 | | | | 11,023,904 |
Reliant Energy Channelview LP Inc., | | | | | | | | |
Revolver, 5.50%, 8/15/07 | | United States | | 130,800 | | | | 111,180 |
Term Loan A, 3.813%, 11/26/17 | | United States | | 1,380,707 | | | | 1,173,601 |
TVMax Holdings Inc., PIK, | | | | | | | | |
11.50%, 6/30/05 | | United States | | 15,313 | | | | 15,313 |
14.00%, 6/30/05 | | United States | | 117,229 | | | | 117,229 |
| | | | | | | |
|
|
Total Corporate Bonds & Notes (Cost $33,760,404) | | | | | | | | 30,797,280 |
| | | | | | | |
|
|
Bonds & Notes in Reorganization 2.3% | | | | | | | | |
a,eAdelphia Communications Corp., | | | | | | | | |
9.25%, 10/01/02 | | United States | | 3,536,000 | | | | 3,403,400 |
8.125%, 7/15/03 | | United States | | 1,895,000 | | | | 1,790,775 |
7.50%, 1/15/04 | | United States | | 350,000 | | | | 325,500 |
10.50%, 7/15/04 | | United States | | 5,577,000 | | | | 5,521,230 |
9.875%, 3/01/05 | | United States | | 504,000 | | | | 485,100 |
10.25%, 11/01/06 | | United States | | 1,418,000 | | | | 1,386,095 |
9.875%, 3/01/07 | | United States | | 72,000 | | | | 69,300 |
8.375%, 2/01/08 | | United States | | 1,238,000 | | | | 1,173,005 |
7.75%, 1/15/09 | | United States | | 991,000 | | | | 931,540 |
7.875%, 5/01/09 | | United States | | 3,372,000 | | | | 3,152,820 |
9.375%, 11/15/09 | | United States | | 1,836,000 | | | | 1,822,230 |
10.875%, 10/01/10 | | United States | | 1,355,000 | | | | 1,348,225 |
senior note, B, 9.50%, 2/15/04 | | United States | | 1,000,000 | | | | 940,000 |
a,eAiken Cnty S C Indl Rev Beloit, 6.00%, 12/01/11 | | United States | | 45,000 | | | | 225 |
a,eArmstrong Holdings Inc., | | | | | | | | |
6.50%, 8/15/05 | | United States | | 444,000 | | | | 323,010 |
9.75%, 4/15/08 | | United States | | 833,000 | | | | 606,007 |
Revolver, 10/29/03 | | United States | | 888,525 | | | | 613,082 |
Trade Claim | | United States | | 2,382,700 | | | | 1,667,890 |
a,eCentury Communications Corp., | | | | | | | | |
9.50%, 3/01/05 | | United States | | 295,000 | | | | 358,425 |
8.875%, 1/15/07 | | United States | | 406,000 | | | | 489,230 |
8.75%, 10/01/07 | | United States | | 702,000 | | | | 828,360 |
8.375%, 12/15/07 | | United States | | 90,000 | | | | 107,550 |
Series B, zero cpn., 1/15/08 | | United States | | 1,250,000 | | | | 881,250 |
zero cpn., 3/15/03 | | United States | | 1,714,000 | | | | 1,825,410 |
eDecisionOne Corp., Term Loan | | United States | | 793,416 | | | | 198,354 |
a,eHarnischfeger Industries Inc., | | | | | | | | |
8.90%, 3/01/22 | | United States | | 410,000 | | | | 3,813 |
8.70%, 6/15/22 | | United States | | 360,000 | | | | 3,420 |
7.25%, 12/15/25 | | United States | | 519,000 | | | | 4,879 |
6.875%, 2/15/27 | | United States | | 463,000 | | | | 4,260 |
Stipulated Bank Claim | | United States | | 603,475 | | | | 5,492 |
MS-16
FRANKLIN TEMPLETON VARIABLE INSURANCE PRODUCTS TRUST
MUTUAL SHARES SECURITIES FUND
Statement of Investments, December 31, 2004 (cont.)
| | | | | | | | | | |
| | | COUNTRY | | PRINCIPAL
AMOUNTf | | | VALUE | |
Bonds & Notes in Reorganization (cont.) | | | | | | | | | | |
a,eMirant Americas Generation Inc., | | | | | | | | | | |
7.625%, 5/01/06 | | United States | | $ | 386,000 | | | $ | 416,880 | |
8.30%, 5/01/11 | | United States | | | 1,514,000 | | | | 1,608,625 | |
9.125%, 5/01/31 | | United States | | | 1,254,000 | | | | 1,313,565 | |
a,eMirant Corp., | | | | | | | | | | |
Tranche C Revolver | | United States | | | 1,904,055 | | | | 1,313,798 | |
4 Year Revolver, 7/17/05 | | United States | | | 1,209,607 | | | | 913,253 | |
364 Day Revolver | | United States | | | 3,446,500 | | | | 2,395,317 | |
a,eOwens Corning, Revolver | | United States | | | 10,840,282 | | | | 9,647,851 | |
a,ePort Seattle Wash Rev Ref-Beloit Proj., 6.00%, 12/01/17 | | United States | | | 20,000 | | | | 100 | |
a,eSafety Kleen Services, 9.25%, 6/01/08 | | United States | | | 5,000 | | | | 19 | |
a,eTeco Panda, | | | | | | | | | | |
Bank Claim | | United States | | | 734,520 | | | | 440,712 | |
Bank Claim #2 | | United States | | | 5,193,050 | | | | 3,271,621 | |
Bank Claim #3 | | United States | | | 33,065 | | | | 33,065 | |
Debt Service Reserve L/C Loan | | United States | | | 152,300 | | | | 95,949 | |
Project L/C Loan Facility | | United States | | | 708,220 | | | | 446,179 | |
eTrump Atlantic, | | | | | | | | | | |
11.25%, 5/01/06 | | United States | | | 8,184,000 | | | | 7,846,410 | |
Series B, 11.25%, 5/01/06 | | United States | | | 2,456,000 | | | | 2,354,690 | |
Series B, 144A, 11.25%, 5/01/06 | | United States | | | 146,000 | | | | 139,977 | |
| | | | | | | | |
|
|
|
Total Bonds & Notes in Reorganization (Cost $52,389,708) | | | | | | | | | 62,507,888 | |
| | | | | | | | |
|
|
|
| | | |
| | | | | UNITS/
PRINCIPAL
AMOUNTf
| | | | |
Companies in Liquidation | | | | | | | | | | |
aBrunos Inc., Liquidating Unit | | United States | | | 5,044 | | | | 11,097 | |
Peregrine Investments Holdings Ltd., 6.70%, 1/15/98 | | Hong Kong | | | 5,000,000 | JPY | | | 1,342 | |
aPIV Investment Finance (Cayman) Ltd. | | Hong Kong | | | 12,200,000 | | | | 671,000 | |
aUnited Cos. Financial Corp.,
Bank Claim | | United States | | | 9,660 | | | | — | |
Revolver | | United States | | | 2,450,427 | | | | — | |
| | | | | | | | |
|
|
|
Total Companies in Liquidation (Cost $ —) | | | | | | | | | 683,439 | |
| | | | | | | | |
|
|
|
| | | |
| | | | | PRINCIPAL
AMOUNTf
| | | | |
Government Agencies 26.6% | | | | | | | | | | |
gFederal Home Loan Bank, 1.142% - 2.912%, 1/03/05 - 1/26/07 | | United States | | | 719,890,000 | | | | 716,122,882 | |
Federal Home Loan Mortgage Corp., 2.50%, 5/19/06 | | United States | | | 5,000,000 | | | | 4,959,665 | |
hU.S. Treasury Bill, 2/24/05 - 6/30/05 | | United States | | | 10,000,000 | | | | 9,924,765 | |
| | | | | | | | |
|
|
|
Total Government Agencies (Cost $731,643,549) | | | | | | | | | 731,007,312 | |
| | | | | | | | |
|
|
|
Total Investments (Cost $2,238,240,269) 99.0% | | | | | | | | | 2,725,309,454 | |
Options Written | | | | | | | | | (94,284 | ) |
Securities Sold Short (.7)% | | | | | | | | | (19,942,407 | ) |
Net Unrealized Loss on Forward Exchange Contracts (.5)% | | | | | | | | | (14,473,693 | ) |
Other Assets, less Liabilities 2.2% | | | | | | | | | 60,899,443 | |
| | | | | | | | |
|
|
|
Net Assets 100.0% | | | | | | | | $ | 2,751,698,513 | |
| | | | | | | | |
|
|
|
MS-17
FRANKLIN TEMPLETON VARIABLE INSURANCE PRODUCTS TRUST
MUTUAL SHARES SECURITIES FUND
Statement of Investments, December 31, 2004 (cont.)
| | | | | | | |
Options Written | | | | | | | |
| | | |
| ISSUER | | COUNTRY | | CONTRACTS | | VALUE |
Health Care Equipment & Supplies | | | | | | | |
iGuidant Corp., Jan. 70.00 Calls, 01/22/05 | | United States | | 86 | | $ | 20,210 |
| | | | | | |
|
|
Metals & Mining | | | | | | | |
iWMC Resources Ltd., Jan. 7.00 Calls, 1/27/05 | | Australia | | 130 | | | 34,088 |
iWMC Resources Ltd., Jan. 7.25 Calls, 1/27/05 | | Australia | | 59 | | | 8,544 |
| | | | | | |
|
|
| | | | | | | | 42,632 |
| | | | | | |
|
|
Software | | | | | | | |
iSymantec Corp., Jan. 25.00 Calls, 1/22/05 | | United States | | 122 | | | 18,300 |
iSymantec Corp., Jan. 27.50 Calls, 1/22/05 | | United States | | 82 | | | 3,362 |
iVeritas Software Corp., Jan. 30.00 Calls, 1/22/05 | | United States | | 163 | | | 9,780 |
| | | | | | |
|
|
| | | | | | | | 31,442 |
| | | | | | |
|
|
Total Options Written (Premiums received $87,780) | | | | | | $ | 94,284 |
| | | | | | |
|
|
Securities Sold Short | | | | | | | |
| | | |
| | | | | SHARES
| | |
Communications Equipment | | | | | | | |
jTellabs Inc. | | United States | | 33,189 | | | 285,093 |
| | | | | | |
|
|
Diversified Financial Services .1% | | | | | | | |
jNasdaq 100 | | United States | | 83,600 | | | 3,337,312 |
| | | | | | |
|
|
Food Products .5% | | | | | | | |
jKraft Foods Inc., A | | United States | | 363,654 | | | 12,949,719 |
| | | | | | |
|
|
Hotels Restaurants & Leisure | | | | | | | |
jHarrah’s Entertainment Inc. | | United States | | 22,668 | | | 1,516,263 |
| | | | | | |
|
|
Pharmaceuticals .1% | | | | | | | |
jJohnson & Johnson | | United States | | 29,234 | | | 1,854,020 |
| | | | | | |
|
|
Total Securities Sold Short (Proceeds $18,671,784) | | | | | | $ | 19,942,407 |
| | | | | | |
|
|
Currency Abbreviations:
EUR. - Euro
GBP - British Pound
JPY - Japanese Yen
Portfolio Abbreviations:
ADR - American Depository Receipt
FRN - Floating Rate Note
GDR - Global Depository Receipt
PIK - Payment-in-Kind
| b | Contingent Distributions represent the right to receive additional distributions, if any, during the reorganization of the underlying company. Shares represent total underlying principal of debt securities. |
| c | See Note 10 regarding restricted securities. |
| d | See Note 11 regarding other considerations. |
| e | See Note 9 regarding defaulted securities. |
| f | The principal amount is stated in U.S. dollars unless otherwise indicated. |
| g | See Note 1(g) regarding securities segregated with broker for securities sold short. |
| h | Security is traded on a discount basis with no stated coupon rate. |
| i | See Note 1(f) regarding written options. |
| j | See Note 1(g) regarding securities sold short. |
| k | A portion of security held in connection with open option contracts. |
See notes to financial statements.
MS-18
FRANKLIN TEMPLETON VARIABLE INSURANCE PRODUCTS TRUST
MUTUAL SHARES SECURITIES FUND
Financial Statements
Statement of Assets and Liabilities
December 31, 2004
| | | |
Assets: | | | |
Investments in securities: | | | |
Cost | | $ | 2,238,240,269 |
| | |
|
|
Value (includes securities segregated with broker for securities sold short in the amount of $12,745,100) | | | 2,725,309,454 |
Cash | | | 14,883,952 |
Foreign currency, at value (cost $2,650,611) | | | 2,820,235 |
Receivables: | | | |
Investment securities sold | | | 18,751,155 |
Capital shares sold | | | 3,712,407 |
Dividends and interest | | | 6,192,214 |
Unrealized gain on forward exchange contracts (Note 8) | | | 922,192 |
Due from broker - synthetic equity swaps | | | 992,646 |
Cash on deposit with brokers for securities sold short | | | 20,235,570 |
| | |
|
|
Total assets | | | 2,793,819,825 |
| | |
|
|
Liabilities: | | | |
Payables: | | | |
Investment securities purchased | | | 4,064,558 |
Capital shares redeemed | | | 312,455 |
Affiliates | | | 2,098,718 |
Options written, at value (premiums received $87,780) | | | 94,284 |
Securities sold short, at value (proceeds $18,671,784) | | | 19,942,407 |
Unrealized loss on forward exchange contracts (Note 8) | | | 15,395,885 |
Deferred tax | | | 3,577 |
Other liabilities | | | 209,428 |
| | |
|
|
Total liabilities | | | 42,121,312 |
| | |
|
|
Net assets, at value | | $ | 2,751,698,513 |
| | |
|
|
Net assets consist of: | | | |
Undistributed net investment income | | $ | 26,174,774 |
Net unrealized appreciation (depreciation) | | | 471,601,928 |
Accumulated net realized gain (loss) | | | 20,186,873 |
Capital shares | | | 2,233,734,938 |
| | |
|
|
Net assets, at value | | $ | 2,751,698,513 |
| | |
|
|
Class 1: | | | |
Net assets, at value | | $ | 287,324,361 |
| | |
|
|
Shares outstanding | | | 17,125,995 |
| | |
|
|
Net asset value per share | | $ | 16.78 |
| | |
|
|
Class 2: | | | |
Net assets, at value | | $ | 2,464,374,152 |
| | |
|
|
Shares outstanding | | | 148,112,642 |
| | |
|
|
Net asset value per share | | $ | 16.64 |
| | |
|
|
See notes to financial statements.
MS-19
FRANKLIN TEMPLETON VARIABLE INSURANCE PRODUCTS TRUST
MUTUAL SHARES SECURITIES FUND
Financial Statements (continued)
Statement of Operations
for the year ended December 31, 2004
| | | | |
Investment Income: | | | | |
(net of foreign taxes of $2,083,207) | | | | |
Dividends | | $ | 32,497,066 | |
Interest | | | 14,855,306 | |
| | |
|
|
|
Total investment income | | | 47,352,372 | |
| | |
|
|
|
Expenses: | | | | |
Management fees (Note 3) | | | 13,210,205 | |
Administrative fees (Note 3) | | | 2,225,453 | |
Distribution fees - Class 2 (Note 3) | | | 4,785,256 | |
Custodian fees (Note 4) | | | 141,700 | |
Reports to shareholders | | | 428,000 | |
Professional fees | | | 158,005 | |
Trustees’ fees and expenses | | | 12,983 | |
Dividends on securities sold short | | | 304,792 | |
Other | | | 120,054 | |
| | |
|
|
|
Total expenses | | | 21,386,448 | |
Expense reductions (Note 4) | | | (14,849 | ) |
| | |
|
|
|
Net expenses | | | 21,371,599 | |
| | |
|
|
|
Net investment income | | | 25,980,773 | |
| | |
|
|
|
Realized and unrealized gains (losses): | | | | |
Net realized gain (loss) from: | | | | |
Investments | | | 90,322,508 | |
Written options | | | (512,740 | ) |
Foreign currency transactions | | | (32,580,823 | ) |
Securities sold short | | | (810,284 | ) |
| | |
|
|
|
Net realized gain (loss) | | | 56,418,661 | |
| | |
|
|
|
Net change in unrealized appreciation (depreciation) on: | | | | |
Investments | | | 200,257,065 | |
Translation of assets and liabilities denominated in foreign currencies | | | 924,987 | |
Deferred taxes | | | (3,577 | ) |
| | |
|
|
|
Net change in unrealized appreciation (depreciation) | | | 201,178,475 | |
| | |
|
|
|
Net realized and unrealized gain (loss) | | | 257,597,136 | |
| | |
|
|
|
Net increase (decrease) in net assets resulting from operations | | $ | 283,577,909 | |
| | |
|
|
|
See notes to financial statements.
MS-20
FRANKLIN TEMPLETON VARIABLE INSURANCE PRODUCTS TRUST
MUTUAL SHARES SECURITIES FUND
Financial Statements (continued)
Statement of Changes in Net Assets
For the years ended December 31, 2004 and 2003
| | | | | | | |
| | | 2004 | | | 2003 | |
| | |
| |
Increase (decrease) in net assets: | | | | | | | |
Operations: | | | | | | | |
Net investment income | | $ 25,980,773 | | | $ | 13,841,023 | |
Net realized gain (loss) from investments, written options, foreign currency transactions, and securities sold short | | 56,418,661 | | | | 8,537,364 | |
Net change in unrealized appreciation (depreciation) on investments, translation of assets and liabilities denominated in foreign currencies, and deferred taxes | | 201,178,475 | | | | 278,678,722 | |
| | |
| |
Net increase (decrease) in net assets resulting from operations | | 283,577,909 | | | | 301,057,109 | |
Distributions to shareholders from: | | | | | | | |
Net investment income: | | | | | | | |
Class 1 | | (2,575,038 | ) | | | (3,290,885 | ) |
Class 2 | | (14,440,220 | ) | | | (9,026,103 | ) |
| | |
| |
Total distributions to shareholders | | (17,015,258 | ) | | | (12,316,988 | ) |
Capital share transactions: (Note 2) | | | | | | | |
Class 1 | | (56,995,395 | ) | | | (38,975,858 | ) |
Class 2 | | 760,000,491 | | | | 653,701,033 | |
| | |
| |
Total capital share transactions | | 703,005,096 | | | | 614,725,175 | |
Net increase (decrease) in net assets | | 969,567,747 | | | | 903,465,296 | |
Net assets: | | | | | | | |
Beginning of year | | 1,782,130,766 | | | | 878,665,470 | |
| | |
| |
End of year | | $2,751,698,513 | | | $ | 1,782,130,766 | |
| | |
| |
Undistributed net investment income (loss) included in net assets: | | | | | | | |
End of year | | $ 26,174,774 | | | $ | 14,428,647 | |
| | |
| |
See notes to financial statements.
MS-21
FRANKLIN TEMPLETON VARIABLE INSURANCE PRODUCTS TRUST
MUTUAL SHARES SECURITIES FUND
Notes to Financial Statements
1. ORGANIZATION AND SIGNIFICANT ACCOUNTING POLICIES
Franklin Templeton Variable Insurance Products Trust (the Trust) is registered under the Investment Company Act of 1940 as an open-end investment company, consisting of twenty-one separate series (the Funds). Mutual Shares Securities Fund (the Fund) included in this report is diversified. The financial statements of the remaining funds in the series are presented separately. Shares of the Fund are sold only to insurance company separate accounts to fund the benefits of variable life insurance policies or variable annuity contracts. As of December 31, 2004, over 54% of the Fund’s shares were sold through one insurance company. The Fund’s investment objective is capital growth.
The following summarizes the Fund’s significant accounting policies.
a. Security Valuation
Securities listed on a securities exchange or on the NASDAQ National Market System, are valued at the last quoted sale price or the official closing price of the day, respectively. Over-the-counter securities and listed securities for which there is no reported sale are valued within the range of the most recent quoted bid and ask prices. Securities that trade in multiple markets or on multiple exchanges are valued according to the broadest and most representative market.
Corporate debt securities and U.S. Government securities generally trade in the over-the-counter market rather than on a securities exchange. The Trust may utilize independent pricing services, quotations from bond dealers, and information with respect to bond and note transactions, to assist in determining a current market value for each security. The Trust’s pricing services may use valuation models or matrix pricing which considers information with respect to comparable bond and note transactions, quotations from bond dealers, or by reference to other securities that are considered comparable in such characteristics as rating, interest rate and maturity date, option adjusted spread models, prepayment projections, interest rate spreads and yield curves, to determine current value.
Foreign securities are valued as of the close of trading on the foreign stock exchange on which the security is primarily traded, or the NYSE, whichever is earlier. The value is then converted into its U.S. dollar equivalent at the foreign exchange rate in effect at the close of the NYSE on the day that the value of the foreign security is determined. If no sale is reported at that time, the foreign security will be valued within the range of the most recent quoted bid and ask prices.
The Trust has procedures to determine the fair value of individual securities and other assets for which market prices are not readily available or which may not be reliably priced. Some methods for valuing these securities may include: fundamental analysis, matrix pricing, discounts from market prices of similar securities, or discounts applied due to the nature and duration of restrictions on the disposition of the securities. Due to the inherent uncertainty of valuations of such securities, the fair values may differ significantly from the values that would have been used had a ready market for such investments existed. Occasionally, events occur between the time at which trading in a security is completed and the close of the NYSE that might call into question the availability (including the reliability) of the value of a portfolio security held by the Fund. If such an event occurs, the securities may be valued using fair value procedures, which may include the use of independent pricing services. All security valuation procedures are approved by the Trust’s Board of Trustees.
b. Foreign Currency Translation
Portfolio securities and other assets and liabilities denominated in foreign currencies are translated into U.S. dollars based on the exchange rate of such currencies against U.S. dollars on the date of valuation. Purchases and sales of securities, income and expense items denominated in foreign currencies are translated into U.S. dollars at the exchange rate in effect on the transaction date. Occasionally events may impact the availability or reliability of foreign exchange rates used to convert the U.S. dollar equivalent value. If such an event occurs, the foreign exchange rate will be valued at fair value using procedures established and approved by the Trust’s Board of Trustees.
The Fund does not separately report the effect of changes in foreign exchange rates from changes in market prices on securities held. Such changes are included in net realized and unrealized gain or loss from investments on the Statement of Operations.
MS-22
FRANKLIN TEMPLETON VARIABLE INSURANCE PRODUCTS TRUST
MUTUAL SHARES SECURITIES FUND
Notes to Financial Statements (continued)
1. ORGANIZATION AND SIGNIFICANT ACCOUNTING POLICIES (cont.)
b. Foreign Currency Translation (cont.)
Realized foreign exchange gains or losses arise from sales of foreign currencies, currency gains or losses realized between the trade and settlement dates on securities transactions and the difference between the recorded amounts of dividends, interest, and foreign withholding taxes and the U.S. dollar equivalent of the amounts actually received or paid. Net unrealized foreign exchange gains and losses arise from changes in foreign exchange rates on foreign denominated assets and liabilities other than investments in securities held at the end of the reporting period.
c. Securities Purchased on a When-Issued, Delayed Delivery, or TBA Basis
The Fund may purchase securities on a when-issued, delayed delivery, or to-be-announced (TBA) basis, with payment and delivery scheduled for a future date. These transactions are subject to market fluctuations and are subject to the risk that the value at delivery may be more or less than the trade date purchase price. Although the Fund will generally purchase these securities with the intention of holding the securities, it may sell the securities before the settlement date.
d. Foreign Currency Contracts
The Fund may enter into forward exchange contracts to hedge against fluctuations in foreign exchange rates. A forward exchange contract is an agreement between two parties to exchange different currencies at an agreed upon exchange rate at a future date. These contracts are valued daily by the Fund and any equity therein is included in the Statement of Assets and Liabilities. Realized and unrealized gains and losses on these contracts are included in the Statement of Operations.
When the Fund purchases or sells foreign securities it may enter into foreign exchange contracts to minimize foreign exchange risk from the trade date to the settlement date of the transactions. Realized and unrealized gains and losses on these contracts are included in the Statement of Operations.
The risks of these contracts include movement in the values of the foreign currencies relative to the U.S. dollar and the possible inability of the counterparties to fulfill their obligations under the contracts.
e. Synthetic Equity Swaps
The Fund may engage in synthetic equity swaps. Synthetic equity swaps are contracts entered into between a broker and the Fund under which the parties agree to make payments to each other so as to replicate the economic consequences that would apply had a purchase or sale of the underlying security taken place. Upon entering into synthetic equity swaps, the Fund is required to pledge to the broker an amount of cash and/or other assets equal to a certain percentage of the contract amount (“initial margin”). Subsequent payments known as “variation margin”, are made or received by the Fund periodically, depending on fluctuations in the value of the underlying security. When the contract is closed, the Fund records a realized gain or loss equal to the difference between the value of the contract at the time it was opened and the value at the time it was closed. The risks of entering into synthetic equity swaps include unfavorable price movements in the underlying securities or the inability of the counterparties to fulfill their obligations under the contract.
f. Options Contracts
The Fund may purchase or write options. Options are contracts entitling the holder to purchase or sell a specified number of shares or units of a particular security at a specified price. Options purchased are recorded as investments; options written (sold) are recorded as liabilities. Upon closing of an option, other than by exercise, which results in a cash settlement, the difference between the premium (original option value) and the settlement proceeds is realized as a gain or loss. When securities are
MS-23
FRANKLIN TEMPLETON VARIABLE INSURANCE PRODUCTS TRUST
MUTUAL SHARES SECURITIES FUND
Notes to Financial Statements (continued)
1. ORGANIZATION AND SIGNIFICANT ACCOUNTING POLICIES (cont.)
f. Options Contracts (cont.)
acquired or delivered upon exercise of an option, the acquisition cost or sale proceeds are adjusted by the amount of the premium. When an option is closed, the difference between the premium and the cost to close the position is realized as a gain or loss. When an option expires, the premium is realized as a gain for options written or as a loss for options purchased. The risks include the possibility there may be an illiquid options market or the inability of the counterparties to fulfill their obligations under the contract. Writing options involves, to varying degrees, elements of market risk in excess of the amount recognized in the Statement of Assets and Liabilities.
g. Securities Sold Short
The Fund is engaged in selling securities short, which obligates the Fund to replace a security borrowed with the same security at current market value. The Fund incurs a loss if the price of the security increases between the date of the short sale and the date on which the Fund replaces the borrowed security. The Fund realizes a gain if the price of the security declines between those dates. Gains are limited to the price at which the Fund sold the security short, while losses are potentially unlimited in size.
The Fund is required to establish a margin account with the broker lending the security sold short. While the short sale is outstanding, the broker retains the proceeds of the short sale and the Fund must maintain a deposit with broker consisting of cash and securities having a value equal to a specified percentage of the value of the securities sold short. The Fund is obligated to pay the counterparty any dividends or interest due on securities sold short. Such dividends and interest are recorded as an expense to the Fund.
h. Income and Deferred Taxes
No provision has been made for U.S. income taxes because the Fund’s policy is to qualify as a regulated investment company under Sub Chapter M of the Internal Revenue Code and to distribute substantially all of its taxable income. Fund distributions to shareholders are determined on an income tax basis and may differ from net investment income and realized gains for financial reporting purposes.
The Fund is subject to a tax imposed on net realized gains of securities of certain foreign countries. The Fund records an estimated deferred tax liability for net unrealized gains on these securities as reflected in the accompanying financial statements.
i. Security Transactions, Investment Income, Expenses and Distributions
Security transactions are accounted for on trade date. Realized gains and losses on security transactions are determined on a specific identification basis. Interest income and estimated expenses are accrued daily. Discounts and premiums on securities purchased are amortized over the lives of the respective securities. Dividend income, dividends declared on securities sold short, and distributions to shareholders are recorded on the ex-dividend date.
Common expenses incurred by the Trust are allocated among the funds based on the ratio of net assets of each fund to the combined net assets. Other expenses are charged to each fund on a specific identification basis.
Distributions received by the Fund from securities may be a return of capital (ROC). Such distributions reduce the cost basis of the securities, and any distributions in excess of the cost basis are recognized as capital gains.
Realized and unrealized gains and losses and net investment income, other than class specific expenses, are allocated daily to each class of shares based upon the relative proportion of net assets of each class.
MS-24
FRANKLIN TEMPLETON VARIABLE INSURANCE PRODUCTS TRUST
MUTUAL SHARES SECURITIES FUND
Notes to Financial Statements (continued)
1. ORGANIZATION AND SIGNIFICANT ACCOUNTING POLICIES (cont.)
j. Accounting Estimates
The preparation of financial statements in accordance with accounting principles generally accepted in the United States of America requires management to make estimates and assumptions that affect the reported amounts of assets and liabilities at the date of the financial statements and the amounts of income and expenses during the reporting period. Actual results could differ from those estimates.
k. Guarantees and Indemnifications
Under the Trust’s organizational documents, its officers and trustees are indemnified by the Trust against certain liability arising out of the performance of their duties to the Trust. Additionally, in the normal course of business, the Trust enters into contracts with service providers that contain general indemnification clauses. The Trust’s maximum exposure under these arrangements is unknown as this would involve future claims that may be made against the Trust that have not yet occurred. However, based on experience, the Trust expects the risk of loss to be remote.
2. SHARES OF BENEFICIAL INTEREST
The Fund offers two classes of shares: Class 1 and Class 2. Each class of shares differs by its distribution fees, voting rights on matters affecting a single class and its exchange privilege.
At December 31, 2004, there were an unlimited number of shares authorized ($.01 par value). Transactions in the Fund’s shares were as follows:
| | | | | | | | | | | | | | |
| | | Year Ended December 31,
| |
| | | 2004
| | | 2003
| |
| Class 1 Shares: | | Shares
| | | Amount
| | | Shares
| | | Amount
| |
Shares sold | | 96,496 | | | $ | 1,497,941 | | | 255,723 | | | $ | 3,324,113 | |
Shares issued in reinvestment of distributions | | 170,194 | | | | 2,575,038 | | | 247,994 | | | | 3,290,885 | |
Shares redeemed | | (3,961,676 | ) | | | (61,068,374 | ) | | (3,582,053 | ) | | | (45,590,856 | ) |
| | |
| |
Net increase (decrease) | | (3,694,986 | ) | | $ | (56,995,395 | ) | | (3,078,336 | ) | | $ | (38,975,858 | ) |
| | |
| |
| Class 2 Shares: | | | | | | | | | | | | |
Shares sold | | 53,881,612 | | | $ | 827,334,586 | | | 54,231,399 | | | $ | 712,756,799 | |
Shares issued in reinvestment of distributions | | 960,760 | | | | 14,440,220 | | | 684,314 | | | | 9,026,103 | |
Shares redeemed | | (5,377,508 | ) | | | (81,774,315 | ) | | (5,323,957 | ) | | | (68,081,869 | ) |
| | |
| |
Net increase (decrease) | | 49,464,864 | | | $ | 760,000,491 | | | 49,591,756 | | | $ | 653,701,033 | |
| | |
| |
3. TRANSACTIONS WITH AFFILIATES
Certain officers and trustees of the Fund are also officers and/or directors of the following entities:
| | |
| Entity | | Affiliation |
Franklin Mutual Advisers, LLC (Franklin Mutual) | | Investment manager |
Franklin Templeton Services, LLC (FT Services) | | Administrative manager |
Franklin/Templeton Distributors Inc. (Distributors) | | Principal underwriter |
Franklin/Templeton Investor Services, LLC (Investor Services) | | Transfer agent |
MS-25
FRANKLIN TEMPLETON VARIABLE INSURANCE PRODUCTS TRUST
MUTUAL SHARES SECURITIES FUND
Notes to Financial Statements (continued)
3. TRANSACTIONS WITH AFFILIATES (cont.)
a. Management Fees
The Fund pays an investment management fee to Franklin Mutual of .60% per year of the average daily net assets of the Fund.
b. Administrative Fees
The Fund pays an administrative fee to FT Services based on the average daily net assets of the Fund as follows:
| | |
| Annualized Fee Rate | | Net Assets |
| .150% | | First $200 million |
| .135% | | Over $200 million, up to and including $700 million |
| .100% | | Over $700 million, up to and including $1.2 billion |
| .075% | | Over $1.2 billion |
c. Distribution Fees
The Fund reimburses Distributors up to .25% per year of its average daily net asset of Class 2, for costs incurred in marketing the Fund’s shares under a Rule 12b-1 plan.
d. Transfer Agent Fees
Investor Services, under terms of an agreement, performs shareholder servicing for the Fund and is not paid by the Fund for the services.
4. EXPENSE OFFSET ARRANGEMENT
The Fund has entered into an arrangement with its custodian whereby credits realized as a result of uninvested cash balances are used to reduce a portion of the Fund’s custodian expenses. During the year ended December 31, 2004, the custodian fees were reduced as noted in the Statement of Operations.
5. INCOME TAXES
The tax character of distributions paid during the years ended December 31, 2004 and 2003, was as follows:
| | | | | | |
| | | 2004
| | 2003
|
Distributions paid from - ordinary income | | $ | 17,015,258 | | $ | 12,316,988 |
Net investment income (loss) differs for financial statement and tax purposes primarily due to differing treatments of defaulted securities, foreign currency transactions, bond discounts and premiums, and certain dividends on securities sold short.
Net realized gains differ for financial statement and tax purposes primarily due to differing treatments of defaulted securities, wash sales, foreign currency transactions, bond discounts and premiums, and certain dividends on securities sold short.
MS-26
FRANKLIN TEMPLETON VARIABLE INSURANCE PRODUCTS TRUST
MUTUAL SHARES SECURITIES FUND
Notes to Financial Statements (continued)
5. INCOME TAXES (cont.)
At December 31, 2004, the cost of investments, net unrealized appreciation (depreciation), undistributed ordinary income and undistributed long term capital gains for income tax purposes were as follows:
| | | | |
Cost of investments | | $ | 2,241,846,669 | |
| | |
|
|
|
Unrealized appreciation | | $ | 498,315,982 | |
Unrealized depreciation | | | (14,853,197 | ) |
| | |
|
|
|
Net unrealized appreciation (depreciation) | | $ | 483,462,785 | |
| | |
|
|
|
Undistributed ordinary income | | $ | 29,805,001 | |
Undistributed long term capital gains | | | 7,502,674 | |
| | |
|
|
|
Distributable earnings | | $ | 37,307,675 | |
| | |
|
|
|
6. INVESTMENT TRANSACTIONS
Purchases and sales of investments (excluding securities sold short and short-term securities) for the year ended December 31, 2004, aggregated $934,697,576 and $540,975,273, respectively.
Transactions in options written during the year ended December 31, 2004, were as follows:
| | | | | | | |
| | | Number
of Contracts
| | | Premiums
Received
| |
Options outstanding at December 31, 2003 | | 230,949 | | | $ | 64,483 | |
Options written | | 390,833 | | | | 797,632 | |
Options expired | | (196,322 | ) | | | (324,113 | ) |
Options exercised | | (423,775 | ) | | | (261,595 | ) |
Options closed | | (1,043 | ) | | | (188,627 | ) |
| | |
| |
Options outstanding at December 31, 2004 | | 642 | | | $ | 87,780 | |
| | |
| |
7. SYNTHETIC EQUITY SWAPS
As of December 31, 2004, the Fund had the following synthetic equity swaps outstanding:
| | | | | | | | |
| Contracts to Buy | | Number of
Contracts | | Value | | Unrealized
Gain (Loss) |
Christian Dior SA (46.76 – 54.99 EUR) | | 40,294 | | $ | 2,736,681 | | $ | 28,452 |
London Stock Exchange PLC (5.36 – 5.71 GBP) | | 38,633 | | | 431,579 | | | 15,493 |
| | | | | | | |
|
|
Total contracts to buy | | | | | | | $ | 43,945 |
| | | | | | | |
|
|
| | | |
| Contracts to Sell | | Number of
Contracts | | Value | | Unrealized
Gain (Loss) |
LVMH Moet Hennessy Louis Vuitton (53.87 – 61.76 EUR) | | 40,460 | | $ | 3,093,851 | | $ | 92,668 |
| | | | | | | |
|
|
Total contracts to sell | | | | | | | $ | 92,668 |
| | | | | | | |
|
|
Net unrealized gain (loss) | | | | | | | $ | 136,613 |
| | | | | | | |
|
|
MS-27
FRANKLIN TEMPLETON VARIABLE INSURANCE PRODUCTS TRUST
MUTUAL SHARES SECURITIES FUND
Notes to Financial Statements (continued)
8. FORWARD CURRENCY CONTRACTS
At December 31, 2004, the Fund has outstanding forward exchange contracts as set out below. The contracts are reported in the financial statements at the Fund’s value, as measured by the difference between the forward exchange rates at the reporting date and the forward exchange rates at the day of entry into the contracts.
| | | | | | | | | | | |
| Contracts to Buy | | In
Exchange for | | Settlement
Date | | Unrealized
Gain (Loss) | |
| 3,063,525 | | Canadian Dollars | | U.S.$ | 2,355,288 | | 1/21/05 | | U.S.$ | 198,691 | |
| 8,924,964 | | Canadian Dollars | | | 7,399,999 | | 4/21/05 | | | 40,798 | |
| | | | |
|
| | | |
|
|
|
| | | | | U.S.$ | 9,755,287 | | | | U.S.$ | 239,489 | |
| | | | |
|
| | | |
|
|
|
| | | |
| Contracts to Sell | | | | | | | |
| 1,600,000 | | British Pounds | | U.S.$ | 3,073,168 | | 2/10/05 | | U.S.$ | 10,610 | |
| 750,000 | | Euro | | | 1,021,200 | | 2/23/05 | | | 2,945 | |
| 14,064,453 | | British Pounds | | | 27,007,408 | | 3/21/05 | | | 144,463 | |
| 30,228,439 | | British Pounds | | | 58,032,810 | | 6/08/05 | | | 522,857 | |
| 881,025,000 | | Korean Won | | | 850,000 | | 6/17/05 | | | 1,828 | |
| | | | |
|
| | | |
|
|
|
| | | | | U.S.$ | 89,984,586 | | | | U.S.$ | 682,703 | |
| | | | |
|
| | | |
|
|
|
| Unrealized gain on forward exchange contracts | | | | | | | U.S.$ | 922,192 | |
| | | | | | | | | |
|
|
|
| | | |
| Contracts to Buy | | | | | | | |
| 4,099,913 | | Canadian Dollars | | U.S.$ | 3,450,000 | | 4/21/05 | | U.S.$ | (31,877 | ) |
| | | | |
|
| | | |
|
|
|
| | | | | U.S.$ | 3,450,000 | | | | U.S.$ | (31,877 | ) |
| | | | |
|
| | | |
|
|
|
| | | |
| Contracts to Sell | | | | | | | |
| 71,400,328 | | Canadian Dollars | | U.S.$ | 54,309,474 | | 1/21/05 | | U.S.$ | (5,215,056 | ) |
| 3,000,000 | | South African Rand | | | 479,272 | | 1/26/05 | | | (48,218 | ) |
| 37,500,000 | | British Pounds | | | 69,254,100 | | 2/10/05 | | | (2,524,615 | ) |
| 4,579,485 | | Euro | | | 5,655,664 | | 2/23/05 | | | (561,782 | ) |
| 41,850,289 | | Danish Krone | | | 6,848,284 | | 3/17/05 | | | (791,246 | ) |
| 2,026,251,007 | | Japanese Yen | | | 18,530,872 | | 3/28/05 | | | (1,374,056 | ) |
| 1,396,560 | | Canadian Dollars | | | 1,100,000 | | 4/21/05 | | | (64,321 | ) |
| 13,722,808 | | Euro | | | 17,322,683 | | 4/25/05 | | | (1,327,632 | ) |
| 6,000,000 | | Euro | | | 7,413,900 | | 5/23/05 | | | (745,203 | ) |
| 10,800,000 | | Euro | | | 14,386,032 | | 6/13/05 | | | (306,646 | ) |
| 21,867,386,208 | | Korean Won | | | 20,850,000 | | 6/17/05 | | | (248,555 | ) |
| 9,000,000 | | Euro | | | 11,365,200 | | 7/25/05 | | | (890,021 | ) |
| 6,000,000 | | Euro | | | 7,417,350 | | 8/23/05 | | | (758,250 | ) |
| 3,500,000 | | Euro | | | 4,263,000 | | 9/13/05 | | | (508,408 | ) |
| | | | |
|
| | | |
|
|
|
| | | | | U.S.$ | 239,195,831 | | | | U.S.$ | (15,364,008 | ) |
| | | | |
|
| | | |
|
|
|
| Unrealized loss on forward exchange contracts. | | | | | | | | (15,395,885 | ) |
| | | | | | | | | |
|
|
|
| Net unrealized [gain/loss] on forward exchange contracts | | | | | | | U.S.$ | (14,473,693 | ) |
| | | | | | | | | |
|
|
|
MS-28
FRANKLIN TEMPLETON VARIABLE INSURANCE PRODUCTS TRUST
MUTUAL SHARES SECURITIES FUND
Notes to Financial Statements (continued)
9. CREDIT RISK AND DEFAULTED SECURITIES
The Fund held defaulted securities and/or other securities for which the income has been deemed uncollectible. At December 31, 2004, the value of these securities was $62,507,888, representing 2.27% of the Fund’s net assets. For information as to specific securities, see the accompanying Statement of Investments.
10. RESTRICTED SECURITIES
At December 31, 2004, investments in securities included issues that are restricted and illiquid. Restricted securities are often purchased in private placement transactions, are not registered under the Securities Act of 1933, may have contractual restrictions on resale, and are valued under methods approved by the Board of Trustees as reflecting fair value. A security may also be considered illiquid if it lacks a readily available market or if its valuation has not changed for a certain period of time. At December 31, 2004, the Fund held investments in restricted and illiquid securities that were valued under approved methods by the Board of Trustees, as follows:
| | | | | | | | | | |
Shares/
Warrants | | Issuer | | Acquisition
Date | | Cost | | Value |
| 56,216 | | AboveNet Inc. | | 10/02/01 | | $ | 2,933,131 | | $ | 1,347,127 |
| 2,231 | | AboveNet Inc., wts., 9/08/08 | | 10/02/01 | | | 279,787 | | | 14,278 |
| 2,625 | | AboveNet Inc., wts., 9/08/10 | | 10/02/01 | | | 300,103 | | | 10,500 |
| 806,100 | | Centennial Bank Holdings Inc. | | 12/29/04 | | | 8,464,050 | | | 8,464,050 |
| 4,653 | | Elephant Capital Holdings Ltd. | | 8/29/03 | | | 4,654,210 | | | 6,188,139 |
| 1,001,113 | | Florida East Coast Industries Inc. | | 5/05/97 | | | 30,413,544 | | | 42,892,687 |
| 639,453 | | International Steel Group | | 4/10/02 | | | 3,118,750 | | | 24,639,403 |
| 184,830 | | Leucadia National Corp. | | 12/20/02 | | | 6,515,258 | | | 12,199,889 |
| 16,280 | | Olympus Re Holdings Ltd. | | 12/19/01 | | | 1,628,000 | | | 2,786,811 |
| 1,120 | | Security Capital European Realty | | 4/08/98 | | | 61,302 | | | 8,064 |
| | | | | | | | | |
|
|
| | | Total Restricted Securities (3.58% of Net Assets) | | | | | | | $ | 98,550,948 |
| | | | | | | | | |
|
|
11. OTHER CONSIDERATIONS
Franklin Mutual, as the Fund’s Investment Manager, may serve as a member on the board of directors of certain companies in which the Fund invests and/or may represent the Fund in certain corporate negotiations. At December 31, 2004, the Investment Manager serves in one or more of these capacities for Kindred Healthcare and AboveNet Inc. As a result of this involvement, the Investment Manager may be in possession of certain material non-public information which, pursuant to the Fund’s policies and the requirements of the federal securities laws, could prevent the Fund from trading in the securities of such companies for limited or extended periods of time.
12. REGULATORY MATTERS
Investigations
As part of various investigations by a number of federal, state, and foreign regulators and governmental entities, including the Securities and Exchange Commission (“SEC”), the California Attorney General’s Office (“CAGO”), and the National Association of Securities Dealers, Inc. (“NASD”), relating to certain practices in the mutual fund industry, including late trading, market timing and marketing support payments to securities dealers who sell fund shares, Franklin Resources, Inc. and certain of its subsidiaries (as used in this section, together, the “Company”), as well as certain current or former executives and employees of the Company, received subpoenas and/or requests for documents, information and/or testimony. The Company and its current employees provided documents and information in response to those requests and subpoenas.
MS-29
FRANKLIN TEMPLETON VARIABLE INSURANCE PRODUCTS TRUST
MUTUAL SHARES SECURITIES FUND
Notes to Financial Statements (continued)
12. REGULATORY MATTERS (cont.)
Settlements
Beginning in August 2004, the Company entered into settlements with certain regulators investigating the mutual fund industry practices noted above. The Company believes that settlement of each of the matters described in this section is in the best interest of the Company and shareholders of the Franklin, Templeton, and Mutual Series mutual funds (the “funds”).
On August 2, 2004, Franklin Resources, Inc. announced that its subsidiary, Franklin Advisers, Inc., reached an agreement with the SEC that resolved the issues resulting from the SEC investigation into market timing activity. In connection with that agreement, the SEC issued an “Order Instituting Administrative and Cease-and-Desist Proceedings Pursuant to Sections 203(e) and 203(k) of the Investment Advisers Act of 1940 and Sections 9(b) and 9(f) of the Investment Company Act of 1940, Making Findings and Imposing Remedial Sanctions and a Cease-and-Desist Order” (the “Order”). The SEC’s Order concerned the activities of a limited number of third parties that ended in 2000 and those that were the subject of the first Massachusetts administrative complaint described below.
Under the terms of the SEC’s Order, pursuant to which Franklin Advisers, Inc. neither admitted nor denied any of the findings contained therein, Franklin Advisers, Inc. agreed to pay $50 million, of which $20 million is a civil penalty, to be distributed to shareholders of certain funds in accordance with a plan to be developed by an independent distribution consultant. At this time, it is unclear which funds or which shareholders of any particular fund will receive distributions. The Order also required Franklin Advisers, Inc. to, among other things, enhance and periodically review compliance policies and procedures.
On September 20, 2004, Franklin Resources, Inc. announced that two of its subsidiaries, Franklin Advisers, Inc. and Franklin Templeton Alternative Strategies, Inc. (“FTAS”), reached an agreement with the Securities Division of the Office of the Secretary of the Commonwealth of Massachusetts (the “State of Massachusetts”) related to its administrative complaint filed on February 4, 2004, concerning one instance of market timing that was also a subject of the August 2, 2004 settlement that Franklin Advisers, Inc. reached with the SEC, as described above.
Under the terms of the settlement consent order issued by the State of Massachusetts, Franklin Advisers, Inc. and FTAS consented to the entry of a cease-and-desist order and agreed to pay a $5 million administrative fine to the State of Massachusetts (the “Massachusetts Consent Order”). The Massachusetts Consent Order included two different sections: “Statements of Fact” and “Violations of Massachusetts Securities Laws.” Franklin Advisers, Inc. and FTAS admitted the facts in the Statements of Fact.
On October 25, 2004, the State of Massachusetts filed a second administrative complaint, alleging that Franklin Resources, Inc.’s Form 8-K filing (in which it described the Massachusetts Consent Order and stated that “Franklin did not admit or deny engaging in any wrongdoing”) failed to state that Franklin Advisers, Inc. and FTAS admitted the Statements of Fact portion of the Massachusetts Consent Order (the “Second Complaint”). Franklin Resources, Inc. reached a second agreement with the State of Massachusetts on November 19, 2004, resolving the Second Complaint. As a result of the November 19, 2004 settlement, Franklin Resources, Inc. filed a new Form 8-K. The terms of the Massachusetts Consent Order did not change and there was no monetary fine associated with this second settlement.
On November 17, 2004, Franklin Resources, Inc. announced that Franklin/Templeton Distributors, Inc. (“FTDI”) reached an agreement with the CAGO, resolving the issues resulting from the CAGO’s investigation concerning sales and marketing support payments. Under the terms of the settlement, FTDI neither admitted nor denied the allegations in the CAGO’s complaint and agreed to pay $2 million to the State of California as a civil penalty, $14 million to the funds, to be allocated by an independent distribution consultant to be paid for by FTDI, and $2 million to the CAGO for its investigative costs.
On December 13, 2004, Franklin Resources, Inc. announced that its subsidiaries FTDI and Franklin Advisers, Inc. reached an agreement with the SEC, resolving the issues resulting from the SEC’s investigation concerning marketing support payments to securities dealers who sell fund shares. In connection with that agreement, the SEC issued an “Order Instituting Administrative and Cease-and-Desist Proceedings, Making Findings, and Imposing Remedial Sanctions Pursuant to Sections 203(e) and 203(k)
MS-30
FRANKLIN TEMPLETON VARIABLE INSURANCE PRODUCTS TRUST
MUTUAL SHARES SECURITIES FUND
Notes to Financial Statements (continued)
12. REGULATORY MATTERS (cont.)
Settlements (cont.)
of the Investment Advisers Act of 1940, Sections 9(b) and 9(f) of the Investment Company Act of 1940, and Section 15(b) of the Securities Exchange Act of 1934” (the “Second Order”).
Under the terms of the Second Order, in which FTDI and Franklin Advisers, Inc. neither admitted nor denied the findings contained therein, they agreed to pay the funds a penalty of $20 million and disgorgement of $1 (one dollar). FTDI and Franklin Advisers, Inc. also agreed to implement certain measures and undertakings relating to marketing support payments to broker-dealers for the promotion or sale of fund shares, including making additional disclosures in the funds’ Prospectuses and Statements of Additional Information. The Second Order further requires the appointment of an independent distribution consultant, at the Company’s expense, who shall develop a plan for the distribution of the penalty and disgorgement to the funds.
Other Legal Proceedings
The Trust, in addition to the Company and other funds, and certain current and former officers, employees, and directors have been named in multiple lawsuits in different federal courts in Nevada, California, Illinois, New York and Florida, alleging violations of various federal securities laws and seeking, among other relief, monetary damages, restitution, removal of fund trustees, directors, advisers, administrators, and distributors, rescission of management contracts and 12b-1 Plans, and/or attorneys’ fees and costs. Specifically, the lawsuits claim breach of duty with respect to alleged arrangements to permit market timing and/or late trading activity, or breach of duty with respect to the valuation of the portfolio securities of certain Templeton funds managed by Franklin Resources, Inc. subsidiaries, resulting in alleged market timing activity. The majority of these lawsuits duplicate, in whole or in part, the allegations asserted in the February 4, 2004 Massachusetts administrative complaint and the findings in the SEC’s August 2, 2004 Order, as described above. The lawsuits are styled as class actions, or derivative actions on behalf of either the named funds or Franklin Resources, Inc.
In addition, the Company, as well as certain current and former officers, employees, and directors, have been named in multiple lawsuits alleging violations of various securities laws and pendent state law claims relating to the disclosure of directed brokerage payments and/or payment of allegedly excessive advisory, commission, and distribution fees, and seeking, among other relief, monetary damages, restitution, rescission of advisory contracts, including recovery of all fees paid pursuant to those contracts, an accounting of all monies paid to the named advisers, declaratory relief, injunctive relief, and/or attorneys’ fees and costs. These lawsuits are styled as class actions or derivative actions brought on behalf of certain funds.
The Company and fund management strongly believes that the claims made in each of the lawsuits identified above are without merit and intends to vigorously defend against them. The Company cannot predict with certainty, however, the eventual outcome of the remaining governmental investigations or private lawsuits, nor whether they will have a material negative impact on the Company. Public trust and confidence are critical to the Company’s business and any material loss of investor and/or client confidence could result in a significant decline in assets under management by the Company, which would have an adverse effect on the Company’s future financial results. If the Company finds that it bears responsibility for any unlawful or inappropriate conduct that caused losses to the Trust, it is committed to making the Trust or its shareholders whole, as appropriate. The Company is committed to taking all appropriate actions to protect the interests of its funds’ shareholders.
MS-31
FRANKLIN TEMPLETON VARIABLE INSURANCE PRODUCTS TRUST
MUTUAL SHARES SECURITIES FUND
Report of Independent Registered Public Accounting Firm
To the Trustees and Shareholders of
Franklin Templeton Variable Insurance Products Trust
In our opinion, the accompanying statement of assets and liabilities, including the statement of investments, and the related statements of operations and of changes in net assets and the financial highlights present fairly, in all material respects, the financial position of Mutual Shares Securities Fund (the Fund) (one of the funds constituting Franklin Templeton Variable Insurance Products Trust) at December 31, 2004, the results of its operations for the year then ended, the changes in its net assets for each of the two years in the period then ended and the financial highlights for each of the five years in the period then ended, in conformity with accounting principles generally accepted in the United States of America. These financial statements and financial highlights (hereafter referred to as “financial statements”) are the responsibility of the Fund’s management; our responsibility is to express an opinion on these financial statements based on our audits. We conducted our audits of these financial statements in accordance with the standards of the Public Company Accounting Oversight Board (United States). Those standards require that we plan and perform the audits to obtain reasonable assurance about whether the financial statements are free of material misstatement. An audit includes examining, on a test basis, evidence supporting the amounts and disclosures in the financial statements, assessing the accounting principles used and significant estimates made by management, and evaluating the overall financial statement presentation. We believe that our audits, which included confirmation of securities at December 31, 2004 by correspondence with the custodian and brokers, provide a reasonable basis for our opinion.
PricewaterhouseCoopers LLP
San Francisco, California
February 9, 2005
MS-32
FRANKLIN TEMPLETON VARIABLE INSURANCE PRODUCTS TRUST
MUTUAL SHARES SECURITIES FUND
Tax Designation (unaudited)
Under Section 852(b)(3)(C) of the Internal Revenue Code (Code), the Fund hereby designates $7,502,674 as a capital gain dividend for the fiscal year ended December 31, 2004.
Under Section 854(b)(2) of the Code, the Fund hereby designates 84.61% of the ordinary income dividends as income qualifying for the dividends received deduction for the fiscal year ended December 31, 2004.
MS-33
TEMPLETON DEVELOPING MARKETS SECURITIES FUND
This annual report for Templeton Developing Markets Securities Fund covers the fiscal year ended December 31, 2004.
Performance Summary as of 12/31/04
Average annual total return of Class 2 shares* represents the average annual change in value, assuming reinvestment of dividends and capital gains. Average returns smooth out variations in returns, which can be significant; they are not the same as year-by-year results.
Periods ended 12/31/04
| | | | | | |
| | | 1-Year | | 5-Year | | Since
Inception
(3/4/96) |
Average Annual Total Return | | +24.71% | | +3.54% | | -0.46% |
*Performance prior to the 5/1/00 merger reflects the historical performance of Templeton Developing Markets Fund. Additionally, because Class 2 shares were not offered until 5/1/97, standardized Class 2 Fund performance for prior periods represents the historical results of Class 1 shares. For periods beginning on 5/1/97 (effective date), the average annual total return of Class 2 shares was -0.42%.
Total Return Index Comparison for Hypothetical $10,000 Investment (3/4/96–12/31/04)
The graph below shows the change in value of a hypothetical $10,000 investment in the Fund over the indicated period and includes reinvestment of any income or distributions. The Fund’s performance* is compared to the performance of the Morgan Stanley Capital International (MSCI) Emerging Markets (EM) Index and the Standard & Poor’s/International Finance Corporation Investable (S&P/IFCI) Composite Index. One cannot invest directly in an index, nor is an index representative of the Fund’s portfolio. Please see Important Notes to Performance Information preceding the Fund Summaries.
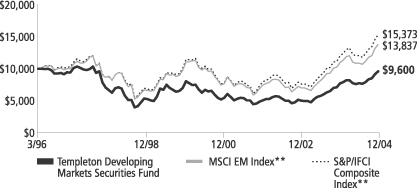
**Source: Standard & Poor’s Micropal. Please see Index Descriptions following the Fund Summaries.
Templeton Developing Markets Securities Fund Class 2
Performance reflects the Fund’s Class 2 operating expenses, but does not include any contract fees, expenses or sales charges. If they had been included, performance would be lower. These charges and deductions, particularly for variable life policies, can have a significant effect on contract values and insurance benefits. See the contract prospectus for a complete description of these expenses, including sales charges.
Performance data quoted represent past performance, which does not guarantee future results. Investment return and principal value will fluctuate, and you may have a gain or loss when you sell your shares. Current performance may differ from figures shown.
TD-1
Fund Goals and Main Investments: Templeton Developing Markets Securities Fund seeks long-term capital appreciation. The Fund invests predominantly in emerging markets investments.
Performance Overview
You can find the Fund’s one-year total return in the Performance Summary. The Fund underperformed its benchmarks, the MSCI EM Index and the S&P/IFCI Composite Index, which returned 25.95% and 28.11% for the year under review.1 Please note that the index performance numbers are purely for reference and that we do not attempt to track the index, but rather undertake investments on the basis of careful fundamental research.
Economic and Market Overview
Economically, 2004 was another positive year for emerging markets. Most Latin American economies recorded strong economic growth. In Eastern Europe, new member countries began seeing positive developments in the form of higher investment inflows as a result of European Union (EU) accession.
On December 26, the largest earthquake in 40 years struck in the Indian Ocean, just north of Sumatra. The earthquake created monster tidal waves, also known as tsunamis, that devastated coastal areas of Indonesia, Sri Lanka, Thailand, India and the Maldives. The remoteness of some of these areas complicated aid relief to the victims. While the tsunamis took a terrible toll on the people in the region, analysts estimated that their economic impact would not be significant.
Emerging markets stocks generally performed well during the year under review. The MSCI EM Index gained 25.95% in U.S. dollar terms as strong share prices and a sliding U.S. dollar boosted performance in the fourth quarter.1 Latin America and Eastern Europe outperformed their emerging market counterparts as both regions continued to attract greater investor interest. In particular, local stock markets of new EU members such as Poland, the Czech Republic, Hungary and Slovakia reached all-time highs. Turkey also recorded strong gains as investors reacted favorably toward the EU’s approval to begin formal accession talks for October 2005 and the Turkish government’s new US$10 billion standby agreement with the International Monetary Fund
1. Source: Standard & Poor’s Micropal. One cannot invest directly in an index, nor is an index representative of the Fund’s portfolio. Please see Index Descriptions following the Fund Summaries.
Fund Risks: Stocks offer the potential for long-term gains but can be subject to short-term up-and-down price movements. Investing in emerging markets involves special considerations, including market and currency fluctuations, economic instability, adverse social and political developments, and the relatively smaller size and lesser liquidity of these markets. All investments in the Fund should be considered long-term investments, which could experience significant volatility in any given year. The Fund is designed for the aggressive portion of a well-diversified portfolio. The Fund’s prospectus also includes a description of the main investment risks.
TD-2
(IMF).2 However, the Russian market underperformed as foreign investors remained cautious due to the Russian government’s actions against YUKOS and new tax claims on Vimpelcom.
Despite recording double-digit gains, Asian stock markets did not perform as well as those in other emerging markets regions as rising interest rates in the U.S., high commodity prices and concerns over China’s overheating economy continued to affect investor sentiment. In Africa, the South African market benefited from a strengthening rand, which greatly enhanced that market’s performance in U.S. dollars.
Investment Strategy
Our investment philosophy is bottom-up, value-oriented and long-term. In choosing investments, we may make onsite visits to companies to assess critical factors such as management strength and local conditions. In addition, we focus on the market price of a company’s securities relative to its evaluation of the company’s potential long-term (typically 5 years) earnings, asset value, cash flow, and balance sheet. Among factors we consider are a company’s historical value measures, including price/earnings ratio, book value, profit margins and liquidation value. We perform in-depth research to construct an action list from which we make our investment decisions.
Manager’s Discussion
In terms of performance, the Fund derived positive results from its underweighted position, relative to the MSCI EM Index, in Russia as well as overweighted positions in Austria and Singapore. The Fund’s decision not to hold YUKOS in Russia helped performance as that company’s stock price continued to tumble mainly due to concerns about the Russian government’s treatment of its assets. In Austria, the strongest contributors to Fund performance were OMV and Bank Austria Creditanstalt. We felt that both companies were well positioned to benefit from their large exposure to fast-growing central and Eastern European economies. However, the Fund’s underweighted positions in Brazil, Mexico and South Africa negatively impacted relative performance. All three markets recorded strong U.S. dollar performances in 2004, resulting in increasingly expensive valuations.
With regard to sectors, the energy sector, whose Fund weighting was about on par with that of the index, performed well.3 Our overweighted positions in MOL, OMV and SK Corp. drove the Fund’s relative energy
2. Source: The Economist Intelligence Unit Ltd., “Turkey Economy: Plumper,” 12/20/04.
3. The energy sector comprises energy equipment and services, and oil and gas in the SOI.
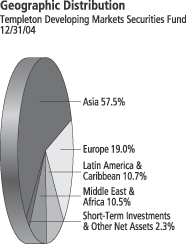
Top 10 Countries
Templeton Developing Markets Securities Fund 12/31/04
| | |
| | | % of Total
Net Assets |
| |
| South Korea | | 17.4% |
| |
| Taiwan | | 13.2% |
| |
| South Africa | | 10.5% |
| |
| China | | 10.1% |
| |
| Brazil | | 7.1% |
| |
| Singapore | | 6.0% |
| |
| Poland | | 3.5% |
| |
| Turkey | | 3.5% |
| |
| India | | 3.5% |
| |
| Mexico | | 3.3% |
TD-3
sector performance. Our overweighted positions in the consumer staples and diversified financial services sectors also reaped significant benefits.4 For example, SABMiller, Remgro and Ambev contributed the most to relative performance. The Fund’s underweighted position in commercial banks and overweighted exposure to telecommunication services hampered relative performance during the year.5
In general, if the value of the U.S. dollar goes up compared with a foreign currency, an investment traded in that foreign currency will go down in value because it will be worth fewer U.S. dollars. This can have a negative effect on Fund performance. Conversely, when the U.S. dollar weakens in relation to a foreign currency, an investment traded in that foreign currency will increase in value, which can contribute to Fund performance. For the 12 months ended December 31, 2004, the U.S. dollar declined in value relative to most non-U.S. currencies. At the end of the period, the Fund’s portfolio was invested predominantly in securities with non-U.S. currency exposure, which resulted in a positive effect on Fund performance. However, one cannot expect the same result in future periods.
In Asia, the Fund’s largest purchases were in South Korea and Taiwan as the Fund increased its exposure to the semiconductors and semiconductor equipment sector. Key purchases included Samsung Electronics, one of the world’s largest electronics manufacturers, and Taiwan Semiconductor Manufacturing, a leading global integrated circuit producer. Additional purchases included Daewoo Shipbuilding, a major player in the global shipbuilding industry, and MediaTek, Taiwan’s biggest integrated circuit design company. We reduced our Indonesian position due to strong performance in 2004 as some stocks reached our sell targets.
The Fund invested in several western European-listed companies with significant business exposure and growth opportunities in emerging markets. They include Oriflame, a cosmetic company with sales operations in over 50 countries as well as market leadership in more than 30 of them; Inbev, the result of a merger between Interbrew and Ambev; and HSBC Holdings, one of the world’s largest banking and financial services organizations.
4. The consumer staples sector comprises food and staples retailing, beverages, food products, tobacco, household products and personal products in the SOI.
5. The telecommunication services sector comprises diversified telecommunication services and
Top 10 Holdings
Templeton Developing Markets Securities Fund 12/31/04
| | |
Company
Sector/Industry,
Country | | % of Total
Net Assets |
| |
Samsung Electronics
Co. Ltd. | | 4.5% |
| Semiconductors & Semiconductor Equipment, South Korea | | |
| |
| China Mobile (Hong Kong) Ltd., fgn. | | 2.4% |
| Wireless Telecommunication Services, China | | |
| |
Telekomunikacja
Polska SA | | 2.2% |
| Diversified Telecommunication Services, Poland | | |
| |
| Remgro Ltd. | | 2.2% |
| Diversified Financial Services, South Africa | | |
| |
| Anglo American PLC | | 2.1% |
| Metals & Mining, South Africa | | |
| |
| SABMiller PLC | | 2.1% |
| Beverages, South Africa | | |
| |
| Kimberly Clark de Mexico SA de CV, A | | 1.9% |
| Household Products, Mexico | | |
| |
Cia De Bebidas Das Americas (Ambev),
ADR, pfd. | | 1.8% |
| Beverages, Brazil | | |
| |
| Inbev | | 1.8% |
| Beverages, Belgium | | |
| |
| Taiwan Cellular Corp. | | 1.7% |
| Wireless Telecommunication Services, Taiwan | | |
The dollar value, number of shares or principal amount, and names of all portfolio holdings are listed in the Fund’s Statement of Investments.
TD-4
We reduced our Latin American exposure during the reporting period as the Fund undertook selective sales in Mexico and Argentina, and sold its only holding in Peru. The Fund realized gains through significant sales such as Carso and Tenaris. Benefiting from a strengthening rand and high commodity prices in 2004, the Fund locked in strong U.S. dollar returns through sales of Anglo American and BHP Billiton.
Thank you for your participation in Templeton Developing Markets Securities Fund. We look forward to serving your future investment needs.
The foregoing information reflects our analysis, opinions and portfolio holdings as of December 31, 2004, the end of the reporting period. The way we implement our main investment strategies and the resulting portfolio holdings may change depending on factors such as market and economic conditions. These opinions may not be relied upon as investment advice or an offer for a particular security. The information is not a complete analysis of every aspect of any market, country, industry, security or the Fund. Statements of fact are from sources considered reliable, but the adviser makes no representation or warranty as to their completeness or accuracy. Although historical performance is no guarantee of future results, these insights may help you understand our investment management philosophy.
TD-5
Fund Expenses
As an investor in a variable insurance contract (“Contract”) that indirectly provides for investment in an underlying mutual fund, you can incur transaction and/or ongoing expenses at both the Fund level and the Contract level.
| • | | Transaction expenses can include sales charges (loads) on purchases, redemption fees, surrender fees, transfer fees and premium taxes. |
| • | | Ongoing expenses can include management fees, distribution and service (12b-1) fees, contract fees, annual maintenance fees, mortality and expense risk fees and other fees and expenses. All mutual funds and Contracts have some types of ongoing expenses. |
The expenses shown in the table below are meant to highlight ongoing expenses at the Fund level only and do not include ongoing expenses at the Contract level, or transaction expenses at either the Fund or Contract levels. While the Fund does not have transaction expenses, if the transaction and ongoing expenses at the Contract level were included, the expenses shown below would be higher. You should consult your Contract prospectus or disclosure document for more information.
The table shows Fund-level ongoing expenses and can help you understand these expenses and compare them with those of other mutual funds offered through the Contract. The table assumes a $1,000 investment held for the six months indicated. Please refer to the Fund prospectus for additional information on operating expenses.
Actual Fund Expenses
The first line (Actual) for each share class listed in the table below provides actual account values and expenses. The “Ending Account Value” is derived from the Fund’s actual return, which includes the effect of ongoing Fund expenses, but does not include the effect of ongoing Contract expenses.
You can estimate the Fund-level expenses you incurred during the period, by following these steps. Of course, your account value and expenses will differ from those in this illustration:
| 1. | Divide your account value by $1,000. |
If an account had an $8,600 value, then $8,600 ÷ $1,000 = 8.6.
| 2. | Multiply the result by the number under the heading “Fund-Level Expenses Incurred During Period.” |
If Fund-Level Expenses Incurred During Period were $7.50, then 8.6 × $7.50 = $64.50.
Templeton Developing Markets Securities Fund Class 2
TD-6
In this illustration, the estimated expenses incurred this period at the Fund level are $64.50.
Hypothetical Example for Comparison with Other Mutual Funds
Information in the second line (Hypothetical) for each class in the table can help you compare ongoing expenses of the Fund with those of other mutual funds offered through the Contract. This information may not be used to estimate the actual ending account balance or expenses you incurred during the period. The hypothetical “Ending Account Value” is based on the actual expense ratio for each class and an assumed 5% annual rate of return before expenses, which does not represent the Fund’s actual return. The figure under the heading “Fund-Level Expenses Incurred During Period” shows the hypothetical expenses your account would have incurred under this scenario. You can compare this figure with the 5% hypothetical examples that appear in shareholder reports of other funds offered through a Contract.
| | | | | | |
| Class 2 | | Beginning
Account
Value 6/30/04 | | Ending
Account
Value 12/31/04 | | Fund-Level
Expenses Incurred
During Period*
6/30/04-12/31/04 |
Actual | | $1,000 | | $1,236.80 | | $10.35 |
Hypothetical (5% return before expenses) | | $1,000 | | $1,015.89 | | $9.32 |
*Expenses are equal to the annualized expense ratio for the Fund’s Class 2 shares (1.84%), which does not include any ongoing expenses of the Contract for which the Fund is an investment option, multiplied by the average account value over the period, multiplied by 184/366 to reflect the one-half year period.
TD-7
FRANKLIN TEMPLETON VARIABLE INSURANCE PRODUCTS TRUST
TEMPLETON DEVELOPING MARKETS SECURITIES FUND
Financial Highlightsa
| | | | | | | | | | | | | | | | | | | | |
| | | Class 1
| |
| | | Year Ended December 31,
| |
| | | 2004 | | | 2003 | | | 2002 | | | 2001 | | | 2000 | |
| | |
|
|
|
Per share operating performance | | | | | | | | | | | | | | | | | | | | |
(for a share outstanding throughout the year) | | | | | | | | | | | | | | | | | | | | |
Net asset value, beginning of year | | $ | 7.14 | | | $ | 4.71 | | | $ | 4.78 | | | $ | 5.25 | | | $ | 7.77 | |
| | |
|
|
|
Income from investment operations: | | | | | | | | | | | | | | | | | | | | |
Net investment incomeb | | | .11 | | | | .13 | | | | .07 | | | | .08 | | | | .07 | |
Net realized and unrealized gains (losses) | | | 1.62 | | | | 2.38 | | | | (.06 | ) | | | (.50 | ) | | | (2.52 | ) |
| | |
|
|
|
Total from investment operations | | | 1.73 | | | | 2.51 | | | | .01 | | | | (.42 | ) | | | (2.45 | ) |
| | |
|
|
|
Less distributions from net investment income | | | (.14 | ) | | | (.08 | ) | | | (.08 | ) | | | (.05 | ) | | | (.07 | ) |
| | |
|
|
|
Net asset value, end of year | | $ | 8.73 | | | $ | 7.14 | | | $ | 4.71 | | | $ | 4.78 | | | $ | 5.25 | |
| | |
|
|
|
| | | | | |
Total returnc | | | 24.83% | | | | 53.74% | | | | .04% | | | | (8.08)% | | | | (31.76)% | |
Ratios/supplemental data | | | | | | | | | | | | | | | | | | | | |
Net assets, end of year (000’s) | | $ | 477,290 | | | $ | 359,299 | | | $ | 225,454 | | | $ | 240,289 | | | $ | 301,645 | |
Ratios to average net assets: | | | | | | | | | | | | | | | | | | | | |
Expenses | | | 1.54% | | | | 1.55% | | | | 1.58% | | | | 1.57% | | | | 1.56% | |
Net investment income | | | 1.52% | | | | 2.35% | | | | 1.45% | | | | 1.64% | | | | 1.13% | |
Portfolio turnover rate | | | 55.67% | | | | 46.20% | | | | 57.91% | | | | 78.29% | | | | 89.48% | |
| a | Financial highlights presented reflect historical financial information from Templeton Variable Products Series Fund (TVP)-Templeton Developing Markets Fund as a result of a merger on May 1, 2000. |
| b | Based on average daily shares outstanding. |
| c | Total return does not include any fees, charges or expenses imposed by the variable annuity and life insurance contracts for which the Franklin Templeton Variable Insurance Products Trust serves as an underlying investment vehicle. Total return is not annualized for periods less than one year. |
See notes to financial statements.
TD-8
FRANKLIN TEMPLETON VARIABLE INSURANCE PRODUCTS TRUST
TEMPLETON DEVELOPING MARKETS SECURITIES FUND
Financial Highlightsa (continued)
| | | | | | | | | | | | | | | | | | | | |
| | | Class 2
| |
| | | Year Ended December 31,
| |
| | | 2004 | | | 2003 | | | 2002 | | | 2001 | | | 2000 | |
| | |
|
|
|
Per share operating performance | | | | | | | | | | | | | | | | | | | | |
(for a share outstanding throughout the year) | | | | | | | | | | | | | | | | | | | | |
Net asset value, beginning of year | | $ | 7.09 | | | $ | 4.69 | | | $ | 4.76 | | | $ | 5.22 | | | $ | 7.74 | |
| | |
|
|
|
Income from investment operations: | | | | | | | | | | | | | | | | | | | | |
Net investment incomeb | | | .09 | | | | .11 | | | | .06 | | | | .07 | | | | .06 | |
Net realized and unrealized gains (losses) | | | 1.63 | | | | 2.35 | | | | (.06 | ) | | | (.49 | ) | | | (2.53 | ) |
| | |
|
|
|
Total from investment operations | | | 1.72 | | | | 2.46 | | | | — | | | | (.42 | ) | | | (2.47 | ) |
| | |
|
|
|
Less distributions from net investment income | | | (.14 | ) | | | (.06 | ) | | | (.07 | ) | | | (.04 | ) | | | (.05 | ) |
| | |
|
|
|
Net asset value, end of year | | $ | 8.67 | | | $ | 7.09 | | | $ | 4.69 | | | $ | 4.76 | | | $ | 5.22 | |
| | |
|
|
|
| | | | | |
Total returnc | | | 24.71% | | | | 52.99% | | | | (.15)% | | | | (8.08)% | | | | (32.04)% | |
Ratios/supplemental data | | | | | | | | | | | | | | | | | | | | |
Net assets, end of year (000’s) | | $ | 327,569 | | | $ | 170,953 | | | $ | 80,952 | | | $ | 64,081 | | | $ | 56,617 | |
Ratios to average net assets: | | | | | | | | | | | | | | | | | | | | |
Expenses | | | 1.79% | | | | 1.80% | | | | 1.83% | | | | 1.82% | | | | 1.81% | |
Net investment income | | | 1.27% | | | | 2.10% | | | | 1.20% | | | | 1.37% | | | | .88% | |
Portfolio turnover rate | | | 55.67% | | | | 46.20% | | | | 57.91% | | | | 78.29% | | | | 89.48% | |
| a | Financial highlights presented reflect historical financial information from Templeton Variable Products Series Fund (TVP) – Templeton Developing Markets Fund as a result of a merger on May 1, 2000. |
| b | Based on average daily shares outstanding. |
| c | Total return does not include any fees, charges or expenses imposed by the variable annuity and life insurance contracts for which the Franklin Templeton Variable Insurance Products Trust serves as an underlying investment vehicle. Total return is not annualized for periods less than one year. |
See notes to financial statements.
TD-9
FRANKLIN TEMPLETON VARIABLE INSURANCE PRODUCTS TRUST
TEMPLETON DEVELOPING MARKETS SECURITIES FUND
Financial Highlights (continued)
| | | | |
| | | Class 3
| |
| | | Period Ended
December 31, 2004c
| |
Per share operating performance | | | | |
(for a share outstanding throughout the period) | | | | |
Net asset value, beginning of period | | $ | 7.13 | |
| | |
|
|
|
Income from investment operations: | | | | |
Net investment incomea | | | .08 | |
Net realized and unrealized gains (losses) | | | 1.61 | |
| | |
|
|
|
Total from investment operations | | | 1.69 | |
| | |
|
|
|
Less distributions from net investment income | | | (.14 | ) |
| | |
|
|
|
Net asset value, end of period | | $ | 8.68 | |
| | |
|
|
|
| |
Total returnb | | | 24.15% | |
Ratios/supplemental data | | | | |
Net assets, end of period (000’s) | | $ | 12 | |
Ratios to average net assets: | | | | |
Expenses | | | 1.54% | d |
Net investment income | | | 1.52% | d |
Portfolio turnover rate | | | 55.67% | |
| a | Based on average daily shares outstanding. |
| b | Total return does not include any fees, charges or expenses imposed by the variable annuity and life insurance contracts for which the Franklin Templeton Variable Insurance Products Trust serves as an underlying investment vehicle. Total return is not annualized for periods less than one year. |
| c | For the period May 1, 2004 (effective date) to December 31, 2004. |
See notes to financial statements.
TD-10
FRANKLIN TEMPLETON VARIABLE INSURANCE PRODUCTS TRUST
TEMPLETON DEVELOPING MARKETS SECURITIES FUND
Statement of Investments, December 31, 2004
| | | | | | | |
| | | INDUSTRY | | SHARES/
RIGHTS | | VALUE |
Long Term Investments 97.7% | | | | | | | |
Argentina .3% | | | | | | | |
Tenaris SA, ADR | | Energy Equipment & Services | | 45,434 | | $ | 2,221,723 |
| | | | | | |
|
|
Austria 2.0% | | | | | | | |
Bank Austria Creditanstalt | | Commercial Banks | | 125,852 | | | 11,356,942 |
OMV AG | | Oil & Gas | | 17,363 | | | 5,223,367 |
| | | | | | |
|
|
| | | | | | | | 16,580,309 |
| | | | | | |
|
|
Belgium 1.8% | | | | �� | | | |
Inbev | | Beverages | | 369,200 | | | 14,298,659 |
| | | | | | |
|
|
Brazil 7.1% | | | | | | | |
Banco Bradesco SA, ADR, pfd. | | Commercial Banks | | 477,270 | | | 11,960,386 |
Centrais Eletricas Brasileiras SA | | Electric Utilities | | 241,544,764 | | | 3,501,307 |
Cia De Bebidas Das Americas (Ambev), ADR, pfd. | | Beverages | | 518,800 | | | 14,697,604 |
Cia Vale do Rio Doce, ADR, pfd., A | | Metals & Mining | | 204,300 | | | 4,980,834 |
Petroleo Brasileiro SA, ADR, pfd. | | Oil & Gas | | 268,264 | | | 9,713,839 |
Souza Cruz SA | | Tobacco | | 430,922 | | | 5,779,157 |
Suzano Bahia Sul Papel e cel, pfd., A | | Paper & Forest Products | | 343,148 | | | 1,773,879 |
Unibanco Uniao de Bancos Brasileiros SA, GDR | | Commercial Banks | | 86,400 | | | 2,740,608 |
Usinas Siderurgicas De Minas Gerais SA, pfd. | | Metals & Mining | | 86,920 | | | 1,765,563 |
| | | | | | |
|
|
| | | | | | | | 56,913,177 |
| | | | | | |
|
|
China 10.1% | | | | | | | |
aAir China Ltd., 144A. | | Airlines | | 1,452,000 | | | 560,416 |
Aluminum Corp. of China Ltd., H | | Metals & Mining | | 9,940,000 | | | 5,882,565 |
Anhui Conch Cement Co. Ltd. | | Construction Materials | | 2,740,000 | | | 2,978,721 |
Beijing Enterprises Holdings Ltd. | | Industrial Conglomerates | | 1,420,128 | | | 2,110,241 |
China Mobile (Hong Kong) Ltd., fgn. | | Wireless Telecommunication Services | | 5,602,000 | | | 18,990,930 |
China Petroleum & Chemical Corp., H | | Oil & Gas | | 8,078,000 | | | 3,325,648 |
China Resources Enterprise Ltd. | | Distributors | | 4,574,000 | | | 7,149,817 |
China Travel International Investment Hong Kong Ltd. | | Hotels Restaurants & Leisure | | 15,506,000 | | | 4,987,263 |
China Unicom Ltd. | | Wireless Telecommunication Services | | 2,172,000 | | | 1,718,531 |
CITIC Pacific Ltd. | | Industrial Conglomerates | | 2,013,959 | | | 5,726,185 |
Denway Motors Ltd. | | Automobiles | | 13,090,234 | | | 4,673,400 |
Huadian Power International Corp. Ltd., H | | Electric Utilities | | 7,826,000 | | | 2,315,742 |
Lenovo Group Ltd., H | | Computers & Peripherals | | 13,606,000 | | | 4,069,827 |
PetroChina Co. Ltd., H | | Oil & Gas | | 14,474,000 | | | 7,727,859 |
Shanghai Industrial Holdings Ltd. | | Industrial Conglomerates | | 2,697,000 | | | 5,759,855 |
TCL International Holdings Inc. | | Household Durables | | 3,584,000 | | | 922,190 |
Travelsky Technology Ltd., H | | IT Services | | 3,227,000 | | | 2,615,544 |
| | | | | | |
|
|
| | | | | | | | 81,514,734 |
| | | | | | |
|
|
Croatia .5% | | | | | | | |
Pliva D D, GDR, Reg S | | Pharmaceuticals | | 320,200 | | | 3,986,490 |
| | | | | | |
|
|
Czech Republic .7% | | | | | | | |
Cesky Telecom AS | | Diversified Telecommunication Services | | 323,510 | | | 5,355,743 |
| | | | | | |
|
|
Greece 1.1% | | | | | | | |
Hellenic Telecommunications Organization SA (OTE) | | Diversified Telecommunication Services | | 154,380 | | | 2,769,505 |
Titan Cement Co. | | Construction Materials | | 207,560 | | | 6,140,162 |
| | | | | | |
|
|
| | | | | | | | 8,909,667 |
| | | | | | |
|
|
TD-11
FRANKLIN TEMPLETON VARIABLE INSURANCE PRODUCTS TRUST
TEMPLETON DEVELOPING MARKETS SECURITIES FUND
Statement of Investments, December 31, 2004 (cont.)
| | | | | | | |
| | | INDUSTRY | | SHARES/
RIGHTS | | VALUE |
Long Term Investments (cont.) | | | | | | | |
Hong Kong 2.6% | | | | | | | |
Cheung Kong Holdings Ltd. | | Real Estate | | 1,184,000 | | $ | 11,805,270 |
Cheung Kong Infrastructure Holdings Ltd. | | Electric Utilities | | 572,000 | | | 1,652,094 |
Guoco Group Ltd. | | Diversified Financial Services | | 328,000 | | | 3,207,081 |
Henderson Investment Ltd. | | Real Estate | | 1,065,000 | | | 1,555,135 |
MTR Corp. Ltd. | | Road & Rail | | 1,613,901 | | | 2,585,049 |
| | | | | | |
|
|
| | | | | | | | 20,804,629 |
| | | | | | |
|
|
Hungary 3.0% | | | | | | | |
Egis RT | | Pharmaceuticals | | 15,827 | | | 954,700 |
Gedeon Richter Ltd. | | Pharmaceuticals | | 50,356 | | | 6,325,851 |
Matav RT | | Diversified Telecommunication Services | | 1,037,300 | | | 4,965,492 |
MOL Magyar Olaj-Es Gazipari RT | | Oil & Gas | | 172,240 | | | 12,114,944 |
| | | | | | |
|
|
| | | | | | | | 24,360,987 |
| | | | | | |
|
|
India 3.5% | | | | | | | |
Gail (India) Ltd. | | Gas Utilities | | 855,630 | | | 4,564,019 |
Hindustan Lever Ltd. | | Household Products | | 2,477,600 | | | 8,220,476 |
Hindustan Petroleum Corp. Ltd. | | Oil & Gas | | 1,050,804 | | | 9,730,567 |
Tata Motors Ltd. | | Automobiles | | 148,000 | | | 1,728,606 |
Tata Tea Ltd. | | Food Products | | 359,803 | | | 3,937,035 |
| | | | | | |
|
|
| | | | | | | | 28,180,703 |
| | | | | | |
|
|
Indonesia .6% | | | | | | | |
Bk Danamon | | Commercial Banks | | 6,840,000 | | | 3,223,808 |
PT Perusahaan Gas Negara | | Gas Utilities | | 7,557,500 | | | 1,546,916 |
PT Perusahaan Gas Negara, 144A | | Gas Utilities | | 169,500 | | | 34,695 |
| | | | | | |
|
|
| | | | | | | | 4,805,419 |
| | | | | | |
|
|
Malaysia 1.6% | | | | | | | |
Kuala Lumpur Kepong Bhd. | | Food Products | | 390,600 | | | 709,248 |
Resorts World Bhd. | | Hotels Restaurants & Leisure | | 2,046,000 | | | 5,384,211 |
SIME Darby Bhd. | | Industrial Conglomerates | | 2,054,500 | | | 3,243,947 |
Tanjong PLC | | Hotels Restaurants & Leisure | | 241,000 | | | 894,237 |
YTL Corp. Bhd. | | Electric Utilities | | 1,061,000 | | | 1,493,776 |
YTL Power International Bhd. | | Water Utilities | | 2,483,400 | | | 1,176,347 |
| | | | | | |
|
|
| | | | | | | | 12,901,766 |
| | | | | | |
|
|
Mexico 3.3% | | | | | | | |
Fomento Economico Mexicano SA de CV Femsa, ADR | | Beverages | | 140,600 | | | 7,396,966 |
Kimberly Clark de Mexico SA de CV, A | | Household Products | | 4,538,033 | | | 15,690,550 |
Telefonos de Mexico SA de CV (Telmex), L, ADR | | Diversified Telecommunication Services | | 99,982 | | | 3,831,310 |
| | | | | | |
|
|
| | | | | | | | 26,918,826 |
| | | | | | |
|
|
Philippines .6% | | | | | | | |
San Miguel Corp., B | | Beverages | | 3,892,630 | | | 5,201,733 |
| | | | | | |
|
|
Poland 3.5% | | | | | | | |
Polski Koncern Naftowy Orlen SA | | Oil & Gas | | 825,929 | | | 10,363,524 |
Telekomunikacja Polska SA | | Diversified Telecommunication Services | | 2,736,600 | | | 17,986,616 |
| | | | | | |
|
|
| | | | | | | | 28,350,140 |
| | | | | | |
|
|
TD-12
FRANKLIN TEMPLETON VARIABLE INSURANCE PRODUCTS TRUST
TEMPLETON DEVELOPING MARKETS SECURITIES FUND
Statement of Investments, December 31, 2004 (cont.)
| | | | | | | |
| | | INDUSTRY | | SHARES/
RIGHTS | | VALUE |
Long Term Investments (cont.) | | | | | | | |
Russia .8% | | | | | | | |
bLukoil Holdings, ADR | | Oil & Gas | | 52,307 | | $ | 6,350,070 |
| | | | | | |
|
|
Singapore 6.0% | | | | | | | |
Comfortdelgro Corp. Ltd. | | Road & Rail | | 4,474,000 | | | 4,248,422 |
Dairy Farm International Holdings Ltd. | | Food & Staples Retailing | | 1,132,933 | | | 2,741,698 |
Fraser & Neave Ltd. | | Beverages | | 1,233,681 | | | 12,319,427 |
Keppel Corp. Ltd. | | Industrial Conglomerates | | 2,182,600 | | | 11,499,332 |
Singapore Press Holdings Ltd. | | Media | | 1,179,000 | | | 3,322,551 |
Singapore Technologies Engineering Ltd. | | Aerospace & Defense | | 2,988,000 | | | 4,265,172 |
Singapore Telecommunications Ltd. | | Diversified Telecommunication Services | | 6,052,428 | | | 8,824,835 |
aSuntec Real Estate Investment Trust | | Real Estate | | 1,252,000 | | | 851,388 |
| | | | | | |
|
|
| | | | | | | | 48,072,825 |
| | | | | | |
|
|
South Africa 10.5% | | | | | | | |
Anglo American PLC | | Metals & Mining | | 731,130 | | | 17,229,630 |
Liberty Group Ltd. | | Insurance | | 65,491 | | | 769,938 |
Nedcor Ltd. | | Commercial Banks | | 450,759 | | | 6,190,477 |
Nedcor Ltd., 144A | | Commercial Banks | | 63,958 | | | 878,364 |
Old Mutual PLC | | Insurance | | 4,501,298 | | | 11,448,078 |
Remgro Ltd. | | Diversified Financial Services | | 1,043,070 | | | 17,374,066 |
SABMiller PLC | | Beverages | | 1,016,424 | | | 17,125,803 |
Sappi Ltd. | | Paper & Forest Products | | 401,900 | | | 5,888,385 |
Sasol Ltd. | | Oil & Gas | | 357,400 | | | 7,633,786 |
| | | | | | |
|
|
| | | | | | | | 84,538,527 |
| | | | | | |
|
|
South Korea 17.4% | | | | | | | |
CJ Corp. | | Food Products | | 105,070 | | | 7,186,009 |
Daewoo Shipbuilding & Marine Engineering Co. Ltd. | | Machinery | | 791,700 | | | 11,777,608 |
Hite Brewery Co. Ltd. | | Beverages | | 87,140 | | | 7,197,131 |
Hyundai Development Co. | | Construction & Engineering | | 463,300 | | | 7,384,515 |
Kangwon Land Inc. | | Hotels Restaurants & Leisure | | 784,165 | | | 10,188,388 |
Kia Motors Corp. | | Automobiles | | 309,230 | | | 3,255,996 |
Korea Gas Corp. | | Gas Utilities | | 89,600 | | | 2,778,362 |
LG Chem Ltd. | | Chemicals | | 195,940 | | | 7,807,694 |
LG Electronics Inc. | | Household Durables | | 125,930 | | | 7,797,636 |
LG Household & Health Care Ltd. | | Household Products | | 94,760 | | | 2,512,715 |
LG International Corp. | | Trading Companies & Distributors | | 325,440 | | | 2,530,711 |
LG Petrochemical Co. Ltd. | | Chemicals | | 146,810 | | | 3,687,268 |
POSCO | | Metals & Mining | | 40,480 | | | 7,312,365 |
Samsung Electronics Co. Ltd. | | Semiconductors & Semiconductor Equipment | | 83,368 | | | 36,280,220 |
Samsung Fine Chemicals Co. Ltd. | | Chemicals | | 221,490 | | | 3,808,464 |
Samsung Heavy Industries Co. Ltd. | | Machinery | | 1,757,220 | | | 10,965,650 |
SK Corp. | | Oil & Gas | | 33,410 | | | 1,836,388 |
SK Telecom Co. Ltd. | | Wireless Telecommunication Services | | 31,730 | | | 6,038,263 |
| | | | | | |
|
|
| | | | | | | | 140,345,383 |
| | | | | | |
|
|
Sweden .5% | | | | | | | |
aOriflame Cosmetics, IDR | | Personal Products | | 170,000 | | | 3,940,575 |
| | | | | | |
|
|
Taiwan 13.2% | | | | | | | |
Acer Inc. | | Computers & Peripherals | | 3,583,254 | | | 5,917,610 |
Chunghwa Telecom Co. Ltd. | | Diversified Telecommunication Services | | 3,162,000 | | | 6,216,577 |
TD-13
FRANKLIN TEMPLETON VARIABLE INSURANCE PRODUCTS TRUST
TEMPLETON DEVELOPING MARKETS SECURITIES FUND
Statement of Investments, December 31, 2004 (cont.)
| | | | | | | |
| | | INDUSTRY | | SHARES/
RIGHTS | | VALUE |
Long Term Investments (cont.) | | | | | | | |
Taiwan (cont.) | | | | | | | |
D-Link Corp. | | Communications Equipment | | 4,066,787 | | $ | 4,733,285 |
Delta Electronics Inc. | | Electronic Equipment & Instruments | | 5,127,467 | | | 9,032,342 |
Elan Microelectronics Corp. | | Semiconductors & Semiconductor Equipment | | 2,725,776 | | | 1,534,803 |
Kinpo Electronics Inc. | | Office Electronics | | 2,453,200 | | | 1,068,789 |
Lite-on Technology Corp. | | Computers & Peripherals | | 6,440,700 | | | 6,868,189 |
MediaTek Inc. | | Semiconductors & Semiconductor Equipment | | 1,098,000 | | | 7,460,459 |
Mega Financial Holdings Co. Ltd. | | Commercial Banks | | 9,866,503 | | | 6,796,993 |
Premier Image Technology Corp. | | Leisure Equipment & Products | | 1,819,000 | | | 1,790,963 |
President Chain Store Corp. | | Food & Staples Retailing | | 2,986,144 | | | 4,790,605 |
Siliconware Precision Industries Co. Ltd. | | Semiconductors & Semiconductor Equipment | | 5,247,000 | | | 4,324,360 |
Sunplus Technology Co. Ltd. | | Semiconductors & Semiconductor Equipment | | 4,629,100 | | | 6,494,428 |
Synnex Technology International Corp. | | Electronic Equipment & Instruments | | 742,600 | | | 1,095,563 |
Taiwan Cellular Corp. | | Wireless Telecommunication Services | | 12,155,302 | | | 13,573,867 |
Taiwan Semiconductor Manufacturing Co. | | Semiconductors & Semiconductor Equipment | | 7,669,000 | | | 12,182,589 |
UNI-President Enterprises Corp. | | Food Products | | 13,577,600 | | | 7,089,908 |
Yuanta Core Pacific Securities Co. | | Capital Markets | | 7,065,978 | | | 5,356,718 |
| | | | | | |
|
|
| | | | | | | | 106,328,048 |
| | | | | | |
|
|
Thailand 1.8% | | | | | | | |
BEC World Public Co. Ltd., fgn. | | Media | | 7,730,700 | | | 3,122,189 |
aKasikornbank Public Co. Ltd., fgn. | | Commercial Banks | | 3,074,800 | | | 4,429,408 |
Land and House Public Co. Ltd., fgn. | | Real Estate | | 3,624,700 | | | 1,053,638 |
Shin Corp. Public Co. Ltd., fgn. | | Wireless Telecommunication Services | | 1,176,900 | | | 1,203,421 |
Siam Cement Public Co. Ltd., fgn. | | Construction Materials | | 177,100 | | | 1,257,385 |
Thai Airways International Public Co. Ltd., fgn. | | Airlines | | 130,000 | | | 162,191 |
aThai Military Bank Public Co. Ltd., fgn. | | Commercial Banks | | 32,522,400 | | | 3,145,656 |
aTrue Corp., PLC, rts., 3/28/08 | | Diversified Telecommunication Services | | 344,616 | | | — |
| | | | | | |
|
|
| | | | | | | | 14,373,888 |
| | | | | | |
|
|
Turkey 3.5% | | | | | | | |
aArcelik AS, Br. | | Household Durables | | 1,048,826,400 | | | 6,416,624 |
Migros Turk TAS | | Food & Staples Retailing | | 933,539,500 | | | 7,753,536 |
Tupras-Turkiye Petrol Rafineleri AS | | Oil & Gas | | 657,260,000 | | | 6,677,391 |
aTurk Hava Yollari Anonim Ortakligi (THY), 144A | | Airlines | | 188,012,000 | | | 1,108,413 |
Turkiye Is Bankasi AS, C | | Commercial Banks | | 1,143,234,000 | | | 6,315,976 |
| | | | | | |
|
|
| | | | | | | | 28,271,940 |
| | | | | | |
|
|
United Kingdom 1.7% | | | | | | | |
HSBC Holdings PLC | | Commercial Banks | | 543,656 | | | 9,302,471 |
Provident Financial PLC | | Consumer Finance | | 328,500 | | | 4,237,245 |
| | | | | | |
|
|
| | | | | | | | 13,539,716 |
| | | | | | |
|
|
Total Long Term Investments (Cost $573,199,966) | | | | | | | 787,065,677 |
| | | | | | |
|
|
TD-14
FRANKLIN TEMPLETON VARIABLE INSURANCE PRODUCTS TRUST
TEMPLETON DEVELOPING MARKETS SECURITIES FUND
Statement of Investments, December 31, 2004 (cont.)
| | | | | | |
| | | PRINCIPAL
AMOUNT | | VALUE | |
Short Term Investments (Cost $22,458,325) 2.9% | | | | | | |
U.S. Government and Agency Securities | | | | | | |
cU.S. Treasury Bills, 1/06/05 – 3/31/05 | | $22,506,000 | | $ | 22,463,389 | |
| | | | |
|
|
|
Total Investments (Cost $595,658,291) 100.6% | | | | | 809,529,066 | |
Other Assets, less Liabilities (.6)% | | | | | (4,658,286 | ) |
| | | | |
|
|
|
Net Assets 100.0% | | | | $ | 804,870,780 | |
| | | | |
|
|
|
Portfolio Abbreviations
ADR - American Depository Receipt
GDR - Global Depository Receipt
IDR - International Depository Receipt
| b | See Note 7 regarding other considerations. |
| c | Security is traded on a discount basis with no stated coupon rate. |
See notes to financial statements.
TD-15
FRANKLIN TEMPLETON VARIABLE INSURANCE PRODUCTS TRUST
TEMPLETON DEVELOPING MARKETS SECURITIES FUND
Financial Statements
Statement of Assets and Liabilities
December 31, 2004
| | | | |
Assets: | | | | |
Investments in securities: | | | | |
Cost | | $ | 595,658,291 | |
| | |
|
|
|
Value | | | 809,529,066 | |
Cash | | | 8,216 | |
Foreign currency, at value (cost $513,194) | | | 524,635 | |
Receivables: | | | | |
Investment securities sold | | | 89,395 | |
Capital shares sold | | | 811,182 | |
Dividends | | | 926,376 | |
Foreign income tax receivable | | | 159,393 | |
| | |
|
|
|
Total assets | | | 812,048,263 | |
| | |
|
|
|
Liabilities: | | | | |
Payables: | | | | |
Investment securities purchased | | | 4,731,476 | |
Capital shares redeemed | | | 886,683 | |
Affiliates | | | 974,994 | |
Deferred tax liability | | | 441,892 | |
Other liabilities | | | 142,438 | |
| | |
|
|
|
Total liabilities | | | 7,177,483 | |
| | |
|
|
|
Net assets, at value | | $ | 804,870,780 | |
| | |
|
|
|
Net assets consist of: | | | | |
Undistributed net investment income | | $ | 1,637,611 | |
Net unrealized appreciation (depreciation) | | | 213,443,902 | |
Accumulated net realized gain (loss) | | | (147,539,841 | ) |
Capital shares | | | 737,329,108 | |
| | |
|
|
|
Net assets, at value | | $ | 804,870,780 | |
| | |
|
|
|
Class 1: | | | | |
Net assets, at value | | $ | 477,289,957 | |
| | |
|
|
|
Shares outstanding | | | 54,653,947 | |
| | |
|
|
|
Net asset value and offering price per share | | $ | 8.73 | |
| | |
|
|
|
Class 2: | | | | |
Net assets, at value | | $ | 327,568,647 | |
| | |
|
|
|
Shares outstanding | | | 37,791,471 | |
| | |
|
|
|
Net asset value and offering price per share | | $ | 8.67 | |
| | |
|
|
|
Class 3: | | | | |
Net assets, at value | | $ | 12,176 | |
| | |
|
|
|
Shares outstanding | | | 1,403 | |
| | |
|
|
|
Net asset value and offering price per sharea | | $ | 8.68 | |
| | |
|
|
|
| a | Redemption price is equal to net asset value less any redemption fees retained by the Fund. |
See notes to financial statements.
TD-16
FRANKLIN TEMPLETON VARIABLE INSURANCE PRODUCTS TRUST
TEMPLETON DEVELOPING MARKETS SECURITIES FUND
Financial Statements (continued)
Statement of Operations
for the year ended December 31, 2004
| | | | |
Investment income: | | | | |
Dividends (net of foreign taxes of $2,118,707) | | $ | 18,874,239 | |
Interest | | | 357,121 | |
| | |
|
|
|
Total investment income | | | 19,231,360 | |
| | |
|
|
|
Expenses: | | | | |
Management fees (Note 3) | | | 7,848,740 | |
Administrative fees (Note 3) | | | 874,723 | |
Distribution fees - Class 2 (Note 3) | | | 579,458 | |
Transfer agent fees | | | 10,778 | |
Custodian fees (Note 4) | | | 635,519 | |
Reports to shareholders | | | 234,051 | |
Professional fees | | | 71,409 | |
Trustees’ fees and expenses | | | 3,753 | |
Other | | | 26,158 | |
| | |
|
|
|
Total expenses | | | 10,284,589 | |
Expense reductions (Note 4) | | | (1,831 | ) |
| | |
|
|
|
Net expenses | | | 10,282,758 | |
| | |
|
|
|
Net investment income | | | 8,948,602 | |
| | |
|
|
|
Realized and unrealized gains (losses): | | | | |
Net realized gain (loss) from: | | | | |
Investments (net of foreign taxes of $2,007,158) | | | 51,038,207 | |
Foreign currency transactions | | | (577,452 | ) |
| | |
|
|
|
Net realized gain (loss) | | | 50,460,755 | |
| | |
|
|
|
Net change in unrealized appreciation (depreciation) on: | | | | |
Investments | | | 89,187,217 | |
Translation of assets and liabilities denominated in foreign currencies | | | 34,734 | |
Deferred taxes | | | 1,472,777 | |
| | |
|
|
|
Net change in unrealized appreciation (depreciation) | | | 90,694,728 | |
| | |
|
|
|
Net realized and unrealized gain (loss) | | | 141,155,483 | |
| | |
|
|
|
Net increase (decrease) in net assets resulting from operations | | $ | 150,104,085 | |
| | |
|
|
|
See notes to financial statements.
TD-17
FRANKLIN TEMPLETON VARIABLE INSURANCE PRODUCTS TRUST
TEMPLETON DEVELOPING MARKETS SECURITIES FUND
Financial Statements (continued)
Statements of Changes in Net Assets
for the years ended December 31, 2004 and 2003
| | | | | | | | |
| | | 2004 | | | 2003 | |
| | |
| |
Increase (decrease) in net assets: | | | | | | | | |
Operations: | | | | | | | | |
Net investment income | | $ | 8,948,602 | | | $ | 8,383,604 | |
Net realized gain (loss) from investments and foreign currency transactions | | | 50,460,755 | | | | 18,835,829 | |
Net change in unrealized appreciation (depreciation) on investments, translation of assets and liabilities denominated in foreign currencies, and deferred taxes | | | 90,694,728 | | | | 141,314,261 | |
| | |
|
|
|
Net increase (decrease) in net assets resulting from operations | | | 150,104,085 | | | | 168,533,694 | |
Distributions to shareholders from: | | | | | | | | |
Net investment income: | | | | | | | | |
Class 1 | | | (7,597,672 | ) | | | (3,521,009 | ) |
Class 2 | | | (4,066,275 | ) | | | (1,068,523 | ) |
Class 3 | | | (190 | ) | | | — | |
| | |
| |
Total distributions to shareholders | | | (11,664,137 | ) | | | (4,589,532 | ) |
Capital share transactions: (Note 2) | | | | | | | | |
Class 1 | | | 32,499,304 | | | | 18,051,739 | |
Class 2 | | | 103,669,110 | | | | 41,851,167 | |
Class 3 | | | 10,000 | | | | — | |
| | |
| |
Total capital share transactions | | | 136,178,414 | | | | 59,902,906 | |
Net increase (decrease) in net assets | | | 274,618,362 | | | | 223,847,068 | |
Net assets: | | | | | | | | |
Beginning of year | | | 530,252,418 | | | | 306,405,350 | |
| | |
| |
End of year | | $ | 804,870,780 | | | $ | 530,252,418 | |
| | |
|
|
|
Undistributed net investment income included in net assets: | | | | | | | | |
End of year | | $ | 1,637,611 | | | $ | 5,951,933 | |
| | |
|
|
|
See notes to financial statements.
TD-18
FRANKLIN TEMPLETON VARIABLE INSURANCE PRODUCTS TRUST
TEMPLETON DEVELOPING MARKETS SECURITIES FUND
Notes to Financial Statements
1. ORGANIZATION AND SIGNIFICANT ACCOUNTING POLICIES
Franklin Templeton Variable Insurance Products Trust (the Trust) is registered under the Investment Company Act of 1940 as an open-end investment company, consisting of twenty-one separate series (the Funds). The Templeton Developing Markets Securities Fund (the Fund) included in this report is diversified. The financial statements of the remaining funds in the series are presented separately. Shares of the Fund are sold only to insurance company separate accounts to fund the benefits of variable life insurance policies or variable annuity contracts. The Fund’s investment objective is capital growth.
The following summarizes the Fund’s significant accounting policies.
a. Security Valuation
Securities listed on a securities exchange or on the NASDAQ National Market System are valued at the last quoted sale price or the official closing price of the day, respectively. Over-the-counter securities and listed securities for which there is no reported sale are valued within the range of the most recent quoted bid and ask prices. Securities that trade in multiple markets or on multiple exchanges are valued according to the broadest and most representative market.
U.S. Government securities generally trade in the over-the-counter market rather than on a securities exchange. The Fund may utilize independent pricing services, quotations from bond dealers, and information with respect to bond and note transactions, to assist in determining a current market value for each security. The Fund’s pricing services may use valuation models or matrix pricing which considers information with respect to comparable bond and note transactions, quotations from bond dealers, or by reference to other securities that are considered comparable in such characteristics as rating, interest rate and maturity date, option adjusted spread models, prepayment projections, interest rate spreads and yield curves, to determine current value.
Foreign securities are valued as of the close of trading on the foreign stock exchange on which the security is primarily traded, or the NYSE, whichever is earlier. The value is then converted into its U.S. dollar equivalent at the foreign exchange rate in effect at the close of the NYSE on the day that the value of the foreign security is determined. If no sale is reported at that time, the foreign security will be valued within the range of the most recent quoted bid and ask prices.
The Trust has procedures to determine the fair value of individual securities and other assets for which market prices are not readily available or which may not be reliably priced. Some methods for valuing these securities may include: fundamental analysis, matrix pricing, discounts from market prices of similar securities, or discounts applied due to the nature and duration of restrictions on the disposition of the securities. Occasionally, events occur between the time at which trading in a security is completed and the close of the NYSE that might call into question the availability (including the reliability) of the value of a portfolio security held by the Fund. If such an event occurs, the securities may be valued using fair value procedures, which may include the use of independent pricing services. All security valuation procedures are approved by the Fund’s Board of Trustees.
b. Foreign Currency Translation
Portfolio securities and other assets and liabilities denominated in foreign currencies are translated into U.S. dollars based on the exchange rate of such currencies against U.S. dollars on the date of valuation. Purchases and sales of securities, income and expense items denominated in foreign currencies are translated into U.S. dollars at the exchange rate in effect on the transaction date. Occasionally, events may impact the availability or reliability of foreign exchange rates used to convert the U.S. dollar equivalent value. If such an event occurs, the foreign exchange rate will be valued at fair value using procedures established and approved by the Fund’s Board of Trustees.
The Fund does not separately report the effect of changes in foreign exchange rates from changes in market prices on securities held. Such changes are included in net realized and unrealized gain or loss from investments on the Statement of Operations.
Realized foreign exchange gains or losses arise from sales of foreign currencies, currency gains or losses realized between the trade and settlement dates on securities transactions and the difference between the recorded amounts of dividends, interest, and
TD-19
FRANKLIN TEMPLETON VARIABLE INSURANCE PRODUCTS TRUST
TEMPLETON DEVELOPING MARKETS SECURITIES FUND
Notes to Financial Statements (continued)
1. ORGANIZATION AND SIGNIFICANT ACCOUNTING POLICIES (cont.)
b. Foreign Currency Translation (continued)
foreign withholding taxes and the U.S. dollar equivalent of the amounts actually received or paid. Net unrealized foreign exchange gains and losses arise from changes in foreign exchange rates on foreign denominated assets and liabilities other than investments in securities held at the end of the reporting period.
c. Foreign Currency Contracts
When the Fund purchases or sells foreign securities it may enter into foreign exchange contracts to minimize foreign exchange risk from the trade date to the settlement date of the transactions. A foreign exchange contract is an agreement between two parties to exchange different currencies at an agreed upon exchange rate on a specified date. Realized and unrealized gains and losses on these contracts are included in the Statement of Operations.
The risks of these contracts include movement in the values of the foreign currencies relative to the U.S. dollar and the possible inability of the counterparties to fulfill their obligations under the contracts.
d. Income and Deferred Taxes
No provision has been made for U.S. income taxes because the Fund’s policy is to qualify as a regulated investment company under Subchapter M of the Internal Revenue Code and to distribute substantially all of its taxable income. Fund distributions to shareholders are determined on an income tax basis and may differ from net investment income and realized gains for financial reporting purposes.
The Fund is subject to a tax imposed on net realized gains of securities of certain foreign countries. The Fund records an estimated deferred tax liability for net unrealized gains on these securities as reflected in the accompanying financial statements.
e. Security Transactions, Investment Income, Expenses and Distributions
Security transactions are accounted for on trade date. Realized gains and losses on security transactions are determined on a specific identification basis. Interest income and estimated expenses are accrued daily. Discounts and premiums on securities purchased are amortized over the lives of the respective securities. Dividend income and distributions to shareholders are recorded on the ex-dividend date.
Common expenses incurred by the Trust are allocated among the Funds based on the ratio of net assets of each fund to the combined net assets. Other expenses are charged to each fund on a specific identification basis.
Realized and unrealized gains and losses and net investment income, other than class specific expenses, are allocated daily to each class of shares based upon the relative proportion of net assets of each class.
f. Accounting Estimates
The preparation of financial statements in accordance with accounting principles generally accepted in the United States of America requires management to make estimates and assumptions that affect the reported amounts of assets and liabilities at the date of the financial statements and the amounts of income and expenses during the reporting period. Actual results could differ from those estimates.
TD-20
FRANKLIN TEMPLETON VARIABLE INSURANCE PRODUCTS TRUST
TEMPLETON DEVELOPING MARKETS SECURITIES FUND
Notes to Financial Statements (continued)
1. ORGANIZATION AND SIGNIFICANT ACCOUNTING POLICIES (cont.)
g. Redemption Fees
Redemptions and exchanges of Class 3 shares held 60 days or less may be subject to the Fund’s redemption fee, which is 1% of the amount redeemed. Such fees are retained by the Fund and accounted for as additional paid-in capital. There were no redemption fees for the year.
h. Guarantees and Indemnifications
Under the Trust’s organizational documents, its officers and trustees are indemnified by the Trust against certain liability arising out of the performance of their duties to the Trust. Additionally, in the normal course of business, the Trust enters into contracts with service providers that contain general indemnification clauses. The Trust’s maximum exposure under these arrangements is unknown as this would involve future claims that may be made against the Trust that have not yet occurred. However, based on experience, the Trust expects the risk of loss to be remote.
2. SHARES OF BENEFICIAL INTEREST
The Fund offers three classes of shares: Class 1 Class 2, and Class 3. Effective May 1, 2004 the Fund began offering a new class of shares, Class 3. Each class of shares differs by its distribution fees, voting rights on matters affecting a single class and its exchange privilege.
At December 31, 2004, there were an unlimited number of shares authorized ($.01 par value). Transactions in the Fund’s shares were as follows:
| | | | | | | | | | | | | | |
| | | Year Ended December 31,
| |
| | | 2004
| | | 2003
| |
| Class 1 Shares: | | Shares
| | | Amount
| | | Shares
| | | Amount
| |
Shares sold | | 8,940,486 | | | $ | 67,520,469 | | | 10,436,573 | | | $ | 60,506,599 | |
Shares issued in reinvestment of distributions | | 1,105,920 | | | | 7,597,672 | | | 652,039 | | | | 3,521,009 | |
Shares redeemed | | (5,740,464 | ) | | | (42,618,837 | ) | | (8,573,395 | ) | | | (45,975,869 | ) |
| | |
| |
Net increase (decrease) | | 4,305,942 | | | $ | 32,499,304 | | | 2,515,217 | | | $ | 18,051,739 | |
| | |
| |
| Class 2 Shares: | | | | | | | | | | | | |
Shares sold | | 21,331,545 | | | $ | 159,905,301 | | | 30,181,277 | | | $ | 163,641,071 | |
Shares issued in reinvestment of distributions | | 595,355 | | | | 4,066,275 | | | 198,398 | | | | 1,068,523 | |
Shares redeemed | | (8,236,506 | ) | | | (60,302,466 | ) | | (23,541,038 | ) | | | (122,858,427 | ) |
| | |
| |
Net increase (decrease) | | 13,690,394 | | | $ | 103,669,110 | | | 6,838,637 | | | $ | 41,851,167 | |
| | |
| |
| Class 3 Shares: | | | | | | | | | | | | |
Shares sold | | 1,403 | | | $ | 10,000 | | | | | | | | |
| | |
| | | | | | | |
Net increase (decrease) | | 1,403 | | | $ | 10,000 | | | | | | | | |
| | |
| | | | | | | |
3. TRANSACTIONS WITH AFFILIATES
Certain officers and trustees of the Fund are also officers and/or directors of the following entities:
| | |
| Entity | | Affiliation |
Templeton Asset Management Ltd. (TAML) | | Investment manager |
Franklin Templeton Services LLC (FT Services) | | Administrative manager |
Franklin Templeton Distributors Inc. (Distributors) | | Principal underwriter |
Franklin Templeton Investor Services LLC (Investor Services) | | Transfer agent |
TD-21
FRANKLIN TEMPLETON VARIABLE INSURANCE PRODUCTS TRUST
TEMPLETON DEVELOPING MARKETS SECURITIES FUND
Notes to Financial Statements (continued)
3. TRANSACTIONS WITH AFFILIATES (cont.)
a. Management Fees
The Fund pays an investment management fee to TAML of 1.25% per year of the average daily net assets of the Fund.
b. Administrative Fees
The Fund pays an administrative fee to FT Services based on the average daily net assets of the Fund as follows:
| | |
| Annualized Fee Rate | | Net Assets |
| .150% | | First $200 million |
| .135% | | Over $200 million, up to and including $700 million |
| .100% | | Over $700 million, up to and including $1.2 billion |
Fees are further reduced on net assets over $1.2 billion.
c. Distribution Fees
The Fund reimburses Distributors up to .25% per year of its average daily net assets of Class 2 and Class 3, for costs incurred in marketing the Fund’s shares under a Rule 12b-1 plan. No payments were made by Class 3 for the period ended December 31, 2004.
d. Transfer Agent Fees
Investor Services, under terms of an agreement, performs shareholder servicing for the Fund and is not paid by the Fund for the services.
e. Other Affiliated Transactions
At December 31, 2004, Franklin Advisers Inc. owned 100% of Class 3.
4. EXPENSE OFFSET ARRANGEMENT
The Fund has entered into an arrangement with its custodian whereby credits realized as a result of uninvested cash balances are used to reduce a portion of the Fund’s custodian expenses. During the year ended December 31, 2004, the custodian fees were reduced as noted in the Statement of Operations.
5. INCOME TAXES
At December 31, 2004, the Fund had tax basis capital losses which may be carried over to offset future capital gains. Such losses expire as follows:
| | | |
Capital loss carryovers expiring in: | | | |
2007 | | $ | 58,738,810 |
2009 | | | 62,323,035 |
2010 | | | 24,246,197 |
| | |
|
|
| | | $ | 145,308,042 |
| | |
|
|
TD-22
FRANKLIN TEMPLETON VARIABLE INSURANCE PRODUCTS TRUST
TEMPLETON DEVELOPING MARKETS SECURITIES FUND
Notes to Financial Statements (continued)
5. INCOME TAXES (cont.)
At December 31, 2004, the Fund had deferred capital and currency losses occurring subsequent to October 31, 2004 of $650,185 and $142,382, respectively. For tax purposes, such losses will be reflected in the year ending December 31, 2005.
The tax character of distributions paid during the years ended December 31, 2004 and 2003, was as follows:
| | | | | | |
| | | 2004
| | 2003
|
Distributions paid from ordinary income | | $ | 11,664,137 | | $ | 4,589,532 |
| | |
|
Net investment income (loss) differs for financial statement and tax purposes primarily due to differing treatments of foreign currency transactions and passive foreign investment company shares.
Net realized gains (losses) differ for financial statement and tax purposes primarily due to differing treatments of wash sales, foreign currency transactions and passive foreign investment company shares.
At December 31, 2004, the cost of investments, net unrealized appreciation (depreciation), and undistributed ordinary income for income tax purposes were as follows:
| | | | |
Cost of investments | | $ | 607,326,405 | |
| | |
|
|
|
Unrealized appreciation | | $ | 206,582,379 | |
Unrealized depreciation | | | (4,379,718 | ) |
| | |
|
|
|
Net unrealized appreciation (depreciation) | | $ | 202,202,661 | |
| | |
|
|
|
Distributable earnings - undistributed ordinary income | | $ | 11,866,491 | |
| | |
|
|
|
6. INVESTMENT TRANSACTIONS
Purchases and sales of investments (excluding short-term securities) for the year ended December 31, 2004, aggregated $480,021,270 and $335,018,988, respectively.
7. OTHER CONSIDERATIONS
TAML, as the Fund’s Manager, may serve as a member on the board of directors of certain companies in which the Fund invests and/or may represent the Fund in certain corporate negotiations. At December 31, 2004, the Manager serves in one or more of these capacities for Lukoil Holdings. As a result of this involvement, the Manager may be in possession of certain material non-public information which, pursuant to the Fund’s policies and the requirements of the federal securities laws, could prevent the Fund from trading in the securities of such companies for limited or extended periods of time.
8. REGULATORY MATTERS
Investigations
As part of various investigations by a number of federal, state, and foreign regulators and governmental entities, including the Securities and Exchange Commission (“SEC”), the California Attorney General’s Office (“CAGO”), and the National Association of Securities Dealers, Inc. (“NASD”), relating to certain practices in the mutual fund industry, including late trading, market timing and marketing support payments to securities dealers who sell fund shares, Franklin Resources, Inc. and certain of its subsidiaries (as used in this section, together, the “Company”), as well as certain current or former executives and employees of the Company, received subpoenas and/or requests for documents, information and/or testimony. The Company and its current employees provided documents and information in response to those requests and subpoenas.
TD-23
FRANKLIN TEMPLETON VARIABLE INSURANCE PRODUCTS TRUST
TEMPLETON DEVELOPING MARKETS SECURITIES FUND
Notes to Financial Statements (continued)
8. REGULATORY MATTERS (cont.)
Settlements
Beginning in August 2004, the Company entered into settlements with certain regulators investigating the mutual fund industry practices noted above. The Company believes that settlement of each of the matters described in this section is in the best interest of the Company and shareholders of the Franklin, Templeton, and Mutual Series mutual funds (the “funds”).
On August 2, 2004, Franklin Resources, Inc. announced that its subsidiary, Franklin Advisers, Inc., reached an agreement with the SEC that resolved the issues resulting from the SEC investigation into market timing activity. In connection with that agreement, the SEC issued an “Order Instituting Administrative and Cease-and-Desist Proceedings Pursuant to Sections 203(e) and 203(k) of the Investment Advisers Act of 1940 and Sections 9(b) and 9(f) of the Investment Company Act of 1940, Making Findings and Imposing Remedial Sanctions and a Cease-and-Desist Order” (the “Order”). The SEC’s Order concerned the activities of a limited number of third parties that ended in 2000 and those that were the subject of the first Massachusetts administrative complaint described below.
Under the terms of the SEC’s Order, pursuant to which Franklin Advisers, Inc. neither admitted nor denied any of the findings contained therein, Franklin Advisers, Inc. agreed to pay $50 million, of which $20 million is a civil penalty, to be distributed to shareholders of certain funds in accordance with a plan to be developed by an independent distribution consultant. At this time, it is unclear which funds or which shareholders of any particular fund will receive distributions. The Order also required Franklin Advisers, Inc. to, among other things, enhance and periodically review compliance policies and procedures.
On September 20, 2004, Franklin Resources, Inc. announced that two of its subsidiaries, Franklin Advisers, Inc. and Franklin Templeton Alternative Strategies, Inc. (“FTAS”), reached an agreement with the Securities Division of the Office of the Secretary of the Commonwealth of Massachusetts (the “State of Massachusetts”) related to its administrative complaint filed on February 4, 2004, concerning one instance of market timing that was also a subject of the August 2, 2004 settlement that Franklin Advisers, Inc. reached with the SEC, as described above.
Under the terms of the settlement consent order issued by the State of Massachusetts, Franklin Advisers, Inc. and FTAS consented to the entry of a cease-and-desist order and agreed to pay a $5 million administrative fine to the State of Massachusetts (the “Massachusetts Consent Order”). The Massachusetts Consent Order included two different sections: “Statements of Fact” and “Violations of Massachusetts Securities Laws.” Franklin Advisers, Inc. and FTAS admitted the facts in the Statements of Fact.
On October 25, 2004, the State of Massachusetts filed a second administrative complaint, alleging that Franklin Resources, Inc.’s Form 8-K filing (in which it described the Massachusetts Consent Order and stated that “Franklin did not admit or deny engaging in any wrongdoing”) failed to state that Franklin Advisers, Inc. and FTAS admitted the Statements of Fact portion of the Massachusetts Consent Order (the “Second Complaint”). Franklin Resources, Inc. reached a second agreement with the State of Massachusetts on November 19, 2004, resolving the Second Complaint. As a result of the November 19, 2004 settlement, Franklin Resources, Inc. filed a new Form 8-K. The terms of the Massachusetts Consent Order did not change and there was no monetary fine associated with this second settlement.
On November 17, 2004, Franklin Resources, Inc. announced that Franklin/Templeton Distributors, Inc. (“FTDI”) reached an agreement with the CAGO, resolving the issues resulting from the CAGO’s investigation concerning sales and marketing support payments. Under the terms of the settlement, FTDI neither admitted nor denied the allegations in the CAGO’s complaint and agreed to pay $2 million to the State of California as a civil penalty, $14 million to the funds, to be allocated by an independent distribution consultant to be paid for by FTDI, and $2 million to the CAGO for its investigative costs.
On December 13, 2004, Franklin Resources, Inc. announced that its subsidiaries FTDI and Franklin Advisers, Inc. reached an agreement with the SEC, resolving the issues resulting from the SEC’s investigation concerning marketing support payments to securities dealers who sell fund shares. In connection with that agreement, the SEC issued an “Order Instituting Administrative and Cease-and-Desist Proceedings, Making Findings, and Imposing Remedial Sanctions Pursuant to Sections 203(e) and 203(k)
TD-24
FRANKLIN TEMPLETON VARIABLE INSURANCE PRODUCTS TRUST
TEMPLETON DEVELOPING MARKETS SECURITIES FUND
Notes to Financial Statements (continued)
8. REGULATORY MATTERS (cont.)
Settlements (cont.)
of the Investment Advisers Act of 1940, Sections 9(b) and 9(f) of the Investment Company Act of 1940, and Section 15(b) of the Securities Exchange Act of 1934” (the “Second Order”).
Under the terms of the Second Order, in which FTDI and Franklin Advisers, Inc. neither admitted nor denied the findings contained therein, they agreed to pay the funds a penalty of $20 million and disgorgement of $1 (one dollar). FTDI and Franklin Advisers, Inc. also agreed to implement certain measures and undertakings relating to marketing support payments to broker-dealers for the promotion or sale of fund shares, including making additional disclosures in the funds’ Prospectuses and Statements of Additional Information. The Second Order further requires the appointment of an independent distribution consultant, at the Company’s expense, who shall develop a plan for the distribution of the penalty and disgorgement to the funds.
Other Legal Proceedings
The Trust, in addition to the Company and other funds, and certain current and former officers, employees, and directors have been named in multiple lawsuits in different federal courts in Nevada, California, Illinois, New York and Florida, alleging violations of various federal securities laws and seeking, among other relief, monetary damages, restitution, removal of fund trustees, directors, advisers, administrators, and distributors, rescission of management contracts and 12b-1 Plans, and/or attorneys’ fees and costs. Specifically, the lawsuits claim breach of duty with respect to alleged arrangements to permit market timing and/or late trading activity, or breach of duty with respect to the valuation of the portfolio securities of certain Templeton funds managed by Franklin Resources, Inc. subsidiaries, resulting in alleged market timing activity. The majority of these lawsuits duplicate, in whole or in part, the allegations asserted in the February 4, 2004 Massachusetts administrative complaint and the findings in the SEC’s August 2, 2004 Order, as described above. The lawsuits are styled as class actions, or derivative actions on behalf of either the named funds or Franklin Resources, Inc.
In addition, the Company, as well as certain current and former officers, employees, and directors, have been named in multiple lawsuits alleging violations of various securities laws and pendent state law claims relating to the disclosure of directed brokerage payments and/or payment of allegedly excessive advisory, commission, and distribution fees, and seeking, among other relief, monetary damages, restitution, rescission of advisory contracts, including recovery of all fees paid pursuant to those contracts, an accounting of all monies paid to the named advisers, declaratory relief, injunctive relief, and/or attorneys’ fees and costs. These lawsuits are styled as class actions or derivative actions brought on behalf of certain funds.
The Company and fund management strongly believes that the claims made in each of the lawsuits identified above are without merit and intends to vigorously defend against them. The Company cannot predict with certainty, however, the eventual outcome of the remaining governmental investigations or private lawsuits, nor whether they will have a material negative impact on the Company. Public trust and confidence are critical to the Company’s business and any material loss of investor and/or client confidence could result in a significant decline in assets under management by the Company, which would have an adverse effect on the Company’s future financial results. If the Company finds that it bears responsibility for any unlawful or inappropriate conduct that caused losses to the Trust, it is committed to making the Trust or its shareholders whole, as appropriate. The Company is committed to taking all appropriate actions to protect the interests of its funds’ shareholders.
TD-25
FRANKLIN TEMPLETON VARIABLE INSURANCE PRODUCTS TRUST
TEMPLETON DEVELOPING MARKETS SECURITIES FUND
Report of Independent Registered Public Accounting Firm
To the Trustees and Shareholders of
Franklin Templeton Variable Insurance Products Trust
In our opinion, the accompanying statement of assets and liabilities, including the statement of investments, and the related statements of operations and of changes in net assets and the financial highlights present fairly, in all material respects, the financial position of Templeton Developing Markets Securities Fund (the Fund) (one of the funds constituting Franklin Templeton Variable Insurance Products Trust) at December 31, 2004, the results of its operations for the year then ended, the changes in its net assets for each of the two years in the period then ended and the financial highlights for each of the periods presented, in conformity with accounting principles generally accepted in the United States of America. These financial statements and financial highlights (hereafter referred to as “financial statements”) are the responsibility of the Fund’s management; our responsibility is to express an opinion on these financial statements based on our audits. We conducted our audits of these financial statements in accordance with the standards of the Public Company Accounting Oversight Board (United States). Those standards require that we plan and perform the audits to obtain reasonable assurance about whether the financial statements are free of material misstatement. An audit includes examining, on a test basis, evidence supporting the amounts and disclosures in the financial statements, assessing the accounting principles used and significant estimates made by management, and evaluating the overall financial statement presentation. We believe that our audits, which included confirmation of securities at December 31, 2004 by correspondence with the custodian and brokers, provide a reasonable basis for our opinion.
PricewaterhouseCoopers LLP
San Francisco, California
February 9, 2005
TD-26
FRANKLIN TEMPLETON VARIABLE INSURANCE PRODUCTS TRUST
TEMPLETON DEVELOPING MARKETS SECURITIES FUND
Tax Designation (unaudited)
At December 31, 2004, more than 50% of the Fund’s total assets were invested in securities of foreign issuers. In most instances, foreign taxes were withheld from dividends paid to the Fund on these investments. The Fund elects to treat foreign taxes paid under Section 853 of the Code. This election will allow shareholders of record in June 2005, to treat their proportionate share of foreign taxes paid by the Fund as having been paid directly by them. The shareholder shall consider these amounts as foreign taxes paid in the tax year in which they receive the Fund distribution.
The foreign tax information will be disclosed in the June 2005, semi-annual report of the Fund.
TD-27
TEMPLETON FOREIGN SECURITIES FUND
This annual report for Templeton Foreign Securities Fund covers the fiscal year ended December 31, 2004.
Performance Summary as of 12/31/04
Average annual total return of Class 2 shares* represents the average annual change in value, assuming reinvestment of dividends and capital gains. Average returns smooth out variations in returns, which can be significant; they are not the same as year-by-year results.
Periods ended 12/31/04
| | | | | | |
| | | 1-Year | | 5-Year | | 10-Year |
Average Annual Total Return | | +18.53% | | +0.92% | | +8.68% |
*Performance prior to the 5/1/00 merger reflects the historical performance of Templeton International Fund. Additionally, because Class 2 shares were not offered until 5/1/97, standardized Class 2 Fund performance for prior periods represents the historical results of Class 1 shares. For periods beginning on 5/1/97, Class 2’s results reflect an additional 12b-1 fee expense, which also affects future performance. Since 5/1/97 (effective date), the average annual total return of Class 2 shares was +5.79%.
Total Return Index Comparison for Hypothetical $10,000 Investment (1/1/95–12/31/04)
The graph below shows the change in value of a hypothetical $10,000 investment in the Fund over the indicated period and includes reinvestment of any income or distributions. The Fund’s performance* is compared to the performance of the Morgan Stanley Capital International (MSCI) Europe Australasia Far East (EAFE) Index. One cannot invest directly in an index, nor is an index representative of the Fund’s portfolio. Please see Important Notes to Performance Information preceding the Fund Summaries.
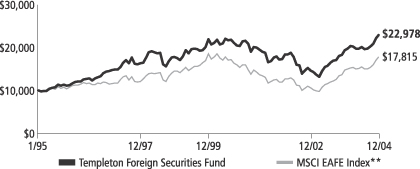
**Source: Standard & Poor’s Micropal. Please see Index Descriptions following the Fund Summaries.
Templeton Foreign Securities Fund – Class 2
Performance reflects the Fund’s Class 2 operating expenses, but does not include any contract fees, expenses or sales charges. If they had been included, performance would be lower. These charges and deductions, particularly for variable life policies, can have a significant effect on contract values and insurance benefits. See the contract prospectus for a complete description of these expenses, including sales charges.
Performance data quoted represent past performance, which does not guarantee future results. Investment return and principal value will fluctuate, and you may have a gain or loss when you sell your shares. Current performance may differ from figures shown.
TF-1
Fund Goal and Main Investments: Templeton Foreign Securities Fund seeks long-term capital growth. The Fund invests predominantly in investments of issuers located outside the U.S., including those in emerging markets.
Performance Overview
You can find the Fund’s total return in the Performance Summary. The Fund underperformed its benchmark, the MSCI EAFE Index, which returned 20.70% for the one-year period under review.1
Economic and Market Overview
The global economic recovery continued in 2004, led by growth in China and the U.S. As of December 31, 2004, U.S. gross domestic product (GDP) had increased for 13 consecutive quarters.2 In China, GDP grew 9.5% in 2004.3
The 12-nation euro zone lagged other regions in the current recovery. However, the European Central Bank projected euro zone growth may be between 1.6% and 2.0% in 2004, compared with only 0.5% in 2003. In Japan, the economy struggled to emerge from a decade-long deflationary period. Although the country’s consumer and business confidence reached their highest levels since 1991, economic growth slowed in response to higher oil prices and reduced external demand. In addition, the U.S. dollar declined approximately 4% versus the yen and 7% versus the euro during 2004.4 This hurt Japanese and European exports into the U.S., as it made their goods more expensive in the world’s biggest market. However, the greenback’s protracted decline should also benefit the U.S. current account deficit by making U.S. goods more competitive in international markets.
Oil prices increased during most of 2004, reaching $56 per barrel in October, but declined to end the year at $43. Higher oil prices triggered investor worries about inflation, decreased spending — due to cautionary consumer and business sentiment — and slower economic and corporate profit growth. As of December 31, 2004, the 12-month moving average price of oil was about $41 per barrel.5
1. Source: Standard & Poor’s Micropal. One cannot invest directly in an index, nor is an index representative of the Fund’s portfolio. Please see Index Descriptions following the Fund Summaries.
2. Source: Bureau of Economic Analysis.
3. Source: National Bureau of Statistics of China.
4. Source: FactSet Research Systems Inc.
5. Source: U.S. Department of Energy.
Fund Risks: Stocks offer the potential for long-term gains but can be subject to short-term up-and-down price movements. Foreign investing involves special risks including currency fluctuations, economic instability, and social and political developments. Emerging markets involve heightened risks due to their relatively smaller size and lesser liquidity. The Fund’s prospectus also includes a description of the main investment risks.
TF-2
In this environment, the MSCI World Index’s total return was 15.25% in U.S. dollars for the 12-month period ended December 31, 2004.6 Emerging markets, as measured by the MSCI Emerging Markets Index, had a one-year total return of 25.95% in U.S. dollars.6 In local currencies, these indexes had notably lower total returns of 11.83% and 16.45% for the same period.6 In 2004, most of the world’s currencies strengthened in relation to the U.S. dollar, which benefited U.S.-based investors of non-U.S. developed and emerging market equities.
Investment Strategy
Our investment philosophy is bottom-up, value-oriented and long-term. In choosing investments, we generally focus on the market price of a company’s securities relative to our evaluation of the company’s potential long-term earnings, asset value and cash flow. Among factors we consider are a company’s historical value measures, including price/earnings ratio, profit margins and liquidation value. We do in-depth research to construct a bargain list from which we buy.
Manager’s Discussion
During the year under review, the Fund benefited from a variety of sectors and individual holdings. For example, strong stock selection in the health care sector aided returns even though we were slightly underweighted compared with the MSCI EAFE Index.7 Among these, the stocks of Mayne Group (sold by period-end) and Ono Pharmaceutical rose on favorable company fundamentals. Merger and acquisition activity in the pharmaceuticals and biotechnology industries was also a boon to certain Fund holdings. For example, the Fund benefited from consolidation in the pharmaceuticals industry when Sanofi acquired Aventis, a long-time portfolio holding. Similarly, UCB acquired Fund holding CellTech Group at a significant premium to its prior-day share price.
Portfolio holdings within the energy sector also provided healthy returns for the Fund as they benefited from steadily rising oil and other energy commodity prices throughout the year.8 Our best performing energy stocks included those of oil and gas companies Eni and Repsol. The Fund’s utilities sector holdings also performed well during the year largely due to healthy earnings growth and a low interest rate environment.9 Our top performers included German multi-utility
6. Source: Standard & Poor’s Micropal. Please see Index Descriptions following the Fund Summaries.
7. In the SOI, the health care sector comprises health care equipment and supplies, and pharmaceuticals.
8. In the SOI, the energy sector comprises energy equipment and services, and oil and gas.
9. In the SOI, the utilities sector comprises electric utilities, and multi-utilities and unregulated power.
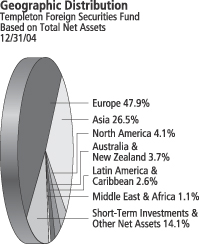
TF-3
E.ON, U.K. power and gas grid operator National Grid Transco, Spanish electric utility Iberdrola and France’s Suez, which provides electricity, natural gas, water and waste management services to more than 130 countries.
In general, if the value of the U.S. dollar goes up compared with a foreign currency, an investment traded in that foreign currency will go down in value because it will be worth fewer U.S. dollars. This can have a negative effect on Fund performance. Conversely, when the U.S. dollar weakens in relation to a foreign currency, an investment traded in that foreign currency will increase in value, which can contribute to Fund performance. For the 12 months ended December 31, 2004, the U.S. dollar declined in value relative to most non-U.S. currencies. At the end of the period, the Fund’s portfolio was invested predominantly in securities with non-U.S. currency exposure, which resulted in a positive effect on Fund performance. However, one cannot expect the same result in future periods.
There were some disappointments and a large cash position that detracted from our overall results. We held approximately 15% in cash (short-term investments and other net assets) for most of 2004, which served as a significant drag in a year when foreign stock markets were quite strong. This uninvested money was, by far, the largest detractor to Fund performance.
Elsewhere, our investments in the consumer staples sector contributed very little to the Fund’s overall return.10 Consumer staples were a small sector weighting in the Fund at less than half the index’s at period-end, but many of the companies within the group were plagued with poor stock performance. Notable laggards during the year included three European companies: U.K.-based supermarket chain J Sainsbury (sold by period-end), U.K. global consumer goods giant Unilever, and Switzerland-based Nestlé, the world’s number-one food company.
Top 10 Holdings
Templeton Foreign Securities Fund
12/31/04
| | |
Company
Sector/Industry,
Country | | % of Total Net Assets |
| |
| Cheung Kong Holdings Ltd. | | 2.3% |
| Real Estate, Hong Kong | | |
| |
| Nippon Telegraph & Telephone Corp. | | 1.7% |
| Diversified Telecommunication Services, Japan | | |
| |
| Sanofi-Aventis | | 1.7% |
| Pharmaceuticals, France | | |
| |
| Samsung Electronics Co. Ltd. | | 1.5% |
| Semiconductors & Semiconductor Equipment, South Korea | | |
| |
| Swiss Reinsurance Co. | | 1.5% |
| Insurance, Switzerland | | |
| |
| Telefonos de Mexico SA de CV (Telmex), L, ADR | | 1.5% |
| Diversified Telecommunication Services, Mexico | | |
| |
| Shell Transport & Trading Co. PLC | | 1.5% |
| Oil & Gas, U.K. | | |
| |
| Denso Corp. | | 1.4% |
| Auto Components, Japan | | |
| |
| BP PLC | | 1.4% |
| Oil & Gas, U.K. | | |
| |
| GlaxoSmithKline PLC | | 1.3% |
| Pharmaceuticals, U.K. | | |
The dollar value, number of shares or principal amount, and names of all portfolio holdings are listed in the Fund’s Statement of Investments.
TF-4
Lastly, some of our holdings within the financials sector, which was significantly underweighted compared with the index at period-end, hurt Fund performance.11 Individual financial stocks that posted positive total returns yet underperformed the index included Bermuda-based insurers XL Capital and ACE Ltd., global banking concern HSBC Holdings (sold by period-end), and South Korea’s Kookmin Bank. Our position in Japanese brokerage Nomura Holdings, on the other hand, posted negative returns during the year.
Thank you for your participation in Templeton Foreign Securities Fund. We look forward to serving your future investment needs.
10. In the SOI, the consumer staples sector comprises food and staples retailing, and food products.
11. In the SOI, the finance sector comprises commercial banks, diversified financial services, capital markets, insurance and real estate.
The foregoing information reflects our analysis, opinions and portfolio holdings as of December 31, 2004, the end of the reporting period. The way we implement our main investment strategies and the resulting portfolio holdings may change depending on factors such as market and economic conditions. These opinions may not be relied upon as investment advice or an offer for a particular security. The information is not a complete analysis of every aspect of any market, country, industry, security or the Fund. Statements of fact are from sources considered reliable, but the adviser makes no representation or warranty as to their completeness or accuracy. Although historical performance is no guarantee of future results, these insights may help you understand our investment management philosophy.
TF-5
Fund Expenses
As an investor in a variable insurance contract (“Contract”) that indirectly provides for investment in an underlying mutual fund, you can incur transaction and/or ongoing expenses at both the Fund level and the Contract level.
| • | | Transaction expenses can include sales charges (loads) on purchases, redemption fees, surrender fees, transfer fees and premium taxes. |
| • | | Ongoing expenses can include management fees, distribution and service (12b-1) fees, contract fees, annual maintenance fees, mortality and expense risk fees and other fees and expenses. All mutual funds and Contracts have some types of ongoing expenses. |
The expenses shown in the table below are meant to highlight ongoing expenses at the Fund level only and do not include ongoing expenses at the Contract level, or transaction expenses at either the Fund or Contract levels. While the Fund does not have transaction expenses, if the transaction and ongoing expenses at the Contract level were included, the expenses shown below would be higher. You should consult your Contract prospectus or disclosure document for more information.
The table shows Fund-level ongoing expenses and can help you understand these expenses and compare them with those of other mutual funds offered through the Contract. The table assumes a $1,000 investment held for the six months indicated. Please refer to the Fund prospectus for additional information on operating expenses.
Actual Fund Expenses
The first line (Actual) for each share class listed in the table below provides actual account values and expenses. The “Ending Account Value” is derived from the Fund’s actual return, which includes the effect of ongoing Fund expenses, but does not include the effect of ongoing Contract expenses.
You can estimate the Fund-level expenses you incurred during the period, by following these steps. Of course, your account value and expenses will differ from those in this illustration:
| 1. | Divide your account value by $1,000. |
If an account had an $8,600 value, then $8,600 ÷ $1,000 = 8.6.
| 2. | Multiply the result by the number under the heading “Fund-level Expenses Incurred During Period.” |
If Fund-Level Expenses Incurred During Period were $7.50, then 8.6 × $7.50 = $64.50.
Templeton Foreign Securities Fund – Class 2
TF-6
In this illustration, the estimated expenses incurred this period at the Fund level are $64.50.
Hypothetical Example for Comparison with Other Mutual Funds
Information in the second line (Hypothetical) for each class in the table can help you compare ongoing expenses of the Fund with those of other mutual funds offered through the Contract. This information may not be used to estimate the actual ending account balance or expenses you incurred during the period. The hypothetical “Ending Account Value” is based on the actual expense ratio for each class and an assumed 5% annual rate of return before expenses, which does not represent the Fund’s actual return. The figure under the heading “Fund-Level Expenses Incurred During Period” shows the hypothetical expenses your account would have incurred under this scenario. You can compare this figure with the 5% hypothetical examples that appear in shareholder reports of other funds offered through a Contract.
| | | | | | | | | |
| Class 2 | | Beginning
Account
Value 6/30/04 | | Ending
Account
Value 12/31/04 | | Fund-Level
Expenses Incurred
During Period*
6/30/04-12/31/04 |
Actual | | $ | 1,000 | | $ | 1,138.00 | | $ | 5.70 |
Hypothetical (5% return before expenses) | | $ | 1,000 | | $ | 1,019.81 | | $ | 5.38 |
*Expenses are equal to the annualized expense ratio for the Fund’s Class 2 shares (1.06%), which does not include any ongoing expenses of the Contract for which the Fund is an investment option, multiplied by the average account value over the period, multiplied by 184/366 to reflect the one-half year period.
TF-7
FRANKLIN TEMPLETON VARIABLE INSURANCE PRODUCTS TRUST
TEMPLETON FOREIGN SECURITIES FUND
Financial Highlightsa
| | | | | | | | | | | | | | | | | | | | |
| | | Class 1
| |
| | | Year Ended December 31,
| |
| | | 2004 | | | 2003 | | | 2002 | | | 2001 | | | 2000 | |
| | |
|
|
|
Per share operating performance | | | | | | | | | | | | | | | | | | | | |
(for a share outstanding throughout the year) | | | | | | | | | | | | | | | | | | | | |
Net asset value, beginning of year | | $ | 12.37 | | | $ | 9.51 | | | $ | 11.85 | | | $ | 18.78 | | | $ | 22.25 | |
| | |
|
|
|
Income from investment operations: | | | | | | | | | | | | | | | | | | | | |
Net investment incomeb | | | .26 | | | | .19 | | | | .22 | | | | .23 | | | | .40 | |
Net realized and unrealized gains (losses) | | | 2.05 | | | | 2.87 | | | | (2.37 | ) | | | (5.23 | ) | | | (.95 | ) |
| | |
|
|
|
Total from investment operations | | | 2.31 | | | | 3.06 | | | | (2.15 | ) | | | (5.00 | ) | | | (.55 | ) |
| | |
|
|
|
Less distributions from: | | | | | | | | | | | | | | | | | | | | |
Net investment income | | | (.15 | ) | | | (.20 | ) | | | (.19 | ) | | | (.26 | ) | | | (.43 | ) |
Net realized gains | | | — | | | | — | | | | — | | | | (1.67 | ) | | | (2.49 | ) |
| | |
|
|
|
Total distributions | | | (.15 | ) | | | (.20 | ) | | | (.19 | ) | | | (1.93 | ) | | | (2.92 | ) |
| | |
|
|
|
Redemption fees | | | — | d | | | — | | | | — | | | | — | | | | — | |
| | |
|
|
|
Net asset value, end of year | | $ | 14.53 | | | $ | 12.37 | | | $ | 9.51 | | | $ | 11.85 | | | $ | 18.78 | |
| | |
|
|
|
| | | | | |
Total returnc | | | 18.87% | | | | 32.55% | | | | (18.40)% | | | | (15.75)% | | | | (2.19)% | |
Ratios/supplemental data | | | | | | | | | | | | | | | | | | | | |
Net assets, end of year (000’s) | | $ | 506,456 | | | $ | 472,665 | | | $ | 397,420 | | | $ | 565,220 | | | $ | 776,495 | |
Ratios to average net assets: | | | | | | | | | | | | | | | | | | | | |
Expenses | | | .82% | | | | .87% | | | | .88% | | | | .90% | | | | .87% | |
Net investment income | | | 1.95% | | | | 1.81% | | | | 1.97% | | | | 1.59% | | | | 2.08% | |
Portfolio turnover rate | | | 10.91% | | | | 18.01% | | | | 28.12% | | | | 20.00% | | | | 32.81% | |
| a | Financial highlights presented reflect historical financial information from Templeton Variable Products Series Fund (TVP) – Templeton International Securities Fund as a result of a merger on May 1, 2000. |
| b | Based on average daily shares outstanding. |
| c | Total return does not include any fees, charges or expenses imposed by the variable annuity and life insurance contracts for which the Franklin Templeton Variable Insurance Products Trust serves as an underlying investment vehicle. Total return is not annualized for periods less than one year. |
| d | Amount is less than $.001 per share. |
See notes to financial statements.
TF-8
FRANKLIN TEMPLETON VARIABLE INSURANCE PRODUCTS TRUST
TEMPLETON FOREIGN SECURITIES FUND
Financial Highlightsa (continued)
| | | | | | | | | | | | | | | | | | | | |
| | | Class 2
| |
| | | Year Ended December 31,
| |
| | | 2004 | | | 2003 | | | 2002 | | | 2001 | | | 2000 | |
| | |
|
|
|
Per share operating performance | | | | | | | | | | | | | | | | | | | | |
(for a share outstanding throughout the year) | | | | | | | | | | | | | | | | | | | | |
Net asset value, beginning of year | | $ | 12.24 | | | $ | 9.42 | | | $ | 11.74 | | | $ | 18.67 | | | $ | 22.13 | |
| | |
|
|
|
Income from investment operations: | | | | | | | | | | | | | | | | | | | | |
Net investment incomeb | | | .22 | | | | .15 | | | | .17 | | | | .18 | | | | .31 | |
Net realized and unrealized gains (losses) | | | 2.03 | | | | 2.85 | | | | (2.32 | ) | | | (5.21 | ) | | | (.90 | ) |
| | |
|
|
|
Total from investment operations | | | 2.25 | | | | 3.00 | | | | (2.15 | ) | | | (5.03 | ) | | | (.59 | ) |
| | |
|
|
|
Less distributions from: | | | | | | | | | | | | | | | | | | | | |
Net investment income | | | (.14 | ) | | | (.18 | ) | | | (.17 | ) | | | (.23 | ) | | | (.38 | ) |
Net realized gains | | | — | | | | — | | | | — | | | | (1.67 | ) | | | (2.49 | ) |
| | |
|
|
|
Total distributions | | | (.14 | ) | | | (.18 | ) | | | (.17 | ) | | | (1.90 | ) | | | (2.87 | ) |
| | |
|
|
|
Redemption fees | | | — | d | | | — | | | | — | | | | — | | | | — | |
| | |
|
|
|
Net asset value, end of year | | $ | 14.35 | | | $ | 12.24 | | | $ | 9.42 | | | $ | 11.74 | | | $ | 18.67 | |
| | |
|
|
|
| | | | | |
Total returnc | | | 18.53% | | | | 32.21% | | | | (18.56)% | | | | (15.99)% | | | | (2.38)% | |
Ratios/supplemental data | | | | | | | | | | | | | | | | | | | | |
Net assets, end of year (000’s) | | $ | 1,445,928 | | | $ | 653,594 | | | $ | 299,760 | | | $ | 225,505 | | | $ | 187,115 | |
Ratios to average net assets: | | | | | | | | | | | | | | | | | | | | |
Expenses | | | 1.07% | | | | 1.12% | | | | 1.13% | | | | 1.15% | | | | 1.12% | |
Net investment income | | | 1.70% | | | | 1.56% | | | | 1.72% | | | | 1.32% | | | | 1.66% | |
Portfolio turnover rate | | | 10.91% | | | | 18.01% | | | | 28.12% | | | | 20.00% | | | | 32.81% | |
| a | Financial highlights presented reflect historical financial information from Templeton Variable Products Series Fund (TVP) – Templeton International Securities Fund as a result of a merger on May 1, 2000. |
| b | Based on average daily shares outstanding. |
| c | Total return does not include any fees, charges or expenses imposed by the variable annuity and life insurance contracts for which the Franklin Templeton Variable Insurance Products Trust serves as an underlying investment vehicle. Total return is not annualized for periods less than one year. |
| d | Amount is less than $.001 per share. |
See notes to financial statements.
TF-9
FRANKLIN TEMPLETON VARIABLE INSURANCE PRODUCTS TRUST
TEMPLETON FOREIGN SECURITIES FUND
Financial Highlights (continued)
| | | | |
| | | Class 3
| |
| | | Period Ended December 31, 2004c
| |
Per share operating performance | | | | |
(for a share outstanding throughout the period) | | | | |
Net asset value, beginning of period | | $ | 12.48 | |
| | |
|
|
|
Income from investment operations: | | | | |
Net investment incomea | | | .09 | |
Net realized and unrealized gains (losses) | | | 1.92 | |
| | |
|
|
|
Total from investment operations | | | 2.01 | |
| | |
|
|
|
Less distributions from net investment income | | | (.14 | ) |
| | |
|
|
|
Redemption fees | | | — | d |
| | |
|
|
|
Net asset value, end of period | | $ | 14.35 | |
| | |
|
|
|
| |
Total returnb | | | 16.25% | |
Ratios/supplemental data | | | | |
Net assets, end of period (000’s) | | $ | 16,559 | |
Ratios to average net assets: | | | | |
Expenses | | | 1.07%e | |
Net investment income | | | 1.70%e | |
Portfolio turnover rate | | | 10.91% | |
| a | Based on average daily shares outstanding. |
| b | Total return does not include any fees, charges or expenses imposed by the variable annuity and life insurance contracts for which the Franklin Templeton Variable Insurance Products Trust serves as an underlying investment vehicle. Total return is not annualized for periods less than one year. |
| c | For the period May 1, 2004 (effective date) to December 31, 2004. |
| d | Amount is less than $.001 per share. |
See notes to financial statements.
TF-10
FRANKLIN TEMPLETON VARIABLE INSURANCE PRODUCTS TRUST
TEMPLETON FOREIGN SECURITIES FUND
Statement of Investments, December 31, 2004
| | | | | | | |
| | | COUNTRY | | SHARES | | VALUE |
Common Stocks 84.5% | | | | | | | |
Aerospace & Defense 1.2% | | | | | | | |
BAE Systems PLC | | United Kingdom | | 3,544,411 | | $ | 15,681,729 |
aRolls-Royce Group PLC | | United Kingdom | | 1,729,900 | | | 8,201,568 |
aRolls-Royce Group PLC, B | | United Kingdom | | 55,010,820 | | | 107,703 |
| | | | | | |
|
|
| | | | | | | | 23,991,000 |
| | | | | | |
|
|
Air Freight & Logistics .9% | | | | | | | |
Deutsche Post AG | | Germany | | 753,313 | | | 17,235,056 |
| | | | | | |
|
|
Airlines .4% | | | | | | | |
Qantas Airways Ltd. | | Australia | | 3,060,000 | | | 8,886,228 |
| | | | | | |
|
|
Auto Components 3.4% | | | | | | | |
Autoliv Inc., SDR | | Sweden | | 393,611 | | | 18,840,149 |
Denso Corp. | | Japan | | 1,044,800 | | | 28,002,109 |
GKN PLC | | United Kingdom | | 4,440,200 | | | 20,156,384 |
| | | | | | |
|
|
| | | | | | | | 66,998,642 |
| | | | | | |
|
|
Automobiles .4% | | | | | | | |
Volkswagen AG | | Germany | | 181,815 | | | 8,228,207 |
| | | | | | |
|
|
Capital Markets 2.5% | | | | | | | |
Amvescap PLC | | United Kingdom | | 2,575,100 | | | 15,854,031 |
Nomura Holdings Inc. | | Japan | | 1,327,730 | | | 19,367,590 |
UBS AG | | Switzerland | | 161,000 | | | 13,429,036 |
| | | | | | |
|
|
| | | | | | | | 48,650,657 |
| | | | | | |
|
|
Chemicals 3.0% | | | | | | | |
Akzo Nobel NV | | Netherlands | | 329,003 | | | 14,009,817 |
BASF AG | | Germany | | 324,369 | | | 23,293,719 |
Bayer AG, Br. | | Germany | | 333,400 | | | 11,265,348 |
Lonza Group AG | | Switzerland | | 173,400 | | | 9,743,711 |
| | | | | | |
|
|
| | | | | | | | 58,312,595 |
| | | | | | |
|
|
Commercial Banks 6.5% | | | | | | | |
Banco Santander Central Hispano SA | | Spain | | 1,919,500 | | | 23,781,462 |
DBS Group Holdings Ltd. | | Singapore | | 1,312,000 | | | 12,940,758 |
aHana Bank | | South Korea | | 684,000 | | | 17,047,141 |
aKookmin Bank, ADR | | South Korea | | 314,560 | | | 12,293,005 |
Lloyds TSB Group PLC | | United Kingdom | | 1,387,500 | | | 12,597,173 |
National Australia Bank Ltd. | | Australia | | 865,300 | | | 19,520,133 |
Nordea Bank AB, FDR | | Sweden | | 2,135,083 | | | 21,599,419 |
Shinsei Bank Ltd. | | Japan | | 1,325,000 | | | 9,029,974 |
| | | | | | |
|
|
| | | | | | | | 128,809,065 |
| | | | | | |
|
|
Commercial Services & Supplies 1.7% | | | | | | | |
Rentokil Initial PLC | | United Kingdom | | 6,633,900 | | | 18,813,750 |
Securitas AB, B | | Sweden | | 809,980 | | | 13,898,538 |
| | | | | | |
|
|
| | | | | | | | 32,712,288 |
| | | | | | |
|
|
Computers & Peripherals 1.3% | | | | | | | |
Compal Electronics Inc. | | Taiwan | | 11,949,000 | | | 11,915,171 |
Lite-on Technology Corp. | | Taiwan | | 6,751,000 | | | 7,199,085 |
NEC Corp. | | Japan | | 1,058,000 | | | 6,580,219 |
| | | | | | |
|
|
| | | | | | | | 25,694,475 |
| | | | | | |
|
|
TF-11
FRANKLIN TEMPLETON VARIABLE INSURANCE PRODUCTS TRUST
TEMPLETON FOREIGN SECURITIES FUND
Statement of Investments, December 31, 2004 (cont.)
| | | | | | | |
| | | COUNTRY | | SHARES | | VALUE |
Common Stocks (cont.) | | | | | | | |
Construction Materials .6% | | | | | | | |
Cemex SA, ADR | | Mexico | | 315,900 | | $ | 11,505,078 |
| | | | | | |
|
|
Diversified Financial Services .7% | | | | | | | |
ING Groep NV | | Netherlands | | 450,610 | | | 13,611,489 |
| | | | | | |
|
|
Diversified Telecommunication Services 7.9% | | | | | | | |
BCE Inc. | | Canada | | 815,260 | | | 19,658,414 |
Chunghwa Telecom Co. Ltd., ADR | | Taiwan | | 728,900 | | | 15,343,345 |
KT Corp., ADR | | South Korea | | 420,880 | | | 9,179,393 |
Nippon Telegraph & Telephone Corp. | | Japan | | 7,388 | | | 33,181,800 |
Telecom Corp. of New Zealand Ltd. | | New Zealand | | 2,550,626 | | | 11,263,589 |
Telefonica SA, ADR | | Spain | | 347,913 | | | 19,657,085 |
Telefonos de Mexico SA de CV (Telmex), L, ADR | | Mexico | | 780,969 | | | 29,926,732 |
Telenor ASA | | Norway | | 2,003,100 | | | 18,166,610 |
| | | | | | |
|
|
| | | | | | | | 156,376,968 |
| | | | | | |
|
|
Electric Utilities 3.0% | | | | | | | |
E.ON AG | | Germany | | 188,653 | | | 17,198,215 |
Endesa SA | | Spain | | 547,398 | | | 12,843,336 |
Hong Kong Electric Holdings Ltd. | | Hong Kong | | 3,653,500 | | | 16,686,297 |
Iberdrola SA, Br. | | Spain | | 528,222 | | | 13,404,103 |
| | | | | | |
|
|
| | | | | | | | 60,131,951 |
| | | | | | |
|
|
Electrical Equipment .9% | | | | | | | |
Kidde PLC | | United Kingdom | | 2,724,071 | | | 8,705,859 |
aVestas Wind Systems AS | | Denmark | | 502,800 | | | 6,236,677 |
aVestas Wind Systems AS, 144A | | Denmark | | 167,600 | | | 2,078,892 |
| | | | | | |
|
|
| | | | | | | | 17,021,428 |
| | | | | | |
|
|
Electronic Equipment & Instruments 1.4% | | | | | | | |
Hitachi Ltd. | | Japan | | 3,361,867 | | | 23,305,268 |
Venture Corp. Ltd. | | Singapore | | 480,000 | | | 4,675,611 |
| | | | | | |
|
|
| | | | | | | | 27,980,879 |
| | | | | | |
|
|
Energy Equipment & Services .4% | | | | | | | |
IHC Caland NV | | Netherlands | | 115,874 | | | 7,349,442 |
| | | | | | |
|
|
Food & Staples Retailing .8% | | | | | | | |
Boots Group PLC | | United Kingdom | | 1,209,400 | | | 15,193,526 |
| | | | | | |
|
|
Food Products 1.7% | | | | | | | |
Nestle SA | | Switzerland | | 51,790 | | | 13,527,833 |
Unilever PLC | | United Kingdom | | 1,945,434 | | | 19,100,339 |
| | | | | | |
|
|
| | | | | | | | 32,628,172 |
| | | | | | |
|
|
Health Care Equipment & Supplies .9% | | | | | | | |
Olympus Corp. | | Japan | | 861,000 | | | 18,368,336 |
| | | | | | |
|
|
Hotels Restaurants & Leisure 1.0% | | | | | | | |
Compass Group PLC | | United Kingdom | | 4,131,400 | | | 19,527,760 |
| | | | | | |
|
|
Household Durables 3.0% | | | | | | | |
Koninklijke Philips Electronics NV | | Netherlands | | 951,239 | | | 25,184,108 |
Persimmon PLC | | United Kingdom | | 614,500 | | | 8,150,399 |
Sony Corp. | | Japan | | 644,654 | | | 24,925,111 |
| | | | | | |
|
|
| | | | | | | | 58,259,618 |
| | | | | | |
|
|
TF-12
FRANKLIN TEMPLETON VARIABLE INSURANCE PRODUCTS TRUST
TEMPLETON FOREIGN SECURITIES FUND
Statement of Investments, December 31, 2004 (cont.)
| | | | | | | |
| | | COUNTRY | | SHARES | | VALUE |
Common Stocks (cont.) | | | | | | | |
Industrial Conglomerates 2.9% | | | | | | | |
Hutchison Whampoa Ltd. | | Hong Kong | | 1,962,000 | | $ | 18,363,460 |
Smiths Group PLC | | United Kingdom | | 1,293,800 | | | 20,413,521 |
Swire Pacific Ltd., B | | Hong Kong | | 12,648,627 | | | 18,795,240 |
| | | | | | |
|
|
| | | | | | | | 57,572,221 |
| | | | | | |
|
|
Insurance 6.1% | | | | | | | |
ACE Ltd. | | Bermuda | | 558,903 | | | 23,893,103 |
AMP Ltd. | | Australia | | 3,157,400 | | | 17,942,722 |
AXA SA | | France | | 479,792 | | | 11,836,588 |
AXA SA, 144A | | France | | 40,480 | | | 998,652 |
Sompo Japan Insurance Inc. | | Japan | | 1,694,000 | | | 17,267,487 |
Swiss Reinsurance Co. | | Switzerland | | 422,015 | | | 29,938,814 |
XL Capital Ltd., A | | Bermuda | | 232,228 | | | 18,032,504 |
| | | | | | |
|
|
| | | | | | | | 119,909,870 |
| | | | | | |
|
|
IT Services .8% | | | | | | | |
Satyam Computers Services Ltd. | | India | | 1,738,866 | | | 16,480,027 |
| | | | | | |
|
|
Machinery .7% | | | | | | | |
Volvo AB, B | | Sweden | | 369,264 | | | 14,645,614 |
| | | | | | |
|
|
Media 3.7% | | | | | | | |
British Sky Broadcasting Group PLC | | United Kingdom | | 2,237,900 | | | 24,141,038 |
Pearson PLC | | United Kingdom | | 1,008,500 | | | 12,166,345 |
Reed Elsevier NV | | Netherlands | | 877,400 | | | 11,942,032 |
Wolters Kluwer NV | | Netherlands | | 380,280 | | | 7,621,907 |
Yell Group PLC | | United Kingdom | | 2,000,000 | | | 16,891,243 |
| | | | | | |
|
|
| | | | | | | | 72,762,565 |
| | | | | | |
|
|
Metals & Mining 2.2% | | | | | | | |
Alcan Inc. | | Canada | | 55,334 | | | 2,712,836 |
Barrick Gold Corp. | | Canada | | 701,894 | | | 16,971,631 |
BHP Billiton Ltd. | | Australia | | 1,338,050 | | | 16,066,445 |
POSCO, ADR | | South Korea | | 165,547 | | | 7,371,808 |
| | | | | | |
|
|
| | | | | | | | 43,122,720 |
| | | | | | |
|
|
Multi-Utilities & Unregulated Power 2.0% | | | | | | | |
National Grid Transco PLC | | United Kingdom | | 1,742,960 | | | 16,610,612 |
Suez SA | | France | | 861,400 | | | 22,934,196 |
| | | | | | |
|
|
| | | | | | | | 39,544,808 |
| | | | | | |
|
|
Oil & Gas 5.8% | | | | | | | |
BP PLC | | United Kingdom | | 2,849,920 | | | 27,789,154 |
Eni SpA | | Italy | | 845,840 | | | 21,142,557 |
Repsol YPF SA | | Spain | | 902,215 | | | 23,457,688 |
Shell Transport & Trading Co. PLC | | United Kingdom | | 3,458,953 | | | 29,478,581 |
Total SA, B | | France | | 54,077 | | | 11,792,561 |
| | | | | | |
|
|
| | | | | | | | 113,660,541 |
| | | | | | |
|
|
Paper & Forest Products 2.1% | | | | | | | |
Stora Enso OYJ, R | | Finland | | 1,305,230 | | | 19,940,823 |
UPM-Kymmene Corp. | | Finland | | 1,013,779 | | | 22,492,654 |
| | | | | | |
|
|
| | | | | | | | 42,433,477 |
| | | | | | |
|
|
TF-13
FRANKLIN TEMPLETON VARIABLE INSURANCE PRODUCTS TRUST
TEMPLETON FOREIGN SECURITIES FUND
Statement of Investments, December 31, 2004 (cont.)
| | | | | | | |
| | | COUNTRY | | SHARES | | VALUE |
Common Stocks (cont.) | | | | | | | |
Pharmaceuticals 5.4% | | | | | | | |
GlaxoSmithKline PLC | | United Kingdom | | 1,131,289 | | $ | 26,535,283 |
Ono Pharmaceutical Co. Ltd. | | Japan | | 299,000 | | | 16,786,272 |
Sanofi-Aventis | | France | | 412,723 | | | 32,931,814 |
Shire Pharmaceuticals Group PLC | | United Kingdom | | 928,000 | | | 9,743,483 |
Takeda Pharmaceutical Co. Ltd. | | Japan | | 401,200 | | | 20,212,771 |
| | | | | | |
|
|
| | | | | | | | 106,209,623 |
| | | | | | |
|
|
Real Estate 2.3% | | | | | | | |
Cheung Kong Holdings Ltd. | | Hong Kong | | 4,570,137 | | | 45,567,314 |
| | | | | | |
|
|
Road & Rail .3% | | | | | | | |
East Japan Railway Co. | | Japan | | 1,100 | | | 6,121,851 |
| | | | | | |
|
|
Semiconductors & Semiconductor Equipment 2.0% | | | | | | | |
Samsung Electronics Co. Ltd. | | South Korea | | 69,750 | | | 30,353,917 |
Taiwan Semiconductor Manufacturing Co. | | Taiwan | | 5,483,234 | | | 8,710,391 |
| | | | | | |
|
|
| | | | | | | | 39,064,308 |
| | | | | | |
|
|
Software 2.3% | | | | | | | |
aCheck Point Software Technologies Ltd. | | Israel | | 842,050 | | | 20,739,691 |
Nintendo Co. Ltd. | | Japan | | 196,000 | | | 24,629,174 |
| | | | | | |
|
|
| | | | | | | | 45,368,865 |
| | | | | | |
|
|
Wireless Telecommunication Services 2.3% | | | | | | | |
China Mobile (Hong Kong) Ltd., fgn. | | China | | 2,932,000 | | | 9,939,559 |
SK Telecom Co. Ltd., ADR | | South Korea | | 546,520 | | | 12,160,070 |
Vodafone Group PLC, ADR | | United Kingdom | | 835,590 | | | 22,878,454 |
| | | | | | |
|
|
| | | | | | | | 44,978,083 |
| | | | | | |
|
|
Total Common Stocks (Cost $1,293,928,767) | | | | | | | 1,664,914,747 |
| | | | | | |
|
|
Preferred Stocks .8% | | | | | | | |
Automobiles .3% | | | | | | | |
Volkswagen AG, pfd. | | Germany | | 160,254 | | | 5,327,882 |
| | | | | | |
|
|
Metals & Mining .5% | | | | | | | |
Cia Vale do Rio Doce, ADR, pfd., A | | Brazil | | 398,376 | | | 9,712,407 |
| | | | | | |
|
|
Total Preferred Stocks (Cost $8,049,893) | | | | | | | 15,040,289 |
| | | | | | |
|
|
Closed End Mutual Funds (Cost $6,368,163) .6% | | | | | | | |
Diversified Financial Services | | | | | | | |
Rodamco Europe NV | | Netherlands | | 164,000 | | | 12,996,798 |
| | | | | | |
|
|
Total Long Term Investments (Cost $1,308,346,823) | | | | | | | 1,692,951,834 |
| | | | | | |
|
|
Short Term Investment (Cost $270,971,187) 13.8% | | | | | | | |
Money Fund | | | | | | | |
bFranklin Institutional Fiduciary Trust Money Market Portfolio | | United States | | 270,971,187 | | | 270,971,187 |
| | | | | | |
|
|
Total Investments (Cost $1,579,318,010) 99.7% | | | | | | | 1,963,923,021 |
Other Assets, less Liabilities .3% | | | | | | | 5,019,832 |
| | | | | | |
|
|
Net Assets 100.0% | | | | | | $ | 1,968,942,853 |
| | | | | | |
|
|
Portfolio Abbreviations:
ADR - American Depository Receipt
FDR - Foreign Depository Receipt
SDR - Special Drawing Rights
| b | See Note 7 regarding investments in Franklin Institutional Fiduciary Trust Money Market Portfolio. |
See notes to financial statements.
TF-14
FRANKLIN TEMPLETON VARIABLE INSURANCE PRODUCTS TRUST
TEMPLETON FOREIGN SECURITIES FUND
Financial Statements
Statement of Assets and Liabilities
December 31, 2004
| | | | |
Assets: | | | | |
Investments in securities: | | | | |
Cost - Unaffiliated issuers | | $ | 1,308,346,823 | |
Cost - Sweep Money Fund (Note 7) | | | 270,971,187 | |
| | |
|
|
|
Total cost of investments | | $ | 1,579,318,010 | |
| | |
|
|
|
Value - Unaffiliated issuers | | $ | 1,692,951,834 | |
Value - Sweep Money Fund (Note 7) | | | 270,971,187 | |
| | |
|
|
|
Total value of investments | | | 1,963,923,021 | |
| | |
|
|
|
Cash | | | 125,592 | |
Foreign currency, at value (cost $2,260,961) | | | 2,508,300 | |
Receivables: | | | | |
Capital shares sold | | | 2,918,340 | |
Dividends | | | 2,635,413 | |
| | |
|
|
|
Total assets | | | 1,972,110,666 | |
| | |
|
|
|
Liabilities: | | | | |
Payables: | | | | |
Investment securities purchased | | | 214,925 | |
Capital shares redeemed | | | 1,149,737 | |
Affiliates | | | 1,450,921 | |
Deferred tax liability | | | 169,581 | |
Other liabilities | | | 182,649 | |
| | |
|
|
|
Total liabilities | | | 3,167,813 | |
| | |
|
|
|
Net assets, at value | | $ | 1,968,942,853 | |
| | |
|
|
|
Net assets consist of: | | | | |
Undistributed net investment income | | $ | 24,955,358 | |
Net unrealized appreciation (depreciation) | | | 384,828,209 | |
Accumulated net realized gain (loss) | | | (107,874,725 | ) |
Capital shares | | | 1,667,034,011 | |
| | |
|
|
|
Net assets, at value | | $ | 1,968,942,853 | |
| | |
|
|
|
Class 1: | | | | |
Net assets, at value | | $ | 506,456,226 | |
| | |
|
|
|
Shares outstanding | | | 34,854,983 | |
| | |
|
|
|
Net asset value and offering price per share | | $ | 14.53 | |
| | |
|
|
|
Class 2: | | | | |
Net assets, at value | | $ | 1,445,927,955 | |
| | |
|
|
|
Shares outstanding | | | 100,737,385 | |
| | |
|
|
|
Net asset value and offering price per share | | $ | 14.35 | |
| | |
|
|
|
Class 3: | | | | |
Net assets, at value | | $ | 16,558,672 | |
| | |
|
|
|
Shares outstanding | | | 1,154,063 | |
| | |
|
|
|
Net asset value and offering price per sharea | | $ | 14.35 | |
| | |
|
|
|
| a | Redemption price is equal to net asset value less any redemption fees retained by the Fund. |
See notes to financial statements.
TF-15
FRANKLIN TEMPLETON VARIABLE INSURANCE PRODUCTS TRUST
TEMPLETON FOREIGN SECURITIES FUND
Financial Statements (continued)
Statement of Operations
for the year ended December 31, 2004
| | | | |
Investment income: | | | | |
Dividends (net of foreign taxes of $4,492,699) | | | | |
Unaffiliated issuers | | $ | 38,283,254 | |
Sweep Money Fund (Note 7) | | | 2,220,093 | |
| | |
|
|
|
Total investment income | | | 40,503,347 | |
| | |
|
|
|
Expenses: | | | | |
Management fees (Note 3) | | | 9,142,311 | |
Administrative fees (Note 3) | | | 1,668,538 | |
Distribution fees: (Note 3) | | | | |
Class 2 | | | 2,462,864 | |
Class 3 | | | 13,407 | |
Transfer agent fees | | | 24,686 | |
Custodian fees (Note 4) | | | 439,081 | |
Reports to shareholders | | | 458,829 | |
Professional fees | | | 116,933 | |
Trustees’ fees and expenses | | | 8,455 | |
Other | | | 64,649 | |
| | |
|
|
|
Total expenses | | | 14,399,753 | |
Expense reductions (Note 4) | | | (6,810 | ) |
| | |
|
|
|
Net expenses | | | 14,392,943 | |
| | |
|
|
|
Net investment income | | | 26,110,404 | |
| | |
|
|
|
Realized and unrealized gains (losses): | | | | |
Net realized gain (loss) from: | | | | |
Investments | | | 39,230,156 | |
Foreign currency transactions | | | 148,337 | |
| | |
|
|
|
Net realized gain (loss) | | | 39,378,493 | |
| | |
|
|
|
Net change in unrealized appreciation (depreciation) on: | | | | |
Investments | | | 215,075,678 | |
Translation of assets and liabilities denominated in foreign currencies | | | 161,257 | |
Deferred taxes | | | 454,828 | |
| | |
|
|
|
Net change in unrealized appreciation (depreciation) | | | 215,691,763 | |
| | |
|
|
|
Net realized and unrealized gain (loss) | | | 255,070,256 | |
| | |
|
|
|
Net increase (decrease) in net assets resulting from operations | | $ | 281,180,660 | |
| | |
|
|
|
See notes to financial statements.
TF-16
FRANKLIN TEMPLETON VARIABLE INSURANCE PRODUCTS TRUST
TEMPLETON FOREIGN SECURITIES FUND
Financial Statements (continued)
Statements of Changes in Net Assets
for the years ended December 31, 2004 and 2003
| | | | | | | | |
| | | 2004 | | | 2003 | |
| | |
| |
Increase (decrease) in net assets: | | | | | | | | |
Operations: | | | | | | | | |
Net investment income | | $ | 26,110,404 | | | $ | 13,945,725 | |
Net realized gain (loss) from investments and foreign currency transactions | | | 39,378,493 | | | | (31,091,065 | ) |
Net change in unrealized appreciation (depreciation) on investments, translation of assets and
liabilities denominated in foreign currencies and deferred taxes | | | 215,691,763 | | | | 272,127,433 | |
| | |
| |
Net increase (decrease) in net assets resulting from operations | | | 281,180,660 | | | | 254,982,093 | |
Distributions to shareholders from: | | | | | | | | |
Net investment income: | | | | | | | | |
Class 1 | | | (5,478,306 | ) | | | (7,698,069 | ) |
Class 2 | | | (10,189,845 | ) | | | (6,848,227 | ) |
Class 3 | | | (37,708 | ) | | | — | |
| | |
| |
Total distributions to shareholders | | | (15,705,859 | ) | | | (14,546,296 | ) |
Capital share transactions: (Note 2) | | | | | | | | |
Class 1 | | | (43,045,841 | ) | | | (35,694,170 | ) |
Class 2 | | | 605,495,077 | | | | 224,338,382 | |
Class 3 | | | 14,758,051 | | | | — | |
| | |
| |
Total capital share transactions | | | 577,207,287 | | | | 188,644,212 | |
Redemption fees | | | 1,304 | | | | — | |
| | |
| |
Net increase (decrease) in net assets | | | 842,683,392 | | | | 429,080,009 | |
Net assets: | | | | | | | | |
Beginning of year | | | 1,126,259,461 | | | | 697,179,452 | |
| | |
| |
End of year | | $ | 1,968,942,853 | | | $ | 1,126,259,461 | |
| | |
| |
Undistributed net investment income included in net assets: | | | | | | | | |
End of year | | $ | 24,955,358 | | | $ | 13,972,294 | |
| | |
| |
See notes to financial statements.
TF-17
FRANKLIN TEMPLETON VARIABLE INSURANCE PRODUCTS TRUST
TEMPLETON FOREIGN SECURITIES FUND
Notes to Financial Statements
1. ORGANIZATION AND SIGNIFICANT ACCOUNTING POLICIES
Franklin Templeton Variable Insurance Products Trust (the Trust) is registered under the Investment Company Act of 1940 as an open-end investment company, consisting of twenty-one separate series (the Funds). Templeton Foreign Securities Fund (the Fund) included in this report is diversified. The financial statements of the remaining funds in the series are presented separately. Shares of the Fund are sold only to insurance company separate accounts to fund the benefits of variable life insurance policies or variable annuity contracts. The Fund’s investment objective is capital growth.
The following summarizes the Fund’s significant accounting policies.
a. Security Valuation
Securities listed on a securities exchange or on the NASDAQ National Market System are valued at the last quoted sale price or the official closing price of the day, respectively. Over-the-counter securities and listed securities for which there is no reported sale are valued within the range of the most recent quoted bid and ask prices. Securities that trade in multiple markets or on multiple exchanges are valued according to the broadest and most representative market. Investments in open-end mutual funds are valued at the closing net asset value.
Foreign securities are valued as of the close of trading on the foreign stock exchange on which the security is primarily traded, or the NYSE, whichever is earlier. The value is then converted into its U.S. dollar equivalent at the foreign exchange rate in effect at the close of the NYSE on the day that the value of the foreign security is determined. If no sale is reported at that time, the foreign security will be valued within the range of the most recent quoted bid and ask prices.
The Trust has procedures to determine the fair value of individual securities and other assets for which market prices are not readily available or which may not be reliably priced. Some methods for valuing these securities may include: fundamental analysis, matrix pricing, discounts from market prices of similar securities, or discounts applied due to the nature and duration of restrictions on the disposition of the securities. Occasionally, events occur between the time at which trading in a security is completed and the close of the NYSE that might call into question the availability (including the reliability) of the value of a portfolio security held by the Fund. If such an event occurs, the securities may be valued using fair value procedures, which may include the use of independent pricing services. All security valuation procedures are approved by the Trust’s Board of Trustees.
b. Foreign Currency Translation
Portfolio securities and other assets and liabilities denominated in foreign currencies are translated into U.S. dollars based on the exchange rate of such currencies against U.S. dollars on the date of valuation. Purchases and sales of securities, income and expense items denominated in foreign currencies are translated into U.S. dollars at the exchange rate in effect on the transaction date. Occasionally events may impact the availability or reliability of foreign exchange rates used to convert the U.S. dollar equivalent value. If such an event occurs, the foreign exchange rate will be valued at fair value using procedures established and approved by the Trust’s Board of Trustees.
The Fund does not separately report the effect of changes in foreign exchange rates from changes in market prices on securities held. Such changes are included in net realized and unrealized gain or loss from investments on the Statement of Operations.
Realized foreign exchange gains or losses arise from sales of foreign currencies, currency gains or losses realized between the trade and settlement dates on securities transactions and the difference between the recorded amounts of dividends, interest, and foreign withholding taxes and the U.S. dollar equivalent of the amounts actually received or paid. Net unrealized foreign exchange gains and losses arise from changes in foreign exchange rates on foreign denominated assets and liabilities other than investments in securities held at the end of the reporting period.
TF-18
FRANKLIN TEMPLETON VARIABLE INSURANCE PRODUCTS TRUST
TEMPLETON FOREIGN SECURITIES FUND
Notes to Financial Statements (continued)
1. ORGANIZATION AND SIGNIFICANT ACCOUNTING POLICIES (cont.)
c. Foreign Currency Contracts
When the Fund purchases or sells foreign securities it may enter into foreign exchange contracts to minimize foreign exchange risk from the trade date to the settlement date of the transactions. A foreign exchange contract is an agreement between two parties to exchange different currencies at an agreed upon exchange rate on a specified date. Realized and unrealized gains and losses on these contracts are included in the Statement of Operations.
The risks of these contracts include movement in the values of the foreign currencies relative to the U.S. dollar and the possible inability of the counterparties to fulfill their obligations under the contracts.
d. Income and Deferred Taxes
No provision has been made for U.S. income taxes because the Fund’s policy is to qualify as a regulated investment company under Sub Chapter M of the Internal Revenue Code and to distribute substantially all of its taxable income. Fund distributions to shareholders are determined on an income tax basis and may differ from net investment income and realized gains for financial reporting purposes.
The Fund is subject to a tax imposed on net realized gains of securities of certain foreign countries. The Fund records an estimated deferred tax liability for net unrealized gains on these securities as reflected in the accompanying financial statements.
e. Security Transactions, Investment Income, Expenses and Distributions
Security transactions are accounted for on trade date. Realized gains and losses on security transactions are determined on a specific identification basis. Interest income and estimated expenses are accrued daily. Dividend income and distributions to shareholders are recorded on the ex-dividend date.
Common expenses incurred by the Trust are allocated among the funds based on the ratio of net assets of each fund to the combined net assets. Other expenses are charged to each fund on a specific identification basis.
Realized and unrealized gains and losses and net investment income, other than class specific expenses, are allocated daily to each class of shares based upon the relative proportion of net assets of each class.
f. Accounting Estimates
The preparation of financial statements in accordance with accounting principles generally accepted in the United States of America requires management to make estimates and assumptions that affect the reported amounts of assets and liabilities at the date of the financial statements and the amounts of income and expenses during the reporting period. Actual results could differ from those estimates.
g. Redemption Fees
Redemptions and exchanges of Class 3 shares held 60 days or less may be subject to the Fund’s redemption fee, which is 1% of the amount redeemed. Such fees are retained by the Fund and accounted for as additional paid-in capital as noted in the Statements of Changes in Net Assets.
h. Guarantees and Indemnifications
Under the Trust’s organizational documents, its officers and trustees are indemnified by the Trust against certain liability arising out of the performance of their duties to the Trust. Additionally, in the normal course of business, the Trust enters into contracts
TF-19
FRANKLIN TEMPLETON VARIABLE INSURANCE PRODUCTS TRUST
TEMPLETON FOREIGN SECURITIES FUND
Notes to Financial Statements (continued)
1. ORGANIZATION AND SIGNIFICANT ACCOUNTING POLICIES (cont.)
h. Guarantees and Indemnifications (cont.)
with service providers that contain general indemnification clauses. The Trust’s maximum exposure under these arrangements is unknown as this would involve future claims that may be made against the Trust that have not yet occurred. However, based on experience, the Trust expects the risk of loss to be remote.
2. SHARES OF BENEFICIAL INTEREST
The Fund offers three classes of shares: Class 1, Class 2, and Class 3. Effective May 1, 2004 the Fund began offering a new class of shares, Class 3. Each class of shares differs by its distribution fees, voting rights on matters affecting a single class and its exchange privilege.
At December 31, 2004, there were an unlimited number of shares authorized ($.01 par value). Transactions in the Fund’s shares were as follows:
| | | | | | | | | | | | | | |
| | | Year Ended December 31,
| |
| | | 2004
| | | 2003
| |
| Class 1 Shares: | | Shares
| | | Amount
| | | Shares
| | | Amount
| |
Shares sold | | 2,258,527 | | | $ | 29,175,787 | | | 4,070,068 | | | $ | 41,441,600 | |
Shares issued in reinvestment of distributions | | 437,215 | | | | 5,478,306 | | | 745,937 | | | | 7,698,069 | |
Shares redeemed | | (6,039,270 | ) | | | (77,699,934 | ) | | (8,386,415 | ) | | | (84,833,839 | ) |
| | |
| |
Net increase (decrease) | | (3,343,528 | ) | | $ | (43,045,841 | ) | | (3,570,410 | ) | | $ | (35,694,170 | ) |
| | |
| |
| Class 2 Shares: | | | | | | | | | | | | |
Shares sold | | 59,591,849 | | | $ | 761,455,379 | | | 77,265,095 | | | $ | 769,052,246 | |
Shares issued in reinvestment of distributions | | 821,762 | | | | 10,189,845 | | | 669,785 | | | | 6,848,227 | |
Shares redeemed | | (13,067,398 | ) | | | (166,150,147 | ) | | (56,376,439 | ) | | | (551,562,091 | ) |
| | |
| |
Net increase (decrease) | | 47,346,213 | | | $ | 605,495,077 | | | 21,558,441 | | | $ | 224,338,382 | |
| | |
| |
| Class 3 Shares:a | | | | | | | | | | | | |
Shares sold | | 1,203,190 | | | $ | 15,372,770 | | | | | | | | |
Shares issued in reinvestment of distributions | | 3,035 | | | | 37,599 | | | | | | | | |
Shares redeemed | | (52,162 | ) | | | (652,318 | ) | | | | | | | |
| | |
| | | | | | | |
Net increase (decrease) | | 1,154,063 | | | $ | 14,758,051 | | | | | | | | |
| | |
| | | | | | | |
| a | For the period May 1, 2004 (effective date) to December 31, 2004. |
3. TRANSACTIONS WITH AFFILIATES
Certain officers and trustees of the Fund are also officers and/or directors of the following entities:
| | |
| Entity | | Affiliation |
Templeton Investment Counsel LLC (TIC) | | Investment manager |
Franklin Templeton Services LLC (FT Services) | | Administrative manager |
Franklin Templeton Distributors Inc. (Distributors) | | Principal underwriter |
Franklin Templeton Investor Services LLC (Investor Services) | | Transfer agent |
TF-20
FRANKLIN TEMPLETON VARIABLE INSURANCE PRODUCTS TRUST
TEMPLETON FOREIGN SECURITIES FUND
Notes to Financial Statements (continued)
3. TRANSACTIONS WITH AFFILIATES (cont.)
a. Management Fees
The Fund pays an investment management fee to TIC based on the average daily net assets of the Fund as follows:
| | |
| Annualized Fee Rate | | Net Assets |
| .750% | | First $200 million |
| .675% | | Over $200 million, up to and including $1.3 billion |
| .600% | | Over $1.3 billion |
b. Administrative Fees
The Fund pays an administrative fee to FT Services based on the average daily net assets of the Fund as follows:
| | |
| Annualized Fee Rate | | Net Assets |
| .150% | | First $200 million |
| .135% | | Over $200 million, up to and including $700 million |
| .100% | | Over $700 million, up to and including $1.2 billion |
| .075% | | Over $1.2 billion |
c. Distribution Fees
The Fund reimburses Distributors up to .25% per year of its average daily net asset of Class 2 and Class 3, for costs incurred in marketing the Fund’s shares under a Rule 12b-1 plan.
d. Transfer Agent Fees
Investor Services, under terms of an agreement, performs shareholder servicing for the Fund and is not paid by the Fund for the services.
4. EXPENSE OFFSET ARRANGEMENT
The Fund has entered into an arrangement with its custodian whereby credits realized as a result of uninvested cash balances are used to reduce a portion of the Fund’s custodian expenses. During the year ended December 31, 2004, the custodian fees were reduced as noted in the Statement of Operations.
5. INCOME TAXES
At December 31, 2004, the Fund had tax basis capital losses which may be carried over to offset future capital gains. Such losses expire as follows:
| | | |
Capital loss carryovers expiring in: | | | |
2010 | | $ | 41,357,645 |
2011 | | | 66,483,700 |
| | |
|
|
| | | $ | 107,841,345 |
| | |
|
At December 31, 2004, the Fund had deferred currency losses occurring subsequent to October 31, 2004 of $33,378. For tax purposes, such losses will be reflected in the year ending December 31, 2005.
TF-21
FRANKLIN TEMPLETON VARIABLE INSURANCE PRODUCTS TRUST
TEMPLETON FOREIGN SECURITIES FUND
Notes to Financial Statements (continued)
5. INCOME TAXES (cont.)
The tax character of distributions paid during the years ended December 31, 2004 and 2003, was as follows:
| | | | | | |
| | | 2004
| | 2003
|
Distributions paid from ordinary income | | $ | 15,705,859 | | $ | 14,546,296 |
| | |
|
Net investment income (loss) and realized gains (losses) differ for financial statement and tax purposes primarily due to differing treatments of foreign currency transactions and passive foreign investment company shares.
At December 31, 2004, the cost of investments, net unrealized appreciation (depreciation), and undistributed ordinary income for income tax purposes were as follows:
| | | | |
Cost of investments | | $ | 1,579,318,010 | |
| | |
|
|
|
Unrealized appreciation | | $ | 414,603,997 | |
Unrealized depreciation | | | (29,998,986 | ) |
| | |
|
|
|
Net unrealized appreciation (depreciation) | | $ | 384,605,011 | |
| | |
|
|
|
Distributable earnings – undistributed ordinary income | | $ | 24,955,154 | |
| | |
| |
6. INVESTMENT TRANSACTIONS
Purchases and sales of investments (excluding short-term securities) for the year ended December 31, 2004, aggregated $631,313,598 and $136,544,183, respectively.
7. INVESTMENTS IN FRANKLIN INSTITUTIONAL FIDUCIARY TRUST MONEY MARKET PORTFOLIO
The Fund may invest in the Franklin Institutional Fiduciary Trust Money Market Portfolio (the Sweep Money Fund), an open-end investment company managed by Franklin Advisers Inc. (an affiliate of the investment manager). Management fees paid by the Fund are reduced on assets invested in the Sweep Money Fund, in an amount not to exceed the management fees paid by the Sweep Money Fund.
8. REGULATORY MATTERS
Investigations
As part of various investigations by a number of federal, state, and foreign regulators and governmental entities, including the Securities and Exchange Commission (“SEC”), the California Attorney General’s Office (“CAGO”), and the National Association of Securities Dealers, Inc. (“NASD”), relating to certain practices in the mutual fund industry, including late trading, market timing and marketing support payments to securities dealers who sell fund shares, Franklin Resources, Inc. and certain of its subsidiaries (as used in this section, together, the “Company”), as well as certain current or former executives and employees of the Company, received subpoenas and/or requests for documents, information and/or testimony. The Company and its current employees provided documents and information in response to those requests and subpoenas.
Settlements
Beginning in August 2004, the Company entered into settlements with certain regulators investigating the mutual fund industry practices noted above. The Company believes that settlement of each of the matters described in this section is in the best interest of the Company and shareholders of the Franklin, Templeton, and Mutual Series mutual funds (the “funds”).
TF-22
FRANKLIN TEMPLETON VARIABLE INSURANCE PRODUCTS TRUST
TEMPLETON FOREIGN SECURITIES FUND
Notes to Financial Statements (continued)
8. REGULATORY MATTERS (cont.)
Settlements (cont.)
On August 2, 2004, Franklin Resources, Inc. announced that its subsidiary, Franklin Advisers, Inc., reached an agreement with the SEC that resolved the issues resulting from the SEC investigation into market timing activity. In connection with that agreement, the SEC issued an “Order Instituting Administrative and Cease-and-Desist Proceedings Pursuant to Sections 203(e) and 203(k) of the Investment Advisers Act of 1940 and Sections 9(b) and 9(f) of the Investment Company Act of 1940, Making Findings and Imposing Remedial Sanctions and a Cease-and-Desist Order” (the “Order”). The SEC’s Order concerned the activities of a limited number of third parties that ended in 2000 and those that were the subject of the first Massachusetts administrative complaint described below.
Under the terms of the SEC’s Order, pursuant to which Franklin Advisers, Inc. neither admitted nor denied any of the findings contained therein, Franklin Advisers, Inc. agreed to pay $50 million, of which $20 million is a civil penalty, to be distributed to shareholders of certain funds in accordance with a plan to be developed by an independent distribution consultant. At this time, it is unclear which funds or which shareholders of any particular fund will receive distributions. The Order also required Franklin Advisers, Inc. to, among other things, enhance and periodically review compliance policies and procedures.
On September 20, 2004, Franklin Resources, Inc. announced that two of its subsidiaries, Franklin Advisers, Inc. and Franklin Templeton Alternative Strategies, Inc. (“FTAS”), reached an agreement with the Securities Division of the Office of the Secretary of the Commonwealth of Massachusetts (the “State of Massachusetts”) related to its administrative complaint filed on February 4, 2004, concerning one instance of market timing that was also a subject of the August 2, 2004 settlement that Franklin Advisers, Inc. reached with the SEC, as described above.
Under the terms of the settlement consent order issued by the State of Massachusetts, Franklin Advisers, Inc. and FTAS consented to the entry of a cease-and-desist order and agreed to pay a $5 million administrative fine to the State of Massachusetts (the “Massachusetts Consent Order”). The Massachusetts Consent Order included two different sections: “Statements of Fact” and “Violations of Massachusetts Securities Laws.” Franklin Advisers, Inc. and FTAS admitted the facts in the Statements of Fact.
On October 25, 2004, the State of Massachusetts filed a second administrative complaint, alleging that Franklin Resources, Inc.’s Form 8-K filing (in which it described the Massachusetts Consent Order and stated that “Franklin did not admit or deny engaging in any wrongdoing”) failed to state that Franklin Advisers, Inc. and FTAS admitted the Statements of Fact portion of the Massachusetts Consent Order (the “Second Complaint”). Franklin Resources, Inc. reached a second agreement with the State of Massachusetts on November 19, 2004, resolving the Second Complaint. As a result of the November 19, 2004 settlement, Franklin Resources, Inc. filed a new Form 8-K. The terms of the Massachusetts Consent Order did not change and there was no monetary fine associated with this second settlement.
On November 17, 2004, Franklin Resources, Inc. announced that Franklin/Templeton Distributors, Inc. (“FTDI”) reached an agreement with the CAGO, resolving the issues resulting from the CAGO’s investigation concerning sales and marketing support payments. Under the terms of the settlement, FTDI neither admitted nor denied the allegations in the CAGO’s complaint and agreed to pay $2 million to the State of California as a civil penalty, $14 million to the funds, to be allocated by an independent distribution consultant to be paid for by FTDI, and $2 million to the CAGO for its investigative costs.
On December 13, 2004, Franklin Resources, Inc. announced that its subsidiaries FTDI and Franklin Advisers, Inc. reached an agreement with the SEC, resolving the issues resulting from the SEC’s investigation concerning marketing support payments to securities dealers who sell fund shares. In connection with that agreement, the SEC issued an “Order Instituting Administrative and Cease-and-Desist Proceedings, Making Findings, and Imposing Remedial Sanctions Pursuant to Sections 203(e) and 203(k) of the Investment Advisers Act of 1940, Sections 9(b) and 9(f) of the Investment Company Act of 1940, and Section 15(b) of the Securities Exchange Act of 1934” (the “Second Order”).
TF-23
FRANKLIN TEMPLETON VARIABLE INSURANCE PRODUCTS TRUST
TEMPLETON FOREIGN SECURITIES FUND
Notes to Financial Statements (continued)
8. REGULATORY MATTERS (cont.)
Settlements (cont.)
Under the terms of the Second Order, in which FTDI and Franklin Advisers, Inc. neither admitted nor denied the findings contained therein, they agreed to pay the funds a penalty of $20 million and disgorgement of $1 (one dollar). FTDI and Franklin Advisers, Inc. also agreed to implement certain measures and undertakings relating to marketing support payments to broker-dealers for the promotion or sale of fund shares, including making additional disclosures in the funds’ Prospectuses and Statements of Additional Information. The Second Order further requires the appointment of an independent distribution consultant, at the Company’s expense, who shall develop a plan for the distribution of the penalty and disgorgement to the funds.
Other Legal Proceedings
The Trust, in addition to the Company and other funds, and certain current and former officers, employees, and directors have been named in multiple lawsuits in different federal courts in Nevada, California, Illinois, New York and Florida, alleging violations of various federal securities laws and seeking, among other relief, monetary damages, restitution, removal of fund trustees, directors, advisers, administrators, and distributors, rescission of management contracts and 12b-1 Plans, and/or attorneys’ fees and costs. Specifically, the lawsuits claim breach of duty with respect to alleged arrangements to permit market timing and/or late trading activity, or breach of duty with respect to the valuation of the portfolio securities of certain Templeton funds managed by Franklin Resources, Inc. subsidiaries, resulting in alleged market timing activity. The majority of these lawsuits duplicate, in whole or in part, the allegations asserted in the February 4, 2004 Massachusetts administrative complaint and the findings in the SEC’s August 2, 2004 Order, as described above. The lawsuits are styled as class actions, or derivative actions on behalf of either the named funds or Franklin Resources, Inc.
In addition, the Company, as well as certain current and former officers, employees, and directors, have been named in multiple lawsuits alleging violations of various securities laws and pendent state law claims relating to the disclosure of directed brokerage payments and/or payment of allegedly excessive advisory, commission, and distribution fees, and seeking, among other relief, monetary damages, restitution, rescission of advisory contracts, including recovery of all fees paid pursuant to those contracts, an accounting of all monies paid to the named advisers, declaratory relief, injunctive relief, and/or attorneys’ fees and costs. These lawsuits are styled as class actions or derivative actions brought on behalf of certain funds.
The Company and fund management strongly believes that the claims made in each of the lawsuits identified above are without merit and intends to vigorously defend against them. The Company cannot predict with certainty, however, the eventual outcome of the remaining governmental investigations or private lawsuits, nor whether they will have a material negative impact on the Company. Public trust and confidence are critical to the Company’s business and any material loss of investor and/or client confidence could result in a significant decline in assets under management by the Company, which would have an adverse effect on the Company’s future financial results. If the Company finds that it bears responsibility for any unlawful or inappropriate conduct that caused losses to the Trust, it is committed to making the Trust or its shareholders whole, as appropriate. The Company is committed to taking all appropriate actions to protect the interests of its funds’ shareholders.
TF-24
FRANKLIN TEMPLETON VARIABLE INSURANCE PRODUCTS TRUST
TEMPLETON FOREIGN SECURITIES FUND
Report of Independent Registered Public Accounting Firm
To the Trustees and Shareholders of
Franklin Templeton Variable Insurance Products Trust
In our opinion, the accompanying statement of assets and liabilities, including the statement of investments, and the related statements of operations and of changes in net assets and the financial highlights present fairly, in all material respects, the financial position of Templeton Foreign Securities Fund (the Fund) (one of the funds constituting Franklin Templeton Variable Insurance Products Trust) at December 31, 2004, the results of its operations for the year then ended, the changes in its net assets for each of the two years in the period then ended and the financial highlights for each of the periods presented, in conformity with accounting principles generally accepted in the United States of America. These financial statements and financial highlights (hereafter referred to as “financial statements”) are the responsibility of the Fund’s management; our responsibility is to express an opinion on these financial statements based on our audits. We conducted our audits of these financial statements in accordance with the standards of the Public Company Accounting Oversight Board (United States). Those standards require that we plan and perform the audits to obtain reasonable assurance about whether the financial statements are free of material misstatement. An audit includes examining, on a test basis, evidence supporting the amounts and disclosures in the financial statements, assessing the accounting principles used and significant estimates made by management, and evaluating the overall financial statement presentation. We believe that our audits, which included confirmation of securities at December 31, 2004 by correspondence with the custodian and brokers, provide a reasonable basis for our opinion.
PricewaterhouseCoopers LLP
San Francisco, California
February 9, 2005
TF-25
FRANKLIN TEMPLETON VARIABLE INSURANCE PRODUCTS TRUST
TEMPLETON FOREIGN SECURITIES FUND
Tax Designation (unaudited)
At December 31, 2004, more than 50% of the Fund’s total assets were invested in securities of foreign issuers. In most instances, foreign taxes were withheld from dividends paid to the Fund on these investments. The Fund elects to treat foreign taxes paid under Section 853 of the Internal Revenue Code. This election will allow shareholders of record in June 2005, to treat their proportionate share of foreign taxes paid by the Fund as having been paid directly by them. The shareholder shall consider these amounts as foreign taxes paid in the tax year in which they receive the Fund distribution.
The foreign tax information will be disclosed in the June 2005, semi-annual report of the Fund.
TF-26
TEMPLETON GLOBAL ASSET ALLOCATION FUND
We are pleased to bring you Templeton Global Asset Allocation Fund’s annual report for the fiscal year ended December 31, 2004.
Performance Summary as of 12/31/04
Average annual total return of Class 2 shares* represents the average annual change in value, assuming reinvestment of dividends and capital gains. Average returns smooth out variations in returns, which can be significant; they are not the same as year-by-year results.
Periods ended 12/31/04
| | | | | | |
| | | 1-Year | | 5-Year | | 10-Year |
Average Annual Total Return | | +15.72% | | +5.63% | | +11.13% |
*Performance prior to the 5/1/00 merger reflects the historical performance of Templeton Asset Allocation Fund. Additionally, because Class 2 shares were not offered until 5/1/97, standardized Class 2 Fund performance for prior periods represents the historical results of Class 1 shares. For periods beginning on 5/1/97, Class 2’s results reflect an additional 12b-1 fee expense, which also affects future performance. Since 5/1/97 (effective date), the average annual total return of Class 2 shares was +8.51%.
Total Return Index Comparison
for Hypothetical $10,000 Investment (1/1/95–12/31/04)
The graph below shows the change in value of a hypothetical $10,000 investment in the Fund over the indicated period and includes reinvestment of any income or distributions. The Fund’s performance* is compared to the performance of the Morgan Stanley Capital International (MSCI) All Country (AC) World Index and the J.P. Morgan (JPM) Government Bond Index (GBI) Global. One cannot invest directly in an index, nor is an index representative of the Fund’s portfolio. Please see Important Notes to Performance Information preceding the Fund Summaries.
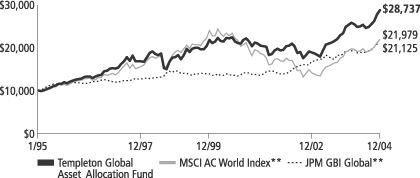
**Sources: Standard & Poor’s Micropal; J.P. Morgan. Please see Index Descriptions following the Fund Summaries.
Templeton Global Asset Allocation Fund – Class 2
Performance reflects the Fund’s Class 2 operating expenses, but does not include any contract fees, expenses or sales charges. If they had been included, performance would be lower. These charges and deductions, particularly for variable life policies, can have a significant effect on contract values and insurance benefits. See the contract prospectus for a complete description of these expenses, including sales charges.
Performance data quoted represent past performance, which does not guarantee future results. Investment return and principal value will fluctuate, and you may have a gain or loss when you sell your shares. Current performance may differ from figures shown.
TGA-1
Fund Goal and Main Investments: Templeton Global Asset Allocation Fund seeks high total return. The Fund invests in equity securities of companies of any country, debt securities of companies and governments of any country, and in money market instruments. The Fund may invest in lower-rated “junk bonds.”
Performance Overview
You can find the Fund’s one-year total return in the Performance Summary. The Fund’s performance was comparable to its broad equity benchmark, the MSCI AC World Index, which returned 15.75% for the year under review, and it outperformed its fixed income benchmark, the JPM GBI Global, which returned 10.10% during the same period.1
Economic and Market Overview
The global economic recovery continued in 2004, led by growth in China and the U.S. As of December 31, 2004, U.S. gross domestic product (GDP) had increased for 13 consecutive quarters.2 In China, GDP grew 9.5% in 2004.3
The 12-nation euro zone lagged other regions in the current recovery. However, the European Central Bank projected euro zone growth may be between 1.6% and 2.0% in 2004, compared with only 0.5% in 2003. In Japan, the economy struggled to emerge from a decade-long deflationary period. Although the country’s consumer and business confidence reached their highest levels since 1991, economic growth slowed in response to higher oil prices and reduced external demand. In addition, the U.S. dollar declined approximately 4% versus the yen and 7% versus the euro during 2004.4 This hurt Japanese and European exports into the U.S., as it made their goods more expensive in the world’s biggest market. However, the greenback’s protracted decline should also benefit the U.S. current account deficit by making U.S. goods more competitive in international markets.
Oil prices increased during most of 2004, reaching $56 per barrel in October, but declined to end the year at $43. Higher oil prices triggered investor worries about inflation, decreased spending — due to cautionary consumer and business sentiment — and slower economic and corporate
1. Sources: Standard & Poor’s Micropal; J.P. Morgan. One cannot invest directly in an index, nor is an index representative of the Fund’s portfolio. Please see Index Descriptions following the Fund Summaries.
2. Source: Bureau of Economic Analysis.
3. Source: National Bureau of Statistics of China.
4. Source: FactSet Research Systems Inc.
Fund Risks: Stocks offer the potential for long-term gains but can be subject to short-term up-and-down price movements. Foreign investing involves special risks including currency fluctuations, economic instability, and social and political developments. Emerging markets involve heightened risks due to their relatively smaller size and lesser liquidity. Bonds and other debt obligations are affected by changes in interest rates and the creditworthiness of their issuers. High yield, lower-rated (junk) bonds generally have greater price swings and higher default risks. The Fund’s prospectus also includes a description of the main investment risks.
TGA-2
profit growth. As of December 31, 2004, the 12-month moving average price of oil was about $41 per barrel.5
In this environment, the MSCI AC World Index’s total return was 15.75% in U.S. dollars for the 12-month period ended December 31, 2004.6 Emerging markets, as measured by the MSCI Emerging Markets Index, had a one-year total return of 25.95% in U.S. dollars.6 In local currencies, these indexes had notably lower total returns of 12.05% and 16.45% for the same period.6 In 2004, most of the world’s currencies strengthened in relation to the U.S. dollar, which benefited U.S.-based investors of non-U.S. developed and emerging market equities.
Global bond markets generated positive returns as global treasury yield curves flattened and most major currencies appreciated relative to the U.S. dollar. The global demand upswing in 2004 favored U.S. exports, which expanded at double-digit rates. However, the U.S. trade and current account balances reached record deficit levels as import volume continued to exceed exports. The magnitude of the current account deficit also remained quite large relative to the country’s economy at nearly 5.6% of GDP.7 The U.S. dollar continued to depreciate over the past year, declining 6.3% against the U.S.’s major trading partners.8
The European Central Bank (ECB) left interest rates unchanged throughout the year. Among the central European and Scandinavian countries, exports and investment experienced robust growth over the year, driving most recent GDP growth estimates for Poland, Sweden and Hungary. Rising inflationary pressures accompanied Poland’s stronger growth, while inflation rates in Hungary slowed and remained low in Sweden and Norway. Additionally, Sweden and Norway maintained impressive current account surpluses at nearly 7% and 13% of GDP.9
In Asia, robust domestic demand and export strength bolstered balance-of-payment positions in countries such as China and Thailand. Both countries experienced building inflationary pressures, prompting the monetary authorities to raise interest rates or implement administrative measures to maintain low inflation. While Asia’s domestic growth conditions led to interest rate increases, the region’s balance-of-payment conditions facilitating international reserve accumulation
5. Source: U.S. Department of Energy.
6. Source: Standard & Poor’s Micropal. Please see Index Descriptions following the Fund Summaries.
7. Source: Bureau of Economic Analysis. For the one year ended 12/31/04.
8. Source: Federal Reserve Board.
9. Sources: Sveriges Riksbank (Sweden); Statistics Sweden; and Statistics Norway.
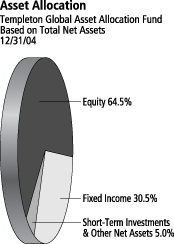
TGA-3
remained intact. Australia and New Zealand were some of the primary beneficiaries of strong commodity prices over the year as commodities comprised much of their exports, and growth remained strong despite higher interest rates.
Investment Strategy
Our investment philosophy is bottom-up, value-oriented and long-term. In choosing equity investments, we will focus on the market price of a company’s securities relative to our evaluation of the company’s potential long-term earnings, asset value and cash flow. Among factors we consider are a company’s historical value measures, including price/earnings ratio, profit margins and liquidation value.
In choosing debt investments, we allocate our assets among issuers, geographic regions and currencies based upon our assessment of relative interest rates among currencies, our outlook for changes in interest rates, and credit risks. With respect to debt securities, we may also from time to time make use of forward currency exchange contracts (Hedging Instruments) for hedging purposes.
Manager’s Discussion
Equity
During the year under review, the Fund benefited from a variety of sectors and individual holdings. For example, portfolio holdings within the energy sector provided healthy returns for the Fund as they benefited from steadily rising oil and other energy commodity prices throughout the year.10 The Fund’s utilities sector holdings also performed well during the year largely due to healthy earnings growth and a low interest rate environment.11 Our top performers included German multi-utility E.ON, U.K. power and gas grid operator National Grid Transco, Spanish electric utility Endesa and France’s Suez, which provides electricity, natural gas, water and waste management services to more than 130 countries.
The Fund’s holdings in the materials sector also boosted returns in 2004 due primarily to rising commodity prices caused by improved global economic growth and a significant increase in demand from China.12 Our top-performing stocks included Australian mining and oil company BHP Billiton; South Korean steel producer POSCO; Companhia Vale do Rio Doce, a diversified Brazilian mining company; and
10. In the SOI, the energy sector comprises oil and gas.
11. In the SOI, the utilities sector comprises electric utilities, and multi-utilities and unregulated power.
12. In the SOI, the materials sector comprises chemicals, containers and packaging, metals and mining, and paper and forest products.
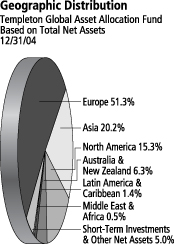
TGA-4
BASF, a Germany-based global manufacturer with interests in chemicals, plastics, and oil and gas exploration.
Industrials stocks were another solid contributor to the Fund’s total returns, even though we were underweighted versus the index.13 Many such companies benefited from improving global economic growth and rising earnings. Our best-performing stocks within the group included BAE Systems, Europe’s largest defense contractor; Volvo, the Swedish manufacturer of vehicles, aircraft and engines; Kidde, a U.K.-based leading global supplier of fire and explosion protection systems; U.K. aircraft engine maker Rolls-Royce; and Boeing, the U.S.-based aerospace and commercial jet manufacturer.
In general, if the value of the U.S. dollar goes up compared with a foreign currency, an investment traded in that foreign currency will go down in value because it will be worth fewer U.S. dollars. This can have a negative effect on Fund performance. Conversely, when the U.S. dollar weakens in relation to a foreign currency, an investment traded in that foreign currency will increase in value, which can contribute to Fund performance. For the 12 months ended December 31, 2004, the U.S. dollar declined in value relative to most non-U.S. currencies. At the end of the period, the Fund’s portfolio was invested predominantly in securities with non-U.S. currency exposure, which resulted in a positive effect on Fund performance. However, one cannot expect the same result in future periods.
Even though the Fund posted double-digit returns this year, there were some disappointments. For example, we had favorable stock selection in information technology (IT) stocks, and our underweighted exposure versus the MSCI AC World Index helped relative performance, but in absolute terms the IT industry underperformed the index.14 Poorer performing Fund holdings included NEC, a Japanese IT solutions provider; Synopsys, the U.S.-based leader in electronic design automation software and services; enterprise management software maker BMC Software; and U.S.-based hard disk drive manufacturer Maxtor.
Elsewhere, our stock selection in the consumer staples sector detracted from the Fund’s overall return.15 Many of the companies within the group performed poorly due to pricing pressure and earnings
13. In the SOI, the industrials sector comprises air freight and logistics, aerospace and defense, commercial services and supplies, electrical equipment, industrial conglomerates, and machinery.
14. In the SOI, the information technology sector comprises computers and peripherals, electronic equipment and instruments, IT services, semiconductors and semiconductor equipment, and software.
15. In the SOI, the consumer staples sector comprises food products.
Top 5 Sectors/Industries
Templeton Global Asset Allocation Fund
Based on Equity Securities
12/31/04
| | |
| | | % of Total Net Assets |
| |
| Media | | 5.5% |
| |
| Commercial Banks | | 4.7% |
| |
| Pharmaceuticals | | 4.7% |
| |
| Diversified Telecommunication Services | | 4.0% |
| |
| Software | | 3.2% |
The dollar value, number of shares or principal amount, and names of all portfolio holdings are listed in the Fund’s Statement of Investments.
TGA-5
disappointments. Notable laggards during the year included three European companies: U.K.-based supermarket chain J Sainsbury, U.K. global consumer goods giant Unilever, and Switzerland-based Nestlé, the world’s number-one food company.
Fixed Income
Interest Rate Strategy
During the reporting period, interest rate policy generally became less accommodative. As economic growth rebounded and an interest rate tightening cycle, particularly in the U.S., became more probable, we reduced the Fund’s overall portfolio duration exposure. Although the Fed raised U.S. interest rates, short-term real interest rates (accounting for inflation) remained negative and the monetary stance still accommodative. Therefore, the Fund remained positioned defensively to a further rise in U.S. interest rates by maintaining a zero allocation to U.S. Treasury securities.
Globally, we found opportunities during the period where interest rate reductions produced positive local market bond returns, or returns in local currency terms, and other instances where interest rate increases facilitated currency gains and overall bond market returns in U.S. dollar terms. During the period, U.S. yields were at historically low levels. Globally, several other international government treasury markets offered substantially higher yields at period-end, which was fairly typical during the reporting period. We felt this situation presented an investment opportunity for the Fund.
Currency Strategy
During the year, currency gains against the U.S. dollar helped global bond markets outperform the U.S. bond market in U.S. dollar terms as well as in local currency terms.
The U.S. sub-index of the JPM GBI Global rose 3.75% compared with other global bond markets’ 10.10% return in U.S. dollars and 4.89% in local currency.16 Consequently, the Fund benefited from its underweighted position in the U.S. relative to the JPM GBI Global.
16. Source: J.P. Morgan. Please see Index Descriptions following the Fund Summaries.
TGA-6
Fund positioning within Europe and Asia benefited relative Fund performance. As the euro rose against the U.S. dollar, we used the currency’s strength to reduce our exposure and reallocate the proceeds to other European (non-euro) and Asian currencies where we believed we saw better value. These non-euro currencies, particularly the Polish zloty, outperformed the euro, benefiting the Fund’s relative performance.
In Asia, the Fund benefited from its lack of exposure to Japan, as Japanese government bonds underperformed the broader market. The Fund continued to increase its allocation to non-Japan Asia during the period given strong regional growth and trade patterns, and to position itself for potential currency appreciation. The Fund also benefited from its overweighted position in South Korea relative to its benchmark.
Global Sovereign Debt Strategy
The Fund also purchased investment-grade and sub-investment grade sovereign debt that typically compensates for greater credit risk by offering higher yields relative to U.S. and European benchmark treasury yield curves. Despite rising U.S. interest rates, U.S. dollar-denominated emerging market debt continued to generate strong returns, rising 11.73% over the period, as measured by the JPM Emerging Markets Bond Index Global (EMBIG).16 Euro-denominated markets also rose, gaining 11.68% in euro terms and 20.51% in U.S. dollar terms, as measured by the JPM Euro EMBIG.16
Regionally, Latin American sovereign debt rose 13.10%, eastern Europe 10.57% and Asia 6.74%.17 The global demand recovery significantly benefited emerging market economies, particularly commodity exporters, supporting growth and in some cases balance of payment and fiscal conditions. As a result, underlying economic and credit fundamentals remained stronger than in previous economic tightening cycles. For example, independent credit rating agency Standard & Poor’s (S&P) upgraded Venezuela’s and Russia’s sovereign debt during the year mainly due to higher oil prices, the alleviation of some political risks in Venezuela and Russia’s prudent fiscal and economic policies. Similarly, S&P also upgraded Ukraine’s rating.
17. Source: J.P. Morgan.
Top 5 Country Holdings
Templeton Global Asset Allocation Fund
Based on Total Net Assets
12/31/04
| | |
| |
| U.S | | 12.7% |
| |
| U.K. | | 9.4% |
| |
| South Korea | | 7.3% |
| |
| Sweden | | 6.9% |
| |
| Japan | | 5.8% |
TGA-7
Although U.S. dollar denominated sovereign debt produced solid returns over the 12-month period, the Fund shortened duration and reallocated away from U.S. dollar-denominated investment-grade and sub-investment grade debt given a greater sensitivity to rising U.S. rates.
Thank you for your participation in Templeton Global Asset Allocation Fund. We look forward to serving your future investment needs.
The foregoing information reflects our analysis, opinions and portfolio holdings as of December 31, 2004, the end of the reporting period. The way we implement our main investment strategies and the resulting portfolio holdings may change depending on factors such as market and economic conditions. These opinions may not be relied upon as investment advice or an offer for a particular security. The information is not a complete analysis of every aspect of any market, country, industry, security or the Fund. Statements of fact are from sources considered reliable, but the adviser makes no representation or warranty as to their completeness or accuracy. Although historical performance is no guarantee of future results, these insights may help you understand our investment management philosophy.
TGA-8
Fund Expenses
As an investor in a variable insurance contract (“Contract”) that indirectly provides for investment in an underlying mutual fund, you can incur transaction and/or ongoing expenses at both the Fund level and the Contract level.
| • | | Transaction expenses can include sales charges (loads) on purchases, redemption fees, surrender fees, transfer fees and premium taxes. |
| • | | Ongoing expenses can include management fees, distribution and service (12b-1) fees, contract fees, annual maintenance fees, mortality and expense risk fees and other fees and expenses. All mutual funds and Contracts have some types of ongoing expenses. |
The expenses shown in the table below are meant to highlight ongoing expenses at the Fund level only and do not include ongoing expenses at the Contract level, or transaction expenses at either the Fund or Contract levels. While the Fund does not have transaction expenses, if the transaction and ongoing expenses at the Contract level were included, the expenses shown below would be higher. You should consult your Contract prospectus or disclosure document for more information.
The table shows Fund-level ongoing expenses and can help you understand these expenses and compare them with those of other mutual funds offered through the Contract. The table assumes a $1,000 investment held for the six months indicated. Please refer to the Fund prospectus for additional information on operating expenses.
Actual Fund Expenses
The first line (Actual) for each share class listed in the table below provides actual account values and expenses. The “Ending Account Value” is derived from the Fund’s actual return, which includes the effect of ongoing Fund expenses, but does not include the effect of ongoing Contract expenses.
You can estimate the Fund-level expenses you incurred during the period, by following these steps. Of course, your account value and expenses will differ from those in this illustration:
| 1. | Divide your account value by $1,000. |
If an account had an $8,600 value, then $8,600 ÷ $1,000 = 8.6.
| 2. | Multiply the result by the number under the heading “Fund-Level Expenses Incurred During Period.” |
If Fund-Level Expenses Incurred During Period were $7.50, then 8.6 × $7.50 = $64.50.
Templeton Global Asset Allocation Fund – Class 2
TGA-9
In this illustration, the estimated expenses incurred this period at the Fund level are $64.50.
Hypothetical Example for Comparison with Other Mutual Funds
Information in the second line (Hypothetical) for each class in the table can help you compare ongoing expenses of the Fund with those of other mutual funds offered through the Contract. This information may not be used to estimate the actual ending account balance or expenses you incurred during the period. The hypothetical “Ending Account Value” is based on the actual expense ratio for each class and an assumed 5% annual rate of return before expenses, which does not represent the Fund’s actual return. The figure under the heading “Fund-Level Expenses Incurred During Period” shows the hypothetical expenses your account would have incurred under this scenario. You can compare this figure with the 5% hypothetical examples that appear in shareholder reports of other funds offered through a Contract.
| | | | | | | | | |
| Class 2 | | Beginning
Account
Value 6/30/04 | | Ending
Account
Value 12/31/04 | | Fund-Level
Expenses Incurred
During Period*
6/30/04-12/31/04 |
Actual | | $ | 1,000 | | $ | 1,133.00 | | $ | 5.90 |
Hypothetical (5% return before expenses) | | $ | 1,000 | | $ | 1,019.61 | | $ | 5.58 |
*Expenses are equal to the annualized expense ratio for the Fund’s Class 2 shares (1.10%), which does not include any ongoing expenses of the Contract for which the Fund is an investment option, multiplied by the average account value over the period, multiplied by 184/366 to reflect the one-half year period.
TGA-10
FRANKLIN TEMPLETON VARIABLE INSURANCE PRODUCTS TRUST
TEMPLETON GLOBAL ASSET ALLOCATION FUND
Financial Highlightsa
| | | | | | | | | | | | | | | | | | | | |
| | | Class 1
| |
| | | Year Ended December 31,
| |
| | | 2004 | | | 2003 | | | 2002 | | | 2001 | | | 2000 | |
| | |
|
|
|
Per share operating performance | | | | | | | | | | | | | | | | | | | | |
(for a share outstanding throughout the year) | | | | | | | | | | | | | | | | | | | | |
Net asset value, beginning of year | | $ | 18.78 | | | $ | 14.59 | | | $ | 15.51 | | | $ | 19.22 | | | $ | 23.37 | |
| | |
|
|
|
Income from investment operations: | | | | | | | | | | | | | | | | | | | | |
Net investment incomeb | | | .48 | | | | .41 | | | | .39 | | | | .38 | d | | | .44 | |
Net realized and unrealized gains (losses) | | | 2.42 | | | | 4.23 | | | | (1.01 | ) | | | (2.16 | )d | | | (.45 | ) |
| | |
|
|
|
Total from investment operations | | | 2.90 | | | | 4.64 | | | | (.62 | ) | | | (1.78 | ) | | | (.01 | ) |
| | |
|
|
|
Less distributions from: | | | | | | | | | | | | | | | | | | | | |
Net investment income | | | (.57 | ) | | | (.45 | ) | | | (.30 | ) | | | (.26 | ) | | | (.52 | ) |
Net realized gains | | | — | | | | — | | | | — | | | | (1.67 | ) | | | (3.62 | ) |
| | |
|
|
|
Total distributions | | | (.57 | ) | | | (.45 | ) | | | (.30 | ) | | | (1.93 | ) | | | (4.14 | ) |
| | |
|
|
|
Net asset value, end of year | | $ | 21.11 | | | $ | 18.78 | | | $ | 14.59 | | | $ | 15.51 | | | $ | 19.22 | |
| | |
|
|
|
| | | | | |
Total returnc | | | 15.94% | | | | 32.31% | | | | (4.17)% | | | | (9.72)% | | | | .29% | |
Ratios/supplemental data | | | | | | | | | | | | | | | | | | | | |
Net assets, end of year (000’s) | | $ | 625,728 | | | $ | 572,798 | | | $ | 425,470 | | | $ | 501,074 | | | $ | 628,244 | |
Ratios to average net assets: | | | | | | | | | | | | | | | | | | | | |
Expenses | | | .84% | | | | .81% | | | | .81% | | | | .81% | | | | .81% | |
Net investment income | | | 2.52% | | | | 2.54% | | | | 2.56% | | | | 2.28% | d | | | 2.20% | |
Portfolio turnover rate | | | 27.43% | | | | 34.25% | | | | 27.27% | | | | 35.63% | | | | 30.32% | |
| a | Financial highlights presented reflect historical financial information from Templeton Variable Products Series Fund (TVP)-Templeton Asset Allocation Fund as a result of a merger on May 1, 2000. |
| b | Based on average daily shares outstanding. |
| c | Total return does not include any fees, charges or expenses imposed by the variable annuity and life insurance contracts for which the Franklin Templeton Variable Insurance Products Trust serves as an underlying investment vehicle. Total return is not annualized for periods less than one year. |
| d | Effective January 1, 2001, the Fund adopted the provisions of the AICPA Audit and Accounting Guide for Investment Companies and began amortizing all premium and discount on fixed-income securities, as required. The effect of this change was as follows: |
| | |
Net investment income per share | | $(.018) |
Net realized and unrealized gains per share | | .018 |
Ratio of net investment income to average net assets | | (.10)% |
Per share data and ratios for prior periods have not been restated to reflect this change in accounting policy.
TGA-11
See notes to financial statements.
FRANKLIN TEMPLETON VARIABLE INSURANCE PRODUCTS TRUST
TEMPLETON GLOBAL ASSET ALLOCATION FUND
Financial Highlights (continued)
| | | | | | | | | | | | | | | | | | | | |
| | | Class 2
| |
| | | Year Ended December 31,
| |
| | | 2004 | | | 2003 | | | 2002 | | | 2001 | | | 2000 | |
| | |
|
|
|
Per share operating performance | | | | | | | | | | | | | | | | | | | | |
(for a share outstanding throughout the year) | | | | | | | | | | | | | | | | | | | | |
Net asset value, beginning of year | | $ | 18.64 | | | $ | 14.49 | | | $ | 15.41 | | | $ | 19.13 | | | $ | 23.27 | |
| | |
| |
Income from investment operations: | | | | | | | | | | | | | | | | | | | | |
Net investment incomeb | | | .43 | | | | .36 | | | | .34 | | | | .33 | d | | | .37 | |
Net realized and unrealized gains (losses) | | | 2.41 | | | | 4.20 | | | | (1.00 | ) | | | (2.15 | )d | | | (.43 | ) |
| | |
|
|
|
Total from investment operations | | | 2.84 | | | | 4.56 | | | | (.66 | ) | | | (1.82 | ) | | | (.06 | ) |
| | |
|
|
|
Less distributions from: | | | | | | | | | | | | | | | | | | | | |
Net investment income | | | (.54 | ) | | | (.41 | ) | | | (.26 | ) | | | (.23 | ) | | | (.46 | ) |
Net realized gains | | | — | | | | — | | | | — | | | | (1.67 | ) | | | (3.62 | ) |
| | |
|
|
|
Total distributions | | | (.54 | ) | | | (.41 | ) | | | (.26 | ) | | | (1.90 | ) | | | (4.08 | ) |
| | |
|
|
|
Net asset value, end of year | | $ | 20.94 | | | $ | 18.64 | | | $ | 14.49 | | | $ | 15.41 | | | $ | 19.13 | |
| | |
|
|
|
| | | | | |
Total returnc | | | 15.72% | | | | 31.95% | | | | (4.39)% | | | | (9.95)% | | | | .04% | |
| | | | | |
Ratios/supplemental data | | | | | | | | | | | | | | | | | | | | |
Net assets, end of year (000’s) | | $ | 65,806 | | | $ | 55,754 | | | $ | 39,926 | | | $ | 38,974 | | | $ | 32,346 | |
Ratios to average net assets: | | | | | | | | | | | | | | | | | | | | |
Expenses | | | 1.09% | | | | 1.06% | | | | 1.06% | | | | 1.06% | | | | 1.07% | |
Net investment income | | | 2.27% | | | | 2.29% | | | | 2.31% | | | | 1.99% | d | | | 1.91% | |
Portfolio turnover rate | | | 27.43% | | | | 34.25% | | | | 27.27% | | | | 35.63% | | | | 30.32% | |
| a | Financial highlights presented reflect historical financial information from Templeton Variable Products Series Fund (TVP)-Templeton Asset Allocation Fund as a result of a merger on May 1, 2000. |
| b | Based on average daily shares outstanding. |
| c | Total return does not include any fees, charges or expenses imposed by the variable annuity and life insurance contracts for which the Franklin Templeton Variable Insurance Products Trust serves as an underlying investment vehicle. Total return is not annualized for periods less than one year. |
| d | Effective January 1, 2001, the Fund adopted the provisions of the AICPA Audit and Accounting Guide for Investment Companies and began amortizing all premium and discount on fixed-income securities, as required. The effect of this change was as follows: |
| | |
Net investment income per share | | $(.018) |
Net realized and unrealized gains per share | | .018 |
Ratio of net investment income to average net assets | | (.10)% |
Per share data and ratios for prior periods have not been restated to reflect this change in accounting policy.
See notes to financial statements.
TGA-12
FRANKLIN TEMPLETON VARIABLE INSURANCE PRODUCTS TRUST
TEMPLETON GLOBAL ASSET ALLOCATION FUND
Statement of Investments, December 31, 2004
| | | | | | | |
| | | COUNTRY | | SHARES | | VALUE |
Common Stocks 64.0% | | | | | | | |
Aerospace & Defense 1.6% | | | | | | | |
BAE Systems PLC | | United Kingdom | | 667,495 | | $ | 2,953,234 |
Boeing Co. | | United States | | 116,600 | | | 6,036,382 |
aRolls-Royce Group PLC | | United Kingdom | | 464,247 | | | 2,201,025 |
aRolls-Royce Group PLC, B | | United Kingdom | | 14,763,054 | | | 28,904 |
| | | | | | |
|
|
| | | | | | | | 11,219,545 |
| | | | | | |
|
|
Air Freight & Logistics .9% | | | | | | | |
Deutsche Post AG | | Germany | | 255,240 | | | 5,839,639 |
| | | | | | |
|
|
Auto Components 1.7% | | | | | | | |
Autoliv Inc., SDR | | Sweden | | 129,000 | | | 6,174,571 |
Valeo SA | | France | | 140,790 | | | 5,884,400 |
| | | | | | |
|
|
| | | | | | | | 12,058,971 |
| | | | | | |
|
|
Automobiles .5% | | | | | | | |
Volkswagen AG | | Germany | | 70,650 | | | 3,197,331 |
| | | | | | |
|
|
Capital Markets 1.6% | | | | | | | |
Amvescap PLC | | United Kingdom | | 587,500 | | | 3,617,041 |
Morgan Stanley | | United States | | 30,900 | | | 1,715,568 |
Nomura Holdings Inc. | | Japan | | 244,600 | | | 3,567,979 |
UBS AG | | Switzerland | | 29,200 | | | 2,435,577 |
| | | | | | |
|
|
| | | | | | | | 11,336,165 |
| | | | | | |
|
|
Chemicals 2.8% | | | | | | | |
Akzo Nobel NV | | Netherlands | | 63,665 | | | 2,711,024 |
BASF AG | | Germany | | 100,840 | | | 7,241,563 |
Bayer AG, Br. | | Germany | | 109,940 | | | 3,714,794 |
Dow Chemical Co. | | United States | | 116,800 | | | 5,782,768 |
| | | | | | |
|
|
| | | | | | | | 19,450,149 |
| | | | | | |
|
|
Commercial Banks 4.7% | | | | | | | |
Banco Santander Central Hispano SA | | Spain | | 445,400 | | | 5,518,241 |
DBS Group Holdings Ltd. | | Singapore | | 476,000 | | | 4,694,970 |
aKookmin Bank, ADR | | South Korea | | 164,670 | | | 6,435,304 |
Lloyds TSB Group PLC | | United Kingdom | | 343,900 | | | 3,122,283 |
National Australia Bank Ltd. | | Australia | | 148,100 | | | 3,340,959 |
Nordea Bank AB, FDR | | Sweden | | 955,960 | | | 9,670,903 |
| | | | | | |
|
|
| | | | | | | | 32,782,660 |
| | | | | | |
|
|
Commercial Services & Supplies 1.9% | | | | | | | |
R.R. Donnelley & Sons Co. | | United States | | 103,660 | | | 3,658,161 |
Rentokil Initial PLC | | United Kingdom | | 1,443,100 | | | 4,092,634 |
Securitas AB, B | | Sweden | | 299,200 | | | 5,134,007 |
| | | | | | |
|
|
| | | | | | | | 12,884,802 |
| | | | | | |
|
|
Computers & Peripherals .8% | | | | | | | |
aMaxtor Corp. | | United States | | 276,400 | | | 1,464,920 |
NEC Corp. | | Japan | | 319,000 | | | 1,984,017 |
aWestern Digital Corp. | | United States | | 216,100 | | | 2,342,524 |
| | | | | | |
|
|
| | | | | | | | 5,791,461 |
| | | | | | |
|
|
Consumer Finance .5% | | | | | | | |
Fannie Mae | | United States | | 50,400 | | | 3,588,984 |
| | | | | | |
|
|
TGA-13
FRANKLIN TEMPLETON VARIABLE INSURANCE PRODUCTS TRUST
TEMPLETON GLOBAL ASSET ALLOCATION FUND
Statement of Investments, December 31, 2004 (cont.)
| | | | | | | |
| | | COUNTRY | | SHARES | | VALUE |
Common Stocks (cont.) | | | | | | | |
Containers & Packaging .9% | | | | | | | |
Temple-Inland Inc. | | United States | | 86,733 | | $ | 5,932,537 |
| | | | | | |
|
|
Diversified Financial Services 1.8% | | | | | | | |
ING Groep NV | | Netherlands | | 210,732 | | | 6,365,541 |
JPMorgan Chase & Co. | | United States | | 154,870 | | | 6,041,478 |
| | | | | | |
|
|
| | | | | | | | 12,407,019 |
| | | | | | |
|
|
Diversified Telecommunication Services 4.0% | | | | | | | |
Chunghwa Telecom Co. Ltd., ADR | | Taiwan | | 141,200 | | | 2,972,260 |
KT Corp., ADR | | South Korea | | 208,260 | | | 4,542,151 |
Nippon Telegraph & Telephone Corp. | | Japan | | 1,152 | | | 5,173,989 |
Nippon Telegraph & Telephone Corp., ADR | | Japan | | 5,680 | | | 128,084 |
Telefonica SA, ADR | | Spain | | 96,339 | | | 5,443,153 |
Telefonos de Mexico SA de CV (Telmex), L, ADR | | Mexico | | 151,858 | | | 5,819,199 |
Telenor ASA | | Norway | | 425,300 | | | 3,857,151 |
| | | | | | |
|
|
| | | | | | | | 27,935,987 |
| | | | | | |
|
|
Electric Utilities 1.9% | | | | | | | |
E.ON AG | | Germany | | 92,290 | | | 8,413,454 |
Endesa SA | | Spain | | 122,000 | | | 2,862,427 |
Endesa SA, ADR | | Spain | | 88,000 | | | 2,047,760 |
| | | | | | |
|
|
| | | | | | | | 13,323,641 |
| | | | | | |
|
|
Electrical Equipment .9% | | | | | | | |
Kidde PLC | | United Kingdom | | 909,500 | | | 2,906,671 |
aVestas Wind Systems AS | | Denmark | | 204,300 | | | 2,534,115 |
aVestas Wind Systems AS, 144A | | Denmark | | 68,100 | | | 844,705 |
| | | | | | |
|
|
| | | | | | | | 6,285,491 |
| | | | | | |
|
|
Electronic Equipment & Instruments .9% | | | | | | | |
Hitachi Ltd. | | Japan | | 845,000 | | | 5,857,743 |
| | | | | | |
|
|
Food Products 1.6% | | | | | | | |
Nestle SA | | Switzerland | | 22,300 | | | 5,824,882 |
Unilever PLC | | United Kingdom | | 513,650 | | | 5,043,034 |
| | | | | | |
|
|
| | | | | | | | 10,867,916 |
| | | | | | |
|
|
Health Care Equipment & Supplies | | | | | | | |
Olympus Corp. | | Japan | | 14,100 | | | 300,806 |
| | | | | | |
|
|
Health Care Providers & Services 1.2% | | | | | | | |
AmerisourceBergen Corp. | | United States | | 70,700 | | | 4,148,676 |
aTenet Healthcare Corp. | | United States | | 376,600 | | | 4,135,068 |
| | | | | | |
|
|
| | | | | | | | 8,283,744 |
| | | | | | |
|
|
Household Durables 1.8% | | | | | | | |
Koninklijke Philips Electronics NV | | Netherlands | | 212,837 | | | 5,634,872 |
Sony Corp. | | Japan | | 41,300 | | | 1,596,837 |
Sony Corp., ADR | | Japan | | 136,900 | | | 5,333,624 |
| | | | | | |
|
|
| | | | | | | | 12,565,333 |
| | | | | | |
|
|
Industrial Conglomerates .9% | | | | | | | |
Swire Pacific Ltd., A | | Hong Kong | | 780,000 | | | 6,522,746 |
| | | | | | |
|
|
TGA-14
FRANKLIN TEMPLETON VARIABLE INSURANCE PRODUCTS TRUST
TEMPLETON GLOBAL ASSET ALLOCATION FUND
Statement of Investments, December 31, 2004 (cont.)
| | | | | | | |
| | | COUNTRY | | SHARES | | VALUE |
Common Stocks (cont.) | | | | | | | |
Insurance 3.1% | | | | | | | |
ACE Ltd. | | Bermuda | | 101,700 | | $ | 4,347,675 |
AXA SA | | France | | 210,734 | | | 5,198,860 |
Swiss Reinsurance Co. | | Switzerland | | 95,570 | | | 6,779,978 |
XL Capital Ltd., A | | Bermuda | | 68,810 | | | 5,343,097 |
| | | | | | |
|
|
| | | | | | | | 21,669,610 |
| | | | | | |
|
|
IT Services 1.1% | | | | | | | |
aBearingPoint Inc. | | United States | | 410,000 | | | 3,292,300 |
Satyam Computers Services Ltd. | | India | | 431,198 | | | 4,086,660 |
| | | | | | |
|
|
| | | | | | | | 7,378,960 |
| | | | | | |
|
|
Leisure Equipment & Products .4% | | | | | | | |
Mattel Inc. | | United States | | 131,100 | | | 2,555,139 |
| | | | | | |
|
|
Machinery 1.1% | | | | | | | |
Atlas Copco AB, A | | Sweden | | 51,630 | | | 2,331,382 |
Volvo AB, B | | Sweden | | 124,268 | | | 4,928,672 |
| | | | | | |
|
|
| | | | | | | | 7,260,054 |
| | | | | | |
|
|
Media 5.5% | | | | | | | |
British Sky Broadcasting Group PLC | | United Kingdom | | 783,600 | | | 8,452,977 |
aComcast Corp. | | United States | | 62,636 | | | 2,084,526 |
aDIRECTV Group Inc. | | United States | | 216,800 | | | 3,629,232 |
John Fairfax Holdings Ltd. | | Australia | | 1,704,780 | | | 6,071,582 |
Pearson PLC | | United Kingdom | | 364,400 | | | 4,396,050 |
Reed Elsevier NV | | Netherlands | | 501,600 | | | 6,827,129 |
aTime Warner Inc. | | United States | | 110,900 | | | 2,155,896 |
Wolters Kluwer NV | | Netherlands | | 215,741 | | | 4,324,071 |
| | | | | | |
|
|
| | | | | | | | 37,941,463 |
| | | | | | |
|
|
Metals & Mining 1.3% | | | | | | | |
Barrick Gold Corp. | | Canada | | 290 | | | 7,012 |
BHP Billiton Ltd. | | Australia | | 551,100 | | | 6,617,255 |
POSCO, ADR | | South Korea | | 57,100 | | | 2,542,663 |
| | | | | | |
|
|
| | | | | | | | 9,166,930 |
| | | | | | |
|
|
Multi-Utilities & Unregulated Power 1.5% | | | | | | | |
National Grid Transco PLC | | United Kingdom | | 420,100 | | | 4,003,602 |
Suez SA | | France | | 229,280 | | | 6,104,426 |
| | | | | | |
|
|
| | | | | | | | 10,108,028 |
| | | | | | |
|
|
Multiline Retail .8% | | | | | | | |
Target Corp. | | United States | | 107,000 | | | 5,556,510 |
| | | | | | |
|
|
Oil & Gas 2.7% | | | | | | | |
BP PLC | | United Kingdom | | 497,510 | | | 4,851,147 |
Eni SpA | | Italy | | 307,225 | | | 7,679,374 |
Shell Transport & Trading Co. PLC | | United Kingdom | | 756,100 | | | 6,443,787 |
| | | | | | |
|
|
| | | | | | | | 18,974,308 |
| | | | | | |
|
|
Paper & Forest Products .9% | | | | | | | |
Stora Enso OYJ, R | | Finland | | 416,260 | | | 6,360,375 |
| | | | | | |
|
|
TGA-15
FRANKLIN TEMPLETON VARIABLE INSURANCE PRODUCTS TRUST
TEMPLETON GLOBAL ASSET ALLOCATION FUND
Statement of Investments, December 31, 2004 (cont.)
| | | | | | | | |
| | | COUNTRY | | SHARES | | | VALUE |
Common Stocks (cont.) | | | | | | | | |
Pharmaceuticals 4.7% | | | | | | | | |
Abbott Laboratories | | United States | | 118,000 | | | $ | 5,504,700 |
Bristol-Myers Squibb Co. | | United States | | 217,420 | | | | 5,570,301 |
GlaxoSmithKline PLC | | United Kingdom | | 220,961 | | | | 5,182,816 |
Ono Pharmaceutical Co. Ltd. | | Japan | | 84,200 | | | | 4,727,104 |
Sanofi-Aventis | | France | | 91,000 | | | | 7,261,032 |
Takeda Pharmaceutical Co. Ltd. | | Japan | | 84,300 | | | | 4,247,100 |
| | | | | | | |
|
|
| | | | | | | | | 32,493,053 |
| | | | | | | |
|
|
Real Estate 1.5% | | | | | | | | |
Cheung Kong Holdings Ltd. | | Hong Kong | | 1,031,500 | | | | 10,284,743 |
| | | | | | | |
|
|
Semiconductors & Semiconductor Equipment 1.1% | | | | | | | | |
Samsung Electronics Co. Ltd. | | South Korea | | 16,790 | | | | 7,306,699 |
| | | | | | | |
|
|
Software 3.2% | | | | | | | | |
aBEA Systems Inc. | | United States | | 420,700 | | | | 3,727,402 |
aBMC Software Inc. | | United States | | 291,900 | | | | 5,429,340 |
aCheck Point Software Technologies Ltd. | | Israel | | 157,190 | | | | 3,871,590 |
Nintendo Co. Ltd. | | Japan | | 54,800 | | | | 6,886,116 |
aSynopsys Inc. | | United States | | 128,080 | | | | 2,512,929 |
| | | | | | | |
|
|
| | | | | | | | | 22,427,377 |
| | | | | | | |
|
|
Specialty Retail .2% | | | | | | | | |
aToys R Us Inc. | | United States | | 50,000 | | | | 1,023,500 |
| | | | | | | |
|
|
Wireless Telecommunication Services 2.0% | | | | | | | | |
China Mobile (Hong Kong) Ltd., fgn. | | China | | 928,000 | | | | 3,145,945 |
SK Telecom Co. Ltd., ADR | | South Korea | | 198,040 | | | | 4,406,390 |
Vodafone Group PLC, ADR | | United Kingdom | | 218,000 | | | | 5,968,840 |
| | | | | | | |
|
|
| | | | | | | | | 13,521,175 |
| | | | | | | |
|
|
Total Common Stocks (Cost $333,735,844) | | | | | | | | 442,460,594 |
| | | | | | | |
|
|
Preferred Stock (Cost $1,226,665) .5% | | | | | | | | |
Metals & Mining | | | | | | | | |
Cia Vale do Rio Doce, ADR, pfd., A | | Brazil | | 140,520 | | | | 3,425,878 |
| | | | | | | |
|
|
| | | |
| | | | | PRINCIPAL AMOUNTb
| | | |
Bonds 30.5% | | | | | | | | |
Buoni Poliennali Del Tesoro, | | | | | | | | |
7.75%, 11/01/06 | | Italy | | 974,190 | EUR | | | 1,444,391 |
5.00%, 2/01/12 | | Italy | | 1,810,000 | EUR | | | 2,695,891 |
Federal Republic of Germany, | | | | | | | | |
5.00%, 8/19/05 | | Germany | | 3,268,000 | EUR | | | 4,564,078 |
6.00%, 7/04/07 | | Germany | | 2,092,000 | EUR | | | 3,068,789 |
5.00%, 7/04/11 | | Germany | | 1,395,000 | EUR | | | 2,080,801 |
Finland Government, 3.00%, 7/04/08 | | Finland | | 1,850,000 | EUR | | | 2,529,654 |
French Treasury Note, 4.75%, 7/12/07 | | France | | 550,000 | EUR | | | 785,123 |
Government of Canada, 6.00%, | | | | | | | | |
6/01/08 | | Canada | | 2,212,000 | CAD | | | 1,999,044 |
6/01/11 | | Canada | | 6,849,000 | CAD | | | 6,354,234 |
Government of France, | | | | | | | | |
3.00%, 7/12/08 | | France | | 2,100,000 | EUR | | | 2,868,210 |
4.00%, 10/25/09 | | France | | 6,420,000 | EUR | | | 9,094,721 |
TGA-16
FRANKLIN TEMPLETON VARIABLE INSURANCE PRODUCTS TRUST
TEMPLETON GLOBAL ASSET ALLOCATION FUND
Statement of Investments, December 31, 2004 (cont.)
| | | | | | | | |
| | | COUNTRY | | PRINCIPAL
AMOUNTb | | | VALUE |
Bonds (cont.) | | | | | | | | |
Government of Hungary, 8.50%, 10/12/05 | | Hungary | | 92,400,000 | HUF | | $ | 509,863 |
Government of Netherlands, | | | | | | | | |
5.75%, 2/15/07 | | Netherlands | | 1,958,000 | EUR | | | 2,831,836 |
5.00%, 7/15/12 | | Netherlands | | 1,760,000 | EUR | | | 2,630,853 |
Government of New Zealand, 7.00%, 7/15/09 | | New Zealand | | 20,308,000 | NZD | | | 15,143,580 |
Government of Spain, | | | | | | | | |
10.15%, 1/31/06 | | Spain | | 2,450,000 | EUR | | | 3,598,600 |
4.80%, 10/31/06 | | Spain | | 2,630,000 | EUR | | | 3,717,732 |
Government of Thailand, | | | | | | | | |
6.00%, 3/05/05 | | Thailand | | 172,000,000 | THB | | | 4,460,169 |
8.50%, 10/14/05 | | Thailand | | 67,800,000 | THB | | | 1,834,353 |
8.00%, 12/08/06 | | Thailand | | 159,750,000 | THB | | | 4,510,244 |
Indonesia Recapital Bond, | | | | | | | | |
14.00%, 6/15/09 | | Indonesia | | 18,000,000,000 | IDR | | | 2,222,246 |
14.275%, 12/15/13 | | Indonesia | | 16,853,000,000 | IDR | | | 2,201,374 |
Kingdom of Belgium, | | | | | | | | |
7.50%, 7/29/08 | | Belgium | | 4,193,000 | EUR | | | 6,580,368 |
5.00%, 9/28/12 | | Belgium | �� | 1,760,000 | EUR | | | 2,631,569 |
Kingdom of Denmark, | | | | | | | | |
5.00%, 8/15/05 | | Denmark | | 11,696,000 | DKK | | | 2,168,032 |
6.00%, 11/15/11 | | Denmark | | 14,660,000 | DKK | | | 3,091,164 |
5.00%, 11/15/13 | | Denmark | | 25,080,000 | DKK | | | 5,035,992 |
Kingdom of Norway, 6.75%, 1/15/07 | | Norway | | 50,000,000 | NOK | | | 8,938,733 |
Kingdom of Sweden, | | | | | | | | |
6.00%, 2/09/05 | | Sweden | | 35,430,000 | SEK | | | 5,352,657 |
8.00%, 8/15/07 | | Sweden | | 34,265,000 | SEK | | | 5,831,977 |
5.50%, 10/08/12 | | Sweden | | 49,110,000 | SEK | | | 8,248,768 |
Korea Treasury Bond, | | | | | | | | |
6.90%, 1/16/07 | | South Korea | | 12,400,000,000 | KRW | | | 13,003,566 |
4.75%, 3/03/07 | | South Korea | | 11,800,000,000 | KRW | | | 11,925,135 |
New South Wales Treasury Corp., | | | | | | | | |
6.50%, 5/01/06 | | Australia | | 9,688,000 | AUD | | | 7,702,322 |
8.00%, 3/01/08 | | Australia | | 2,430,000 | AUD | | | 2,045,761 |
Queensland Treasury Corp., 6.00%, | | | | | | | | |
7/14/09 | | Australia | | 300,000 | AUD | | | 240,766 |
8/14/13 | | Australia | | 2,800,000 | AUD | | | 2,268,076 |
Republic of Austria, 5.00%, | | | | | | | | |
1/15/08 | | Austria | | 4,900,000 | EUR | | | 7,087,552 |
7/15/12 | | Austria | | 4,800,000 | EUR | | | 7,189,305 |
Republic of Poland, | | | | | | | | |
8.50%, 11/12/06 | | Poland | | 620,000 | PLN | | | 213,753 |
8.50%, 5/12/07 | | Poland | | 15,700,000 | PLN | | | 5,478,464 |
6.00%, 5/24/09 | | Poland | | 24,850,000 | PLN | | | 8,204,418 |
Republic of Singapore, 4.00%, 3/01/07 | | Singapore | | 1,700,000 | SGD | | | 1,093,518 |
CRepublic of Slovak, Strip, 1/14/07 | | Slovak Republic | | 181,500,000 | SKK | | | 5,923,468 |
Republic of Philippines, 9.00%, 2/15/13 | | Philippines | | 1,425,000 | | | | 1,461,551 |
Republic of Ukraine, 144A, FRN, 5.33%, 8/05/09 | | Ukraine | | 1,100,000 | | | | 1,163,250 |
Russian Federation, Reg S, 5.00% to 3/31/07, 7.50% thereafter, 3/31/30 | | Russia | | 4,540,000 | | | | 4,700,716 |
United Kingdom, 7.50%, 12/07/06 | | United Kingdom | | 867,000 | GBP | | | 1,757,530 |
| | | | | | | |
|
|
Total Bonds (Cost $160,950,961) | | | | | | | | 210,484,197 |
| | | | | | | |
|
|
Total Long Term Investments (Cost $495,913,470) | | | | | | | | 656,370,669 |
| | | | | | | |
|
|
TGA-17
FRANKLIN TEMPLETON VARIABLE INSURANCE PRODUCTS TRUST
TEMPLETON GLOBAL ASSET ALLOCATION FUND
Statement of Investments, December 31, 2004 (cont.)
| | | | | | | | |
| | | COUNTRY | | SHARES | | | VALUE |
Short Term Investments 4.5% | | | | | | | | |
Foreign Government Security (Cost $949,813) .1% | | | | | | | | |
cNorwegian Treasury Bill, 9/21/05 | | Norway | | 5,900,000 | NOK | | $ | 959,652 |
| | | | | | | |
|
|
Total Investments before Money Fund (Cost $496,863,283) | | | | | | | | 657,330,321 |
| | | | | | | |
|
|
Money Fund (Cost $30,532,682) 4.4% | | | | | | | | |
dFranklin Institutional Fiduciary Trust Money Market Portfolio | | United States | | 30,532,682 | | | | 30,532,682 |
| | | | | | | |
|
|
Total Investments (Cost $527,395,965) 99.5% | | | | | | | | 687,863,003 |
Other Assets, less Liabilities .5% | | | | | | | | 3,670,491 |
| | | | | | | |
|
|
Net Assets 100.0% | | | | | | | $ | 691,533,494 |
| | | | | | | |
|
|
Currency Abbreviations:
AUD - Australian Dollar
CAD - Canadian Dollar
DKK - Danish Krone
EUR - Euro
GBP - British Pound
HUF - Hungarian Forint
IDR - Indonesian Rupiah
KRW - South Korean Won
NOK - Norwegian Krone
NZD - New Zealand Dollar
PLN - Polish Zloty
SEK - Swedish Krona
SGD - Singapore Dollar
SKK - Slovak Koruna
THB - Thai Baht
Portfolio Abbreviations:
ADR - American Depository Receipt
FDR - Foreign Depository Receipt
FRN - Floating Rate Note
SDR - Special Drawing Rights
| b | The principal amount is stated in U.S. dollars unless otherwise indicated. |
| c | Security is traded on a discount basis with no stated coupon rate. |
| d | See Note 7 regarding investments in Franklin Institutional Fiduciary Trust Money Market Portfolio. |
TGA-18
See notes to financial statements.
FRANKLIN TEMPLETON VARIABLE INSURANCE PRODUCTS TRUST
TEMPLETON GLOBAL ASSET ALLOCATION FUND
Financial Statements
Statement of Assets and Liabilities
December 31, 2004
| | | | |
Assets: | | | | |
Investments in securities: | | | | |
Cost - Unaffiliated issuers | | $ | 496,863,283 | |
Cost - Sweep Money Fund (Note 7) | | | 30,532,682 | |
| | |
|
|
|
Total cost of investments | | $ | 527,395,965 | |
| | |
|
|
|
Value - Unaffiliated issuers | | $ | 657,330,321 | |
Value - Sweep Money Fund (Note 7) | | | 30,532,682 | |
| | |
|
|
|
Total value of investments | | | 687,863,003 | |
| | |
|
|
|
Cash | | | 36,516 | |
Foreign currency, at value (cost $2,068) | | | 2,078 | |
Receivables: | | | | |
Capital shares sold | | | 160,034 | |
Dividends and interest | | | 5,664,981 | |
| | |
|
|
|
Total assets | | | 693,726,612 | |
| | |
|
|
|
Liabilities: | | | | |
Payables: | | | | |
Capital shares redeemed | | | 1,681,261 | |
Affiliates | | | 432,230 | |
Other liabilities | | | 79,627 | |
| | |
|
|
|
Total liabilities | | | 2,193,118 | |
| | |
|
|
|
Net assets, at value | | $ | 691,533,494 | |
| | |
|
|
|
Net assets consist of: | | | | |
Undistributed net investment income | | $ | 22,180,158 | |
Net unrealized appreciation (depreciation) | | | 160,862,030 | |
Accumulated net realized gain (loss) | | | (28,332,421 | ) |
Capital shares | | | 536,823,727 | |
| | |
|
|
|
Net assets, at value | | $ | 691,533,494 | |
| | |
|
|
|
Class 1: | | | | |
Net assets, at value | | $ | 625,727,746 | |
| | |
|
|
|
Shares outstanding | | | 29,636,610 | |
| | |
|
|
|
Net asset value and offering price per share | | $ | 21.11 | |
| | |
|
|
|
Class 2: | | | | |
Net assets, at value | | $ | 65,805,748 | |
| | |
|
|
|
Shares outstanding | | | 3,141,868 | |
| | |
|
|
|
Net asset value and offering price per share | | $ | 20.94 | |
| | |
|
|
|
See notes to financial statements.
TGA-19
FRANKLIN TEMPLETON VARIABLE INSURANCE PRODUCTS TRUST
TEMPLETON GLOBAL ASSET ALLOCATION FUND
Financial Statements (continued)
Statement of Operations
for the year ended December 31, 2004
| | | | |
Investment income: | | | | |
Dividends: (net of foreign taxes of $1,092,585) | | | | |
Unaffiliated issuers | | $ | 11,040,206 | |
Sweep Money Fund (Note 7) | | | 190,996 | |
Interest (net of foreign taxes of $51,845) | | | 9,476,905 | |
| | |
|
|
|
Total investment income | | | 20,708,107 | |
| | |
|
|
|
Expenses: | | | | |
Management fees (Note 3) | | | 3,678,732 | |
Administrative fees (Note 3) | | | 862,235 | |
Distribution fees - Class 2 (Note 3) | | | 147,355 | |
Transfer agent fees | | | 9,013 | |
Custodian fees (Note 4) | | | 211,367 | |
Reports to shareholders | | | 327,834 | |
Professional fees | | | 61,843 | |
Trustees’ fees and expenses | | | 3,821 | |
Other | | | 27,654 | |
| | |
|
|
|
Total expenses | | | 5,329,854 | |
Expense reductions (Note 4) | | | (1,372 | ) |
| | |
|
|
|
Net expenses | | | 5,328,482 | |
| | |
|
|
|
Net investment income | | | 15,379,625 | |
| | |
|
|
|
Realized and unrealized gains (losses): | | | | |
Net realized gain (loss) from: | | | | |
Investments | | | 27,907,966 | |
Foreign currency transactions | | | 10,671,502 | |
| | |
|
|
|
Net realized gain (loss) | | | 38,579,468 | |
| | |
|
|
|
Net change in unrealized appreciation (depreciation) on: | | | | |
Investments | | | 41,338,534 | |
Translation of assets and liabilities denominated in foreign currencies | | | 47,737 | |
Deferred taxes | | | 104,220 | |
| | |
|
|
|
Net change in unrealized appreciation (depreciation) | | | 41,490,491 | |
| | |
|
|
|
Net realized and unrealized gain (loss) | | | 80,069,959 | |
| | |
|
|
|
Net increase (decrease) in net assets resulting from operations | | $ | 95,449,584 | |
| | |
|
|
|
See notes to financial statements.
TGA-20
FRANKLIN TEMPLETON VARIABLE INSURANCE PRODUCTS TRUST
TEMPLETON GLOBAL ASSET ALLOCATION FUND
Financial Statements (continued)
Statements of Changes in Net Assets
for the years ended December 31, 2004 and 2003
| | | | | | | | |
| | | 2004 | | | 2003 | |
| | |
| |
Increase (decrease) in net assets: | | | | | | | | |
Operations: | | | | | | | | |
Net investment income | | $ | 15,379,625 | | | $ | 12,882,138 | |
Net realized gain (loss) from investments and foreign currency transactions | | | 38,579,468 | | | | (47,730,263 | ) |
Net change in unrealized appreciation (depreciation) on investments, translation of assets and
liabilities denominated in foreign currencies and deferred taxes | | | 41,490,491 | | | | 183,932,996 | |
| | |
| |
Net increase (decrease) in net assets resulting from operations | | | 95,449,584 | | | | 149,084,871 | |
Distributions to shareholders from: | | | | | | | | |
Net investment income: | | | | | | | | |
Class 1 | | | (16,563,956 | ) | | | (12,872,007 | ) |
Class 2 | | | (1,658,563 | ) | | | (1,147,201 | ) |
| | |
| |
Total distributions to shareholders | | | (18,222,519 | ) | | | (14,019,208 | ) |
Capital share transactions: (Note 2) | | | | | | | | |
Class 1 | | | (17,118,553 | ) | | | 24,154,273 | |
Class 2 | | | 2,872,334 | | | | 3,935,942 | |
| | |
| |
Total capital share transactions | | | (14,246,219 | ) | | | 28,090,215 | |
Net increase (decrease) in net assets | | | 62,980,846 | | | | 163,155,878 | |
Net assets: | | | | | | | | |
Beginning of year | | | 628,552,648 | | | | 465,396,770 | |
| | |
| |
End of year | | $ | 691,533,494 | | | $ | 628,552,648 | |
| | |
| |
Undistributed net investment income included in net assets: | | | | | | | | |
End of year | | $ | 22,180,158 | | | $ | 14,496,244 | |
| | |
| |
See notes to financial statements.
TGA-21
FRANKLIN TEMPLETON VARIABLE INSURANCE PRODUCTS TRUST
TEMPLETON GLOBAL ASSET ALLOCATION FUND
Notes to Financial Statements
1. ORGANIZATION AND SIGNIFICANT ACCOUNTING POLICIES
Franklin Templeton Variable Insurance Products Trust (the Trust) is registered under the Investment Company Act of 1940 as an open-end investment company, consisting of twenty-one separate series (the Funds). Templeton Global Asset Allocation Fund (the Fund) included in this report is diversified. The financial statements of the remaining funds in the series are presented separately. Shares of the Fund are sold only to insurance company separate accounts to fund the benefits of variable life insurance policies or variable annuity contracts. As of December 31, 2004, over 54% of the Fund’s shares were sold through one insurance company. The Fund’s investment objective is high total return.
The following summarizes the Fund’s significant accounting policies.
a. Security Valuation
Securities listed on a securities exchange or on the NASDAQ National Market System are valued at the last quoted sale price or the official closing price of the day, respectively. Over-the-counter securities and listed securities for which there is no reported sale are valued within the range of the most recent quoted bid and ask prices. Securities that trade in multiple markets or on multiple exchanges are valued according to the broadest and most representative market. Investments in open-end mutual funds are valued at the closing net asset value.
Foreign securities are valued as of the close of trading on the foreign stock exchange on which the security is primarily traded, or the NYSE, whichever is earlier. The value is then converted into its U.S. dollar equivalent at the foreign exchange rate in effect at the close of the NYSE on the day that the value of the foreign security is determined. If no sale is reported at that time, the foreign security will be valued within the range of the most recent quoted bid and ask prices.
The Trust has procedures to determine the fair value of individual securities and other assets for which market prices are not readily available or which may not be reliably priced. Some methods for valuing these securities may include: fundamental analysis, matrix pricing, discounts from market prices of similar securities, or discounts applied due to the nature and duration of restrictions on the disposition of the securities. Occasionally, events occur between the time at which trading in a security is completed and the close of the NYSE that might call into question the availability (including the reliability) of the value of a portfolio security held by the Fund. If such an event occurs, the securities may be valued using fair value procedures, which may include the use of independent pricing services. All security valuation procedures are approved by the Trust’s Board of Trustees.
b. Foreign Currency Translation
Portfolio securities and other assets and liabilities denominated in foreign currencies are translated into U.S. dollars based on the exchange rate of such currencies against U.S. dollars on the date of valuation. Purchases and sales of securities, income and expense items denominated in foreign currencies are translated into U.S. dollars at the exchange rate in effect on the transaction date. Occasionally events may impact the availability or reliability of foreign exchange rates used to convert the U.S. dollar equivalent value. If such an event occurs, the foreign exchange rate will be valued at fair value using procedures established and approved by the Trust’s Board of Trustees.
The Fund does not separately report the effect of changes in foreign exchange rates from changes in market prices on securities held. Such changes are included in net realized and unrealized gain or loss from investments on the Statement of Operations.
Realized foreign exchange gains or losses arise from sales of foreign currencies, currency gains or losses realized between the trade and settlement dates on securities transactions and the difference between the recorded amounts of dividends, interest, and foreign withholding taxes and the U.S. dollar equivalent of the amounts actually received or paid. Net unrealized foreign exchange gains and losses arise from changes in foreign exchange rates on foreign denominated assets and liabilities other than investments in securities held at the end of the reporting period.
TGA-22
FRANKLIN TEMPLETON VARIABLE INSURANCE PRODUCTS TRUST
TEMPLETON GLOBAL ASSET ALLOCATION FUND
Notes to Financial Statements (continued)
1. ORGANIZATION AND SIGNIFICANT ACCOUNTING POLICIES (cont.)
c. Foreign Currency Contracts
When the Fund purchases or sells foreign securities it may enter into foreign exchange contracts to minimize foreign exchange risk from the trade date to the settlement date of the transactions. A foreign exchange contract is an agreement between two parties to exchange different currencies at an agreed upon exchange rate on a specified date. Realized and unrealized gains and losses on these contracts are included in the Statement of Operations.
The risks of these contracts include movement in the values of the foreign currencies relative to the U.S. dollar and the possible inability of the counterparties to fulfill their obligations under the contracts.
d. Income and Deferred Taxes
No provision has been made for U.S. income taxes because the Fund’s policy is to qualify as a regulated investment company under Sub Chapter M of the Internal Revenue Code and to distribute substantially all of its taxable income. Fund distributions to shareholders are determined on an income tax basis and may differ from net investment income and realized gains for financial reporting purposes.
The Fund is subject to a tax imposed on net realized gains of securities of certain foreign countries. The Fund records an estimated deferred tax liability for net unrealized gains on these securities.
e. Security Transactions, Investment Income, Expenses and Distributions
Security transactions are accounted for on trade date. Realized gains and losses on security transactions are determined on a specific identification basis. Interest income and estimated expenses are accrued daily. Discounts and premiums on securities purchased are amortized over the lives of the respective securities. Dividend income and distributions to shareholders are recorded on the ex-dividend date.
Common expenses incurred by the Trust are allocated among the funds based on the ratio of net assets of each fund to the combined net assets. Other expenses are charged to each fund on a specific identification basis.
Realized and unrealized gains and losses and net investment income, other than class specific expenses, are allocated daily to each class of shares based upon the relative proportion of net assets of each class.
f. Accounting Estimates
The preparation of financial statements in accordance with accounting principles generally accepted in the United States of America requires management to make estimates and assumptions that affect the reported amounts of assets and liabilities at the date of the financial statements and the amounts of income and expenses during the reporting period. Actual results could differ from those estimates.
g. Guarantees and Indemnifications
Under the Trust’s organizational documents, its officers and trustees are indemnified by the Trust against certain liability arising out of the performance of their duties to the Trust. Additionally, in the normal course of business, the Trust enters into contracts with service providers that contain general indemnification clauses. The Trust’s maximum exposure under these arrangements is unknown as this would involve future claims that may be made against the Trust that have not yet occurred. However, based on experience, the Trust expects the risk of loss to be remote.
TGA-23
FRANKLIN TEMPLETON VARIABLE INSURANCE PRODUCTS TRUST
TEMPLETON GLOBAL ASSET ALLOCATION FUND
Notes to Financial Statements (continued)
2. SHARES OF BENEFICIAL INTEREST
The Fund offers two classes of shares: Class 1 and Class 2. Each class of shares differs by its distribution fees, voting rights on matters affecting a single class and its exchange privilege.
At December 31, 2004, there were an unlimited number of shares authorized ($.01 par value). Transactions in the Fund’s shares were as follows:
| | | | | | | | | | | | | | |
| | | Year Ended December 31, 2004,
| |
| | | 2004
| | | 2003
| |
| Class 1 Shares: | | Shares
| | | Amount
| | | Shares
| | | Amount
| |
Shares sold | | 2,523,033 | | | $ | 48,527,568 | | | 2,924,694 | | | $ | 48,227,589 | |
Shares issued in reinvestment of distributions | | 904,640 | | | | 16,563,956 | | | 795,550 | | | | 12,872,007 | |
Shares redeemed | | (4,294,965 | ) | | | (82,210,077 | ) | | (2,381,733 | ) | | | (36,945,323 | ) |
| | |
| |
Net increase (decrease) | | (867,292 | ) | | $ | (17,118,553 | ) | | 1,338,511 | | | $ | 24,154,273 | |
| | |
| |
| | | | |
| Class 2 Shares: | | | | | | | | | | | | |
Shares sold | | 617,661 | | | $ | 11,736,853 | | | 949,657 | | | $ | 15,396,855 | |
Shares issued in reinvestment of distributions | | 91,180 | | | | 1,658,563 | | | 71,299 | | | | 1,147,201 | |
Shares redeemed | | (557,792 | ) | | | (10,523,082 | ) | | (785,835 | ) | | | (12,608,114 | ) |
| | |
| |
Net increase (decrease) | | 151,049 | | | $ | 2,872,334 | | | 235,121 | | | $ | 3,935,942 | |
| | |
| |
3. TRANSACTIONS WITH AFFILIATES
Certain officers and trustees of the Fund are also officers and/or directors of the following entities:
| | |
| Entity | | Affiliation |
Templeton Investment Counsel LLC (TIC) | | Investment manager |
Franklin Templeton Services LLC (FT Services) | | Administrative manager |
Franklin Templeton Distributors Inc. (Distributors) | | Principal underwriter |
Franklin Templeton Investor Services LLC (Investor Services) | | Transfer agent |
a. Management Fees
The Fund pays an investment management fee to TIC based on the average daily net assets of the Fund as follows:
| | |
| Annualized Fee Rate | | Net Assets |
| .650% | | First $200 million |
| .585% | | Over $200 million, up to and including $1.3 billion |
| .520% | | Over $1.3 billion |
Under a subadvisory agreement, Advisers, an affiliate of TIC, provides subadvisory services to the Fund and receives from TIC fees based on the average daily net assets of the Fund.
b. Administrative Fees
The Fund pays an administrative fee to FT Services based on the average daily net assets of the Fund as follows:
| | |
| Annualized Fee Rate | | Net Assets |
| .150% | | First $200 million |
| .135% | | Over $200 million, up to and including $700 million |
| .100% | | Over $700 million, up to and including $1.2 billion |
Fees are further reduced on net assets over $1.2 billion.
TGA-24
FRANKLIN TEMPLETON VARIABLE INSURANCE PRODUCTS TRUST
TEMPLETON GLOBAL ASSET ALLOCATION FUND
Notes to Financial Statements (continued)
3. TRANSACTIONS WITH AFFILIATES (cont.)
c. Distribution Fees
The Fund reimburses Distributors up to .25% per year of its average daily net asset of Class 2, for costs incurred in marketing the Fund’s shares under a Rule 12b-1 plan.
d. Transfer Agent Fees
Investor Services, under terms of an agreement, performs shareholder servicing for the Fund and is not paid by the Fund for the services.
4. EXPENSE OFFSET ARRANGEMENT
The Fund has entered into an arrangement with its custodian whereby credits realized as a result of uninvested cash balances are used to reduce a portion of the Fund’s custodian expenses. During the year ended December 31, 2004, the custodian fees were reduced as noted in the Statement of Operations.
5. INCOME TAXES
At December 31, 2004, the Fund had tax basis capital losses of $28,332,421 which may be carried over to offset future capital gains. Such losses expire in 2011.
The tax character of distributions paid during the years ended December 31, 2004 and 2003, was as follows:
| | | | | | |
| | | 2004
| | 2003
|
Distributions paid from ordinary income | | $ | 18,222,519 | | $ | 14,019,208 |
| | |
|
|
Net investment income (loss) and realized gains (losses) differ for financial statement and tax purposes primarily due to differing treatments of foreign currency transactions, and bond discount and premiums.
At December 31, 2004, the cost of investments, net unrealized appreciation (depreciation) and undistributed ordinary income for income tax purposes were as follows:
| | | | |
Cost of investments | | $ | 530,145,376 | |
| | |
|
|
|
Unrealized appreciation | | $ | 174,667,943 | |
Unrealized depreciation | | | (16,950,316 | ) |
| | |
|
|
|
Net unrealized appreciation (depreciation) | | $ | 157,717,627 | |
| | |
|
|
|
Distributable earnings – undistributed ordinary income | | $ | 24,929,569 | |
| | |
|
|
|
TGA-25
FRANKLIN TEMPLETON VARIABLE INSURANCE PRODUCTS TRUST
TEMPLETON GLOBAL ASSET ALLOCATION FUND
Notes to Financial Statements (continued)
6. INVESTMENT TRANSACTIONS
Purchases and sales of investments (excluding short-term securities) for the year ended December 31, 2004, aggregated $162,689,015 and $180,117,528, respectively.
7. INVESTMENTS IN FRANKLIN INSTITUTIONAL FIDUCIARY TRUST MONEY MARKET PORTFOLIO
The Fund may invest in the Franklin Institutional Fiduciary Trust Money Market Portfolio (the Sweep Money Fund), an open-end investment company managed by Franklin Advisers Inc. (an affiliate of the investment manager). Management fees paid by the Fund are reduced on assets invested in the Sweep Money Fund, in an amount not to exceed the management fees paid by the Sweep Money Fund.
8. REGULATORY MATTERS
Investigations
As part of various investigations by a number of federal, state, and foreign regulators and governmental entities, including the Securities and Exchange Commission (“SEC”), the California Attorney General’s Office (“CAGO”), and the National Association of Securities Dealers, Inc. (“NASD”), relating to certain practices in the mutual fund industry, including late trading, market timing and marketing support payments to securities dealers who sell fund shares, Franklin Resources, Inc. and certain of its subsidiaries (as used in this section, together, the “Company”), as well as certain current or former executives and employees of the Company, received subpoenas and/or requests for documents, information and/or testimony. The Company and its current employees provided documents and information in response to those requests and subpoenas.
Settlements
Beginning in August 2004, the Company entered into settlements with certain regulators investigating the mutual fund industry practices noted above. The Company believes that settlement of each of the matters described in this section is in the best interest of the Company and shareholders of the Franklin, Templeton, and Mutual Series mutual funds (the “funds”).
On August 2, 2004, Franklin Resources, Inc. announced that its subsidiary, Franklin Advisers, Inc., reached an agreement with the SEC that resolved the issues resulting from the SEC investigation into market timing activity. In connection with that agreement, the SEC issued an “Order Instituting Administrative and Cease-and-Desist Proceedings Pursuant to Sections 203(e) and 203(k) of the Investment Advisers Act of 1940 and Sections 9(b) and 9(f) of the Investment Company Act of 1940, Making Findings and Imposing Remedial Sanctions and a Cease-and-Desist Order” (the “Order”). The SEC’s Order concerned the activities of a limited number of third parties that ended in 2000 and those that were the subject of the first Massachusetts administrative complaint described below.
Under the terms of the SEC’s Order, pursuant to which Franklin Advisers, Inc. neither admitted nor denied any of the findings contained therein, Franklin Advisers, Inc. agreed to pay $50 million, of which $20 million is a civil penalty, to be distributed to shareholders of certain funds in accordance with a plan to be developed by an independent distribution consultant. At this time, it is unclear which funds or which shareholders of any particular fund will receive distributions. The Order also required Franklin Advisers, Inc. to, among other things, enhance and periodically review compliance policies and procedures.
On September 20, 2004, Franklin Resources, Inc. announced that two of its subsidiaries, Franklin Advisers, Inc. and Franklin Templeton Alternative Strategies, Inc. (“FTAS”), reached an agreement with the Securities Division of the Office of the Secretary of the Commonwealth of Massachusetts (the “State of Massachusetts”) related to its administrative complaint filed on February 4, 2004, concerning one instance of market timing that was also a subject of the August 2, 2004 settlement that Franklin Advisers, Inc. reached with the SEC, as described above.
TGA-26
FRANKLIN TEMPLETON VARIABLE INSURANCE PRODUCTS TRUST
TEMPLETON GLOBAL ASSET ALLOCATION FUND
Notes to Financial Statements (continued)
8. REGULATORY MATTERS (cont.)
Settlements (cont.)
Under the terms of the settlement consent order issued by the State of Massachusetts, Franklin Advisers, Inc. and FTAS consented to the entry of a cease-and-desist order and agreed to pay a $5 million administrative fine to the State of Massachusetts (the “Massachusetts Consent Order”). The Massachusetts Consent Order included two different sections: “Statements of Fact” and “Violations of Massachusetts Securities Laws.” Franklin Advisers, Inc. and FTAS admitted the facts in the Statements of Fact.
On October 25, 2004, the State of Massachusetts filed a second administrative complaint, alleging that Franklin Resources, Inc.’s Form 8-K filing (in which it described the Massachusetts Consent Order and stated that “Franklin did not admit or deny engaging in any wrongdoing”) failed to state that Franklin Advisers, Inc. and FTAS admitted the Statements of Fact portion of the Massachusetts Consent Order (the “Second Complaint”). Franklin Resources, Inc. reached a second agreement with the State of Massachusetts on November 19, 2004, resolving the Second Complaint. As a result of the November 19, 2004 settlement, Franklin Resources, Inc. filed a new Form 8-K. The terms of the Massachusetts Consent Order did not change and there was no monetary fine associated with this second settlement.
On November 17, 2004, Franklin Resources, Inc. announced that Franklin/Templeton Distributors, Inc. (“FTDI”) reached an agreement with the CAGO, resolving the issues resulting from the CAGO’s investigation concerning sales and marketing support payments. Under the terms of the settlement, FTDI neither admitted nor denied the allegations in the CAGO’s complaint and agreed to pay $2 million to the State of California as a civil penalty, $14 million to the funds, to be allocated by an independent distribution consultant to be paid for by FTDI, and $2 million to the CAGO for its investigative costs.
On December 13, 2004, Franklin Resources, Inc. announced that its subsidiaries FTDI and Franklin Advisers, Inc. reached an agreement with the SEC, resolving the issues resulting from the SEC’s investigation concerning marketing support payments to securities dealers who sell fund shares. In connection with that agreement, the SEC issued an “Order Instituting Administrative and Cease-and-Desist Proceedings, Making Findings, and Imposing Remedial Sanctions Pursuant to Sections 203(e) and 203(k) of the Investment Advisers Act of 1940, Sections 9(b) and 9(f) of the Investment Company Act of 1940, and Section 15(b) of the Securities Exchange Act of 1934” (the “Second Order”).
Under the terms of the Second Order, in which FTDI and Franklin Advisers, Inc. neither admitted nor denied the findings contained therein, they agreed to pay the funds a penalty of $20 million and disgorgement of $1 (one dollar). FTDI and Franklin Advisers, Inc. also agreed to implement certain measures and undertakings relating to marketing support payments to broker-dealers for the promotion or sale of fund shares, including making additional disclosures in the funds’ Prospectuses and Statements of Additional Information. The Second Order further requires the appointment of an independent distribution consultant, at the Company’s expense, who shall develop a plan for the distribution of the penalty and disgorgement to the funds.
Other Legal Proceedings
The Trust, in addition to the Company and other funds, and certain current and former officers, employees, and directors have been named in multiple lawsuits in different federal courts in Nevada, California, Illinois, New York and Florida, alleging violations of various federal securities laws and seeking, among other relief, monetary damages, restitution, removal of fund trustees, directors, advisers, administrators, and distributors, rescission of management contracts and 12b-1 Plans, and/or attorneys’ fees and costs. Specifically, the lawsuits claim breach of duty with respect to alleged arrangements to permit market timing and/or late trading activity, or breach of duty with respect to the valuation of the portfolio securities of certain Templeton funds managed by Franklin Resources, Inc. subsidiaries, resulting in alleged market timing activity. The majority of these lawsuits duplicate, in whole or in part, the allegations asserted in the February 4, 2004 Massachusetts administrative complaint and the findings in the SEC’s August 2, 2004 Order, as described above. The lawsuits are styled as class actions, or derivative actions on behalf of either the named funds or Franklin Resources, Inc.
TGA-27
FRANKLIN TEMPLETON VARIABLE INSURANCE PRODUCTS TRUST
TEMPLETON GLOBAL ASSET ALLOCATION FUND
Notes to Financial Statements (continued)
8. REGULATORY MATTERS (cont.)
Other Legal Proceedings (cont.)
In addition, the Company, as well as certain current and former officers, employees, and directors, have been named in multiple lawsuits alleging violations of various securities laws and pendent state law claims relating to the disclosure of directed brokerage payments and/or payment of allegedly excessive advisory, commission, and distribution fees, and seeking, among other relief, monetary damages, restitution, rescission of advisory contracts, including recovery of all fees paid pursuant to those contracts, an accounting of all monies paid to the named advisers, declaratory relief, injunctive relief, and/or attorneys’ fees and costs. These lawsuits are styled as class actions or derivative actions brought on behalf of certain funds.
The Company and fund management strongly believes that the claims made in each of the lawsuits identified above are without merit and intends to vigorously defend against them. The Company cannot predict with certainty, however, the eventual outcome of the remaining governmental investigations or private lawsuits, nor whether they will have a material negative impact on the Company. Public trust and confidence are critical to the Company’s business and any material loss of investor and/or client confidence could result in a significant decline in assets under management by the Company, which would have an adverse effect on the Company’s future financial results. If the Company finds that it bears responsibility for any unlawful or inappropriate conduct that caused losses to the Trust, it is committed to making the Trust or its shareholders whole, as appropriate. The Company is committed to taking all appropriate actions to protect the interests of its funds’ shareholders.
TGA-28
FRANKLIN TEMPLETON VARIABLE INSURANCE PRODUCTS TRUST
TEMPLETON GLOBAL ASSET ALLOCATION FUND
Report of Independent Registered Public Accounting Firm
To the Trustees and Shareholders of Franklin Templeton Variable Insurance Products Trust
In our opinion, the accompanying statement of assets and liabilities, including the statement of investments, and the related statements of operations and of changes in net assets and the financial highlights present fairly, in all material respects, the financial position of Templeton Global Asset Allocation Fund (the Fund) (one of the funds constituting Franklin Templeton Variable Insurance Products Trust) at December 31, 2004, the results of its operations for the year then ended, the changes in its net assets for each of the two years in the period then ended and the financial highlights for each of the five years in the period then ended, in conformity with accounting principles generally accepted in the United States of America. These financial statements and financial highlights (hereafter referred to as “financial statements”) are the responsibility of the Fund’s management; our responsibility is to express an opinion on these financial statements based on our audits. We conducted our audits of these financial statements in accordance the standards of the Public Company Accounting Oversight Board (United States). Those standards require that we plan and perform the audits to obtain reasonable assurance about whether the financial statements are free of material misstatement. An audit includes examining, on a test basis, evidence supporting the amounts and disclosures in the financial statements, assessing the accounting principles used and significant estimates made by management, and evaluating the overall financial statement presentation. We believe that our audits, which included confirmation of securities at December 31, 2004 by correspondence with the custodian, provide a reasonable basis for our opinion.
PricewaterhouseCoopers LLP
San Francisco, California
February 9, 2005
TGA-29
FRANKLIN TEMPLETON VARIABLE INSURANCE PRODUCTS TRUST
TEMPLETON GLOBAL ASSET ALLOCATION FUND
Tax Designation (unaudited)
Under Section 854(b)(2) of the Internal Revenue Code (Code), the Fund hereby designates 7.00% of the ordinary income dividends as income qualifying for the dividends received deduction for the fiscal year ended December 31, 2004.
At December 31, 2004, more than 50% of the Fund’s total assets were invested in securities of foreign issuers. In most instances, foreign taxes were withheld from dividends and interest paid to the Fund on these investments. The Fund elects to treat foreign taxes paid under Section 853 of the Code. This election will allow shareholders of record in June 2005, to treat their proportionate share of foreign taxes paid by the Fund as having been paid directly by them. The shareholder shall consider these amounts as foreign taxes paid in the tax year in which they receive the Fund distribution.
The foreign tax information will be disclosed in the June 2005, semi-annual report of the Fund.
TGA-30
TEMPLETON GLOBAL INCOME SECURITIES FUND
We are pleased to bring you Templeton Global Income Securities Fund’s annual report for the fiscal year ended December 31, 2004.
Performance Summary as of 12/31/04
Average annual total return of Class 2 shares* represents the average annual change in value, assuming reinvestment of dividends and capital gains. Average returns smooth out variations in returns, which can be significant; they are not the same as year-by-year results.
Periods ended 12/31/04
| | | | | | |
| | | 1-Year | | 5-Year | | 10-Year |
Average Annual Total Return | | +14.74% | | +12.63% | | +8.91% |
*Because Class 2 shares were not offered until 1/6/99, standardized Class 2 Fund performance for prior periods represents the historical results of Class 1 shares. For periods beginning on 1/6/99, Class 2’s results reflect an additional 12b-1 fee expense, which also affects future performance. Since 1/6/99 (effective date), the average annual total return of Class 2 shares was +9.21%.
Total Return Index Comparison for Hypothetical $10,000 Investment (1/1/95–12/31/04)
The graph below shows the change in value of a hypothetical $10,000 investment in the Fund over the indicated period and includes reinvestment of any income or distributions. The Fund’s performance* is compared to the performance of the J.P. Morgan (JPM) Government Bond Index (GBI) Global, as well as the Consumer Price Index (CPI). One cannot invest directly in an index, nor is an index representative of the Fund’s portfolio. Please see Important Notes to Performance Information preceding the Fund Summaries.
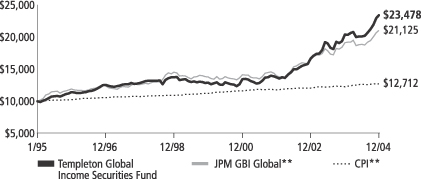
**Sources: Standard & Poor’s Micropal; J.P. Morgan. Please see Index Descriptions following the Fund Summaries.
Templeton Global Income Securities Fund – Class 2
Performance reflects the Fund’s Class 2 operating expenses, but does not include any contract fees, expenses or sales charges. If they had been included, performance would be lower. These charges and deductions, particularly for variable life policies, can have a significant effect on contract values and insurance benefits. See the contract prospectus for a complete description of these expenses, including sales charges.
Performance data quoted represent past performance, which does not guarantee future results. Investment return and principal value will fluctuate, and you may have a gain or loss when you sell your shares. Current performance may differ from figures shown.
TGI-1
Fund Goals and Main Investments: Templeton Global Income Securities Fund seeks high current income, consistent with preservation of capital. Capital appreciation is a secondary consideration. The Fund invests mainly in debt securities of governments and their political subdivisions and agencies, supranational organizations and companies located anywhere in the world, including emerging markets. The Fund may also invest in lower-rated “junk bonds.”
Performance Overview
You can find the Fund’s one-year total return in the Performance Summary. The Fund outperformed its benchmark, the JPM GBI Global, which delivered a 10.10% total return in U.S. dollar terms for the year under review.1
Economic and Market Overview
Global economic growth over the past year solidified, led by the U.S. and Asia, although it slowed somewhat since the first quarter. Although inflation rates remained relatively low, inflationary pressures began to build in some regions partly due to elevated oil and commodity prices. Despite strong growth, global bond markets generated positive returns as global treasury yield curves flattened and most major currencies appreciated relative to the U.S. dollar.
In the U.S., the core Consumer Price Index (excluding food and energy) rose from a historically low rate of 1.1% at the beginning of the year to 2.2% by period-end.2 Additionally, the labor market recovered as employers hired 2.2 million workers in 2004.2 Although economic activity slowed during the second half of the year, productivity rates remained favorable. The Federal Reserve Board (Fed) raised the federal funds target rate from 1.00% to 2.25% during the year. The global demand upswing in 2004 favored U.S. exports, which expanded at double-digit rates. However, the U.S. trade and current account balances reached record deficit levels as import volume continued to exceed exports. As the trade deficit widened throughout the year, it reached $60 billion in November 2004.3 The magnitude of the current account deficit also remained quite large relative to the country’s economy at nearly 5.6% of gross domestic product (GDP), compared with 4.5% at the end of 2003.4 The U.S. dollar depreciated during the past year, declining 6.3% against the U.S.’s major trading partners.5
1. Source: J.P. Morgan. One cannot invest directly in an index, nor is an index representative of the Fund’s portfolio. Please see Index Descriptions following the Fund Summaries.
2. Source: Bureau of Labor Statistics.
3. Source: U.S. Census Bureau.
4. Source: Bureau of Economic Analysis. For the one year ended 12/31/04.
5. Source: Federal Reserve Board.
Fund Risks: Bonds and other debt obligations are affected by changes in interest rates and the creditworthiness of their issuers. High yield, lower-rated (junk) bonds generally have greater price swings and higher default risks. Foreign investing involves special risks including currency fluctuations, economic instability, and social and political developments. Emerging markets involve heightened risks due to their relatively smaller size and lesser liquidity. The Fund’s prospectus also includes a description of the main investment risks.
What is a current account?
A current account is that part of the balance of payments where all of one country’s international transactions in goods and services are recorded.
What is balance of payments?
Balance of payments is a record of all of a country’s exports and imports of goods and services, borrowing and lending with the rest of the world during a particular time period. It helps a country evaluate its competitive strengths and weaknesses and forecast the strength of its currency.
TGI-2
Economic growth in the 12-country euro zone strengthened during the year, reaching 1.8% in the third quarter compared with the same period a year earlier, mainly driven by the export sector.6 High unemployment rates corresponded with weak consumer spending in the region. However, tepid domestic demand and currency strength helped contain underlying inflation rates, which remained relatively constant during the period. Consequently, the European Central Bank (ECB) left interest rates unchanged throughout the year. Other European countries exhibited more dynamic growth over the period. Among central European and Scandinavian countries, exports and investment experienced robust growth, propelling third quarter 2004 GDP growth estimates for Poland, Sweden and Hungary to 4.8%, 3.8% and 3.7%, respectively.7 Rising inflationary pressures accompanied Poland’s stronger growth. Sweden’s and Norway’s inflation rates remained low while Hungary’s slowed. Additionally, Sweden and Norway maintained impressive current account surpluses at nearly 7% and 13% of their GDPs.8
Strong regional growth characterized the Asia Pacific region’s economy during the year. Robust domestic demand and export strength bolstered balance of payment positions in China and Thailand. Both countries experienced building inflationary pressures, prompting monetary authorities to raise interest rates or implement administrative measures to maintain low inflation. Although Asia’s domestic growth conditions led to interest rate increases, the region’s balance of payment conditions facilitating international reserve accumulation remained intact. Even without the strong domestic demand seen elsewhere in Asia, South Korea still reached a growth rate of 4.6%, mostly due to competitive external conditions.9 South Korea’s current account surplus nearly doubled over the period, driven by the trade balance as exports rose more than 30%.10 Australia and New Zealand particularly benefited from strong commodity prices over the year as commodities comprised much of their exports. Despite higher interest rates, growth remained strong.
Investment Strategy
We allocate the Fund’s assets among issuers, geographic regions, and currencies based upon our assessment of relative interest rates among currencies, our outlook for changes in interest rates, and credit risks. In considering these factors, we evaluate a country’s changing market,
6. Source: Eurostat.
7. Sources: Eurostat (Poland); Statistics Sweden; Hungarian Central Statistical Office.
8. Sources: Sveriges Riksbank (Sweden); Statistics Sweden; Statistics Norway.
9. Source: Bank of Korea.
10. Source: Korea International Trade Association.
TGI-3
economic and political conditions, such as inflation rate, growth prospects, global trade patterns and government policies. We intend to manage the Fund’s exposure to various currencies, and may from time to time seek to hedge (protect) against currency risk by using forward currency exchange contracts.
Manager’s Discussion
The Fund’s total return is influenced by various factors, including interest rate developments, currency movements and exposure to sovereign debt markets.
Interest Rate Strategy
During the reporting period, interest rate policy generally became less accommodative. As economic growth rebounded and an interest rate tightening cycle, particularly in the U.S., became more probable, we reduced the Fund’s overall portfolio duration exposure. Although the Fed raised U.S. interest rates, short-term real interest rates (accounting for inflation) remained negative and the monetary stance still accommodative. Therefore, the Fund remained positioned defensively to a further rise in U.S. interest rates by maintaining a zero allocation to U.S. Treasury securities. Globally, we found opportunities during the period where interest rate reductions produced positive local market bond returns, or returns in local currency terms, and other instances where interest rate increases facilitated currency gains and overall bond market returns in U.S. dollar terms.
For example, monetary authorities in Sweden reduced interest rates at the beginning of the period. However, continued low inflation rates relative to other developed markets, coupled with currency prospects we felt were attractive, supported local bond market performance. Swedish bond markets rose 8.61% in local currency terms, outperforming not only the broader market, but also euro area and U.S. government bond markets.11 In Indonesia, improved economic stability, declining inflation and prudent fiscal policies prompted their central bank to reduce rates, boosting local bond market returns to 21.00% for the year.12 Relative Fund performance benefited from a lack of exposure to the Japanese government bond market given local market returns of only 1.29% over the year.11 While export growth supported GDP growth in Japan over the past year, interest rates remained close to zero as weak domestic conditions failed to build sustainable inflation.
11. Source: J.P. Morgan.
12. Source: HSBC.
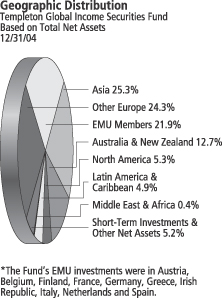
TGI-4
Currency Strategy
During the year, currency gains against the U.S. dollar helped global bond markets outperform the U.S. bond market in U.S. dollar terms as well as in local currency terms. The U.S. sub-index of the JPM GBI Global rose 3.75% compared with other global bond markets’ 10.10% return in U.S. dollars and 4.89% in local currency.13 Consequently, the Fund benefited from its underweighted position in the U.S. relative to the JPM GBI Global.
Fund positioning within Europe and Asia also benefited relative Fund performance. As the euro rose against the U.S. dollar, we used the currency’s strength to reduce our exposure and reallocate the proceeds to other European (non-euro) and Asian currencies where we believed we saw better value. These non-euro currencies generally outperformed the euro, benefiting the Fund’s relative performance. For instance, the Polish zloty appreciated 24.25% against the U.S. dollar, compared with the euro, which rose 7.59%. In addition to attractive currency valuation, strong export growth, rising interest rates and higher confidence following progress on fiscal reform supported currency fundamentals over the period. The strong currency returns brought overall bond market returns in Poland to 36.30% in U.S. dollar terms during the 12-month period.11
The Fund continued to increase its allocation to non-Japan Asia during the period given strong regional growth and trade patterns, and to position itself for potential currency appreciation. The Fund benefited from its overweighted position in South Korea relative to its benchmark. Korea’s bond market rose 25.91% in U.S. dollar terms following a 15.10% appreciation of the South Korean won versus the U.S. dollar.12 The central bank appeared increasingly tolerant of currency appreciation to address inflationary risks associated with an undervalued currency while using interest rate policy to stimulate domestic demand. Thailand underperformed the rest of Asia over the period. However, we still found value in the Thai baht and maintained our position given that we felt fundamentals remained intact. The rest of Asia’s performance more than compensated for lagging returns in Thailand.
Global Sovereign Debt Strategy
The Fund also purchased investment-grade and sub-investment grade sovereign debt that typically compensates for greater credit risk by offering higher yields relative to U.S. and European benchmark treasury
13. Source: J.P. Morgan. Please see Index Descriptions following the Fund Summaries.
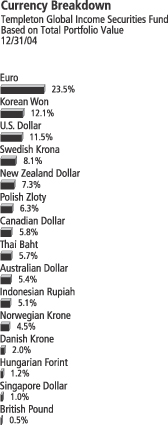
TGI-5
yield curves. Despite rising U.S. interest rates, U.S. dollar-denominated emerging market debt continued to generate strong returns, rising 11.73% over the period, as measured by the JPM Emerging Markets Bond Index Global (EMBIG).13 Sovereign interest rate spreads declined from 403 basis points (100 basis points equal 1.00%) greater than the U.S. Treasury market at the beginning of the reporting period to 347 basis points by period-end. Euro-denominated markets also rose, gaining 11.68% in euro terms and 20.51% in U.S. dollar terms, as measured by the JPM Euro EMBIG.13
Regionally, Latin American sovereign debt rose 13.10%, eastern Europe 10.57% and Asia 6.74%.11 The global demand recovery significantly benefited emerging market economies, particularly commodity exporters, supporting growth and in some cases balance of payment and fiscal conditions. As a result, underlying economic and credit fundamentals remained stronger than in previous economic tightening cycles. For example, independent credit rating agency Standard & Poor’s (S&P) upgraded Venezuela’s and Russia’s sovereign debt during the year mainly due to higher oil prices, the alleviation of some political risks in Venezuela, and Russia’s prudent fiscal and economic policies. Similarly, S&P also upgraded Ukraine’s rating.
Although U.S. dollar denominated sovereign debt produced solid returns over the 12-month period, the Fund shortened duration and reallocated away from U.S. dollar-denominated investment-grade and sub-investment grade debt given a greater sensitivity to rising U.S. rates.
Thank you for your participation in Templeton Global Income Securities Fund. We look forward to serving your future investment needs.
The foregoing information reflects our analysis, opinions and portfolio holdings as of December 31, 2004, the end of the reporting period. The way we implement our main investment strategies and the resulting portfolio holdings may change depending on factors such as market and economic conditions. These opinions may not be relied upon as investment advice or an offer for a particular security. The information is not a complete analysis of every aspect of any market, country, industry, security or the Fund. Statements of fact are from sources considered reliable, but the adviser makes no representation or warranty as to their completeness or accuracy. Although historical performance is no guarantee of future results, these insights may help you understand our investment management philosophy.
TGI-6
Fund Expenses
As an investor in a variable insurance contract (“Contract”) that indirectly provides for investment in an underlying mutual fund, you can incur transaction and/or ongoing expenses at both the Fund level and the Contract level.
| • | | Transaction expenses can include sales charges (loads) on purchases, redemption fees, surrender fees, transfer fees and premium taxes. |
| • | | Ongoing expenses can include management fees, distribution and service (12b-1) fees, contract fees, annual maintenance fees, mortality and expense risk fees and other fees and expenses. All mutual funds and Contracts have some types of ongoing expenses. |
The expenses shown in the table below are meant to highlight ongoing expenses at the Fund level only and do not include ongoing expenses at the Contract level, or transaction expenses at either the Fund or Contract levels. While the Fund does not have transaction expenses, if the transaction and ongoing expenses at the Contract level were included, the expenses shown below would be higher. You should consult your Contract prospectus or disclosure document for more information.
The table shows Fund-level ongoing expenses and can help you understand these expenses and compare them with those of other mutual funds offered through the Contract. The table assumes a $1,000 investment held for the six months indicated. Please refer to the Fund prospectus for additional information on operating expenses.
Actual Fund Expenses
The first line (Actual) for each share class listed in the table below provides actual account values and expenses. The “Ending Account Value” is derived from the Fund’s actual return, which includes the effect of ongoing Fund expenses, but does not include the effect of ongoing Contract expenses.
You can estimate the Fund-level expenses you incurred during the period, by following these steps. Of course, your account value and expenses will differ from those in this illustration:
| 1. | Divide your account value by $1,000. |
If an account had an $8,600 value, then $8,600 ÷ $1,000 = 8.6.
| 2. | Multiply the result by the number under the heading “Fund-Level Expenses Incurred During Period.” |
If Fund-Level Expenses Incurred During Period were $7.50, then 8.6 × $7.50 = $64.50.
Templeton Global Income Securities Fund – Class 2
TGI-7
In this illustration, the estimated expenses incurred this period at the Fund level are $64.50.
Hypothetical Example for Comparison with Other Mutual Funds
Information in the second line (Hypothetical) for each class in the table can help you compare ongoing expenses of the Fund with those of other mutual funds offered through the Contract. This information may not be used to estimate the actual ending account balance or expenses you incurred during the period. The hypothetical “Ending Account Value” is based on the actual expense ratio for each class and an assumed 5% annual rate of return before expenses, which does not represent the Fund’s actual return. The figure under the heading “Fund-Level Expenses Incurred During Period” shows the hypothetical expenses your account would have incurred under this scenario. You can compare this figure with the 5% hypothetical examples that appear in shareholder reports of other funds offered through a Contract.
| | | | | | | | | |
| Class 2 | | Beginning
Account
Value 6/30/04 | | Ending
Account
Value 12/31/04 | | Fund-Level
Expenses Incurred
During Period*
6/30/04-12/31/04 |
Actual | | $ | 1,000 | | $ | 1,164.60 | | $ | 5.60 |
Hypothetical (5% return before expenses) | | $ | 1,000 | | $ | 1,019.96 | | $ | 5.23 |
*Expenses are equal to the annualized expense ratio for the Fund’s Class 2 shares (1.03%), which does not include any ongoing expenses of the Contract for which the Fund is an investment option, multiplied by the average account value over the period, multiplied by 184/366 to reflect the one-half year period.
TGI-8
FRANKLIN TEMPLETON VARIABLE INSURANCE PRODUCTS TRUST
TEMPLETON GLOBAL INCOME SECURITIES FUND
Financial Highlights
| | | | | | | | | | | | | | | | | | | | |
| | | Class 1
| |
| | | Year Ended December 31,
| |
| | | 2004 | | | 2003 | | | 2002 | | | 2001 | | | 2000 | |
| | |
|
|
|
Per share operating performance | | | | | | | | | | | | | | | | | | | | |
(for a share outstanding throughout the year) | | | | | | | | | | | | | | | | | | | | |
Net asset value, beginning of year | | $ | 15.54 | | | $ | 13.67 | | | $ | 11.39 | | | $ | 11.53 | | | $ | 11.07 | |
| | |
|
|
|
Income from investment operations: | | | | | | | | | | | | | | | | | | | | |
Net investment incomea | | | .66 | | | | .69 | | | | .59 | | | | .59 | c | | | .68 | |
Net realized and unrealized gains (losses) | | | 1.37 | | | | 2.35 | | | | 1.83 | | | | (.32 | )c | | | (.20 | ) |
| | |
|
|
|
Total from investment operations | | | 2.03 | | | | 3.04 | | | | 2.42 | | | | .27 | | | | .48 | |
| | |
|
|
|
Less distributions from net investment income | | | (1.77 | ) | | | (1.17 | ) | | | (.14 | ) | | | (.41 | ) | | | (.02 | ) |
| | |
|
|
|
Net asset value, end of year | | $ | 15.80 | | | $ | 15.54 | | | $ | 13.67 | | | $ | 11.39 | | | $ | 11.53 | |
| | |
|
|
|
| | | | | |
Total returnb | | | 15.09% | | | | 22.72% | | | | 21.44% | | | | 2.55% | | | | 4.32% | |
Ratios/supplemental data | | | | | | | | | | | | | | | | | | | | |
Net assets, end of year (000’s) | | $ | 49,845 | | | $ | 52,842 | | | $ | 50,622 | | | $ | 63,781 | | | $ | 81,171 | |
Ratios to average net assets: | | | | | | | | | | | | | | | | | | | | |
Expenses before expense reduction | | | .79% | | | | .76% | | | | .73% | | | | .71% | | | | .72% | |
Expenses net of expense reduction | | | .78% | | | | .76% | | | | .73% | | | | .71% | | | | .72% | |
Net investment income | | | 4.40% | | | | 4.72% | | | | 4.88% | | | | 5.22% | c | | | 6.22% | |
Portfolio turnover rate | | | 37.39% | | | | 53.01% | | | | 27.91% | | | | 122.45% | | | | 40.43% | |
| a | Based on average daily shares outstanding. |
| b | Total return does not include any fees, charges or expenses imposed by the variable annuity and life insurance contracts for which the Franklin Templeton Variable Insurance Products Trust serves as an underlying investment vehicle. Total return is not annualized for periods less than one year. |
| c | Effective January 1, 2001, the Fund adopted the provisions of the AICPA Audit and Accounting Guide for Investment Companies and began amortizing all premium and discount on fixed-income securities, as required. The effect of this change was as follows: |
| | |
Net investment income (loss) per share | | $(.059) |
Net realized and unrealized gains (losses) per share | | .059 |
Ratio of net investment income to average net assets | | (.53)% |
Per share data and ratios for prior periods have not been restated to reflect this change in accounting policy.
See notes to financial statements.
TGI-9
FRANKLIN TEMPLETON VARIABLE INSURANCE PRODUCTS TRUST
TEMPLETON GLOBAL INCOME SECURITIES FUND
Financial Highlights (continued)
| | | | | | | | | | | | | | | | | | | | |
| | | Class 2
| |
| | | Year Ended December 31,
| |
| | | 2004 | | | 2003 | | | 2002 | | | 2001 | | | 2000 | |
| | |
|
|
|
Per share operating performance | | | | | | | | | | | | | | | | | | | | |
(for a share outstanding throughout the year) | | | | | | | | | | | | | | | | | | | | |
Net asset value, beginning of year | | $ | 15.42 | | | $ | 13.59 | | | $ | 11.33 | | | $ | 11.48 | | | $ | 11.04 | |
| | |
|
|
|
Income from investment operations: | | | | | | | | | | | | | | | | | | | | |
Net investment incomea | | | .60 | | | | .65 | | | | .54 | | | | .55 | c | | | .65 | |
Net realized and unrealized gains (losses) | | | 1.36 | | | | 2.33 | | | | 1.84 | | | | (.31 | )c | | | (.19 | ) |
| | |
|
|
|
Total from investment operations | | | 1.96 | | | | 2.98 | | | | 2.38 | | | | .24 | | | | .46 | |
| | |
|
|
|
Less distributions from net investment income | | | (1.74 | ) | | | (1.15 | ) | | | (.12 | ) | | | (.39 | ) | | | (.02 | ) |
| | |
|
|
|
Net asset value, end of year | | $ | 15.64 | | | $ | 15.42 | | | $ | 13.59 | | | $ | 11.33 | | | $ | 11.48 | |
| | |
|
|
|
| | | | | |
Total returnb | | | 14.74% | | | | 22.44% | | | | 21.15% | | | | 2.24% | | | | 4.14% | |
Ratios/supplemental data | | | | | | | | | | | | | | | | | | | | |
Net assets, end of year (000’s) | | $ | 19,779 | | | $ | 5,181 | | | $ | 2,119 | | | $ | 1,286 | | | $ | 1,237 | |
Ratios to average net assets: | | | | | | | | | | | | | | | | | | | | |
Expenses before expense reduction | | | 1.04% | | | | 1.01% | | | | .98% | | | | .96% | | | | .97% | |
Expenses net of expense reduction | | | 1.03% | | | | 1.01% | | | | .98% | | | | .96% | | | | .97% | |
Net investment income | | | 4.15% | | | | 4.47% | | | | 4.63% | | | | 4.95% | c | | | 5.94% | |
Portfolio turnover rate | | | 37.39% | | | | 53.01% | | | | 27.91% | | | | 122.45% | | | | 40.43% | |
| a | Based on average daily shares outstanding. |
| b | Total return does not include any fees, charges or expenses imposed by the variable annuity and life insurance contracts for which the Franklin Templeton Variable Insurance Products Trust serves as an underlying investment vehicle. Total return is not annualized for periods less than one year. |
| c | Effective January 1, 2001, the Fund adopted the provisions of the AICPA Audit and Accounting Guide for Investment Companies and began amortizing all premium and discount on fixed-income securities, as required. The effect of this change was as follows: |
| | |
Net investment income (loss) per share | | $(.059) |
Net realized and unrealized gains (losses) per share | | .059 |
Ratio of net investment income to average net assets | | (.53)% |
Per share data and ratios for prior periods have not been restated to reflect this change in accounting policy.
See notes to financial statements.
TGI-10
FRANKLIN TEMPLETON VARIABLE INSURANCE PRODUCTS TRUST
TEMPLETON GLOBAL INCOME SECURITIES FUND
Statement of Investments, December 31, 2004
| | | | | | |
| | | PRINCIPAL
AMOUNTa | | | VALUE |
Long Term Investments 94.8% | | | | | | |
Australia 5.4% | | | | | | |
New South Wales Treasury Corp., | | | | | | |
6.50%, 5/01/06 | | 200,000 | AUD | | $ | 159,008 |
8.00%, 3/01/08 | | 1,990,000 | AUD | | | 1,675,335 |
Queensland Treasury Corp., 6.00%, | | | | | | |
8/14/13 | | 2,200,000 | AUD | | | 1,782,059 |
10/14/15 | | 200,000 | AUD | | | 162,189 |
| | | | | |
|
|
| | | | | | | 3,778,591 |
| | | | | |
|
|
Austria 2.7% | | | | | | |
Republic of Austria, | | | | | | |
5.50%, 10/20/07 | | 425,000 | EUR | | | 620,267 |
5.00%, 7/15/12 | | 850,000 | EUR | | | 1,273,106 |
| | | | | |
|
|
| | | | | | | 1,893,373 |
| | | | | |
|
|
Belgium 1.6% | | | | | | |
Kingdom of Belgium, 7.50%, 7/29/08 | | 686,000 | EUR | | | 1,076,588 |
| | | | | |
|
|
Brazil .6% | | | | | | |
Republic of Brazil, L, FRN, 3.125%, 4/15/12 | | 403,239 | | | | 386,101 |
| | | | | |
|
|
Canada 5.3% | | | | | | |
Government of Canada, | | | | | | |
8.75%, 12/01/05 | | 345,000 | CAD | | | 303,238 |
3.00%, 6/01/06 | | 1,700,000 | CAD | | | 1,421,715 |
5.75%, 9/01/06 | | 200,000 | CAD | | | 174,445 |
6.00%, 6/01/11 | | 937,000 | CAD | | | 869,312 |
Province of Alberta, | | | | | | |
7.50%, 12/01/05 | | 930,000 | CAD | | | 808,375 |
senior note, 7.25%, 10/28/05 | | 150,000 | CAD | | | 129,476 |
| | | | | |
|
|
| | | | | | | 3,706,561 |
| | | | | |
|
|
Colombia .4% | | | | | | |
Republic of Colombia, | | | | | | |
10.00%, 1/23/12 | | 132,000 | | | | 152,131 |
11.75%, 2/25/20 | | 119,000 | | | | 152,338 |
| | | | | |
|
|
| | | | | | | 304,469 |
| | | | | |
|
|
Denmark 2.0% | | | | | | |
Kingdom of Denmark, | | | | | | |
7.00%, 11/15/07 | | 1,450,000 | DKK | | | 295,176 |
5.00%, 11/15/13 | | 3,950,000 | DKK | | | 793,149 |
7.00%, 11/10/24 | | 1,300,000 | DKK | | | 325,951 |
| | | | | |
|
|
| | | | | | | 1,414,276 |
| | | | | |
|
|
Finland 3.6% | | | | | | |
Government of Finland, | | | | | | |
5.00%, 4/25/09 | | 660,000 | EUR | | | 968,971 |
5.375%, 7/04/13 | | 1,000,000 | EUR | | | 1,538,498 |
| | | | | |
|
|
| | | | | | | 2,507,469 |
| | | | | |
|
|
France 2.2% | | | | | | |
Government of France, 4.00%, 10/25/09 | | 1,055,000 | EUR | | | 1,494,537 |
| | | | | |
|
|
TGI-11
FRANKLIN TEMPLETON VARIABLE INSURANCE PRODUCTS TRUST
TEMPLETON GLOBAL INCOME SECURITIES FUND
Statement of Investments, December 31, 2004 (cont.)
| | | | | | |
| | | PRINCIPAL
AMOUNTa | | | VALUE |
Long Term Investments (cont.) | | | | | | |
Germany 2.5% | | | | | | |
Federal Republic of Germany, | | | | | | |
2.50%, 9/16/05 | | 385,000 | EUR | | $ | 523,495 |
4.00%, 2/16/07 | | 860,000 | EUR | | | 1,201,785 |
| | | | | |
|
|
| | | | | | | 1,725,280 |
| | | | | |
|
|
Greece 1.5% | | | | | | |
Hellenic Republic, 4.60%, 5/20/13 | | 700,000 | EUR | | | 1,011,538 |
| | | | | |
|
|
Hungary 1.2% | | | | | | |
Government of Hungary, | | | | | | |
9.25%, 5/12/05 | | 31,800,000 | HUF | | | 176,041 |
8.50%, 10/12/05 | | 101,100,000 | HUF | | | 557,870 |
7.00%, 4/12/06 | | 20,000,000 | HUF | | | 108,521 |
| | | | | |
|
|
| | | | | | | 842,432 |
| | | | | |
|
|
Indonesia 5.1% | | | | | | |
Government of Indonesia, 11.00%, 10/15/14 | | 600,000,000 | IDR | | | 67,038 |
Indonesia Recapital Bond, | | | | | | |
14.00%, 6/15/09 | | 7,407,000,000 | IDR | | | 914,454 |
13.15%, 3/15/10 | | 6,005,000,000 | IDR | | | 726,487 |
14.25%, 6/15/13 | | 2,550,000,000 | IDR | | | 332,400 |
14.275%, 12/15/13 | | 11,692,000,000 | IDR | | | 1,527,233 |
| | | | | |
|
|
| | | | | | | 3,567,612 |
| | | | | |
|
|
Irish Republic 1.7% | | | | | | |
Republic of Ireland, 5.00%, 4/18/13 | | 800,000 | EUR | | | 1,202,204 |
| | | | | |
|
|
Italy 1.1% | | | | | | |
Buoni Poliennali Del Tesoro, 7.75%, 11/01/06 | | 531,293 | EUR | | | 787,726 |
| | | | | |
|
|
Mexico 1.0% | | | | | | |
United Mexican States, 144A, 7.50%, 3/08/10 | | 450,000 | EUR | | | 713,697 |
| | | | | |
|
|
Netherlands 4.2% | | | | | | |
Government of Netherlands, | | | | | | |
3.00%, 7/15/06 | | 450,000 | EUR | | | 616,024 |
5.75%, 2/15/07 | | 1,598,000 | EUR | | | 2,311,171 |
| | | | | |
|
|
| | | | | | | 2,927,195 |
| | | | | |
|
|
New Zealand 7.3% | | | | | | |
Government of New Zealand, | | | | | | |
7.00%, 7/15/09 | | 5,430,000 | NZD | | | 4,049,125 |
6.00%, 11/15/11 | | 1,300,000 | NZD | | | 934,315 |
6.50%, 4/15/13 | | 130,000 | NZD | | | 96,479 |
| | | | | |
|
|
| | | | | | | 5,079,919 |
| | | | | |
|
|
Norway 1.9% | | | | | | |
Kingdom of Norway, 6.75%, 1/15/07 | | 7,350,000 | NOK | | | 1,313,994 |
| | | | | |
|
|
Philippines 1.4% | | | | | | |
Republic of Philippines, | | | | | | |
9.00%, 2/15/13 | | 800,000 | | | | 820,520 |
Reg S, 9.125%, 2/22/10 | | 100,000 | EUR | | | 143,958 |
| | | | | |
|
|
| | | | | | | 964,478 |
| | | | | |
|
|
TGI-12
FRANKLIN TEMPLETON VARIABLE INSURANCE PRODUCTS TRUST
TEMPLETON GLOBAL INCOME SECURITIES FUND
Statement of Investments, December 31, 2004 (cont.)
| | | | | | |
| | | PRINCIPAL
AMOUNTa | | | VALUE |
Long Term Investments (cont.) | | | | | | |
Poland 6.3% | | | | | | |
Republic of Poland, | | | | | | |
8.50%, 11/12/06 | | 4,720,000 | PLN | | $ | 1,627,284 |
8.50%, 5/12/07 | | 3,290,000 | PLN | | | 1,148,035 |
6.00%, 5/24/09 | | 4,860,000 | PLN | | | 1,604,566 |
| | | | | |
|
|
| | | | | | | 4,379,885 |
| | | | | |
|
|
Russia 1.8% | | | | | | |
Russian Federation, Reg S, | | | | | | |
11.00%, 7/24/18 | | 860,000 | | | | 1,207,300 |
5.00% to 3/31/07, 7.50% thereafter, 3/31/30 | | 45,000 | | | | 46,593 |
| | | | | |
|
|
| | | | | | | 1,253,893 |
| | | | | |
|
|
Singapore 1.0% | | | | | | |
Republic of Singapore, | | | | | | |
4.00%, 3/01/07 | | 850,000 | SGD | | | 546,759 |
2.625%, 10/01/07 | | 180,000 | SGD | | | 112,969 |
| | | | | |
|
|
| | | | | | | 659,728 |
| | | | | |
|
|
South Africa .4% | | | | | | |
Republic of South Africa, 5.25%, 5/16/13 | | 200,000 | EUR | | | 288,512 |
| | | | | |
|
|
South Korea 12.1% | | | | | | |
Korea Treasury Bond, | | | | | | |
4.50%, 3/05/06 | | 2,100,000,000 | KRW | | | 2,086,321 |
4.50%, 9/03/06 | | 510,000,000 | KRW | | | 509,666 |
6.90%, 1/16/07 | | 1,200,000,000 | KRW | | | 1,258,410 |
4.75%, 3/03/07 | | 1,600,000,000 | KRW | | | 1,616,967 |
4.75%, 3/12/08 | | 2,883,000,000 | KRW | | | 2,942,877 |
| | | | | |
|
|
| | | | | | | 8,414,241 |
| | | | | |
|
|
Spain .8% | | | | | | |
Government of Spain, 6.00%, 1/31/08 | | 390,000 | EUR | | | 579,786 |
| | | | | |
|
|
Sweden 8.1% | | | | | | |
Kingdom of Sweden, | | | | | | |
6.00%, 2/09/05 | | 5,500,000 | SEK | | | 830,923 |
3.50%, 4/20/06 | | 3,800,000 | SEK | | | 580,681 |
8.00%, 8/15/07 | | 14,990,000 | SEK | | | 2,551,330 |
5.25%, 3/15/11 | | 3,900,000 | SEK | | | 642,073 |
5.50%, 10/08/12 | | 6,280,000 | SEK | | | 1,054,821 |
| | | | | |
|
|
| | | | | | | 5,659,828 |
| | | | | |
|
|
Thailand 5.7% | | | | | | |
Government of Thailand, | | | | | | |
6.00%, 3/05/05 | | 8,000,000 | THB | | | 207,450 |
8.50%, 10/14/05 | | 82,800,000 | THB | | | 2,240,183 |
8.00%, 12/08/06 | | 43,500,000 | THB | | | 1,228,141 |
4.125%, 2/12/08 | | 9,000,000 | THB | | | 237,758 |
8.50%, 12/08/08 | | 1,000,000 | THB | | | 30,397 |
| | | | | |
|
|
| | | | | | | 3,943,929 |
| | | | | |
|
|
TGI-13
FRANKLIN TEMPLETON VARIABLE INSURANCE PRODUCTS TRUST
TEMPLETON GLOBAL INCOME SECURITIES FUND
Statement of Investments, December 31, 2004 (cont.)
| | | | | | | |
| | | PRINCIPAL
AMOUNTa | | | VALUE |
Long Term Investments (cont.) | | | | | | | |
Ukraine 2.5% | | | | | | | |
Republic of Ukraine, | | | | | | | |
144A, 6.875%, 3/04/11 | | $ | 260,000 | | | $ | 267,475 |
144A, 7.65%, 6/11/13 | | | 1,130,000 | | | | 1,211,078 |
FRN, 5.36%, 8/05/09 | | | 275,000 | | | | 291,761 |
| | | | | | |
|
|
| | | | | | | | 1,770,314 |
| | | | | | |
|
|
United Kingdom .5% | | | | | | | |
United Kingdom, 7.50%, 12/07/06 | | | 175,000 | GBP | | | 354,750 |
| | | | | | |
|
|
Venezuela 2.9% | | | | | | | |
Republic of Venezuela, | | | | | | | |
9.25%, 9/15/27 | | | 1,710,000 | | | | 1,808,325 |
FRN, 3.09%, 4/20/11 | | | 265,000 | | | | 241,647 |
| | | | | | |
|
|
| | | | | | | | 2,049,972 |
| | | | | | |
|
|
Total Long Term Investments (Cost $53,802,148) | | | | | | | 66,052,878 |
| | | | | | |
|
|
Short Term Investments 3.1% | | | | | | | |
Canada .5% | | | | | | | |
bCanada Treasury Bill, 7/14/05 | | | 390,000 | CAD | | | 320,347 |
| | | | | | |
|
|
Norway 2.6% | | | | | | | |
bNorwegian Treasury Bills, 6/15/05 - 9/21/05 | | | 11,140,000 | NOK | | | 1,814,775 |
| | | | | | |
|
|
Total Short Term Investments (Cost $2,028,754) | | | | | | | 2,135,122 |
| | | | | | |
|
|
Total Investments (Cost $55,830,902) 97.9% | | | | | | | 68,188,000 |
Other Assets, less Liabilities 2.1% | | | | | | | 1,436,173 |
| | | | | | |
|
|
Net Assets 100.0% | | | | | | $ | 69,624,173 |
| | | | | | |
|
|
Currency Abbreviations:
AUD - Australian Dollar
CAD - Canadian Dollar
DKK - Danish Krone
EUR - Euro
GBP - British Pound
HUF - Hungarian Forint
IDR - Indonesian Rupiah
KRW - South Korean Won
NOK - Norwegian Krone
NZD - New Zealand Dollar
PLN - Polish Zloty
SEK - Swedish Krona
SGD - Singapore Dollar
THB - Thai Baht
Portfolio Abbreviation:
FRN - Floating Rate Note
| a | The principal amount is stated in U.S. dollars unless otherwise indicated. |
| b | Security is traded on a discount basis with no stated coupon rate. |
See notes to financial statements.
TGI-14
FRANKLIN TEMPLETON VARIABLE INSURANCE PRODUCTS TRUST
TEMPLETON GLOBAL INCOME SECURITIES FUND
Financial Statements
Statement of Assets and Liabilities
December 31, 2004
| | | | |
Assets: | | | | |
Investments in securities: | | | | |
Cost | | $ | 55,830,902 | |
| | |
|
|
|
Value | | | 68,188,000 | |
Foreign currency, at value (cost $127,248) | | | 129,352 | |
Receivables: | | | | |
Capital shares sold | | | 43,966 | |
Interest | | | 1,469,536 | |
| | |
|
|
|
Total assets | | | 69,830,854 | |
| | |
|
|
|
Liabilities: | | | | |
Payables: | | | | |
Capital shares redeemed | | | 7,359 | |
Affiliates | | | 43,839 | |
Funds advanced by custodian | | | 118,787 | |
Custodian fees (Note 4) | | | 10,500 | |
Professional fees | | | 16,936 | |
Other liabilities | | | 9,260 | |
| | |
|
|
|
Total liabilities | | | 206,681 | |
| | |
|
|
|
Net assets, at value | | $ | 69,624,173 | |
| | |
|
|
|
Net assets consist of: | | | | |
Undistributed net investment income | | $ | 3,781,771 | |
Net unrealized appreciation (depreciation) | | | 12,454,569 | |
Accumulated net realized gain (loss) | | | (9,131,804 | ) |
Capital shares | | | 62,519,637 | |
| | |
|
|
|
Net assets, at value | | $ | 69,624,173 | |
| | |
|
|
|
Class 1: | | | | |
Net assets, at value | | $ | 49,844,681 | |
| | |
|
|
|
Shares outstanding | | | 3,154,870 | |
| | |
|
|
|
Net asset value and offering price per share | | $ | 15.80 | |
| | |
|
|
|
Class 2: | | | | |
Net assets, at value | | $ | 19,779,492 | |
| | |
|
|
|
Shares outstanding | | | 1,264,323 | |
| | |
|
|
|
Net asset value and offering price per share | | $ | 15.64 | |
| | |
|
|
|
See notes to financial statements.
TGI-15
FRANKLIN TEMPLETON VARIABLE INSURANCE PRODUCTS TRUST
TEMPLETON GLOBAL INCOME SECURITIES FUND
Financial Statements (continued)
Statement of Operations
for the year ended December 31, 2004
| | | | |
Investment income: | | | | |
Interest (net of foreign taxes of $72,127) | | $ | 2,990,567 | |
Expenses: | | | | |
Management fees (Note 3) | | | 360,978 | |
Distribution fees - Class 2 (Note 3) | | | 22,555 | |
Transfer agent fees | | | 2,366 | |
Custodian fees (Note 4) | | | 40,431 | |
Reports to shareholders | | | 29,550 | |
Professional fees | | | 17,044 | |
Trustees’ fees and expenses | | | 349 | |
Other | | | 4,253 | |
| | |
|
|
|
Total expenses | | | 477,526 | |
Expense reductions (Note 4) | | | (4,537 | ) |
| | |
|
|
|
Net expenses | | | 472,989 | |
| | |
|
|
|
Net investment income | | | 2,517,578 | |
| | |
|
|
|
Realized and unrealized gains (losses): | | | | |
Net realized gain (loss) from: | | | | |
Investments | | | 3,211,042 | |
Foreign currency transactions | | | 63,626 | |
| | |
|
|
|
Net realized gain (loss) | | | 3,274,668 | |
| | |
|
|
|
Net change in unrealized appreciation (depreciation) on: | | | | |
Investments | | | 2,882,362 | |
Translation of assets and liabilities denominated in foreign currencies | | | 15,420 | |
| | |
|
|
|
Net change in unrealized appreciation (depreciation) | | | 2,897,782 | |
| | |
|
|
|
Net realized and unrealized gain (loss) | | | 6,172,450 | |
| | |
|
|
|
Net increase (decrease) in net assets resulting from operations | | $ | 8,690,028 | |
| | |
|
|
|
See notes to financial statements.
TGI-16
FRANKLIN TEMPLETON VARIABLE INSURANCE PRODUCTS TRUST
TEMPLETON GLOBAL INCOME SECURITIES FUND
Financial Statements (continued)
Statements of Changes in Net Assets
for the years ended December 31, 2004 and 2003
| | | | | | | | |
| | | 2004 | | | 2003 | |
| | |
| |
Increase (decrease) in net assets: | | | | | | | | |
Operations: | | | | | | | | |
Net investment income | | $ | 2,517,578 | | | $ | 2,601,977 | |
Net realized gain (loss) from investments and foreign currency transactions | | | 3,274,668 | | | | 3,815,347 | |
Net change in unrealized appreciation (depreciation) on investments and translation of assets and liabilities denominated in foreign currencies | | | 2,897,782 | | | | 4,940,637 | |
| | |
| |
Net increase (decrease) in net assets resulting from operations | | | 8,690,028 | | | | 11,357,961 | |
Distributions to shareholders from: | | | | | | | | |
Net investment income: | | | | | | | | |
Class 1 | | | (5,364,377 | ) | | | (3,980,291 | ) |
Class 2 | | | (706,986 | ) | | | (323,749 | ) |
| | |
| |
Total distributions to shareholders | | | (6,071,363 | ) | | | (4,304,040 | ) |
Capital share transactions: (Note 2) | | | | | | | | |
Class 1 | | | (4,352,338 | ) | | | (4,386,768 | ) |
Class 2 | | | 13,335,159 | | | | 2,614,619 | |
| | |
| |
Total capital share transactions | | | 8,982,821 | | | | (1,772,149 | ) |
Net increase (decrease) in net assets | | | 11,601,486 | | | | 5,281,772 | |
Net assets: | | | | | | | | |
Beginning of year | | | 58,022,687 | | | | 52,740,915 | |
| | |
| |
End of year | | $ | 69,624,173 | | | $ | 58,022,687 | |
| | |
| |
Undistributed net investment income included in net assets: | | | | | | | | |
End of year | | $ | 3,781,771 | | | $ | 5,047,873 | |
| | |
| |
See notes to financial statements.
TGI-17
FRANKLIN TEMPLETON VARIABLE INSURANCE PRODUCTS TRUST
TEMPLETON GLOBAL INCOME SECURITIES FUND
Notes to Financial Statements
1. ORGANIZATION AND SIGNIFICANT ACCOUNTING POLICIES
Franklin Templeton Variable Insurance Products Trust (the Trust) is registered under the Investment Company Act of 1940 as an open-end investment company, consisting of twenty-one separate series (the Funds). The Templeton Global Income Securities Fund (the Fund) included in this report is non-diversified. The financial statements of the remaining funds in the series are presented separately. Shares of the Fund are sold only to insurance company separate accounts to fund the benefits of variable life insurance policies or variable annuity contracts. As of December 31, 2004, over 61% of the Fund’s shares were sold through one insurance company. The Fund’s investment objective is current income.
The following summarizes the Fund’s significant accounting policies.
a. Security Valuation
Securities listed on a securities exchange or on the NASDAQ National Market System are valued at the last quoted sale price or the official closing price of the day, respectively. Over-the-counter securities and listed securities for which there is no reported sale are valued within the range of the most recent quoted bid and ask prices. Securities that trade in multiple markets or on multiple exchanges are valued according to the broadest and most representative market.
Foreign securities are valued as of the close of trading on the foreign stock exchange on which the security is primarily traded, or the NYSE, whichever is earlier. The value is then converted into its U.S. dollar equivalent at the foreign exchange rate in effect at the close of the NYSE on the day that the value of the foreign security is determined. If no sale is reported at that time, the foreign security will be valued within the range of the most recent quoted bid and ask prices.
The Trust has procedures to determine the fair value of individual securities and other assets for which market prices are not readily available or which may not be reliably priced. Some methods for valuing these securities may include: fundamental analysis, matrix pricing, discounts from market prices of similar securities, or discounts applied due to the nature and duration of restrictions on the disposition of the securities. Occasionally, events occur between the time at which trading in a security is completed and the close of the NYSE that might call into question the availability (including the reliability) of the value of a portfolio security held by the Fund. If such an event occurs, the securities may be valued using fair value procedures, which may include the use of independent pricing services. All security valuation procedures are approved by the Trust’s Board of Trustees.
b. Foreign Currency Translation
Portfolio securities and other assets and liabilities denominated in foreign currencies are translated into U.S. dollars based on the exchange rate of such currencies against U.S. dollars on the date of valuation. Purchases and sales of securities, income and expense items denominated in foreign currencies are translated into U.S. dollars at the exchange rate in effect on the transaction date. Occasionally events may impact the availability or reliability of foreign exchange rates used to convert the U.S. dollar equivalent value. If such an event occurs, the foreign exchange rate will be valued at fair value using procedures established and approved by the Fund’s Board of Trustees.
The Fund does not separately report the effect of changes in foreign exchange rates from changes in market prices on securities held. Such changes are included in net realized and unrealized gain or loss from investments on the Statement of Operations.
Realized foreign exchange gains or losses arise from sales of foreign currencies, currency gains or losses realized between the trade and settlement dates on securities transactions and the difference between the recorded amounts of dividends, interest, and foreign withholding taxes and the U.S. dollar equivalent of the amounts actually received or paid. Net unrealized foreign exchange gains and losses arise from changes in foreign exchange rates on foreign denominated assets and liabilities other than investments in securities.
TGI-18
FRANKLIN TEMPLETON VARIABLE INSURANCE PRODUCTS TRUST
TEMPLETON GLOBAL INCOME SECURITIES FUND
Notes to Financial Statements (continued)
1. ORGANIZATION AND SIGNIFICANT ACCOUNTING POLICIES (cont.)
c. Foreign Currency Contracts
When the Fund purchases or sells foreign securities it may enter into foreign exchange contracts to minimize foreign exchange risk from the trade date to the settlement date of the transactions. A foreign exchange contract is an agreement between two parties to exchange different currencies at an agreed upon exchange rate on a specified date. Realized and unrealized gains and losses on these contracts are included in the Statement of Operations.
The risks of these contracts include movement in the values of the foreign currencies relative to the U.S. dollar and the possible inability of the counterparties to fulfill their obligations under the contracts.
d. Income Taxes
No provision has been made for U.S. income taxes because the Fund’s policy is to qualify as a regulated investment company under Subchapter M of the Internal Revenue Code and to distribute substantially all of its taxable income. Fund distributions to shareholders are determined on an income tax basis and may differ from net investment income and realized gains for financial reporting purposes.
e. Security Transactions, Investment Income, Expenses and Distributions
Security transactions are accounted for on trade date. Realized gains and losses on security transactions are determined on a specific identification basis. Interest income and estimated expenses are accrued daily. Discounts and premiums on securities purchased are amortized over the lives of the respective securities. Distributions to shareholders are recorded on the ex-dividend date.
Common expenses incurred by the Trust are allocated among the funds based on the ratio of net assets of each fund to the combined net assets. Other expenses are charged to each fund on a specific identification basis.
Realized and unrealized gains and losses and net investment income, other than class specific expenses, are allocated daily to each class of shares based upon the relative proportion of net assets of each class.
f. Accounting Estimates
The preparation of financial statements in accordance with accounting principles generally accepted in the United States of America requires management to make estimates and assumptions that affect the reported amounts of assets and liabilities at the date of the financial statements and the amounts of income and expenses during the reporting period. Actual results could differ from those estimates.
g. Guarantees and Indemnifications
Under the Trust’s organizational documents, its officers and trustees are indemnified by the Trust against certain liability arising out of the performance of their duties to the Trust. Additionally, in the normal course of business, the Trust enters into contracts with service providers that contain general indemnification clauses. The Trust’s maximum exposure under these arrangements is unknown as this would involve future claims that may be made against the Trust that have not yet occurred. However, based on experience, the Trust expects the risk of loss to be remote.
TGI-19
FRANKLIN TEMPLETON VARIABLE INSURANCE PRODUCTS TRUST
TEMPLETON GLOBAL INCOME SECURITIES FUND
Notes to Financial Statements (continued)
2. SHARES OF BENEFICIAL INTEREST
The Fund offers two classes of shares: Class 1 and Class 2. Each class of shares differs by its distribution fees, voting rights on matters affecting a single class and its exchange privilege.
At December 31, 2004, there were an unlimited number of shares authorized ($.01 par value). Transactions in the Fund’s shares were as follows:
| | | | | | | | | | | | | | |
| | | Year Ended December 31,
| |
| | | 2004
| | | 2003
| |
| Class 1 Shares: | | Shares
| | | Amount
| | | Shares
| | | Amount
| |
Shares sold | | 142,426 | | | $ | 2,100,636 | | | 157,660 | | | $ | 2,314,617 | |
Shares issued in reinvestment of distributions | | 400,626 | | | | 5,364,377 | | | 271,137 | | | | 3,980,291 | |
Shares redeemed | | (788,314 | ) | | | (11,817,351 | ) | | (733,010 | ) | | | (10,681,676 | ) |
| | |
| |
Net increase (decrease) | | (245,262 | ) | | $ | (4,352,338 | ) | | (304,213 | ) | | $ | (4,386,768 | ) |
| | |
| |
| Class 2 Shares: | | | | | | | | | | | | |
Shares sold | | 973,769 | | | $ | 14,111,268 | | | 255,207 | | | $ | 3,668,776 | |
Shares issued in reinvestment of distributions | | 53,237 | | | | 706,986 | | | 22,205 | | | | 323,749 | |
Shares redeemed | | (98,666 | ) | | | (1,483,095 | ) | | (97,419 | ) | | | (1,377,906 | ) |
| | |
| |
Net increase (decrease) | | 928,340 | | | $ | 13,335,159 | | | 179,993 | | | $ | 2,614,619 | |
| | |
| |
3. TRANSACTIONS WITH AFFILIATES
Certain officers and trustees of the Fund are also officers and/or directors of the following entities:
| | |
| Entity | | Affiliation |
Franklin Advisers Inc. (Advisers) | | Investment manager |
Franklin Templeton Services LLC (FT Services) | | Administrative manager |
Franklin Templeton Distributors Inc. (Distributors) | | Principal underwriter |
Franklin Templeton Investor Services LLC (Investor Services) | | Transfer agent |
a. Management Fees
The Fund pays an investment management fee to Advisers based on the average daily net assets of the Fund as follows:
| | |
| Annualized Fee Rate | | Net Assets |
| .625% | | First $100 million |
| .500% | | Over $100 million, up to and including $250 million |
| .450% | | Over $250 million, up to and including $10 billion |
Fees are further reduced on net assets over $10 billion.
b. Administrative Fees
Under an agreement with Advisers, FT Services provides administrative services to the Fund. The fee is paid by Advisers based on the average daily net assets of the Fund, and is not an additional expense of the Fund.
TGI-20
FRANKLIN TEMPLETON VARIABLE INSURANCE PRODUCTS TRUST
TEMPLETON GLOBAL INCOME SECURITIES FUND
Notes to Financial Statements (continued)
3. TRANSACTIONS WITH AFFILIATES (cont.)
c. Distribution Fees
The Fund reimburses Distributors up to .25% per year of its average daily net assets of Class 2, for costs incurred in marketing the Fund’s shares under a Rule 12b-1 plan.
d. Transfer Agent Fees
Investor Services, under terms of an agreement, performs shareholder servicing for the Fund and is not paid by the Fund for the services.
4. EXPENSE OFFSET ARRANGEMENT
The Fund has entered into an arrangement with its custodian whereby credits realized as a result of uninvested cash balances are used to reduce a portion of the Fund’s custodian expenses. During the year ended December 31, 2004, the custodian fees were reduced as noted in the Statement of Operations.
5. INCOME TAXES
At December 31, 2004, the Fund had tax basis capital losses which may be carried over to offset future capital gains. Such losses expire as follows:
| | | |
Capital loss carryovers expiring in: | | | |
2007 | | $ | 4,883,076 |
2008 | | | 2,370,518 |
2009 | | | 1,649,033 |
2010 | | | 177,731 |
| | |
|
|
| | | $ | 9,080,358 |
| | |
|
|
The tax character of distributions paid during the years ended December 31, 2004 and 2003, was as follows:
| | | | | | |
| | | 2004
| | 2003
|
Distributions paid from ordinary income | | $ | 6,071,363 | | $ | 4,304,040 |
| | |
|
Net investment income (loss) differs for financial statement and tax purposes primarily due to differing treatments of foreign currency transactions and bond discounts and premiums.
Net realized gains (losses) differ for financial statement and tax purposes primarily due to differing treatments of wash sales, foreign currency transactions, and bond discounts and premiums.
At December 31, 2004, the cost of investments, net unrealized appreciation (depreciation), and undistributed ordinary income for income tax purposes were as follows:
| | | | |
Cost of investments | | $ | 56,787,092 | |
| | |
|
|
|
Unrealized appreciation | | $ | 11,476,104 | |
Unrealized depreciation | | | (75,196 | ) |
| | |
|
|
|
Net unrealized appreciation (depreciation) | | $ | 11,400,908 | |
| | |
|
|
|
Undistributed ordinary income | | $ | 4,687,040 | |
| | |
|
|
|
TGI-21
FRANKLIN TEMPLETON VARIABLE INSURANCE PRODUCTS TRUST
TEMPLETON GLOBAL INCOME SECURITIES FUND
Notes to Financial Statements (continued)
6. INVESTMENT TRANSACTIONS
Purchases and sales of investments (excluding short-term securities) for the year ended December 31, 2004, aggregated $25,137,986 and $20,929,042, respectively.
7. CREDIT RISK
The Fund has 15.1% of its portfolio invested in below investment grade and comparable quality unrated high yield securities, which tend to be more sensitive to economic conditions than higher rated securities. The risk of loss due to default by the issuer may be significantly greater for the holders of high yielding securities because such securities are generally unsecured and are often subordinated to other creditors of the issuer.
8. REGULATORY MATTERS
Investigations
As part of various investigations by a number of federal, state, and foreign regulators and governmental entities, including the Securities and Exchange Commission (“SEC”), the California Attorney General’s Office (“CAGO”), and the National Association of Securities Dealers, Inc. (“NASD”), relating to certain practices in the mutual fund industry, including late trading, market timing and marketing support payments to securities dealers who sell fund shares, Franklin Resources, Inc. and certain of its subsidiaries (as used in this section, together, the “Company”), as well as certain current or former executives and employees of the Company, received subpoenas and/or requests for documents, information and/or testimony. The Company and its current employees provided documents and information in response to those requests and subpoenas.
Settlements
Beginning in August 2004, the Company entered into settlements with certain regulators investigating the mutual fund industry practices noted above. The Company believes that settlement of each of the matters described in this section is in the best interest of the Company and shareholders of the Franklin, Templeton, and Mutual Series mutual funds (the “funds”).
On August 2, 2004, Franklin Resources, Inc. announced that its subsidiary, Franklin Advisers, Inc., reached an agreement with the SEC that resolved the issues resulting from the SEC investigation into market timing activity. In connection with that agreement, the SEC issued an “Order Instituting Administrative and Cease-and-Desist Proceedings Pursuant to Sections 203(e) and 203(k) of the Investment Advisers Act of 1940 and Sections 9(b) and 9(f) of the Investment Company Act of 1940, Making Findings and Imposing Remedial Sanctions and a Cease-and-Desist Order” (the “Order”). The SEC’s Order concerned the activities of a limited number of third parties that ended in 2000 and those that were the subject of the first Massachusetts administrative complaint described below.
Under the terms of the SEC’s Order, pursuant to which Franklin Advisers, Inc. neither admitted nor denied any of the findings contained therein, Franklin Advisers, Inc. agreed to pay $50 million, of which $20 million is a civil penalty, to be distributed to shareholders of certain funds in accordance with a plan to be developed by an independent distribution consultant. At this time, it is unclear which funds or which shareholders of any particular fund will receive distributions. The Order also required Franklin Advisers, Inc. to, among other things, enhance and periodically review compliance policies and procedures.
On September 20, 2004, Franklin Resources, Inc. announced that two of its subsidiaries, Franklin Advisers, Inc. and Franklin Templeton Alternative Strategies, Inc. (“FTAS”), reached an agreement with the Securities Division of the Office of the Secretary of the Commonwealth of Massachusetts (the “State of Massachusetts”) related to its administrative complaint filed on February 4, 2004, concerning one instance of market timing that was also a subject of the August 2, 2004 settlement that Franklin Advisers, Inc. reached with the SEC, as described above.
TGI-22
FRANKLIN TEMPLETON VARIABLE INSURANCE PRODUCTS TRUST
TEMPLETON GLOBAL INCOME SECURITIES FUND
Notes to Financial Statements (continued)
8. REGULATORY MATTERS (cont.)
Settlements (cont.)
Under the terms of the settlement consent order issued by the State of Massachusetts, Franklin Advisers, Inc. and FTAS consented to the entry of a cease-and-desist order and agreed to pay a $5 million administrative fine to the State of Massachusetts (the “Massachusetts Consent Order”). The Massachusetts Consent Order included two different sections: “Statements of Fact” and “Violations of Massachusetts Securities Laws.” Franklin Advisers, Inc. and FTAS admitted the facts in the Statements of Fact.
On October 25, 2004, the State of Massachusetts filed a second administrative complaint, alleging that Franklin Resources, Inc.’s Form 8-K filing (in which it described the Massachusetts Consent Order and stated that “Franklin did not admit or deny engaging in any wrongdoing”) failed to state that Franklin Advisers, Inc. and FTAS admitted the Statements of Fact portion of the Massachusetts Consent Order (the “Second Complaint”). Franklin Resources, Inc. reached a second agreement with the State of Massachusetts on November 19, 2004, resolving the Second Complaint. As a result of the November 19, 2004 settlement, Franklin Resources, Inc. filed a new Form 8-K. The terms of the Massachusetts Consent Order did not change and there was no monetary fine associated with this second settlement.
On November 17, 2004, Franklin Resources, Inc. announced that Franklin/Templeton Distributors, Inc. (“FTDI”) reached an agreement with the CAGO, resolving the issues resulting from the CAGO’s investigation concerning sales and marketing support payments. Under the terms of the settlement, FTDI neither admitted nor denied the allegations in the CAGO’s complaint and agreed to pay $2 million to the State of California as a civil penalty, $14 million to the funds, to be allocated by an independent distribution consultant to be paid for by FTDI, and $2 million to the CAGO for its investigative costs.
On December 13, 2004, Franklin Resources, Inc. announced that its subsidiaries FTDI and Franklin Advisers, Inc. reached an agreement with the SEC, resolving the issues resulting from the SEC’s investigation concerning marketing support payments to securities dealers who sell fund shares. In connection with that agreement, the SEC issued an “Order Instituting Administrative and Cease-and-Desist Proceedings, Making Findings, and Imposing Remedial Sanctions Pursuant to Sections 203(e) and 203(k) of the Investment Advisers Act of 1940, Sections 9(b) and 9(f) of the Investment Company Act of 1940, and Section 15(b) of the Securities Exchange Act of 1934” (the “Second Order”).
Under the terms of the Second Order, in which FTDI and Franklin Advisers, Inc. neither admitted nor denied the findings contained therein, they agreed to pay the funds a penalty of $20 million and disgorgement of $1 (one dollar). FTDI and Franklin Advisers, Inc. also agreed to implement certain measures and undertakings relating to marketing support payments to broker-dealers for the promotion or sale of fund shares, including making additional disclosures in the funds’ Prospectuses and Statements of Additional Information. The Second Order further requires the appointment of an independent distribution consultant, at the Company’s expense, who shall develop a plan for the distribution of the penalty and disgorgement to the funds.
Other Legal Proceedings
The Trust, in addition to the Company and other funds, and certain current and former officers, employees, and directors have been named in multiple lawsuits in different federal courts in Nevada, California, Illinois, New York and Florida, alleging violations of various federal securities laws and seeking, among other relief, monetary damages, restitution, removal of fund trustees, directors, advisers, administrators, and distributors, rescission of management contracts and 12b-1 Plans, and/or attorneys’ fees and costs. Specifically, the lawsuits claim breach of duty with respect to alleged arrangements to permit market timing and/or late trading activity, or breach of duty with respect to the valuation of the portfolio securities of certain Templeton funds managed by Franklin Resources, Inc. subsidiaries, resulting in alleged market timing activity. The majority of these lawsuits duplicate, in whole or in part, the allegations asserted in the February 4, 2004 Massachusetts administrative complaint and the findings in the SEC’s August 2, 2004 Order, as described above. The lawsuits are styled as class actions, or derivative actions on behalf of either the named funds or Franklin Resources, Inc.
TGI-23
FRANKLIN TEMPLETON VARIABLE INSURANCE PRODUCTS TRUST
TEMPLETON GLOBAL INCOME SECURITIES FUND
Notes to Financial Statements (continued)
8. REGULATORY MATTERS (cont.)
Other Legal Proceedings (cont.)
In addition, the Company, as well as certain current and former officers, employees, and directors, have been named in multiple lawsuits alleging violations of various securities laws and pendent state law claims relating to the disclosure of directed brokerage payments and/or payment of allegedly excessive advisory, commission, and distribution fees, and seeking, among other relief, monetary damages, restitution, rescission of advisory contracts, including recovery of all fees paid pursuant to those contracts, an accounting of all monies paid to the named advisers, declaratory relief, injunctive relief, and/or attorneys’ fees and costs. These lawsuits are styled as class actions or derivative actions brought on behalf of certain funds.
The Company and fund management strongly believes that the claims made in each of the lawsuits identified above are without merit and intends to vigorously defend against them. The Company cannot predict with certainty, however, the eventual outcome of the remaining governmental investigations or private lawsuits, nor whether they will have a material negative impact on the Company. Public trust and confidence are critical to the Company’s business and any material loss of investor and/or client confidence could result in a significant decline in assets under management by the Company, which would have an adverse effect on the Company’s future financial results. If the Company finds that it bears responsibility for any unlawful or inappropriate conduct that caused losses to the Trust, it is committed to making the Trust or its shareholders whole, as appropriate. The Company is committed to taking all appropriate actions to protect the interests of its funds’ shareholders.
TGI-24
FRANKLIN TEMPLETON VARIABLE INSURANCE PRODUCTS TRUST
TEMPLETON GLOBAL INCOME SECURITIES FUND
Report of Independent Registered Public Accounting Firm
To the Trustees and Shareholders of Franklin Templeton Variable Insurance Products Trust
In our opinion, the accompanying statement of assets and liabilities, including the statement of investments, and the related statements of operations and of changes in net assets and the financial highlights present fairly, in all material respects, the financial position of Templeton Global Income Securities Fund (the Fund) (one of the funds constituting Franklin Templeton Variable Insurance Products Trust) at December 31, 2004, the results of its operations for the year then ended, the changes in its net assets for each of the two years in the period then ended and the financial highlights for each of the five years in the period then ended, in conformity with accounting principles generally accepted in the United States of America. These financial statements and financial highlights (hereafter referred to as “financial statements”) are the responsibility of the Fund’s management; our responsibility is to express an opinion on these financial statements based on our audits. We conducted our audits of these financial statements in accordance with the standards of the Public Company Accounting Oversight Board (United States). Those standards require that we plan and perform the audits to obtain reasonable assurance about whether the financial statements are free of material misstatement. An audit includes examining, on a test basis, evidence supporting the amounts and disclosures in the financial statements, assessing the accounting principles used and significant estimates made by management, and evaluating the overall financial statement presentation. We believe that our audits, which included confirmation of securities at December 31, 2004 by correspondence with the custodian, provide a reasonable basis for our opinion.
PricewaterhouseCoopers LLP
San Francisco, California
February 9, 2005
TGI-25
FRANKLIN TEMPLETON VARIABLE INSURANCE PRODUCTS TRUST
TEMPLETON GLOBAL INCOME SECURITIES FUND
Tax Designation (unaudited)
At December 31, 2004, more than 50% of the Fund’s total assets were invested in securities of foreign issuers. In most instances, foreign taxes were withheld from interest paid to the Fund on these investments. The Fund elects to treat foreign taxes paid under Section 853 of the Internal Revenue Code. This election will allow shareholders of record in June 2005, to treat their proportionate share of foreign taxes paid by the Fund as having been paid directly by them. The shareholder shall consider these amounts as foreign taxes paid in the tax year in which they receive the Fund distribution.
The foreign tax information will be disclosed in the June 2005, semi-annual report of the Fund.
TGI-26
TEMPLETON GROWTH SECURITIES FUND
We are pleased to bring you Templeton Growth Securities Fund’s annual report for the fiscal year ended December 31, 2004.
Performance Summary as of 12/31/04
Average annual total return of Class 2 shares* represents the average annual change in value, assuming reinvestment of dividends and capital gains. Average returns smooth out variations in returns, which can be significant; they are not the same as year-by-year results.
Periods ended 12/31/04
| | | | | | |
| | | 1-Year | | 5-Year | | 10-Year |
Average Annual Total Return | | +16.03% | | +4.59% | | +9.84% |
*Because Class 2 shares were not offered until 1/6/99, standardized Class 2 Fund performance for prior periods represents the historical results of Class 1 shares. For periods beginning on 1/6/99, Class 2’s results reflect an additional 12b-1 fee expense, which also affects future performance. Since 1/6/99 (effective date), the average annual total return of Class 2 shares was +6.48%.
Total Return Index Comparison for Hypothetical $10,000 Investment (1/1/95–12/31/04)
The graph below shows the change in value of a hypothetical $10,000 investment in the Fund over the indicated period and includes reinvestment of any income or distributions. The Fund’s performance* is compared to the performance of the Morgan Stanley Capital International (MSCI) All Country (AC) World Index. One cannot invest directly in an index, nor is an index representative of the Fund’s portfolio. Please see Important Notes to Performance Information preceding the Fund Summaries.
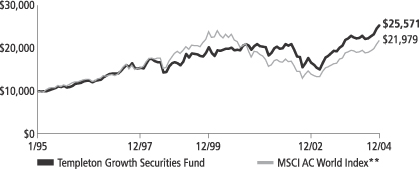
**Source: Standard & Poor’s Micropal. Please see Index Descriptions following the Fund Summaries.
Templeton Growth Securities Fund – Class 2
Performance reflects the Fund’s Class 2 operating expenses, but does not include any contract fees, expenses or sales charges. If they had been included, performance would be lower. These charges and deductions, particularly for variable life policies, can have a significant effect on contract values and insurance benefits. See the contract prospectus for a complete description of these expenses, including sales charges.
Performance data quoted represent past performance, which does not guarantee future results. Investment return and principal value will fluctuate, and you may have a gain or loss when you sell your shares. Current performance may differ from figures shown.
TG-1
Fund Goals and Main Investments: Templeton Growth Securities Fund seeks long-term capital growth. The Fund invests mainly in equity securities of companies located anywhere in the world, including those in the U.S. and emerging markets.
Performance Overview
You can find the Fund’s one-year total return in the Performance Summary. The Fund outperformed its benchmark, the MSCI AC World Index, which returned 15.75% for the year under review.1
Economic and Market Overview
The global economic recovery continued in 2004, led by growth in China and the U.S. As of December 31, 2004, U.S. gross domestic product (GDP) had increased for 13 consecutive quarters.2 In China, GDP grew 9.5% in 2004.3
The 12-nation euro zone lagged other regions in the current recovery. However, the European Central Bank projected euro zone growth may be between 1.6% and 2.0% in 2004, compared with only 0.5% in 2003. In Japan, the economy struggled to emerge from a decade-long deflationary period. Although the country’s consumer and business confidence reached their highest levels since 1991, economic growth slowed in response to higher oil prices and reduced external demand. In addition, the U.S. dollar declined approximately 4% versus the yen and 7% versus the euro during 2004.4 This hurt Japanese and European exports into the U.S., as it made their goods more expensive in the world’s biggest market. However, the greenback’s protracted decline should also benefit the U.S. current account deficit by making U.S. goods more competitive in international markets.
Oil prices increased during most of 2004, reaching $56 per barrel in October, but declined to end the year at $43. Higher oil prices triggered investor worries about inflation, decreased spending — due to cautionary consumer and business sentiment — and slower economic and corporate profit growth. As of December 31, 2004, the 12-month moving average price of oil was about $41 per barrel.5
1. Source: Standard & Poor’s Micropal. One cannot invest directly in an index, nor is an index representative of the Fund’s portfolio. Please see Index Descriptions following the Fund Summaries.
2. Source: Bureau of Economic Analysis.
3. Source: National Bureau of Statistics of China.
4. Source: FactSet Research Systems Inc.
5. Source: U.S. Department of Energy.
Fund Risks: Stocks offer the potential for long-term gains but can be subject to short-term up-and-down price movements. Foreign investing involves special risks including currency fluctuations, economic instability, and social and political developments. Emerging markets involve heightened risks due to their relatively smaller size and lesser liquidity. Bonds and other debt obligations are affected by changes in interest rates and the creditworthiness of their issuers. The Fund’s prospectus also includes a description of the main investment risks.
TG-2
In this environment, the MSCI AC World Index’s total return was 15.75% in U.S. dollars for the 12-month period ended December 31, 2004.6 Emerging markets, as measured by the MSCI Emerging Markets Index, had a one-year total return of 25.95% in U.S. dollars.6 In local currencies, these indexes had notably lower total returns of 12.05% and 16.45% for the same period.6 In 2004, most of the world’s currencies strengthened in relation to the U.S. dollar, which benefited U.S.-based investors of non-U.S. developed and emerging market equities.
Investment Strategy
Our investment philosophy is bottom-up, value-oriented and long-term. In choosing investments, we will focus on the market price of a company’s securities relative to our evaluation of the company’s potential long-term earnings, asset value and cash flow. Among factors we consider are a company’s historical value measures, including price/earnings ratio, profit margins and liquidation value. We do in-depth research to construct a bargain list from which we buy.
Manager’s Discussion
As in past reporting periods, our bottom-up investment strategy for the Fund resulted in a geographic and industry mix that was very different than that of the benchmark MSCI AC World Index. Geographically, we continued to find securities for our bargain list across the globe. From a country standpoint, our substantially overweighted exposure to the U.K. and underweighted exposure to the U.S. contributed positively to the Fund’s relative performance during the year under review. Our U.K. holdings Reuters Group, BAE Systems and Abbey National (exchanged for Banco Santander Central Hispano shares) performed well, while our U.S. holdings AT&T Wireless, CIGNA and Noble Corp. also appreciated. We sold Reuters Group and AT&T Wireless during the period. Combined with strong stock selection, the weakening U.S. dollar played a part in driving the Fund’s outperformance. In addition, our overweighted positions in Hong Kong and Switzerland aided Fund performance.
Looking at the Fund from an industry perspective, a number of sectors stood out. Despite being underweighted, information technology contributed the most sector-wise to Fund performance.7 Our holdings in
6. Source: Standard & Poor’s Micropal. Please see Index Descriptions following the Fund Summaries.
7. The information technology sector comprises IT services, software, computers and peripherals, electronic equipment and instruments, and semiconductors and semiconductor equipment in the SOI.
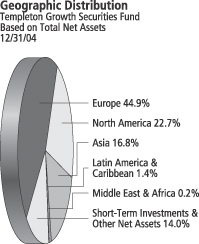
TG-3
Nintendo and Check Point Software Technologies appreciated 35% and 46%, respectively, during the year. Our overweighting and strong stock selection in materials and telecommunication services sectors also benefited Fund performance.8
In general, if the value of the U.S. dollar goes up compared with a foreign currency, an investment traded in that foreign currency will go down in value because it will be worth fewer U.S. dollars. This can have a negative effect on Fund performance. Conversely, when the U.S. dollar weakens in relation to a foreign currency, an investment traded in that foreign currency will increase in value, which can contribute to Fund performance. For the 12 months ended December 31, 2004, the U.S. dollar declined in value relative to most non-U.S. currencies. At the end of the period, the Fund’s portfolio was invested primarily in securities with non-U.S. currency exposure, which resulted in a positive effect on Fund performance. However, one cannot expect the same result in future periods.
Offsetting the Fund’s gains, the lower-than-index exposure to Australia, Japan and Canada hurt the Fund’s relative performance. We held no Australian stocks, and Japanese holdings such as Nomura Holdings and Nippon Telegraph & Telephone and Canadian holding Celestica stumbled. From the sector perspective, financials stocks generally lost value. Kookmin Bank, Swiss Reinsurance and the aforementioned Nomura Holdings had a negative impact on the Fund.
During the reporting period, holding a larger-than-normal cash position was a drag on the Fund’s performance. Fund inflows were strong and we were not able to quickly invest the cash.
Thank you for your participation in Templeton Growth Securities Fund. We look forward to serving your future investment needs.
The foregoing information reflects our analysis, opinions and portfolio holdings as of December 31, 2004, the end of the reporting period. The way we implement our main investment strategies and the resulting portfolio holdings may change depending on factors such as market and economic conditions. These opinions may not be relied upon as investment advice or an offer for a particular security. The information is not a complete analysis of every aspect of any market, country, industry, security or the Fund. Statements of fact are from sources considered reliable, but the adviser makes no representation or warranty as to their completeness or accuracy. Although historical performance is no guarantee of future results, these insights may help you understand our investment management philosophy.
8. The materials sector comprises chemicals, metals and mining, and paper and forest products in the SOI. The telecommunication services sector comprises diversified telecommunication services and wireless telecommunication services in the SOI.
Top 10 Holdings
Templeton Growth Securities Fund 12/31/04
| | |
Company
Sector/Industry,
Country | | % of Total
Net Assets |
| |
| GlaxoSmithKline PLC | | 2.0% |
| Pharmaceuticals, U.K. | | |
| |
| Shell Transport & Trading Co. PLC | | 1.7% |
| Oil & Gas, U.K. | | |
| |
| British Sky Broadcasting Group PLC | | 1.7% |
| Media, U.K. | | |
| |
| Nestlé SA | | 1.6% |
| Food Products, Switzerland | | |
| |
| Unilever NV | | 1.5% |
| Food Products, Netherlands | | |
| |
| E.ON AG | | 1.4% |
| Electric Utilities, Germany | | |
| |
| BP PLC | | 1.4% |
| Oil & Gas, U.K. | | |
| |
| Eni SpA | | 1.4% |
| Oil & Gas, Italy | | |
| |
| Royal Bank of Scotland Group PLC, ord. & 144A | | 1.3% |
| Commercial Banks, U.K. | | |
| |
| Nomura Holdings Inc. | | 1.2% |
| Capital Markets, Japan | | |
The dollar value, number of shares or principal amount, and names of all portfolio holdings are listed in the Fund’s Statement of Investments.
TG-4
Fund Expenses
As an investor in a variable insurance contract (“Contract”) that indirectly provides for investment in an underlying mutual fund, you can incur transaction and/or ongoing expenses at both the Fund level and the Contract level.
| • | | Transaction expenses can include sales charges (loads) on purchases, redemption fees, surrender fees, transfer fees and premium taxes. |
| • | | Ongoing expenses can include management fees, distribution and service (12b-1) fees, contract fees, annual maintenance fees, mortality and expense risk fees and other fees and expenses. All mutual funds and Contracts have some types of ongoing expenses. |
The expenses shown in the table below are meant to highlight ongoing expenses at the Fund level only and do not include ongoing expenses at the Contract level, or transaction expenses at either the Fund or Contract levels. While the Fund does not have transaction expenses, if the transaction and ongoing expenses at the Contract level were included, the expenses shown below would be higher. You should consult your Contract prospectus or disclosure document for more information.
The table shows Fund-level ongoing expenses and can help you understand these expenses and compare them with those of other mutual funds offered through the Contract. The table assumes a $1,000 investment held for the six months indicated. Please refer to the Fund prospectus for additional information on operating expenses.
Actual Fund Expenses
The first line (Actual) for each share class listed in the table below provides actual account values and expenses. The “Ending Account Value” is derived from the Fund’s actual return, which includes the effect of ongoing Fund expenses, but does not include the effect of ongoing Contract expenses.
You can estimate the Fund-level expenses you incurred during the period, by following these steps. Of course, your account value and expenses will differ from those in this illustration:
| 1. | Divide your account value by $1,000. |
If an account had an $8,600 value, then $8,600 ÷ $1,000 = 8.6.
| 2. | Multiply the result by the number under the heading “Fund-Level Expenses Incurred During Period.” |
If Fund-Level Expenses Incurred During Period were $7.50, then 8.6 × $7.50 = $64.50.
Templeton Growth Securities Fund – Class 2
TG-5
In this illustration, the estimated expenses incurred this period at the Fund level are $64.50.
Hypothetical Example for Comparison with Other Mutual Funds
Information in the second line (Hypothetical) for each class in the table can help you compare ongoing expenses of the Fund with those of other mutual funds offered through the Contract. This information may not be used to estimate the actual ending account balance or expenses you incurred during the period. The hypothetical “Ending Account Value” is based on the actual expense ratio for each class and an assumed 5% annual rate of return before expenses, which does not represent the Fund’s actual return. The figure under the heading “Fund-Level Expenses Incurred During Period” shows the hypothetical expenses your account would have incurred under this scenario. You can compare this figure with the 5% hypothetical examples that appear in shareholder reports of other funds offered through a Contract.
| | | | | | | | | |
| Class 2 | | Beginning
Account
Value 6/30/04 | | Ending
Account
Value 12/31/04 | | Fund-Level
Expenses Incurred
During Period*
6/30/04-12/31/04 |
Actual | | $ | 1,000 | | $ | 1,108.70 | | $ | 5.88 |
Hypothetical (5% return before expenses) | | $ | 1,000 | | $ | 1,019.56 | | $ | 5.63 |
*Expenses are equal to the annualized expense ratio for the Fund’s Class 2 shares (1.11%), which does not include any ongoing expenses of the Contract for which the Fund is an investment option, multiplied by the average account value over the period, multiplied by 184/366 to reflect the one-half year period.
TG-6
FRANKLIN TEMPLETON VARIABLE INSURANCE PRODUCTS TRUST
TEMPLETON GROWTH SECURITIES FUND
Financial Highlights
| | | | | | | | | | | | | | | | | | | | |
| | | Class 1
| |
| | | Year Ended December 31, | |
| | |
|
|
|
| | | 2004 | | | 2003 | | | 2002 | | | 2001 | | | 2000 | |
| | |
|
|
|
Per share operating performance | | | | | | | | | | | | | | | | | | | | |
(for a share outstanding throughout the year) | | | | | | | | | | | | | | | | | | | | |
Net asset value, beginning of year | | $ | 11.31 | | | $ | 8.67 | | | $ | 11.09 | | | $ | 13.76 | | | $ | 15.63 | |
| | |
|
|
|
Income from investment operations: | | | | | | | | | | | | | | | | | | | | |
Net investment incomea | | | .21 | | | | .17 | | | | .17 | | | | .26 | | | | .30 | |
Net realized and unrealized gains (losses) | | | 1.61 | | | | 2.63 | | | | (2.13 | ) | | | (.36 | ) | | | (.15 | ) |
| | |
|
|
|
Total from investment operations | | | 1.82 | | | | 2.80 | | | | (1.96 | ) | | | (.10 | ) | | | .15 | |
| | |
|
|
|
Less distributions from: | | | | | | | | | | | | | | | | | | | | |
Net investment income | | | (.15 | ) | | | (.16 | ) | | | (.24 | ) | | | (.28 | ) | | | (.27 | ) |
Net realized gains | | | — | | | | — | | | | (.22 | ) | | | (2.29 | ) | | | (1.75 | ) |
| | |
|
|
|
Total distributions | | | (.15 | ) | | | (.16 | ) | | | (.46 | ) | | | (2.57 | ) | | | (2.02 | ) |
| | |
|
|
|
Net asset value, end of year | | $ | 12.98 | | | $ | 11.31 | | | $ | 8.67 | | | $ | 11.09 | | | $ | 13.76 | |
| | |
|
|
|
| | | | | |
Total returnb | | | 16.25% | | | | 32.62% | | | | (18.32)% | | | | (.98)% | | | | 1.74% | |
Ratios/supplemental data | | | | | | | | | | | | | | | | | | | | |
Net assets, end of year (000’s) | | $ | 800,118 | | | $ | 769,339 | | | $ | 665,537 | | | $ | 966,725 | | | $ | 1,163,637 | |
Ratios to average net assets: | | | | | | | | | | | | | | | | | | | | |
Expenses | | | .86% | | | | .88% | | | | .87% | | | | .85% | | | | .88% | |
Net investment income | | | 1.75% | | | | 1.74% | | | | 1.69% | | | | 2.13% | | | | 2.18% | |
Portfolio turnover rate | | | 19.13% | | | | 37.43% | | | | 30.67% | | | | 31.05% | | | | 69.67% | |
| aBased | on average daily shares outstanding. |
bTotal return does not include any fees, charges or expenses imposed by the variable annuity and life insurance contracts for which the Franklin Templeton Variable Insurance Products Trust serves as an underlying investment vehicle. Total return is not annualized for periods less than one year.
See notes to financial statements.
TG-7
FRANKLIN TEMPLETON VARIABLE INSURANCE PRODUCTS TRUST
TEMPLETON GROWTH SECURITIES FUND
Financial Highlights (continued)
| | | | | | | | | | | | | | | | | | | | |
| | | Class 2
| |
| | | Year Ended December 31, | |
| | |
|
|
|
| | | 2004 | | | 2003 | | | 2002 | | | 2001 | | | 2000 | |
| | |
|
|
|
Per share operating performance | | | | | | | | | | | | | | | | | | | | |
(for a share outstanding throughout the year) | | | | | | | | | | | | | | | | | | | | |
Net asset value, beginning of year | | $ | 11.19 | | | $ | 8.59 | | | $ | 11.01 | | | $ | 13.69 | | | $ | 15.60 | |
| | |
|
|
|
Income from investment operations: | | | | | | | | | | | | | | | | | | | | |
Net investment incomea | | | .17 | | | | .13 | | | | .13 | | | | .21 | | | | .25 | |
Net realized and unrealized gains (losses) | | | 1.61 | | | | 2.62 | | | | (2.10 | ) | | | (.34 | ) | | | (.15 | ) |
| | |
|
|
|
Total from investment operations | | | 1.78 | | | | 2.75 | | | | (1.97 | ) | | | (.13 | ) | | | .10 | |
| | |
|
|
|
Less distributions from: | | | | | | | | | | | | | | | | | | | | |
Net investment income | | | (.14 | ) | | | (.15 | ) | | | (.23 | ) | | | (.26 | ) | | | (.26 | ) |
Net realized gains | | | — | | | | — | | | | (.22 | ) | | | (2.29 | ) | | | (1.75 | ) |
| | |
|
|
|
Total distributions | | | (.14 | ) | | | (.15 | ) | | | (.45 | ) | | | (2.55 | ) | | | (2.01 | ) |
| | |
|
|
|
Net asset value, end of year | | $ | 12.83 | | | $ | 11.19 | | | $ | 8.59 | | | $ | 11.01 | | | $ | 13.69 | |
| | |
|
|
|
| | | | | |
Total returnb | | | 16.03% | | | | 32.13% | | | | (18.49)% | | | | (1.31)% | | | | 1.47% | |
Ratios/supplemental data | | | | | | | | | | | | | | | | | | | | |
Net assets, end of year (000’s) | | $ | 1,189,112 | | | $ | 511,659 | | | $ | 190,054 | | | $ | 113,925 | | | $ | 79,043 | |
Ratios to average net assets: | | | | | | | | | | | | | | | | | | | | |
Expenses | | | 1.11% | | | | 1.13% | | | | 1.12% | | | | 1.10% | | | | 1.12% | |
Net investment income | | | 1.50% | | | | 1.49% | | | | 1.44% | | | | 1.80% | | | | 1.87% | |
Portfolio turnover rate | | | 19.13% | | | | 37.43% | | | | 30.67% | | | | 31.05% | | | | 69.67% | |
| aBased | on average daily shares outstanding. |
| bTotal | return does not include any fees, charges or expenses imposed by the variable annuity and life insurance contracts for which the Franklin Templeton Variable Insurance Products Trust serves as an underlying investment vehicle. Total return is not annualized for periods less than one year. |
See notes to financial statements.
TG-8
FRANKLIN TEMPLETON VARIABLE INSURANCE PRODUCTS TRUST
TEMPLETON GROWTH SECURITIES FUND
Statement of Investments, December 31, 2004
| | | | | | | |
| | | COUNTRY | | SHARES | | VALUE |
Common Stocks 85.3% | | | | | | | |
Aerospace & Defense 3.3% | | | | | | | |
BAE Systems PLC | | United Kingdom | | 4,506,173 | | $ | 19,936,905 |
BAE Systems PLC, 144A | | United Kingdom | | 36,352 | | | 160,834 |
Boeing Co. | | United States | | 299,590 | | | 15,509,774 |
Raytheon Co. | | United States | | 361,410 | | | 14,033,550 |
aRolls-Royce Group PLC | | United Kingdom | | 3,292,060 | | | 15,607,870 |
aRolls-Royce Group PLC, B | | United Kingdom | | 104,687,508 | | | 204,963 |
| | | | | | |
|
|
| | | | | | | | 65,453,896 |
| | | | | | |
|
|
Airlines .6% | | | | | | | |
Singapore Airlines Ltd. | | Singapore | | 1,720,100 | | | 12,013,196 |
| | | | | | |
|
|
Auto Components .6% | | | | | | | |
Valeo SA | | France | | 262,715 | | | 10,980,326 |
| | | | | | |
|
|
Automobiles .6% | | | | | | | |
Volkswagen AG | | Germany | | 258,907 | | | 11,717,077 |
| | | | | | |
|
|
Capital Markets 2.4% | | | | | | | |
Morgan Stanley | | United States | | 100,000 | | | 5,552,000 |
Nomura Holdings Inc. | | Japan | | 1,641,173 | | | 23,939,782 |
UBS AG | | Switzerland | | 213,966 | | | 17,846,938 |
| | | | | | |
|
|
| | | | | | | | 47,338,720 |
| | | | | | |
|
|
Chemicals 3.2% | | | | | | | |
Akzo Nobel NV | | Netherlands | | 493,365 | | | 21,008,785 |
BASF AG | | Germany | | 145,200 | | | 10,427,161 |
Bayer AG, Br. | | Germany | | 423,776 | | | 14,319,088 |
aSyngenta AG | | Switzerland | | 174,770 | | | 18,536,561 |
| | | | | | |
|
|
| | | | | | | | 64,291,595 |
| | | | | | |
|
|
Commercial Banks 5.0% | | | | | | | |
Banco Santander Central Hispano SA | | Spain | | 1,310,140 | | | 16,231,855 |
DBS Group Holdings Ltd. | | Singapore | | 603,000 | | | 5,947,620 |
aHana Bank | | South Korea | | 157,540 | | | 3,926,325 |
aKookmin Bank | | South Korea | | 373,740 | | | 14,621,783 |
Lloyds TSB Group PLC | | United Kingdom | | 1,032,660 | | | 9,375,565 |
Nordea Bank AB | | Sweden | | 1,087,191 | | | 10,964,041 |
Royal Bank of Scotland Group PLC | | United Kingdom | | 237,980 | | | 8,003,013 |
Royal Bank of Scotland Group PLC, 144A | | United Kingdom | | 511,885 | | | 17,214,145 |
Standard Chartered PLC | | United Kingdom | | 698,325 | | | 12,981,837 |
| | | | | | |
|
|
| | | | | | | | 99,266,184 |
| | | | | | |
|
|
Commercial Services & Supplies 1.9% | | | | | | | |
H&R Block Inc. | | United States | | 177,790 | | | 8,711,710 |
Rentokil Initial PLC | | United Kingdom | | 5,968,960 | | | 16,927,979 |
Securitas AB, B | | Sweden | | 764,565 | | | 13,119,257 |
| | | | | | |
|
|
| | | | | | | | 38,758,946 |
| | | | | | |
|
|
Computers & Peripherals .9% | | | | | | | |
aMaxtor Corp. | | United States | | 1,145,880 | | | 6,073,164 |
aSeagate Technology | | United States | | 740,005 | | | 12,779,886 |
| | | | | | |
|
|
| | | | | | | | 18,853,050 |
| | | | | | |
|
|
TG-9
FRANKLIN TEMPLETON VARIABLE INSURANCE PRODUCTS TRUST
TEMPLETON GROWTH SECURITIES FUND
Statement of Investments, December 31, 2004 (cont.)
| | | | | | | |
| | | COUNTRY | | SHARES | | VALUE |
Common Stocks (cont.) | | | | | | | |
Diversified Telecommunication Services 6.5% | | | | | | | |
BCE Inc. | | Canada | | 939,345 | | $ | 22,650,483 |
aBelgacom SA | | Belgium | | 273,600 | | | 11,806,546 |
KT Corp., ADR | | South Korea | | 1,011,735 | | | 22,065,940 |
Nippon Telegraph & Telephone Corp. | | Japan | | 4,272 | | | 19,186,878 |
SBC Communications Inc. | | United States | | 441,280 | | | 11,371,786 |
TDC AS | | Denmark | | 430,274 | | | 18,189,214 |
Telefonica SA | | Spain | | 365,190 | | | 6,868,498 |
Telefonos de Mexico SA de CV (Telmex), L, ADR | | Mexico | | 450,465 | | | 17,261,819 |
| | | | | | |
|
|
| | | | | | | | 129,401,164 |
| | | | | | |
|
|
Electric Utilities 4.0% | | | | | | | |
DTE Energy Co. | | United States | | 539,285 | | | 23,259,362 |
E.ON AG | | Germany | | 301,375 | | | 27,474,316 |
Endesa SA | | Spain | | 639,690 | | | 15,008,739 |
Hong Kong Electric Holdings Ltd. | | Hong Kong | | 2,867,498 | | | 13,096,462 |
| | | | | | |
|
|
| | | | | | | | 78,838,879 |
| | | | | | |
|
|
Electronic Equipment & Instruments 1.4% | | | | | | | |
aCelestica Inc. | | Canada | | 403,440 | | | 5,692,538 |
Hitachi Ltd. | | Japan | | 3,130,500 | | | 21,701,377 |
| | | | | | |
|
|
| | | | | | | | 27,393,915 |
| | | | | | |
|
|
Energy Equipment & Services .9% | | | | | | | |
aNoble Corp. | | United States | | 347,400 | | | 17,279,676 |
| | | | | | |
|
|
Food & Staples Retailing 1.3% | | | | | | | |
Albertson’s Inc. | | United States | | 494,700 | | | 11,813,436 |
aKroger Co. | | United States | | 764,261 | | | 13,405,138 |
| | | | | | |
|
|
| | | | | | | | 25,218,574 |
| | | | | | |
|
|
Food Products 4.5% | | | | | | | |
Cadbury Schweppes PLC | | United Kingdom | | 1,843,610 | | | 17,162,863 |
H.J. Heinz Co. | | United States | | 278,585 | | | 10,862,029 |
Nestle SA | | Switzerland | | 120,369 | | | 31,441,045 |
Unilever NV | | Netherlands | | 438,390 | | | 29,346,169 |
| | | | | | |
|
|
| | | | | | | | 88,812,106 |
| | | | | | |
|
|
Health Care Equipment & Supplies .8% | | | | | | | |
Olympus Corp. | | Japan | | 750,000 | | | 16,000,293 |
| | | | | | |
|
|
Health Care Providers & Services 3.4% | | | | | | | |
AmerisourceBergen Corp. | | United States | | 336,571 | | | 19,749,986 |
CIGNA Corp. | | United States | | 215,072 | | | 17,543,423 |
HCA Inc. | | United States | | 264,750 | | | 10,579,410 |
aTenet Healthcare Corp. | | United States | | 1,816,075 | | | 19,940,504 |
| | | | | | |
|
|
| | | | | | | | 67,813,323 |
| | | | | | |
|
|
Hotels Restaurants & Leisure 1.7% | | | | | | | |
Accor SA | | France | | 518,800 | | | 22,676,203 |
Compass Group PLC | | United Kingdom | | 2,499,790 | | | 11,815,680 |
| | | | | | |
|
|
| | | | | | | | 34,491,883 |
| | | | | | |
|
|
TG-10
FRANKLIN TEMPLETON VARIABLE INSURANCE PRODUCTS TRUST
TEMPLETON GROWTH SECURITIES FUND
Statement of Investments, December 31, 2004 (cont.)
| | | | | | | |
| | | COUNTRY | | SHARES | | VALUE |
Common Stocks (cont.) | | | | | | | |
Household Durables 1.7% | | | | | | | |
Koninklijke Philips Electronics NV | | Netherlands | | 556,890 | | $ | 14,743,695 |
Sony Corp. | | Japan | | 499,300 | | | 19,305,097 |
| | | | | | |
|
|
| | | | | | | | 34,048,792 |
| | | | | | |
|
|
Industrial Conglomerates 1.7% | | | | | | | |
Smiths Group PLC | | United Kingdom | | 1,080,061 | | | 17,041,156 |
Swire Pacific Ltd., A | | Hong Kong | | 1,406,800 | | | 11,764,357 |
Tyco International Ltd. | | United States | | 166,120 | | | 5,937,129 |
| | | | | | |
|
|
| | | | | | | | 34,742,642 |
| | | | | | |
|
|
Insurance 3.6% | | | | | | | |
ACE Ltd. | | Bermuda | | 297,200 | | | 12,705,300 |
AXA SA | | France | | 370,111 | | | 9,130,731 |
Swiss Reinsurance Co. | | Switzerland | | 319,590 | | | 22,672,525 |
Willis Group Holdings Ltd. | | United States | | 311,038 | | | 12,805,434 |
XL Capital Ltd., A | | Bermuda | | 185,292 | | | 14,387,924 |
| | | | | | |
|
|
| | | | | | | | 71,701,914 |
| | | | | | |
|
|
IT Services 1.2% | | | | | | | |
Electronic Data Systems Corp. | | United States | | 794,633 | | | 18,356,023 |
Satyam Computers Services Ltd. | | India | | 481,726 | | | 4,565,537 |
| | | | | | |
|
|
| | | | | | | | 22,921,560 |
| | | | | | |
|
|
Leisure Equipment & Products .9% | | | | | | | |
Fuji Photo Film Co. Ltd. | | Japan | | 482,000 | | | 17,600,859 |
Mattel Inc. | | United States | | 8,600 | | | 167,614 |
| | | | | | |
|
|
| | | | | | | | 17,768,473 |
| | | | | | |
|
|
Media 6.2% | | | | | | | |
British Sky Broadcasting Group PLC | | United Kingdom | | 3,093,596 | | | 33,371,741 |
aDIRECTV Group Inc. | | United States | | 1,203,819 | | | 20,151,930 |
aInterpublic Group of Cos. Inc. | | United States | | 702,015 | | | 9,407,001 |
Pearson PLC | | United Kingdom | | 1,600,718 | | | 19,310,746 |
Reed Elsevier NV | | Netherlands | | 1,484,375 | | | 20,203,389 |
VNU NV | | Netherlands | | 318,410 | | | 9,389,146 |
Wolters Kluwer NV | | Netherlands | | 590,730 | | | 11,839,931 |
| | | | | | |
|
|
| | | | | | | | 123,673,884 |
| | | | | | |
|
|
Metals & Mining 2.0% | | | | | | | |
Barrick Gold Corp. | | Canada | | 745,345 | | | 18,052,256 |
BHP Billiton PLC | | United Kingdom | | 836,750 | | | 9,805,287 |
POSCO | | South Korea | | 61,332 | | | 11,079,100 |
| | | | | | |
|
|
| | | | | | | | 38,936,643 |
| | | | | | |
|
|
Multi-Utilities & Unregulated Power 1.1% | | | | | | | |
National Grid Transco PLC | | United Kingdom | | 2,334,378 | | | 22,246,894 |
| | | | | | |
|
|
Oil & Gas 5.9% | | | | | | | |
BP PLC | | United Kingdom | | 2,782,360 | | | 27,130,387 |
El Paso Corp. | | United States | | 221,400 | | | 2,302,560 |
Eni SpA | | Italy | | 1,081,305 | | | 27,028,223 |
Repsol YPF SA | | Spain | | 919,148 | | | 23,897,948 |
Shell Transport & Trading Co. PLC | | United Kingdom | | 4,027,633 | | | 34,325,100 |
TransCanada Corp. | | Canada | | 89,875 | | | 2,233,105 |
| | | | | | |
|
|
| | | | | | | | 116,917,323 |
| | | | | | |
|
|
TG-11
FRANKLIN TEMPLETON VARIABLE INSURANCE PRODUCTS TRUST
TEMPLETON GROWTH SECURITIES FUND
Statement of Investments, December 31, 2004 (cont.)
| | | | | | | |
| | | COUNTRY | | SHARES | | VALUE |
Common Stocks (cont.) | | | | | | | |
Paper & Forest Products 2.8% | | | | | | | |
Bowater Inc. | | United States | | 191,800 | | $ | 8,433,446 |
International Paper Co. | | United States | | 240,000 | | | 10,080,000 |
Stora Enso OYJ, R | | Finland | | 1,245,938 | | | 19,037,700 |
UPM-Kymmene Corp. | | Finland | | 862,805 | | | 19,143,003 |
| | | | | | |
|
|
| | | | | | | | 56,694,149 |
| | | | | | |
|
|
Pharmaceuticals 8.4% | | | | | | | |
Abbott Laboratories | | United States | | 313,207 | | | 14,611,107 |
Bristol-Myers Squibb Co. | | United States | | 862,800 | | | 22,104,936 |
GlaxoSmithKline PLC | | United Kingdom | | 1,661,700 | | | 38,976,494 |
Novartis AG | | Switzerland | | 412,490 | | | 20,643,514 |
Pfizer Inc. | | United States | | 816,660 | | | 21,959,987 |
Sanofi-Aventis | | France | | 243,046 | | | 19,393,021 |
Shire Pharmaceuticals Group PLC | | United Kingdom | | 1,111,940 | | | 11,674,751 |
Takeda Pharmaceutical Co. Ltd. | | Japan | | 357,000 | | | 17,985,940 |
| | | | | | |
|
|
| | | | | | | | 167,349,750 |
| | | | | | |
|
|
Real Estate 1.1% | | | | | | | |
Cheung Kong Holdings Ltd. | | Hong Kong | | 2,243,499 | | | 22,369,181 |
| | | | | | |
|
|
Semiconductors & Semiconductor Equipment .7% | | | | | | | |
Samsung Electronics Co. Ltd. | | South Korea | | 30,300 | | | 13,186,003 |
| | | | | | |
|
|
Software 1.6% | | | | | | | |
aCadence Design Systems Inc. | | United States | | 605,945 | | | 8,368,101 |
aCheck Point Software Technologies Ltd. | | Israel | | 176,510 | | | 4,347,441 |
Nintendo Co. Ltd. | | Japan | | 160,000 | | | 20,105,448 |
| | | | | | |
|
|
| | | | | | | | 32,820,990 |
| | | | | | |
|
|
Specialty Retail .2% | | | | | | | |
aOffice Depot Inc. | | United States | | 187,200 | | | 3,249,792 |
| | | | | | |
|
|
Wireless Telecommunication Services 3.2% | | | | | | | |
China Mobile (Hong Kong) Ltd., fgn. | | China | | 2,608,500 | | | 8,842,885 |
KDDI Corp. | | Japan | | 2,369 | | | 12,767,897 |
SK Telecom Co. Ltd. | | South Korea | | 80,853 | | | 15,386,438 |
SK Telecom Co. Ltd., ADR | | South Korea | | 303,380 | | | 6,750,205 |
Vodafone Group PLC | | United Kingdom | | 7,603,943 | | | 20,616,088 |
| | | | | | |
|
|
| | | | | | | | 64,363,513 |
| | | | | | |
|
|
Total Common Stocks (Cost $1,406,827,764) | | | | | | | 1,696,914,306 |
| | | | | | |
|
|
Preferred Stocks .7% | | | | | | | |
Automobiles .2% | | | | | | | |
Volkswagen AG, pfd. | | Germany | | 108,300 | | | 3,600,594 |
| | | | | | |
|
|
Metals & Mining .5% | | | | | | | |
Cia Vale do Rio Doce, ADR, pfd., A | | Brazil | | 415,500 | | | 10,129,890 |
| | | | | | |
|
|
Total Preferred Stocks (Cost $6,373,138) | | | | | | | 13,730,484 |
| | | | | | |
|
|
Total Long Term Investments (Cost $1,413,200,902) | | | | | | | 1,710,644,790 |
| | | | | | |
|
|
TG-12
FRANKLIN TEMPLETON VARIABLE INSURANCE PRODUCTS TRUST
TEMPLETON GROWTH SECURITIES FUND
Statement of Investments, December 31, 2004 (cont.)
| | | | | | | | |
| | | COUNTRY | | PRINCIPAL
AMOUNT | | VALUE |
Short Term Investments 13.9% | | | | | | | | |
U.S. Government and Agency Securities 5.9% | | | | | | | | |
bFederal Home Loan Bank, 1/03/05 | | United States | | $ | 90,777,000 | | $ | 90,767,544 |
bU.S. Treasury Bill, 3/10/05 | | United States | | | 26,950,000 | | | 26,847,725 |
| | | | | | | |
|
|
Total U.S. Government and Agency Securities (Cost $117,612,057) | | | | | | | | 117,615,269 |
| | | | | | | |
|
|
Total Investments before Repurchase Agreements (Cost $1,530,812,959) | | | | | | | | 1,828,260,059 |
| | | | | | | |
|
|
Repurchase Agreements 8.0% | | | | | | | | |
cBZW Securities Inc., 1.40%, 1/03/05 (Maturity Value $50,005,833)
Collateralized by bU.S. Treasury Bills, 6/30/05 | | United States | | | 50,000,000 | | | 50,000,000 |
cDresdner Bank AG, 1.60%, 1/03/05 (Maturity Value $8,001,067)
Collateralized by bU.S. Treasury Bills, 1/03/05 | | United States | | | 8,000,000 | | | 8,000,000 |
cParibas Corp., 2.10%, 1/03/05 (Maturity Value $100,017,500)
Collateralized by U.S. Government Agency Securities, 1.44 - 7.125%, 2/15/05 - 9/14/06 | | United States | | | 100,000,000 | | | 100,000,000 |
| | | | | | | |
|
|
Total Repurchase Agreements (Cost $158,000,000) | | | | | | | | 158,000,000 |
| | | | | | | |
|
|
Total Investments (Cost $1,688,812,959) 99.9% | | | | | | | | 1,986,260,059 |
Other Assets, less Liabilities .1% | | | | | | | | 2,970,010 |
| | | | | | | |
|
|
Net Assets 100.0% | | | | | | | $ | 1,989,230,069 |
| | | | | | | |
|
|
Portfolio Abbreviation:
ADR - American Depository Receipt
| b | Security is traded on a discount basis with no stated coupon rate. |
| c | See Note 1(c) regarding repurchase agreements. |
See notes to financial statements.
TG-13
FRANKLIN TEMPLETON VARIABLE INSURANCE PRODUCTS TRUST
TEMPLETON GROWTH SECURITIES FUND
Financial Statements
Statement of Assets and Liabilities
December 31, 2004
| | | | |
Assets: | | | | |
Investments in securities: | | | | |
Cost - Unaffiliated issuers | | $ | 1,530,812,959 | |
Cost - Repurchase agreements | | | 158,000,000 | |
| | |
|
|
|
Total cost of investments | | $ | 1,688,812,959 | |
| | |
|
|
|
Value - Unaffiliated issuers | | $ | 1,828,260,059 | |
Value - Repurchase agreements | | | 158,000,000 | |
| | |
|
|
|
Total value of investments | | | 1,986,260,059 | |
| | |
|
|
|
Cash | | | 119,091 | |
Receivables: | | | | |
Investment securities sold | | | 732,867 | |
Capital shares sold | | | 3,847,583 | |
Dividends | | | 3,356,892 | |
| | |
|
|
|
Total assets | | | 1,994,316,492 | |
| | |
|
|
|
Liabilities: | | | | |
Payables: | | | | |
Investment securities purchased | | | 3,137,682 | |
Capital shares redeemed | | | 273,861 | |
Affiliates | | | 1,513,745 | |
Other liabilities | | | 161,135 | |
| | |
|
|
|
Total liabilities | | | 5,086,423 | |
| | |
|
|
|
Net assets, at value | | $ | 1,989,230,069 | |
| | |
|
|
|
Net assets consist of: | | | | |
Undistributed net investment income | | $ | 23,647,817 | |
Net unrealized appreciation (depreciation) | | | 297,555,870 | |
Accumulated net realized gain (loss) | | | (11,268,804 | ) |
Capital shares | | | 1,679,295,186 | |
| | |
|
|
|
Net assets, at value | | $ | 1,989,230,069 | |
| | |
|
|
|
Class 1: | | | | |
Net assets, at value | | $ | 800,117,851 | |
| | |
|
|
|
Shares outstanding | | | 61,653,594 | |
| | |
|
|
|
Net asset value and offering price per share | | $ | 12.98 | |
| | |
|
|
|
Class 2: | | | | |
Net assets, at value | | $ | 1,189,112,218 | |
| | |
|
|
|
Shares outstanding | | | 92,680,531 | |
| | |
|
|
|
Net asset value and offering price per share | | $ | 12.83 | |
| | |
|
|
|
See notes to financial statements.
TG-14
FRANKLIN TEMPLETON VARIABLE INSURANCE PRODUCTS TRUST
TEMPLETON GROWTH SECURITIES FUND
Financial Statements (continued)
Statement of Operations
for the year ended December 31, 2004
| | | | |
Investment income: | | | | |
Dividends (net of foreign taxes of $3,684,309) | | $ | 37,436,753 | |
Interest (net of foreign taxes of $382) | | | 2,663,135 | |
| | |
|
|
|
Total investment income | | | 40,099,888 | |
| | |
|
|
|
Expenses: | | | | |
Management fees (Note 3) | | | 12,123,842 | |
Distribution fees - Class 2 (Note 3) | | | 1,941,766 | |
Transfer agent fees | | | 17,857 | |
Custodian fees (Note 4) | | | 383,219 | |
Reports to shareholders | | | 474,499 | |
Professional fees | | | 106,885 | |
Trustees’ fees and expenses | | | 9,097 | |
Other | | | 72,947 | |
| | |
|
|
|
Total expenses | | | 15,130,112 | |
Expense reductions (Note 4) | | | (11,564 | ) |
| | |
|
|
|
Net expenses | | | 15,118,548 | |
| | |
|
|
|
Net investment income | | | 24,981,340 | |
| | |
|
|
|
Realized and unrealized gains (losses): | | | | |
Net realized gain (loss) from: | | | | |
Investments | | | 67,533,471 | |
Foreign currency transactions | | | 308,452 | |
| | |
|
|
|
Net realized gain (loss) | | | 67,841,923 | |
| | |
|
|
|
Net change in unrealized appreciation (depreciation) on: | | | | |
Investments | | | 160,634,233 | |
Translation of assets and liabilities denominated in foreign currencies | | | (231,130 | ) |
Deferred taxes | | | 258,124 | |
| | |
|
|
|
Net change in unrealized appreciation (depreciation) | | | 160,661,227 | |
| | |
|
|
|
Net realized and unrealized gain (loss) | | | 228,503,150 | |
| | |
|
|
|
Net increase (decrease) in net assets resulting from operations | | $ | 253,484,490 | |
| | |
|
|
|
See notes to financial statements.
TG-15
FRANKLIN TEMPLETON VARIABLE INSURANCE PRODUCTS TRUST
TEMPLETON GROWTH SECURITIES FUND
Financial Statements (continued)
Statements of Changes in Net Assets
for the years ended December 31, 2004 and 2003
| | | | | | | | |
| | | 2004 | | | 2003 | |
| | |
| |
Increase (decrease) in net assets: | | | | | | | | |
Operations: | | | | | | | | |
Net investment income | | $ | 24,981,340 | | | $ | 16,388,847 | |
Net realized gain (loss) from investments and foreign currency transactions | | | 67,841,923 | | | | (17,131,289 | ) |
Net change in unrealized appreciation (depreciation) on investments, translation of assets and liabilities denominated in foreign currencies, and deferred taxes | | | 160,661,227 | | | | 296,799,389 | |
| | |
| |
Net increase (decrease) in net assets resulting from operations | | | 253,484,490 | | | | 296,056,947 | |
Distributions to shareholders from: | | | | | | | | |
Net investment income: | | | | | | | | |
Class 1 | | | (9,645,451 | ) | | | (11,363,488 | ) |
Class 2 | | | (8,547,806 | ) | | | (4,553,762 | ) |
| | |
| |
Total distributions to shareholders | | | (18,193,257 | ) | | | (15,917,250 | ) |
Capital share transactions: (Note 2) | | | | | | | | |
Class 1 | | | (75,091,706 | ) | | | (80,154,599 | ) |
Class 2 | | | 548,032,814 | | | | 225,420,705 | |
| | |
| |
Total capital share transactions | | | 472,941,108 | | | | 145,266,106 | |
Net increase (decrease) in net assets | | | 708,232,341 | | | | 425,405,803 | |
Net assets: | | | | | | | | |
Beginning of year | | | 1,280,997,728 | | | | 855,591,925 | |
| | |
| |
End of year | | $ | 1,989,230,069 | | | $ | 1,280,997,728 | |
| | |
| |
Undistributed net investment income included in net assets: | | | | | | | | |
End of year | | $ | 23,647,817 | | | $ | 16,602,943 | |
| | |
| |
See notes to financial statements.
TG-16
FRANKLIN TEMPLETON VARIABLE INSURANCE PRODUCTS TRUST
TEMPLETON GROWTH SECURITIES FUND
Notes to Financial Statements
1. ORGANIZATION AND SIGNIFICANT ACCOUNTING POLICIES
Franklin Templeton Variable Insurance Products Trust (the Trust) is registered under the Investment Company Act of 1940 as an open-end investment company, consisting of twenty-one separate series (the Funds). Templeton Growth Securities Fund (the Fund) included in this report is diversified. The financial statements of the remaining funds in the series are presented separately. Shares of the Fund are sold only to insurance company separate accounts to fund the benefits of variable life insurance policies or variable annuity contracts. The Fund’s investment objective is capital growth.
The following summarizes the Fund’s significant accounting policies.
a. Security Valuation
Securities listed on a securities exchange or on the NASDAQ National Market System are valued at the last quoted sale price or the official closing price of the day, respectively. Over-the-counter securities and listed securities for which there is no reported sale are valued within the range of the most recent quoted bid and ask prices. Securities that trade in multiple markets or on multiple exchanges are valued according to the broadest and most representative market. Repurchase agreements are valued at cost.
Corporate debt securities and U.S. Government securities generally trade in the over-the-counter market rather than on a securities exchange. The Trust may utilize independent pricing services, quotations from bond dealers, and information with respect to bond and note transactions, to assist in determining a current market value for each security. The Trust’s pricing services may use valuation models or matrix pricing which considers information with respect to comparable bond and note transactions, quotations from bond dealers, or by reference to other securities that are considered comparable in such characteristics as rating, interest rate and maturity date, option adjusted spread models, prepayment projections, interest rate spreads and yield curves, to determine current value.
Foreign securities are valued as of the close of trading on the foreign stock exchange on which the security is primarily traded, or the NYSE, whichever is earlier. The value is then converted into its U.S. dollar equivalent at the foreign exchange rate in effect at the close of the NYSE on the day that the value of the foreign security is determined. If no sale is reported at that time, the foreign security will be valued within the range of the most recent quoted bid and ask prices.
The Trust has procedures to determine the fair value of individual securities and other assets for which market prices are not readily available or which may not be reliably priced. Some methods for valuing these securities may include: fundamental analysis, matrix pricing, discounts from market prices of similar securities, or discounts applied due to the nature and duration of restrictions on the disposition of the securities. Occasionally, events occur between the time at which trading in a security is completed and the close of the NYSE that might call into question the availability (including the reliability) of the value of a portfolio security held by the Fund. If such an event occurs, the securities may be valued using fair value procedures, which may include the use of independent pricing services. All security valuation procedures are approved by the Trust’s Board of Trustees.
b. Foreign Currency Translation
Portfolio securities and other assets and liabilities denominated in foreign currencies are translated into U.S. dollars based on the exchange rate of such currencies against U.S. dollars on the date of valuation. Purchases and sales of securities, income and expense items denominated in foreign currencies are translated into U.S. dollars at the exchange rate in effect on the transaction date. Occasionally events may impact the availability or reliability of foreign exchange rates used to convert the U.S. dollar equivalent value. If such an event occurs, the foreign exchange rate will be valued at fair value using procedures established and approved by the Trust’s Board of Trustees.
The Fund does not separately report the effect of changes in foreign exchange rates from changes in market prices on securities held. Such changes are included in net realized and unrealized gain or loss from investments on the Statement of Operations.
TG-17
FRANKLIN TEMPLETON VARIABLE INSURANCE PRODUCTS TRUST
TEMPLETON GROWTH SECURITIES FUND
Notes to Financial Statements (continued)
1. ORGANIZATION AND SIGNIFICANT ACCOUNTING POLICIES (cont.)
Foreign Currency Translation (cont.)
Realized foreign exchange gains or losses arise from sales of foreign currencies, currency gains or losses realized between the trade and settlement dates on securities transactions and the difference between the recorded amounts of dividends, interest, and foreign withholding taxes and the U.S. dollar equivalent of the amounts actually received or paid. Net unrealized foreign exchange gains and losses arise from changes in foreign exchange rates on foreign denominated assets and liabilities other than investments in securities held at the end of the reporting period.
c. Repurchase Agreements
The Fund may enter into repurchase agreements, which are accounted for as a loan by the Fund to the seller, collateralized by securities which are delivered to the Fund’s custodian. The market value, including accrued interest, of the initial collateralization is required to be at least 102% of the dollar amount invested by the Fund, with the value of the underlying securities marked to market daily to maintain coverage of at least 100%. At December 31, 2004, all repurchase agreements held by the Fund had been entered into on that date.
d. Foreign Currency Contracts
When the Fund purchases or sells foreign securities it may enter into foreign exchange contracts to minimize foreign exchange risk from the trade date to the settlement date of the transactions. A foreign exchange contract is an agreement between two parties to exchange different currencies at an agreed upon exchange rate on a specified date. Realized and unrealized gains and losses on these contracts are included in the Statement of Operations.
The risks of these contracts include movement in the values of the foreign currencies relative to the U.S. dollar and the possible inability of the counterparties to fulfill their obligations under the contracts.
e. Income and Deferred Taxes
No provision has been made for U.S. income taxes because the Fund’s policy is to qualify as a regulated investment company under Sub Chapter M of the Internal Revenue Code and to distribute substantially all of its taxable income. Fund distributions to shareholders are determined on an income tax basis and may differ from net investment income and realized gains for financial reporting purposes.
The Fund is subject to a tax imposed on net realized gains of securities of certain foreign countries. The Fund records an estimated deferred tax liability for net unrealized gains on these securities.
f. Security Transactions, Investment Income, Expenses and Distributions
Security transactions are accounted for on trade date. Realized gains and losses on security transactions are determined on a specific identification basis. Interest income and estimated expenses are accrued daily. Discounts and premiums on securities purchased are amortized over the lives of the respective securities. Dividend income and distributions to shareholders are recorded on the ex-dividend date.
Common expenses incurred by the Trust are allocated among the funds based on the ratio of net assets of each fund to the combined net assets. Other expenses are charged to each fund on a specific identification basis.
Realized and unrealized gains and losses and net investment income, other than class specific expenses, are allocated daily to each class of shares based upon the relative proportion of net assets of each class.
TG-18
FRANKLIN TEMPLETON VARIABLE INSURANCE PRODUCTS TRUST
TEMPLETON GROWTH SECURITIES FUND
Notes to Financial Statements (continued)
1. ORGANIZATION AND SIGNIFICANT ACCOUNTING POLICIES (cont.)
g. Accounting Estimates
The preparation of financial statements in accordance with accounting principles generally accepted in the United States of America requires management to make estimates and assumptions that affect the reported amounts of assets and liabilities at the date of the financial statements and the amounts of income and expenses during the reporting period. Actual results could differ from those estimates.
h. Guarantees and Indemnifications
Under the Trust’s organizational documents, its officers and trustees are indemnified by the Trust against certain liability arising out of the performance of their duties to the Trust. Additionally, in the normal course of business, the Trust enters into contracts with service providers that contain general indemnification clauses. The Trust’s maximum exposure under these arrangements is unknown as this would involve future claims that may be made against the Trust that have not yet occurred. However, based on experience, the Trust expects the risk of loss to be remote.
2. SHARES OF BENEFICIAL INTEREST
The Fund offers two classes of shares: Class 1 and Class 2. Each class of shares differs by its distribution fees, voting rights on matters affecting a single class and its exchange privilege.
At December 31, 2004, there were an unlimited number of shares authorized ($.01 par value). Transactions in the Fund’s shares were as follows:
| | | | | | | | | | | | | | |
| | | Year Ended December 31,
| |
| | | 2004
| | | 2003
| |
| Class 1 Shares: | | Shares
| | | Amount
| | | Shares
| | | Amount
| |
Shares sold | | 1,256,557 | | | $ | 14,860,796 | | | 1,110,988 | | | $ | 10,553,604 | |
Shares issued in reinvestment of distributions | | 835,104 | | | | 9,645,451 | | | 1,181,236 | | | | 11,363,488 | |
Shares redeemed | | (8,487,240 | ) | | | (99,597,953 | ) | | (11,030,466 | ) | | | (102,071,691 | ) |
| | |
| |
Net increase (decrease) | | (6,395,579 | ) | | $ | (75,091,706 | ) | | (8,738,242 | ) | | $ | (80,154,599 | ) |
| | |
| |
| Class 2 Shares: | | | | | | | | | | | | |
Shares sold | | 50,615,234 | | | $ | 589,822,365 | | | 30,448,582 | | | $ | 289,636,811 | |
Shares issued in reinvestment of distributions | | 747,186 | | | | 8,547,806 | | | 477,333 | | | | 4,553,762 | |
Shares redeemed | | (4,387,645 | ) | | | (50,337,357 | ) | | (7,334,303 | ) | | | (68,769,868 | ) |
| | |
| |
Net increase (decrease) | | 46,974,775 | | | $ | 548,032,814 | | | 23,591,612 | | | $ | 225,420,705 | |
| | |
| |
3. TRANSACTIONS WITH AFFILIATES
Certain officers and trustees of the Fund are also officers and/or directors of the following entities:
| | |
| Entity | | Affiliation |
Templeton Global Advisors Ltd. (TGAL) | | Investment manager |
Templeton Asset Management Ltd. (TAML) | | Investment manager |
Franklin Templeton Services LLC (FT Services) | | Administrative manager |
Franklin Templeton Distributors Inc. (Distributors) | | Principal underwriter |
Franklin Templeton Investor Services LLC (Investor Services) | | Transfer agent |
TG-19
FRANKLIN TEMPLETON VARIABLE INSURANCE PRODUCTS TRUST
TEMPLETON GROWTH SECURITIES FUND
Notes to Financial Statements (continued)
3. TRANSACTIONS WITH AFFILIATES (cont.)
a. Management Fees
The Fund pays an investment management fee to TGAL based on the average daily net assets of the Fund as follows:
| | |
| Annualized Fee Rate | | Net Assets |
| 1.00% | | First $100 million |
| .90% | | Over $100 million, up to and including $250 million |
| .80% | | Over $250 million, up to and including $500 million |
| .75% | | Over $500 million |
Under a subadvisory agreement, TAML, an affiliate of TGAL, provides subadvisory services to the Fund and receives from TGAL fees based on the average daily net assets of the Fund.
b. Administrative Fees
Under an agreement with TGAL, FT Services provides administrative services to the Fund. The fee is paid by TGAL based on the average daily net assets of the Fund, and is not an additional expense of the Fund.
c. Distribution Fees
The Fund reimburses Distributors up to .25% per year of its average daily net assets of Class 2, for costs incurred in marketing the Fund’s shares under a Rule 12b-1 plan.
d. Transfer Agent Fees
Investor Services, under terms of an agreement, performs shareholder servicing for the Fund and is not paid by the Fund for the services.
4. EXPENSE OFFSET ARRANGEMENT
The Fund has entered into an arrangement with its custodian whereby credits realized as a result of uninvested cash balances are used to reduce a portion of the Fund’s custodian expenses. During the year ended December 31, 2004, the custodian fees were reduced as noted in the Statement of Operations.
5. INCOME TAXES
At December 31, 2004, the Fund had tax basis capital losses of $11,265,016 which may be carried over to offset future capital gains. Such losses expire in 2011.
At December 31, 2004, the Fund had deferred currency losses occurring subsequent to October 31, 2004 of $3,788. For tax purposes, such losses will be reflected in the year ending December 31, 2005.
The tax character of distributions paid during the years ended December 31, 2004 and 2003, was as follows:
| | | | | | |
| | | 2004
| | 2003
|
Distributions paid from ordinary income | | $ | 18,193,257 | | $ | 15,917,250 |
| | |
|
|
Net investment income (loss) and realized gains (losses) differ for financial statement and tax purposes primarily due to differing treatment of foreign currency transactions.
TG-20
FRANKLIN TEMPLETON VARIABLE INSURANCE PRODUCTS TRUST
TEMPLETON GROWTH SECURITIES FUND
Notes to Financial Statements (continued)
5. INCOME TAXES (cont.)
At December 31, 2004, the cost of investments, net unrealized appreciation (depreciation), and undistributed ordinary income for income tax purposes were as follows:
| | | | |
Cost of investments | | $ | 1,688,812,959 | |
| | |
|
|
|
Unrealized appreciation | | $ | 337,882,790 | |
Unrealized depreciation | | | (40,435,690 | ) |
| | |
|
|
|
Net unrealized appreciation (depreciation) | | $ | 297,447,100 | |
| | |
|
|
|
Distributable earnings - undistributed ordinary income | | $ | 23,647,326 | |
| | |
|
|
|
6. INVESTMENT TRANSACTIONS
Purchases and sales of investments (excluding short-term securities) for the year ended December 31, 2004, aggregated $620,859,324 and $257,281,470, respectively.
7. REGULATORY MATTERS
Investigations
As part of various investigations by a number of federal, state, and foreign regulators and governmental entities, including the Securities and Exchange Commission (“SEC”), the California Attorney General’s Office (“CAGO”), and the National Association of Securities Dealers, Inc. (“NASD”), relating to certain practices in the mutual fund industry, including late trading, market timing and marketing support payments to securities dealers who sell fund shares, Franklin Resources, Inc. and certain of its subsidiaries (as used in this section, together, the “Company”), as well as certain current or former executives and employees of the Company, received subpoenas and/or requests for documents, information and/or testimony. The Company and its current employees provided documents and information in response to those requests and subpoenas.
Settlements
Beginning in August 2004, the Company entered into settlements with certain regulators investigating the mutual fund industry practices noted above. The Company believes that settlement of each of the matters described in this section is in the best interest of the Company and shareholders of the Franklin, Templeton, and Mutual Series mutual funds (the “funds”).
On August 2, 2004, Franklin Resources, Inc. announced that its subsidiary, Franklin Advisers, Inc., reached an agreement with the SEC that resolved the issues resulting from the SEC investigation into market timing activity. In connection with that agreement, the SEC issued an “Order Instituting Administrative and Cease-and-Desist Proceedings Pursuant to Sections 203(e) and 203(k) of the Investment Advisers Act of 1940 and Sections 9(b) and 9(f) of the Investment Company Act of 1940, Making Findings and Imposing Remedial Sanctions and a Cease-and-Desist Order” (the “Order”). The SEC’s Order concerned the activities of a limited number of third parties that ended in 2000 and those that were the subject of the first Massachusetts administrative complaint described below.
Under the terms of the SEC’s Order, pursuant to which Franklin Advisers, Inc. neither admitted nor denied any of the findings contained therein, Franklin Advisers, Inc. agreed to pay $50 million, of which $20 million is a civil penalty, to be distributed to shareholders of certain funds in accordance with a plan to be developed by an independent distribution consultant. At this time, it is unclear which funds or which shareholders of any particular fund will receive distributions. The Order also required Franklin Advisers, Inc. to, among other things, enhance and periodically review compliance policies and procedures.
TG-21
FRANKLIN TEMPLETON VARIABLE INSURANCE PRODUCTS TRUST
TEMPLETON GROWTH SECURITIES FUND
Notes to Financial Statements (continued)
7. REGULATORY MATTERS (cont.)
Settlements (cont.)
On September 20, 2004, Franklin Resources, Inc. announced that two of its subsidiaries, Franklin Advisers, Inc. and Franklin Templeton Alternative Strategies, Inc. (“FTAS”), reached an agreement with the Securities Division of the Office of the Secretary of the Commonwealth of Massachusetts (the “State of Massachusetts”) related to its administrative complaint filed on February 4, 2004, concerning one instance of market timing that was also a subject of the August 2, 2004 settlement that Franklin Advisers, Inc. reached with the SEC, as described above.
Under the terms of the settlement consent order issued by the State of Massachusetts, Franklin Advisers, Inc. and FTAS consented to the entry of a cease-and-desist order and agreed to pay a $5 million administrative fine to the State of Massachusetts (the “Massachusetts Consent Order”). The Massachusetts Consent Order included two different sections: “Statements of Fact” and “Violations of Massachusetts Securities Laws.” Franklin Advisers, Inc. and FTAS admitted the facts in the Statements of Fact.
On October 25, 2004, the State of Massachusetts filed a second administrative complaint, alleging that Franklin Resources, Inc.’s Form 8-K filing (in which it described the Massachusetts Consent Order and stated that “Franklin did not admit or deny engaging in any wrongdoing”) failed to state that Franklin Advisers, Inc. and FTAS admitted the Statements of Fact portion of the Massachusetts Consent Order (the “Second Complaint”). Franklin Resources, Inc. reached a second agreement with the State of Massachusetts on November 19, 2004, resolving the Second Complaint. As a result of the November 19, 2004 settlement, Franklin Resources, Inc. filed a new Form 8-K. The terms of the Massachusetts Consent Order did not change and there was no monetary fine associated with this second settlement.
On November 17, 2004, Franklin Resources, Inc. announced that Franklin/Templeton Distributors, Inc. (“FTDI”) reached an agreement with the CAGO, resolving the issues resulting from the CAGO’s investigation concerning sales and marketing support payments. Under the terms of the settlement, FTDI neither admitted nor denied the allegations in the CAGO’s complaint and agreed to pay $2 million to the State of California as a civil penalty, $14 million to the funds, to be allocated by an independent distribution consultant to be paid for by FTDI, and $2 million to the CAGO for its investigative costs.
On December 13, 2004, Franklin Resources, Inc. announced that its subsidiaries FTDI and Franklin Advisers, Inc. reached an agreement with the SEC, resolving the issues resulting from the SEC’s investigation concerning marketing support payments to securities dealers who sell fund shares. In connection with that agreement, the SEC issued an “Order Instituting Administrative and Cease-and-Desist Proceedings, Making Findings, and Imposing Remedial Sanctions Pursuant to Sections 203(e) and 203(k) of the Investment Advisers Act of 1940, Sections 9(b) and 9(f) of the Investment Company Act of 1940, and Section 15(b) of the Securities Exchange Act of 1934” (the “Second Order”).
Under the terms of the Second Order, in which FTDI and Franklin Advisers, Inc. neither admitted nor denied the findings contained therein, they agreed to pay the funds a penalty of $20 million and disgorgement of $1 (one dollar). FTDI and Franklin Advisers, Inc. also agreed to implement certain measures and undertakings relating to marketing support payments to broker-dealers for the promotion or sale of fund shares, including making additional disclosures in the funds’ Prospectuses and Statements of Additional Information. The Second Order further requires the appointment of an independent distribution consultant, at the Company’s expense, who shall develop a plan for the distribution of the penalty and disgorgement to the funds.
Other Legal Proceedings
The Trust, in addition to the Company and other funds, and certain current and former officers, employees, and directors have been named in multiple lawsuits in different federal courts in Nevada, California, Illinois, New York and Florida, alleging violations of various federal securities laws and seeking, among other relief, monetary damages, restitution, removal of fund trustees, directors, advisers, administrators, and distributors, rescission of management contracts and 12b-1 Plans, and/or attorneys’ fees and costs. Specifically, the lawsuits claim breach of duty with respect to alleged arrangements to permit market
TG-22
FRANKLIN TEMPLETON VARIABLE INSURANCE PRODUCTS TRUST
TEMPLETON GROWTH SECURITIES FUND
Notes to Financial Statements (continued)
7. REGULATORY MATTERS (cont.)
Other Legal Proceedings (cont.)
timing and/or late trading activity, or breach of duty with respect to the valuation of the portfolio securities of certain Templeton funds managed by Franklin Resources, Inc. subsidiaries, resulting in alleged market timing activity. The majority of these lawsuits duplicate, in whole or in part, the allegations asserted in the February 4, 2004 Massachusetts administrative complaint and the findings in the SEC’s August 2, 2004 Order, as described above. The lawsuits are styled as class actions, or derivative actions on behalf of either the named funds or Franklin Resources, Inc.
In addition, the Company, as well as certain current and former officers, employees, and directors, have been named in multiple lawsuits alleging violations of various securities laws and pendent state law claims relating to the disclosure of directed brokerage payments and/or payment of allegedly excessive advisory, commission, and distribution fees, and seeking, among other relief, monetary damages, restitution, rescission of advisory contracts, including recovery of all fees paid pursuant to those contracts, an accounting of all monies paid to the named advisers, declaratory relief, injunctive relief, and/or attorneys’ fees and costs. These lawsuits are styled as class actions or derivative actions brought on behalf of certain funds.
The Company and fund management strongly believes that the claims made in each of the lawsuits identified above are without merit and intends to vigorously defend against them. The Company cannot predict with certainty, however, the eventual outcome of the remaining governmental investigations or private lawsuits, nor whether they will have a material negative impact on the Company. Public trust and confidence are critical to the Company’s business and any material loss of investor and/or client confidence could result in a significant decline in assets under management by the Company, which would have an adverse effect on the Company’s future financial results. If the Company finds that it bears responsibility for any unlawful or inappropriate conduct that caused losses to the Trust, it is committed to making the Trust or its shareholders whole, as appropriate. The Company is committed to taking all appropriate actions to protect the interests of its funds’ shareholders.
TG-23
FRANKLIN TEMPLETON VARIABLE INSURANCE PRODUCTS TRUST
TEMPLETON GROWTH SECURITIES FUND
Report of Independent Registered Public Accounting Firm
To the Trustees and Shareholders of Franklin Templeton Variable Insurance Products Trust
In our opinion, the accompanying statement of assets and liabilities, including the statement of investments, and the related statements of operations and of changes in net assets and the financial highlights present fairly, in all material respects, the financial position of Templeton Growth Securities Fund (the Fund) (one of the funds constituting Franklin Templeton Variable Insurance Products Trust) at December 31, 2004, the results of its operations for the year then ended, the changes in its net assets for each of the two years in the period then ended and the financial highlights for each of the five years in the period then ended, in conformity with accounting principles generally accepted in the United States of America. These financial statements and financial highlights (hereafter referred to as “financial statements”) are the responsibility of the Fund’s management; our responsibility is to express an opinion on these financial statements based on our audits. We conducted our audits of these financial statements in accordance with the standards of the Public Company Accounting Oversight Board (United States). Those standards require that we plan and perform the audits to obtain reasonable assurance about whether the financial statements are free of material misstatement. An audit includes examining, on a test basis, evidence supporting the amounts and disclosures in the financial statements, assessing the accounting principles used and significant estimates made by management, and evaluating the overall financial statement presentation. We believe that our audits, which included confirmation of securities at December 31, 2004 by correspondence with the custodian and brokers, provide a reasonable basis for our opinion.
PricewaterhouseCoopers LLP
San Francisco, California
February 9, 2005
TG-24
FRANKLIN TEMPLETON VARIABLE INSURANCE PRODUCTS TRUST
TEMPLETON GROWTH SECURITIES FUND
Tax Designation (unaudited)
Under Section 854(b)(2) of the Internal Revenue Code (Code), the Fund hereby designates 29.48% of the ordinary income dividends as income qualifying for the dividends received deduction for the fiscal year ended December 31, 2004.
At December 31, 2004, more than 50% of the Fund’s total assets were invested in securities of foreign issuers. In most instances, foreign taxes were withheld from dividends and interest paid to the Fund on these investments. The Fund elects to treat foreign taxes paid under Section 853 of the Code. This election will allow shareholders of record in June 2005, to treat their proportionate share of foreign taxes paid by the Fund as having been paid directly by them. The shareholder shall consider these amounts as foreign taxes paid in the tax year in which they receive the Fund distribution.
The foreign tax information will be disclosed in the June 2005, semi-annual report of the Fund.
TG-25
INDEX DESCRIPTIONS
The indexes are unmanaged and include reinvested distributions.
Consumer Price Index (CPI), calculated by the U.S. Bureau of Labor Statistics, is a commonly used measure of the inflation rate.
Credit Suisse First Boston (CSFB) High Yield Index is designed to mirror the investible universe of the U.S. dollar-denominated high yield debt market.
Dow Jones Industrial Average (the Dow) is price weighted based on the average market price of 30 blue chip stocks of companies that are generally industry leaders.
Dow Jones Wilshire Real Estate Securities Index is a broad measure of the performance of publicly traded real estate securities, such as real estate investment trusts and real estate operating companies. The index is capitalization weighted and rebalanced monthly, and returns are calculated on a buy-and-hold basis.
J.P. Morgan (JPM) Emerging Markets Bond Index Global (EMBIG) tracks total returns for U.S. dollar-denominated debt instruments issued by emerging market sovereign and quasi-sovereign entities: Brady bonds, loans and Eurobonds.
J.P. Morgan (JPM) Euro Emerging Markets Bond Index Global (EMBIG) tracks total returns for euro-denominated straight fixed coupon instruments issued by emerging market sovereign and quasi-sovereign entities.
J.P. Morgan (JPM) Government Bond Index (GBI) Global tracks total returns of government bonds in developed countries globally. The bonds included in the index are weighted according to their market capitalization. The index is unhedged and expressed in terms of $US.
Lehman Brothers U.S. Aggregate Index represents securities that are SEC-registered, taxable and dollar denominated. The index covers the U.S. investment grade fixed-rate bond market, with index components for government and corporate securities, mortgage pass-through securities and asset-backed securities. All issues included must have at least one year to final maturity and must be rated investment grade (Baa3 or better) by Moody’s Investors Service. They must be publicly issued, fixed rate, and have at least par amount outstanding. They must also be dollar denominated and non-convertible. Total return includes price appreciation/depreciation and income as a percentage of the original investment. The index is rebalanced monthly by market capitalization.
Lehman Brothers U.S. Intermediate Government Bond Index includes securities issued by the U.S. Treasury or agency. These include public obligations of the U.S. Treasury with remaining maturity of one year or more and publicly issued debt of U.S. governmental agencies, quasi-federal corporations, and corporate or foreign debt. All issues included must have one to ten years to final maturity and must be rated investment grade (Baa3 or better) by Moody’s Investors Service. They must also be dollar-denominated and non-convertible. Total return includes price appreciation/depreciation and income as a percentage of the original investment. The index is rebalanced monthly by market capitalization.
I-1
Lipper Multi-Sector Income Funds Objective Average is calculated by averaging the total returns of all funds within the Lipper Multi-Sector Income Funds classification in the Lipper Open-End underlying funds universe. Lipper Multi-Sector Income Funds are defined as funds that seek current income by allocating assets among different fixed income securities sectors (not primarily in one sector except for defensive purposes), including U.S. and foreign governments, with a significant portion rated below investment grade. For the one-year period ended 12/31/04, there were 112 funds in this category. Lipper calculations do not include sales charges, but include reinvestment of any income and distributions. Fund performance relative to the average may have differed if these and other factors had been considered.
Lipper VIP Equity Income Funds Objective Average is an equally weighted average calculation of performance figures for all funds within the Lipper Equity Income Funds classification in the Lipper VIP underlying funds universe. Lipper Equity Income Funds are defined as funds that seek relatively high current income and growth of income through investing at least 60% of their portfolio in equity securities. For the one-year period ended 12/31/04, there were 61 funds in this category. Lipper calculations do not include contract fees, expenses or sales charges, and may have been different if such charges had been considered.
Lipper VIP General U.S. Government Funds Objective Average is an equally weighted average calculation of performance figures for all funds within the Lipper U.S. Government Funds classification in the Lipper VIP underlying funds universe. Lipper U.S. Government Funds are defined as funds that invest primarily in U.S. government and Agency issues. For the one-year period ended 12/31/04, there were 56 funds in this category. Lipper calculations do not include contract fees, expenses or sales charges, and may have been different if such charges had been considered.
Lipper VIP Income Funds Objective Average is an equally weighted average calculation of performance figures for all funds within the Lipper Income Funds classification in the Lipper VIP underlying funds universe. Lipper Income Funds seek a high level of current income by investing in income-producing stocks, bonds and money market instruments. For the one-year period ended 12/31/04, there were 18 funds in this category. Lipper calculations do not include contract fees, expenses or sales charges, and may have been different if such charges had been considered.
Merrill Lynch 2-, 5- and 10-Year Zero Coupon Bond Indexes include zero coupon bonds that pay no interest and are issued at a discount from redemption price.
Merrill Lynch U.S. Treasury Strips 1-Year Index consists of U.S. Treasury debt that has been issued in stripped form that is captured in the Merrill Lynch U.S. Broad Market Index. The index is composed of a single synthetic security rolled daily to achieve a 1-year constant maturity.
Morgan Stanley Capital International (MSCI) All Country (AC) World Index is a free float-adjusted, market capitalization-weighted index designed to measure equity market performance in global developed and emerging markets.
Morgan Stanley Capital International (MSCI) Emerging Markets (EM) Index is a free float-adjusted, market capitalization-weighted index designed to measure equity market performance in global emerging markets.
I-2
Morgan Stanley Capital International (MSCI) Europe Australasia Far East (EAFE) Index is a free float-adjusted, market capitalization-weighted index designed to measure equity market performance in global developed markets excluding the U.S. and Canada.
Morgan Stanley Capital International (MSCI) World Index is a free float-adjusted, market capitalization-weighted index designed to measure equity performance in global developed markets.
National Association of Securities Dealers Automated Quotations (NASDAQ) Composite Index measures all domestic and international common stocks listed on The NASDAQ Stock Market. The index is market value weighted and includes over 3,000 companies.
Russell 1000 Growth Index is market capitalization weighted and measures performance of those Russell 1000 Index companies with higher price-to-book ratios and higher forecasted growth values.
Russell 1000 Index is market capitalization weighted and measures performance of the 1,000 largest companies in the Russell 3000 Index, which represent approximately 92% of total market capitalization of the Russell 3000 Index.
Russell 1000 Value Index is market capitalization weighted and measures performance of those Russell 1000 Index companies with lower price-to-book ratios and lower forecasted growth values.
Russell 2000 Index is market capitalization weighted and measures performance of the 2,000 smallest companies in the Russell 3000 Index, which represent approximately 8% of total market capitalization of the Russell 3000 Index.
Russell 2000 Value Index is market capitalization weighted and measures performance of those Russell 2000 Index companies with lower price-to-book ratios and lower forecasted growth values.
Russell 2500 Growth Index is market capitalization weighted and measures performance of those Russell 2500 Index companies with higher price-to-book ratios and higher forecasted growth values.
Russell Midcap Value Index is market capitalization weighted and measures performance of those Russell Midcap Index companies with lower price-to-book ratios and lower forecasted growth values.
Standard & Poor’s 500 Composite Index (S&P 500) consists of 500 stocks chosen for market size, liquidity and industry group representation. Each stock’s weight in the index is proportionate to its market value. The S&P 500 is one of the most widely used benchmarks of U.S. equity performance.
Standard & Poor’s/International Finance Corporation Investable (S&P/IFCI) Composite Index is a market capitalization-weighted index designed to measure the performance of emerging market stocks. It tracks approximately 2,000 securities such as Brazil, Mexico, China and South Korea. Performance represents total return in $US.
I-3
Board Members and Officers
The name, age and address of the officers and board members, as well as their affiliations, positions held with the Trust, principal occupations during the past five years and number of portfolios overseen in the Franklin Templeton Investments fund complex are shown below. Each board member will serve until that person’s successor is elected and qualified.
Independent Board Members
| | | | | | | | |
| Name, Age and Address | | Position | | Length of
Time Served | | Number of
Portfolios in Fund
Complex Overseen
by Board Member* | | Other Directorships Held |
FRANK H. ABBOTT, III (83) One Franklin Parkway San Mateo, CA 94403-1906 | | Trustee | | Since 1988 | | 113 | | None |
|
Principal Occupation During Past 5 Years: President and Director, Abbott Corporation (an investment company). |
HARRIS J. ASHTON (72) One Franklin Parkway San Mateo, CA 94403-1906 | | Trustee | | Since 1988 | | 142 | | Director, Bar-S Foods (meat packing company). |
|
Principal Occupation During Past 5 Years: Director of various companies; and formerly, Director, RBC Holdings, Inc. (bank holding company) (until 2002); and President, Chief Executive Officer and Chairman of the Board, General Host Corporation (nursery and craft centers) (until 1998). |
ROBERT F. CARLSON (76) One Franklin Parkway San Mateo, CA 94403-1906 | | Trustee | | Since 1998 | | 49 | | None |
|
Principal Occupation During Past 5 Years: Senior Member and past President, Board of Administration, California Public Employees Retirement Systems (CALPERS); and formerly, member and Chairman of the Board, Sutter Community Hospitals; member, Corporate Board, Blue Shield of California; and Chief Counsel, California Department of Transportation. |
S. JOSEPH FORTUNATO (72) One Franklin Parkway San Mateo, CA 94403-1906 | | Trustee | | Since 1995 | | 143 | | None |
|
Principal Occupation During Past 5 Years: Attorney; and formerly, member of the law firm of Pitney, Hardin, Kipp & Szuch (until 2002) (Consultant (2003)). |
FRANK W.T. LAHAYE (75) One Franklin Parkway San Mateo, CA 94403-1906 | | Trustee | | Since 1988 | | 115 | | Director, The California Center for Land Recycling (redevelopment). |
|
Principal Occupation During Past 5 Years: General Partner, Las Olas L.P. (Asset Management); and formerly, Chairman, Peregrine Venture Management Company (venture capital). |
GORDON S. MACKLIN (76) One Franklin Parkway San Mateo, CA 94403-1906 | | Trustee | | Since 1995 | | 142 | | Director, Martek Biosciences Corporation; MedImmune, Inc. (biotechnology); and Overstock.com (Internet services); and formerly, Director, MCI Communication Corporation (subsequently known as MCI WorldCom, Inc. and WorldCom, Inc.) (communications services) (1988-2002), White Mountains Insurance Group Ltd. (holding company) (1987-2004) and Spacehab, Inc. (aerospace services) (1994-2003). |
|
Principal Occupation During Past 5 Years: Director of various companies; and formerly, Deputy Chairman, White Mountains Insurance Group, Ltd. (holding company) (2001-2004); Chairman, White River Corporation (financial services) (1993-1998) and Hambrecht & Quist Group (investment banking) (1987-1992); and President, National Association of Securities Dealers, Inc. (1970-1987). |
BOD-1
Interested Board Members and Officers
| | | | | | | | |
| Name, Age and Address | | Position | | Length of
Time Served | | Number of
Portfolios in Fund
Complex Overseen
by Board Member* | | Other Directorships Held |
**CHARLES B. JOHNSON (71) One Franklin Parkway San Mateo, CA 94403-1906 | | Trustee and Chairman of the Board | | Since 1988 | | 142 | | None |
|
Principal Occupation During Past 5 Years: Chairman of the Board, Member—Office of the Chairman and Director, Franklin Resources, Inc.; Vice President, Franklin Templeton Distributors, Inc.; Director, Fiduciary Trust Company International; and officer and/or director or trustee, as the case may be, of some of the other subsidiaries of Franklin Resources, Inc. and of 46 of the investment companies in Franklin Templeton Investments. |
**RUPERT H. JOHNSON, Jr. (64) One Franklin Parkway San Mateo, CA 94403-1906 | | Trustee,
President and
Chief Executive Officer—
Investment Management | | Trustee since 1988 and President and Chief Executive Officer—Investment Management since 2002 | | 125 | | None |
|
Principal Occupation During Past 5 Years: Vice Chairman, Member—Office of the Chairman and Director, Franklin Resources, Inc.; Vice President and Director, Franklin Templeton Distributors, Inc.; Director, Franklin Advisers, Inc. and Franklin Investment Advisory Services, Inc.; Senior Vice President, Franklin Advisory Services, LLC; and officer and/or director or trustee, as the case may be, of some of the other subsidiaries of Franklin Resources, Inc. and of 49 of the investment companies in Franklin Templeton Investments. |
HARMON E. BURNS (59) One Franklin Parkway San Mateo, CA 94403-1906 | | Vice President | | Since 1988 | | Not
Applicable | | Not Applicable |
|
Principal Occupation During Past 5 Years: Vice Chairman, Member—Office of the Chairman and Director, Franklin Resources, Inc.; Vice President and Director, Franklin Templeton Distributors, Inc.; Executive Vice President, Franklin Advisers, Inc.; Director, Franklin Investment Advisory Services, Inc.; and officer and/or director or trustee, as the case may be, of some of the other subsidiaries of Franklin Resources, Inc. and of 49 of the investment companies in Franklin Templeton Investments. |
JAMES M. DAVIS (52) One Franklin Parkway San Mateo, CA 94403-1906 | | Chief Compliance Officer | | Since July 2004 | | Not
Applicable | | Not Applicable |
|
Principal Occupation During Past 5 Years: Officer of 51 of the investment companies in Franklin Templeton Investments; Director, Global Compliance, Franklin Resources, Inc.; and formerly, Director of Compliance, Franklin Resources, Inc. (1994-2001). |
LAURA FERGERSON (42) One Franklin Parkway San Mateo, CA 94403-1906 | | Treasurer | | Since July 2004 | | Not
Applicable | | Not Applicable |
|
Principal Occupation During Past 5 Years: Officer of 34 of the investment companies in Franklin Templeton Investments; and formerly, Director and member of Audit and Valuation Committees, Runkel Funds, Inc. (2003-2004); Assistant Treasurer of most of the investment companies in Franklin Templeton Investments (1997-2003); and Vice President, Franklin Templeton Services, LLC (1997-2003). |
BOD-2
| | | | | | | | |
| Name, Age and Address | | Position | | Length of
Time Served | | Number of
Portfolios in Fund
Complex Overseen
by Board Member* | | Other Directorships Held |
MARTIN L. FLANAGAN (44) One Franklin Parkway San Mateo, CA 94403-1906 | | Vice President | | Since 1995 | | Not
Applicable | | Not Applicable |
|
Principal Occupation During Past 5 Years: Co-President and Chief Executive Officer, Franklin Resources, Inc.; Senior Vice President and Chief Financial Officer, Franklin Mutual Advisers, LLC; Executive Vice President, Chief Financial Officer and Director, Templeton Worldwide, Inc.; Executive Vice President and Chief Operating Officer, Templeton Investment Counsel, LLC; President and Director, Franklin Advisers, Inc.; Executive Vice President, Franklin Investment Advisory Services, Inc. and Franklin Templeton Investor Services, LLC; Chief Financial Officer, Franklin Advisory Services, LLC; Chairman, Franklin Templeton Services, LLC; and officer and/or director or trustee, as the case may be, of some of the other subsidiaries of Franklin Resources, Inc. and of 49 of the investment companies in Franklin Templeton Investments. |
JIMMY D. GAMBILL (57) 500 East Broward Blvd. Suite 2100
Fort Lauderdale,
FL 33394-3091 | | Senior Vice President and Chief
Executive Officer—Finance and Administration | | Since 2002 | | Not
Applicable | | Not Applicable |
|
Principal Occupation During Past 5 Years: President, Franklin Templeton Services, LLC; Senior Vice President, Templeton Worldwide, Inc.; and officer of 51 of the investment companies in Franklin Templeton Investments. |
DAVID P. GOSS (57) One Franklin Parkway San Mateo, CA 94403-1906 | | Vice President | | Since 2000 | | Not
Applicable | | Not Applicable |
|
Principal Occupation During Past 5 Years: Senior Associate General Counsel, Franklin Resources, Inc.; officer and director of one of the subsidiaries of Franklin Resources, Inc.; officer of 51 of the investment companies in Franklin Templeton Investments; and formerly, President, Chief Executive Officer and Director, Property Resources Equity Trust (until 1999) and Franklin Select Realty Trust (until 2000). |
BARBARA J. GREEN (57) One Franklin Parkway San Mateo, CA 94403-1906 | | Vice President | | Since 2000 | | Not
Applicable | | Not Applicable |
|
Principal Occupation During Past 5 Years: Vice President, Deputy General Counsel and Secretary, Franklin Resources, Inc.; Secretary and Senior Vice President, Templeton Worldwide, Inc.; Secretary, Franklin Advisers, Inc., Franklin Advisory Services, LLC, Franklin Investment Advisory Services, Inc., Franklin Mutual Advisers, LLC, Franklin Templeton Alternative Strategies, Inc., Franklin Templeton Investor Services, LLC, Franklin Templeton Services, LLC, Franklin Templeton Distributors, Inc., Templeton Investment Counsel, LLC, and Templeton/Franklin Investment Services, Inc.; and officer of some of the other subsidiaries of Franklin Resources, Inc. and of 51 of the investment companies in Franklin Templeton Investments; and formerly, Deputy Director, Division of Investment Management, Executive Assistant and Senior Advisor to the Chairman, Counselor to the Chairman, Special Counsel and Attorney Fellow, U.S. Securities and Exchange Commission (1986-1995); Attorney, Rogers & Wells (until 1986); and Judicial Clerk, U.S. District Court (District of Massachusetts) (until 1979). |
MICHAEL O. MAGDOL (67) 600 Fifth Avenue Rockefeller Center New York, NY 10048-0772 | | Vice President— AML Compliance | | Since 2002 | | Not
Applicable | | Not Applicable |
|
Principal Occupation During Past 5 Years: Vice Chairman, Chief Banking Officer and Director, Fiduciary Trust Company International; Director, FTI Banque, Arch Chemicals, Inc. and Lingnan Foundation; and officer and/or director, as the case may be, of some of the other subsidiaries of Franklin Resources, Inc. and of 48 of the investment companies in Franklin Templeton Investments. |
BOD-3
| | | | | | | | |
| Name, Age and Address | | Position | | Length of
Time Served | | Number of
Portfolios in Fund
Complex Overseen
by Board Member* | | Other Directorships Held |
MURRAY L. SIMPSON (67) One Franklin Parkway San Mateo, CA 94403-1906 | | Vice President and Secretary | | Since 2000 | | Not
Applicable | | Not Applicable |
|
Principal Occupation During Past 5 Years: Executive Vice President and General Counsel, Franklin Resources, Inc.; officer and/or director, as the case may be, of some of the subsidiaries of Franklin Resources, Inc. and of 51 of the investment companies in Franklin Templeton Investments; and formerly, Chief Executive Officer and Managing Director, Templeton Franklin Investment Services (Asia) Limited (until 2000); and Director, Templeton Asset Management Ltd. (until 1999). |
GALEN G. VETTER (53) 500 East Broward Blvd. Suite 2100 Fort Lauderdale,
FL 33394-3091 | | Chief Financial Officer and Chief Accounting Officer | | Since May 2004 | | Not
Applicable | | Not Applicable |
|
Principal Occupation During Past 5 Years: Officer of 51 of the investment companies in Franklin Templeton Investments; Senior Vice President, Franklin Templeton Services, LLC; and formerly, Managing Director, RSM McGladrey, Inc.; and Partner, McGladrey & Pullen, LLP. |
| *We | base the number of portfolios on each separate series of the U.S. registered investment companies within the Franklin Templeton Investments fund complex. These portfolios have a common investment adviser or affiliated investment advisers. |
| **Charles | B. Johnson and Rupert H. Johnson, Jr. are considered to be interested persons of the Trust under the federal securities laws due to their positions as officers and directors and major shareholders of Franklin Resources, Inc., which is the parent company of the Trust’s advisers and distributor. |
Note: Charles B. Johnson and Rupert H. Johnson, Jr. are brothers.
The Sarbanes-Oxley Act of 2002 and Rules adopted by the Securities and Exchange Commission require the Fund to disclose whether the Fund’s Audit Committee includes at least one member who is an audit committee financial expert within the meaning of such Act and Rules. The Fund’s Board of Directors has determined that there is at least one such financial expert on the Audit Committee and has designated Frank W.T. LaHaye as its audit committee financial expert. The Board believes that Mr. LaHaye qualifies as such an expert in view of his extensive business background and experience, including service as President and Director of McCormick Selph Associates from 1954 through 1965; Director and Chairman of Teledyne Canada Ltd. from 1966 through 1971; Director and Chairman of Quarterdeck Corporation from 1982 through 1998; and services as a Director of various other public companies including U.S. Telephone Inc. (1981-1984), Fisher Imaging Inc. (1991-1998) and Digital Transmissions Systems (1995-1999). In addition, Mr. LaHaye served from 1981 to 2000 as a Director and Chairman of Peregrine Venture Management Co., a venture capital firm, and has been a Member and Chairman of the Fund’s Audit Committee since its inception. As a result of such background and experience, the Board of Directors believes that Mr. LaHaye has acquired an understanding of generally accepted accounting principles and financial statements, the general application of such principles in connection with the accounting estimates, accruals and reserves, and analyzing and evaluating financial statements that present a breadth and level of complexity of accounting issues generally comparable to those of the Fund, as well as an understanding of internal controls and procedures for financial reporting and an understanding of audit committee functions. Mr. LaHaye is an independent Director as that term is defined under the relevant Securities and Exchange Commission Rules and Releases.
The Statement of Additional Information (SAI) includes additional information about the board members and is available, without charge, upon request. Contract owners may call 1-800/321-8563 or their insurance companies to request the SAI.
BOD-4
FRANKLIN TEMPLETON VARIABLE INSURANCE PRODUCTS TRUST
SHAREHOLDER INFORMATION
Proxy Voting Policies and Procedures
The Fund has established Proxy Voting Policies and Procedures (“Policies”) that the Fund uses to determine how to vote proxies relating to portfolio securities. Shareholders may view the Fund’s complete Policies online at franklintempleton.com. Alternatively, shareholders may request copies of the Policies free of charge by calling the Proxy Group collect at 1-954/847-2268 or by sending a written request to: Franklin Templeton Companies, LLC, 500 East Broward Boulevard, Suite 1500, Fort Lauderdale, FL 33394, Attention: Proxy Group. Copies of the Fund’s proxy voting records are also made available online at franklintempleton.com and posted on the Securities and Exchange Commission’s website at sec.gov and reflect the most recent 12-month period ended June 30.
Quarterly Statement of Investments
The Fund files a complete statement of investments with the Securities and Exchange Commission for the first and third quarters for each fiscal year on Form N-Q. Shareholders may view the filed Form N-Q by visiting the Commission’s website at sec.gov. The filed form may also be viewed and copied at the Commission’s Public Reference Room in Washington, DC. Information regarding the operations of the Public Reference Room may be obtained by calling 1-800/SEC-0330.
SI-1

| (a) | The Registrant has adopted a code of ethics that applies to its principal executive officers and principal financial and accounting officer. |
| (f) | Pursuant to Item 11(a), the Registrant is attaching as an exhibit a copy of its code of ethics that applies to its principal executive officers financial and accounting officer. |
| Item 3. | Audit Committee Financial Expert. |
| | |
| (a)(1) | | The Registrant has an audit committee financial expert serving on its audit committee. |
| |
| (2) | | The audit committee financial expert is Frank W.T. LaHaye and he is “Independent” as defined under the relevant Securities and Exchange Commission Rules And Releases. |
| Item 4. | Principal Accountant Fees and Services. |
N/A
| Item 5. | Audit Committee of Listed Registrants. |
N/A
| Item 7. | Disclosure of Proxy Voting Policies and Procedures for Closed-End Management Investment Companies. |
N/A
| Item 8. | Purchases of Equity Securities by Closed-End Management Investment Companies and Affiliated Purchases. |
N/A
| Item 9. | Submission of Matters to a vote of Security Holders. |
There have been no changes to the procedures by which shareholders may recommend nominees to the Registrant’s Board of Trustees that would require disclosure herein.
| Item 10. | Controls and Procedures. |
(a) Evaluation of Disclosure Controls and Procedures. The Registrant maintains disclosure controls and procedures that are designed to ensure that information required to be disclosed in the Registrant’s filings under the Securities Exchange Act of 1934 and the Investment Company Act of 1940 is recorded, processed, summarized and reported within the periods specified in the rules and forms of the Securities and Exchange Commission. Such information is accumulated and communicated to the Registrant’s management, including its principal executive officer and principal financial officer, as appropriate, to allow timely decisions regarding required disclosure. The Registrant’s management, including the principal executive officer and the principal financial officer, recognizes that any set of controls and procedures, no matter how well designed and operated, can provide only reasonable assurance of achieving the desired control objectives.
Within 90 days prior to the filing date of this Shareholder Report on Form N-CSR, the Registrant had carried out an evaluation, under the supervision and with the participation of the Registrant’s management, including the Registrant’s principal executive officer and the Registrant’s principal financial officer, of the effectiveness of the design and operation of the Registrant’s disclosure controls and procedures. Based on such evaluation, the Registrant’s principal executive officer and principal financial officer concluded that the Registrant’s disclosure controls and procedures are effective.
(b) Changes in Internal Controls. There have been no significant changes in the Registrant’s internal controls or in other factors that could significantly affect the internal controls subsequent to the date of their evaluation in connection with the preparation of this Shareholder Report on Form N-CSR.
| (a) | Code of Ethics for Principal Executive and Senior Financial Officers |
| | |
| (b)(1) | | Certifications pursuant to Section 302 of the Sarbanes-Oxley Act of 2002 of Jimmy D. Gambill, Chief Executive Officer—Finance and Administration, and Galen G. Vetter, Chief Financial Officer |
| |
| (b)(2) | | Certifications pursuant to Section 906 of the Sarbanes-Oxley Act of 2002 of Jimmy D. Gambill, Chief Executive Officer—Finance and Administration, and Galen G. Vetter, Chief Financial Officer |
SIGNATURES
Pursuant to the requirements of the Securities Exchange Act of 1934 and the Investment Company Act of 1940, the registrant has duly caused this report to be signed on its behalf by the undersigned, thereunto duly authorized.
FRANKLIN TEMPLETON VARIABLE INSURANCE PRODUCTS TRUST
| | |
| |
| By | | /s/ JIMMY D. GAMBILL |
| | | Jimmy D. Gambill |
| | | Chief Executive Officer – Finance and Administration |
| |
Date: | | April 25, 2005 |
Pursuant to the requirements of the Securities Exchange Act of 1934 and the Investment Company Act of 1940, this report has been signed below by the following persons on behalf of the registrant and in the capacities and on the dates indicated.
| | |
| |
| By | | /s/ JIMMY D. GAMBILL |
| | | Jimmy D. Gambill |
| | | Chief Executive Officer – Finance and Administration |
| |
Date: | | April 25, 2005 |
| | |
| |
| By | | /s/ GALEN G. VETTER |
| | | Galen G. Vetter |
| | | Chief Financial Officer |
| |
Date: | | April 25, 2005 |