UNITED STATES
SECURITIES AND EXCHANGE COMMISSION
Washington, D.C. 20549
FORM N-CSR
CERTIFIED SHAREHOLDER REPORT OF REGISTERED MANAGEMENT INVESTMENT COMPANIES
Investment Company Act file number 811-05583
Franklin Templeton Variable Insurance Products Trust
(Exact name of registrant as specified in charter)
One Franklin Parkway, San Mateo, CA 94403-1906
(Address of principal executive offices) (Zip code)
Craig S. Tyle, One Franklin Parkway, San Mateo, CA 94403-1906
(Name and address of agent for service)
Registrant’s telephone number, including area code: (650) 312-2000
Date of fiscal year end: 12/31
Date of reporting period: 12/31/06
| Item 1. | Reports to Stockholders. |

DECEMBER 31, 2006
FRANKLIN TEMPLETON
VARIABLE INSURANCE PRODUCTS TRUST
ANNUAL REPORT

FRANKLIN TEMPLETON VARIABLE INSURANCE PRODUCTS TRUST ANNUAL REPORT
TABLEOF CONTENTS
*Not part of the annual report
NOT FDIC INSURED | MAY LOSE VALUE | NO BANK GUARANTEE
MASTER CLASS – 3
IMPORTANT NOTESTOPERFORMANCE INFORMATION
Performance data is historical and cannot predict or guarantee future results. Principal value and investment return will fluctuate with market conditions, and you may have a gain or loss when you withdraw your money. Inception dates of the funds may have preceded the effective dates of the subaccounts, contracts, or their availability in all states.
When reviewing the index comparisons, please keep in mind that indexes have a number of inherent performance differentials over the funds. First, unlike the funds, which must hold a minimum amount of cash to maintain liquidity, indexes do not have a cash component. Second, the funds are actively managed and, thus, are subject to management fees to cover salaries of securities analysts or portfolio managers in addition to other expenses. Indexes are unmanaged and do not include any commissions or other expenses typically associated with investing in securities. Third, indexes often contain a different mix of securities than the fund to which they are compared. Additionally, please remember that indexes are simply a measure of performance and cannot be invested in directly.
i
SUPPLEMENT DATED FEBRUARY 16, 2007
TOTHE PROSPECTUSES DATED MAY 1, 2006OF
FRANKLIN TEMPLETON VARIABLE INSURANCE PRODUCTS TRUST
FRANKLIN FLEX CAP GROWTH SECURITIES FUND
FRANKLIN GLOBAL COMMUNICATIONS SECURITIES FUND
FRANKLIN GROWTHAND INCOME SECURITIES FUND
FRANKLIN HIGH INCOME SECURITIES FUND
FRANKLIN INCOME SECURITIES FUND
FRANKLIN LARGE CAP GROWTH SECURITIES FUND
FRANKLIN LARGE CAP VALUE SECURITIES FUND
FRANKLIN MONEY MARKET FUND
FRANKLIN REAL ESTATE FUND
FRANKLIN RISING DIVIDENDS SECURITIES FUND
FRANKLIN SMALL CAP VALUE SECURITIES FUND
FRANKLIN SMALL-MID CAP GROWTH SECURITIES FUND
FRANKLIN STRATEGIC INCOME SECURITIES FUND
FRANKLIN U.S. GOVERNMENT FUND
FRANKLIN ZERO COUPON FUND —MATURINGIN DECEMBER 2010
MUTUAL DISCOVERY SECURITIES FUND
MUTUAL SHARES SECURITIES FUND
TEMPLETON DEVELOPING MARKETS SECURITIES FUND
TEMPLETON FOREIGN SECURITIES FUND
TEMPLETON GLOBAL ASSET ALLOCATION FUND
TEMPLETON GLOBAL INCOME SECURITIES FUND
TEMPLETON GROWTH SECURITIES FUND (THE “FUNDS”)
The prospectuses of the Funds are amended by adding the following after the first paragraph in the section titled “Overview”:
Shares of the Funds may also be offered to and purchased by other investment companies. Throughout this prospectus and the Statement of Additional Information, references to “Contracts,” “Contract Owners,” and “Insurers,” each defined below, may also include such investment company purchasers where appropriate.
Please keep this supplement for future reference.
SUPP-1
Templeton Developing Markets Securities Fund
This annual report for Templeton Developing Markets Securities Fund covers the fiscal year ended December 31, 2006.
Performance Summary as of 12/31/06
Average annual total return of Class 3 shares* represents the average annual change in value, assuming reinvestment of dividends and capital gains. Average returns smooth out variations in returns, which can be significant; they are not the same as year-by-year results.
Periods ended 12/31/06
| | | | | | |
| | | 1-Year | | 5-Year | | 10-Year |
Average Annual Total Return | | +28.17% | | +25.52% | | +5.23% |
*Performance prior to the 5/1/00 merger reflects historical performance of Templeton Developing Markets Fund. Additionally, Class 3 and Class 2 shares were not offered until 5/1/04 and 5/1/97, respectively. As a result, Class 3 Fund performance for periods prior to 5/1/04 represents historical results of Class 2 shares which, for periods prior to 5/1/97, reflects historical results of Class 1 shares. For periods beginning on 5/1/97, Class 2’s results reflect an additional 12b-1 fee expense, which also affects future performance. The 12b-1 fee rate is currently the same for Classes 2 and 3. Since 5/1/04 (effective date), the average annual total return of Class 3 shares was +30.41%.
Total Return Index Comparison
for Hypothetical $10,000 Investment (1/1/97–12/31/06)
The graph below shows the change in value of a hypothetical $10,000 investment in the Fund over the indicated period and includes reinvestment of any income or distributions. The Fund’s performance* is compared to the performance of the Morgan Stanley Capital International (MSCI) Emerging Markets (EM) Index and the Standard & Poor’s/International Finance Corporation Investable (S&P/IFCI) Composite Index. One cannot invest directly in an index, nor is an index representative of the Fund’s portfolio. Please see Important Notes to Performance Information preceding the Fund Summaries.
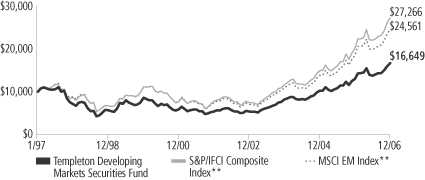
**Source: Standard & Poor’s Micropal. Please see Index Descriptions following the Fund Summaries.
Templeton Developing Markets Securities Fund Class 3
Performance reflects the Fund’s Class 3 operating expenses, but does not include any contract fees, expenses or sales charges. If they had been included, performance would be lower. These charges and deductions, particularly for variable life policies, can have a significant effect on contract values and insurance benefits. See the contract prospectus for a complete description of these expenses, including sales charges.
Performance data represent past performance, which does not guarantee future results. Investment return and principal value will fluctuate, and you may have a gain or loss when you sell your shares.
Current performance may differ from figures shown.
TD-1
Fund Goal and Main Investments: Templeton Developing Markets Securities Fund seeks long-term capital appreciation. The Fund normally invests at least 80% of its net assets in emerging market investments and normally invests primarily to predominantly in equity securities.
Performance Overview
You can find the Fund’s one-year total return in the Performance Summary. The Fund underperformed the MSCI EM Index’s +32.59% return, and the S&P/IFCI Composite Index’s +35.11% return for the same period.1 Please note that index performance numbers are purely for reference and that we do not attempt to track an index but rather undertake investments on the basis of fundamental research.
Economic and Market Overview
During the 12 months under review, strong investor confidence, continuing fund inflows, robust corporate earnings and a supportive economic environment led emerging markets to end 2006 at historical highs. After the markets experienced a correction in May, they recovered as fund flows stabilized, robust economic data was reported and the U.S. showed signs of an easing monetary policy. In addition, the interest rate spread on emerging market bonds relative to U.S. Treasury yields maintained a downward trend during the year, falling from about 250 basis points (100 basis points equal one percentage point) to about 170 basis points due to rising liquidity and low inflation.2 We believe this signaled greater investor confidence in emerging markets.
Eastern European markets recorded the strongest returns in 2006. Russia benefited from high commodity prices that supported its exports and from strong foreign investor participation, while a weaker U.S. dollar enhanced returns in Poland and the Czech Republic. Turkey was one of the few emerging markets to end the year with a negative return. Although that market recovered some of the losses from the correction earlier in the year, investors remained cautious due to slow progress for European Union accession talks and expectations of slower growth after a substantial interest rate increase in the second quarter.
In South Africa, a consumer spending boom, propelled by low borrowing rates and greater domestic demand, led to higher corporate earnings in related companies. Foreign investment reached a record high, which boosted returns for South Africa’s markets.
1. Source: Standard & Poor’s Micropal. One cannot invest directly in an index, nor is an index representative of the Fund’s portfolio. Please see Index Descriptions following the Fund Summaries.
2. Source: J.P. Morgan.
Fund Risks: The Fund’s investments in stocks offer the potential for long-term gains but can be subject to short-term price fluctuation. Investing in emerging markets is subject to all the risks of foreign investing generally, and has additional, heightened risks, including market and currency fluctuations, economic instability, adverse social and political developments, the relatively smaller size and lesser liquidity of these markets, and less effective or irregular government supervision and regulation of business and industry practices. The Fund’s prospectus also includes a description of the main investment risks.
TD-2
Latin American markets benefited from strong commodity prices, solid domestic demand and smooth power transitions in the region’s key
economies. International confidence in the region, especially in Brazil, remained high. A loosening monetary policy, growing foreign reserves and repayment of debt to foreign lenders further supported the Brazilian market.
Asian giants China and India continued to report strong economic growth, which led to significant fund inflows that pushed markets to record highs. Elsewhere in the region, Thailand and South Korea struggled with strong local currencies, which threatened to erode their export competitiveness. North Korea’s nuclear test in October exposed the region to geopolitical tensions. However, the resumption of six-party talks could yield some positive results in the longer term. Although a military coup and capital controls in Thailand initially rattled investor confidence in the nation’s financial markets, we continued to search for opportunities among Thai equities.
Investment Strategy
Our investment philosophy is bottom-up, value-oriented and long-term. In choosing investments, we may make onsite visits to companies to assess critical factors such as management strength and local conditions. In addition, we focus on the market price of a company’s securities relative to our evaluation of the company’s potential long-term (typically five years) earnings, asset value, cash flow and balance sheet. Among factors we consider are a company’s historical value measures, including price/earnings ratio, book value, profit margins and liquidation value. We perform in-depth research to construct an action list from which we make our investment decisions.
Manager’s Discussion
During the 12 months under review, relative to the MSCI EM index, the Fund’s performance benefited from underweighted exposure to Israel and exposure to Croatia (not in the index). Stock selection in South Africa, with the Fund’s overweighted exposure to non-index holdings Anglo American and Remgro, benefited the Fund’s relative performance. An underweighted position in Sasol also had a positive impact. In Israel, the largest contributor to performance was the Fund’s underweighted position in Teva Pharmaceutical. The Fund only held one Croatian stock, Pliva, which outperformed the index and contributed to relative performance. At the sector level, stock selection in the pharmaceuticals and biotechnology, automobiles, and components and
TD-3
diversified financials sectors contributed to relative Fund performance during the period.3 The Fund also benefited from an underweighted position in the technology hardware and equipment sector, which underperformed the broader MSCI EM index.4
It is important to recognize the effect of currency movements on the Fund’s performance. In general, if the value of the U.S. dollar goes up compared with a foreign currency, an investment traded in that foreign currency will go down in value because it will be worth fewer U.S. dollars. This can have a negative effect on Fund performance. Conversely, when the U.S. dollar weakens in relation to a foreign currency, an investment traded in that foreign currency will increase in value, which can contribute to Fund performance. For the 12 months ended December 31, 2006, the U.S. dollar declined in value relative to most non-U.S. currencies. As a result, the Fund’s performance was positively affected by the portfolio’s investment predominantly in securities with non-U.S. currency exposure. However, one cannot expect the same result in future periods.
Conversely, the Fund’s underweighted exposure to India and overweighted exposure to Turkey detracted from Fund returns relative to the index. The Fund’s positions in Poland and China also detracted from relative performance mainly due to an overweighted position in underperforming Telekomunikacja Polska and an underweighted position in China Life Insurance, which significantly outperformed the MSCI EM index. Overweighted positions in Turkish companies Arcelik, Turkiye Vakiflar Bankasi (Vakifbank) and Tupras-Turkiye Petrol Rafineleri (Tupras) negatively affected relative performance as these stocks declined in value during the reporting period. Despite a small decline for the year under review, the Turkish market actually rebounded more than 20% after a June correction. Moreover, we believed these companies’ valuations generally remained attractive, so we increased some of our holdings at lower prices during the year. By industry, the Fund’s positions in the banks, capital goods and insurance industries had a negative impact on relative performance partly due to overweighted positions in stocks such as KOC Holding and Old Mutual, as well as a position in HSBC Holdings, which is not an index component.5
3. The pharmaceuticals and biotechnology sector comprises pharmaceuticals in the SOI. The automobiles and components sector comprises automobiles in the SOI. The diversified financials sector comprises consumer finance and diversified financial services in the SOI.
4. The technology hardware and equipment sector comprises communications equipment, computers and peripherals, and electronic equipment and instruments in the SOI.
5. The banks sector comprises commercial banks in the SOI. The capital goods sector comprises building products, construction and engineering, construction materials and industrial conglomerates in the SOI.
Top 10 Holdings
Templeton Developing Markets Securities Fund
12/31/06
| | |
Company
Sector/Industry,
Country | | % of Total
Net Assets |
| Samsung Electronics Co. Ltd. | | 4.4% |
| Semiconductors & Semiconductor Equipment, South Korea | | |
| PetroChina Co. Ltd. | | 4.3% |
| Oil, Gas & Consumable Fuels, China | | |
| Petroleo Brasileiro SA, ADR, pfd. | | 3.3% |
| Oil, Gas & Consumable Fuels, Brazil | | |
| Remgro Ltd. | | 3.0% |
| Diversified Financial Services, South Africa | | |
| Gazprom | | 3.0% |
| Oil, Gas & Consumable Fuels, Russia | | |
| Akbank TAS | | 2.7% |
| Commercial Banks, Turkey | | |
| Old Mutual PLC | | 2.6% |
| Insurance, South Africa | | |
| Taiwan Semiconductor Manufacturing Co. Ltd. | | 2.4% |
| Semiconductors & Semiconductor Equipment, Taiwan | | |
| Anglo American PLC | | 2.2% |
| Metals & Mining, South Africa | | |
| LUKOIL, ADR | | 2.0% |
| Oil, Gas & Consumable Fuels, Russia | | |
The dollar value, number of shares or principal amount, and names of all portfolio holdings are listed in the Fund’s Statement of Investments (SOI).
TD-4
The Fund increased its exposure to Eastern and Southern Europe during the year under review. More specifically, we increased our allocations in Turkey, Russia, Hungary and Austria. Turkish investments included major commercial banks Akbank and Vakifbank; Tupras, the country’s largest industrial company with a dominant market share in oil refining; and Turkcell, a leading provider of mobile communications services. Turkey’s financial market correction lowered valuations and provided the Fund with an opportunity to build positions at what we considered attractive prices. The Fund also purchased MOL Magyar Olaj-es Gazipari, a Hungarian integrated oil and gas company with large exposure to Central and Eastern Europe; Russia’s Gazprom, the world’s largest gas producer in terms of reserves and production; and Austria’s OMV, one of the leading oil and gas groups in Central and Eastern Europe.
We also significantly increased our investments in South Africa during the reporting period. The Fund increased its holdings in consumer sectors such as insurance, wireless telecommunications, banking, home furnishing and retail clothing. Significant additions included Old Mutual, a major financial services group involved in life insurance, short-term insurance, asset management and banking; MTN Group, a dominant wireless telecommunications services provider in Africa; JD Group, the country’s leading furniture retailer; and Edgars Consolidated Stores, a leading specialty fashion retailer in southern Africa. Higher disposable incomes and strong consumer demand could lead to greater consumption of the products and services offered by these sectors of the economy.
We also undertook selective investments in Israel, Brazil and Pakistan. Purchases included Petroleo Brasileiro, Brazil’s national oil and gas company; Teva Pharmaceutical, which is among the world’s largest generic pharmaceutical companies; and Pakistan Telecommunications, the country’s dominant integrated telecommunication services provider.
The Fund increased its exposure to the oil, gas and consumable fuels industry. We believe energy stocks will benefit from greater revenues and earnings due to relatively higher oil prices in recent years. The correction in commodity prices during the year provided the Fund with an opportunity to build positions at lower prices. The consumer finance and banking industries also helped performance. We believe higher incomes, credit growth and greater demand for financial services should benefit banks. The Fund also invested in semiconductors and computer hardware companies in an attempt to benefit from greater export demand for Asian information technology products.
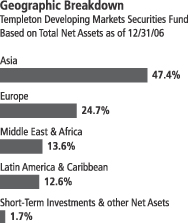
Top 10 Countries
Templeton Developing Markets Securities Fund
12/31/06
| | |
| | | % of Total
Net Assets |
| South Korea | | 15.0% |
| South Africa | | 13.1% |
| Taiwan | | 12.3% |
| China | | 11.5% |
| Brazil | | 9.9% |
| Russia | | 8.7% |
| Turkey | | 7.9% |
| Hungary | | 3.5% |
| Thailand | | 2.7% |
| Mexico | | 2.3% |
TD-5
On the other hand, we substantially reduced the Fund’s holdings in Singapore and South Korea as certain stocks reached their sell targets. Specific sales included Daewoo Shipping, South Korea’s major shipbuilder; CJ Corporation, a prominent integrated food maker in South Korea; Singapore Telecom, a leading integrated telecommunications services provider in Singapore; and shares of Fraser and Neave, a dominant player in the Singapore soft drinks and beer market. One of the largest sales during the year was Pliva, a Croatian pharmaceutical company. We sold our Pliva shares after the company was the subject of a takeover battle and the share price went far above our sell limit. We also sold stocks selectively in Mexico, India and China as the Fund continued to realign its exposure seeking to benefit from the continued economic recovery in emerging markets.
Thank you for your participation in Templeton Developing Markets Securities Fund. We look forward to serving your future investment needs.
The foregoing information reflects our analysis, opinions and portfolio holdings as of December 31, 2006, the end of the reporting period. The way we implement our main investment strategies and the resulting portfolio holdings may change depending on factors such as market and economic conditions. These opinions may not be relied upon as investment advice or an offer for a particular security. The information is not a complete analysis of every aspect of any market, country, industry, security or the Fund. Statements of fact are from sources considered reliable, but the investment manager makes no representation or warranty as to their completeness or accuracy. Although historical performance is no guarantee of future results, these insights may help you understand our investment management philosophy.
TD-6
Fund Expenses
As an investor in a variable insurance contract (“Contract”) that indirectly provides for investment in an underlying mutual fund, you can incur transaction and/or ongoing expenses at both the Fund level and the Contract level.
| • | | Transaction expenses can include sales charges (loads) on purchases, redemption fees, surrender fees, transfer fees and premium taxes. |
| • | | Ongoing expenses can include management fees, distribution and service (12b-1) fees, contract fees, annual maintenance fees, mortality and expense risk fees and other fees and expenses. All mutual funds and Contracts have some types of ongoing expenses. |
The expenses shown in the table are meant to highlight ongoing expenses at the Fund level only and do not include ongoing expenses at the Contract level, or transaction expenses at either the Fund or Contract level. While the Fund does not have transaction expenses, if the transaction and ongoing expenses at the Contract level were included, the expenses shown would be higher. You should consult your Contract prospectus or disclosure document for more information.
The table shows Fund-level ongoing expenses and can help you understand these expenses and compare them with those of other mutual funds offered through the Contract. The table assumes a $1,000 investment held for the six months indicated. Please refer to the Fund prospectus for additional information on operating expenses.
Actual Fund Expenses
The first line (Actual) of the table provides actual account values and expenses. The “Ending Account Value” is derived from the Fund’s actual return, which includes the effect of ongoing Fund expenses, but does not include the effect of ongoing Contract expenses.
You can estimate the Fund-level expenses you incurred during the period by following these steps. Of course, your account value and expenses will differ from those in this illustration:
| 1. | Divide your account value by $1,000. |
If an account had an $8,600 value, then $8,600 ÷ $1,000 = 8.6.
| 2. | Multiply the result by the number under the heading “Fund-Level Expenses Incurred During Period.” |
If Fund-Level Expenses Incurred During Period were $7.50, then 8.6 x $7.50 = $64.50.
In this illustration, the estimated expenses incurred this period at the Fund level are $64.50.
Templeton Developing Markets Securities Fund Class 3
TD-7
Hypothetical Example for Comparison with Other Mutual Funds
Information in the second line (Hypothetical) of the table can help you compare ongoing expenses of the Fund with those of other mutual funds offered through the Contract. This information may not be used to estimate the actual ending account balance or expenses you incurred during the period. The hypothetical “Ending Account Value” is based on the Fund’s actual expense ratio and an assumed 5% annual rate of return before expenses, which does not represent the Fund’s actual return. The figure under the heading “Fund-Level Expenses Incurred During Period” shows the hypothetical expenses your account would have incurred under this scenario. You can compare this figure with the 5% hypothetical examples that appear in shareholder reports of other funds offered through a Contract.
| | | | | | | | | |
| Class 3 | | Beginning
Account
Value 7/1/06 | | Ending
Account
Value 12/31/06 | | Fund-Level
Expenses Incurred
During Period*
7/1/06-12/31/06 |
Actual | | $ | 1,000 | | $ | 1,210.90 | | $ | 9.70 |
Hypothetical (5% return before expenses) | | $ | 1,000 | | $ | 1,016.43 | | $ | 8.84 |
*Expenses are equal to the annualized expense ratio for the Fund’s Class 3 shares (1.74%), which does not include any ongoing expenses of the Contract for which the Fund is an investment option, multiplied by the average account value over the period, multiplied by 184/365 to reflect the one-half year period.
TD-8
Franklin Templeton Variable Insurance Products Trust
Financial Highlights
Templeton Developing Markets Securities Fund
| | | | | | | | | | | | | | | | | | | | |
| | | Year Ended December 31, | |
| Class 1 | | 2006 | | | 2005 | | | 2004 | | | 2003 | | | 2002 | |
| | | | |
Per share operating performance | | | | | | | | | | | | | | | | | | | | |
(for a share outstanding throughout the year) | | | | | | | | | | | | | | | | | | | | |
Net asset value, beginning of year | | $ | 10.99 | | | $ | 8.73 | | | $ | 7.14 | | | $ | 4.71 | | | $ | 4.78 | |
| | | | |
Income from investment operationsa: | | | | | | | | | | | | | | | | | | | | |
Net investment incomeb | | | 0.24 | | | | 0.17 | | | | 0.11 | | | | 0.13 | | | | 0.07 | |
Net realized and unrealized gains (losses) | | | 2.84 | | | | 2.23 | | | | 1.62 | | | | 2.38 | | | | (0.06 | ) |
| | | | |
Total from investment operations | | | 3.08 | | | | 2.40 | | | | 1.73 | | | | 2.51 | | | | 0.01 | |
| | | | |
Less distributions from net investment income | | | (0.15 | ) | | | (0.14 | ) | | | (0.14 | ) | | | (0.08 | ) | | | (0.08 | ) |
| | | | |
Redemption fees | | | — | d | | | — | d | | | — | | | | — | | | | — | |
| | | | |
Net asset value, end of year | | $ | 13.92 | | | $ | 10.99 | | | $ | 8.73 | | | $ | 7.14 | | | $ | 4.71 | |
| | | | |
| | | | | |
Total returnc | | | 28.43% | | | | 27.76% | | | | 24.83% | | | | 53.74% | | | | 0.04% | |
Ratios/supplemental data | | | | | | | | | | | | | | | | | | | | |
Net assets, end of year (000’s) | | $ | 749,120 | | | $ | 651,826 | | | $ | 477,290 | | | $ | 359,299 | | | $ | 225,454 | |
Ratios to average net assets: | | | | | | | | | | | | | | | | | | | | |
Expenses | | | 1.47% | e | | | 1.53% | e | | | 1.54% | e | | | 1.55% | | | | 1.58% | |
Net investment income | | | 1.93% | | | | 1.77% | | | | 1.52% | | | | 2.35% | | | | 1.45% | |
Portfolio turnover rate | | | 53.65% | | | | 31.24% | | | | 55.67% | | | | 46.20% | | | | 57.91% | |
| a | The amount shown for a share outstanding throughout the period may not correlate with the Statement of Operations for the period due to the timing of sales and repurchase of the Fund shares in relation to income earned and/or fluctuating market value of the investments of the Fund. |
| b | Based on average daily shares outstanding. |
| c | Total return does not include any fees, charges or expenses imposed by the variable annuity and life insurance contracts for which the Franklin Templeton Variable Insurance Products Trust serves as an underlying investment vehicle. |
| d | Amount rounds to less than $0.01 per share. |
| e | Benefit of expense reduction rounds to less than 0.01%. |
The accompanying notes are an integral part of these financial statements.
TD-9
Franklin Templeton Variable Insurance Products Trust
Financial Highlights (continued)
Templeton Developing Markets Securities Fund
| | | | | | | | | | | | | | | | | | | | |
| | | Year Ended December 31, | |
| Class 2 | | 2006 | | | 2005 | | | 2004 | | | 2003 | | | 2002 | |
| | | | |
Per share operating performance | | | | | | | | | | | | | | | | | | | | |
(for a share outstanding throughout the year) | | | | | | | | | | | | | | | | | | | | |
Net asset value, beginning of year | | $ | 10.90 | | | $ | 8.67 | | | $ | 7.09 | | | $ | 4.69 | | | $ | 4.76 | |
| | | | |
Income from investment operationsa: | | | | | | | | | | | | | | | | | | | | |
Net investment incomeb | | | 0.20 | | | | 0.14 | | | | 0.09 | | | | 0.11 | | | | 0.06 | |
Net realized and unrealized gains (losses) | | | 2.82 | | | | 2.21 | | | | 1.63 | | | | 2.35 | | | | (0.06 | ) |
| | | | |
Total from investment operations | | | 3.02 | | | | 2.35 | | | | 1.72 | | | | 2.46 | | | | — | |
| | | | |
Less distributions from net investment income | | | (0.13 | ) | | | (0.12 | ) | | | (0.14 | ) | | | (0.06 | ) | | | (0.07 | ) |
| | | | |
Redemption fees | | | — | d | | | — | d | | | — | | | | — | | | | — | |
| | | | |
Net asset value, end of year | | $ | 13.79 | | | $ | 10.90 | | | $ | 8.67 | | | $ | 7.09 | | | $ | 4.69 | |
| | | | |
| | | | | |
Total returnc | | | 28.09% | | | | 27.43% | | | | 24.71% | | | | 52.99% | | | | (0.15)% | |
Ratios/supplemental data | | | | | | | | | | | | | | | | | | | | |
Net assets, end of year (000’s) | | $ | 857,514 | | | $ | 650,646 | | | $ | 327,569 | | | $ | 170,953 | | | $ | 80,952 | |
Ratios to average net assets: | | | | | | | | | | | | | | | | | | | | |
Expenses | | | 1.72% | e | | | 1.78% | e | | | 1.79% | e | | | 1.80% | | | | 1.83% | |
Net investment income | | | 1.68% | | | | 1.52% | | | | 1.27% | | | | 2.10% | | | | 1.20% | |
Portfolio turnover rate | | | 53.65% | | | | 31.24% | | | | 55.67% | | | | 46.20% | | | | 57.91% | |
| a | The amount shown for a share outstanding throughout the period may not correlate with the Statement of Operations for the period due to the timing of sales and repurchase of the Fund shares in relation to income earned and/or fluctuating market value of the investments of the Fund. |
| b | Based on average daily shares outstanding. |
| c | Total return does not include any fees, charges or expenses imposed by the variable annuity and life insurance contracts for which the Franklin Templeton Variable Insurance Products Trust serves as an underlying investment vehicle. |
| d | Amount rounds to less than $0.01 per share. |
| e | Benefit of expense reduction rounds to less than 0.01%. |
The accompanying notes are an integral part of these financial statements.
TD-10
Franklin Templeton Variable Insurance Products Trust
Financial Highlights (continued)
Templeton Developing Markets Securities Fund
| | | | | | | | | | | | |
| | | Year Ended December 31, | |
| Class 3 | | 2006 | | | 2005 | | | 2004f | |
| | | | |
Per share operating performance | | | | | | | | | | | | |
(for a share outstanding throughout the year) | | | | | | | | | | | | |
Net asset value, beginning of year | | $ | 10.90 | | | $ | 8.68 | | | $ | 7.13 | |
| | | | |
Income from investment operationsa: | | | | | | | | | | | | |
Net investment incomeb | | | 0.20 | | | | 0.04 | | | | 0.08 | |
Net realized and unrealized gains (losses) | | | 2.83 | | | | 2.32 | | | | 1.61 | |
| | | | |
Total from investment operations | | | 3.03 | | | | 2.36 | | | | 1.69 | |
| | | | |
Less distributions from net investment income | | | (0.15 | ) | | | (0.14 | ) | | | (0.14 | ) |
| | | | |
Redemption fees | | | — | d | | | — | d | | | — | |
| | | | |
Net asset value, end of year | | $ | 13.78 | | | $ | 10.90 | | | $ | 8.68 | |
| | | | |
| | | |
Total returnc | | | 28.17% | | | | 27.45% | | | | 24.15% | |
Ratios/supplemental data | | | | | | | | | | | | |
Net assets, end of year (000’s) | | $ | 43,372 | | | $ | 11,521 | | | $ | 12 | |
Ratios to average net assets: | | | | | | | | | | | | |
Expenses | | | 1.72% | e | | | 1.78% | e | | | 1.54% | e,g |
Net investment income | | | 1.68% | | | | 1.52% | | | | 1.52% | g |
Portfolio turnover rate | | | 53.65% | | | | 31.24% | | | | 55.67% | |
| a | The amount shown for a share outstanding throughout the period may not correlate with the Statement of Operations for the period due to the timing of sales and repurchase of the Fund shares in relation to income earned and/or fluctuating market value of the investments of the Fund. |
| b | Based on average daily shares outstanding. |
| c | Total return does not include any fees, charges or expenses imposed by the variable annuity and life insurance contracts for which the Franklin Templeton Variable Insurance Products Trust serves as an underlying investment vehicle. Total return is not annualized for periods less than one year. |
| d | Amount rounds to less than $0.01 per share. |
| e | Benefit of expense reduction rounds to less than 0.01%. |
| f | For the period May 1, 2004 (effective date) to December 31, 2004. |
The accompanying notes are an integral part of these financial statements.
TD-11
Franklin Templeton Variable Insurance Products Trust
Statement of Investments, December 31, 2006
| | | | | | | |
| Templeton Developing Markets Securities Fund | | Industry | | Shares/
Rights | | Value |
Long Term Investments 98.3% | | | | | | | |
Austria 0.8% | | | | | | | |
OMV AG | | Oil, Gas & Consumable Fuels | | 83,060 | | $ | 4,713,568 |
Wienerberger AG | | Building Products | | 155,800 | | | 9,254,870 |
| | | | | | | |
| | | | | | | 13,968,438 |
| | | | | | | |
Brazil 9.9% | | | | | | | |
Banco Bradesco SA, ADR, pfd. | | Commercial Banks | | 728,772 | | | 29,405,950 |
Centrais Eletricas Brasileiras SA | | Electric Utilities | | 411,324,764 | | | 9,835,984 |
Companhia Vale do Rio Doce, ADR, pfd., A | | Metals & Mining | | 1,263,350 | | | 33,162,938 |
CPFL Energia SA | | Electric Utilities | | 409,872 | | | 5,755,282 |
Petroleo Brasileiro SA, ADR, pfd. | | Oil, Gas & Consumable Fuels | | 582,022 | | | 53,988,361 |
Souza Cruz SA | | Tobacco | | 639,338 | | | 11,386,291 |
Unibanco-Uniao de Bancos Brasileiros SA, GDR, pfd. | | Commercial Banks | | 221,000 | | | 20,544,160 |
| | | | | | | |
| | | | | | | 164,078,966 |
| | | | | | | |
China 11.5% | | | | | | | |
Aluminum Corp. of China Ltd., H | | Metals & Mining | | 27,316,000 | | | 25,282,351 |
aChina Coal Energy Co., H | | Oil, Gas & Consumable Fuels | | 2,739,000 | | | 1,778,080 |
a,bChina Coal Energy Co., H, 144A | | Oil, Gas & Consumable Fuels | | 1,076,000 | | | 698,508 |
China Mobile Ltd. | | Wireless Telecommunication Services | | 1,901,113 | | | 16,422,719 |
China Petroleum and Chemical Corp., H | | Oil, Gas & Consumable Fuels | | 19,412,000 | | | 17,966,796 |
China Shenhua Energy Co. Ltd., H | | Oil, Gas & Consumable Fuels | | 827,000 | | | 1,990,120 |
Citic Pacific Ltd. | | Industrial Conglomerates | | 878,959 | | | 3,033,757 |
CNOOC Ltd. | | Oil, Gas & Consumable Fuels | | 33,668,000 | | | 31,983,767 |
Denway Motors Ltd. | | Automobiles | | 18,950,234 | | | 7,673,491 |
PetroChina Co. Ltd., H | | Oil, Gas & Consumable Fuels | | 42,498,000 | | | 60,202,973 |
bPetroChina Co. Ltd., H, 144A | | Oil, Gas & Consumable Fuels | | 7,682,000 | | | 10,882,376 |
Shanghai Industrial Holdings Ltd. | | Industrial Conglomerates | | 3,999,000 | | | 8,512,940 |
Travelsky Technology Ltd., H | | IT Services | | 2,253,000 | | | 3,434,897 |
| | | | | | | |
| | | | | | | 189,862,775 |
| | | | | | | |
Czech Republic 0.2% | | | | | | | |
Philip Morris CR AS | | Tobacco | | 6,115 | | | 3,181,502 |
| | | | | | | |
Hong Kong 1.0% | | | | | | | |
Cheung Kong (Holdings) Ltd. | | Real Estate Management & Development | | 618,000 | | | 7,606,679 |
Cheung Kong Infrastructure Holdings Ltd. | | Electric Utilities | | 524,000 | | | 1,626,733 |
Dairy Farm International Holdings Ltd. | | Food & Staples Retailing | | 426,933 | | | 1,451,572 |
Hopewell Holdings Ltd. | | Transportation Infrastructure | | 724,000 | | | 2,540,792 |
MTR Corp. Ltd. | | Road & Rail | | 1,539,370 | | | 3,870,613 |
| | | | | | | |
| | | | | | | 17,096,389 |
| | | | | | | |
Hungary 3.5% | | | | | | | |
aMagyar Telekom PLC | | Diversified Telecommunication Services | | 2,692,482 | | | 14,957,841 |
MOL Magyar Olaj-es Gazipari Rt. | | Oil, Gas & Consumable Fuels | | 193,095 | | | 21,900,559 |
OTP Bank Nyrt. | | Commercial Banks | | 306,270 | | | 14,071,582 |
Richter Gedeon Nyrt. | | Pharmaceuticals | | 32,556 | | | 7,425,937 |
| | | | | | | |
| | | | | | | 58,355,919 |
| | | | | | | |
India 1.6% | | | | | | | |
Gail India Ltd. | | Gas Utilities | | 867,330 | | | 5,142,245 |
Indian Oil Corp. Ltd. | | Oil, Gas & Consumable Fuels | | 426,373 | | | 4,349,749 |
Oil & Natural Gas Corp. Ltd. | | Oil, Gas & Consumable Fuels | | 669,418 | | | 13,202,474 |
TD-12
Franklin Templeton Variable Insurance Products Trust
Statement of Investments, December 31, 2006 (continued)
| | | | | | | |
| Templeton Developing Markets Securities Fund | | Industry | | Shares/
Rights | | Value |
Long Term Investments (continued) | | | | | | | |
India (continued) | | | | | | | |
bOil & Natural Gas Corp. Ltd., 144A | | Oil, Gas & Consumable Fuels | | 193,545 | | $ | 3,817,156 |
Tata Chemicals Ltd. | | Chemicals | | 57,000 | | | 278,507 |
| | | | | | | |
| | | | | | | 26,790,131 |
| | | | | | | |
Indonesia 0.3% | | | | | | | |
PT Astra International Tbk | | Automobiles | | 2,577,500 | | | 4,499,555 |
| | | | | | | |
Israel 0.6% | | | | | | | |
aTaro Pharmaceutical Industries Ltd. | | Pharmaceuticals | | 306,702 | | | 3,067,020 |
Teva Pharmaceutical Industries Ltd., ADR | | Pharmaceuticals | | 205,240 | | | 6,378,859 |
| | | | | | | |
| | | | | | | 9,445,879 |
| | | | | | | |
Malaysia 1.3% | | | | | | | |
Maxis Communications Bhd. | | Wireless Telecommunication Services | | 5,093,500 | | | 14,717,762 |
Sime Darby Bhd. | | Industrial Conglomerates | | 3,660,700 | | | 7,466,584 |
| | | | | | | |
| | | | | | | 22,184,346 |
| | | | | | | |
Mexico 2.3% | | | | | | | |
Grupo Bimbo SA de CV, A | | Food Products | | 668,764 | | | 3,342,969 |
Kimberly Clark de Mexico SA de CV, A | | Household Products | | 4,538,033 | | | 20,962,056 |
Telefonos de Mexico SA de CV, L, ADR | | Diversified Telecommunication Services | | 474,564 | | | 13,411,178 |
| | | �� | | | | |
| | | | | | | 37,716,203 |
| | | | | | | |
Pakistan 0.3% | | | | | | | |
cPakistan Telecommunications Corp., A | | Diversified Telecommunication Services | | 6,012,103 | | | 4,381,250 |
| | | | | | | |
Panama 0.2% | | | | | | | |
Banco Latinoamericano de Exportaciones SA, E | | Commercial Banks | | 230,200 | | | 3,904,192 |
| | | | | | | |
Peru 0.1% | | | | | | | |
Compania de Minas Buenaventura SA, ADR | | Metals & Mining | | 58,100 | | | 1,630,286 |
| | | | | | | |
Philippines 0.4% | | | | | | | |
San Miguel Corp., B | | Beverages | | 4,239,593 | | | 6,698,643 |
| | | | | | | |
Poland 0.6% | | | | | | | |
aGrupa Lotos SA | | Oil, Gas & Consumable Fuels | | 86,100 | | | 1,462,036 |
Polski Koncern Naftowy Orlen SA | | Oil, Gas & Consumable Fuels | | 461,144 | | | 7,576,403 |
| | | | | | | |
| | | | | | | 9,038,439 |
| | | | | | | |
Russia 8.7% | | | | | | | |
bEvraz Group SA, GDR, 144A | | Metals & Mining | | 60,000 | | | 1,521,000 |
Gazprom | | Oil, Gas & Consumable Fuels | | 657,910 | | | 7,565,965 |
Gazprom, ADR | | Oil, Gas & Consumable Fuels | | 895,426 | | | 41,189,596 |
LUKOIL, ADR | | Oil, Gas & Consumable Fuels | | 383,176 | | | 33,490,446 |
Mining and Metallurgical Co. Norilsk Nickel | | Metals & Mining | | 130,562 | | | 20,498,234 |
Mobile Telesystems, ADR | | Wireless Telecommunication Services | | 143,300 | | | 7,192,227 |
a,bOAO TMK, 144A | | Energy Equipment & Services | | 184,274 | | | 1,529,474 |
TNK-BP | | Oil, Gas & Consumable Fuels | | 1,648,000 | | | 4,276,560 |
Unified Energy Systems | | Electric Utilities | | 21,157,300 | | | 22,849,884 |
aZAO Polyus Gold Co. | | Metals & Mining | | 56,819 | | | 2,801,177 |
| | | | | | | |
| | | | | | | 142,914,563 |
| | | | | | | |
TD-13
Franklin Templeton Variable Insurance Products Trust
Statement of Investments, December 31, 2006 (continued)
| | | | | | | |
| Templeton Developing Markets Securities Fund | | Industry | | Shares/
Rights | | Value |
Long Term Investments (continued) | | | | | | | |
Singapore 0.9% | | | | | | | |
ComfortDelGro Corp. Ltd. | | Road & Rail | | 6,447,000 | | $ | 6,768,835 |
Fraser and Neave Ltd. | | Industrial Conglomerates | | 3,005,005 | | | 8,818,365 |
| | | | | | | |
| | | | | | | 15,587,200 |
| | | | | | | |
South Africa 13.1% | | | | | | | |
Anglo American PLC | | Metals & Mining | | 754,236 | | | 36,803,811 |
Edgars Consolidated Stores Ltd. | | Specialty Retail | | 2,467,356 | | | 13,733,056 |
aImperial Holdings Ltd. | | Air Freight & Logistics | | 662,735 | | | 15,506,604 |
JD Group Ltd. | | Specialty Retail | | 847,960 | | | 9,624,429 |
Massmart Holdings Ltd. | | Food & Staples Retailing | | 106,590 | | | 1,067,611 |
MTN Group Ltd. | | Wireless Telecommunication Services | | 1,823,400 | | | 22,191,692 |
Nedbank Group Ltd. | | Commercial Banks | | 1,043,947 | | | 19,884,705 |
Old Mutual PLC | | Insurance | | 12,583,248 | | | 42,939,384 |
Remgro Ltd. | | Diversified Financial Services | | 1,919,805 | | | 48,759,692 |
Standard Bank Group Ltd. | | Commercial Banks | | 381,892 | | | 5,149,106 |
| | | | | | | |
| | | | | | | 215,660,090 |
| | | | | | | |
South Korea 15.0% | | | | | | | |
aGS Holdings Corp. | | Oil, Gas & Consumable Fuels | | 273,800 | | | 8,861,699 |
Hana Financial Group Inc. | | Commercial Banks | | 452,748 | | | 23,805,782 |
aHite Brewery Co. Ltd. | | Beverages | | 33,452 | | | 4,298,402 |
aHyundai Development Co. | | Construction & Engineering | | 259,620 | | | 15,856,361 |
aKangwon Land Inc. | | Hotels Restaurants & Leisure | | 1,267,005 | | | 27,519,894 |
LG Card Co. Ltd. | | Consumer Finance | | 358,580 | | | 23,866,776 |
aLG Corp. | | Industrial Conglomerates | | 93,390 | | | 2,997,518 |
aLotte Shopping Co. Ltd. | | Multiline Retail | | 36,570 | | | 15,178,516 |
Samsung Electronics Co. Ltd. | | Semiconductors & Semiconductor Equipment | | 109,028 | | | 71,864,692 |
Samsung Fine Chemicals Co. Ltd. | | Chemicals | | 12,670 | | | 317,431 |
aShinhan Financial Group Co. Ltd. | | Commercial Banks | | 331,000 | | | 16,905,914 |
aSK Corp. | | Oil, Gas & Consumable Fuels | | 248,030 | | | 19,469,022 |
SK Telecom Co. Ltd. | | Wireless Telecommunication Services | | 70,760 | | | 16,929,140 |
| | | | | | | |
| | | | | | | 247,871,147 |
| | | | | | | |
Sweden 0.9% | | | | | | | |
Oriflame Cosmetics SA, SDR | | Personal Products | | 354,688 | | | 14,599,197 |
| | | | | | | |
Taiwan 12.3% | | | | | | | |
Asustek Computer Inc. | | Computers & Peripherals | | 6,387,900 | | | 17,486,594 |
Chunghwa Telecom Co. Ltd. | | Diversified Telecommunication Services | | 6,265,860 | | | 11,652,942 |
D-Link Corp. | | Communications Equipment | | 7,292,411 | | | 9,556,113 |
Lite-On Technology Corp. | | Computers & Peripherals | | 9,937,092 | | | 13,433,448 |
MediaTek Inc. | | Semiconductors & Semiconductor Equipment | | 737,770 | | | 7,630,152 |
Mega Financial Holding Co. Ltd. | | Commercial Banks | | 24,442,503 | | | 17,965,259 |
President Chain Store Corp. | | Food & Staples Retailing | | 5,007,144 | | | 12,093,363 |
Realtek Semiconductor Corp. | | Semiconductors & Semiconductor Equipment | | 8,893,772 | | | 15,311,972 |
Siliconware Precision Industries Co. | | Semiconductors & Semiconductor Equipment | | 4,144,521 | | | 6,512,183 |
Sunplus Technology Co. Ltd. | | Semiconductors & Semiconductor Equipment | | 9,746,972 | | | 11,890,199 |
Synnex Technology International Corp. | | Electronic Equipment & Instruments | | 5,286,936 | | | 6,684,725 |
Taiwan Mobile Co. Ltd. | | Wireless Telecommunication Services | | 16,249,302 | | | 16,855,191 |
Taiwan Semiconductor Manufacturing Co. Ltd. | | Semiconductors & Semiconductor Equipment | | 19,298,004 | | | 39,975,917 |
United Microelectronics Corp. | | Semiconductors & Semiconductor Equipment | | 18,554,000 | | | 11,530,413 |
aYageo Corp. | | Electronic Equipment & Instruments | | 7,495,000 | | | 3,496,210 |
| | | | | | | |
| | | | | | | 202,074,681 |
| | | | | | | |
TD-14
Franklin Templeton Variable Insurance Products Trust
Statement of Investments, December 31, 2006 (continued)
| | | | | | | | |
| Templeton Developing Markets Securities Fund | | Industry | | Shares/
Rights | | Value |
Long Term Investments (continued) | | | | | | | | |
Thailand 2.7% | | | | | | | | |
Kasikornbank Public Co. Ltd., fgn. | | Commercial Banks | | | 6,272,600 | | $ | 11,058,886 |
PTT Public Co. Ltd., fgn. | | Oil, Gas & Consumable Fuels | | | 880,000 | | | 5,212,976 |
Siam Cement Public Co. Ltd., fgn. | | Construction Materials | | | 1,736,714 | | | 12,443,593 |
Siam Commercial Bank Public Co. Ltd., fgn. | | Commercial Banks | | | 4,325,000 | | | 7,076,164 |
Thai Airways International Public Co. Ltd., fgn. | | Airlines | | | 3,900,700 | | | 4,896,506 |
Thai Beverages Co. Ltd., fgn. | | Beverages | | | 17,228,000 | | | 3,033,395 |
aTrue Corp. Public Co. Ltd., fgn., rts., 3/28/08 | | Diversified Telecommunication Services | | | 344,616 | | | — |
| | | | | | | | |
| | | | | | | | 43,721,520 |
| | | | | | | | |
Turkey 7.9% | | | | | | | | |
Akbank TAS | | Commercial Banks | | | 7,419,776 | | | 45,079,529 |
Anadolu Efes Biracilik Ve Malt Sanayii AS | | Beverages | | | 19,690 | | | 608,575 |
Arcelik AS, Br. | | Household Durables | | | 2,342,781 | | | 13,820,008 |
aKOC Holding AS | | Industrial Conglomerates | | | 793,245 | | | 3,082,195 |
aMigros Turk TAS | | Food & Staples Retailing | | | 63,956 | | | 826,842 |
Tupras-Turkiye Petrol Rafineleri AS | | Oil, Gas & Consumable Fuels | | | 1,353,260 | | | 23,135,918 |
aTurk Hava Yollari Anonim Ortakligi | | Airlines | | | 420,000 | | | 1,809,961 |
a,bTurk Hava Yollari Anonim Ortakligi, 144A | | Airlines | | | 1,785,000 | | | 7,692,335 |
Turkcell Iletisim Hizmetleri AS | | Wireless Telecommunication Services | | | 3,706,728 | | | 18,723,494 |
Turkiye Vakiflar Bankasi T.A.O. | | Commercial Banks | | | 3,167,635 | | | 14,881,507 |
| | | | | | | | |
| | | | | | | | 129,660,364 |
| | | | | | | | |
United Kingdom 2.2% | | | | | | | | |
HSBC Holdings PLC | | Commercial Banks | | | 1,103,488 | | | 20,228,095 |
Provident Financial PLC | | Consumer Finance | | | 1,163,037 | | | 15,977,598 |
| | | | | | | | |
| | | | | | | | 36,205,693 |
| | | | | | | | |
Total Long Term Investments
(Cost $1,109,626,099) | | | | | | | | 1,621,127,368 |
| | | | | | | | |
| | | |
| | | | | Principal
Amount | | |
Short Term Investment (Cost $28,752,657) 1.7% | | | | | | | | |
U.S. Government and Agency Securities 1.7% | | | | | | | | |
dFHLB, 1/02/07 | | | | $ | 28,768,000 | | | 28,768,000 |
| | | | | | | | |
Total Investments (Cost $1,138,378,756) 100.0% | | | | | | | | 1,649,895,368 |
Other Assets, less Liabilities 0.0%e | | | | | | | | 110,384 |
| | | | | | | | |
Net Assets 100.0% | | | | | | | $ | 1,650,005,752 |
| | | | | | | | |
Selected Portfolio Abbreviations
ADR - American Depository Receipt
FHLB - Federal Home Loan Bank
GDR - Global Depository Receipt
SDR - Swedish Depository Receipt
a | Non-income producing for the twelve months ended December 31, 2006. |
b | Security was purchased pursuant to Rule 144A under the Securities Act of 1933 and may be sold in transactions exempt from registration only to qualified institutional buyers or in a public offering registered under the Securities Act of 1933. These securities have been deemed liquid under guidelines approved by the Trust’s Board of Trustees. At December 31, 2006, the aggregate value of these securities was $26,140,849, representing 1.58% of net assets. |
c | See Note 1(c) regarding securities purchased on a when-issued or delayed delivery basis. |
d | The security is traded on a discount basis with no stated coupon rate. |
e | Rounds to less than 0.1% of net assets. |
The accompanying notes are an integral part of these financial statements.
TD-15
Franklin Templeton Variable Insurance Products Trust
Financial Statements
Statement of Assets and Liabilities
December 31, 2006
| | | |
| | | Templeton Developing Markets Securities Fund |
Assets: | | | |
Investments in securities: | | | |
Cost | | $ | 1,138,378,756 |
| | | |
Value | | $ | 1,649,895,368 |
Foreign currency, at value (cost $1,695,601) | | | 1,696,692 |
Receivables: | | | |
Investment securities sold | | | 11,470,054 |
Capital shares sold | | | 1,404,800 |
Dividends | | | 3,549,718 |
Foreign tax | | | 234,375 |
| | | |
Total assets | | | 1,668,251,007 |
| | | |
Liabilities: | | | |
Payables: | | | |
Investment securities purchased | | | 12,629,482 |
Capital shares redeemed | | | 2,368,541 |
Affiliates | | | 2,198,422 |
Funds advanced by custodian | | | 203,564 |
Deferred taxes | | | 219,469 |
Accrued expenses and other liabilities | | | 625,777 |
| | | |
Total liabilities | | | 18,245,255 |
| | | |
Net assets, at value | | $ | 1,650,005,752 |
| | | |
Net assets consist of: | | | |
Paid-in capital | | $ | 993,247,172 |
Undistributed net investment income | | | 14,021,116 |
Net unrealized appreciation (depreciation) | | | 511,351,956 |
Accumulated net realized gain (loss) | | | 131,385,508 |
| | | |
Net assets, at value | | $ | 1,650,005,752 |
| | | |
Class 1: | | | |
Net assets, at value | | $ | 749,119,774 |
| | | |
Shares outstanding | | | 53,818,737 |
| | | |
Net asset value and maximum offering price per share | | $ | 13.92 |
| | | |
Class 2: | | | |
Net assets, at value | | $ | 857,514,239 |
| | | |
Shares outstanding | | | 62,180,852 |
| | | |
Net asset value and maximum offering price per share | | $ | 13.79 |
| | | |
Class 3: | | | |
Net assets, at value | | $ | 43,371,739 |
| | | |
Shares outstanding | | | 3,148,106 |
| | | |
Net asset value and maximum offering price per sharea | | $ | 13.78 |
| | | |
a | Redemption price is equal to net asset value less any redemption fees retained by the Fund. |
The accompanying notes are an integral part of these financial statements.
TD-16
Franklin Templeton Variable Insurance Products Trust
Financial Statements (continued)
Statement of Operations
for the year ended December 31, 2006
| | | | |
| | | Templeton Developing Markets Securities Fund | |
Investment income: | | | | |
Dividends (net of foreign taxes of $3,959,214) | | $ | 50,338,302 | |
Interest | | | 1,265,903 | |
Other income (Note 8) | | | 127,029 | |
| | | | |
Total investment income | | | 51,731,234 | |
| | | | |
Expenses: | | | | |
Management fees (Note 3a) | | | 18,722,761 | |
Administrative fees (Note 3b) | | | 1,713,923 | |
Distribution fees: (Note 3c) | | | | |
Class 2 | | | 1,945,195 | |
Class 3 | | | 67,037 | |
Unaffiliated transfer agent fees | | | 1,349 | |
Custodian fees (Note 4) | | | 1,403,325 | |
Reports to shareholders | | | 392,353 | |
Professional fees | | | 87,815 | |
Trustees’ fees and expenses | | | 7,461 | |
Other | | | 49,028 | |
| | | | |
Total expenses | | | 24,390,247 | |
Expense reductions (Note 4) | | | (6,678 | ) |
| | | | |
Net expenses | | | 24,383,569 | |
| | | | |
Net investment income | | | 27,347,665 | |
| | | | |
Realized and unrealized gains (losses): | | | | |
Net realized gain (loss) from: | | | | |
Investments (net of foreign taxes of $367,379) | | | 179,335,833 | |
Foreign currency transactions | | | (471,937 | ) |
| | | | |
Net realized gain (loss) | | | 178,863,896 | |
| | | | |
Net change in unrealized appreciation (depreciation) on: | | | | |
Investments | | | 155,108,514 | |
Translation of assets and liabilities denominated in foreign currencies | | | 45,295 | |
Change in deferred taxes on unrealized appreciation | | | (48,185 | ) |
| | | | |
Net change in unrealized appreciation (depreciation) | | | 155,105,624 | |
| | | | |
Net realized and unrealized gain (loss) | | | 333,969,520 | |
| | | | |
Net increase (decrease) in net assets resulting from operations | | $ | 361,317,185 | |
| | | | |
The accompanying notes are an integral part of these financial statements.
TD-17
Franklin Templeton Variable Insurance Products Trust
Financial Statements (continued)
Statements of Changes in Net Assets
| | | | | | | | |
| | | Templeton Developing
Markets Securities Fund | |
| | | Year Ended December 31, | |
| | | 2006 | | | 2005 | |
| | | | |
Increase (decrease) in net assets: | | | | | | | | |
Operations: | | | | | | | | |
Net investment income | | $ | 27,347,665 | | | $ | 16,601,225 | |
Net realized gain (loss) from investments and foreign currency transactions | | | 178,863,896 | | | | 99,606,542 | |
Net change in unrealized appreciation (depreciation) on investments, and translation of assets and liabilities denominated in foreign currencies, and deferred taxes | | | 155,105,624 | | | | 142,802,430 | |
| | | | |
Net increase (decrease) in net assets resulting from operations | | | 361,317,185 | | | | 259,010,197 | |
| | | | |
Distributions to shareholders from: | | | | | | | | |
Net investment income: | | | | | | | | |
Class 1 | | | (8,939,497 | ) | | | (7,605,217 | ) |
Class 2 | | | (8,560,133 | ) | | | (5,680,711 | ) |
Class 3 | | | (315,203 | ) | | | (9,713 | ) |
| | | | |
Total distributions to shareholders | | | (17,814,833 | ) | | | (13,295,641 | ) |
| | | | |
Capital share transactions: (Note 2) | | | | | | | | |
Class 1 | | | (65,550,558 | ) | | | 44,513,024 | |
Class 2 | | | 32,574,378 | | | | 208,495,324 | |
Class 3 | | | 25,467,947 | | | | 10,396,752 | |
| | | | |
Total capital share transactions | | | (7,508,233 | ) | | | 263,405,100 | |
| | | | |
Redemption fees | | | 19,233 | | | | 1,964 | |
| | | | |
Net increase (decrease) in net assets | | | 336,013,352 | | | | 509,121,620 | |
Net assets: | | | | | | | | |
Beginning of year | | | 1,313,992,400 | | | | 804,870,780 | |
| | | | |
End of year | | $ | 1,650,005,752 | | | $ | 1,313,992,400 | |
| | | | |
Undistributed net investment income included in net assets: | | | | | | | | |
End of year | | $ | 14,021,116 | | | $ | 4,018,236 | |
| | | | |
The accompanying notes are an integral part of these financial statements.
TD-18
Franklin Templeton Variable Insurance Products Trust
Notes to Financial Statements
Templeton Developing Markets Securities Fund
1. ORGANIZATION AND SIGNIFICANT ACCOUNTING POLICIES
Franklin Templeton Variable Insurance Products Trust (the Trust) is registered under the Investment Company Act of 1940, as amended, (the 1940 Act) as an open-end investment company, consisting of twenty-two separate funds. The Templeton Developing Markets Securities Fund (the Fund) included in this report is diversified. The financial statements of the remaining funds in the Trust are presented separately. Shares of the Fund are sold only to insurance company separate accounts to fund the benefits of variable life insurance policies or variable annuity contracts. The Fund offers three classes of shares: Class 1, Class 2, and Class 3. Each class of shares differs by its distribution fees, voting rights on matters affecting a single class and its exchange privilege.
The following summarizes the Fund’s significant accounting policies.
a. Security Valuation
Securities listed on a securities exchange or on the NASDAQ National Market System are valued at the last quoted sale price or the official closing price of the day, respectively. Over-the-counter securities and listed securities for which there is no reported sale are valued within the range of the most recent quoted bid and ask prices. Securities that trade in multiple markets or on multiple exchanges are valued according to the broadest and most representative market.
Government securities generally trade in the over-the-counter market rather than on a securities exchange. The Trust may utilize independent pricing services, quotations from bond dealers, and information with respect to bond and note transactions, to assist in determining a current market value for each security. The Trust’s pricing services may use valuation models or matrix pricing which considers information with respect to comparable bond and note transactions, quotations from bond dealers, or by reference to other securities that are considered comparable in such characteristics as rating, interest rate and maturity date, option adjusted spread models, prepayment projections, interest rate spreads and yield curves, to determine current value.
Foreign securities are valued as of the close of trading on the foreign stock exchange on which the security is primarily traded, or the NYSE, whichever is earlier. If no sale is reported at that time, the foreign security will be valued within the range of the most recent quoted bid and ask prices. The value is then converted into its U.S. dollar equivalent at the foreign exchange rate in effect at the close of the NYSE on the day that the value of the foreign security is determined.
The Trust has procedures to determine the fair value of individual securities and other assets for which market prices are not readily available or which may not be reliably priced. Methods for valuing these securities may include: fundamental analysis, matrix pricing, discounts from market prices of similar securities, or discounts applied due to the nature and duration of restrictions on the disposition of the securities. Due to the inherent uncertainty of valuations of such securities, the fair values may differ significantly from the values that would have been used had a ready market for such investments existed. Occasionally, events occur between the time at which trading in a security is completed and the close of the NYSE that might call into question the availability (including the reliability) of the value of a portfolio security held by the Fund. The investment manager monitors price movements following the close of trading in foreign stock markets through a series of country specific market proxies (such as baskets of American Depository Receipts, futures contracts and exchange traded funds). These price movements are measured against established trigger thresholds for each specific market proxy to assist in determining if an event has occurred. If such an event occurs, the securities may be valued using fair value procedures, which may include the use of independent pricing services. All security valuation procedures are approved by the Trust’s Board of Trustees.
b. Foreign Currency Translation
Portfolio securities and other assets and liabilities denominated in foreign currencies are translated into U.S. dollars based on the exchange rate of such currencies against U.S. dollars on the date of valuation. Purchases and sales of securities, income and expense items denominated in foreign currencies are translated into U.S. dollars at the exchange rate in effect on the transaction date. Occasionally, events may impact the availability or reliability of foreign exchange rates used to convert the U.S. dollar
TD-19
Franklin Templeton Variable Insurance Products Trust
Notes to Financial Statements (continued)
Templeton Developing Markets Securities Fund
1. ORGANIZATION AND SIGNIFICANT ACCOUNTING POLICIES (continued)
b. Foreign Currency Translation (continued)
equivalent value. If such an event occurs, the foreign exchange rate will be valued at fair value using procedures established and approved by the Trust’s Board of Trustees.
The Fund does not separately report the effect of changes in foreign exchange rates from changes in market prices on securities held. Such changes are included in net realized and unrealized gain or loss from investments on the Statement of Operations.
Realized foreign exchange gains or losses arise from sales of foreign currencies, currency gains or losses realized between the trade and settlement dates on securities transactions and the difference between the recorded amounts of dividends, interest, and foreign withholding taxes and the U.S. dollar equivalent of the amounts actually received or paid. Net unrealized foreign exchange gains and losses arise from changes in foreign exchange rates on foreign denominated assets and liabilities other than investments in securities held at the end of the reporting period.
c. Securities Purchased on a When-Issued or Delayed Delivery Basis
The Fund may purchase securities on a when-issued or delayed delivery basis, with payment and delivery scheduled for a future date. These transactions are subject to market fluctuations and are subject to the risk that the value at delivery may be more or less than the trade date purchase price. Although the Fund will generally purchase these securities with the intention of holding the securities, it may sell the securities before the settlement date. Sufficient assets have been segregated for these securities.
d. Foreign Currency Contracts
When the Fund purchases or sells foreign securities it may enter into foreign exchange contracts to minimize foreign exchange risk from the trade date to the settlement date of the transactions. A foreign exchange contract is an agreement between two parties to exchange different currencies at an agreed upon exchange rate at a future date. Realized and unrealized gains and losses on these contracts are included in the Statement of Operations.
The risks of these contracts include movement in the values of the foreign currencies relative to the U.S. dollar and the possible inability of the counterparties to fulfill their obligations under the contracts, which may be in excess of the amount reflected in the Statement of Assets and Liabilities.
e. Income and Deferred Taxes
No provision has been made for U.S. income taxes because the Fund intends to qualify as a regulated investment company under the Internal Revenue Code and to distribute to shareholders substantially all of its taxable income and net realized gains.
Foreign securities held by the Fund may be subject to foreign taxation on dividend and interest income received. Foreign taxes, if any, are recorded based on the tax regulations and rates that exist in the foreign markets in which the Fund invests.
The Fund may be subject to a tax imposed on net realized gains on securities of certain foreign countries. The Fund records an estimated deferred tax liability for net unrealized gains on these securities in an amount that would be payable if the securities were disposed of on the valuation date.
f. Security Transactions, Investment Income, Expenses and Distributions
Security transactions are accounted for on trade date. Realized gains and losses on security transactions are determined on a specific identification basis. Interest income and estimated expenses are accrued daily. Dividend income is recorded on the ex-dividend date except that certain dividends from foreign securities are recognized as soon as the Fund is notified of the
TD-20
Franklin Templeton Variable Insurance Products Trust
Notes to Financial Statements (continued)
Templeton Developing Markets Securities Fund
1. ORGANIZATION AND SIGNIFICANT ACCOUNTING POLICIES (continued)
f. Security Transactions, Investment Income, Expenses and Distributions (continued)
ex-dividend date. Distributions to shareholders are recorded on the ex-dividend date and are determined according to income tax regulations (tax basis). Such distributions are reinvested in additional shares of the Fund. Distributable earnings determined on a tax basis may differ from earnings recorded in accordance with accounting principles generally accepted in the United States. These differences may be permanent or temporary. Permanent differences are reclassified among capital accounts to reflect their tax character. These reclassifications have no impact on net assets or the results of operations. Temporary differences are not reclassified, as they may reverse in subsequent periods.
Common expenses incurred by the Trust are allocated among the funds based on the ratio of net assets of each fund to the combined net assets of the Trust. Fund specific expenses are charged directly to the fund that incurred the expense.
Realized and unrealized gains and losses and net investment income, other than class specific expenses, are allocated daily to each class of shares based upon the relative proportion of net assets of each class. Differences in class-level expenses may result in payment of different per share distributions by class.
g. Accounting Estimates
The preparation of financial statements in accordance with accounting principles generally accepted in the United States of America requires management to make estimates and assumptions that affect the reported amounts of assets and liabilities at the date of the financial statements and the amounts of income and expenses during the reporting period. Actual results could differ from those estimates.
h. Redemption Fees
Redemptions and exchanges of Class 3 shares held 60 days or less may be subject to the Fund’s redemption fee, which is 1% of the amount redeemed. Such fees are retained by the Fund and accounted for as an addition to paid-in capital.
i. Guarantees and Indemnifications
Under the Trust’s organizational documents, its officers and trustees are indemnified by the Trust against certain liabilities arising out of the performance of their duties to the Trust. Additionally, in the normal course of business, the Trust enters into contracts with service providers that contain general indemnification clauses. The Trust’s maximum exposure under these arrangements is unknown as this would involve future claims that may be made against the Trust that have not yet occurred. Currently, the Trust expects the risk of loss to be remote.
2. SHARES OF BENEFICIAL INTEREST
At December 31, 2006, there were an unlimited number of shares authorized ($0.01 par value). Transactions in the Fund’s shares were as follows:
| | | | | | | | | | | | | | |
| | | Year Ended December 31, | |
| | | 2006 | | | 2005 | |
| Class 1 Shares: | | Shares | | | Amount | | | Shares | | | Amount | |
Shares sold | | 8,227,856 | | | $ | 99,913,441 | | | 10,118,344 | | | $ | 96,449,675 | |
Shares issued in reinvestment of distributions | | 823,158 | | | | 8,939,497 | | | 833,905 | | | | 7,605,217 | |
Shares redeemed | | (14,545,716 | ) | | | (174,403,496 | ) | | (6,292,757 | ) | | | (59,541,868 | ) |
| | | | |
Net increase (decrease) | | (5,494,702 | ) | | $ | (65,550,558 | ) | | 4,659,492 | | | $ | 44,513,024 | |
| | | | |
TD-21
Franklin Templeton Variable Insurance Products Trust
Notes to Financial Statements (continued)
Templeton Developing Markets Securities Fund
2. SHARES OF BENEFICIAL INTEREST (continued)
| | | | | | | | | | | | | | |
| | | Year Ended December 31, | |
| | | 2006 | | | 2005 | |
| Class 2 Shares: | | Shares | | | Amount | | | Shares | | | Amount | |
Shares sold | | 18,145,883 | | | $ | 219,369,554 | | | 27,948,311 | | | $ | 264,714,321 | |
Shares issued in reinvestment of distributions | | 794,812 | | | | 8,560,133 | | | 627,010 | | | | 5,680,711 | |
Shares redeemed | | (16,460,489 | ) | | | (195,355,309 | ) | | (6,666,146 | ) | | | (61,899,708 | ) |
| | | | |
Net increase (decrease) | | 2,480,206 | | | $ | 32,574,378 | | | 21,909,175 | | | $ | 208,495,324 | |
| | | | |
| Class 3 Shares: | | | | | | | | | | | | |
Shares sold | | 2,626,549 | | | $ | 31,906,146 | | | 1,108,615 | | | $ | 10,932,663 | |
Shares issued in reinvestment of distributions | | 29,294 | | | | 315,203 | | | 1,051 | | | | 9,523 | |
Shares redeemed | | (564,285 | ) | | | (6,753,402 | ) | | (54,521 | ) | | | (545,434 | ) |
| | | | |
Net increase (decrease) | | 2,091,558 | | | $ | 25,467,947 | | | 1,055,145 | | | $ | 10,396,752 | |
| | | | |
3. TRANSACTIONS WITH AFFILIATES
Franklin Resources, Inc. is the holding company for various subsidiaries that together are referred to as Franklin Templeton Investments. Certain officers and trustees of the Trust are also officers and/or directors of the following subsidiaries:
| | |
| Subsidiary | | Affiliation |
Templeton Asset Management Ltd. (TAML) | | Investment manager |
Franklin Templeton Services, LLC (FT Services) | | Administrative manager |
Franklin Templeton Distributors, Inc. (Distributors) | | Principal underwriter |
Franklin Templeton Investor Services, LLC (Investor Services) | | Transfer agent |
a. Management Fees
The Fund pays an investment management fee to TAML based on the average daily net assets of the Fund as follows:
| | |
| Annualized Fee Rate | | Net Assets |
| 1.250% | | Up to and including $1 billion |
| 1.200% | | Over $1 billion, up to and including $5 billion |
| 1.150% | | Over $5 billion, up to and including $10 billion |
| 1.100% | | Over $10 billion, up to and including $15 billion |
| 1.050% | | Over $15 billion, up to and including $20 billion |
| 1.000% | | In excess of $20 billion |
b. Administrative Fees
The Fund pays an administrative fee to FT Services based on the average daily net assets of the Fund as follows:
| | |
| Annualized Fee Rate | | Net Assets |
| 0.150% | | Up to and including $200 million |
| 0.135% | | Over $200 million, up to and including $700 million |
| 0.100% | | Over $700 million, up to and including $1.2 billion |
| 0.075% | | In excess of $1.2 billion |
TD-22
Franklin Templeton Variable Insurance Products Trust
Notes to Financial Statements (continued)
Templeton Developing Markets Securities Fund
3. TRANSACTIONS WITH AFFILIATES (continued)
c. Distribution Fees
The Fund’s Board of Trustees has adopted distribution plans for Class 2 and Class 3 shares pursuant to Rule 12b-1 under the 1940 Act. Under the Fund’s compensation distribution plans, the Fund pays Distributors for costs incurred in connection with the servicing, sale and distribution of the Fund’s shares up to 0.25% and 0.35% per year of its average daily net assets of Class 2 and Class 3, respectively. The Board of Trustees has agreed to limit the current rate to 0.25% per year for Class 3.
d. Transfer Agent Fees
Investor Services, under terms of an agreement, performs shareholder servicing for the Fund and is not paid by the Fund for the services.
4. EXPENSE OFFSET ARRANGEMENT
The Fund has entered into an arrangement with its custodian whereby credits realized as a result of uninvested cash balances are used to reduce a portion of the Fund’s custodian expenses. During the year ended December 31, 2006, the custodian fees were reduced as noted in the Statement of Operations.
5. INCOME TAXES
For tax purposes, capital losses may be carried over to offset future capital gains, if any. During the year ended December 31, 2006, the Fund utilized $45,185,834 of capital loss carryforwards.
The tax character of distributions paid during the years ended December 31, 2006 and 2005, was as follows:
| | | | | | |
| | | 2006 | | 2005 |
Distributions paid from ordinary income | | $ | 17,814,833 | | $ | 13,295,641 |
| | | |
For tax purposes, realized currency losses occurring subsequent to October 31, may be deferred and treated as occurring on the first day of the following fiscal year. At December 31, 2006, the Fund deferred realized currency losses of $85,514.
At December 31, 2006, the cost of investments, net unrealized appreciation (depreciation), undistributed ordinary income and undistributed long term capital gains for income tax purposes were as follows:
| | | | |
Cost of investments | | $ | 1,168,670,771 | |
| | | | |
| |
Unrealized appreciation | | $ | 516,252,357 | |
Unrealized depreciation | | | (35,027,760 | ) |
| | | | |
Net unrealized appreciation (depreciation) | | $ | 481,224,597 | |
| | | | |
Undistributed ordinary income | | $ | 47,356,940 | |
Undistributed long term capital gains | | | 128,427,211 | |
| | | | |
Distributable earnings | | $ | 175,784,151 | |
| | | | |
Net investment income differs for financial statement and tax purposes primarily due to differing treatments of foreign currency transactions and passive foreign investment company shares.
TD-23
Franklin Templeton Variable Insurance Products Trust
Notes to Financial Statements (continued)
Templeton Developing Markets Securities Fund
5. INCOME TAXES (continued)
Net realized gains (losses) differ for financial statement and tax purposes primarily due to differing treatments of wash sales, foreign currency transactions and passive foreign investment company shares.
6. INVESTMENT TRANSACTIONS
Purchases and sales of investments (excluding short term securities) for the year ended December 31, 2006, aggregated $805,756,349 and $798,580,124, respectively.
7. CONCENTRATION OF RISK
Investing in foreign securities may include certain risks and considerations not typically associated with investing in U.S. securities, such as fluctuating currency values and changing local and regional economic, political and social conditions, which may result in greater market volatility. In addition, certain foreign securities may not be as liquid as U.S. securities.
8. REGULATORY MATTERS
As part of various investigations by a number of federal, state, and foreign regulators and governmental entities, including the Securities and Exchange Commission (“SEC”), relating to certain practices in the mutual fund industry, including late trading, market timing and marketing support payments to securities dealers who sell fund shares (“marketing support”), Franklin Resources, Inc. and certain of its subsidiaries (collectively, the “Company”), entered into settlements with certain of those regulators. Specifically, the Company entered into settlements with the SEC, among others, concerning market timing and marketing support.
On June 23, 2006, the SEC approved the proposed plan of distribution for the marketing support settlement, and disbursement of the settlement monies to the designated funds, in accordance with the terms and conditions of that settlement and plan, was completed in September 2006 and is recorded as other income.
The plan of distribution for the market timing settlement is currently under review by the SEC staff. After publication of notice of the plan and a 30-day comment period, the proposed plan of distribution will be submitted to the SEC for approval. Following the SEC’s approval of the plan of distribution, with modifications as appropriate, distribution of the settlement monies will begin in accordance with the terms and conditions of the settlement and plan.
In addition, the Company, as well as most of the mutual funds within Franklin Templeton Investments and certain current or former officers, Company directors, fund directors, and employees, have been named in private lawsuits (styled as shareholder class actions, or as derivative actions on behalf of either the named funds or Franklin Resources, Inc.). The lawsuits relate to the industry practices referenced above, as well as to allegedly excessive commissions and advisory and distribution fees.
The Company and fund management believe that the claims made in each of the private lawsuits referenced above are without merit and intend to defend against them vigorously. The Company cannot predict with certainty the eventual outcome of these lawsuits, nor whether they will have a material negative impact on the Company. If it is determined that the Company bears responsibility for any unlawful or inappropriate conduct that caused losses to the Fund, it is committed to making the Fund or its shareholders whole, as appropriate.
9. NEW ACCOUNTING PRONOUNCEMENTS
In July 2006, the Financial Accounting Standards Board (FASB) issued FASB Interpretation No. 48, “Accounting for Uncertainty in Income Taxes – an Interpretation of FASB Statement No. 109” (“FIN 48”), which clarifies the accounting for uncertainty in tax
TD-24
Franklin Templeton Variable Insurance Products Trust
Notes to Financial Statements (continued)
Templeton Developing Markets Securities Fund
9. NEW ACCOUNTING PRONOUNCEMENTS (continued)
positions taken or expected to be taken in a tax return. FIN 48 provides guidance on the measurement, recognition, classification and disclosure of tax positions, along with accounting for the related interest and penalties. FIN 48 is effective for fiscal years beginning after December 15, 2006, and is to be applied to all open tax years as of the date of effectiveness. On December 22, 2006, the Securities and Exchange Commission extended the implementation date to no later than the last net asset value calculation in the first semi-annual reporting period in 2007. The Fund is currently evaluating the impact, if any, of applying the various provisions of FIN 48.
In September 2006, FASB issued FASB Statement No. 157, “Fair Value Measurement” (“SFAS 157”), which defines fair value, establishes a framework for measuring fair value, and expands disclosures about fair value measurements. SFAS 157 is effective for fiscal years beginning after November 15, 2007, and interim periods within those fiscal years. The Trust believes the adoption of SFAS 157 will have no material impact on its financial statements.
TD-25
Franklin Templeton Variable Insurance Products Trust
Templeton Developing Markets Securities Fund
Report of Independent Registered Public Accounting Firm
To the Board of Trustees and Shareholders of Franklin Templeton Variable Insurance Products Trust
In our opinion, the accompanying statement of assets and liabilities, including the statement of investments, and the related statements of operations and of changes in net assets and the financial highlights present fairly, in all material respects, the financial position of Templeton Developing Markets Securities Fund (one of the funds constituting the Franklin Templeton Variable Insurance Products Trust, hereafter referred to as the “Fund”) at December 31, 2006, the results of its operations for the year then ended, the changes in its net assets for each of the two years in the period then ended and the financial highlights for each of the periods presented, in conformity with accounting principles generally accepted in the United States of America. These financial statements and financial highlights (hereafter referred to as “financial statements”) are the responsibility of the Fund’s management; our responsibility is to express an opinion on these financial statements based on our audits. We conducted our audits of these financial statements in accordance with the standards of the Public Company Accounting Oversight Board (United States). Those standards require that we plan and perform the audit to obtain reasonable assurance about whether the financial statements are free of material misstatement. An audit includes examining, on a test basis, evidence supporting the amounts and disclosures in the financial statements, assessing the accounting principles used and significant estimates made by management, and evaluating the overall financial statement presentation. We believe that our audits, which included confirmation of securities at December 31, 2006 by correspondence with the custodian and brokers, provide a reasonable basis for our opinion.
PricewaterhouseCoopers LLP
San Francisco, California
February 16, 2007
TD-26
Franklin Templeton Variable Insurance Products Trust
Tax Designation (unaudited)
Templeton Developing Markets Securities Fund
Under Section 852(b)(3)(C) of the Internal Revenue Code (Code), the Fund designates the maximum amount allowable but no less than $128,427,211 as a long term capital gain dividend for the fiscal year ended December 31, 2006.
At December 31, 2006, more than 50% of the Fund’s total assets were invested in securities of foreign issuers. In most instances, foreign taxes were withheld from dividends paid to the Fund on these investments. The Fund elects to treat foreign taxes paid as allowed under Section 853 of the Code. This election will allow shareholders of record in June 2007, to treat their proportionate share of foreign taxes paid by the Fund as having been paid directly by them. Shareholders shall consider these amounts as foreign taxes paid in the tax year in which they receive the Fund distribution.
The foreign tax information will be disclosed in the June 30, 2007, semi-annual report of the Fund.
TD-27
Templeton Foreign Securities Fund
This annual report for Templeton Foreign Securities Fund covers the fiscal year ended December 31, 2006.
Performance Summary as of 12/31/06
Average annual total return of Class 3 shares* represents the average annual change in value, assuming reinvestment of dividends and capital gains. Average returns smooth out variations in returns, which can be significant; they are not the same as year-by-year results.
Periods ended 12/31/06
| | | | | | |
| | | 1-Year | | 5-Year | | 10-Year |
Average Annual Total Return | | +21.46% | | +11.29% | | +7.91% |
*Performance prior to the 5/1/00 merger reflects historical performance of Templeton International Fund. Additionally, Class 3 and Class 2 shares were not offered until 5/1/04 and 5/1/97, respectively. As a result, Class 3 Fund performance for periods prior to 5/1/04 represents historical results of Class 2 shares which, for periods prior to 5/1/97, reflects historical results of Class 1 shares. For periods beginning on 5/1/97, Class 2’s results reflect an additional 12b-1 fee expense, which also affects future performance. The 12b-1 fee rate is currently the same for Classes 2 and 3. Since 5/1/04 (effective date), the average annual total return of Class 3 shares was +18.03%.
Total Return Index Comparison for Hypothetical $10,000 Investment (1/1/97–12/31/06)
The graph below shows the change in value of a hypothetical $10,000 investment in the Fund over the indicated period and includes reinvestment of any income or distributions. The Fund’s performance* is compared to the performance of the Morgan Stanley Capital International (MSCI) Europe, Australasia, Far East (EAFE) Index. One cannot invest directly in an index, nor is an index representative of the Fund’s portfolio. Please see Important Notes to Performance Information preceding the Fund Summaries.
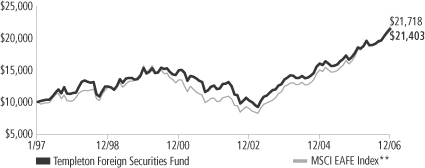
**Source: Standard & Poor’s Micropal. Please see Index Descriptions following the Fund Summaries.
Templeton Foreign Securities Fund – Class 3
Performance reflects the Fund’s Class 3 operating expenses, but does not include any contract fees, expenses or sales charges. If they had been included, performance would be lower. These charges and deductions, particularly for variable life policies, can have a significant effect on contract values and insurance benefits. See the contract prospectus for a complete description of these expenses, including sales charges.
Performance data represent past performance, which does not guarantee future results. Investment return and principal value will fluctuate, and you may have a gain or loss when you sell your shares.
Current performance may differ from figures shown.
TF-1
Fund Goal and Main Investments: Templeton Foreign Securities Fund seeks long-term capital growth. The Fund normally invests at least 80% of its net assets in investments of issuers located outside the U.S., including those in emerging markets, and normally invests predominantly in equity securities.
Performance Overview
You can find the Fund’s one-year total return in the Performance Summary. The Fund underperformed its benchmark, the MSCI EAFE Index, which returned +26.86% for the same period.1 Please note that index performance information is provided for reference and that we do not attempt to track the index but rather undertake investments on the basis of fundamental research.
Economic and Market Overview
The global economy grew in 2006, although gross domestic product growth slowed in the U.S. while it accelerated in Europe. The economic drivers remained consistent over the past four years: strong corporate and consumer demand, reasonably low inflation, a tight or improving labor market, and a relatively moderate interest rate environment, despite recent interest rate hikes by many of the world’s central banks. However, the economy also faced headwinds from elevated energy prices, higher global interest rates and a weaker U.S. housing market. These factors dampened investor confidence mid-year, when many equity markets declined before rebounding later in the year.
Despite such challenges, global economic activity was healthy. Strong global liquidity — whether petrodollars, corporate cash, private equity, household savings or central banks’ reserves — continued to search for a home. Largely as a result, bond yield spreads over U.S. Treasuries narrowed, and equity and commodity markets rose in the latter part of the year. The shift from risk aversion to risk tolerance was concurrent with the U.S. Federal Reserve Board’s decisions since June to hold the federal funds target rate at 5.25%, as well with as lower oil prices in the second half of the year.
Narrowing corporate credit spreads globally reflected greater risk tolerance, while abundant cash supplies in the capital markets contributed to record global merger and acquisition activity in 2006. The total value
1. Source: Standard & Poor’s Micropal. One cannot invest directly in an index, nor is an index representative of the Fund’s portfolio. Please see Index Descriptions following the Fund Summaries.
Fund Risks: The Fund’s investments in stocks offer the potential for long-term gains but can be subject to short-term price fluctuation. Foreign investing, especially in emerging markets, involves additional risks including currency fluctuations, economic instability, and social and political developments. The Fund’s prospectus also includes a description of the main investment risks.
TF-2
of deals announced as a result of hostile takeovers, private equity buyouts and broad corporate consolidation was $3.8 trillion.2 This figure surpassed the $3.4 trillion mark set in 2000.2 Announced deals from private equity alone reached a record $700 billion, more than double the record set in 2005 and 20 times greater than a decade ago.3
With this economic backdrop, the non-U.S. equity markets — including emerging markets that remained a major magnet for global fund flows — led global equity markets to end 2006 on a strong note, and all major regions delivered double-digit total returns for the year. Stock market indexes in the U.S. and most European countries reached six-year highs in the fourth quarter, and many emerging market indexes in Asia, Europe and Latin America neared or reached all-time highs.
Investment Strategy
Our investment philosophy is bottom-up, value-oriented and long-term. In choosing investments, we generally focus on the market price of a company’s securities relative to our evaluation of the company’s potential long-term earnings, asset value and cash flow. Among factors we consider are a company’s historical value measures, including price/earnings ratio, profit margins and liquidation value. We do in-depth research to construct a bargain list from which we buy.
Manager’s Discussion
During the year under review, Fund performance versus the benchmark index was driven by several factors. Stock selection in the consumer discretionary sector provided a significant boost to relative performance.4 German auto maker BMW (not an index component), U.K. publisher Pearson, U.K. foodservice giant Compass Group, and U.K. apparel manufacturer Burberry Group were some of the sector’s standout performers.
The Fund’s results were also aided by investments in the telecommunication services sector, benefiting from stock selection and a significantly overweighted allocation relative to the index.5 Notable contributors included Norway’s Telenor, Spain’s Telefonica, U.K.
2. Source: “Can M&A’s ‘Best of Times’ Get Better?,” The Wall Street Journal, 1/2/07.
3. Source: “TPG tops buy-out league with $101bn,” The Wall Street Journal, 12/27/06.
4. The consumer discretionary sector comprises hotels, restaurants and leisure; household durables; leisure equipment and products; media; specialty retail; and textiles, apparel and luxury goods in the SOI.
5. The telecommunications sector comprises diversified telecommunication services and wireless telecommunication services in the SOI.
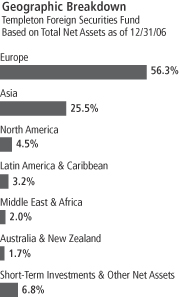
TF-3
wireless provider Vodafone Group, Russian wireless provider Mobile TeleSystems and China Mobile. Mobile TeleSystems and China Mobile are not part of the index.
The Fund’s industrials sector position also benefited relative performance due to stock selection and an underweighted allocation.6 Notable contributors included Australia’s Qantas Airways and European wind turbine manufacturers and wind farm operators Vestas Wind Systems and Gamesa Corporacion Tecnologica, which each experienced significant sales growth as interest increased in clean and renewable energy sources.
It is important to recognize the effect of currency movements on the Fund’s performance. In general, if the value of the U.S. dollar goes up compared with a foreign currency, an investment traded in that foreign currency will go down in value because it will be worth fewer U.S. dollars. This can have a negative effect on Fund performance. Conversely, when the U.S. dollar weakens in relation to a foreign currency, an investment traded in that foreign currency will increase in value, which can contribute to Fund performance. For the 12 months ended December 31, 2006, the U.S. dollar declined in value relative to most non-U.S. currencies. As a result, the Fund’s performance was positively affected by the portfolio’s investment predominantly in securities with non-U.S. currency exposure. However, one cannot expect the same result in future periods.
Despite the Fund’s positive results, there were some disappointments. Although the financials sector made the greatest absolute contribution to returns of any sector held by the Fund, relative performance versus the index suffered somewhat due to stock selection and our underweighting during a year of strong performance.7 Laggard stocks included Japanese banks Shinsei Bank, Mitsubishi UFJ Financial Group and Sumitomo Mitsui Financial Group, and insurer Sompo Japan Insurance.
The information technology sector hurt relative returns due to stock selection, especially within the technology hardware and equipment industry.8 Detractors from relative performance included Israeli Internet
6. The industrials sector comprises airlines, commercial services and supplies, electrical equipment, and industrial conglomerates in the SOI.
7. The financials sectors comprises capital markets, commercial banks, diversified financial services, insurance, and real estate management and development in the SOI.
8. The information technology sector comprises computers and peripherals, electronic equipment and instruments, semiconductors and semiconductor equipment, and software in the SOI.
Top 10 Holdings
Templeton Foreign Securities Fund 12/31/06
| | |
Company
Sector/Industry,
Country | | % of Total
Net Assets |
| Sumitomo Mitsui Financial Group Inc. | | 2.6% |
| Commercial Banks, Japan | | |
| Cheung Kong (Holdings) Ltd. | | 2.2% |
| Real Estate Management & Development, Hong Kong | | |
| Sanofi-Aventis | | 2.1% |
| Pharmaceuticals, France | | |
| GlaxoSmithKline PLC | | 2.0% |
| Pharmaceuticals, U.K. | | |
| ING Groep NV | | 2.0% |
| Diversified Financial Services, Netherlands | | |
| Mitsubishi UFJ Financial Group Inc. | | 1.9% |
| Commercial Banks, Japan | | |
| Royal Dutch Shell PLC, B | | 1.8% |
| Oil, Gas & Consumable Fuels, U.K. | | |
| British Sky Broadcasting Group PLC | | 1.8% |
| Media, U.K. | | |
| ACE Ltd. | | 1.8% |
| Insurance, Bermuda | | |
| Siemens AG | | 1.6% |
| Industrial Conglomerates, Germany | | |
The dollar value, number of shares or principal amount, and names of all portfolio holdings are listed in the Fund’s Statement of Investments (SOI).
TF-4
security specialist CheckPoint Software Technologies, Japanese industrial electronics manufacturer Hitachi, Singaporean computer hardware maker Flextronics International, and South Korean semiconductor manufacturer Samsung Electronics. Flextronics and Samsung are not index components.
Stock selection among health care sector stocks also hindered relative results, particularly large European pharmaceuticals producers GlaxoSmithKline and Sanofi-Aventis.9
Thank you for your participation in Templeton Foreign Securities Fund. We look forward to serving your future investment needs.
9. The health care sector comprises health care providers and services and pharmaceuticals in the SOI.
The foregoing information reflects our analysis, opinions and portfolio holdings as of December 31, 2006, the end of the reporting period. The way we implement our main investment strategies and the resulting portfolio holdings may change depending on factors such as market and economic conditions. These opinions may not be relied upon as investment advice or an offer for a particular security. The information is not a complete analysis of every aspect of any market, country, industry, security or the Fund. Statements of fact are from sources considered reliable, but the investment manager makes no representation or warranty as to their completeness or accuracy. Although historical performance is no guarantee of future results, these insights may help you understand our investment management philosophy.
TF-5
Templeton Foreign Securities Fund – Class 3
Fund Expenses
As an investor in a variable insurance contract (“Contract”) that indirectly provides for investment in an underlying mutual fund, you can incur transaction and/or ongoing expenses at both the Fund level and the Contract level.
| • | | Transaction expenses can include sales charges (loads) on purchases, redemption fees, surrender fees, transfer fees and premium taxes. |
| • | | Ongoing expenses can include management fees, distribution and service (12b-1) fees, contract fees, annual maintenance fees, mortality and expense risk fees and other fees and expenses. All mutual funds and Contracts have some types of ongoing expenses. |
The expenses shown in the table are meant to highlight ongoing expenses at the Fund level only and do not include ongoing expenses at the Contract level, or transaction expenses at either the Fund or Contract level. While the Fund does not have transaction expenses, if the transaction and ongoing expenses at the Contract level were included, the expenses shown would be higher. You should consult your Contract prospectus or disclosure document for more information.
The table shows Fund-level ongoing expenses and can help you understand these expenses and compare them with the six months indicated. Please refer to the Fund prospectus for additional information on operating expenses.
Actual Fund Expenses
The first line (Actual) of the table provides actual account values and expenses. The “Ending Account Value” is derived from the Fund’s actual return, which includes the effect of ongoing Fund expenses, but does not include the effect of ongoing Contract expenses.
You can estimate the Fund-level expenses you incurred during the period by following these steps. Of course, your account value and expenses will differ from those in this illustration:
| 1. | Divide your account value by $1,000. |
If an account had an $8,600 value, then $8,600 ÷ $1,000 = 8.6.
| 2. | Multiply the result by the number under the heading “Fund-Level Expenses Incurred During Period.” |
If Fund-Level Expenses Incurred During Period were $7.50, then 8.6 x $7.50 = $64.50.
In this illustration, the estimated expenses incurred this period at the Fund level are $64.50.
TF-6
Hypothetical Example for Comparison with Other Mutual Funds
Information in the second line (Hypothetical) of the table can help you compare ongoing expenses of the Fund with those of other mutual funds offered through the Contract. This information may not be used to estimate the actual ending account balance or expenses you incurred during the period. The hypothetical “Ending Account Value” is based on the Fund’s actual expense ratio and an assumed 5% annual rate of return before expenses, which does not represent the Fund’s actual return. The figure under the heading “Fund-Level Expenses Incurred During Period” shows the hypothetical expenses your account would have incurred under this scenario. You can compare this figure with the 5% hypothetical examples that appear in shareholder reports of other funds offered through a Contract.
| | | | | | | | | |
| Class 3 | | Beginning
Account
Value 7/1/06 | | Ending
Account Value 12/31/06 | | Fund-Level
Expenses Incurred
During Period*
7/1/06-12/31/06 |
Actual | | $ | 1,000 | | $ | 1,134.20 | | $ | 5.38 |
Hypothetical (5% return before expenses) | | $ | 1,000 | | $ | 1,020.16 | | $ | 5.09 |
*Expenses are equal to the annualized expense ratio for the Fund’s Class 3 shares (1.00%), which does not include any ongoing expenses of the Contract for which the Fund is an investment option, multiplied by the average account value over the period, multiplied by 184/365 to reflect the one-half year period.
TF-7
Franklin Templeton Variable Insurance Products Trust
Financial Highlights
Templeton Foreign Securities Fund
| | | | | | | | | | | | | | | | | | | | |
| | | Year Ended December 31, | |
| Class 1 | | 2006 | | | 2005 | | | 2004 | | | 2003 | | | 2002 | |
| | | | |
Per share operating performance | | | | | | | | | | | | | | | | | | | | |
(for a share outstanding throughout the year) | | | | | | | | | | | | | | | | | | | | |
Net asset value, beginning of year | | $ | 15.84 | | | $ | 14.53 | | | $ | 12.37 | | | $ | 9.51 | | | $ | 11.85 | |
| | | | |
Income from investment operationsa: | | | | | | | | | | | | | | | | | | | | |
Net investment incomeb | | | 0.46 | | | | 0.30 | | | | 0.26 | | | | 0.19 | | | | 0.22 | |
Net realized and unrealized gains (losses) | | | 2.94 | | | | 1.20 | | | | 2.05 | | | | 2.87 | | | | (2.37 | ) |
| | | | |
Total from investment operations | | | 3.40 | | | | 1.50 | | | | 2.31 | | | | 3.06 | | | | (2.15 | ) |
| | | | |
Less distributions from net investment income | | | (0.24 | ) | | | (0.19 | ) | | | (0.15 | ) | | | (0.20 | ) | | | (0.19 | ) |
| | | | |
Redemption fees | | | — | d | | | — | d | | | — | d | | | — | | | | — | |
| | | | |
Net asset value, end of year | | $ | 19.00 | | | $ | 15.84 | | | $ | 14.53 | | | $ | 12.37 | | | $ | 9.51 | |
| | | | |
| | | | | |
Total returnc | | | 21.70% | | | | 10.48% | | | | 18.87% | | | | 32.55% | | | | (18.40)% | |
Ratios/supplemental data | | | | | | | | | | | | | | | | | | | | |
Net assets, end of year (000’s) | | $ | 594,991 | | | $ | 531,775 | | | $ | 506,456 | | | $ | 472,665 | | | $ | 397,420 | |
Ratios to average net assets: | | | | | | | | | | | | | | | | | | | | |
Expenses | | | 0.75% | e | | | 0.77% | e | | | 0.82% | e | | | 0.87% | | | | 0.88% | |
Net investment income | | | 2.63% | | | | 2.03% | | | | 1.95% | | | | 1.81% | | | | 1.97% | |
Portfolio turnover rate | | | 18.97% | f | | | 14.61% | | | | 10.91% | | | | 18.01% | | | | 28.12% | |
a | The amount shown for a share outstanding throughout the period may not correlate with the Statement of Operations for the period due to the timing of sales and repurchase of the Fund shares in relation to income earned and/or fluctuating market value of the investments of the Fund. |
b | Based on average daily shares outstanding. |
c | Total return does not include any fees, charges or expenses imposed by the variable annuity and life insurance contracts for which the Franklin Templeton Variable Insurance Products Trust serves as an underlying investment vehicle. |
d | Amount rounds to less than $0.01 per share. |
e | Benefit of expense reduction rounds to less than 0.01%. |
f | Excludes the value of portfolio securities delivered as a result of a redemption in-kind. See Note 9. |
The accompanying notes are an integral part of these financial statements.
TF-8
Franklin Templeton Variable Insurance Products Trust
Financial Highlights (continued)
Templeton Foreign Securities Fund
| | | | | | | | | | | | | | | | | | | | |
| | | Year Ended December 31, | |
| Class 2 | | 2006 | | | 2005 | | | 2004 | | | 2003 | | | 2002 | |
| | | | |
Per share operating performance | | | | | | | | | | | | | | | | | | | | |
(for a share outstanding throughout the year) | | | | | | | | | | | | | | | | | | | | |
Net asset value, beginning of year | | $ | 15.63 | | | $ | 14.35 | | | $ | 12.24 | | | $ | 9.42 | | | $ | 11.74 | |
| | | | |
Income from investment operationsa: | | | | | | | | | | | | | | | | | | | | |
Net investment incomeb | | | 0.40 | | | | 0.26 | | | | 0.22 | | | | 0.15 | | | | 0.17 | |
Net realized and unrealized gains (losses) | | | 2.91 | | | | 1.19 | | | | 2.03 | | | | 2.85 | | | | (2.32 | ) |
| | | | |
Total from investment operations | | | 3.31 | | | | 1.45 | | | | 2.25 | | | | 3.00 | | | | (2.15 | ) |
| | | | |
Less distributions from net investment income | | | (0.21 | ) | | | (0.17 | ) | | | (0.14 | ) | | | (0.18 | ) | | | (0.17 | ) |
| | | | |
Redemption fees | | | — | d | | | — | d | | | — | d | | | — | | | | — | |
| | | | |
Net asset value, end of year | | $ | 18.73 | | | $ | 15.63 | | | $ | 14.35 | | | $ | 12.24 | | | $ | 9.42 | |
| | | | |
| | | | | |
Total returnc | | | 21.44% | | | | 10.17% | | | | 18.53% | | | | 32.21% | | | | (18.56)% | |
| | | | | |
Ratios/supplemental data | | | | | | | | | | | | | | | | | | | | |
Net assets, end of year (000’s) | | $ | 2,941,374 | | | $ | 2,232,990 | | | $ | 1,445,928 | | | $ | 653,594 | | | $ | 299,760 | |
Ratios to average net assets: | | | | | | | | | | | | | | | | | | | | |
Expenses | | | 1.00% | e | | | 1.02% | e | | | 1.07% | e | | | 1.12% | | | | 1.13% | |
Net investment income | | | 2.38% | | | | 1.78% | | | | 1.70% | | | | 1.56% | | | | 1.72% | |
Portfolio turnover rate | | | 18.97% | f | | | 14.61% | | | | 10.91% | | | | 18.01% | | | | 28.12% | |
a | The amount shown for a share outstanding throughout the period may not correlate with the Statement of Operations for the period due to the timing of sales and repurchase of the Fund shares in relation to income earned and/or fluctuating market value of the investments of the Fund. |
b | Based on average daily shares outstanding. |
c | Total return does not include any fees, charges or expenses imposed by the variable annuity and life insurance contracts for which the Franklin Templeton Variable Insurance Products Trust serves as an underlying investment vehicle. |
d | Amount rounds to less than $0.01 per share. |
e | Benefit of expense reduction rounds to less than 0.01%. |
f | Excludes the value of portfolio securities delivered as a result of a redemption in-kind. See Note 9. |
The accompanying notes are an integral part of these financial statements.
TF-9
Franklin Templeton Variable Insurance Products Trust
Financial Highlights (continued)
Templeton Foreign Securities Fund
| | | | | | | | | | | | |
| | | Year Ended December 31, | |
| Class 3 | | 2006 | | | 2005 | | | 2004g | |
| | | | |
Per share operating performance | | | | | | | | | | | | |
(for a share outstanding throughout the year) | | | | | | | | | | | | |
Net asset value, beginning of year | | $ | 15.60 | | | $ | 14.35 | | | $ | 12.48 | |
| | | | | | | | | | | | |
Income from investment operationsa: | | | | | | | | | | | | |
Net investment incomeb | | | 0.37 | | | | 0.25 | | | | 0.09 | |
Net realized and unrealized gains (losses) | | | 2.94 | | | | 1.18 | | | | 1.92 | |
| | | | |
Total from investment operations | | | 3.31 | | | | 1.43 | | | | 2.01 | |
| | | | |
Less distributions from net investment income | | | (0.23 | ) | | | (0.18 | ) | | | (0.14 | ) |
| | | | |
Redemption fees | | | —d | | | | —d | | | | —d | |
| | | | |
Net asset value, end of year | | $ | 18.68 | | | $ | 15.60 | | | $ | 14.35 | |
| | | | |
| | | |
Total returnc | | | 21.46% | | | | 10.13% | | | | 16.25% | |
Ratios/supplemental data | | | | | | | | | | | | |
Net assets, end of year (000’s) | | $ | 150,417 | | | $ | 47,462 | | | $ | 16,559 | |
Ratios to average net assets: | | | | | | | | | | | | |
Expenses | | | 1.00%e | | | | 1.02%e | | | | 1.07%e,h | |
Net investment income | | | 2.38% | | | | 1.78% | | | | 1.70% h | |
Portfolio turnover rate | | | 18.97% f | | | | 14.61% | | | | 10.91% | |
a | The amount shown for a share outstanding throughout the period may not correlate with the Statement of Operations for the period due to the timing of sales and repurchase of the Fund shares in relation to income earned and/or fluctuating market value of the investments of the Fund. |
b | Based on average daily shares outstanding. |
c | Total return does not include any fees, charges or expenses imposed by the variable annuity and life insurance contracts for which the Franklin Templeton Variable Insurance Products Trust serves as an underlying investment vehicle. Total return is not annualized for periods less than one year. |
d | Amount rounds to less than $0.01 per share. |
e | Benefit of expense reduction rounds to less than 0.01%. |
f | Excludes the value of portfolio securities delivered as a result of a redemption in-kind. See Note 9. |
g | For the period May 1, 2004 (effective date) to December 31, 2004. |
The accompanying notes are an integral part of these financial statements.
TF-10
Franklin Templeton Variable Insurance Products Trust
Statement of Investments, December 31, 2006
| | | | | | | |
| Templeton Foreign Securities Fund | | Country | | Shares | | Value |
Long Term Investments 93.2% | | | | | | | |
Common Stocks 91.7% | | | | | | | |
Air Freight & Logistics 0.9% | | | | | | | |
Deutsche Post AG | | Germany | | 1,087,912 | | $ | 32,886,648 |
| | | | | | | |
Airlines 0.8% | | | | | | | |
Qantas Airways Ltd. | | Australia | | 7,008,990 | | | 28,881,721 |
| | | | | | | |
Automobiles 0.8% | | | | | | | |
Bayerische Motoren Werke AG | | Germany | | 521,239 | | | 29,999,482 |
| | | | | | | |
Capital Markets 2.2% | | | | | | | |
Amvescap PLC | | United Kingdom | | 4,806,294 | | | 56,097,934 |
Nomura Holdings Inc. | | Japan | | 1,255,218 | | | 23,673,410 |
| | | | | | | |
| | | | | | | 79,771,344 |
| | | | | | | |
Chemicals 1.4% | | | | | | | |
Ciba Specialty Chemicals AG | | Switzerland | | 550,500 | | | 36,615,670 |
Lonza Group AG | | Switzerland | | 163,930 | | | 14,165,877 |
| | | | | | | |
| | | | | | | 50,781,547 |
| | | | | | | |
Commercial Banks 13.2% | | | | | | | |
Banco Santander Central Hispano SA | | Spain | | 1,814,669 | | | 33,871,715 |
DBS Group Holdings Ltd. | | Singapore | | 1,240,347 | | | 18,280,245 |
Hana Financial Group Inc. | | South Korea | | 672,040 | | | 35,336,297 |
aKookmin Bank, ADR | | South Korea | | 295,869 | | | 23,858,876 |
Mega Financial Holding Co. Ltd. | | Taiwan | | 34,084,000 | | | 25,051,766 |
Mitsubishi UFJ Financial Group Inc. | | Japan | | 5,541 | | | 68,427,521 |
Nordea Bank AB, FDR | | Sweden | | 2,018,478 | | | 31,227,843 |
Royal Bank of Scotland Group PLC | | United Kingdom | | 998,998 | | | 38,990,804 |
aShinhan Financial Group Co. Ltd. | | South Korea | | 762,930 | | | 38,966,855 |
Shinsei Bank Ltd. | | Japan | | 4,217,368 | | | 24,800,753 |
bShinsei Bank Ltd., 144A | | Japan | | 500,110 | | | 2,940,959 |
Sumitomo Mitsui Financial Group Inc. | | Japan | | 9,191 | | | 94,199,353 |
UniCredito Italiano SpA | | Italy | | 5,668,225 | | | 49,682,738 |
| | | | | | | |
| | | | | | | 485,635,725 |
| | | | | | | |
Commercial Services & Supplies 1.2% | | | | | | | |
Rentokil Initial PLC | | United Kingdom | | 6,271,598 | | | 20,388,091 |
Securitas AB, B | | Sweden | | 1,278,238 | | | 19,823,212 |
aSecuritas Systems AB, B | | Sweden | | 1,278,238 | | | 5,168,028 |
| | | | | | | |
| | | | | | | 45,379,331 |
| | | | | | | |
Computers & Peripherals 1.0% | | | | | | | |
Compal Electronics Inc. | | Taiwan | | 12,789,038 | | | 11,401,613 |
Lite-On Technology Corp. | | Taiwan | | 15,656,068 | | | 21,164,640 |
NEC Corp. | | Japan | | 1,000,219 | | | 4,781,153 |
| | | | | | | |
| | | | | | | 37,347,406 |
| | | | | | | |
Containers & Packaging 0.9% | | | | | | | |
Amcor Ltd. | | Australia | | 5,968,788 | | | 34,160,269 |
| | | | | | | |
Diversified Financial Services 3.5% | | | | | | | |
ING Groep NV | | Netherlands | | 1,621,448 | | | 71,895,778 |
KKR Private Equity Investors LP | | Guernsey Islands | | 1,150,749 | | | 26,294,615 |
bKKR Private Equity Investors LP, 144A | | Guernsey Islands | | 1,255,000 | | | 28,676,750 |
| | | | | | | |
| | | | | | | 126,867,143 |
| | | | | | | |
TF-11
Franklin Templeton Variable Insurance Products Trust
Statement of Investments, December 31, 2006 (continued)
| | | | | | | |
| Templeton Foreign Securities Fund | | Country | | Shares | | Value |
Long Term Investments (continued) | | | | | | | |
Common Stocks (continued) | | | | | | | |
Diversified Telecommunication Services 7.7% | | | | | | | |
BCE Inc. | | Canada | | 1,316,452 | | $ | 35,474,441 |
China Telecom Corp. Ltd., H | | China | | 58,406,357 | | | 31,984,353 |
Chunghwa Telecom Co. Ltd., ADR | | Taiwan | | 1,965,744 | | | 38,784,129 |
France Telecom SA | | France | | 1,996,173 | | | 55,204,257 |
aKT Corp., ADR | | South Korea | | 397,895 | | | 10,086,638 |
Singapore Telecommunications Ltd. | | Singapore | | 5,295,000 | | | 11,325,834 |
Telefonica SA, ADR | | Spain | | 612,344 | | | 39,036,930 |
Telefonos de Mexico SA de CV, L, ADR | | Mexico | | 1,476,635 | | | 41,729,705 |
Telenor ASA | | Norway | | 1,074,804 | | | 20,209,887 |
| | | | | | | |
| | | | | | | 283,836,174 |
| | | | | | | |
Electric Utilities 1.2% | | | | | | | |
aBritish Energy Group PLC | | United Kingdom | | 2,644,330 | | | 28,132,327 |
Hong Kong Electric Holdings Ltd. | | Hong Kong | | 3,453,969 | | | 16,916,529 |
| | | | | | | |
| | | | | | | 45,048,856 |
| | | | | | | |
Electrical Equipment 1.8% | | | | | | | |
Gamesa Corp. Tecnologica SA | | Spain | | 469,878 | | | 12,932,472 |
bGamesa Corp. Tecnologica SA, 144A | | Spain | | 1,012,244 | | | 27,860,033 |
aVestas Wind Systems AS | | Denmark | | 633,788 | | | 26,785,542 |
| | | | | | | |
| | | | | | | 67,578,047 |
| | | | | | | |
Electronic Equipment & Instruments 1.8% | | | | | | | |
Electrocomponents PLC | | United Kingdom | | 2,624,686 | | | 15,073,206 |
aFlextronics International Ltd. | | Singapore | | 1,755,290 | | | 20,150,729 |
Hitachi Ltd. | | Japan | | 3,178,263 | | | 19,811,578 |
Venture Corp. Ltd. | | Singapore | | 1,339,613 | | | 11,793,522 |
| | | | | | | |
| | | | | | | 66,829,035 |
| | | | | | | |
Food & Staples Retailing 2.2% | | | | | | | |
Alliance Boots PLC | | United Kingdom | | 3,483,927 | | | 57,174,627 |
William Morrison Supermarkets PLC | | United Kingdom | | 4,622,259 | | | 23,037,340 |
| | | | | | | |
| | | | | | | 80,211,967 |
| | | | | | | |
Food Products 1.9% | | | | | | | |
Nestle SA | | Switzerland | | 103,509 | | | 36,780,926 |
Unilever PLC | | United Kingdom | | 1,170,483 | | | 32,732,832 |
| | | | | | | |
| | | | | | | 69,513,758 |
| | | | | | | |
Health Care Providers & Services 0.4% | | | | | | | |
Celesio AG | | Germany | | 279,850 | | | 14,891,158 |
aHutchison China Meditech Ltd. | | Hong Kong | | 177 | | | 629 |
| | | | | | | |
| | | | | | | 14,891,787 |
| | | | | | | |
Hotels Restaurants & Leisure 1.9% | | | | | | | |
Compass Group PLC | | United Kingdom | | 9,792,178 | | | 55,611,879 |
TUI AG | | Germany | | 792,560 | | | 15,892,063 |
| | | | | | | |
| | | | | | | 71,503,942 |
| | | | | | | |
Household Durables 2.3% | | | | | | | |
aHusqvarna AB, B | | Sweden | | 785,757 | | | 12,271,719 |
Koninklijke Philips Electronics NV | | Netherlands | | 899,289 | | | 33,915,629 |
Sony Corp. | | Japan | | 904,219 | | | 38,740,849 |
| | | | | | | |
| | | | | | | 84,928,197 |
| | | | | | | |
TF-12
Franklin Templeton Variable Insurance Products Trust
Statement of Investments, December 31, 2006 (continued)
| | | | | | | |
| Templeton Foreign Securities Fund | | Country | | Shares | | Value |
Long Term Investments (continued) | | | | | | | |
Common Stocks (continued) | | | | | | | |
Industrial Conglomerates 3.2% | | | | | | | |
Hutchison Whampoa Ltd. | | Hong Kong | | 3,276,709 | | $ | 33,297,191 |
Siemens AG | | Germany | | 606,534 | | | 60,529,531 |
Smiths Group PLC | | United Kingdom | | 1,223,141 | | | 23,749,776 |
| | | | | | | |
| | | | | | | 117,576,498 |
| | | | | | | |
Insurance 7.1% | | | | | | | |
ACE Ltd. | | Bermuda | | 1,075,149 | | | 65,121,775 |
Aviva PLC | | United Kingdom | | 1,850,740 | | | 29,792,538 |
AXA SA | | France | | 453,589 | | | 18,363,973 |
bAXA SA, 144A | | France | | 38,270 | | | 1,549,396 |
Old Mutual PLC | | South Africa | | 12,806,104 | | | 43,699,864 |
Sompo Japan Insurance Inc. | | Japan | | 1,601,485 | | | 19,575,425 |
Swiss Reinsurance Co. | | Switzerland | | 495,733 | | | 42,146,764 |
XL Capital Ltd., A | | Bermuda | | 591,272 | | | 42,583,409 |
| | | | | | | |
| | | | | | | 262,833,144 |
| | | | | | | |
Leisure Equipment & Products 1.0% | | | | | | | |
FUJIFILM Holdings Corp. | | Japan | | 921,374 | | | 37,850,371 |
| | | | | | | |
Media 5.2% | | | | | | | |
British Sky Broadcasting Group PLC | | United Kingdom | | 6,401,066 | | | 65,435,448 |
Eutelsat Communications | | France | | 2,081,860 | | | 39,793,344 |
Pearson PLC | | United Kingdom | | 3,409,246 | | | 51,509,169 |
Reed Elsevier NV | | Netherlands | | 2,012,869 | | | 34,329,572 |
| | | | | | | |
| | | | | | | 191,067,533 |
| | | | | | | |
Metals & Mining 1.1% | | | | | | | |
Barrick Gold Corp. | | Canada | | 663,561 | | | 20,415,071 |
POSCO, ADR | | South Korea | | 255,230 | | | 21,099,864 |
| | | | | | | |
| | | | | | | 41,514,935 |
| | | | | | | |
Multi-Utilities 1.7% | | | | | | | |
Centrica PLC | | United Kingdom | | 2,772,071 | | | 19,244,687 |
Suez SA | | France | | 814,356 | | | 42,171,881 |
| | | | | | | |
| | | | | | | 61,416,568 |
| | | | | | | |
Oil, Gas & Consumable Fuels 7.7% | | | | | | | |
BP PLC | | United Kingdom | | 4,777,726 | | | 53,097,904 |
Eni SpA | | Italy | | 1,493,373 | | | 50,229,410 |
Hindustan Petroleum Corp. Ltd. | | India | | 1,031,444 | | | 6,509,215 |
Indian Oil Corp. Ltd. | | India | | 267,497 | | | 2,728,936 |
Reliance Industries Ltd. | | India | | 1,374,378 | | | 39,577,039 |
Repsol YPF SA | | Spain | | 1,487,591 | | | 51,448,793 |
Royal Dutch Shell PLC, B | | United Kingdom | | 1,879,537 | | | 65,886,158 |
Total SA, B | | France | | 204,496 | | | 14,752,491 |
| | | | | | | |
| | | | | | | 284,229,946 |
| | | | | | | |
Paper & Forest Products 3.2% | | | | | | | |
Norske Skogindustrier ASA | | Norway | | 1,362,151 | | | 23,483,102 |
Stora Enso OYJ, R | | Finland | | 2,665,971 | | | 42,025,465 |
UPM-Kymmene OYJ | | Finland | | 2,066,829 | | | 52,165,431 |
| | | | | | | |
| | | | | | | 117,673,998 |
| | | | | | | |
Pharmaceuticals 4.9% | | | | | | | |
GlaxoSmithKline PLC | | United Kingdom | | 2,755,715 | | | 72,531,029 |
Sanofi-Aventis | | France | | 855,625 | | | 79,006,268 |
Takeda Pharmaceutical Co. Ltd. | | Japan | | 421,454 | | | 28,926,611 |
| | | | | | | |
| | | | | | | 180,463,908 |
| | | | | | | |
TF-13
Franklin Templeton Variable Insurance Products Trust
Statement of Investments, December 31, 2006 (continued)
| | | | | | | |
| Templeton Foreign Securities Fund | | Country | | Shares | | Value |
Long Term Investments (continued) | | | | | | | |
Common Stocks (continued) | | | | | | | |
Real Estate Management & Development 2.2% | | | | | | | |
Cheung Kong (Holdings) Ltd. | | Hong Kong | | 6,650,922 | | $ | 81,863,158 |
| | | | | | | |
Semiconductors & Semiconductor Equipment 2.6% | | | | | | | |
aInfineon Technologies AG | | Germany | | 1,396,863 | | | 19,656,283 |
Samsung Electronics Co. Ltd. | | South Korea | | 85,747 | | | 56,519,259 |
Taiwan Semiconductor Manufacturing Co. Ltd. | | Taiwan | | 10,180,816 | | | 21,089,614 |
| | | | | | | |
| | | | | | | 97,265,156 |
| | | | | | | |
Software 0.9% | | | | | | | |
aCheck Point Software Technologies Ltd. | | Israel | | 1,448,281 | | | 31,746,320 |
| | | | | | | |
Specialty Retail 0.5% | | | | | | | |
Kingfisher PLC | | United Kingdom | | 3,691,096 | | | 17,239,870 |
| | | | | | | |
Textiles, Apparel & Luxury Goods 0.5% | | | | | | | |
Burberry Group PLC | | United Kingdom | | 1,512,618 | | | 19,121,228 |
| | | | | | | |
Water Utilities 0.6% | | | | | | | |
Companhia de Saneamento Basico do Estado de San Paulo, ADR | | Brazil | | 635,130 | | | 21,505,502 |
| | | | | | | |
Wireless Telecommunication Services 2.2% | | | | | | | |
Mobile Telesystems, ADR | | Russia | | 633,420 | | | 31,791,350 |
Vodafone Group PLC, ADR | | United Kingdom | | 1,773,520 | | | 49,268,385 |
| | | | | | | |
| | | | | | | 81,059,735 |
| | | | | | | |
Total Common Stocks (Cost $2,562,370,104) | | | | | | | 3,380,480,249 |
| | | | | | | |
Preferred Stocks 1.5% | | | | | | | |
Diversified Telecommunication Services 1.0% | | | | | | | |
Tele Norte Leste Participacoes SA, ADR, pfd. | | Brazil | | 2,524,665 | | | 37,668,001 |
| | | | | | | |
Metals & Mining 0.5% | | | | | | | |
Companhia Vale do Rio Doce, ADR, pfd., A | | Brazil | | 648,056 | | | 17,011,470 |
| | | | | | | |
Total Preferred Stocks (Cost $40,938,689) | | | | | | | 54,679,471 |
| | | | | | | |
Total Long Term Investments (Cost $2,603,308,792) | | | | | | | 3,435,159,720 |
| | | | | | | |
Short Term Investment (Cost $251,571,388) 6.8% | | | | | | | |
Money Market Fund 6.8% | | | | | | | |
cFranklin Institutional Fiduciary Trust Money Market Portfolio, 4.97% | | United States | | 251,571,388 | | | 251,571,388 |
| | | | | | | |
Total Investments (Cost $2,854,880,180) 100.0% | | | | | | | 3,686,731,108 |
Other Assets, less Liabilities 0.0% | | | | | | | 50,603 |
| | | | | | | |
Net Assets 100.0% | | | | | | $ | 3,686,781,711 |
| | | | | | | |
Selected Portfolio Abbreviations
ADR - American Depository Receipt
FDR - Foreign Depository Receipt
a | Non-income producing for the twelve months ended December 31, 2006. |
b | Security was purchased pursuant to Rule 144A under the Securities Act of 1933 and may be sold in transactions exempt from registration only to qualified institutional buyers or in a public offering registered under the Securities Act of 1933. These securities have been deemed liquid under guidelines approved by the Trust’s Board of Trustees. At December 31, 2006, the aggregate value of these securities was $61,027,138, representing 1.66% of net assets. |
c | See Note 7 regarding investments in the Franklin Institutional Fiduciary Trust Money Market Portfolio. The rate shown is the annualized seven-day yield at period end. |
The accompanying notes are an integral part of these financial statements.
TF-14
Franklin Templeton Variable Insurance Products Trust
Financial Statements
Statement of Assets and Liabilities
December 31, 2006
| | | |
| | | Templeton
Foreign
Securities Fund |
Assets: | | | |
Investments in securities: | | | |
Cost - Unaffiliated issuers | | $ | 2,603,308,792 |
Cost - Sweep Money Fund (Note 7) | | | 251,571,388 |
| | | |
Total cost of investments | | $ | 2,854,880,180 |
| | | |
Value - Unaffiliated issuers | | $ | 3,435,159,720 |
Value - Sweep Money Fund (Note 7) | | | 251,571,388 |
| | | |
Total value of investments | | | 3,686,731,108 |
Cash | | | 224,683 |
Receivables: | | | |
Capital shares sold | | | 7,715,765 |
Dividends | | | 3,986,528 |
| | | |
Total assets | | | 3,698,658,084 |
| | | |
Liabilities: | | | |
Payables: | | | |
Investment securities purchased | | | 281,308 |
Capital shares redeemed | | | 6,717,358 |
Affiliates | | | 3,394,595 |
Deferred taxes | | | 900,228 |
Accrued expenses and other liabilities | | | 582,884 |
| | | |
Total liabilities | | | 11,876,373 |
| | | |
Net assets, at value | | $ | 3,686,781,711 |
| | | |
Net assets consist of: | | | |
Paid-in capital | | $ | 2,598,327,587 |
Undistributed net investment income | | | 79,126,854 |
Net unrealized appreciation (depreciation) | | | 831,026,902 |
Accumulated net realized gain (loss) | | | 178,300,368 |
| | | |
Net assets, at value | | $ | 3,686,781,711 |
| | | |
Class 1: | | | |
Net assets, at value | | $ | 594,991,084 |
| | | |
Shares outstanding | | �� | 31,323,485 |
| | | |
Net asset value and maximum offering price per share | | $ | 19.00 |
| | | |
Class 2: | | | |
Net assets, at value | | $ | 2,941,373,961 |
| | | |
Shares outstanding | | | 157,076,790 |
| | | |
Net asset value and maximum offering price per share | | $ | 18.73 |
| | | |
Class 3: | | | |
Net assets, at value | | $ | 150,416,666 |
| | | |
Shares outstanding | | | 8,051,834 |
| | | |
Net asset value and maximum offering price per sharea | | $ | 18.68 |
| | | |
a | Redemption price is equal to net asset value less any redemption fees retained by the Fund. |
The accompanying notes are an integral part of these financial statements.
TF-15
Franklin Templeton Variable Insurance Products Trust
Financial Statements (continued)
Statement of Operations
for the year ended December 31, 2006
| | | | |
| | | Templeton
Foreign
Securities Fund | |
Investment income: | | | | |
Dividends: (net of foreign taxes $6,331,561) | | | | |
Unaffiliated issuers | | $ | 94,252,227 | |
Sweep Money Fund (Note 7) | | | 13,479,710 | |
Other income (Note 10) | | | 37,270 | |
| | | | |
Total investment income | | | 107,769,207 | |
| | | | |
Expenses: | | | | |
Management fees (Note 3a) | | | 19,201,074 | |
Administrative fees (Note 3b) | | | 2,961,776 | |
Distribution fees: (Note 3c) | | | | |
Class 2 | | | 6,336,161 | |
Class 3 | | | 220,422 | |
Unaffiliated transfer agent fees | | | 1,959 | |
Custodian fees (Note 4) | | | 928,195 | |
Reports to shareholders | | | 593,356 | |
Professional fees | | | 128,644 | |
Trustees’ fees and expenses | | | 14,831 | |
Other | | | 79,785 | |
| | | | |
Total expenses | | | 30,466,203 | |
Expense reductions (Note 4) | | | (17,577 | ) |
| | | | |
Net expenses | | | 30,448,626 | |
| | | | |
Net investment income | | | 77,320,581 | |
| | | | |
Realized and unrealized gains (losses): | | | | |
Net realized gain (loss) from: | | | | |
Investments (Includes gains from a redemption in-kind of $34,808,242) (Note 9) | | | 215,017,237 | |
Foreign currency transactions | | | 1,699,890 | |
| | | | |
Net realized gain (loss) | | | 216,717,127 | |
| | | | |
Net change in unrealized appreciation (depreciation) on: | | | | |
Investments | | | 343,266,282 | |
Translation of assets and liabilities denominated in foreign currencies | | | 39,935 | |
Change in deferred taxes on unrealized appreciation | | | (900,228 | ) |
| | | | |
Net change in unrealized appreciation (depreciation) | | | 342,405,989 | |
| | | | |
Net realized and unrealized gain (loss) | | | 559,123,116 | |
| | | | |
Net increase (decrease) in net assets resulting from operations | | $ | 636,443,697 | |
| | | | |
The accompanying notes are an integral part of these financial statements.
TF-16
Franklin Templeton Variable Insurance Products Trust
Financial Statements (continued)
Statements of Changes in Net Assets
| | | | | | | | |
| | | Templeton Foreign Securities Fund | |
| | | Year Ended December 31, | |
| | | 2006 | | | 2005 | |
| | | | |
Increase (decrease) in net assets: | | | | | | | | |
Operations: | | | | | | | | |
Net investment income | | $ | 77,320,581 | | | $ | 42,879,381 | |
Net realized gain (loss) from investments and foreign currency transactions | | | 216,717,127 | | | | 105,273,303 | |
Net change in unrealized appreciation (depreciation) on investments and translation of assets and liabilities denominated in foreign currencies and deferred taxes | | | 342,405,989 | | | | 103,792,704 | |
| | | | |
Net increase (decrease) in net assets resulting from operations | | | 636,443,697 | | | | 251,945,388 | |
| | | | |
Distribution to shareholders from: | | | | | | | | |
Net investment income: | | | | | | | | |
Class 1 | | | (7,899,286 | ) | | | (6,459,354 | ) |
Class 2 | | | (30,532,245 | ) | | | (20,723,612 | ) |
Class 3 | | | (1,067,001 | ) | | | (354,063 | ) |
| | | | |
Total distributions to shareholders | | | (39,498,532 | ) | | | (27,537,029 | ) |
| | | | |
Capital share transactions: (Note 2) | | | | | | | | |
Class 1 | | | (39,662,208 | ) | | | (19,374,244 | ) |
Class 2 | | | 232,018,498 | | | | 610,744,172 | |
Class 3 | | | 85,243,717 | | | | 27,501,947 | |
| | | | |
Total capital share transactions | | | 277,600,007 | | | | 618,871,875 | |
| | | | |
Redemption fees | | | 9,162 | | | | 4,290 | |
| | | | |
Net increase (decrease) in net assets | | | 874,554,334 | | | | 843,284,524 | |
Net assets: | | | | | | | | |
Beginning of year | | | 2,812,227,377 | | | | 1,968,942,853 | |
| | | | |
End of year | | $ | 3,686,781,711 | | | $ | 2,812,227,377 | |
| | | | |
Undistributed net investment income included in net assets: | | | | | | | | |
End of year | | $ | 79,126,854 | | | $ | 39,493,779 | |
| | | | |
The accompanying notes are an integral part of these financial statements.
TF-17
Franklin Templeton Variable Insurance Products Trust
Notes to Financial Statements
Templeton Foreign Securities Fund
1. ORGANIZATION AND SIGNIFICANT ACCOUNTING POLICIES
Franklin Templeton Variable Insurance Products Trust (the Trust) is registered under the Investment Company Act of 1940, as amended, (the 1940 Act) as an open-end investment company, consisting of twenty-two separate funds. The Templeton Foreign Securities Fund (the Fund) included in this report is diversified. The financial statements of the remaining funds in the Trust are presented separately. Shares of the Fund are sold only to insurance company separate accounts to fund the benefits of variable life insurance policies or variable annuity contracts. The Fund offers three classes of shares: Class 1, Class 2, and Class 3. Each class of shares differs by its distribution fees, voting rights on matters affecting a single class and its exchange privilege.
The following summarizes the Fund’s significant accounting policies.
a. Security Valuation
Securities listed on a securities exchange or on the NASDAQ National Market System are valued at the last quoted sale price or the official closing price of the day, respectively. Over-the-counter securities and listed securities for which there is no reported sale are valued within the range of the most recent quoted bid and ask prices. Securities that trade in multiple markets or on multiple exchanges are valued according to the broadest and most representative market. Investments in open-end mutual funds are valued at the closing net asset value.
Foreign securities are valued as of the close of trading on the foreign stock exchange on which the security is primarily traded, or the NYSE, whichever is earlier. If no sale is reported at that time, the foreign security will be valued within the range of the most recent quoted bid and ask prices. The value is then converted into its U.S. dollar equivalent at the foreign exchange rate in effect at the close of the NYSE on the day that the value of the foreign security is determined.
The Trust has procedures to determine the fair value of individual securities and other assets for which market prices are not readily available or which may not be reliably priced. Methods for valuing these securities may include: fundamental analysis, matrix pricing, discounts from market prices of similar securities, or discounts applied due to the nature and duration of restrictions on the disposition of the securities. Due to the inherent uncertainty of valuations of such securities, the fair values may differ significantly from the values that would have been used had a ready market for such investments existed. Occasionally, events occur between the time at which trading in a security is completed and the close of the NYSE that might call into question the availability (including the reliability) of the value of a portfolio security held by the Fund. The investment manager monitors price movements following the close of trading in foreign stock markets through a series of country specific market proxies (such as baskets of American Depository Receipts, futures contracts and exchange traded funds). These price movements are measured against established trigger thresholds for each specific market proxy to assist in determining if an event has occurred. If such an event occurs, the securities may be valued using fair value procedures, which may include the use of independent pricing services. All security valuation procedures are approved by the Trust’s Board of Trustees.
b. Foreign Currency Translation
Portfolio securities and other assets and liabilities denominated in foreign currencies are translated into U.S. dollars based on the exchange rate of such currencies against U.S. dollars on the date of valuation. Purchases and sales of securities, income and expense items denominated in foreign currencies are translated into U.S. dollars at the exchange rate in effect on the transaction date. Occasionally, events may impact the availability or reliability of foreign exchange rates used to convert the U.S. dollar equivalent value. If such an event occurs, the foreign exchange rate will be valued at fair value using procedures established and approved by the Trust’s Board of Trustees.
The Fund does not separately report the effect of changes in foreign exchange rates from changes in market prices on securities held. Such changes are included in net realized and unrealized gain or loss from investments on the Statement of Operations.
Realized foreign exchange gains or losses arise from sales of foreign currencies, currency gains or losses realized between the trade and settlement dates on securities transactions and the difference between the recorded amounts of dividends, interest, and
TF-18
Franklin Templeton Variable Insurance Products Trust
Notes to Financial Statements (continued)
Templeton Foreign Securities Fund
1. ORGANIZATION AND SIGNIFICANT ACCOUNTING POLICIES (continued)
b. Foreign Currency Translation (continued)
foreign withholding taxes and the U.S. dollar equivalent of the amounts actually received or paid. Net unrealized foreign exchange gains and losses arise from changes in foreign exchange rates on foreign denominated assets and liabilities other than investments in securities held at the end of the reporting period.
c. Foreign Currency Contracts
When the Fund purchases or sells foreign securities it may enter into foreign exchange contracts to minimize foreign exchange risk from the trade date to the settlement date of the transactions. A foreign exchange contract is an agreement between two parties to exchange different currencies at an agreed upon exchange rate on a specified date. Realized and unrealized gains and losses on these contracts are included in the Statement of Operations.
The risks of these contracts include movement in the values of the foreign currencies relative to the U.S. dollar and the possible inability of the counterparties to fulfill their obligations under the contracts, which may be in excess of the amount reflected in the Statement of Assets and Liabilities.
d. Income and Deferred Taxes
No provision has been made for U.S. income taxes because the Fund intends to qualify as a regulated investment company under the Internal Revenue Code and to distribute to shareholders substantially all of its taxable income and net realized gains.
Foreign securities held by the Fund may be subject to foreign taxation on dividend income received. Foreign taxes, if any, are recorded based on the tax regulations and rates that exist in the foreign markets in which the Fund invests.
The Fund may be subject to a tax imposed on net realized gains on securities of certain foreign countries. The Fund records an estimated deferred tax liability for net unrealized gains on these securities in an amount that would be payable if the securities were disposed of on the valuation date.
e. Security Transactions, Investment Income, Expenses and Distributions
Security transactions are accounted for on trade date. Realized gains and losses on security transactions are determined on a specific identification basis. Interest income and estimated expenses are accrued daily. Dividend income is recorded on the ex-dividend date except that certain dividends from foreign securities are recognized as soon as the Fund is notified of the ex-dividend date. Distributions to shareholders are recorded on the ex-dividend date and are determined according to income tax regulations (tax basis). Distributable earnings determined on a tax basis may differ from earnings recorded in accordance with accounting principles generally accepted in the United States. These differences may be permanent or temporary. Permanent differences are reclassified among capital accounts to reflect their tax character. These reclassifications have no impact on net assets or the results of operations. Temporary differences are not reclassified, as they may reverse in subsequent periods.
Common expenses incurred by the Trust are allocated among the funds based on the ratio of net assets of each fund to the combined net assets of the Trust. Fund specific expenses are charged directly to the fund that incurred the expense.
Realized and unrealized gains and losses and net investment income, other than class specific expenses, are allocated daily to each class of shares based upon the relative proportion of net assets of each class. Differences in class-level expenses may result in payment of different per share distributions by class.
TF-19
Franklin Templeton Variable Insurance Products Trust
Notes to Financial Statements (continued)
Templeton Foreign Securities Fund
1. ORGANIZATION AND SIGNIFICANT ACCOUNTING POLICIES (continued)
f. Accounting Estimates
The preparation of financial statements in accordance with accounting principles generally accepted in the United States of America requires management to make estimates and assumptions that affect the reported amounts of assets and liabilities at the date of the financial statements and the amounts of income and expenses during the reporting period. Actual results could differ from those estimates.
g. Redemption Fees
Redemptions and exchanges of Class 3 shares held 60 days or less may be subject to the Fund’s redemption fee, which is 1% of the amount redeemed. Such fees are retained by the Fund and accounted for as an addition to paid-in capital.
h. Guarantees and Indemnifications
Under the Trust’s organizational documents, its officers and trustees are indemnified by the Trust against certain liabilities arising out of the performance of their duties to the Trust. Additionally, in the normal course of business, the Trust enters into contracts with service providers that contain general indemnification clauses. The Trust’s maximum exposure under these arrangements is unknown as this would involve future claims that may be made against the Trust that have not yet occurred. Currently, the Trust expects the risk of loss to be remote.
2. SHARES OF BENEFICIAL INTEREST
At December 31, 2006, there were an unlimited number of shares authorized ($0.01 par value). Transactions in the Fund’s shares were as follows:
| | | | | | | | | | | | | | |
| | | Year Ended December 31, | |
| | | 2006 | | | 2005 | |
| Class 1 Shares: | | Shares | | | Amount | | | Shares | | | Amount | |
Shares sold | | 2,328,810 | | | $ | 39,073,549 | | | 3,758,655 | | | $ | 55,211,998 | |
Shares issued in reinvestment of distributions | | 492,781 | | | | 7,899,286 | | | 453,606 | | | | 6,459,354 | |
Shares redeemed | | (5,075,580 | ) | | | (86,635,043 | ) | | (5,489,770 | ) | | | (81,045,596 | ) |
| | | | | | | | | | | | | | |
Net increase (decrease) | | (2,253,989 | ) | | $ | (39,662,208 | ) | | (1,277,509 | ) | | $ | (19,374,244 | ) |
| | | | | | | | | | | | | | |
| |
| | | Year Ended December 31, | |
| | | 2006 | | | 2005 | |
| Class 2 Shares: | | Shares | | | Amount | | | Shares | | | Amount | |
Shares sold | | 43,227,824 | | | $ | 728,731,224 | | | 51,344,360 | | | $ | 745,826,623 | |
Shares issued in reinvestment of distributions | | 1,925,158 | | | | 30,455,999 | | | 1,472,894 | | | | 20,723,612 | |
Shares redeemed in-kind (Note 9) | | (8,720,489 | ) | | | (151,213,281 | ) | | — | | | | — | |
Shares redeemed | | (22,264,085 | ) | | | (375,955,444 | ) | | (10,646,257 | ) | | | (155,806,063 | ) |
| | | | | | | | | | | | | | |
Net increase (decrease) | | 14,168,408 | | | $ | 232,018,498 | | | 42,170,997 | | | $ | 610,744,172 | |
| | | | | | | | | | | | | | |
TF-20
Franklin Templeton Variable Insurance Products Trust
Notes to Financial Statements (continued)
Templeton Foreign Securities Fund
2. SHARES OF BENEFICIAL INTEREST (continued)
| | | | | | | | | | | | | | |
| | | Year Ended December 31, | |
| | | 2006 | | | 2005 | |
| Class 3 Shares: | | Shares | | | Amount | | | Shares | | | Amount | |
Shares sold | | 5,176,865 | | | $ | 88,136,330 | | | 2,107,457 | | | $ | 30,752,443 | |
Shares issued in reinvestment of distributions | | 67,617 | | | | 1,067,001 | | | 25,189 | | | | 353,916 | |
Shares redeemed | | (234,367 | ) | | | (3,959,614 | ) | | (244,990 | ) | | | (3,604,412 | ) |
| | | | | | | | | | | | | | |
Net increase (decrease) | | 5,010,115 | | | $ | 85,243,717 | | | 1,887,656 | | | $ | 27,501,947 | |
| | | | | | | | | | | | | | |
3. TRANSACTIONS WITH AFFILIATES
Franklin Resources, Inc. is the holding company for various subsidiaries that together are referred to as Franklin Templeton Investments. Certain officers and trustees of the Trust are also officers and/or directors of the following subsidiaries:
| | |
| Subsidiary | | Affiliation |
Templeton Investment Counsel, LLC (TIC) | | Investment manager |
Franklin Templeton Services, LLC (FT Services) | | Administrative manager |
Franklin Templeton Distributors, Inc. (Distributors) | | Principal underwriter |
Franklin Templeton Investor Services, LLC (Investor Services) | | Transfer agent |
a. Management Fees
Effective May 1, 2006, the Fund pays an investment management fee to TIC based on the average daily net assets of the Fund as follows:
| | |
| Annualized Fee Rate | | Net Assets |
| 0.750% | | Up to and including $200 million |
| 0.675% | | Over $200 million, up to and including $1.3 billion |
| 0.600% | | Over $1.3 billion, up to and including $10 billion |
| 0.580% | | Over $10 billion, up to and including $15 billion |
| 0.560% | | Over $15 billion, up to and including $20 billion |
| 0.540% | | In excess of $20 billion |
Prior to May 1, 2006, the annualized rate of 0.600% was applicable to net assets in excess of $1.3 billion.
b. Administrative Fees
The Fund pays an administrative fee to FT Services based on the average daily net assets of the Fund as follows:
| | |
| Annualized Fee Rate | | Net Assets |
| 0.150% | | Up to and including $200 million |
| 0.135% | | Over $200 million, up to and including $700 million |
| 0.100% | | Over $700 million, up to and including $1.2 billion |
| 0.075% | | In excess of $1.2 billion |
c. Distribution Fees
The Fund’s Board of Trustees has adopted distribution plans for Class 2 and Class 3 shares pursuant to Rule 12b-1 under the 1940 Act. Under the Fund’s compensation distribution plans, the Fund pays Distributors for costs incurred in connection with the servicing, sale and distribution of the Fund’s shares up to 0.25% and 0.35% per year of its average daily net assets of Class 2 and Class 3, respectively. The Board of Trustees has agreed to limit the current rate to 0.25% per year for Class 3.
TF-21
Franklin Templeton Variable Insurance Products Trust
Notes to Financial Statements (continued)
Templeton Foreign Securities Fund
3. TRANSACTIONS WITH AFFILIATES (continued)
d. Transfer Agent Fees
Investor Services, under terms of an agreement, performs shareholder servicing for the Fund and is not paid by the Fund for the services.
4. EXPENSE OFFSET ARRANGEMENT
The Fund has entered into an arrangement with its custodian whereby credits realized as a result of uninvested cash balances are used to reduce a portion of the Fund’s custodian expenses. During the year ended December 31, 2006, the custodian fees were reduced as noted in the Statement of Operations.
5. INCOME TAXES
For tax purposes, capital losses may be carried over to offset future capital gains, if any. During the year ended December 31, 2006, the Fund utilized $1,301,670 of capital loss carryforwards.
For tax purposes, realized currency losses, occurring subsequent to October 31, may be deferred and treated as occurring on the first day of the following fiscal year. At December 31, 2006, the Fund deferred realized currency losses of $606,955.
The tax character of distributions paid during the years ended December 31, 2006 and 2005, was as follows:
| | | | | | |
| | | 2006 | | 2005 |
Distributions paid from ordinary income | | $ | 39,498,532 | | $ | 27,537,029 |
| | | | | |
At December 31, 2006, the cost of investments, net unrealized appreciation (depreciation), undistributed ordinary income and undistributed long term capital gains for income tax purposes were as follows:
| | | | |
Cost of investments | | $ | 2,854,880,180 | |
| | | | |
Unrealized appreciation | | $ | 856,496,210 | |
Unrealized depreciation | | | (24,645,282 | ) |
| | | | |
Net unrealized appreciation (depreciation) | | $ | 831,850,928 | |
| | | | |
Undistributed ordinary income | | $ | 87,855,172 | |
Undistributed long term capital gains | | | 170,179,007 | |
| | | | |
Distributable earnings | | $ | 258,034,179 | |
| | | | |
Net investment income differs for financial statement and tax purposes primarily due to differing treatments of foreign currency transactions.
Net realized gains (losses) differ for financial statement and tax purposes primarily due to differing treatment of gains realized on in-kind shareholder redemptions and foreign currency transactions.
6. INVESTMENT TRANSACTIONS
Purchases and sales of investments (excluding short term securities) for the year ended December 31, 2006, aggregated $1,135,821,788 and $549,647,692, respectively. Sales of investments excludes $151,213,281 of an in-kind redemption.
TF-22
Franklin Templeton Variable Insurance Products Trust
Notes to Financial Statements (continued)
Templeton Foreign Securities Fund
7. INVESTMENTS IN FRANKLIN INSTITUTIONAL FIDUCIARY TRUST MONEY MARKET PORTFOLIO
The Fund may invest in the Franklin Institutional Fiduciary Trust Money Market Portfolio (the Sweep Money Fund), an open-end investment company managed by Franklin Advisers, Inc. (an affiliate of the investment manager). Management fees paid by the Fund are reduced on assets invested in the Sweep Money Fund, in an amount not to exceed the management and administrative fees paid by the Sweep Money Fund.
8. CONCENTRATION OF RISK
Investing in foreign securities may include certain risks and considerations not typically associated with investing in U.S. securities, such as fluctuating currency values and changing local and regional economic, political and social conditions, which may result in greater market volatility. In addition, certain foreign securities may not be as liquid as U.S. securities.
9. REDEMPTION IN-KIND
During the year ended December 31, 2006, the Fund realized $34,808,242 of net gains resulting from a redemption in-kind in which a shareholder redeemed fund shares for securities held by the Fund rather than for cash. Because such gains are not taxable to the Fund, and are not distributed to shareholders, they have been reclassified from accumulated net realized gains to paid-in capital.
10. REGULATORY MATTERS
As part of various investigations by a number of federal, state, and foreign regulators and governmental entities, including the Securities and Exchange Commission (“SEC”), relating to certain practices in the mutual fund industry, including late trading, market timing and marketing support payments to securities dealers who sell fund shares (“marketing support”), Franklin Resources, Inc. and certain of its subsidiaries (collectively, the “Company”), entered into settlements with certain of those regulators. Specifically, the Company entered into settlements with the SEC, among others, concerning market timing and marketing support.
On June 23, 2006, the SEC approved the proposed plan of distribution for the marketing support settlement, and disbursement of the settlement monies to the designated funds, in accordance with the terms and conditions of that settlement and plan, was completed in September 2006 and is recorded as other income.
The plan of distribution for the market timing settlement is currently under review by the SEC staff. After publication of notice of the plan and a 30-day comment period, the proposed plan of distribution will be submitted to the SEC for approval. Following the SEC’s approval of the plan of distribution, with modifications as appropriate, distribution of the settlement monies will begin in accordance with the terms and conditions of the settlement and plan.
In addition, the Company, as well as most of the mutual funds within Franklin Templeton Investments and certain current or former officers, Company directors, fund directors, and employees, have been named in private lawsuits (styled as shareholder class actions, or as derivative actions on behalf of either the named funds or Franklin Resources, Inc.). The lawsuits relate to the industry practices referenced above, as well as to allegedly excessive commissions and advisory and distribution fees.
The Company and fund management believe that the claims made in each of the private lawsuits referenced above are without merit and intend to defend against them vigorously. The Company cannot predict with certainty the eventual outcome of these lawsuits, nor whether they will have a material negative impact on the Company. If it is determined that the Company bears responsibility for any unlawful or inappropriate conduct that caused losses to the Trust, it is committed to making the Trust or its shareholders whole, as appropriate.
TF-23
Franklin Templeton Variable Insurance Products Trust
Notes to Financial Statements (continued)
Templeton Foreign Securities Fund
11. NEW ACCOUNTING PRONOUNCEMENTS
In July 2006, the Financial Accounting Standards Board (FASB) issued FASB Interpretation No. 48, “Accounting for Uncertainty in Income Taxes – an Interpretation of FASB Statement No. 109” (“FIN 48”), which clarifies the accounting for uncertainty in tax positions taken or expected to be taken in a tax return. FIN 48 provides guidance on the measurement, recognition, classification and disclosure of tax positions, along with accounting for the related interest and penalties. FIN 48 is effective for fiscal years beginning after December 15, 2006, and is to be applied to all open tax years as of the date of effectiveness. On December 22, 2006, the Securities and Exchange Commission extended the implementation date to no later than the last net asset value calculation in the first semi-annual reporting period in 2007. The Fund is currently evaluating the impact, if any, of applying the various provisions of FIN 48.
In September 2006, FASB issued FASB Statement No. 157, “Fair Value Measurement” (“SFAS 157”), which defines fair value, establishes a framework for measuring fair value, and expands disclosures about fair value measurements. SFAS 157 is effective for fiscal years beginning after November 15, 2007, and interim periods within those fiscal years. The Trust believes the adoption of SFAS 157 will have no material impact on its financial statements.
TF-24
Franklin Templeton Variable Insurance Products Trust
Templeton Foreign Securities Fund
Report of Independent Registered Public Accounting Firm
To the Board of Trustees and Shareholders of
Franklin Templeton Variable Insurance Products Trust
In our opinion, the accompanying statement of assets and liabilities, including the statement of investments, and the related statements of operations and of changes in net assets and the financial highlights present fairly, in all material respects, the financial position of the Templeton Foreign Securities Fund (one of the funds constituting the Franklin Templeton Variable Insurance Products Trust, hereafter referred to as the “Fund”) at December 31, 2006, the results of its operations for the year then ended, the changes in its net assets for each of the two years in the period then ended and the financial highlights for each of the periods presented, in conformity with accounting principles generally accepted in the United States of America. These financial statements and financial highlights (hereafter referred to as “financial statements”) are the responsibility of the Fund’s management; our responsibility is to express an opinion on these financial statements based on our audits. We conducted our audits of these financial statements in accordance with the standards of the Public Company Accounting Oversight Board (United States). Those standards require that we plan and perform the audit to obtain reasonable assurance about whether the financial statements are free of material misstatement. An audit includes examining, on a test basis, evidence supporting the amounts and disclosures in the financial statements, assessing the accounting principles used and significant estimates made by management, and evaluating the overall financial statement presentation. We believe that our audits, which included confirmation of securities at December 31, 2006 by correspondence with the custodian and brokers, provide a reasonable basis for our opinion.
PricewaterhouseCoopers LLP
San Francisco, California
February 16, 2007
TF-25
Franklin Templeton Variable Insurance Products Trust
Tax Designation (unaudited)
Templeton Foreign Securities Fund
Under Section 852(b)(3)(C) of the Internal Revenue Code (Code), the Fund designates the maximum amount allowable but no less than $170,179,007 as a long term capital gain dividend for the fiscal year ended December 31, 2006.
At December 31, 2006, more than 50% of the Fund’s total assets were invested in securities of foreign issuers. In most instances, foreign taxes were withheld from dividends paid to the Fund on these investments. The Fund elects to treat foreign taxes paid as allowed under Section 853 of the Internal Revenue Code (Code). This election will allow shareholders of record in June 2007, to treat their proportionate share of foreign taxes paid by the Fund as having been paid directly by them. Shareholders shall consider these amounts as foreign taxes paid in the tax year in which they receive the Fund distribution.
The foreign tax information will be disclosed in the June 30, 2007, semi-annual report of the Fund.
TF-26
Templeton Global Income Securities Fund
We are pleased to bring you Templeton Global Income Securities Fund’s annual report for the fiscal year ended December 31, 2006.
Performance Summary as of 12/31/06
Average annual total return of Class 3 shares* represents the average annual change in value, assuming reinvestment of dividends and capital gains. Average returns smooth out variations in returns, which can be significant; they are not the same as year-by-year results.
Periods ended 12/31/06
| | | | | | |
| | | 1-Year | | 5-Year | | 10-Year |
Average Annual Total Return | | +12.84% | | +13.21% | | +7.39% |
*Class 3 and Class 2 shares were not offered until 4/1/05 and 1/6/99, respectively. As a result, Class 3 Fund performance for periods prior to 4/1/05 represents historical results of Class 2 shares which, for periods prior to 1/6/99, reflects historical results of Class 1 shares. For periods beginning on 1/6/99, Class 2’s results reflect an additional 12b-1 fee expense, which also affects future performance. The 12b-1 fee rate is currently the same for Classes 2 and 3. Since 4/1/05 (effective date), the total return of Class 3 shares was +6.65%.
Total Return Index Comparison for Hypothetical $10,000 Investment (1/1/97–12/31/06)
The graph below shows the change in value of a hypothetical $10,000 investment in the Fund over the indicated period and includes reinvestment of any income or distributions. The Fund’s performance is compared to the performance of the J.P. Morgan (JPM) Government Bond Index (GBI) Global, as well as the Consumer Price Index (CPI). One cannot invest directly in an index, nor is an index representative of the Fund’s portfolio. Please see Important Notes to Performance Information preceding the Fund Summaries.
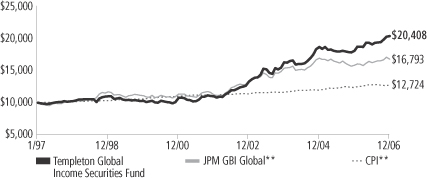
**Sources: J.P. Morgan; Standard & Poor’s Micropal. Please see Index Descriptions following the Fund Summaries.
Templeton Global Income Securities Fund – Class 3
Performance reflects the Fund’s Class 3 operating expenses, but does not include any contract fees, expenses or sales charges. If they had been included, performance would be lower. These charges and deductions, particularly for variable life policies, can have a significant effect on contract values and insurance benefits. See the contract prospectus for a complete description of these expenses, including sales charges.
Performance data represent past performance, which does not guarantee future results. Investment return and principal value will fluctuate, and you may have a gain or loss when you sell your shares.
Current performance may differ from figures shown.
TGI-1
Fund Goals and Main Investments: Templeton Global Income Securities Fund seeks high current income, consistent with preservation of capital, with capital appreciation as a secondary consideration. The Fund normally invests mainly in debt securities of governments and their political subdivisions and agencies, supranational organizations and companies located anywhere in the world, including emerging markets.
Performance Overview
You can find the Fund’s one-year total return in the Performance Summary. The Fund outperformed its benchmark, the JPM GBI Global, which delivered a +5.94% total return in U.S. dollar terms for the year under review.1
Economic and Market Overview
The U.S. economy slowed in 2006, led by a downturn in investment, particularly in housing. Consumption continued to be strong, hurting the country’s external balance of payments as the trade and current account deficits grew to record size. The current account deficit, which was 6.8% of gross domestic product (GDP) in third quarter 2006, was largely the result of low American savings that made the U.S. dependent on short-term financing from Asian and oil-producing countries with current account surpluses.2 Monetary policy did not loosen in response to this slowdown because inflationary concerns persisted. The Federal Reserve Board raised rates 100 basis points (100 basis points equal one percentage point) bringing it to 5.25% in June to reduce inflationary pressure.
In other parts of the developed world, Europe’s growth accelerated while Japan slowly came out of deflation. Euro-zone GDP growth increased, led by exports and investment. Capacity utilization increased as the labor market improved despite interest rate hikes. In Japan, industrial production increased along with capacity utilization, an indication of economic improvement despite continuing low real GDP growth. The Bank of Japan raised its interest rate 25 basis points during the year in response to rising consumer prices in the second quarter, a positive sign for an economy that suffered prolonged deflation.
Many emerging market economies had a very good year, particularly commodity exporters. High international prices for raw materials,
1. Source: J.P. Morgan. One cannot invest directly in an index, nor is an index representative of the Fund’s portfolio. Please see Index Descriptions following the Fund Summaries.
2. Source: Bureau of Economic Analysis.
Fund Risks: Because the Fund invests in bonds and other debt obligations, the Fund’s share price and yield will be affected by interest rate movements. Bond prices generally move in the opposite direction of interest rates. Thus, as prices of bonds in the Fund adjust to a rise in interest rates, the Fund’s share price may decline. High yield, lower-rated (junk) bonds generally have greater price swings and higher default risks. Foreign investing, especially in emerging markets, involves additional risks including currency fluctuations, economic instability, and social and political developments. The Fund’s prospectus also includes a description of the main investment risks.
What is a current account?
A current account is that part of the balance of payments where all of one country’s international transactions in goods and services are recorded.
What is balance of payments?
Balance of payments is a record of all of a country’s exports and imports of goods and services, borrowing and lending with the rest of the world during a particular time period. It helps a country evaluate its competitive strengths and weaknesses and forecast the strength of its currency.
TGI-2
caused in part by Asia’s surge in demand, resulted in strong export growth. Higher profits in these sectors also increased foreign investment and boosted overall production. Growth helped improve many
countries’ debt profiles, as did high liquidity in the international market, which lowered the cost of debt. Finally, inflation dropped in many countries due to effective monetary and fiscal policies.
Investment Strategy
We allocate the Fund’s assets among issuers, geographic regions, and currencies based upon our assessment of relative interest rates among currencies, our outlook for changes in interest rates and currencies, and credit risks. In considering these factors, we may evaluate a country’s changing market, economic and political conditions, such as inflation rate, growth prospects, global trade patterns and government policies. We seek to manage the Fund’s exposure to various currencies, and may from time to time seek to hedge (protect) against currency risk by using forward currency exchange contracts.
Manager’s Discussion
The Fund’s total return was influenced by various factors including currency movements, interest rate developments and exposure to sovereign debt markets.
Currency Strategy
In the current environment of rising interest rates and low spreads for credit risk, an increased share of total return came from exchange rate movements. Foreign currencies generally performed well in 2006 as the U.S. dollar fell 4.22% against its major trading partners.3 This decline was mainly due to slowing U.S. growth and continuing global imbalances centered on the U.S. current account deficit. Also contributing to the dollar’s depreciation was a narrower gap between U.S. interest rates and those of other developed countries as the Fed paused its rate hikes while other central banks continued theirs. The U.S. dollar’s weakness helped the Fund’s relative performance because the Fund was well diversified in currency exposure and was underweighted in the dollar compared with the benchmark index.
In the second half of the year, the Fund added a position in the Japanese yen due to improving fundamentals and our belief that it was relatively cheap because of weak past performance. During that period, deflation ended, the economy expanded and the central bank raised
3. Source: Federal Reserve H10 Report.
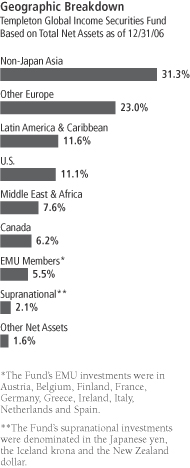
TGI-3
interest rates. However, the Fund remained underweighted compared with the benchmark index and benefited relatively from the yen’s 0.94% depreciation against the dollar during the year.4 The euro appreciated 11.79% against the dollar, largely because the European Central Bank hiked interest rates 125 basis points and euro-zone growth accelerated to 2.7% in the third quarter compared with a year earlier.4, 5 Despite this strong performance, our commitment to currency diversification led us to favor non-euro European countries. The Fund’s underweighted position versus the euro detracted from relative performance, but this was offset by our overweighted positions in other European currencies that outperformed the index and the euro.
Our strategy of favoring peripheral countries worked well for the Fund in 2006, particularly in the cases of Sweden and South Korea. The Swedish krona appreciated 16.3% against the dollar in part because interest rates increased 150 basis points.4, 6 Also, Sweden accumulated a trade surplus of $18.9 billion through November and a fiscal surplus of $8.1 billion during that time frame.6 These strong fundamentals and increasing economic activity led the Fund to hold a significantly overweighted position throughout the year that helped relative performance. Also benefiting the Fund, the South Korean won appreciated 8.69% as interest rates increased 75 basis points, international reserves rose, the current account posted a surplus of nearly $6 billion through November, and growth accelerated.4, 7
Interest Rate Strategy
Strong growth in many parts of the world continued to push up interest rates. Therefore, we maintained short duration positions in many countries. However, we found select opportunities where specific cycles created falling interest rate environments that were profitable for the Fund in the past year. One notable example was Indonesia where interest rates were lowered 300 basis points as inflation fell significantly.8 The country’s CPI declined from 17.1% in December 2005 to 6.6% in December 2006.8 Indonesia’s bond market returned +29.53% during the year in local currency terms according to the HSBC Asian Local
4. Source: Exshare (via Compustat via FactSet).
5. Source: Eurostat.
6. Source: Sveriges Riksbank.
7. Source: Bank of Korea.
8. Source: Bank Indonesia.
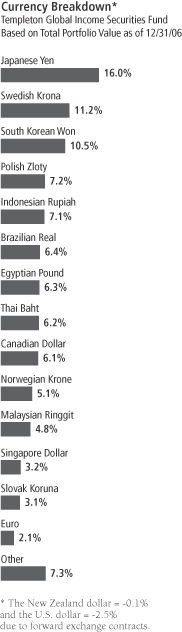
The dollar value, number of shares or principal amount, and names of all portfolio holdings are listed in the Fund’s Statement of Investments.
TGI-4
Bond Index (ALBI), and contributed to the Fund’s outperformance.9 Poland was another example where a country’s specific interest rate cycle contributed to the Fund’s relative return. Poland’s bond market returned 5.2% in local currency terms according to the JPM GBI Global.10 Poland ended a long string of interest rate cuts in February, and its interest rate ended down 50 basis points for the year.11
Global Sovereign Debt Strategy
The Fund also invested in sovereign debt that typically compensates for greater credit risk by offering higher yields relative to U.S. and European benchmark Treasury curves. This risk premium declined in 2006 and more money entered the market. The yield spread between U.S. Treasuries and the JPM Emerging Markets Bond Index Global (EMBIG) fell from 237 to 171 basis points over the 12-month period.10 This trend of higher valuations led the Fund to increasingly find value in local markets. In addition to being relatively cheaper, these instruments could benefit from currency appreciation in a weak dollar environment. The Fund’s performance benefited from the improving outlook for sovereign debt, especially of non-Japan Asia and Latin America, because lower perceived risk of credit events led to higher prices.
Thank you for your participation in Templeton Global Income Securities Fund. We look forward to serving your future investment needs.
9. Source: S&P Micropal. Please see Index Descriptions following the Fund Summaries.
10. Source: J.P. Morgan. Please see Index Descriptions following the Fund Summaries.
11. Source: National Bank of Poland.
The foregoing information reflects our analysis, opinions and portfolio holdings as of December 31, 2006, the end of the reporting period. The way we implement our main investment strategies and the resulting portfolio holdings may change depending on factors such as market and economic conditions. These opinions may not be relied upon as investment advice or an offer for a particular security. The information is not a complete analysis of every aspect of any market, country, industry, security or the Fund. Statements of fact are from sources considered reliable, but the investment manager makes no representation or warranty as to their completeness or accuracy. Although historical performance is no guarantee of future results, these insights may help you understand our investment management philosophy.
TGI-5
Templeton Global Income Securities Fund – Class 3
Fund Expenses
As an investor in a variable insurance contract (“Contract”) that indirectly provides for investment in an underlying mutual fund, you can incur transaction and/or ongoing expenses at both the Fund level and the Contract level.
| • | | Transaction expenses can include sales charges (loads) on purchases, redemption fees, surrender fees, transfer fees and premium taxes. |
| • | | Ongoing expenses can include management fees, distribution and service (12b-1) fees, contract fees, annual maintenance fees, mortality and expense risk fees and other fees and expenses. All mutual funds and Contracts have some types of ongoing expenses. |
The expenses shown in the table are meant to highlight ongoing expenses at the Fund level only and do not include ongoing expenses at the Contract level, or transaction expenses at either the Fund or Contract level. While the Fund does not have transaction expenses, if the transaction and ongoing expenses at the Contract level were included, the expenses shown would be higher. You should consult your Contract prospectus or disclosure document for more information.
The table shows Fund-level ongoing expenses and can help you understand these expenses and compare them with those of other mutual funds offered through the Contract. The table assumes a $1,000 investment held for the six months indicated. Please refer to the Fund prospectus for additional information on operating expenses.
Actual Fund Expenses
The first line (Actual) of the table provides actual account values and expenses. The “Ending Account Value” is derived from the Fund’s actual return, which includes the effect of ongoing Fund expenses, but does not include the effect of ongoing Contract expenses.
You can estimate the Fund-level expenses you incurred during the period by following these steps. Of course, your account value and expenses will differ from those in this illustration:
| 1. | Divide your account value by $1,000. |
If an account had an $8,600 value, then $8,600 ÷ $1,000 = 8.6.
| 2. | Multiply the result by the number under the heading “Fund-Level Expenses Incurred During Period.” |
If Fund-Level Expenses Incurred During Period were $7.50, then 8.6 x $7.50 = $64.50.
In this illustration, the estimated expenses incurred this period at the Fund level are $64.50.
TGI-6
Hypothetical Example for Comparison with Other Mutual Funds
Information in the second line (Hypothetical) of the table can help you compare ongoing expenses of the Fund with those of other mutual funds offered through the Contract. This information may not be used to estimate the actual ending account balance or expenses you incurred during the period. The hypothetical “Ending Account Value” is based on the Fund’s actual expense ratio and an assumed 5% annual rate of return before expenses, which does not represent the Fund’s actual return. The figure under the heading “Fund-Level Expenses Incurred During Period” shows the hypothetical expenses your account would have incurred under this scenario. You can compare this figure with the 5% hypothetical examples that appear in shareholder reports of other funds offered through a Contract.
| | | | | | | | | |
| Class 3 | | Beginning
Account
Value 7/1/06 | | Ending
Account
Value 12/31/06 | | Fund-Level
Expenses Incurred
During Period*
7/1/06-12/31/06 |
Actual | | $ | 1,000 | | $ | 1,069.00 | | $ | 5.22 |
Hypothetical (5% return before expenses) | | $ | 1,000 | | $ | 1,020.16 | | $ | 5.09 |
*Expenses are equal to the annualized expense ratio for the Fund’s Class 3 shares (1.00%), which does not include any ongoing expenses of the Contract for which the Fund is an investment option, multiplied by the average account value over the period, multiplied by 184/365 to reflect the one-half year period.
TGI-7
Franklin Templeton Variable Insurance Products Trust
Financial Highlights
Templeton Global Income Securities Fund
| | | | | | | | | | | | | | | | | | | | |
| | | Year Ended December 31, | |
| Class 1 | | 2006 | | | 2005 | | | 2004 | | | 2003 | | | 2002 | |
| | | | |
Per share operating performance | | | | | | | | | | | | | | | | | | | | |
(for a share outstanding throughout the year) | | | | | | | | | | | | | | | | | | | | |
Net asset value, beginning of year | | $ | 14.36 | | | $ | 15.80 | | | $ | 15.54 | | | $ | 13.67 | | | $ | 11.39 | |
| | | | |
Income from investment operationsa: | | | | | | | | | | | | | | | | | | | | |
Net investment incomeb | | | 0.61 | | | | 0.57 | | | | 0.66 | | | | 0.69 | | | | 0.59 | |
Net realized and unrealized gains (losses) | | | 1.24 | | | | (1.03 | ) | | | 1.37 | | | | 2.35 | | | | 1.83 | |
| | | | |
Total from investment operations | | | 1.85 | | | | (0.46 | ) | | | 2.03 | | | | 3.04 | | | | 2.42 | |
| | | | |
Less distributions from net investment income | | | (0.48 | ) | | | (0.98 | ) | | | (1.77 | ) | | | (1.17 | ) | | | (0.14 | ) |
| | | | |
Redemption fees | | | — | d | | | — | d | | | — | | | | — | | | | — | |
| | | | |
Net asset value, end of year | | $ | 15.73 | | | $ | 14.36 | | | $ | 15.80 | | | $ | 15.54 | | | $ | 13.67 | |
| | | | |
| | | | | |
Total returnc | | | 13.14% | | | | (2.91)% | | | | 15.09% | | | | 22.72% | | | | 21.44% | |
Ratios/supplemental data | | | | | | | | | | | | | | | | | | | | |
Net assets, end of year (000’s) | | $ | 75,843 | | | $ | 53,115 | | | $ | 49,845 | | | $ | 52,842 | | | $ | 50,622 | |
Ratios to average net assets: | | | | | | | | | | | | | | | | | | | | |
Expenses before expense reduction | | | 0.80% | | | | 0.78% | | | | 0.79% | | | | 0.76% | | | | 0.73% | |
Expenses net of expense reduction | | | 0.72% | | | | 0.74% | | | | 0.78% | | | | 0.76% | | | | 0.73% | |
Net investment income | | | 4.09% | | | | 3.81% | | | | 4.40% | | | | 4.72% | | | | 4.88% | |
Portfolio turnover rate | | | 30.65% | | | | 30.28% | | | | 37.39% | | | | 53.01% | | | | 27.91% | |
| a | The amount shown for a share outstanding throughout the period may not correlate with the Statement of Operations for the period due to the timing of sales and repurchase of the Fund shares in relation to income earned and/or fluctuating market value of the investments of the Fund. |
| b | Based on average daily shares outstanding. |
| c | Total return does not include any fees, charges or expenses imposed by the variable annuity and life insurance contracts for which the Franklin Templeton Variable Insurance Products Trust serves as an underlying investment vehicle. |
| d | Amount rounds to less than $0.01 per share. |
The accompanying notes are an integral part of these financial statements.
TGI-8
Franklin Templeton Variable Insurance Products Trust
Financial Highlights (continued)
Templeton Global Income Securities Fund
| | | | | | | | | | | | | | | | | | | | |
| | | Year Ended December 31, | |
| Class 2 | | 2006 | | | 2005 | | | 2004 | | | 2003 | | | 2002 | |
| | | | |
Per share operating performance | | | | | | | | | | | | | | | | | | | | |
(for a share outstanding throughout the year) | | | | | | | | | | | | | | | | | | | | |
Net asset value, beginning of year | | $ | 14.19 | | | $ | 15.64 | | | $ | 15.42 | | | $ | 13.59 | | | $ | 11.33 | |
| | | | |
Income from investment operationsa: | | | | | | | | | | | | | | | | | | | | |
Net investment incomeb | | | 0.57 | | | | 0.52 | | | | 0.60 | | | | 0.65 | | | | 0.54 | |
Net realized and unrealized gains (losses) | | | 1.21 | | | | (1.00 | ) | | | 1.36 | | | | 2.33 | | | | 1.84 | |
| | | | |
Total from investment operations | | | 1.78 | | | | (0.48 | ) | | | 1.96 | | | | 2.98 | | | | 2.38 | |
| | | | |
Less distributions from net investment income | | | (0.47 | ) | | | (0.97 | ) | | | (1.74 | ) | | | (1.15 | ) | | | (0.12 | ) |
| | | | |
Redemption fees | | | — | d | | | — | d | | | — | | | | — | | | | — | |
| | | | |
Net asset value, end of year | | $ | 15.50 | | | $ | 14.19 | | | $ | 15.64 | | | $ | 15.42 | | | $ | 13.59 | |
| | | | |
| | | | | |
Total returnc | | | 12.77% | | | | (3.08)% | | | | 14.74% | | | | 22.44% | | | | 21.15% | |
Ratios/supplemental data | | | | | | | | | | | | | | | | | | | | |
Net assets, end of year (000’s) | | $ | 205,768 | | | $ | 61,255 | | | $ | 19,779 | | | $ | 5,181 | | | $ | 2,119 | |
Ratios to average net assets: | | | | | | | | | | | | | | | | | | | | |
Expenses before expense reduction | | | 1.05% | | | | 1.03% | | | | 1.04% | | | | 1.01% | | | | 0.98% | |
Expenses net of expense reduction | | | 0.97% | | | | 0.99% | | | | 1.03% | | | | 1.01% | | | | 0.98% | |
Net investment income | | | 3.84% | | | | 3.56% | | | | 4.15% | | | | 4.47% | | | | 4.63% | |
Portfolio turnover rate | | | 30.65% | | | | 30.28% | | | | 37.39% | | | | 53.01% | | | | 27.91% | |
| a | The amount shown for a share outstanding throughout the period may not correlate with the Statement of Operations for the period due to the timing of sales and repurchase of the Fund shares in relation to income earned and/or fluctuating market value of the investments of the Fund. |
| b | Based on average daily shares outstanding. |
| c | Total return does not include any fees, charges or expenses imposed by the variable annuity and life insurance contracts for which the Franklin Templeton Variable Insurance Products Trust serves as an underlying investment vehicle. |
| d | Amount rounds to less than $0.01 per share. |
The accompanying notes are an integral part of these financial statements.
TGI-9
Franklin Templeton Variable Insurance Products Trust
Financial Highlights (continued)
Templeton Global Income Securities Fund
| | | | | | | | |
| | | Year Ended December 31, | |
| Class 3 | | 2006 | | | 2005e | |
| | | | |
Per share operating performance | | | | | | | | |
(for a share outstanding throughout the year) | | | | | | | | |
Net asset value, beginning of year | | $ | 14.18 | | | $ | 15.27 | |
| | | | |
Income from investment operationsa: | | | | | | | | |
Net investment incomeb | | | 0.58 | | | | 0.38 | |
Net realized and unrealized gains (losses) | | | 1.21 | | | | (0.50 | ) |
| | | | |
Total from investment operations | | | 1.79 | | | | (0.12 | ) |
| | | | |
Less distributions from net investment income | | | (0.48 | ) | | | (0.97 | ) |
| | | | |
Redemption fees | | | — | d | | | — | d |
| | | | |
Net asset value, end of year | | $ | 15.49 | | | $ | 14.18 | |
| | | | |
| | |
Total returnc | | | 12.84% | | | | (0.80)% | |
Ratios/supplemental data | | | | | | | | |
Net assets, end of year (000’s) | | $ | 35,572 | | | $ | 5,769 | |
Ratios to average net assets: | | | | | | | | |
Expenses before expense reduction | | | 1.05% | | | | 1.03% | f |
Expenses net of expense reduction | | | 0.97% | | | | 0.99% | f |
Net investment income | | | 3.84% | | | | 3.56% | f |
Portfolio turnover rate | | | 30.65% | | | | 30.28% | |
| a | The amount shown for a share outstanding throughout the period may not correlate with the Statement of Operations for the period due to the timing of sales and repurchase of the Fund shares in relation to income earned and/or fluctuating market value of the investments of the Fund. |
| b | Based on average daily shares outstanding. |
| c | Total return does not include any fees, charges or expenses imposed by the variable annuity and life insurance contracts for which the Franklin Templeton Variable Insurance Products Trust serves as an underlying investment vehicle. |
| d | Amount rounds to less than $0.01 per share. |
| e | For the period April 1, 2005 (effective date) to December 31, 2005. |
The accompanying notes are an integral part of these financial statements.
TGI-10
Franklin Templeton Variable Insurance Products Trust
Statement of Investments, December 31, 2006
| | | | | | |
| Templeton Global Income Securities Fund | | Principal
Amounta | | | Value |
Government and Agency Securities 74.2% | | | | | | |
Argentina 3.8% | | | | | | |
Government of Argentina, | | | | | | |
b,cFRN, 5.59%, 8/03/12 | | 13,522,000 | | | $ | 9,616,512 |
dGross Domestic Product Linked Security, 12/15/35, wts. | | 13,185,000 | | | | 1,812,938 |
dGross Domestic Product Linked Security, 12/15/35, wts. | | 4,380,000 | EUR | | | 763,200 |
| | | | | | |
| | | | | | 12,192,650 |
| | | | | | |
Australia 0.5% | | | | | | |
New South Wales Treasury Corp., 8.00%, 3/01/08 | | 1,990,000 | AUD | | | 1,598,255 |
| | | | | | |
Austria 0.4% | | | | | | |
Government of Austria, | | | | | | |
5.50%, 10/20/07 | | 425,000 | EUR | | | 567,557 |
5.00%, 7/15/12 | | 400,000 | EUR | | | 555,098 |
| | | | | | |
| | | | | | 1,122,655 |
| | | | | | |
Belgium 0.3% | | | | | | |
Government of Belgium, 7.50%, 7/29/08 | | 686,000 | EUR | | | 953,911 |
| | | | | | |
Brazil 5.3% | | | | | | |
Nota Do Tesouro Nacional, | | | | | | |
9.762%, 1/01/10 | | 4,500 | eBRL | | | 1,986,900 |
9.762%, 1/01/12 | | 19,250 | eBRL | | | 8,224,476 |
9.762%, 1/01/14 | | 7,100 | eBRL | | | 2,951,142 |
fIndex Linked, 6.00%, 11/15/09 | | 2,500 | eBRL | | | 1,799,618 |
fIndex Linked, 6.00%, 5/15/15 | | 2,750 | eBRL | | | 1,856,264 |
| | | | | | |
| | | | | | 16,818,400 |
| | | | | | |
Canada 2.2% | | | | | | |
Province of Alberta, 5.00%, 12/16/08 | | 170,000 | CAD | | | 148,329 |
Province of Manitoba, 6.375%, 9/01/15 | | 1,638,000 | NZD | | | 1,123,559 |
Province of Newfoundland, 5.90%, 12/12/07 | | 300,000 | CAD | | | 260,751 |
Province of Ontario, | | | | | | |
6.125%, 9/12/07 | | 3,555,000 | CAD | | | 3,086,329 |
3.875%, 3/08/08 | | 1,925,000 | CAD | | | 1,647,777 |
6.25%, 6/16/15 | | 925,000 | NZD | | | 623,649 |
| | | | | | |
| | | | | | 6,890,394 |
| | | | | | |
Finland 0.2% | | | | | | |
Government of Finland, 5.375%, 7/04/13 | | 540,000 | EUR | | | 770,744 |
| | | | | | |
France 0.1% | | | | | | |
Government of France, 4.00%, 10/25/09 | | 195,000 | EUR | | | 258,113 |
| | | | | | |
Germany 4.0% | | | | | | |
Government of Germany, 4.00%, 2/16/07 | | 110,000 | EUR | | | 145,252 |
KfW Bankengruppe, | | | | | | |
bFRN, 0.233%, 8/08/11 | | 1,280,000,000 | JPY | | | 10,758,936 |
senior note, E, 8.25%, 9/20/07 | | 129,000,000 | ISK | | | 1,745,773 |
| | | | | | |
| | | | | | 12,649,961 |
| | | | | | |
Greece 0.1% | | | | | | |
Government of the Hellenic Republic, 3.25%, 6/21/07 | | 270,000 | EUR | | | 355,473 |
| | | | | | |
Indonesia 6.6% | | | | | | |
Government of Indonesia,
10.00%, 10/15/11 | | 1,800,000,000 | IDR | | | 200,031 |
11.00%, 12/15/12 | | 450,000,000 | IDR | | | 53,196 |
TGI-11
Franklin Templeton Variable Insurance Products Trust
Statement of Investments, December 31, 2006 (continued)
| | | | | | |
| Templeton Global Income Securities Fund | | Principal
Amounta | | | Value |
Government and Agency Securities (continued) | | | | | | |
Indonesia (continued) | | | | | | |
Government of Indonesia (continued) | | | | | | |
14.25%, 6/15/13 | | 11,269,000,000 | IDR | | $ | 1,528,679 |
14.275%, 12/15/13 | | 21,167,000,000 | IDR | | | 2,882,962 |
11.00%, 10/15/14 | | 3,390,000,000 | IDR | | | 400,969 |
10.75%, 5/15/16 | | 3,300,000,000 | IDR | | | 375,923 |
10.00%, 7/15/17 | | 3,500,000,000 | IDR | | | 390,143 |
11.50%, 9/15/19 | | 30,075,000,000 | IDR | | | 3,604,390 |
11.00%, 11/15/20 | | 31,230,000,000 | IDR | | | 3,676,517 |
12.80%, 6/15/21 | | 31,965,000,000 | IDR | | | 4,247,308 |
12.90%, 6/15/22 | | 10,710,000,000 | IDR | | | 1,437,070 |
11.75%, 8/15/23 | | 1,615,000,000 | IDR | | | 194,038 |
11.00%, 9/15/25 | | 8,550,000,000 | IDR | | | 1,004,400 |
12.00%, 9/15/26 | | 6,500,000,000 | IDR | | | 822,121 |
| | | | | | |
| | | | | | 20,817,747 |
| | | | | | |
Iraq 1.9% | | | | | | |
gGovernment of Iraq, Reg S, 5.80%, 1/15/28 | | 9,300,000 | | | | 6,068,250 |
| | | | | | |
Malaysia 4.4% | | | | | | |
Government of Malaysia, | | | | | | |
6.90%, 3/15/07 | | 1,075,000 | MYR | | | 306,643 |
8.60%, 12/01/07 | | 19,995,000 | MYR | | | 5,924,207 |
3.135%, 12/17/07 | | 14,625,000 | MYR | | | 4,130,388 |
6.45%, 7/01/08 | | 8,900,000 | MYR | | | 2,628,147 |
4.305%, 2/27/09 | | 3,660,000 | MYR | | | 1,051,959 |
| | | | | | |
| | | | | | 14,041,344 |
| | | | | | |
Mexico 1.2% | | | | | | |
Government of Mexico, | | | | | | |
h144A, 7.50%, 3/08/10 | | 450,000 | EUR | | | 648,851 |
8.00%, 12/17/15 | | 76,000 | iMXN | | | 728,886 |
10.00%, 12/05/24 | | 205,000 | iMXN | | | 2,355,951 |
| | | | | | |
| | | | | | 3,733,688 |
| | | | | | |
Netherlands 0.2% | | | | | | |
Government of the Netherlands, 5.75%, 2/15/07 | | 488,000 | EUR | | | 645,705 |
| | | | | | |
New Zealand 0.5% | | | | | | |
Government of New Zealand, 7.00%, 7/15/09 | | 2,435,000 | NZD | | | 1,730,696 |
| | | | | | |
Norway 2.8% | | | | | | |
Government of Norway, 6.75%, 1/15/07 | | 54,660,000 | NOK | | | 8,774,466 |
| | | | | | |
Peru 1.3% | | | | | | |
Government of Peru, | | | | | | |
8.60%, 8/12/17 | | 6,185,000 | PEN | | | 2,285,075 |
7.84%, 8/12/20 | | 4,945,000 | PEN | | | 1,765,314 |
| | | | | | |
| | | | | | 4,050,389 |
| | | | | | |
Philippines 0.4% | | | | | | |
Government of the Philippines, | | | | | | |
9.00%, 2/15/13 | | 800,000 | | | | 928,000 |
gReg S, 9.125%, 2/22/10 | | 330,000 | EUR | | | 490,613 |
| | | | | | |
| | | | | | 1,418,613 |
| | | | | | |
TGI-12
Franklin Templeton Variable Insurance Products Trust
Statement of Investments, December 31, 2006 (continued)
| | | | | | |
| Templeton Global Income Securities Fund | | Principal
Amounta | | | Value |
Government and Agency Securities (continued) | | | | | | |
Poland 6.6% | | | | | | |
Government of Poland, | | | | | | |
8.50%, 5/12/07 | | 16,290,000 | PLN | | $ | 5,698,116 |
5.75%, 6/24/08 | | 3,900,000 | PLN | | | 1,366,538 |
6.00%, 5/24/09 | | 8,195,000 | PLN | | | 2,909,509 |
5.75%, 9/23/22 | | 30,500,000 | PLN | | | 10,964,368 |
| | | | | | |
| | | | | | 20,938,531 |
| | | | | | |
Singapore 3.0% | | | | | | |
Government of Singapore, | | | | | | |
1.75%, 2/01/07 | | 2,335,000 | SGD | | | 1,520,955 |
4.00%, 3/01/07 | | 7,160,000 | SGD | | | 4,673,930 |
2.625%, 10/01/07 | | 4,980,000 | SGD | | | 3,237,843 |
| | | | | | |
| | | | | | 9,432,728 |
| | | | | | |
Slovak Republic 2.9% | | | | | | |
Government of Slovakia, | | | | | | |
4.95%, 3/05/08 | | 81,000,000 | SKK | | | 3,115,543 |
4.80%, 4/14/09 | | 33,500,000 | SKK | | | 1,298,056 |
4.90%, 2/05/10 | | 1,000,000 | SKK | | | 39,081 |
8.50%, 8/17/10 | | 70,000,000 | SKK | | | 3,059,712 |
7.50%, 3/13/12 | | 19,000,000 | SKK | | | 837,989 |
5.00%, 1/22/13 | | 6,000,000 | SKK | | | 240,216 |
4.90%, 2/11/14 | | 4,900,000 | SKK | | | 195,239 |
5.30%, 5/12/19 | | 11,200,000 | SKK | | | 471,377 |
| | | | | | |
| | | | | | 9,257,213 |
| | | | | | |
South Africa 0.1% | | | | | | |
Government of South Africa, 5.25%, 5/16/13 | | 200,000 | EUR | | | 273,029 |
| | | | | | |
South Korea 9.7% | | | | | | |
Government of Korea, 4.25%, 3/10/08 | | 2,700,000,000 | KRW | | | 2,879,402 |
Korea Treasury Note, | | | | | | |
6.90%, 1/16/07 | | 1,200,000,000 | KRW | | | 1,291,190 |
4.75%, 3/03/07 | | 5,740,000,000 | KRW | | | 6,169,966 |
3.75%, 9/10/07 | | 5,950,000,000 | KRW | | | 6,347,806 |
4.75%, 3/12/08 | | 3,768,000,000 | KRW | | | 4,039,491 |
4.50%, 9/09/08 | | 1,945,000,000 | KRW | | | 2,076,075 |
4.25%, 9/10/08 | | 7,500,000,000 | KRW | | | 7,974,480 |
| | | | | | |
| | | | | | 30,778,410 |
| | | | | | |
Spain 0.2% | | | | | | |
Government of Spain, 6.00%, 1/31/08 | | 390,000 | EUR | | | 526,102 |
| | | | | | |
jSupranational 2.1% | | | | | | |
European Investment Bank, | | | | | | |
2.125%, 9/20/07 | | 300,000,000 | JPY | | | 2,547,950 |
bsenior note, FRN, 0.205%, 9/21/11 | | 305,000,000 | JPY | | | 2,562,579 |
Inter-American Development Bank, | | | | | | |
9.00%, 1/04/07 | | 79,500,000 | ISK | | | 1,119,324 |
6.00%, 12/15/17 | | 575,000 | NZD | | | 385,652 |
| | | | | | |
| | | | | | 6,615,505 |
| | | | | | |
TGI-13
Franklin Templeton Variable Insurance Products Trust
Statement of Investments, December 31, 2006 (continued)
| | | | | | |
| Templeton Global Income Securities Fund | | Principal
Amounta | | | Value |
Government and Agency Securities (continued) | | | | | | |
Sweden 8.8% | | | | | | |
Government of Sweden, 8.00%, 8/15/07 | | 148,705,000 | SEK | | $ | 22,304,014 |
kSwedish Treasury Bill, 12/19/07 | | 38,775,000 | SEK | | | 5,476,436 |
| | | | | | |
| | | | | | 27,780,450 |
| | | | | | |
Thailand 0.5% | | | | | | |
Bank of Thailand Bond, | | | | | | |
5.00%, 1/12/08 | | 14,350,000 | THB | | | 404,907 |
5.50%, 8/10/08 | | 23,700,000 | THB | | | 670,716 |
Government of Thailand, | | | | | | |
5.60%, 7/07/07 | | 11,960,000 | THB | | | 338,564 |
4.125%, 2/12/08 | | 9,000,000 | THB | | | 251,621 |
8.50%, 12/08/08 | | 1,000,000 | THB | | | 30,015 |
| | | | | | |
| | | | | | 1,695,823 |
| | | | | | |
United States 4.1% | | | | | | |
FNMA, | | | | | | |
2.125%, 10/09/07 | | 1,350,000,000 | JPY | | | 11,477,285 |
1.75%, 3/26/08 | | 180,000,000 | JPY | | | 1,532,354 |
| | | | | | |
| | | | | | 13,009,639 |
| | | | | | |
Total Government and Agency Securities (Cost $220,144,919) | | | | | | 235,198,884 |
| | | | | | |
Short Term Investments 24.2% | | | | | | |
Government and Agency Securities 17.2% | | | | | | |
Australia 0.6% | | | | | | |
Queensland Treasury Corp., Series 07G, 8.00%, 9/14/07 | | 2,400,000 | AUD | | | 1,916,613 |
| | | | | | |
Canada 4.0% | | | | | | |
Government of Canada, 4.50%, 9/01/07 | | 14,655,000 | CAD | | | 12,602,608 |
| | | | | | |
Egypt 5.6% | | | | | | |
kEgypt Certificate of Deposit, 9/12/07 | | 10,000,000 | EGP | | | 1,631,167 |
kEgypt Treasury Bill, 1/16/07 | | 2,300,000 | EGP | | | 401,365 |
1/30/07 | | 2,000,000 | EGP | | | 347,770 |
2/20/07 | | 2,100,000 | EGP | | | 362,620 |
3/06/07 | | 6,400,000 | EGP | | | 1,102,946 |
3/27/07 | | 10,500,000 | EGP | | | 1,799,685 |
4/17/07 | | 5,000,000 | EGP | | | 852,353 |
6/19/07 | | 775,000 | EGP | | | 129,648 |
6/26/07 | | 8,400,000 | EGP | | | 1,405,846 |
7/17/07 | | 25,000 | EGP | | | 4,161 |
7/24/07 | | 700,000 | EGP | | | 116,037 |
7/31/07 | | 5,550,000 | EGP | | | 918,574 |
8/28/07 | | 775,000 | EGP | | | 127,344 |
9/04/07 | | 3,500,000 | EGP | | | 574,216 |
9/25/07 | | 725,000 | EGP | | | 118,306 |
10/09/07 | | 4,000,000 | EGP | | | 650,393 |
10/23/07 | | 2,750,000 | EGP | | | 445,555 |
11/06/07 | | 5,875,000 | EGP | | | 948,736 |
11/13/07 | | 10,900,000 | EGP | | | 1,757,095 |
11/20/07 | | 10,450,000 | EGP | | | 1,681,580 |
1/01/08 | | 15,000,000 | EGP | | | 2,388,989 |
| | | | | | |
| | | | | | 17,764,386 |
| | | | | | |
TGI-14
Franklin Templeton Variable Insurance Products Trust
Statement of Investments, December 31, 2006 (continued)
| | | | | | | |
| Templeton Global Income Securities Fund | | Principal
Amounta | | | Value | |
Short Term Investments (continued) | | | | | | | |
Government and Agency Securities (continued) | | | | | | | |
Norway 1.9% | | | | | | | |
kNorwegian Treasury Bill, | | | | | | | |
3/21/07 | | 7,525,000 | NOK | | $ | 1,194,779 | |
6/20/07 | | 8,000,000 | NOK | | | 1,261,081 | |
9/19/07 | | 23,100,000 | NOK | | | 3,602,742 | |
| | | | | | | |
| | | | | | 6,058,602 | |
| | | | | | | |
Thailand 5.1% | | | | | | | |
kThailand Treasury Bill, | | | | | | | |
1/18/07 | | 43,100,000 | THB | | | 1,211,508 | |
3/08/07 | | 48,350,000 | THB | | | 1,349,833 | |
4/05/07 | | 8,850,000 | THB | | | 246,634 | |
4/19/07 | | 25,780,000 | THB | | | 717,114 | |
5/03/07 | | 88,000,000 | THB | | | 2,443,346 | |
5/17/07 | | 18,000,000 | THB | | | 498,976 | |
7/05/07 | | 20,000,000 | THB | | | 550,434 | |
7/19/07 | | 6,400,000 | THB | | | 175,903 | |
8/02/07 | | 22,000,000 | THB | | | 603,847 | |
8/16/07 | | 90,255,000 | THB | | | 2,471,407 | |
9/06/07 | | 63,160,000 | THB | | | 1,724,642 | |
10/04/07 | | 69,615,000 | THB | | | 1,893,810 | |
11/08/07 | | 30,000,000 | THB | | | 812,325 | |
12/06/07 | | 59,780,000 | THB | | | 1,613,111 | |
| | | | | | | |
| | | | | | 16,312,890 | |
| | | | | | | |
Total Government and Agency Securities (Cost $53,813,882) | | | | | | 54,655,099 | |
| | | | | | | |
Total Investments before Repurchase Agreement (Cost $273,958,801) | | | | | | 289,853,983 | |
| | | | | | | |
United States 7.0% | | | | | | | |
Repurchase Agreement (Cost $22,226,951) 7.0% | | | | | | | |
lJoint Repurchase Agreement, 5.137%, 1/02/07 (Maturity Value $22,239,638) | | 22,226,951 | | | | 22,226,951 | |
ABN AMRO Bank, N.V., New York Branch (Maturity Value $2,135,005) | | | | | | | |
Banc of America Securities LLC (Maturity Value $2,135,005) | | | | | | | |
Barclays Capital Inc. (Maturity Value $993,223) | | | | | | | |
Bear, Stearns & Co. Inc. (Maturity Value $993,223) | | | | | | | |
BNP Paribas Securities Corp. (Maturity Value $2,135,005) | | | | | | | |
Deutsche Bank Securities Inc. (Maturity Value $496,833) | | | | | | | |
Dresdner Kleinwort Wasserstein Securities LLC (Maturity Value $496,833) | | | | | | | |
Goldman, Sachs & Co. (Maturity Value $2,135,005) | | | | | | | |
Greenwich Capital Markets Inc. (Maturity Value $2,135,005) | | | | | | | |
Lehman Brothers Inc. (Maturity Value $2,179,486) | | | | | | | |
Merrill Lynch Government Securities Inc. (Maturity Value $2,135,005) | | | | | | | |
Morgan Stanley & Co. Inc. (Maturity Value $2,135,005) | | | | | | | |
UBS Securities LLC (Maturity Value $2,135,005) | | | | | | | |
Collateralized by U.S Government Agency Securities, 2.75% - 7.625%, 2/23/07 - 12/09/11;
kU.S. Government Agency Discount Notes, 1/12/07 - 2/08/07; kU.S. Treasury Bills, 1/25/07;
and U.S. Treasury Notes, 3.625% - 6.125%, 5/15/07 - 5/31/11 | | | | | | | |
| | | | | | | |
Total Short Term Investments (Cost $76,040,833) | | | | | | 76,882,050 | |
| | | | | | | |
Total Investments (Cost $296,185,752) 98.4% | | | | | | 312,080,934 | |
Net Unrealized Loss on Forward Exchange Contracts (0.2)% | | | | | | (494,400 | ) |
Other Assets, less Liabilities 1.8% | | | | | | 5,596,462 | |
| | | | | | | |
Net Assets 100.0% | | | | | $ | 317,182,996 | |
| | | | | | | |
TGI-15
Franklin Templeton Variable Insurance Products Trust
Statement of Investments, December 31, 2006 (continued)
Currency Abbreviations
AUD - Australian Dollar
BRL - Brazilian Real
CAD - Canadian Dollar
EGP - Egyptian Pounds
EUR - Euro
IDR - Indonesian Rupiah
ISK - Iceland Krona
JPY - Japanese Yen
KRW - South Korean Won
MXN - Mexican Peso
MYR - Malaysian Ringgit
NOK - Norwegian Krone
NZD - New Zealand Dollar
PEN - Peruvian Nuevo Sol
PLN - Polish Zloty
SEK - Swedish Krona
SGD - Singapore Dollar
SKK - Slovak Koruna
THB - Thai Baht
Selected Portfolio Abbreviations
FNMA - Federal National Mortgage Association
FRN - Floating Rate Note
a | The principal amount is stated in U.S. dollars unless otherwise indicated. |
b | The coupon rate shown represents the rate at period end. |
c | The principal amount is stated in original face, and scheduled paydowns are reflected in the market price on ex-date. |
d | Warrants are linked to the Argentine Republic Gross Domestic Product (GDP) and do not pay principal over life of security or at expiration. Warrants entitle the holder to receive only variable income payments, subject to certain conditions, which are based on growth of the Argentine GDP and the principal or “notional” value of these GDP linked warrants. |
e | Principal is stated in 1,000 Real units. |
f | Principal amount of security is adjusted for inflation. See Note 1(f) |
g | Security was purchased pursuant to Regulation S under the Securities Act of 1933, which exempts from registration securities offered and sold outside of the United States. Such a security cannot be sold in the United States without either an effective registration statement filed pursuant to the Securities Act of 1933, or pursuant to an exemption from registration. These securities have been deemed liquid under guidelines approved by the Trust’s Board of Trustees. At December 31, 2006, the value of these securities was $6,558,863, representing 2.07% of net assets. |
h | Security was purchased pursuant to Rule 144A under the Securities Act of 1933 and may be sold in transactions exempt from registration only to qualified institutional buyers or in a public offering registered under the Securities Act of 1933. These securities have been deemed liquid under guidelines approved by the Trust’s Board of Trustees. At December 31, 2006, the value of this security was $648,851, representing 0.20% of net assets. |
i | Principal is stated in 100 Peso units. |
j | A supranational organization is an entity formed by two or more central governments through international treaties. |
k | The security is traded on a discount basis with no stated coupon rate. |
l | See Note 1(c) regarding joint repurchase agreement. |
The accompanying notes are an integral part of these financial statements.
TGI-16
Franklin Templeton Variable Insurance Products Trust
Financial Statements
Statement of Assets and Liabilities
December 31, 2006
| | | | |
| | | Templeton
Global Income
Securities Fund | |
Assets: | | | | |
Investments in securities: | | | | |
Cost - Unaffiliated issuers | | $ | 273,958,801 | |
Cost - Repurchase agreement | | | 22,226,951 | |
| | | | |
Total cost of investments | | $ | 296,185,752 | |
| | | | |
Value - Unaffiliated issuers | | $ | 289,853,983 | |
Value - Repurchase agreement | | | 22,226,951 | |
| | | | |
Total value of investments | | | 312,080,934 | |
Foreign currency, at value (cost $2,501,786) | | | 2,503,087 | |
Receivables: | | | | |
Capital shares sold | | | 584,562 | |
Interest | | | 5,403,606 | |
Unrealized gain on forward exchange contracts (Note 7) | | | 560,584 | |
| | | | |
Total assets | | | 321,132,773 | |
| | | | |
Liabilities: | | | | |
Payables: | | | | |
Investment securities purchased | | | 2,396,309 | |
Capital shares redeemed | | | 127,043 | |
Affiliates | | | 236,262 | |
Unrealized loss on forward exchange contracts (Note 7) | | | 1,054,984 | |
Accrued expenses and other liabilities | | | 135,179 | |
| | | | |
Total liabilities | | | 3,949,777 | |
| | | | |
Net assets, at value | | $ | 317,182,996 | |
| | | | |
Net assets consist of: | | | | |
Paid-in capital | | $ | 298,607,930 | |
Undistributed net investment income | | | 9,842,829 | |
Net unrealized appreciation (depreciation) | | | 15,501,486 | |
Accumulated net realized gain (loss) | | | (6,769,249 | ) |
| | | | |
Net assets, at value | | $ | 317,182,996 | |
| | | | |
Class 1: | | | | |
Net assets, at value | | $ | 75,843,303 | |
| | | | |
Shares outstanding | | | 4,822,638 | |
| | | | |
Net asset value and maximum offering price per share | | $ | 15.73 | |
| | | | |
Class 2: | | | | |
Net assets, at value | | $ | 205,767,610 | |
| | | | |
Shares outstanding | | | 13,273,761 | |
| | | | |
Net asset value and maximum offering price per share | | $ | 15.50 | |
| | | | |
Class 3: | | | | |
Net assets, at value | | $ | 35,572,083 | |
| | | | |
Shares outstanding | | | 2,296,389 | |
| | | | |
Net asset value and maximum offering price per sharea | | $ | 15.49 | |
| | | | |
a | Redemption price is equal to net asset value less any redemption fees retained by the Fund. |
The accompanying notes are an integral part of these financial statements.
TGI-17
Franklin Templeton Variable Insurance Products Trust
Financial Statements (continued)
Statement of Operations
for the year ended December 31, 2006
| | | | |
| | | Templeton
Global Income
Securities Fund | |
Investment income: | | | | |
Interest (net of foreign taxes of $345,106) | | $ | 9,588,047 | |
| | | | |
Expenses: | | | | |
Management fees (Note 3a) | | | 1,115,338 | |
Distribution fees: (Note 3c) | | | | |
Class 2 | | | 293,718 | |
Class 3 | | | 45,946 | |
Unaffiliated transfer agent fees | | | 756 | |
Custodian fees (Note 4) | | | 225,670 | |
Reports to shareholders | | | 208,217 | |
Professional fees | | | 24,092 | |
Trustees’ fees and expenses | | | 766 | |
Other | | | 11,538 | |
| | | | |
Total expenses | | | 1,926,041 | |
Expense reductions (Note 4) | | | (149,015 | ) |
| | | | |
Net expenses | | | 1,777,026 | |
| | | | |
Net investment income | | | 7,811,021 | |
| | | | |
Realized and unrealized gains (losses): | | | | |
Net realized gain (loss) from: | | | | |
Investments (net of foreign taxes of $6,256) | | | 4,121,530 | |
Foreign currency transactions | | | 127,026 | |
| | | | |
Net realized gain (loss) | | | 4,248,556 | |
| | | | |
Net change in unrealized appreciation (depreciation) on: | | | | |
Investments | | | 12,138,312 | |
Translation of assets and liabilities denominated in foreign currencies | | | 135,055 | |
| | | | |
Net change in unrealized appreciation (depreciation) | | | 12,273,367 | |
| | | | |
Net realized and unrealized gain (loss) | | | 16,521,923 | |
| | | | |
Net increase (decrease) in net assets resulting from operations | | $ | 24,332,944 | |
| | | | |
The accompanying notes are an integral part of these financial statements.
TGI-18
Franklin Templeton Variable Insurance Products Trust
Financial Statements (continued)
Statements of Changes in Net Assets
| | | | | | | | |
| | | Templeton Global Income
Securities Fund | |
| | | Year Ended December 31, | |
| | | 2006 | | | 2005 | |
| | | | |
Increase (decrease) in net assets: | | | | | | | | |
Operations: | | | | | | | | |
Net investment income | | $ | 7,811,021 | | | $ | 3,292,059 | |
Net realized gain (loss) from investments and foreign currency transactions | | | 4,248,556 | | | | 3,899,560 | |
Net change in unrealized appreciation (depreciation) on investments and translation of assets and liabilities denominated in foreign currencies | | | 12,273,367 | | | | (9,226,450 | ) |
| | | | |
Net increase (decrease) in net assets resulting from operations | | | 24,332,944 | | | | (2,034,831 | ) |
| | | | |
Distributions to shareholders from: | | | | | | | | |
Net investment income: | | | | | | | | |
Class 1 | | | (2,013,759 | ) | | | (3,016,853 | ) |
Class 2 | | | (3,259,404 | ) | | | (2,073,846 | ) |
Class 3 | | | (431,514 | ) | | | (32,207 | ) |
| | | | |
Total distributions to shareholders | | | (5,704,677 | ) | | | (5,122,906 | ) |
| | | | |
Capital share transactions: (Note 2) | | | | | | | | |
Class 1 | | | 16,986,934 | | | | 7,710,594 | |
Class 2 | | | 133,487,737 | | | | 44,184,638 | |
Class 3 | | | 27,934,695 | | | | 5,777,317 | |
| | | | |
Total capital share transactions | | | 178,409,366 | | | | 57,672,549 | |
| | | | |
Redemption fees | | | 6,342 | | | | 36 | |
| | | | |
Net increase (decrease) in net assets | | | 197,043,975 | | | | 50,514,848 | |
Net assets: | | | | | | | | |
Beginning of year | | | 120,139,021 | | | | 69,624,173 | |
| | | | |
End of year | | $ | 317,182,996 | | | $ | 120,139,021 | |
| | | | |
Undistributed net investment income included in net assets: | | | | | | | | |
End of year | | $ | 9,842,829 | | | $ | 4,412,581 | |
| | | | |
The accompanying notes are an integral part of these financial statements.
TGI-19
Franklin Templeton Variable Insurance Products Trust
Notes to Financial Statements
Templeton Global Income Securities Fund
1. ORGANIZATION AND SIGNIFICANT ACCOUNTING POLICIES
Franklin Templeton Variable Insurance Products Trust (the Trust) is registered under the Investment Company Act of 1940, as amended, (the 1940 Act) as an open-end investment company, consisting of twenty-two separate funds. The Templeton Global Income Securities Fund (the Fund) included in this report is non-diversified. The financial statements of the remaining funds in the Trust are presented separately. Shares of the Fund are sold only to insurance company separate accounts to fund the benefits of variable life insurance policies or variable annuity contracts. The Fund offers three classes of shares: Class 1, Class 2, and Class 3. Each class of shares differs by its distribution fees, voting rights on matters affecting a single class and its exchange privilege.
The following summarizes the Fund’s significant accounting policies.
a. Security Valuation
Securities listed on a securities exchange or on the NASDAQ National Market System are valued at the last quoted sale price or the official closing price of the day, respectively. Over-the-counter securities and listed securities for which there is no reported sale are valued within the range of the most recent quoted bid and ask prices. Securities that trade in multiple markets or on multiple exchanges are valued according to the broadest and most representative market.
Corporate debt securities and government securities generally trade in the over-the-counter market rather than on a securities exchange. The Trust may utilize independent pricing services, quotations from bond dealers, and information with respect to bond and note transactions, to assist in determining a current market value for each security. The Trust’s pricing services may use valuation models or matrix pricing which considers information with respect to comparable bond and note transactions, quotations from bond dealers, or by reference to other securities that are considered comparable in such characteristics as rating, interest rate and maturity date, option adjusted spread models, prepayment projections, interest rate spreads and yield curves, to determine current value.
Foreign securities are valued as of the close of trading on the foreign stock exchange on which the security is primarily traded, or the NYSE, whichever is earlier. If no sale is reported at that time, the foreign security will be valued within the range of the most recent quoted bid and ask prices. The value is then converted into its U.S. dollar equivalent at the foreign exchange rate in effect at the close of the NYSE on the day that the value of the foreign security is determined.
The Trust has procedures to determine the fair value of individual securities and other assets for which market prices are not readily available or which may not be reliably priced. Methods for valuing these securities may include: fundamental analysis, matrix pricing, discounts from market prices of similar securities, or discounts applied due to the nature and duration of restrictions on the disposition of the securities. Due to the inherent uncertainty of valuations of such securities, the fair values may differ significantly from the values that would have been used had a ready market for such investments existed. Occasionally, events occur between the time at which trading in a security is completed and the close of the NYSE that might call into question the availability (including the reliability) of the value of a portfolio security held by the Fund. The investment manager monitors price movements following the close of trading in foreign stock markets through a series of country specific market proxies (such as baskets of American Depository Receipts, futures contracts and exchange traded funds). These price movements are measured against established trigger thresholds for each specific market proxy to assist in determining if an event has occurred. If such an event occurs, the securities may be valued using fair value procedures, which may include the use of independent pricing services. All security valuation procedures are approved by the Trust’s Board of Trustees.
b. Foreign Currency Translation
Portfolio securities and other assets and liabilities denominated in foreign currencies are translated into U.S. dollars based on the exchange rate of such currencies against U.S. dollars on the date of valuation. Purchases and sales of securities, income and expense items denominated in foreign currencies are translated into U.S. dollars at the exchange rate in effect on the transaction
TGI-20
Franklin Templeton Variable Insurance Products Trust
Notes to Financial Statements (continued)
Templeton Global Income Securities Fund
1. ORGANIZATION AND SIGNIFICANT ACCOUNTING POLICIES (continued)
b. Foreign Currency Translation (continued)
date. Occasionally, events may impact the availability or reliability of foreign exchange rates used to convert the U.S. dollar equivalent value. If such an event occurs, the foreign exchange rate will be valued at fair value using procedures established and approved by the Trust’s Board of Trustees.
The Fund does not separately report the effect of changes in foreign exchange rates from changes in market prices on securities held. Such changes are included in net realized and unrealized gain or loss from investments on the Statement of Operations.
Realized foreign exchange gains or losses arise from sales of foreign currencies, currency gains or losses realized between the trade and settlement dates on securities transactions and the difference between the recorded amounts of dividends, interest, and foreign withholding taxes and the U.S. dollar equivalent of the amounts actually received or paid. Net unrealized foreign exchange gains and losses arise from changes in foreign exchange rates on foreign denominated assets and liabilities other than investments in securities held at the end of the reporting period.
c. Joint Repurchase Agreement
The Fund may enter into a joint repurchase agreement whereby its uninvested cash balance is deposited into a joint cash account with other funds managed by the investment manager or an affiliate of the investment manager and is used to invest in one or more repurchase agreements. The value and face amount of the joint repurchase agreement are allocated to the funds based on their pro-rata interest. A repurchase agreement is accounted for as a loan by the Fund to the seller, collateralized by securities which are delivered to the Fund’s custodian. The market value, including accrued interest, of the initial collateralization is required to be at least 102% of the dollar amount invested by the funds, with the value of the underlying securities marked to market daily to maintain coverage of at least 100%. The joint repurchase agreement held by the Fund at year end had been entered into on December 29, 2006. The joint repurchase agreement is valued at cost.
d. Foreign Currency Contracts
When the Fund purchases or sells foreign securities it may enter into foreign exchange contracts to minimize foreign exchange risk from the trade date to the settlement date of the transactions. A foreign exchange contract is an agreement between two parties to exchange different currencies at an agreed upon exchange rate at a future date. Realized and unrealized gains and losses on these contracts are included in the Statement of Operations.
The Fund may also enter into forward exchange contracts to hedge against fluctuations in foreign exchange rates. These contracts are valued daily by the Fund and the unrealized gains or losses on the contracts, as measured by the difference between the contractual forward foreign exchange rates and the forward rates at the reporting date, are included in the Statement of Assets and Liabilities. Realized and unrealized gains and losses on these contracts are included in the Statement of Operations.
The risks of these contracts include movement in the values of the foreign currencies relative to the U.S. dollar and the possible inability of the counterparties to fulfill their obligations under the contracts, which may be in excess of the amount reflected in the Statement of Assets and Liabilities.
e. Income Taxes
No provision has been made for U.S. income taxes because the Fund intends to qualify as a regulated investment company under the Internal Revenue Code and to distribute to shareholders substantially all of its taxable income and net realized gains.
Foreign securities held by the Fund may be subject to foreign taxation on dividend and interest income received. Foreign taxes, if any, are recorded based on the tax regulations and rates that exist in the foreign markets in which the Fund invests.
TGI-21
Franklin Templeton Variable Insurance Products Trust
Notes to Financial Statements (continued)
Templeton Global Income Securities Fund
1. ORGANIZATION AND SIGNIFICANT ACCOUNTING POLICIES (continued)
f. Security Transactions, Investment Income, Expenses and Distributions
Security transactions are accounted for on trade date. Realized gains and losses on security transactions are determined on a specific identification basis. Interest income and estimated expenses are accrued daily. Amortization of premium and accretion of discount on debt securities are included in interest income. Distributions to shareholders are recorded on the ex-dividend date and are determined according to income tax regulations (tax basis). Distributable earnings determined on a tax basis may differ from earnings recorded in accordance with accounting principles generally accepted in the United States. These differences may be permanent or temporary. Permanent differences are reclassified among capital accounts to reflect their tax character. These reclassifications have no impact on net assets or the results of operations. Temporary differences are not reclassified, as they may reverse in subsequent periods.
Common expenses incurred by the Trust are allocated among the funds based on the ratio of net assets of each fund to the combined net assets of the Trust. Fund specific expenses are charged directly to the fund that incurred the expense.
Realized and unrealized gains and losses and net investment income, other than class specific expenses, are allocated daily to each class of shares based upon the relative proportion of net assets of each class. Differences in class-level expenses may result in payment of different per share distributions by class.
Inflation-indexed bonds provide an inflation hedge through periodic increases in the security’s interest accruals and principal redemption value, by amounts corresponding to the current rate of inflation. Any such adjustments, including adjustments to principal redemption value, are recorded as interest income.
g. Accounting Estimates
The preparation of financial statements in accordance with accounting principles generally accepted in the United States of America requires management to make estimates and assumptions that affect the reported amounts of assets and liabilities at the date of the financial statements and the amounts of income and expenses during the reporting period. Actual results could differ from those estimates.
h. Redemption Fees
Redemptions and exchanges of Class 3 shares held 60 days or less may be subject to the Fund’s redemption fee, which is 1% of the amount redeemed. Such fees are retained by the Fund and accounted for as an addition to paid-in capital.
i. Guarantees and Indemnifications
Under the Trust’s organizational documents, its officers and trustees are indemnified by the Trust against certain liabilities arising out of the performance of their duties to the Trust. Additionally, in the normal course of business, the Trust enters into contracts with service providers that contain general indemnification clauses. The Trust’s maximum exposure under these arrangements is unknown as this would involve future claims that may be made against the Trust that have not yet occurred. Currently, the Trust expects the risk of loss to be remote.
TGI-22
Franklin Templeton Variable Insurance Products Trust
Notes to Financial Statements (continued)
Templeton Global Income Securities Fund
2. SHARES OF BENEFICIAL INTEREST
At December 31, 2006, there were an unlimited number of shares authorized ($0.01 par value). Transactions in the Fund’s shares were as follows:
| | | | | | | | | | | | | | |
| | | Year Ended December 31, | |
| | | 2006 | | | 2005a | |
| Class 1 Shares: | | Shares | | | Amount | | | Shares | | | Amount | |
Shares sold | | 2,027,528 | | | $ | 30,612,502 | | | 1,067,253 | | | $ | 15,508,065 | |
Shares issued in reinvestment of distributions | | 137,929 | | | | 2,013,759 | | | 210,969 | | | | 3,016,853 | |
Shares redeemed | | (1,040,680 | ) | | | (15,639,327 | ) | | (735,231 | ) | | | (10,814,324 | ) |
| | | | |
Net increase (decrease) | | 1,124,777 | | | $ | 16,986,934 | | | 542,991 | | | $ | 7,710,594 | |
| | | | |
| Class 2 Shares: | | | | | | | | | | | | |
Shares sold | | 8,960,584 | | | $ | 133,647,009 | | | 3,017,652 | | | $ | 43,735,355 | |
Shares issued in reinvestment of distributions | | 226,190 | | | | 3,259,404 | | | 146,665 | | | | 2,073,846 | |
Shares redeemed | | (230,816 | ) | | | (3,418,676 | ) | | (110,837 | ) | | | (1,624,563 | ) |
| | | | |
Net increase (decrease) | | 8,955,958 | | | $ | 133,487,737 | | | 3,053,480 | | | $ | 44,184,638 | |
| | | | |
| Class 3 Shares: | | | | | | | | | | | | |
Shares sold | | 2,255,932 | | | $ | 33,481,415 | | | 427,371 | | | $ | 6,068,634 | |
Shares issued in reinvestment of distributions | | 29,966 | | | | 431,514 | | | 2,233 | | | | 31,575 | |
Shares redeemed | | (396,229 | ) | | | (5,978,234 | ) | | (22,884 | ) | | | (322,892 | ) |
| | | | |
Net increase (decrease) | | 1,889,669 | | | $ | 27,934,695 | | | 406,720 | | | $ | 5,777,317 | |
| | | | |
| a | For Class 3 shares, for the period April 1, 2005 (effective date) to December 31, 2005. |
3. TRANSACTIONS WITH AFFILIATES
Franklin Resources, Inc. is the holding company for various subsidiaries that together are referred to as Franklin Templeton Investments. Certain officers and trustees of the Trust are also officers and/or directors of the following subsidiaries:
| | |
| Subsidiary | | Affiliation |
Franklin Advisers, Inc. (Advisers) | | Investment manager |
Franklin Templeton Services, LLC (FT Services) | | Administrative manager |
Franklin Templeton Distributors, Inc. (Distributors) | | Principal underwriter |
Franklin Templeton Investor Services, LLC (Investor Services) | | Transfer agent |
a. Management Fees
The Fund pays an investment management fee to Advisers based on the average daily net assets of the Fund as follows:
| | |
| Annualized Fee Rate | | Net Assets |
0.625% | | up to and including $100 million |
0.500% | | over $100 million, up to and including $250 million |
0.450% | | over $250 million, up to and including $10 billion |
0.440% | | over $10 billion, up to and including $12.5 billion |
0.420% | | over $12.5 billion, up to and including $15 billion |
0.400% | | in excess of $15 billion |
b. Administrative Fees
Under an agreement with Advisers, FT Services provides administrative services to the Fund. The fee is paid by Advisers based on average daily net assets, and is not an additional expense of the Fund.
TGI-23
Franklin Templeton Variable Insurance Products Trust
Notes to Financial Statements (continued)
Templeton Global Income Securities Fund
3. TRANSACTIONS WITH AFFILIATES (continued)
c. Distribution Fees
The Fund’s Board of Trustees has adopted distribution plans for Class 2 and Class 3 shares pursuant to Rule 12b-1 under the 1940 Act. Under the Fund’s compensation distribution plans, the Fund pays Distributors for costs incurred in connection with the servicing, sale and distribution of the Fund’s shares up to 0.25% and 0.35% per year of its average daily net assets of Class 2 and Class 3, respectively. The Board of Trustees has agreed to limit the current rate to 0.25% per year for Class 3.
d. Transfer Agent Fees
Investor Services, under terms of an agreement, performs shareholder servicing for the Fund and is not paid by the Fund for the services.
4. EXPENSE OFFSET ARRANGEMENT
The Fund has entered into an arrangement with its custodian whereby credits realized as a result of uninvested cash balances are used to reduce a portion of the Fund’s custodian expenses. During the year ended December 31, 2006, the custodian fees were reduced as noted in the Statement of Operations.
5. INCOME TAXES
For tax purposes, capital losses may be carried over to offset future capital gains, if any. At December 31, 2006, the capital loss carryforwards were as follows:
Capital loss carryforwards expiring in:
| | | |
2007 | | $ | 2,569,857 |
2008 | | | 2,370,518 |
2009 | | | 1,649,033 |
2010 | | | 177,731 |
| | | |
| | $ | 6,767,139 |
| | | |
During the year ended December 31, 2006, the Fund utilized $875,316 of capital loss carryforwards.
The tax character of distributions paid during the years ended December 31, 2006 and 2005, was as follows:
| | | | | | |
| | | 2006 | | 2005 |
Distributions paid from ordinary income | | $ | 5,704,677 | | $ | 5,122,906 |
| | | |
At December 31, 2006, the cost of investments, net unrealized appreciation (depreciation) and undistributed ordinary income for income tax purposes were as follows:
| | | | |
Cost of investments | | $ | 299,036,842 | |
| | | | |
| |
Unrealized appreciation | | $ | 15,259,341 | |
Unrealized depreciation | | | (2,215,249 | ) |
| | | | |
Net unrealized appreciation (depreciation) | | $ | 13,044,092 | |
| | | | |
Distributable earnings – Undistributed ordinary income | | $ | 12,260,730 | |
| | | | |
TGI-24
Franklin Templeton Variable Insurance Products Trust
Notes to Financial Statements (continued)
Templeton Global Income Securities Fund
5. INCOME TAXES (continued)
Net investment income differs for financial statement and tax purposes primarily due to differing treatments of foreign currency transactions, and bond discounts and premiums.
Net realized gains (losses) differ for financial statement and tax purposes primarily due to differing treatments of wash sales, foreign currency transactions, and bond discounts and premiums.
6. INVESTMENT TRANSACTIONS
Purchases and sales of investments (excluding short term securities) for the year ended December 31, 2006, aggregated $181,459,475 and $49,573,650, respectively.
7. FORWARD EXCHANGE CONTRACTS
At December 31, 2006, the Fund had the following forward exchange contracts outstanding:
| | | | | | | | | | | | | | |
| Contracts to Buy | | Contract
Amounta | | | Settlement
Date | | Unrealized
Gain | | Unrealized
Loss | |
| 900,000 | | Brazilian Real | | 378,231 | | | 1/4/07 | | $ | 42,537 | | $ | — | |
| 172,000,000 | | Japanese Yen | | 1,557,266 | | | 2/1/07 | | | — | | | (105,567 | ) |
| 174,752,000 | | Japanese Yen | | 1,600,000 | | | 2/9/07 | | | — | | | (123,633 | ) |
| 87,450,400 | | Japanese Yen | | 800,000 | | | 2/9/07 | | | — | | | (61,188 | ) |
| 87,432,000 | | Japanese Yen | | 800,000 | | | 2/9/07 | | | — | | | (61,343 | ) |
| 43,888,000 | | Japanese Yen | | 400,000 | | | 2/9/07 | | | — | | | (29,219 | ) |
| 43,924,000 | | Japanese Yen | | 400,000 | | | 2/9/07 | | | — | | | (28,914 | ) |
| 48,129,750 | | Japanese Yen | | 450,000 | | | 2/13/07 | | | — | | | (43,184 | ) |
| 48,204,000 | | Japanese Yen | | 450,000 | | | 2/13/07 | | | — | | | (42,556 | ) |
| 996,625 | | Brazilian Real | | 425,000 | | | 2/21/07 | | | 37,182 | | | — | |
| 48,073,500 | | Japanese Yen | | 450,000 | | | 2/22/07 | | | — | | | (43,212 | ) |
| 1,111,500 | | Brazilian Real | | 450,000 | | | 2/26/07 | | | 65,076 | | | — | |
| 1,083,600 | | Brazilian Real | | 430,000 | | | 2/28/07 | | | 71,988 | | | — | |
| 21,500,000 | | Swedish Krona | | 3,007,414 | | | 2/28/07 | | | 142,617 | | | — | |
| 38,027,500 | | Japanese Yen | | 350,000 | | | 3/5/07 | | | — | | | (27,764 | ) |
| 25,000,000 | | Indian Rupee | | 888,415 | NZD | | 3/21/07 | | | — | | | (61,644 | ) |
| 42,030,000 | | Indian Rupee | | 900,000 | | | 3/27/07 | | | 42,645 | | | — | |
| 1,235,688 | | Romania Leu | | 425,000 | | | 3/28/07 | | | 54,319 | | | — | |
| 33,600,000 | | Japanese Yen | | 300,000 | | | 4/19/07 | | | — | | | (13,598 | ) |
| 2,451,400 | | Romania Leu | | 850,000 | | | 4/23/07 | | | 99,148 | | | — | |
| 34,696,800 | | Japanese Yen | | 240,000 | EUR | | 4/27/07 | | | — | | | (22,374 | ) |
| 101,142,000 | | Japanese Yen | | 900,000 | | | 5/24/07 | | | — | | | (34,005 | ) |
| 21,250,000 | | Iceland Krona | | 286,350 | | | 6/20/07 | | | 203 | | | — | |
| 31,875,000 | | Iceland Krona | | 431,326 | | | 6/21/07 | | | — | | | (1,596 | ) |
| 31,875,000 | | Iceland Krona | | 427,852 | | | 6/27/07 | | | 1,287 | | | — | |
| 426,288,750 | | Japanese Yen | | 3,750,000 | | | 7/5/07 | | | — | | | (80,433 | ) |
| 433,331,250 | | Japanese Yen | | 3,750,000 | | | 7/13/07 | | | — | | | (16,136 | ) |
| 175,000,000 | | Japanese Yen | | 1,513,727 | | | 7/17/07 | | | — | | | (5,070 | ) |
| 27,917,500 | | Japanese Yen | | 250,000 | | | 9/4/07 | | | — | | | (7,865 | ) |
| 14,000,000 | | Indian Rupee | | 462,092 | NZD | | 10/29/07 | | | — | | | (9,465 | ) |
| 14,500,000 | | Indian Rupee | | 488,594 | NZD | | 10/29/07 | | | — | | | (16,701 | ) |
| 27,925,000 | | Indian Rupee | | 929,749 | NZD | | 10/29/07 | | | — | | | (24,426 | ) |
| 31,600,000 | | Indian Rupee | | 1,083,676 | NZD | | 10/30/07 | | | — | | | (49,410 | ) |
TGI-25
Franklin Templeton Variable Insurance Products Trust
Notes to Financial Statements (continued)
Templeton Global Income Securities Fund
7. FORWARD EXCHANGE CONTRACTS (continued)
| | | | | | | | | | | | | | |
| Contracts to Sell | | Contract
Amounta | | | Settlement
Date | | Unrealized
Gain | | Unrealized
Loss | |
| 357,000 | | Euro | | 50,433,390 | JPY | | 3/6/07 | | $ | — | | $ | (45,294 | ) |
| 9,640,135 | | Mexican Peso | | 473,137,801 | CLP | | 8/16/07 | | | 3,582 | | | — | |
| 6,597,015 | | Mexican Peso | | 321,907,960 | CLP | | 8/20/07 | | | — | | | (959 | ) |
| 7,962,312 | | Mexican Peso | | 380,200,405 | CLP | | 8/21/07 | | | — | | | (16,717 | ) |
| 2,017,928 | | Mexican Peso | | 96,194,629 | CLP | | 9/14/07 | | | — | | | (4,359 | ) |
| 5,422,023 | | Mexican Peso | | 260,007,686 | CLP | | 9/12/07 | | | — | | | (8,871 | ) |
| 2,329,569 | | New Zealand Dollar | | 69,677,396 | INR | | 7/27/07 | | | — | | | (69,481 | ) |
| | | | | | | | | | | | | | |
| Unrealized gain (loss) on forward exchange contracts | | | | | | | | 560,584 | | | (1,054,984 | ) |
| | | | | | | | | | | | | | |
| Net unrealized gain (loss) on forward exchange contracts | | | | | | | | | | $ | (494,400 | ) |
| | | | | | | | | | | | | | |
| a | In U.S. Dollar unless otherwise indicated. |
Currency Abbreviations
CLP - Chilean Peso
EUR - Euro
INR - Indian Rupee
JPY - Japanese Yen
NZD - New Zealand Dollar
8. CREDIT RISK
The Fund has 19.66% of its portfolio invested in below investment grade and comparable quality unrated high yield securities, which tend to be more sensitive to economic conditions than higher rated securities. The risk of loss due to default by the issuer may be significantly greater for the holders of high yielding securities because such securities are generally unsecured and are often subordinated to other creditors of the issuer.
9. CONCENTRATION OF RISK
Investing in foreign securities may include certain risks and considerations not typically associated with investing in U.S. securities, such as fluctuating currency values and changing local and regional economic, political and social conditions, which may result in greater market volatility. In addition, certain foreign securities may not be as liquid as U.S. securities.
10. REGULATORY MATTERS
As part of various investigations by a number of federal, state, and foreign regulators and governmental entities, including the Securities and Exchange Commission (“SEC”), relating to certain practices in the mutual fund industry, including late trading, market timing and marketing support payments to securities dealers who sell fund shares (“marketing support”), Franklin Resources, Inc. and certain of its subsidiaries (collectively, the “Company”), entered into settlements with certain of those regulators. Specifically, the Company entered into settlements with the SEC, among others, concerning market timing and marketing support.
On June 23, 2006, the SEC approved the proposed plan of distribution for the marketing support settlement, and disbursement of the settlement monies to the designated funds, in accordance with the terms and conditions of that settlement and plan, was completed in September 2006. The Fund did not participate in that Settlement.
TGI-26
Franklin Templeton Variable Insurance Products Trust
Notes to Financial Statements (continued)
Templeton Global Income Securities Fund
10. REGULATORY MATTERS (continued)
The plan of distribution for the market timing settlement is currently under review by the SEC staff. After publication of notice of the plan and a 30-day comment period, the proposed plan of distribution will be submitted to the SEC for approval. Following the SEC’s approval of the plan of distribution, with modifications as appropriate, distribution of the settlement monies will begin in accordance with the terms and conditions of the settlement and plan.
In addition, the Company, as well as most of the mutual funds within Franklin Templeton Investments and certain current or former officers, Company directors, fund directors, and employees, have been named in private lawsuits (styled as shareholder class actions, or as derivative actions on behalf of either the named funds or Franklin Resources, Inc.). The lawsuits relate to the industry practices referenced above, as well as to allegedly excessive commissions and advisory and distribution fees.
The Company and fund management believe that the claims made in each of the private lawsuits referenced above are without merit and intend to defend against them vigorously. The Company cannot predict with certainty the eventual outcome of these lawsuits, nor whether they will have a material negative impact on the Company. If it is determined that the Company bears responsibility for any unlawful or inappropriate conduct that caused losses to the Trust, it is committed to making the Trust or its shareholders whole, as appropriate.
11. NEW ACCOUNTING PRONOUNCEMENTS
In July 2006, the Financial Accounting Standards Board (FASB) issued FASB Interpretation No. 48, “Accounting for Uncertainty in Income Taxes - an Interpretation of FASB Statement No. 109” (“FIN 48”), which clarifies the accounting for uncertainty in tax positions taken or expected to be taken in a tax return. FIN 48 provides guidance on the measurement, recognition, classification and disclosure of tax positions, along with accounting for the related interest and penalties. FIN 48 is effective for fiscal years beginning after December 15, 2006, and is to be applied to all open tax years as of the date of effectiveness. On December 22, 2006, the Securities and Exchange Commission extended the implementation date to no later than the last net asset value calculation in the first semi-annual reporting period in 2007. The Fund is currently evaluating the impact, if any, of applying the various provisions of FIN 48.
In September 2006, FASB issued FASB Statement No. 157, “Fair Value Measurement” (“SFAS 157”), which defines fair value, establishes a framework for measuring fair value, and expands disclosures about fair value measurements. SFAS 157 is effective for fiscal years beginning after November 15, 2007, and interim periods within those fiscal years. The Trust believes the adoption of SFAS 157 will have no material impact on its financial statements.
TGI-27
Franklin Templeton Variable Insurance Products Trust
Templeton Global Income Securities Fund
Report of Independent Registered Public Accounting Firm
To the Board of Trustees and Shareholders of
Franklin Templeton Variable Insurance Products Trust
In our opinion, the accompanying statement of assets and liabilities, including the statement of investments, and the related statements of operations and of changes in net assets and the financial highlights present fairly, in all material respects, the financial position of Templeton Global Income Securities Fund (one of the funds constituting the Franklin Templeton Variable Insurance Products Trust, hereafter referred to as the “Fund”) at December 31, 2006, the results of its operations for the year then ended, the changes in its net assets for each of the two years in the period then ended and the financial highlights for each of the periods presented, in conformity with accounting principles generally accepted in the United States of America. These financial statements and financial highlights (hereafter referred to as “financial statements”) are the responsibility of the Fund’s management; our responsibility is to express an opinion on these financial statements based on our audits. We conducted our audits of these financial statements in accordance with the standards of the Public Company Accounting Oversight Board (United States). Those standards require that we plan and perform the audit to obtain reasonable assurance about whether the financial statements are free of material misstatement. An audit includes examining, on a test basis, evidence supporting the amounts and disclosures in the financial statements, assessing the accounting principles used and significant estimates made by management, and evaluating the overall financial statement presentation. We believe that our audits, which included confirmation of securities at December 31, 2006 by correspondence with the custodian and brokers, provide a reasonable basis for our opinion.
PricewaterhouseCoopers LLP
San Francisco, California
February 16, 2007
TGI-28
Franklin Templeton Variable Insurance Products Trust
Tax Designation (unaudited)
Templeton Global Income Securities Fund
At December 31, 2006, more than 50% of the Fund’s total assets were invested in securities of foreign issuers. In most instances, foreign taxes were withheld from dividends paid to the Fund on these investments. The Fund elects to treat foreign taxes paid as allowed under Section 853 of the Internal Revenue Code. This election will allow shareholders of record in June 2007, to treat their proportionate share of foreign taxes paid by the Fund as having been paid directly by them. Shareholders shall consider these amounts as foreign taxes paid in the tax year in which they receive the Fund distribution.
The foreign tax information will be disclosed in the June 30, 2007, semi-annual report of the Fund.
TGI-29
INDEX DESCRIPTIONS
The indexes are unmanaged and include reinvested distributions.
Consumer Price Index (CPI), calculated by the U.S. Bureau of Labor Statistics, is a commonly used measure of the inflation rate.
CS High Yield Index is designed to mirror the investible universe of the U.S. dollar-denominated high yield debt market.
Dow Jones Industrial Average (the Dow) is price weighted based on the average market price of 30 blue chip stocks of companies that are generally industry leaders.
Dow Jones Wilshire Real Estate Securities Index is a broad measure of the performance of publicly traded real estate securities, such as real estate investment trusts and real estate operating companies. The index is capitalization weighted and rebalanced monthly, and returns are calculated on a buy-and-hold basis.
HSBC Asian Local Bond Index (ALBI) tracks total return performance of a bond portfolio, which consists of local-currency denominated, high quality and liquid bonds in Asia ex-Japan. Local bond market returns are from country sub-indexes of the HSBC ALBI.
J.P. Morgan (JPM) Emerging Markets Bond Index (EMBI) Global tracks total returns for U.S. dollar-denominated debt instruments issued by emerging market sovereign and quasi-sovereign entities: Brady bonds, loans and Eurobonds.
J.P. Morgan (JPM) Government Bond Index (GBI) Global tracks total returns for liquid, fixed-rate, domestic government bonds with maturities greater than one year issued by developed countries globally.
Lehman Brothers (LB) U.S. Aggregate Index represents securities that are SEC-registered, taxable and dollar denominated. The index covers the U.S. investment grade fixed-rate bond market, with index components for government and corporate securities, mortgage pass-through securities and asset-backed securities. All issues included must have at least one year to final maturity and must be rated investment grade (Baa3 or better) by Moody’s Investors Service. They must also be dollar denominated and nonconvertible. Total return includes price appreciation/depreciation and income as a percentage of the original investment. The index is rebalanced monthly by market capitalization.
Lehman Brothers (LB) U.S. Government: Intermediate Index is the intermediate component of the LB U.S. Government Index. The index includes securities issued by the U.S. government or agency. These include obligations of the U.S. Treasury with remaining maturity of one year or more and publicly issued debt of U.S. governmental agencies, quasi-federal corporations, and corporate or foreign debt guaranteed by the U.S. government.
Lipper Multi-Sector Income Funds Classification Average is calculated by averaging the total returns of all funds within the Lipper Multi-Sector Income Funds classification in the Lipper Open-End underlying funds universe. Lipper Multi-Sector Income Funds are defined as funds that seek current income by allocating assets among different fixed income securities sectors (not primarily in one sector except for defensive purposes), including U.S. and foreign governments, with a significant portion rated below investment grade. For the 12-month period ended 12/31/06, there were 114 funds in this category. Lipper calculations do not include sales charges, but include reinvestment of any income or distributions. Fund performance relative to the average may have differed if these and other factors had been considered.
Lipper VIP Equity Income Funds Classification Average is an equally weighted average calculation of performance figures for all funds within the Lipper Equity Income Funds classification in the Lipper VIP underlying funds universe. Lipper Equity Income Funds seek relatively high current income and growth of income through investing 60% or more of their portfolios in equities. For the 12-month period ended 12/31/06, there were 61 funds in this category. Lipper calculations do not include contract fees, expenses or sales charges, and may have been different if such charges had been considered.
Lipper VIP General U.S. Government Funds Classification Average is an equally weighted average calculation of performance figures for all funds within the Lipper U.S. Government Funds classification in the Lipper VIP underlying fund universe. Lipper U.S. Government Funds invest primarily in U.S. government and agency issues. For the 12-month period ended 12/31/06, there were 63 funds in this category. Lipper calculations do not include contract fees, expenses or sales charges, and may have been different if such charges had been considered.
Lipper VIP High Current Yield Funds Classification Average is an equally weighted average calculation for performance figures for all funds within the Lipper High Current Yield Funds aim at high (relative) current yield from fixed income securities, have no quality or maturity restrictions, and tend to invest in lower grade debt issues. For the 12-month period ended 12/31/06, there were 100 funds in this category. Lipper calculations do not include contract fees, expenses or sales charges, and may have been different if such charges had been considered.
I-1
Merrill Lynch 2- and 5-Year Zero Coupon Bond Indexes include zero coupon bonds that pay no interest and are issued at a discount from redemption price.
Morgan Stanley Capital International (MSCI) All Country (AC) World Index is a free float-adjusted, market capitalization-weighted index designed to measure equity market performance in global developed and emerging markets.
Morgan Stanley Capital International (MSCI) Emerging Markets (EM) Index is a free float-adjusted, market capitalization-weighted index designed to measure equity market performance in global emerging markets.
Morgan Stanley Capital International (MSCI) Europe, Australasia, Far East (EAFE) Index is a free float-adjusted, market capitalization-weighted index designed to measure equity market performance in global developed markets excluding the U.S. and Canada.
Morgan Stanley Capital International (MSCI) World Index is a free float-adjusted, market capitalization-weighted index designed to measure equity market performance in global developed markets.
NASDAQ Composite Index measures all NASDAQ domestic and international based common type stocks listed on The NASDAQ Stock Market. The index is market value weighted and includes over 3,000 companies.
Russell 1000® Growth Index is market capitalization weighted and measures performance of those Russell 1000 Index companies with higher price-to-book ratios and higher forecasted growth values.
Russell 1000 Index is market capitalization weighted and measures performance of the 1,000 largest companies in the Russell 3000 Index, which represent approximately 92% of total market capitalization of the Russell 3000 Index.
Russell 1000 Value Index is market capitalization weighted and measures performance of those Russell 1000 Index companies with lower price-to-book ratios and lower forecasted growth values.
Russell 2500™ Index is market capitalization weighted and measures performance of the 2,500 smallest companies in the Russell 3000 Index, which represent approximately 17% of total market capitalization of the Russell 3000 Index.
Russell 2500 Value Index is market capitalization weighted and measures performance of those Russell 2500 Index companies with lower price-to-book ratios and lower forecasted growth values.
Russell 3000® Growth Index is market capitalization weighted and measures performance of those Russell 3000 Index companies with higher price-to-book ratios and higher forecasted growth values.
Russell 3000 Index is market capitalization weighted and measures performance of the 3,000 largest U.S. companies based on total market capitalization, which represent approximately 98% of the investible U.S. equity market.
Russell Midcap™ Growth Index is market capitalization weighted and measures performance of those Russell Midcap Index companies with higher price-to-book ratios and higher forecasted growth values.
Russell Midcap Index is market capitalization weighted and measures performance of the 800 smallest companies in the Russell 1000 Index, which represent approximately 26% of total market capitalization of the Russell 1000 Index.
Standard & Poor’s 500 Index (S&P 500) consists of 500 stocks chosen for market size, liquidity and industry group representation. Each stock’s weight in the index is proportionate to its market value. The S&P 500 is one of the most widely used benchmarks of U.S. equity performance.
Standard & Poor’s/International Finance Corporation Investable (S&P/IFCI) Composite Index is a free float-adjusted, market capitalization-weighted index designed to measure equity performance in global emerging markets.
I-2
Board Members and Officers
The name, year of birth and address of the officers and board members, as well as their affiliations, positions held with the Trust, principal occupation during the past five years and number of portfolios overseen in the Franklin Templeton Investments fund complex are shown below. Generally, each board member will serve until that person’s successor is elected and qualified.
Independent Board Members
| | | | | | | | |
| Name, Year of Birth and Address | | Position | | Length of
Time Served | | Number of
Portfolios in Fund
Complex Overseen
by Board Member* | | Other Directorships Held |
HARRIS J. ASHTON (1932) One Franklin Parkway San Mateo, CA 94403-1906 | | Trustee | | Since 1988 | | 142 | | Director, Bar-S Foods (meat packing company). |
|
Principal Occupation During Past 5 Years: Director of various companies; and formerly, Director, RBC Holdings, Inc. (bank holding company) (until 2002); and President, Chief Executive Officer and Chairman of the Board, General Host Corporation (nursery and craft centers) (until 1998). |
ROBERT F. CARLSON (1928) One Franklin Parkway San Mateo, CA 94403-1906 | | Trustee | | Since 1998 | | 57 | | None |
|
Principal Occupation During Past 5 Years: Vice President, senior member and past President, Board of Administration, California Public Employees Retirement Systems (CALPERS); and formerly, member and Chairman of the Board, Sutter Community Hospitals; member, Corporate Board, Blue Shield of California; and Chief Counsel, California Department of Transportation. |
EDITH E. HOLIDAY (1952) One Franklin Parkway San Mateo, CA 94403-1906 | | Trustee | | Since 2005 | | 143 | | Director, Hess Corporation (formerly Amerada Hess Corporation) (exploration and refining of oil and gas), H.J. Heinz Company (processed foods and allied products), RTI International Metals, Inc. (manufacture and distribution of titanium), Canadian National Railway (railroad) and White Mountains Insurance Group, Ltd. (holding company). |
|
Principal Occupation During Past 5 Years: Director or Trustee of various companies and trusts; and formerly, Assistant to the President of the United States and Secretary of the Cabinet (1990-1993); General Counsel to the United States Treasury Department (1989-1990); and Counselor to the Secretary and Assistant Secretary for Public Affairs and Public Liaison-United States Treasury Department (1988-1989). |
FRANK W.T. LAHAYE (1929) One Franklin Parkway San Mateo, CA 94403-1906 | | Trustee | | Since 1988 | | 116 | | Director, Center for Creative Land Recycling (redevelopment). |
|
Principal Occupation During Past 5 Years: General Partner, Las Olas L.P. (Asset Management); and formerly, Chairman, Peregrine Venture Management Company (venture capital). |
FRANK A. OLSON (1932) One Franklin Parkway San Mateo, CA 94403-1906 | | Trustee | | Since 2005 | | 103 | | Director, Hess Corporation (formerly Amerada Hess Corporation) (exploration and refining of oil and gas) and Sentient Jet (private jet service); and formerly, Director, Becton Dickinson and Company (medical technology), Cooper Industries, Inc. (electrical products and tools and hardware), Health Net, Inc. (formerly Foundation Health) (integrated managed care), The Hertz Corporation (car rental), Pacific Southwest Airlines, The RCA Corporation, Unicom (formerly Commonwealth Edison), UAL Corporation (airlines) and White Mountains Insurance Group, Ltd. (holding company). |
|
Principal Occupation During Past 5 Years: Chairman Emeritus, The Hertz Corporation (since 2000) (Chairman of the Board (1980-2000) and Chief Executive Officer (1977-1999)); and formerly, Chairman of the Board, President and Chief Executive Officer, UAL Corporation. |
BOD-1
Interested Board Members and Officers
| | | | | | | | |
| Name, Year of Birth and Address | | Position | | Length of
Time Served | | Number of
Portfolios in Fund
Complex Overseen
by Board Member* | | Other Directorships Held |
**CHARLES B. JOHNSON (1933) One Franklin Parkway San Mateo, CA 94403-1906 | | Trustee and Chairman of the Board | | Since 1988 | | 142 | | None |
|
Principal Occupation During Past 5 Years: Chairman of the Board, Member—Office of the Chairman and Director, Franklin Resources, Inc.; Director, Templeton Worldwide, Inc.; and officer and/or director or trustee, as the case may be, of some of the other subsidiaries of Franklin Resources, Inc. and of 41 of the investment companies in Franklin Templeton Investments. |
**RUPERT H. JOHNSON, JR. (1940) One Franklin Parkway San Mateo, CA 94403-1906 | | Trustee, President and Chief Executive Officer—Investment Management | | Trustee since 1988 and President and Chief Executive Officer—Investment Management since 2002 | | 126 | | None |
|
Principal Occupation During Past 5 Years: Vice Chairman, Member—Office of the Chairman and Director, Franklin Resources, Inc.; Director, Franklin Advisers, Inc. and Templeton Worldwide, Inc.; Senior Vice President, Franklin Advisory Services, LLC; and officer and/or director or trustee, as the case may be, of some of the other subsidiaries of Franklin Resources, Inc. and of 44 of the investment companies in Franklin Templeton Investments. |
JAMES M. DAVIS (1952) One Franklin Parkway San Mateo, CA 94403-1906 | | Chief Compliance Officer and Vice President—AML Compliance | | Chief Compliance Officer since 2004 and Vice President—AML Compliance since February 2006 | | Not
Applicable | | Not Applicable |
|
Principal Occupation During Past 5 Years: Director, Global Compliance, Franklin Resources, Inc.; officer of some of the other subsidiaries of Franklin Resources, Inc. and of 46 of the investment companies in Franklin Templeton Investments; and formerly, Director of Compliance, Franklin Resources, Inc. (1994-2001). |
LAURA FERGERSON (1962) One Franklin Parkway San Mateo, CA 94403-1906 | | Treasurer | | Since 2004 | | Not
Applicable | | Not Applicable |
|
Principal Occupation During Past 5 Years: Vice President, Franklin Templeton Services, LLC; officer of 30 of the investment companies in Franklin Templeton Investments; and formerly, Director and member of Audit and Valuation Committees, Runkel Funds, Inc. (2003-2004); Assistant Treasurer of most of the investment companies in Franklin Templeton Investments (1997-2003); and Vice President, Franklin Templeton Services, LLC (1997-2003). |
JIMMY D. GAMBILL (1947) 500 East Broward Blvd. Suite 2100 Fort Lauderdale, FL 33394-3091 | | Senior Vice President and Chief Executive Officer—Finance and Administration | | Since 2002 | | Not
Applicable | | Not Applicable |
|
Principal Occupation During Past 5 Years: President, Franklin Templeton Services, LLC; Senior Vice President, Templeton Worldwide, Inc.; and officer of some of the other subsidiaries of Franklin Resources, Inc. and of 46 of the investment companies in Franklin Templeton Investments. |
DAVID P. GOSS (1947) One Franklin Parkway San Mateo, CA 94403-1906 | | Vice President | | Since 2000 | | Not
Applicable | | Not Applicable |
|
Principal Occupation During Past 5 Years: Senior Associate General Counsel, Franklin Templeton Investments; officer and director of one of the subsidiaries of Franklin Resources, Inc.; and officer of 46 of the investment companies in Franklin Templeton Investments. |
BOD-2
| | | | | | | | |
| Name, Year of Birth and Address | | Position | | Length of
Time Served | | Number of
Portfolios in Fund
Complex Overseen
by Board Member* | | Other Directorships Held |
BARBARA J. GREEN (1947) One Franklin Parkway San Mateo, CA 94403-1906 | | Vice President | | Since 2000 | | Not
Applicable | | Not Applicable |
|
Principal Occupation During Past 5 Years: Vice President, Deputy General Counsel and Secretary, Franklin Resources, Inc.; Secretary and Senior Vice President, Templeton Worldwide, Inc.; Secretary, Franklin Advisers, Inc., Franklin Advisory Services, LLC, Franklin Investment Advisory Services, LLC, Franklin Mutual Advisers, LLC, Franklin Templeton Institutional, LLC, Franklin Templeton Investor Services, LLC, Franklin Templeton Services, LLC, Franklin Templeton Distributors, Inc., Templeton Investment Counsel, LLC, and Templeton/Franklin Investment Services, Inc.; Vice President, Templeton Global Advisers Limited; and officer of some of the other subsidiaries of Franklin Resources, Inc. and of 46 of the investment companies in Franklin Templeton Investments; and formerly, Deputy Director, Division of Investment Management, Executive Assistant and Senior Advisor to the Chairman, Counselor to the Chairman, Special Counsel and Attorney Fellow, U.S. Securities and Exchange Commission (1986-1995); Attorney, Rogers & Wells (until 1986); and Judicial Clerk, U.S. District Court (District of Massachusetts) (until 1979). |
KAREN L. SKIDMORE (1952) One Franklin Parkway San Mateo, CA 94403-1906 | | Vice President and Secretary | | Vice President since February 2006 Secretary since April 2006 | | Not
Applicable | | Not Applicable |
|
Principal Occupation During Past 5 Years: Senior Associate General Counsel, Franklin Templeton Investments; Vice President and Secretary, Templeton Funds Annuity Company; and officer of 30 of the investment companies in Franklin Templeton Investments. |
CRAIG S. TYLE (1960) One Franklin Parkway San Mateo, CA 94403-1906 | | Vice President | | Since 2005 | | Not
Applicable | | Not Applicable |
|
Principal Occupation During Past 5 Years: General Counsel and Executive Vice President, Franklin Resources, Inc.; officer of some of the other subsidiaries of Franklin Resources, Inc. and of 46 of the investment companies in Franklin Templeton Investments; and formerly, Partner, Shearman & Sterling, LLP (2004-2005); and General Counsel, Investment Company Institute (ICI) (1997-2004). |
BOD-3
| | | | | | | | |
| Name, Year of Birth and Address | | Position | | Length of
Time Served | | Number of
Portfolios in Fund
Complex Overseen
by Board Member* | | Other Directorships Held |
GALEN G. VETTER (1951) 500 East Broward Blvd. Suite 2100 Fort Lauderdale, FL 33394-3091 | | Chief Financial Officer and Chief Accounting Officer | | Since 2004 | | Not
Applicable | | Not Applicable |
|
Principal Occupation During Past 5 Years: Senior Vice President, Franklin Templeton Services, LLC; officer of 46 of the investment companies in Franklin Templeton Investments; and formerly, Managing Director, RSM McGladrey, Inc. (1999-2004); and Partner, McGladrey & Pullen, LLP (1979-1987 and 1991-2004). |
| *We | base the number of portfolios on each separate series of the U.S. registered investment companies within the Franklin Templeton Investments fund complex. These portfolios have a common investment manager or affiliated investment managers. |
| **Charles | B. Johnson and Rupert H. Johnson, Jr. are considered to be interested persons of the Fund under the federal securities laws due to their positions as officers and directors and major shareholders of Franklin Resources, Inc., which is the parent company of the Trust’s manager and distributor. |
Note 1: Charles B. Johnson and Rupert H. Johnson, Jr. are brothers.
Note 2: Prior to December 31, 2006, S. Joseph Fortunato and Gordon S. Macklin ceased to be a trustee of the Trust.
The Sarbanes-Oxley Act of 2002 and Rules adopted by the Securities and Exchange Commission require the Fund to disclose whether the Fund’s Audit Committee includes at least one member who is an audit committee financial expert within the meaning of such Act and Rules. The Fund’s Board of Trustees has determined that there is at least one such financial expert on the Audit Committee and has designated Frank W.T. LaHaye as its audit committee financial expert. The Board believes that Mr. LaHaye qualifies as such an expert in view of his extensive business background and experience, including service as President and Director of McCormick Selph Associates from 1954 through 1965; Director and Chairman of Teledyne Canada Ltd. from 1966 through 1971; Director and Chairman of Quarterdeck Corporation from 1982 through 1998; and services as a Director of various other public companies including U.S. Telephone Inc. (1981-1984), Fisher Imaging Inc. (1991-1998) and Digital Transmissions Systems (1995-1999). In addition, Mr. LaHaye served from 1981 to 2000 as a Director and Chairman of Peregrine Venture Management Co., a venture capital firm, and has been a Member and Chairman of the Fund’s Audit Committee since its inception. As a result of such background and experience, the Board of Trustees believes that Mr. LaHaye has acquired an understanding of generally accepted accounting principles and financial statements, the general application of such principles in connection with the accounting estimates, accruals and reserves, and analyzing and evaluating financial statements that present a breadth and level of complexity of accounting issues generally comparable to those of the Fund, as well as an understanding of internal controls and procedures for financial reporting and an understanding of audit committee functions. Mr. LaHaye is an independent Trustee as that term is defined under the relevant Securities and Exchange Commission Rules and Releases.
The Statement of Additional Information (SAI) includes additional information about the board members and is available, without charge, upon request. Shareholders may call 1-800/321-8563 or their insurance companies to request the SAI.
BOD-4
Franklin Templeton Variable Insurance Products Trust
Shareholder Information
Proxy Voting Policies and Procedures
The Trust has established Proxy Voting Policies and Procedures (“Policies”) that the Trust uses to determine how to vote proxies relating to portfolio securities. Shareholders may view the Trust’s complete Policies online at franklintempleton.com. Alternatively, shareholders may request copies of the Policies free of charge by calling the Proxy Group collect at 1-954/527-7678 or by sending a written request to: Franklin Templeton Companies, LLC, 500 East Broward Boulevard, Suite 1500, Fort Lauderdale, FL 33394, Attention: Proxy Group. Copies of the Trust’s proxy voting records are also made available online at franklintempleton.com and posted on the U.S. Securities and Exchange Commission’s website at sec.gov and reflect the most recent 12-month period ended June 30.
Quarterly Statement of Investments
The Trust files a complete statement of investments with the U.S. Securities and Exchange Commission for the first and third quarters for each fiscal year on Form N-Q. Shareholders may view the filed Form N-Q by visiting the Commission’s website at sec.gov. The filed form may also be viewed and copied at the Commission’s Public Reference Room in Washington, DC. Information regarding the operations of the Public Reference Room may be obtained by calling 1-800/SEC-0330.
SI-1
| | |
 | | One Franklin Parkway San Mateo, CA 94403-1906 |
Annual Report
FRANKLIN TEMPLETON
VARIABLE INSURANCE PRODUCTS TRUST
Investment Managers
Franklin Advisers, Inc.
Franklin Advisory Services, LLC
Franklin Mutual Advisers, LLC
Templeton Asset Management, Ltd., Singapore
Templeton Global Advisors Limited
Templeton Investment Counsel, LLC
Distributor
Franklin Templeton Distributors, Inc.
Franklin Templeton Variable Insurance Products Trust (FTVIP) shares are sold only to insurance company separate accounts (“Separate Account”) to serve as the investment vehicles for both variable annuity and variable life insurance contracts.
Authorized for distribution only when accompanied or preceded by the current prospectus for the applicable contract, which includes the Separate Account and the FTVIP prospectuses. Investors should carefully consider a fund’s investment goals, risks, charges and expenses before investing. The prospectus contains this and other information; please read it carefully before investing.
To ensure the highest quality of service, telephone calls to or from our service departments may be monitored, recorded and accessed. These calls can be identified by the presence of a regular beeping tone.
FTVIP A2006 02/07
| (a) | The Registrant has adopted a code of ethics that applies to its principal executive officers and principal financial and accounting officer. |
| (f) | Pursuant to Item 12(a)(1), the Registrant is attaching as an exhibit a copy of its code of ethics that applies to its principal executive officers and principal financial and accounting officer. |
| Item 3. | Audit Committee Financial Expert. |
| | |
| (a) (1) | | The Registrant has an audit committee financial expert serving on its audit committee. |
| | |
| (2) | | The audit committee financial expert is Frank W.T. LaHaye and he is “Independent” as defined under the relevant Securities and Exchange Commission Rules And Releases. |
| Item 4. | Principal Accountant Fees and Services. |
(a) Audit Fees
The aggregate fees paid to the principal accountant for professional services rendered by the principal accountant for the audit of the registrant’s annual financial statements or for services that are normally provided by the principal accountant in connection with statutory and regulatory filings or engagements were $771,109 for the fiscal year ended December 31, 2006 and $729,089 for the fiscal year ended December 31, 2005.
(b) Audit-Related Fees
There were no fees paid to the principal accountant for assurance and related services rendered by the principal accountant to the registrant that are reasonably related to the performance of the audit of the registrant’s financial statements and are not reported under paragraph (a) of Item 4.
There were no fees paid to the principal accountant for assurance and related services rendered by the principal accountant to the registrant’s investment adviser and any entity controlling, controlled by or under common control with the investment adviser that provides ongoing services to the registrant that are reasonably related to the performance of the audit of their financial statements.
(c) Tax Fees
There were no fees paid to the principal accountant for professional services rendered by the principal accountant to the registrant for tax compliance, tax advice and tax planning.
The aggregate fees paid to the principal accountant for professional services rendered by the principal accountant to the registrant’s investment adviser and any entity controlling, controlled by or under common control with the investment adviser that provides ongoing services to the registrant for tax compliance, tax advice and tax planning were $3,961 for the fiscal year ended December 31, 2006 and $4,955 for the fiscal year ended December 31, 2005. The services for which these fees were paid included tax compliance and advice.
(d) All Other Fees
The aggregate fees paid to the principal accountant for products and services rendered by the principal accountant to the registrant not reported in paragraphs (a)-(c) of Item 4 were $14,799 for the fiscal year ended December 31, 2006 and $0 for the fiscal year ended December 31, 2005. The services for which these fees were paid included review of materials provided to the fund Board in connection with the investment management contract renewal process.
The aggregate fees paid to the principal accountant for products and services rendered by the principal accountant to the registrant’s investment adviser and any entity controlling, controlled by or under common control with the investment adviser that provides ongoing
services to the registrant not reported in paragraphs (a)-(c) of Item 4 were $161,062 for the fiscal year ended December 31, 2006 and $5,835 for the fiscal year ended December 31, 2005. The services for which these fees were paid included review of materials provided to the fund Board in connection with the investment management contract renewal process and the review of the ICI transfer agent survey.
(e) (1) The registrant’s audit committee is directly responsible for approving the services to be provided by the auditors, including:
(i) pre-approval of all audit and audit related services;
(ii) pre-approval of all non-audit related services to be provided to the Fund by the auditors;
(iii) pre-approval of all non-audit related services to be provided to the registrant by the auditors to the registrant’s investment adviser or to any entity that controls, is controlled by or is under common control with the registrant’s investment adviser and that provides ongoing services to the registrant where the non-audit services relate directly to the operations or financial reporting of the registrant; and
(iv) establishment by the audit committee, if deemed necessary or appropriate, as an alternative to committee pre-approval of services to be provided by the auditors, as required by paragraphs (ii) and (iii) above, of policies and procedures to permit such services to be pre-approved by other means, such as through establishment of guidelines or by action of a designated member or members of the committee; provided the policies and procedures are detailed as to the particular service and the committee is informed of each service and such policies and procedures do not include delegation of audit committee responsibilities, as contemplated under the Securities Exchange Act of 1934, to management; subject, in the case of (ii) through (iv), to any waivers, exceptions or exemptions that may be available under applicable law or rules.
(e) (2) None of the services provided to the registrant described in paragraphs (b)-(d) of Item 4 were approved by the audit committee pursuant to paragraph (c)(7)(i)(C) of Rule 2-01 of regulation S-X.
(f) No disclosures are required by this Item 4(f).
(g) The aggregate non-audit fees paid to the principal accountant for services rendered by the principal accountant to the registrant and the registrant’s investment adviser and any entity controlling, controlled by or under common control with the investment adviser that provides ongoing services to the registrant were $179,822 for the fiscal year ended December 31, 2006 and $10,790 for the fiscal year ended December 31, 2005.
(h) The registrant’s audit committee of the board has considered whether the provision of non-audit services that were rendered to the registrant’s investment adviser (not including any sub-adviser whose role is primarily portfolio management and is subcontracted with or overseen by another investment adviser), and any entity controlling, controlled by, or under common control with the investment adviser that
provides ongoing services to the registrant that were not pre-approved pursuant to paragraph (c)(7)(ii) of Rule 2-01 of Regulation S-X is compatible with maintaining the principal accountant’s independence.
| Item 5. | Audit Committee of Listed Registrants. N/A |
| Item 6. | Schedule of Investments. N/A |
| Item 7. | Disclosure of Proxy Voting Policies and Procedures for Closed-End Management Investment Companies. N/A |
| Item 8. | Portfolio Managers of Closed-End Management Investment Companies. N/A |
| Item 9. | Purchases of Equity Securities by Closed-End Management Investment Companies and Affiliated Purchases. N/A |
| Item 10. | Submission of Matters to a vote of Security Holders. |
There have been no changes to the procedures by which shareholders may recommend nominees to the Registrant’s Board of Trustees that would require disclosure herein.
| Item 11. | Controls and Procedures. |
(a) Evaluation of Disclosure Controls and Procedures. The Registrant maintains disclosure controls and procedures that are designed to ensure that information required to be disclosed in the Registrant’s filings under the Securities Exchange Act of 1934 and the Investment Company Act of 1940 is recorded, processed, summarized and reported within the periods specified in the rules and forms of the Securities and Exchange Commission. Such information is accumulated and communicated to the Registrant’s management, including its principal executive officer and principal financial officer, as appropriate, to allow timely decisions regarding required disclosure. The Registrant’s management, including the principal executive officer and the principal financial officer, recognizes that any set of controls and procedures, no matter how well designed and operated, can provide only reasonable assurance of achieving the desired control objectives.
Within 90 days prior to the filing date of this Shareholder Report on Form N-CSR, the Registrant had carried out an evaluation, under the supervision and with the participation of the Registrant’s management, including the Registrant’s principal executive officer and the Registrant’s principal financial officer, of the effectiveness of the design and operation of the Registrant’s disclosure controls and procedures. Based on such evaluation, the Registrant’s principal executive officer and principal financial officer concluded that the Registrant’s disclosure controls and procedures are effective.
(b) Changes in Internal Controls. There have been no significant changes in the Registrant’s internal controls or in other factors that
could significantly affect the internal controls subsequent to the date of their evaluation in connection with the preparation of this Shareholder Report on Form N-CSR.
(a) (1) Code of Ethics
(a) (2) Certifications pursuant to Section 302 of the Sarbanes-Oxley Act of 2002 of Jimmy D. Gambill, Chief Executive Officer - Finance and Administration, and Galen G. Vetter, Chief Financial Officer
(b) Certifications pursuant to Section 906 of the Sarbanes-Oxley Act of 2002 of Jimmy D. Gambill, Chief Executive Officer - Finance and Administration, and Galen G. Vetter, Chief Financial Officer
SIGNATURES
Pursuant to the requirements of the Securities Exchange Act of 1934 and the Investment Company Act of 1940, the registrant has duly caused this report to be signed on its behalf by the undersigned, thereunto duly authorized.
FRANKLIN TEMPLETON VARIABLE INSURANCE PRODUCTS TRUST
| | |
| |
| By | | /s/ Jimmy D. Gambill |
Jimmy D. Gambill |
Chief Executive Officer -Finance and Administration |
Date February 27, 2007 |
Pursuant to the requirements of the Securities Exchange Act of 1934 and the Investment Company Act of 1940, this report has been signed below by the following persons on behalf of the registrant and in the capacities and on the dates indicated.
| | |
| |
| By | | /s/ Jimmy D. Gambill |
Jimmy D. Gambill |
Chief Executive Officer -Finance and Administration |
Date February 27, 2007 |
| | |
| |
| By | | /s/ Galen G. Vetter |
Galen G. Vetter |
Chief Financial Officer |
Date February 27, 2007 |