UNITED STATES
SECURITIES AND EXCHANGE COMMISSION
Washington, D.C. 20549
FORM N-CSR
CERTIFIED SHAREHOLDER REPORT OF REGISTERED
MANAGEMENT INVESTMENT COMPANIES
Investment Company Act file number 811-05583
Franklin Templeton Variable Insurance Products Trust
(Exact name of registrant as specified in charter)
| | |
| One Franklin Parkway, San Mateo, CA | | 94403-1906 |
| |
| (Address of principal executive offices) | | (Zip code) |
Craig S. Tyle, One Franklin Parkway, San Mateo, CA 94403-1906
(Name and address of agent for service)
Registrant’s telephone number, including area code: (650) 312-2100
Date of fiscal year end: 12/31
Date of reporting period: 12/31/05
Item 1. Reports to Stockholders.

DECEMBER 31, 2005
FRANKLIN TEMPLETON
VARIABLE INSURANCE PRODUCTS TRUST
ANNUAL REPORT

FRANKLIN TEMPLETON VARIABLE INSURANCE PRODUCTS TRUST ANNUAL REPORT
TABLEOF CONTENTS
NOT FDIC INSURED | MAY LOSE VALUE | NO BANK GUARANTEE
MASTER CLASS – 3
IMPORTANT NOTESTO PERFORMANCE INFORMATION
Performance data is historical and cannot predict or guarantee future results. Principal value and investment return will fluctuate with market conditions, and you may have a gain or loss when you withdraw your money. Inception dates of the funds may have preceded the effective dates of the subaccounts, contracts, or their availability in all states.
When reviewing the index comparisons, please keep in mind that indexes have a number of inherent performance differentials over the funds. First, unlike the funds, which must hold a minimum amount of cash to maintain liquidity, indexes do not have a cash component. Second, the funds are actively managed and, thus, are subject to management fees to cover salaries of securities analysts or portfolio managers in addition to other expenses. Indexes are unmanaged and do not include any commissions or other expenses typically associated with investing in securities. Third, indexes often contain a different mix of securities than the fund to which they are compared. Additionally, please remember that indexes are simply a measure of performance and cannot be invested in directly.
i
TEMPLETON DEVELOPING MARKETS SECURITIES FUND
This annual report for Templeton Developing Markets Securities Fund covers the fiscal year ended December 31, 2005.
Performance Summary as of 12/31/05
Average annual total return of Class 3 shares* represents the average annual change in value, assuming reinvestment of dividends and capital gains. Average returns smooth out variations in returns, which can be significant; they are not the same as year-by-year results.
Periods ended 12/31/05
| | | | | | |
| | | 1-Year | | 5-Year | | Since
Inception
(3/4/96) |
Average Annual Total Return | | +27.45% | | +17.45% | | +2.09% |
*Performance prior to the 5/1/00 merger reflects historical performance of Templeton Developing Markets Fund. Additionally, Class 3 and Class 2 shares were not offered until 5/1/04 and 5/1/97, respectively. As a result, Class 3 Fund performance for periods prior to 5/1/04 represents historical results of Class 2 shares which, for periods prior to 5/1/97, reflects historical results of Class 1 shares. For periods beginning on 5/1/97, Class 2’s results reflect an additional 12b-1 fee expense, which also affects future performance. The 12b-1 fee rate is currently the same for Classes 2 and 3. Since 5/1/04 (effective date), the average annual total return of Class 3 shares was +31.78%.
Total Return Index Comparison for Hypothetical $10,000 Investment (3/4/96–12/31/05)
The graph below shows the change in value of a hypothetical $10,000 investment in the Fund over the indicated period and includes reinvestment of any income or distributions The Fund’s performance* is compared to the performance of the Morgan Stanley Capital International (MSCI) Emerging Markets (EM) Index and the Standard & Poor’s/International Finance Corporation Investable (S&P/IFCI) Composite Index. One cannot invest directly in an index, nor is an index representative of the Fund’s portfolio. Please see Important Notes to Performance Information preceding the Fund Summaries.
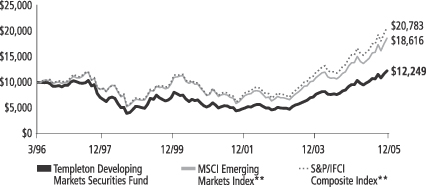
**Source: Standard & Poor’s Micropal. Please see Index Descriptions following the Fund Summaries.
Templeton Developing Markets Securities Fund Class 3
Performance reflects the Fund’s Class 3 operating expenses, but does not include any contract fees, expenses or sales charges. If they had been included, performance would be lower. These charges and deductions, particularly for variable life policies, can have a significant effect on contract values and insurance benefits. See the contract prospectus for a complete description of these expenses, including sales charges.
Performance data represent past performance, which does not guarantee future results. Investment return and principal value will fluctuate, and you may have a gain or loss when you sell your shares. Current performance may differ from figures shown.
TD-1
Fund Goal and Main Investments: Templeton Developing Markets Securities Fund seeks long-term capital appreciation. The Fund normally invests at least 80% of its net assets in emerging market investments, primarily to predominantly in equity securities.
Performance Overview
You can find the Fund’s one-year total return in the Performance Summary. The Fund underperformed the MSCI EM Index and the S&P/IFCI Composite Index, which returned +34.54% and +35.19% for the same period.1 Please note that index performance numbers are purely for reference and that we do not attempt to track an index, but rather undertake investments on the basis of fundamental research.
Economic and Market Overview
During the year under review, most Asian economies recorded robust growth, particularly those of China and India, which attracted new investment. China had a record year with new equity issuance, while India experienced record foreign fund inflows in 2005. In Latin America, market sentiment was positive as the region’s risk profile improved, economies’ financial positions improved, and governments reduced interest rates in light of subdued inflation and sustained economic recovery.
Eastern Europe experienced greater integration with Western Europe, implemented reforms, and had benign inflation and falling interest rates, which contributed to a favorable investment environment. Russia’s market was one of the strongest emerging markets performers as the MSCI Russia Index returned +73.77% in 2005.2 High commodity prices, especially for oil, provided a boost to the Russian economy. In Turkey, European Union accession talks, robust gross domestic product growth, implementation of key reforms, and International Monetary Fund support provided investors with reasons to remain confident.
In this environment, emerging markets had another strong year in 2005, as measured by the MSCI EM Index. Latin America and Eastern Europe led emerging markets performance, while emerging Asian markets, although experiencing double-digit returns, lagged the overall
1. Source: Standard & Poor’s Micropal. One cannot invest directly in an index, nor is an index representative of the Fund’s portfolio. Please see Index Descriptions following the Fund Summaries.
2. Source: Standard & Poor’s Micropal. Please see Index Descriptions following the Fund Summaries.
Fund Risks: The Fund’s investments in stocks offer the potential for long-term gains but can be subject to short-term up-and-down price movements. Investing in emerging markets is subject to all the risks of foreign investing generally, and has additional, heightened risks, including market and currency fluctuations, economic instability, adverse social and political developments, the relatively smaller size and lesser liquidity of these markets, and less effective or irregular government supervision and regulation of business and industry practices. The Fund’s prospectus also includes a description of the main investment risks.
TD-2
index. Rising U.S. interest rates led investors to adopt a more cautious stance toward investing in Asia. However, in 2005’s fourth quarter, Asian markets experienced higher returns relative to Latin American and Eastern European markets largely due to the U.S. Federal Reserve Board’s signaling a possible halt to raising interest rates in the near future. High commodity prices and market stability allowed South Africa’s stock prices to continue their upward trend during the year, while positive developments in Turkey led the country’s equity market to end 2005 up significantly.
Investment Strategy
Our investment philosophy is bottom-up, value-oriented and long-term. In choosing investments, we may make onsite visits to companies to assess critical factors such as management strength and local conditions. In addition, we focus on the market price of a company’s securities relative to our evaluation of the company’s potential long-term (typically five years) earnings, asset value, cash flow and balance sheet. Among factors we may consider are a company’s historical value measures, including price/earnings ratio, book value, profit margins and liquidation value. We perform in-depth research to construct an action list from which we make our investment decisions.
Manager’s Discussion
In terms of performance relative to the MSCI EM Index, the Fund benefited from underweighted exposure to and stock selection in Taiwan and Malaysia. The Fund’s exposure to South Korea, which was roughly in line with the index, also helped performance due to the Fund’s overweighted positions in strong performing stocks such as Hyundai Development, Samsung Heavy Industries, and Daewoo Shipbuilding & Marine Engineering. On the other hand, the Fund’s underweighted exposure to Mexico and Russia hindered results relative to the index. The Fund’s U.K. holdings underperformed the index during the period, thus hurting relative performance; however, we believed those companies were well positioned in their respective areas to benefit from growing demand for financial and banking services in emerging markets.
At the sector level, stock selection in the capital goods industry benefited performance relative to the MSCI EM Index.3 Our underweighted allocations in the insurance and technology hardware and equipment sectors also helped performance, as these sectors underperformed the
3. The capital goods sector comprises aerospace and defense, building products, chemicals, construction and engineering, industrial conglomerates, and machinery in the Statement of Investments (SOI).
TD-3
overall index.4 In contrast, the Fund’s overweighted exposure to Taiwan Mobile hurt relative performance. In addition, our having no holdings in America Movil and Orascom Telecom hindered the Fund’s relative results. We did not own those two stocks due to expensive valuations and the availability of what we considered more attractively valued telecommunications stocks in other markets. Similarly, our underweighted position in energy sector stocks and our stock selection in the food, beverage and tobacco sector hindered performance during the period.5
During the year under review, the Fund’s exposure to Asia increased as we found stocks trading at what we considered attractive valuations. We made the largest purchases in Taiwan, Thailand and China H shares (Hong Kong-listed companies), while also adding significant investments in South Korea and Malaysia. Key purchases included adding to existing positions in PetroChina, a dominant participant in China’s oil and gas sector; Mega Financial Holdings, a leading financial holding company in Taiwan; and SK, a South Korean conglomerate that operates oil refineries, cellular telephone services and import-export businesses. In addition, we initiated a position in Maxis Communications, one of Malaysia’s prominent integrated telecommunication services providers. Conversely, we reduced exposure to Singapore and Hong Kong as we sold some shares as selected stocks reached our sale price targets.
In Latin America, we increased our allocations to Brazil and Mexico, while eliminating exposure to Argentina via the sale of Tenaris. Brazil and Mexico benefited from greater investor interest and fund inflows during 2005. Significant purchases included adding to Petroleo Brasileiro (Petrobras), Brazil’s national oil and gas company with activities in the exploration, production, refining, transportation and distribution of oil and its byproducts; Companhia Vale do Rio Doce, a Brazilian producer of iron ore that is among the world’s largest; and Telefonos de Mexico, Mexico’s nationwide provider of fixed-line telephone services and the leading Internet and local and long-distance services provider. We also initiated exposure to Panama during the period.
4. The technology hardware and equipment sector comprises communications equipment, computers and peripherals, electronic equipment and instruments, and office equipment in the SOI.
5. The energy sector comprises oil, gas and consumable fuels in the SOI. The food, beverage and tobacco sector comprises beverages, food products and tobacco in the SOI.
Top 10 Holdings
Templeton Developing Markets Securities Fund
12/31/05
| | |
Company
Sector/Industry,
Country | | % of Total
Net Assets |
| |
| Samsung Electronics Co. Ltd. | | 4.1% |
| Semiconductors & Semiconductor Equipment, South Korea | | |
| |
| PetroChina Co. Ltd. | | 2.7% |
| Oil, Gas & Consumable Fuels, China | | |
| |
China Mobile
(Hong Kong) Ltd., fgn. | | 2.6% |
| Wireless Telecommunication Services, China | | |
| |
Petroleo Brasileiro SA,
ADR, pfd. | | 2.2% |
| Oil, Gas & Consumable Fuels, Brazil | | |
| |
| Remgro Ltd. | | 2.1% |
| Diversified Financial Services, South Africa | | |
| |
| Anglo American PLC | | 1.9% |
| Metals & Mining, South Africa | | |
| |
Banco Bradesco SA,
ADR, pfd. | | 1.8% |
| Commercial Banks, Brazil | | |
| |
| HSBC Holdings PLC | | 1.6% |
| Commercial Banks, U.K. | | |
| |
| Old Mutual PLC | | 1.5% |
| Insurance, South Africa | | |
| |
| Nedbank Group Ltd. | | 1.4% |
| Commercial Banks, South Africa | | |
The dollar value, number of shares or principal amount, and names of all portfolio holdings are listed in the Fund’s Statement of Investments.
TD-4
The Fund’s largest sales were in Europe as some stock valuations grew increasingly expensive due to the region’s strong market performances. Significant sales included stocks from Austria, Belgium, the Czech Republic, Greece and Poland. As we searched for undervalued stocks in the region, in line with our strategy, we made selective purchases in Russia, Finland and the U.K. Key purchases included initiating positions in Mining and Metallurgical Co. Norilsk Nickel, one of the world’s largest precious metals companies; Mobile Telesystems, one of Eastern Europe’s and Russia’s largest mobile telecommunication services providers; and Nokian Renkaat, a well-known Finnish tire manufacturer with significant exposure to Russia’s market. We also added to our positions in HSBC Holdings, one of the world’s largest banking and financial services organizations; and Provident Financial, a consumer finance company with exposure to Central and Eastern Europe, as well as Latin America. In addition, we increased the number of South African holdings during the period as the country continued to experience positive developments.
Thank you for your participation in Templeton Developing Markets Securities Fund. We look forward to serving your future investment needs.
The foregoing information reflects our analysis, opinions and portfolio holdings as of December 31, 2005, the end of the reporting period. The way we implement our main investment strategies and the resulting portfolio holdings may change depending on factors such as market and economic conditions. These opinions may not be relied upon as investment advice or an offer for a particular security. The information is not a complete analysis of every aspect of any market, country, industry, security or the Fund. Statements of fact are from sources considered reliable, but the adviser makes no representation or warranty as to their completeness or accuracy. Although historical performance is no guarantee of future results, these insights may help you understand our investment management philosophy.
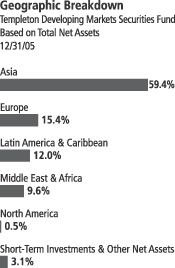
Top 10 Countries
Templeton Developing Markets Securities Fund
12/31/05
| | |
| | | % of Total
Net Assets |
| South Korea | | 19.0% |
| Taiwan | | 13.6% |
| China | | 10.9% |
| South Africa | | 9.6% |
| Brazil | | 8.4% |
| Thailand | | 4.1% |
| Russia | | 3.9% |
| India | | 3.6% |
| Mexico | | 3.3% |
| Singapore | | 3.2% |
TD-5
Fund Expenses
As an investor in a variable insurance contract (“Contract”) that indirectly provides for investment in an underlying mutual fund, you can incur transaction and/or ongoing expenses at both the Fund level and the Contract level.
| • | | Transaction expenses can include sales charges (loads) on purchases, redemption fees, surrender fees, transfer fees and premium taxes. |
| • | | Ongoing expenses can include management fees, distribution and service (12b-1) fees, contract fees, annual maintenance fees, mortality and expense risk fees and other fees and expenses. All mutual funds and Contracts have some types of ongoing expenses. |
The expenses shown in the table below are meant to highlight ongoing expenses at the Fund level only and do not include ongoing expenses at the Contract level, or transaction expenses at either the Fund or Contract level. While the Fund does not have transaction expenses, if the transaction and ongoing expenses at the Contract level were included, the expenses shown below would be higher. You should consult your Contract prospectus or disclosure document for more information.
The table shows Fund-level ongoing expenses and can help you understand these expenses and compare them with those of other mutual funds offered through the Contract. The table assumes a $1,000 investment held for the six months indicated. Please refer to the Fund prospectus for additional information on operating expenses.
Actual Fund Expenses
The first line (Actual) of the table below provides actual account values and expenses. The “Ending Account Value” is derived from the Fund’s actual return, which includes the effect of ongoing Fund expenses, but does not include the effect of ongoing Contract expenses.
You can estimate the Fund-level expenses you incurred during the period by following these steps. Of course, your account value and expenses will differ from those in this illustration:
| 1. | Divide your account value by $1,000. |
If an account had an $8,600 value, then $8,600 ÷ $1,000 = 8.6.
| 2. | Multiply the result by the number under the heading “Fund-Level Expenses Incurred During Period.” |
If Fund-Level Expenses Incurred During Period were $7.50, then 8.6 x $7.50 = $64.50.
Templeton Developing Markets Securities Fund Class 3
TD-6
In this illustration, the estimated expenses incurred this period at the Fund level are $64.50.
Hypothetical Example for Comparison with Other Mutual Funds
Information in the second line (Hypothetical) of the table can help you compare ongoing expenses of the Fund with those of other mutual funds offered through the Contract. This information may not be used to estimate the actual ending account balance or expenses you incurred during the period. The hypothetical “Ending Account Value” is based on the Fund’s actual expense ratio and an assumed 5% annual rate of return before expenses, which does not represent the Fund’s actual return. The figure under the heading “Fund-Level Expenses Incurred During Period” shows the hypothetical expenses your account would have incurred under this scenario. You can compare this figure with the 5% hypothetical examples that appear in shareholder reports of other funds offered through a Contract.
| | | | | | | | | |
| Class 3 | | Beginning
Account
Value 7/1/05 | | Ending
Account
Value 12/31/05 | | Fund-Level
Expenses Incurred
During Period*
7/1/05-12/31/05 |
Actual | | $ | 1,000 | | $ | 1,201.80 | | $ | 9.93 |
Hypothetical (5% return before expenses) | | $ | 1,000 | | $ | 1,016.18 | | $ | 9.10 |
*Expenses are equal to the annualized expense ratio for the Fund’s Class 3 shares (1.79%), which does not include any ongoing expenses of the Contract for which the Fund is an investment option, multiplied by the average account value over the period, multiplied by 184/365 to reflect the one-half year period.
TD-7
Franklin Templeton Variable Insurance Products Trust
Financial Highlights
Templeton Developing Markets Securities Fund
| | | | | | | | | | | | | | | | | | | | |
| | | Year Ended December 31,
| |
| Class 1 | | 2005 | | | 2004 | | | 2003 | | | 2002 | | | 2001 | |
| | |
| |
Per share operating performance | | | | | | | | | | | | | | | | | | | | |
(for a share outstanding throughout the year) | | | | | | | | | | | | | | | | | | | | |
Net asset value, beginning of year | | $ | 8.73 | | | $ | 7.14 | | | $ | 4.71 | | | $ | 4.78 | | | $ | 5.25 | |
| | |
|
|
|
Income from investment operations: | | | | | | | | | | | | | | | | | | | | |
Net investment incomea | | | 0.17 | | | | 0.11 | | | | 0.13 | | | | 0.07 | | | | 0.08 | |
Net realized and unrealized gains (losses) | | | 2.23 | | | | 1.62 | | | | 2.38 | | | | (0.06 | ) | | | (0.50 | ) |
| | |
|
|
|
Total from investment operations | | | 2.40 | | | | 1.73 | | | | 2.51 | | | | 0.01 | | | | (0.42 | ) |
| | |
|
|
|
Less distributions from net investment income | | | (0.14 | ) | | | (0.14 | ) | | | (0.08 | ) | | | (0.08 | ) | | | (0.05 | ) |
| | |
|
|
|
Redemption fees | | | —c | | | | — | | | | — | | | | — | | | | — | |
| | |
|
|
|
Net asset value, end of year | | $ | 10.99 | | | $ | 8.73 | | | $ | 7.14 | | | $ | 4.71 | | | $ | 4.78 | |
| | |
|
|
|
| | | | | |
Total returnb | | | 27.76% | | | | 24.83% | | | | 53.74% | | | | 0.04% | | | | (8.08)% | |
Ratios/supplemental data | | | | | | | | | | | | | | | | | | | | |
Net assets, end of year (000’s) | | $ | 651,826 | | | $ | 477,290 | | | $ | 359,299 | | | $ | 225,454 | | | $ | 240,289 | |
Ratios to average net assets: | | | | | | | | | | | | | | | | | | | | |
Expenses | | | 1.53% | | | | 1.54% | | | | 1.55% | | | | 1.58% | | | | 1.57% | |
Net investment income | | | 1.77% | | | | 1.52% | | | | 2.35% | | | | 1.45% | | | | 1.64% | |
Portfolio turnover rate | | | 31.24% | | | | 55.67% | | | | 46.20% | | | | 57.91% | | | | 78.29% | |
aBased on average daily shares outstanding.
bTotal return does not include any fees, charges or expenses imposed by the variable annuity and life insurance contracts for which the Franklin Templeton Variable Insurance Products Trust serves as an underlying investment vehicle.
cAmount is less than $0.01 per share.
See notes to financial statements.
TD-8
Franklin Templeton Variable Insurance Products Trust
Financial Highlights (continued)
Templeton Developing Markets Securities Fund (continued)
| | | | | | | | | | | | | | | | | | | | |
| | | Year Ended December 31,
| |
| Class 2 | | 2005 | | | 2004 | | | 2003 | | | 2002 | | | 2001 | |
| | |
| |
Per share operating performance | | | | | | | | | | | | | | | | | | | | |
(for a share outstanding throughout the year) | | | | | | | | | | | | | | | | | | | | |
Net asset value, beginning of year | | $ | 8.67 | | | $ | 7.09 | | | $ | 4.69 | | | $ | 4.76 | | | $ | 5.22 | |
| | |
|
|
|
Income from investment operations: | | | | | | | | | | | | | | | | | | | | |
Net investment incomea | | | 0.14 | | | | 0.09 | | | | 0.11 | | | | 0.06 | | | | 0.07 | |
Net realized and unrealized gains (losses) | | | 2.21 | | | | 1.63 | | | | 2.35 | | | | (0.06 | ) | | | (0.49 | ) |
| | |
|
|
|
Total from investment operations | | | 2.35 | | | | 1.72 | | | | 2.46 | | | | — | | | | (0.42 | ) |
| | |
|
|
|
Less distributions from net investment income | | | (0.12 | ) | | | (0.14 | ) | | | (0.06 | ) | | | (0.07 | ) | | | (0.04 | ) |
| | |
|
|
|
Redemption fees | | | —c | | | | — | | | | — | | | | — | | | | — | |
| | |
|
|
|
Net asset value, end of year | | $ | 10.90 | | | $ | 8.67 | | | $ | 7.09 | | | $ | 4.69 | | | $ | 4.76 | |
| | |
|
|
|
| | | | | |
Total returnb | | | 27.43% | | | | 24.71% | | | | 52.99% | | | | (0.15)% | | | | (8.08)% | |
Ratios/supplemental data | | | | | | | | | | | | | | | | | | | | |
Net assets, end of year (000’s) | | $ | 650,646 | | | $ | 327,569 | | | $ | 170,953 | | | $ | 80,952 | | | $ | 64,081 | |
Ratios to average net assets: | | | | | | | | | | | | | | | | | | | | |
Expenses | | | 1.78% | | | | 1.79% | | | | 1.80% | | | | 1.83% | | | | 1.82% | |
Net investment income | | | 1.52% | | | | 1.27% | | | | 2.10% | | | | 1.20% | | | | 1.37% | |
Portfolio turnover rate | | | 31.24% | | | | 55.67% | | | | 46.20% | | | | 57.91% | | | | 78.29% | |
aBased on average daily shares outstanding.
bTotal return does not include any fees, charges or expenses imposed by the variable annuity and life insurance contracts for which the Franklin Templeton Variable Insurance Products Trust serves as an underlying investment vehicle.
cAmount is less than $0.01 per share.
See notes to financial statements.
TD-9
Franklin Templeton Variable Insurance Products Trust
Financial Highlights (continued)
Templeton Developing Markets Securities Fund (continued)
| | | | | | | | |
| | | Year Ended December 31,
| |
| Class 3 | | 2005 | | | 2004d | |
| | |
| |
Per share operating performance | | | | | | | | |
(for a share outstanding throughout the year) | | | | | | | | |
Net asset value, beginning of year | | $ | 8.68 | | | $ | 7.13 | |
| | |
|
|
|
Income from investment operations: | | | | | | | | |
Net investment incomea | | | 0.04 | | | | 0.08 | |
Net realized and unrealized gains (losses) | | | 2.32 | | | | 1.61 | |
| | |
|
|
|
Total from investment operations | | | 2.36 | | | | 1.69 | |
| | |
|
|
|
Less distributions from net investment income | | | (0.14 | ) | | | (0.14 | ) |
| | |
|
|
|
Redemption fees | | | —c | | | | — | |
| | |
|
|
|
Net asset value, end of year | | $ | 10.90 | | | $ | 8.68 | |
| | |
|
|
|
| | |
Total returnb | | | 27.45% | | | | 24.15% | |
Ratios/supplemental data | | | | | | | | |
Net assets, end of year (000’s) | | $ | 11,521 | | | $ | 12 | |
Ratios to average net assets: | | | | | | | | |
Expenses | | | 1.78% | | | | 1.54%e | |
Net investment income | | | 1.52% | | | | 1.52%e | |
Portfolio turnover rate | | | 31.24% | | | | 55.67% | |
aBased on average daily shares outstanding.
bTotal return does not include any fees, charges or expenses imposed by the variable annuity and life insurance contracts for which the Franklin Templeton Variable Insurance Products Trust serves as an underlying investment vehicle. Total return is not annualized for periods less than one year.
cAmount is less than $0.01 per share.
dFor the period May 1, 2004 (effective date) to December 31, 2004.
eAnnualized.
See notes to financial statements.
TD-10
Franklin Templeton Variable Insurance Products Trust
Statement of Investments, December 31, 2005
| | | | | | | |
| Templeton Developing Markets Securities Fund | | Industry | | Shares/ Rights | | Value |
Long Term Investments 96.9% | | | | | | | |
Austria 0.5% | | | | | | | |
Wienerberger AG | | Building Products | | 154,600 | | $ | 6,186,185 |
| | | | | | |
|
|
Brazil 8.4% | | | | | | | |
Banco Bradesco SA, ADR, pfd. | | Commercial Banks | | 818,772 | | | 23,867,204 |
Centrais Eletricas Brasileiras SA | | Electric Utilities | | 579,624,764 | | | 9,419,552 |
Companhia de Bebidas das Americas (AmBev) | | Beverages | | 12,916,000 | | | 4,153,801 |
Companhia Vale do Rio Doce, ADR, pfd., A | | Metals & Mining | | 473,550 | | | 17,166,187 |
Klabin SA, pfd. | | Containers & Packaging | | 25,082 | | | 44,515 |
Petroleo Brasileiro SA, ADR, pfd. | | Oil, Gas & Consumable Fuels | | 446,822 | | | 28,761,932 |
Souza Cruz SA | | Tobacco | | 848,825 | | | 10,527,274 |
Suzano Bahia Sul Papel e Celulose SA, pfd., A | | Paper & Forest Products | | 589,854 | | | 2,969,072 |
Unibanco Uniao de Bancos Brasileiros SA, GDR | | Commercial Banks | | 98,200 | | | 6,242,574 |
Usinas Siderurgicas de Minas Gerais SA, pfd., A | | Metals & Mining | | 274,500 | | | 6,527,050 |
Votorantim Celulose e Papel SA, ADR | | Paper & Forest Products | | 36,000 | | | 442,440 |
| | | | | | |
|
|
| | | | | | | | 110,121,601 |
| | | | | | |
|
|
China 10.9% | | | | | | | |
Aluminum Corp. of China Ltd., H | | Metals & Mining | | 17,636,000 | | | 13,419,796 |
Anhui Conch Cement Co. Ltd., H | | Construction Materials | | 4,080,000 | | | 5,025,246 |
aChina Construction Bank, H | | Commercial Banks | | 860,000 | | | 299,472 |
a,bChina Construction Bank, H, 144A | | Commercial Banks | | 25,663,000 | | | 8,936,449 |
China International Marine Containers Co. Ltd., B | | Machinery | | 1,860,700 | | | 1,499,858 |
China Mobile (Hong Kong) Ltd., fgn. | | Wireless Telecommunication Services | | 7,212,000 | | | 34,136,233 |
China Resources Enterprise Ltd. | | Distributors | | 4,422,000 | | | 7,898,822 |
China Travel International Investment Hong Kong Ltd. | | Hotels Restaurants & Leisure | | 11,784,000 | | | 2,826,829 |
Chongqing Changan Automobile Co. Ltd., B | | Automobiles | | 2,386,800 | | | 674,146 |
CITIC Pacific Ltd. | | Industrial Conglomerates | | 1,347,959 | | | 3,729,046 |
Denway Motors Ltd. | | Automobiles | | 22,758,234 | | | 7,558,047 |
GOME Electrical Appliances Holdings Ltd. | | Specialty Retail | | 3,940,000 | | | 2,667,776 |
Huadian Power International Corp. Ltd., H | | Independent Power Producers &
Energy Traders | | 10,606,000 | | | 2,708,386 |
Huaneng Power International Inc., H | | Independent Power Producers &
Energy Traders | | 4,188,000 | | | 2,754,677 |
PetroChina Co. Ltd., H | | Oil, Gas & Consumable Fuels | | 36,360,000 | | | 29,777,717 |
bPetroChina Co. Ltd., H, 144A | | Oil, Gas & Consumable Fuels | | 7,682,000 | | | 6,291,321 |
Shanghai Industrial Holdings Ltd. | | Industrial Conglomerates | | 3,982,000 | | | 8,294,068 |
TCL Multimedia Technology Holdings Ltd. | | Household Durables | | 4,951,689 | | | 715,262 |
Travelsky Technology Ltd., H | | IT Services | | 3,575,000 | | | 3,296,673 |
| | | | | | |
|
|
| | | | | | | | 142,509,824 |
| | | | | | |
|
|
Croatia 0.6% | | | | | | | |
Pliva d.d., GDR, Reg S | | Pharmaceuticals | | 601,600 | | | 7,838,848 |
| | | | | | |
|
|
Czech Republic 0.1% | | | | | | | |
Philip Morris CR AS | | Tobacco | | 1,875 | | | 1,392,648 |
| | | | | | |
|
|
Finland 0.5% | | | | | | | |
Nokian Renkaat OYJ | | Auto Components | | 468,420 | | | 5,905,841 |
| | | | | | |
|
|
Hong Kong 1.6% | | | | | | | |
Cheung Kong Holdings Ltd. | | Real Estate | | 1,184,000 | | | 12,147,466 |
Cheung Kong Infrastructure Holdings Ltd. | | Electric Utilities | | 572,000 | | | 1,800,030 |
Dairy Farm International Holdings Ltd. | | Food & Staples Retailing | | 1,146,433 | | | 4,150,087 |
MTR Corp. Ltd. | | Road & Rail | | 1,665,885 | | | 3,276,489 |
| | | | | | |
|
|
| | | | | | | | 21,374,072 |
| | | | | | |
|
|
TD-11
Franklin Templeton Variable Insurance Products Trust
Statement of Investments, December 31, 2005 (continued)
| | | | | | | |
| Templeton Developing Markets Securities Fund | | Industry | | Shares/ Rights | | Value |
Long Term Investments (cont.) | | | | | | | |
Hungary 2.5% | | | | | | | |
BorsodChem Rt. | | Chemicals | | 271,447 | | $ | 2,926,035 |
Gedeon Richter Ltd. | | Pharmaceuticals | | 50,356 | | | 9,042,462 |
Magyar Telekom Ltd. | | Diversified Telecommunication Services | | 2,083,800 | | | 9,326,658 |
MOL Magyar Olaj-es Gazipari Rt. | | Oil, Gas & Consumable Fuels | | 58,090 | | | 5,431,389 |
OTP Bank | | Commercial Banks | | 188,171 | | | 6,144,197 |
| | | | | | |
|
|
| | | | | | | | 32,870,741 |
| | | | | | |
|
|
India 3.6% | | | | | | | |
Bharat Petroleum Corp. Ltd. | | Oil, Gas & Consumable Fuels | | 114,458 | | | 1,104,515 |
Gail India Ltd. | | Gas Utilities | | 855,630 | | | 5,054,483 |
a,bHimatsingka Seide Ltd., GDR, 144A | | Textiles, Apparel & Luxury Goods | | 753,000 | | | 2,155,086 |
Hindalco Industries Inc. | | Metals & Mining | | 1,419,500 | | | 4,523,976 |
Hindustan Lever Ltd. | | Household Products | | 2,268,100 | | | 9,942,943 |
Hindustan Petroleum Corp. Ltd. | | Oil, Gas & Consumable Fuels | | 1,387,169 | | | 10,135,166 |
Indian Oil Corp. Ltd. | | Oil, Gas & Consumable Fuels | | 245,296 | | | 3,035,739 |
National Aluminum Co. Ltd. | | Metals & Mining | | 85,900 | | | 419,621 |
Oil & Natural Gas Corp. Ltd. | | Oil, Gas & Consumable Fuels | | 175,332 | | | 4,578,427 |
Ranbaxy Laboratories Ltd. | | Pharmaceuticals | | 151,000 | | | 1,216,021 |
Tata Tea Ltd. | | Food Products | | 230,678 | | | 4,861,951 |
| | | | | | |
|
|
| | | | | | | | 47,027,928 |
| | | | | | |
|
|
Indonesia 0.8% | | | | | | | |
PT Astra International Tbk | | Automobiles | | 6,439,000 | | | 6,681,363 |
PT Bank Danamon Indonesia Tbk | | Commercial Banks | | 8,486,000 | | | 4,100,560 |
| | | | | | |
|
|
| | | | | | | | 10,781,923 |
| | | | | | |
|
|
Malaysia 2.1% | | | | | | | |
Kuala Lumpur Kepong Bhd. | | Food Products | | 696,600 | | | 1,548,205 |
Maxis Communications Bhd. | | Wireless Telecommunication Services | | 4,584,000 | | | 10,188,014 |
Resorts World Bhd. | | Hotels Restaurants & Leisure | | 2,046,000 | | | 6,063,024 |
Sime Darby Bhd. | | Industrial Conglomerates | | 3,574,700 | | | 5,816,750 |
Tanjong PLC | | Hotels Restaurants & Leisure | | 513,000 | | | 1,968,117 |
YTL Corp. Bhd. | | Multi-Utilities | | 88,866 | | | 125,793 |
YTL Power International Bhd. | | Water Utilities | | 2,582,736 | | | 1,530,713 |
| | | | | | |
|
|
| | | | | | | | 27,240,616 |
| | | | | | |
|
|
Mexico 3.3% | | | | | | | |
Fomento Economico Mexicano SA de CV (Femsa), ADR | | Beverages | | 144,792 | | | 10,498,868 |
Grupo Bimbo SA de CV, A | | Food Products | | 668,764 | | | 2,328,324 |
aGrupo Televisa SA | | Media | | 703,034 | | | 2,811,474 |
Kimberly Clark de Mexico SA de CV, A | | Household Products | | 4,538,033 | | | 16,226,324 |
Telefonos de Mexico SA de CV (Telmex), L, ADR | | Diversified Telecommunication Services | | 467,364 | | | 11,534,544 |
| | | | | | |
|
|
| | | | | | | | 43,399,534 |
| | | | | | |
|
|
Panama 0.3% | | | | | | | |
Banco Latinoamericano de Exportaciones SA, E | | Commercial Banks | | 224,400 | | | 4,106,520 |
| | | | | | |
|
|
Philippines 0.5% | | | | | | | |
San Miguel Corp., B | | Beverages | | 4,263,893 | | | 7,115,869 |
| | | | | | |
|
|
Poland 1.6% | | | | | | | |
Polski Koncern Naftowy Orlen SA | | Oil, Gas & Consumable Fuels | | 472,229 | | | 9,114,594 |
Telekomunikacja Polska SA | | Diversified Telecommunication Services | | 1,623,100 | | | 11,691,716 |
| | | | | | |
|
|
| | | | | | | | 20,806,310 |
| | | | | | |
|
|
TD-12
Franklin Templeton Variable Insurance Products Trust
Statement of Investments, December 31, 2005 (continued)
| | | | | | | |
| Templeton Developing Markets Securities Fund | | Industry | | Shares/ Rights | | Value |
Long Term Investments (cont.) | | | | | | | |
Portugal 0.2% | | | | | | | |
aJeronimo Martins SGPS SA | | Food & Staples Retailing | | 158,244 | | $ | 2,379,182 |
| | | | | | |
|
|
Russia 3.9% | | | | | | | |
Lukoil Holdings, ADR | | Oil, Gas & Consumable Fuels | | 278,508 | | | 16,543,375 |
Mining and Metallurgical Co. Norilsk Nickel | | Metals & Mining | | 156,800 | | | 13,892,480 |
Mobile Telesystems, ADR | | Wireless Telecommunication Services | | 274,500 | | | 9,607,500 |
bNovolipetsk Steel, 144A | | Metals & Mining | | 2,331,000 | | | 3,333,330 |
Unified Energy Systems | | Electric Utilities | | 16,795,200 | | | 7,121,165 |
| | | | | | |
|
|
| | | | | | | | 50,497,850 |
| | | | | | |
|
|
Singapore 3.2% | | | | | | | |
ComfortDelGro Corp. Ltd. | | Road & Rail | | 6,447,000 | | | 6,202,953 |
DBS Group Holdings Ltd. | | Commercial Banks | | 445,000 | | | 4,415,346 |
Fraser and Neave Ltd. | | Industrial Conglomerates | | 1,183,681 | | | 13,168,224 |
Keppel Corp. Ltd. | | Industrial Conglomerates | | 737,600 | | | 4,879,040 |
Singapore Press Holdings Ltd. | | Media | | 867,000 | | | 2,241,859 |
Singapore Technologies Engineering Ltd. | | Aerospace & Defense | | 1,640,000 | | | 2,820,530 |
Singapore Telecommunications Ltd. | | Diversified Telecommunication Services | | 5,376,428 | | | 8,438,304 |
| | | | | | |
|
|
| | | | | | | | 42,166,256 |
| | | | | | |
|
|
South Africa 9.6% | | | | | | | |
Anglo American PLC | | Metals & Mining | | 754,679 | | | 25,487,934 |
Edgars Consolidated Stores Ltd. | | Specialty Retail | | 1,035,206 | | | 5,752,326 |
aImperial Holdings Ltd. | | Air Freight & Logistics | | 336,634 | | | 7,480,164 |
JD Group Ltd. | | Specialty Retail | | 100,000 | | | 1,211,379 |
Nampak Ltd. | | Containers & Packaging | | 842,940 | | | 2,243,399 |
Nedbank Group Ltd. | | Commercial Banks | | 1,123,141 | | | 17,750,154 |
bNedbank Group Ltd., 144A | | Commercial Banks | | 64,737 | | | 1,023,106 |
Old Mutual PLC | | Insurance | | 7,094,498 | | | 20,108,938 |
Remgro Ltd. | | Diversified Financial Services | | 1,462,610 | | | 28,200,462 |
SABMiller PLC | | Beverages | | 224,734 | | | 4,182,130 |
Sappi Ltd. | | Paper & Forest Products | | 1,024,880 | | | 11,744,615 |
aSteinhoff International Holdings Ltd. | | Household Durables | | 510,000 | | | 1,511,260 |
| | | | | | |
|
|
| | | | | | | | 126,695,867 |
| | | | | | |
|
|
South Korea 19.0% | | | | | | | |
aCJ Corp. | | Food Products | | 105,870 | | | 10,981,057 |
aDaewoo Shipbuilding & Marine Engineering Co. Ltd. | | Machinery | | 680,700 | | | 18,613,682 |
Hana Financial Group Inc. | | Commercial Banks | | 389,749 | | | 17,872,357 |
aHite Brewery Co. Ltd. | | Beverages | | 44,300 | | | 6,331,712 |
aHyundai Development Co. | | Construction & Engineering | | 363,070 | | | 16,504,820 |
aKangwon Land Inc. | | Hotels Restaurants & Leisure | | 665,665 | | | 13,577,584 |
Korea Gas Corp. | | Gas Utilities | | 85,200 | | | 2,803,355 |
aLG Card Co. Ltd. | | Consumer Finance | | 246,150 | | | 12,338,040 |
aLG Chem Ltd. | | Chemicals | | 195,940 | | | 11,085,439 |
aLG Corp. | | Industrial Conglomerates | | 425,000 | | | 13,330,025 |
aLG Electronics Inc. | | Household Durables | | 129,820 | | | 11,506,626 |
aLG Household & Health Care Ltd. | | Household Products | | 26,670 | | | 1,455,931 |
aLG Petrochemical Co. Ltd. | | Chemicals | | 157,710 | | | 3,944,707 |
aLG.Philips LCD Co. Ltd. | | Electronic Equipment & Instruments | | 90,440 | | | 3,855,482 |
POSCO | | Metals & Mining | | 43,200 | | | 8,661,439 |
Samsung Electronics Co. Ltd. | | Semiconductors & Semiconductor Equipment | | 82,988 | | | 54,281,977 |
aSamsung Fine Chemicals Co. Ltd. | | Chemicals | | 205,260 | | | 6,774,089 |
aSamsung Heavy Industries Co. Ltd. | | Machinery | | 312,070 | | | 5,498,007 |
Shinhan Financial Group Co. Ltd. | | Commercial Banks | | 169,000 | | | 6,885,806 |
TD-13
Franklin Templeton Variable Insurance Products Trust
Statement of Investments, December 31, 2005 (continued)
| | | | | | | |
| Templeton Developing Markets Securities Fund | | Industry | | Shares/ Rights | | Value |
Long Term Investments (cont.) | | | | | | | |
South Korea (cont.) | | | | | | | |
aSK Corp. | | Oil, Gas & Consumable Fuels | | 247,940 | | $ | 12,821,513 |
SK Telecom Co. Ltd. | | Wireless Telecommunication Services | | 58,590 | | | 10,525,846 |
| | | | | | |
|
|
| | | | | | | | 249,649,494 |
| | | | | | |
|
|
Sweden 0.7% | | | | | | | |
Oriflame Cosmetics SA, SDR | | Personal Products | | 334,650 | | | 9,645,063 |
| | | | | | |
|
|
Taiwan 13.6% | | | | | | | |
Acer Inc. | | Computers & Peripherals | | 1,739,629 | | | 4,372,059 |
aAu Optronics Corp. | | Electronic Equipment & Instruments | | 1,136,000 | | | 1,695,703 |
BenQ Corp. | | Computers & Peripherals | | 3,488,000 | | | 3,373,616 |
Chinatrust Financial Holding Co. Ltd. | | Commercial Banks | | 7,656,184 | | | 6,064,027 |
Chunghwa Telecom Co. Ltd. | | Diversified Telecommunication Services | | 6,094,000 | | | 10,544,505 |
D-Link Corp. | | Communications Equipment | | 6,629,465 | | | 7,593,496 |
Delta Electronics Inc. | | Electronic Equipment & Instruments | | 1,964,290 | | | 4,027,134 |
Lite-On Technology Corp. | | Computers & Peripherals | | 8,395,314 | | | 11,444,726 |
MediaTek Inc. | | Semiconductors & Semiconductor
Equipment | | 1,349,700 | | | 15,911,958 |
Mega Financial Holding Co. Ltd. | | Commercial Banks | | 23,281,503 | | | 15,142,037 |
Premier Image Technology Corp. | | Leisure Equipment & Products | | 5,645,430 | | | 7,575,623 |
President Chain Store Corp. | | Food & Staples Retailing | | 5,413,144 | | | 11,345,234 |
Realtek Semiconductor Corp. | | Semiconductors & Semiconductor
Equipment | | 8,076,450 | | | 9,447,723 |
Siliconware Precision Industries Co. | | Semiconductors & Semiconductor
Equipment | | 3,701,901 | | | 5,193,138 |
Sunplus Technology Co. Ltd. | | Semiconductors & Semiconductor
Equipment | | 6,642,040 | | | 8,417,250 |
Synnex Technology International Corp. | | Electronic Equipment & Instruments | | 4,256,760 | | | 5,245,334 |
Taiwan Mobile Co. Ltd. | | Wireless Telecommunication Services | | 17,871,302 | | | 15,624,766 |
Taiwan Semiconductor Manufacturing Co. Ltd. | | Semiconductors & Semiconductor
Equipment | | 9,012,428 | | | 17,159,208 |
UNI-President Enterprises Corp. | | Food Products | | 24,314,600 | | | 11,554,925 |
Yang Ming Marine Transport Corp. | | Marine | | 2,281,000 | | | 1,483,538 |
Yuanta Core Pacific Securities Co. | | Capital Markets | | 8,353,329 | | | 5,814,618 |
| | | | | | |
|
|
| | | | | | | | 179,030,618 |
| | | | | | |
|
|
Thailand 4.1% | | | | | | | |
The Aromatics (Thailand) Public Co. Ltd., fgn. | | Chemicals | | 496,700 | | | 365,639 |
Bangkok Bank Public Co. Ltd., fgn. | | Commercial Banks | | 2,108,500 | | | 5,910,482 |
BEC World Public Co. Ltd., fgn. | | Media | | 7,576,700 | | | 2,530,184 |
Kasikornbank Public Co. Ltd., fgn. | | Commercial Banks | | 5,798,600 | | | 10,600,731 |
Land and House Public Co. Ltd., fgn. | | Household Durables | | 10,761,075 | | | 2,334,517 |
Shin Corp. Public Co. Ltd., fgn. | | Wireless Telecommunication Services | | 5,478,300 | | | 5,641,881 |
Siam Cement Public Co. Ltd., fgn. | | Construction Materials | | 1,668,514 | | | 10,737,055 |
Siam Commercial Bank Public Co. Ltd., fgn. | | Commercial Banks | | 4,042,000 | | | 5,123,315 |
Siam Makro Public Co. Ltd., fgn. | | Food & Staples Retailing | | 400,000 | | | 720,536 |
aThai Airways International Public Co. Ltd., fgn. | | Airlines | | 2,750,400 | | | 2,949,850 |
aTMB Bank Public Co. Ltd., fgn. | | Commercial Banks | | 65,667,100 | | | 6,882,841 |
aTrue Corp. Public Co. Ltd., rts., 3/28/08 | | Diversified Telecommunication Services | | 344,616 | | | — |
| | | | | | |
|
|
| | | | | | | | 53,797,031 |
| | | | | | |
|
|
Turkey 2.6% | | | | | | | |
Arcelik AS, Br. | | Household Durables | | 1,117,826 | | | 7,780,499 |
KOC Holding AS | | Industrial Conglomerates | | 1,422,950 | | | 6,690,657 |
TD-14
Franklin Templeton Variable Insurance Products Trust
Statement of Investments, December 31, 2005 (continued)
| | | | | | | | |
| Templeton Developing Markets Securities Fund | | Industry | | Shares/ Rights | | Value |
Long Term Investments (cont.) | | | | | | | | |
Turkey (cont.) | | | | | | | | |
Migros Turk TAS | | Food & Staples
Retailing | | | 656,397 | | $ | 6,367,124 |
aPetkim Petrokimya Holding AS | | Chemicals | | | 296,000 | | | 1,720,548 |
Tupras-Turkiye Petrol Rafineleri AS | | Oil, Gas &
Consumable Fuels | | | 638,260 | | | 11,720,732 |
| | | | | | | |
|
|
| | | | | | | | | 34,279,560 |
| | | | | | | |
|
|
United Kingdom 2.2% | | | | | | | | |
HSBC Holdings PLC | | Commercial Banks | | | 1,273,161 | | | 20,443,087 |
Provident Financial PLC | | Consumer Finance | | | 946,032 | | | 8,911,113 |
| | | | | | | |
|
|
| | | | | | | | | 29,354,200 |
| | | | | | | |
|
|
United States 0.5% | | | | | | | | |
Avon Products Inc. | | Personal Products | | | 231,000 | | | 6,595,050 |
| | | | | | | |
|
|
Total Long Term Investments (Cost $916,371,173) | | | | | | | | 1,272,768,631 |
| | | | | | | |
|
|
| | | |
| | | | | Principal
Amount
| | |
Short Term Investments (Cost $39,458,742) 3.0% | | | | | | | | |
U.S. Government and Agency Securities 3.0% | | | | | | | | |
cU.S. Treasury Bills, 1/05/06 - 3/23/06 | | | | $ | 39,664,000 | | | 39,469,381 |
| | | | | | | |
|
|
Total Investments (Cost $955,829,915) 99.9% | | | | | | | | 1,312,238,012 |
Other Assets, less Liabilities 0.1% | | | | | | | | 1,754,388 |
| | | | | | | |
|
|
Net Assets 100.0% | | | | | | | $ | 1,313,992,400 |
| | | | | | | |
|
|
Selected Portfolio Abbreviations
ADR - American Depository Receipt
GDR - Global Depository Receipt
SDR - Swedish Depository Receipt
| b | Security was purchased pursuant to Rule 144A under the Securities Act of 1933 and may be sold in transactions exempt from registration only to qualified institutional buyers or in a public offering registered under the Securities Act of 1933. These securities have been deemed liquid under guidelines approved by the Trust’s Board of Trustees. At December 31, 2005, the value of these securities was $21,739,292, representing 1.65% of net assets. |
| c | The security is traded on a discount basis with no stated coupon rate. |
TD-15
See notes to financial statements.
Franklin Templeton Variable Insurance Products Trust
Financial Statements
Statement of Assets and Liabilities
December 31, 2005
| | | | |
| | | Templeton
Developing Markets
Securities Fund
| |
Assets: | | | | |
Investments in securities: | | | | |
Cost | | $ | 955,829,915 | |
| | |
|
|
|
Value | | $ | 1,312,238,012 | |
Cash | | | 960,992 | |
Foreign currency, at value (cost $1,652,632) | | | 1,656,241 | |
Receivables: | | | | |
Investment securities sold | | | 1,887,559 | |
Capital shares sold | | | 856,795 | |
Dividends | | | 1,891,648 | |
Foreign income tax | | | 159,393 | |
| | |
|
|
|
Total assets | | | 1,319,650,640 | |
| | |
|
|
|
Liabilities: | | | | |
Payables: | | | | |
Investment securities purchased | | | 2,453,997 | |
Capital shares redeemed | | | 866,825 | |
Affiliates | | | 1,730,625 | |
Deferred tax | | | 171,284 | |
Accrued expenses and other liabilities | | | 435,509 | |
| | |
|
|
|
Total liabilities | | | 5,658,240 | |
| | |
|
|
|
Net assets, at value | | $ | 1,313,992,400 | |
| | |
|
|
|
Net assets consist of: | | | | |
Paid-in capital | | $ | 1,000,736,172 | |
Undistributed net investment income | | | 4,018,236 | |
Net unrealized appreciation (depreciation) | | | 356,246,332 | |
Accumulated net realized gain (loss) | | | (47,008,340 | ) |
| | |
|
|
|
Net assets, at value | | $ | 1,313,992,400 | |
| | |
|
|
|
Class 1: | | | | |
Net assets, at value | | $ | 651,825,984 | |
| | |
|
|
|
Shares outstanding | | | 59,313,439 | |
| | |
|
|
|
Net asset value and offering price per share | | | $10.99 | |
| | |
|
|
|
Class 2: | | | | |
Net assets, at value | | $ | 650,645,754 | |
| | |
|
|
|
Shares outstanding | | | 59,700,646 | |
| | |
|
|
|
Net asset value and offering price per share | | | $10.90 | |
| | |
|
|
|
Class 3: | | | | |
Net assets, at value | | $ | 11,520,662 | |
| | |
|
|
|
Shares outstanding | | | 1,056,548 | |
| | |
|
|
|
Net asset value and offering price per sharea | | | $10.90 | |
| | |
|
|
|
aRedemption price is equal to net asset value less any redemption fees retained by the Fund.
See notes to financial statements.
TD-16
Franklin Templeton Variable Insurance Products Trust
Financial Statements (continued)
Statement of Operations
for the year ended December 31, 2005
| | | | |
| | | Templeton
Developing Markets
Securities Fund
| |
Investment income: | | | | |
Dividends (net of foreign taxes of $2,869,539) | | $ | 31,267,981 | |
Interest | | | 1,723,886 | |
Other income (Note 8) | | | 72,428 | |
| | |
|
|
|
Total investment income | | | 33,064,295 | |
| | |
|
|
|
Expenses: | | | | |
Management fees (Note 3a) | | | 12,479,133 | |
Administrative fees (Note 3b) | | | 1,274,031 | |
Distribution fees: (Note 3c) | | | | |
Class 2 | | | 1,145,151 | |
Class 3 | | | 7,524 | |
Unaffiliated transfer agent fees | | | 6,181 | |
Custodian fees (Note 4) | | | 972,368 | |
Reports to shareholders | | | 480,634 | |
Professional fees | | | 65,770 | |
Trustees’ fees and expenses | | | 4,971 | |
Other | | | 32,532 | |
| | |
|
|
|
Total expenses | | | 16,468,295 | |
Expense reductions (Note 4) | | | (5,225 | ) |
| | |
|
|
|
Net expenses | | | 16,463,070 | |
| | |
|
|
|
Net investment income | | | 16,601,225 | |
| | |
|
|
|
Realized and unrealized gains (losses): | | | | |
Net realized gain (loss) from: | | | | |
Investments (net of foreign taxes of $82,046) | | | 100,653,650 | |
Foreign currency transactions | | | (1,047,108 | ) |
| | |
|
|
|
Net realized gain (loss) | | | 99,606,542 | |
| | |
|
|
|
Net change in unrealized appreciation (depreciation) on: | | | | |
Investments | | | 142,537,322 | |
Translation of assets and liabilities denominated in foreign currencies | | | (5,500 | ) |
Change in deferred taxes on unrealized appreciation | | | 270,608 | |
| | |
|
|
|
Net change in unrealized appreciation (depreciation) | | | 142,802,430 | |
| | |
|
|
|
Net realized and unrealized gain (loss) | | | 242,408,972 | |
| | |
|
|
|
Net increase (decrease) in net assets resulting from operations | | $ | 259,010,197 | |
| | |
|
|
|
See notes to financial statements.
TD-17
Franklin Templeton Variable Insurance Products Trust
Financial Statements (continued)
Statements of Changes in Net Assets
| | | | | | | | |
| | | Templeton
Developing Markets
Securities Fund
| |
| | | Year Ended December 31,
| |
| | | 2005 | | | 2004 | |
| | |
| |
Increase (decrease) in net assets: | | | | | | | | |
Operations: | | | | | | | | |
Net investment income | | $ | 16,601,225 | | | $ | 8,948,602 | |
Net realized gain (loss) from investments and foreign currency transactions | | | 99,606,542 | | | | 50,460,755 | |
Net change in unrealized appreciation (depreciation) on investments and translation of assets and liabilities denominated in foreign currencies, and deferred taxes | | | 142,802,430 | | | | 90,694,728 | |
| | |
| |
Net increase (decrease) in net assets resulting from operations | | | 259,010,197 | | | | 150,104,085 | |
| | |
| |
Distributions to shareholders from: | | | | | | | | |
Net investment income: | | | | | | | | |
Class 1 | | | (7,605,217 | ) | | | (7,597,672 | ) |
Class 2 | | | (5,680,711 | ) | | | (4,066,275 | ) |
Class 3 | | | (9,713 | ) | | | (190 | ) |
| | |
| |
Total distributions to shareholders | | | (13,295,641 | ) | | | (11,664,137 | ) |
| | |
| |
Capital share transactions: (Note 2) | | | | | | | | |
Class 1 | | | 44,513,024 | | | | 32,499,304 | |
Class 2 | | | 208,495,324 | | | | 103,669,110 | |
Class 3 | | | 10,396,752 | | | | 10,000 | |
| | |
| |
Total capital share transactions | | | 263,405,100 | | | | 136,178,414 | |
| | |
| |
Redemption fees | | | 1,964 | | | | — | |
| | |
| |
Net increase (decrease) in net assets | | | 509,121,620 | | | | 274,618,362 | |
Net assets: | | | | | | | | |
Beginning of year | | | 804,870,780 | | | | 530,252,418 | |
| | |
| |
End of year | | $ | 1,313,992,400 | | | $ | 804,870,780 | |
| | |
| |
Undistributed net investment income included in net assets: | | | | | | | | |
End of year | | $ | 4,018,236 | | | $ | 1,637,611 | |
| | |
| |
See notes to financial statements.
TD-18
Franklin Templeton Variable Insurance Products Trust
Notes to Financial Statements
Templeton Developing Markets Securities Fund
1. ORGANIZATION AND SIGNIFICANT ACCOUNTING POLICIES
Franklin Templeton Variable Insurance Products Trust (the Trust) is registered under the Investment Company Act of 1940 as an open-end investment company, consisting of twenty-two separate series. The Templeton Developing Markets Securities Fund (the Fund) included in this report is diversified. The financial statements of the remaining funds in the series are presented separately. Shares of the Fund are sold only to insurance company separate accounts to fund the benefits of variable life insurance policies or variable annuity contracts.
The following summarizes the Fund’s significant accounting policies.
a. Security Valuation
Securities listed on a securities exchange or on the NASDAQ National Market System are valued at the last quoted sale price or the official closing price of the day, respectively. Over-the-counter securities and listed securities for which there is no reported sale are valued within the range of the most recent quoted bid and ask prices. Securities that trade in multiple markets or on multiple exchanges are valued according to the broadest and most representative market.
Government securities generally trade in the over-the-counter market rather than on a securities exchange. The Fund may utilize independent pricing services, quotations from bond dealers, and information with respect to bond and note transactions, to assist in determining a current market value for each security. The Fund’s pricing services may use valuation models or matrix pricing which considers information with respect to comparable bond and note transactions, quotations from bond dealers, or by reference to other securities that are considered comparable in such characteristics as rating, interest rate and maturity date, option adjusted spread models, prepayment projections, interest rate spreads and yield curves, to determine current value.
Foreign securities are valued as of the close of trading on the foreign stock exchange on which the security is primarily traded, or the NYSE, whichever is earlier. If no sale is reported at that time, the foreign security will be valued within the range of the most recent quoted bid and ask prices. The value is then converted into its U.S. dollar equivalent at the foreign exchange rate in effect at the close of the NYSE on the day that the value of the foreign security is determined.
The Trust has procedures to determine the fair value of individual securities and other assets for which market prices are not readily available or which may not be reliably priced. Methods for valuing these securities may include: fundamental analysis, matrix pricing, discounts from market prices of similar securities, or discounts applied due to the nature and duration of restrictions on the disposition of the securities. Due to the inherent uncertainty of valuations of such securities, the fair values may differ significantly from the values that would have been used had a ready market for such investments existed. Occasionally, events occur between the time at which trading in a security is completed and the close of the NYSE that might call into question the availability (including the reliability) of the value of a portfolio security held by the Fund. If such an event occurs, the securities may be valued using fair value procedures, which may include the use of independent pricing services. All security valuation procedures are approved by the Trust’s Board of Trustees.
b. Foreign Currency Translation
Portfolio securities and other assets and liabilities denominated in foreign currencies are translated into U.S. dollars based on the exchange rate of such currencies against U.S. dollars on the date of valuation. Purchases and sales of securities, income and expense items denominated in foreign currencies are translated into U.S. dollars at the exchange rate in effect on the transaction date. Occasionally, events may impact the availability or reliability of foreign exchange rates used to convert the U.S. dollar equivalent value. If such an event occurs, the foreign exchange rate will be valued at fair value using procedures established and approved by the Trust’s Board of Trustees.
The Fund does not separately report the effect of changes in foreign exchange rates from changes in market prices on securities held. Such changes are included in net realized and unrealized gain or loss from investments on the Statement of Operations.
TD-19
Franklin Templeton Variable Insurance Products Trust
Notes to Financial Statements (continued)
Templeton Developing Markets Securities Fund
1. ORGANIZATION AND SIGNIFICANT ACCOUNTING POLICIES (continued)
Realized foreign exchange gains or losses arise from sales of foreign currencies, currency gains or losses realized between the trade and settlement dates on securities transactions and the difference between the recorded amounts of dividends, interest, and foreign withholding taxes and the U.S. dollar equivalent of the amounts actually received or paid. Net unrealized foreign exchange gains and losses arise from changes in foreign exchange rates on foreign denominated assets and liabilities other than investments in securities held at the end of the reporting period.
c. Foreign Currency Contracts
When the Fund purchases or sells foreign securities it may enter into foreign exchange contracts to minimize foreign exchange risk from the trade date to the settlement date of the transactions. A foreign exchange contract is an agreement between two parties to exchange different currencies at an agreed upon exchange rate on a specified date. Realized and unrealized gains and losses on these contracts are included in the Statement of Operations.
The risks of these contracts include movement in the values of the foreign currencies relative to the U.S. dollar and the possible inability of the counterparties to fulfill their obligations under the contracts, which may be in excess of the amount reflected in the Statement of Assets and Liabilities.
d. Income Taxes and Deferred Taxes
No provision has been made for U.S. income taxes because the Fund’s policy is to continue to qualify as a regulated investment company under the Internal Revenue Code and to distribute to shareholders substantially all of its taxable income and net realized gains.
The Fund is subject to a tax imposed on net realized gains on securities of certain foreign countries. The Fund records an estimated deferred tax liability for net unrealized gains on these securities in an amount that would be payable if the securities were disposed of on the valuation date.
Foreign securities held by the Fund may be subject to foreign taxation. Foreign taxes, if any, are recorded based on the tax regulations and rates that exist in the foreign markets in which the Fund invests.
e. Security Transactions, Investment Income, Expenses and Distributions
Security transactions are accounted for on trade date. Realized gains and losses on security transactions are determined on a specific identification basis. Interest income and estimated expenses are accrued daily. Dividend income is recorded on the ex-dividend date except that certain dividends from foreign securities are recognized as soon as the Fund is notified of the ex-dividend date. Distributions to shareholders are recorded on the ex-dividend date and are determined according to income tax regulations (tax basis). Such distributions are reinvested in additional shares of the Fund. Distributable earnings determined on a tax basis may differ from earnings recorded in accordance with generally accepted accounting principles. These differences may be permanent or temporary. Permanent differences are reclassified among capital accounts to reflect their character. These reclassifications have no impact on net assets or the results of operations. Temporary differences are not reclassified, as they may reverse in subsequent periods.
Common expenses incurred by the Trust are allocated among the funds based on the ratio of net assets of each fund to the combined net assets of the Trust. Fund specific expenses are charged directly to the fund that incurred the expense.
Realized and unrealized gains and losses and net investment income, other than class specific expenses, are allocated daily to each class of shares based upon the relative proportion of net assets of each class.
TD-20
Franklin Templeton Variable Insurance Products Trust
Notes to Financial Statements (continued)
Templeton Developing Markets Securities Fund
1. ORGANIZATION AND SIGNIFICANT ACCOUNTING POLICIES (continued)
f. Accounting Estimates
The preparation of financial statements in accordance with accounting principles generally accepted in the United States of America requires management to make estimates and assumptions that affect the reported amounts of assets and liabilities at the date of the financial statements and the amounts of income and expenses during the reporting period. Actual results could differ from those estimates.
g. Redemption Fees
Redemptions and exchanges of Class 3 shares held 60 days or less may be subject to the Fund’s redemption fee, which is 1% of the amount redeemed. Such fees are retained by the Fund and accounted for as an addition to paid-in capital.
h. Guarantees and Indemnifications
Under the Trust’s organizational documents, its officers and trustees are indemnified by the Trust against certain liabilities arising out of the performance of their duties to the Trust. Additionally, in the normal course of business, the Trust enters into contracts with service providers that contain general indemnification clauses. The Trust’s maximum exposure under these arrangements is unknown as this would involve future claims that may be made against the Trust that have not yet occurred. However, based on experience, the Trust expects the risk of loss to be remote.
2. SHARES OF BENEFICIAL INTEREST
The Fund offers three classes of shares: Class 1, Class 2 , and Class 3. Effective May 1, 2004, the Fund began offering a new class of shares, Class 3. Each class of shares differs by its distribution fees, voting rights on matters affecting a single class and its exchange privilege.
At December 31, 2005, there were an unlimited number of shares authorized ($0.01 par value). Transactions in the Fund’s shares were as follows:
| | | | | | | | | | | | | | |
| | | Year Ended December 31,
| |
| | | 2005
| | | 2004
| |
| Class 1 Shares: | | Shares
| | | Amount
| | | Shares
| | | Amount
| |
Shares sold | | 10,118,344 | | | $ | 96,449,675 | | | 8,940,486 | | | $ | 67,520,469 | |
Shares issued in reinvestment of distributions | | 833,905 | | | | 7,605,217 | | | 1,105,920 | | | | 7,597,672 | |
Shares redeemed | | (6,292,757 | ) | | | (59,541,868 | ) | | (5,740,464 | ) | | | (42,618,837 | ) |
| | |
| |
Net increase (decrease) | | 4,659,492 | | | $ | 44,513,024 | | | 4,305,942 | | | $ | 32,499,304 | |
| | |
| |
| Class 2 Shares: | | | | | | | | | | | | |
Shares sold | | 27,948,311 | | | $ | 264,714,321 | | | 21,331,545 | | | $ | 159,905,301 | |
Shares issued in reinvestment of distributions | | 627,010 | | | | 5,680,711 | | | 595,355 | | | | 4,066,275 | |
Shares redeemed | | (6,666,146 | ) | | | (61,899,708 | ) | | (8,236,506 | ) | | | (60,302,466 | ) |
| | |
| |
Net increase (decrease) | | 21,909,175 | | | $ | 208,495,324 | | | 13,690,394 | | | $ | 103,669,110 | |
| | |
| |
| Class 3 Shares: | | | | | | | | | | | | |
Shares sold | | 1,108,615 | | | $ | 10,932,663 | | | 1,403 | | | $ | 10,000 | |
Shares issued in reinvestment of distributions | | 1,051 | | | | 9,523 | | | — | | | | — | |
Shares redeemed | | (54,521 | ) | | | (545,434 | ) | | — | | | | — | |
| | |
| |
Net increase (decrease) | | 1,055,145 | | | $ | 10,396,752 | | | 1,403 | | | $ | 10,000 | |
| | |
| |
TD-21
Franklin Templeton Variable Insurance Products Trust
Notes to Financial Statements (continued)
Templeton Developing Markets Securities Fund
3. TRANSACTIONS WITH AFFILIATES
Franklin Resources, Inc. is the holding company for various subsidiaries that together are referred to as Franklin Templeton Investments. Certain officers and trustees of the Trust are also officers and/or directors of the following subsidiaries:
| | |
| Subsidiary | | Affiliation |
Templeton Asset Management, Ltd. (TAML) | | Investment manager |
Franklin Templeton Services, LLC (FT Services) | | Administrative manager |
Franklin Templeton Distributors, Inc. (Distributors) | | Principal underwriter |
Franklin Templeton Investor Services, LLC (Investor Services) | | Transfer agent |
a. Management Fees
Effective May 1, 2005, the Fund pays an investment management fee to TAML based on the average daily net assets of the Fund as follows:
| | |
| Annualized Fee Rate | | Net Assets |
| 1.250% | | Up to and including $1 billion |
| 1.200% | | Over $1 billion, up to and including $5 billion |
| 1.150% | | Over $5 billion, up to and including $10 billion |
| 1.100% | | Over $10 billion, up to and including $15 billion |
| 1.050% | | Over $15 billion, up to and including $20 billion |
| 1.000% | | In excess of $20 billion |
Prior to May 1, 2005, the Fund paid fees to TAML of 1.25% per year of the average daily net assets of the Fund.
b. Administrative Fees
The Fund pays an administrative fee to FT Services based on the average daily net assets of the Fund as follows:
| | |
| Annualized Fee Rate | | Net Assets |
| 0.150% | | Up to and including $200 million |
| 0.135% | | Over $200 million, up to and including $700 million |
| 0.100% | | Over $700 million, up to and including $1.2 billion |
| 0.075% | | In excess of $1.2 billion |
c. Distribution Fees
The Fund’s Board of Trustees has adopted distribution plans for Class 2 and Class 3 shares pursuant to Rule 12b-1 under the 1940 Act. Under the Fund’s compensation distribution plans, the Fund pays Distributors for costs incurred in connection with the sale and distribution of the Fund’s shares up to 0.35% per year of its average daily net assets of each class. The Board of Trustees has set the current rate at 0.25% per year.
d. Transfer Agent Fees
Investor Services, under terms of an agreement, performs shareholder servicing for the Fund and is not paid by the Fund for the services.
4. EXPENSE OFFSET ARRANGEMENT
The Fund has entered into an arrangement with its custodian whereby credits realized as a result of uninvested cash balances are used to reduce a portion of the Fund’s custodian expenses. During the year ended December 31, 2005, the custodian fees were reduced as noted in the Statement of Operations.
TD-22
Franklin Templeton Variable Insurance Products Trust
Notes to Financial Statements (continued)
Templeton Developing Markets Securities Fund
5. INCOME TAXES
At December 31, 2005, the Fund had tax basis capital losses which may be carried over to offset future capital gains, if any. During the year ended December 31, 2005, the Fund utilized $100,122,208 of capital loss carryforwards. At December 31, 2005, the capital loss carryforwards were as follows:
| | | |
Capital loss carryforwards expiring in: | | | |
| |
2007 | | $ | 19,956,300 |
2009 | | | 983,337 |
2010 | | | 24,246,197 |
| | |
|
| | | $ | 45,185,834 |
| | |
|
For tax purposes, realized capital losses and realized currency losses, occurring subsequent to October 31, may be deferred and treated as occurring on the first day of the following fiscal year. At December 31, 2005, the Fund deferred realized currency losses of $346,577.
The tax character of distributions paid during the years ended December 31, 2005 and 2004, was as follows:
| | | | | | |
| | | 2005
| | 2004
|
Distributions paid from - ordinary income | | $ | 13,295,641 | | $ | 11,664,137 |
| | |
|
At December 31, 2005, the cost of investments, net unrealized appreciation (depreciation) and undistributed ordinary income for income tax purposes were as follows:
| | | | |
Cost of investments | | $ | 971,350,435 | |
| | |
|
|
|
| |
Unrealized appreciation | | $ | 367,045,306 | |
Unrealized depreciation | | | (26,157,729 | ) |
| | |
|
|
|
Net unrealized appreciation (depreciation) | | $ | 340,887,577 | |
| | |
|
|
|
Distributable earnings - undistributed ordinary income | | $ | 18,062,824 | |
| | |
|
|
|
Net investment income differs for financial statement and tax purposes primarily due to differing treatments of foreign currency transactions and passive foreign investment company shares.
Net realized gains (losses) differ for financial statement and tax purposes primarily due to differing treatments of wash sales and foreign currency transactions.
6. INVESTMENT TRANSACTIONS
Purchases and sales of investments (excluding short term securities) for the year ended December 31, 2005, aggregated $538,514,537 and $297,029,323, respectively.
7. CONCENTRATION OF RISK
Investing in foreign securities may include certain risks and considerations not typically associated with investing in U.S. securities, such as fluctuating currency values and changing local and regional economic, political and social conditions, which may result in greater market volatility. In addition, certain foreign securities may not be as liquid as U.S. securities.
TD-23
Franklin Templeton Variable Insurance Products Trust
Notes to Financial Statements (continued)
Templeton Developing Markets Securities Fund
8. REGULATORY MATTERS
As part of various investigations by a number of federal, state, and foreign regulators and governmental entities, relating to certain practices in the mutual fund industry, including late trading, market timing and marketing support payments to securities dealers who sell fund shares, Franklin Resources, Inc. and certain of its subsidiaries (collectively, the “Company”), entered into settlements with certain of those regulators.
Specifically, the Company entered into settlements with the Securities and Exchange Commission (“SEC”) concerning market timing (the “August 2, 2004 SEC Order”) and marketing support payments to securities dealers who sell fund shares (the “December 13, 2004 SEC Order”) and with the California Attorney General’s Office (“CAGO”) concerning marketing support payments to securities dealers who sell fund shares (the “CAGO Settlement”). Under the terms of the settlements with the SEC and the CAGO, the Company retained an Independent Distribution Consultant (“IDC”) to develop a plan for distribution of the respective settlement monies. The CAGO approved the distribution plan under the CAGO Settlement and, in accordance with the terms and conditions of that settlement, the monies were disbursed to the relevant funds and are recorded as other income in the current period. The SEC has not yet approved the distribution plan pertaining to the December 13, 2004 SEC Order. When approved, disbursements of settlement monies will be made promptly to the relevant funds, in accordance with the terms and conditions of that order. The IDC continues to develop the plan of distribution under the August 2, 2004 SEC Order that resolved the SEC’s market timing investigation.
In addition, the Company, as well as most of the mutual funds within Franklin Templeton Investments and certain current or former officers, directors, and/or employees, have been named in private lawsuits (styled as shareholder class actions, or as derivative actions on behalf of either the named funds or Franklin Resources, Inc.) relating to the industry practices referenced above, as well as to allegedly excessive advisory fees, commissions, and/or 12b-1 fees. The lawsuits were filed in different courts throughout the country. Many of those suits are now pending in a multi-district litigation in the United States District Court for the District of Maryland.
The Company and fund management strongly believe that the claims made in each of the private lawsuits referenced above are without merit and intend to defend against them vigorously. The Company cannot predict with certainty the eventual outcome of these lawsuits, nor whether they will have a material negative impact on the Company. If it is determined that the Company bears responsibility for any unlawful or inappropriate conduct that caused losses to the Trust, it is committed to making the Trust or their shareholders whole, as appropriate.
TD-24
Franklin Templeton Variable Insurance Products Trust
Templeton Developing Markets Securities Fund
Report of Independent Registered Public Accounting Firm
To the Board of Trustees and Shareholders of
Franklin Templeton Variable Insurance Products Trust:
In our opinion, the accompanying statement of assets and liabilities, including the statement of investments, and the related statements of operations and of changes in net assets and the financial highlights present fairly, in all material respects, the financial position of Templeton Developing Markets Securities Fund (one of the funds constituting Franklin Templeton Variable Insurance Products Trust, hereafter referred to as the “Fund”) at December 31, 2005, the results of its operations for the year then ended, the changes in its net assets for each of the two years in the period then ended and the financial highlights for each of the periods presented, in conformity with accounting principles generally accepted in the United States of America. These financial statements and financial highlights (hereafter referred to as “financial statements”) are the responsibility of the Fund’s management; our responsibility is to express an opinion on these financial statements based on our audits. We conducted our audits of these financial statements in accordance with the standards of the Public Company Accounting Oversight Board (United States). Those standards require that we plan and perform the audit to obtain reasonable assurance about whether the financial statements are free of material misstatement. An audit includes examining, on a test basis, evidence supporting the amounts and disclosures in the financial statements, assessing the accounting principles used and significant estimates made by management, and evaluating the overall financial statement presentation. We believe that our audits, which included confirmation of securities at December 31, 2005, by correspondence with the custodian and brokers, provide a reasonable basis for our opinion.
PricewaterhouseCoopers LLP
San Francisco, California
February 10, 2006
TD-25
Franklin Templeton Variable Insurance Products Trust
Tax Designation (unaudited)
Templeton Developing Markets Securities Fund
At December 31, 2005, more than 50% of the Fund’s total assets were invested in securities of foreign issuers. In most instances, foreign taxes were withheld from dividends paid to the Fund on these investments. The Fund elects to treat foreign taxes paid as allowed under Section 853 of the Internal Revenue Code. This election will allow shareholders of record in June 2006, to treat their proportionate share of foreign taxes paid by the Fund as having been paid directly by them. The shareholder shall consider these amounts as foreign taxes paid in the tax year in which they receive the Fund distribution.
The foreign tax information will be disclosed in the June 30, 2006, semi-annual report of the Fund.
TD-26
TEMPLETON FOREIGN SECURITIES FUND
This annual report for Templeton Foreign Securities Fund covers the fiscal year ended December 31, 2005.
Performance Summary as of 12/31/05
Average annual total return of Class 3 shares* represents the average annual change in value, assuming reinvestment of dividends and capital gains. Average returns smooth out variations in returns, which can be significant; they are not the same as year-by-year results.
Periods ended 12/31/05
| | | | | | |
| | | 1-Year | | 5-Year | | 10-Year |
Average Annual Total Return | | +10.13% | | +3.38% | | +8.13% |
*Performance prior to the 5/1/00 merger reflects historical performance of Templeton International Fund. Additionally, Class 3 and Class 2 shares were not offered until 5/1/04 and 5/1/97, respectively. As a result, Class 3 Fund performance for periods prior to 5/1/04 represents historical results of Class 2 shares which, for periods prior to 5/1/97, reflects historical results of Class 1 shares. For periods beginning on 5/1/97, Class 2’s results reflect an additional 12b-1 fee expense, which also affects future performance. The 12b-1 fee rate is currently the same for Classes 2 and 3. Since 5/1/04 (effective date), the average annual total return of Class 3 shares was +16.02%.
Total Return Index Comparison
for Hypothetical $10,000 Investment (1/1/96–12/31/05)
The graph below shows the change in value of a hypothetical $10,000 investment in the Fund over the indicated period and includes reinvestment of any income or distributions. The Fund’s performance* is compared to the performance of the Morgan Stanley Capital International (MSCI) Europe, Australasia, Far East (EAFE) Index. One cannot invest directly in an index, nor is an index representative of the Fund’s portfolio. Please see Important Notes to Performance Information preceding the Fund Summaries.
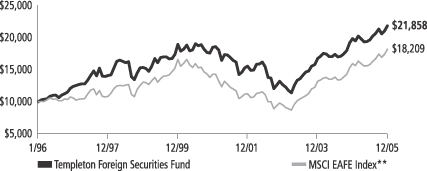
**Source: Standard & Poor’s Micropal. Please see Index Descriptions following the Fund Summaries.
Templeton Foreign Securities Fund – Class 3
Performance reflects the Fund’s Class 3 operating expenses, but does not include any contract fees, expenses or sales charges. If they had been included, performance would be lower. These charges and deductions, particularly for variable life policies, can have a significant effect on contract values and insurance benefits. See the contract prospectus for a complete description of these expenses, including sales charges.
Performance data represent past performance, which does not guarantee future results. Investment return and principal value will fluctuate, and you may have a gain or loss when you sell your shares. Current performance may differ from figures shown.
TF-1
Fund Goal and Main Investments: Templeton Foreign Securities Fund seeks long-term capital growth. The Fund normally invests at least 80% of its net assets in investments of issuers located outside the U.S., including those in emerging markets.
Performance Overview
You can find the Fund’s one-year total return in the Performance Summary. The Fund underperformed its benchmark, the MSCI EAFE Index, which had a +14.02% total return for the same period.1 Please note that index performance information is provided for reference and that we do not attempt to track the index, but rather undertake investments on the basis of fundamental research.
Economic and Market Overview
The global economy overcame fears of derailment generated by higher energy costs and advanced at a solid clip during 2005, with signs of firming recoveries in Europe and Japan. Excluding the volatile energy and food sectors, inflation remained relatively subdued worldwide, and monetary policy remained fairly accommodative. The U.S. Federal Reserve Board raised the short-term federal funds target rate with eight quarter-point increases, bringing it to 4.25%. The European Central Bank (ECB) made one quarter-point rise in short-term rates, its first increase after keeping rates at historically low levels for more than two and a half years. Even after the increases, both rates remained at levels considered accommodative for economic growth.
Strong demand for oil sustained high prices during most of the year, while prices for other commodities such as industrial metals were also high, led by copper, whose contract price rose 45.4% during 2005.2 This contributed to economic growth in countries such as Australia and Canada, and emerging markets in Asia and Latin America that are tied to mining and industrial commodities.
In this environment, global equity markets performed strongly, particularly outside the U.S. One-year total return for the MSCI All Country (AC) World ex US Index was +17.11% in U.S. dollar terms.3 By comparison the total return for the MSCI USA Index was +5.72%.3 In terms of
1. Source: Standard & Poor’s Micropal. One cannot invest directly in an index, nor is an index representative of the Fund’s portfolio. Please see Index Descriptions following the Fund Summaries.
2. Source: New York Mercantile Exchange.
3. Source: Standard & Poor’s Micropal. Please see Index Descriptions following the Fund Summaries.
Fund Risks: The Fund’s investments in stocks offer the potential for long-term gains but can be subject to short-term up-and-down price movements. Foreign investing, especially in emerging markets, involves additional risks including currency fluctuations, economic instability, and social and political developments. The Fund’s prospectus also includes a description of the main investment risks.
TF-2
sectors, energy and materials led equity market performance, and telecommunication services and consumer-related sectors lagged.
Among developed countries, the Japanese equity market performed well, returning +44.70% in local currency terms for the year under review.4 However, this market benefited primarily from investors outside Japan, and the return was significantly less (+25.62%) after conversion into U.S. dollars. 4 In contrast, the conversion into dollars enhanced equity market returns in Brazil (+57.04%), Mexico (+49.11%) and South Korea (+58.00%).4 At the beginning of the year, the consensus of many analysts appeared to be that the U.S. dollar would decline in value relative to major currencies. In fact, for the year the dollar appreciated versus the yen, the euro, the pound and most other currencies.
Investment Strategy
Our investment philosophy is bottom-up, value-oriented and long-term. In choosing investments, we generally focus on the market price of a company’s securities relative to our evaluation of the company’s potential long-term earnings, asset value and cash flow. Among factors we consider are a company’s historical value measures, including price/earnings ratio, profit margins and liquidation value. We do in-depth research to construct a bargain list from which we buy.
Manager’s Discussion
During the year under review, the Fund’s performance benefited from stock selection in the financials sector. Despite being underweighted in financials relative to the MSCI EAFE Index, the Fund’s sector holdings outperformed those of the index.5 Strong performing financials stocks were concentrated in Japan (Mitsubishi UFJ Financial, Nomura Holdings, Sompo Japan Insurance and Sumitomo Mitsui Financial) and South Korea (Kookmin Bank, Hana Bank and Shinhan Financial Group). Our industrials holdings helped the Fund’s absolute performance, as the sector outperformed the overall index.6 Strong performers included Denmark’s Vestas Wind Systems and the U.K.’s Rolls-Royce Group and BAE Systems. The Fund’s energy sector holdings also helped absolute performance because the sector outperformed the overall index, and the
4. Source: Standard & Poor’s Micropal. Individual country market returns are measured by MSCI country-specific indexes.
5. The financials sector comprises capital markets, commercial banks, insurance and real estate in the Statement of Investments (SOI).
6. The industrials sector comprises aerospace and defense, air freight and logistics, airlines, commercial services and supplies, electrical equipment, industrial conglomerates, and road and rail in the SOI.
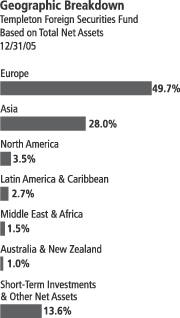
TF-3
Fund had strong returns from France’s Total, the Netherlands’ SBM Offshore and Italy’s Eni.7
Despite the Fund’s positive return, there were several detractors from relative performance. The Fund’s overweighted exposure to the telecommunication services sector, the worst performing MSCI EAFE Index sector, hindered results.8 The Fund’s overall telecommunication services sector position underperformed the overall index; however, it outperformed the index’s telecommunication services sector. Poor performing telecommunication services stocks in the Fund’s portfolio included Spain’s Telefonica, the U.K.’s Vodafone Group and South Korea’s SK Telecom. The Fund’s overweighted position and stock selection in the consumer discretionary sector also hurt relative performance.9 Compass Group and British Sky Broadcasting Group, both in the U.K., performed poorly during the period. The Fund’s underweighted Japanese exposure, as well as stock selection within the country, hurt the Fund’s performance relative to the index.
It is important to recognize the effect of currency movements on the Fund’s performance. In general, if the value of the U.S. dollar increases compared with a foreign currency, an investment traded in that foreign currency will decrease in value because it will be worth fewer U.S. dollars. This can have a negative effect on Fund performance. Conversely, when the U.S. dollar weakens in relation to a foreign currency, an investment traded in that foreign currency will increase in value, which can contribute to Fund performance. For the 12 months ended December 31, 2005, the U.S. dollar rose in value relative to most non-U.S. currencies. As a result, the Fund’s performance was negatively affected by the portfolio’s investment primarily in securities with non-U.S. currency exposure.
Thank you for your participation in Templeton Foreign Securities Fund. We look forward to serving your future investment needs.
7. The energy sector comprises energy equipment and services; and oil, gas and consumable fuels in the SOI.
8. The telecommunication services sector comprises diversified telecommunication services and wireless telecommunication services in the SOI.
9. The consumer discretionary sector comprises automobiles; auto components; hotels, restaurants and leisure; household durables; leisure equipment and products; and media in the SOI.
The foregoing information reflects our analysis, opinions and portfolio holdings as of December 31, 2005, the end of the reporting period. The way we implement our main investment strategies and the resulting portfolio holdings may change depending on factors such as market and economic conditions. These opinions may not be relied upon as investment advice or an offer for a particular security. The information is not a complete analysis of every aspect of any market, country, industry, security or the Fund. Statements of fact are from sources considered reliable, but the adviser makes no representation or warranty as to their completeness or accuracy. Although historical performance is no guarantee of future results, these insights may help you understand our investment management philosophy.
Top 10 Holdings
Templeton Foreign Securities Fund
12/31/05
| | |
Company
Sector/Industry,
Country | | % of Total
Net Assets |
| Cheung Kong Holdings Ltd. | | 2.0% |
| Real Estate, Hong Kong | | |
| GlaxoSmithKline PLC | | 1.7% |
| Pharmaceuticals, U.K. | | |
| Samsung Electronics Co. Ltd. | | 1.6% |
| Semiconductors & Semiconductor Equipment, South Korea | | |
| ING Groep NV | | 1.6% |
| Capital Markets, Netherlands | | |
| Sanofi-Aventis | | 1.6% |
| Pharmaceuticals, France | | |
| British Sky Broadcasting Group PLC | | 1.5% |
| Media, U.K. | | |
| Royal Dutch Shell PLC, B | | 1.5% |
| Oil, Gas & Consumable Fuels, U.K. | | |
| Vodafone Group PLC, ADR | | 1.5% |
| Wireless Telecommunication Services, U.K. | | |
| Electrolux AB, B | | 1.4% |
| Household Durables, Sweden | | |
| Sony Corp. | | 1.4% |
| Household Durables, Japan | | |
The dollar value, number of shares or principal amount, and names of all portfolio holdings are listed in the Fund’s Statement of Investments.
TF-4
Fund Expenses
As an investor in a variable insurance contract (“Contract”) that indirectly provides for investment in an underlying mutual fund, you can incur transaction and/or ongoing expenses at both the Fund level and the Contract level.
| • | | Transaction expenses can include sales charges (loads) on purchases, redemption fees, surrender fees, transfer fees and premium taxes. |
| • | | Ongoing expenses can include management fees, distribution and service (12b-1) fees, contract fees, annual maintenance fees, mortality and expense risk fees and other fees and expenses. All mutual funds and Contracts have some types of ongoing expenses. |
The expenses shown in the table below are meant to highlight ongoing expenses at the Fund level only and do not include ongoing expenses at the Contract level, or transaction expenses at either the Fund or Contract level. While the Fund does not have transaction expenses, if the transaction and ongoing expenses at the Contract level were included, the expenses shown below would be higher. You should consult your Contract prospectus or disclosure document for more information.
The table shows Fund-level ongoing expenses and can help you understand these expenses and compare them with — the six months indicated. Please refer to the Fund prospectus for additional information on operating expenses.
Actual Fund Expenses
The first line (Actual) of the table below provides actual account values and expenses. The “Ending Account Value” is derived from the Fund’s actual return, which includes the effect of ongoing Fund expenses, but does not include the effect of ongoing Contract expenses.
You can estimate the Fund-level expenses you incurred during the period by following these steps. Of course, your account value and expenses will differ from those in this illustration:
| 1. | Divide your account value by $1,000. |
If an account had an $8,600 value, then $8,600 ÷ $1,000 = 8.6.
| 2. | Multiply the result by the number under the heading “Fund-Level Expenses Incurred During Period.” |
If Fund-Level Expenses Incurred During Period were $7.50, then 8.6 x $7.50 = $64.50.
Templeton Foreign Securities Fund – Class 3
TF-5
In this illustration, the estimated expenses incurred this period at the Fund level are $64.50.
Hypothetical Example for Comparison with Other Mutual Funds
Information in the second line (Hypothetical) of the table can help you compare ongoing expenses of the Fund with those of other mutual funds offered through the Contract. This information may not be used to estimate the actual ending account balance or expenses you incurred during the period. The hypothetical “Ending Account Value” is based on the Fund’s actual expense ratio and an assumed 5% annual rate of return before expenses, which does not represent the Fund’s actual return. The figure under the heading “Fund-Level Expenses Incurred During Period” shows the hypothetical expenses your account would have incurred under this scenario. You can compare this figure with the 5% hypothetical examples that appear in shareholder reports of other funds offered through a Contract.
| | | | | | | | | |
| Class 3 | | Beginning Account Value 7/1/05 | | Ending Account Value 12/31/05 | | Fund-Level Expenses Incurred During Period* 7/1/05-12/31/05 |
Actual | | $ | 1,000 | | $ | 1,111.90 | | $ | 5.43 |
Hypothetical (5% return before expenses) | | $ | 1,000 | | $ | 1,020.06 | | $ | 5.19 |
*Expenses are equal to the annualized expense ratio for the Fund’s Class 3 shares (1.02%), which does not include any ongoing expenses of the Contract for which the Fund is an investment option, multiplied by the average account value over the period, multiplied by 184/365 to reflect the one-half year period.
TF-6
Franklin Templeton Variable Insurance Products Trust
Financial Highlights
Templeton Foreign Securities Fund
| | | | | | | | | | | | | | | | | | | | |
| | | Year Ended December 31,
| |
| Class 1 | | 2005 | | | 2004 | | | 2003 | | | 2002 | | | 2001 | |
| | |
|
|
|
Per share operating performance | | | | | | | | | | | | | | | | | | | | |
(for a share outstanding throughout the year) | | | | | | | | | | | | | | | | | | | | |
Net asset value, beginning of year | | $ | 14.53 | | | $ | 12.37 | | | $ | 9.51 | | | $ | 11.85 | | | $ | 18.78 | |
| | |
|
|
|
Income from investment operations: | | | | | | | | | | | | | | | | | | | | |
Net investment incomea | | | 0.30 | | | | 0.26 | | | | 0.19 | | | | 0.22 | | | | 0.23 | |
Net realized and unrealized gains (losses) | | | 1.20 | | | | 2.05 | | | | 2.87 | | | | (2.37 | ) | | | (5.23 | ) |
| | |
|
|
|
Total from investment operations | | | 1.50 | | | | 2.31 | | | | 3.06 | | | | (2.15 | ) | | | (5.00 | ) |
| | |
|
|
|
Less distributions from: | | | | | | | | | | | | | | | | | | | | |
Net investment income | | | (0.19 | ) | | | (0.15 | ) | | | (0.20 | ) | | | (0.19 | ) | | | (0.26 | ) |
Net realized gains | | | — | | | | — | | | | — | | | | — | | | | (1.67 | ) |
| | |
|
|
|
Total distributions | | | (0.19 | ) | | | (0.15 | ) | | | (0.20 | ) | | | (0.19 | ) | | | (1.93 | ) |
| | |
|
|
|
Redemption fees | | | — | c | | | — | c | | | — | | | | — | | | | — | |
| | |
|
|
|
Net asset value, end of year | | $ | 15.84 | | | $ | 14.53 | | | $ | 12.37 | | | $ | 9.51 | | | $ | 11.85 | |
| | |
|
|
|
| | | | | |
Total returnb | | | 10.48% | | | | 18.87% | | | | 32.55% | | | | (18.40)% | | | | (15.75)% | |
Ratios/supplemental data | | | | | | | | | | | | | | | | | | | | |
Net assets, end of year (000’s) | | $ | 531,775 | | | $ | 506,456 | | | $ | 472,665 | | | $ | 397,420 | | | $ | 565,220 | |
Ratios to average net assets: | | | | | | | | | | | | | | | | | | | | |
Expenses | | | 0.77% | | | | 0.82% | | | | 0.87% | | | | 0.88% | | | | 0.90% | |
Net investment income | | | 2.03% | | | | 1.95% | | | | 1.81% | | | | 1.97% | | | | 1.59% | |
Portfolio turnover rate | | | 14.61% | | | | 10.91% | | | | 18.01% | | | | 28.12% | | | | 20.00% | |
| a | Based on average daily shares outstanding. |
| b | Total return does not include any fees, charges or expenses imposed by the variable annuity and life insurance contracts for which the Franklin Templeton Variable Insurance Products Trust serves as an underlying investment vehicle. |
| c | Amount is less than $0.01 per share. |
See notes to financial statements.
TF-7
Franklin Templeton Variable Insurance Products Trust
Financial Highlights (continued)
Templeton Foreign Securities Fund (continued)
| | | | | | | | | | | | | | | | | | | | |
| | | Year Ended December 31,
| |
| Class 2 | | 2005 | | | 2004 | | | 2003 | | | 2002 | | | 2001 | |
| | |
|
|
|
Per share operating performance | | | | | | | | | | | | | | | | | | | | |
(for a share outstanding throughout the year) | | | | | | | | | | | | | | | | | | | | |
Net asset value, beginning of year | | $ | 14.35 | | | $ | 12.24 | | | $ | 9.42 | | | $ | 11.74 | | | $ | 18.67 | |
| | |
|
|
|
Income from investment operations: | | | | | | | | | | | | | | | | | | | | |
Net investment incomea | | | 0.26 | | | | 0.22 | | | | 0.15 | | | | 0.17 | | | | 0.18 | |
Net realized and unrealized gains (losses) | | | 1.19 | | | | 2.03 | | | | 2.85 | | | | (2.32 | ) | | | (5.21 | ) |
| | |
|
|
|
Total from investment operations | | | 1.45 | | | | 2.25 | | | | 3.00 | | | | (2.15 | ) | | | (5.03 | ) |
| | |
|
|
|
Less distributions from: | | | | | | | | | | | | | | | | | | | | |
Net investment income | | | (0.17 | ) | | | (0.14 | ) | | | (0.18 | ) | | | (0.17 | ) | | | (0.23 | ) |
Net realized gains | | | — | | | | — | | | | — | | | | — | | | | (1.67 | ) |
| | |
|
|
|
Total distributions | | | (0.17 | ) | | | (0.14 | ) | | | (0.18 | ) | | | (0.17 | ) | | | (1.90 | ) |
| | |
|
|
|
Redemption fees | | | — | c | | | — | c | | | — | | | | — | | | | — | |
| | |
|
|
|
Net asset value, end of year | | $ | 15.63 | | | $ | 14.35 | | | $ | 12.24 | | | $ | 9.42 | | | $ | 11.74 | |
| | |
|
|
|
| | | | | |
Total returnb | | | 10.17% | | | | 18.53% | | | | 32.21% | | | | (18.56)% | | | | (15.99)% | |
Ratios/supplemental data | | | | | | | | | | | | | | | | | | | | |
Net assets, end of year (000’s) | | $ | 2,232,990 | | | $ | 1,445,928 | | | $ | 653,594 | | | $ | 299,760 | | | $ | 225,505 | |
Ratios to average net assets: | | | | | | | | | | | | | | | | | | | | |
Expenses | | | 1.02% | | | | 1.07% | | | | 1.12% | | | | 1.13% | | | | 1.15% | |
Net investment income | | | 1.78% | | | | 1.70% | | | | 1.56% | | | | 1.72% | | | | 1.32% | |
Portfolio turnover rate | | | 14.61% | | | | 10.91% | | | | 18.01% | | | | 28.12% | | | | 20.00% | |
| a | Based on average daily shares outstanding. |
| b | Total return does not include any fees, charges or expenses imposed by the variable annuity and life insurance contracts for which the Franklin Templeton Variable Insurance Products Trust serves as an underlying investment vehicle. |
| c | Amount is less than $0.01 per share. |
See notes to financial statements.
TF-8
Franklin Templeton Variable Insurance Products Trust
Financial Highlights (continued)
Templeton Foreign Securities Fund (continued)
| | | | | | | | |
| | | Year Ended December 31,
| |
| Class 3 | | 2005 | | | 2004d | |
| | |
|
|
|
Per share operating performance | | | | | | | | |
(for a share outstanding throughout the year) | | | | | | | | |
Net asset value, beginning of year | | $ | 14.35 | | | $ | 12.48 | |
| | |
|
|
|
Income from investment operations: | | | | | | | | |
Net investment incomea | | | 0.25 | | | | 0.09 | |
Net realized and unrealized gains (losses) | | | 1.18 | | | | 1.92 | |
| | |
|
|
|
Total from investment operations | | | 1.43 | | | | 2.01 | |
| | |
|
|
|
Less distributions from net investment income | | | (0.18 | ) | | | (0.14 | ) |
| | |
|
|
|
Redemption fees | | | — | c | | | — | c |
| | |
|
|
|
Net asset value, end of year | | $ | 15.60 | | | $ | 14.35 | |
| | |
|
|
|
| | |
Total returnb | | | 10.13% | | | | 16.25% | |
Ratios/supplemental data | | | | | | | | |
Net assets, end of year (000’s) | | $ | 47,462 | | | $ | 16,559 | |
Ratios to average net assets: | | | | | | | | |
Expenses | | | 1.02% | | | | 1.07% | e |
Net investment income | | | 1.78% | | | | 1.70% | e |
Portfolio turnover rate | | | 14.61% | | | | 10.91% | |
| a | Based on average daily shares outstanding. |
| b | Total return does not include any fees, charges or expenses imposed by the variable annuity and life insurance contracts for which the Franklin Templeton Variable Insurance Products Trust serves as an underlying investment vehicle. |
| c | Amount is less than $0.01 per share. |
| d | For the period May 1, 2004 (effective date) to December 31, 2004. |
See notes to financial statements.
TF-9
Franklin Templeton Variable Insurance Products Trust
Statement of Investments, December 31, 2005
| | | | | | | |
| Templeton Foreign Securities Fund | | Country | | Shares | | Value |
Long Term Investments 86.8% | | | | | | | |
Common Stocks 85.3% | | | | | | | |
Aerospace & Defense 1.3% | | | | | | | |
BAE Systems PLC | | United Kingdom | | 3,544,411 | | $ | 23,279,045 |
aRolls-Royce Group PLC | | United Kingdom | | 1,729,900 | | | 12,723,282 |
Rolls-Royce Group PLC, B | | United Kingdom | | 57,778,660 | | | 101,891 |
| | | | | | |
|
|
| | | | | | | | 36,104,218 |
| | | | | | |
|
|
Air Freight & Logistics 0.6% | | | | | | | |
Deutsche Post AG | | Germany | | 753,313 | | | 18,299,933 |
| | | | | | |
|
|
Airlines 0.8% | | | | | | | |
Qantas Airways Ltd. | | Australia | | 7,413,890 | | | 21,971,374 |
| | | | | | |
|
|
Auto Components 0.8% | | | | | | | |
GKN PLC | | United Kingdom | | 4,440,200 | | | 22,000,728 |
| | | | | | |
|
|
Automobiles 0.9% | | | | | | | |
Bayerische Motoren Werke AG | | Germany | | 551,350 | | | 24,150,481 |
| | | | | | |
|
|
Capital Markets 3.2% | | | | | | | |
Amvescap PLC | | United Kingdom | | 2,575,100 | | | 19,582,061 |
ING Groep NV | | Netherlands | | 1,304,660 | | | 45,254,488 |
Nomura Holdings Inc. | | Japan | | 1,327,730 | | | 25,422,942 |
| | | | | | |
|
|
| | | | | | | | 90,259,491 |
| | | | | | |
|
|
Chemicals 1.8% | | | | | | | |
Akzo Nobel NV | | Netherlands | | 329,003 | | | 15,248,541 |
BASF AG | | Germany | | 324,369 | | | 24,856,595 |
Lonza Group AG | | Switzerland | | 173,400 | | | 10,611,882 |
| | | | | | |
|
|
| | | | | | | | 50,717,018 |
| | | | | | |
|
|
Commercial Banks 11.9% | | | | | | | |
Banco Santander Central Hispano SA | | Spain | | 1,919,500 | | | 25,337,261 |
a,bBank of Communications Ltd., 144A | | China | | 4,184,000 | | | 1,902,149 |
DBS Group Holdings Ltd. | | Singapore | | 1,312,000 | | | 13,017,830 |
Hana Financial Group Inc. | | South Korea | | 690,840 | | | 31,679,214 |
aKookmin Bank, ADR | | South Korea | | 314,560 | | | 23,500,778 |
Lloyds TSB Group PLC | | United Kingdom | | 1,387,500 | | | 11,661,102 |
Mega Financial Holding Co. Ltd. | | Taiwan | | 19,749,000 | | | 12,844,536 |
Mitsubishi UFJ Financial Group Inc. | | Japan | | 2,616 | | | 35,462,171 |
Nordea Bank AB, FDR | | Sweden | | 2,135,083 | | | 22,318,867 |
Royal Bank of Scotland Group PLC | | United Kingdom | | 852,940 | | | 25,753,582 |
aShinhan Financial Group Co. Ltd. | | South Korea | | 869,130 | | | 35,412,195 |
bShinsei Bank Ltd., 144A | | Japan | | 4,990,000 | | | 28,833,178 |
Sumitomo Mitsui Financial Group Inc. | | Japan | | 3,511 | | | 37,183,343 |
UniCredito Italiano SpA | | Italy | | 4,423,938 | | | 30,480,964 |
| | | | | | |
|
|
| | | | | | | | 335,387,170 |
| | | | | | |
|
|
Commercial Services & Supplies 1.5% | | | | | | | |
Contax Participacoes SA, ADR | | Brazil | | 806,480 | | | 969,169 |
Rentokil Initial PLC | | United Kingdom | | 6,633,900 | | | 18,660,734 |
Securitas AB, B | | Sweden | | 1,352,080 | | | 22,462,345 |
| | | | | | |
|
|
| | | | | | | | 42,092,248 |
| | | | | | |
|
|
Computers & Peripherals 1.4% | | | | | | | |
Compal Electronics Inc. | | Taiwan | | 12,423,975 | | | 11,202,829 |
Lite-On Technology Corp. | | Taiwan | | 15,579,480 | | | 21,238,381 |
NEC Corp. | | Japan | | 1,058,000 | | | 6,579,446 |
| | | | | | |
|
|
| | | | | | | | 39,020,656 |
| | | | | | |
|
|
TF-10
Franklin Templeton Variable Insurance Products Trust
Statement of Investments, December 31, 2005 (continued)
| | | | | | | |
| Templeton Foreign Securities Fund | | Country | | Shares | | Value |
Common Stocks (cont.) | | | | | | | |
Diversified Telecommunication Services 7.3% | | | | | | | |
BCE Inc. | | Canada | | 1,210,660 | | $ | 29,029,591 |
China Telecom Corp. Ltd., H | | China | | 39,562,000 | | | 14,541,758 |
Chunghwa Telecom Co. Ltd., ADR | | Taiwan | | 1,325,350 | | | 24,320,172 |
France Telecom SA | | France | | 779,220 | | | 19,362,847 |
KT Corp., ADR | | South Korea | | 420,880 | | | 9,069,964 |
Nippon Telegraph & Telephone Corp. | | Japan | | 7,388 | | | 33,550,521 |
Telefonica SA, ADR | | Spain | | 361,829 | | | 16,289,542 |
Telefonos de Mexico SA de CV (Telmex), L, ADR | | Mexico | | 1,561,938 | | | 38,548,630 |
Telenor ASA | | Norway | | 2,003,100 | | | 19,661,221 |
| | | | | | |
|
|
| | | | | | | | 204,374,246 |
| | | | | | |
|
|
Electric Utilities 2.2% | | | | | | | |
Endesa SA | | Spain | | 547,398 | | | 14,399,385 |
Hong Kong Electric Holdings Ltd. | | Hong Kong | | 3,653,500 | | | 18,093,982 |
Iberdrola SA, Br. | | Spain | | 528,222 | | | 14,438,999 |
National Grid PLC | | United Kingdom | | 1,529,536 | | | 14,973,179 |
| | | | | | |
|
|
| | | | | | | | 61,905,545 |
| | | | | | |
|
|
Electrical Equipment 1.3% | | | | | | | |
Gamesa Corp. Tecnologica SA | | Spain | | 123,635 | | | 1,809,075 |
bGamesa Corp. Tecnologica SA, 144A | | Spain | | 1,552,713 | | | 22,719,896 |
aVestas Wind Systems AS | | Denmark | | 502,800 | | | 8,257,271 |
a,bVestas Wind Systems AS, 144A | | Denmark | | 167,600 | | | 2,752,424 |
| | | | | | |
|
|
| | | | | | | | 35,538,666 |
| | | | | | |
|
|
Electronic Equipment & Instruments 2.3% | | | | | | | |
Electrocomponents PLC | | United Kingdom | | 2,776,310 | | | 13,421,972 |
Hitachi Ltd. | | Japan | | 3,361,867 | | | 22,644,110 |
Mabuchi Motor Co. Ltd. | | Japan | | 303,100 | | | 16,820,342 |
Venture Corp. Ltd. | | Singapore | | 1,417,000 | | | 11,758,982 |
| | | | | | |
|
|
| | | | | | | | 64,645,406 |
| | | | | | |
|
|
Energy Equipment & Services 0.3% | | | | | | | |
SBM Offshore NV | | Netherlands | | 115,874 | | | 9,362,360 |
| | | | | | |
|
|
Food & Staples Retailing 0.8% | | | | | | | |
Boots Group PLC | | United Kingdom | | 2,229,200 | | | 23,222,300 |
| | | | | | |
|
|
Food Products 2.1% | | | | | | | |
Nestle SA | | Switzerland | | 109,488 | | | 32,752,643 |
Unilever PLC | | United Kingdom | | 2,751,334 | | | 27,288,814 |
| | | | | | |
|
|
| | | | | | | | 60,041,457 |
| | | | | | |
|
|
Health Care Equipment & Supplies 0.9% | | | | | | | |
Olympus Corp. | | Japan | | 956,000 | | | 25,108,871 |
| | | | | | |
|
|
Hotels Restaurants & Leisure 1.2% | | | | | | | |
Compass Group PLC | | United Kingdom | | 8,828,220 | | | 33,490,666 |
| | | | | | |
|
|
Household Durables 3.8% | | | | | | | |
Electrolux AB, B | | Sweden | | 1,509,600 | | | 39,233,831 |
Koninklijke Philips Electronics NV | | Netherlands | | 951,239 | | | 29,560,763 |
Sony Corp. | | Japan | | 956,454 | | | 39,058,784 |
| | | | | | |
|
|
| | | | | | | | 107,853,378 |
| | | | | | |
|
|
TF-11
Franklin Templeton Variable Insurance Products Trust
Statement of Investments, December 31, 2005 (continued)
| | | | | | | |
| Templeton Foreign Securities Fund | | Country | | Shares | | Value |
Common Stocks (cont.) | | | | | | | |
Industrial Conglomerates 2.7% | | | | | | | |
Hutchison Whampoa Ltd. | | Hong Kong | | 1,962,000 | | $ | 18,687,160 |
Siemens AG | | Germany | | 404,770 | | | 34,678,761 |
Smiths Group PLC | | United Kingdom | | 1,293,800 | | | 23,283,104 |
| | | | | | |
|
|
| | | | | | | | 76,649,025 |
| | | | | | |
|
|
Insurance 5.0% | | | | | | | |
ACE Ltd. | | Bermuda | | 558,903 | | | 29,867,776 |
AXA SA | | France | | 479,792 | | | 15,483,728 |
bAXA SA, 144A | | France | | 40,480 | | | 1,306,361 |
Old Mutual PLC | | South Africa | | 5,240,370 | | | 14,853,521 |
Sompo Japan Insurance Inc. | | Japan | | 1,694,000 | | | 22,891,892 |
Swiss Reinsurance Co. | | Switzerland | | 493,655 | | | 36,148,134 |
XL Capital Ltd., A | | Bermuda | | 301,458 | | | 20,312,240 |
| | | | | | |
|
|
| | | | | | | | 140,863,652 |
| | | | | | |
|
|
Leisure Equipment & Products 0.9% | | | | | | | |
Fuji Photo Film Co. Ltd. | | Japan | | 786,800 | | | 25,997,797 |
| | | | | | |
|
|
Media 5.5% | | | | | | | |
British Sky Broadcasting Group PLC | | United Kingdom | | 5,060,700 | | | 43,228,671 |
Pearson PLC | | United Kingdom | | 2,229,000 | | | 26,364,820 |
Reed Elsevier NV | | Netherlands | | 1,542,120 | | | 21,542,537 |
VNU NV | | Netherlands | | 1,109,540 | | | 36,791,946 |
Wolters Kluwer NV | | Netherlands | | 380,280 | | | 7,689,322 |
Yell Group PLC | | United Kingdom | | 2,000,000 | | | 18,460,428 |
| | | | | | |
|
|
| | | | | | | | 154,077,724 |
| | | | | | |
|
|
Metals & Mining 1.2% | | | | | | | |
Barrick Gold Corp. | | Canada | | 701,894 | | | 19,571,870 |
BHP Billiton Ltd. | | Australia | | 408,050 | | | 6,809,645 |
POSCO, ADR | | South Korea | | 165,547 | | | 8,196,232 |
| | | | | | |
|
|
| | | | | | | | 34,577,747 |
| | | | | | |
|
|
Multi-Utilities 1.4% | | | | | | | |
Centrica PLC | | United Kingdom | | 2,932,210 | | | 12,851,425 |
Suez SA | | France | | 861,400 | | | 26,819,909 |
| | | | | | |
|
|
| | | | | | | | 39,671,334 |
| | | | | | |
|
|
Oil, Gas & Consumable Fuels 5.2% | | | | | | | |
BP PLC | | United Kingdom | | 2,849,920 | | | 30,350,466 |
Eni SpA | | Italy | | 845,840 | | | 23,461,576 |
Repsol YPF SA | | Spain | | 1,186,541 | | | 34,653,618 |
Royal Dutch Shell PLC, B | | United Kingdom | | 1,343,941 | | | 42,960,364 |
Total SA, B | | France | | 54,077 | | | 13,584,844 |
| | | | | | |
|
|
| | | | | | | | 145,010,868 |
| | | | | | |
|
|
Paper & Forest Products 3.6% | | | | | | | |
Norske Skogindustrier ASA | | Norway | | 723,160 | | | 11,490,890 |
Sappi Ltd., ADR | | South Africa | | 1,142,840 | | | 12,948,377 |
Stora Enso OYJ, R | | Finland | | 2,819,980 | | | 38,153,401 |
UPM-Kymmene OYJ | | Finland | | 1,895,319 | | | 37,156,888 |
| | | | | | |
|
|
| | | | | | | | 99,749,556 |
| | | | | | |
|
|
TF-12
Franklin Templeton Variable Insurance Products Trust
Statement of Investments, December 31, 2005 (continued)
| | | | | | | | |
| Templeton Foreign Securities Fund | | Country | | Shares | | Value | |
Common Stocks (cont.) | | | | | | | | |
Pharmaceuticals 4.5% | | | | | | | | |
GlaxoSmithKline PLC | | United Kingdom | | 1,861,009 | | $ | 47,034,043 | |
Sanofi-Aventis | | France | | 500,723 | | | 43,865,789 | |
Shire PLC | | United Kingdom | | 928,000 | | | 11,878,537 | |
Takeda Pharmaceutical Co. Ltd. | | Japan | | 445,800 | | | 24,097,297 | |
| | | | | | |
|
|
|
| | | | | | | | 126,875,666 | |
| | | | | | |
|
|
|
Real Estate 2.8% | | | | | | | | |
Cheung Kong Holdings Ltd. | | Hong Kong | | 5,614,137 | | | 57,599,273 | |
Swire Pacific Ltd., B | | Hong Kong | | 12,648,627 | | | 22,022,720 | |
| | | | | | |
|
|
|
| | | | | | | | 79,621,993 | |
| | | | | | |
|
|
|
Road & Rail 0.3% | | | | | | | | |
East Japan Railway Co. | | Japan | | 1,100 | | | 7,558,248 | |
| | | | | | |
|
|
|
Semiconductors & Semiconductor Equipment 2.0% | | | | | | | | |
Samsung Electronics Co. Ltd. | | South Korea | | 69,750 | | | 45,623,077 | |
Taiwan Semiconductor Manufacturing Co. Ltd. | | Taiwan | | 5,757,380 | | | 10,961,761 | |
| | | | | | |
|
|
|
| | | | | | | | 56,584,838 | |
| | | | | | |
|
|
|
Software 1.4% | | | | | | | | |
aCheck Point Software Technologies Ltd. | | Israel | | 842,050 | | | 16,925,205 | |
Nintendo Co. Ltd. | | Japan | | 196,000 | | | 23,663,475 | |
| | | | | | |
|
|
|
| | | | | | | | 40,588,680 | |
| | | | | | |
|
|
|
Wireless Telecommunication Services 2.4% | | | | | | | | |
China Mobile (Hong Kong) Ltd., fgn. | | China | | 2,932,000 | | | 13,877,902 | |
SK Telecom Co. Ltd., ADR | | South Korea | | 474,820 | | | 9,634,098 | |
Vodafone Group PLC, ADR | | United Kingdom | | 1,997,440 | | | 42,885,037 | |
| | | | | | |
|
|
|
| | | | | | | | 66,397,037 | |
| | | | | | |
|
|
|
Total Common Stocks (Cost $1,925,307,466) | | | | | | | 2,399,770,377 | |
| | | | | | |
|
|
|
Preferred Stocks 1.5% | | | | | | | | |
Automobiles 0.2% | | | | | | | | |
Volkswagen AG, pfd. | | Germany | | 160,254 | | | 6,137,335 | |
| | | | | | |
|
|
|
Diversified Telecommunication Services 0.8% | | | | | | | | |
Tele Norte Leste Participacoes SA, ADR, pfd. | | Brazil | | 1,309,680 | | | 23,469,466 | |
| | | | | | |
|
|
|
Metals & Mining 0.5% | | | | | | | | |
Companhia Vale do Rio Doce, ADR, pfd., A | | Brazil | | 342,746 | | | 12,424,542 | |
| | | | | | |
|
|
|
Total Preferred Stocks (Cost $27,909,608) | | | | | | | 42,031,343 | |
| | | | | | |
|
|
|
Total Long Term Investments (Cost $1,953,217,074) | | | | | | | 2,441,801,720 | |
| | | | | | |
|
|
|
Short Term Investment (Cost $383,771,994) 13.7% | | | | | | | | |
Money Fund 13.7% | | | | | | | | |
cFranklin Institutional Fiduciary Trust Money Market Portfolio | | United States | | 383,771,994 | | | 383,771,994 | |
| | | | | | |
|
|
|
Total Investments (Cost $2,336,989,068) 100.5% | | | | | | | 2,825,573,714 | |
Other Assets, less Liabilities (0.5)% | | | | | | | (13,346,337 | ) |
| | | | | | |
|
|
|
Net Assets 100.0% | | | | | | $ | 2,812,227,377 | |
| | | | | | |
|
|
|
Selected Portfolio Abbreviations
ADR - American Depository Reciept
FDR - Foreign Depository Reciept
a Non-income producing.
| b | Security was purchased pursuant to Rule 144A under the Securities Act of 1933 and may be sold in transactions exempt from registration only to qualified institutional buyers or in a public offering registered under the Securities Act of 1933. These securities have been deemed liquid under the guidelines approved by the Trust’s Board of Trustees. At December 31, 2005, the value of these securities was $57,514,008, representing 2.05% of net assets. |
c See Note 7 regarding investments in the Franklin Institutional Fiduciary Trust Money Market Portfolio.
See notes to financial statements.
TF-13
Franklin Templeton Variable Insurance Products Trust
Financial Statements
Statement of Assets and Liabilities
December 31, 2005
| | | | |
| | | Templeton
Foreign
Securities Fund
| |
Assets: | | | | |
Investments in securities: | | | | |
Cost - Unaffiliated issuers | | $ | 1,953,217,074 | |
Cost - Sweep Money Fund (Note 7) | | | 383,771,994 | |
| | |
|
|
|
Total cost of investments | | $ | 2,336,989,068 | |
| | |
|
|
|
Value - Unaffiliated issuers | | $ | 2,441,801,720 | |
Value - Sweep Money Fund (Note 7) | | | 383,771,994 | |
| | |
|
|
|
Total value of investments | | | 2,825,573,714 | |
Cash | | | 150,729 | |
Foreign currency, at value (cost $6,145,275) | | | 6,140,586 | |
Receivables: | | | | |
Investment securities sold | | | 8,840,398 | |
Capital shares sold | | | 2,734,874 | |
Dividends | | | 3,516,167 | |
| | |
|
|
|
Total assets | | | 2,846,956,468 | |
| | |
|
|
|
Liabilities: | | | | |
Payables: | | | | |
Investment securities purchased | | | 29,943,347 | |
Capital shares redeemed | | | 1,781,684 | |
Affiliates | | | 2,536,429 | |
Accrued expenses and other liabilities | | | 467,631 | |
| | |
|
|
|
Total liabilities | | | 34,729,091 | |
| | |
|
|
|
Net assets, at value | | $ | 2,812,227,377 | |
| | |
|
|
|
Net assets consist of: | | | | |
Paid-in capital | | $ | 2,285,910,176 | |
Undistributed net investment income | | | 39,493,779 | |
Net unrealized appreciation (depreciation) | | | 488,620,913 | |
Accumulated net realized gain (loss) | | | (1,797,491 | ) |
| | |
|
|
|
Net assets, at value | | $ | 2,812,227,377 | |
| | |
|
|
|
Class 1: | | | | |
Net assets, at value | | $ | 531,774,693 | |
| | |
|
|
|
Shares outstanding | | | 33,577,474 | |
| | |
|
|
|
Net asset value and offering price per share | | $ | 15.84 | |
| | |
|
|
|
Class 2: | | | | |
Net assets, at value | | $ | 2,232,990,435 | |
| | |
|
|
|
Shares outstanding | | | 142,908,382 | |
| | |
|
|
|
Net asset value and offering price per share | | $ | 15.63 | |
| | |
|
|
|
Class 3: | | | | |
Net assets, at value | | $ | 47,462,249 | |
| | |
|
|
|
Shares outstanding | | | 3,041,719 | |
| | |
|
|
|
Net asset value and offering price per sharea | | $ | 15.60 | |
| | |
|
|
|
aRedemption price is equal to net asset value less any redemption fees retained by the Fund.
See notes to financial statements.
TF-14
Franklin Templeton Variable Insurance Products Trust
Financial Statements (continued)
Statement of Operations
for the year ended December 31, 2005
| | | | |
| | | Templeton
Foreign
Securities Fund
| |
Investment income: | | | | |
Dividends: (net of foreign taxes of $4,372,409) | | | | |
Unaffiliated issuers | | $ | 56,025,702 | |
Sweep Money Fund (Note 7) | | | 9,496,331 | |
Other income (Note 9) | | | 30,606 | |
| | |
|
|
|
Total investment income | | | 65,552,639 | |
| | |
|
|
|
Expenses: | | | | |
Management fees (Note 3a) | | | 13,997,281 | |
Administrative fees (Note 3b) | | | 2,327,271 | |
Distribution fees: (Note 3c) | | | | |
Class 2 | | | 4,503,381 | |
Class 3 | | | 74,412 | |
Unaffiliated transfer agent fees | | | 14,941 | |
Custodian fees (Note 4) | | | 691,246 | |
Reports to shareholders | | | 923,637 | |
Professional fees | | | 76,335 | |
Trustees’ fees and expenses | | | 11,918 | |
Other | | | 54,397 | |
| | |
|
|
|
Total expenses | | | 22,674,819 | |
Expense reductions (Note 4) | | | (1,561 | ) |
| | |
|
|
|
Net expenses | | | 22,673,258 | |
| | |
|
|
|
Net investment income | | | 42,879,381 | |
| | |
|
|
|
Realized and unrealized gains (losses): | | | | |
Net realized gain (loss) from: | | | | |
Investments | | | 106,539,675 | |
Foreign currency transactions | | | (1,266,372 | ) |
| | |
|
|
|
Net realized gain (loss) | | | 105,273,303 | |
| | |
|
|
|
Net change in unrealized appreciation (depreciation) on: | | | | |
Investments | | | 103,979,634 | |
Translation of assets and liabilities denominated in foreign currencies | | | (356,511 | ) |
Change in deferred taxes on unrealized appreciation | | | 169,581 | |
| | |
|
|
|
Net change in unrealized appreciation (depreciation) | | | 103,792,704 | |
| | |
|
|
|
Net realized and unrealized gain (loss) | | | 209,066,007 | |
| | |
|
|
|
Net increase (decrease) in net assets resulting from operations | | $ | 251,945,388 | |
| | |
|
|
|
See notes to financial statements.
TF-15
Franklin Templeton Variable Insurance Products Trust
Financial Statements (continued)
Statements of Changes in Net Assets
| | | | | | | | |
| | | Templeton Foreign Securities Fund
| |
| | | Year Ended December 31,
| |
| | | 2005 | | | 2004 | |
| | |
| |
Increase (decrease) in net assets: | | | | | | | | |
Operations: | | | | | | | | |
Net investment income | | $ | 42,879,381 | | | $ | 26,110,404 | |
Net realized gain (loss) from investments and foreign currency transactions | | | 105,273,303 | | | | 39,378,493 | |
Net change in unrealized appreciation (depreciation) on investments, translation of assets and liabilities denominated in foreign currencies and deferred taxes | | | 103,792,704 | | | | 215,691,763 | |
| | |
| |
Net increase (decrease) in net assets resulting from operations | | | 251,945,388 | | | | 281,180,660 | |
| | |
| |
Distributions to shareholders from: | | | | | | | | |
Net investment income: | | | | | | | | |
Class 1 | | | (6,459,354 | ) | | | (5,478,306 | ) |
Class 2 | | | (20,723,612 | ) | | | (10,189,845 | ) |
Class 3 | | | (354,063 | ) | | | (37,708 | ) |
| | |
| |
Total distributions to shareholders | | | (27,537,029 | ) | | | (15,705,859 | ) |
| | |
| |
Capital share transactions: (Note 2) | | | | | | | | |
Class 1 | | | (19,374,244 | ) | | | (43,045,841 | ) |
Class 2 | | | 610,744,172 | | | | 605,495,077 | |
Class 3 | | | 27,501,947 | | | | 14,758,051 | |
| | |
| |
Total capital share transactions | | | 618,871,875 | | | | 577,207,287 | |
| | |
| |
Redemption fees | | | 4,290 | | | | 1,304 | |
| | |
| |
Net increase (decrease) in net assets | | | 843,284,524 | | | | 842,683,392 | |
Net assets: | | | | | | | | |
Beginning of year | | | 1,968,942,853 | | | | 1,126,259,461 | |
| | |
| |
End of year | | $ | 2,812,227,377 | | | $ | 1,968,942,853 | |
| | |
| |
Undistributed net investment income included in net assets: | | | | | | | | |
End of year | | $ | 39,493,779 | | | $ | 24,955,358 | |
| | |
| |
See notes to financial statements.
TF-16
Franklin Templeton Variable Insurance Products Trust
Notes to Financial Statements
Templeton Foreign Securities Fund
1. ORGANIZATION AND SIGNIFICANT ACCOUNTING POLICIES
Franklin Templeton Variable Insurance Products Trust (the Trust) is registered under the Investment Company Act of 1940 as an open-end investment company, consisting of twenty-two separate series. The Templeton Foreign Securities Fund (the Fund) included in this report is diversified. The financial statements of the remaining funds in the series are presented separately. Shares of the Fund are sold only to insurance company separate accounts to fund the benefits of variable life insurance policies or variable annuity contracts.
The following summarizes the Fund’s significant accounting policies.
a. Security Valuation
Securities listed on a securities exchange or on the NASDAQ National Market System are valued at the last quoted sale price or the official closing price of the day, respectively. Over-the-counter securities and listed securities for which there is no reported sale are valued within the range of the most recent quoted bid and ask prices. Securities that trade in multiple markets or on multiple exchanges are valued according to the broadest and most representative market. Investments in open-end mutual funds are valued at the closing net asset value.
Foreign securities are valued as of the close of trading on the foreign stock exchange on which the security is primarily traded, or the NYSE, whichever is earlier. If no sale is reported at that time, the foreign security will be valued within the range of the most recent quoted bid and ask prices. The value is then converted into its U.S. dollar equivalent at the foreign exchange rate in effect at the close of the NYSE on the day that the value of the foreign security is determined.
The Trust has procedures to determine the fair value of individual securities and other assets for which market prices are not readily available or which may not be reliably priced. Methods for valuing these securities may include: fundamental analysis, matrix pricing, discounts from market prices of similar securities, or discounts applied due to the nature and duration of restrictions on the disposition of the securities. Due to the inherent uncertainty of valuations of such securities, the fair values may differ significantly from the values that would have been used had a ready market for such investments existed. Occasionally, events occur between the time at which trading in a security is completed and the close of the NYSE that might call into question the availability (including the reliability) of the value of a portfolio security held by the Fund. If such an event occurs, the securities may be valued using fair value procedures, which may include the use of independent pricing services. All security valuation procedures are approved by the Trust’s Board of Trustees.
b. Foreign Currency Translation
Portfolio securities and other assets and liabilities denominated in foreign currencies are translated into U.S. dollars based on the exchange rate of such currencies against U.S. dollars on the date of valuation. Purchases and sales of securities, income and expense items denominated in foreign currencies are translated into U.S. dollars at the exchange rate in effect on the transaction date. Occasionally, events may impact the availability or reliability of foreign exchange rates used to convert the U.S. dollar equivalent value. If such an event occurs, the foreign exchange rate will be valued at fair value using procedures established and approved by the Trust’s Board of Trustees.
The Fund does not separately report the effect of changes in foreign exchange rates from changes in market prices on securities held. Such changes are included in net realized and unrealized gain or loss from investments on the Statement of Operations.
Realized foreign exchange gains or losses arise from sales of foreign currencies, currency gains or losses realized between the trade and settlement dates on securities transactions and the difference between the recorded amounts of dividends, interest, and foreign withholding taxes and the U.S. dollar equivalent of the amounts actually received or paid. Net unrealized foreign exchange gains and losses arise from changes in foreign exchange rates on foreign denominated assets and liabilities other than investments in securities held at the end of the reporting period.
TF-17
Franklin Templeton Variable Insurance Products Trust
Notes to Financial Statements (continued)
Templeton Foreign Securities Fund
1. ORGANIZATION AND SIGNIFICANT ACCOUNTING POLICIES (continued)
c. Foreign Currency Contracts
When the Fund purchases or sells foreign securities it may enter into foreign exchange contracts to minimize foreign exchange risk from the trade date to the settlement date of the transactions. A foreign exchange contract is an agreement between two parties to exchange different currencies at an agreed upon exchange rate on a specified date. Realized and unrealized gains and losses on these contracts are included in the Statement of Operations.
The risks of these contracts include movement in the values of the foreign currencies relative to the U.S. dollar and the possible inability of the counterparties to fulfill their obligations under the contracts, which may be in excess of the amount reflected in the Statement of Assets and Liabilities.
d. Income and Deferred Taxes
No provision has been made for U.S. income taxes because the Fund’s policy is to continue to qualify as a regulated investment company under the Internal Revenue Code and to distribute to shareholders substantially all of its taxable income and net realized gains.
The Fund is subject to a tax imposed on net realized gains on securities of certain foreign countries. The Fund records an estimated deferred tax liability for net unrealized gains on these securities in an amount that would be payable if the securities were disposed of on the valuation date.
Foreign securities held by the Fund may be subject to foreign taxation. Foreign taxes, if any, are recorded based on the tax regulations and rates that exist in the foreign markets in which the Fund invests.
e. Security Transactions, Investment Income, Expenses and Distributions
Security transactions are accounted for on trade date. Realized gains and losses on security transactions are determined on a specific identification basis. Interest income and estimated expenses are accrued daily. Dividend income is recorded on the ex-dividend date except that certain dividends from foreign securities are recognized as soon as the Fund is notified of the ex-dividend date. Distributions to shareholders are recorded on the ex-dividend date and are determined according to income tax regulations (tax basis). Such distributions are reinvested in additional shares of the Fund. Distributable earnings determined on a tax basis may differ from earnings recorded in accordance with generally accepted accounting principles. These differences may be permanent or temporary. Permanent differences are reclassified among capital accounts to reflect their tax character. These reclassifications have no impact on net assets or the results of operations. Temporary differences are not reclassified, as they may reverse in subsequent periods.
Common expenses incurred by the Trust are allocated among the funds based on the ratio of net assets of each Fund to the combined net assets of the Trust. Fund specific expenses are charged directly to the fund that incurred the expense.
Realized and unrealized gains and losses and net investment income, other than class specific expenses, are allocated daily to each class of shares based upon the relative proportion of net assets of each class.
f. Accounting Estimates
The preparation of financial statements in accordance with accounting principles generally accepted in the United States of America requires management to make estimates and assumptions that affect the reported amounts of assets and liabilities at the date of the financial statements and the amounts of income and expenses during the reporting period. Actual results could differ from those estimates.
TF-18
Franklin Templeton Variable Insurance Products Trust
Notes to Financial Statements (continued)
Templeton Foreign Securities Fund
1. ORGANIZATION AND SIGNIFICANT ACCOUNTING POLICIES (continued)
g. Redemption Fees
Redemptions and exchanges of Class 3 shares held 60 days or less may be subject to the Fund’s redemption fee, which is 1% of the amount redeemed. Such fees are retained by the Fund and accounted for as an addition to paid-in capital.
h. Guarantees and Indemnifications
Under the Trust’s organizational documents, its officers and trustees are indemnified by the Trust against certain liabilities arising out of the performance of their duties to the Trust. Additionally, in the normal course of business, the Trust enters into contracts with service providers that contain general indemnification clauses. The Trust’s maximum exposure under these arrangements is unknown as this would involve future claims that may be made against the Trust that have not yet occurred. However, based on experience, the Trust expects the risk of loss to be remote.
2. SHARES OF BENEFICIAL INTEREST
The Fund offers three classes of shares: Class 1, Class 2 and Class 3. Effective May 1, 2004 the Fund began offering a new class of shares, Class 3. Each class of shares differs by its distribution fees, voting rights on matters affecting a single class and its exchange privilege.
At December 31, 2005, there were an unlimited number of shares authorized ($0.01 par value). Transactions in the Fund’s shares were as follows:
| | | | | | | | | | | | | | |
| | | Year Ended December 31,
| |
| | | 2005
| | | 2004
| |
| Class 1 Shares: | | Shares
| | | Amount
| | | Shares
| | | Amount
| |
Shares sold | | 3,758,655 | | | $ | 55,211,998 | | | 2,258,527 | | | $ | 29,175,787 | |
Shares issued in reinvestment of distributions | | 453,606 | | | | 6,459,354 | | | 437,215 | | | | 5,478,306 | |
Shares redeemed | | (5,489,770 | ) | | | (81,045,596 | ) | | (6,039,270 | ) | | | (77,699,934 | ) |
| | |
| |
Net increase (decrease) | | (1,277,509 | ) | | $ | (19,374,244 | ) | | (3,343,528 | ) | | $ | (43,045,841 | ) |
| | |
| |
| Class 2 Shares: | | | | | | | | | | | | |
Shares sold | | 51,344,360 | | | $ | 745,826,623 | | | 59,591,849 | | | $ | 761,455,379 | |
Shares issued in reinvestment of distributions | | 1,472,894 | | | | 20,723,612 | | | 821,762 | | | | 10,189,845 | |
Shares redeemed | | (10,646,257 | ) | | | (155,806,063 | ) | | (13,067,398 | ) | | | (166,150,147 | ) |
| | |
| |
Net increase (decrease) | | 42,170,997 | | | $ | 610,744,172 | | | 47,346,213 | | | $ | 605,495,077 | |
| | |
| |
| Class 3 Shares:a | | | | | | | | | | | | |
Shares sold | | 2,107,457 | | | $ | 30,752,443 | | | 1,203,190 | | | $ | 15,372,770 | |
Shares issued in reinvestment of distributions | | 25,189 | | | | 353,916 | | | 3,035 | | | | 37,599 | |
Shares redeemed | | (244,990 | ) | | | (3,604,412 | ) | | (52,162 | ) | | | (652,318 | ) |
| | |
| |
Net increase (decrease) | | 1,887,656 | | | $ | 27,501,947 | | | 1,154,063 | | | $ | 14,758,051 | |
| | |
| |
| a | For the period May 1, 2004 (effective date) to December 31, 2004. |
TF-19
Franklin Templeton Variable Insurance Products Trust
Notes to Financial Statements (continued)
Templeton Foreign Securities Fund
3. TRANSACTIONS WITH AFFILIATES
Franklin Resources, Inc. is the holding company for various subsidiaries that together are referred to as Franklin Templeton Investments. Certain officers and trustees of the Trust are also officers and/or directors of the following subsidiaries:
| | |
| Subsidiary | | Affiliation |
Templeton Investment Counsel, LLC (TIC) | | Investment manager |
Franklin Templeton Services, LLC (FT Services) | | Administrative manager |
Franklin Templeton Distributors, Inc. (Distributors) | | Principal underwriter |
Franklin Templeton Investor Services, LLC (Investor Services) | | Transfer agent |
a. Management Fees
The Fund pays an investment management fee to TIC based on the average daily net assets of the Fund as follows:
| | |
| Annualized Fee Rate | | Net Assets |
| 0.750% | | Up to and including $200 million |
| 0.675% | | Over $200 million, up to and including $1.3 billion |
| 0.600% | | In excess of $1.3 billion |
b. Administrative Fees
The Fund pays an administrative fee to FT Services based on the average daily net assets of the Fund as follows:
| | |
| Annualized Fee Rate | | Net Assets |
| 0.150% | | Up to and including $200 million |
| 0.135% | | Over $200 million, up to and including $700 million |
| 0.100% | | Over $700 million, up to and including $1.2 billion |
| 0.075% | | In excess of $1.2 billion |
c. Distribution Fees
The Fund’s Board of Trustees has adopted distribution plans for Class 2 and Class 3 shares pursuant to Rule 12b-1 under the 1940 Act. Under the Fund’s compensation distribution plans, the Fund pays Distributors for costs incurred in connection with the sale and distribution of the Fund’s shares up to 0.35% per year of its average daily net assets of each class. The Board of Trustees has set the current rate at 0.25% per year.
d. Transfer Agent Fees
Investor Services, under terms of an agreement, performs shareholder servicing for the Fund and is not paid by the Fund for the services.
4. EXPENSE OFFSET ARRANGEMENT
The Fund has entered into an arrangement with its custodian whereby credits realized as a result of uninvested cash balances are used to reduce a portion of the Fund’s custodian expenses. During the year ended December 31, 2005, the custodian fees were reduced as noted in the Statement of Operations.
TF-20
Franklin Templeton Variable Insurance Products Trust
Notes to Financial Statements (continued)
Templeton Foreign Securities Fund
5. INCOME TAXES
At December 31, 2005, the Fund had tax basis capital losses of $1,301,670 expiring on December 31, 2011, which may be carried over to offset future capital gains, if any. During the year ended December 31, 2005, the Fund utilized $106,539,675 of capital loss carryforwards.
For tax purposes, realized currency losses, occurring subsequent to October 31, may be deferred and treated as occurring on the first day of the following fiscal year. At December 31, 2005, the Fund deferred realized currency losses of $495,819.
The tax character of distributions paid during the years ended December 31, 2005 and 2004, was as follows:
| | | | | | |
| | | 2005
| | 2004
|
Distributions paid from ordinary income | | $ | 27,537,029 | | $ | 15,705,859 |
| | |
|
|
At December 31, 2005, the cost of investments, net unrealized appreciation (depreciation) and undistributed ordinary income for income tax purposes were as follows:
| | | | |
Cost of investments | | $ | 2,336,989,068 | |
| | |
|
|
|
| |
Unrealized appreciation | | $ | 556,170,295 | |
Unrealized depreciation | | | (67,585,649 | ) |
| | |
|
|
|
Net unrealized appreciation (depreciation) | | $ | 488,584,646 | |
| | |
|
|
|
Distributable earnings - undistributed ordinary income | | $ | 39,493,779 | |
| | |
|
|
|
Net investment income and realized gains (losses) differs for financial statement and tax purposes primarily due to differing treatments of foreign currency transactions.
6. INVESTMENT TRANSACTIONS
Purchases and sales of investments (excluding short term securities) for the year ended December 31, 2005, aggregated $831,021,504 and $293,046,003, respectively.
7. INVESTMENTS IN FRANKLIN INSTITUTIONAL FIDUCIARY TRUST MONEY MARKET PORTFOLIO
The Fund may invest in the Franklin Institutional Fiduciary Trust Money Market Portfolio (the Sweep Money Fund), an open-end investment company managed by Franklin Advisers Inc. (an affiliate of the investment manager). Management fees paid by the Fund are reduced on assets invested in the Sweep Money Fund, in an amount not to exceed the management and administrative fees paid by the Sweep Money Fund.
TF-21
Franklin Templeton Variable Insurance Products Trust
Notes to Financial Statements (continued)
Templeton Foreign Securities Fund
8. CONCENTRATION OF RISK
Investing in foreign securities may include certain risks and considerations not typically associated with investing in U.S. securities, such as fluctuating currency values and changing local and regional economic, political and social conditions, which may result in greater market volatility. In addition, certain foreign securities may not be as liquid as U.S. securities.
9. REGULATORY MATTERS
As part of various investigations by a number of federal, state, and foreign regulators and governmental entities, relating to certain practices in the mutual fund industry, including late trading, market timing and marketing support payments to securities dealers who sell fund shares, Franklin Resources, Inc. and certain of its subsidiaries (collectively, the “Company”), entered into settlements with certain of those regulators.
Specifically, the Company entered into settlements with the Securities and Exchange Commission (“SEC”) concerning market timing (the “August 2, 2004 SEC Order”) and marketing support payments to securities dealers who sell fund shares (the “December 13, 2004 SEC Order”) and with the California Attorney General’s Office (“CAGO”) concerning marketing support payments to securities dealers who sell fund shares (the “CAGO Settlement”). Under the terms of the settlements with the SEC and the CAGO, the Company retained an Independent Distribution Consultant (“IDC”) to develop a plan for distribution of the respective settlement monies. The CAGO approved the distribution plan under the CAGO Settlement and, in accordance with the terms and conditions of that settlement, the monies were disbursed to the relevant funds and are recorded as other income in the current period. The SEC has not yet approved the distribution plan pertaining to the December 13, 2004 SEC Order. When approved, disbursements of settlement monies will be made promptly to the relevant funds, in accordance with the terms and conditions of that order. The IDC continues to develop the plan of distribution under the August 2, 2004 SEC Order that resolved the SEC’s market timing investigation.
In addition, the Company, as well as most of the mutual funds within Franklin Templeton Investments and certain current or former officers, directors, and/or employees, have been named in private lawsuits (styled as shareholder class actions, or as derivative actions on behalf of either the named funds or Franklin Resources, Inc.) relating to the industry practices referenced above, as well as to allegedly excessive advisory fees, commissions, and/or 12b-1 fees. The lawsuits were filed in different courts throughout the country. Many of those suits are now pending in a multi-district litigation in the United States District Court for the District of Maryland.
The Company and fund management strongly believe that the claims made in each of the private lawsuits referenced above are without merit and intend to defend against them vigorously. The Company cannot predict with certainty the eventual outcome of these lawsuits, nor whether they will have a material negative impact on the Company. If it is determined that the Company bears responsibility for any unlawful or inappropriate conduct that caused losses to the Trust, it is committed to making the Trust or their shareholders whole, as appropriate.
TF-22
Franklin Templeton Variable Insurance Products Trust
Templeton Foreign Securities Fund
Report of Independent Registered Public Accounting Firm
To the Board of Trustees and Shareholders of
Franklin Templeton Variable Insurance Products Trust
In our opinion, the accompanying statement of assets and liabilities, including the statement of investments, and the related statements of operations and of changes in net assets and the financial highlights present fairly, in all material respects, the financial position of Templeton Foreign Securities Fund (one of the funds constituting Franklin Templeton Variable Insurance Products Trust, hereafter referred to as the “Fund”) at December 31, 2005, the results of its operations for the year then ended, the changes in its net assets for each of the two years in the period then ended and the financial highlights for each of the periods presented, in conformity with accounting principles generally accepted in the United States of America. These financial statements and financial highlights (hereafter referred to as “financial statements”) are the responsibility of the Fund’s management; our responsibility is to express an opinion on these financial statements based on our audits. We conducted our audits of these financial statements in accordance with the standards of the Public Company Accounting Oversight Board (United States). Those standards require that we plan and perform the audit to obtain reasonable assurance about whether the financial statements are free of material misstatement. An audit includes examining, on a test basis, evidence supporting the amounts and disclosures in the financial statements, assessing the accounting principles used and significant estimates made by management, and evaluating the overall financial statement presentation. We believe that our audits, which included confirmation of securities at December 31, 2005, by correspondence with the custodian and brokers, provide a reasonable basis for our opinion.
PricewaterhouseCoopers LLP
San Francisco, California
February 10, 2006
TF-23
Franklin Templeton Variable Insurance Products Trust
Tax Designation (unaudited)
Templeton Foreign Securities Fund
At December 31, 2005, more than 50% of the Fund’s total assets were invested in securities of foreign issuers. In most instances, foreign taxes were withheld from dividends paid to the Fund on these investments. The Fund elects to treat foreign taxes paid as allowed under Section 853 of the Internal Revenue Code. This election will allow shareholders of record in June 2006, to treat their proportionate share of foreign taxes paid by the Fund as having been paid directly by them. The shareholder shall consider these amounts as foreign taxes paid in the tax year in which they receive the Fund distribution.
The foreign tax information will be disclosed in the June 30, 2006, semi-annual report of the Fund.
TF-24
TEMPLETON GLOBAL INCOME SECURITIES FUND
This annual report for Templeton Global Income Securities Fund covers the fiscal year ended December 31, 2005.
Performance Summary as of 12/31/05
Average annual total return of Class 3 shares represents the average annual change in value, assuming reinvestment of dividends and capital gains. Average returns smooth out variations in returns, which can be significant; they are not the same as year-by-year results.
Periods ended 12/31/05
| | | | | | |
| | | 1-Year | | 5-Year | | 10-Year |
Average Annual Total Return | | -3.15% | | +11.00% | | +7.09% |
*Class 3 and Class 2 shares were not offered until 4/1/05 and 1/6/99, respectively. As a result, Class 3 Fund performance for periods prior to 4/1/05 represents historical results of Class 2 shares which, for periods prior to 1/6/99, reflects historical results of Class 1 shares. For periods beginning on 1/6/99, Class 2’s results reflect an additional 12b-1 fee expense, which also affects future performance. The 12b-1 fee rate is currently the same for Classes 2 and 3. Since 4/1/05 (effective date), the total return of Class 3 shares was -0.80%.
Total Return Index Comparison
for Hypothetical $10,000 Investment (1/1/96–12/31/05)
The graph below shows the change in value of a hypothetical $10,000 investment in the Fund over the indicated period and includes reinvestment of any income or distributions. The Fund’s performance* is compared to the performance of the J.P. Morgan (JPM) Global Government Bond Index (GGBI), as well as the Consumer Price Index (CPI). One cannot invest directly in an index, nor is an index representative of the Fund’s portfolio. Please see Important Notes to Performance Information preceding the Fund Summaries.
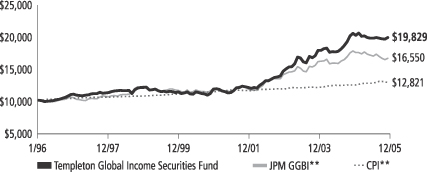
**Sources: J.P. Morgan; Standard & Poor’s Micropal. Please see Index Descriptions following the Fund Summaries.
Templeton Global Income Securities Fund – Class 3
Performance reflects the Fund’s Class 3 operating expenses, but does not include any contract fees, expenses or sales charges. If they had been included, performance would be lower. These charges and deductions, particularly for variable life policies, can have a significant effect on contract values and insurance benefits. See the contract prospectus for a complete description of these expenses, including sales charges.
Performance data represent past performance, which does not guarantee future results. Investment return and principal value will fluctuate, and you may have a gain or loss when you sell your shares.
Current performance may differ from figures shown.
TGI-1
Fund Goal and Main Investments: Templeton Global Income Securities Fund seeks high current income, consistent with preservation of capital, with capital appreciation as a secondary consideration. The Fund normally invests mainly in debt securities of governments and their political subdivisions and agencies, supranational organizations and companies located anywhere in the world, including emerging markets.
Performance Overview
You can find the Fund’s total return for the period under review in the Performance Summary. The Fund outperformed its benchmark, the JPM GGBI (the Index), which had a -6.53% total return in U.S. dollar terms for the year under review.1
Economic and Market Overview
The U.S. economy experienced solid growth during the year under review and remained notably resilient despite higher energy prices and the impact of hurricanes in the south. In third quarter 2005, the economy expanded 3.6% compared with the year earlier period. Continuing productivity growth and job creation increased capital and labor utilization and, along with higher global commodity prices, exerted inflationary pressures in the U.S. The Federal Reserve Board (Fed) continued its series of measured interest rate hikes, increasing the federal funds target rate 200 basis points (100 basis points equal one percentage point) to 4.25% by period-end to remove policy accommodation given strong growth conditions and higher inflation. Consistent with strong economic growth and in particular solid consumption trends, U.S. imports exceeded exports, driving the U.S. trade balance to a $64 billion monthly deficit level by November 2005.2 Although higher oil prices negatively impacted the deficit, the underlying trade balance (not including oil) also deteriorated, largely as a result of a widening trade deficit with the Pacific Rim region. Furthermore, the U.S. current account deficit widened to 6.2% of gross domestic product (GDP) in third quarter 2005 versus 5.7% a year earlier.2
In contrast to the U.S., Asia generated trade and current account surpluses. These surpluses facilitated foreign reserve accumulation, most notably in China where foreign exchange reserves reached $819 billion
1. Source: J.P. Morgan. One cannot invest directly in an index, nor is an index representative of the Fund’s portfolio. Please see Index Descriptions following the Fund Summaries.
2. Source: U.S. Department of Commerce.
Fund Risks: Because the Fund invests in bonds and other debt obligations, the Fund’s share price and yield will be affected by interest rate movements. Bond prices generally move in the opposite direction from interest rates. Thus, as the prices of bonds in the Fund adjust to a rise in interest rates, the Fund’s share price may decline. High yield, lower-rated (junk) bonds generally have greater price swings and higher default risks. Foreign investing, especially in emerging markets, involves additional risks including currency fluctuations, economic instability, and social and political developments. The Fund’s prospectus also includes a description of the main investment risks.
What is a current account?
A current account is that part of the balance of payments where all of one country’s international transactions in goods and services are recorded.
What is balance of payments?
Balance of payments is a record of all of a country’s exports and imports of goods and services, borrowing and lending with the rest of the world during a particular time period. It helps a country evaluate its competitive strengths and weaknesses and forecast the strength of its currency.
TGI-2
in December 2005.3 This foreign reserve buildup combined with international political pressure prompted the Chinese government to revalue the yuan and move from its U.S. dollar peg to a managed float versus a basket of undisclosed global currencies. Although global demand for Asian products remained favorable for the region’s growth prospects, there were also signs during the period of a pickup in domestic growth drivers. For example, private consumption accelerated in South Korea. Furthermore, this rebalancing extended to Japan where notable improvements in domestic demand conditions improved prospects for the country to finally exit deflation. In China, increased consumption and strong domestic growth conditions benefited the country’s regional trade partners through import demand. Overall, aggregate demand among Asian economies rose over the Fund’s fiscal year. In Singapore, South Korea and Thailand, GDP growth rates improved. Correspondingly, regional interest rates began to rise. Thailand raised rates 200 basis points to 4.00% and South Korea began to tighten monetary policy in the second half of the year, raising rates 25 basis points to 3.75%.4
Following sluggish economic growth in the first half of the year, economic activity in the 12-country euro zone accelerated in the second half but remained more moderate than growth in the U.S. or Asia. Euro-zone GDP for third quarter 2005 rose 1.6% compared with a year earlier.5 While underlying inflationary pressures remained well contained, higher energy prices and liquidity conditions prompted the European Central Bank (ECB) to increase interest rates by 25 basis points to 2.25% after being on hold for 30 months. Central European economies also benefited from the firmer growth conditions in the euro zone. Poland’s GDP growth rose 3.7% while Slovakia’s GDP growth accelerated further to 6.2% in third quarter 2005.6 Prior fiscal reforms and prudent macroeconomic policies enabled Slovakia to join ERMII, which is the precursor to adopting the euro, in the fourth quarter. Economic conditions in Norway and Sweden remained characterized by significantly large current account surpluses and better domestic growth conditions, led by labor market improvement. Correspondingly, Norway’s central bank raised interest rates during the period and Sweden’s paused after reducing rates earlier in the period.
3. Source: National Bureau of Statistics, China.
4. Sources: Bank of Thailand; Bank of Korea (South Korea).
5. Source: Eurostat.
6. Sources: Polish Statistics Office; Statistical Office of Slovakia.
TGI-3
Investment Strategy
We allocate the Fund’s assets among issuers, geographic regions, and currencies based upon our assessment of relative interest rates among currencies, our outlook for changes in interest rates, and credit risks. In considering these factors, we may evaluate a country’s changing market, and economic and political conditions, such as inflation rate, growth prospects, global trade patterns and government policies. We seek to manage the Fund’s exposure to various currencies, and may from time to time seek to hedge (protect) against currency risk by using forward currency exchange contracts.
Manager’s Discussion
The Fund’s total return is influenced by various factors, including interest rate developments, currency movements and exposure to sovereign debt markets.
Interest Rate Strategy
In anticipation of rising global interest rates, led by the U.S. Fed, we shortened the Fund’s overall duration, particularly in Asia and increasingly Europe. However, we continued to find opportunities over the past year to take advantage of lower interest rates to benefit Fund performance. For example, the National Bank of Poland reduced interest rates 200 basis points during the year to 4.50%, bolstering local bond market returns to 9.67% in local currency terms.7 While economic growth in Poland remained above rates in the euro zone, the composition of growth showed slower private consumption and investment growth. Furthermore, currency appreciation against its major trading partners contributed to the disinflationary process, with consumer price inflation falling from 4.4% at the end of 2004 to 1.0% in November 2005.8 In another example, the National Bank of Slovakia reduced interest rates 100 basis points to 3.00%, to ease the constraint imposed on monetary conditions by the currency appreciation. While we continued to avoid the U.K.’s currency risk, the lack of exposure to the U.K. bond market detracted from relative Fund performance given the 25 basis-point reduction in interest rates during the year.9
Currency Strategy
During the 12 months under review, the U.S. dollar received some reprieve from the depreciation trend that began in early 2002. The dollar
7. Source: J.P. Morgan, Government Bond Index Monitor, December 2005.
8. Source: Polish Statistics Office.
9. Source: Bank of England.
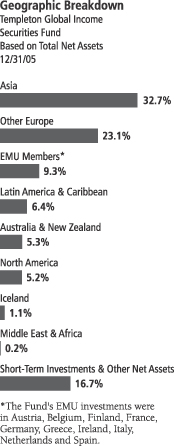
TGI-4
appreciated 8.42% against its major trading partners, including 15.23% appreciation against the euro and 15.18% appreciation against the yen.10 This reprieve likely was due in part to the Fed’s interest rate increases, which brought U.S. rates in line with the ECB rate at the beginning of the reporting period and 200 basis points higher by period-end. However, while this positive interest rate differential was increasing, the U.S. balance of payment position deteriorated, led by a larger current account deficit and greater reliance on debt financing, particularly from the government sector. That the U.S. current account deficit deteriorated significantly while the country also experienced currency strength indicated global macroeconomic imbalances. These imbalances were largely offset by sufficient global market liquidity resulting from a large, global savings pool in Asia and oil-exporting countries. Given the magnitude of global economic imbalances, particularly between the U.S. and Asia, we believe the U.S. dollar may need to weaken to help improve the U.S. current account position over the medium term.
In a relatively difficult currency environment, currency diversification was an important component of the Fund’s strong performance relative to the JPM GGBI. We significantly reduced exposure to the euro and increased allocation to non-Japan Asia, non-euro Europe and the Americas outside of the U.S. The two most notable allocation changes, and consequently, the largest currency contributors to relative performance, were the Canadian dollar and the South Korean won. Macroeconomic fundamentals remained supportive of the Canadian dollar, which appreciated 2.57% against the U.S. dollar and brought the total return of Canadian bond markets to 10.02% in U.S. dollar terms over the year.7 Energy and commodity prices continued to underpin Canada’s overall economic environment. Additionally, the higher commodity price environment bolstered the Canadian balance of payment position through higher exports as well as increased capital flows into the energy sector. We continued to see more signs of domestic demand strength in Asia. One of the best examples was the acceleration of South Korean private consumption in third quarter to 4.0% from 2.8% in second quarter 2005, which was preceded by an improvement in consumer confidence and a rise in property prices earlier in the year.11 The South Korean won appreciated 2.41% against the U.S. dollar.7 The Swedish krona weakened more than the euro against the dollar, or 16.50%, and was one of the more significant currency detractors from relative performance.7 Currency performance over
10. Source: Compustat.
11. Source: Bank of Korea (South Korea).
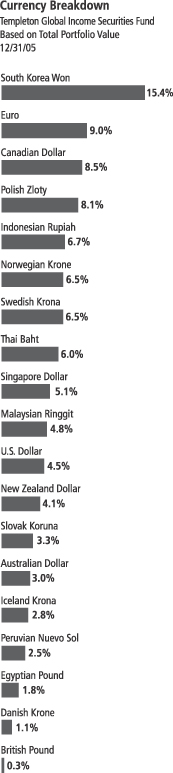
The dollar value, number of shares or principal amount, and names of all portfolio holdings are listed in the Fund’s Statement of Investments.
TGI-5
the period was hindered by Sweden’s lower interest rates relative to other developed markets; however, the country maintained large current account and fiscal surpluses.
Global Sovereign Debt Strategy
The Fund also purchased investment-grade and sub-investment-grade sovereign debt that typically compensates for greater credit risk by offering higher yields relative to U.S. and European benchmark treasury curves. Despite rising U.S. interest rates, U.S. dollar-denominated emerging market debt continued to generate strong returns, rising 10.73% over the period, as measured by the JPM Emerging Markets Bond Index (EMBI) Global.12 Sovereign interest rate spreads narrowed from 347 basis points greater than the U.S. Treasury market at the beginning of the reporting period, to 237 basis points by period-end. Regionally, Latin American sovereign debt rose 10.88%, eastern European 10.91% and Asian 11.39%.12 Euro-denominated markets also rose during the period, gaining 7.07% in euro terms as measured by the JPM Euro EMBI Global, yet declined in U.S. dollar terms given the euro’s volatility.12 We sought to take advantage of strength in sovereign debt prices to reduce allocations to U.S. dollar-denominated credit, particularly in Venezuela and Ukraine.
Thank you for your participation in Templeton Global Income Securities Fund. We look forward to serving your future investment needs.
12. Source: J.P. Morgan, Emerging Markets Bond Index Monitor, December 2005. Please see Index Descriptions following the Fund Summaries.
The foregoing information reflects our analysis, opinions and portfolio holdings as of December 31, 2005, the end of the reporting period. The way we implement our main investment strategies and the resulting portfolio holdings may change depending on factors such as market and economic conditions. These opinions may not be relied upon as investment advice or an offer for a particular security. The information is not a complete analysis of every aspect of any market, country, industry, security or the Fund. Statements of fact are from sources considered reliable, but the adviser makes no representation or warranty as to their completeness or accuracy. Although historical performance is no guarantee of future results, these insights may help you understand our investment management philosophy.
TGI-6
Fund Expenses
As an investor in a variable insurance contract (“Contract”) that indirectly provides for investment in an underlying mutual fund, you can incur transaction and/or ongoing expenses at both the Fund level and the Contract level.
| • | | Transaction expenses can include sales charges (loads) on purchases, redemption fees, surrender fees, transfer fees and premium taxes. |
| • | | Ongoing expenses can include management fees, distribution and service (12b-1) fees, contract fees, annual maintenance fees, mortality and expense risk fees and other fees and expenses. All mutual funds and Contracts have some types of ongoing expenses. |
The expenses shown in the table below are meant to highlight ongoing expenses at the Fund level only and do not include ongoing expenses at the Contract level, or transaction expenses at either the Fund or Contract level. While the Fund does not have transaction expenses, if the transaction and ongoing expenses at the Contract level were included, the expenses shown below would be higher. You should consult your Contract prospectus or disclosure document for more information.
The table shows Fund-level ongoing expenses and can help you understand these expenses and compare them with those of other mutual funds offered through the Contract. The table assumes a $1,000 investment held for the six months indicated. Please refer to the Fund prospectus for additional information on operating expenses.
Actual Fund Expenses
The first line (Actual) of the table below provides actual account values and expenses. The “Ending Account Value” is derived from the Fund’s actual return, which includes the effect of ongoing Fund expenses, but does not include the effect of ongoing Contract expenses.
You can estimate the Fund-level expenses you incurred during the period by following these steps. Of course, your account value and expenses will differ from those in this illustration:
| 1. | Divide your account value by $1,000. |
If an account had an $8,600 value, then $8,600 ÷ $1,000 = 8.6.
| 2. | Multiply the result by the number under the heading “Fund-Level Expenses Incurred During Period.” |
If Fund-Level Expenses Incurred During Period were $7.50, then 8.6 x $7.50 = $64.50.
Templeton Global Income Securities Fund – Class 3
TGI-7
In this illustration, the estimated expenses incurred this period at the Fund level are $64.50.
Hypothetical Example for Comparison with Other Mutual Funds
Information in the second line (Hypothetical) of the table can help you compare ongoing expenses of the Fund with those of other mutual funds offered through the Contract. This information may not be used to estimate the actual ending account balance or expenses you incurred during the period. The hypothetical “Ending Account Value” is based on the Fund’s actual expense ratio and an assumed 5% annual rate of return before expenses, which does not represent the Fund’s actual return. The figure under the heading “Fund-Level Expenses Incurred During Period” shows the hypothetical expenses your account would have incurred under this scenario. You can compare this figure with the 5% hypothetical examples that appear in shareholder reports of other funds offered through a Contract.
| | | | | | | | | |
| Class 3 | | Beginning
Account
Value 7/1/05 | | Ending
Account
Value 12/31/05 | | Fund-Level
Expenses Incurred
During Period*
7/1/05–12/31/05 |
Actual | | $ | 1,000 | | $ | 1,005.70 | | $ | 5.06 |
Hypothetical (5% return before expenses) | | $ | 1,000 | | $ | 1,020.16 | | $ | 5.09 |
*Expenses are equal to the annualized expense ratio, net of expense reduction, for the Fund’s Class 3 shares (1.00%), which does not include any ongoing expenses of the Contract for which the Fund is an investment option, multiplied by the average account value over the period, multiplied by 184/365 to reflect the one-half year period.
TGI-8
Franklin Templeton Variable Insurance Products Trust
Financial Highlights
Templeton Global Income Securities Fund
| | | | | | | | | | | | | | | | | | | | |
| | | Year Ended December 31,
| |
| Class 1 | | 2005 | | | 2004 | | | 2003 | | | 2002 | | | 2001 | |
| | |
|
|
|
Per share operating performance | | | | | | | | | | | | | | | | | | | | |
(for a share outstanding throughout the year) | | | | | | | | | | | | | | | | | | | | |
Net asset value, beginning of year | | $ | 15.80 | | | $ | 15.54 | | | $ | 13.67 | | | $ | 11.39 | | | $ | 11.53 | |
| | |
|
|
|
Income from investment operations: | | | | | | | | | | | | | | | | | | | | |
Net investment incomea | | | 0.57 | | | | 0.66 | | | | 0.69 | | | | 0.59 | | | | 0.59 | d |
Net realized and unrealized gains (losses) | | | (1.03 | ) | | | 1.37 | | | | 2.35 | | | | 1.83 | | | | (0.32 | )d |
| | |
|
|
|
Total from investment operations | | | (0.46 | ) | | | 2.03 | | | | 3.04 | | | | 2.42 | | | | .27 | |
| | |
|
|
|
Less distributions from net investment income | | | (0.98 | ) | | | (1.77 | ) | | | (1.17 | ) | | | (0.14 | ) | | | (0.41 | ) |
| | |
|
|
|
Redemption fees | | | — | c | | | — | | | | — | | | | — | | | | — | |
| | |
|
|
|
Net asset value, end of year | | $ | 14.36 | | | $ | 15.80 | | | $ | 15.54 | | | $ | 13.67 | | | $ | 11.39 | |
| | |
|
|
|
| | | | | |
Total returnb | | | (2.91)% | | | | 15.09% | | | | 22.72% | | | | 21.44% | | | | 2.55% | |
Ratios/supplemental data | | | | | | | | | | | | | | | | | | | | |
Net assets, end of year (000’s) | | $ | 53,115 | | | $ | 49,845 | | | $ | 52,842 | | | $ | 50,622 | | | $ | 63,781 | |
Ratios to average net assets: | | | | | | | | | | | | | | | | | | | | |
Expenses before expense reduction | | | 0.78% | | | | 0.79% | | | | 0.76% | | | | 0.73% | | | | 0.71% | |
Expenses net of expense reduction | | | 0.74% | | | | 0.78% | | | | 0.76% | | | | 0.73% | | | | 0.71% | |
Net investment income | | | 3.81% | | | | 4.40% | | | | 4.72% | | | | 4.88% | | | | 5.22% | d |
Portfolio turnover rate | | | 30.28% | | | | 37.39% | | | | 53.01% | | | | 27.91% | | | | 122.45% | |
| aBased | on average daily shares outstanding. |
| bTotal | return does not include any fees, charges or expenses imposed by the variable annuity and life insurance contracts for which the Franklin Templeton Variable Insurance Products Trust serves as an underlying investment vehicle. |
| cAmount | is less than $0.01 per share. |
| dEffective | January 1, 2001, the fund adopted the provisions of the AICPA Audit and Accounting Guide of Investment Companies and began amortizing all |
| premium | and discount on fixed-income securities, as required. The effect of this change was as follows: |
| | |
Net investment income (loss) per share | | $(0.059) |
Net realized and unrealized gains (losses) per share | | 0.059 |
Ratio of net investment income to average net assets | | (0.53)% |
See notes to financial statements.
TGI-9
Franklin Templeton Variable Insurance Products Trust
Financial Highlights (continued)
Templeton Global Income Securities Fund (continued)
| | | | | | | | | | | | | | | | | | | | |
| | | Year Ended December 31,
| |
| Class 2 | | 2005 | | | 2004 | | | 2003 | | | 2002 | | | 2001 | |
| | |
|
|
|
Per share operating performance | | | | | | | | | | | | | | | | | | | | |
(for a share outstanding throughout the year) | | | | | | | | | | | | | | | | | | | | |
Net asset value, beginning of year | | $ | 15.64 | | | $ | 15.42 | | | $ | 13.59 | | | $ | 11.33 | | | $ | 11.48 | |
| | |
|
|
|
Income from investment operations: | | | | | | | | | | | | | | | | | | | | |
Net investment incomea | | | 0.52 | | | | 0.60 | | | | 0.65 | | | | 0.54 | | | | 0.55 | d |
Net realized and unrealized gains (losses) | | | (1.00 | ) | | | 1.36 | | | | 2.33 | | | | 1.84 | | | | (0.31 | )d |
| | |
|
|
|
Total from investment operations | | | (0.48 | ) | | | 1.96 | | | | 2.98 | | | | 2.38 | | | | 0.24 | |
| | |
|
|
|
Less distributions from net investment income | | | (0.97 | ) | | | (1.74 | ) | | | (1.15 | ) | | | (0.12 | ) | | | (0.39 | ) |
| | |
|
|
|
Redemption fees | | | —c | | | | — | | | | — | | | | — | | | | — | |
| | |
|
|
|
Net asset value, end of year | | $ | 14.19 | | | $ | 15.64 | | | $ | 15.42 | | | $ | 13.59 | | | $ | 11.33 | |
| | |
|
|
|
| | | | | |
Total returnb | | | (3.08)% | | | | 14.74% | | | | 22.44% | | | | 21.15% | | | | 2.24% | |
Ratios/supplemental data | | | | | | | | | | | | | | | | | | | | |
Net assets, end of year (000’s) | | $ | 61,255 | | | $ | 19,779 | | | $ | 5,181 | | | $ | 2,119 | | | $ | 1,286 | |
Ratios to average net assets: | | | | | | | | | | | | | | | | | | | | |
Expenses before expense reduction | | | 1.03% | | | | 1.04% | | | | 1.01% | | | | 0.98% | | | | 0.96% | |
Expense net of expense reduction | | | 0.99% | | | | 1.03% | | | | 1.01% | | | | 0.98% | | | | 0.96% | |
Net investment income | | | 3.56% | | | | 4.15% | | | | 4.47% | | | | 4.63% | | | | 4.95% | d |
Portfolio turnover rate | | | 30.28% | | | | 37.39% | | | | 53.01% | | | | 27.91% | | | | 122.45% | |
| aBased | on average daily shares outstanding. |
| bTotal | return does not include any fees, charges or expenses imposed by the variable annuity and life insurance contracts for which the Franklin Templeton |
| Variable | Insurance Products Trust serves as an underlying investment vehicle |
| cAmount | is less than $0.01 per share. |
| dEffective | January 1, 2001, the fund adopted the provisions of the AICPA Audit and Accounting Guide of Investment Companies and began amortizing all |
| premium | and discount on fixed-income securities, as required. The effect of this change was as follows: |
| | |
Net investment income (loss) per share | | $(0.059) |
Net realized and unrealized gains (losses) per share | | 0.059 |
Ratio of net investment income to average net assets | | (0.53)% |
See notes to financial statements.
TGI-10
Franklin Templeton Variable Insurance Products Trust
Financial Highlights (continued)
Templeton Global Income Securities Fund (continued)
| | | | |
| | | Period Ended
December 31,
| |
| Class 3 | | 2005c | |
| | |
|
|
|
Per share operating performance | | | | |
(for a share outstanding throughout the period) | | | | |
Net asset value, beginning of period | | $ | 15.27 | |
| | |
|
|
|
Income from investment operations: | | | | |
Net investment incomea | | | 0.38 | |
Net realized and unrealized gains (losses) | | | (0.50 | ) |
| | |
|
|
|
Total from investment operations | | | (0.12 | ) |
| | |
|
|
|
Less distributions from net investment income | | | (0.97 | ) |
| | |
|
|
|
Redemption fees | | | —d | |
| | |
|
|
|
Net asset value, end of period | | $ | 14.18 | |
| | |
|
|
|
| |
Total returnb | | | (0.80)% | |
Ratios/supplemental data | | | | |
Net assets, end of period (000’s) | | $ | 5,769 | |
Ratios to average net assets: | | | | |
Expenses before expense reduction | | | 1.03%e | |
Expenses net of expense reduction | | | 0.99%e | |
Net investment income | | | 3.56%e | |
Portfolio turnover rate | | | 30.28% | |
| aBased | on average daily shares outstanding. |
| bTotal | return does not include any fees, charges or expenses imposed by the variable annuity and life insurance contracts for which the Franklin Templeton |
| Variable | Insurance Products Trust serves as an underlying investment vehicle. Total return is not annualized for periods less than one year. |
| cFor | the period April 1, 2005 (effective date) to December 31, 2005. |
| dAmount | is less than $0.01 per share. |
See notes to financial statements.
TGI-11
Franklin Templeton Variable Insurance Products Trust
Statement of Investments, December 31, 2005
| | | | | | |
| Templeton Global Income Securities Fund | | Principal
Amounta | | | Value |
Long Term Investments 83.3% | | | | | | |
Argentina 3.2% | | | | | | |
bGovernment of Argentina, FRN, 4.005%, 8/03/12 | | 4,997,000 | | | $ | �� 3,856,127 |
| | | | | |
|
|
Australia 2.8% | | | | | | |
New South Wales Treasury Corp., 8.00%, 3/01/08 | | 1,990,000 | AUD | | | 1,534,915 |
Queensland Treasury Corp., 6.00%, | | | | | | |
8/14/13 | | 2,200,000 | AUD | | | 1,676,523 |
10/14/15 | | 200,000 | AUD | | | 152,861 |
| | | | | |
|
|
| | | | | | | 3,364,299 |
| | | | | |
|
|
Austria 1.4% | | | | | | |
Government of Austria, | | | | | | |
5.50%, 10/20/07 | | 425,000 | EUR | | | 526,281 |
5.00%, 7/15/12 | | 850,000 | EUR | | | 1,114,237 |
| | | | | |
|
|
| | | | | | | 1,640,518 |
| | | | | |
|
|
Belgium 0.8% | | | | | | |
Government of Belgium, 7.50%, 7/29/08 | | 686,000 | EUR | | | 902,729 |
| | | | | |
|
|
Brazil 0.3% | | | | | | |
bGovernment of Brazil, FRN, 5.25%, 4/15/12 | | 349,477 | | | | 345,982 |
| | | | | |
|
|
Canada 5.2% | | | | | | |
Government of Canada, | | | | | | |
3.00%, 6/01/06 | | 3,470,000 | CAD | | | 2,978,205 |
5.75%, 9/01/06 | | 790,000 | CAD | | | 688,394 |
7.00%, 12/01/06 | | 750,000 | CAD | | | 663,259 |
Province of Alberta, 5.00%, 12/16/08 | | 170,000 | CAD | | | 150,296 |
Province of British Columbia, 5.25%, 12/01/06 | | 1,000,000 | CAD | | | 870,515 |
Province of Manitoba, 5.10%, 12/01/06 | | 1,090,000 | CAD | | | 948,290 |
| | | | | |
|
|
| | | | | | | 6,298,959 |
| | | | | |
|
|
Denmark 1.1% | | | | | | |
Government of Denmark, | | | | | | |
7.00%, 11/15/07 | | 1,450,000 | DKK | | | 247,169 |
5.00%, 11/15/13 | | 3,950,000 | DKK | | | 704,787 |
7.00%, 11/10/24 | | 1,300,000 | DKK | | | 304,027 |
| | | | | |
|
|
| | | | | | | 1,255,983 |
| | | | | |
|
|
Finland 1.3% | | | | | | |
Government of Finland, | | | | | | |
5.00%, 4/25/09 | | 660,000 | EUR | | | 831,152 |
5.375%, 7/04/13 | | 540,000 | EUR | | | 734,883 |
| | | | | |
|
|
| | | | | | | 1,566,035 |
| | | | | |
|
|
France 0.9% | | | | | | |
Government of France, 4.00%, 10/25/09 | | 845,000 | EUR | | | 1,036,908 |
| | | | | |
|
|
Germany 2.0% | | | | | | |
Government of Germany, 4.00%, 2/16/07 | | 110,000 | EUR | | | 132,008 |
KfW Bankengruppe, | | | | | | |
8.25%, 9/20/07 | | 36,000,000 | ISK | | | 568,857 |
senior note, 6.375%, 2/17/15 | | 2,530,000 | NZD | | | 1,728,296 |
| | | | | |
|
|
| | | | | | | 2,429,161 |
| | | | | |
|
|
TGI-12
Franklin Templeton Variable Insurance Products Trust
Statement of Investments, December 31, 2005 (continued)
| | | | | | |
| Templeton Global Income Securities Fund | | Principal
Amounta | | | Value |
Long Term Investments (cont.) | | | | | | |
Greece 1.0% | | | | | | |
Government of the Hellenic Republic, | | | | | | |
3.25%, 6/21/07 | | 270,000 | EUR | | $ | 321,334 |
4.60%, 5/20/13 | | 700,000 | EUR | | | 894,825 |
| | | | | |
|
|
| | | | | | | 1,216,159 |
| | | | | |
|
|
Iceland 1.1% | | | | | | |
Inter-American Development Bank, 9.00%, 1/04/07 | | 79,500,000 | ISK | | | 1,262,525 |
| | | | | |
|
|
Indonesia 6.3% | | | | | | |
Government of Indonesia, | | | | | | |
14.00%, 6/15/09 | | 13,407,000,000 | IDR | | | 1,393,891 |
13.15%, 3/15/10 | | 8,880,000,000 | IDR | | | 899,500 |
15.425%, 9/15/10 | | 450,000,000 | IDR | | | 49,192 |
10.00%, 10/15/11 | | 1,800,000,000 | IDR | | | 158,595 |
11.00%, 12/15/12 | | 450,000,000 | IDR | | | 40,728 |
14.25%, 6/15/13 | | 11,269,000,000 | IDR | | | 1,187,796 |
14.275%, 12/15/13 | | 21,167,000,000 | IDR | | | 2,239,052 |
11.00%, 10/15/14 | | 3,390,000,000 | IDR | | | 299,141 |
10.75%, 5/15/16 | | 3,300,000,000 | IDR | | | 280,023 |
10.00%, 7/15/17 | | 3,500,000,000 | IDR | | | 277,803 |
11.00%, 11/15/20 | | 9,600,000,000 | IDR | | | 793,734 |
| | | | | |
|
|
| | | | | | | 7,619,455 |
| | | | | |
|
|
Ireland 0.9% | | | | | | |
Government of Ireland, 5.00%, 4/18/13 | | 800,000 | EUR | | | 1,058,126 |
| | | | | |
|
|
Italy 0.0%c | | | | | | |
Government of Italy, 7.75%, 11/01/06 | | 41,293 | EUR | | | 50,894 |
| | | | | |
|
|
Malaysia 4.5% | | | | | | |
Government of Malaysia, | | | | | | |
6.90%, 3/15/07 | | 800,000 | MYR | | | 220,368 |
8.60%, 12/01/07 | | 4,270,000 | MYR | | | 1,237,390 |
3.135%, 12/17/07 | | 3,500,000 | MYR | | | 920,721 |
6.45%, 7/01/08 | | 4,600,000 | MYR | | | 1,302,897 |
4.305%, 2/27/09 | | 3,660,000 | MYR | | | 988,573 |
4.032%, 9/15/09 | | 1,850,000 | MYR | | | 497,084 |
3.644%, 8/25/10 | | 1,100,000 | MYR | | | 290,838 |
| | | | | |
|
|
| | | | | | | 5,457,871 |
| | | | | |
|
|
Mexico 0.5% | | | | | | |
dGovernment of Mexico, 144A, 7.50%, 3/08/10 | | 450,000 | EUR | | | 607,288 |
| | | | | |
|
|
Netherlands 0.6% | | | | | | |
Government of the Netherlands, | | | | | | |
3.00%, 7/15/06 | | 150,000 | EUR | | | 177,943 |
5.75%, 2/15/07 | | 488,000 | EUR | | | 596,368 |
| | | | | |
|
|
| | | | | | | 774,311 |
| | | | | |
|
|
New Zealand 2.5% | | | | | | |
Government of New Zealand, 7.00%, 7/15/09 | | 3,680,000 | NZD | | | 2,594,985 |
Inter-American Development Bank, 6.00%, 12/15/17 | | 575,000 | NZD | | | 381,689 |
| | | | | |
|
|
| | | | | | | 2,976,674 |
| | | | | |
|
|
Norway 5.9% | | | | | | |
Government of Norway, 6.75%, 1/15/07 | | 45,660,000 | NOK | | | 7,032,233 |
| | | | | |
|
|
TGI-13
Franklin Templeton Variable Insurance Products Trust
Statement of Investments, December 31, 2005 (continued)
| | | | | | |
| Templeton Global Income Securities Fund | | Principal Amounta | | | Value |
Long Term Investments (cont.) | | | | | | |
Peru 2.4% | | | | | | |
Government of Peru, | | | | | | |
8.60%, 8/12/17 | | 6,185,000 | PEN | | $ | 1,848,661 |
7.84%, 8/12/20 | | 3,730,000 | PEN | | | 1,044,367 |
| | | | | |
|
|
| | | | | | | 2,893,028 |
| | | | | |
|
|
Philippines 1.1% | | | | | | |
Government of the Philippines, | | | | | | |
9.00%, 2/15/13 | | 800,000 | | | | 889,000 |
Reg S, 9.125%, 2/22/10 | | 330,000 | EUR | | | 444,778 |
| | | | | |
|
|
| | | | | | | 1,333,778 |
| | | | | |
|
|
Poland 7.7% | | | | | | |
Government of Poland, | | | | | | |
8.50%, 11/12/06 | | 4,720,000 | PLN | | | 1,501,580 |
8.50%, 5/12/07 | | 5,990,000 | PLN | | | 1,938,839 |
6.00%, 5/24/09 | | 8,195,000 | PLN | | | 2,612,385 |
6.25%, 10/24/15 | | 3,690,000 | PLN | | | 1,235,358 |
5.75%, 9/23/22 | | 5,800,000 | PLN | | | 1,905,421 |
| | | | | |
|
|
| | | | | | | 9,193,583 |
| | | | | |
|
|
Singapore 4.8% | | | | | | |
Government of Singapore, | | | | | | |
1.75%, 2/01/07 | | 700,000 | SGD | | | 416,792 |
4.00%, 3/01/07 | | 7,160,000 | SGD | | | 4,386,762 |
2.625%, 10/01/07 | | 1,630,000 | SGD | | | 978,765 |
| | | | | |
|
|
| | | | | | | 5,782,319 |
| | | | | |
|
|
Slovak Republic 3.1% | | | | | | |
Government of Slovakia, | | | | | | |
4.95%, 3/05/08 | | 4,000,000 | SKK | | | 129,150 |
4.80%, 4/14/09 | | 33,500,000 | SKK | | | 1,092,063 |
4.90%, 2/05/10 | | 1,000,000 | SKK | | | 33,027 |
8.50%, 8/17/10 | | 30,000,000 | SKK | | | 1,134,028 |
7.50%, 3/13/12 | | 19,000,000 | SKK | | | 723,894 |
5.00%, 1/22/13 | | 6,000,000 | SKK | | | 204,754 |
4.90%, 2/11/14 | | 4,900,000 | SKK | | | 166,842 |
5.30%, 5/12/19 | | 6,700,000 | SKK | | | 240,580 |
| | | | | |
|
|
| | | | | | | 3,724,338 |
| | | | | |
|
|
South Africa 0.2% | | | | | | |
Government of South Africa, 5.25%, 5/16/13 | | 200,000 | EUR | | | 256,753 |
| | | | | |
|
|
South Korea 14.5% | | | | | | |
Government of Korea, | | | | | | |
6.90%, 1/16/07 | | 1,200,000,000 | KRW | | | 1,217,167 |
4.75%, 3/03/07 | | 5,740,000,000 | KRW | | | 5,694,251 |
3.75%, 9/10/07 | | 2,550,000,000 | KRW | | | 2,480,916 |
4.50%, 9/09/08 | | 1,945,000,000 | KRW | | | 1,903,667 |
4.00%, 6/10/10 | | 3,300,000,000 | KRW | | | 3,111,053 |
Korea Treasury Note, 4.75%, 3/12/08 | | 3,093,000,000 | KRW | | | 3,051,663 |
| | | | | |
|
|
| | | | | | | 17,458,717 |
| | | | | |
|
|
Spain 0.4% | | | | | | |
Government of Spain, 6.00%, 1/31/08 | | 390,000 | EUR | | | 489,327 |
| | | | | |
|
|
TGI-14
Franklin Templeton Variable Insurance Products Trust
Statement of Investments, December 31, 2005 (continued)
| | | | | | |
| Templeton Global Income Securities Fund | | Principal Amounta | | | Value |
Long Term Investments (cont.) | | | | | | |
Sweden 5.0% | | | | | | |
Government of Sweden, | | | | | | |
3.50%, 4/20/06 | | 2,100,000 | SEK | | $ | 265,596 |
8.00%, 8/15/07 | | 31,790,000 | SEK | | | 4,341,492 |
5.25%, 3/15/11 | | 3,900,000 | SEK | | | 539,879 |
5.50%, 10/08/12 | | 6,280,000 | SEK | | | 897,798 |
| | | | | |
|
|
| | | | | | | 6,044,765 |
| | | | | |
|
|
Thailand 1.5% | | | | | | |
Government of Thailand, | | | | | | |
8.00%, 12/08/06 | | 60,700,000 | THB | | | 1,534,479 |
4.125%, 2/12/08 | | 9,000,000 | THB | | | 216,054 |
8.50%, 12/08/08 | | 1,000,000 | THB | | | 26,633 |
| | | | | |
|
|
| | | | | | | 1,777,166 |
| | | | | |
|
|
United Kingdom 0.3% | | | | | | |
Government of United Kingdom, 7.50%, 12/07/06 | | 175,000 | GBP | | | 310,066 |
| | | | | |
|
|
Venezuela 0.0%c | | | | | | |
bGovernment of Venezuela, FRN, 5.194%, 4/20/11 | | 40,000 | | | | 39,250 |
| | | | | |
|
|
Total Long Term Investments (Cost $96,705,093) | | | | | | 100,055,327 |
| | | | | |
|
|
Short Term Investments 11.1% | | | | | | |
Austria 1.1% | | | | | | |
Government of Austria, 9.00%, 9/15/06 | | 85,000,000 | ISK | | | 1,347,646 |
| | | | | |
|
|
Canada 2.8% | | | | | | |
eCanada Treasury Bill, 11/30/06 | | 360,000 | CAD | | | 298,559 |
Province of Ontario, | | | | | | |
7.75%, 7/24/06 | | 1,600,000 | CAD | | | 1,406,659 |
3.50%, 9/08/06 | | 1,920,000 | CAD | | | 1,649,155 |
| | | | | |
|
|
| | | | | | | 3,354,373 |
| | | | | |
|
|
Egypt 1.7% | | | | | | |
eEgypt Treasury Bills, 5/30/06 - 12/05/06 | | 12,200,000 | EGP | | | 2,028,602 |
| | | | | |
|
|
Norway 0.3% | | | | | | |
eNorway Treasury Bill, 3/15/06 | | 2,400,000 | NOK | | | 354,113 |
| | | | | |
|
|
Sweden 1.1% | | | | | | |
eGovernment of Sweden, Strip, 9/20/06 | | 8,450,000 | SEK | | | 1,046,457 |
eSweden Treasury Bill, 12/20/06 | | 2,000,000 | SEK | | | 246,253 |
| | | | | |
|
|
| | | | | | | 1,292,710 |
| | | | | |
|
|
Thailand 4.1% | | | | | | |
eBank of Thailand Bond, Strip, 4/07/06 | | 8,400,000 | THB | | | 202,841 |
eThailand Treasury Bills, 4/17/06 - 11/30/06 | | 202,250,000 | THB | | | 4,793,203 |
| | | | | |
|
|
| | | | | | | 4,996,044 |
| | | | | |
|
|
Total Short Term Investments (Cost $13,508,452) | | | | | | 13,373,488 |
| | | | | |
|
|
Total Investments (Cost $110,213,545) 94.4% | | | | | | 113,428,815 |
Net Unrealized Gain on Forward Exchange Contracts 0.00%c | | | | | | 47,200 |
Other Assets, less Liabilities 5.6% | | | | | | 6,663,006 |
| | | | | |
|
|
Net Assets 100.0% | | | | | $ | 120,139,021 |
| | | | | |
|
|
TGI-15
Franklin Templeton Variable Insurance Products Trust
Statement of Investments, December 31, 2005 (continued)
| | | | |
| Templeton Global Income Securities Fund | | | | |
Currency Abbreviations
AUD - Australian Dollar
CAD - Canadian Dollar
DKK - Danish Krone
EUR - Euro
EGP - Egyptian Pound
GBP - British Pound
IDR - Indonesian Rupiah
ISK - Iceland Krona
KRW - South Korean Won
MYR - Malaysian Ringgit
NOK - Norwegian Krone
NZD - New Zealand Dollar
PEN - Peruvian Nuevo Sol
PLN - Polish Zloty
SEK - Swedish Krona
SGD - Singapore Dollar
SKK - Slovak Koruna
THB - Thai Baht
Selected Portfolio Abbreviations
FRN - Floating Rate Note
aThe principal amount is stated in U.S. dollars unless otherwise indicated.
bThe coupon rate shown represents the rate at period end.
cRounds to less than 0.05% of net assets.
dSecurity was purchased pursuant to Rule 144A under the Securities Act of 1933 and may be sold in transactions exempt from registration only to qualified institutional buyers or in a public offering registered under the Securities Act of 1933. These securities have been deemed liquid under the guidelines approved by the Fund’s Board of Trustees. At December 31, 2005, the value of these securities was $607,288, representing 0.50% of net assets.
eThe security is traded on a discount basis with no stated coupon rate.
TGI-16
Franklin Templeton Variable Insurance Products Trust
Financial Statements
Statement of Assets and Liabilities
December 31, 2005
| | | | |
| | | Templeton
Global Income
Securities Fund
| |
Assets: | | | | |
Investments in securities: | | | | |
Cost | | $ | 110,213,545 | |
| | |
|
|
|
Value | | $ | 113,428,815 | |
Cash | | | 7,304,362 | |
Receivables: | | | | |
Investment securities sold | | | 305,457 | |
Capital shares sold | | | 280,021 | |
Interest | | | 2,300,302 | |
Unrealized gain on forward exchange contracts (Note 7) | | | 47,200 | |
| | |
|
|
|
Total assets | | | 123,666,157 | |
| | |
|
|
|
Liabilities: | | | | |
Payables: | | | | |
Investment securities purchased | | | 3,140,446 | |
Capital shares redeemed | | | 19,099 | |
Affiliates | | | 89,078 | |
Foreign cash advanced by custodian (cost $241,634) | | | 242,015 | |
Accrued expenses and other liabilities | | | 36,498 | |
| | |
|
|
|
Total liabilities | | | 3,527,136 | |
| | |
|
|
|
Net assets, at value | | $ | 120,139,021 | |
| | |
|
|
|
Net assets consist of: | | | | |
Paid-in capital | | $ | 120,192,222 | |
Undistributed net investment income | | | 4,412,581 | |
Net unrealized appreciation (depreciation) | | | 3,228,119 | |
Accumulated net realized gain (loss) | | | (7,693,901 | ) |
| | |
|
|
|
Net assets, at value | | $ | 120,139,021 | |
| | |
|
|
|
Class 1: | | | | |
Net assets, at value | | $ | 53,114,950 | |
| | |
|
|
|
Shares outstanding | | | 3,697,861 | |
| | |
|
|
|
Net asset value and offering price per share | | | $14.36 | |
| | |
|
|
|
Class 2: | | | | |
Net assets, at value | | $ | 61,254,919 | |
| | |
|
|
|
Shares outstanding | | | 4,317,803 | |
| | |
|
|
|
Net asset value and offering price per share | | | $14.19 | |
| | |
|
|
|
Class 3: | | | | |
Net assets, at value | | $ | 5,769,152 | |
| | |
|
|
|
Shares outstanding | | | 406,720 | |
| | |
|
|
|
Net asset value and offering price per sharea | | | $14.18 | |
| | |
|
|
|
a Redemption price is equal to net asset value less any redemption fees retained by the Fund.
See notes to financial statements.
TGI-17
Franklin Templeton Variable Insurance Products Trust
Financial Statements (continued)
Statement of Operations
for the year ended December 31, 2005
| | | | |
| | | Templeton
Global Income
Securities Fund
| |
Investment income: | | | | |
Interest (net of foreign taxes $132,073) | | | 4,043,929 | |
| | |
|
|
|
Expenses: | | | | |
Management fees (Note 3a) | | | 548,337 | |
Distribution fees: (Note 3c) | | | | |
Class 2 | | | 91,555 | |
Class 3 | | | 4,377 | |
Unaffiliated transfer agent fees | | | 853 | |
Custodian fees (Note 4) | | | 67,698 | |
Reports to shareholders | | | 53,577 | |
Professional fees | | | 19,388 | |
Trustees’ fees and expenses | | | 431 | |
Other | | | 6,662 | |
| | |
|
|
|
Total expenses | | | 792,878 | |
Expense reductions (Note 4) | | | (41,008 | ) |
| | |
|
|
|
Net expenses | | | 751,870 | |
| | |
|
|
|
Net investment income | | | 3,292,059 | |
| | |
|
|
|
Realized and unrealized gains (losses): | | | | |
Net realized gain (loss) from: | | | | |
Investments | | | 3,944,766 | |
Foreign currency transactions | | | (45,206 | ) |
| | |
|
|
|
Net realized gain (loss) | | | 3,899,560 | |
| | |
|
|
|
Net change in unrealized appreciation (depreciation) on: | | | | |
Investments | | | (9,094,628 | ) |
Translation of assets and liabilities denominated in foreign currencies | | | (131,822 | ) |
| | |
|
|
|
Net change in unrealized appreciation (depreciation) | | | (9,226,450 | ) |
| | |
|
|
|
Net realized and unrealized gain (loss) | | | (5,326,890 | ) |
| | |
|
|
|
Net increase (decrease) in net assets resulting from operations | | $ | (2,034,831 | ) |
| | |
|
|
|
See notes to financial statements.
TGI-18
Franklin Templeton Variable Insurance Products Trust
Financial Statements (continued)
Statements of Changes in Net Assets
| | | | | | | | |
| | | Templeton Global Income
Securities Fund
| |
| | | Year Ended December 31,
| |
| | | 2005 | | | 2004 | |
| | |
| |
Increase (decrease) in net assets: | | | | | | | | |
Operations: | | | | | | | | |
Net investment income | | $ | 3,292,059 | | | $ | 2,517,578 | |
Net realized gain (loss) from investments and foreign currency transactions | | | 3,899,560 | | | | 3,274,668 | |
Net change in unrealized appreciation (depreciation) on investments and translation of assets and liabilities denominated in foreign currencies | | | (9,226,450 | ) | | | 2,897,782 | |
| | |
| |
Net increase (decrease) in net assets resulting from operations | | | (2,034,831 | ) | | | 8,690,028 | |
| | |
| |
Distributions to shareholders from: | | | | | | | | |
Net investment income: | | | | | | | | |
Class 1 | | | (3,016,853 | ) | | | (5,364,377 | ) |
Class 2 | | | (2,073,846 | ) | | | (706,986 | ) |
Class 3 | | | (32,207 | ) | | | — | |
| | |
| |
Total distributions to shareholders | | | (5,122,906 | ) | | | (6,071,363 | ) |
| | |
| |
Capital share transactions: (Note 2) | | | | | | | | |
Class 1 | | | 7,710,594 | | | | (4,352,338 | ) |
Class 2 | | | 44,184,638 | | | | 13,335,159 | |
Class 3 | | | 5,777,317 | | | | — | |
| | |
| |
Total capital share transactions | | | 57,672,549 | | | | 8,982,821 | |
| | |
| |
Redemption fees | | | 36 | | | | — | |
| | |
| |
Net increase (decrease) in net assets | | | 50,514,848 | | | | 11,601,486 | |
Net assets: | | | | | | | | |
Beginning of year | | | 69,624,173 | | | | 58,022,687 | |
| | |
| |
End of year | | $ | 120,139,021 | | | $ | 69,624,173 | |
| | |
| |
Undistributed net investment income included in net assets: | | | | | | | | |
End of year | | $ | 4,412,581 | | | $ | 3,781,771 | |
| | |
| |
See notes to financial statements.
TGI-19
Franklin Templeton Variable Insurance Products Trust
Notes to Financial Statements
Templeton Global Income Securities Fund
1. ORGANIZATION AND SIGNIFICANT ACCOUNTING POLICIES
Franklin Templeton Variable Insurance Products Trust (the Trust) is registered under the Investment Company Act of 1940 as an open-end investment company, consisting of twenty-two separate series. The Templeton Global Income Securities Fund (the Fund) included in this report is non-diversified. The financial statements of the remaining funds in the series are presented separately. Shares of the Fund are sold only to insurance company separate accounts to fund the benefits of variable life insurance policies or variable annuity contracts.
The following summarizes the Fund’s significant accounting policies.
a. Security Valuation
Securities listed on a securities exchange or on the NASDAQ National Market System are valued at the last quoted sale price or the official closing price of the day, respectively. Over-the-counter securities and listed securities for which there is no reported sale are valued within the range of the most recent quoted bid and ask prices. Securities that trade in multiple markets or on multiple exchanges are valued according to the broadest and most representative market.
Corporate debt securities and government securities generally trade in the over-the-counter market rather than on a securities exchange. The Trust may utilize independent pricing services, quotations from bond dealers, and information with respect to bond and note transactions, to assist in determining a current market value for each security. The Trust’s pricing services may use valuation models or matrix pricing which considers information with respect to comparable bond and note transactions, quotations from bond dealers, or by reference to other securities that are considered comparable in such characteristics as rating, interest rate and maturity date, option adjusted spread models, prepayment projections, interest rate spreads and yield curves, to determine current value.
Foreign securities are valued as of the close of trading on the foreign stock exchange on which the security is primarily traded, or the NYSE, whichever is earlier. If no sale is reported at that time, the foreign security will be valued within the range of the most recent quoted bid and ask prices. The value is then converted into its U.S. dollar equivalent at the foreign exchange rate in effect at the close of the NYSE on the day that the value of the foreign security is determined.
The Trust has procedures to determine the fair value of individual securities and other assets for which market prices are not readily available or which may not be reliably priced. Methods for valuing these securities may include: fundamental analysis, matrix pricing, discounts from market prices of similar securities, or discounts applied due to the nature and duration of restrictions on the disposition of the securities. Due to the inherent uncertainty of valuations of such securities, the fair values may differ significantly from the values that would have been used had a ready market for such investments existed. Occasionally, events occur between the time at which trading in a security is completed and the close of the NYSE that might call into question the availability (including the reliability) of the value of a portfolio security held by the Fund. If such an event occurs, the securities may be valued using fair value procedures, which may include the use of independent pricing services. All security valuation procedures are approved by the Trust’s Board of Trustees.
b. Foreign Currency Translation
Portfolio securities and other assets and liabilities denominated in foreign currencies are translated into U.S. dollars based on the exchange rate of such currencies against U.S. dollars on the date of valuation. Purchases and sales of securities, income and expense items denominated in foreign currencies are translated into U.S. dollars at the exchange rate in effect on the transaction date. Occasionally, events may impact the availability or reliability of foreign exchange rates used to convert the U.S. dollar equivalent value. If such an event occurs, the foreign exchange rate will be valued at fair value using procedures established and approved by the Trust’s Board of Trustees.
The Fund does not separately report the effect of changes in foreign exchange rates from changes in market prices on securities held. Such changes are included in net realized and unrealized gain or loss from investments on the Statement of Operations.
TGI-20
Franklin Templeton Variable Insurance Products Trust
Notes to Financial Statements (continued)
Templeton Global Income Securities Fund
1. ORGANIZATION AND SIGNIFICANT ACCOUNTING POLICIES (continued)
Realized foreign exchange gains or losses arise from sales of foreign currencies, currency gains or losses realized between the trade and settlement dates on securities transactions and the difference between the recorded amounts of dividends, interest, and foreign withholding taxes and the U.S. dollar equivalent of the amounts actually received or paid. Net unrealized foreign exchange gains and losses arise from changes in foreign exchange rates on foreign denominated assets and liabilities other than investments in securities held at the end of the reporting period.
c. Foreign Currency Contracts
The Fund may enter into forward exchange contracts to hedge against fluctuations in foreign exchange rates. A forward exchange contract is an agreement between two parties to exchange different currencies at an agreed upon exchange rate at a future date. These contracts are valued daily by the Fund and the net unrealized gain or loss on the contracts, as measured by the difference between the contractual forward foreign exchange rates and the forward rates at the reporting date, is included in the Statement of Assets and Liabilities. Realized and unrealized gains and losses on these contracts are included in the Statement of Operations.
When the Fund purchases or sells foreign securities it may enter into foreign exchange contracts to minimize foreign exchange risk from the trade date to the settlement date of the transactions. Realized and unrealized gains and losses on these contracts are included in the Statement of Operations.
The risks of these contracts include movement in the values of the foreign currencies relative to the U.S. dollar and the possible inability of the counterparties to fulfill their obligations under the contracts, which may be in excess of the amount reflected in the Statement of Assets and Liabilities.
d. Income Taxes
No provision has been made for U.S. income taxes because the Fund’s policy is to continue to qualify as a regulated investment company under the Internal Revenue Code and to distribute to shareholders substantially all of its taxable income and net realized gains.
Foreign securities held by the Fund may be subject to foreign taxation. Foreign taxes, if any, are recorded based on the tax regulations and rates that exist in the foreign markets in which the Fund invests.
e. Security Transactions, Investment Income, Expenses and Distributions
Security transactions are accounted for on trade date. Realized gains and losses on security transactions are determined on a specific identification basis. Interest income and estimated expenses are accrued daily. Amortization of premium and accretion of discount on debt securities are included in interest income. Distributions to shareholders are recorded on the ex-dividend date and are determined according to income tax regulations (tax basis). Such distributions are reinvested in additional shares of the Fund. Distributable earnings determined on a tax basis may differ from earnings recorded in accordance with generally
accepted accounting principles. These differences may be permanent or temporary. Permanent differences are reclassified among capital accounts to reflect their tax character. These reclassifications have no impact on net assets or the results of operations. Temporary differences are not reclassified, as they may reverse in subsequent periods.
Common expenses incurred by the Trust are allocated among the funds based on the ratio of net assets of each Fund to the combined net assets of the Trust. Fund specific expenses are charged directly to the fund that incurred the expense.
Realized and unrealized gains and losses and net investment income, other than class specific expenses, are allocated daily to each class of shares based upon the relative proportion of net assets of each class.
TGI-21
Franklin Templeton Variable Insurance Products Trust
Notes to Financial Statements (continued)
Templeton Global Income Securities Fund
1. ORGANIZATION AND SIGNIFICANT ACCOUNTING POLICIES (continued)
f. Accounting Estimates
The preparation of financial statements in accordance with accounting principles generally accepted in the United States of America requires management to make estimates and assumptions that affect the reported amounts of assets and liabilities at the date of the financial statements and the amounts of income and expenses during the reporting period. Actual results could differ from those estimates.
g. Redemption Fees
Redemptions and exchanges of Class 3 shares held 60 days or less may be subject to the Fund’s redemption fee, which is 1% of the amount redeemed. Such fees are retained by the Fund and accounted for as an addition to paid-in capital.
h. Guarantees and Indemnifications
Under the Trust’s organizational documents, its officers and trustees are indemnified by the Trust against certain liabilities arising out of the performance of their duties to the Trust. Additionally, in the normal course of business, the Trust enters into contracts with service providers that contain general indemnification clauses. The Trust’s maximum exposure under these arrangements is unknown as this would involve future claims that may be made against the Trust that have not yet occurred. However, based on experience, the Trust expects the risk of loss to be remote.
2. SHARES OF BENEFICIAL INTEREST
The Fund offers three classes of shares: Class 1, Class 2, and Class 3. Effective April 1, 2005, the Fund began offering a new class of shares, Class 3. Each class of shares differs by its distribution fees, voting rights on matters affecting a single class and its exchange privilege.
At December 31, 2005, there were an unlimited number of shares authorized ($0.01 par value). Transactions in the Fund’s shares were as follows:
| | | | | | | | | | | | | | |
| | | Year Ended December 31,
| |
| | | 2005
| | | 2004
| |
| Class 1 Shares: | | Shares
| | | Amount
| | | Shares
| | | Amount
| |
Shares sold | | 1,067,253 | | | $ | 15,508,065 | | | 142,426 | | | $ | 2,100,636 | |
Shares issued in reinvestment of distributions | | 210,969 | | | | 3,016,853 | | | 400,626 | | | | 5,364,377 | |
Shares redeemed | | (735,231 | ) | | | (10,814,324 | ) | | (788,314 | ) | | | (11,817,351 | ) |
| | |
| |
Net increase (decrease) | | 542,991 | | | $ | 7,710,594 | | | (245,262 | ) | | $ | (4,352,338 | ) |
| | |
| |
| Class 2 Shares: | | | | | | | | | | | | |
Shares sold | | 3,017,652 | | | $ | 43,735,355 | | | 973,769 | | | $ | 14,111,268 | |
Shares issued in reinvestment of distributions | | 146,665 | | | | 2,073,846 | | | 53,237 | | | | 706,986 | |
Shares redeemed | | (110,837 | ) | | | (1,624,563 | ) | | (98,666 | ) | | | (1,483,095 | ) |
| | |
| |
Net increase (decrease) | | 3,053,480 | | | $ | 44,184,638 | | | 928,340 | | | $ | 13,335,159 | |
| | |
| |
| Class 3 Shares: | | | | | | | | | | | | |
Shares sold | | 427,371 | | | $ | 6,068,634 | | | | | | | | |
Shares issued in reinvestment of distributions | | 2,233 | | | | 31,575 | | | | | | | | |
Shares redeemed | | (22,884 | ) | | | (322,892 | ) | | | | | | | |
| | |
| | | | | | | |
Net increase (decrease) | | 406,720 | | | $ | 5,777,317 | | | | | | | | |
| | |
| | | | | | | |
TGI-22
Franklin Templeton Variable Insurance Products Trust
Notes to Financial Statements (continued)
Templeton Global Income Securities Fund
3. TRANSACTIONS WITH AFFILIATES
Franklin Resources, Inc. is the holding company for various subsidiaries that together are referred to as Franklin Templeton Investments. Certain officers and trustees of the Trust are also officers and/or directors of the following subsidiaries:
| | |
| Subsidiary | | Affiliation |
Franklin Advisers, Inc. (Advisers) | | Investment manager |
Franklin Templeton Services, LLC (FT Services) | | Administrative manager |
Franklin Templeton Distributors, Inc. (Distributors) | | Principal underwriter |
Franklin Templeton Investor Services, LLC (Investor Services) | | Transfer agent |
a. Management Fees
The Fund pays an investment management fee to Advisers based on the average daily net assets of the Fund as follows:
| | |
| Annualized Fee Rate | | Net Assets |
| 0.625% | | Up to and including $100 million |
| 0.500% | | Over $100 million, up to and including $250 million |
| 0.450% | | Over $250 million, up to and including $10 billion |
| 0.440% | | Over $10 billion, up to and including $12.5 billion |
| 0.420% | | Over $12.5 billion, up to and including $15 billion |
| 0.400% | | In excess of $15 billion |
b. Administrative Fees
Under an agreement with Advisers, FT Services provides administrative services to the Fund. The fee is paid by Advisers based on average daily net assets, and is not an additional expense of the Fund.
c. Distribution Fees
The Fund’s Board of Trustees has adopted distribution plans for Class 2 and Class 3 shares pursuant to Rule 12b-1 under the 1940 Act. Under the Fund’s compensation distribution plans, the Fund pays Distributors for costs incurred in connection with the sale and distribution of the Fund’s shares up to 0.35% per year of its average daily net assets of each class. The Board of Trustees has set the current rate at 0.25% per year.
d. Transfer Agent Fees
Investor Services, under terms of an agreement, performs shareholder servicing for the Fund and is not paid by the Fund for the services.
4. EXPENSE OFFSET ARRANGEMENT
The Fund has entered into an arrangement with its custodian whereby credits realized as a result of uninvested cash balances are used to reduce a portion of the Fund’s custodian expenses. During the year ended December 31, 2005, the custodian fees were reduced as noted in the Statement of Operations.
TGI-23
Franklin Templeton Variable Insurance Products Trust
Notes to Financial Statements (continued)
Templeton Global Income Securities Fund
5. INCOME TAXES
At December 31, 2005, the Fund had tax basis capital losses which may be carried over to offset future capital gains, if any. During the year ended December 31, 2005, the Fund utilized $1,437,903 of capital loss carryforwards. At December 31, 2005, the capital loss carryforwards were as follows:
| | | |
Capital loss carryforwards expiring in: | | | |
2007 | | $ | 3,445,173 |
2008 | | | 2,370,518 |
2009 | | | 1,649,033 |
2010 | | | 177,731 |
| | |
|
| | | $ | 7,642,455 |
| | |
|
The tax character of distributions paid during the years ended December 31, 2005 and 2004, was as follows:
| | | | | | |
| | | 2005
| | 2004
|
Distributions paid from ordinary income | | $ | 5,122,906 | | $ | 6,071,363 |
| | |
|
|
At December 31, 2005, the cost of investments, net unrealized appreciation (depreciation) and undistributed ordinary income for income tax purposes were as follows:
| | | | |
Cost of investments | | $ | 111,555,785 | |
| | |
|
|
|
| |
Unrealized appreciation | | $ | 5,344,640 | |
Unrealized depreciation | | | (3,471,610 | ) |
| | |
|
|
|
Net unrealized appreciation (depreciation) | | $ | 1,873,030 | |
| | |
|
|
|
Distributable earnings - undistributed ordinary income | | $ | 5,703,378 | |
| | |
|
|
|
Net investment income differs for financial statement and tax purposes primarily due to differing treatments of foreign currency transactions, and bond discounts and premiums.
Net realized gains (losses) differ for financial statement and tax purposes primarily due to differing treatments of wash sales, foreign currency transactions, and bond discounts and premiums.
6. INVESTMENT TRANSACTIONS
Purchases and sales of investments (excluding short term securities) for the year ended December 31, 2005, aggregated $70,626,734 and $24,837,116, respectively.
TGI-24
Franklin Templeton Variable Insurance Products Trust
Notes to Financial Statements (continued)
Templeton Global Income Securities Fund
7. FORWARD EXCHANGE CONTRACTS
At December 31, 2005, the Fund had outstanding forward exchange contracts as set out below.
| | | | | | | | | |
Contracts to Buy | | Contract
Amounta | | | Settlement
Date | | Unrealized
Gain (Loss) |
| 25,000,000 | | Indian Rupee | | 811,530 | NZD | | 6/21/06 | | $ 6,674 |
| 11,600,000 | | Thai Baht | | 407,991 | NZD | | 11/30/06 | | 10,558 |
| 11,600,000 | | Thai Baht | | 406,554 | NZD | | 12/06/06 | | 11,611 |
| 295,000,000 | | South Korean Won | | 413,015 | NZD | | 12/06/06 | | 18,357 |
| | | | |
|
| | | |
|
| | | | | 2,039,090 | NZD | | | | 47,200 |
| | | | |
|
| | | |
|
| Net unrealized gain (loss) on forward exchange contracts | | | | | | | $47,200 |
| | | | | | | | | |
|
| a | In U.S. dollars unless otherwise indicated. |
Currency Abbreviations
8. CREDIT RISK
The Fund has 14.18% of its portfolio invested in below investment grade and comparable quality unrated high yield securities, which tend to be more sensitive to economic conditions than higher rated securities. The risk of loss due to default by the issuer may be significantly greater for the holders of high yielding securities because such securities are generally unsecured and are often subordinated to other creditors of the issuer.
9. CONCENTRATION OF RISK
Investing in foreign securities may include certain risks and considerations not typically associated with investing in U.S. securities, such as fluctuating currency values and changing local and regional economic, political and social conditions, which may result in greater market volatility. In addition, certain foreign securities may not be as liquid as U.S. securities.
10. REGULATORY MATTERS
As part of various investigations by a number of federal, state, and foreign regulators and governmental entities, relating to certain practices in the mutual fund industry, including late trading, market timing and marketing support payments to securities dealers who sell fund shares, Franklin Resources, Inc. and certain of its subsidiaries (collectively, the “Company”), entered into settlements with certain of those regulators.
Specifically, the Company entered into settlements with the Securities and Exchange Commission (“SEC”) concerning market timing (the “August 2, 2004 SEC Order”) and marketing support payments to securities dealers who sell fund shares (the “December 13, 2004 SEC Order”) and with the California Attorney General’s Office (“CAGO”) concerning marketing support payments to securities dealers who sell fund shares (the “CAGO Settlement”). Under the terms of the settlements with the SEC and the CAGO, the Company retained an Independent Distribution Consultant (“IDC”) to develop a plan for distribution of the respective settlement monies. The CAGO approved the distribution plan under the CAGO Settlement and, in accordance with the terms and conditions of that settlement, the monies were disbursed to the relevant funds. The SEC has not yet approved the distribution plan pertaining to the December 13, 2004 SEC Order. When approved, disbursements of settlement monies will be made promptly to the relevant funds, in accordance with the terms and conditions of that order. The IDC continues to develop the plan of distribution under the August 2, 2004 SEC Order that resolved the SEC’s market timing investigation.
In addition, the Company, as well as most of the mutual funds within Franklin Templeton Investments and certain current or former officers, directors, and/or employees, have been named in private lawsuits (styled as shareholder class actions, or as
TGI-25
Franklin Templeton Variable Insurance Products Trust
Notes to Financial Statements (continued)
Templeton Global Income Securities Fund
derivative actions on behalf of either the named funds or Franklin Resources, Inc.) relating to the industry practices referenced above, as well as to allegedly excessive advisory fees, commissions, and/or 12b-1 fees. The lawsuits were filed in different courts throughout the country. Many of those suits are now pending in a multi-district litigation in the United States District Court for the District of Maryland.
The Company and fund management strongly believe that the claims made in each of the private lawsuits referenced above are without merit and intend to defend against them vigorously. The Company cannot predict with certainty the eventual outcome of these lawsuits, nor whether they will have a material negative impact on the Company. If it is determined that the Company bears responsibility for any unlawful or inappropriate conduct that caused losses to the Trust, it is committed to making the Trust or their shareholders whole, as appropriate.
TGI-26
Franklin Templeton Variable Insurance Products Trust
Templeton Global Income Securities Fund
Report of Independent Registered Public Accounting Firm
To the Board of Trustees and Shareholders of
Franklin Templeton Variable Insurance Products Trust
In our opinion, the accompanying statement of assets and liabilities, including the statement of investments, and the related statements of operations and of changes in net assets and the financial highlights present fairly, in all material respects, the financial position of Templeton Global Income Securities Fund (one of the funds constituting Franklin Templeton Variable Insurance Products Trust, hereafter referred to as the “Fund”) at December 31, 2005, the results of its operations for the year then ended, the changes in its net assets for each of the two years in the period then ended and the financial highlights for each of the five years in the period then ended, in conformity with accounting principles generally accepted in the United States of America. These financial statements and financial highlights (hereafter referred to as “financial statements”) are the responsibility of the Fund’s management; our responsibility is to express an opinion on these financial statements based on our audits. We conducted our audits of these financial statements in accordance with the standards of the Public Company Accounting Oversight Board (United States). Those standards require that we plan and perform the audit to obtain reasonable assurance about whether the financial statements are free of material misstatement. An audit includes examining, on a test basis, evidence supporting the amounts and disclosures in the financial statements, assessing the accounting principles used and significant estimates made by management, and evaluating the overall financial statement presentation. We believe that our audits, which included confirmation of securities at December 31, 2005, by correspondence with the custodian and brokers, provide a reasonable basis for our opinion.
PricewaterhouseCoopers LLP
San Francisco, California
February 10, 2006
TGI-27
Franklin Templeton Variable Insurance Products Trust
Tax Designation (unaudited)
Templeton Global Income Securities Fund
At December 31, 2005, more than 50% of the Fund’s total assets were invested in securities of foreign issuers. In most instances, foreign taxes were withheld from dividends paid to the Fund on these investments. The Fund elects to treat foreign taxes paid as allowed under Section 853 of the Internal Revenue Code. This election will allow shareholders of record in June 2006, to treat their proportionate share of foreign taxes paid by the Fund as having been paid directly by them. The shareholder shall consider these amounts as foreign taxes paid in the tax year in which they receive the Fund distribution.
The foreign tax information will be disclosed in the June 30, 2006, semi-annual report of the Fund.
TGI-28
INDEX DESCRIPTIONS
The indexes are unmanaged and include reinvested distributions.
Consumer Price Index (CPI), calculated by the U.S. Bureau of Labor Statistics, is a commonly used measure of the inflation rate.
CSFB High Yield Index is designed to mirror the investible universe of the U.S. dollar-denominated high yield debt market.
Dow Jones Industrial Average (the Dow) is price weighted based on the average market price of 30 blue chip stocks of companies that are generally industry leaders.
Dow Jones Wilshire Real Estate Securities Index is a broad measure of the performance of publicly traded real estate securities, such as real estate investment trusts and real estate operating companies. The index is capitalization weighted and rebalanced monthly, and returns are calculated on a buy-and-hold basis.
J.P. Morgan (JPM) Emerging Markets Bond Index (EMBI) Global tracks total returns for U.S. dollar-denominated debt instruments issued by emerging market sovereign and quasi-sovereign entities: Brady bonds, loans and Eurobonds.
J.P. Morgan (JPM) Euro Emerging Markets Bond Index (EMBI) Global tracks total returns for euro-denominated, straight fixed coupon instruments issued by emerging market sovereign and quasi-sovereign entities.
J.P. Morgan (JPM) Global Government Bond Index (GGBI) tracks total returns for liquid, fixed-rate, domestic government bonds with maturities greater than one year issued by developed countries globally.
Lehman Brothers (LB) U.S. Aggregate Index represents securities that are SEC-registered, taxable and dollar denominated. The index covers the U.S. investment grade fixed-rate bond market, with index components for government and corporate securities, mortgage pass-through securities and asset-backed securities. All issues included must have at least one year to final maturity and must be rated investment grade (Baa3 or better) by Moody’s Investors Service. They must also be dollar denominated and nonconvertible. Total return includes price appreciation/depreciation and income as a percentage of the original investment. The index is rebalanced monthly by market capitalization.
Lehman Brothers (LB) U.S. Government: Intermediate Index is the intermediate component of the LB U.S. Government Index. The index includes securities issued by the U.S. government or its agencies. These include public obligations of the U.S. Treasury with remaining maturity of one year or more and publicly issued debt of U.S. government agencies, quasi-federal corporations, and corporate or foreign debt guaranteed by the U.S. government.
Lehman Brothers (LB) U.S. High Yield Index covers the universe of fixed rate, non-investment-grade debt. The index includes both corporate and non-corporate sectors.
I-1
Lipper Multi-Sector Income Funds Classification Average is calculated by averaging the total returns of all funds within the Lipper Multi-Sector Income Funds classification in the Lipper Open-End underlying funds universe. Lipper Multi-Sector Income Funds are defined as funds that seek current income by allocating assets among different fixed income securities sectors (not primarily in one sector except for defensive purposes), including U.S. and foreign governments, with a significant portion rated below investment grade. For the 12-month period ended 12/31/05, there were 113 funds in this category. Lipper calculations do not include sales charges, but include reinvestment of any income or distributions. Fund performance relative to the average may have differed if these and other factors had been considered.
Lipper VIP Equity Income Funds Classification Average is an equally weighted average calculation of performance figures for all funds within the Lipper Equity Income Funds classification in the Lipper VIP underlying funds universe. Lipper Equity Income Funds seek relatively high current income and growth of income through investing 60% or more of their portfolios in equities. For the 12-month period ended 12/31/05, there were 62 funds in this category. Lipper calculations do not include contract fees, expenses or sales charges, and may have been different if such charges had been considered.
Lipper VIP General U.S. Government Funds Classification Average is an equally weighted average calculation of performance figures for all funds within the Lipper U.S. Government Funds classification in the Lipper VIP underlying funds universe. Lipper U.S. Government Funds invest primarily in U.S. government and agency issues. For the 12-month period ended 12/31/05, there were 59 funds in this category. Lipper calculations do not include contract fees, expenses or sales charges, and may have been different if such charges had been considered.
Lipper VIP High Current Yield Funds Classification Average is an equally weighted average calculation of performance figures for all funds within the Lipper U.S. High Current Yield Funds classification in the Lipper VIP underlying funds universe. Lipper U.S. High Current Yield Funds aim at high (relative) current yield from fixed income securities, have no quality or maturity restrictions, and tend to invest in lower grade debt issues. For the 12-month period ended 12/31/05, there were 94 funds in this category. Lipper calculations do not include contract fees, expenses or sales charges, and may have been different if such charges had been considered.
Lipper VIP Income Funds Classification Average is an equally weighted average calculation of performance figures for all funds within the Lipper Income Funds classification in the Lipper VIP underlying funds universe. Lipper Income Funds seek a high level of current income through investing in income-producing stocks, bonds and money market instruments. For the 12-month period ended 12/31/05, there were 22 funds in this category. Lipper calculations do not include contract fees, expenses or sales charges, and may have been different if such charges had been considered.
Merrill Lynch 2- and 5-Year Zero Coupon Bond Indexes include zero coupon bonds that pay no interest and are issued at a discount from redemption price.
Morgan Stanley Capital International (MSCI) All Country (AC) World Index is a free float-adjusted, market capitalization-weighted index designed to measure equity market performance in global developed and emerging markets.
I-2
Morgan Stanley Capital International (MSCI) All Country (AC) World ex US Index is a free float-adjusted, market capitalization-weighted index designed to measure equity market performance in global developed and emerging markets excluding the U.S.
Morgan Stanley Capital International (MSCI) Emerging Markets (EM) Index is a free float-adjusted, market capitalization-weighted index designed to measure equity market performance in global emerging markets.
Morgan Stanley Capital International (MSCI) Europe, Australasia, Far East (EAFE) Index is a free float-adjusted, market capitalization-weighted index designed to measure equity market performance in global developed markets excluding the U.S. and Canada.
Morgan Stanley Capital International (MSCI) Russia Index is a free float-adjusted, market capitalization-weighted index designed to measure equity performance in Russia.
Morgan Stanley Capital International (MSCI) USA Index is a free float-adjusted, market capitalization-weighted index designed to measure equity market performance in the U.S.
Morgan Stanley Capital International (MSCI) World Index is a free float-adjusted, market capitalization-weighted index designed to measure equity market performance in global developed markets.
NASDAQ Composite Index measures all NASDAQ domestic and international based common type stocks listed on The NASDAQ Stock Market. The index is market value weighted and includes more than 3,000 companies.
Russell 1000 Growth Index is market capitalization weighted and measures performance of those Russell 1000 Index companies with higher price-to-book ratios and higher forecasted growth values.
Russell 1000 Index is market capitalization weighted and measures performance of the 1,000 largest companies in the Russell 3000 Index, which represent approximately 92% of total market capitalization of the Russell 3000 Index.
Russell 1000 Value Index is market capitalization weighted and measures performance of those Russell 1000 Index companies with lower price-to-book ratios and lower forecasted growth values.
Russell 2000 Value Index is market capitalization weighted and measures performance of those Russell 2000 Index companies with lower price-to-book ratios and lower forecasted growth values.
Russell 2500 Growth Index is market capitalization weighted and measures performance of those Russell 2500 Index companies with higher price-to-book ratios and higher forecasted growth values.
Russell 2500 Value Index is market capitalization weighted and measures performance of those Russell 2500 Index companies with lower price-to-book ratios and lower forecasted growth values.
Russell 3000 Growth Index is market capitalization weighted and measures performance of those Russell 3000 Index companies with higher price-to-book ratios and higher forecasted growth values.
I-3
Russell Midcap Growth Index is market capitalization weighted and measures performance of those Russell Midcap Index companies with higher price-to-book ratios and higher forecasted growth values.
Russell Midcap Value Index is market capitalization weighted and measures performance of those Russell Midcap Index companies with lower price-to-book ratios and lower forecasted growth values.
Standard & Poor’s 500 Index (S&P 500) consists of 500 stocks chosen for market size, liquidity and industry group representation. Each stock’s weight in the index is proportionate to its market value. The S&P 500 is one of the most widely used benchmarks of U.S. equity performance.
Standard & Poor’s/International Finance Corporation Investable (S&P/IFCI) Composite Index is a free float-adjusted, market capitalization-weighted index designed to measure equity performance in global emerging markets.
I-4
Board Members and Officers
The name, year of birth and address of the officers and board members, as well as their affiliations, positions held with the Trust, principal occupations during the past five years and number of portfolios overseen in the Franklin Templeton Investments fund complex are shown below. Each board member will serve until that person’s successor is elected and qualified.
Independent Board Members
| | | | | | | | |
| Name, Year of Birth and Address | | Position | | Length of
Time Served | | Number of
Portfolios in Fund
Complex Overseen
by Board Member* | | Other Directorships Held |
HARRIS J. ASHTON (1932) One Franklin Parkway San Mateo, CA 94403-1906 | | Trustee | | Since 1988 | | 140 | | Director, Bar-S Foods (meat packing company). |
|
Principal Occupation During Past 5 Years: Director of various companies; and formerly, Director, RBC Holdings, Inc. (bank holding company) (until 2002); and President, Chief Executive Officer and Chairman of the Board, General Host Corporation (nursery and craft centers) (until 1998). |
ROBERT F. CARLSON (1928) One Franklin Parkway San Mateo, CA 94403-1906 | | Trustee | | Since 1998 | | 56 | | None |
|
Principal Occupation During Past 5 Years: Vice President, senior member and past President, Board of Administration, California Public Employees Retirement Systems (CALPERS); and formerly, member and Chairman of the Board, Sutter Community Hospitals; member, Corporate Board, Blue Shield of California; and Chief Counsel, California Department of Transportation. |
S. JOSEPH FORTUNATO (1932) One Franklin Parkway San Mateo, CA 94403-1906 | | Trustee | | Since 1989 | | 141 | | None |
|
Principal Occupation During Past 5 Years: Attorney; and formerly, member of the law firm of Pitney, Hardin, Kipp & Szuch (until 2002) (Consultant (2003)). |
EDITH E. HOLIDAY (1952) One Franklin Parkway San Mateo, CA 94403-1906 | | Trustee | | Since June 2005 | | 136 | | Director, Amerada Hess Corporation (exploration and refining of oil and gas), H.J. Heinz Company (processed foods and allied products), RTI International Metals, Inc. (manufacture and distribution of titanium), Canadian National Railway (railroad), and White Mountains Insurance Group, Ltd. (holding company). |
|
Principal Occupation During Past 5 Years: Director or Trustee of various companies and trusts; and formerly, Assistant to the President of the United States and Secretary of the Cabinet (1990-1993); General Counsel to the United States Treasury Department (1989-1990); and Counselor to the Secretary and Assistant Secretary for Public Affairs and Public Liaison-United States Treasury Department (1988-1989). |
FRANK W.T. LAHAYE (1929) One Franklin Parkway San Mateo, CA 94403-1906 | | Trustee | | Since 1988 | | 114 | | Director, Center for Creative Land Recycling (redevelopment). |
|
Principal Occupation During Past 5 Years: General Partner, Las Olas L.P. (Asset Management); and formerly, Chairman, Peregrine Venture Management Company (venture capital). |
BOD-1
| | | | | | | | |
| Name, Year of Birth and Address | | Position | | Length of
Time Served | | Number of
Portfolios in Fund
Complex Overseen
by Board Member* | | Other Directorships Held |
GORDON S. MACKLIN (1928) One Franklin Parkway San Mateo, CA 94403-1906 | | Trustee | | Since 1993 | | 140 | | Director, Martek Biosciences Corporation, MedImmune, Inc. (biotechnology), and Overstock.com (Internet services); and formerly, Director, MCI Communication Corporation (subsequently known as MCI WorldCom, Inc. and WorldCom, Inc.) (communications services) (1988-2002), White Mountains Insurance Group, Ltd. (holding company) (1987-2004) and Spacehab, Inc. (aerospace services) (1994-2003). |
|
Principal Occupation During Past 5 Years: Director of various companies; and formerly, Deputy Chairman, White Mountains Insurance Group, Ltd. (holding company) (2001-2004); Chairman, White River Corporation (financial services) (1993-1998) and Hambrecht & Quist Group (investment banking) (1987-1992); and President, National Association of Securities Dealers, Inc. (1970-1987). |
FRANK A. OLSON (1932) One Franklin Parkway San Mateo, CA 94403-1906 | | Trustee | | Since June 2005 | | 101 | | Director, White Mountains Insurance Group, Ltd. (holding company), Amerada Hess Corporation (exploration and refining of oil and gas) and Sentient Jet (private jet service); and formerly, Director, Becton Dickinson and Company (medical technology), Cooper Industries, Inc. (electrical products and tools and hardware), Health Net, Inc. (formerly, Foundation Health) (integrated managed care), The Hertz Corporation, Pacific Southwest Airlines, The RCA Corporation, Unicom (formerly, Commonwealth Edison) and UAL Corporation (airlines). |
|
Principal Occupation During Past 5 Years: Chairman Emeritus, The Hertz Corporation (car rental) (since 2000) (Chairman of the Board (1980-2000) and Chief Executive Officer (1977-1999)); and formerly, Chairman of the Board, President and Chief Executive Officer, UAL Corporation (airlines). |
Interested Board Members and Officers
| | | | | | | | |
| Name, Year of Birth and Address | | Position | | Length of
Time Served | | Number of
Portfolios in Fund
Complex Overseen
by Board Member* | | Other Directorships Held |
**CHARLES B. JOHNSON (1933) One Franklin Parkway San Mateo, CA 94403-1906 | | Trustee and Chairman of the Board | | Since 1988 | | 140 | | None |
|
Principal Occupation During Past 5 Years: Chairman of the Board, Member—Office of the Chairman and Director, Franklin Resources, Inc.; Vice President, Franklin Templeton Distributors, Inc.; Director, Fiduciary Trust Company International; and officer and/or director or trustee, as the case may be, of some of the other subsidiaries of Franklin Resources, Inc. and of 42 of the investment companies in Franklin Templeton Investments. |
**RUPERT H. JOHNSON, JR. (1940) One Franklin Parkway San Mateo, CA 94403-1906 | | Trustee, President and Chief Executive Officer— Investment Management | | Trustee since 1988 and President and Chief Executive Officer—Investment Management since 2002 | | 124 | | None |
|
Principal Occupation During Past 5 Years: Vice Chairman, Member—Office of the Chairman and Director, Franklin Resources, Inc.; Vice President and Director, Franklin Templeton Distributors, Inc.; Director, Franklin Advisers, Inc.; Senior Vice President, Franklin Advisory Services, LLC; and officer and/or director or trustee, as the case may be, of some of the other subsidiaries of Franklin Resources, Inc. and of 45 of the investment companies in Franklin Templeton Investments. |
BOD-2
| | | | | | | | |
| Name, Year of Birth and Address | | Position | | Length of
Time Served | | Number of
Portfolios in Fund
Complex Overseen
by Board Member* | | Other Directorships Held |
HARMON E. BURNS (1945) One Franklin Parkway San Mateo, CA 94403-1906 | | Vice President | | Since 1988 | | Not
Applicable | | Not Applicable |
|
Principal Occupation During Past 5 Years: Vice Chairman, Member—Office of the Chairman and Director, Franklin Resources, Inc.; Vice President and Director, Franklin Templeton Distributors, Inc.; Executive Vice President, Franklin Advisers, Inc.; and officer and/or director or trustee, as the case may be, of some of the other subsidiaries of Franklin Resources, Inc. and of 45 of the investment companies in Franklin Templeton Investments. |
JAMES M. DAVIS (1952) One Franklin Parkway San Mateo, CA 94403-1906 | | Chief Compliance Officer | | Since 2004 | | Not
Applicable | | Not Applicable |
|
Principal Occupation During Past 5 Years: Director, Global Compliance, Franklin Resources, Inc.; officer of 47 of the investment companies in Franklin Templeton Investments; and formerly, Director of Compliance, Franklin Resources, Inc. (1994-2001). |
LAURA FERGERSON (1962) One Franklin Parkway San Mateo, CA 94403-1906 | | Treasurer | | Since 2004 | | Not
Applicable | | Not Applicable |
|
Principal Occupation During Past 5 Years: Vice President, Franklin Templeton Services, LLC; officer of 31 of the investment companies in Franklin Templeton Investments; and formerly, Director and member of Audit and Valuation Committees, Runkel Funds, Inc. (2003-2004); Assistant Treasurer of most of the investment companies in Franklin Templeton Investments (1997-2003); and Vice President, Franklin Templeton Services, LLC (1997-2003). |
JIMMY D. GAMBILL (1947) 500 East Broward Blvd. Suite 2100 Fort Lauderdale, FL 33394-3091 | | Senior Vice President and Chief Executive Officer— Finance and Administration | | Since 2002 | | Not
Applicable | | Not Applicable |
|
Principal Occupation During Past 5 Years: President, Franklin Templeton Services, LLC; Senior Vice President, Templeton Worldwide, Inc.; and officer of 47 of the investment companies in Franklin Templeton Investments. |
DAVID P. GOSS (1947) One Franklin Parkway San Mateo, CA 94403-1906 | | Vice President | | Since 2000 | | Not
Applicable | | Not Applicable |
|
Principal Occupation During Past 5 Years: Senior Associate General Counsel, Franklin Resources, Inc.; officer and director of one of the subsidiaries of Franklin Resources, Inc.; officer of 47 of the investment companies in Franklin Templeton Investments; and formerly, President, Chief Executive Officer and Director, Property Resources Equity Trust (until 1999) and Franklin Select Realty Trust (until 2000). |
STEVEN J. GRAY (1955) One Franklin Parkway San Mateo, CA 94403-1906 | | Secretary | | Since October 2005 | | Not
Applicable | | Not Applicable |
|
Principal Occupation During Past 5 Years: Senior Associate General Counsel, Franklin Resources, Inc.; officer of 33 of the investment companies in Franklin Templeton Investments; and formerly, Chief Legal Counsel, Atlas Advisers, Inc. (until 2000). |
BOD-3
| | | | | | | | |
| Name, Year of Birth and Address | | Position | | Length of
Time Served | | Number of
Portfolios in Fund
Complex Overseen
by Board Member* | | Other Directorships Held |
BARBARA J. GREEN (1947) One Franklin Parkway San Mateo, CA 94403-1906 | | Vice President | | Since 2000 | | Not
Applicable | | Not Applicable |
|
Principal Occupation During Past 5 Years: Vice President, Deputy General Counsel and Secretary, Franklin Resources, Inc.; Secretary and Senior Vice President, Templeton Worldwide, Inc.; Secretary, Franklin Advisers, Inc., Franklin Advisory Services, LLC, Franklin Investment Advisory Services, LLC, Franklin Mutual Advisers, LLC, Franklin Templeton Alternative Strategies, Inc., Franklin Templeton Investor Services, LLC, Franklin Templeton Services, LLC, Franklin Templeton Distributors, Inc., Templeton Investment Counsel, LLC, and Templeton/Franklin Investment Services, Inc.; and officer of some of the other subsidiaries of Franklin Resources, Inc. and of 47 of the investment companies in Franklin Templeton Investments; and formerly, Deputy Director, Division of Investment Management, Executive Assistant and Senior Advisor to the Chairman, Counselor to the Chairman, Special Counsel and Attorney Fellow, U.S. Securities and Exchange Commission (1986-1995); Attorney, Rogers & Wells (until 1986); and Judicial Clerk, U.S. District Court (District of Massachusetts) (until 1979). |
MICHAEL O. MAGDOL (1937) 600 Fifth Avenue Rockefeller Center New York, NY 10020-2302 | | Vice President— AML Compliance | | Since 2002 | | Not
Applicable | | Not Applicable |
|
Principal Occupation During Past 5 Years: Vice Chairman, Chief Banking Officer and Director, Fiduciary Trust Company International; Director, Franklin Templeton Institutional Suisse S.A., Arch Chemicals, Inc. and Lingnan Foundation; and officer and/or director, as the case may be, of some of the other subsidiaries of Franklin Resources, Inc. and of 45 of the investment companies in Franklin Templeton Investments. |
CRAIG S. TYLE (1960) One Franklin Parkway San Mateo, CA 94403-1906 | | Vice President | | Since October 2005 | | Not
Applicable | | Not Applicable |
|
Principal Occupation During Past 5 Years: General Counsel and Executive Vice President, Franklin Resources, Inc.; officer of 47 of the investment companies in Franklin Templeton Investments; and formerly, Partner, Shearman & Sterling, LLP (2004-2005); and General Counsel, Investment Company Institute (ICI) (1997-2004). |
GALEN G. VETTER (1951) 500 East Broward Blvd. Suite 2100 Fort Lauderdale, FL 33394-3091 | | Chief Financial Officer and Chief Accounting Officer | | Since 2004 | | Not
Applicable | | Not Applicable |
|
Principal Occupation During Past 5 Years: Senior Vice President, Franklin Templeton Services, LLC; officer of 47 of the investment companies in Franklin Templeton Investments; and formerly, Managing Director, RSM McGladrey, Inc. (1999-2004); and Partner, McGladrey & Pullen, LLP (1979-1987 and 1991-2004). |
| *We | base the number of portfolios on each separate series of the U.S. registered investment companies within the Franklin Templeton Investments fund complex. These portfolios have a common investment adviser or affiliated investment advisers. |
| **Charles | B. Johnson and Rupert H. Johnson, Jr. are considered to be interested persons of the Trust under the federal securities laws due to their positions as officers and directors and major shareholders of Franklin Resources, Inc., which is the parent company of the Trust’s advisers and distributor. |
Note: Charles B. Johnson and Rupert H. Johnson, Jr. are brothers.
BOD-4
The Sarbanes-Oxley Act of 2002 and Rules adopted by the Securities and Exchange Commission require the Fund to disclose whether the Fund’s Audit Committee includes at least one member who is an audit committee financial expert within the meaning of such Act and Rules. The Fund’s Board of Trustees has determined that there is at least one such financial expert on the Audit Committee and has designated Frank W.T. LaHaye as its audit committee financial expert. The Board believes that Mr. LaHaye qualifies as such an expert in view of his extensive business background and experience, including service as President and Director of McCormick Selph Associates from 1954 through 1965; Director and Chairman of Teledyne Canada Ltd. from 1966 through 1971; Director and Chairman of Quarterdeck Corporation from 1982 through 1998; and services as a Director of various other public companies including U.S. Telephone Inc. (1981-1984), Fisher Imaging Inc. (1991-1998) and Digital Transmissions Systems (1995-1999). In addition, Mr. LaHaye served from 1981 to 2000 as a Director and Chairman of Peregrine Venture Management Co., a venture capital firm, and has been a Member and Chairman of the Fund’s Audit Committee since its inception. As a result of such background and experience, the Board of Trustees believes that Mr. LaHaye has acquired an understanding of generally accepted accounting principles and financial statements, the general application of such principles in connection with the accounting estimates, accruals and reserves, and analyzing and evaluating financial statements that present a breadth and level of complexity of accounting issues generally comparable to those of the Fund, as well as an understanding of internal controls and procedures for financial reporting and an understanding of audit committee functions. Mr. LaHaye is an independent Trustee as that term is defined under the relevant Securities and Exchange Commission Rules and Releases.
The Statement of Additional Information (SAI) includes additional information about the board members and is available, without charge, upon request. Contract owners may call 1-800/321-8563 or their insurance companies to request the SAI.
BOD-5
Franklin Templeton Variable Insurance Products Trust
Shareholder Information
Board Review of Advisory Contracts
Franklin Mutual Advisers, LLC (Franklin Mutual) entered into an agreement with Franklin Templeton Investment Management Limited (Investment Management) on behalf of Mutual Discovery Securities Fund, effective May 19, 2005. Investment Management provides the services of Anne E. Gudefin to Franklin Mutual while she remains employed by Investment Management. Ms. Gudefin was previously employed by Franklin Mutual. Investment Management is indirectly wholly owned by Franklin Resources Inc., (Resources), a publicly-owned company engaged in the financial services industry through its subsidiaries. Charles B. Johnson and Rupert H. Johnson, Jr. are the principal shareholders of Resources. The Board of Trustees (“Board”), in approving the agreement between Franklin Mutual and Investment Management, noted that its determinations and considerations had not changed from those enumerated with respect to the Board’s approval of the annual renewal of the agreement with Franklin Mutual with respect to Mutual Discovery Securities Fund. In this regard it was noted that the agreement with Investment Management was intended solely to reflect Ms. Gudefin’s relocation to the London offices of Franklin Templeton Investments and in no way impacted the services provided by Franklin Mutual or the fees paid by the Fund for such services.
Templeton Investment Counsel, LLC (Investment Counsel) entered into an agreement with Investment Management, effective October 17, 2005, on behalf of each of Templeton Global Asset Allocation Fund and Templeton Foreign Securities Fund. Investment Management provides the services of Tucker Scott, one of the members of each Fund’s portfolio management team who resides in Geneva, Switzerland, while he remains employed by Investment Management. The Board, in approving the agreements between Investment Counsel and Investment Management, noted that its determinations and considerations had not changed from those enumerated with respect to the Board’s approval of the annual renewal of the agreements with Investment Counsel with respect to Templeton Global Asset Allocation Fund and Templeton Foreign Securities Fund. In this regard it was noted that the agreements with Investment Management were intended solely to reflect Tucker Scott’s relocation to the Switzerland offices of Franklin Templeton Investments and in no way impacted the services provided by Investment Counsel or the fees paid by the Funds for such services.
Proxy Voting Policies and Procedures
The Trust has established Proxy Voting Policies and Procedures (“Policies”) that the Trust uses to determine how to vote proxies relating to portfolio securities. Shareholders may view the Trust’s complete Policies online at franklintempleton.com. Alternatively, shareholders may request copies of the Policies free of charge by calling the Proxy Group collect at 1-954/847-2268 or by sending a written request to: Franklin Templeton Companies, LLC, 500 East Broward Boulevard, Suite 1500, Fort Lauderdale, FL 33394, Attention: Proxy Group. Copies of the Trust’s proxy voting records are also made available online at franklintempleton.com and posted on the U.S. Securities and Exchange Commission’s website at sec.gov and reflect the most recent 12-month period ended June 30.
Quarterly Statement of Investments
The Trust files a complete statement of investments with the U.S. Securities and Exchange Commission for the first and third quarters for each fiscal year on Form N-Q. Shareholders may view the filed Form N-Q by visiting the Commission’s website at sec.gov. The filed form may also be viewed and copied at the Commission’s Public Reference Room in Washington, DC. Information regarding the operations of the Public Reference Room may be obtained by calling 1-800/SEC-0330.
SI-1
| | |
 | | One Franklin Parkway San Mateo, CA 94403-1906 |
Annual Report
FRANKLIN TEMPLETON
VARIABLE INSURANCE PRODUCTS TRUST
Investment Managers
Franklin Advisers, Inc.
Franklin Advisory Services, LLC
Franklin Mutual Advisers, LLC
Templeton Asset Management, Ltd., Singapore
Templeton Global Advisors Limited
Templeton Investment Counsel, LLC
Distributor
Franklin Templeton Distributors, Inc.
Franklin Templeton Variable Insurance Products Trust (FTVIP) shares are sold only to insurance company separate accounts (“Separate Account”) to serve as the investment vehicles for both variable annuity and variable life insurance contracts.
Authorized for distribution only when accompanied or preceded by the current prospectus for the applicable contract, which includes the Separate Account and the FTVIP prospectuses. Investors should carefully consider a fund’s investment goals, risks, charges and expenses before investing. The prospectus contains this and other information; please read it carefully before investing.
To ensure the highest quality of service, telephone calls to or from our service departments may be monitored, recorded and accessed. These calls can be identified by the presence of a regular beeping tone.
FTVIP A2005 02/06
Item 2. Code of Ethics.
| (a) | The Registrant has adopted a code of ethics that applies to its principal executive officers and principal financial and accounting officer. |
| (f) | Pursuant to Item 12(a)(1), the Registrant is attaching as an exhibit a copy of its code of ethics that applies to its principal executive officers and principal financial and accounting officer. |
Item 3. Audit Committee Financial Expert.
| | | | |
| (a) | | (1) | | The Registrant has an audit committee financial expert serving on its audit committee. |
| | (2) | | The audit committee financial expert is Frank W.T. LaHaye and he is “Independent” as defined under the relevant Securities and Exchange Commission Rules And Releases. |
Item 4. Principal Accountant Fees and Services.
(a) Audit Fees
The aggregate fees paid to the principal accountant for professional services rendered by the principal accountant for the audit of the registrant’s annual financial statements or for services that are normally provided by the principal accountant in connection with statutory and regulatory filings or engagements were $645,310 for the fiscal year ended December 31, 2005 and $580,753 for the fiscal year ended December 31, 2004.
(b) Audit-Related Fees
There were no fees paid to the principal accountant for assurance and related services rendered by the principal accountant to the registrant that are reasonably related to the performance of the audit of the registrant’s financial statements and are not reported under paragraph (a) of Item 4.
The aggregate fees paid to the principal accountant for assurance and related services rendered by the principal accountant to the registrant’s investment adviser and any entity controlling, controlled by or under common control with the investment adviser that provides ongoing services to the registrant that are reasonably related to the performance of the audit of their financial statements were $0 for the fiscal year ended December 31, 2005 and $48,579 for the fiscal year ended December 31, 2004. The services for which these fees were paid included attestation services.
(c) Tax Fees
There were no fees paid to the principal accountant for professional services rendered by the principal accountant to the registrant for tax compliance, tax advice and tax planning.
The aggregate fees paid to the principal accountant for professional services rendered by the principal accountant to the registrant’s investment adviser and any entity controlling, controlled by or under common control with the investment adviser that provides ongoing services to the registrant for tax compliance, tax advice and tax planning were $23,161 for the fiscal year ended December 31, 2005 and $0 for the fiscal year ended December 31, 2004. The services for which these fees were paid included tax compliance and advice.
(d) All Other Fees
The aggregate fees paid to the principal accountant for products and services rendered by the principal accountant to the registrant not reported in paragraphs (a)-(c) of Item 4 were $0 for the fiscal year ended December 31, 2005 and $7,563 for the fiscal year ended December 31, 2004. The services for which these fees were paid included review of materials provided to the fund Board in connection with the investment management contract renewal process.
The aggregate fees paid to the principal accountant for products and services rendered by the principal accountant to the registrant’s investment adviser and any entity controlling, controlled by or under common control with the investment adviser that provides ongoing services to the registrant not reported in paragraphs (a)-(c) of Item 4 were $4,789 for the fiscal year ended December 31, 2005 and $152,437 for the fiscal year ended December 31, 2004. The services for which these fees were paid included review of materials provided to the fund Board in connection with the investment management contract renewal process and the review of the ICI transfer agent survey.
(e) (1) The registrant’s audit committee is directly responsible for approving the services to be provided by the auditors, including:
(i) pre-approval of all audit and audit related services;
(ii) pre-approval of all non-audit related services to be provided to the Fund by the auditors;
(iii) pre-approval of all non-audit related services to be provided to the registrant by the auditors to the registrant’s investment adviser or to any entity that controls, is controlled by or is under common control with the registrant’s investment adviser and that provides ongoing services to the registrant where the non-audit services relate directly to the operations or financial reporting of the registrant; and
(iv) establishment by the audit committee, if deemed necessary or appropriate, as an alternative to committee pre-approval of services to be provided by the auditors, as required by paragraphs (ii) and (iii) above, of policies and procedures to permit such services to be pre-approved by other means, such as through establishment of guidelines or by action of a designated member or members of the committee; provided the policies and procedures are detailed as to the particular service and the committee is informed of each service and such policies and procedures do not include delegation of audit committee responsibilities, as contemplated under the Securities Exchange Act of 1934, to management; subject, in the case of (ii) through (iv), to any waivers, exceptions or exemptions that may be available under applicable law or rules.
(e) (2) None of the services provided to the registrant described in paragraphs (b)-(d) of Item 4 were approved by the audit committee pursuant to paragraph (c)(7)(i)(C) of Rule 2-01 of regulation S-X.
(f) No disclosures are required by this Item 4(f).
(g) The aggregate non-audit fees paid to the principal accountant for services rendered by the principal accountant to the registrant and the registrant’s investment adviser and any entity controlling, controlled by or under common control with the investment adviser that provides ongoing services to the registrant were $27,950 for the fiscal year ended December 31, 2005 and $208,579 for the fiscal year ended December 31, 2004.
(h) The registrant’s audit committee of the board of trustees has considered whether the provision of non-audit services that were rendered to the registrant’s investment adviser (not including any sub-adviser whose role is primarily portfolio management and is subcontracted with or overseen by another investment adviser), and any entity controlling, controlled by, or under common control with the investment adviser that provides ongoing services to the registrant that were not pre-approved pursuant to paragraph (c)(7)(ii) of Rule 2-01 of Regulation S-X is compatible with maintaining the principal accountant’s independence.
| | | | |
Item 5. | | Audit Committee of Listed Registrants. | | N/A |
| | |
Item 6. | | Schedule of Investments. | | N/A |
| | |
Item 7. | | Disclosure of Proxy Voting Policies and Procedures for Closed-End Management Investment Companies. | | N/A |
| | |
Item 8. | | Portfolio Managers of Closed-End Management Investment Companies. | | N/A |
| | |
Item 9. | | Purchases of Equity Securities by Closed-End Management Investment Companies and Affiliated Purchases. | | N/A |
Item 10. Submission of Matters to a vote of Security Holders.
There have been no changes to the procedures by which shareholders may recommend nominees to the Registrant’s Board of Trustees that would require disclosure herein.
Item 11. Controls and Procedures.
(a) Evaluation of Disclosure Controls and Procedures. The Registrant maintains disclosure controls and procedures that are designed to ensure that information required to be disclosed in the Registrant’s filings under the Securities Exchange Act of 1934 and the Investment Company Act of 1940 is recorded, processed, summarized and reported within the periods specified in the rules and forms of the Securities and Exchange Commission. Such information is accumulated and communicated to the Registrant’s management, including its principal executive officer and principal financial officer, as appropriate, to allow timely decisions regarding required disclosure. The Registrant’s management, including the principal executive officer and the principal financial officer, recognizes that any set of controls and procedures, no matter how well designed and operated, can provide only reasonable assurance of achieving the desired control objectives.
Within 90 days prior to the filing date of this Shareholder Report on Form N-CSR, the Registrant had carried out an evaluation, under the supervision and with the participation of the Registrant’s management, including the Registrant’s principal executive officer and the
Registrant’s principal financial officer, of the effectiveness of the design and operation of the Registrant’s disclosure controls and procedures. Based on such evaluation, the Registrant’s principal executive officer and principal financial officer concluded that the Registrant’s disclosure controls and procedures are effective.
(b) Changes in Internal Controls. There have been no significant changes in the Registrant’s internal controls or in other factors that could significantly affect the internal controls subsequent to the date of their evaluation in connection with the preparation of this Shareholder Report on Form N-CSR.
Item 12. Exhibits.
(a) (1) Code of Ethics
(a) (2) Certifications pursuant to Section 302 of the Sarbanes-Oxley Act of 2002 of Jimmy D. Gambill, Chief Executive Officer - Finance and Administration, and Galen G. Vetter, Chief Financial Officer
(b) Certifications pursuant to Section 906 of the Sarbanes-Oxley Act of 2002 of Jimmy D. Gambill, Chief Executive Officer - Finance and Administration, and Galen G. Vetter, Chief Financial Officer
SIGNATURES
Pursuant to the requirements of the Securities Exchange Act of 1934 and the Investment Company Act of 1940, the registrant has duly caused this report to be signed on its behalf by the undersigned, thereunto duly authorized.
FRANKLIN TEMPLETON VARIABLE INSURANCE PRODUCTS TRUST
| | |
| By | | /s/ Jimmy D. Gambill |
| Jimmy D. Gambill |
| Chief Executive Officer - Finance and Administration |
| Date: | | February 21, 2006 |
Pursuant to the requirements of the Securities Exchange Act of 1934 and the Investment Company Act of 1940, this report has been signed below by the following persons on behalf of the registrant and in the capacities and on the dates indicated.
| | |
| By | | /s/ Jimmy D. Gambill |
| Jimmy D. Gambill |
| Chief Executive Officer - Finance and Administration |
| Date: | | February 21, 2006 |
| | |
| By | | /s/ Galen G. Vetter |
| Galen G. Vetter |
| Chief Financial Officer |
| Date: | | February 21, 2006 |