UNITED STATES
SECURITIES AND EXCHANGE COMMISSION
Washington, D.C. 20549
FORM N-CSR
CERTIFIED SHAREHOLDER REPORT OF REGISTERED
MANAGEMENT INVESTMENT COMPANIES
| | |
Investment Company Act file number | | 811-05583 |
Franklin Templeton Variable Insurance Products Trust
|
| (Exact name of registrant as specified in charter) |
| | |
| One Franklin Parkway, San Mateo, CA | | 94403-1906 |
| (Address of principal executive offices) | | (Zip code) |
Craig S. Tyle, One Franklin Parkway, San Mateo, CA 94403-1906
|
| (Name and address of agent for service) |
Registrant’s telephone number, including area code: (650) 312-2000
Date of fiscal year end: 12/31
Date of reporting period: 12/31/07
| Item 1. | Reports to Stockholders. |

DECEMBER 31, 2007
FRANKLIN TEMPLETON
VARIABLE INSURANCE PRODUCTS TRUST
ANNUAL REPORT

FRANKLIN TEMPLETON VARIABLE INSURANCE PRODUCTS TRUST ANNUAL REPORT
TABLEOF CONTENTS
*Not part of the annual report
NOT FDIC INSURED | MAY LOSE VALUE | NO BANK GUARANTEE
MASTER CLASS – 1
IMPORTANT NOTESTOPERFORMANCE INFORMATION
Performance data is historical and cannot predict or guarantee future results. Principal value and investment return will fluctuate with market conditions, and you may have a gain or loss when you withdraw your money. Inception dates of the funds may have preceded the effective dates of the subaccounts, contracts, or their availability in all states.
When reviewing the index comparisons, please keep in mind that indexes have a number of inherent performance differentials over the funds. First, unlike the funds, which must hold a minimum amount of cash to maintain liquidity, indexes do not have a cash component. Second, the funds are actively managed and, thus, are subject to management fees to cover salaries of securities analysts or portfolio managers in addition to other expenses. Indexes are unmanaged and do not include any commissions or other expenses typically associated with investing in securities. Third, indexes often contain a different mix of securities than the fund to which they are compared. Additionally, please remember that indexes are simply a measure of performance and cannot be invested in directly.
i
FRANKLIN GLOBAL COMMUNICATIONS SECURITIES FUND
We are pleased to bring you Franklin Global Communications Securities Fund’s annual report for the fiscal year ended December 31, 2007.
Performance Summary as of 12/31/07
Average annual total return of Class 1 shares represents the average annual change in value, assuming reinvestment of dividends and capital gains. Average returns smooth out variations in returns, which can be significant; they are not the same as year-by-year results.
Periods ended 12/31/07
| | | | | | |
| | | 1-Year | | 5-Year | | 10-Year |
Average Annual Total Return | | +24.58% | | +23.77% | | +3.62% |
Total Return Index Comparison for Hypothetical $10,000 Investment (1/1/98–12/31/07)
The graph below shows the change in value of a hypothetical $10,000 investment in the Fund over the indicated period and includes reinvestment of any income or distributions. The Fund’s performance is compared to the performance of the Standard & Poor’s 500 Index (S&P 500) and the Bloomberg World Communications Index. One cannot invest directly in an index, nor is an index representative of the Fund’s portfolio. Please see Important Notes to Performance Information preceding the Fund Summaries.
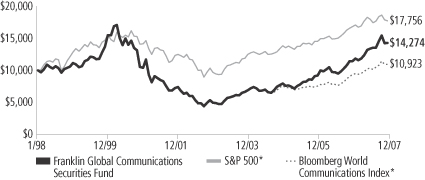
*Source: Standard & Poor’s Micropal. Due to data availability, performance for the Bloomberg World Communications Index is shown starting 8/31/03 using the Fund’s value on that date. Please see Index Descriptions following the Fund Summaries.
Franklin Global Communications Securities Fund – Class 1
Performance reflects the Fund’s Class 1 operating expenses, but does not include any contract fees, expenses or sales charges. If they had been included, performance would be lower. These charges and deductions, particularly for variable life policies, can have a significant effect on contract values and insurance benefits. See the contract prospectus for a complete description of these expenses, including sales charges.
Performance data represent past performance, which does not guarantee future results. Investment return and principal value will fluctuate, and you may have a gain or loss when you sell your shares.
Current performance may differ from figures shown.
FGC-1
Fund Goals and Main Investments: Franklin Global Communications Securities Fund seeks capital appreciation and current income. The Fund normally invests at least 80% of its net assets in investments of communications companies anywhere in the world and normally invests predominantly in equity securities.
Performance Overview
You can find the Fund’s one-year total return in the Performance Summary. The Fund outperformed its broad benchmark, the S&P 500, which returned +5.49% for the period under review.1 The Fund also outperformed its narrow benchmark, the Bloomberg World Communications Index, which returned +17.20%.1
Economic and Market Overview
During the 12 months ended December 31, 2007, the U.S. economy advanced at a moderate but uneven pace. Gross domestic product (GDP) grew an annualized 0.6% in the first quarter of 2007 but advanced in the second quarter at an annualized 3.8% rate. Federal defense spending, accelerating exports and declining imports, greater business inventory investment and increased spending for nonresidential structures supported growth. GDP grew an annualized 4.9% in the third quarter of 2007 despite a struggling housing market and the abrupt unraveling of the subprime mortgage market. The housing downturn affected the overall economy by fourth quarter 2007 as credit conditions worsened, consumer spending slowed, and GDP growth decelerated to an estimated 0.6% annualized rate.
The unemployment rate increased from 4.4% at the beginning of the period to 5.0% in December 2007.2 Although consumer confidence in July neared a six-year high, it declined through period-end largely due to rising mortgage and fuel costs, falling home prices and a weaker job market. Oil prices were volatile and established a new record high in November, nearing $99 per barrel. For the 12 months ended December 31, 2007, the core Consumer Price Index (CPI), which excludes food and energy costs, rose 2.4%, which was higher than its 10-year average rate.2
1. Source: Standard & Poor’s Micropal. One cannot invest directly in an index, nor is an index representative of the Fund’s portfolio. Please see Index Descriptions following the Fund Summaries.
2. Source: Bureau of Labor Statistics.
Fund Risks: The Fund’s investments in stocks offer the potential for long-term gains but can be subject to short-term price fluctuations. By investing predominantly in communications companies, the Fund carries much greater risk of adverse developments affecting the communications sector, and among those companies, than a fund that invests more broadly. Foreign investing, especially in emerging markets, involves additional risks, including currency fluctuations, economic instability, market volatility, and political and social instability. Smaller and midsize companies have historically been more volatile in price than larger company securities, especially over the short term. The Fund’s prospectus also includes a description of the main investment risks.
FGC-2
Facing the prospect of slower economic growth, the Federal Reserve Board lowered the federal funds target rate to 4.25% from 5.25% during the period. As investors fled riskier, poorer-performing assets, U.S. Treasuries rallied and the 10-year Treasury note yield fell from 4.71% at the beginning of the period to 4.04% on December 31, 2007.
Following sell-offs in late February and mid-March, stock markets rebounded amid generally strong first quarter corporate earnings reports. However, volatility picked up substantially in the latter half of the year due to investor concerns about slowing economic growth. The major stock indexes recovered from a late-summer sell-off and a November correction, and the blue chip stocks of the Dow Jones Industrial Average posted a 12-month total return of +8.88%.3 The broader S&P 500 returned +5.49%, and the technology-heavy NASDAQ Composite Index returned +11.53%.3 The energy, materials and utilities sectors performed particularly well.
Investment Strategy
We are research-driven, fundamental investors. As bottom-up investors focusing primarily on individual securities, we seek companies that have identifiable drivers of future earnings growth and that present, in our opinion, the best trade-off between that potential earnings growth, business and financial risk, and valuation. We rely on a team of analysts to help provide in-depth industry expertise within the communications industry and use both qualitative and quantitative analysis to evaluate companies for distinct, sustainable and competitive advantages likely to lead to growth in earnings and/or share price. Competitive advantages such as a particular marketing niche, proven technology, sound financial profits and records, or strong management are all factors we believe may contribute to growth in earnings or share price.
Manager’s Discussion
During the year under review, the global communications sector performed well. The Fund benefited particularly from several of its investments in the wireless communications sector. Wireless access in less developed countries with low service penetration rates, or the number of wireless users, grew more rapidly than many industry analysts expected and yet, many of these markets continued to hold the potential for strong future growth. Relative global economic stability,
3. Source: Standard & Poor’s Micropal. Please see Index Descriptions following the Fund Summaries.
FGC-3
combined with the rollout of pre-paid wireless plans, also fueled industry expansion. Within wireless communications, China’s leading wireless services provider, China Mobile, was among the Fund’s top contributors to performance as the company posted strong earnings growth due to robust subscriber growth rates during the reporting period. The Fund also benefited from its investments in Canada’s leading wireless voice and data communications provider Rogers Communications and Latin America-based America Movil.
Several of the Fund’s electronic technology sector holdings were also significant contributors to performance.4 Shares of computer processing hardware manufacturer Apple rose to record highs during the review period due to strong sales of its digital music players and services, Macintosh personal computers and related computer hardware devices. Another key contributor was Finland’s Nokia, the world’s largest mobile phone maker. The company increased its market share largely due to strong sales in the Asia-Pacific region and in Europe. In addition, through a series of recent acquisitions, the company expanded its scope beyond cell phones to include several Internet-related services. Within the consumer durables sector, Japanese gamemaker Nintendo was a standout performer.5
In contrast, not all of the Fund’s holdings performed well, including a few individual wireless telecommunications holdings. For example, new Fund holding MetroPCS Communications suffered from increased competition and slower-than-expected subscription growth rates. The Fund’s investment in Leap International Wireless also declined in value. Other major detractors included Rackable Systems (sold during the reporting period), a leading provider of servers and storage systems for large-scale data centers, and digital content provider Limelight Networks, which was bought and sold during the reporting period.
Thank you for your participation in Franklin Global Communications Securities Fund. We look forward to serving your future investment needs.
4. The electronic technology sector comprises aerospace and defense, computer communications, computer processing hardware and telecommunications equipment in the SOI.
5. The consumer durables sector comprises electronics and appliances and recreational products in the SOI.
The foregoing information reflects our analysis, opinions and portfolio holdings as of December 31, 2007, the end of the reporting period. The way we implement our main investment strategies and the resulting portfolio holdings may change depending on factors such as market and economic conditions. These opinions may not be relied upon as investment advice or an offer for a particular security. The information is not a complete analysis of every aspect of any market, country, industry, security or the Fund. Statements of fact are from sources considered reliable, but the investment manager makes no representation or warranty as to their completeness or accuracy. Although historical performance is no guarantee of future results, these insights may help you understand our investment management philosophy.
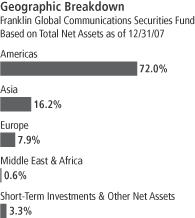
Top 10 Holdings
Franklin Global Communications Securities Fund
12/31/07
| | |
Company
Sector/Industry,
Country | | % of Total
Net Assets |
| |
| America Movil SAB de CV, L, ADR | | 4.9% |
| Wireless Communications, Mexico | | |
| |
Rogers Communications
Inc., B | | 4.8% |
| Wireless Communications, Canada | | |
| |
| Apple Inc. | | 4.6% |
| Computer Processing Hardware, U.S. | | |
| |
| NII Holdings Inc. | | 4.2% |
| Wireless Communications, U.S. | | |
| |
| Nintendo Co. Ltd. | | 4.0% |
| Recreational Products, Japan | | |
| |
| Google Inc., A | | 3.8% |
Internet Software &
Services, U.S. | | |
| |
| MetroPCS Communications Inc. | | 3.5% |
| Wireless Communications, U.S. | | |
| |
| American Tower Corp., A | | 3.4% |
| Specialty Telecommunications, U.S. | | |
| |
| China Mobile (Hong Kong) Ltd., ADR | | 3.4% |
| Wireless Communications, China | | |
| |
| SBA Communications Corp. | | 3.3% |
| Wireless Communications, U.S. | | |
The dollar value, number of shares or principal amount, and names of all portfolio holdings are listed in the Fund’s Statement of Investments (SOI).
FGC-4
Fund Expenses
As an investor in a variable insurance contract (Contract) that indirectly provides for investment in an underlying mutual fund, you can incur transaction and/or ongoing expenses at both the Fund level and the Contract level.
| • | | Transaction expenses can include sales charges (loads) on purchases, redemption fees, surrender fees, transfer fees and premium taxes. |
| • | | Ongoing expenses can include management fees, distribution and service (12b-1) fees, contract fees, annual maintenance fees, mortality and expense risk fees and other fees and expenses. All mutual funds and Contracts have some types of ongoing expenses. |
The expenses shown in the table are meant to highlight ongoing expenses at the Fund level only and do not include ongoing expenses at the Contract level, or transaction expenses at either the Fund or Contract level. While the Fund does not have transaction expenses, if the transaction and ongoing expenses at the Contract level were included, the expenses shown would be higher. You should consult your Contract prospectus or disclosure document for more information.
The table shows Fund-level ongoing expenses and can help you understand these expenses and compare them with those of other mutual funds offered through the Contract. The table assumes a $1,000 investment held for the six months indicated. Please refer to the Fund prospectus for additional information on operating expenses.
Actual Fund Expenses
The first line (Actual) of the table provides actual account values and expenses. The “Ending Account Value” is derived from the Fund’s actual return, which includes the effect of ongoing Fund expenses, but does not include the effect of ongoing Contract expenses.
You can estimate the Fund-level expenses you incurred during the period by following these steps. Of course, your account value and expenses will differ from those in this illustration:
| 1. | Divide your account value by $1,000. |
If an account had an $8,600 value, then $8,600 ÷ $1,000 = 8.6.
| 2. | Multiply the result by the number under the heading “Fund-Level Expenses Incurred During Period.” |
If Fund-Level Expenses Incurred During Period were $7.50, then 8.6 x $7.50 = $64.50.
In this illustration, the estimated expenses incurred this period at the Fund level are $64.50.
Franklin Global Communications Securities Fund – Class 1
FGC-5
Hypothetical Example for Comparison with Other Mutual Funds
Information in the second line (Hypothetical) of the table can help you compare ongoing expenses of the Fund with those of other mutual funds offered through the Contract. This information may not be used to estimate the actual ending account balance or expenses you incurred during the period. The hypothetical “Ending Account Value” is based on the Fund’s actual expense ratio and an assumed 5% annual rate of return before expenses, which does not represent the Fund’s actual return. The figure under the heading “Fund-Level Expenses Incurred During Period” shows the hypothetical expenses your account would have incurred under this scenario. You can compare this figure with the 5% hypothetical examples that appear in shareholder reports of other funds offered through a Contract.
| | | | | | | | | |
| Class 1 | | Beginning
Account Value 7/1/07 | | Ending
Account
Value 12/31/07 | | Fund-Level
Expenses Incurred
During Period*
7/1/07–12/31/07 |
Actual | | $ | 1,000 | | $ | 1,065.50 | | $ | 3.07 |
Hypothetical (5% return before expenses) | | $ | 1,000 | | $ | 1,022.23 | | $ | 3.01 |
*Expenses are calculated using the most recent six-month annualized expense ratio for the Fund’s Class 1 shares (0.59%), which does not include any ongoing expenses of the Contract for which the Fund is an investment option, multiplied by the average account value over the period, multiplied by 184/365 to reflect the one-half year period.
FGC-6
Franklin Templeton Variable Insurance Products Trust
Financial Highlights
Franklin Global Communications Securities Fund
| | | | | | | | | | | | | | | | | | | | |
| | | Year Ended December 31, | |
| Class 1 | | 2007 | | | 2006 | | | 2005 | | | 2004 | | | 2003 | |
| | | | |
Per share operating performance | | | | | | | | | | | | | | | | | | | | |
(for a share outstanding throughout the year) | | | | | | | | | | | | | | | | | | | | |
Net asset value, beginning of year | | $ | 10.06 | | | $ | 8.09 | | | $ | 7.17 | | | $ | 6.32 | | | $ | 4.53 | |
| | | | |
Income from investment operationsa: | | | | | | | | | | | | | | | | | | | | |
Net investment income (loss)b | | | 0.04 | | | | (0.01 | ) | | | 0.04 | | | | 0.05 | | | | 0.06 | |
Net realized and unrealized gains (losses) | | | 2.42 | | | | 2.01 | | | | 1.08 | | | | 0.87 | | | | 1.78 | |
| | | | |
Total from investment operations | | | 2.46 | | | | 2.00 | | | | 1.12 | | | | 0.92 | | | | 1.84 | |
| | | | |
Less distributions from net investment income | | | — | | | | (0.03 | ) | | | (0.20 | ) | | | (0.07 | ) | | | (0.05 | ) |
| | | | |
Net asset value, end of year | | $ | 12.52 | | | $ | 10.06 | | | $ | 8.09 | | | $ | 7.17 | | | $ | 6.32 | |
| | | | |
| | | | | |
Total returnc | | | 24.58% | | | | 24.69% | | | | 16.12% | | | | 14.66% | | | | 40.46% | |
Ratios to average net assets | | | | | | | | | | | | | | | | | | | | |
Expenses | | | 0.61% | d | | | 0.67% | d | | | 0.65% | d | | | 0.64% | d | | | 0.64% | |
Net investment income (loss) | | | 0.30% | | | | (0.13)% | | | | 0.63% | | | | 0.85% | | | | 1.08% | |
| | | | | |
Supplemental data | | | | | | | | | | | | | | | | | | | | |
Net assets, end of year (000’s) | | $ | 152,519 | | | $ | 145,425 | | | $ | 138,015 | | | $ | 142,898 | | | $ | 149,480 | |
Portfolio turnover rate | | | 93.43% | | | | 134.21% | | | | 170.40% | | | | 178.52% | | | | 96.60% | |
a The amount shown for a share outstanding throughout the period may not correlate with the Statement of Operations for the period due to the timing of sales and repurchases of the Fund shares in relation to income earned and/or fluctuating market value of the investments of the Fund.
b Based on average daily shares outstanding.
c Total return does not include any fees, charges or expenses imposed by the variable annuity and life insurance contracts for which the Franklin Templeton Variable Insurance Products Trust serves as an underlying investment vehicle.
d Benefit of expense reduction rounds to less than 0.01%.
The accompanying notes are an integral part of these financial statements.
FGC-7
Franklin Templeton Variable Insurance Products Trust
Financial Highlights (continued)
Franklin Global Communications Securities Fund
| | | | | | | | | | | | | | | | | | | | |
| | | Year Ended December 31, | |
| Class 2 | | 2007 | | | 2006 | | | 2005 | | | 2004 | | | 2003 | |
| | | | |
Per share operating performance | | | | | | | | | | | | | | | | | | | | |
(for a share outstanding throughout the year) | | | | | | | | | | | | | | | | | | | | |
Net asset value, beginning of year | | $ | 9.94 | | | $ | 8.00 | | | $ | 7.10 | | | $ | 6.28 | | | $ | 4.51 | |
| | | | |
Income from investment operationsa: | | | | | | | | | | | | | | | | | | | | |
Net investment income (loss)b | | | (0.01 | ) | | | (0.03 | ) | | | 0.03 | | | | 0.04 | | | | 0.05 | |
Net realized and unrealized gains (losses) | | | 2.41 | | | | 1.99 | | | | 1.06 | | | | 0.84 | | | | 1.77 | |
| | | | |
Total from investment operations | | | 2.40 | | | | 1.96 | | | | 1.09 | | | | 0.88 | | | | 1.82 | |
| | | | |
Less distributions from net investment income | | | — | | | | (0.02 | ) | | | (0.19 | ) | | | (0.06 | ) | | | (0.05 | ) |
| | | | |
Net asset value, end of year | | $ | 12.34 | | | $ | 9.94 | | | $ | 8.00 | | | $ | 7.10 | | | $ | 6.28 | |
| | | | |
| | | | | |
Total returnc | | | 24.25% | | | | 24.56% | | | | 15.79% | | | | 14.18% | | | | 40.44% | |
Ratios to average net assets | | | | | | | | | | | | | | | | | | | | |
Expenses | | | 0.86% | d | | | 0.92% | d | | | 0.90% | d | | | 0.89% | d | | | 0.89% | |
Net investment income (loss) | | | 0.05% | | | | (0.38)% | | | | 0.38% | | | | 0.60% | | | | 0.83% | |
| | | | | |
Supplemental data | | | | | | | | | | | | | | | | | | | | |
Net assets, end of year (000’s) | | $ | 143,078 | | | $ | 78,975 | | | $ | 38,613 | | | $ | 23,704 | | | $ | 10,719 | |
Portfolio turnover rate | | | 93.43% | | | | 134.21% | | | | 170.40% | | | | 178.52% | | | | 96.60% | |
a The amount shown for a share outstanding throughout the period may not correlate with the Statement of Operations for the period due to the timing of sales and repurchases of the Fund shares in relation to income earned and/or fluctuating market value of the investments of the Fund.
b Based on average daily shares outstanding.
c Total return does not include any fees, charges or expenses imposed by the variable annuity and life insurance contracts for which the Franklin Templeton Variable Insurance Products Trust serves as an underlying investment vehicle.
d Benefit of expense reduction rounds to less than 0.01%.
The accompanying notes are an integral part of these financial statements.
FGC-8
Franklin Templeton Variable Insurance Products Trust
Statement of Investments, December 31, 2007
| | | | | | | |
| Franklin Global Communications Securities Fund | | Country | | Shares | | Value |
Long Term Investments 96.7% | | | | | | | |
Common Stocks 96.4% | | | | | | | |
Advertising/Marketing Services 1.9% | | | | | | | |
aFocus Media Holding Ltd., ADR | | China | | 96,700 | | $ | 5,493,527 |
| | | | | | | |
Aerospace & Defense 3.1% | | | | | | | |
aFLIR Systems Inc. | | United States | | 183,100 | | | 5,731,030 |
aOrbital Sciences Corp. | | United States | | 134,000 | | | 3,285,680 |
| | | | | | | |
| | | | | | | 9,016,710 |
| | | | | | | |
Broadcasting 1.4% | | | | | | | |
Grupo Televisa SA, ADR | | Mexico | | 140,900 | | | 3,349,193 |
aXM Satellite Radio Holdings Inc., A | | United States | | 66,000 | | | 807,840 |
| | | | | | | |
| | | | | | | 4,157,033 |
| | | | | | | |
Computer Communications 3.8% | | | | | | | |
aCisco Systems Inc. | | United States | | 166,700 | | | 4,512,569 |
aF5 Networks Inc. | | United States | | 122,100 | | | 3,482,292 |
aRiverbed Technology Inc. | | United States | | 116,900 | | | 3,125,906 |
| | | | | | | |
| | | | | | | 11,120,767 |
| | | | | | | |
Computer Processing Hardware 4.6% | | | | | | | |
aApple Inc. | | United States | | 68,600 | | | 13,588,288 |
| | | | | | | |
Data Processing Services 0.5% | | | | | | | |
aNeuStar Inc., A | | United States | | 48,900 | | | 1,402,452 |
| | | | | | | |
Diversified Telecommunication Services 9.2% | | | | | | | |
AT&T Inc. | | United States | | 75,117 | | | 3,121,862 |
aBharti Airtel Ltd. | | India | | 188,245 | | | 4,751,150 |
Cable & Wireless PLC | | United Kingdom | | 742,700 | | | 2,744,817 |
PT Telekomunikasi Indonesia, B | | Indonesia | | 1,627,000 | | | 1,758,217 |
Reliance Communication Ltd. | | India | | 79,000 | | | 1,496,599 |
Singapore Telecommunications Ltd. | | Singapore | | 563,000 | | | 1,562,316 |
Telenor ASA | | Norway | | 315,000 | | | 7,520,701 |
Telus Corp. | | Canada | | 87,900 | | | 4,242,054 |
| | | | | | | |
| | | | | | | 27,197,716 |
| | | | | | | |
Electronic Production Equipment 0.7% | | | | | | | |
aFormFactor Inc. | | United States | | 66,400 | | | 2,197,840 |
| | | | | | | |
Electronics/Appliances 0.6% | | | | | | | |
Sony Corp., ADR | | Japan | | 30,800 | | | 1,672,440 |
| | | | | | | |
Finance/Rental/Leasing 1.2% | | | | | | | |
a,bBM&F (Bolsa De Mercadorias E Futuros), 144A | | Brazil | | 257,000 | | | 3,609,551 |
| | | | | | | |
Internet Software/Services 8.9% | | | | | | | |
aBaidu.com Inc., ADR | | China | | 11,000 | | | 4,294,290 |
aEquinix Inc. | | United States | | 60,900 | | | 6,155,163 |
aGoogle Inc., A | | United States | | 16,400 | | | 11,340,272 |
aSohu.com Inc. | | China | | 33,700 | | | 1,837,324 |
aVeriSign Inc. | | United States | | 72,300 | | | 2,719,203 |
| | | | | | | |
| | | | | | | 26,346,252 |
| | | | | | | |
Media Conglomerates 1.7% | | | | | | | |
News Corp., A | | United States | | 140,600 | | | 2,880,894 |
The Walt Disney Co. | | United States | | 69,940 | | | 2,257,663 |
| | | | | | | |
| | | | | | | 5,138,557 |
| | | | | | | |
FGC-9
Franklin Templeton Variable Insurance Products Trust
Statement of Investments, December 31, 2007 (continued)
| | | | | | | |
| Franklin Global Communications Securities Fund | | Country | | Shares | | Value |
Long Term Investments (continued) | | | | | | | |
Common Stocks (continued) | | | | | | | |
Movies/Entertainment 0.3% | | | | | | | |
aOutdoor Channel Holdings Inc. | | United States | | 142,300 | | $ | 981,870 |
| | | | | | | |
Recreational Products 8.5% | | | | | | | |
aActivision Inc. | | United States | | 284,700 | | | 8,455,590 |
Nintendo Co. Ltd. | | Japan | | 19,700 | | | 11,818,410 |
aScientific Games Corp., A | | United States | | 95,400 | | | 3,172,050 |
aUbisoft Entertainment SA | | France | | 16,200 | | | 1,642,373 |
| | | | | | | |
| | | | | | | 25,088,423 |
| | | | | | | |
Semiconductors 2.1% | | | | | | | |
Maxim Integrated Products Inc. | | United States | | 171,000 | | | 4,528,080 |
aMicrosemi Corp. | | United States | | 79,300 | | | 1,755,702 |
| | | | | | | |
| | | | | | | 6,283,782 |
| | | | | | | |
Specialty Telecommunications 6.9% | | | | | | | |
aAmerican Tower Corp., A | | United States | | 239,302 | | | 10,194,265 |
aCrown Castle International Corp. | | United States | | 150,090 | | | 6,243,744 |
aMaxcom Telecomunicaciones SA, ADR | | Mexico | | 64,900 | | | 824,879 |
aTime Warner Telecom Inc., A | | United States | | 159,300 | | | 3,232,197 |
| | | | | | | |
| | | | | | | 20,495,085 |
| | | | | | | |
Telecommunications Equipment 13.1% | | | | | | | |
aComverse Technology Inc. | | United States | | 193,200 | | | 3,332,700 |
Garmin Ltd. | | Cayman Islands | | 44,700 | | | 4,335,900 |
Harris Corp. | | United States | | 97,000 | | | 6,079,960 |
Nokia Corp., ADR | | Finland | | 249,300 | | | 9,570,627 |
QUALCOMM Inc. | | United States | | 163,300 | | | 6,425,855 |
aResearch In Motion Ltd. | | Canada | | 48,700 | | | 5,522,580 |
Telefonaktiebolaget LM Ericsson, B, ADR | | Sweden | | 85,100 | | | 1,987,085 |
aViaSat Inc. | | United States | | 43,500 | | | 1,497,705 |
| | | | | | | |
| | | | | | | 38,752,412 |
| | | | | | | |
Wireless Communications 27.9% | | | | | | | |
America Movil SAB de CV, L, ADR | | Mexico | | 234,300 | | | 14,383,677 |
Cellcom Israel Ltd. | | Israel | | 52,400 | | | 1,664,224 |
China Mobile (Hong Kong) Ltd., ADR | | China | | 115,300 | | | 10,016,111 |
cGlobe Telecom Inc. | | Philippines | | 40,100 | | | 1,526,971 |
aLeap Wireless International Inc. | | United States | | 132,800 | | | 6,193,792 |
aMetroPCS Communications Inc. | | United States | | 539,400 | | | 10,491,330 |
aNII Holdings Inc. | | United States | | 258,800 | | | 12,505,216 |
Rogers Communications Inc., B | | Canada | | 315,800 | | | 14,297,199 |
aSBA Communications Corp. | | United States | | 290,300 | | | 9,823,752 |
Taiwan Mobile Co. Ltd. | | Taiwan | | 1,155,000 | | | 1,549,261 |
| | | | | | | |
| | | | | | | 82,451,533 |
| | | | | | | |
Total Common Stocks (Cost $190,785,092) | | | | | | | 284,994,238 |
| | | | | | | |
Preferred Stock (Cost $720,899) 0.3% | | | | | | | |
Telecommunications Equipment 0.3% | | | | | | | |
a,d,eDilithium Networks Inc., depository receipt, D, pfd., 144A, PIPES | | United States | | 309,399 | | | 1,067,426 |
| | | | | | | |
Total Long Term Investments (Cost $191,505,991) | | | | | | | 286,061,664 |
| | | | | | | |
FGC-10
Franklin Templeton Variable Insurance Products Trust
Statement of Investments, December 31, 2007 (continued)
| | | | | | | | | |
| Franklin Global Communications Securities Fund | | Country | | Principal
Amount | | Value | |
Short Term Investment (Cost $16,181,709) 5.5% | | | | | | | | | |
Repurchase Agreement 5.5% | | | | | | | | | |
fJoint Repurchase Agreement, 3.773%, 1/02/08 (Maturity Value $16,185,101) | | United States | | $ | 16,181,709 | | $ | 16,181,709 | |
ABN AMRO Bank, NV, New York Branch (Maturity Value $1,592,614) | | | | | | | | | |
Banc of America Securities LLC (Maturity Value $1,592,614) | | | | | | | | | |
Barclays Capital Inc. (Maturity Value $733,509) | | | | | | | | | |
BNP Paribas Securities Corp. (Maturity Value $1,592,614) | | | | | | | | | |
Credit Suisse Securities (USA) LLC (Maturity Value $419,032) | | | | | | | | | |
Deutsche Bank Securities Inc. (Maturity Value $1,592,614) | | | | | | | | | |
Dresdner Kleinwort Wasserstein Securities LLC (Maturity Value $1,592,614) | | | | | | | | | |
Goldman, Sachs & Co. (Maturity Value $1,927,807) | | | | | | | | | |
Greenwich Capital Markets Inc. (Maturity Value $1,592,614) | | | | | | | | | |
Lehman Brothers Inc. (Maturity Value $1,956,455) | | | | | | | | | |
Merrill Lynch Government Securities Inc. (Maturity Value $1,592,614) | | | | | | | | | |
Collateralized by U.S. Government Agency Securities, 3.00% - 6.25%, 1/15/08 - 11/14/12; gU.S. Government Agency Discount Notes, 1/02/08 - 8/01/12; gU.S. Treasury Bill, 6/12/08 and U.S. Treasury Notes, 3.25% - 4.625%, 3/31/08 - 8/15/10 | | | | | | | | | |
| | | | | | | | | |
Total Investments (Cost $207,687,700) 102.2% | | | | | | | | 302,243,373 | |
Other Assets, less Liabilities (2.2)% | | | | | | | | (6,646,502 | ) |
| | | | | | | | | |
Net Assets 100.0% | | | | | | | $ | 295,596,871 | |
| | | | | | | | | |
Selected Portfolio Abbreviations
ADR - American Depository Receipt
PIPES - Private Investment in Public Equity Security
a Non-income producing for the twelve months ended December 31, 2007.
b Security was purchased pursuant to Rule 144A under the Securities Act of 1933 and may be sold in transactions exempt from registration only to qualified institutional buyers or in a public offering registered under the Securities Act of 1933. These securities have been deemed liquid under guidelines approved by the Fund’s Board of Trustees. At December 31, 2007 the value of this security was $3,609,551, representing 1.22% of net assets.
c A portion or all of the securities purchased on a when-issued or delayed delivery basis. See Note 1(d).
d Security has been deemed illiquid because it may not be able to be sold within seven days. At December 31, 2007, the value of this security was $1,067,426, representing 0.36% of net assets.
e See Note 8 regarding restricted securities.
f See Note 1(c) regarding joint repurchase agreement.
g The security is traded on a discount basis with no stated coupon rate.
The accompanying notes are an integral part of these financial statements.
FGC-11
Franklin Templeton Variable Insurance Products Trust
Financial Statements
Statement of Assets and Liabilities
December 31, 2007
| | | | |
| | | Franklin Global
Communications
Securities Fund | |
Assets: | | | | |
Investments in securities: | | | | |
Cost - Unaffiliated issuers | | $ | 191,505,991 | |
Cost - Repurchase agreements | | | 16,181,709 | |
| | | | |
Total cost of investments | | $ | 207,687,700 | |
| | | | |
Value - Unaffiliated issuers | | $ | 286,061,664 | |
Value - Repurchase agreements | | | 16,181,709 | |
| | | | |
Total value of investments | | | 302,243,373 | |
Receivables: | | | | |
Capital shares sold | | | 191,794 | |
Dividends | | | 151,990 | |
| | | | |
Total assets | | | 302,587,157 | |
| | | | |
Liabilities: | | | | |
Payables: | | | | |
Investment securities purchased | | | 6,370,541 | |
Capital shares redeemed | | | 196,826 | |
Affiliates | | | 190,036 | |
Deferred tax | | | 150,034 | |
Accrued expenses and other liabilities | | | 82,849 | |
| | | | |
Total liabilities | | | 6,990,286 | |
| | | | |
Net assets, at value | | $ | 295,596,871 | |
| | | | |
Net assets consist of: | | | | |
Paid-in capital | | $ | 404,938,750 | |
Undistributed net investment income | | | 559,988 | |
Net unrealized appreciation (depreciation) | | | 94,397,867 | |
Accumulated net realized gain (loss) | | | (204,299,734 | ) |
| | | | |
Net assets, at value | | $ | 295,596,871 | |
| | | | |
Class 1: | | | | |
Net assets, at value | | $ | 152,518,921 | |
| | | | |
Shares outstanding | | | 12,181,234 | |
| | | | |
Net asset value and maximum offering price per share | | $ | 12.52 | |
| | | | |
Class 2: | | | | |
Net assets, at value | | $ | 143,077,950 | |
| | | | |
Shares outstanding | | | 11,591,610 | |
| | | | |
Net asset value and maximum offering price per share | | $ | 12.34 | |
| | | | |
The accompanying notes are an integral part of these financial statements.
FGC-12
Franklin Templeton Variable Insurance Products Trust
Financial Statements (continued)
Statement of Operations
for the year ended December 31, 2007
| | | | |
| | | Franklin Global
Communications
Securities Fund | |
Investment income: | | | | |
Dividends (net of foreign taxes of $100,872) | | $ | 2,083,873 | |
Interest | | | 321,868 | |
| | | | |
Total investment income | | | 2,405,741 | |
| | | | |
Expenses: | | | | |
Management fees (Note 3a) | | | 1,432,109 | |
Distribution fees - Class 2 (Note 3c) | | | 279,101 | |
Unaffiliated transfer agent fees | | | 3,928 | |
Custodian fees (Note 4) | | | 64,458 | |
Reports to shareholders | | | 68,777 | |
Registration and filing fees | | | 1,014 | |
Professional fees | | | 34,141 | |
Trustees’ fees and expenses | | | 1,055 | |
Other | | | 10,655 | |
| | | | |
Total expenses | | | 1,895,238 | |
Expense reductions (Note 4) | | | (209 | ) |
| | | | |
Net expenses | | | 1,895,029 | |
| | | | |
Net investment income | | | 510,712 | |
| | | | |
Realized and unrealized gains (losses): | | | | |
Net realized gain (loss) from: | | | | |
Investments | | | 29,217,766 | |
Foreign currency transactions | | | (295,084 | ) |
| | | | |
Net realized gain (loss) | | | 28,922,682 | |
| | | | |
Net change in unrealized appreciation (depreciation) on: | | | | |
Investments | | | 22,906,515 | |
Translation of assets and liabilities denominated in foreign currencies | | | (8,877 | ) |
Change in deferred taxes on unrealized appreciation (depreciation) | | | 541,133 | |
| | | | |
Net change in unrealized appreciation (depreciation) | | | 23,438,771 | |
| | | | |
Net realized and unrealized gain (loss) | | | 52,361,453 | |
| | | | |
Net increase (decrease) in net assets resulting from operations | | $ | 52,872,165 | |
| | | | |
The accompanying notes are an integral part of these financial statements.
FGC-13
Franklin Templeton Variable Insurance Products Trust
Financial Statements (continued)
Statements of Changes in Net Assets
| | | | | | | | |
| | | Franklin Global Communications
Securities Fund | |
| | | Year Ended December 31, | |
| | | 2007 | | | 2006 | |
| | | | |
Increase (decrease) in net assets: | | | | | | | | |
Operations: | | | | | | | | |
Net investment income (loss) | | $ | 510,712 | | | $ | (403,493 | ) |
Net realized gain (loss) from investments and foreign currency transactions | | | 28,922,682 | | | | 11,783,503 | |
Net change in unrealized appreciation (depreciation) on investments, translation of assets and liabilities denominated in foreign currencies, and deferred taxes | | | 23,438,771 | | | | 31,341,175 | |
| | | | |
Net increase (decrease) in net assets resulting from operations | | | 52,872,165 | | | | 42,721,185 | |
| | | | |
Distributions to shareholders from: | | | | | | | | |
Net investment income: | | | | | | | | |
Class 1 | | | — | | | | (482,164 | ) |
Class 2 | | | — | | | | (123,165 | ) |
| | | | |
Total distributions to shareholders | | | — | | | | (605,329 | ) |
| | | | |
Capital share transactions: (Note 2) | | | | | | | | |
Class 1 | | | (25,800,362 | ) | | | (23,214,974 | ) |
Class 2 | | | 44,124,623 | | | | 28,871,476 | |
| | | | |
Total capital share transactions | | | 18,324,261 | | | | 5,656,502 | |
| | | | |
Net increase (decrease) in net assets | | | 71,196,426 | | | | 47,772,358 | |
Net assets: | | | | | | | | |
Beginning of year | | | 224,400,445 | | | | 176,628,087 | |
| | | | |
End of year | | $ | 295,596,871 | | | $ | 224,400,445 | |
| | | | |
Undistributed net investment income included in net assets: | | | | | | | | |
End of year | | $ | 559,988 | | | $ | — | |
| | | | |
The accompanying notes are an integral part of these financial statements.
FGC-14
Franklin Templeton Variable Insurance Products Trust
Notes to Financial Statements
Franklin Global Communications Securities Fund
1. ORGANIZATION AND SIGNIFICANT ACCOUNTING POLICIES
Franklin Templeton Variable Insurance Products Trust (Trust) is registered under the Investment Company Act of 1940, as amended, (1940 Act) as an open-end investment company, consisting of twenty-three separate funds. The Franklin Global Communications Securities Fund (Fund) included in this report is diversified. The financial statements of the remaining funds in the Trust are presented separately. Shares of the Fund are sold only to insurance company separate accounts to fund the benefits of variable life insurance policies or variable annuity contracts. As of December 31, 2007, 99.70% of the Fund’s shares were held through one insurance company. The Fund offers two classes of shares: Class 1 and Class 2. Each class of shares differs by its distribution fees, voting rights on matters affecting a single class and its exchange privilege.
The following summarizes the Fund’s significant accounting policies.
a. Security Valuation
Securities listed on a securities exchange or on the NASDAQ National Market System are valued at the last quoted sale price or the official closing price of the day, respectively. Over-the-counter securities and listed securities for which there is no reported sale are valued within the range of the most recent quoted bid and ask prices. Securities that trade in multiple markets or on multiple exchanges are valued according to the broadest and most representative market.
Foreign securities are valued as of the close of trading on the foreign stock exchange on which the security is primarily traded, or the NYSE, whichever is earlier. If no sale is reported at that time, the foreign security will be valued within the range of the most recent quoted bid and ask prices. The value is then converted into its U.S. dollar equivalent at the foreign exchange rate in effect at the close of the NYSE on the day that the value of the foreign security is determined.
The Trust has procedures to determine the fair value of individual securities and other assets for which market prices are not readily available or which may not be reliably priced. Methods for valuing these securities may include: fundamental analysis, matrix pricing, discounts from market prices of similar securities, or discounts applied due to the nature and duration of restrictions on the disposition of the securities. Due to the inherent uncertainty of valuations of such securities, the fair values may differ significantly from the values that would have been used had a ready market for such investments existed. Occasionally, events occur between the time at which trading in a security is completed and the close of the NYSE that might call into question the availability (including the reliability) of the value of a portfolio security held by the Fund. The investment manager monitors price movements following the close of trading in foreign stock markets through a series of country specific market proxies (such as baskets of American Depository Receipts, futures contracts and exchange traded funds). These price movements are measured against established trigger thresholds for each specific market proxy to assist in determining if an event has occurred. If such an event occurs, the securities may be valued using fair value procedures, which may include the use of independent pricing services. All security valuation procedures are approved by the Trust’s Board of Trustees.
b. Foreign Currency Translation
Portfolio securities and other assets and liabilities denominated in foreign currencies are translated into U.S. dollars based on the exchange rate of such currencies against U.S. dollars on the date of valuation. Purchases and sales of securities, income and expense items denominated in foreign currencies are translated into U.S. dollars at the exchange rate in effect on the transaction date. Occasionally, events may impact the availability or reliability of foreign exchange rates used to convert the U.S. dollar equivalent value. If such an event occurs, the foreign exchange rate will be valued at fair value using procedures established and approved by the Trust’s Board of Trustees.
The Fund does not separately report the effect of changes in foreign exchange rates from changes in market prices on securities held. Such changes are included in net realized and unrealized gain or loss from investments on the Statement of Operations.
Realized foreign exchange gains or losses arise from sales of foreign currencies, currency gains or losses realized between the trade and settlement dates on securities transactions and the difference between the recorded amounts of dividends, interest, and
FGC-15
Franklin Templeton Variable Insurance Products Trust
Notes to Financial Statements (continued)
Franklin Global Communications Securities Fund
1. ORGANIZATION AND SIGNIFICANT ACCOUNTING POLICIES (continued)
b. Foreign Currency Translation (continued)
foreign withholding taxes and the U.S. dollar equivalent of the amounts actually received or paid. Net unrealized foreign exchange gains and losses arise from changes in foreign exchange rates on foreign denominated assets and liabilities other than investments in securities held at the end of the reporting period.
c. Joint Repurchase Agreement
The Fund may enter into a joint repurchase agreement whereby its uninvested cash balance is deposited into a joint cash account with other funds managed by the investment manager or an affiliate of the investment manager and is used to invest in one or more repurchase agreements. The value and face amount of the joint repurchase agreement are allocated to the funds based on their pro-rata interest. A repurchase agreement is accounted for as a loan by the fund to the seller, collateralized by securities which are delivered to the fund’s custodian. The market value, including accrued interest, of the initial collateralization is required to be at least 102% of the dollar amount invested by the funds, with the value of the underlying securities marked to market daily to maintain coverage of at least 100%. The joint repurchase agreement held by the Fund at year end had been entered into on December 31, 2007. The joint repurchase agreement is valued at cost.
d. Securities Purchased on a When-Issued or Delayed Delivery Basis
The Fund may purchase securities on a when-issued or delayed delivery basis, with payment and delivery scheduled for a future date. These transactions are subject to market fluctuations and are subject to the risk that the value at delivery may be more or less than the trade date purchase price. Although the Fund will generally purchase these securities with the intention of holding the securities, it may sell the securities before the settlement date. Sufficient assets have been segregated for these securities.
e. Foreign Currency Contracts
When the Fund purchases or sells foreign securities it may enter into foreign exchange contracts to minimize foreign exchange risk from the trade date to the settlement date of the transactions. A foreign exchange contract is an agreement between two parties to exchange different currencies at an agreed upon exchange rate at a future date. Realized and unrealized gains and losses on these contracts are included in the Statement of Operations.
The risks of these contracts include movement in the values of the foreign currencies relative to the U.S. dollar and the possible inability of the counterparties to fulfill their obligations under the contracts, which may be in excess of the amount reflected in the Statement of Assets and Liabilities.
f. Income and Deferred Taxes
No provision has been made for U.S. income taxes because it is the Fund’s policy to qualify as a regulated investment company under the Internal Revenue Code and to distribute to shareholders substantially all of its taxable income and net realized gains.
Foreign securities held by the Fund may be subject to foreign taxation on dividend income received. Foreign taxes, if any, are recorded based on the tax regulations and rates that exist in the foreign markets in which the Fund invests.
The Fund may be subject to a tax imposed on net realized gains on securities of certain foreign countries. The Fund records an estimated deferred tax liability for net unrealized gains on these securities in an amount that would be payable if the securities were disposed of on the valuation date.
FGC-16
Franklin Templeton Variable Insurance Products Trust
Notes to Financial Statements (continued)
Franklin Global Communications Securities Fund
1. ORGANIZATION AND SIGNIFICANT ACCOUNTING POLICIES (continued)
g. Security Transactions, Investment Income, Expenses and Distributions
Security transactions are accounted for on trade date. Realized gains and losses on security transactions are determined on a specific identification basis. Interest income and estimated expenses are accrued daily. Dividend income is recorded on the ex-dividend date except that certain dividends from foreign securities are recognized as soon as the Fund is notified of the ex-dividend date. Distributions to shareholders are recorded on the ex-dividend date and are determined according to income tax regulations (tax basis). Distributable earnings determined on a tax basis may differ from earnings recorded in accordance with accounting principles generally accepted in the United States of America. These differences may be permanent or temporary. Permanent differences are reclassified among capital accounts to reflect their tax character. These reclassifications have no impact on net assets or the results of operations. Temporary differences are not reclassified, as they may reverse in subsequent periods.
Common expenses incurred by the Trust are allocated among the funds based on the ratio of net assets of each fund to the combined net assets of the Trust. Fund specific expenses are charged directly to the fund that incurred the expense.
Realized and unrealized gains and losses and net investment income, other than class specific expenses, are allocated daily to each class of shares based upon the relative proportion of net assets of each class. Differences in per share distributions, by class, are generally due to differences in class specific expenses.
h. Accounting Estimates
The preparation of financial statements in accordance with accounting principles generally accepted in the United States of America requires management to make estimates and assumptions that affect the reported amounts of assets and liabilities at the date of the financial statements and the amounts of income and expenses during the reporting period. Actual results could differ from those estimates.
i. Guarantees and Indemnifications
Under the Trust’s organizational documents, its officers and trustees are indemnified by the Trust against certain liabilities arising out of the performance of their duties to the Trust. Additionally, in the normal course of business, the Trust, on behalf of the Fund, enters into contracts with service providers that contain general indemnification clauses. The Trust’s maximum exposure under these arrangements is unknown as this would involve future claims that may be made against the Trust that have not yet occurred. Currently, the Trust expects the risk of loss to be remote.
FGC-17
Franklin Templeton Variable Insurance Products Trust
Notes to Financial Statements (continued)
Franklin Global Communications Securities Fund
2. SHARES OF BENEFICIAL INTEREST
At December 31, 2007, there were an unlimited number of shares authorized (without par value). Transactions in the Fund’s shares were as follows:
| | | | | | | | | | | | | | |
| | | Year Ended December 31, | |
| | | 2007 | | | 2006 | |
| Class 1 Shares: | | Shares | | | Amount | | | Shares | | | Amount | |
Shares sold | | 30,242 | | | $ | 378,996 | | | 57,921 | | | $ | 547,073 | |
Shares issued in reinvestment of distributions | | — | | | | — | | | 58,729 | | | | 482,164 | |
Shares redeemed | | (2,311,298 | ) | | | (26,179,358 | ) | | (2,723,642 | ) | | | (24,244,211 | ) |
| | | | |
Net increase (decrease) | | (2,281,056 | ) | | $ | (25,800,362 | ) | | (2,606,992 | ) | | $ | (23,214,974 | ) |
| | | | |
| Class 2 Shares: | | | | | | | | | | | | |
Shares sold | | 7,011,538 | | | $ | 81,791,331 | | | 5,693,989 | | | $ | 50,888,577 | |
Shares issued in reinvestment of distributions | | — | | | | — | | | 15,150 | | | | 123,165 | |
Shares redeemed | | (3,365,328 | ) | | | (37,666,708 | ) | | (2,588,691 | ) | | | (22,140,266 | ) |
| | | | |
Net increase (decrease) | | 3,646,210 | | | $ | 44,124,623 | | | 3,120,448 | | | $ | 28,871,476 | |
| | | | |
3. TRANSACTIONS WITH AFFILIATES
Franklin Resources, Inc. is the holding company for various subsidiaries that together are referred to as Franklin Templeton Investments. Certain officers and trustees of the Trust are also officers and/or directors of the following subsidiaries:
| | |
| Subsidiary | | Affiliation |
Franklin Advisers, Inc. (Advisers) | | Investment manager |
Franklin Templeton Services, LLC (FT Services) | | Administrative manager |
Franklin Templeton Distributors, Inc. (Distributors) | | Principal underwriter |
Franklin Templeton Investor Services, LLC (Investor Services) | | Transfer agent |
a. Management Fees
The Fund pays an investment management fee to Advisers based on the average daily net assets of the Fund as follows:
| | |
| Annualized Fee Rate | | Net Assets |
| 0.625% | | Up to and including $100 million |
| 0.500% | | Over $100 million, up to and including $250 million |
| 0.450% | | Over $250 million, up to and including $10 billion |
| 0.440% | | Over $10 billion, up to and including $12.5 billion |
| 0.420% | | Over $12.5 billion, up to and including $15 billion |
| 0.400% | | In excess of $15 billion |
Effective January 1, 2008, the Fund will pay fees based on the average daily net assets of the Fund as follows:
| | |
| Annualized Fee Rate | | Net Assets |
| 0.625% | | Up to and including $100 million |
| 0.500% | | Over $100 million, up to and including $250 million |
| 0.450% | | Over $250 million, up to and including $7.5 billion |
| 0.440% | | Over $7.5 billion, up to and including $10 billion |
| 0.430% | | Over $10 billion, up to and including $12.5 billion |
| 0.420% | | Over $12.5 billion, up to and including $15 billion |
| 0.400% | | In excess of $15 billion |
FGC-18
Franklin Templeton Variable Insurance Products Trust
Notes to Financial Statements (continued)
Franklin Global Communications Securities Fund
3. TRANSACTIONS WITH AFFILIATES (continued)
b. Administrative Fees
Under an agreement with Advisers, FT Services provides administrative services to the Fund. The fee is paid by Advisers based on average daily net assets, and is not an additional expense of the Fund.
c. Distribution Fees
The Fund’s Board of Trustees has adopted a distribution plan for Class 2 shares pursuant to Rule 12b-1 under the 1940 Act. Under the Fund’s compensation distribution plan, the Fund pays Distributors for costs incurred in connection with the servicing, sale and distribution of the Fund’s shares up to 0.35% per year of its average daily net assets. The Board of Trustees has agreed to limit the current rate to 0.25% per year.
d. Transfer Agent Fees
Investor Services, under terms of an agreement, performs shareholder servicing for the Fund and is not paid by the Fund for the services.
4. EXPENSE OFFSET ARRANGEMENT
The Fund has entered into an arrangement with its custodian whereby credits realized as a result of uninvested cash balances are used to reduce a portion of the Fund’s custodian expenses. During the year ended December 31, 2007, the custodian fees were reduced as noted in the Statement of Operations.
5. INCOME TAXES
The Fund has reviewed the tax positions taken on federal income tax returns, for each of the three open tax years and as of December 31, 2007 and has determined that no provision for income tax is required in the Fund’s financial statements.
For tax purposes, capital losses may be carried over to offset future capital gains, if any. At December 31, 2007, the capital loss carryforwards were as follows:
| | | |
Capital loss carryforwards expiring in: | | | |
2009 | | $ | 92,657,881 |
2010 | | | 108,979,162 |
| | | |
| | $ | 201,637,043 |
| | | |
During the year ended December 31, 2007, the Fund utilized $29,837,543 of capital loss carryforwards.
For tax purposes, realized currency losses, occurring subsequent to October 31, may be deferred and treated as occurring on the first day of the following fiscal year. At December 31, 2007, the Fund deferred realized currency losses of $183,744.
The tax character of distributions paid during the years ended December 31, 2007 and 2006, was as follows:
| | | | | | |
| | | 2007 | | 2006 |
Distributions paid from ordinary income | | $ | — | | $ | 605,329 |
FGC-19
Franklin Templeton Variable Insurance Products Trust
Notes to Financial Statements (continued)
Franklin Global Communications Securities Fund
5. INCOME TAXES (continued)
At December 31, 2007, the cost of investments, net unrealized appreciation (depreciation) and undistributed ordinary income for income tax purposes were as follows:
| | | | |
Cost of investments | | $ | 210,166,647 | |
| | | | |
| |
Unrealized appreciation | | $ | 104,410,594 | |
Unrealized depreciation | | | (12,333,868 | ) |
| | | | |
Net unrealized appreciation (depreciation) | | $ | 92,076,726 | |
| | | | |
Distributable earnings - undistributed ordinary income | | $ | 617,080 | |
| | | | |
Net investment income (loss) differs for financial statement and tax purposes primarily due to differing treatments of foreign currency transactions, passive foreign investment company shares and foreign capital gain taxes.
Net realized gains (losses) differ for financial statement and tax purposes primarily due to differing treatment of wash sales, foreign currency transactions, passive foreign investment company shares and foreign capital gain taxes.
6. INVESTMENT TRANSACTIONS
Purchases and sales of investments (excluding short term securities) for the year ended December 31, 2007, aggregated $255,896,459 and $242,000,152, respectively.
7. CONCENTRATION OF RISK
Investing in foreign securities may include certain risks and considerations not typically associated with investing in U.S. securities, such as fluctuating currency values and changing local and regional economic, political and social conditions, which may result in greater market volatility. In addition, certain foreign securities may not be as liquid as U.S. securities.
8. RESTRICTED SECURITIES
The Fund may invest in securities that are restricted under the Securities Act of 1933 (1933 Act) or which are subject to legal, contractual, or other agreed upon restrictions on resale. Restricted securities are often purchased in private placement transactions, and cannot be sold without prior registration unless the sale is pursuant to an exemption under the 1933 Act. Disposal of these securities may require greater effort and expense, and prompt sale at an acceptable price may be difficult. The Fund may have registration rights for restricted securities. The issuer generally incurs all registration costs.
At December 31, 2007, the Fund held investments in restricted securities, excluding 144A securities deemed to be liquid, valued in accordance with procedures approved by the Trust’s Board of Trustees as reflecting fair value, as follows:
| | | | | | | | | | |
| Shares | | Issuer | | Acquisition
Date | | Cost | | Value |
| 309,399 | | Dilithium Networks Inc., depository receipt, D, pfd., 144A, PIPES | | 7/13/06 | | $ | 720,899 | | $ | 1,067,426 |
| | | | | | | | | | |
| | Total Restricted Securities (0.36% of Net Assets) | | | | | | | | |
FGC-20
Franklin Templeton Variable Insurance Products Trust
Notes to Financial Statements (continued)
Franklin Global Communications Securities Fund
9. REGULATORY AND LITIGATION MATTERS
As part of various investigations by a number of federal, state, and foreign regulators and governmental entities, including the Securities and Exchange Commission (“SEC”), relating to certain practices in the mutual fund industry, including late trading, market timing and marketing support payments to securities dealers who sell fund shares (“marketing support”), Franklin Resources, Inc. and certain of its subsidiaries (collectively, the “Company”), entered into settlements with certain of those regulators and governmental entities. Specifically, the Company entered into settlements with the SEC, among others, concerning market timing and marketing support.
On June 6, 2007, the SEC posted for public comment the proposed plan of distribution for the market timing settlement. Once the SEC approves the final plan of distribution, disbursements of settlement monies will be made promptly to individuals who were shareholders of the designated funds during the relevant period, in accordance with the terms and conditions of the settlement and plan.
In addition, the Company, as well as most of the mutual funds within Franklin Templeton Investments and certain current or former officers, Company directors, fund directors, and employees, have been named in private lawsuits (styled as shareholder class actions, or as derivative actions on behalf of either the named funds or Franklin Resources, Inc.). The lawsuits relate to the industry practices referenced above.
The Company and fund management believe that the claims made in each of the private lawsuits referenced above are without merit and intend to defend against them vigorously. The Company cannot predict with certainty the eventual outcome of these lawsuits, nor whether they will have a material negative impact on the Company. If it is determined that the Company bears responsibility for any unlawful or inappropriate conduct that caused losses to the Fund, it is committed to making the Trust or its shareholders whole, as appropriate.
10. NEW ACCOUNTING PRONOUNCEMENT
In September 2006, the Financial Accounting Standards Board (FASB) issued FASB Statement No. 157, “Fair Value Measurement” (SFAS 157), which defines fair value, establishes a framework for measuring fair value, and expands disclosures about fair value measurements. SFAS 157 is effective for fiscal years beginning after November 15, 2007, and interim periods within those fiscal years. The Trust believes the adoption of SFAS 157 will have no material impact on its financial statements.
FGC-21
Franklin Templeton Variable Insurance Products Trust
Franklin Global Communications Securities Fund
Report of Independent Registered Public Accounting Firm
To the Board of Trustees and Shareholders of
Franklin Templeton Variable Insurance Products Trust
In our opinion, the accompanying statement of assets and liabilities, including the statement of investments, and the related statements of operations and of changes in net assets and the financial highlights present fairly, in all material respects, the financial position of Franklin Global Communications Securities Fund (one of the funds constituting Franklin Templeton Variable Insurance Products Trust, hereafter referred to as the “Fund”) at December 31, 2007, the results of its operations for the year then ended, the changes in its net assets for each of the two years in the period then ended and the financial highlights for each of the five years in the period then ended, in conformity with accounting principles generally accepted in the United States of America. These financial statements and financial highlights (hereafter referred to as “financial statements”) are the responsibility of the Fund’s management. Our responsibility is to express an opinion on these financial statements based on our audits. We conducted our audits of these financial statements in accordance with the standards of the Public Company Accounting Oversight Board (United States). Those standards require that we plan and perform the audit to obtain reasonable assurance about whether the financial statements are free of material misstatement. An audit includes examining, on a test basis, evidence supporting the amounts and disclosures in the financial statements, assessing the accounting principles used and significant estimates made by management, and evaluating the overall financial statement presentation. We believe that our audits, which included confirmation of securities at December 31, 2007 by correspondence with the custodian and brokers, provide a reasonable basis for our opinion.
PricewaterhouseCoopers LLP
San Francisco, California
February 14, 2008
FGC-22
FRANKLIN GLOBAL REAL ESTATE SECURITIES FUND
(FRANKLIN REAL ESTATE FUND BEFORE MAY 1, 2007)
This annual report for Franklin Global Real Estate Securities Fund covers the fiscal year ended December 31, 2007.
Performance Summary as of 12/31/07
Average annual total return of Class 1 shares* represents the average annual change in value, assuming reinvestment of dividends and capital gains. Average returns smooth out variations in returns, which can be significant; they are not the same as year-by-year results.
Periods ended 12/31/07
| | | | | | |
| | | 1-Year | | 5-Year | | 10-Year |
Average Annual Total Return | | -20.65% | | +14.43% | | +8.38% |
*The manager and administrator have contractually agreed in advance to waive or limit their respective fees so that the increase in investment management and fund administration fees provided by the Fund’s agreements effective in 2007 are phased in over a five-year period, with there being no increase in the rate of such fees for the first year ending 4/30/08. For each year thereafter through 4/30/12, the manager and administrator will receive one-fifth of the increase in the rate of fees. Beginning 5/1/12, the full new investment management and administration fees will then be in effect. If the manager and administrator had not waived fees, the Fund’s total returns would have been lower.
Total Return Index Comparison for Hypothetical $10,000 Investment (1/1/98–12/31/07)
The graph below shows the change in value of a hypothetical $10,000 investment in the Fund over the indicated period and includes reinvestment of any income or distributions. The Fund’s performance* is compared to the performance of the Standard & Poor’s 500 Index (S&P 500), the Dow Jones Wilshire Real Estate Securities Index and the S&P/Citigroup BMI Global REIT Index (hedged into U.S. dollars). One cannot invest directly in an index, nor is an index representative of the Fund’s portfolio. Please see Important Notes to Performance Information preceding the Fund Summaries.
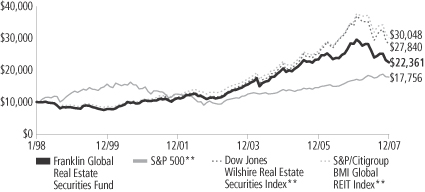
**Source: Standard & Poor’s Micropal. Please see Index Descriptions following the Fund Summaries.
Franklin Global Real Estate Securities Fund Class 1
Performance reflects the Fund’s Class 1 operating expenses, but does not include any contract fees, expenses or sales charges. If they had been included, performance would be lower. These charges and deductions, particularly for variable life policies, can have a significant effect on contract values and insurance benefits. See the contract prospectus for a complete description of these expenses, including sales charges.
Performance data represent past performance, which does not guarantee future results. Investment return and principal value will fluctuate, and you may have a gain or loss when you sell your shares.
Current performance may differ from figures shown.
FGR-1
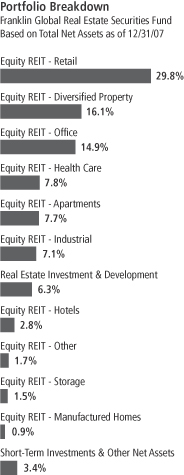
Fund Goal and Main Investments: Franklin Global Real Estate Securities Fund seeks high total return. The Fund normally invests at least 80% of its net assets in investments of companies located anywhere in the world that operate in the real estate sector.
Performance Overview
You can find the Fund’s one-year total return in the Performance Summary. The Fund underperformed its benchmark, the S&P/Citigroup BMI Global REIT Index (hedged into U.S. dollars), which returned -14.27%. For comparison, the Fund underperformed the Dow Jones Wilshire Real Estate Securities Index and the S&P 500, which returned -6.20% and +6.92%.1 The S&P/Citigroup BMI Global REIT Index (hedged into U.S. dollars) replaced the Dow Jones Wilshire Real Estate Securities Index and the S&P 500 as the Fund’s benchmark effective May 1, 2007, to coincide with the Fund’s change to a global real estate fund.1
Economic and Market Overview
In spite of elevated energy prices and widespread fears of contagion from the deteriorating U.S. housing situation, the global economy remained resilient in 2007. Consumer and corporate demand strength, particularly in China and other developing economies, generally favorable employment and accommodative monetary policies continued to underpin the current expansionary period that began in 2002.
These factors also contributed to the strength of global equity markets during 2007. However, concerns about slower growth and declining asset quality surfaced in the first quarter. These were initially centered on the U.S. subprime mortgage market but spread in August to global capital markets. Difficulties in assessing risk and the value of collateral in the structured finance industry contributed to declining risk appetite among lenders and investors. The private equity industry, which relies on the availability of cheap credit, played a pivotal role in several large and high-profile acquisitions and helped boost merger and acquisition activity in the first half of the year. This was an important driver of equity performance, but as liquidity dried up in the second half of the year, significantly slower money flows from private equity weighed on market performance. However, global merger and acquisition activity
1. Source: Standard & Poor’s Micropal. One cannot invest directly in an index, nor is an index representative of the Fund’s portfolio. Please see Index Descriptions following the Fund Summaries.
Fund Risks: The Fund’s investments in stocks offer the potential for long-term gains but can be subject to short-term price fluctuations. As a nondiversified global fund that invests predominantly in companies that operate in the real estate sector, the Fund carries much greater risk of adverse developments affecting that sector than a fund that invests more broadly. Foreign investing, especially in emerging markets, involves additional risks, including currency fluctuations, economic instability, market volatility, and political and social instability. The Fund’s prospectus also includes a description of the main investment risks.
FGR-2
still reached record levels. The staggering $4.5 trillion of deals announced in 2007 eclipsed the previous record from 2006 by 24%.2
To alleviate the credit crunch and restore investor confidence, the world’s major central banks infused capital into the system, and the U.S. Federal Reserve Board reduced its target interest rate by a full percentage point. However, credit and equity markets continued to face headwinds as write-downs and losses from subprime mortgage financing affected many large financial institutions toward the end of the year, and equity prices remained volatile.
For the year, however, global and non-U.S. equity markets registered the fifth consecutive year of double-digit total returns, making this an exceptionally strong period for investors in global equities. Broad-based stock performance by European and Asian shares at least doubled that of U.S. stocks, while emerging market equity returns more than tripled those in developed markets. Led by the BRIC countries, Brazil, Russia, India and China, emerging market economies continued to grow at accelerated rates, supporting elevated prices for oil and other commodities. At the same time, investment inflows from developed economies continued to underpin equity prices in emerging markets. In addition, U.S. dollar weakness versus the currencies of many major trading partners enhanced equity returns for U.S.-based investors holding stocks denominated in these currencies.
Global Real Estate Market Overview
The year was marked by volatility for the global real estate market in general as concerns about fallout from the subprime mortgage and liquidity crisis, as well as slower global growth rates took a toll on investor confidence. As a result, all of the major real estate investment trust (REIT) markets corrected, with the steepest losses occurring in major developed countries where REITs have grown rapidly over the past five years. In local currency terms, as measured by the S&P/Citigroup BMI Global REIT Index (hedged into U.S. dollars), U.K. REITs declined 30.86% since their introduction in February 2007. French and U.S. REITs were also substantially lower, falling 20.41% and 16.70% for the year. REIT markets in Canada, Australia, Belgium and Netherlands were generally more resilient, but still ended the year with modest losses, returning -3.10%, -8.55%, -7.94% and -10.14% in local currency, respectively. Asian markets were mixed, with the Hong Kong and Singapore markets gaining 10.39% and 2.77%, while in Japan, REITs ended
2. Source: “For Deal Makers, Tale of Two Halves,” The Wall Street Journal, 1/2/08.
FGR-3
the year down 2.26%. Property buying activity contracted substantially, particularly in the second half of the year. Private equity funds, which had represented a significant portion of the property market buyers at the start of the year, were forced to trim their purchases due to deteriorating liquidity conditions and limited financial resources.
Investment Strategy
We are research-driven, fundamental investors. Our active investment strategy is centered on the belief that unsynchronized regional economic activity within the global economy provides consistent, attractive return opportunities in the global real estate markets. When selecting investments for the Fund’s portfolio, we use a bottom-up, value-oriented stock selection process that incorporates macro-level views in the evaluation process.
Manager’s Discussion
The portfolio’s investment guidelines were updated to include international REIT markets in the Fund’s investment strategy beginning in May 2007.
During the year under review, the Fund benefited from its overweighted allocations to U.S. health care REITs Ventas and Nationwide Health Properties, relative to the Fund’s benchmark, the S&P/Citigroup BMI Global REIT Index (hedged into U.S. dollars). Ventas, a leading health care REIT that invests in inpatient rehabilitation and long-term acute care hospitals throughout the U.S. and Canada, benefited from higher rents and resident fees. Nationwide Health Properties is one of the largest owners of skilled nursing homes for the elderly in the U.S. and has nearly 500 facilities in its portfolio. During the year, the company continued to benefit from its recent acquisitions, operating leverage and rent hikes. Other major contributors to relative performance included investments in urban commercial and residential developer Forest City Enterprises (sold during the reporting period) and Macquarie Airports, an Australian airport company with significant retail operations. Neither Forest City nor Macquarie Airports were index components.
We seek to manage the Fund’s exposure to various currencies, and may from time to time seek to hedge (protect) against currency risk by using forward currency exchange contracts. Although the Fund’s hedging policy did not allow the Fund to participate in the decline of the U.S. dollar in 2007, it reduced the overall volatility of the portfolio in accordance with our high income/low volatility strategy.
FGR-4
The Fund also had some detractors from performance during the 12 months under review, mostly in the homebuilding industry, which suffered in the weak U.S. housing market environment. In particular, Meritage Homes, M.D.C. Holdings and Lennar (not index components) weighed on the Fund’s relative performance. Meritage and Lennar suffered from exposure to the deteriorating California and Florida real estate markets. M.D.C. holdings, which builds residences nationwide in addition to offering mortgage loans, title services and insurance was also a disappointment as the company was forced to curtail construction and earnings fell due to a softer housing market than in recent years. We sold our investments in all three companies when the Fund’s investment guidelines were broadened to include international REITs.
During the year, we assumed a defensive posture by increasing our exposure to health care REITs, which generally benefit from long-term leases and relatively high yields. For example, we added to or initiated positions in HCP, Ventas and Nationwide Health Properties during the reporting period. We also increased our exposure to retail operators such as Kimco Realty with prime location shopping centers, low occupancy costs and high sales growth rates. Another new defensive portfolio holding was Plum Creek Timber, a forestry REIT. In addition, we continued to invest in U.S. office companies such as Vornado Realty Trust, which have what we believed were experienced management teams prepared to buy assets in a distressed environment.
Outside the U.S., we were underweighted in Europe due to the lack of proactive monetary policies and slowing fundamentals. We favored defensive retail property and office companies in prime commercial business district locations. We trimmed our exposure to Asia in the summer as we sold several positions in Malaysia that we believed were overvalued. We kept stocks with what we thought were prime properties in prime locations as our analysis indicated that the spread between prime and secondary properties was widening and that in the recent environment, only prime properties were holding value. In light of the uncertain environment, we remained overweighted in the defensive Australian and Canadian markets, regions that have benefited from high commodity prices as well as positive spreads between property yields and interest rates.
In the current uncertain economic environment, we focused on companies that we believe are defensive and in prime locations throughout the world. Although the low level of transactions does not clearly indicate the full extent of the market decline, we believe that widening spreads
FGR-5
between AAA- and BBB-rated commercial mortgage backed securities point to a growing gap between prime and secondary properties and that an economic downturn would add to this disparity. We seek to invest in retail property companies that offer low occupancy costs and good locations to retailers who would be reluctant to close stores. We also feel that REITs with strong balance sheets have the upper hand to buy distressed assets as opportunities arise. In the red-hot New York real estate market, some U.S. office REITs in our portfolio have already stepped up purchases in the absence of highly leveraged private real estate funds. Although the outlook remains uncertain, our analysis indicates REITs are gaining market share.
Thank you for your participation in Franklin Global Real Estate Securities Fund. We look forward to serving your future investment needs.
The foregoing information reflects our analysis, opinions and portfolio holdings as of December 31, 2007, the end of the reporting period. The way we implement our main investment strategies and the resulting portfolio holdings may change depending on factors such as market and economic conditions. These opinions may not be relied upon as investment advice or an offer for a particular security. The information is not a complete analysis of every aspect of any market, country, industry, security or the Fund. Statements of fact are from sources considered reliable, but the investment manager makes no representation or warranty as to their completeness or accuracy. Although historical performance is no guarantee of future results, these insights may help you understand our investment management philosophy.
Top 10 Holdings
Franklin Global Real Estate Securities Fund
12/31/07
| | |
Company
Sector/Industry,
Country | | % of Total
Net Assets |
| |
| Westfield Group | | 7.1% |
| Equity REIT – Retail, Australia | | |
| |
| Simon Property Group Inc. | | 4.4% |
| Equity REIT – Retail, U.S. | | |
| |
| ProLogis | | 3.6% |
| Equity REIT – Industrial, U.S. | | |
| |
| Equity Residential | | 3.6% |
| Equity REIT – Apartments, U.S. | | |
| |
| Vornado Realty Trust | | 3.1% |
| Equity REIT – Office, U.S. | | |
| |
| Unibail-Rodamco | | 3.0% |
| Equity REIT – Retail, France | | |
| |
| Ventas Inc. | | 2.7% |
| Equity REIT – Health Care, U.S. | | |
| |
| Stockland | | 2.7% |
| Equity REIT – Diversified Property, Australia | | |
| |
| Kimco Realty Corp. | | 2.6% |
| Equity REIT – Retail, U.S. | | |
| |
| HCP Inc. | | 2.4% |
| Equity REIT – Health Care, U.S. | | |
The dollar value, number of shares or principal amount, and names of all portfolio holdings are listed in the Fund’s Statement of Investments.
FGR-6
Fund Expenses
As an investor in a variable insurance contract (Contract) that indirectly provides for investment in an underlying mutual fund, you can incur transaction and/or ongoing expenses at both the Fund level and the Contract level.
| • | | Transaction expenses can include sales charges (loads) on purchases, redemption fees, surrender fees, transfer fees and premium taxes. |
| • | | Ongoing expenses can include management fees, distribution and service (12b-1) fees, contract fees, annual maintenance fees, mortality and expense risk fees and other fees and expenses. All mutual funds and Contracts have some types of ongoing expenses. |
The expenses shown in the table are meant to highlight ongoing expenses at the Fund level only and do not include ongoing expenses at the Contract level, or transaction expenses at either the Fund or Contract level. While the Fund does not have transaction expenses, if the transaction and ongoing expenses at the Contract level were included, the expenses shown would be higher. You should consult your Contract prospectus or disclosure document for more information.
The table shows Fund-level ongoing expenses and can help you understand these expenses and compare them with those of other mutual funds offered through the Contract. The table assumes a $1,000 investment held for the six months indicated. Please refer to the Fund prospectus for additional information on operating expenses.
Actual Fund Expenses
The first line (Actual) of the table provides actual account values and expenses. The “Ending Account Value” is derived from the Fund’s actual return, which includes the effect of ongoing Fund expenses, but does not include the effect of ongoing Contract expenses.
You can estimate the Fund-level expenses you incurred during the period by following these steps. Of course, your account value and expenses will differ from those in this illustration:
| 1. | Divide your account value by $1,000. |
If an account had an $8,600 value, then $8,600 ÷ $1,000 = 8.6.
| 2. | Multiply the result by the number under the heading “Fund-Level Expenses Incurred During Period.” |
If Fund-Level Expenses Incurred During Period were $7.50, then 8.6 x $7.50 = $64.50.
In this illustration, the estimated expenses incurred this period at the Fund level are $64.50.
Franklin Global Real Estate Securities Fund Class 1
FGR-7
Hypothetical Example for Comparison with Other Mutual Funds
Information in the second line (Hypothetical) of the table can help you compare ongoing expenses of the Fund with those of other mutual funds offered through the Contract. This information may not be used to estimate the actual ending account balance or expenses you incurred during the period. The hypothetical “Ending Account Value” is based on the Fund’s actual expense ratio and an assumed 5% annual rate of return before expenses, which does not represent the Fund’s actual return. The figure under the heading “Fund-Level Expenses Incurred During Period” shows the hypothetical expenses your account would have incurred under this scenario. You can compare this figure with the 5% hypothetical examples that appear in shareholder reports of other funds offered through a Contract.
| | | | | | | | | |
| Class 1 | | Beginning
Account
Value 7/1/07 | | Ending
Account
Value 12/31/07 | | Fund-Level
Expenses Incurred
During Period*
7/1/07–12/31/07 |
Actual | | $ | 1,000 | | $ | 859.70 | | $ | 2.62 |
Hypothetical (5% return before expenses) | | $ | 1,000 | | $ | 1,022.38 | | $ | 2.85 |
*Expenses are calculated using the most recent six-month annualized expense ratio, net of expense waiver, for the Fund’s Class 1 shares (0.56%), which does not include any ongoing expenses of the Contract for which the Fund is an investment option, multiplied by the average account value over the period, multiplied by 184/365 to reflect the one-half year period.
FGR-8
SUPPLEMENT DATED JANUARY 31, 2008
TOTHE PROSPECTUSES DATED MAY 1, 2007
OF
FRANKLIN GLOBAL REAL ESTATE SECURITIES FUND (FUND)
A SERIESOF FRANKLIN TEMPLETON VARIABLE INSURANCE PRODUCTS TRUST
The “Management” section on page FGR-8 of the Fund’s Class 1 and Class 2 prospectuses is amended as follows:
| | 1. | Paragraph 2 of the section, relating to a sub-advisory agreement between FT Institutional and Franklin Advisers, Inc., is deleted effective the close of business January 31, 2008. Starting February 1, 2008, there will no longer be a sub-advisor for the Fund. |
| | 2. | The portfolio management line-up is replaced with the following: |
The Fund is managed by a team of dedicated professionals focused on investments in the global real estate securities market. The portfolio managers of the team are as follows:
Jack Foster
SENIOR VICE PRESIDENT OF FT INSTITUTIONAL
Mr. Foster has been a manager of the Fund since May 2007. He joined Franklin Templeton Investments in 1987.
Boris E. Pialloux CFA®1
PORTFOLIO MANAGER OF FT INSTITUTIONAL
Mr. Pialloux has been a manager of the Fund since October 2007. He joined Franklin Templeton Investments in 2006. Mr. Pialloux was an equity analyst with Deutsche Asset Management/Scudder, and has held business development and marketing positions with Mitchell Hutchins (UBS Paine Webber) Weiss, Peck & Greer (Robeco Group), and Societe Generale Asset Management for at least the prior four years.
David Levy
PORTFOLIO MANAGER OF FT INSTITUTIONAL
David Levy has been a manager of the Fund since December 2007. Prior to joining Franklin Templeton Investments in December 2007, Mr. Levy spent over 16 years at New York Life Investment Management where, since 1997, he was a portfolio manager for New York Life’s REIT portfolios.
The portfolio managers have equal authority over all aspects of the Fund’s investment portfolio, including but not limited to, purchases and sales of individual securities, portfolio risk assessment, and the management of daily cash balances in accordance with anticipated management requirements. The degree to which each manager may perform these functions, and the nature of these functions, may change from time to time.
The Fund’s SAI provides additional information about the portfolio managers’ compensation, other accounts that they manage and their ownership of Fund shares.
1. | CFA® and Chartered Financial Analyst® are trademarks owned by CFA Institute. |
Please keep this supplement for future reference.
FGR-9
Franklin Templeton Variable Insurance Products Trust
Financial Highlights
Franklin Global Real Estate Securities Fund
| | | | | | | | | | | | | | | | | | | | |
| | | Year Ended December 31, | |
| Class 1 | | 2007 | | | 2006 | | | 2005 | | | 2004 | | | 2003 | |
| | | | |
Per share operating performance | | | | | | | | | | | | | | | | | | | | |
(for a share outstanding throughout the year) | | | | | | | | | | | | | | | | | | | | |
Net asset value, beginning of year | | $ | 35.25 | | | $ | 32.55 | | | $ | 30.87 | | | $ | 23.91 | | | $ | 18.05 | |
| | | | |
Income from investment operationsa: | | | | | | | | | | | | | | | | | | | | |
Net investment incomeb | | | 0.80 | | | | 0.67 | | | | 0.70 | | | | 0.75 | | | | 0.74 | |
Net realized and unrealized gains (losses) | | | (7.56 | ) | | | 5.40 | | | | 3.38 | | | | 6.78 | | | | 5.67 | |
| | | | |
Total from investment operations | | | (6.76 | ) | | | 6.07 | | | | 4.08 | | | | 7.53 | | | | 6.41 | |
| | | | |
Less distributions from: | | | | | | | | | | | | | | | | | | | | |
Net investment income | | | (0.81 | ) | | | (0.75 | ) | | | (0.49 | ) | | | (0.53 | ) | | | (0.55 | ) |
Net realized gains | | | (2.26 | ) | | | (2.62 | ) | | | (1.91 | ) | | | (0.04 | ) | | | — | |
| | | | |
Total distributions | | | (3.07 | ) | | | (3.37 | ) | | | (2.40 | ) | | | (0.57 | ) | | | (0.55 | ) |
| | | | |
Net asset value, end of year | | $ | 25.42 | | | $ | 35.25 | | | $ | 32.55 | | | $ | 30.87 | | | $ | 23.91 | |
| | | | |
| | | | | |
Total returnc | | | (20.65)% | | | | 20.87% | | | | 13.74% | | | | 32.19% | | | | 36.08% | |
Ratios to average net assets | | | | | | | | | | | | | | | | | | | | |
Expenses before waiver and payments by affiliates | | | 0.84% | | | | 0.50% | | | | 0.49% | | | | 0.50% | | | | 0.53% | |
Expenses net of waiver and payments by affiliates | | | 0.52% | d | | | 0.50% | d | | | 0.49% | d | | | 0.50% | d | | | 0.53% | |
Net investment income | | | 2.57% | | | | 2.04% | | | | 2.32% | | | | 3.00% | | | | 3.62% | |
| | | | | |
Supplemental data | | | | | | | | | | | | | | | | | | | | |
Net assets, end of year (000’s) | | $ | 83,250 | | | $ | 140,487 | | | $ | 145,425 | | | $ | 152,451 | | | $ | 134,468 | |
Portfolio turnover rate | | | 121.84% | | | | 31.39% | | | | 36.10% | | | | 39.42% | | | | 15.44% | |
a The amount shown for a share outstanding throughout the period may not correlate with the Statement of Operations for the period due to the timing of sales and repurchases of the Fund shares in relation to income earned and/or fluctuating market value of the investments of the Fund.
b Based on average daily shares outstanding.
c Total return does not include any fees, charges or expenses imposed by the variable annuity and life insurance contracts for which the Franklin Templeton Variable Insurance Products Trust serves as an underlying investment vehicle.
d Benefit of expense reduction rounds to less than 0.01%.
The accompanying notes are an integral part of these financial statements.
FGR-10
Franklin Templeton Variable Insurance Products Trust
Financial Highlights (continued)
Franklin Global Real Estate Securities Fund
| | | | | | | | | | | | | | | | | | | | |
| | | Year Ended December 31, | |
| Class 2 | | 2007 | | | 2006 | | | 2005 | | | 2004 | | | 2003 | |
| | | | |
Per share operating performance | | | | | | | | | | | | | | | | | | | | |
(for a share outstanding throughout the year) | | | | | | | | | | | | | | | | | | | | |
Net asset value, beginning of year | | $ | 34.67 | | | $ | 32.08 | | | $ | 30.49 | | | $ | 23.65 | | | $ | 17.88 | |
| | | | |
Income from investment operationsa: | | | | | | | | | | | | | | | | | | | | |
Net investment incomeb | | | 0.72 | | | | 0.58 | | | | 0.64 | | | | 0.72 | | | | 0.74 | |
Net realized and unrealized gains (losses) | | | (7.43 | ) | | | 5.31 | | | | 3.30 | | | | 6.65 | | | | 5.55 | |
| | | | |
Total from investment operations | | | (6.71 | ) | | | 5.89 | | | | 3.94 | | | | 7.37 | | | | 6.29 | |
| | | | |
Less distributions from: | | | | | | | | | | | | | | | | | | | | |
Net investment income | | | (0.73 | ) | | | (0.68 | ) | | | (0.44 | ) | | | (0.49 | ) | | | (0.52 | ) |
Net realized gains | | | (2.26 | ) | | | (2.62 | ) | | | (1.91 | ) | | | (0.04 | ) | | | — | |
| | | | |
Total distributions | | | (2.99 | ) | | | (3.30 | ) | | | (2.35 | ) | | | (0.53 | ) | | | (0.52 | ) |
| | | | |
Net asset value, end of year | | $ | 24.97 | | | $ | 34.67 | | | $ | 32.08 | | | $ | 30.49 | | | $ | 23.65 | |
| | | | |
| | | | | |
Total returnc | | | (20.86)% | | | | 20.58% | | | | 13.47% | | | | 31.80% | | | | 35.75% | |
Ratios to average net assets | | | | | | | | | | | | | | | | | | | | |
Expenses before waiver and payments by affiliates | | | 1.09% | | | | 0.75% | | | | 0.74% | | | | 0.75% | | | | 0.78% | |
Expenses net of waiver and payments by affiliates | | | 0.77% | d | | | 0.75% | d | | | 0.74% | d | | | 0.75% | d | | | 0.78% | |
Net investment income | | | 2.32% | | | | 1.79% | | | | 2.07% | | | | 2.75% | | | | 3.37% | |
| | | | | |
Supplemental data | | | | | | | | | | | | | | | | | | | | |
Net assets, end of year (000’s) | | $ | 893,837 | | | $ | 1,491,571 | | | $ | 1,343,868 | | | $ | 1,005,647 | | | $ | 522,415 | |
Portfolio turnover rate | | | 121.84% | | | | 31.39% | | | | 36.10% | | | | 39.42% | | | | 15.44% | |
a The amount shown for a share outstanding throughout the period may not correlate with the Statement of Operations for the period due to the timing of sales and repurchases of the Fund shares in relation to income earned and/or fluctuating market value of the investments of the Fund.
b Based on average daily shares outstanding.
c Total return does not include any fees, charges or expenses imposed by the variable annuity and life insurance contracts for which the Franklin Templeton Variable Insurance Products Trust serves as an underlying investment vehicle.
d Benefit of expense reduction rounds to less than 0.01%.
The accompanying notes are an integral part of these financial statements.
FGR-11
Franklin Templeton Variable Insurance Products Trust
Statement of Investments, December 31, 2007
| | | | | | | |
| Franklin Global Real Estate Securities Fund | | Country | | Shares | | Value |
Long Term Investments 96.6% | | | | | | | |
Common Stocks 96.5% | | | | | | | |
Equity REIT - Apartments 7.7% | | | | | | | |
AvalonBay Communities Inc. | | United States | | 184,500 | | $ | 17,368,830 |
Camden Property Trust | | United States | | 262,700 | | | 12,649,005 |
Equity Residential | | United States | | 957,200 | | | 34,909,084 |
Nippon Accommodations Fund Inc. | | Japan | | 523 | | | 2,734,242 |
Post Properties Inc. | | United States | | 210,900 | | | 7,406,808 |
| | | | | | | |
| | | | | | | 75,067,969 |
| | | | | | | |
Equity REIT - Diversified Property 16.1% | | | | | | | |
Allco Commercial Real Estate Investment Trust | | Singapore | | 3,254,291 | | | 2,020,598 |
British Land Co. PLC | | United Kingdom | | 941,000 | | | 17,678,203 |
Canadian REIT | | Canada | | 369,800 | | | 10,787,926 |
Challenger Diversified Property Group | | Australia | | 14,552,790 | | | 12,750,427 |
DB RREEF Trust | | Australia | | 7,279,600 | | | 12,756,043 |
General Property Trust | | Australia | | 2,836,600 | | | 10,040,560 |
Hammerson PLC | | United Kingdom | | 486,900 | | | 9,867,949 |
Land Securities Group PLC | | United Kingdom | | 777,600 | | | 23,268,489 |
Link REIT | | Hong Kong | | 4,175,000 | | | 9,037,330 |
Mirvac Group | | Australia | | 1,840,700 | | | 9,676,376 |
Mori Hills REIT Investment Corp. | | Japan | | 580 | | | 4,004,842 |
Stockland | | Australia | | 3,514,100 | | | 25,924,158 |
Valad Property Group | | Australia | | 3,391,280 | | | 3,832,938 |
Wereldhave NV | | Netherlands | | 51,400 | | | 5,604,791 |
| | | | | | | |
| | | | | | | 157,250,630 |
| | | | | | | |
Equity REIT - Health Care 7.8% | | | | | | | |
HCP Inc. | | United States | | 683,400 | | | 23,768,652 |
Nationwide Health Properties Inc. | | United States | | 620,200 | | | 19,455,674 |
OMEGA Healthcare Investors Inc. | | United States | | 423,100 | | | 6,790,755 |
Ventas Inc. | | United States | | 587,600 | | | 26,588,900 |
| | | | | | | |
| | | | | | | 76,603,981 |
| | | | | | | |
Equity REIT - Hotels 2.8% | | | | | | | |
Host Hotels & Resorts Inc. | | United States | | 1,116,214 | | | 19,020,287 |
LaSalle Hotel Properties | | United States | | 270,500 | | | 8,628,950 |
| | | | | | | |
| | | | | | | 27,649,237 |
| | | | | | | |
Equity REIT - Industrial 7.1% | | | | | | | |
AMB Property Corp. | | United States | | 215,000 | | | 12,375,400 |
Goodman Group | | Australia | | 3,224,600 | | | 13,815,391 |
ING Industrial Fund | | Australia | | 2,418,800 | | | 5,382,848 |
Mapletree Logistics Trust | | Singapore | | 3,994,122 | | | 3,020,287 |
ProLogis | | United States | | 551,247 | | | 34,938,035 |
| | | | | | | |
| | | | | | | 69,531,961 |
| | | | | | | |
Equity REIT - Manufactured Homes 0.9% | | | | | | | |
Equity Lifestyle Properties Inc. | | United States | | 105,800 | | | 4,831,886 |
Sun Communities Inc. | | United States | | 183,100 | | | 3,857,917 |
| | | | | | | |
| | | | | | | 8,689,803 |
| | | | | | | |
Equity REIT - Office 14.9% | | | | | | | |
Boston Properties Inc. | | United States | | 211,700 | | | 19,436,177 |
CapitaCommercial Trust | | Singapore | | 2,696,100 | | | 4,563,796 |
Champion REIT | | Hong Kong | | 10,472,100 | | | 6,137,072 |
FGR-12
Franklin Templeton Variable Insurance Products Trust
Statement of Investments, December 31, 2007 (continued)
| | | | | | | |
| Franklin Global Real Estate Securities Fund | | Country | | Shares | | Value |
Long Term Investments (continued) | | | | | | | |
Common Stocks (continued) | | | | | | | |
Equity REIT - Office (continued) | | | | | | | |
Commonwealth Property Office Fund | | Australia | | 7,974,245 | | $ | 10,794,350 |
Cousins Properties Inc. | | United States | | 191,300 | | | 4,227,730 |
Japan Prime Realty Investment Co. | | Japan | | 930 | | | 3,752,858 |
Japan Real Estate Investment Co. | | Japan | | 1,057 | | | 13,269,964 |
Kenedix Realty Investment Corp. | | Japan | | 691 | | | 4,622,571 |
aKenedix Realty Investment Corp., 144A | | Japan | | 265 | | | 1,772,766 |
Macquarie Office Trust | | Australia | | 2,879,009 | | | 3,531,421 |
MID REIT Inc. | | Japan | | 1,051 | | | 4,929,140 |
Nippon Building Fund Inc. | | Japan | | 1,014 | | | 14,275,927 |
Nippon Commercial Investment Corp. | | Japan | | 1,143 | | | 5,114,621 |
Nomura Real Estate Office Fund Inc. | | Japan | | 690 | | | 6,558,759 |
ORIX JREIT Inc. | | Japan | | 660 | | | 4,350,087 |
SL Green Realty Corp. | | United States | | 82,600 | | | 7,719,796 |
Vornado Realty Trust | | United States | | 341,200 | | | 30,008,540 |
| | | | | | | |
| | | | | | | 145,065,575 |
| | | | | | | |
Equity REIT - Other 1.7% | | | | | | | |
Plum Creek Timber Co. Inc. | | United States | | 354,000 | | | 16,298,160 |
| | | | | | | |
Equity REIT - Retail 29.7% | | | | | | | |
CapitaMall Trust | | Singapore | | 2,724,100 | | | 6,538,823 |
CapitaRetail China Trust | | China | | 1,967,000 | | | 2,933,886 |
CFS Retail Property Trust | | Australia | | 4,689,135 | | | 9,613,622 |
Eurocommercial Properties NV | | Netherlands | | 228,400 | | | 11,766,038 |
Federal Realty Investment Trust | | United States | | 117,400 | | | 9,644,410 |
General Growth Properties Inc. | | United States | | 221,400 | | | 9,117,252 |
Japan Retail Fund Investment Corp. | | Japan | | 1,048 | | | 7,490,077 |
Kimco Realty Corp. | | United States | | 659,500 | | | 24,005,800 |
Liberty International PLC | | United Kingdom | | 666,900 | | | 14,350,801 |
Macquarie DDR Trust | | Australia | | 599,590 | | | 404,505 |
Regency Centers Corp. | | United States | | 297,400 | | | 19,179,326 |
RioCan REIT | | Canada | | 971,100 | | | 21,322,669 |
Simon Property Group Inc. | | United States | | 491,245 | | | 42,669,541 |
Taubman Centers Inc. | | United States | | 267,100 | | | 13,138,649 |
Unibail-Rodamco | | France | | 132,253 | | | 28,889,314 |
Westfield Group | | Australia | | 3,772,800 | | | 69,416,311 |
| | | | | | | |
| | | | | | | 290,481,024 |
| | | | | | | |
Equity REIT - Storage 1.5% | | | | | | | |
Public Storage | | United States | | 197,200 | | | 14,476,452 |
| | | | | | | |
Real Estate Investment & Development 6.3% | | | | | | | |
Australian Infrastructure Fund | | Australia | | 4,167,700 | | | 11,319,744 |
Charter Hall Group | | Australia | | 5,214,100 | | | 11,375,151 |
bEurosic | | France | | 138,600 | | | 7,075,261 |
Homburg Invest Inc. | | Canada | | 1,093,900 | | | 4,843,432 |
Koninklijke Vopak NV | | Netherlands | | 115,100 | | | 6,517,282 |
Macquarie Airports | | Australia | | 4,142,900 | | | 14,700,697 |
Norwegian Property ASA | | Norway | | 470,500 | | | 5,757,337 |
| | | | | | | |
| | | | | | | 61,588,904 |
| | | | | | | |
Total Common Stocks (Cost $927,044,781) | | | | | | | 942,703,696 |
| | | | | | | |
FGR-13
Franklin Templeton Variable Insurance Products Trust
Statement of Investments, December 31, 2007 (continued)
| | | | | | | | |
| Franklin Global Real Estate Securities Fund | | Country | | Shares | | Value |
Long Term Investments (continued) | | | | | | | | |
Preferred Stock (Cost $1,166,844) 0.1% | | | | | | | | |
Equity REIT - Retail 0.1% | | | | | | | | |
Kimco Realty Corp., 7.75%, pfd., G | | United States | | | 46,100 | | $ | 1,053,846 |
| | | | | | | | |
Total Long Term Investments (Cost $928,211,625) | | | | | | | | 943,757,542 |
| | | | | | | | |
| | | |
| | | | | Principal
Amount | | |
Short Term Investment (Cost $20,309,783) 2.1% | | | | | | | | |
Repurchase Agreement 2.1% | | | | | | | | |
cJoint Repurchase Agreement, 3.773%, 1/02/08 (Maturity Value $20,314,040) | | United States | | $ | 20,309,783 | | | 20,309,783 |
ABN AMRO Bank, NV, New York Branch (Maturity Value $1,998,902) | | | | | | | | |
Banc of America Securities LLC (Maturity Value $1,998,902) | | | | | | | | |
Barclays Capital Inc. (Maturity Value $920,632) | | | | | | | | |
BNP Paribas Securities Corp. (Maturity Value $1,998,902) | | | | | | | | |
Credit Suisse Securities (USA) LLC (Maturity Value $525,930) | | | | | | | | |
Deutsche Bank Securities Inc. (Maturity Value $1,998,902) | | | | | | | | |
Dresdner Kleinwort Wasserstein Securities LLC (Maturity Value $1,998,902) | | | | | | | | |
Goldman, Sachs & Co. (Maturity Value $2,419,605) | | | | | | | | |
Greenwich Capital Markets Inc. (Maturity Value $1,998,902) | | | | | | | | |
Lehman Brothers Inc. (Maturity Value $2,455,559) | | | | | | | | |
Merrill Lynch Government Securities Inc. (Maturity Value $1,998,902) | | | | | | | | |
Collateralized by U.S. Government Agency Securities, 3.00% - 6.25%, 1/15/08 - 11/14/12; dU.S. Government Agency Discount Notes, 1/02/08 - 8/01/12; dU.S. Treasury Bill, 6/12/08 and U.S. Treasury Notes, 3.25% - 4.625%, 3/31/08 - 8/15/10 | | | | | | | | |
| | | | | | | | |
Total Investments (Cost $948,521,408) 98.7% | | | | | | | | 964,067,325 |
Net Unrealized Gain on Forward Exchange Contracts 0.7% | | | | | | | | 7,387,348 |
Other Assets, less Liabilities 0.6% | | | | | | | | 5,632,219 |
| | | | | | | | |
Net Assets 100.0% | | | | | | | $ | 977,086,892 |
| | | | | | | | |
Selected Portfolio Abbreviations
REIT - Real Estate Investment Trust
a Security was purchased pursuant to Rule 144A under the Securities Act of 1933 and may be sold in transactions exempt from registration only to qualified institutional buyers or in a public offering registered under the Securities Act of 1933. These securities have been deemed liquid under guidelines approved by the Fund’s Board of Trustees. At December 31, 2007, the value of this security was $1,772,766, representing 0.18% of net assets.
b Non-income producing for the twelve months ended December 31, 2007.
c See Note 1(c) regarding joint repurchase agreement.
d The security is traded on a discount basis with no stated coupon rate.
The accompanying notes are an integral part of these financial statements.
FGR-14
Franklin Templeton Variable Insurance Products Trust
Financial Statements
Statement of Assets and Liabilities
December 31, 2007
| | | | |
| | | Franklin Global
Real Estate
Securities Fund | |
Assets: | | | | |
Investments in securities: | | | | |
Cost - Unaffiliated issuers | | $ | 928,211,625 | |
Cost - Repurchase agreements | | | 20,309,783 | |
| | | | |
Total cost of investments | | $ | 948,521,408 | |
| | | | |
Value - Unaffiliated issuers | | $ | 943,757,542 | |
Value - Repurchase agreements | | | 20,309,783 | |
| | | | |
Total value of investments | | | 964,067,325 | |
Foreign currency, at value (cost $169,458) | | | 211,867 | |
Receivables: | | | | |
Investment securities sold | | | 4,330,109 | |
Capital shares sold | | | 23,823 | |
Dividends | | | 8,124,599 | |
Unrealized gain on forward exchange contracts (Note 7) | | | 11,224,348 | |
| | | | |
Total assets | | | 987,982,071 | |
| | | | |
Liabilities: | | | | |
Payables: | | | | |
Investment securities purchased | | | 5,371,278 | |
Capital shares redeemed | | | 454,579 | |
Affiliates | | | 799,803 | |
Funds advanced by custodian | | | 16,647 | |
Unrealized loss on forward exchange contracts (Note 7) | | | 3,837,000 | |
Accrued expenses and other liabilities | | | 415,872 | |
| | | | |
Total liabilities | | | 10,895,179 | |
| | | | |
Net assets, at value | | $ | 977,086,892 | |
| | | | |
Net assets consist of: | | | | |
Paid-in capital | | $ | 795,588,185 | |
Distributions in excess of net investment income | | | (2,396,222 | ) |
Net unrealized appreciation (depreciation) | | | 23,040,287 | |
Accumulated net realized gain (loss) | | | 160,854,642 | |
| | | | |
Net assets, at value | | $ | 977,086,892 | |
| | | | |
Class 1: | | | | |
Net assets, at value | | $ | 83,250,342 | |
| | | | |
Shares outstanding | | | 3,274,809 | |
| | | | |
Net asset value and maximum offering price per share | | $ | 25.42 | |
| | | | |
Class 2: | | | | |
Net assets, at value | | $ | 893,836,550 | |
| | | | |
Shares outstanding | | | 35,797,305 | |
| | | | |
Net asset value and maximum offering price per share | | $ | 24.97 | |
| | | | |
The accompanying notes are an integral part of these financial statements.
FGR-15
Franklin Templeton Variable Insurance Products Trust
Financial Statements (continued)
Statement of Operations
for the year ended December 31, 2007
| | | | |
| | | Franklin Global
Real Estate
Securities Fund | |
Investment income: | | | | |
Dividends (net of foreign taxes of $2,657,169) | | $ | 37,209,295 | |
Interest | | | 5,271,478 | |
| | | | |
Total investment income | | | 42,480,773 | |
| | | | |
Expenses: | | | | |
Management fees (Note 3a) | | | 8,606,147 | |
Administrative fees (Note 3b) | | | 2,095,502 | |
Distribution fees - Class 2 (Note 3c) | | | 3,144,499 | |
Unaffiliated transfer agent fees | | | 187,432 | |
Custodian fees (Note 4) | | | 148,716 | |
Reports to shareholders | | | 291,389 | |
Professional fees | | | 88,985 | |
Trustees’ fees and expenses | | | 5,592 | |
Other | | | 30,922 | |
| | | | |
Total expenses | | | 14,599,184 | |
Expense reductions (Note 4) | | | (7,990 | ) |
Expenses waived/paid by affiliates (Note 3e) | | | (4,272,782 | ) |
| | | | |
Net expenses | | | 10,318,412 | |
| | | | |
Net investment income | | | 32,162,361 | |
| | | | |
Realized and unrealized gains (losses): | | | | |
Net realized gain (loss) from: | | | | |
Investments: | | | | |
Unaffiliated Issuers | | | 166,399,409 | |
Non-controlled affiliated issuers (Note 9) | | | 4,195,860 | |
Foreign currency transactions | | | (41,946,082 | ) |
| | | | |
Net realized gain (loss) | | | 128,649,187 | |
| | | | |
Net change in unrealized appreciation (depreciation) on: | | | | |
Investments | | | (461,308,311 | ) |
Translation of assets and liabilities denominated in foreign currencies | | | 123,997 | |
| | | | |
Net change in unrealized appreciation (depreciation) | | | (461,184,314 | ) |
| | | | |
Net realized and unrealized gain (loss) | | | (332,535,127 | ) |
| | | | |
Net increase (decrease) in net assets resulting from operations | | $ | (300,372,766 | ) |
| | | | |
The accompanying notes are an integral part of these financial statements.
FGR-16
Franklin Templeton Variable Insurance Products Trust
Financial Statements (continued)
Statements of Changes in Net Assets
| | | | | | | | |
| | | Franklin Global Real Estate
Securities Fund | |
| | | Year Ended December 31, | |
| | | 2007 | | | 2006 | |
| | | | |
Increase (decrease) in net assets: | | | | | | | | |
Operations: | | | | | | | | |
Net investment income | | $ | 32,162,361 | | | $ | 27,867,792 | |
Net realized gain (loss) from investments and foreign currency transactions | | | 128,649,187 | | | | 103,464,225 | |
Net change in unrealized appreciation (depreciation) on investments and translation of assets and liabilities denominated in foreign currencies | | | (461,184,314 | ) | | | 151,830,642 | |
| | | | |
Net increase (decrease) in net assets resulting from operations | | | (300,372,766 | ) | | | 283,162,659 | |
| | | | |
Distributions to shareholders from: | | | | | | | | |
Net investment income: | | | | | | | | |
Class 1 | | | (2,857,012 | ) | | | (2,972,697 | ) |
Class 2 | | | (29,449,245 | ) | | | (28,165,696 | ) |
Net realized gains: | | | | | | | | |
Class 1 | | | (7,916,992 | ) | | | (10,457,689 | ) |
Class 2 | | | (91,299,137 | ) | | | (109,387,703 | ) |
| | | | |
Total distributions to shareholders | | | (131,522,386 | ) | | | (150,983,785 | ) |
| | | | |
Capital share transactions: (Note 2) | | | | | | | | |
Class 1 | | | (22,282,799 | ) | | | (17,534,147 | ) |
Class 2 | | | (200,793,537 | ) | | | 28,119,966 | |
| | | | |
Total capital share transactions | | | (223,076,336 | ) | | | 10,585,819 | |
| | | | |
Net increase (decrease) in net assets | | | (654,971,488 | ) | | | 142,764,693 | |
Net assets: | | | | | | | | |
Beginning of year | | | 1,632,058,380 | | | | 1,489,293,687 | |
| | | | |
End of year | | $ | 977,086,892 | | | $ | 1,632,058,380 | |
| | | | |
Undistributed net investment income (distributions in excess of net investment income) included in
net assets: | | | | | | | | |
End of year | | $ | (2,396,222 | ) | | $ | 36,716,081 | |
| | | | |
The accompanying notes are an integral part of these financial statements.
FGR-17
Franklin Templeton Variable Insurance Products Trust
Notes to Financial Statements
Franklin Global Real Estate Securities Fund
1. ORGANIZATION AND SIGNIFICANT ACCOUNTING POLICIES
Franklin Templeton Variable Insurance Products Trust (Trust) is registered under the Investment Company Act of 1940, as amended, (1940 Act) as an open-end investment company, consisting of twenty-three separate funds. The Franklin Global Real Estate Securities Fund (Fund) included in this report is non-diversified. The financial statements of the remaining funds in the Trust are presented separately. Shares of the Fund are sold only to insurance company separate accounts to fund the benefits of variable life insurance policies or variable annuity contracts. As of December 31, 2007, 61.87% of the Fund’s shares were held through one insurance company. The Fund offers two classes of shares: Class 1 and Class 2. Each class of shares differs by its distribution fees, voting rights on matters affecting a single class and its exchange privilege.
Effective May 1, 2007, the Franklin Real Estate Fund was renamed the Franklin Global Real Estate Securities Fund.
The following summarizes the Fund's significant accounting policies.
a. Security Valuation
Securities listed on a securities exchange or on the NASDAQ National Market System are valued at the last quoted sale price or the official closing price of the day, respectively. Over-the-counter securities and listed securities for which there is no reported sale are valued within the range of the most recent quoted bid and ask prices. Securities that trade in multiple markets or on multiple exchanges are valued according to the broadest and most representative market.
Foreign securities are valued as of the close of trading on the foreign stock exchange on which the security is primarily traded, or the NYSE, whichever is earlier. If no sale is reported at that time, the foreign security will be valued within the range of the most recent quoted bid and ask prices. The value is then converted into its U.S. dollar equivalent at the foreign exchange rate in effect at the close of the NYSE on the day that the value of the foreign security is determined.
The Trust has procedures to determine the fair value of individual securities and other assets for which market prices are not readily available or which may not be reliably priced. Methods for valuing these securities may include: fundamental analysis, matrix pricing, discounts from market prices of similar securities, or discounts applied due to the nature and duration of restrictions on the disposition of the securities. Due to the inherent uncertainty of valuations of such securities, the fair values may differ significantly from the values that would have been used had a ready market for such investments existed. Occasionally, events occur between the time at which trading in a security is completed and the close of the NYSE that might call into question the availability (including the reliability) of the value of a portfolio security held by the Fund. The investment manager monitors price movements following the close of trading in foreign stock markets through a series of country specific market proxies (such as baskets of American Depository Receipts, futures contracts and exchange traded funds). These price movements are measured against established trigger thresholds for each specific market proxy to assist in determining if an event has occurred. If such an event occurs, the securities may be valued using fair value procedures, which may include the use of independent pricing services. All security valuation procedures are approved by the Trust’s Board of Trustees.
b. Foreign Currency Translation
Portfolio securities and other assets and liabilities denominated in foreign currencies are translated into U.S. dollars based on the exchange rate of such currencies against U.S. dollars on the date of valuation. Purchases and sales of securities, income and expense items denominated in foreign currencies are translated into U.S. dollars at the exchange rate in effect on the transaction date. Occasionally, events may impact the availability or reliability of foreign exchange rates used to convert the U.S. dollar equivalent value. If such an event occurs, the foreign exchange rate will be valued at fair value using procedures established and approved by the Trust’s Board of Trustees.
The Fund does not separately report the effect of changes in foreign exchange rates from changes in market prices on securities held. Such changes are included in net realized and unrealized gain or loss from investments on the Statement of Operations.
FGR-18
Franklin Templeton Variable Insurance Products Trust
Notes to Financial Statements (continued)
Franklin Global Real Estate Securities Fund
1. ORGANIZATION AND SIGNIFICANT ACCOUNTING POLICIES (continued)
b. Foreign Currency Translation (continued)
Realized foreign exchange gains or losses arise from sales of foreign currencies, currency gains or losses realized between the trade and settlement dates on securities transactions and the difference between the recorded amounts of dividends, interest, and foreign withholding taxes and the U.S. dollar equivalent of the amounts actually received or paid. Net unrealized foreign exchange gains and losses arise from changes in foreign exchange rates on foreign denominated assets and liabilities other than investments in securities held at the end of the reporting period.
c. Joint Repurchase Agreement
The Fund may enter into a joint repurchase agreement whereby its uninvested cash balance is deposited into a joint cash account with other funds managed by the investment manager or an affiliate of the investment manager and is used to invest in one or more repurchase agreements. The value and face amount of the joint repurchase agreement are allocated to the funds based on their pro-rata interest. A repurchase agreement is accounted for as a loan by the fund to the seller, collateralized by securities which are delivered to the fund's custodian. The market value, including accrued interest, of the initial collateralization is required to be at least 102% of the dollar amount invested by the funds, with the value of the underlying securities marked to market daily to maintain coverage of at least 100%. The joint repurchase agreement held by the Fund at year end had been entered into on December 31, 2007. The joint repurchase agreement is valued at cost.
d. Foreign Currency Contracts
When the Fund purchases or sells foreign securities it may enter into foreign exchange contracts to minimize foreign exchange risk from the trade date to the settlement date of the transactions. A foreign exchange contract is an agreement between two parties to exchange different currencies at an agreed upon exchange rate at a future date. Realized and unrealized gains and losses on these contracts are included in the Statement of Operations.
The Fund may also enter into forward exchange contracts to hedge against fluctuations in foreign exchange rates. These contracts are valued daily by the Fund and the unrealized gains or losses on the contracts, as measured by the difference between the contractual forward foreign exchange rates and the forward rates at the reporting date, are included in the Statement of Assets and Liabilities. Realized and unrealized gains and losses on these contracts are included in the Statement of Operations.
The risks of these contracts include movement in the values of the foreign currencies relative to the U.S. dollar and the possible inability of the counterparties to fulfill their obligations under the contracts, which may be in excess of the amount reflected in the Statement of Assets and Liabilities.
e. Income Taxes
No provision has been made for U.S. income taxes because it is the Fund's policy to qualify as a regulated investment company under the Internal Revenue Code and to distribute to shareholders substantially all of its taxable income and net realized gains.
Foreign securities held by the Fund may be subject to foreign taxation on dividend income received. Foreign taxes, if any, are recorded based on the tax regulations and rates that exist in the foreign markets in which the Fund invests.
f. Security Transactions, Investment Income, Expenses and Distributions
Security transactions are accounted for on trade date. Realized gains and losses on security transactions are determined on a specific identification basis. Interest income and estimated expenses are accrued daily. Dividend income is recorded on the ex-dividend date except that certain dividends from foreign securities are recognized as soon as the Fund is notified of the ex-dividend date. Distributions to shareholders are recorded on the ex-dividend date and are determined according to income tax regulations (tax basis). Distributable earnings determined on a tax basis may differ from earnings recorded in accordance with
FGR-19
Franklin Templeton Variable Insurance Products Trust
Notes to Financial Statements (continued)
Franklin Global Real Estate Securities Fund
1. ORGANIZATION AND SIGNIFICANT ACCOUNTING POLICIES (continued)
f. Security Transactions, Investment Income, Expenses and Distributions (continued)
accounting principles generally accepted in the United States of America. These differences may be permanent or temporary. Permanent differences are reclassified among capital accounts to reflect their tax character. These reclassifications have no impact on net assets or the results of operations. Temporary differences are not reclassified, as they may reverse in subsequent periods.
Common expenses incurred by the Trust are allocated among the funds based on the ratio of net assets of each fund to the combined net assets of the Trust. Fund specific expenses are charged directly to the fund that incurred the expense.
Realized and unrealized gains and losses and net investment income, other than class specific expenses, are allocated daily to each class of shares based upon the relative proportion of net assets of each class. Differences in per share distributions, by class, are generally due to differences in class specific expenses.
Distributions received by the Trust from certain securities may be a return of capital (ROC). Such distributions reduce the cost basis of the securities, and any distributions in excess of the cost basis are recognized as capital gains.
g. Accounting Estimates
The preparation of financial statements in accordance with accounting principles generally accepted in the United States of America requires management to make estimates and assumptions that affect the reported amounts of assets and liabilities at the date of the financial statements and the amounts of income and expenses during the reporting period. Actual results could differ from those estimates.
h. Guarantees and Indemnifications
Under the Trust's organizational documents, its officers and trustees are indemnified by the Trust against certain liabilities arising out of the performance of their duties to the Trust. Additionally, in the normal course of business, the Trust, on behalf of the Fund, enters into contracts with service providers that contain general indemnification clauses. The Trust's maximum exposure under these arrangements is unknown as this would involve future claims that may be made against the Trust that have not yet occurred. Currently, the Trust expects the risk of loss to be remote.
2. SHARES OF BENEFICIAL INTEREST
At December 31, 2007, there were an unlimited number of shares authorized (without par value). Transactions in the Fund's shares were as follows:
| | | | | | | | | | | | | | |
| | | Year Ended December 31, | |
| | | 2007 | | | 2006 | |
| Class 1 Shares: | | Shares | | | Amount | | | Shares | | | Amount | |
Shares sold | | 9,797 | | | $ | 284,754 | | | 18,170 | | | $ | 618,107 | |
Shares issued in reinvestment of distributions | | 352,092 | | | | 10,774,004 | | | 463,277 | | | | 13,430,386 | |
Shares redeemed | | (1,072,312 | ) | | | (33,341,557 | ) | | (963,820 | ) | | | (31,582,640 | ) |
| | | | |
Net increase (decrease) | | (710,423 | ) | | $ | (22,282,799 | ) | | (482,373 | ) | | $ | (17,534,147 | ) |
| | | | |
| Class 2 Shares: | | | | | | | | | | | | |
Shares sold | | 1,033,159 | | | $ | 30,946,099 | | | 2,437,974 | | | $ | 80,664,672 | |
Shares issued in reinvestment of distributions | | 4,012,907 | | | | 120,748,382 | | | 4,816,295 | | | | 137,553,399 | |
Shares redeemed | | (12,264,638 | ) | | | (352,488,018 | ) | | (6,132,130 | ) | | | (190,098,105 | ) |
| | | | |
Net increase (decrease) | | (7,218,572 | ) | | $ | (200,793,537 | ) | | 1,122,139 | | | $ | 28,119,966 | |
| | | | |
FGR-20
Franklin Templeton Variable Insurance Products Trust
Notes to Financial Statements (continued)
Franklin Global Real Estate Securities Fund
3. TRANSACTIONS WITH AFFILIATES
Franklin Resources, Inc. is the holding company for various subsidiaries that together are referred to as Franklin Templeton Investments. Certain officers and trustees of the Trust are also officers and/or directors of the following subsidiaries:
| | |
| Subsidiary | | Affiliation |
Franklin Templeton Institutional, LLC (FT Institutional) | | Investment manager |
Franklin Advisers, Inc. (Advisers) | | Investment manager |
Franklin Templeton Services, LLC (FT Services) | | Administrative manager |
Franklin Templeton Distributors, Inc. (Distributors) | | Principal underwriter |
Franklin Templeton Investor Services, LLC (Investor Services) | | Transfer agent |
a. Management Fees
Effective May 1, 2007 the Fund pays an investment management fee to FT Institutional based on the average daily net assets of the Fund as follows:
| | |
| Annualized Fee Rate | | Net Assets |
| 0.800% | | Up to and including $500 million |
| 0.700% | | Over $500 million, up to and including $1 billion |
| 0.650% | | Over $1 billion, up to and including $1.5 billion |
| 0.600% | | Over $1.5 billion, up to and including $6.5 billion |
| 0.580% | | Over $6.5 billion, up to and including $11.5 billion |
| 0.560% | | Over $11.5 billion, up to and including $16.5 billion |
| 0.540% | | Over $16.5 billion, up to and including $19 billion |
| 0.530% | | Over $19 billion, up to and including $21.5 billion |
| 0.520% | | In excess of $21.5 billion |
Prior to May 1, 2007 the Fund paid an investment management fee rate to Advisers based on the average daily net assets of the Fund as follows:
| | |
| Annualized Fee Rate | | Net Assets |
| 0.625% | | Up to and including $100 million |
| 0.500% | | Over $100 million, up to and including $250 million |
| 0.450% | | Over $250 million, up to and including $10 billion |
| 0.440% | | Over $10 billion, up to and including $12.5 billion |
| 0.420% | | Over $12.5 billion, up to and including $15 billion |
| 0.400% | | In excess of $15 billion |
Under a subadvisory agreement, Advisers, an affiliate of FT Institutional, provides subadvisory services to the Fund and receives from FT Institutional fees based on the average daily net assets of the Fund.
b. Administrative Fees
Effective May 1, 2007, the Fund pays an administrative fee to FT Services of 0.25% per year of the average daily net assets of the Fund.
Prior to May 1, 2007, under an agreement with Advisers, FT Services provided administrative services to the Fund. The fee was paid by Advisers based on average daily net assets, and was not an additional expense of the Fund.
FGR-21
Franklin Templeton Variable Insurance Products Trust
Notes to Financial Statements (continued)
Franklin Global Real Estate Securities Fund
3. TRANSACTIONS WITH AFFILIATES (continued)
c. Distribution Fees
The Fund's Board of Trustees has adopted a distribution plan for Class 2 shares pursuant to Rule 12b-1 under the 1940 Act. Under the Fund's compensation distribution plan, the Fund pays Distributors for costs incurred in connection with the servicing, sale and distribution of the Fund's shares up to 0.35% per year of its average daily net assets. The Board of Trustees has agreed to limit the current rate to 0.25% per year.
d. Transfer Agent Fees
Investor Services, under terms of an agreement, performs shareholder servicing for the Fund and is not paid by the Fund for the services.
e. Waiver and Expense Reimbursements
FT Services and FT Institutional have agreed in advance to waive all or a portion of their respective fees and to assume payment of other expenses through April 30, 2012. Total expenses waived are not subject to reimbursement by the Fund subsequent to the Fund’s fiscal year end.
4. EXPENSE OFFSET ARRANGEMENT
The Fund has entered into an arrangement with its custodian whereby credits realized as a result of uninvested cash balances are used to reduce a portion of the Fund’s custodian expenses. During the year ended December 31, 2007, the custodian fees were reduced as noted in the Statement of Operations.
5. INCOME TAXES
The Fund has reviewed the tax positions taken on federal income tax returns, for each of the three open tax years and as of December 31, 2007 and has determined that no provision for income tax is required in the Fund’s financial statements.
For tax purposes, realized capital losses occurring subsequent to October 31, may be deferred and treated as occurring on the first day of the following fiscal year. At December 31, 2007, the Fund deferred realized capital losses of $17,764,600.
The tax character of distributions paid during the years ended December 31, 2007 and 2006, was as follows:
| | | | | | |
| | | 2007 | | 2006 |
Distributions paid from: | | | | | | |
Ordinary income | | $ | 37,911,390 | | $ | 52,932,620 |
Long term capital gain | | | 93,610,996 | | | 98,051,165 |
| | | |
| | $ | 131,522,386 | | $ | 150,983,785 |
| | | |
FGR-22
Franklin Templeton Variable Insurance Products Trust
Notes to Financial Statements (continued)
Franklin Global Real Estate Securities Fund
5. INCOME TAXES (continued)
At December 31, 2007, the cost of investments, net unrealized appreciation (depreciation), undistributed ordinary income and undistributed long term capital gains for income tax purposes were as follows:
| | | | |
Cost of investments | | $ | 963,627,936 | |
| | | | |
| |
Unrealized appreciation | | $ | 94,415,663 | |
Unrealized depreciation | | | (93,976,274 | ) |
| | | | |
Net unrealized appreciation (depreciation) | | $ | 439,389 | |
| | | | |
Undistributed ordinary income | | $ | 11,785,970 | |
Undistributed long term capital gains | | | 186,908,296 | |
| | | | |
Distributable earnings | | $ | 198,694,266 | |
| | | | |
Net investment income differs for financial statement and tax purposes primarily due to differing treatments of foreign currency transactions, passive foreign investment company shares, and pass-through entity income.
Net realized gains (losses) differ for financial statement and tax purposes primarily due to differing treatments of wash sales, foreign currency transactions, passive foreign investment company shares, and pass-through entity income.
6. INVESTMENT TRANSACTIONS
Purchases and sales of investments (excluding short term securities) for the year ended December 31, 2007, aggregated $1,572,477,558 and $1,852,779,608, respectively.
7. FORWARD EXCHANGE CONTRACTS
At December 31, 2007, the Fund had the following forward exchange contracts outstanding:
| | | | | | | | | | | | | |
| | | Contract
Amounta | | Settlement
Date | | Unrealized
Gain | | Unrealized
Loss | |
| Contracts to Buy | | | | | | | | | | | |
| 5,976,436 | | Australian Dollar | | 5,123,001 | | 1/15/08 | | $ | 108,783 | | $ | — | |
| 7,989,012 | | Australian Dollar | | 7,125,000 | | 1/15/08 | | | — | | | (131,405 | ) |
| 8,262,614 | | Australian Dollar | | 7,127,000 | | 1/15/08 | | | 106,107 | | | — | |
| 8,925,534 | | Australian Dollar | | 7,767,000 | | 1/15/08 | | | 46,429 | | | — | |
| 17,133,151 | | Australian Dollar | | 14,729,370 | | 1/15/08 | | | 269,022 | | | — | |
| 2,912,072 | | British Pound | | 5,862,000 | | 1/15/08 | | | — | | | (78,425 | ) |
| 3,115,960 | | British Pound | | 6,312,000 | | 1/15/08 | | | — | | | (123,489 | ) |
| 4,896,511 | | Euro | | 7,258,000 | | 1/15/08 | | | — | | | (110,258 | ) |
| 586,654,868 | | Japanese Yen | | 5,192,325 | | 1/15/08 | | | 77,461 | | | — | |
| 664,410,060 | | Japanese Yen | | 6,081,000 | | 1/15/08 | | | — | | | (112,757 | ) |
| 7,552,518 | | Singapore Dollar | | 5,231,000 | | 1/15/08 | | | 14,624 | | | — | |
| 11,137,380 | | Singapore Dollar | | 7,643,000 | | 1/15/08 | | | 92,500 | | | — | |
| 13,706,266 | | Singapore Dollar | | 9,424,000 | | 1/15/08 | | | 95,727 | | | — | |
| 4,338,884 | | Australian Dollar | | 3,723,630 | | 2/14/08 | | | 67,897 | | | — | |
| 5,786,616 | | Australian Dollar | | 5,063,000 | | 2/14/08 | | | — | | | (6,374 | ) |
| 2,820,151 | | British Pound | | 5,770,000 | | 2/14/08 | | | — | | | (173,534 | ) |
| 173,203,684 | | Japanese Yen | | 1,537,675 | | 2/14/08 | | | 23,277 | | | — | |
| 1,156,679,840 | | Japanese Yen | | 10,288,000 | | 2/14/08 | | | 136,270 | | | — | |
| 11,423,964 | | Singapore Dollar | | 7,946,000 | | 2/14/08 | | | 4,701 | | | — | |
| 26,163,532 | | Australian Dollar | | 22,357,000 | | 3/17/08 | | | 455,643 | | | — | |
FGR-23
Franklin Templeton Variable Insurance Products Trust
Notes to Financial Statements (continued)
Franklin Global Real Estate Securities Fund
7. FORWARD EXCHANGE CONTRACTS (continued)
| | | | | | | | | | | | | |
| | | Contract
Amounta | | Settlement
Date | | Unrealized
Gain | | Unrealized
Loss | |
| Contracts to Sell | | | | | | | | | | | |
| 14,472,647 | | Australian Dollar | | 13,042,749 | | 1/15/08 | | | 373,368 | | | — | |
| 24,377,200 | | Australian Dollar | | 21,927,779 | | 1/15/08 | | | 587,934 | | | — | |
| 26,058,685 | | Australian Dollar | | 23,474,185 | | 1/15/08 | | | 662,364 | | | — | |
| 28,973,134 | | Australian Dollar | | 26,114,065 | | 1/15/08 | | | 750,931 | | | — | |
| 2,602,333 | | British Pound | | 5,264,000 | | 1/15/08 | | | 95,587 | | | — | |
| 3,365,052 | | British Pound | | 6,818,000 | | 1/15/08 | | | 134,774 | | | | |
| 3,566,704 | | British Pound | | 7,240,552 | | 1/15/08 | | | 156,832 | | | — | |
| 7,056,454 | | British Pound | | 14,316,486 | | 1/15/08 | | | 301,883 | | | — | |
| 7,342,858 | | British Pound | | 14,899,760 | | 1/15/08 | | | 316,338 | | | — | |
| 14,683,824 | | Canadian Dollar | | 15,090,514 | | 1/15/08 | | | 311,371 | | | — | |
| 16,996,115 | | Euro | | 24,208,757 | | 1/15/08 | | | — | | | (601,533 | ) |
| 388,286,021 | | Japanese Yen | | 3,345,246 | | 1/15/08 | | | — | | | (142,639 | ) |
| 1,251,064,928 | | Japanese Yen | | 10,748,535 | | 1/15/08 | | | — | | | (489,495 | ) |
| 1,600,940,727 | | Japanese Yen | | 13,756,741 | | 1/15/08 | | | — | | | (624,143 | ) |
| 10,608,486 | | Norwegian Krone | | 1,971,830 | | 1/15/08 | | | 20,600 | | | — | |
| 12,969,017 | | Singapore Dollar | | 8,924,454 | | 1/15/08 | | | — | | | (83,215 | ) |
| 14,056,162 | | Singapore Dollar | | 9,680,886 | | 1/15/08 | | | — | | | (81,863 | ) |
| 16,644,520 | | Singapore Dollar | | 11,463,957 | | 1/15/08 | | | — | | | (96,543 | ) |
| 14,475,239 | | Canadian Dollar | | 14,864,694 | | 1/22/08 | | | 294,126 | | | — | |
| 19,579,368 | | Australian Dollar | | 17,799,604 | | 2/14/08 | | | 690,202 | | | — | |
| 21,032,104 | | Australian Dollar | | 19,661,442 | | 2/14/08 | | | 1,282,570 | | | — | |
| 22,628,815 | | Australian Dollar | | 20,555,563 | | 2/14/08 | | | 781,407 | | | — | |
| 26,018,605 | | Australian Dollar | | 23,646,749 | | 2/14/08 | | | 910,431 | | | — | |
| 8,683,600 | | British Pound | | 18,100,964 | | 2/14/08 | | | 868,737 | | | — | |
| 7,472,879 | | Euro | | 10,972,577 | | 2/14/08 | | | 59,923 | | | — | |
| 801,307,905 | | Japanese Yen | | 7,233,000 | | 2/14/08 | | | 11,425 | | | — | |
| 938,117,160 | | Japanese Yen | | 8,537,807 | | 2/14/08 | | | 83,275 | | | — | |
| 1,314,796,784 | | Japanese Yen | | 11,965,969 | | 2/14/08 | | | 116,712 | | | — | |
| 2,266,803,071 | | Japanese Yen | | 20,651,231 | | 2/14/08 | | | 222,270 | | | — | |
| 13,789,502 | | Norwegian Krone | | 2,591,281 | | 2/14/08 | | | 57,014 | | | — | |
| 17,063,182 | | Norwegian Krone | | 3,207,317 | | 2/14/08 | | | 71,406 | | | — | |
| 7,669,710 | | Singapore Dollar | | 5,356,691 | | 2/14/08 | | | 18,827 | | | — | |
| 17,043,295 | | Singapore Dollar | | 11,902,989 | | 2/14/08 | | | 41,420 | | | — | |
| 6,684,228 | | Canadian Dollar | | 6,810,911 | | 2/21/08 | | | 80,769 | | | — | |
| 5,531,753 | | Australian Dollar | | 4,812,625 | | 3/17/08 | | | — | | | (10,650 | ) |
| 10,620,318 | | Australian Dollar | | 9,250,297 | | 3/17/08 | | | — | | | (9,826 | ) |
| 15,650,076 | | Australian Dollar | | 13,646,866 | | 3/17/08 | | | 1,171 | | | — | |
| 18,953,656 | | Australian Dollar | | 16,513,752 | | 3/17/08 | | | — | | | (12,418 | ) |
| 37,998,141 | | Australian Dollar | | 32,705,000 | | 3/17/08 | | | — | | | (426,536 | ) |
| 73,475,993 | | Australian Dollar | | 63,975,547 | | 3/17/08 | | | — | | | (90,022 | ) |
| 7,397,163 | | British Pound | | 15,029,556 | | 3/17/08 | | | 362,589 | | | — | |
| 9,170,897 | | Euro | | 13,388,592 | | 3/17/08 | | | — | | | (4,656 | ) |
| 12,369,963 | | Euro | | 18,108,389 | | 3/17/08 | | | 43,200 | | | — | |
| 133,237,459 | | Hong Kong Dollar | | 17,147,678 | | 3/17/08 | | | 12,526 | | | — | |
| 234,227,162 | | Japanese Yen | | 2,086,377 | | 3/17/08 | | | — | | | (31,743 | ) |
| 776,795,711 | | Japanese Yen | | 6,917,148 | | 3/17/08 | | | — | | | (107,431 | ) |
| 1,501,052,280 | | Japanese Yen | | 13,286,000 | | 3/17/08 | | | — | | | (288,045 | ) |
| 1,859,934 | | Singapore Dollar | | 1,297,749 | | 3/17/08 | | | 1,018 | | | — | |
| 2,493,006 | | Singapore Dollar | | 1,741,011 | | 3/17/08 | | | 2,907 | | | — | |
| | | | | | | | | | |
| Unrealized gain (loss) on forward exchange contracts | | | | | | | 11,224,348 | | $ | (3,837,000 | ) |
| | | | | | | | | | |
| Net unrealized gain (loss) on forward exchange contracts | | | | | | $ | 7,387,348 | | | | |
| | | | | | | | | | | | | |
aIn | U.S. dollars unless otherwise indicated. |
FGR-24
Franklin Templeton Variable Insurance Products Trust
Notes to Financial Statements (continued)
Franklin Global Real Estate Securities Fund
8. CONCENTRATION OF RISK
Investing in foreign securities may include certain risks and considerations not typically associated with investing in U.S. securities, such as fluctuating currency values and changing local and regional economic, political and social conditions, which may result in greater market volatility. In addition, certain foreign securities may not be as liquid as U.S. securities.
9. HOLDINGS OF 5% VOTING SECURITIES OF PORTFOLIO COMPANIES
The 1940 Act defines “affiliated companies” to include investments in portfolio companies in which a fund owns 5% or more of the outstanding voting securities. Investments in “affiliated companies” for the Fund for the year ended December 31, 2007, were as shown below.
| | | | | | | | | | | | | | | | | |
| Name of Issuer | | Number of Shares
Held at Beginning
of Year | | Gross
Additions | | Gross
Reductions | | Number of Shares
Held at End of
Year | | Value at
End of
Year | | | Investment
Income | | Realized Capital
Gain (Loss) |
Non-Controlled Affiliates | | | | | | | | | | | | | | | | | |
MortgageIT Holdings Inc. | | 1,480,500 | | — | | 1,480,500 | | — | | | a | | $ | — | | $ | 4,195,860 |
| | | | | | | | | | |
Total Affiliated Securities (0.00% of Net Assets) | | | | | | | | | | | | | | | |
aAs | of December 31, 2007, no longer an affiliate. |
10. REGULATORY AND LITIGATION MATTERS
As part of various investigations by a number of federal, state, and foreign regulators and governmental entities, including the Securities and Exchange Commission (“SEC”), relating to certain practices in the mutual fund industry, including late trading, market timing and marketing support payments to securities dealers who sell fund shares (“marketing support”), Franklin Resources, Inc. and certain of its subsidiaries (collectively, the “Company”), entered into settlements with certain of those regulators and governmental entities. Specifically, the Company entered into settlements with the SEC, among others, concerning market timing and marketing support.
On June 6, 2007, the SEC posted for public comment the proposed plan of distribution for the market timing settlement. Once the SEC approves the final plan of distribution, disbursements of settlement monies will be made promptly to individuals who were shareholders of the designated funds during the relevant period, in accordance with the terms and conditions of the settlement and plan.
In addition, the Company, as well as most of the mutual funds within Franklin Templeton Investments and certain current or former officers, Company directors, fund directors, and employees, have been named in private lawsuits (styled as shareholder class actions, or as derivative actions on behalf of either the named funds or Franklin Resources, Inc.). The lawsuits relate to the industry practices referenced above.
The Company and fund management believe that the claims made in each of the private lawsuits referenced above are without merit and intend to defend against them vigorously. The Company cannot predict with certainty the eventual outcome of these lawsuits, nor whether they will have a material negative impact on the Company. If it is determined that the Company bears responsibility for any unlawful or inappropriate conduct that caused losses to the Fund, it is committed to making the Trust or its shareholders whole, as appropriate.
11. NEW ACCOUNTING PRONOUNCEMENT
In September 2006, the Financial Accounting Standards Board (FASB) issued FASB Statement No. 157, “Fair Value Measurement” (SFAS 157), which defines fair value, establishes a framework for measuring fair value, and expands disclosures about fair value measurements. SFAS 157 is effective for fiscal years beginning after November 15, 2007, and interim periods within those fiscal years. The Trust believes the adoption of SFAS 157 will have no material impact on its financial statements.
FGR-25
Franklin Templeton Variable Insurance Products Trust
Franklin Global Real Estate Securities Fund
Report of Independent Registered Public Accounting Firm
To the Board of Trustees and Shareholders of
Franklin Templeton Variable Insurance Products Trust
In our opinion, the accompanying statement of assets and liabilities, including the statement of investments, and the related statements of operations and of changes in net assets and the financial highlights present fairly, in all material respects, the financial position of Franklin Global Real Estate Securities Fund (formerly Franklin Real Estate Fund) (one of the funds constituting Franklin Templeton Variable Insurance Products Trust, hereafter referred to as the “Fund”) at December 31, 2007, the results of its operations for the year then ended, the changes in its net assets for each of the two years in the period then ended and the financial highlights for each of the five years in the period then ended, in conformity with accounting principles generally accepted in the United States of America. These financial statements and financial highlights (hereafter referred to as “financial statements”) are the responsibility of the Fund's management. Our responsibility is to express an opinion on these financial statements based on our audits. We conducted our audits of these financial statements in accordance with the standards of the Public Company Accounting Oversight Board (United States). Those standards require that we plan and perform the audit to obtain reasonable assurance about whether the financial statements are free of material misstatement. An audit includes examining, on a test basis, evidence supporting the amounts and disclosures in the financial statements, assessing the accounting principles used and significant estimates made by management, and evaluating the overall financial statement presentation. We believe that our audits, which included confirmation of securities at December 31, 2007 by correspondence with the custodian and brokers, provide a reasonable basis for our opinion.
PricewaterhouseCoopers LLP
San Francisco, California
February 14, 2008
FGR-26
Franklin Templeton Variable Insurance Products Trust
Tax Designation (unaudited)
Franklin Global Real Estate Securities Fund
Under Section 852(b)(3)(C) of the Internal Revenue Code (Code), the Fund designates the maximum amount allowable but no less than $187,256,146 as a long term capital gain dividend for the fiscal year ended December 31, 2007.
Under Section 854(b)(2) of the Code, the Fund designates 3.48% of the ordinary income dividends as income qualifying for the dividends received deduction for the fiscal year ended December 31, 2007.
At December 31, 2007, more than 50% of the Fund's total assets were invested in securities of foreign issuers. In most instances, foreign taxes were withheld from income paid to the Fund on these investments. The Fund elects to treat foreign taxes paid as allowed under Section 853 of the Code. This election will allow shareholders of record as of the 2008 distribution date, to treat their proportionate share of foreign taxes paid by the Fund as having been paid directly by them. The shareholder shall consider these amounts as foreign taxes paid in the tax year in which they receive the Fund distribution.
FGR-27
FRANKLIN GROWTHAND INCOME SECURITIES FUND
This annual report for Franklin Growth and Income Securities Fund covers the fiscal year ended December 31, 2007.
Performance Summary as of 12/31/07
Average annual total return of Class 1 shares represents the average annual change in value, assuming reinvestment of dividends and capital gains. Average returns smooth out variations in returns, which can be significant; they are not the same as year-by-year results.
Periods ended 12/31/07
| | | | | | |
| | | 1-Year | | 5-Year | | 10-Year |
Average Annual Total Return | | -3.46% | | +10.38% | | +5.77% |
Total Return Index Comparison for Hypothetical $10,000 Investment (1/1/98–12/31/07)
The graph below shows the change in value of a hypothetical $10,000 investment in the Fund over the indicated period and includes reinvestment of any income or distributions. The Fund’s performance is compared to the performance of the Standard & Poor’s 500 Index (S&P 500), the Russell 1000® Value Index and the Lipper VIP Equity Income Funds Classification Average, as well as the Consumer Price Index (CPI). One cannot invest directly in an index, nor is an index representative of the Fund’s portfolio. Please see Important Notes to Performance Information preceding the Fund Summaries.
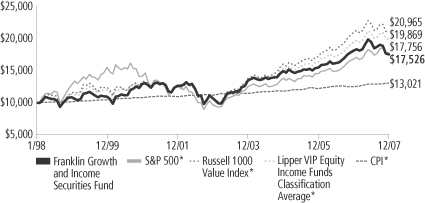
*Sources: Standard & Poor’s Micropal; Lipper Inc. Please see Index Descriptions following the Fund Summaries.
Franklin Growth and Income Securities Fund Class 1
Performance reflects the Fund’s Class 1 operating expenses, but does not include any contract fees, expenses or sales charges. If they had been included, performance would be lower. These charges and deductions, particularly for variable life policies, can have a significant effect on contract values and insurance benefits. See the contract prospectus for a complete description of these expenses, including sales charges.
Performance data represent past performance, which does not guarantee future results. Investment return and principal value will fluctuate, and you may have a gain or loss when you sell your shares. Current performance may differ from figures shown.
FGI-1
Fund Goals and Main Investments: Franklin Growth and Income Securities Fund seeks capital appreciation with current income as a secondary goal. The Fund normally invests predominantly in a broadly diversified portfolio of equity securities that the Fund’s manager considers to be financially strong but undervalued by the market.
Performance Overview
You can find the Fund’s one-year total return in the Performance Summary. The Fund underperformed its benchmark, the S&P 500 and its peers as measured by the Lipper VIP Equity Income Fund Classification Average, which returned +5.49% and +2.69%.1 The Fund also underperformed its additional benchmark, the Russell 1000® Value Index, which returned -0.17% for the same period.1 Please note that the Fund invests primarily in stocks with above average dividend yields. As a result, its holdings and returns may differ from those of the S&P 500 and the Russell benchmark, which include nondividend-paying stocks and do not focus on dividend yield.
Economic and Market Overview
During the 12 months ended December 31, 2007, the U.S. economy advanced at a moderate but uneven pace. Gross domestic product (GDP) grew an annualized 0.6% in the first quarter of 2007 but advanced in the second quarter at an annualized 3.8% rate. Federal defense spending, accelerating exports and declining imports, greater business inventory investment and increased spending for nonresidential structures supported growth. GDP grew an annualized 4.9% in the third quarter of 2007 despite a struggling housing market and the abrupt unraveling of the subprime mortgage market. The housing downturn affected the overall economy by fourth quarter 2007 as credit conditions worsened, consumer spending slowed, and GDP growth decelerated to an estimated 0.6% annualized rate.
1. Sources: Standard & Poor’s Micropal; Lipper Inc. One cannot invest directly in an index, nor is an index representative of the Fund’s portfolio. Please see Index Descriptions following the Fund Summaries.
Fund Risks: The Fund’s investments in stocks offer the potential for long-term gains but can be subject to short-term price fluctuations. Common stocks with higher dividend yields can be sensitive to interest rate movements. By having significant investments in a particular sector from time to time, such as the financial services sector, the Fund may be at greater risk of adverse developments in a sector than a fund that invests more broadly. Foreign investing, especially in emerging markets, involves additional risks, including currency fluctuations, economic instability, market volatility, and political and social instability. The Fund’s prospectus also includes a description of the main investment risks.
FGI-2
The unemployment rate increased from 4.4% at the beginning of the period to 5.0% in December 2007.2 Although consumer confidence in July neared a six-year high, it declined through period-end largely due to rising mortgage and fuel costs, falling home prices and a weaker job market. Oil prices were volatile and established a new record high in November, nearing $99 per barrel. For the 12 months ended December 31, 2007, the core Consumer Price Index (CPI), which excludes food and energy costs, rose 2.4%, which was higher than its 10-year average rate.2
Facing the prospect of slower economic growth, the Federal Reserve Board lowered the federal funds target rate to 4.25% from 5.25% during the period. As investors fled riskier, poorer-performing assets, U.S. Treasuries rallied and the 10-year Treasury note yield fell from 4.71% at the beginning of the period to 4.04% on December 31, 2007.
Following sell-offs in late February and mid-March, stock markets rebounded amid generally strong first quarter corporate earnings reports. However, volatility picked up substantially in the latter half of the year due to investor concerns about slowing economic growth. The major stock indexes recovered from a late-summer sell-off and a November correction, and the blue chip stocks of the Dow Jones Industrial Average posted a 12-month total return of +8.88%.3 The broader S&P 500 returned +5.49%, and the technology-heavy NASDAQ Composite Index returned +11.53%.3 The energy, materials and utilities sectors performed particularly well.
Investment Strategy
We are research-driven, fundamental investors, pursuing a disciplined investment strategy. As bottom-up investors focusing primarily on individual securities, we seek companies that offer current dividend yields and present, in our opinion, the best trade-off between valuation, potential earnings growth and business risk. Special emphasis is placed upon dividend yield as we believe that high relative dividend yield can be a good indicator of value.
2. Source: Bureau of Labor Statistics.
3. Source: Standard & Poor’s Micropal. Please see Index Descriptions following the Fund Summaries.
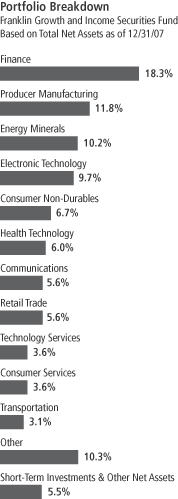
FGI-3
Manager’s Discussion
During the year under review, electronic technology companies Nokia and Intel were among the Fund’s major contributors to absolute performance. Nokia, the world’s largest mobile phone maker, increased its market share largely due to strong sales in the Asia-Pacific region and in Europe. In addition, through a series of recent acquisitions, the company expanded its scope beyond cell phones to include several Internet-related services. Shares of leading semiconductor company Intel rose as the company reported record microprocessor, chipset and flash unit sales in the third quarter of 2007. Other significant contributors to performance included major telecommunications company AT&T and Mexico-based wireless services provider America Movil.
Concern for strong demand and tight supplies led to rising oil and energy prices during the year under review. Integrated oil companies Chevron, Exxon Mobil and ConocoPhilips were among the Fund’s energy minerals sector holdings that contributed to performance despite industrywide weak refining margins. Likewise, the Fund also benefited from its holdings in electric utilities companies TXU and Public Service Enterprise Group. We sold our position in Public Service Enterprise Group by period-end, and we no longer held TXU due to a cash merger during the reporting period.
Not all of the Fund’s holdings performed well during the reporting period. Several of the Fund’s finance sector holdings sustained severe losses due to investor fears about the credit crunch stemming from the unraveling U.S. subprime mortgage crisis. Among the Fund’s major detractors were online discount broker E*TRADE Financial, savings bank Washington Mutual, large financial conglomerate Citigroup and leading debt insurer MBIA. Somewhat related to these fears, shares of homebuilder D.R. Horton declined sharply and hurt Fund performance. Within the retail trade sector, home improvement chain Home Depot also detracted from the Fund’s results.
Thank you for your participation in Franklin Growth and Income Securities Fund. We look forward to serving your future investment needs.
The foregoing information reflects our analysis, opinions and portfolio holdings as of December 31, 2007, the end of the reporting period. The way we implement our main investment strategies and the resulting portfolio holdings may change depending on factors such as market and economic conditions. These opinions may not be relied upon as investment advice or an offer for a particular security. The information is not a complete analysis of every aspect of any market, country, industry, security or the Fund. Statements of fact are from sources considered reliable, but the investment manager makes no representation or warranty as to their completeness or accuracy. Although historical performance is no guarantee of future results, these insights may help you understand our investment management philosophy.
Top 10 Holdings
Franklin Growth and Income
Securities Fund
12/31/07
| | |
Company Sector/Industry | | % of Total
Net Assets |
| |
| AT&T Inc. | | 3.5% |
| Communications | | |
| |
| Chevron Corp. | | 2.7% |
| Energy Minerals | | |
| |
| ConocoPhillips | | 2.5% |
| Energy Minerals | | |
| |
| Intel Corp. | | 2.4% |
| Electronic Technology | | |
| |
| Exxon Mobil Corp. | | 2.3% |
| Energy Minerals | | |
| |
| Bank of America Corp. | | 2.3% |
| Finance | | |
| |
| General Electric Co. | | 2.3% |
| Producer Manufacturing | | |
| |
| Roche Holding AG (Switzerland) | | 2.2% |
| Health Technology | | |
| |
| Honeywell International Inc. | | 2.2% |
| Producer Manufacturing | | |
| |
| America Movil SAB de CV, L, ADR (Mexico) | | 2.2% |
| Communications | | |
The dollar value, number of shares or principal amount, and names of all portfolio holdings are listed in the Fund’s Statement of Investments.
FGI-4
Fund Expenses
As an investor in a variable insurance contract (Contract) that indirectly provides for investment in an underlying mutual fund, you can incur transaction and/or ongoing expenses at both the Fund level and the Contract level.
| • | | Transaction expenses can include sales charges (loads) on purchases, redemption fees, surrender fees, transfer fees and premium taxes. |
| • | | Ongoing expenses can include management fees, distribution and service (12b-1) fees, contract fees, annual maintenance fees, mortality and expense risk fees and other fees and expenses. All mutual funds and Contracts have some types of ongoing expenses. |
The expenses shown in the table are meant to highlight ongoing expenses at the Fund level only and do not include ongoing expenses at the Contract level, or transaction expenses at either the Fund or Contract level. While the Fund does not have transaction expenses, if the transaction and ongoing expenses at the Contract level were included, the expenses shown would be higher. You should consult your Contract prospectus or disclosure document for more information.
The table shows Fund-level ongoing expenses and can help you understand these expenses and compare them with those of other mutual funds offered through the Contract. The table assumes a $1,000 investment held for the six months indicated. Please refer to the Fund prospectus for additional information on operating expenses.
Actual Fund Expenses
The first line (Actual) of the table provides actual account values and expenses. The “Ending Account Value” is derived from the Fund’s actual return, which includes the effect of ongoing Fund expenses, but does not include the effect of ongoing Contract expenses.
You can estimate the Fund-level expenses you incurred during the period by following these steps. Of course, your account value and expenses will differ from those in this illustration:
| 1. | Divide your account value by $1,000. |
If an account had an $8,600 value, then $8,600 ÷ $1,000 = 8.6.
| 2. | Multiply the result by the number under the heading “Fund-Level Expenses Incurred During Period.” |
If Fund-Level Expenses Incurred During Period were $7.50, then 8.6 x $7.50 = $64.50.
In this illustration, the estimated expenses incurred this period at the Fund level are $64.50.
Franklin Growth and Income Securities Fund Class 1
FGI-5
Hypothetical Example for Comparison with Other Mutual Funds
Information in the second line (Hypothetical) of the table can help you compare ongoing expenses of the Fund with those of other mutual funds offered through the Contract. This information may not be used to estimate the actual ending account balance or expenses you incurred during the period. The hypothetical “Ending Account Value” is based on the Fund’s actual expense ratio and an assumed 5% annual rate of return before expenses, which does not represent the Fund’s actual return. The figure under the heading “Fund-Level Expenses Incurred During Period” shows the hypothetical expenses your account would have incurred under this scenario. You can compare this figure with the 5% hypothetical examples that appear in shareholder reports of other funds offered through a Contract.
| | | | | | | | | |
| Class 1 | | Beginning
Account Value 7/1/07 | | Ending
Account
Value 12/31/07 | | Fund-Level
Expenses Incurred
During Period*
7/1/07–12/31/07 |
Actual | | $ | 1,000 | | $ | 900.80 | | $ | 2.40 |
Hypothetical (5% return before expenses) | | $ | 1,000 | | $ | 1,022.68 | | $ | 2.55 |
*Expenses are calculated using the most recent six-month annualized expense ratio for the Fund’s Class 1 shares (0.50%), which does not include any ongoing expenses of the Contract for which the Fund is an investment option, multiplied by the average account value over the period, multiplied by 184/365 to reflect the one-half year period.
FGI-6
Franklin Templeton Variable Insurance Products Trust
Financial Highlights
Franklin Growth and Income Securities Fund
| | | | | | | | | | | | | | | | | | | | |
| | | Year Ended December 31, | |
| Class 1 | | 2007 | | | 2006 | | | 2005 | | | 2004 | | | 2003 | |
| | | | |
Per share operating performance | | | | | | | | | | | | | | | | | | | | |
(for a share outstanding throughout the year) | | | | | | | | | | | | | | | | | | | | |
Net asset value, beginning of year | | $ | 16.83 | | | $ | 15.60 | | | $ | 15.60 | | | $ | 14.44 | | | $ | 11.82 | |
| | | | |
Income from investment operationsa: | | | | | | | | | | | | | | | | | | | | |
Net investment incomeb | | | 0.41 | | | | 0.42 | | | | 0.42 | | | | 0.40 | | | | 0.36 | |
Net realized and unrealized gains (losses) | | | (0.82 | ) | | | 2.05 | | | | 0.15 | | | | 1.14 | | | | 2.66 | |
| | | | |
Total from investment operations | | | (0.41 | ) | | | 2.47 | | | | 0.57 | | | | 1.54 | | | | 3.02 | |
| | | | |
Less distributions from: | | | | | | | | | | | | | | | | | | | | |
Net investment income | | | (0.42 | ) | | | (0.43 | ) | | | (0.43 | ) | | | (0.38 | ) | | | (0.40 | ) |
Net realized gains | | | (0.93 | ) | | | (0.81 | ) | | | (0.14 | ) | | | — | | | | — | |
| | | | |
Total distributions | | | (1.35 | ) | | | (1.24 | ) | | | (0.57 | ) | | | (0.38 | ) | | | (0.40 | ) |
| | | | |
Net asset value, end of year | | $ | 15.07 | | | $ | 16.83 | | | $ | 15.60 | | | $ | 15.60 | | | $ | 14.44 | |
| | | | |
| | | | | |
Total returnc | | | (3.46)% | | | | 17.05% | | | | 3.71% | | | | 10.91% | | | | 26.06% | |
Ratios to average net assets | | | | | | | | | | | | | | | | | | | | |
| Expenses | | | 0.52% | d | | | 0.54% | d | | | 0.51% | d | | | 0.52% | d | | | 0.53% | |
| Net investment income | | | 2.47% | | | | 2.63% | | | | 2.74% | | | | 2.77% | | | | 2.92% | |
| | | | | |
Supplemental data | | | | | | | | | | | | | | | | | | | | |
Net assets, end of year (000’s) | | $ | 306,691 | | | $ | 388,751 | | | $ | 405,245 | | | $ | 471,596 | | | $ | 505,393 | |
Portfolio turnover rate | | | 36.66% | | | | 23.05% | | | | 43.89% | | | | 40.15% | | | | 43.18% | |
aThe amount shown for a share outstanding throughout the period may not correlate with the Statement of Operations for the period due to the timing of sales and repurchases of the Fund shares in relation to income earned and/or fluctuating market value of the investments of the Fund.
bBased on average daily shares outstanding.
cTotal return does not include any fees, charges or expenses imposed by the variable annuity and life insurance contracts for which the Franklin Templeton Variable Insurance Products Trust serves as an underlying investment vehicle.
dBenefit of expense reduction rounds to less than 0.01%.
The accompanying notes are an integral part of these financial statements.
FGI-7
Franklin Templeton Variable Insurance Products Trust
Financial Highlights (continued)
Franklin Growth and Income Securities Fund
| | | | | | | | | | | | | | | | | | | | |
| | | Year Ended December 31, | |
| Class 2 | | 2007 | | | 2006 | | | 2005 | | | 2004 | | | 2003 | |
| | | | |
Per share operating performance | | | | | | | | | | | | | | | | | | | | |
(for a share outstanding throughout the year) | | | | | | | | | | | | | | | | | | | | |
Net asset value, beginning of year | | $ | 16.62 | | | $ | 15.42 | | | $ | 15.43 | | | $ | 14.31 | | | $ | 11.74 | |
| | | | |
Income from investment operationsa: | | | | | | | | | | | | | | | | | | | | |
Net investment incomeb | | | 0.37 | | | | 0.37 | | | | 0.38 | | | | 0.37 | | | | 0.33 | |
Net realized and unrealized gains (losses) | | | (0.82 | ) | | | 2.03 | | | | 0.15 | | | | 1.12 | | | | 2.63 | |
| | | | |
Total from investment operations | | | (0.45 | ) | | | 2.40 | | | | 0.53 | | | | 1.49 | | | | 2.96 | |
| | | | |
Less distributions from: | | | | | | | | | | | | | | | | | | | | |
Net investment income | | | (0.38 | ) | | | (0.39 | ) | | | (0.40 | ) | | | (0.37 | ) | | | (0.39 | ) |
Net realized gains | | | (0.93 | ) | | | (0.81 | ) | | | (0.14 | ) | | | — | | | | — | |
| | | | |
Total distributions | | | (1.31 | ) | | | (1.20 | ) | | | (0.54 | ) | | | (0.37 | ) | | | (0.39 | ) |
| | | | |
Net asset value, end of year | | $ | 14.86 | | | $ | 16.62 | | | $ | 15.42 | | | $ | 15.43 | | | $ | 14.31 | |
| | | | |
| | | | | |
Total returnc | | | (3.71)% | | | | 16.76% | | | | 3.51% | | | | 10.61% | | | | 25.70% | |
Ratios to average net assets | | | | | | | | | | | | | | | | | | | | |
| Expenses | | | 0.77% | d | | | 0.79% | d | | | 0.76% | d | | | 0.77% | d | | | 0.78% | |
| Net investment income | | | 2.22% | | | | 2.38% | | | | 2.49% | | | | 2.52% | | | | 2.67% | |
| | | | | |
Supplemental data | | | | | | | | | | | | | | | | | | | | |
Net assets, end of year (000’s) | | $ | 312,692 | | | $ | 348,724 | | | $ | 313,286 | | | $ | 263,146 | | | $ | 136,824 | |
Portfolio turnover rate | | | 36.66% | | | | 23.05% | | | | 43.89% | | | | 40.15% | | | | 43.18% | |
aThe amount shown for a share outstanding throughout the period may not correlate with the Statement of Operations for the period due to the timing of sales and repurchases of the Fund shares in relation to income earned and/or fluctuating market value of the investments of the Fund.
bBased on average daily shares outstanding.
cTotal return does not include any fees, charges or expenses imposed by the variable annuity and life insurance contracts for which the Franklin Templeton Variable Insurance Products Trust serves as an underlying investment vehicle.
dBenefit of expense reduction rounds to less than 0.01%.
The accompanying notes are an integral part of these financial statements.
FGI-8
Franklin Templeton Variable Insurance Products Trust
Statement of Investments, December 31, 2007
| | | | | | | |
| Franklin Growth and Income Securities Fund | | Country | | Shares | | Value |
Long Term Investments 94.5% | | | | | | | |
Common Stocks 89.2% | | | | | | | |
Commercial Services 1.6% | | | | | | | |
R. R. Donnelley & Sons Co. | | United States | | 267,800 | | $ | 10,106,772 |
| | | | | | | |
Communications 5.6% | | | | | | | |
America Movil SAB de CV, L, ADR | | Mexico | | 218,100 | | | 13,389,159 |
AT&T Inc. | | United States | | 518,897 | | | 21,565,359 |
| | | | | | | |
| | | | | | | 34,954,518 |
| | | | | | | |
Consumer Durables 1.2% | | | | | | | |
KB Home | | United States | | 350,900 | | | 7,579,440 |
| | | | | | | |
Consumer Non-Durables 6.7% | | | | | | | |
Anheuser-Busch Cos. Inc. | | United States | | 204,500 | | | 10,703,530 |
The Coca-Cola Co. | | United States | | 208,400 | | | 12,789,508 |
Diageo PLC, ADR | | United Kingdom | | 75,200 | | | 6,454,416 |
Unilever NV, N.Y. shs. | | Netherlands | | 308,800 | | | 11,258,848 |
| | | | | | | |
| | | | | | | 41,206,302 |
| | | | | | | |
Consumer Services 1.8% | | | | | | | |
Carnival Corp. | | United States | | 247,900 | | | 11,029,071 |
| | | | | | | |
Electronic Technology 9.7% | | | | | | | |
Embraer-Empresa Brasileira de Aeronautica SA, ADR | | Brazil | | 227,900 | | | 10,389,961 |
Intel Corp. | | United States | | 550,000 | | | 14,663,000 |
Microchip Technology Inc. | | United States | | 371,200 | | | 11,663,104 |
Nokia Corp., ADR | | Finland | | 315,300 | | | 12,104,367 |
Raytheon Co. | | United States | | 189,000 | | | 11,472,300 |
| | | | | | | |
| | | | | | | 60,292,732 |
| | | | | | | |
Energy Minerals 10.2% | | | | | | | |
Chesapeake Energy Corp. | | United States | | 280,087 | | | 10,979,411 |
Chevron Corp. | | United States | | 176,116 | | | 16,436,906 |
ConocoPhillips | | United States | | 176,500 | | | 15,584,950 |
Exxon Mobil Corp. | | United States | | 154,644 | | | 14,488,596 |
Sunoco Inc. | | United States | | 78,000 | | | 5,650,320 |
| | | | | | | |
| | | | | | | 63,140,183 |
| | | | | | | |
Finance 15.8% | | | | | | | |
AFLAC Inc. | | United States | | 133,000 | | | 8,329,790 |
American International Group Inc. | | United States | | 72,200 | | | 4,209,260 |
Bank of America Corp. | | United States | | 349,812 | | | 14,433,243 |
Capital One Financial Corp. | | United States | | 108,164 | | | 5,111,831 |
CapitalSource Inc. | | United States | | 517,700 | | | 9,106,343 |
Citigroup Inc. | | United States | | 337,000 | | | 9,921,280 |
Fortress Investment Group LP, A | | United States | | 4,900 | | | 76,342 |
JPMorgan Chase & Co. | | United States | | 164,670 | | | 7,187,845 |
Marsh & McLennan Cos. Inc. | | United States | | 290,600 | | | 7,692,182 |
Merrill Lynch & Co. Inc. | | United States | | 201,100 | | | 10,795,048 |
U.S. Bancorp | | United States | | 328,500 | | | 10,426,590 |
Wachovia Corp. | | United States | | 226,800 | | | 8,625,204 |
Washington Mutual Inc. | | United States | | 161,400 | | | 2,196,654 |
| | | | | | | |
| | | | | | | 98,111,612 |
| | | | | | | |
Health Technology 5.0% | | | | | | | |
Pfizer Inc. | | United States | | 552,000 | | | 12,546,960 |
Roche Holding AG | | Switzerland | | 79,200 | | | 13,670,597 |
Schering-Plough Corp. | | United States | | 190,368 | | | 5,071,403 |
| | | | | | | |
| | | | | | | 31,288,960 |
| | | | | | | |
FGI-9
Franklin Templeton Variable Insurance Products Trust
Statement of Investments, December 31, 2007 (continued)
| | | | | | | |
| Franklin Growth and Income Securities Fund | | Country | | Shares | | Value |
Long Term Investments (continued) | | | | | | | |
Common Stocks (continued) | | | | | | | |
Industrial Services 1.1% | | | | | | | |
Waste Management Inc. | | United States | | 201,900 | | $ | 6,596,073 |
| | | | | | | |
Non-Energy Minerals 1.8% | | | | | | | |
Alcoa Inc. | | United States | | 302,600 | | | 11,060,030 |
| | | | | | | |
Process Industries 1.5% | | | | | | | |
The Dow Chemical Co. | | United States | | 239,600 | | | 9,445,032 |
| | | | | | | |
Producer Manufacturing 11.8% | | | | | | | |
3M Co. | | United States | | 134,600 | | | 11,349,472 |
Autoliv Inc. | | Sweden | | 98,000 | | | 5,165,580 |
Caterpillar Inc. | | United States | | 166,900 | | | 12,110,264 |
General Electric Co. | | United States | | 376,900 | | | 13,971,683 |
Honeywell International Inc. | | United States | | 218,200 | | | 13,434,574 |
Masco Corp. | | United States | | 414,300 | | | 8,953,023 |
Pitney Bowes Inc. | | United States | | 211,300 | | | 8,037,852 |
| | | | | | | |
| | | | | | | 73,022,448 |
| | | | | | | |
Real Estate Investment Trust 1.4% | | | | | | | |
iStar Financial Inc. | | United States | | 337,600 | | | 8,794,480 |
| | | | | | | |
Retail Trade 5.6% | | | | | | | |
Best Buy Co. Inc. | | United States | | 239,500 | | | 12,609,675 |
The Home Depot Inc. | | United States | | 343,000 | | | 9,240,420 |
Nordstrom Inc. | | United States | | 342,900 | | | 12,594,717 |
| | | | | | | |
| | | | | | | 34,444,812 |
| | | | | | | |
Technology Services 3.6% | | | | | | | |
Microsoft Corp. | | United States | | 342,400 | | | 12,189,440 |
Paychex Inc. | | United States | | 280,500 | | | 10,159,710 |
| | | | | | | |
| | | | | | | 22,349,150 |
| | | | | | | |
Transportation 3.1% | | | | | | | |
J.B. Hunt Transport Services Inc. | | United States | | 366,100 | | | 10,086,055 |
United Parcel Service Inc., B | | United States | | 127,400 | | | 9,009,728 |
| | | | | | | |
| | | | | | | 19,095,783 |
| | | | | | | |
Utilities 1.7% | | | | | | | |
Dominion Resources Inc. | | United States | | 216,700 | | | 10,282,415 |
| | | | | | | |
Total Common Stocks (Cost $456,269,467) | | | | | | | 552,799,813 |
| | | | | | | |
Preferred Stock (Cost $8,133,100) 1.3% | | | | | | | |
Finance 1.3% | | | | | | | |
aFNMA, 8.25%, pfd. | | United States | | 325,000 | | | 8,352,500 |
| | | | | | | |
Convertible Preferred Stocks 4.0% | | | | | | | |
Consumer Services 1.8% | | | | | | | |
a,bThe Goldman Sachs Group Inc. into Comcast Corp., 5.00%, cvt. pfd., 144A | | United States | | 600,000 | | | 10,978,200 |
| | | | | | | |
Finance 1.2% | | | | | | | |
E*TRADE Financial Corp., 6.125%, cvt. pfd. | | United States | | 378,300 | | | 2,144,961 |
aWashington Mutual Inc, 7.75%, cvt. pfd., R | | United States | | 6,100 | | | 5,398,500 |
| | | | | | | |
| | | | | | | 7,543,461 |
| | | | | | | |
Health Technology 1.0% | | | | | | | |
Schering-Plough Corp., 6.00%, cvt. pfd. | | United States | | 25,000 | | | 6,036,296 |
| | | | | | | |
Total Convertible Preferred Stocks (Cost $33,331,899) | | | | | | | 24,557,957 |
| | | | | | | |
Total Long Term Investments (Cost $497,734,466) | | | | | | | 585,710,270 |
| | | | | | | |
FGI-10
Franklin Templeton Variable Insurance Products Trust
Statement of Investments, December 31, 2007 (continued)
| | | | | | | | |
| Franklin Growth and Income Securities Fund | | Country | | Principal
Amount | | Value |
Short Term Investment (Cost $25,303,009) 4.1% | | | | | | | | |
Repurchase Agreement 4.1% | | | | | | | | |
cJoint Repurchase Agreement, 3.773%, 1/02/08 (Maturity Value $25,308,312) | | United States | | $ | 25,303,009 | | $ | 25,303,009 |
ABN AMRO Bank NV, New York Branch (Maturity Value $2,490,338)
Banc of America Securities LLC (Maturity Value $2,490,338)
Barclays Capital Inc. (Maturity Value $1,146,973)
BNP Paribas Securities Corp. (Maturity Value $2,490,338)
Credit Suisse Securities (USA) LLC (Maturity Value $655,232)
Deutsche Bank Securities Inc. (Maturity Value $2,490,338)
Dresdner Kleinwort Wasserstein Securities LLC (Maturity Value $2,490,338)
Goldman, Sachs & Co. (Maturity Value $3,014,473)
Greenwich Capital Markets Inc. (Maturity Value $2,490,338)
Lehman Brothers Inc. (Maturity Value $3,059,268)
Merrill Lynch Government Securities Inc. (Maturity Value $2,490,338) | | | | | | | | |
Collateralized by U.S. Government Agency Securities, 3.00% - 6.25%, 1/15/08 - 11/14/12; dU.S. Government Agency Discount Notes, 1/02/08 - 8/01/12; dU.S. Treasury Bill, 6/12/08; and U.S. Treasury Notes, 3.25% - 4.625%, 3/31/08 - 8/15/10 | | | | | | | | |
| | | | | | | | |
Total Investments (Cost $523,037,475) 98.6% | | | | | | | | 611,013,279 |
Other Assets, less Liabilities 1.4% | | | | | | | | 8,369,724 |
| | | | | | | | |
Net Assets 100.0% | | | | | | | $ | 619,383,003 |
| | | | | | | | |
Selected Portfolio Abbreviations
ADR - American Depository Receipt
FNMA - Federal National Mortgage Association
aNon-income producing for the twelve months ended December 31, 2007.
bSecurity was purchased pursuant to Rule 144A under the Securities Act of 1933 and may be sold in transactions exempt from registration only to qualified institutional buyers or in a public offering registered under the Securities Act of 1933. This security has been deemed liquid under guidelines approved by the Fund’s Board of Trustees. At December 31, 2007 the value of this security was $10,978,200, representing 1.77% of net assets.
cSee Note 1(c) regarding joint repurchase agreement.
dThe security is traded on a discount basis with no stated coupon rate.
The accompanying notes are an integral part of these financial statements.
FGI-11
Franklin Templeton Variable Insurance Products Trust
Financial Statements
Statement of Assets and Liabilities
December 31, 2007
| | | |
| | | Franklin Growth
and Income
Securities Fund |
Assets: | | | |
Investments in securities: | | | |
Cost - Unaffiliated issuers | | $ | 497,734,466 |
Cost - Repurchase agreements | | | 25,303,009 |
| | | |
Total cost of investments | | $ | 523,037,475 |
| | | |
Value - Unaffiliated issuers | | $ | 585,710,270 |
Value - Repurchase agreements | | | 25,303,009 |
| | | |
Total value of investments | | | 611,013,279 |
Receivables: | | | |
Investment securities sold | | | 8,184,813 |
Capital shares sold | | | 1,291,855 |
Dividends | | | 637,841 |
| | | |
Total assets | | | 621,127,788 |
| | | |
Liabilities: | | | |
Payables: | | | |
Investment securities purchased | | | 758,100 |
Capital shares redeemed | | | 424,945 |
Affiliates | | | 394,767 |
Reports to shareholders | | | 121,280 |
Accrued expenses and other liabilities | | | 45,693 |
| | | |
Total liabilities | | | 1,744,785 |
| | | |
Net assets, at value | | $ | 619,383,003 |
| | | |
Net assets consist of: | | | |
Paid-in capital | | $ | 477,693,803 |
Undistributed net investment income | | | 16,941,787 |
Net unrealized appreciation (depreciation) | | | 87,975,804 |
Accumulated net realized gain (loss) | | | 36,771,609 |
| | | |
Net assets, at value | | $ | 619,383,003 |
| | | |
Class 1: | | | |
Net assets, at value | | $ | 306,691,394 |
| | | |
Shares outstanding | | | 20,355,002 |
| | | |
Net asset value and maximum offering price per share | | $ | 15.07 |
| | | |
Class 2: | | | |
Net assets, at value | | $ | 312,691,609 |
| | | |
Shares outstanding | | | 21,046,029 |
| | | |
Net asset value and maximum offering price per share | | $ | 14.86 |
| | | |
The accompanying notes are an integral part of these financial statements.
FGI-12
Franklin Templeton Variable Insurance Products Trust
Financial Statements (continued)
Statement of Operations
for the year ended December 31, 2007
| | | | |
| | | Franklin Growth
and Income
Securities Fund | |
Investment income: | | | | |
Dividends | | $ | 20,820,558 | |
Interest | | | 618,408 | |
Income from securities loaned | | | 150,843 | |
| | | | |
Total investment income | | | 21,589,809 | |
| | | | |
Expenses: | | | | |
Management fees (Note 3a) | | | 3,506,676 | |
Distribution fees - Class 2 (Note 3c) | | | 899,508 | |
Unaffiliated transfer agent fees | | | 12,418 | |
Custodian fees (Note 4) | | | 16,349 | |
Reports to shareholders | | | 141,912 | |
Professional fees | | | 39,545 | |
Trustees’ fees and expenses | | | 3,211 | |
Other | | | 22,103 | |
| | | | |
Total expenses | | | 4,641,722 | |
Expense reductions (Note 4) | | | (6 | ) |
| | | | |
Net expenses | | | 4,641,716 | |
| | | | |
Net investment income | | | 16,948,093 | |
| | | | |
Realized and unrealized gains (losses): | | | | |
Net realized gain (loss) from: | | | | |
Investments | | | 37,900,420 | |
Foreign currency transactions | | | 53,532 | |
| | | | |
Net realized gain (loss) | | | 37,953,952 | |
| | | | |
Net change in unrealized appreciation (depreciation) on investments | | | (76,998,728 | ) |
| | | | |
Net realized and unrealized gain (loss) | | | (39,044,776 | ) |
| | | | |
Net increase (decrease) in net assets resulting from operations | | $ | (22,096,683 | ) |
| | | | |
The accompanying notes are an integral part of these financial statements.
FGI-13
Franklin Templeton Variable Insurance Products Trust
Financial Statements (continued)
Statements of Changes in Net Assets
| | | | | | | | |
| | | Franklin Growth and Income
Securities Fund | |
| | | Year Ended December 31, | |
| | | 2007 | | | 2006 | |
| | | | |
Increase (decrease) in net assets: | | | | | | | | |
Operations: | | | | | | | | |
Net investment income | | $ | 16,948,093 | | | $ | 17,870,136 | |
Net realized gain (loss) from investments and foreign currency transactions | | | 37,953,952 | | | | 40,268,258 | |
Net change in unrealized appreciation (depreciation) on investments | | | (76,998,728 | ) | | | 52,679,425 | |
| | | | |
Net increase (decrease) in net assets resulting from operations | | | (22,096,683 | ) | | | 110,817,819 | |
| | | | |
Distributions to shareholders from: | | | | | | | | |
Net investment income: | | | | | | | | |
Class 1 | | | (8,774,492 | ) | | | (10,156,911 | ) |
Class 2 | | | (8,436,065 | ) | | | (7,558,734 | ) |
Net realized gains: | | | | | | | | |
Class 1 | | | (19,524,195 | ) | | | (19,198,119 | ) |
Class 2 | | | (20,561,240 | ) | | | (15,678,017 | ) |
| | | | |
Total distributions to shareholders | | | (57,295,992 | ) | | | (52,591,781 | ) |
| | | | |
Capital share transactions: (Note 2) | | | | | | | | |
Class 1 | | | (44,846,830 | ) | | | (48,044,550 | ) |
Class 2 | | | 6,147,390 | | | | 8,762,172 | |
| | | | |
Total capital share transactions | | | (38,699,440 | ) | | | (39,282,378 | ) |
| | | | |
Net increase (decrease) in net assets | | | (118,092,115 | ) | | | 18,943,660 | |
Net assets: | | | | | | | | |
Beginning of year | | | 737,475,118 | | | | 718,531,458 | |
| | | | |
End of year | | $ | 619,383,003 | | | $ | 737,475,118 | |
| | | | |
Undistributed net investment income included in net assets: | | | | | | | | |
End of year | | $ | 16,941,787 | | | $ | 17,843,156 | |
| | | | |
The accompanying notes are an integral part of these financial statements.
FGI-14
Franklin Templeton Variable Insurance Products Trust
Notes to Financial Statements
Franklin Growth and Income Securities Fund
1. ORGANIZATION AND SIGNIFICANT ACCOUNTING POLICIES
Franklin Templeton Variable Insurance Products Trust (Trust) is registered under the Investment Company Act of 1940, as amended, (1940 Act) as an open-end investment company, consisting of twenty-three separate funds. The Franklin Growth and Income Securities Fund (Fund) included in this report is diversified. The financial statements of the remaining funds in the Trust are presented separately. Shares of the Fund are sold only to insurance company separate accounts to fund the benefits of variable life insurance policies or variable annuity contracts. As of December 31, 2007, 76.20% of the Fund’s shares were held through one insurance company. The Fund offers two classes of shares: Class 1 and Class 2. Each class of shares differs by its distribution fees, voting rights on matters affecting a single class and its exchange privilege.
The following summarizes the Fund’s significant accounting policies.
a. Security Valuation
Securities listed on a securities exchange or on the NASDAQ National Market System are valued at the last quoted sale price or the official closing price of the day, respectively. Over-the-counter securities and listed securities for which there is no reported sale are valued within the range of the most recent quoted bid and ask prices. Securities that trade in multiple markets or on multiple exchanges are valued according to the broadest and most representative market.
Foreign securities are valued as of the close of trading on the foreign stock exchange on which the security is primarily traded, or the NYSE, whichever is earlier. If no sale is reported at that time, the foreign security will be valued within the range of the most recent quoted bid and ask prices. The value is then converted into its U.S. dollar equivalent at the foreign exchange rate in effect at the close of the NYSE on the day that the value of the foreign security is determined.
The Trust has procedures to determine the fair value of individual securities and other assets for which market prices are not readily available or which may not be reliably priced. Methods for valuing these securities may include: fundamental analysis, matrix pricing, discounts from market prices of similar securities, or discounts applied due to the nature and duration of restrictions on the disposition of the securities. Due to the inherent uncertainty of valuations of such securities, the fair values may differ significantly from the values that would have been used had a ready market for such investments existed. Occasionally, events occur between the time at which trading in a security is completed and the close of the NYSE that might call into question the availability (including the reliability) of the value of a portfolio security held by the Fund. The investment manager monitors price movements following the close of trading in foreign stock markets through a series of country specific market proxies (such as baskets of American Depository Receipts, futures contracts and exchange traded funds). These price movements are measured against established trigger thresholds for each specific market proxy to assist in determining if an event has occurred. If such an event occurs, the securities may be valued using fair value procedures, which may include the use of independent pricing services. All security valuation procedures are approved by the Trust’s Board of Trustees.
b. Foreign Currency Translation
Portfolio securities and other assets and liabilities denominated in foreign currencies are translated into U.S. dollars based on the exchange rate of such currencies against U.S. dollars on the date of valuation. Purchases and sales of securities, income and expense items denominated in foreign currencies are translated into U.S. dollars at the exchange rate in effect on the transaction date. Occasionally, events may impact the availability or reliability of foreign exchange rates used to convert the U.S. dollar equivalent value. If such an event occurs, the foreign exchange rate will be valued at fair value using procedures established and approved by the Trust’s Board of Trustees.
The Fund does not separately report the effect of changes in foreign exchange rates from changes in market prices on securities held. Such changes are included in net realized and unrealized gain or loss from investments on the Statement of Operations.
FGI-15
Franklin Templeton Variable Insurance Products Trust
Notes to Financial Statements (continued)
Franklin Growth and Income Securities Fund
1. ORGANIZATION AND SIGNIFICANT ACCOUNTING POLICIES (continued)
b. Foreign Currency Translation (continued)
Realized foreign exchange gains or losses arise from sales of foreign currencies, currency gains or losses realized between the trade and settlement dates on securities transactions and the difference between the recorded amounts of dividends, interest, and foreign withholding taxes and the U.S. dollar equivalent of the amounts actually received or paid. Net unrealized foreign exchange gains and losses arise from changes in foreign exchange rates on foreign denominated assets and liabilities other than investments in securities held at the end of the reporting period.
c. Joint Repurchase Agreement
The Fund may enter into a joint repurchase agreement whereby its uninvested cash balance is deposited into a joint cash account with other funds managed by the investment manager or an affiliate of the investment manager and is used to invest in one or more repurchase agreements. The value and face amount of the joint repurchase agreement are allocated to the funds based on their pro-rata interest. A repurchase agreement is accounted for as a loan by the fund to the seller, collateralized by securities which are delivered to the fund’s custodian. The market value, including accrued interest, of the initial collateralization is required to be at least 102% of the dollar amount invested by the funds, with the value of the underlying securities marked to market daily to maintain coverage of at least 100%. The joint repurchase agreement held by the Fund at year end had been entered into on December 31, 2007. The joint repurchase agreement is valued at cost.
d. Foreign Currency Contracts
When the Fund purchases or sells foreign securities it may enter into foreign exchange contracts to minimize foreign exchange risk from the trade date to the settlement date of the transactions. A foreign exchange contract is an agreement between two parties to exchange different currencies at an agreed upon exchange rate at a future date. Realized and unrealized gains and losses on these contracts are included in the Statement of Operations.
The risks of these contracts include movement in the values of the foreign currencies relative to the U.S. dollar and the possible inability of the counterparties to fulfill their obligations under the contracts, which may be in excess of the amount reflected in the Statement of Assets and Liabilities.
e. Securities Lending
The Fund may loan securities to certain brokers through a securities lending agent for which it receives initial cash collateral against the loaned securities in an amount equal to at least 102% of the market value of the loaned securities. Collateral is maintained over the life of the loan in an amount not less than 100% of the market value of loaned securities, as determined at the close of fund business each day; any additional collateral required due to changes in security values is delivered to the fund on the next business day. The fund receives interest income from the investment of cash collateral, adjusted by lender fees and broker rebates. The fund bears the risk of loss with respect to the investment of the collateral and the securities loaned. The securities lending agent has agreed to indemnify the fund in the case of default of any securities borrower. At December 31, 2007, the Fund had no securities on loan.
f. Income Taxes
No provision has been made for U.S. income taxes because it is the Fund’s policy to qualify as a regulated investment company under the Internal Revenue Code and to distribute to shareholders substantially all of its taxable income and net realized gains.
FGI-16
Franklin Templeton Variable Insurance Products Trust
Notes to Financial Statements (continued)
Franklin Growth and Income Securities Fund
1. ORGANIZATION AND SIGNIFICANT ACCOUNTING POLICIES (continued)
g. Security Transactions, Investment Income, Expenses and Distributions
Security transactions are accounted for on trade date. Realized gains and losses on security transactions are determined on a specific identification basis. Interest income and estimated expenses are accrued daily. Dividend income is recorded on the ex-dividend date except that certain dividends from foreign securities are recognized as soon as the Fund is notified of the ex-dividend date. Distributions to shareholders are recorded on the ex-dividend date and are determined according to income tax regulations (tax basis). Distributable earnings determined on a tax basis may differ from earnings recorded in accordance with accounting principles generally accepted in the United States of America. These differences may be permanent or temporary. Permanent differences are reclassified among capital accounts to reflect their tax character. These reclassifications have no impact on net assets or the results of operations. Temporary differences are not reclassified, as they may reverse in subsequent periods.
Common expenses incurred by the Trust are allocated among the funds based on the ratio of net assets of each fund to the combined net assets of the Trust. Fund specific expenses are charged directly to the fund that incurred the expense.
Realized and unrealized gains and losses and net investment income, other than class specific expenses, are allocated daily to each class of shares based upon the relative proportion of net assets of each class. Differences in per share distributions, by class, are generally due to differences in class specific expenses.
h. Accounting Estimates
The preparation of financial statements in accordance with accounting principles generally accepted in the United States of America requires management to make estimates and assumptions that affect the reported amounts of assets and liabilities at the date of the financial statements and the amounts of income and expenses during the reporting period. Actual results could differ from those estimates.
i. Guarantees and Indemnifications
Under the Trust’s organizational documents, its officers and trustees are indemnified by the Trust against certain liabilities arising out of the performance of their duties to the Trust. Additionally, in the normal course of business, the Trust, on behalf of the Fund, enters into contracts with service providers that contain general indemnification clauses. The Trust’s maximum exposure under these arrangements is unknown as this would involve future claims that may be made against the Trust that have not yet occurred. Currently, the Trust expects the risk of loss to be remote.
FGI-17
Franklin Templeton Variable Insurance Products Trust
Notes to Financial Statements (continued)
Franklin Growth and Income Securities Fund
2. SHARES OF BENEFICIAL INTEREST
At December 31, 2007, there were an unlimited number of shares authorized (without par value). Transactions in the Fund’s shares were as follows:
| | | | | | | | | | | | | | |
| | | Year Ended December 31, | |
| | | 2007 | | | 2006 | |
| Class 1 Shares: | | Shares | | | Amount | | | Shares | | | Amount | |
Shares sold | | 27,512 | | | $ | 465,422 | | | 114,159 | | | $ | 1,817,005 | |
Shares issued in reinvestment of distributions | | 1,649,108 | | | | 28,298,687 | | | 2,003,756 | | | | 29,355,030 | |
Shares redeemed | | (4,423,307 | ) | | | (73,610,939 | ) | | (4,989,570 | ) | | | (79,216,585 | ) |
| | | | |
Net increase (decrease) | | (2,746,687 | ) | | $ | (44,846,830 | ) | | (2,871,655 | ) | | $ | (48,044,550 | ) |
| | | | |
| Class 2 Shares: | | | | | | | | | | | | |
Shares sold | | 3,345,833 | | | $ | 57,300,105 | | | 2,218,990 | | | $ | 34,370,276 | |
Shares issued in reinvestment of distributions | | 1,710,755 | | | | 28,997,305 | | | 1,603,640 | | | | 23,236,751 | |
Shares redeemed | | (4,996,720 | ) | | | (80,150,020 | ) | | (3,151,790 | ) | | | (48,844,855 | ) |
| | | | |
Net increase (decrease) | | 59,868 | | | $ | 6,147,390 | | | 670,840 | | | $ | 8,762,172 | |
| | | | |
3. TRANSACTIONS WITH AFFILIATES
Franklin Resources, Inc. is the holding company for various subsidiaries that together are referred to as Franklin Templeton Investments. Certain officers and trustees of the Trust are also officers and/or directors of the following subsidiaries:
| | |
| Subsidiary | | Affiliation |
Franklin Advisers, Inc. (Advisers) | | Investment manager |
Franklin Templeton Services, LLC (FT Services) | | Administrative manager |
Franklin Templeton Distributors, Inc. (Distributors) | | Principal underwriter |
Franklin Templeton Investor Services, LLC (Investor Services) | | Transfer agent |
a. Management Fees
The Fund pays an investment management fee to Advisers based on the average daily net assets of the Fund as follows:
| | |
| Annualized Fee Rate | | Net Assets |
| 0.625% | | Up to and including $100 million |
| 0.500% | | Over $100 million, up to and including $250 million |
| 0.450% | | Over $250 million, up to and including $10 billion |
| 0.440% | | Over $10 billion, up to and including $12.5 billion |
| 0.420% | | Over $12.5 billion, up to and including $15 billion |
| 0.400% | | In excess of $15 billion |
FGI-18
Franklin Templeton Variable Insurance Products Trust
Notes to Financial Statements (continued)
Franklin Growth and Income Securities Fund
3. TRANSACTIONS WITH AFFILIATES (continued)
a. Management Fees (continued)
Effective January 1, 2008, the Fund will pay fees based on the average daily net assets of the Fund as follows:
| | |
| Annualized Fee Rate | | Net Assets |
| 0.625% | | Up to and including $100 million |
| 0.500% | | Over $100 million, up to and including $250 million |
| 0.450% | | Over $250 million, up to and including $7.5 billion |
| 0.440% | | Over $7.5 billion, up to and including $10 billion |
| 0.430% | | Over $10 billion, up to and including $12.5 billion |
| 0.420% | | Over $12.5 billion, up to and including $15 billion |
| 0.400% | | In excess of $15 billion |
b. Administrative Fees
Under an agreement with Advisers, FT Services provides administrative services to the Fund. The fee is paid by Advisers based on average daily net assets, and is not an additional expense of the Fund.
c. Distribution Fees
The Fund’s Board of Trustees has adopted a distribution plan for Class 2 shares pursuant to Rule 12b-1 under the 1940 Act. Under the Fund’s compensation distribution plan, the Fund pays Distributors for costs incurred in connection with the servicing, sale and distribution of the Fund’s shares up to 0.35% per year of its average daily net assets. The Board of Trustees has agreed to limit the current rate to 0.25% per year.
d. Transfer Agent Fees
Investor Services, under terms of an agreement, performs shareholder servicing for the Fund and is not paid by the Fund for the services.
4. EXPENSE OFFSET ARRANGEMENT
The Fund has entered into an arrangement with its custodian whereby credits realized as a result of uninvested cash balances are used to reduce a portion of the Fund’s custodian expenses. During the year ended December 31, 2007, the custodian fees were reduced as noted in the Statement of Operations.
5. INCOME TAXES
The Fund has reviewed the tax positions taken on federal income tax returns, for each of the three open tax years and as of December 31, 2007 and has determined that no provision for income tax is required in the Fund’s financial statements.
For tax purposes, realized capital losses, occurring subsequent to October 31, may be deferred and treated as occurring on the first day of the following fiscal year. At December 31, 2007, the Fund deferred realized capital losses of $3,153,720.
The tax character of distributions paid during the years ended December 31, 2007 and 2006, was as follows:
| | | | | | |
| | | 2007 | | 2006 |
Distributions paid from: | | | | | | |
Ordinary income | | $ | 22,500,691 | | $ | 19,793,901 |
Long term capital gain | | | 34,795,301 | | | 32,797,880 |
| | | |
| | $ | 57,295,992 | | $ | 52,591,781 |
| | | |
FGI-19
Franklin Templeton Variable Insurance Products Trust
Notes to Financial Statements (continued)
Franklin Growth and Income Securities Fund
5. INCOME TAXES (continued)
At December 31, 2007, the cost of investments, net unrealized appreciation (depreciation), undistributed ordinary income and undistributed long term capital gains for income tax purposes were as follows:
| | | | |
Cost of investments | | $ | 524,393,702 | |
| | | | |
| |
Unrealized appreciation | | $ | 137,140,923 | |
Unrealized depreciation | | | (50,521,346 | ) |
| | | | |
Net unrealized appreciation (depreciation) | | $ | 86,619,577 | |
| | | | |
Undistributed ordinary income | | $ | 19,525,340 | |
Undistributed long term capital gains | | | 38,793,210 | |
| | | | |
Distributable earnings | | $ | 58,318,550 | |
| | | | |
Net investment income differs for financial statement and tax purposes primarily due to differing treatments of foreign currency transactions and bond discounts.
Net realized gains (losses) differ for financial statement and tax purposes primarily due to differing treatment of wash sales, foreign currency transactions and bond discounts.
6. INVESTMENT TRANSACTIONS
Purchases and sales of investments (excluding short term securities) for the year ended December 31, 2007, aggregated $258,496,123 and $359,105,067 respectively.
7. REGULATORY AND LITIGATION MATTERS
As part of various investigations by a number of federal, state, and foreign regulators and governmental entities, including the Securities and Exchange Commission (“SEC”), relating to certain practices in the mutual fund industry, including late trading, market timing and marketing support payments to securities dealers who sell fund shares (“marketing support”), Franklin Resources, Inc. and certain of its subsidiaries (collectively, the “Company”), entered into settlements with certain of those regulators and governmental entities. Specifically, the Company entered into settlements with the SEC, among others, concerning market timing and marketing support.
On June 6, 2007, the SEC posted for public comment the proposed plan of distribution for the market timing settlement. Once the SEC approves the final plan of distribution, disbursements of settlement monies will be made promptly to individuals who were shareholders of the designated funds during the relevant period, in accordance with the terms and conditions of the settlement and plan.
In addition, the Company, as well as most of the mutual funds within Franklin Templeton Investments and certain current or former officers, Company directors, fund directors, and employees, have been named in private lawsuits (styled as shareholder class actions, or as derivative actions on behalf of either the named funds or Franklin Resources, Inc.). The lawsuits relate to the industry practices referenced above.
The Company and fund management believe that the claims made in each of the private lawsuits referenced above are without merit and intend to defend against them vigorously. The Company cannot predict with certainty the eventual outcome of these lawsuits, nor whether they will have a material negative impact on the Company. If it is determined that the Company bears responsibility for any unlawful or inappropriate conduct that caused losses to the Fund, it is committed to making the Trust or its shareholders whole, as appropriate.
FGI-20
Franklin Templeton Variable Insurance Products Trust
Notes to Financial Statements (continued)
Franklin Growth and Income Securities Fund
8. NEW ACCOUNTING PRONOUNCEMENT
In September 2006, the Financial Accounting Standards Board (FASB) issued FASB Statement No. 157, “Fair Value Measurement” (SFAS 157), which defines fair value, establishes a framework for measuring fair value, and expands disclosures about fair value measurements. SFAS 157 is effective for fiscal years beginning after November 15, 2007, and interim periods within those fiscal years. The Trust believes the adoption of SFAS 157 will have no material impact on its financial statements.
FGI-21
Franklin Templeton Variable Insurance Products Trust
Franklin Growth and Income Securities Fund
Report of Independent Registered Public Accounting Firm
To the Board of Trustees and Shareholders of
Franklin Templeton Variable Insurance Products Trust
In our opinion, the accompanying statement of assets and liabilities, including the statement of investments, and the related statements of operations and of changes in net assets and the financial highlights present fairly, in all material respects, the financial position of Franklin Growth and Income Securities Fund (one of the funds constituting Franklin Templeton Variable Insurance Products Trust, hereafter referred to as the “Fund”) at December 31, 2007, the results of its operations for the year then ended, the changes in its net assets for each of the two years in the period then ended and the financial highlights for each of the five years in the period then ended, in conformity with accounting principles generally accepted in the United States of America. These financial statements and financial highlights (hereafter referred to as “financial statements”) are the responsibility of the Fund’s management. Our responsibility is to express an opinion on these financial statements based on our audits. We conducted our audits of these financial statements in accordance with the standards of the Public Company Accounting Oversight Board (United States). Those standards require that we plan and perform the audit to obtain reasonable assurance about whether the financial statements are free of material misstatement. An audit includes examining, on a test basis, evidence supporting the amounts and disclosures in the financial statements, assessing the accounting principles used and significant estimates made by management, and evaluating the overall financial statement presentation. We believe that our audits, which included confirmation of securities at December 31, 2007 by correspondence with the custodian and brokers, provide a reasonable basis for our opinion.
PricewaterhouseCoopers LLP
San Francisco, California
February 14, 2008
FGI-22
Franklin Templeton Variable Insurance Products Trust
Tax Designation (unaudited)
Franklin Growth and Income Securities Fund
Under Section 852(b)(3)(C) of the Internal Revenue Code (Code), the Fund designates the maximum amount allowable but no less than $38,795,522 as a long term capital gain dividend for the fiscal year ended December 31, 2007.
Under Section 854(b)(2) of the Code, the Fund designates 71.50% of the ordinary income dividends as income qualifying for the dividends received deduction for the fiscal year ended December 31, 2007.
FGI-23
FRANKLIN HIGH INCOME SECURITIES FUND
We are pleased to bring you Franklin High Income Securities Fund’s annual report for the fiscal year ended December 31, 2007.
Performance Summary as of 12/31/07
Average annual total return of Class 1 shares represents the average annual change in value, assuming reinvestment of dividends and capital gains. Average returns smooth out variations in returns, which can be significant; they are not the same as year-by-year results.
Periods ended 12/31/07
| | | | | | |
| | | 1-Year | | 5-Year | | 10-Year |
Average Annual Total Return | | +3.02% | | +11.10% | | +3.43% |
Total Return Index Comparison
for Hypothetical $10,000 Investment (1/1/98–12/31/07)
The graph below shows the change in value of a hypothetical $10,000 investment in the Fund over the indicated period and includes reinvestment of any income or distributions. The Fund’s performance is compared to the performance of the Credit Suisse (CS) High Yield Index and the Lipper VIP High Current Yield Funds Classification Average. One cannot invest directly in an index, nor is an index representative of the Fund’s portfolio. Please see Important Notes to Performance Information preceding the Fund Summaries.
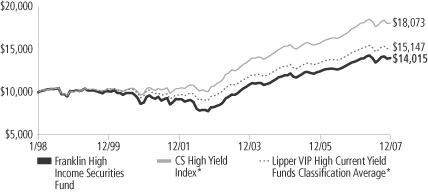
*Sources: Standard & Poor’s Micropal; Lipper Inc. Please see Index Descriptions following the Fund Summaries.
Franklin High Income Securities Fund – Class 1
Performance reflects the Fund’s Class 1 operating expenses, but does not include any contract fees, expenses or sales charges. If they had been included, performance would be lower. These charges and deductions, particularly for variable life policies, can have a significant effect on contract values and insurance benefits. See the contract prospectus for a complete description of these expenses, including sales charges.
Performance data represent past performance, which does not guarantee future results. Investment return and principal value will fluctuate, and you may have a gain or loss when you sell your shares. Current performance may differ from figures shown.
FH-1
Fund Goals and Main Investments: Franklin High Income Securities Fund seeks a high level of current income with capital appreciation as a secondary goal. The Fund normally invests primarily to predominantly in high yield, lower quality debt securities.
Performance Overview
You can find the Fund’s one-year total return in the Performance Summary. The Fund performed comparably to its benchmark, the CS High Yield Index, which returned +2.65% for the period under review.1 The Fund outperformed its peers, as measured by the +2.55% return of the Lipper VIP High Current Yield Funds Classification Average.2
Economic and Market Overview
The U.S. economy grew at a moderate but uneven pace for the year ended December 31, 2007. After starting 2007 with first quarter gross domestic product (GDP) growth of 0.6% annualized, the economy accelerated to a strong second quarter growth rate of 3.8% annualized, fueled by a surge in exports. In the third quarter, GDP growth advanced at a 4.9% annualized rate, the fastest pace in four years. For most of the reporting period, consumer spending and personal income supported economic expansion, but signs of a slowing economy became evident as a number of indicators reflected a housing market correction, financial market strains and softening business and consumer spending, as well as upward inflation pressures from increasing food, energy and commodity prices and a weaker dollar. In the fourth quarter, GDP growth slowed to an estimated 0.6% annualized rate.
Oil prices exhibited continued volatility, reaching a historical high in November. Core inflation, which excludes food and energy costs, rose modestly for the year, signaling that inflation risk remains. For December 2007, core inflation had a 12-month increase of 2.4%.3 The Federal Reserve Board’s (Fed’s) preferred measure of inflation, the core personal consumption expenditures price index, reported a 12-month increase of 2.2%.4
1. Source: Standard & Poor’s Micropal.
2. Source: Lipper Inc.
One cannot invest directly in an index, nor is an index representative of the Fund’s portfolio. Please see Index Descriptions following the Fund Summaries.
3. Source: Bureau of Labor Statistics.
4. Source: Bureau of Economic Analysis.
Fund Risks: Because the Fund invests in bonds and other debt obligations, its share price and yield will be affected by interest rate movements. Bond prices generally move in the opposite direction of interest rates. Thus, as prices of bonds in the Fund adjust to a rise in interest rates, the Fund’s share price may decline. The Fund invests primarily to predominantly in high yield, lower-rated (junk) bonds, which generally have greater price swings and higher risk of default and loss of principal than investment grade bonds. Foreign investing, especially in emerging markets, involves additional risks including currency fluctuations, economic instability, market volatility, and political and social instability. The Fund’s prospectus also includes a description of the main investment risks.
FH-2
As investor uncertainty continued in the latter half of 2007, the Fed remained committed to act in an effort to restore normalcy to U.S. financial markets. The Fed cut the discount rate (the Fed’s interest rate charged to member banks) four times, bringing the rate to 4.75%. It also lowered the federal funds target rate three times. Minutes released from its December meeting, in which the Fed lowered the federal funds target rate to 4.25%, cited an uncertain outlook for economic growth and inflation and the need for the committee to be “exceptionally alert to economic and financial developments.”
Over the period, investors sought relative safety in short-term U.S. Treasuries, Treasury yields declined and the yield curve steepened. Short-term, two- and five-year yields declined significantly, with the two-year bill yielding 3.05% at the end of December, down from 4.82% a year earlier. The 10-year U.S. Treasury note ended December yielding 4.04%, compared with 4.71% at the beginning of the period.
Regarding the high yield bond market, 2007 began relatively strong. Yield spreads at the beginning of the year were well below the 10-year average, but with corporate fundamentals generally strong, demand for the high yield asset class remained intact. However, beginning in early summer, the subprime mortgage loan market began to collapse, and although the high yield market had little direct exposure to the subprime market, it could not withstand the effects of the resulting equity market volatility and broader risk aversion in the financial markets. Moreover, a pending supply of lower-quality high yield bonds, which were slated to finance many large, leveraged-buyout transactions, weighed on the secondary market as demand for such transactions waned. Also, greater concerns surrounding the slowdown in U.S. economic growth increased concerns over the credit outlook for more cyclical high yield issuers. Consequently, spread premiums over U.S. Treasury securities widened by more than 300 basis points (100 basis points equal one percentage point) from their end-of-May lows as measured by the CS High Yield Index. Overall, the spread increased from 271 basis points at the end of May to 589 basis points by period-end, which erased some of the market’s earlier gains.
Investment Strategy
We are research-driven, fundamental investors who rely on a team of analysts to provide in-depth industry expertise and use qualitative and quantitative analyses to evaluate companies. As bottom-up investors, we focus primarily on individual securities. We also consider sectors

FH-3
when choosing investments. In selecting securities for the Fund’s investment portfolio, we do not rely principally on ratings assigned by rating agencies, but perform our own independent analysis to evaluate an issuer’s creditworthiness. We consider a variety of factors, including an issuer’s experience and managerial strength, its sensitivity to economic conditions and its current financial condition.
Manager’s Discussion
During the fiscal year under review, we generally maintained a slightly conservative positioning, from a risk perspective, relative to our peers and the benchmark CS High Yield Index based on our assessment of the market’s valuations. With a significant supply of pending leveraged buyout and other scheduled merger and acquisition-related financial transactions, as well as growing concerns about the domestic economic outlook, valuations fell considerably later in the year. In this environment, the Fund’s somewhat defensive positioning benefited performance relative to the Fund’s peer group.5
Certain industry allocations and specific holdings also helped relative performance. Although our investment process is mainly driven by bottom-up, company-specific analysis, we also use our fundamental research process to assess certain industries and their relative valuations. For example, the Fund was overweighted versus its peers in the chemicals industry during the year.6 Strong operating results and some merger and acquisition activity in the sector led it to outperform the overall market and aid relative performance. In particular, the bonds of Fund holding Lyondell Chemical rose above par value based on tender offers or expectations for future premium redemptions. The Lyondell position was tendered during the period. Additionally, the Fund was underweighted in the retail and housing industries during the fiscal year.7 Because these two industries significantly underperformed the overall market, the Fund’s positioning benefited relative returns.
Although the Fund’s overall positioning helped drive outperformance relative to its peers, certain holdings and industry weightings negatively impacted results. For example, the Fund’s allocation versus its peers in
5. For comparison, the Fund’s peer group comprises some of the mutual funds found within the Lipper High Current Yield Funds Classification Average. Please see Index Descriptions following the Fund Summaries.
6. The Fund’s chemicals holdings are in the materials sector in the SOI.
7. The Fund’s housing holdings are in the consumer durables and apparel, and real estate sectors in the SOI.
Top 10 Sectors/Industries
Franklin High Income Securities Fund
12/31/07
| | |
| | | % of Total
Net Assets |
| Media | | 11.4% |
| Energy | | 9.9% |
| Materials | | 9.7% |
| Utilities | | 8.5% |
| Telecommunication Services | | 8.1% |
| Consumer Services | | 7.7% |
| Capital Goods | | 7.4% |
| Health Care Equipment & Services | | 6.4% |
| Automobiles & Components | | 4.6% |
| Commercial Services & Supplies | | 4.2% |
The dollar value, number of shares or principal amount, and names of all portfolio holdings are listed in the Fund’s Statement of Investments (SOI).
FH-4
the gaming and pay television industries hindered relative performance.8 The Fund held an overweighted position in the gaming industry based on our positive view of underlying asset values. However, increased competition for existing casino operators, combined with slowing demand in some regions, led to fundamental concerns and contributed to the industry’s underperformance during the year. Regarding the pay television industry, the Fund maintained an underweighted position, which hurt results. Although we viewed the pay television industry’s relative valuations as somewhat fully valued, it outperformed the overall market.
Thank you for your participation in Franklin High Income Securities Fund. We look forward to serving your future investment needs.
8. The Fund’s gaming holdings are in the consumer services sector and pay television holdings are in the media sector in the SOI.
The foregoing information reflects our analysis, opinions and portfolio holdings as of December 31, 2007, the end of the reporting period. The way we implement our main investment strategies and the resulting portfolio holdings may change depending on factors such as market and economic conditions. These opinions may not be relied upon as investment advice or an offer for a particular security. The information is not a complete analysis of every aspect of any market, country, industry, security or the Fund. Statements of fact are from sources considered reliable, but the investment manager makes no representation or warranty as to their completeness or accuracy. Although historical performance is no guarantee of future results, these insights may help you understand our investment management philosophy.
FH-5
Fund Expenses
As an investor in a variable insurance contract (Contract) that indirectly provides for investment in an underlying mutual fund, you can incur transaction and/or ongoing expenses at both the Fund level and the Contract level.
| • | | Transaction expenses can include sales charges (loads) on purchases, redemption fees, surrender fees, transfer fees and premium taxes. |
| • | | Ongoing expenses can include management fees, distribution and service (12b-1) fees, contract fees, annual maintenance fees, mortality and expense risk fees and other fees and expenses. All mutual funds and Contracts have some types of ongoing expenses. |
The expenses shown in the table are meant to highlight ongoing expenses at the Fund level only and do not include ongoing expenses at the Contract level, or transaction expenses at either the Fund or Contract level. While the Fund does not have transaction expenses, if the transaction and ongoing expenses at the Contract level were included, the expenses shown would be higher. You should consult your Contract prospectus or disclosure document for more information.
The table shows Fund-level ongoing expenses and can help you understand these expenses and compare them with those of other mutual funds offered through the Contract. The table assumes a $1,000 investment held for the six months indicated. Please refer to the Fund prospectus for additional information on operating expenses.
Actual Fund Expenses
The first line (Actual) of the table provides actual account values and expenses. The “Ending Account Value” is derived from the Fund’s actual return, which includes the effect of ongoing Fund expenses, but does not include the effect of ongoing Contract expenses.
You can estimate the Fund-level expenses you incurred during the period by following these steps. Of course, your account value and expenses will differ from those in this illustration:
| 1. | Divide your account value by $1,000. |
If an account had an $8,600 value, then $8,600 ÷ $1,000 = 8.6.
| 2. | Multiply the result by the number under the heading “Fund-Level Expenses Incurred During Period.” |
If Fund-Level Expenses Incurred During Period were $7.50, then 8.6 x $7.50 = $64.50.
In this illustration, the estimated expenses incurred this period at the Fund level are $64.50.
Franklin High Income Securities Fund – Class 1
FH-6
Hypothetical Example for Comparison with Other Mutual Funds
Information in the second line (Hypothetical) of the table can help you compare ongoing expenses of the Fund with those of other mutual funds offered through the Contract. This information may not be used to estimate the actual ending account balance or expenses you incurred during the period. The hypothetical “Ending Account Value” is based on the Fund’s actual expense ratio and an assumed 5% annual rate of return before expenses, which does not represent the Fund’s actual return. The figure under the heading “Fund-Level Expenses Incurred During Period” shows the hypothetical expenses your account would have incurred under this scenario. You can compare this figure with the 5% hypothetical examples that appear in shareholder reports of other funds offered through a Contract.
| | | | | | | | | |
| Class 1 | | Beginning
Account Value 7/1/07 | | Ending
Account
Value 12/31/07 | | Fund-Level
Expenses Incurred
During Period*
7/1/07–12/31/07 |
Actual | | $ | 1,000 | | $ | 1,003.00 | | $ | 3.13 |
Hypothetical (5% return before expenses) | | $ | 1,000 | | $ | 1,022.08 | | $ | 3.16 |
*Expenses are calculated using the most recent six-month annualized expense ratio for the Fund’s Class 1 shares (0.62%), which does not include any ongoing expenses of the Contract for which the Fund is an investment option, multiplied by the average account value over the period, multiplied by 184/365 to reflect the one-half year period.
FH-7
Franklin Templeton Variable Insurance Products Trust
Financial Highlights
Franklin High Income Securities Fund
| | | | | | | | | | | | | | | | | | | | |
| | | Year Ended December 31, | |
| Class 1 | | 2007 | | | 2006 | | | 2005 | | | 2004 | | | 2003 | |
| | | | |
Per share operating performance | | | | | | | | | | | | | | | | | | | | |
(for a share outstanding throughout the year) | | | | | | | | | | | | | | | | | | | | |
Net asset value, beginning of year | | $ | 6.96 | | | $ | 6.82 | | | $ | 6.99 | | | $ | 6.81 | | | $ | 5.67 | |
| | | | |
Income from investment operationsa: | | | | | | | | | | | | | | | | | | | | |
Net investment incomeb | | | 0.51 | | | | 0.49 | | | | 0.48 | | | | 0.49 | | | | 0.51 | |
Net realized and unrealized gains (losses) | | | (0.30 | ) | | | 0.12 | | | | (0.23 | ) | | | 0.15 | | | | 1.21 | |
| | | | |
Total from investment operations | | | 0.21 | | | | 0.61 | | | | 0.25 | | | | 0.64 | | | | 1.72 | |
| | | | |
Less distributions from net investment income | | | (0.45 | ) | | | (0.47 | ) | | | (0.42 | ) | | | (0.46 | ) | | | (0.58 | ) |
| | | | |
Net asset value, end of year | | $ | 6.72 | | | $ | 6.96 | | | $ | 6.82 | | | $ | 6.99 | | | $ | 6.81 | |
| | | | |
| | | | | |
Total returnc | | | 3.02% | | | | 9.48% | | | | 3.72% | | | | 10.04% | | | | 31.50% | |
Ratios to average net assets | | | | | | | | | | | | | | | | | | | | |
Expenses before expense reduction | | | 0.61% | | | | 0.64% | | | | 0.60% | | | | 0.62% | | | | 0.62% | |
Expenses net of expense reduction | | | 0.61% | d | | | 0.63% | | | | 0.60% | d | | | 0.62% | d | | | 0.62% | |
Net investment income | | | 7.38% | | | | 7.14% | | | | 6.96% | | | | 7.17% | | | | 8.19% | |
| | | | | |
Supplemental data | | | | | | | | | | | | | | | | | | | | |
Net assets, end of year (000’s) | | $ | 61,286 | | | $ | 77,641 | | | $ | 87,814 | | | $ | 109,569 | | | $ | 136,218 | |
Portfolio turnover rate | | | 40.65% | | | | 37.99% | | | | 47.60% | | | | 59.87% | | | | 52.01% | |
aThe amount shown for a share outstanding throughout the period may not correlate with the Statement of Operations for the period due to the timing of sales and repurchases of the Fund shares in relation to income earned and/or fluctuating market value of the investments of the Fund.
bBased on average daily shares outstanding.
cTotal return does not include any fees, charges or expenses imposed by the variable annuity and life insurance contracts for which the Franklin Templeton Variable Insurance Products Trust serves as an underlying investment vehicle.
dBenefit of expense reduction rounds to less than 0.01%.
The accompanying notes are an integral part of these financial statements.
FH-8
Franklin Templeton Variable Insurance Products Trust
Financial Highlights (continued)
Franklin High Income Securities Fund
| | | | | | | | | | | | | | | | | | | | |
| | | Year Ended December 31, | |
| Class 2 | | 2007 | | | 2006 | | | 2005 | | | 2004 | | | 2003 | |
| | | | |
Per share operating performance | | | | | | | | | | | | | | | | | | | | |
(for a share outstanding throughout the year) | | | | | | | | | | | | | | | | | | | | |
Net asset value, beginning of year | | $ | 6.85 | | | $ | 6.71 | | | $ | 6.90 | | | $ | 6.73 | | | $ | 5.62 | |
| | | | |
Income from investment operationsa: | | | | | | | | | | | | | | | | | | | | |
Net investment incomeb | | | 0.48 | | | | 0.46 | | | | 0.45 | | | | 0.46 | | | | 0.48 | |
Net realized and unrealized gains (losses) | | | (0.29 | ) | | | 0.13 | | | | (0.23 | ) | | | 0.16 | | | | 1.21 | |
| | | | |
Total from investment operations | | | 0.19 | | | | 0.59 | | | | 0.22 | | | | 0.62 | | | | 1.69 | |
| | | | |
Less distributions from net investment income | | | (0.44 | ) | | | (0.45 | ) | | | (0.41 | ) | | | (0.45 | ) | | | (0.58 | ) |
| | | | |
Net asset value, end of year | | $ | 6.60 | | | $ | 6.85 | | | $ | 6.71 | | | $ | 6.90 | | | $ | 6.73 | |
| | | | |
| | | | | |
Total returnc | | | 2.72% | | | | 9.36% | | | | 3.31% | | | | 9.87% | | | | 31.18% | |
Ratios to average net assets | | | | | | | | | | | | | | | | | | | | |
Expenses before expense reduction | | | 0.86% | | | | 0.89% | | | | 0.85% | | | | 0.87% | | | | 0.87% | |
Expenses net of expense reduction | | | 0.86% | d | | | 0.88% | | | | 0.85% | d | | | 0.87% | d | | | 0.87% | |
Net investment income | | | 7.13% | | | | 6.89% | | | | 6.71% | | | | 6.92% | | | | 7.94% | |
| | | | | |
Supplemental data | | | | | | | | | | | | | | | | | | | | |
Net assets, end of year (000’s) | | $ | 155,777 | | | $ | 166,318 | | | $ | 139,413 | | | $ | 122,579 | | | $ | 58,681 | |
Portfolio turnover rate | | | 40.65% | | | | 37.99% | | | | 47.60% | | | | 59.87% | | | | 52.01% | |
aThe amount shown for a share outstanding throughout the period may not correlate with the Statement of Operations for the period due to the timing of sales and repurchases of the Fund shares in relation to income earned and/or fluctuating market value of the investments of the Fund.
bBased on average daily shares outstanding.
cTotal return does not include any fees, charges or expenses imposed by the variable annuity and life insurance contracts for which the Franklin Templeton Variable Insurance Products Trust serves as an underlying investment vehicle.
dBenefit of expense reduction rounds to less than 0.01%.
The accompanying notes are an integral part of these financial statements.
FH-9
Franklin Templeton Variable Insurance Products Trust
Statement of Investments, December 31, 2007
| | | | | | | | |
| Franklin High Income Securities Fund | | Country | | Principal
Amounta | | Value |
Long Term Investments 96.7% | | | | | | | | |
Corporate Bonds 96.7% | | | | | | | | |
Automobiles & Components 4.6% | | | | | | | | |
bAllison Transmission Inc., senior note, 144A, 11.00%, 11/01/15 | | United States | | $ | 2,300,000 | | $ | 2,104,500 |
Ford Motor Credit Co. LLC, | | | | | | | | |
7.80%, 6/01/12 | | United States | | | 3,000,000 | | | 2,632,332 |
senior note, 9.875%, 8/10/11 | | United States | | | 2,200,000 | | | 2,082,346 |
General Motors Corp., senior deb., 8.25%, 7/15/23 | | United States | | | 1,000,000 | | | 800,000 |
bTRW Automotive Inc., senior note, 144A, 7.25%, 3/15/17 | | United States | | | 2,500,000 | | | 2,256,250 |
| | | | | | | | |
| | | | | | | | 9,875,428 |
| | | | | | | | |
Capital Goods 7.4% | | | | | | | | |
DRS Technologies Inc., senior sub. note, 7.625%, 2/01/18 | | United States | | | 2,200,000 | | | 2,238,500 |
Greenbrier Cos. Inc., senior note, 8.375%, 5/15/15 | | United States | | | 2,400,000 | | | 2,304,000 |
L-3 Communications Corp., senior sub. note, 5.875%, 1/15/15 | | United States | | | 2,500,000 | | | 2,425,000 |
RBS Global & Rexnord Corp., senior note, 9.50%, 8/01/14 | | United States | | | 2,500,000 | | | 2,487,500 |
Terex Corp., senior sub. note, 8.00%, 11/15/17 | | United States | | | 2,300,000 | | | 2,340,250 |
TransDigm Inc., senior sub. note, 7.75%, 7/15/14 | | United States | | | 2,400,000 | | | 2,448,000 |
United Rentals North America Inc., senior sub. note, 7.75%, 11/15/13 | | United States | | | 2,000,000 | | | 1,740,000 |
| | | | | | | | |
| | | | | | | | 15,983,250 |
| | | | | | | | |
Commercial Services & Supplies 4.2% | | | | | | | | |
Allied Waste North America Inc., senior secured note, 6.875%, 6/01/17 | | United States | | | 2,100,000 | | | 2,058,000 |
ARAMARK Corp., senior note, 8.50%, 2/01/15 | | United States | | | 2,300,000 | | | 2,340,250 |
c,dGoss Graphic Systems Inc., senior sub. note, 12.25%, 11/19/05 | | United States | | | 1,912,374 | | | — |
JohnsonDiversey Holdings Inc., senior disc. note, 10.67%, 5/15/13 | | United States | | | 2,500,000 | | | 2,537,500 |
RSC Equipment Rental Inc., senior note, 9.50%, 12/01/14 | | United States | | | 2,500,000 | | | 2,250,000 |
| | | | | | | | |
| | | | | | | | 9,185,750 |
| | | | | | | | |
Consumer Durables & Apparel 3.2% | | | | | | | | |
Beazer Homes USA Inc., senior note, 8.125%, 6/15/16 | | United States | | | 1,100,000 | | | 825,000 |
Jarden Corp., senior sub. note, 7.50%, 5/01/17 | | United States | | | 2,400,000 | | | 2,076,000 |
Jostens IH Corp., senior sub. note, 7.625%, 10/01/12 | | United States | | | 1,500,000 | | | 1,515,000 |
KB Home, senior note, | | | | | | | | |
6.25%, 6/15/15 | | United States | | | 1,700,000 | | | 1,487,500 |
7.25%, 6/15/18 | | United States | | | 1,200,000 | | | 1,092,000 |
| | | | | | | | |
| | | | | | | | 6,995,500 |
| | | | | | | | |
Consumer Services 7.7% | | | | | | | | |
Boyd Gaming Corp., senior sub. note, 6.75%, 4/15/14 | | United States | | | 1,200,000 | | | 1,149,000 |
bFontainebleau Las Vegas, 144A, 10.25%, 6/15/15 | | United States | | | 1,700,000 | | | 1,483,250 |
bGreektown Holdings, senior note, 144A, 10.75%, 12/01/13 | | United States | | | 2,000,000 | | | 1,955,000 |
MGM MIRAGE, senior note, | | | | | | | | |
6.625%, 7/15/15 | | United States | | | 2,500,000 | | | 2,356,250 |
6.875%, 4/01/16 | | United States | | | 1,000,000 | | | 947,500 |
7.50%, 6/01/16 | | United States | | | 500,000 | | | 497,500 |
bOutback Steakhouse Inc., senior note, 144A, 10.00%, 6/15/15 | | United States | | | 1,900,000 | | | 1,396,500 |
Pinnacle Entertainment Inc., senior sub. note, | | | | | | | | |
8.25%, 3/15/12 | | United States | | | 200,000 | | | 203,000 |
8.75%, 10/01/13 | | United States | | | 2,100,000 | | | 2,147,250 |
Royal Caribbean Cruises Ltd., | | | | | | | | |
senior deb., 7.25%, 3/15/18 | | United States | | | 1,800,000 | | | 1,737,021 |
senior note, 6.875%, 12/01/13 | | United States | | | 700,000 | | | 683,213 |
FH-10
Franklin Templeton Variable Insurance Products Trust
Statement of Investments, December 31, 2007 (continued)
| | | | | | | | |
| Franklin High Income Securities Fund | | Country | | Principal
Amounta | | Value |
Long Term Investments (continued) | | | | | | | | |
Corporate Bonds (continued) | | | | | | | | |
Consumer Services (continued) | | | | | | | | |
Station Casinos Inc., | | | | | | | | |
senior note, 6.00%, 4/01/12 | | United States | | $ | 300,000 | | $ | 268,500 |
senior sub. note, 6.50%, 2/01/14 | | United States | | | 300,000 | | | 226,500 |
senior sub. note, 6.875%, 3/01/16 | | United States | | | 2,200,000 | | | 1,617,000 |
| | | | | | | | |
| | | | | | | | 16,667,484 |
| | | | | | | | |
Diversified Financials 3.3% | | | | | | | | |
E*TRADE Financial Corp., senior note, 8.00%, 6/15/11 | | United States | | | 300,000 | | | 261,750 |
GMAC LLC, 6.875%, 8/28/12 | | United States | | | 5,300,000 | | | 4,445,407 |
Lehman Brothers Holdings Inc., senior note, 6.20%, 9/26/14 | | United States | | | 2,300,000 | | | 2,345,676 |
| | | | | | | | |
| | | | | | | | 7,052,833 |
| | | | | | | | |
Energy 9.9% | | | | | | | | |
Chesapeake Energy Corp., senior note, | | | | | | | | |
7.625%, 7/15/13 | | United States | | | 500,000 | | | 518,750 |
6.25%, 1/15/18 | | United States | | | 3,000,000 | | | 2,895,000 |
Compagnie Generale de Geophysique-Veritas, senior note, | | | | | | | | |
7.50%, 5/15/15 | | France | | | 500,000 | | | 508,750 |
7.75%, 5/15/17 | | France | | | 700,000 | | | 710,500 |
El Paso Corp., senior note, 6.875%, 6/15/14 | | United States | | | 2,500,000 | | | 2,530,560 |
Mariner Energy Inc., senior note, 7.50%, 4/15/13 | | United States | | | 2,600,000 | | | 2,515,500 |
Markwest Energy Partners LP, senior note, 6.875%, 11/01/14 | | United States | | | 2,500,000 | | | 2,393,750 |
Peabody Energy Corp., senior note, B, 6.875%, 3/15/13 | | United States | | | 2,500,000 | | | 2,525,000 |
bPetroplus Finance Ltd., senior note, 144A, 6.75%, 5/01/14 | | Switzerland | | | 1,900,000 | | | 1,778,875 |
Tesoro Corp., senior note, 6.50%, 6/01/17 | | United States | | | 2,200,000 | | | 2,189,000 |
The Williams Cos. Inc., | | | | | | | | |
8.75%, 3/15/32 | | United States | | | 800,000 | | | 982,000 |
senior note, 7.625%, 7/15/19 | | United States | | | 600,000 | | | 653,250 |
senior note, 7.875%, 9/01/21 | | United States | | | 1,200,000 | | | 1,336,500 |
| | | | | | | | |
| | | | | | | | 21,537,435 |
| | | | | | | | |
Food, Beverage & Tobacco 2.4% | | | | | | | | |
Dean Foods Inc., senior note, 7.00%, 6/01/16 | | United States | | | 600,000 | | | 537,000 |
Reynolds American Inc., senior secured note, 7.625%, 6/01/16 | | United States | | | 2,500,000 | | | 2,669,990 |
Smithfield Foods Inc., senior note, 7.75%, | | | | | | | | |
5/15/13 | | United States | | | 1,200,000 | | | 1,188,000 |
7/01/17 | | United States | | | 800,000 | | | 778,000 |
| | | | | | | | |
| | | | | | | | 5,172,990 |
| | | | | | | | |
Health Care Equipment & Services 6.4% | | | | | | | | |
bFMC Finance III SA, senior note, 144A, 6.875%, 7/15/17 | | Germany | | | 2,700,000 | | | 2,713,500 |
HCA Inc., | | | | | | | | |
senior note, 6.50%, 2/15/16 | | United States | | | 400,000 | | | 340,000 |
senior secured note, 9.125%, 11/15/14 | | United States | | | 2,400,000 | | | 2,502,000 |
Tenet Healthcare Corp., senior note, 7.375%, 2/01/13 | | United States | | | 2,500,000 | | | 2,200,000 |
United Surgical Partners International Inc., senior sub. note, PIK, 9.25%, 5/01/17 | | United States | | | 1,500,000 | | | 1,470,000 |
eU.S. Oncology Holdings Inc., senior note, FRN, PIK, 10.759%, 3/15/12 | | United States | | | 2,600,000 | | | 2,171,000 |
Vanguard Health Holding Co. II LLC, senior sub. note, 9.00%, 10/01/14 | | United States | | | 2,500,000 | | | 2,418,750 |
| | | | | | | | |
| | | | | | | | 13,815,250 |
| | | | | | | | |
Materials 9.7% | | | | | | | | |
Crown Americas Inc., senior note, 7.75%, 11/15/15 | | United States | | | 2,500,000 | | | 2,587,500 |
FH-11
Franklin Templeton Variable Insurance Products Trust
Statement of Investments, December 31, 2007 (continued)
| | | | | | | | |
| Franklin High Income Securities Fund | | Country | | Principal
Amounta | | Value |
Long Term Investments (continued) | | | | | | | | |
Corporate Bonds (continued) | | | | | | | | |
Materials (continued) | | | | | | | | |
Freeport-McMoRan Copper & Gold Inc., senior note, 8.375%, 4/01/17 | | United States | | $ | 2,200,000 | | $ | 2,365,000 |
Huntsman International LLC, senior sub. note, 7.875%, 11/15/14 | | United States | | | 2,200,000 | | | 2,343,000 |
bIneos Group Holdings PLC, 144A, 8.50%, 2/15/16 | | United Kingdom | | | 2,500,000 | | | 2,237,500 |
JSG Funding PLC, senior sub. note, 7.75%, 4/01/15 | | Ireland | | | 2,500,000 | | | 2,387,500 |
bMacDermid Inc., senior sub. note, 144A, 9.50%, 4/15/17 | | United States | | | 2,000,000 | | | 1,890,000 |
Nalco Co., senior sub. note, 8.875%, 11/15/13 | | United States | | | 2,500,000 | | | 2,618,750 |
Novelis Inc., senior note, 7.25%, 2/15/15 | | Canada | | | 2,200,000 | | | 2,079,000 |
Owens-Illinois Inc., senior note, 7.80%, 5/15/18 | | United States | | | 2,500,000 | | | 2,556,250 |
| | | | | | | | |
| | | | | | | | 21,064,500 |
| | | | | | | | |
Media 11.4% | | | | | | | | |
Cablevision Systems Corp., senior note, B, 8.00%, 4/15/12 | | United States | | | 1,000,000 | | | 975,000 |
c,dCallahan Nordrhein-Westfallen, senior note, 14.00%, 7/15/10 | | Germany | | | 2,750,000 | | | 275 |
CanWest Media Inc., senior sub. note, 8.00%, 9/15/12 | | Canada | | | 2,600,000 | | | 2,466,750 |
CCH II LLC, senior note, 10.25%, 9/15/10 | | United States | | | 3,800,000 | | | 3,743,000 |
CSC Holdings Inc., senior note, 6.75%, 4/15/12 | | United States | | | 1,000,000 | | | 961,250 |
Dex Media West LLC, senior sub. note, 9.875%, 8/15/13 | | United States | | | 1,500,000 | | | 1,563,750 |
Lamar Media Corp., senior sub. note, | | | | | | | | |
7.25%, 1/01/13 | | United States | | | 2,000,000 | | | 2,010,000 |
6.625%, 8/15/15 | | United States | | | 300,000 | | | 293,250 |
Liberty Media Corp., senior note, 5.70%, 5/15/13 | | United States | | | 2,000,000 | | | 1,862,824 |
Quebecor Media Inc., | | | | | | | | |
b144A, 7.75%, 3/15/16 | | Canada | | | 200,000 | | | 193,000 |
senior note, 7.75%, 3/15/16 | | Canada | | | 1,800,000 | | | 1,737,000 |
R.H. Donnelley Corp., senior note, 8.875%, 1/15/16 | | United States | | | 3,500,000 | | | 3,290,000 |
Radio One Inc., senior sub. note, 6.375%, 2/15/13 | | United States | | | 2,300,000 | | | 1,911,875 |
bRainbow National Services LLC, senior sub. deb., 144A, 10.375%, 9/01/14 | | United States | | | 1,330,000 | | | 1,448,038 |
bUnivision Communications Inc., senior note, 144A, PIK, 9.75%, 3/15/15 | | United States | | | 2,600,000 | | | 2,382,250 |
| | | | | | | | |
| | | | | | | | 24,838,262 |
| | | | | | | | |
Real Estate 2.2% | | | | | | | | |
Forest City Enterprises Inc., senior note, | | | | | | | | |
7.625%, 6/01/15 | | United States | | | 2,300,000 | | | 2,231,000 |
6.50%, 2/01/17 | | United States | | | 300,000 | | | 273,000 |
Host Marriott LP, senior note, | | | | | | | | |
M, 7.00%, 8/15/12 | | United States | | | 1,800,000 | | | 1,809,000 |
O, 6.375%, 3/15/15 | | United States | | | 500,000 | | | 490,000 |
| | | | | | | | |
| | | | | | | | 4,803,000 |
| | | | | | | | |
Retailing 2.2% | | | | | | | | |
bDollar General Corp., senior note, 144A, 10.625%, 7/15/15 | | United States | | | 2,500,000 | | | 2,306,250 |
Michaels Stores Inc., senior note, 10.00%, 11/01/14 | | United States | | | 2,500,000 | | | 2,387,500 |
| | | | | | | | |
| | | | | | | | 4,693,750 |
| | | | | | | | |
Semiconductors & Semiconductor Equipment 1.0% | | | | | | | | |
Freescale Semiconductor Inc., senior note, 8.875%, 12/15/14 | | United States | | | 2,500,000 | | | 2,243,750 |
| | | | | | | | |
Software & Services 3.4% | | | | | | | | |
bFirst Data Corp., senior note, 144A, 9.875%, 9/24/15 | | United States | | | 2,100,000 | | | 1,955,625 |
Iron Mountain Inc., senior sub. note, 8.75%, 7/15/18 | | United States | | | 2,200,000 | | | 2,323,750 |
SunGard Data Systems Inc., | | | | | | | | |
senior note, 9.125%, 8/15/13 | | United States | | | 900,000 | | | 920,250 |
senior sub. note, 10.25%, 8/15/15 | | United States | | | 2,100,000 | | | 2,157,750 |
| | | | | | | | |
| | | | | | | | 7,357,375 |
| | | | | | | | |
FH-12
Franklin Templeton Variable Insurance Products Trust
Statement of Investments, December 31, 2007 (continued)
| | | | | | | | |
| Franklin High Income Securities Fund | | Country | | Principal
Amounta | | Value |
Long Term Investments (continued) | | | | | | | | |
Corporate Bonds (continued) | | | | | | | | |
Technology Hardware & Equipment 1.1% | | | | | | | | |
Sanmina-SCI Corp., | | | | | | | | |
b,esenior note, 144A, FRN, 7.741%, 6/15/14 | | United States | | $ | 1,000,000 | | $ | 968,750 |
senior sub. note, 6.75%, 3/01/13 | | United States | | | 1,400,000 | | | 1,225,000 |
senior sub. note, 8.125%, 3/01/16 | | United States | | | 300,000 | | | 267,375 |
| | | | | | | | |
| | | | | | | | 2,461,125 |
| | | | | | | | |
Telecommunication Services 8.1% | | | | | | | | |
Centennial Communications Corp., senior note, 10.00%, 1/01/13 | | United States | | | 2,500,000 | | | 2,612,500 |
bDigicel Group Ltd., senior note, 144A, 8.875%, 1/15/15 | | Jamaica | | | 2,700,000 | | | 2,477,250 |
Intelsat Subsidiary Holding Co. Ltd., senior note, 8.25%, 1/15/13 | | Bermuda | | | 3,000,000 | | | 3,030,000 |
MetroPCS Wireless Inc., senior note, 9.25%, 11/01/14 | | United States | | | 2,000,000 | | | 1,890,000 |
Millicom International Cellular SA, senior note, 10.00%, 12/01/13 | | Luxembourg | | | 2,200,000 | | | 2,354,000 |
Qwest Communications International Inc., senior note, | | | | | | | | |
7.50%, 2/15/14 | | United States | | | 1,000,000 | | | 1,002,500 |
B, 7.50%, 2/15/14 | | United States | | | 2,000,000 | | | 2,005,000 |
bWind Acquisition Finance SA, senior note, 144A, 10.75%, 12/01/15 | | Italy | | | 2,025,000 | | | 2,217,375 |
| | | | | | | | |
| | | | | | | | 17,588,625 |
| | | | | | | | |
Utilities 8.5% | | | | | | | | |
bAES Corp., senior note, 144A, 8.00%, 10/15/17 | | United States | | | 2,300,000 | | | 2,363,250 |
Aquila Inc., senior note, 14.875%, 7/01/12 | | United States | | | 2,000,000 | | | 2,520,000 |
Dynegy Holdings Inc., senior note, | | | | | | | | |
7.50%, 6/01/15 | | United States | | | 300,000 | | | 282,000 |
8.375%, 5/01/16 | | United States | | | 2,300,000 | | | 2,259,750 |
Edison Mission Energy, senior note, 7.00%, 5/15/17 | | United States | | | 2,700,000 | | | 2,666,250 |
Mirant North America LLC, senior note, 7.375%, 12/31/13 | | United States | | | 2,500,000 | | | 2,518,750 |
NRG Energy Inc., senior note, | | | | | | | | |
7.25%, 2/01/14 | | United States | | | 900,000 | | | 879,750 |
7.375%, 2/01/16 | | United States | | | 2,100,000 | | | 2,052,750 |
bTexas Competitive Electric Holdings Co. LLC, senior note, 144A, 10.25%, 11/01/15 | | United States | | | 3,000,000 | | | 2,985,000 |
| | | | | | | | |
| | | | | | | | 18,527,500 |
| | | | | | | | |
Total Corporate Bonds (Cost $219,912,053) | | | | | | | | 209,863,807 |
| | | | | | | | |
| | | |
| | | | | Shares | | |
Common Stock (Cost $89,208) 0.0% | | | | | | | | |
Commercial Services & Supplies 0.0% | | | | | | | | |
c,f,gGoss Holdings Inc., B | | United States | | | 44,604 | | | — |
| | | | | | | | |
Total Long Term Investments (Cost $220,001,261) | | | | | | | | 209,863,807 |
| | | | | | | | |
FH-13
Franklin Templeton Variable Insurance Products Trust
Statement of Investments, December 31, 2007 (continued)
| | | | | | | | |
| Franklin High Income Securities Fund | | Country | | Principal
Amounta | | Value |
Short Term Investment (Cost $3,107,180) 1.4% | | | | | | | | |
Repurchase Agreement 1.4% | | | | | | | | |
hJoint Repurchase Agreement, 3.773%, 1/02/08 (Maturity Value $3,107,831) | | United States | | $ | 3,107,180 | | $ | 3,107,180 |
ABN AMRO Bank NV, New York Branch (Maturity Value $305,811) | | | | | | | | |
Banc of America Securities LLC (Maturity Value $305,811) | | | | | | | | |
Barclays Capital Inc. (Maturity Value $140,847) | | | | | | | | |
BNP Paribas Securities Corp. (Maturity Value $305,811) | | | | | | | | |
Credit Suisse Securities (USA) LLC (Maturity Value $80,462) | | | | | | | | |
Deutsche Bank Securities Inc. (Maturity Value $305,811) | | | | | | | | |
Dresdner Kleinwort Wasserstein Securities LLC (Maturity Value $305,811) | | | | | | | | |
Goldman, Sachs & Co. (Maturity Value $370,174) | | | | | | | | |
Greenwich Capital Markets Inc. (Maturity Value $305,811) | | | | | | | | |
Lehman Brothers Inc. (Maturity Value $375,671) | | | | | | | | |
Merrill Lynch Government Securities Inc. (Maturity Value $305,811) | | | | | | | | |
Collateralized by U.S. Government Agency Securities, 3.00% - 6.25%, 1/15/08 - 11/14/12; iU.S. Government Agency Discount Notes, 1/02/08 - 8/01/12; iU.S. Treasury Bill, 6/12/08 and U.S. Treasury Notes, 3.25% - 4.625%, 3/31/08 - 8/15/10 | | | | | | | | |
| | | | | | | | |
Total Investments (Cost $223,108,441) 98.1% | | | | | | | | 212,970,987 |
Other Assets, less Liabilities 1.9% | | | | | | | | 4,091,635 |
| | | | | | | | |
Net Assets 100.0% | | | | | | | $ | 217,062,622 |
| | | | | | | | |
Selected Portfolio Abbreviations
FRN - Floating Rate Note
PIK - Payment-In-Kind
aThe principal amount is stated in U.S. dollars unless otherwise indicated.
bSecurity was purchased pursuant to Rule 144A under the Securities Act of 1933 and may be sold in transactions exempt from registration only to qualified institutional buyers or in a public offering registered under the Securities Act of 1933. These securities have been deemed liquid under guidelines approved by the Trust’s Board of Trustees. At December 31, 2007, the aggregate value of these securities was $37,112,163, representing 17.10% of net assets.
cSecurity has been deemed illiquid because it may not be able to be sold within seven days. At December 31, 2007, the aggregate value of these securities was $275, representing less than 0.01% of net assets.
dSee Note 7 regarding defaulted securities.
eThe coupon rate shown represents the rate at period end.
fNon-income producing for the twelve months ended December 31, 2007.
gSee Note 8 regarding restricted securities.
hSee Note 1(b) regarding joint repurchase agreement.
iThe security is traded on a discount basis with no stated coupon rate.
The accompanying notes are an integral part of these financial statements.
FH-14
Franklin Templeton Variable Insurance Products Trust
Financial Statements
Statement of Assets and Liabilities
December 31, 2007
| | | | |
| | | Franklin High
Income
Securities Fund | |
Assets: | | | | |
Investments in securities: | | | | |
Cost - Unaffiliated issuers | | $ | 220,001,261 | |
Cost - Repurchase agreements | | | 3,107,180 | |
| | | | |
Total cost of investments | | $ | 223,108,441 | |
| | | | |
Value - Unaffiliated issuers | | $ | 209,863,807 | |
Value - Repurchase agreements | | | 3,107,180 | |
| | | | |
Total value of investments | | | 212,970,987 | |
Interest receivable | | | 4,458,272 | |
| | | | |
Total assets | | | 217,429,259 | |
| | | | |
Liabilities: | | | | |
Payables: | | | | |
Capital shares redeemed | | | 120,755 | |
Affiliates | | | 169,527 | |
Reports to shareholders | | | 38,590 | |
Professional fees | | | 28,615 | |
Accrued expenses and other liabilities | | | 9,150 | |
| | | | |
Total liabilities | | | 366,637 | |
| | | | |
Net assets, at value | | $ | 217,062,622 | |
| | | | |
Net assets consist of: | | | | |
Paid-in capital | | $ | 342,223,024 | |
Undistributed net investment income | | | 17,129,175 | |
Net unrealized appreciation (depreciation) | | | (10,137,454 | ) |
Accumulated net realized gain (loss) | | | (132,152,123 | ) |
| | | | |
Net assets, at value | | $ | 217,062,622 | |
| | | | |
Class 1: | | | | |
Net assets, at value | | $ | 61,285,926 | |
| | | | |
Shares outstanding | | | 9,121,828 | |
| | | | |
Net asset value and maximum offering price per share | | $ | 6.72 | |
| | | | |
Class 2: | | | | |
Net assets, at value | | $ | 155,776,696 | |
| | | | |
Shares outstanding | | | 23,614,879 | |
| | | | |
Net asset value and maximum offering price per share | | $ | 6.60 | |
| | | | |
The accompanying notes are an integral part of these financial statements.
FH-15
Franklin Templeton Variable Insurance Products Trust
Financial Statements (continued)
Statement of Operations
for the year ended December 31, 2007
| | | | |
| | | Franklin High
Income
Securities Fund | |
Investment income: | | | | |
Interest | | $ | 19,459,410 | |
| | | | |
Expenses: | | | | |
Management fees (Note 3a) | | | 1,340,865 | |
Distribution fees - Class 2 (Note 3c) | | | 432,305 | |
Unaffiliated transfer agent fees | | | 2,647 | |
Custodian fees (Note 4) | | | 5,278 | |
Reports to shareholders | | | 87,647 | |
Professional fees | | | 32,443 | |
Trustees’ fees and expenses | | | 1,071 | |
Other | | | 17,832 | |
| | | | |
Total expenses | | | 1,920,088 | |
Expense reductions (Note 4) | | | (2,241 | ) |
| | | | |
Net expenses | | | 1,917,847 | |
| | | | |
Net investment income | | | 17,541,563 | |
| | | | |
Realized and unrealized gains (losses): | | | | |
Net realized gain (loss) from investments | | | 235,385 | |
Net change in unrealized appreciation (depreciation) on investments | | | (11,924,906 | ) |
| | | | |
Net realized and unrealized gain (loss) | | | (11,689,521 | ) |
| | | | |
Net increase (decrease) in net assets resulting from operations | | $ | 5,852,042 | |
| | | | |
The accompanying notes are an integral part of these financial statements.
FH-16
Franklin Templeton Variable Insurance Products Trust
Financial Statements (continued)
Statements of Changes in Net Assets
| | | | | | | | |
| | | Franklin High Income
Securities Fund | |
| | | Year Ended December 31, | |
| | | 2007 | | | 2006 | |
| | | | |
Increase (decrease) in net assets: | | | | | | | | |
Operations: | | | | | | | | |
Net investment income | | $ | 17,541,563 | | | $ | 16,125,983 | |
Net realized gain (loss) from investments | | | 235,385 | | | | (3,500,966 | ) |
Net change in unrealized appreciation (depreciation) on investments | | | (11,924,906 | ) | | | 8,189,602 | |
| | | | |
Net increase (decrease) in net assets resulting from operations | | | 5,852,042 | | | | 20,814,619 | |
| | | | |
Distributions to shareholders from: | | | | | | | | |
Net investment income: | | | | | | | | |
Class 1 | | | (4,495,151 | ) | | | (5,262,787 | ) |
Class 2 | | | (11,904,068 | ) | | | (9,121,702 | ) |
| | | | |
Total distributions to shareholders | | | (16,399,219 | ) | | | (14,384,489 | ) |
| | | | |
Capital share transactions: (Note 2) | | | | | | | | |
Class 1 | | | (14,109,266 | ) | | | (12,259,606 | ) |
Class 2 | | | (2,239,776 | ) | | | 22,561,846 | |
| | | | |
Total capital share transactions | | | (16,349,042 | ) | | | 10,302,240 | |
| | | | |
Net increase (decrease) in net assets | | | (26,896,219 | ) | | | 16,732,370 | |
Net assets: | | | | | | | | |
Beginning of year | | | 243,958,841 | | | | 227,226,471 | |
| | | | |
End of year | | $ | 217,062,622 | | | $ | 243,958,841 | |
| | | | |
Undistributed net investment income included in net assets: | | | | | | | | |
End of year | | $ | 17,129,175 | | | $ | 15,626,526 | |
| | | | |
The accompanying notes are an integral part of these financial statements.
FH-17
Franklin Templeton Variable Insurance Products Trust
Notes to Financial Statements
Franklin High Income Securities Fund
1. ORGANIZATION AND SIGNIFICANT ACCOUNTING POLICIES
Franklin Templeton Variable Insurance Products Trust (Trust) is registered under the Investment Company Act of 1940, as amended, (1940 Act) as an open-end investment company, consisting of twenty-three separate funds. The Franklin High Income Securities Fund (Fund) included in this report is diversified. The financial statements of the remaining funds in the Trust are presented separately. Shares of the Fund are sold only to insurance company separate accounts to fund the benefits of variable life insurance policies or variable annuity contracts. As of December 31, 2007, 94.26% of the Fund’s shares were held through one insurance company. The Fund offers two classes of shares: Class 1 and Class 2. Each class of shares differs by its distribution fees, voting rights on matters affecting a single class and its exchange privilege.
The following summarizes the Fund’s significant accounting policies.
a. Security Valuation
Securities listed on a securities exchange or on the NASDAQ National Market System are valued at the last quoted sale price or the official closing price of the day, respectively. Over-the-counter securities and listed securities for which there is no reported sale are valued within the range of the most recent quoted bid and ask prices. Securities that trade in multiple markets or on multiple exchanges are valued according to the broadest and most representative market.
Corporate debt securities generally trade in the over-the-counter market rather than on a securities exchange. The Trust may utilize independent pricing services, quotations from bond dealers, and information with respect to bond and note transactions, to assist in determining a current market value for each security. The Trust’s pricing services may use valuation models or matrix pricing which considers information with respect to comparable bond and note transactions, quotations from bond dealers, or by reference to other securities that are considered comparable in such characteristics as rating, interest rate and maturity date, option adjusted spread models, prepayment projections, interest rate spreads and yield curves, to determine current value.
Foreign securities are valued as of the close of trading on the foreign stock exchange on which the security is primarily traded, or the NYSE, whichever is earlier. If no sale is reported at that time, the foreign security will be valued within the range of the most recent quoted bid and ask prices. The value is then converted into its U.S. dollar equivalent at the foreign exchange rate in effect at the close of the NYSE on the day that the value of the foreign security is determined.
The Trust has procedures to determine the fair value of individual securities and other assets for which market prices are not readily available or which may not be reliably priced. Methods for valuing these securities may include: fundamental analysis, matrix pricing, discounts from market prices of similar securities, or discounts applied due to the nature and duration of restrictions on the disposition of the securities. Due to the inherent uncertainty of valuations of such securities, the fair values may differ significantly from the values that would have been used had a ready market for such investments existed. Occasionally, events occur between the time at which trading in a security is completed and the close of the NYSE that might call into question the availability (including the reliability) of the value of a portfolio security held by the Fund. If such an event occurs, the securities may be valued using fair value procedures, which may include the use of independent pricing services. All security valuation procedures are approved by the Trust’s Board of Trustees.
b. Joint Repurchase Agreement
The Fund may enter into a joint repurchase agreement whereby its uninvested cash balance is deposited into a joint cash account with other funds managed by the investment manager or an affiliate of the investment manager and is used to invest in one or more repurchase agreements. The value and face amount of the joint repurchase agreement are allocated to the funds based on their pro-rata interest. A repurchase agreement is accounted for as a loan by the Fund to the seller, collateralized by securities which are delivered to the Fund’s custodian. The market value, including accrued interest, of the initial collateralization is required to be at least 102% of the dollar amount invested by the funds, with the value of the underlying securities marked to
FH-18
Franklin Templeton Variable Insurance Products Trust
Notes to Financial Statements (continued)
Franklin High Income Securities Fund
1. ORGANIZATION AND SIGNIFICANT ACCOUNTING POLICIES (continued)
b. Joint Repurchase Agreement (continued)
market daily to maintain coverage of at least 100%. The joint repurchase agreement held by the Fund at year end had been entered into on December 31, 2007. The joint repurchase agreement is valued at cost.
c. Income Taxes
No provision has been made for U.S. income taxes because it is the Fund’s policy to qualify as a regulated investment company under the Internal Revenue Code and to distribute to shareholders substantially all of its taxable income and net realized gains.
d. Security Transactions, Investment Income, Expenses and Distributions
Security transactions are accounted for on trade date. Realized gains and losses on security transactions are determined on a specific identification basis. Interest income and estimated expenses are accrued daily. Amortization of premium and accretion of discount on debt securities are included in interest income. Distributions to shareholders are recorded on the ex-dividend date and are determined according to income tax regulations (tax basis). Distributable earnings determined on a tax basis may differ from earnings recorded in accordance with accounting principles generally accepted in the United States of America. These differences may be permanent or temporary. Permanent differences are reclassified among capital accounts to reflect their tax character. These reclassifications have no impact on net assets or the results of operations. Temporary differences are not reclassified, as they may reverse in subsequent periods.
Common expenses incurred by the Trust are allocated among the funds based on the ratio of net assets of each fund to the combined net assets of the Trust. Fund specific expenses are charged directly to the fund that incurred the expense.
Realized and unrealized gains and losses and net investment income, other than class specific expenses, are allocated daily to each class of shares based upon the relative proportion of net assets of each class. Differences in per share distributions, by class, are generally due to differences in class specific expenses.
e. Accounting Estimates
The preparation of financial statements in accordance with accounting principles generally accepted in the United States of America requires management to make estimates and assumptions that affect the reported amounts of assets and liabilities at the date of the financial statements and the amounts of income and expenses during the reporting period. Actual results could differ from those estimates.
f. Guarantees and Indemnifications
Under the Trust’s organizational documents, its officers and trustees are indemnified by the Trust against certain liabilities arising out of the performance of their duties to the Trust. Additionally, in the normal course of business, the Trust, on behalf of the Fund, enters into contracts with service providers that contain general indemnification clauses. The Trust’s maximum exposure under these arrangements is unknown as this would involve future claims that may be made against the Trust that have not yet occurred. Currently, the Trust expects the risk of loss to be remote.
FH-19
Franklin Templeton Variable Insurance Products Trust
Notes to Financial Statements (continued)
Franklin High Income Securities Fund
2. SHARES OF BENEFICIAL INTEREST
At December 31, 2007, there were an unlimited number of shares authorized (without par value). Transactions in the Fund’s shares were as follows:
| | | | | | | | | | | | | | |
| | | Year Ended December 31, | |
| | | 2007 | | | 2006 | |
| Class 1 Shares: | | Shares | | | Amount | | | Shares | | | Amount | |
Shares sold | | 730,046 | | | $ | 4,985,612 | | | 512,532 | | | $ | 3,388,740 | |
Shares issued in reinvestment of distributions | | 663,002 | | | | 4,495,151 | | | 814,673 | | | | 5,262,787 | |
Shares redeemed | | (3,418,532 | ) | | | (23,590,029 | ) | | (3,056,921 | ) | | | (20,911,133 | ) |
| | | | |
Net increase (decrease) | | (2,025,484 | ) | | $ | (14,109,266 | ) | | (1,729,716 | ) | | $ | (12,259,606 | ) |
| | | | |
| Class 2 Shares: | | | | | | | | | | | | |
Shares sold | | 7,186,912 | | | $ | 49,319,160 | | | 7,703,760 | | | $ | 51,288,226 | |
Shares issued in reinvestment of distributions | | 1,787,398 | | | | 11,904,068 | | | 1,431,978 | | | | 9,121,702 | |
Shares redeemed | | (9,639,217 | ) | | | (63,463,004 | ) | | (5,618,386 | ) | | | (37,848,082 | ) |
| | | | |
Net increase (decrease) | | (664,907 | ) | | $ | (2,239,776 | ) | | 3,517,352 | | | $ | 22,561,846 | |
| | | | |
3. TRANSACTIONS WITH AFFILIATES
Franklin Resources, Inc. is the holding company for various subsidiaries that together are referred to as Franklin Templeton Investments. Certain officers and trustees of the Trust are also officers and/or directors of the following subsidiaries:
| | |
| Subsidiary | | Affiliation |
Franklin Advisers, Inc. (Advisers) | | Investment manager |
Franklin Templeton Services, LLC (FT Services) | | Administrative manager |
Franklin Templeton Distributors, Inc. (Distributors) | | Principal underwriter |
Franklin Templeton Investor Services, LLC (Investor Services) | | Transfer agent |
a. Management Fees
The Fund pays an investment management fee to Advisers based on the average daily net assets of the Fund as follows:
| | |
| Annualized Fee Rate | | Net Assets |
| 0.625% | | Up to and including $100 million |
| 0.500% | | Over $100 million, up to and including $250 million |
| 0.450% | | Over $250 million, up to and including $10 billion |
| 0.440% | | Over $10 billion, up to and including $12.5 billion |
| 0.420% | | Over $12.5 billion, up to and including $15 billion |
| 0.400% | | In excess of $15 billion |
FH-20
Franklin Templeton Variable Insurance Products Trust
Notes to Financial Statements (continued)
Franklin High Income Securities Fund
3. TRANSACTIONS WITH AFFILIATES (continued)
a. Management Fees (continued)
Effective January 1, 2008, the Fund will pay fees based on the average daily net assets of the Fund as follows:
| | |
| Annualized Fee Rate | | Net Assets |
| 0.625% | | Up to and including $100 million |
| 0.500% | | Over $100 million, up to and including $250 million |
| 0.450% | | Over $250 million, up to and including $7.5 billion |
| 0.440% | | Over $7.5 billion, up to and including $10 billion |
| 0.430% | | Over $10 billion, up to and including $12.5 billion |
| 0.420% | | Over $12.5 billion, up to and including $15 billion |
| 0.400% | | In excess of $15 billion |
b. Administrative Fees
Under an agreement with Advisers, FT Services provides administrative services to the Fund. The fee is paid by Advisers based on average daily net assets, and is not an additional expense of the Fund.
c. Distribution Fees
The Fund’s Board of Trustees has adopted a distribution plan for Class 2 shares pursuant to Rule 12b-1 under the 1940 Act. Under the Fund’s compensation distribution plan, the Fund pays Distributors for costs incurred in connection with the servicing, sale and distribution of the Fund’s shares up to 0.35% per year of its average daily net assets. The Board of Trustees has agreed to limit the current rate to 0.25% per year.
d. Transfer Agent Fees
Investor Services, under terms of an agreement, performs shareholder servicing for the Fund and is not paid by the Fund for the services.
4. EXPENSE OFFSET ARRANGEMENT
The Fund has entered into an arrangement with its custodian whereby credits realized as a result of uninvested cash balances are used to reduce a portion of the Fund’s custodian expenses. During the year ended December 31, 2007, the custodian fees were reduced as noted in the Statement of Operations.
5. INCOME TAXES
The Fund has reviewed the tax positions taken on federal income tax returns, for each of the three open tax years and as of December 31, 2007 and has determined that no provision for income tax is required in the Fund’s financial statements.
FH-21
Franklin Templeton Variable Insurance Products Trust
Notes to Financial Statements (continued)
Franklin High Income Securities Fund
5. INCOME TAXES (continued)
For tax purposes, capital losses may be carried over to offset future capital gains, if any. At December 31, 2007, the capital loss carryforwards were as follows:
| | | |
Capital loss carryforwards expiring in: | | | |
2008 | | $ | 26,944,467 |
2009 | | | 14,152,532 |
2010 | | | 46,366,314 |
2011 | | | 24,711,916 |
2012 | | | 9,009,590 |
2013 | | | 6,321,190 |
2014 | | | 40,420 |
2015 | | | 4,493,289 |
| | | |
| | | $132,039,718 |
| | | |
On December 31, 2007, the Fund had expired capital loss carryforwards of $2,294,320, which were reclassified to paid-in capital.
For tax purposes, realized capital losses occurring subsequent to October 31, may be deferred and treated as occurring on the first day of the following fiscal year. At December 31, 2007, the Fund deferred realized capital losses of $152,454.
The tax character of distributions paid during the years ended December 31, 2007 and 2006, was as follows:
| | | | | | |
| | | 2007 | | 2006 |
Distributions paid from ordinary income | | $ | 16,399,219 | | $ | 14,384,489 |
| | | |
At December 31, 2007, the cost of investments, net unrealized appreciation (depreciation) and undistributed ordinary income for income tax purposes were as follows:
| | | | |
Cost of investments | | $ | 223,724,137 | |
| | | | |
| |
Unrealized appreciation | | $ | 2,554,918 | |
Unrealized depreciation | | | (13,308,068 | ) |
| | | | |
Net unrealized appreciation (depreciation) | | $ | (10,753,150 | ) |
| | | | |
Distributable earnings – undistributed ordinary income | | $ | 17,784,923 | |
| | | | |
Net investment income and net realized gains (losses) differs for financial statement and tax purposes primarily due to differing treatments of bond discounts and premiums.
6. INVESTMENT TRANSACTIONS
Purchases and sales of investments (excluding short term securities) for the year ended December 31, 2007, aggregated $94,697,917 and $108,787,510, respectively.
7. CREDIT RISK AND DEFAULTED SECURITIES
The Fund has 95.05% of its portfolio invested in below investment grade and comparable quality unrated high yield securities, which tend to be more sensitive to economic conditions than higher rated securities. The risk of loss due to default by the issuer may be significantly greater for the holders of high yielding securities because such securities are generally unsecured and are often subordinated to other creditors of the issuer.
FH-22
Franklin Templeton Variable Insurance Products Trust
Notes to Financial Statements (continued)
Franklin High Income Securities Fund
7. CREDIT RISK AND DEFAULTED SECURITIES (continued)
The Fund held defaulted securities and/or other securities for which the income has been deemed uncollectible. At December 31, 2007, the aggregate value of these securities was $275, representing less than 0.01% of the Fund’s net assets. The Fund discontinues accruing income on securities for which income has been deemed uncollectible and provides an estimate for losses on interest receivable. The securities have been identified on the accompanying Statement of Investments.
8. RESTRICTED SECURITIES
The Fund may invest in securities that are restricted under the Securities Act of 1933 (1933 Act) or which are subject to legal, contractual, or other agreed upon restrictions on resale. Restricted securities are often purchased in private placement transactions, and cannot be sold without prior registration unless the sale is pursuant to an exemption under the 1933 Act.
Disposal of these securities may require greater effort and expense, and prompt sale at an acceptable price may be difficult. The Fund may have registration rights for restricted securities. The issuer generally incurs all registration costs.
At December 31, 2007, the Fund held investments in restricted securities, excluding 144A securities deemed to be liquid, valued in accordance with procedures approved by the Trust’s Board of Trustees as reflecting fair value, as follows:
| | | | | | | | | | |
| Shares | | Issuer | | Acquisition
Dates | | Cost | | Value |
| 44,604 | | aGoss Holdings Inc., B | | 11/17/99 | | $ | 89,208 | | $ | — |
| | | | | | | | | | |
| | Total Restricted Securities (0.00% of Net Assets) | | | | | | | $ | — |
| | | | | | | | | | |
a | The Fund also invests in unrestricted securities of the issuer, valued at $0 as of December 31, 2007. |
9. REGULATORY AND LITIGATION MATTERS
As part of various investigations by a number of federal, state, and foreign regulators and governmental entities, including the Securities and Exchange Commission (“SEC”), relating to certain practices in the mutual fund industry, including late trading, market timing and marketing support payments to securities dealers who sell fund shares (“marketing support”), Franklin Resources, Inc. and certain of its subsidiaries (collectively, the “Company”), entered into settlements with certain of those regulators and governmental entities. Specifically, the Company entered into settlements with the SEC, among others, concerning market timing and marketing support.
On June 6, 2007, the SEC posted for public comment the proposed plan of distribution for the market timing settlement. Once the SEC approves the final plan of distribution, disbursements of settlement monies will be made promptly to individuals who were shareholders of the designated funds during the relevant period, in accordance with the terms and conditions of the settlement and plan.
In addition, the Company, as well as most of the mutual funds within Franklin Templeton Investments and certain current or former officers, Company directors, fund directors, and employees, have been named in private lawsuits (styled as shareholder class actions, or as derivative actions on behalf of either the named funds or Franklin Resources, Inc.). The lawsuits relate to the industry practices referenced above.
The Company and fund management believe that the claims made in each of the private lawsuits referenced above are without merit and intend to defend against them vigorously. The Company cannot predict with certainty the eventual outcome of these lawsuits, nor whether they will have a material negative impact on the Company. If it is determined that the Company bears responsibility for any unlawful or inappropriate conduct that caused losses to the Trust, it is committed to making the Trust or its shareholders whole, as appropriate.
FH-23
Franklin Templeton Variable Insurance Products Trust
Notes to Financial Statements (continued)
Franklin High Income Securities Fund
10. NEW ACCOUNTING PRONOUNCEMENT
In September 2006, the Financial Accounting Standards Board (FASB) issued FASB Statement No. 157, “Fair Value Measurement” (SFAS 157), which defines fair value, establishes a framework for measuring fair value, and expands disclosures about fair value measurements. SFAS 157 is effective for fiscal years beginning after November 15, 2007, and interim periods within those fiscal years. The Trust believes the adoption of SFAS 157 will have no material impact on its financial statements.
FH-24
Franklin Templeton Variable Insurance Products Trust
Franklin High Income Securities Fund
Report of Independent Registered Public Accounting Firm
To the Board of Trustees and Shareholders of
Franklin Templeton Variable Insurance Products Trust
In our opinion, the accompanying statement of assets and liabilities, including the statement of investments, and the related statements of operations and of changes in net assets and the financial highlights present fairly, in all material respects, the financial position of Franklin High Income Securities Fund (one of the funds constituting Franklin Templeton Variable Insurance Products Trust, hereafter referred to as the “Fund”) at December 31, 2007, the results of its operations for the year then ended, the changes in its net assets for each of the two years in the period then ended and the financial highlights for each of the five years in the period then ended, in conformity with accounting principles generally accepted in the United States of America. These financial statements and financial highlights (hereafter referred to as “financial statements”) are the responsibility of the Fund’s management. Our responsibility is to express an opinion on these financial statements based on our audits. We conducted our audits of these financial statements in accordance with the standards of the Public Company Accounting Oversight Board (United States). Those standards require that we plan and perform the audit to obtain reasonable assurance about whether the financial statements are free of material misstatement. An audit includes examining, on a test basis, evidence supporting the amounts and disclosures in the financial statements, assessing the accounting principles used and significant estimates made by management, and evaluating the overall financial statement presentation. We believe that our audits, which included confirmation of securities at December 31, 2007 by correspondence with the custodian and brokers, provide a reasonable basis for our opinion.
PricewaterhouseCoopers LLP
San Francisco, California
February 14, 2008
FH-25
FRANKLIN INCOME SECURITIES FUND
This annual report for Franklin Income Securities Fund covers the fiscal year ended December 31, 2007.
Performance Summary as of 12/31/07
Average annual total return of Class 1 shares represents the average annual change in value, assuming reinvestment of dividends and capital gains or distributions. Average returns smooth out variations in returns, which can be significant; they are not the same as year-by-year results.
Periods ended 12/31/07
| | | | | | |
| | | 1-Year | | 5-Year | | 10-Year |
Average Annual Total Return | | +4.01% | | +13.60% | | +8.57% |
Total Return Index Comparison for Hypothetical $10,000 Investment (1/1/98–12/31/07)
The graph below shows the change in value of a hypothetical $10,000 investment in the Fund over the indicated period and includes reinvestment of any income or distributions. The Fund’s performance is compared to the performance of the Standard & Poor’s 500 Index (S&P 500) and the Lehman Brothers (LB) U.S. Aggregate Index. One cannot invest directly in an index, nor is an index representative of the Fund’s portfolio. Please see Important Notes to Performance Information preceding the Fund Summaries.
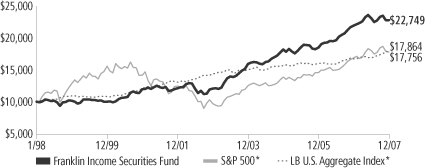
*Source: Standard & Poor’s Micropal. Please see Index Descriptions following the Fund Summaries.
Franklin Income Securities Fund – Class 1
Performance reflects the Fund’s Class 1 operating expenses, but does not include any contract fees, expenses or sales charges. If they had been included, performance would be lower. These charges and deductions, particularly for variable life policies, can have a significant effect on contract values and insurance benefits. See the contract prospectus for a complete description of these expenses, including sales charges.
Performance data represent past performance, which does not guarantee future results. Investment return and principal value will fluctuate, and you may have a gain or loss when you sell your shares.
Current performance may differ from figures shown.
FI-1
Fund Goal and Main Investments: Franklin Income Securities Fund seeks to maximize income while maintaining prospects for capital appreciation. The Fund normally invests in both equity and debt securities. The Fund seeks income by investing in corporate, foreign and U.S. Treasury bonds as well as stocks with dividend yields the manager believes are attractive.
Performance Overview
You can find the Fund’s one-year total return in the Performance Summary. The Fund underperformed its equity benchmark, the S&P 500, which returned +5.49%, and underperformed its fixed income benchmark, the LB U.S. Aggregate Index, which returned +6.97% for the same period.1
Economic and Market Overview
During the 12 months ended December 31, 2007, the U.S. economy advanced at a moderate but uneven pace. Gross domestic product (GDP) grew an annualized 0.6% in the first quarter of 2007 but advanced in the second quarter at an annualized 3.8% rate. Federal defense spending, accelerating exports and declining imports, greater business inventory investment and increased spending for nonresidential structures supported growth. GDP grew an annualized 4.9% in the third quarter of 2007 despite a struggling housing market and the abrupt unraveling of the subprime mortgage market. The housing downturn affected the overall economy by fourth quarter 2007 as credit conditions worsened, consumer spending slowed, and GDP growth decelerated to an estimated 0.6% annualized rate.
The unemployment rate increased from 4.4% at the beginning of the period to 5.0% in December 2007.2 Although consumer confidence in July neared a six-year high, it declined through period-end largely due to rising mortgage and fuel costs, falling home prices and a weaker job market. Oil prices were volatile and established a new record high in November, nearing $99 per barrel. For the 12 months ended December 31, 2007, the core Consumer Price Index (CPI), which excludes food and energy costs, rose 2.4%, which was higher than its 10-year average rate.2
1. Source: Standard & Poor’s Micropal. One cannot invest directly in an index, nor is an index representative of the Fund’s portfolio. Please see Index Descriptions following the Fund Summaries.
2. Source: Bureau of Labor Statistics.
Fund Risks: The Fund’s investments in stocks offer the potential for long-term gains but can be subject to short-term price fluctuations. Because the Fund invests in bonds and other debt obligations, its share price and yield will be affected by interest rate movements. Bond prices generally move in the opposite direction of interest rates. Thus, as prices of bonds in the Fund adjust to a rise in interest rates, the Fund’s share price may decline. The Fund may invest a significant portion of its assets in high yield lower-rated (junk) bonds, which generally have greater price swings and higher risk of default and loss of principal than investment-grade bonds. Foreign investing, especially in emerging markets, involves additional risks, including currency fluctuations, economic instability, market volatility, and political and social instability. The Fund’s prospectus also includes a description of the main investment risks.
FI-2
Strong economic growth and solid corporate earnings helped U.S. stocks post gains through the first three quarters of 2007. Concerns about subprime mortgage losses, weakening consumer spending and inflationary fears, partly due to rising crude oil prices, were offset somewhat by the Federal Reserve Board’s 50 basis-points (half a percentage point) cut to the federal funds target rate at its September meeting. However, a broad market slump in the fourth quarter erased some of the earlier gains. Continued turmoil in the housing and financial sectors — including falling home prices, rising credit losses and tightening lending standards — weighed on equity prices. Stocks of major financial institutions including banks and brokers declined as rising losses pressured earnings and led to the expectation of significant restructurings ahead. Conversely, utilities and energy-related shares generally performed well. Improving power market fundamentals and renewed interest in utility infrastructure rate base growth opportunities attracted investors. Growing fears of recession, during which investors often seek the stability of utility earnings, and plummeting bond yields also benefited utility stocks. In the energy sector, rising crude oil prices helped drive strong performance during the year. Despite fears of slowing U.S. economic growth, increasing global demand for energy, particularly in China and India, and supply concerns related to the Middle East conflicts supported prices.
During the year under review, the 10-year U.S. Treasury yield’s decline drove the fixed income market’s +6.97% return, as measured by the LB U.S. Aggregate Index.1 Reduced liquidity across a broad segment of fixed income markets along with heightened uncertainty regarding economic conditions contributed to the rally in U.S. Treasury securities. In sharp contrast to Treasury strength, corporate bonds — including investment grade and high yield — underperformed as credit spreads widened, reflecting higher risk premiums in the market.
Investment Strategy
We search for undervalued or out-of-favor securities we believe offer opportunities for income today and growth tomorrow. We generally perform independent analysis of the debt securities being considered for the Fund’s portfolio, rather than relying principally on ratings assigned by rating agencies. In analyzing debt and equity securities, we
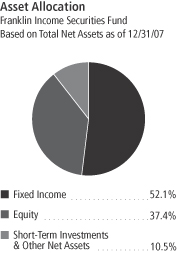
FI-3
consider a variety of factors, including: a security’s relative value based on such factors as anticipated cash flow, interest or dividend coverage, asset coverage, and earnings prospects; the experience and strength of a company’s management; a company’s sensitivity to changes in interest rates and business conditions; a company’s debt maturity schedules and borrowing requirements; and a company’s changing financial condition and market recognition of the change.
Manager’s Discussion
Several of the Fund’s electric utility equity holdings performed well, including TXU, Public Service Enterprise Group (PSEG) and FirstEnergy. TXU’s share price surged as it was successfully acquired by private equity partners KKR and TPG. PSEG benefited from improving power markets in its core areas of operations as well as potential growth opportunities in the regulated utility business.
Energy minerals equity holdings also contributed to the Fund’s performance, partly driven by strong prices for oil, copper and gold. Shares of integrated oil companies Chevron and ConocoPhillips appreciated as crude oil prices increased and approached $100 per barrel at period-end. Domestic energy producer Chesapeake Energy benefited from strong natural gas prices and solid production performance. Within non-energy minerals, Freeport McMoran Copper & Gold’s stock rose due to continued strong global demand for metals. In process industries, Lyondell Chemical shares gained following Basell’s successful purchase of the company.
Turmoil in housing-related sectors, including finance companies exposed to subprime mortgages and related structured credit products, negatively impacted some Fund holdings. Financial firms including Washington Mutual, Bank of America and Citigroup were significant detractors from performance during the period. Additionally, in consumer durables, home builders D.R. Horton and KB Home hampered the Fund.
Some corporate bond holdings negatively affected Fund performance relative to the fixed income benchmark as widening spreads more than offset the rally in U.S. Treasury securities. Specific holdings that hurt results included GMAC Financial Services and Charter Communications (CCH). GMAC was weighed down by mortgage lending exposure via its Residential Capital subsidiary. Despite revenue and cash flow growth we felt was attractive, Charter Communications declined as the cable sector weakened partly due to fears of elevated
Top Five Equity Holdings
Franklin Income Securities Fund
12/31/07
| | |
Company
Sector/Industry | | % of Total
Net Assets |
| |
| Pfizer Inc. | | 2.2% |
| Health Technology | | |
| |
| AT&T Inc. | | 1.8% |
| Communications | | |
| |
| Bank of America Corp. | | 1.7% |
| Finance | | |
| |
| Public Service Enterprise Group Inc. | | 1.6% |
| Electric Utilities | | |
| |
| Merck & Co. Inc. | | 1.3% |
| Health Technology | | |
Top Five Bond Holdings
Franklin Income Securities Fund
12/31/07
| | |
Issuer
Sector/Industry | | % of Total
Net Assets |
| |
Ford Motor Credit
Co. LLC | | 3.1% |
| Consumer Durables | | |
| |
| GMAC LLC | | 2.8% |
| Finance | | |
| |
| Tenet Healthcare Corp. | | 2.0% |
| Health Services | | |
| |
| Federal National Mortgage Association (FNMA) Fixed Rate | | 2.0% |
| Mortgage-Backed Securities | | |
| |
| Federal Home Loan Mortgage Corp. (FHLMC) Fixed Rate | | 1.9% |
| Mortgage-Backed Securities | | |
The dollar value, number of shares or principal amount, and names of all portfolio holdings are listed in the Fund’s Statement of Investments.
FI-4
competition from telecommunication services providers and satellite broadcast companies.
Thank you for your participation in Franklin Income Securities Fund. We look forward to serving your future investment needs.
The foregoing information reflects our analysis, opinions and portfolio holdings as of December 31, 2007, the end of the reporting period. The way we implement our main investment strategies and the resulting portfolio holdings may change depending on factors such as market and economic conditions. These opinions may not be relied upon as investment advice or an offer for a particular security. The information is not a complete analysis of every aspect of any market, country, industry, security or the Fund. Statements of fact are from sources considered reliable, but the investment manager makes no representation or warranty as to their completeness or accuracy. Although historical performance is no guarantee of future results, these insights may help you understand our investment management philosophy.
FI-5
Fund Expenses
As an investor in a variable insurance contract (Contract) that indirectly provides for investment in an underlying mutual fund, you can incur transaction and/or ongoing expenses at both the Fund level and the Contract level.
| • | | Transaction expenses can include sales charges (loads) on purchases, redemption fees, surrender fees, transfer fees and premium taxes. |
| • | | Ongoing expenses can include management fees, distribution and service (12b-1) fees, contract fees, annual maintenance fees, mortality and expense risk fees and other fees and expenses. All mutual funds and Contracts have some types of ongoing expenses. |
The expenses shown in the table are meant to highlight ongoing expenses at the Fund level only and do not include ongoing expenses at the Contract level, or transaction expenses at either the Fund or Contract level. While the Fund does not have transaction expenses, if the transaction and ongoing expenses at the Contract level were included, the expenses shown would be higher. You should consult your Contract prospectus or disclosure document for more information.
The table shows Fund-level ongoing expenses and can help you understand these expenses and compare them with those of other mutual funds offered through the Contract. The table assumes a $1,000 investment held for the six months indicated. Please refer to the Fund prospectus for additional information on operating expenses.
Actual Fund Expenses
The first line (Actual) of the table provides actual account values and expenses. The “Ending Account Value” is derived from the Fund’s actual return, which includes the effect of ongoing Fund expenses, but does not include the effect of ongoing Contract expenses.
You can estimate the Fund-level expenses you incurred during the period by following these steps. Of course, your account value and expenses will differ from those in this illustration:
| 1. | Divide your account value by $1,000. |
If an account had an $8,600 value, then $8,600 ÷ $1,000 = 8.6.
| 2. | Multiply the result by the number under the heading “Fund-Level Expenses Incurred During Period.” |
If Fund-Level Expenses Incurred During Period were $7.50, then 8.6 x $7.50 = $64.50.
In this illustration, the estimated expenses incurred this period at the Fund level are $64.50.
Franklin Income Securities Fund – Class 1
FI-6
Hypothetical Example for Comparison with Other Mutual Funds
Information in the second line (Hypothetical) of the table can help you compare ongoing expenses of the Fund with those of other mutual funds offered through the Contract. This information may not be used to estimate the actual ending account balance or expenses you incurred during the period. The hypothetical “Ending Account Value” is based on the Fund’s actual expense ratio and an assumed 5% annual rate of return before expenses, which does not represent the Fund’s actual return. The figure under the heading “Fund-Level Expenses Incurred During Period” shows the hypothetical expenses your account would have incurred under this scenario. You can compare this figure with the 5% hypothetical examples that appear in shareholder reports of other funds offered through a Contract.
| | | | | | | | | |
| Class 1 | | Beginning
Account Value 7/1/07 | | Ending
Account
Value 12/31/07 | | Fund-Level
Expenses Incurred
During Period*
7/1/07–12/31/07 |
Actual | | $ | 1,000 | | $ | 987.70 | | $ | 2.35 |
Hypothetical (5% return before expenses) | | $ | 1,000 | | $ | 1,022.84 | | $ | 2.40 |
*Expenses are calculated using the most recent six-month annualized expense ratio for the Fund’s Class 1 shares (0.47%), which does not include any ongoing expenses of the Contract for which the Fund is an investment option, multiplied by the average account value over the period, multiplied by 184/365 to reflect the one-half year period.
FI-7
Franklin Templeton Variable Insurance Products Trust
Financial Highlights
Franklin Income Securities Fund
| | | | | | | | | | | | | | | | | | | | |
| | | Year Ended December 31, | |
| Class 1 | | 2007 | | | 2006 | | | 2005 | | | 2004 | | | 2003 | |
| | | | |
Per share operating performance | | | | | | | | | | | | | | | | | | | | |
(for a share outstanding throughout the year) | | | | | | | | | | | | | | | | | | | | |
Net asset value, beginning of year | | $ | 17.65 | | | $ | 15.56 | | | $ | 15.89 | | | $ | 14.40 | | | $ | 11.48 | |
| | | | |
Income from investment operationsa: | | | | | | | | | | | | | | | | | | | | |
Net investment incomeb | | | 1.03 | | | | 0.94 | | | | 0.85 | | | | 0.83 | | | | 0.81 | |
Net realized and unrealized gains (losses) | | | (0.31 | ) | | | 1.85 | | | | (0.56 | ) | | | 1.14 | | | | 2.79 | |
| | | | |
Total from investment operations | | | 0.72 | | | | 2.79 | | | | 0.29 | | | | 1.97 | | | | 3.60 | |
| | | | |
Less distributions from: | | | | | | | | | | | | | | | | | | | | |
Net investment income | | | (0.63 | ) | | | (0.62 | ) | | | (0.57 | ) | | | (0.48 | ) | | | (0.68 | ) |
Net realized gains | | | (0.11 | ) | | | (0.08 | ) | | | (0.05 | ) | | | — | | | | — | |
| | | | |
Total distributions | | | (0.74 | ) | | | (0.70 | ) | | | (0.62 | ) | | | (0.48 | ) | | | (0.68 | ) |
| | | | |
Net asset value, end of year | | $ | 17.63 | | | $ | 17.65 | | | $ | 15.56 | | | $ | 15.89 | | | $ | 14.40 | |
| | | | |
| | | | | |
Total returnc | | | 4.01% | | | | 18.47% | | | | 1.83% | | | | 14.13% | | | | 32.10% | |
Ratios to average net assets | | | | | | | | | | | | | | | | | | | | |
Expenses | | | 0.47% | d | | | 0.47% | d | | | 0.48% | d | | | 0.49% | d | | | 0.51% | |
Net investment income | | | 5.77% | | | | 5.70% | | | | 5.44% | | | | 5.71% | | | | 6.33% | |
| | | | | |
Supplemental data | | | | | | | | | | | | | | | | | | | | |
Net assets, end of year (000’s) | | $ | 455,932 | | | $ | 458,613 | | | $ | 457,625 | | | $ | 530,742 | | | $ | 537,950 | |
Portfolio turnover rate | | | 32.11% | | | | 25.05% | | | | 34.76% | | | | 44.02% | | | | 47.03% | |
aThe amount shown for a share outstanding throughout the period may not correlate with the Statement of Operations for the period due to the timing of sales and repurchases of the Fund shares in relation to income earned and/or fluctuating market value of the investments of the Fund.
bBased on average daily shares outstanding.
cTotal return does not include any fees, charges or expenses imposed by the variable annuity and life insurance contracts for which the Franklin Templeton Variable Insurance Products Trust serves as an underlying investment vehicle.
dBenefit of expense reduction rounds to less than 0.01%.
The accompanying notes are an integral part of these financial statements.
FI-8
Franklin Templeton Variable Insurance Products Trust
Financial Highlights (continued)
Franklin Income Securities Fund
| | | | | | | | | | | | | | | | | | | | |
| | | Year Ended December 31, | |
| Class 2 | | 2007 | | | 2006 | | | 2005 | | | 2004 | | | 2003 | |
| | | | |
Per share operating performance | | | | | | | | | | | | | | | | | | | | |
(for a share outstanding throughout the year) | | | | | | | | | | | | | | | | | | | | |
Net asset value, beginning of year | | $ | 17.36 | | | $ | 15.32 | | | $ | 15.67 | | | $ | 14.23 | | | $ | 11.38 | |
| | | | |
Income from investment operationsa: | | | | | | | | | | | | | | | | | | | | |
Net investment incomeb | | | 0.97 | | | | 0.89 | | | | 0.80 | | | | 0.80 | | | | 0.76 | |
Net realized and unrealized gains (losses) | | | (0.30 | ) | | | 1.82 | | | | (0.55 | ) | | | 1.11 | | | | 2.77 | |
| | | | |
Total from investment operations | | | 0.67 | | | | 2.71 | | | | 0.25 | | | | 1.91 | | | | 3.53 | |
| | | | |
Less distributions from: | | | | | | | | | | | | | | | | | | | | |
Net investment income | | | (0.61 | ) | | | (0.59 | ) | | | (0.55 | ) | | | (0.47 | ) | | | (0.68 | ) |
Net realized gains | | | (0.11 | ) | | | (0.08 | ) | | | (0.05 | ) | | | — | | | | — | |
| | | | |
Total distributions | | | (0.72 | ) | | | (0.67 | ) | | | (0.60 | ) | | | (0.47 | ) | | | (0.68 | ) |
| | | | |
Net asset value, end of year | | $ | 17.31 | | | $ | 17.36 | | | $ | 15.32 | | | $ | 15.67 | | | $ | 14.23 | |
| | | | |
| | | | | |
Total returnc | | | 3.76% | | | | 18.24% | | | | 1.60% | | | | 13.85% | | | | 31.72% | |
Ratios to average net assets | | | | | | | | | | | | | | | | | | | | |
Expenses | | | 0.72% | d | | | 0.72% | d | | | 0.73% | d | | | 0.74% | d | | | 0.76% | |
Net investment income | | | 5.52% | | | | 5.45% | | | | 5.19% | | | | 5.46% | | | | 6.08% | |
| | | | | |
Supplemental data | | | | | | | | | | | | | | | | | | | | |
Net assets, end of year (000’s) | | $ | 7,429,064 | | | $ | 5,109,373 | | | $ | 2,865,361 | | | $ | 1,631,184 | | | $ | 621,001 | |
Portfolio turnover rate | | | 32.11% | | | | 25.05% | | | | 34.76% | | | | 44.02% | | | | 47.03% | |
aThe amount shown for a share outstanding throughout the period may not correlate with the Statement of Operations for the period due to the timing of sales and repurchases of the Fund shares in relation to income earned and/or fluctuating market value of the investments of the Fund.
bBased on average daily shares outstanding.
cTotal return does not include any fees, charges or expenses imposed by the variable annuity and life insurance contracts for which the Franklin Templeton Variable Insurance Products Trust serves as an underlying investment vehicle.
dBenefit of expense reduction rounds to less than 0.01%.
The accompanying notes are an integral part of these financial statements.
FI-9
Franklin Templeton Variable Insurance Products Trust
Statement of Investments, December 31, 2007
| | | | | | | |
| Franklin Income Securities Fund | | Country | | Shares | | Value |
Long Term Investments 89.5% | | | | | | | |
Common Stocks 28.7% | | | | | | | |
Communications 2.4% | | | | | | | |
AT&T Inc. | | United States | | 3,487,484 | | $ | 144,939,835 |
Verizon Communications Inc. | | United States | | 1,000,000 | | | 43,690,000 |
| | | | | | | |
| | | | | | | 188,629,835 |
| | | | | | | |
Consumer Durables 0.2% | | | | | | | |
KB Home | | United States | | 600,000 | | | 12,960,000 |
| | | | | | | |
Electric Utilities 10.6% | | | | | | | |
Alliant Energy Corp. | | United States | | 300,000 | | | 12,207,000 |
Ameren Corp. | | United States | | 1,000,000 | | | 54,210,000 |
American Electric Power Co. Inc. | | United States | | 600,000 | | | 27,936,000 |
CenterPoint Energy Inc. | | United States | | 300,000 | | | 5,139,000 |
Consolidated Edison Inc. | | United States | | 1,200,000 | | | 58,620,000 |
Dominion Resources Inc. | | United States | | 1,665,800 | | | 79,042,210 |
DTE Energy Co. | | United States | | 260,500 | | | 11,451,580 |
Duke Energy Corp. | | United States | | 3,400,000 | | | 68,578,000 |
FirstEnergy Corp. | | United States | | 1,250,000 | | | 90,425,000 |
FPL Group Inc. | | United States | | 500,000 | | | 33,890,000 |
Hawaiian Electric Industries Inc. | | United States | | 120,000 | | | 2,732,400 |
PG&E Corp. | | United States | | 1,300,000 | | | 56,017,000 |
Pinnacle West Capital Corp. | | United States | | 300,000 | | | 12,723,000 |
Portland General Electric Co. | | United States | | 1,250,000 | | | 34,725,000 |
Progress Energy Inc. | | United States | | 550,000 | | | 26,636,500 |
Public Service Enterprise Group Inc. | | United States | | 1,250,000 | | | 122,800,000 |
Puget Energy Inc. | | United States | | 1,566,300 | | | 42,963,609 |
The Southern Co. | | United States | | 2,123,200 | | | 82,274,000 |
TECO Energy Inc. | | United States | | 1,000,000 | | | 17,210,000 |
| | | | | | | |
| | | | | | | 839,580,299 |
| | | | | | | |
Electronic Technology 1.2% | | | | | | | |
Maxim Integrated Products Inc. | | United States | | 2,500,000 | | | 66,200,000 |
Microchip Technology Inc. | | United States | | 362,000 | | | 11,374,040 |
Texas Instruments Inc. | | United States | | 450,000 | | | 15,030,000 |
| | | | | | | |
| | | | | | | 92,604,040 |
| | | | | | | |
Energy Minerals 2.6% | | | | | | | |
BP PLC, ADR | | United Kingdom | | 500,000 | | | 36,585,000 |
Canadian Oil Sands Trust | | Canada | | 1,750,000 | | | 68,168,553 |
Chevron Corp. | | United States | | 50,000 | | | 4,666,500 |
ConocoPhillips | | United States | | 762,600 | | | 67,337,580 |
Royal Dutch Shell PLC, A, ADR | | Netherlands | | 313,800 | | | 26,421,960 |
| | | | | | | |
| | | | | | | 203,179,593 |
| | | | | | | |
Finance 4.1% | | | | | | | |
Bank of America Corp. | | United States | | 3,250,000 | | | 134,095,000 |
CapitalSource Inc. | | United States | | 650,000 | | | 11,433,500 |
HSBC Holdings PLC | | United Kingdom | | 3,500,000 | | | 58,555,420 |
JPMorgan Chase & Co. | | United States | | 900,000 | | | 39,285,000 |
Wachovia Corp. | | United States | | 100,000 | | | 3,803,000 |
Washington Mutual Inc. | | United States | | 2,000,000 | | | 27,220,000 |
Wells Fargo & Co. | | United States | | 1,600,000 | | | 48,304,000 |
| | | | | | | |
| | | | | | | 322,695,920 |
| | | | | | | |
FI-10
Franklin Templeton Variable Insurance Products Trust
Statement of Investments, December 31, 2007 (continued)
| | | | | | | |
| Franklin Income Securities Fund | | Country | | Shares | | Value |
Long Term Investments (continued) | | | | | | | |
Common Stocks (continued) | | | | | | | |
Gas Distributors 0.8% | | | | | | | |
AGL Resources Inc. | | United States | | 125,000 | | $ | 4,705,000 |
Atmos Energy Corp. | | United States | | 610,000 | | | 17,104,400 |
NiSource Inc. | | United States | | 600,000 | | | 11,334,000 |
Spectra Energy Corp. | | United States | | 1,076,500 | | | 27,795,230 |
| | | | | | | |
| | | | | | | 60,938,630 |
| | | | | | | |
Health Technology 4.9% | | | | | | | |
Bristol-Myers Squibb Co. | | United States | | 500,000 | | | 13,260,000 |
Johnson & Johnson | | United States | | 1,200,000 | | | 80,040,000 |
Merck & Co. Inc. | | United States | | 1,750,000 | | | 101,692,500 |
Pfizer Inc. | | United States | | 7,500,000 | | | 170,475,000 |
Schering-Plough Corp. | | United States | | 660,275 | | | 17,589,726 |
| | | | | | | |
| | | | | | | 383,057,226 |
| | | | | | | |
Industrial Services 0.4% | | | | | | | |
Halliburton Co. | | United States | | 900,000 | | | 34,119,000 |
| | | | | | | |
Non-Energy Minerals 0.2% | | | | | | | |
AngloGold Ashanti Ltd., ADR | | South Africa | | 100,000 | | | 4,281,000 |
Barrick Gold Corp. | | Canada | | 200,000 | | | 8,410,000 |
| | | | | | | |
| | | | | | | 12,691,000 |
| | | | | | | |
Process Industries 0.3% | | | | | | | |
The Dow Chemical Co. | | United States | | 712,300 | | | 28,078,866 |
| | | | | | | |
Producer Manufacturing 0.7% | | | | | | | |
3M Co. | | United States | | 700,000 | | | 59,024,000 |
| | | | | | | |
Real Estate Investment Trust 0.3% | | | | | | | |
iStar Financial Inc. | | United States | | 968,800 | | | 25,237,240 |
| | | | | | | |
Total Common Stocks (Cost $1,867,506,272) | | | | | | | 2,262,795,649 |
| | | | | | | |
Convertible Preferred Stocks 7.1% | | | | | | | |
Consumer Durables 0.5% | | | | | | | |
aThe Goldman Sachs Group Inc. into D.R. Horton Inc., 9.00%, cvt. pfd., 144A | | United States | | 2,500,000 | | | 33,407,250 |
aMerrill Lynch & Co. Inc. into D.R. Horton Inc., 4.00%, cvt. pfd., 144A | | United States | | 608,000 | | | 8,028,640 |
| | | | | | | |
| | | | | | | 41,435,890 |
| | | | | | | |
Consumer Services 0.8% | | | | | | | |
bCitigroup Into Comcast Corp., 8.50%, cvt. pfd. | | United States | | 1,750,000 | | | 32,725,875 |
a,bThe Goldman Sachs Group Inc. into Comcast Corp., 5.00%, cvt. pfd., 144A | | United States | | 1,000,000 | | | 18,297,000 |
aMorgan Stanley into Starbucks Corp., 7.00%, cvt. pfd., 144A | | United States | | 530,000 | | | 11,206,850 |
| | | | | | | |
| | | | | | | 62,229,725 |
| | | | | | | |
Electric Utilities 0.1% | | | | | | | |
PNM Resources Inc., 6.75%, cvt. pfd. | | United States | | 225,600 | | | 9,165,000 |
| | | | | | | |
Electronic Technology 0.3% | | | | | | | |
aMorgan Stanley into Intel Corp., 7.30%, cvt. pfd., 144A | | United States | | 1,100,000 | | | 26,757,500 |
| | | | | | | |
Energy Minerals 1.8% | | | | | | | |
aChesapeake Energy Corp., 5.00%, cvt. pfd., 144A | | United States | | 100,000 | | | 11,891,500 |
aDeutsche Bank AG into Chevron Corp., 8.00%, cvt. pfd., 144A | | United States | | 800,000 | | | 72,476,000 |
aMorgan Stanley into ConocoPhillips, 7.00%, cvt. pfd., 144A | | United States | | 520,000 | | | 42,590,600 |
aMorgan Stanley into Devon Energy Corp., 8.00%, cvt. pfd., 144A | | United States | | 200,000 | | | 14,783,000 |
| | | | | | | |
| | | | | | | 141,741,100 |
| | | | | | | |
FI-11
Franklin Templeton Variable Insurance Products Trust
Statement of Investments, December 31, 2007 (continued)
| | | | | | | |
| Franklin Income Securities Fund | | Country | | Shares | | Value |
Long Term Investments (continued) | | | | | | | |
Convertible Preferred Stocks (continued) | | | | | | | |
Finance 1.0% | | | | | | | |
E*TRADE Financial Corp., 6.125%, cvt. pfd. | | United States | | 600,000 | | $ | 3,402,000 |
aLehman Brothers Holdings Inc. into Merrill Lynch & Co. Inc., 8.00%, cvt. pfd., 144A | | United States | | 540,000 | | | 30,790,800 |
bWashington Mutual Inc., 7.75%, cvt. pfd., R | | United States | | 48,400 | | | 42,834,000 |
| | | | | | | |
| | | | | | | 77,026,800 |
| | | | | | | |
Health Technology 1.1% | | | | | | | |
a,bMorgan Stanley into Genentech Inc., 5.26%, cvt. pfd., 144A | | United States | | 900,000 | | | 60,232,500 |
Schering-Plough Corp., 6.00%, cvt. pfd. | | United States | | 100,000 | | | 24,145,180 |
| | | | | | | |
| | | | | | | 84,377,680 |
| | | | | | | |
Industrial Services 0.6% | | | | | | | |
Credit Suisse into Baker Hughes Inc., 8.00%, cvt. pfd. | | United States | | 600,000 | | | 44,091,720 |
| | | | | | | |
Process Industries 0.0%c | | | | | | | |
Huntsman Corp., 5.00%, cvt. pfd. | | United States | | 50,000 | | | 2,481,250 |
| | | | | | | |
Real Estate Investment Trusts 0.2% | | | | | | | |
Felcor Lodging Trust Inc., 7.80%, cvt. pfd., A | | United States | | 200,000 | | | 4,124,000 |
Lexington Realty Trust, 6.50%, cvt. pfd. | | United States | | 200,000 | | | 7,683,000 |
| | | | | | | |
| | | | | | | 11,807,000 |
| | | | | | | |
Retail Trade 0.7% | | | | | | | |
a,bLehman Brothers into Target Corp., 7.50%, cvt. pfd., 144A | | United States | | 600,000 | | | 31,680,000 |
a,bMerrill Lynch & Co. Inc. Into Home Depot Inc., 9.00%, cvt. pfd., 144A | | United States | | 584,000 | | | 16,503,840 |
Retail Ventures into DSW Inc., 6.625%, cvt. pfd. | | United States | | 250,000 | | | 10,000,000 |
| | | | | | | |
| | | | | | | 58,183,840 |
| | | | | | | |
Total Convertible Preferred Stocks (Cost $591,417,645) | | | | | | | 559,297,505 |
| | | | | | | |
Preferred Stocks 1.6% | | | | | | | |
Finance 1.6% | | | | | | | |
bFHLMC, 8.375%, pfd | | United States | | 2,207,000 | | | 57,602,700 |
FNMA, | | | | | | | |
6.75%, pfd. | | United States | | 500,000 | | | 11,875,000 |
7.625%, pfd., R | | United States | | 800,000 | | | 20,400,000 |
b8.25%, pfd. | | United States | | 1,374,000 | | | 35,311,800 |
| | | | | | | |
Total Preferred Stocks (Cost $122,025,000) | | | | | | | 125,189,500 |
| | | | | | | |
| | | |
| | | | | Principal
Amountd | | |
e,fSenior Floating Rate Interests 3.1% | | | | | | | |
Commercial Services 1.3% | | | | | | | |
Ceva Group PLC, | | | | | | | |
Dollar Pre-Refunded L/C Commitment, 5.26%, 8/01/12 | | United States | | 2,105,263 | | | 2,035,053 |
EGL Term Loans, 7.872%, 8/01/12 | | United States | | 17,850,000 | | | 17,254,703 |
First Data Corp., | | | | | | | |
Term Loan B-2, 7.58% - 7.634%, 9/24/14 | | United States | | 54,862,500 | | | 52,037,081 |
Term Loan B-3, 7.58% - 7.634%, 9/24/14 | | United States | | 9,975,000 | | | 9,354,056 |
US Investigations Services Inc., Term Loan B, 7.91%, 4/01/15 | | United States | | 19,949,875 | | | 18,896,122 |
| | | | | | | |
| | | | | | | 99,577,015 |
| | | | | | | |
Consumer Durables 0.3% | | | | | | | |
Jarden Corp., Term Loan B-3, 7.698%, 1/24/12 | | United States | | 24,875,000 | | | 24,427,996 |
| | | | | | | |
FI-12
Franklin Templeton Variable Insurance Products Trust
Statement of Investments, December 31, 2007 (continued)
| | | | | | | |
| Franklin Income Securities Fund | | Country | | Principal
Amountd | | Value |
Long Term Investments (continued) | | | | | | | |
e,fSenior Floating Rate Interests (continued) | | | | | | | |
Electric Utilities 0.7% | | | | | | | |
Texas Competitive Electric Holdings Co. LLC, | | | | | | | |
Term Loan B-2, 8.396%, 10/10/14 | | United States | | 33,000,000 | | $ | 32,340,330 |
Term Loan B-3, 8.396%, 10/10/14 | | United States | | 25,000,000 | | | 24,525,250 |
| | | | | | | |
| | | | | | | 56,865,580 |
| | | | | | | |
Health Technology 0.1% | | | | | | | |
Bausch and Lomb Inc., Parent Term Loan B, 8.08%, 4/28/15 | | United States | | 7,040,000 | | | 7,004,096 |
| | | | | | | |
Process Industries 0.3% | | | | | | | |
Berry Plastics Holding Corp., Senior Unsecured Term Loan, PIK, 12.244%, 6/15/14 | | United States | | 28,296,800 | | | 24,832,140 |
| | | | | | | |
Producer Manufacturing 0.4% | | | | | | | |
Allison Transmission, Term Loan B, 7.90% - 8.00%, 8/07/14 | | United States | | 15,000,000 | | | 13,961,400 |
Rexnord Holdings Inc., PIK Interest Facility, FRN, 12.131%, 2/20/13 | | United States | | 21,974,193 | | | 19,532,420 |
| | | | | | | |
| | | | | | | 33,493,820 |
| | | | | | | |
Total Senior Floating Rate Interests
(Cost $253,004,677) | | | | | | | 246,200,647 |
| | | | | | | |
Corporate Bonds 43.6% | | | | | | | |
Alternative Power Generation 1.6% | | | | | | | |
a,gCalpine Corp., senior secured note, 144A, 8.50%, 7/15/10 | | United States | | 13,000,000 | | | 13,975,000 |
Dynegy Holdings Inc., senior note, | | | | | | | |
6.875%, 4/01/11 | | United States | | 30,000,000 | | | 29,100,000 |
8.75%, 2/15/12 | | United States | | 26,185,000 | | | 26,577,775 |
8.375%, 5/01/16 | | United States | | 55,000,000 | | | 54,037,500 |
| | | | | | | |
| | | | | | | 123,690,275 |
| | | | | | | |
Commercial Services 1.8% | | | | | | | |
aCeva Group PLC, senior note, 144A, 10.00%, 9/01/14 | | United Kingdom | | 25,000,000 | | | 25,812,500 |
Dex Media Inc., | | | | | | | |
senior disc. note, zero cpn. to 11/15/08, 9.00% thereafter, 11/15/13 | | United States | | 14,500,000 | | | 13,267,500 |
zero cpn. to 11/15/08, 9.00% thereafter, 11/15/13 | | United States | | 10,000,000 | | | 9,150,000 |
JohnsonDiversey Holdings Inc., senior disc. note, 10.67%, 5/15/13 | | United States | | 20,000,000 | | | 20,300,000 |
JohnsonDiversey Inc., senior sub. note, B, 9.625%, 5/15/12 | | United States | | 23,000,000 | | | 23,632,500 |
R.H. Donnelley Corp., | | | | | | | |
6.875%, 1/15/13 | | United States | | 11,400,000 | | | 10,260,000 |
senior note, 8.875%, 1/15/16 | | United States | | 5,000,000 | | | 4,700,000 |
asenior note, 144A, 8.875%, 10/15/17 | | United States | | 28,700,000 | | | 26,691,000 |
RSC Equipment Rental Inc., senior note, 9.50%, 12/01/14 | | United States | | 5,500,000 | | | 4,950,000 |
| | | | | | | |
| | | | | | | 138,763,500 |
| | | | | | | |
Communications 1.2% | | | | | | | |
aDigicel Group Ltd., senior note, 144A, 8.875%, 1/15/15 | | Jamaica | | 20,000,000 | | | 18,350,000 |
MetroPCS Wireless Inc., senior note, 9.25%, 11/01/14 | | United States | | 15,000,000 | | | 14,175,000 |
Qwest Capital Funding Inc., | | | | | | | |
7.00%, 8/03/09 | | United States | | 16,000,000 | | | 16,040,000 |
7.25%, 2/15/11 | | United States | | 28,000,000 | | | 27,720,000 |
Qwest Communications International Inc., senior note, B, 7.50%, 2/15/14 | | United States | | 17,600,000 | | | 17,644,000 |
| | | | | | | |
| | | | | | | 93,929,000 |
| | | | | | | |
Consumer Durables 5.0% | | | | | | | |
Beazer Homes USA Inc., senior note, | | | | | | | |
8.625%, 5/15/11 | | United States | | 11,660,000 | | | 9,036,500 |
8.125%, 6/15/16 | | United States | | 20,000,000 | | | 15,000,000 |
FI-13
Franklin Templeton Variable Insurance Products Trust
Statement of Investments, December 31, 2007 (continued)
| | | | | | | |
| Franklin Income Securities Fund | | Country | | Principal Amountd | | Value |
Long Term Investments (continued) | | | | | | | |
Corporate Bonds (continued) | | | | | | | |
Consumer Durables (continued) | | | | | | | |
D.R. Horton Inc., | | | | | | | |
5.625%, 1/15/16 | | United States | | 5,500,000 | | $ | 4,568,976 |
senior note, 6.50%, 4/15/16 | | United States | | 5,000,000 | | | 4,344,755 |
Ford Motor Co., 7.45%, 7/16/31 | | United States | | 50,000,000 | | | 37,375,000 |
Ford Motor Credit Co. LLC, 7.375%, 10/28/09 | | United States | | 118,000,000 | | | 111,112,576 |
7.875%, 6/15/10 | | United States | | 55,000,000 | | | 50,773,910 |
7.375%, 2/01/11 | | United States | | 50,000,000 | | | 44,804,850 |
senior note, 9.75%, 9/15/10 | | United States | | 8,000,000 | | | 7,638,000 |
senior note, 9.875%, 8/10/11 | | United States | | 22,000,000 | | | 20,823,462 |
senior note, 7.25%, 10/25/11 | | United States | | 10,000,000 | | | 8,668,470 |
General Motors Corp., senior deb., 8.25%, 7/15/23 | | United States | | 25,000,000 | | | 20,000,000 |
K Hovnanian Enterprises Inc., senior note, 7.50%, 5/15/16 | | United States | | 5,000,000 | | | 3,525,000 |
KB Home, senior note, 6.375%, 8/15/11 | | United States | | 5,000,000 | | | 4,600,000 |
5.75%, 2/01/14 | | United States | | 6,500,000 | | | 5,638,750 |
6.25%, 6/15/15 | | United States | | 20,000,000 | | | 17,500,000 |
7.25%, 6/15/18 | | United States | | 10,600,000 | | | 9,646,000 |
Visant Holding Corp., senior note, 8.75%, 12/01/13 | | United States | | 17,000,000 | | | 17,170,000 |
| | | | | | | |
| | | | | | | 392,226,249 |
| | | | | | | |
Consumer Non-Durables 0.3% | | | | | | | |
Dole Food Co. Inc., senior note, 8.625%, 5/01/09 | | United States | | 14,500,000 | | | 14,065,000 |
Reynolds American Inc., senior secured note, 7.25%, 6/01/13 | | United States | | 5,900,000 | | | 6,270,131 |
| | | | | | | |
| | | | | | | 20,335,131 |
| | | | | | | |
Consumer Services 5.5% | | | | | | | |
Cablevision Systems Corp., senior note, B, 8.00%, 4/15/12 | | United States | | 60,000,000 | | | 58,500,000 |
CCH I Holdings LLC, senior note, | | | | | | | |
13.50%, 1/15/14 | | United States | | 80,000,000 | | | 57,700,000 |
11.75%, 5/15/14 | | United States | | 58,000,000 | | | 36,975,000 |
CCH I LLC, senior secured note, 11.00%, 10/01/15 | | United States | | 85,000,000 | | | 69,700,000 |
CCH II LLC, senior note, 10.25%, 9/15/10 | | United States | | 9,700,000 | | | 9,554,500 |
Clear Channel Communications Inc., | | | | | | | |
5.50%, 9/15/14 | | United States | | 22,000,000 | | | 16,791,170 |
senior note, 5.75%, 1/15/13 | | United States | | 7,000,000 | | | 5,802,293 |
CSC Holdings Inc., senior note, B, 7.625%, 4/01/11 | | United States | | 10,000,000 | | | 10,025,000 |
EchoStar DBS Corp., senior note, 7.125%, 2/01/16 | | United States | | 25,000,000 | | | 25,625,000 |
Liberty Media Corp., senior note, 5.70%, 5/15/13 | | United States | | 15,000,000 | | | 13,971,180 |
MGM MIRAGE, senior note, | | | | | | | |
6.75%, 4/01/13 | | United States | | 10,000,000 | | | 9,750,000 |
6.625%, 7/15/15 | | United States | | 15,000,000 | | | 14,137,500 |
7.625%, 1/15/17 | | United States | | 20,000,000 | | | 19,850,000 |
Quebecor Media Inc., | | | | | | | |
a144A, 7.75%, 3/15/16 | | Canada | | 9,750,000 | | | 9,408,750 |
senior note, 7.75%, 3/15/16 | | Canada | | 4,900,000 | | | 4,728,500 |
aUnivision Communications Inc., senior note, 144A, PIK, 9.75%, 3/15/15 | | United States | | 50,000,000 | | | 45,812,500 |
XM Satellite Radio Inc., senior note, 9.75%, 5/01/14 | | United States | | 30,000,000 | | | 29,175,000 |
| | | | | | | |
| | | | | | | 437,506,393 |
| | | | | | | |
Electric Utilities 3.3% | | | | | | | |
Energy Future Holdings Corp., senior note, | | | | | | | |
P, 5.55%, 11/15/14 | | United States | | 50,000,000 | | | 40,159,150 |
a144A, 10.875%, 11/01/17 | | United States | | 37,500,000 | | | 37,875,000 |
a144A, PIK, 11.25%, 11/01/17 | | United States | | 48,800,000 | | | 49,532,000 |
FI-14
Franklin Templeton Variable Insurance Products Trust
Statement of Investments, December 31, 2007 (continued)
| | | | | | | |
| Franklin Income Securities Fund | | Country | | Principal
Amountd | | Value |
Long Term Investments (continued) | | | | | | | |
Corporate Bonds (continued) | | | | | | | |
Electric Utilities (continued) | | | | | | | |
NRG Energy Inc., senior note, | | | | | | | |
7.25%, 2/01/14 | | United States | | 5,000,000 | | $ | 4,887,500 |
7.375%, 2/01/16 | | United States | | 6,000,000 | | | 5,865,000 |
Reliant Energy Inc., senior note, | | | | | | | |
7.625%, 6/15/14 | | United States | | 19,500,000 | | | 19,402,500 |
7.875%, 6/15/17 | | United States | | 17,500,000 | | | 17,412,500 |
aTexas Competitive Electric Holdings Co. LLC, senior note, 144A, | | | | | | | |
10.25%, 11/01/15 | | United States | | 58,900,000 | | | 58,605,500 |
PIK, 10.50%, 11/01/16 | | United States | | 30,000,000 | | | 29,775,000 |
| | | | | | | |
| | | | | | | 263,514,150 |
| | | | | | | |
Electronic Technology 3.8% | | | | | | | |
DRS Technologies Inc., senior note, 6.625%, 2/01/16 | | United States | | 4,500,000 | | | 4,466,250 |
Flextronics International Ltd., senior sub. note, 6.25%, 11/15/14 | | Singapore | | 17,500,000 | | | 16,756,250 |
Freescale Semiconductor Inc., senior note, | | | | | | | |
8.875%, 12/15/14 | | United States | | 55,000,000 | | | 49,362,500 |
10.125%, 12/15/16 | | United States | | 77,000,000 | | | 63,910,000 |
aHawker Beechcraft Acquisition Co., senior note, 144A, | | | | | | | |
8.50%, 4/01/15 | | United States | | 8,200,000 | | | 8,220,500 |
9.75%, 4/01/17 | | United States | | 25,000,000 | | | 24,937,500 |
L-3 Communications Corp., senior sub. note, 6.375%, 10/15/15 | | United States | | 30,000,000 | | | 29,700,000 |
Lucent Technologies Inc., 6.45%, 3/15/29 | | United States | | 10,400,000 | | | 8,645,000 |
NXP BV/NXP Funding LLC, senior note, 9.50%, 10/15/15 | | Netherlands | | 20,000,000 | | | 18,375,000 |
Sanmina-SCI Corp., | | | | | | | |
a,esenior note, 144A, FRN, 7.741%, 6/15/10 | | United States | | 17,954,000 | | | 17,998,885 |
senior sub. note, 6.75%, 3/01/13 | | United States | | 22,000,000 | | | 19,250,000 |
senior sub. note, 8.125%, 3/01/16 | | United States | | 18,100,000 | | | 16,131,625 |
Seagate Technology HDD Holdings, senior note, | | | | | | | |
6.375%, 10/01/11 | | United States | | 10,000,000 | | | 9,912,500 |
6.80%, 10/01/16 | | United States | | 10,000,000 | | | 9,800,000 |
| | | | | | | |
| | | | | | | 297,466,010 |
| | | | | | | |
Energy Minerals 2.7% | | | | | | | |
Callon Petroleum Co., senior note, 9.75%, 12/08/10 | | United States | | 17,500,000 | | | 17,062,500 |
Chesapeake Energy Corp., senior note, | | | | | | | |
7.625%, 7/15/13 | | United States | | 25,000,000 | | | 25,937,500 |
6.50%, 8/15/17 | | United States | | 20,200,000 | | | 19,594,000 |
6.25%, 1/15/18 | | United States | | 20,000,000 | | | 19,300,000 |
Mariner Energy Inc., senior note, 7.50%, 4/15/13 | | United States | | 10,000,000 | | | 9,675,000 |
Massey Energy Co., senior note, 6.875%, 12/15/13 | | United States | | 10,000,000 | | | 9,475,000 |
Newfield Exploration Co., senior sub. note, 6.625%, 4/15/16 | | United States | | 22,500,000 | | | 22,162,500 |
aOPTI Canada Inc., senior note, 144A, 7.875%, 12/15/14 | | Canada | | 20,000,000 | | | 19,650,000 |
Peabody Energy Corp., senior note, 7.375%, 11/01/16 | | United States | | 8,000,000 | | | 8,240,000 |
Pioneer Natural Resources Co., senior bond, 6.875%, 5/01/18 | | United States | | 16,065,000 | | | 15,615,582 |
Plains Exploration & Production Co., senior note, 7.75%, 6/15/15 | | United States | | 15,000,000 | | | 15,075,000 |
aW&T Offshore Inc., senior note, 144A, 8.25%, 6/15/14 | | United States | | 35,000,000 | | | 32,987,500 |
| | | | | | | |
| | | | | | | 214,774,582 |
| | | | | | | |
Finance 4.7% | | | | | | | |
E*TRADE Financial Corp., senior note, | | | | | | | |
7.375%, 9/15/13 | | United States | | 30,400,000 | | | 23,560,000 |
7.875%, 12/01/15 | | United States | | 3,000,000 | | | 2,302,500 |
FI-15
Franklin Templeton Variable Insurance Products Trust
Statement of Investments, December 31, 2007 (continued)
| | | | | | | |
| Franklin Income Securities Fund | | Country | | Principal
Amountd | | Value |
Long Term Investments (continued) | | | | | | | |
Corporate Bonds (continued) | | | | | | | |
Finance (continued) | | | | | | | |
GMAC LLC, | | | | | | | |
5.625%, 5/15/09 | | United States | | 23,000,000 | | $ | 21,706,595 |
7.75%, 1/19/10 | | United States | | 95,000,000 | | | 88,658,180 |
6.875%, 9/15/11 | | United States | | 85,000,000 | | | 72,773,600 |
6.875%, 8/28/12 | | United States | | 17,500,000 | | | 14,678,230 |
6.75%, 12/01/14 | | United States | | 30,000,000 | | | 24,227,850 |
Hertz Corp., senior note, 8.875%, 1/01/14 | | United States | | 10,700,000 | | | 10,900,625 |
Lehman Brothers Holdings Inc., senior note, | | | | | | | |
6.20%, 9/26/14 | | United States | | 55,000,000 | | | 56,092,245 |
7.00%, 9/27/27 | | United States | | 17,000,000 | | | 17,300,373 |
Residential Capital LLC, senior note, 6.375%, 6/30/10 | | United States | | 40,000,000 | | | 25,800,000 |
United Rentals North America Inc., senior sub. note, 7.00%, 2/15/14 | | United States | | 5,000,000 | | | 4,212,500 |
Washington Mutual Inc., 4.00%, 1/15/09 | | United States | | 8,000,000 | | | 7,535,000 |
| | | | | | | |
| | | | | | | 369,747,698 |
| | | | | | | |
Gas Distributors 0.3% | | | | | | | |
aIntergen NV, senior secured note, 144A, 9.00%, 6/30/17 | | Netherlands | | 25,000,000 | | | 26,437,500 |
| | | | | | | |
Health Services 4.4% | | | | | | | |
Community Health Systems Inc., senior sub. note, 8.875%, 7/15/15 | | United States | | 50,000,000 | | | 51,187,500 |
DaVita Inc., | | | | | | | |
senior note, 6.625%, 3/15/13 | | United States | | 65,825,000 | | | 65,825,000 |
senior sub. note, 7.25%, 3/15/15 | | United States | | 19,500,000 | | | 19,646,250 |
HCA Inc., | | | | | | | |
6.375%, 1/15/15 | | United States | | 5,000,000 | | | 4,250,000 |
senior note, 6.50%, 2/15/16 | | United States | | 20,000,000 | | | 17,000,000 |
senior secured note, 9.25%, 11/15/16 | | United States | | 12,500,000 | | | 13,156,250 |
Tenet Healthcare Corp., senior note, | | | | | | | |
6.375%, 12/01/11 | | United States | | 85,000,000 | | | 77,775,000 |
6.50%, 6/01/12 | | United States | | 17,500,000 | | | 15,662,500 |
7.375%, 2/01/13 | | United States | | 35,000,000 | | | 30,800,000 |
eFRN, 9.25%, 2/01/15 | | United States | | 35,000,000 | | | 32,550,000 |
eU.S. Oncology Holdings Inc., senior note, FRN, PIK, 10.759%, 3/15/12 | | United States | | 20,000,000 | | | 16,700,000 |
Vanguard Health Holding Co. I LLC, senior disc. note, zero cpn. to 10/01/09, 11.25% thereafter, 10/01/15 | | United States | | 7,200,000 | | | 5,364,000 |
| | | | | | | |
| | | | | | | 349,916,500 |
| | | | | | | |
Industrial Services 2.8% | | | | | | | |
Allied Waste North America Inc., | | | | | | | |
senior note, 7.25%, 3/15/15 | | United States | | 20,000,000 | | | 20,000,000 |
senior note, B, 7.375%, 4/15/14 | | United States | | 15,000,000 | | | 15,037,500 |
senior note, B, 7.125%, 5/15/16 | | United States | | 30,000,000 | | | 29,925,000 |
senior secured note, 6.50%, 11/15/10 | | United States | | 18,000,000 | | | 18,090,000 |
senior secured note, 6.125%, 2/15/14 | | United States | | 10,000,000 | | | 9,662,500 |
senior secured note, 6.875%, 6/01/17 | | United States | | 25,000,000 | | | 24,500,000 |
El Paso Corp., senior note, | | | | | | | |
6.75%, 5/15/09 | | United States | | 18,000,000 | | | 18,262,998 |
MTN, 7.75%, 1/15/32 | | United States | | 22,500,000 | | | 22,951,733 |
Sabine Pass LNG LP, senior secured note, | | | | | | | |
7.25%, 11/30/13 | | United States | | 6,000,000 | | | 5,760,000 |
7.50%, 11/30/16 | | United States | | 40,000,000 | | | 38,400,000 |
Sesi LLC, senior note, 6.875%, 6/01/14 | | United States | | 18,500,000 | | | 17,945,000 |
| | | | | | | |
| | | | | | | 220,534,731 |
| | | | | | | |
FI-16
Franklin Templeton Variable Insurance Products Trust
Statement of Investments, December 31, 2007 (continued)
| | | | | | | | |
| Franklin Income Securities Fund | | Country | | Principal
Amountd | | | Value |
Long Term Investments (continued) | | | | | | | | |
Corporate Bonds (continued) | | | | | | | | |
Non-Energy Minerals 0.8% | | | | | | | | |
Freeport-McMoRan Copper & Gold Inc., senior note, 8.375%, 4/01/17 | | United States | | 26,700,000 | | | $ | 28,702,500 |
Novelis Inc., senior note, 7.25%, 2/15/15 | | Canada | | 33,800,000 | | | | 31,941,000 |
| | | | | | | | |
| | | | | | | | 60,643,500 |
| | | | | | | | |
Process Industries 1.1% | | | | | | | | |
Berry Plastics Holding Corp., senior secured note, 8.875%, 9/15/14 | | United States | | 15,000,000 | | | | 14,325,000 |
aIneos Group Holdings PLC, senior sub. note, 144A, 7.875%, 2/15/16 | | United Kingdom | | 15,000,000 | EUR | | | 18,387,809 |
Jefferson Smurfit Corp., senior note, 8.25%, 10/01/12 | | United States | | 10,500,000 | | | | 10,395,000 |
Nalco Finance Holdings, senior note, zero cpn. to 8/01/09, 9.00% thereafter, 2/01/14 | | United States | | 36,829,000 | | | | 34,066,825 |
Stone Container Corp., senior note, 8.00%, 3/15/17 | | United States | | 9,600,000 | | | | 9,324,000 |
| | | | | | | | |
| | | | | | | | 86,498,634 |
| | | | | | | | |
Producer Manufacturing 0.9% | | | | | | | | |
Case New Holland Inc., senior note, 7.125%, 3/01/14 | | United States | | 6,300,000 | | | | 6,315,750 |
RBS Global & Rexnord Corp., senior note, 9.50%, 8/01/14 | | United States | | 10,000,000 | | | | 9,950,000 |
Terex Corp., senior sub. note, 8.00%, 11/15/17 | | United States | | 45,000,000 | | | | 45,787,500 |
aTRW Automotive Inc., senior note, 144A, 7.25%, 3/15/17 | | United States | | 9,400,000 | | | | 8,483,500 |
| | | | | | | | |
| | | | | | | | 70,536,750 |
| | | | | | | | |
Real Estate Investment Trusts 0.6% | | | | | | | | |
Host Hotels & Resorts LP, senior note, 6.875%, 11/01/14 | | United States | | 5,000,000 | | | | 5,000,000 |
Host Marriott LP, senior note, | | United States | | 5,000,000 | | | | 5,062,500 |
K, 7.125%, 11/01/13 | | | | | | | | |
O, 6.375%, 3/15/15 | | United States | | 9,000,000 | | | | 8,820,000 |
Q, 6.75%, 6/01/16 | | United States | | 27,000,000 | | | | 26,730,000 |
| | | | | | | | |
| | | | | | | | 45,612,500 |
| | | | | | | | |
Retail Trade 1.1% | | | | | | | | |
aDollar General Corp., senior note, 144A, | | | | | | | | |
10.625%, 7/15/15 | | United States | | 82,000,000 | | | | 75,645,000 |
PIK, 11.875%, 7/15/17 | | United States | | 15,000,000 | | | | 11,887,500 |
| | | | | | | | |
| | | | | | | | 87,532,500 |
| | | | | | | | |
Technology Services 1.7% | | | | | | | | |
aCeridian Corp., senior note, 144A, 11.25%, 11/15/15 | | United States | | 27,000,000 | | | | 25,110,000 |
aFirst Data Corp., senior note, 144A, 9.875%, 9/24/15 | | United States | | 43,000,000 | | | | 40,043,750 |
Fiserv Inc., senior note, | | | | | | | | |
6.125%, 11/20/12 | | United States | | 20,000,000 | | | | 20,377,260 |
6.80%, 11/20/17 | | United States | | 25,000,000 | | | | 25,620,300 |
SunGard Data Systems Inc., | | | | | | | | |
senior note, 9.125%, 8/15/13 | | United States | | 9,000,000 | | | | 9,202,500 |
senior sub. note, 10.25%, 8/15/15 | | United States | | 14,500,000 | | | | 14,898,750 |
| | | | | | | | |
| | | | | | | | 135,252,560 |
| | | | | | | | |
Total Corporate Bonds (Cost $3,563,331,944) | | | | | | | | 3,434,918,163 |
| | | | | | | | |
Convertible Bonds 1.4% | | | | | | | | |
Electronic Technology 0.7% | | | | | | | | |
aAdvanced Micro Devices Inc., cvt., senior note, 144A, 5.75%, 8/15/12 | | United States | | 50,000,000 | | | | 40,143,250 |
Nortel Networks Corp., cvt., senior note, 4.25%, 9/01/08 | | Canada | | 17,312,000 | | | | 17,109,173 |
| | | | | | | | |
| | | | | | | | 57,252,423 |
| | | | | | | | |
Health Technology 0.2% | | | | | | | | |
Amgen Inc., cvt., senior note, 0.375%, 2/01/13 | | United States | | 15,000,000 | | | | 13,115,160 |
| | | | | | | | |
FI-17
Franklin Templeton Variable Insurance Products Trust
Statement of Investments, December 31, 2007 (continued)
| | | | | | | |
| Franklin Income Securities Fund | | Country | | Principal Amountd | | Value |
Long Term Investments (continued) | | | | | | | |
Convertible Bonds (continued) | | | | | | | |
Real Estate Investment Trust 0.5% | | | | | | | |
eiStar Financial Inc., senior note, cvt., FRN, 5.743%, 10/01/12 | | United States | | 40,000,000 | | $ | 35,600,000 |
| | | | | | | |
Total Convertible Bonds (Cost $117,700,081) | | | | | | | 105,967,583 |
| | | | | | | |
Mortgage-Backed Securities 4.0% | | | | | | | |
Federal Home Loan Mortgage Corp. (FHLMC) Fixed Rate 1.9% | | | | | | | |
FHLMC Gold 30 Year, 5.00%, 7/01/33 - 11/01/36 | | United States | | 69,719,867 | | | 68,097,269 |
FHLMC Gold 30 Year, 6.00%, 5/01/36 - 6/01/36 | | United States | | 83,342,887 | | | 84,609,067 |
| | | | | | | |
| | | | | | | 152,706,336 |
| | | | | | | |
Federal National Mortgage Association (FNMA) Fixed Rate 2.0% | | | | | | | |
FNMA 30 Year, 5.50%, 2/01/35 - 7/01/37 | | United States | | 131,845,734 | | | 131,773,197 |
FNMA 30 Year, 6.00%, 7/01/37 | | United States | | 24,578,563 | | | 24,964,820 |
| | | | | | | |
| | | | | | | 156,738,017 |
| | | | | | | |
Government National Mortgage Association (GNMA) Fixed Rate 0.1% | | | | | | | |
GNMA I SF 30 Year, 5.00%, 3/15/34 | | United States | | 8,950,556 | | | 8,824,023 |
| | | | | | | |
Total Mortgage-Backed Securities (Cost $312,523,923) | | | | | | | 318,268,376 |
| | | | | | | |
Total Long Term Investments (Cost $6,827,509,542) | | | | | | | 7,052,637,423 |
| | | | | | | |
Short Term Investment (Cost $741,607,592) 9.4% | | | | | | | |
Repurchase Agreement 9.4% | | | | | | | |
hJoint Repurchase Agreement, 3.773%, 1/02/08 (Maturity Value $741,763,030) | | United States | | 741,607,592 | | | 741,607,592 |
ABN AMRO Bank, NV, New York Branch (Maturity Value $72,989,482) | | | | | | | |
Banc of America Securities LLC (Maturity Value $72,989,482) | | | | | | | |
Barclays Capital Inc. (Maturity Value $33,616,701) | | | | | | | |
BNP Paribas Securities Corp. (Maturity Value $72,989,482) | | | | | | | |
Credit Suisse Securities (USA) LLC (Maturity Value $19,204,245) | | | | | | | |
Deutsche Bank Securities Inc. (Maturity Value $72,989,482) | | | | | | | |
Dresdner Kleinwort Wasserstein Securities LLC (Maturity Value $72,989,482) | | | | | | | |
Goldman, Sachs & Co. (Maturity Value $88,351,395) | | | | | | | |
Greenwich Capital Markets Inc. (Maturity Value $72,989,482) | | | | | | | |
Lehman Brothers Inc. (Maturity Value $89,664,315) | | | | | | | |
Merrill Lynch Government Securities Inc. (Maturity Value $72,989,482) | | | | | | | |
Collateralized by U.S. Government Agency Securities, 3.00% - 6.25%, 1/15/08 - 11/14/12; iU.S. Government Agency Discount Notes, 1/02/08 - 8/01/12; iU.S. Treasury Bill, 6/12/08 and U.S. Treasury Notes, 3.25% - 4.625%, 3/31/08 - 8/15/10 | | | | | | | |
| | | | | | | |
Total Investments (Cost $7,569,117,134) 98.9% | | | | | | | 7,794,245,015 |
Other Assets, less Liabilities 1.1% | | | | | | | 90,751,590 |
| | | | | | | |
Net Assets 100.0% | | | | | | $ | 7,884,996,605 |
| | | | | | | |
FI-18
Franklin Templeton Variable Insurance Products Trust
Statement of Investments, December 31, 2007 (continued)
Currency Abbreviations
EUR - Euro
Selected Portfolio Abbreviations
ADR - American Depository Receipt
FHLMC - Federal Home Loan Mortgage Corp.
FNMA - Federal National Mortgage Association
FRN - Floating Rate Note
GNMA - Government National Mortgage Association
L/C - Letter of Credit
MTN - Medium Term Note
PIK - Payment-In-Kind
SF - Single Family
aSecurity was purchased pursuant to Rule 144A under the Securities Act of 1933 and may be sold in transactions exempt from registration only to qualified institutional buyers or in a public offering registered under the Securities Act of 1933. These securities have been deemed liquid under guidelines approved by the Trust’s Board of Trustees. At December 31, 2007, the aggregate value of these securities was $1,044,415,424, representing 13.25% of net assets.
bNon-income producing for the twelve months ended December 31, 2007.
cRounds to less than 0.1% of net assets.
dThe principal amount is stated in U.S. dollars unless otherwise indicated.
eThe coupon rate shown represents the rate at period end.
fSee Note 1(e) regarding senior floating rate interests.
gSee Note 9 regarding other considerations.
hSee Note 1(c) regarding joint repurchase agreement.
iThe security is traded on a discount basis with no stated coupon rate.
The accompanying notes are an integral part of these financial statements.
FI-19
Franklin Templeton Variable Insurance Products Trust
Financial Statements
Statement of Assets and Liabilities
December 31, 2007
| | | |
| | | Franklin Income
Securities Fund |
Assets: | | | |
Investments in securities: | | | |
Cost - Unaffiliated issuers | | $ | 6,827,509,542 |
Cost - Repurchase agreements | | | 741,607,592 |
| | | |
Total cost of investments | | $ | 7,569,117,134 |
| | | |
Value - Unaffiliated issuers | | $ | 7,052,637,423 |
Value - Repurchase agreements | | | 741,607,592 |
| | | |
Total value of investments | | | 7,794,245,015 |
Cash | | | 7,000 |
Receivables: | | | |
Investment securities sold | | | 629,244 |
Capital shares sold | | | 18,617,534 |
Dividends and interest | | | 83,283,730 |
| | | |
Total assets | | | 7,896,782,523 |
| | | |
Liabilities: | | | |
Payables: | | | |
Investment securities purchased | | | 3,859,900 |
Capital shares redeemed | | | 1,317,134 |
Affiliates | | | 6,076,613 |
Unrealized loss on unfunded loan commitments (Note 8) | | | 4,630 |
Accrued expenses and other liabilities | | | 527,641 |
| | | |
Total liabilities | | | 11,785,918 |
| | | |
Net assets, at value | | $ | 7,884,996,605 |
| | | |
Net assets consist of: | | | |
Paid-in capital | | $ | 7,156,898,757 |
Undistributed net investment income | | | 384,940,522 |
Net unrealized appreciation (depreciation) | | | 225,121,080 |
Accumulated net realized gain (loss) | | | 118,036,246 |
| | | |
Net assets, at value | | $ | 7,884,996,605 |
| | | |
Class 1: | | | |
Net assets, at value | | $ | 455,932,403 |
| | | |
Shares outstanding | | | 25,855,001 |
| | | |
Net asset value and maximum offering price per share | | $ | 17.63 |
| | | |
Class 2: | | | |
Net assets, at value | | $ | 7,429,064,202 |
| | | |
Shares outstanding | | | 429,229,281 |
| | | |
Net asset value and maximum offering price per share | | $ | 17.31 |
| | | |
The accompanying notes are an integral part of these financial statements.
FI-20
Franklin Templeton Variable Insurance Products Trust
Financial Statements (continued)
Statement of Operations
for the year ended December 31, 2007
| | | | |
| | | Franklin Income
Securities Fund | |
Investment income: | | | | |
Dividends | | $ | 126,036,704 | |
Interest | | | 309,097,628 | |
| | | | |
Total investment income | | | 435,134,332 | |
| | | | |
Expenses: | | | | |
Management fees (Note 3a) | | | 31,601,478 | |
Distribution fees - Class 2 (Note 3c) | | | 16,307,036 | |
Unaffiliated transfer agent fees | | | 93,179 | |
Custodian fees (Note 4) | | | 138,903 | |
Reports to shareholders | | | 592,029 | |
Professional fees | | | 212,794 | |
Trustees’ fees and expenses | | | 27,682 | |
Other | | | 162,543 | |
| | | | |
Total expenses | | | 49,135,644 | |
Expense reductions (Note 4) | | | (33,536 | ) |
| | | | |
Net expenses | | | 49,102,108 | |
| | | | |
Net investment income | | | 386,032,224 | |
| | | | |
Realized and unrealized gains (losses): | | | | |
Net realized gain (loss) from: | | | | |
Investments | | | 122,263,897 | |
Foreign currency transactions | | | (49,977 | ) |
| | | | |
Net realized gain (loss) | | | 122,213,920 | |
| | | | |
Net change in unrealized appreciation (depreciation) on: | | | | |
Investments | | | (307,215,141 | ) |
Translation of assets and liabilities denominated in foreign currencies | | | (2,171 | ) |
| | | | |
Net change in unrealized appreciation (depreciation) | | | (307,217,312 | ) |
| | | | |
Net realized and unrealized gain (loss) | | | (185,003,392 | ) |
| | | | |
Net increase (decrease) in net assets resulting from operations | | $ | 201,028,832 | |
| | | | |
The accompanying notes are an integral part of these financial statements.
FI-21
Franklin Templeton Variable Insurance Products Trust
Financial Statements (continued)
Statements of Changes in Net Assets
| | | | | | | | |
| | | Franklin Income
Securities Fund | |
| | | Year Ended December 31, | |
| | | 2007 | | | 2006 | |
| | | | |
Increase (decrease) in net assets: | | | | | | | | |
Operations: | | | | | | | | |
Net investment income | | $ | 386,032,224 | | | $ | 231,453,806 | |
Net realized gain (loss) from investments and foreign currency transactions | | | 122,213,920 | | | | 50,169,811 | |
Net change in unrealized appreciation (depreciation) on investments and translation of assets and liabilities denominated in foreign currencies | | | (307,217,312 | ) | | | 442,205,125 | |
| | | | |
Net increase (decrease) in net assets resulting from operations | | | 201,028,832 | | | | 723,828,742 | |
| | | | |
Distributions to shareholders from: | | | | | | | | |
Net investment income: | | | | | | | | |
Class 1 | | | (15,402,825 | ) | | | (16,659,361 | ) |
Class 2 | | | (219,687,222 | ) | | | (128,977,159 | ) |
Net realized gains: | | | | | | | | |
Class 1 | | | (2,738,874 | ) | | | (2,134,776 | ) |
Class 2 | | | (40,741,730 | ) | | | (17,252,278 | ) |
| | | | |
Total distributions to shareholders | | | (278,570,651 | ) | | | (165,023,574 | ) |
| | | | |
Capital share transactions: (Note 2) | | | | | | | | |
Class 1 | | | (2,880,965 | ) | | | (57,156,696 | ) |
Class 2 | | | 2,397,434,200 | | | | 1,743,350,753 | |
| | | | |
Total capital share transactions | | | 2,394,553,235 | | | | 1,686,194,057 | |
| | | | |
Net increase (decrease) in net assets | | | 2,317,011,416 | | | | 2,244,999,225 | |
Net assets: | | | | | | | | |
Beginning of year | | | 5,567,985,189 | | | | 3,322,985,964 | |
| | | | |
End of year | | $ | 7,884,996,605 | | | $ | 5,567,985,189 | |
| | | | |
Undistributed net investment income included in net assets: | | | | | | | | |
End of year | | $ | 384,940,522 | | | $ | 230,777,605 | |
| | | | |
The accompanying notes are an integral part of these financial statements.
FI-22
Franklin Templeton Variable Insurance Products Trust
Notes to Financial Statements
Franklin Income Securities Fund
1. ORGANIZATION AND SIGNIFICANT ACCOUNTING POLICIES
Franklin Templeton Variable Insurance Products Trust (Trust) is registered under the Investment Company Act of 1940, as amended, (1940 Act) as an open-end investment company, consisting of twenty-three separate funds. The Franklin Income Securities Fund (Fund) included in this report is diversified. The financial statements of the remaining funds in the Trust are presented separately. Shares of the Fund are sold only to insurance company separate accounts to fund the benefits of variable life insurance policies or variable annuity contracts. As of December 31, 2007, 50.81% of the Fund’s shares were held through one insurance company. The Fund offers two classes of shares: Class 1, and Class 2. Each class of shares differs by its distribution fees, voting rights on matters affecting a single class and its exchange privilege.
The following summarizes the Fund’s significant accounting policies.
a. Security Valuation
Securities listed on a securities exchange or on the NASDAQ National Market System are valued at the last quoted sale price or the official closing price of the day, respectively. Over-the-counter securities and listed securities for which there is no reported sale are valued within the range of the most recent quoted bid and ask prices. Securities that trade in multiple markets or on multiple exchanges are valued according to the broadest and most representative market.
Corporate debt securities generally trade in the over-the-counter market rather than on a securities exchange. The Trust may utilize independent pricing services, quotations from bond dealers, and information with respect to bond and note transactions, to assist in determining a current market value for each security. The Trust’s pricing services may use valuation models or matrix pricing which considers information with respect to comparable bond and note transactions, quotations from bond dealers, or by reference to other securities that are considered comparable in such characteristics as rating, interest rate and maturity date, option adjusted spread models, prepayment projections, interest rate spreads and yield curves, to determine current value.
Foreign securities are valued as of the close of trading on the foreign stock exchange on which the security is primarily traded, or the NYSE, whichever is earlier. If no sale is reported at that time, the foreign security will be valued within the range of the most recent quoted bid and ask prices. The value is then converted into its U.S. dollar equivalent at the foreign exchange rate in effect at the close of the NYSE on the day that the value of the foreign security is determined.
The Trust has procedures to determine the fair value of individual securities and other assets for which market prices are not readily available or which may not be reliably priced. Methods for valuing these securities may include: fundamental analysis, matrix pricing, discounts from market prices of similar securities, or discounts applied due to the nature and duration of restrictions on the disposition of the securities. Due to the inherent uncertainty of valuations of such securities, the fair values may differ significantly from the values that would have been used had a ready market for such investments existed. Occasionally, events occur between the time at which trading in a security is completed and the close of the NYSE that might call into question the availability (including the reliability) of the value of a portfolio security held by the Fund. The investment manager monitors price movements following the close of trading in foreign stock markets through a series of country specific market proxies (such as baskets of American Depository Receipts, futures contracts and exchange traded funds). These price movements are measured against established trigger thresholds for each specific market proxy to assist in determining if an event has occurred. If such an event occurs, the securities may be valued using fair value procedures, which may include the use of independent pricing services. All security valuation procedures are approved by the Trust’s Board of Trustees.
b. Foreign Currency Translation
Portfolio securities and other assets and liabilities denominated in foreign currencies are translated into U.S. dollars based on the exchange rate of such currencies against U.S. dollars on the date of valuation. Purchases and sales of securities, income and expense items denominated in foreign currencies are translated into U.S. dollars at the exchange rate in effect on the transaction date. Occasionally, events may impact the availability or reliability of foreign exchange rates used to convert the U.S. dollar
FI-23
Franklin Templeton Variable Insurance Products Trust
Notes to Financial Statements (continued)
Franklin Income Securities Fund
1. ORGANIZATION AND SIGNIFICANT ACCOUNTING POLICIES (continued)
b. Foreign Currency Translation (continued)
equivalent value. If such an event occurs, the foreign exchange rate will be valued at fair value using procedures established and approved by the Trust’s Board of Trustees.
The Fund does not separately report the effect of changes in foreign exchange rates from changes in market prices on securities held. Such changes are included in net realized and unrealized gain or loss from investments on the Statement of Operations.
Realized foreign exchange gains or losses arise from sales of foreign currencies, currency gains or losses realized between the trade and settlement dates on securities transactions and the difference between the recorded amounts of dividends, interest, and foreign withholding taxes and the U.S. dollar equivalent of the amounts actually received or paid. Net unrealized foreign exchange gains and losses arise from changes in foreign exchange rates on foreign denominated assets and liabilities other than investments in securities held at the end of the reporting period.
c. Joint Repurchase Agreement
The Fund may enter into a joint repurchase agreement whereby its uninvested cash balance is deposited into a joint cash account with other funds managed by the investment manager or an affiliate of the investment manager and is used to invest in one or more repurchase agreements. The value and face amount of the joint repurchase agreement are allocated to the funds based on their pro-rata interest. A repurchase agreement is accounted for as a loan by the Fund to the seller, collateralized by securities which are delivered to the Fund’s custodian. The market value, including accrued interest, of the initial collateralization is required to be at least 102% of the dollar amount invested by the funds, with the value of the underlying securities marked to market daily to maintain coverage of at least 100%. The joint repurchase agreement held by the Fund at year end had been entered into on December 31, 2007. The joint repurchase agreement is valued at cost.
d. Foreign Currency Contracts
When the Fund purchases or sells foreign securities it may enter into foreign exchange contracts to minimize foreign exchange risk from the trade date to the settlement date of the transactions. A foreign exchange contract is an agreement between two parties to exchange different currencies at an agreed upon exchange rate at a future date. Realized and unrealized gains and losses on these contracts are included in the Statement of Operations.
The risks of these contracts include movement in the values of the foreign currencies relative to the U.S. dollar and the possible inability of the counterparties to fulfill their obligations under the contracts, which may be in excess of the amount reflected in the Statement of Assets and Liabilities.
e. Senior Floating Rate Interests
Senior secured corporate loans pay interest at rates which are periodically reset by reference to a base lending rate plus a spread. These base lending rates are generally the prime rate offered by a designated U.S. bank or the London InterBank Offered Rate (LIBOR). Senior secured corporate loans often require prepayment of principal from excess cash flows or at the discretion of the borrower. As a result, actual maturity may be substantially less than the stated maturity.
Senior secured corporate loans in which the Fund invests are generally readily marketable, but may be subject to some restrictions on resale.
FI-24
Franklin Templeton Variable Insurance Products Trust
Notes to Financial Statements (continued)
Franklin Income Securities Fund
1. ORGANIZATION AND SIGNIFICANT ACCOUNTING POLICIES (continued)
f. Income Taxes
No provision has been made for U.S. income taxes because it is the Fund’s policy to qualify as a regulated investment company under the Internal Revenue Code and to distribute to shareholders substantially all of its taxable income and net realized gains.
g. Security Transactions, Investment Income, Expenses and Distributions
Security transactions are accounted for on trade date. Realized gains and losses on security transactions are determined on a specific identification basis. Interest income and estimated expenses are accrued daily. Amortization of premium and accretion of discount on debt securities are included in interest income. Facility fees are recognized as income over the expected term of the loan. Dividend income is recorded on the ex-dividend date. Distributions to shareholders are recorded on the ex-dividend date and are determined according to income tax regulations (tax basis). Distributable earnings determined on a tax basis may differ from earnings recorded in accordance with accounting principles generally accepted in the United States of America. These differences may be permanent or temporary. Permanent differences are reclassified among capital accounts to reflect their tax character. These reclassifications have no impact on net assets or the results of operations. Temporary differences are not reclassified, as they may reverse in subsequent periods.
Common expenses incurred by the Trust are allocated among the funds based on the ratio of net assets of each fund to the combined net assets of the Trust. Fund specific expenses are charged directly to the fund that incurred the expense.
Realized and unrealized gains and losses and net investment income, other than class specific expenses, are allocated daily to each class of shares based upon the relative proportion of net assets of each class. Differences in per share distributions, by class, are generally due to differences in class specific expenses.
h. Accounting Estimates
The preparation of financial statements in accordance with accounting principles generally accepted in the United States of America requires management to make estimates and assumptions that affect the reported amounts of assets and liabilities at the date of the financial statements and the amounts of income and expenses during the reporting period. Actual results could differ from those estimates.
i. Guarantees and Indemnifications
Under the Trust’s organizational documents, its officers and trustees are indemnified by the Trust against certain liabilities arising out of the performance of their duties to the Trust. Additionally, in the normal course of business, the Trust, on behalf of the Fund, enters into contracts with service providers that contain general indemnification clauses. The Trust’s maximum exposure under these arrangements is unknown as this would involve future claims that may be made against the Trust that have not yet occurred. Currently, the Trust expects the risk of loss to be remote.
FI-25
Franklin Templeton Variable Insurance Products Trust
Notes to Financial Statements (continued)
Franklin Income Securities Fund
2. SHARES OF BENEFICIAL INTEREST
At December 31, 2007, there were an unlimited number of shares authorized (without par value). Transactions in the Fund’s shares were as follows:
| | | | | | | | | | | | | | |
| | | Year Ended December 31, | |
| | | 2007 | | | 2006 | |
| Class 1 Shares: | | Shares | | | Amount | | | Shares | | | Amount | |
Shares sold | | 3,423,742 | | | $ | 60,983,057 | | | 435,291 | | | $ | 7,230,033 | |
Shares issued in reinvestment of distributions | | 1,003,968 | | | | 18,141,699 | | | 1,200,903 | | | | 18,794,137 | |
Shares redeemed | | (4,552,806 | ) | | | (82,005,721 | ) | | (5,070,278 | ) | | | (83,180,866 | ) |
| | | | |
Net increase (decrease) | | (125,096 | ) | | $ | (2,880,965 | ) | | (3,434,084 | ) | | $ | (57,156,696 | ) |
| | | | |
| Class 2 Shares: | | | | | | | | | | | | |
Shares sold | | 139,710,740 | | | $ | 2,474,805,910 | | | 104,498,137 | | | $ | 1,703,616,378 | |
Shares issued in reinvestment of distributions | | 14,663,792 | | | | 260,428,952 | | | 9,489,256 | | | | 146,229,437 | |
Shares redeemed | | (19,520,061 | ) | | | (337,800,662 | ) | | (6,632,814 | ) | | | (106,495,062 | ) |
| | | | |
Net increase (decrease) | | 134,854,471 | | | $ | 2,397,434,200 | | | 107,354,579 | | | $ | 1,743,350,753 | |
| | | | |
3. TRANSACTIONS WITH AFFILIATES
Franklin Resources, Inc. is the holding company for various subsidiaries that together are referred to as Franklin Templeton Investments. Certain officers and trustees of the Trust are also officers and/or directors of the following subsidiaries:
| | |
| Subsidiary | | Affiliation |
Franklin Advisers, Inc. (Advisers) | | Investment manager |
Franklin Templeton Services, LLC (FT Services) | | Administrative manager |
Franklin Templeton Distributors, Inc. (Distributors) | | Principal underwriter |
Franklin Templeton Investor Services, LLC (Investor Services) | | Transfer agent |
a. Management Fees
The Fund pays an investment management fee to Advisers based on the average daily net assets of the Fund as follows:
| | |
| Annualized Fee Rate | | Net Assets |
| 0.625% | | Up to and including $100 million |
| 0.500% | | Over $100 million, up to and including $250 million |
| 0.450% | | Over $250 million, up to and including $10 billion |
| 0.440% | | Over $10 billion, up to and including $12.5 billion |
| 0.420% | | Over $12.5 billion, up to and including $15 billion |
| 0.400% | | In excess of $15 billion |
Effective January 1, 2008, the Fund will pay fees based on the average daily net assets of the Fund as follows:
| | |
| Annualized Fee Rate | | Net Assets |
| 0.625% | | Up to and including $100 million |
| 0.500% | | Over $100 million, up to and including $250 million |
| 0.450% | | Over $250 million, up to and including $7.5 billion |
| 0.440% | | Over $7.5 billion, up to and including $10 billion |
| 0.430% | | Over $10 billion, up to and including $12.5 billion |
| 0.420% | | Over $12.5 billion, up to and including $15 billion |
| 0.400% | | In excess of $15 billion |
FI-26
Franklin Templeton Variable Insurance Products Trust
Notes to Financial Statements (continued)
Franklin Income Securities Fund
3. TRANSACTIONS WITH AFFILIATES (continued)
b. Administrative Fees
Under an agreement with Advisers, FT Services provides administrative services to the Fund. The fee is paid by Advisers based on average daily net assets, and is not an additional expense of the Fund
c. Distribution Fees
The Fund’s Board of Trustees has adopted a distribution plan for Class 2 shares pursuant to Rule 12b-1 under the 1940 Act. Under the Fund’s compensation distribution plan, the Fund pays Distributors for costs incurred in connection with the servicing, sale and distribution of the Fund’s shares up to 0.35% per year of its average daily net assets. The Board of Trustees has agreed to limit the current rate to 0.25% per year.
d. Transfer Agent Fees
Investor Services, under terms of an agreement, performs shareholder servicing for the Fund and is not paid by the Fund for the services.
4. EXPENSE OFFSET ARRANGEMENT
The Fund has entered into an arrangement with its custodian whereby credits realized as a result of uninvested cash balances are used to reduce a portion of the Fund’s custodian expenses. During the year ended December 31, 2007, the custodian fees were reduced as noted in the Statement of Operations.
5. INCOME TAXES
The Fund has reviewed the tax positions taken on federal income tax returns, for each of the three open tax years and as of December 31, 2007 and has determined that no provision for income tax is required in the Fund’s financial statements.
For tax purposes, realized capital losses and realized currency losses occurring subsequent to October 31, may be deferred and treated as occurring on the first day of the following fiscal year. At December 31, 2007, the Fund deferred realized capital losses and realized currency losses of $37,892,052 and $29,885, respectively.
The tax character of distributions paid during the years ended December 31, 2007 and 2006, was as follows:
| | | | | | |
| | | 2007 | | 2006 |
Distributions paid from: | | | | | | |
Ordinary income | | $ | 249,210,633 | | $ | 153,317,720 |
Long term capital gain | | | 29,360,018 | | | 11,705,854 |
| | | |
| | $ | 278,570,651 | | $ | 165,023,574 |
| | | |
FI-27
Franklin Templeton Variable Insurance Products Trust
Notes to Financial Statements (continued)
Franklin Income Securities Fund
5. INCOME TAXES (continued)
At December 31, 2007, the cost of investments, net unrealized appreciation (depreciation), undistributed ordinary income and undistributed long term capital gains for income tax purposes were as follows:
| | | | |
Cost of investments | | $ | 7,570,668,179 | |
| | | | |
| |
Unrealized appreciation | | $ | 574,515,033 | |
Unrealized depreciation | | | (350,938,197 | ) |
| | | | |
Net unrealized appreciation (depreciation) | | $ | 223,576,836 | |
| | | | |
Undistributed ordinary income | | $ | 440,312,742 | |
Undistributed long term capital gains | | | 105,367,572 | |
| | | | |
Distributable earnings | | $ | 545,680,314 | |
| | | | |
Net investment income differs for financial statement and tax purposes primarily due to differing treatments of defaulted securities, foreign currency transactions, and bond discounts and premiums.
Net realized gains (losses) differ for financial statement and tax purposes primarily due to differing treatments of wash sales, foreign currency transactions, and bond discounts and premiums.
6. INVESTMENT TRANSACTIONS
Purchases and sales of investments (excluding short term securities) for the year ended December 31, 2007, aggregated $4,223,222,388 and $2,018,710,821, respectively.
7. CREDIT RISK AND DEFAULTED SECURITIES
The Fund has 45.78% of its portfolio invested in below investment grade and comparable quality unrated high yield securities, which tend to be more sensitive to economic conditions than higher rated securities. The risk of loss due to default by the issuer may be significantly greater for the holders of high yielding securities because such securities are generally unsecured and are often subordinated to other creditors of the issuer.
8. UNFUNDED LOAN COMMITMENTS
The Fund may enter into certain credit agreements, all or a portion of which may be unfunded. The Fund is obligated to fund these loan commitments at the borrowers’ discretion. Funded portions of credit agreements are presented on the Statement of Investments.
At December 31, 2007, the unfunded commitment was as follows:
| | | |
| Borrower | | Unfunded
Commitment |
Bausch & Lomb Incorporated, Delayed Draw Term Loan | | $ | 1,760,000 |
Unfunded loan commitments and funded portions of credit agreements are marked to market daily and any unrealized gain or loss is included in the Statement of Assets and Liabilities and Statement of Operations.
FI-28
Franklin Templeton Variable Insurance Products Trust
Notes to Financial Statements (continued)
Franklin Income Securities Fund
9. OTHER CONSIDERATIONS
Officers, directors or employees of the Fund’s Investment Manager, may serve from time to time as members of bondholders’ steering committees or official creditors’ committees. Such participation may result in the possession by the Investment Manager of material non-public information which, pursuant to the Fund’s policies and the requirements of applicable securities laws, could prevent the Fund from trading in the securities of such companies for limited or extended periods of time.
10. REGULATORY AND LITIGATION MATTERS
As part of various investigations by a number of federal, state, and foreign regulators and governmental entities, including the Securities and Exchange Commission (“SEC”), relating to certain practices in the mutual fund industry, including late trading, market timing and marketing support payments to securities dealers who sell fund shares (“marketing support”), Franklin Resources, Inc. and certain of its subsidiaries (collectively, the “Company”), entered into settlements with certain of those regulators and governmental entities. Specifically, the Company entered into settlements with the SEC, among others, concerning market timing and marketing support.
On June 6, 2007, the SEC posted for public comment the proposed plan of distribution for the market timing settlement. Once the SEC approves the final plan of distribution, disbursements of settlement monies will be made promptly to individuals who were shareholders of the designated funds during the relevant period, in accordance with the terms and conditions of the settlement and plan.
In addition, the Company, as well as most of the mutual funds within Franklin Templeton Investments and certain current or former officers, Company directors, fund directors, and employees, have been named in private lawsuits (styled as shareholder class actions, or as derivative actions on behalf of either the named funds or Franklin Resources, Inc.). The lawsuits relate to the industry practices referenced above.
The Company and fund management believe that the claims made in each of the private lawsuits referenced above are without merit and intend to defend against them vigorously. The Company cannot predict with certainty the eventual outcome of these lawsuits, nor whether they will have a material negative impact on the Company. If it is determined that the Company bears responsibility for any unlawful or inappropriate conduct that caused losses to the Trust, it is committed to making the Trust or its shareholders whole, as appropriate.
11. NEW ACCOUNTING PRONOUNCEMENT
In September 2006, the Financial Accounting Standards Board (FASB) issued FASB Statement No. 157, “Fair Value Measurement” (SFAS 157), which defines fair value, establishes a framework for measuring fair value, and expands disclosures about fair value measurements. SFAS 157 is effective for fiscal years beginning after November 15, 2007, and interim periods within those fiscal years. The Trust believes the adoption of SFAS 157 will have no material impact on its financial statements.
FI-29
Franklin Templeton Variable Insurance Products Trust
Franklin Income Securities Fund
Report of Independent Registered Public Accounting Firm
To the Board of Trustees and Shareholders of
Franklin Templeton Variable Insurance Products Trust
In our opinion, the accompanying statement of assets and liabilities, including the statement of investments, and the related statements of operations and of changes in net assets and the financial highlights present fairly, in all material respects, the financial position of Franklin Income Securities Fund (one of the funds constituting Franklin Templeton Variable Insurance Products Trust, hereafter referred to as the “Fund”) at December 31, 2007, the results of its operations for the year then ended, the changes in its net assets for each of the two years in the period then ended and the financial highlights for each of the five years in the period then ended, in conformity with accounting principles generally accepted in the United States of America. These financial statements and financial highlights (hereafter referred to as “financial statements”) are the responsibility of the Fund’s management. Our responsibility is to express an opinion on these financial statements based on our audits. We conducted our audits of these financial statements in accordance with the standards of the Public Company Accounting Oversight Board (United States). Those standards require that we plan and perform the audit to obtain reasonable assurance about whether the financial statements are free of material misstatement. An audit includes examining, on a test basis, evidence supporting the amounts and disclosures in the financial statements, assessing the accounting principles used and significant estimates made by management, and evaluating the overall financial statement presentation. We believe that our audits, which included confirmation of securities at December 31, 2007 by correspondence with the custodian, agent banks and brokers, provide a reasonable basis for our opinion.
PricewaterhouseCoopers LLP
San Francisco, California
February 14, 2008
FI-30
Franklin Templeton Variable Insurance Products Trust
Tax Designation (unaudited)
Franklin Income Securities Fund
Under Section 852(b)(3)(C) of the Internal Revenue Code (Code), the Fund designates the maximum amount allowable but no less than $105,385,107 as a long term capital gain dividend for the fiscal year ended December 31, 2007.
Under Section 854(b)(2) of the Code, the Fund designates 33.50% of the ordinary income dividends as income qualifying for the dividends received deduction for the fiscal year ended December 31, 2007.
FI-31
FRANKLIN LARGE CAP GROWTH SECURITIES FUND
This annual report for Franklin Large Cap Growth Securities Fund covers the fiscal year ended December 31, 2007.
Performance Summary as of 12/31/07
Average annual total return of Class 1 shares represents the average annual change in value, assuming reinvestment of dividends and capital gains. Average returns smooth out variations in returns, which can be significant; they are not the same as year-by-year results.
Periods ended 12/31/07
| | | | | | |
| | | 1-Year | | 5-Year | | 10-Year |
Average Annual Total Return | | +6.53% | | +10.55% | | +6.58% |
Total Return Index Comparison for Hypothetical $10,000 Investment (1/1/98–12/31/07)
The graph below shows the change in value of a hypothetical $10,000 investment in the Fund over the indicated period and includes reinvestment of any income or distributions. The Fund’s performance is compared to the performance of the Standard & Poor’s 500 Index (S&P 500) and the Russell 1000® Growth Index. One cannot invest directly in an index, nor is an index representative of the Fund’s portfolio. Please see Important Notes to Performance Information preceding the Fund Summaries.
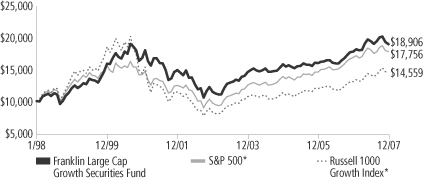
*Source: Standard & Poor’s Micropal. Please see Index Descriptions following the Fund Summaries.
Franklin Large Cap Growth Securities Fund Class 1
Performance reflects the Fund’s Class 1 operating expenses, but does not include any contract fees, expenses or sales charges. If they had been included, performance would be lower. These charges and deductions, particularly for variable life policies, can have a significant effect on contract values and insurance benefits. See the contract prospectus for a complete description of these expenses, including sales charges.
Performance data represent past performance, which does not guarantee future results. Investment return and principal value will fluctuate, and you may have a gain or loss when you sell your shares. Current performance may differ from figures shown.
FLG-1
Fund Goal and Main Investments: Franklin Large Cap Growth Securities Fund seeks capital appreciation. The Fund normally invests at least 80% of its net assets in investments of large capitalization companies and normally invests predominantly in equity securities. For this Fund, large capitalization companies are those with market capitalization values within those of the top 50% of companies in the Russell 1000 Index at the time of purchase.1
Performance Overview
You can find the Fund’s one-year total return in the Performance Summary. Compared with its benchmarks, the Fund underperformed the +11.81% return of the Russell 1000 Growth Index, but outperformed the S&P 500, which returned +5.49%.2
Economic and Market Overview
During the 12 months ended December 31, 2007, the U.S. economy advanced at a moderate but uneven pace. Gross domestic product (GDP) grew an annualized 0.6% in the first quarter of 2007 but advanced in the second quarter at an annualized 3.8% rate. Federal defense spending, accelerating exports and declining imports, greater business inventory investment and increased spending for nonresidential structures supported growth. GDP grew an annualized 4.9% in the third quarter of 2007 despite a struggling housing market and the abrupt unraveling of the subprime mortgage market. The housing downturn affected the overall economy by fourth quarter 2007 as credit conditions worsened, consumer spending slowed, and GDP growth decelerated to an estimated 0.6% annualized rate.
The unemployment rate increased from 4.4% at the beginning of the period to 5.0% in December 2007.3 Although consumer confidence in July neared a six-year high, it declined through period-end largely due to rising mortgage and fuel costs, falling home prices and a weaker job market. Oil prices were volatile and established a new record high in November, nearing $99 per barrel. For the 12 months ended December 31, 2007, the core Consumer Price Index (CPI), which excludes food and energy costs, rose 2.4%, which was higher than its 10-year average rate.3
1. Please see Index Descriptions following the Fund Summaries.
2. Source: Standard & Poor’s Micropal. One cannot invest directly in an index, nor is an index representative of the Fund’s portfolio. Please see Index Descriptions following the Fund Summaries.
3. Source: Bureau of Labor Statistics.
Fund Risks: The Fund’s investments in stocks offer the potential for long-term gains but can be subject to short-term price fluctuations. Large capitalization stocks tend to go through cycles of outperforming or lagging the stock market in general and, in the past, these periods have lasted for several years. By having significant investments in particular sectors from time to time, such as the technology sector, which has been among the market’s most volatile sectors, the Fund may be at greater risk from adverse developments in a sector than a fund that invests more broadly. Foreign investing, especially in emerging markets, involves additional risks, including currency fluctuations, economic instability, market volatility, and political and social instability. The Fund’s prospectus also includes a description of the main investment risks.
FLG-2
Facing the prospect of slower economic growth, the Federal Reserve Board lowered the federal funds target rate to 4.25% from 5.25% during the period. As investors fled riskier, poorer-performing assets, U.S. Treasuries rallied and the 10-year Treasury note yield fell from 4.71% at the beginning of the period to 4.04% on December 31, 2007.
Following sell-offs in late February and mid-March, stock markets rebounded amid generally strong first quarter corporate earnings reports. However, volatility picked up substantially in the latter half of the year due to investor concerns about slowing economic growth. The major stock indexes recovered from a late-summer sell-off and a November correction, and the blue chip stocks of the Dow Jones Industrial Average posted a 12-month total return of +8.88%.4 The broader S&P 500 returned +5.49%, and the technology-heavy NASDAQ Composite Index returned +11.53%.4 The energy, materials and utilities sectors performed particularly well. Large-capitalization stocks generally outperformed small caps, and growth stocks fared better than their value counterparts.
Investment Strategy
We are research-driven, fundamental investors pursuing a growth strategy. As bottom-up investors focusing primarily on individual securities, we seek companies that have identifiable drivers of future earnings growth and that present, in our opinion, the best trade-off between that potential earnings growth, business and financial risk, and valuation. We rely on a team of analysts to help provide in-depth industry expertise and use both qualitative and quantitative analysis to evaluate companies for distinct, sustainable and competitive advantages likely to lead to growth in earnings and/or share price. Competitive advantages such as a particular product niche, proven technology, sound financial profits and records, or strong management are all factors we believe may contribute to growth in earnings or share price.
Manager’s Discussion
Looking back on the key factors impacting the Fund’s returns during the period under review, we would like to remind shareholders that our investment strategy is primarily bottom-up and driven by individual stock selection. However, we recognize that a sector-based discussion can be a helpful way to organize a portfolio review of key performance drivers.
4. Source: Standard & Poor’s Micropal. Please see Index Descriptions following the Fund Summaries.
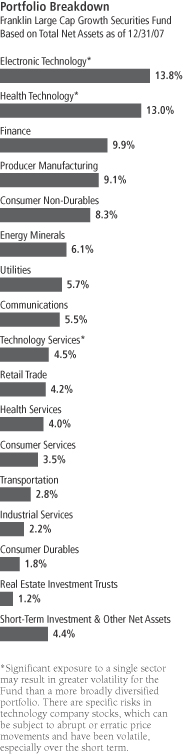
FLG-3
From a sector perspective, electronic technology and utilities were the top contributing sectors to Fund performance relative to the S&P 500. In the electronic technology sector, the Fund benefited from its selection of telecommunications equipment, computer communications and semiconductor stocks. Standout performers included telecommunications equipment maker Nokia,4 networking equipment company Juniper Networks and, in the semiconductor industry, positions in Intel and Texas Instruments. In the utilities sector, the Fund benefited from outperforming electric utilities Energy Future Holdings and Public Service Enterprise Group.
The Fund’s underweighting in the struggling finance sector also helped relative performance. In particular, the Fund benefited from stock selection in the finance/rental/leasing and life/health insurance industries. A position in outperforming insurer AFLAC was especially beneficial. Finally, stock selection in the consumer durables sector also supported relative performance. Video game software maker Electronic Arts and high-end stereo and audio equipment manufacturer Harman International Industries were strong performers in this sector.
By contrast, stock selection in the communications sector hurt performance relative to the S&P 500, due largely to weakness in NII Holdings4 and Sprint Nextel. Stock selection in the health technology sector was also detrimental. Key detractors from this sector included biotechnology holdings Amgen and Genentech.
In the transportation sector, the Fund’s positions in Southwest Airlines and air freight company FedEx performed poorly, as both suffered double-digit share price declines during the year. Additionally, underweighted exposure to the robust energy minerals sector dampened relative results, as did investments in several poor-performing financials stocks, notably Washington Mutual and E*TRADE Financial.
Thank you for your participation in Franklin Large Cap Growth Securities Fund. We look forward to serving your future investment needs.
4. This holding is not an S&P 500 component.
The foregoing information reflects our analysis, opinions and portfolio holdings as of December 31, 2007, the end of the reporting period. The way we implement our main investment strategies and the resulting portfolio holdings may change depending on factors such as market and economic conditions. These opinions may not be relied upon as investment advice or an offer for a particular security. The information is not a complete analysis of every aspect of any market, country, industry, security or the Fund. Statements of fact are from sources considered reliable, but the investment manager makes no representation or warranty as to their completeness or accuracy. Although historical performance is no guarantee of future results, these insights may help you understand our investment management philosophy.
Top 10 Holdings
Franklin Large Cap Growth Securities Fund 12/31/07
| | |
Company Sector/Industry | | % of Total
Net Assets |
| |
| Johnson & Johnson | | 3.3% |
| Health Technology | | |
| |
| Microsoft Corp. | | 2.9% |
| Technology Services | | |
| |
| The Procter & Gamble Co. | | 2.7% |
| Consumer Non-Durables | | |
| |
| WellPoint Inc. | | 2.5% |
| Health Services | | |
| |
| American International Group Inc. | | 2.4% |
| Finance | | |
| |
| Roche Holding AG, ADR (Switzerland) | | 2.0% |
| Health Technology | | |
| |
| 3M Co. | | 2.0% |
| Producer Manufacturing | | |
| |
| AFLAC Inc. | | 1.9% |
| Finance | | |
| |
| Avery Dennison Corp. | | 1.9% |
| Producer Manufacturing | | |
| |
| Bank of America Corp. | | 1.8% |
| Finance | | |
The dollar value, number of shares or principal amount, and names of all portfolio holdings are listed in the Fund’s Statement of Investments.
FLG-4
Fund Expenses
As an investor in a variable insurance contract (Contract) that indirectly provides for investment in an underlying mutual fund, you can incur transaction and/or ongoing expenses at both the Fund level and the Contract level.
| • | | Transaction expenses can include sales charges (loads) on purchases, redemption fees, surrender fees, transfer fees and premium taxes. |
| • | | Ongoing expenses can include management fees, distribution and service (12b-1) fees, contract fees, annual maintenance fees, mortality and expense risk fees and other fees and expenses. All mutual funds and Contracts have some types of ongoing expenses. |
The expenses shown in the table are meant to highlight ongoing expenses at the Fund level only and do not include ongoing expenses at the Contract level, or transaction expenses at either the Fund or Contract level. While the Fund does not have transaction expenses, if the transaction and ongoing expenses at the Contract level were included, the expenses shown would be higher. You should consult your Contract prospectus or disclosure document for more information.
The table shows Fund-level ongoing expenses and can help you understand these expenses and compare them with those of other mutual funds offered through the Contract. The table assumes a $1,000 investment held for the six months indicated. Please refer to the Fund prospectus for additional information on operating expenses.
Actual Fund Expenses
The first line (Actual) of the table provides actual account values and expenses. The “Ending Account Value” is derived from the Fund’s actual return, which includes the effect of ongoing Fund expenses, but does not include the effect of ongoing Contract expenses.
You can estimate the Fund-level expenses you incurred during the period by following these steps. Of course, your account value and expenses will differ from those in this illustration:
| 1. | Divide your account value by $1,000. |
If an account had an $8,600 value, then $8,600 ÷ $1,000 = 8.6.
| 2. | Multiply the result by the number under the heading “Fund-Level Expenses Incurred During Period.” |
If Fund-Level Expenses Incurred During Period were $7.50, then 8.6 x $7.50 = $64.50.
In this illustration, the estimated expenses incurred this period at the Fund level are $64.50.
Franklin Large Cap Growth Securities Fund Class 1
FLG-5
Hypothetical Example for Comparison with Other Mutual Funds
Information in the second line (Hypothetical) of the table can help you compare ongoing expenses of the Fund with those of other mutual funds offered through the Contract. This information may not be used to estimate the actual ending account balance or expenses you incurred during the period. The hypothetical “Ending Account Value” is based on the Fund’s actual expense ratio and an assumed 5% annual rate of return before expenses, which does not represent the Fund’s actual return. The figure under the heading “Fund-Level Expenses Incurred During Period” shows the hypothetical expenses your account would have incurred under this scenario. You can compare this figure with the 5% hypothetical examples that appear in shareholder reports of other funds offered through a Contract.
| | | | | | | | | |
| Class 1 | | Beginning
Account Value 7/1/07 | | Ending
Account
Value 12/31/07 | | Fund-Level
Expenses Incurred
During Period*
7/1/07–12/31/07 |
Actual | | $ | 1,000 | | $ | 986.30 | | $ | 3.65 |
Hypothetical (5% return before expenses) | | $ | 1,000 | | $ | 1,021.53 | | $ | 3.72 |
*Expenses are calculated using the most recent six-month annualized expense ratio for the Fund’s Class 1 shares (0.73%), which does not include any ongoing expenses of the Contract for which the Fund is an investment option, multiplied by the average account value over the period, multiplied by 184/365 to reflect the one-half year period.
FLG-6
Franklin Templeton Variable Insurance Products Trust
Financial Highlights
Franklin Large Cap Growth Securities Fund
| | | | | | | | | | | | | | | | | | | | |
| | | Year Ended December 31, | |
| Class 1 | | 2007 | | | 2006 | | | 2005 | | | 2004 | | | 2003 | |
| | | | |
Per share operating performance | | | | | | | | | | | | | | | | | | | | |
(for a share outstanding throughout the year) | | | | | | | | | | | | | | | | | | | | |
Net asset value, beginning of year | | $ | 16.70 | | | $ | 15.17 | | | $ | 15.08 | | | $ | 14.01 | | | $ | 11.10 | |
| | | | |
Income from investment operationsa: | | | | | | | | | | | | | | | | | | | | |
Net investment incomeb | | | 0.21 | | | | 0.17 | | | | 0.17 | | | | 0.13 | | | | 0.10 | |
Net realized and unrealized gains (losses) | | | 0.89 | | | | 1.51 | | | | 0.02 | | | | 1.02 | | | | 2.90 | |
| | | | |
Total from investment operations | | | 1.10 | | | | 1.68 | | | | 0.19 | | | | 1.15 | | | | 3.00 | |
| | | | |
Less distributions from: | | | | | | | | | | | | | | | | | | | | |
Net investment income | | | (0.16 | ) | | | (0.15 | ) | | | (0.10 | ) | | | (0.08 | ) | | | (0.09 | ) |
Net realized gains | | | (0.13 | ) | | | — | | | | — | | | | — | | | | — | |
| | | | |
Total distributions | | | (0.29 | ) | | | (0.15 | ) | | | (0.10 | ) | | | (0.08 | ) | | | (0.09 | ) |
| | | | |
Net asset value, end of year | | $ | 17.51 | | | $ | 16.70 | | | $ | 15.17 | | | $ | 15.08 | | | $ | 14.01 | |
| | | | |
| | | | | |
Total returnc | | | 6.53% | | | | 11.17% | | | | 1.31% | | | | 8.23% | | | | 27.14% | |
Ratios to average net assets | | | | | | | | | | | | | | | | | | | | |
Expenses | | | 0.74% | d | | | 0.76% | d | | | 0.76%d | | | | 0.79% | d | | | 0.79% | |
Net investment income | | | 1.21% | | | | 1.11% | | | | 1.14% | | | | 0.99% | | | | 0.86% | |
| | | | | |
Supplemental data | | | | | | | | | | | | | | | | | | | | |
Net assets, end of year (000’s) | | $ | 96,920 | | | $ | 114,929 | | | $ | 136,464 | | | $ | 169,107 | | | $ | 191,028 | |
Portfolio turnover rate | | | 50.67% | | | | 50.97% | | | | 39.44% | | | | 38.48% | | | | 35.28% | |
aThe amount shown for a share outstanding throughout the period may not correlate with the Statement of Operations for the period due to the timing of sales and repurchases of the Fund shares in relation to income earned and/or fluctuating market value of the investments of the Fund.
bBased on average daily shares outstanding.
cTotal return does not include any fees, charges or expenses imposed by the variable annuity and life insurance contracts for which the Franklin Templeton Variable Insurance Products Trust serves as an underlying investment vehicle.
dBenefit of expense reduction rounds to less than 0.01%.
The accompanying notes are an integral part of these financial statements.
FLG-7
Franklin Templeton Variable Insurance Products Trust
Financial Highlights (continued)
Franklin Large Cap Growth Securities Fund
| | | | | | | | | | | | | | | | | | | | |
| | | Year Ended December 31, | |
| Class 2 | | 2007 | | | 2006 | | | 2005 | | | 2004 | | | 2003 | |
| | | | |
Per share operating performance | | | | | | | | | | | | | | | | | | | | |
(for a share outstanding throughout the year) | | | | | | | | | | | | | | | | | | | | |
Net asset value, beginning of year | | $ | 16.47 | | | $ | 14.97 | | | $ | 14.90 | | | $ | 13.87 | | | $ | 11.00 | |
| | | | |
Income from investment operationsa: | | | | | | | | | | | | | | | | | | | | |
Net investment incomeb | | | 0.17 | | | | 0.13 | | | | 0.13 | | | | 0.11 | | | | 0.08 | |
Net realized and unrealized gains (losses) | | | 0.87 | | | | 1.49 | | | | 0.03 | | | | 0.99 | | | | 2.87 | |
| | | | |
Total from investment operations | | | 1.04 | | | | 1.62 | | | | 0.16 | | | | 1.10 | | | | 2.95 | |
| | | | |
Less distributions from: | | | | | | | | | | | | | | | | | | | | |
Net investment income | | | (0.13 | ) | | | (0.12 | ) | | | (0.09 | ) | | | (0.07 | ) | | | (0.08 | ) |
Net realized gains | | | (0.13 | ) | | | — | | | | — | | | | — | | | | — | |
| | | | |
Total distributions | | | (0.26 | ) | | | (0.12 | ) | | | (0.09 | ) | | | (0.07 | ) | | | (0.08 | ) |
| | | | |
Net asset value, end of year | | $ | 17.25 | | | $ | 16.47 | | | $ | 14.97 | | | $ | 14.90 | | | $ | 13.87 | |
| | | | |
| | | | | |
Total returnc | | | 6.23% | | | | 10.90% | | | | 1.06% | | | | 7.93% | | | | 26.95% | |
Ratios to average net assets | | | | | | | | | | | | | | | | | | | | |
Expenses | | | 0.99% | d | | | 1.01% | d | | | 1.01% | d | | | 1.04% | d | | | 1.04% | |
Net investment income | | | 0.96% | | | | 0.86% | | | | 0.89% | | | | 0.74% | | | | 0.61% | |
| | | | | |
Supplemental data | | | | | | | | | | | | | | | | | | | | |
Net assets, end of year (000’s) | | $ | 642,351 | | | $ | 636,592 | | | $ | 510,395 | | | $ | 340,465 | | | $ | 128,029 | |
Portfolio turnover rate | | | 50.67% | | | | 50.97% | | | | 39.44% | | | | 38.48% | | | | 35.28% | |
aThe amount shown for a share outstanding throughout the period may not correlate with the Statement of Operations for the period due to the timing of sales and repurchases of the Fund shares in relation to income earned and/or fluctuating market value of the investments of the Fund.
bBased on average daily shares outstanding.
cTotal return does not include any fees, charges or expenses imposed by the variable annuity and life insurance contracts for which the Franklin Templeton Variable Insurance Products Trust serves as an underlying investment vehicle.
dBenefit of expense reduction rounds to less than 0.01%.
The accompanying notes are an integral part of these financial statements.
FLG-8
Franklin Templeton Variable Insurance Products Trust
Statement of Investments, December 31, 2007
| | | | | | | |
| Franklin Large Cap Growth Securities Fund | | Country | | Shares | | Value |
Common Stocks 95.6% | | | | | | | |
Communications 5.5% | | | | | | | |
AT&T Inc. | | United States | | 247,000 | | $ | 10,265,320 |
aCrown Castle International Corp. | | United States | | 125,000 | | | 5,200,000 |
aNII Holdings Inc. | | United States | | 152,150 | | | 7,351,888 |
Sprint Nextel Corp. | | United States | | 792,925 | | | 10,411,105 |
Verizon Communications Inc. | | United States | | 164,200 | | | 7,173,898 |
| | | | | | | |
| | | | | | | 40,402,211 |
| | | | | | | |
Consumer Durables 1.8% | | | | | | | |
aElectronic Arts Inc. | | United States | | 137,000 | | | 8,002,170 |
Harman International Industries Inc. | | United States | | 70,700 | | | 5,211,297 |
| | | | | | | |
| | | | | | | 13,213,467 |
| | | | | | | |
Consumer Non-Durables 8.3% | | | | | | | |
Altria Group Inc. | | United States | | 130,000 | | | 9,825,400 |
Anheuser-Busch Cos. Inc. | | United States | | 172,400 | | | 9,023,416 |
Clorox Co. | | United States | | 125,500 | | | 8,178,835 |
aHansen Natural Corp. | | United States | | 177,766 | | | 7,873,256 |
PepsiCo Inc. | | United States | | 86,600 | | | 6,572,940 |
The Procter & Gamble Co. | | United States | | 268,300 | | | 19,698,586 |
| | | | | | | |
| | | | | | | 61,172,433 |
| | | | | | | |
Consumer Services 3.5% | | | | | | | |
aComcast Corp. | | United States | | 339,800 | | | 6,204,748 |
aStarbucks Corp. | | United States | | 434,400 | | | 8,892,168 |
The Walt Disney Co. | | United States | | 334,600 | | | 10,800,888 |
| | | | | | | |
| | | | | | | 25,897,804 |
| | | | | | | |
Electronic Technology 13.8% | | | | | | | |
aApple Inc. | | United States | | 29,200 | | | 5,783,936 |
The Boeing Co. | | United States | | 104,300 | | | 9,122,078 |
aCisco Systems Inc. | | United States | | 373,300 | | | 10,105,231 |
aDell Inc. | | United States | | 295,800 | | | 7,250,058 |
Intel Corp. | | United States | | 414,200 | | | 11,042,572 |
aJuniper Networks Inc. | | United States | | 281,700 | | | 9,352,440 |
aMicrosemi Corp. | | United States | | 323,100 | | | 7,153,434 |
aNetwork Appliance Inc. | | United States | | 414,100 | | | 10,335,936 |
Nokia Corp., ADR | | Finland | | 268,000 | | | 10,288,520 |
QUALCOMM Inc. | | United States | | 250,600 | | | 9,861,110 |
Texas Instruments Inc. | | United States | | 360,700 | | | 12,047,380 |
| | | | | | | |
| | | | | | | 102,342,695 |
| | | | | | | |
Energy Minerals 6.1% | | | | | | | |
ConocoPhillips | | United States | | 96,600 | | | 8,529,780 |
Devon Energy Corp. | | United States | | 112,000 | | | 9,957,920 |
Exxon Mobil Corp. | | United States | | 142,000 | | | 13,303,980 |
Peabody Energy Corp. | | United States | | 212,200 | | | 13,080,008 |
| | | | | | | |
| | | | | | | 44,871,688 |
| | | | | | | |
Finance 9.9% | | | | | | | |
AFLAC Inc. | | United States | | 229,300 | | | 14,361,059 |
American International Group Inc. | | United States | | 308,600 | | | 17,991,380 |
Bank of America Corp. | | United States | | 326,858 | | | 13,486,161 |
JPMorgan Chase & Co. | | United States | | 95,140 | | | 4,152,861 |
Merrill Lynch & Co. Inc. | | United States | | 130,500 | | | 7,005,240 |
FLG-9
Franklin Templeton Variable Insurance Products Trust
Statement of Investments, December 31, 2007 (continued)
| | | | | | | |
| Franklin Large Cap Growth Securities Fund | | Country | | Shares | | Value |
Common Stocks (continued) | | | | | | | |
Finance (continued) | | | | | | | |
Wachovia Corp. | | United States | | 300,000 | | $ | 11,409,000 |
Washington Mutual Inc. | | United States | | 380,200 | | | 5,174,522 |
| | | | | | | |
| | | | | | | 73,580,223 |
| | | | | | | |
Health Services 4.0% | | | | | | | |
aExpress Scripts Inc. | | United States | | 160,500 | | | 11,716,500 |
aWellPoint Inc. | | United States | | 207,000 | | | 18,160,110 |
| | | | | | | |
| | | | | | | 29,876,610 |
| | | | | | | |
Health Technology 13.0% | | | | | | | |
aAmgen Inc. | | United States | | 141,200 | | | 6,557,328 |
aGenentech Inc. | | United States | | 143,800 | | | 9,644,666 |
Johnson & Johnson | | United States | | 368,300 | | | 24,565,610 |
Medtronic Inc. | | United States | | 188,900 | | | 9,496,003 |
Pfizer Inc. | | United States | | 290,900 | | | 6,612,157 |
Roche Holding AG, ADR | | Switzerland | | 176,700 | | | 15,129,938 |
Schering-Plough Corp. | | United States | | 412,700 | | | 10,994,328 |
Teva Pharmaceutical Industries Ltd., ADR | | Israel | | 278,200 | | | 12,930,736 |
| | | | | | | |
| | | | | | | 95,930,766 |
| | | | | | | |
Industrial Services 2.2% | | | | | | | |
Halliburton Co. | | United States | | 199,000 | | | 7,544,090 |
Schlumberger Ltd. | | United States | | 88,500 | | | 8,705,745 |
| | | | | | | |
| | | | | | | 16,249,835 |
| | | | | | | |
Producer Manufacturing 9.1% | | | | | | | |
3M Co. | | United States | | 171,100 | | | 14,427,152 |
Avery Dennison Corp. | | United States | | 259,100 | | | 13,768,574 |
General Electric Co. | | United States | | 315,600 | | | 11,699,292 |
Johnson Controls Inc. | | United States | | 309,300 | | | 11,147,172 |
Tyco International Ltd. | | United States | | 238,275 | | | 9,447,604 |
United Technologies Corp. | | United States | | 93,600 | | | 7,164,144 |
| | | | | | | |
| | | | | | | 67,653,938 |
| | | | | | | |
Real Estate Investment Trust 1.2% | | | | | | | |
iStar Financial Inc. | | United States | | 330,600 | | | 8,612,129 |
| | | | | | | |
Retail Trade 4.2% | | | | | | | |
CVS Caremark Corp. | | United States | | 243,900 | | | 9,695,025 |
Target Corp. | | United States | | 192,500 | | | 9,625,000 |
Wal-Mart Stores Inc. | | United States | | 246,400 | | | 11,711,392 |
| | | | | | | |
| | | | | | | 31,031,417 |
| | | | | | | |
Technology Services 4.5% | | | | | | | |
International Business Machines Corp. | | United States | | 105,600 | | | 11,415,360 |
Microsoft Corp. | | United States | | 610,000 | | | 21,716,000 |
| | | | | | | |
| | | | | | | 33,131,360 |
| | | | | | | |
Transportation 2.8% | | | | | | | |
FedEx Corp. | | United States | | 130,400 | | | 11,627,768 |
Southwest Airlines Co. | | United States | | 731,900 | | | 8,929,180 |
| | | | | | | |
| | | | | | | 20,556,948 |
| | | | | | | |
FLG-10
Franklin Templeton Variable Insurance Products Trust
Statement of Investments, December 31, 2007 (continued)
| | | | | | | | |
| Franklin Large Cap Growth Securities Fund | | Country | | Shares | | Value |
Common Stocks (continued) | | | | | | | | |
Utilities 5.7% | | | | | | | | |
Ameren Corp. | | United States | | | 185,900 | | $ | 10,077,639 |
Dominion Resources Inc. | | United States | | | 175,000 | | | 8,303,750 |
Exelon Corp. | | United States | | | 96,800 | | | 7,902,752 |
a,bIberdrola Renovables, 144A | | Spain | | | 751,200 | | | 6,193,890 |
Public Service Enterprise Group Inc. | | United States | | | 100,400 | | | 9,863,296 |
| | | | | | | | |
| | | | | | | | 42,341,327 |
| | | | | | | | |
Total Common Stocks (Cost $610,543,388) | | | | | | | | 706,864,851 |
| | | | | | | | |
| | | |
| | | | | Principal
Amount | | |
Short Term Investment (Cost $25,299,895) 3.4% | | | | | | | | |
Repurchase Agreement 3.4% | | | | | | | | |
cJoint Repurchase Agreement, 3.773%, 1/02/08 (Maturity Value $25,305,198) | | United States | | $ | 25,299,895 | | | 25,299,895 |
ABN AMRO Bank, NV, New York Branch (Maturity Value $2,490,031) | | | | | | | | |
Banc of America Securities LLC (Maturity Value $2,490,031) | | | | | | | | |
Barclays Capital Inc. (Maturity Value $1,146,832) | | | | | | | | |
BNP Paribas Securities Corp. (Maturity Value $2,490,031) | | | | | | | | |
Credit Suisse Securities (USA) LLC (Maturity Value $655,152) | | | | | | | | |
Deutsche Bank Securities Inc. (Maturity Value $2,490,031) | | | | | | | | |
Dresdner Kleinwort Wasserstein Securities LLC (Maturity Value $2,490,031) | | | | | | | | |
Goldman, Sachs & Co. (Maturity Value $3,014,102) | | | | | | | | |
Greenwich Capital Markets Inc. (Maturity Value $2,490,031) | | | | | | | | |
Lehman Brothers Inc. (Maturity Value $3,058,895) | | | | | | | | |
Merrill Lynch Government Securities Inc. (Maturity Value $2,490,031) | | | | | | | | |
Collateralized by U.S. Government Agency Securities, 3.00% - 6.25%, 1/15/08 - 11/14/12;
dU.S. Government Agency Discount Notes, 1/02/08 - 8/01/12; dU.S. Treasury Bill, 6/12/08 and U.S. Treasury Notes, 3.25% - 4.625%, 3/31/08 - 8/15/10 | | | | | | | | |
| | | | | | | | |
Total Investments (Cost $635,843,283) 99.0% | | | | | | | | 732,164,746 |
Other Assets, less Liabilities 1.0% | | | | | | | | 7,106,735 |
| | | | | | | | |
Net Assets 100.0% | | | | | | | $ | 739,271,481 |
| | | | | | | | |
Selected Portfolio Abbreviations
ADR - American Depository Receipt
aNon-income producing for the twelve months ended December 31, 2007.
bSecurity was purchased pursuant to Rule 144A under the Securities Act of 1933 and may be sold in transactions exempt from registration only to qualified institutional buyers or in a public offering registered under the Securities Act of 1933. These securities have been deemed liquid under guidelines approved by the Trust’s Board of Trustees. At December 31, 2007, the value of this security was $6,193,890, representing 0.84% of net assets.
cSee Note 1(c) regarding joint repurchase agreement.
dThe security is traded on a discount basis with no stated coupon rate.
The accompanying notes are an integral part of these financial statements.
FLG-11
Franklin Templeton Variable Insurance Products Trust
Financial Statements
Statement of Assets and Liabilities
December 31, 2007
| | | |
| | | Franklin
Large Cap Growth
Securities Fund |
Assets: | | | |
Investments in securities: | | | |
Cost - Unaffiliated issuers | | $ | 610,543,388 |
Cost - Repurchase agreements | | | 25,299,895 |
| | | |
Total cost of investments | | $ | 635,843,283 |
| | | |
Value - Unaffiliated issuers | | $ | 706,864,851 |
Value - Repurchase agreements | | | 25,299,895 |
| | | |
Total value of investments | | | 732,164,746 |
Receivables: | | | |
Investment securities sold | | | 7,304,083 |
Capital shares sold | | | 2,344,042 |
Dividends | | | 613,014 |
| | | |
Total assets | | | 742,425,885 |
| | | |
Liabilities: | | | |
Payables: | | | |
Investment securities purchased | | | 1,951,200 |
Capital shares redeemed | | | 352,450 |
Affiliates | | | 725,902 |
Accrued expenses and other liabilities | | | 124,852 |
| | | |
Total liabilities | | | 3,154,404 |
| | | |
Net assets, at value | | $ | 739,271,481 |
| | | |
Net assets consist of: | | | |
Paid-in capital | | $ | 599,863,428 |
Undistributed net investment income | | | 7,959,580 |
Net unrealized appreciation (depreciation) | | | 96,321,463 |
Accumulated net realized gain (loss) | | | 35,127,010 |
| | | |
Net assets, at value | | $ | 739,271,481 |
| | | |
Class 1: | | | |
Net assets, at value | | $ | 96,920,172 |
| | | |
Shares outstanding | | | 5,536,480 |
| | | |
Net asset value and maximum offering price per share | | $ | 17.51 |
| | | |
Class 2: | | | |
Net assets, at value | | $ | 642,351,309 |
| | | |
Shares outstanding | | | 37,239,493 |
| | | |
Net asset value and maximum offering price per share | | $ | 17.25 |
| | | |
The accompanying notes are an integral part of these financial statements.
FLG-12
Franklin Templeton Variable Insurance Products Trust
Financial Statements (continued)
Statement of Operations
for the year ended December 31, 2007
| | | | |
| | | Franklin
Large Cap Growth
Securities Fund | |
Investment income: | | | | |
Dividends | | $ | 13,312,458 | |
Interest | | | 2,070,216 | |
| | | | |
Total investment income | | | 15,382,674 | |
| | | | |
Expenses: | | | | |
Management fees (Note 3a) | | | 5,578,293 | |
Distribution fees - Class 2 (Note 3c) | | | 1,707,675 | |
Unaffiliated transfer agent fees | | | 8,655 | |
Custodian fees (Note 4) | | | 14,101 | |
Reports to shareholders | | | 159,476 | |
Professional fees | | | 43,463 | |
Trustees’ fees and expenses | | | 3,394 | |
Other | | | 20,418 | |
| | | | |
Total expenses | | | 7,535,475 | |
Expense reductions (Note 4) | | | (26 | ) |
| | | | |
Net expenses | | | 7,535,449 | |
| | | | |
Net investment income | | | 7,847,225 | |
| | | | |
Realized and unrealized gains (losses): | | | | |
Net realized gain (loss) from: | | | | |
Investments | | | 40,263,259 | |
Foreign currency transactions | | | 112,429 | |
| | | | |
Net realized gain (loss) | | | 40,375,688 | |
| | | | |
Net change in unrealized appreciation (depreciation) on investments | | | 615,536 | |
| | | | |
Net realized and unrealized gain (loss) | | | 40,991,224 | |
| | | | |
Net increase (decrease) in net assets resulting from operations | | $ | 48,838,449 | |
| | | | |
The accompanying notes are an integral part of these financial statements.
FLG-13
Franklin Templeton Variable Insurance Products Trust
Financial Statements (continued)
Statements of Changes in Net Assets
| | | | | | | | |
| | | Franklin Large Cap Growth
Securities Fund | |
| | | Year Ended December 31, | |
| | | 2007 | | | 2006 | |
| | | | |
Increase (decrease) in net assets: | | | | | | | | |
Operations: | | | | | | | | |
Net investment income | | $ | 7,847,225 | | | $ | 6,201,102 | |
Net realized gain (loss) from investments and foreign currency transactions | | | 40,375,688 | | | | 24,109,842 | |
Net change in unrealized appreciation (depreciation) on investments | | | 615,536 | | | | 42,521,575 | |
| | | | |
Net increase (decrease) in net assets resulting from operations | | | 48,838,449 | | | | 72,832,519 | |
| | | | |
Distributions to shareholders from: | | | | | | | | |
Net investment income: | | | | | | | | |
Class 1 | | | (1,011,747 | ) | | | (1,153,417 | ) |
Class 2 | | | (5,183,286 | ) | | | (4,179,415 | ) |
Net realized gains: | | | | | | | | |
Class 1 | | | (783,904 | ) | | | — | |
Class 2 | | | (5,103,109 | ) | | | — | |
| | | | |
Total distributions to shareholders | | | (12,082,046 | ) | | | (5,332,832 | ) |
| | | | |
Capital share transactions: (Note 2) | | | | | | | | |
Class 1 | | | (23,683,527 | ) | | | (32,948,351 | ) |
Class 2 | | | (25,322,436 | ) | | | 70,110,920 | |
| | | | |
Total capital share transactions | | | (49,005,963 | ) | | | 37,162,569 | |
| | | | |
Net increase (decrease) in net assets | | | (12,249,560 | ) | | | 104,662,256 | |
Net assets: | | | | | | | | |
Beginning of year | | | 751,521,041 | | | | 646,858,785 | |
| | | | |
End of year | | $ | 739,271,481 | | | $ | 751,521,041 | |
| | | | |
Undistributed net investment income included in net assets: | | | | | | | | |
End of year | | $ | 7,959,580 | | | $ | 6,194,160 | |
| | | | |
The accompanying notes are an integral part of these financial statements.
FLG-14
Franklin Templeton Variable Insurance Products Trust
Notes to Financial Statements
Franklin Large Cap Growth Securities Fund
1. ORGANIZATION AND SIGNIFICANT ACCOUNTING POLICIES
Franklin Templeton Variable Insurance Products Trust (Trust) is registered under the Investment Company Act of 1940, as amended, (1940 Act) as an open-end investment company, consisting of twenty-three separate funds. The Franklin Large Cap Growth Securities Fund (Fund) included in this report is diversified. The financial statements of the remaining funds in the Trust are presented separately. Shares of the Fund are sold only to insurance company separate accounts to fund the benefits of variable life insurance policies or variable annuity contracts. The Fund offers two classes of shares: Class 1 and Class 2. Each class of shares differs by its distribution fees, voting rights on matters affecting a single class and its exchange privilege.
The following summarizes the Fund’s significant accounting policies.
a. Security Valuation
Securities listed on a securities exchange or on the NASDAQ National Market System are valued at the last quoted sale price or the official closing price of the day, respectively. Over-the-counter securities and listed securities for which there is no reported sale are valued within the range of the most recent quoted bid and ask prices. Securities that trade in multiple markets or on multiple exchanges are valued according to the broadest and most representative market.
Foreign securities are valued as of the close of trading on the foreign stock exchange on which the security is primarily traded, or the NYSE, whichever is earlier. If no sale is reported at that time, the foreign security will be valued within the range of the most recent quoted bid and ask prices. The value is then converted into its U.S. dollar equivalent at the foreign exchange rate in effect at the close of the NYSE on the day that the value of the foreign security is determined.
The Trust has procedures to determine the fair value of individual securities and other assets for which market prices are not readily available or which may not be reliably priced. Methods for valuing these securities may include: fundamental analysis, matrix pricing, discounts from market prices of similar securities, or discounts applied due to the nature and duration of restrictions on the disposition of the securities. Due to the inherent uncertainty of valuations of such securities, the fair values may differ significantly from the values that would have been used had a ready market for such investments existed. Occasionally, events occur between the time at which trading in a security is completed and the close of the NYSE that might call into question the availability (including the reliability) of the value of a portfolio security held by the Fund. If such an event occurs, the securities may be valued using fair value procedures, which may include the use of independent pricing services. All security valuation procedures are approved by the Trust’s Board of Trustees.
b. Foreign Currency Translation
Portfolio securities and other assets and liabilities denominated in foreign currencies are translated into U.S. dollars based on the exchange rate of such currencies against U.S. dollars on the date of valuation. Purchases and sales of securities, income and expense items denominated in foreign currencies are translated into U.S. dollars at the exchange rate in effect on the transaction date. Occasionally, events may impact the availability or reliability of foreign exchange rates used to convert the U.S. dollar equivalent value. If such an event occurs, the foreign exchange rate will be valued at fair value using procedures established and approved by the Trust’s Board of Trustees.
The Fund does not separately report the effect of changes in foreign exchange rates from changes in market prices on securities held. Such changes are included in net realized and unrealized gain or loss from investments on the Statement of Operations.
Realized foreign exchange gains or losses arise from sales of foreign currencies, currency gains or losses realized between the trade and settlement dates on securities transactions and the difference between the recorded amounts of dividends, interest, and foreign withholding taxes and the U.S. dollar equivalent of the amounts actually received or paid. Net unrealized foreign exchange gains and losses arise from changes in foreign exchange rates on foreign denominated assets and liabilities other than investments in securities held at the end of the reporting period.
FLG-15
Franklin Templeton Variable Insurance Products Trust
Notes to Financial Statements (continued)
Franklin Large Cap Growth Securities Fund
1. ORGANIZATION AND SIGNIFICANT ACCOUNTING POLICIES (continued)
c. Joint Repurchase Agreement
The Fund may enter into a joint repurchase agreement whereby its uninvested cash balance is deposited into a joint cash account with other funds managed by the investment manager or an affiliate of the investment manager and is used to invest in one or more repurchase agreements. The value and face amount of the joint repurchase agreement are allocated to the funds based on their pro-rata interest. A repurchase agreement is accounted for as a loan by the fund to the seller, collateralized by securities which are delivered to the fund’s custodian. The market value, including accrued interest, of the initial collateralization is required to be at least 102% of the dollar amount invested by the funds, with the value of the underlying securities marked to market daily to maintain coverage of at least 100%. The joint repurchase agreement held by the Fund at year end had been entered into on December 31, 2007. The joint repurchase agreement is valued at cost.
d. Foreign Currency Contracts
When the Fund purchases or sells foreign securities it may enter into foreign exchange contracts to minimize foreign exchange risk from the trade date to the settlement date of the transactions. A foreign exchange contract is an agreement between two parties to exchange different currencies at an agreed upon exchange rate at a future date. Realized and unrealized gains and losses on these contracts are included in the Statement of Operations.
The risks of these contracts include movement in the values of the foreign currencies relative to the U.S. dollar and the possible inability of the counterparties to fulfill their obligations under the contracts, which may be in excess of the amount reflected in the Statement of Assets and Liabilities.
e. Income Taxes
No provision has been made for U.S. income taxes because it is the Fund’s policy to qualify as a regulated investment company under the Internal Revenue Code and to distribute to shareholders substantially all of its taxable income and net realized gains.
f. Security Transactions, Investment Income, Expenses and Distributions
Security transactions are accounted for on trade date. Realized gains and losses on security transactions are determined on a specific identification basis. Interest income and estimated expenses are accrued daily. Dividend income is recorded on the ex-dividend date. Distributions to shareholders are recorded on the ex-dividend date and are determined according to income tax regulations (tax basis). Distributable earnings determined on a tax basis may differ from earnings recorded in accordance with accounting principles generally accepted in the United States of America. These differences may be permanent or temporary. Permanent differences are reclassified among capital accounts to reflect their tax character. These reclassifications have no impact on net assets or the results of operations. Temporary differences are not reclassified, as they may reverse in subsequent periods.
Common expenses incurred by the Trust are allocated among the funds based on the ratio of net assets of each fund to the combined net assets of the Trust. Fund specific expenses are charged directly to the fund that incurred the expense.
Realized and unrealized gains and losses and net investment income, other than class specific expenses, are allocated daily to each class of shares based upon the relative proportion of net assets of each class. Differences in per share distributions, by class, are generally due to differences in class specific expenses.
FLG-16
Franklin Templeton Variable Insurance Products Trust
Notes to Financial Statements (continued)
Franklin Large Cap Growth Securities Fund
1. ORGANIZATION AND SIGNIFICANT ACCOUNTING POLICIES (continued)
g. Accounting Estimates
The preparation of financial statements in accordance with accounting principles generally accepted in the United States of America requires management to make estimates and assumptions that affect the reported amounts of assets and liabilities at the date of the financial statements and the amounts of income and expenses during the reporting period. Actual results could differ from those estimates.
h. Guarantees and Indemnifications
Under the Trust’s organizational documents, its officers and trustees are indemnified by the Trust against certain liabilities arising out of the performance of their duties to the Trust. Additionally, in the normal course of business, the Trust, on behalf of the Fund, enters into contracts with service providers that contain general indemnification clauses. The Trust’s maximum exposure under these arrangements is unknown as this would involve future claims that may be made against the Trust that have not yet occurred. Currently, the Trust expects the risk of loss to be remote.
2. SHARES OF BENEFICIAL INTEREST
At December 31, 2007, there were an unlimited number of shares authorized (without par value). Transactions in the Fund’s shares were as follows:
| | | | | | | | | | | | | | |
| | | Year Ended December 31, | |
| | | 2007 | | | 2006 | |
| Class 1 Shares: | | Shares | | | Amount | | | Shares | | | Amount | |
Shares sold | | 49,014 | | | $ | 867,822 | | | 17,693 | | | $ | 273,194 | |
Shares issued in reinvestment of distributions | | 98,500 | | | | 1,795,651 | | | 77,724 | | | | 1,153,417 | |
Shares redeemed | | (1,491,144 | ) | | | (26,347,000 | ) | | (2,212,364 | ) | | | (34,374,962 | ) |
| | | | |
Net increase (decrease) | | (1,343,630 | ) | | $ | (23,683,527 | ) | | (2,116,947 | ) | | $ | (32,948,351 | ) |
| | | | |
| Class 2 Shares: | | | | | | | | | | | | |
Shares sold | | 4,957,506 | | | $ | 85,672,603 | | | 8,292,719 | | | $ | 126,608,893 | |
Shares issued in reinvestment of distributions | | 572,102 | | | | 10,286,395 | | | 285,284 | | | | 4,179,415 | |
Shares redeemed | | (6,934,030 | ) | | | (121,281,434 | ) | | (4,036,356 | ) | | | (60,677,388 | ) |
| | | | |
Net increase (decrease) | | (1,404,422 | ) | | $ | (25,322,436 | ) | | 4,541,647 | | | $ | 70,110,920 | |
| | | | |
3. TRANSACTIONS WITH AFFILIATES
Franklin Resources, Inc. is the holding company for various subsidiaries that together are referred to as Franklin Templeton Investments. Certain officers and trustees of the Trust are also officers and/or directors of the following subsidiaries:
| | |
| Subsidiary | | Affiliation |
Franklin Advisers, Inc. (Advisers) | | Investment manager |
Franklin Templeton Services, LLC (FT Services) | | Administrative manager |
Franklin Templeton Distributors, Inc. (Distributors) | | Principal underwriter |
Franklin Templeton Investor Services, LLC (Investor Services) | | Transfer agent |
FLG-17
Franklin Templeton Variable Insurance Products Trust
Notes to Financial Statements (continued)
Franklin Large Cap Growth Securities Fund
3. TRANSACTIONS WITH AFFILIATES (continued)
a. Management Fees
The Fund pays an investment management fee to Advisers based on the average daily net assets of the Fund as follows:
| | |
| Annualized Fee Rate | | Net Assets |
| 0.750% | | Up to and including $500 million |
| 0.625% | | Over $500 million, up to and including $1 billion |
| 0.500% | | In excess of $1 billion |
b. Administrative Fees
Under an agreement with Advisers, FT Services provides administrative services to the Fund. The fee is paid by Advisers based on average daily net assets, and is not an additional expense of the Fund
c. Distribution Fees
The Fund’s Board of Trustees has adopted a distribution plan for Class 2 shares pursuant to Rule 12b-1 under the 1940 Act. Under the Fund’s compensation distribution plan, the Fund pays Distributors for costs incurred in connection with the servicing, sale and distribution of the Fund’s shares up to 0.35% per year of its average daily net assets. The Board of Trustees has agreed to limit the current rate to 0.25% per year.
d. Transfer Agent Fees
Investor Services, under terms of an agreement, performs shareholder servicing for the Fund and is not paid by the Fund for the services.
4. EXPENSE OFFSET ARRANGEMENT
The Fund has entered into an arrangement with its custodian whereby credits realized as a result of uninvested cash balances are used to reduce a portion of the Fund’s custodian expenses. During the year ended December 31, 2007, the custodian fees were reduced as noted in the Statement of Operations.
5. INCOME TAXES
The Fund has reviewed the tax positions taken on federal income tax returns, for each of the three open tax years and as of December 31, 2007 and has determined that no provision for income tax is required in the Fund’s financial statements.
For tax purposes, realized capital losses occurring subsequent to October 31, may be deferred and treated as occurring on the first day of the following fiscal year. At December 31, 2007, the Fund deferred realized capital losses of $1,528,312.
The tax character of distributions paid during the years ended December 31, 2007 and 2006, was as follows:
| | | | | | |
| | | 2007 | | 2006 |
Distributions paid from: | | | | | | |
Ordinary income | | $ | 6,195,033 | | $ | 5,332,832 |
Long term capital gain | | | 5,887,013 | | | — |
| | | |
| | $ | 12,082,046 | | $ | 5,332,832 |
| | | |
FLG-18
Franklin Templeton Variable Insurance Products Trust
Notes to Financial Statements (continued)
Franklin Large Cap Growth Securities Fund
5. INCOME TAXES (continued)
At December 31, 2007, the cost of investments, net unrealized appreciation (depreciation), undistributed ordinary income and undistributed long term capital gains for income tax purposes were as follows:
| | | | |
Cost of investments | | $ | 637,079,004 | |
| | | | |
| |
Unrealized appreciation | | $ | 133,996,459 | |
Unrealized depreciation | | | (38,910,717 | ) |
| | | | |
Net unrealized appreciation (depreciation) | | $ | 95,085,742 | |
| | | | |
Undistributed ordinary income | | $ | 21,671,793 | |
Undistributed long term capital gains | | | 24,178,830 | |
| | | | |
Distributable earnings | | $ | 45,850,623 | |
| | | | |
Net investment income differs for financial statement and tax purposes primarily due to differing treatment of foreign currency transactions.
Net realized gains (losses) differ for financial statement and tax purposes primarily due to differing treatments of wash sales and foreign currency transactions.
6. INVESTMENT TRANSACTIONS
Purchases and sales of investments (excluding short term securities) for the year ended December 31, 2007, aggregated $379,037,703 and $432,793,575, respectively.
7. REGULATORY AND LITIGATION MATTERS
As part of various investigations by a number of federal, state, and foreign regulators and governmental entities, including the Securities and Exchange Commission (“SEC”), relating to certain practices in the mutual fund industry, including late trading, market timing and marketing support payments to securities dealers who sell fund shares (“marketing support”), Franklin Resources, Inc. and certain of its subsidiaries (collectively, the “Company”), entered into settlements with certain of those regulators and governmental entities. Specifically, the Company entered into settlements with the SEC, among others, concerning market timing and marketing support.
On June 6, 2007, the SEC posted for public comment the proposed plan of distribution for the market timing settlement. Once the SEC approves the final plan of distribution, disbursements of settlement monies will be made promptly to individuals who were shareholders of the designated funds during the relevant period, in accordance with the terms and conditions of the settlement and plan.
In addition, the Company, as well as most of the mutual funds within Franklin Templeton Investments and certain current or former officers, Company directors, fund directors, and employees, have been named in private lawsuits (styled as shareholder class actions, or as derivative actions on behalf of either the named funds or Franklin Resources, Inc.). The lawsuits relate to the industry practices referenced above.
The Company and fund management believe that the claims made in each of the private lawsuits referenced above are without merit and intend to defend against them vigorously. The Company cannot predict with certainty the eventual outcome of these lawsuits, nor whether they will have a material negative impact on the Company. If it is determined that the Company bears responsibility for any unlawful or inappropriate conduct that caused losses to the Fund, it is committed to making the Trust or its shareholders whole, as appropriate.
FLG-19
Franklin Templeton Variable Insurance Products Trust
Notes to Financial Statements (continued)
Franklin Large Cap Growth Securities Fund
8. NEW ACCOUNTING PRONOUNCEMENT
In September 2006, the Financial Accounting Standards Board (FASB) issued FASB Statement No. 157, “Fair Value Measurement” (SFAS 157), which defines fair value, establishes a framework for measuring fair value, and expands disclosures about fair value measurements. SFAS 157 is effective for fiscal years beginning after November 15, 2007, and interim periods within those fiscal years. The Trust believes the adoption of SFAS 157 will have no material impact on its financial statements.
FLG-20
Franklin Templeton Variable Insurance Products Trust
Franklin Large Cap Growth Securities Fund
Report of Independent Registered Public Accounting Firm
To the Board of Trustees and Shareholders of
Franklin Templeton Variable Insurance Products Trust
In our opinion, the accompanying statement of assets and liabilities, including the statement of investments, and the related statements of operations and of changes in net assets and the financial highlights present fairly, in all material respects, the financial position of Franklin Large Cap Growth Securities Fund (one of the funds constituting Franklin Templeton Variable Insurance Products Trust, hereafter referred to as the “Fund”) at December 31, 2007, the results of its operations for the year then ended, the changes in its net assets for each of the two years in the period then ended and the financial highlights for each of the five years in the period then ended, in conformity with accounting principles generally accepted in the United States of America. These financial statements and financial highlights (hereafter referred to as “financial statements”) are the responsibility of the Fund’s management. Our responsibility is to express an opinion on these financial statements based on our audits. We conducted our audits of these financial statements in accordance with the standards of the Public Company Accounting Oversight Board (United States). Those standards require that we plan and perform the audit to obtain reasonable assurance about whether the financial statements are free of material misstatement. An audit includes examining, on a test basis, evidence supporting the amounts and disclosures in the financial statements, assessing the accounting principles used and significant estimates made by management, and evaluating the overall financial statement presentation. We believe that our audits, which included confirmation of securities at December 31, 2007 by correspondence with the custodian and brokers, provide a reasonable basis for our opinion.
PricewaterhouseCoopers LLP
San Francisco, California
February 14, 2008
FLG-21
Franklin Templeton Variable Insurance Products Trust
Tax Designation (unaudited)
Franklin Large Cap Growth Securities Fund
Under Section 852(b)(3)(C) of the Internal Revenue Code (Code), the Fund designates the maximum amount allowable but no less than $24,183,048 as a long term capital gain dividend for the fiscal year ended December 31, 2007.
Under Section 854(b)(2) of the Code, the Fund designates 100% of the ordinary income dividends as income qualifying for the dividends received deduction for the fiscal year ended December 31, 2007.
FLG-22
FRANKLIN MONEY MARKET FUND
Fund Goal and Main Investments: Franklin Money Market Fund seeks high current income, consistent with liquidity and capital preservation. The Fund invests exclusively in U.S. dollar denominated money market debt instruments. The Fund seeks to maintain a stable share price of $1.00, but there is no guarantee that it will be able to do so.
We are pleased to bring you Franklin Money Market Fund’s annual report for the fiscal year ended December 31, 2007.
Economic and Market Overview
The U.S. economy grew at a moderate but uneven pace for the year ended December 31, 2007. After starting 2007 with first quarter gross domestic product (GDP) growth of 0.6% annualized, the economy accelerated to a strong second quarter growth rate of 3.8% annualized, fueled by a surge in exports. In the third quarter, GDP growth advanced at a 4.9% annualized rate, the fastest pace in four years. For most of the reporting period, consumer spending and personal income supported economic expansion, but signs of a slowing economy became evident as a number of indicators reflected a housing market correction, financial market strains and softening business and consumer spending, as well as upward inflation pressures from increasing food, energy and commodity prices and a weaker dollar. In the fourth quarter, GDP growth slowed to an estimated 0.6% annualized rate.
Oil prices exhibited continued volatility, reaching a historical high in November. Core inflation, which excludes food and energy costs, rose modestly for the year, signaling that inflation risk remains. For December 2007, core inflation had a 12-month increase of 2.4%.1 The Federal Reserve Board’s (Fed’s) preferred measure of inflation, the core personal consumption expenditures price index, reported a 12-month increase of 2.2%.2
As investor uncertainty continued in the latter half of 2007, the Fed remained committed to act in an effort to restore normalcy to U.S. financial markets. The Fed cut the discount rate (the Fed’s interest rate charged to member banks) four times, bringing the rate to 4.75%. It also lowered the federal funds target rate three times. Minutes released from its December meeting, in which the Fed lowered the federal funds target rate to 4.25%, cited an uncertain outlook for economic growth and inflation and the need for the committee to be “exceptionally alert to economic and financial developments.”
1. Source: Bureau of Labor Statistics.
2. Source: Bureau of Economic Analysis.
An investment in the Fund is neither insured nor guaranteed by the U.S. government or by any other entity or institution. There is no assurance the $1.00 share price will be maintained and it is possible to lose money by investing in the Fund. The Fund’s prospectus also includes a description of the main investment risks.
FM-1
Over the period, investors sought relative safety in short-term U.S. Treasuries, Treasury yields declined and the yield curve steepened. Short-term, two- and five-year yields declined significantly, with the two-year bill yielding 3.05% at the end of December, down from 4.82% a year earlier. The 10-year U.S. Treasury note ended December yielding 4.04%, compared with 4.71% at the beginning of the period.
Investment Strategy
In selecting investments, we use a conservative investment approach, focusing on the highest-quality eligible money market securities. We assess the relative value of each security meeting our credit criteria to find the best combination of assets we believe will maximize the Fund’s yield relative to our expectations of the investment environment. We monitor short-term interest rates, economic conditions, and Federal Reserve Board monetary policy to determine the portfolio maturity we believe will provide high overall return.
Manager’s Discussion
Consistent with our strategy, we continued to invest mainly in high-quality money market securities. For example, on December 31, 2007, 100% of the portfolio was invested in securities with a short-term credit rating of A-1 or P-1, or higher, by independent credit rating agency Standard & Poor’s or Moody’s Investors Service.3
Thank you for your participation in Franklin Money Market Fund. We look forward to serving your future investment needs.
3. These do not indicate ratings of the Fund.
The foregoing information reflects our analysis, opinions and portfolio holdings as of December 31, 2007, the end of the reporting period. The way we implement our main investment strategies and the resulting portfolio holdings may change depending on factors such as market and economic conditions. These opinions may not be relied upon as investment advice or an offer for a particular security. The information is not a complete analysis of every aspect of any market, country, industry, security or the Fund. Statements of fact are from sources considered reliable, but the investment manager makes no representation or warranty as to their completeness or accuracy. Although historical performance is no guarantee of future results, these insights may help you understand our investment management philosophy.
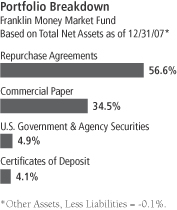
The dollar value, number of shares or principal amount, and names of all portfolio holdings are listed in the Fund’s Statement of Investments.
FM-2
Fund Expenses
As an investor in a variable insurance contract (Contract) that indirectly provides for investment in an underlying mutual fund, you can incur transaction and/or ongoing expenses at both the Fund level and the Contract level.
| • | | Transaction expenses can include sales charges (loads) on purchases, redemption fees, surrender fees, transfer fees and premium taxes. |
| • | | Ongoing expenses can include management fees, distribution and service (12b-1) fees, contract fees, annual maintenance fees, mortality and expense risk fees and other fees and expenses. All mutual funds and Contracts have some types of ongoing expenses. |
The expenses shown in the table are meant to highlight ongoing expenses at the Fund level only and do not include ongoing expenses at the Contract level, or transaction expenses at either the Fund or Contract level. While the Fund does not have transaction expenses, if the transaction and ongoing expenses at the Contract level were included, the expenses shown would be higher. You should consult your Contract prospectus or disclosure document for more information.
The table shows Fund-level ongoing expenses and can help you understand these expenses and compare them with those of other mutual funds offered through the Contract. The table assumes a $1,000 investment held for the six months indicated. Please refer to the Fund prospectus for additional information on operating expenses.
Actual Fund Expenses
The first line (Actual) of the table provides actual account values and expenses. The “Ending Account Value” is derived from the Fund’s actual return, which includes the effect of ongoing Fund expenses, but does not include the effect of ongoing Contract expenses.
You can estimate the Fund-level expenses you incurred during the period by following these steps. Of course, your account value and expenses will differ from those in this illustration:
| 1. | Divide your account value by $1,000. |
If an account had an $8,600 value, then $8,600 ÷ $1,000 = 8.6.
| 2. | Multiply the result by the number under the heading “Fund-Level Expenses Incurred During Period.” |
If Fund-Level Expenses Incurred During Period were $7.50, then 8.6 x $7.50 = $64.50.
In this illustration, the estimated expenses incurred this period at the Fund level are $64.50.
Franklin Money Market Fund – Class 1
FM-3
Hypothetical Example for Comparison with Other Mutual Funds
Information in the second line (Hypothetical) of the table can help you compare ongoing expenses of the Fund with those of other mutual funds offered through the Contract. This information may not be used to estimate the actual ending account balance or expenses you incurred during the period. The hypothetical “Ending Account Value” is based on the Fund’s actual expense ratio and an assumed 5% annual rate of return before expenses, which does not represent the Fund’s actual return. The figure under the heading “Fund-Level Expenses Incurred During Period” shows the hypothetical expenses your account would have incurred under this scenario. You can compare this figure with the 5% hypothetical examples that appear in shareholder reports of other funds offered through a Contract.
| | | | | | | | | |
| Class 1 | | Beginning
Account
Value 7/1/07 | | Ending
Account
Value 12/31/07 | | Fund-Level
Expenses Incurred
During Period*
7/1/07–12/31/07 |
Actual | | $ | 1,000 | | $ | 1,022.10 | | $ | 3.57 |
Hypothetical (5% return before expenses) | | $ | 1,000 | | $ | 1,021.68 | | $ | 3.57 |
*Expenses are calculated using the most recent six-month annualized expense ratio for the Fund’s Class 1 shares (0.70%), which does not include any ongoing expenses of the Contract for which the Fund is an investment option, multiplied by the average account value over the period, multiplied by 184/365 to reflect the one-half year period.
FM-4
Franklin Templeton Variable Insurance Products Trust
Financial Highlights
Franklin Money Market Fund
| | | | | | | | | | | | | | | | | | | | |
| | | Year Ended December 31, | |
| Class 1 | | 2007 | | | 2006 | | | 2005 | | | 2004 | | | 2003 | |
| | | | |
Per share operating performance | | | | | | | | | | | | | | | | | | | | |
(for a share outstanding throughout the year) | | | | | | | | | | | | | | | | | | | | |
Net asset value, beginning of year | | $ | 1.00 | | | $ | 1.00 | | | $ | 1.00 | | | $ | 1.00 | | | $ | 1.00 | |
| | | | |
Income from investment operations - net investment income | | | 0.044 | | | | 0.043 | | | | 0.025 | | | | 0.007 | | | | 0.005 | |
Less distributions from net investment income | | | (0.044 | ) | | | (0.043 | ) | | | (0.025 | ) | | | (0.007 | ) | | | (0.005 | ) |
| | | | |
Net asset value, end of year | | $ | 1.00 | | | $ | 1.00 | | | $ | 1.00 | | | $ | 1.00 | | | $ | 1.00 | |
| | | | |
| | | | | |
Total returna | | | 4.52% | | | | 4.38% | | | | 2.55% | | | | 0.73% | | | | 0.52% | |
Ratios to average net assets | | | | | | | | | | | | | | | | | | | | |
Expenses | | | 0.73% | b | | | 0.75% | b | | | 0.70% | b | | | 0.68% | | | | 0.66% | |
Net investment income | | | 4.43% | | | | 4.25% | | | | 2.48% | | | | 0.67% | | | | 0.56% | |
| | | | | |
Supplemental data | | | | | | | | | | | | | | | | | | | | |
Net assets, end of year (000’s) | | $ | 35,775 | | | $ | 39,198 | | | $ | 46,750 | | | $ | 59,026 | | | $ | 81,734 | |
a Total return does not include any fees, charges or expenses imposed by the variable annuity and life insurance contracts for which the Franklin Templeton Variable Insurance Products Trust serves as an underlying investment vehicle.
b Benefit of expense reduction rounds to less than 0.01%.
The accompanying notes are an integral part of these financial statements.
FM-5
Franklin Templeton Variable Insurance Products Trust
Financial Highlights (continued)
Franklin Money Market Fund
| | | | | | | | | | | | | | | | | | | | |
| | | Year Ended December 31, | |
| Class 2 | | 2007 | | | 2006 | | | 2005 | | | 2004 | | | 2003 | |
| | | | |
Per share operating performance | | | | | | | | | | | | | | | | | | | | |
(for a share outstanding throughout the year) | | | | | | | | | | | | | | | | | | | | |
Net asset value, beginning of year | | $ | 1.00 | | | $ | 1.00 | | | $ | 1.00 | | | $ | 1.00 | | | $ | 1.00 | |
| | | | |
Income from investment operations - net investment income | | | 0.042 | | | | 0.040 | | | | 0.023 | | | | 0.004 | | | | 0.003 | |
Less distributions from net investment income | | | (0.042 | ) | | | (0.040 | ) | | | (0.023 | ) | | | (0.004 | ) | | | (0.003 | ) |
| | | | |
Net asset value, end of year | | $ | 1.00 | | | $ | 1.00 | | | $ | 1.00 | | | $ | 1.00 | | | $ | 1.00 | |
| | | | |
| | | | | |
Total returna | | | 4.26% | | | | 4.12% | | | | 2.29% | | | | 0.44% | | | | 0.27% | |
Ratios to average net assets | | | | | | | | | | | | | | | | | | | | |
Expenses | | | 0.98% | b | | | 1.00% | b | | | 0.95% | b | | | 0.93% | | | | 0.91% | |
Net investment income | | | 4.18% | | | | 4.00% | | | | 2.23% | | | | 0.42% | | | | 0.31% | |
| | | | | |
Supplemental data | | | | | | | | | | | | | | | | | | | | |
Net assets, end of year (000’s) | | $ | 873 | | | $ | 1,057 | | | $ | 962 | | | $ | 887 | | | $ | 590 | |
a Total return does not include any fees, charges or expenses imposed by the variable annuity and life insurance contracts for which the Franklin Templeton Variable Insurance Products Trust serves as an underlying investment vehicle.
b Benefit of expense reduction rounds to less than 0.01%.
The accompanying notes are an integral part of these financial statements.
FM-6
Franklin Templeton Variable Insurance Products Trust
Statement of Investments, December 31, 2007
| | | | | | |
| Franklin Money Market Fund | | Principal
Amount | | Value |
Investments 100.1% | | | | | | |
Certificates of Deposit 4.1% | | | | | | |
Abbey National Treasury Service, Stamford Branch, 4.86%, 1/23/08 | | $ | 500,000 | | $ | 500,002 |
Bank of Scotland, New York Branch, 4.93%, 1/28/08 | | | 500,000 | | | 500,029 |
Royal Bank of Canada, New York Branch, 5.06%, 1/15/08 | | | 250,000 | | | 250,001 |
Royal Bank of Scotland NY, New York Branch, 4.80%, 2/04/08 | | | 250,000 | | | 250,000 |
| | | | | | |
Total Certificates of Deposit (Cost $1,500,032) | | | | | | 1,500,032 |
| | | | | | |
aCommercial Paper 34.5% | | | | | | |
AIG Funding Inc., 1/08/08 | | | 500,000 | | | 499,547 |
Barclays U.S. Funding Corp., 1/09/08 | | | 550,000 | | | 549,412 |
Barclays U.S. Funding Corp., 1/15/08 - 2/05/08 | | | 700,000 | | | 698,220 |
Commonwealth Bank of Australia, 1/16/08 - 4/07/08 | | | 1,050,000 | | | 1,040,240 |
Commonwealth Bank of Australia, 2/21/08 | | | 500,000 | | | 496,504 |
Cregem North America Inc., 1/11/08 | | | 500,000 | | | 499,306 |
Export Development Corp., 1/22/08 | | | 500,000 | | | 498,492 |
General Electric Capital Corp., 1/15/08 - 1/25/08 | | | 457,000 | | | 455,713 |
Goldman Sachs Group Inc., 1/07/08 | | | 500,000 | | | 499,563 |
Goldman Sachs Group Inc., 1/30/08 | | | 250,000 | | | 249,029 |
Rabobank USA Finance Corp., 1/03/08 | | | 500,000 | | | 499,848 |
Royal Bank of Scotland Group PLC, 1/09/08 | | | 525,000 | | | 524,421 |
Royal Bank of Scotland Group PLC, 1/11/08 | | | 250,000 | | | 249,651 |
Royal Bank of Scotland Group PLC, 1/28/08 | | | 500,000 | | | 498,155 |
Societe Generale North America, 1/04/08 - 2/01/08 | | | 1,700,000 | | | 1,695,837 |
Svenska Handelsbanken Inc., 1/28/08 | | | 250,000 | | | 249,098 |
Svenska Handelsbanken Inc., 2/08/08 | | | 425,000 | | | 422,791 |
Toyota Motor Credit Corp., 1/24/08 - 4/02/08 | | | 1,500,000 | | | 1,488,663 |
UBS AG Finance Delaware Inc., 1/02/08 | | | 850,000 | | | 847,217 |
UBS AG Finance Delaware Inc., 2/19/08 | | | 675,000 | | | 673,788 |
| | | | | | |
Total Commercial Paper (Cost $12,635,495) | | | | | | 12,635,495 |
| | | | | | |
U.S. Government and Agency Securities 4.9% | | | | | | |
aFHLB,
1/10/08 | | | 400,000 | | | 399,570 |
1/22/08 | | | 500,000 | | | 498,614 |
2/11/08 | | | 300,000 | | | 298,305 |
aFNMA,
1/03/08 | | | 110,000 | | | 109,970 |
1/07/08 | | | 500,000 | | | 499,645 |
| | | | | | |
Total U.S. Government and Agency Securities (Cost $1,806,104) | | | | | | 1,806,104 |
| | | | | | |
Total Investments before Repurchase Agreements (Cost $15,941,631) | | | | | | 15,941,631 |
| | | | | | |
FM-7
Franklin Templeton Variable Insurance Products Trust
Statement of Investments, December 31, 2007 (continued)
| | | | | | | |
| Franklin Money Market Fund | | Principal
Amount | | Value | |
Investments (continued) | | | | | | | |
bRepurchase Agreements 56.6% | | | | | | | |
ABN AMRO Bank NV, 3.00%, 1/02/08 (Maturity Value $13,752,292)
Collateralized by U.S. Government Agency Securities, 3.875%, 7/15/08 | | $ | 13,750,000 | | $ | 13,750,000 | |
Nationsbanc Montgomery Securities, 4.10%, 1/02/08 (Maturity Value $7,001,594)
Collateralized by U.S. Government Agency Securities, 4.40%, 4/23/08 | | | 7,000,000 | | | 7,000,000 | |
| | | | | | | |
Total Repurchase Agreements (Cost $20,750,000) | | | | | | 20,750,000 | |
| | | | | | | |
Total Investments (Cost $36,691,631) 100.1% | | | | | | 36,691,631 | |
Other Assets, less Liabilities (0.1)% | | | | | | (43,798 | ) |
| | | | | | | |
Net Assets 100.0% | | | | | $ | 36,647,833 | |
| | | | | | | |
Selected Portfolio Abbreviations
FHLB - Federal Home Loan Bank
FNMA - Federal National Mortgage Association
a The security is traded on a discount basis with no stated coupon rate.
b See Note 1(b) regarding repurchase agreements.
The accompanying notes are an integral part of these financial statements.
FM-8
Franklin Templeton Variable Insurance Products Trust
Financial Statements
Statement of Assets and Liabilities
December 31, 2007
| | | | |
| | | Franklin
Money
Market Fund | |
Assets: | | | | |
Investments in securities, at amortized cost | | $ | 15,941,631 | |
Repurchase agreements, at value and cost | | | 20,750,000 | |
| | | | |
Total investments | | $ | 36,691,631 | |
Cash | | | 5,964 | |
Receivables: | | | | |
Interest | | | 16,229 | |
| | | | |
Total assets | | | 36,713,824 | |
| | | | |
Liabilities: | | | | |
Payables: | | | | |
Capital shares redeemed | | | 12,642 | |
Affiliates | | | 23,263 | |
Reports to shareholders | | | 10,761 | |
Professional fees | | | 18,071 | |
Accrued expenses and other liabilities | | | 1,254 | |
| | | | |
Total liabilities | | | 65,991 | |
| | | | |
Net assets, at value | | $ | 36,647,833 | |
| | | | |
Net assets consist of: | | | | |
Paid-in capital | | $ | 36,648,557 | |
Accumulated net realized gain (loss) | | | (724 | ) |
| | | | |
Net assets, at value | | $ | 36,647,833 | |
| | | | |
Class 1: | | | | |
Net assets, at value | | $ | 35,775,314 | |
| | | | |
Shares outstanding | | | 35,782,994 | |
| | | | |
Net asset value per share | | $ | 1.00 | |
| | | | |
Class 2: | | | | |
Net assets, at value | | $ | 872,519 | |
| | | | |
Shares outstanding | | | 872,697 | |
| | | | |
Net asset value per share | | $ | 1.00 | |
| | | | |
The accompanying notes are an integral part of these financial statements.
FM-9
Franklin Templeton Variable Insurance Products Trust
Financial Statements (continued)
Statement of Operations
for the year ended December 31, 2007
| | | | |
| | | Franklin
Money
Market Fund | |
Investment income: | | | | |
Interest | | $ | 2,372,888 | |
| | | | |
Expenses: | | | | |
Management fees (Note 3a) | | | 287,714 | |
Distribution fees - Class 2 (Note 3c) | | | 2,261 | |
Unaffiliated transfer agent fees | | | 768 | |
Custodian fees (Note 4) | | | 404 | |
Reports to shareholders | | | 21,757 | |
Professional fees | | | 18,661 | |
Trustees’ fees and expenses | | | 192 | |
Other | | | 5,037 | |
| | | | |
Total expenses | | | 336,794 | |
Expense reductions (Note 4) | | | (221 | ) |
| | | | |
Net expenses | | | 336,573 | |
| | | | |
Net investment income | | | 2,036,315 | |
| | | | |
Net increase (decrease) in net assets resulting from operations | | $ | 2,036,315 | |
| | | | |
The accompanying notes are an integral part of these financial statements.
FM-10
Franklin Templeton Variable Insurance Products Trust
Financial Statements (continued)
Statements of Changes in Net Assets
| | | | | | | | |
| | | Franklin Money
Market Fund | |
| | | Year Ended December 31, | |
| | | 2007 | | | 2006 | |
| | | | |
Increase (decrease) in net assets: | | | | | | | | |
Net investment income from operations | | $ | 2,036,315 | | | $ | 1,850,584 | |
| | | | |
Distributions to shareholders from: | | | | | | | | |
Net investment income: | | | | | | | | |
Class 1 | | | (1,998,505 | ) | | | (1,818,412 | ) |
Class 2 | | | (37,810 | ) | | | (40,030 | ) |
| | | | |
Total distributions to shareholders | | | (2,036,315 | ) | | | (1,858,442 | ) |
| | | | |
Capital share transactions: (Note 2) | | | | | | | | |
Class 1 | | | (3,422,676 | ) | | | (7,544,700 | ) |
Class 2 | | | (184,270 | ) | | | 95,467 | |
| | | | |
Total capital share transactions | | | (3,606,946 | ) | | | (7,449,233 | ) |
| | | | |
Net increase (decrease) in net assets | | | (3,606,946 | ) | | | (7,457,091 | ) |
Net assets (there is no undistributed net investment income at the beginning or end of year): | | | | | | | | |
Beginning of year | | | 40,254,779 | | | | 47,711,870 | |
| | | | |
End of year | | $ | 36,647,833 | | | $ | 40,254,779 | |
| | | | |
The accompanying notes are an integral part of these financial statements.
FM-11
Franklin Templeton Variable Insurance Products Trust
Notes to Financial Statements
Franklin Money Market Fund
1. ORGANIZATION AND SIGNIFICANT ACCOUNTING POLICIES
Franklin Templeton Variable Insurance Products Trust (Trust) is registered under the Investment Company Act of 1940, as amended, (1940 Act) as an open-end investment company, consisting of twenty-three separate funds. The Franklin Money Market Fund (Fund) included in this report is diversified. The financial statements of the remaining funds in the Trust are presented separately. Shares of the Fund are sold only to insurance company separate accounts to fund the benefits of variable life insurance policies or variable annuity contracts. As of December 31, 2007, 90.80% of the Fund’s shares were held through one insurance company. The Fund offers two classes of shares: Class 1 and Class 2. Each class of shares differs by its distribution fees, voting rights on matters affecting a single class and its exchange privilege.
The following summarizes the Fund’s significant accounting policies.
a. Security Valuation
Securities are valued at amortized cost which approximates market value. This method involves valuing an instrument at its cost and thereafter assuming a constant amortization to maturity of any discount or premium. All security valuation procedures are approved by the Trust’s Board of Trustees.
b. Repurchase Agreements
The Fund may enter into repurchase agreements, which are accounted for as a loan by the fund to the seller, collateralized by securities which are delivered to the fund’s custodian. The market value, including accrued interest, of the initial collateralization is required to be at least 102% of the dollar amount invested by the fund, with the value of the underlying securities marked to market daily to maintain coverage of at least 100%. All repurchase agreements held by the Fund at year end had been entered into on December 31, 2007. Repurchase agreements are valued at cost.
c. Income Taxes
No provision has been made for U.S. income taxes because it is the Fund’s policy to qualify as a regulated investment company under the Internal Revenue Code and to distribute to shareholders substantially all of its taxable income and net realized gains.
d. Security Transactions, Investment Income, Expenses and Distributions
Security transactions are accounted for on trade date. Realized gains and losses on security transactions are determined on a specific identification basis. Interest income and estimated expenses are accrued daily. Amortization of premium and accretion of discount on debt securities are included in interest income. Dividends from net investment income are normally declared daily and distributed monthly to shareholders. Distributions to shareholders are determined according to income tax regulations (tax basis). Distributable earnings determined on a tax basis may differ from earnings recorded in accordance with accounting principles generally accepted in the United States of America. These differences may be permanent or temporary. Permanent differences are reclassified among capital accounts to reflect their tax character. These reclassifications have no impact on net assets or the results of operations. Temporary differences are not reclassified, as they may reverse in subsequent periods.
Common expenses incurred by the Trust are allocated among the funds based on the ratio of net assets of each fund to the combined net assets of the Trust. Fund specific expenses are charged directly to the fund that incurred the expense.
Net investment income, other than class specific expenses, is allocated daily to each class of shares based upon the relative value of the settled shares of each class. Realized and unrealized gains and losses are allocated daily to each class of shares based upon the relative proportion of net assets of each class. Differences in per share distributions, by class, are generally due to differences in class specific expenses.
FM-12
Franklin Templeton Variable Insurance Products Trust
Notes to Financial Statements (continued)
Franklin Money Market Fund
1. ORGANIZATION AND SIGNIFICANT ACCOUNTING POLICIES (continued)
e. Accounting Estimates
The preparation of financial statements in accordance with accounting principles generally accepted in the United States of America requires management to make estimates and assumptions that affect the reported amounts of assets and liabilities at the date of the financial statements and the amounts of income and expenses during the reporting period. Actual results could differ from those estimates.
f. Guarantees and Indemnifications
Under the Trust’s organizational documents, its officers and trustees are indemnified by the Trust against certain liabilities arising out of the performance of their duties to the Trust. Additionally, in the normal course of business, the Trust, on behalf of the Fund, enters into contracts with service providers that contain general indemnification clauses. The Trust’s maximum exposure under these arrangements is unknown as this would involve future claims that may be made against the Trust that have not yet occurred. Currently, the Trust expects the risk of loss to be remote.
2. SHARES OF BENEFICIAL INTEREST
At December 31, 2007, there were an unlimited number of shares authorized (without par value). Transactions in the Fund’s shares at $1.00 per share were as follows:
| | | | | | | | |
| | | Year Ended December 31, | |
| | | 2007 | | | 2006 | |
| Class 1 Shares: | | | | | | |
Shares sold | | $ | 41,473,728 | | | $ | 2,821,194 | |
Shares issued in reinvestment of distributions | | | 1,997,072 | | | | 1,819,860 | |
Shares redeemed | | | (46,893,476 | ) | | | (12,185,754 | ) |
| | | | |
Net increase (decrease) | | $ | (3,422,676 | ) | | $ | (7,544,700 | ) |
| | | | |
| Class 2 Shares: | | | | | | |
Shares sold | | $ | 168,231 | | | $ | 200,141 | |
Shares issued in reinvestment of distributions | | | 37,754 | | | | 40,086 | |
Shares redeemed | | | (390,255 | ) | | | (144,760 | ) |
| | | | |
Net increase (decrease) | | $ | (184,270 | ) | | $ | 95,467 | |
| | | | |
3. TRANSACTIONS WITH AFFILIATES
Franklin Resources, Inc. is the holding company for various subsidiaries that together are referred to as Franklin Templeton Investments. Certain officers and trustees of the Trust are also officers and/or directors of the following subsidiaries:
| | |
| Subsidiary | | Affiliation |
Franklin Advisers, Inc. (Advisers) | | Investment manager |
Franklin Templeton Services, LLC (FT Services) | | Administrative manager |
Franklin Templeton Distributors, Inc. (Distributors) | | Principal underwriter |
Franklin Templeton Investor Services, LLC (Investor Services) | | Transfer agent |
FM-13
Franklin Templeton Variable Insurance Products Trust
Notes to Financial Statements (continued)
Franklin Money Market Fund
3. TRANSACTIONS WITH AFFILIATES (continued)
a. Management Fees
The Fund pays an investment management fee to Advisers based on the average daily net assets of the Fund as follows:
| | |
| Annualized Fee Rate | | Net Assets |
| 0.625% | | Up to and including $100 million |
| 0.500% | | Over $100 million, up to and including $250 million |
| 0.450% | | Over $250 million, up to and including $10 billion |
| 0.440% | | Over $10 billion, up to and including $12.5 billion |
| 0.420% | | Over $12.5 billion, up to and including $15 billion |
| 0.400% | | In excess of $15 billion |
Effective January 1, 2008, the Fund will pay fees based on the average daily net assets of the Fund as follows:
| | |
| Annualized Fee Rate | | Net Assets |
| 0.625% | | Up to and including $100 million |
| 0.500% | | Over $100 million, up to and including $250 million |
| 0.450% | | Over $250 million, up to and including $7.5 billion |
| 0.440% | | Over $7.5 billion, up to and including $10 billion |
| 0.430% | | Over $10 billion, up to and including $12.5 billion |
| 0.420% | | Over $12.5 billion, up to and including $15 billion |
| 0.400% | | In excess of $15 billion |
b. Administrative Fees
Under an agreement with Advisers, FT Services provides administrative services to the Fund. The fee is paid by Advisers based on average daily net assets, and is not an additional expense of the Fund.
c. Distribution Fees
The Fund’s Board of Trustees has adopted a distribution plan for Class 2 shares pursuant to Rule 12b-1 under the 1940 Act. Under the Fund’s compensation distribution plan, the Fund pays Distributors for costs incurred in connection with the servicing, sale and distribution of the Fund’s shares up to 0.35% per year of its average daily net assets. The board of Trustees has agreed to limit the current rate to 0.25% per year.
d. Transfer Agent Fees
Investor Services, under terms of an agreement, performs shareholder servicing for the Fund and is not paid by the Fund for the services.
4. EXPENSE OFFSET ARRANGEMENT
The Fund has entered into an arrangement with its custodian whereby credits realized as a result of uninvested cash balances are used to reduce a portion of the Fund’s custodian expenses. During the year ended December 31, 2007, the custodian fees were reduced as noted in the Statement of Operations.
FM-14
Franklin Templeton Variable Insurance Products Trust
Notes to Financial Statements (continued)
Franklin Money Market Fund
5. INCOME TAXES
The Fund has reviewed the tax positions taken on federal income tax returns, for each of the three open tax years and as of December 31, 2007 and has determined that no provision for income tax is required in the Fund’s financial statements.
For tax purposes, capital losses may be carried over to offset future capital gains, if any. At December 31, 2007, the capital loss carryforwards were as follows:
| | | |
Capital loss carryforwards expiring in: | | | |
2008 | | $ | 280 |
2010 | | | 444 |
| | | |
| | | $724 |
| | | |
The tax character of distributions paid during the years ended December 31, 2007 and 2006, was as follows:
| | | | | | |
| | | 2007 | | 2006 |
Distributions paid from ordinary income | | $ | 2,036,315 | | $ | 1,858,442 |
At December 31, 2007, the cost of investments and undistributed ordinary income for book and income tax purposes were the same.
6. REGULATORY AND LITIGATION MATTERS
As part of various investigations by a number of federal, state, and foreign regulators and governmental entities, including the Securities and Exchange Commission (“SEC”), relating to certain practices in the mutual fund industry, including late trading, market timing and marketing support payments to securities dealers who sell fund shares (“marketing support”), Franklin Resources, Inc. and certain of its subsidiaries (collectively, the “Company”), entered into settlements with certain of those regulators and governmental entities. Specifically, the Company entered into settlements with the SEC, among others, concerning market timing and marketing support.
On June 6, 2007, the SEC posted for public comment the proposed plan of distribution for the market timing settlement. Once the SEC approves the final plan of distribution, disbursements of settlement monies will be made promptly to individuals who were shareholders of the designated funds during the relevant period, in accordance with the terms and conditions of the settlement and plan.
In addition, the Company, as well as most of the mutual funds within Franklin Templeton Investments and certain current or former officers, Company directors, fund directors, and employees, have been named in private lawsuits (styled as shareholder class actions, or as derivative actions on behalf of either the named funds or Franklin Resources, Inc.). The lawsuits relate to the industry practices referenced above.
The Company and fund management believe that the claims made in each of the private lawsuits referenced above are without merit and intend to defend against them vigorously. The Company cannot predict with certainty the eventual outcome of these lawsuits, nor whether they will have a material negative impact on the Company. If it is determined that the Company bears responsibility for any unlawful or inappropriate conduct that caused losses to the Fund, it is committed to making the Trust or its shareholders whole, as appropriate.
FM-15
Franklin Templeton Variable Insurance Products Trust
Notes to Financial Statements (continued)
Franklin Money Market Fund
7. NEW ACCOUNTING PRONOUNCEMENT
In September 2006, the Financial Accounting Standards Board (FASB) issued FASB Statement No. 157, “Fair Value Measurement” (SFAS 157), which defines fair value, establishes a framework for measuring fair value, and expands disclosures about fair value measurements. SFAS 157 is effective for fiscal years beginning after November 15, 2007, and interim periods within those fiscal years. The Trust believes the adoption of SFAS 157 will have no material impact on its financial statements.
FM-16
Franklin Templeton Variable Insurance Products Trust
Franklin Money Market Fund
Report of Independent Registered Public Accounting Firm
To the Board of Trustees and Shareholders of
Franklin Templeton Variable Insurance Products Trust
In our opinion, the accompanying statement of assets and liabilities, including the statement of investments, and the related statements of operations and of changes in net assets and the financial highlights present fairly, in all material respects, the financial position of Franklin Money Market Fund (one of the funds constituting Franklin Templeton Variable Insurance Products Trust, hereafter referred to as the “Fund”) at December 31, 2007, the results of its operations for the year then ended, the changes in its net assets for each of the two years in the period then ended and the financial highlights for each of the five years in the period then ended, in conformity with accounting principles generally accepted in the United States of America. These financial statements and financial highlights (hereafter referred to as “financial statements”) are the responsibility of the Fund’s management. Our responsibility is to express an opinion on these financial statements based on our audits. We conducted our audits of these financial statements in accordance with the standards of the Public Company Accounting Oversight Board (United States). Those standards require that we plan and perform the audit to obtain reasonable assurance about whether the financial statements are free of material misstatement. An audit includes examining, on a test basis, evidence supporting the amounts and disclosures in the financial statements, assessing the accounting principles used and significant estimates made by management, and evaluating the overall financial statement presentation. We believe that our audits, which included confirmation of securities at December 31, 2007 by correspondence with the custodian and brokers, provide a reasonable basis for our opinion.
PricewaterhouseCoopers LLP
San Francisco, California
February 14, 2008
FM-17
FRANKLIN RISING DIVIDENDS SECURITIES FUND
This annual report for Franklin Rising Dividends Securities Fund covers the fiscal year ended December 31, 2007.
Performance Summary as of 12/31/07
Average annual total return of Class 1 shares represents the average annual change in value, assuming reinvestment of dividends and capital gains. Average returns smooth out variations in returns, which can be significant; they are not the same as year-by-year results.
Periods ended 12/31/07
| | | | | | |
| | | 1-Year | | 5-Year | | 10-Year |
Average Annual Total Return | | -2.41% | | +10.54% | | +8.05% |
Total Return Index Comparison
for Hypothetical $10,000 Investment (1/1/98–12/31/07)
The graph below shows the change in value of a hypothetical $10,000 investment in the Fund over the indicated period and includes reinvestment of any income or distributions. The Fund’s performance is compared to the performance of the Standard & Poor’s 500 Index (S&P 500). One cannot invest directly in an index, nor is an index representative of the Fund’s portfolio. Please see Important Notes to Performance Information preceding the Fund Summaries.
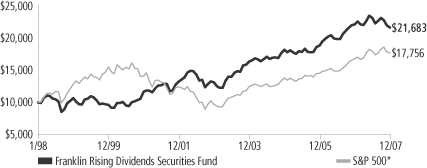
*Source: Standard & Poor’s Micropal. Please see Index Descriptions following the Fund Summaries.
Franklin Rising Dividends Securities Fund – Class 1
Performance reflects the Fund’s Class 1 operating expenses, but does not include any contract fees, expenses or sales charges. If they had been included, performance would be lower. These charges and deductions, particularly for variable life policies, can have a significant effect on contract values and insurance benefits. See the contract prospectus for a complete description of these expenses, including sales charges.
Performance data represent past performance, which does not guarantee future results. Investment return and principal value will fluctuate, and you may have a gain or loss when you sell your shares.
Current performance may differ from figures shown.
FRD-1
Fund Goal and Main Investments: Franklin Rising Dividends Securities Fund seeks long-term capital appreciation, with preservation of capital as an important consideration. The Fund normally invests at least 80% of its net assets in investments of companies that have paid rising dividends, and normally invests predominantly in equity securities.
Performance Overview
You can find the Fund’s 12-month total return in the Performance Summary. The Fund underperformed its benchmark, the S&P 500, which posted a +5.49% total return for the same period.1
Economic and Market Overview
During the 12 months ended December 31, 2007, the U.S. economy advanced at a moderate but uneven pace. Gross domestic product (GDP) grew an annualized 0.6% in the first quarter of 2007 but advanced in the second quarter at an annualized 3.8% rate. Federal defense spending, accelerating exports and declining imports, greater business inventory investment and increased spending for nonresidential structures supported growth. GDP grew an annualized 4.9% in the third quarter of 2007 despite a struggling housing market and the abrupt unraveling of the subprime mortgage market. The housing downturn affected the overall economy by fourth quarter 2007 as credit conditions worsened, consumer spending slowed, and GDP growth decelerated to an estimated 0.6% annualized rate.
The unemployment rate increased from 4.4% at the beginning of the period to 5.0% in December 2007.2 Although consumer confidence in July neared a six-year high, it declined through period-end largely due to rising mortgage and fuel costs, falling home prices and a weaker job market. Oil prices were volatile and established a new record high in November, nearing $99 per barrel. For the 12 months ended December 31, 2007, the core Consumer Price Index (CPI), which excludes food and energy costs, rose 2.4%, which was higher than its 10-year average rate.2
1. Source: Standard & Poor’s Micropal. One cannot invest directly in an index, nor is an index representative of the Fund’s portfolio. Please see Index Descriptions following the Fund Summaries.
2. Source: Bureau of Labor Statistics.
Fund Risks: The Fund’s investments in stocks offer the potential for long-term gains but can be subject to short-term price fluctuations. Smaller and midsize company securities can increase the risk of greater price fluctuations, particularly over the short term. By having significant investments in particular sectors from time to time, such as financial services, the Fund may be at greater risk of adverse developments in a sector than a fund that invests more broadly. The Fund’s prospectus also includes a description of the main investment risks.
FRD-2
Facing the prospect of slower economic growth, the Federal Reserve Board lowered the federal funds target rate to 4.25% from 5.25% during the period. As investors fled riskier, poorer-performing assets, U.S. Treasuries rallied and the 10-year Treasury note yield fell from 4.71% at the beginning of the period to 4.04% on December 31, 2007.
Following sell-offs in late February and mid-March, stock markets rebounded amid generally strong first quarter corporate earnings reports. However, volatility picked up substantially in the latter half of the year due to investor concerns about slowing economic growth. The major stock indices recovered from a late-summer sell-off and a November correction, and the blue chip stocks of the Dow Jones Industrial Average posted a 12-month total return of +8.88%.3 The broader S&P 500 returned +5.49%, and the technology-heavy NASDAQ Composite Index returned +11.53%.3 The energy, materials and utilities sectors performed particularly well.
Investment Strategy
We are a research-driven, fundamental investment adviser, pursuing a disciplined value-oriented strategy. As bottom-up investors concentrating primarily on individual securities, we seek fundamentally sound companies that we believe meet our screening criteria, which include consistent, substantial dividend increases; reinvested earnings; and strong balance sheets. We attempt to acquire such stocks at attractive prices, often when they are out of favor with other investors. In following these criteria, we do not necessarily focus on companies whose securities pay a high dividend but rather on companies that consistently raise their dividends.
Manager’s Discussion
Significant contributors to the Fund’s return during the year ended December 31, 2007, included Praxair, AFLAC and Roper Industries. Praxair’s industrial gas businesses had consistent sales and earnings growth, which seemed to become more highly valued by investors in the current uncertain economic environment. Important drivers of Praxair’s businesses included high energy prices, environmental concerns and emerging market growth. The company has increased its dividend in each of the past 14 years. AFLAC’s share price rose following indications that new sales were increasing in Japan. The company
3. Source: Standard & Poor’s Micropal. Please see Index Descriptions following the Fund Summaries.
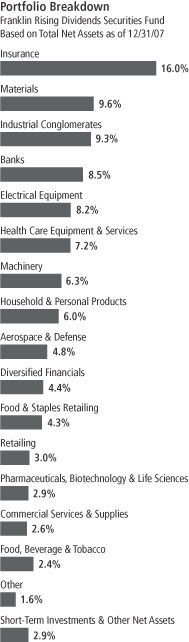
FRD-3
Top 10 Holdings
Franklin Rising Dividends Securities Fund 12/31/07
| | |
Company
Sector/Industry | | % of Total
Net Assets |
| |
| United Technologies Corp. | | 4.9% |
| Aerospace & Defense | | |
| |
| Praxair Inc. | | 4.8% |
| Materials | | |
| |
| The Procter & Gamble Co. | | 4.8% |
| Household & Personal Products | | |
| |
| Roper Industries Inc. | | 4.6% |
| Electrical Equipment | | |
| |
| General Electric Co. | | 4.4% |
| Industrial Conglomerates | | |
| |
| State Street Corp. | | 4.4% |
| Diversified Financials | | |
| |
| Wal-Mart Stores Inc. | | 4.3% |
| Food & Staples Retailing | | |
| |
| Dover Corp. | | 4.3% |
| Machinery | | |
| |
| American International Group Inc. | | 4.2% |
| Insurance | | |
| |
| Carlisle Cos. Inc. | | 3.9% |
| Industrial Conglomerates | | |
The dollar value, number of shares or principal amount, and names of all portfolio holdings are listed in the Fund’s Statement of Investments.
also benefited from being a financial stock that did not have major credit quality concerns. AFLAC has 25 years of dividend increases. Roper continued to generate strong organic growth across many of its businesses, which include radio frequency identification, energy systems and controls, and automatic meter reading. Roper has 15 years of dividend increases.
Three stocks that declined in value during the period were Freddie Mac, Washington Mutual and Family Dollar Stores. Through September, Freddie Mac was largely considered a beneficiary of mortgage market turmoil; however, its share price declined sharply after it became likely that mark-to-market accounting would begin to pressure its regulatory capital requirement. Washington Mutual’s provision for credit losses increased substantially as the housing market weakened. The share prices of retailers such as Family Dollar fell as investors anticipated that house price declines and high gasoline prices would lead to deterioration in consumer spending. Family Dollar reported a disappointing decline in same store sales for November.
We did not initiate any new positions during the fiscal year. However, we significantly increased the Fund’s Freddie Mac position and significantly reduced its Fannie Mae position as we felt that Freddie Mac became the more attractively valued of these two companies. The Fund realized a tax benefit from losses incurred on the Fannie Mae sale. We also significantly increased the Fund’s holdings in Procter & Gamble and Old Republic International. During the first half of 2007, Procter & Gamble’s stock price had periods of weakness as investors were disappointed with relatively modest sales growth and only slight profit margin expansion. Procter & Gamble has increased its dividend for 51 years. Although Old Republic’s general insurance business generated operating profits, its smaller mortgage guaranty business reported underwriting losses, which contributed to its stock price falling below book value. Old Republic has 26 years of dividend increases. We made smaller additions to 21 other positions during the fiscal year.
In addition to Fannie Mae, we reduced positions in Teleflex and Roper Industries. Teleflex performed well during the year’s first half despite exposure to difficult automotive and marine markets. Roper reported strong sales and earnings growth, but reached a valuation that we believed warranted some profit taking. We reduced eight other positions during the period.
FRD-4
Our 10 largest positions on December 31, 2007, represented 44.6% of the Fund’s total net assets. It is interesting to note how these 10 companies would, in aggregate, respond to the Fund’s screening criteria based on a simple average of statistical measures. On average, these 10 companies have raised their dividends 29 years in a row and by 299% in the past 10 years. Their most recent year-over-year dividend increases averaged 15% with a yield of 1.6% on December 31, 2007, and a dividend payout ratio of 28%, based on estimates of calendar year 2007 operating earnings. The average price/earnings ratio was 17.7 times calendar year 2007 estimates versus 18.6 for that of the unmanaged S&P 500.
Thank you for your participation in Franklin Rising Dividends Securities Fund. We look forward to serving your future investment needs.
The foregoing information reflects our analysis, opinions and portfolio holdings as of December 31, 2007, the end of the reporting period. The way we implement our main investment strategies and the resulting portfolio holdings may change depending on factors such as market and economic conditions. These opinions may not be relied upon as investment advice or an offer for a particular security. The information is not a complete analysis of every aspect of any market, country, industry, security or the Fund. Statements of fact are from sources considered reliable, but the investment manager makes no representation or warranty as to their completeness or accuracy. Although historical performance is no guarantee of future results, these insights may help you understand our investment management philosophy.
FRD-5
Fund Expenses
As an investor in a variable insurance contract (Contract) that indirectly provides for investment in an underlying mutual fund, you can incur transaction and/or ongoing expenses at both the Fund level and the Contract level.
| • | | Transaction expenses can include sales charges (loads) on purchases, redemption fees, surrender fees, transfer fees and premium taxes. |
| • | | Ongoing expenses can include management fees, distribution and service (12b-1) fees, contract fees, annual maintenance fees, mortality and expense risk fees and other fees and expenses. All mutual funds and Contracts have some types of ongoing expenses. |
The expenses shown in the table are meant to highlight ongoing expenses at the Fund level only and do not include ongoing expenses at the Contract level, or transaction expenses at either the Fund or Contract level. While the Fund does not have transaction expenses, if the transaction and ongoing expenses at the Contract level were included, the expenses shown would be higher. You should consult your Contract prospectus or disclosure document for more information.
The table shows Fund-level ongoing expenses and can help you understand these expenses and compare them with those of other mutual funds offered through the Contract. The table assumes a $1,000 investment held for the six months indicated. Please refer to the Fund prospectus for additional information on operating expenses.
Actual Fund Expenses
The first line (Actual) of the table provides actual account values and expenses. The “Ending Account Value” is derived from the Fund’s actual return, which includes the effect of ongoing Fund expenses, but does not include the effect of ongoing Contract expenses.
You can estimate the Fund-level expenses you incurred during the period by following these steps. Of course, your account value and expenses will differ from those in this illustration:
| 1. | Divide your account value by $1,000. If an account had an $8,600 value, then $8,600 ÷ $1,000 = 8.6. |
| 2. | Multiply the result by the number under the heading “Fund-Level Expenses Incurred During Period.” If Fund-Level Expenses Incurred During Period were $7.50, then 8.6 x $7.50 = $64.50. |
In this illustration, the estimated expenses incurred this period at the Fund level are $64.50.
Franklin Rising Dividends Securities Fund – Class 1
FRD-6
Hypothetical Example for Comparison with Other Mutual Funds
Information in the second line (Hypothetical) of the table can help you compare ongoing expenses of the Fund with those of other mutual funds offered through the Contract. This information may not be used to estimate the actual ending account balance or expenses you incurred during the period. The hypothetical “Ending Account Value” is based on the Fund’s actual expense ratio and an assumed 5% annual rate of return before expenses, which does not represent the Fund’s actual return. The figure under the heading “Fund-Level Expenses Incurred During Period” shows the hypothetical expenses your account would have incurred under this scenario. You can compare this figure with the 5% hypothetical examples that appear in shareholder reports of other funds offered through a Contract.
| | | | | | | | | |
| Class 1 | | Beginning
Account
Value 7/1/07 | | Ending
Account
Value 12/31/07 | | Fund-Level
Expenses Incurred
During Period*
7/1/07–12/31/07 |
Actual | | $ | 1,000 | | $ | 933.40 | | $ | 2.88 |
Hypothetical (5% return before expenses) | | $ | 1,000 | | $ | 1,022.23 | | $ | 3.01 |
*Expenses are calculated using the most recent six-month annualized expense ratio for the Fund’s Class 1 shares (0.59%), which does not include any ongoing expenses of the Contract for which the Fund is an investment option, multiplied by the average account value over the period, multiplied by 184/365 to reflect the one-half year period.
FRD-7
Franklin Templeton Variable Insurance Products Trust
Financial Highlights
Franklin Rising Dividends Securities Fund
| | | | | | | | | | | | | | | | | | | | |
| | | Year Ended December 31, | |
| Class 1 | | 2007 | | | 2006 | | | 2005 | | | 2004 | | | 2003 | |
| | | | |
Per share operating performance | | | | | | | | | | | | | | | | | | | | |
(for a share outstanding throughout the year) | | | | | | | | | | | | | | | | | | | | |
Net asset value, beginning of year | | $ | 20.88 | | | $ | 18.11 | | | $ | 17.75 | | | $ | 16.28 | | | $ | 13.57 | |
| | | | |
Income from investment operationsa: | | | | | | | | | | | | | | | | | | | | |
Net investment incomeb | | | 0.36 | | | | 0.58 | | | | 0.28 | | | | 0.26 | | | | 0.19 | |
Net realized and unrealized gains (losses) | | | (0.80 | ) | | | 2.53 | | | | 0.36 | | | | 1.55 | | | | 3.10 | |
| | | | |
Total from investment operations | | | (0.44 | ) | | | 3.11 | | | | 0.64 | | | | 1.81 | | | | 3.29 | |
| | | | |
Less distributions from: | | | | | | | | | | | | | | | | | | | | |
Net investment income | | | (0.53 | ) | | | (0.24 | ) | | | (0.18 | ) | | | (0.12 | ) | | | (0.14 | ) |
Net realized gains | | | (0.30 | ) | | | (0.10 | ) | | | (0.10 | ) | | | (0.22 | ) | | | (0.44 | ) |
| | | | |
Total distributions | | | (0.83 | ) | | | (0.34 | ) | | | (0.28 | ) | | | (0.34 | ) | | | (0.58 | ) |
| | | | |
Net asset value, end of year | | $ | 19.61 | | | $ | 20.88 | | | $ | 18.11 | | | $ | 17.75 | | | $ | 16.28 | |
| | | | |
| | | | | |
Total returnc | | | (2.41)% | | | | 17.43% | | | | 3.68% | | | | 11.25% | | | | 24.88% | |
Ratios to average net assets | | | | | | | | | | | | | | | | | | | | |
Expenses | | | 0.59% | d | | | 0.61% | d | | | 0.62% | d | | | 0.69% | d | | | 0.76% | |
Net investment income | | | 1.72% | | | | 3.15% | | | | 1.65% | | | | 1.56% | | | | 1.39% | |
| | | | | |
Supplemental data | | | | | | | | | | | | | | | | | | | | |
Net assets, end of year (000’s) | | $ | 235,946 | | | $ | 288,303 | | | $ | 292,223 | | | $ | 326,883 | | | $ | 326,663 | |
Portfolio turnover rate | | | 3.29% | | | | 6.19% | | | | 2.26% | | | | 2.78% | | | | 9.54% | |
a The amount shown for a share outstanding throughout the period may not correlate with the Statement of Operations for the period due to the timing of sales and repurchases of the Fund shares in relation to income earned and/or fluctuating market value of the investments of the Fund.
b Based on average daily shares outstanding.
c Total return does not include any fees, charges or expenses imposed by the variable annuity and life insurance contracts for which the Franklin Templeton Variable Insurance Products Trust serves as an underlying investment vehicle.
d Benefit of expense reduction rounds to less than 0.01%.
The accompanying notes are an integral part of these financial statements.
FRD-8
Franklin Templeton Variable Insurance Products Trust
Financial Highlights (continued)
Franklin Rising Dividends Securities Fund
| | | | | | | | | | | | | | | | | | | | |
| | | Year Ended December 31, | |
| Class 2 | | 2007 | | | 2006 | | | 2005 | | | 2004 | | | 2003 | |
| | | | |
Per share operating performance | | | | | | | | | | | | | | | | | | | | |
(for a share outstanding throughout the year) | | | | | | | | | | | | | | | | | | | | |
Net asset value, beginning of year | | $ | 20.55 | | | $ | 17.84 | | | $ | 17.51 | | | $ | 16.09 | | | $ | 13.44 | |
| | | | |
Income from investment operationsa: | | | | | | | | | | | | | | | | | | | | |
Net investment incomeb | | | 0.30 | | | | 0.56 | | | | 0.24 | | | | 0.22 | | | | 0.17 | |
Net realized and unrealized gains (losses) | | | (0.79 | ) | | | 2.46 | | | | 0.34 | | | | 1.53 | | | | 3.05 | |
| | | | |
Total from investment operations | | | (0.49 | ) | | | 3.02 | | | | 0.58 | | | | 1.75 | | | | 3.22 | |
| | | | |
Less distributions from: | | | | | | | | | | | | | | | | | | | | |
Net investment income | | | (0.49 | ) | | | (0.21 | ) | | | (0.15 | ) | | | (0.11 | ) | | | (0.13 | ) |
Net realized gains | | | (0.30 | ) | | | (0.10 | ) | | | (0.10 | ) | | | (0.22 | ) | | | (0.44 | ) |
| | | | |
Total distributions | | | (0.79 | ) | | | (0.31 | ) | | | (0.25 | ) | | | (0.33 | ) | | | (0.57 | ) |
| | | | |
Net asset value, end of year | | $ | 19.27 | | | $ | 20.55 | | | $ | 17.84 | | | $ | 17.51 | | | $ | 16.09 | |
| | | | |
| | | | | |
Total returnc | | | (2.69)% | | | | 17.12% | | | | 3.43% | | | | 11.00% | | | | 24.59% | |
Ratios to average net assets | | | | | | | | | | | | | | | | | | | | |
Expenses | | | 0.84% | d | | | 0.86% | d | | | 0.87% | d | | | 0.94% | d | | | 1.01% | |
Net investment income | | | 1.47% | | | | 2.90% | | | | 1.40% | | | | 1.31% | | | | 1.14% | |
| | | | | |
Supplemental data | | | | | | | | | | | | | | | | | | | | |
Net assets, end of year (000’s) | | $ | 2,079,366 | | | $ | 1,981,240 | | | $ | 1,423,827 | | | $ | 997,800 | | | $ | 343,675 | |
Portfolio turnover rate | | | 3.29% | | | | 6.19% | | | | 2.26% | | | | 2.78% | | | | 9.54% | |
a The amount shown for a share outstanding throughout the period may not correlate with the Statement of Operations for the period due to the timing of sales and repurchases of the Fund shares in relation to income earned and/or fluctuating market value of the investments of the Fund.
b Based on average daily shares outstanding.
c Total return does not include any fees, charges or expenses imposed by the variable annuity and life insurance contracts for which the Franklin Templeton Variable Insurance Products Trust serves as an underlying investment vehicle.
d Benefit of expense reduction rounds to less than 0.01%.
The accompanying notes are an integral part of these financial statements.
FRD-9
Franklin Templeton Variable Insurance Products Trust
Statement of Investments, December 31, 2007
| | | | | |
| Franklin Rising Dividends Securities Fund | | Shares | | Value |
Common Stocks 97.1% | | | | | |
Aerospace & Defense 4.8% | | | | | |
United Technologies Corp. | | 1,467,700 | | $ | 112,337,758 |
| | | | | |
Banks 8.5% | | | | | |
Fannie Mae | | 114,000 | | | 4,557,720 |
Freddie Mac | | 1,892,008 | | | 64,460,713 |
Peoples Bancorp Inc. | | 159,979 | | | 3,981,877 |
PNC Financial Services Group Inc. | | 150,953 | | | 9,910,065 |
SunTrust Banks Inc. | | 442,104 | | | 27,627,079 |
aTrustCo Bank Corp. NY | | 328,588 | | | 3,259,593 |
U.S. Bancorp | | 2,209,549 | | | 70,131,085 |
aWashington Mutual Inc. | | 980,200 | | | 13,340,522 |
| | | | | |
| | | | | 197,268,654 |
| | | | | |
Commercial Services & Supplies 2.6% | | | | | |
aABM Industries Inc. | | 1,080,689 | | | 22,035,249 |
Cintas Corp. | | 1,079,700 | | | 36,299,514 |
Superior Uniform Group Inc. | | 237,100 | | | 2,311,725 |
| | | | | |
| | | | | 60,646,488 |
| | | | | |
Consumer Durables & Apparel 1.6% | | | | | |
aLeggett & Platt Inc. | | 1,837,700 | | | 32,049,488 |
bRuss Berrie and Co. Inc. | | 306,081 | | | 5,007,485 |
| | | | | |
| | | | | 37,056,973 |
| | | | | |
Diversified Financials 4.4% | | | | | |
State Street Corp. | | 1,254,900 | | | 101,897,880 |
| | | | | |
Electrical Equipment 8.2% | | | | | |
aBrady Corp., A | | 2,380,279 | | | 83,523,990 |
aRoper Industries Inc. | | 1,711,274 | | | 107,023,076 |
| | | | | |
| | | | | 190,547,066 |
| | | | | |
Food & Staples Retailing 4.3% | | | | | |
Wal-Mart Stores Inc. | | 2,117,500 | | | 100,644,775 |
| | | | | |
Food, Beverage & Tobacco 2.4% | | | | | |
McCormick & Co. Inc. | | 1,438,895 | | | 54,548,509 |
| | | | | |
Health Care Equipment & Services 7.2% | | | | | |
Becton Dickinson and Co. | | 585,200 | | | 48,911,016 |
Hillenbrand Industries Inc. | | 1,252,800 | | | 69,818,544 |
aWest Pharmaceutical Services Inc. | | 1,165,600 | | | 47,311,704 |
| | | | | |
| | | | | 166,041,264 |
| | | | | |
Household & Personal Products 6.0% | | | | | |
Alberto-Culver Co. | | 1,146,450 | | | 28,133,883 |
The Procter & Gamble Co. | | 1,514,900 | | | 111,223,958 |
| | | | | |
| | | | | 139,357,841 |
| | | | | |
Industrial Conglomerates 9.3% | | | | | |
aCarlisle Cos. Inc. | | 2,456,400 | | | 90,960,492 |
General Electric Co. | | 2,766,100 | | | 102,539,327 |
Teleflex Inc. | | 353,700 | | | 22,286,637 |
| | | | | |
| | | | | 215,786,456 |
| | | | | |
Insurance 16.0% | | | | | |
AFLAC Inc. | | 1,359,000 | | | 85,114,170 |
FRD-10
Franklin Templeton Variable Insurance Products Trust
Statement of Investments, December 31, 2007 (continued)
| | | | | | |
| Franklin Rising Dividends Securities Fund | | Shares | | Value | |
Common Stocks (continued) | | | | | | |
Insurance (continued) | | | | | | |
American International Group Inc. | | 1,648,700 | | $ | 96,119,210 | |
aArthur J. Gallagher & Co. | | 759,500 | | | 18,372,305 | |
aErie Indemnity Co., A | | 1,401,733 | | | 72,735,925 | |
Mercury General Corp. | | 154,200 | | | 7,680,702 | |
Old Republic International Corp. | | 4,261,808 | | | 65,674,461 | |
RLI Corp. | | 416,812 | | | 23,670,754 | |
| | | | | | |
| | | | | 369,367,527 | |
| | | | | | |
Machinery 6.3% | | | | | | |
Donaldson Co. Inc. | | 274,800 | | | 12,745,224 | |
Dover Corp. | | 2,147,000 | | | 98,955,230 | |
Graco Inc. | | 356,112 | | | 13,268,733 | |
Nordson Corp. | | 345,391 | | | 20,018,863 | |
| | | | | | |
| | | | | 144,988,050 | |
| | | | | | |
Materials 9.6% | | | | | | |
Bemis Co. Inc. | | 1,404,400 | | | 38,452,472 | |
Nucor Corp. | | 1,207,602 | | | 71,514,190 | |
Praxair Inc. | | 1,255,600 | | | 111,384,276 | |
| | | | | | |
| | | | | 221,350,938 | |
| | | | | | |
Pharmaceuticals, Biotechnology & Life Sciences 2.9% | | | | | | |
Pfizer Inc. | | 2,944,300 | | | 66,923,939 | |
| | | | | | |
Retailing 3.0% | | | | | | |
Family Dollar Stores Inc. | | 3,393,500 | | | 65,257,005 | |
bSally Beauty Holdings Inc. | | 528,550 | | | 4,783,378 | |
| | | | | | |
| | | | | 70,040,383 | |
| | | | | | |
Semiconductors & Semiconductor Equipment 0.0%c | | | | | | |
Cohu Inc. | | 50,300 | | | 769,589 | |
| | | | | | |
Total Common Stocks (Cost $1,848,478,734) | | | | | 2,249,574,090 | |
| | | | | | |
Short Term Investments 3.9% | | | | | | |
Money Market Fund (Cost $61,591,258) 2.7% | | | | | | |
dFranklin Institutional Fiduciary Trust Money Market Portfolio, 4.58% | | 61,591,258 | | | 61,591,258 | |
| | | | | | |
eInvestments from Cash Collateral Received for Loaned Securities 1.2% | | | | | | |
Money Market Fund (Cost $27,936,000) 1.2% | | | | | | |
fBank of New York Institutional Cash Reserve Fund, 5.06% | | 27,936,000 | | | 27,936,000 | |
| | | | | | |
Total Investments (Cost $1,938,005,992) 101.0% | | | | | 2,339,101,348 | |
Other Assets, less Liabilities (1.0)% | | | | | (23,788,936 | ) |
| | | | | | |
Net Assets 100.0% | | | | $ | 2,315,312,412 | |
| | | | | | |
a A portion or all of the security is on loan as of December 31, 2007. See Note 1(b).
b Non-income producing for the twelve months ended December 31, 2007.
c Rounds to less than 0.1% of net assets.
d See Note 7 regarding investments in the Franklin Institutional Fiduciary Trust Money Market Portfolio. The rate shown is the annualized seven-day yield at period end.
e See Note 1(b) regarding securities on loan.
f The rate shown is the annualized seven-day yield at period end.
The accompanying notes are an integral part of these financial statements.
FRD-11
Franklin Templeton Variable Insurance Products Trust
Financial Statements
Statement of Assets and Liabilities
December 31, 2007
| | | |
| | | Franklin Rising
Dividends
Securities Fund |
Assets: | | | |
Investments in securities: | | | |
Cost - Unaffiliated issuers | | $ | 1,876,414,734 |
Cost - Sweep Money Fund (Note 7) | | | 61,591,258 |
| | | |
Total cost of investments | | $ | 1,938,005,992 |
| | | |
Value - Unaffiliated issuers | | $ | 2,277,510,090 |
Value - Sweep Money Fund (Note 7) | | | 61,591,258 |
| | | |
Total value of investmentsa | | | 2,339,101,348 |
Receivables: | | | |
Capital shares sold | | | 2,047,751 |
Dividends | | | 5,102,363 |
| | | |
Total assets | | | 2,346,251,462 |
| | | |
Liabilities: | | | |
Payables: | | | |
Capital shares redeemed | | | 748,323 |
Affiliates | | | 2,002,599 |
Payable upon return of securities loaned | | | 27,936,000 |
Accrued expenses and other liabilities | | | 252,128 |
| | | |
Total liabilities | | | 30,939,050 |
| | | |
Net assets, at value | | $ | 2,315,312,412 |
| | | |
Net assets consist of: | | | |
Paid-in capital | | $ | 1,864,047,162 |
Undistributed net investment income | | | 35,970,075 |
Net unrealized appreciation (depreciation) | | | 401,095,356 |
Accumulated net realized gain (loss) | | | 14,199,819 |
| | | |
Net assets, at value | | $ | 2,315,312,412 |
| | | |
Class 1: | | | |
Net assets, at value | | $ | 235,946,070 |
| | | |
Shares outstanding | | | 12,032,600 |
| | | |
Net asset value and maximum offering price per share | | $ | 19.61 |
| | | |
Class 2: | | | |
Net assets, at value | | $ | 2,079,366,342 |
| | | |
Shares outstanding | | | 107,883,711 |
| | | |
Net asset value and maximum offering price per share | | $ | 19.27 |
| | | |
aIncludes | $27,271,767 of securities loaned. |
The accompanying notes are an integral part of these financial statements.
FRD-12
Franklin Templeton Variable Insurance Products Trust
Financial Statements (continued)
Statement of Operations
for the year ended December 31, 2007
| | | | |
| | | Franklin Rising
Dividends
Securities Fund | |
Investment income: | | | | |
Dividends: | | | | |
Unaffiliated issuers | | $ | 51,240,437 | |
Sweep Money Fund (Note 7) | | | 3,999,954 | |
Income from securities loaned | | | 166,819 | |
| | | | |
Total investment income | | | 55,407,210 | |
| | | | |
Expenses: | | | | |
Management fees (Note 3a) | | | 13,577,940 | |
Distribution fees - Class 2 (Note 3c) | | | 5,320,470 | |
Unaffiliated transfer agent fees | | | 37,663 | |
Custodian fees (Note 4) | | | 40,595 | |
Reports to shareholders | | | 304,613 | |
Professional fees | | | 92,036 | |
Trustees’ fees and expenses | | | 10,183 | |
Other | | | 51,782 | |
| | | | |
Total expenses | | | 19,435,282 | |
Expense reductions (Note 4) | | | (7,857 | ) |
| | | | |
Net expenses | | | 19,427,425 | |
| | | | |
Net investment income | | | 35,979,785 | |
| | | | |
Realized and unrealized gains (losses): | | | | |
Net realized gain (loss) from investments | | | 15,955,531 | |
Net change in unrealized appreciation (depreciation) on investments | | | (118,598,969 | ) |
| | | | |
Net realized and unrealized gain (loss) | | | (102,643,438 | ) |
| | | | |
Net increase (decrease) in net assets resulting from operations | | $ | (66,663,653 | ) |
| | | | |
The accompanying notes are an integral part of these financial statements.
FRD-13
Franklin Templeton Variable Insurance Products Trust
Financial Statements (continued)
Statements of Changes in Net Assets
| | | | | | | | |
| | | Franklin Rising Dividends
Securities Fund | |
| | | Year Ended December 31, | |
| | | 2007 | | | 2006 | |
| | | | |
Increase (decrease) in net assets: | | | | | | | | |
Operations: | | | | | | | | |
Net investment income | | $ | 35,979,785 | | | $ | 57,211,739 | |
Net realized gain (loss) from investments | | | 15,955,531 | | | | 33,508,862 | |
Net change in unrealized appreciation (depreciation) on investments | | | (118,598,969 | ) | | | 217,200,778 | |
| | | | |
Net increase (decrease) in net assets resulting from operations | | | (66,663,653 | ) | | | 307,921,379 | |
| | | | |
Distributions to shareholders from: | | | | | | | | |
Net investment income: | | | | | | | | |
Class 1 | | | (6,748,637 | ) | | | (3,557,246 | ) |
Class 2 | | | (50,470,683 | ) | | | (17,374,522 | ) |
Net realized gains: | | | | | | | | |
Class 1 | | | (3,824,396 | ) | | | (1,432,271 | ) |
Class 2 | | | (30,955,762 | ) | | | (8,224,725 | ) |
| | | | |
Total distributions to shareholders | | | (91,999,478 | ) | | | (30,588,764 | ) |
| | | | |
Capital share transactions: (Note 2) | | | | | | | | |
Class 1 | | | (36,683,874 | ) | | | (45,251,524 | ) |
Class 2 | | | 241,115,910 | | | | 321,413,040 | |
| | | | |
Total capital share transactions | | | 204,432,036 | | | | 276,161,516 | |
| | | | |
Net increase (decrease) in net assets | | | 45,768,905 | | | | 553,494,131 | |
Net assets: | | | | | | | | |
Beginning of year | | | 2,269,543,507 | | | | 1,716,049,376 | |
| | | | |
End of year | | $ | 2,315,312,412 | | | $ | 2,269,543,507 | |
| | | | |
Undistributed net investment income included in net assets: | | | | | | | | |
End of year | | $ | 35,970,075 | | | $ | 57,209,610 | |
| | | | |
The accompanying notes are an integral part of these financial statements.
FRD-14
Franklin Templeton Variable Insurance Products Trust
Notes to Financial Statements
Franklin Rising Dividends Securities Fund
1. ORGANIZATION AND SIGNIFICANT ACCOUNTING POLICIES
Franklin Templeton Variable Insurance Products Trust (Trust) is registered under the Investment Company Act of 1940, as amended, (1940 Act) as an open-end investment company, consisting of twenty-three separate funds. The Franklin Rising Dividends Securities Fund (Fund) included in this report is diversified. The financial statements of the remaining funds in the Trust are presented separately. Shares of the Fund are sold only to insurance company separate accounts to fund the benefits of variable life insurance policies or variable annuity contracts. As of December 31, 2007, 61.99% of the Fund’s shares were held through one insurance company. The Fund offers two classes of shares: Class 1 and Class 2. Each class of shares differs by its distribution fees, voting rights on matters affecting a single class and its exchange privilege.
The following summarizes the Fund’s significant accounting policies.
a. Security Valuation
Securities listed on a securities exchange or on the NASDAQ National Market System are valued at the last quoted sale price or the official closing price of the day, respectively. Over-the-counter securities and listed securities for which there is no reported sale are valued within the range of the most recent quoted bid and ask prices. Securities that trade in multiple markets or on multiple exchanges are valued according to the broadest and most representative market. Investments in open-end mutual funds are valued at the closing net asset value.
The Trust has procedures to determine the fair value of individual securities and other assets for which market prices are not readily available or which may not be reliably priced. Methods for valuing these securities may include: fundamental analysis, matrix pricing, discounts from market prices of similar securities, or discounts applied due to the nature and duration of restrictions on the disposition of the securities. Due to the inherent uncertainty of valuations of such securities, the fair values may differ significantly from the values that would have been used had a ready market for such investments existed. Occasionally, events occur between the time at which trading in a security is completed and the close of the NYSE that might call into question the availability (including the reliability) of the value of a portfolio security held by the Fund. If such an event occurs, the securities may be valued using fair value procedures, which may include the use of independent pricing services. All security valuation procedures are approved by the Trust’s Board of Trustees.
b. Securities Lending
The Fund participates in a principal based security lending program and receives a minimum guaranteed payment for its participation, and may receive additional payment based on actual securities loaned. The Fund receives cash collateral against the loaned securities in an amount equal to at least 102% of the market value of the loaned securities. Collateral is maintained over the life of the loan in an amount not less than 100% of the market value of loaned securities, as determined at the close of Fund business each day; any additional collateral required due to changes in security values is delivered to the Fund on the next business day. The collateral is held in a segregated account with the Fund’s custodian on the Fund’s behalf. While the Fund continues to bear the market risk with respect to securities loaned and the risk that the principal may default on its obligations to the Fund, the principal bears the risk of default by any third party borrower.
c. Income Taxes
No provision has been made for U.S. income taxes because it is the Fund’s policy to qualify as a regulated investment company under the Internal Revenue Code and to distribute to shareholders substantially all of its taxable income and net realized gains.
d. Security Transactions, Investment Income, Expenses and Distributions
Security transactions are accounted for on trade date. Realized gains and losses on security transactions are determined on a specific identification basis. Estimated expenses are accrued daily. Dividend income is recorded on the ex-dividend date.
FRD-15
Franklin Templeton Variable Insurance Products Trust
Notes to Financial Statements (continued)
Franklin Rising Dividends Securities Fund
1. ORGANIZATION AND SIGNIFICANT ACCOUNTING POLICIES (continued)
d. Security Transactions, Investment Income, Expenses and Distributions (continued)
Distributions to shareholders are recorded on the ex-dividend date and are determined according to income tax regulations (tax basis). Distributable earnings determined on a tax basis may differ from earnings recorded in accordance with accounting principles generally accepted in the United States of America. These differences may be permanent or temporary. Permanent differences are reclassified among capital accounts to reflect their tax character. These reclassifications have no impact on net assets or the results of operations. Temporary differences are not reclassified, as they may reverse in subsequent periods.
Common expenses incurred by the Trust are allocated among the funds based on the ratio of net assets of each fund to the combined net assets of the Trust. Fund specific expenses are charged directly to the fund that incurred the expense.
Realized and unrealized gains and losses and net investment income, other than class specific expenses, are allocated daily to each class of shares based upon the relative proportion of net assets of each class. Differences in per share distributions, by class, are generally due to differences in class specific expenses.
e. Accounting Estimates
The preparation of financial statements in accordance with accounting principles generally accepted in the United States of America requires management to make estimates and assumptions that affect the reported amounts of assets and liabilities at the date of the financial statements and the amounts of income and expenses during the reporting period. Actual results could differ from those estimates.
f. Guarantees and Indemnifications
Under the Trust’s organizational documents, its officers and trustees are indemnified by the Trust against certain liabilities arising out of the performance of their duties to the Trust. Additionally, in the normal course of business, the Trust, on behalf of the Fund, enters into contracts with service providers that contain general indemnification clauses. The Trust’s maximum exposure under these arrangements is unknown as this would involve future claims that may be made against the Trust that have not yet occurred. Currently, the Trust expects the risk of loss to be remote.
2. SHARES OF BENEFICIAL INTEREST
At December 31, 2007, there were an unlimited number of shares authorized (without par value). Transactions in the Fund’s shares were as follows:
| | | | | | | | | | | | | | |
| | | Year Ended December 31, | |
| | | 2007 | | | 2006 | |
| Class 1 Shares: | | Shares | | | Amount | | | Shares | | | Amount | |
Shares sold | | 404,175 | | | $ | 8,421,307 | | | 481,656 | | | $ | 9,458,762 | |
Shares issued in reinvestment of distributions | | 493,836 | | | | 10,573,033 | | | 270,875 | | | | 4,989,517 | |
Shares redeemed | | (2,671,946 | ) | | | (55,678,214 | ) | | (3,079,003 | ) | | | (59,699,803 | ) |
| | | | |
Net increase (decrease) | | (1,773,935 | ) | | $ | (36,683,874 | ) | | (2,326,472 | ) | | $ | (45,251,524 | ) |
| | | | |
| Class 2 Shares: | | | | | | | | | | | | |
Shares sold | | 17,185,808 | | | $ | 353,479,589 | | | 20,767,990 | | | $ | 400,946,971 | |
Shares issued in reinvestment of distributions | | 3,864,568 | | | | 81,426,445 | | | 1,410,427 | | | | 25,599,247 | |
Shares redeemed | | (9,573,257 | ) | | | (193,790,124 | ) | | (5,580,652 | ) | | | (105,133,178 | ) |
| | | | |
Net increase (decrease) | | 11,477,119 | | | $ | 241,115,910 | | | 16,597,765 | | | $ | 321,413,040 | |
| | | | |
FRD-16
Franklin Templeton Variable Insurance Products Trust
Notes to Financial Statements (continued)
Franklin Rising Dividends Securities Fund
3. TRANSACTIONS WITH AFFILIATES
Franklin Resources, Inc. is the holding company for various subsidiaries that together are referred to as Franklin Templeton Investments. Certain officers and trustees of the Trust are also officers and/or directors of the following subsidiaries:
| | |
| Subsidiary | | Affiliation |
Franklin Advisory Services, LLC (Advisory Services) | | Investment manager |
Franklin Templeton Services, LLC (FT Services) | | Administrative manager |
Franklin Templeton Distributors, Inc. (Distributors) | | Principal underwriter |
Franklin Templeton Investor Services, LLC (Investor Services) | | Transfer agent |
a. Management Fees
The Fund pays an investment management fee to Advisory Services based on the average daily net assets of the Fund as follows:
| | |
| Annualized Fee Rate | | Net Assets |
| 0.750% | | Up to and including $500 million |
| 0.625% | | Over $500 million, up to and including $1 billion |
| 0.500% | | In excess of $1 billion |
b. Administrative Fees
Under an agreement with Advisory Services, FT Services provides administrative services to the Fund. The fee is paid by Advisory Services based on average daily net assets, and is not an additional expense of the Fund.
c. Distribution Fees
The Fund’s Board of Trustees has adopted a distribution plan for Class 2 shares pursuant to Rule 12b-1 under the 1940 Act. Under the Fund’s compensation distribution plan, the Fund pays Distributors for costs incurred in connection with the servicing, sale and distribution of the Fund’s shares up to 0.35% per year of its average daily net assets. The Board of Trustees has agreed to limit the current rate to 0.25% per year.
d. Transfer Agent Fees
Investor Services, under terms of an agreement, performs shareholder servicing for the Fund and is not paid by the Fund for the services.
4. EXPENSE OFFSET ARRANGEMENT
The Fund has entered into an arrangement with its custodian whereby credits realized as a result of uninvested cash balances are used to reduce a portion of the Fund’s custodian expenses. During the year ended December 31, 2007, the custodian fees were reduced as noted in the Statement of Operations.
5. INCOME TAXES
The Fund has reviewed the tax positions taken on federal income tax returns, for each of the three open tax years and as of December 31, 2007 and has determined that no provision for income tax is required in the Fund’s financial statements.
FRD-17
Franklin Templeton Variable Insurance Products Trust
Notes to Financial Statements (continued)
Franklin Rising Dividends Securities Fund
5. INCOME TAXES (continued)
The tax character of distributions paid during the years ended December 31, 2007 and 2006, was as follows:
| | | | | | |
| | | 2007 | | 2006 |
Distributions paid from: | | | | | | |
Ordinary income | | $ | 58,920,961 | | $ | 22,867,117 |
Long term capital gain | | | 33,078,517 | | | 7,721,647 |
| | | |
| | $ | 91,999,478 | | $ | 30,588,764 |
| | | |
At December 31, 2007, the cost of investments, net unrealized appreciation (depreciation), undistributed ordinary income and undistributed long term capital gains for income tax purposes were as follows:
| | | | |
Cost of investments | | $ | 1,939,071,629 | |
| | | | |
| |
Unrealized appreciation | | $ | 541,994,664 | |
Unrealized depreciation | | | (141,964,945 | ) |
| | | | |
Net unrealized appreciation (depreciation) | | $ | 400,029,719 | |
| | | | |
Undistributed ordinary income | | $ | 37,493,436 | |
Undistributed long term capital gains | | | 13,742,096 | |
| | | | |
Distributable earnings | | $ | 51,235,532 | |
| | | | |
Net realized gains (losses) differ for financial statement and tax purposes primarily due to differing treatment of wash sales.
6. INVESTMENT TRANSACTIONS
Purchases and sales of investments (excluding short term securities) for the year ended December 31, 2007, aggregated $264,671,612 and $75,947,309, respectively.
7. INVESTMENTS IN FRANKLIN INSTITUTIONAL FIDUCIARY TRUST MONEY MARKET PORTFOLIO
The Fund may invest in the Franklin Institutional Fiduciary Trust Money Market Portfolio (Sweep Money Fund), an open-end investment company managed by Franklin Advisers, Inc. (an affiliate of the investment manager). Management fees paid by the Fund are reduced on assets invested in the Sweep Money Fund, in an amount not to exceed the management and administrative fees paid by the Sweep Money Fund.
8. REGULATORY AND LITIGATION MATTERS
As part of various investigations by a number of federal, state, and foreign regulators and governmental entities, including the Securities and Exchange Commission (“SEC”), relating to certain practices in the mutual fund industry, including late trading, market timing and marketing support payments to securities dealers who sell fund shares (“marketing support”), Franklin Resources, Inc. and certain of its subsidiaries (collectively, the “Company”), entered into settlements with certain of those regulators and governmental entities. Specifically, the Company entered into settlements with the SEC, among others, concerning market timing and marketing support.
On June 6, 2007, the SEC posted for public comment the proposed plan of distribution for the market timing settlement. Once the SEC approves the final plan of distribution, disbursements of settlement monies will be made promptly to individuals who were shareholders of the designated funds during the relevant period, in accordance with the terms and conditions of the settlement and plan.
FRD-18
Franklin Templeton Variable Insurance Products Trust
Notes to Financial Statements (continued)
Franklin Rising Dividends Securities Fund
8. REGULATORY AND LITIGATION MATTERS (continued)
In addition, the Company, as well as most of the mutual funds within Franklin Templeton Investments and certain current or former officers, Company directors, fund directors, and employees, have been named in private lawsuits (styled as shareholder class actions, or as derivative actions on behalf of either the named funds or Franklin Resources, Inc.). The lawsuits relate to the industry practices referenced above.
The Company and fund management believe that the claims made in each of the private lawsuits referenced above are without merit and intend to defend against them vigorously. The Company cannot predict with certainty the eventual outcome of these lawsuits, nor whether they will have a material negative impact on the Company. If it is determined that the Company bears responsibility for any unlawful or inappropriate conduct that caused losses to the Trust, it is committed to making the Trust or its shareholders whole, as appropriate.
9. NEW ACCOUNTING PRONOUNCEMENT
In September 2006, the Financial Accounting Standards Board (FASB) issued FASB Statement No. 157, “Fair Value Measurement” (SFAS 157), which defines fair value, establishes a framework for measuring fair value, and expands disclosures about fair value measurements. SFAS 157 is effective for fiscal years beginning after November 15, 2007, and interim periods within those fiscal years. The Trust believes the adoption of SFAS 157 will have no material impact on its financial statements.
FRD-19
Franklin Templeton Variable Insurance Products Trust
Franklin Rising Dividends Securities Fund
Report of Independent Registered Public Accounting Firm
To the Board of Trustees and Shareholders of
Franklin Templeton Variable Insurance Products Trust
In our opinion, the accompanying statement of assets and liabilities, including the statement of investments, and the related statements of operations and of changes in net assets and the financial highlights present fairly, in all material respects, the financial position of Franklin Rising Dividends Securities Fund (one of the funds constituting Franklin Templeton Variable Insurance Products Trust, hereafter referred to as the “Fund”) at December 31, 2007, the results of its operations for the year then ended, the changes in its net assets for each of the two years in the period then ended and the financial highlights for each of the five years in the period then ended, in conformity with accounting principles generally accepted in the United States of America. These financial statements and financial highlights (hereafter referred to as “financial statements”) are the responsibility of the Fund’s management. Our responsibility is to express an opinion on these financial statements based on our audits. We conducted our audits of these financial statements in accordance with the standards of the Public Company Accounting Oversight Board (United States). Those standards require that we plan and perform the audit to obtain reasonable assurance about whether the financial statements are free of material misstatement. An audit includes examining, on a test basis, evidence supporting the amounts and disclosures in the financial statements, assessing the accounting principles used and significant estimates made by management, and evaluating the overall financial statement presentation. We believe that our audits, which included confirmation of securities at December 31, 2007 by correspondence with the custodian and brokers, provide a reasonable basis for our opinion.
PricewaterhouseCoopers LLP
San Francisco, California
February 14, 2008
FRD-20
Franklin Templeton Variable Insurance Products Trust
Tax Designation (unaudited)
Franklin Rising Dividends Securities Fund
Under Section 852(b)(3)(C) of the Internal Revenue Code (Code), the Fund designates the maximum amount allowable but no less than $13,746,164 as a long term capital gain dividend for the fiscal year ended December 31, 2007.
Under Section 854(b)(2) of the Code, the Fund designates 85.75% of the ordinary income dividends as income qualifying for the dividends received deduction for the fiscal year ended December 31, 2007.
FRD-21
FRANKLIN SMALL CAP VALUE SECURITIES FUND
This annual report for Franklin Small Cap Value Securities Fund covers the fiscal year ended December 31, 2007.
Performance Summary as of 12/31/07
Average annual total return of Class 1 shares represents the average annual change in value, assuming reinvestment of dividends and capital gains. Average returns smooth out variations in returns, which can be significant; they are not the same as year-by-year results.
Periods ended 12/31/07
| | | | | | |
| | | 1-Year | | 5-Year | | Since
Inception
(5/1/98) |
Average Annual Total Return | | -2.14% | | +15.51% | | +8.07% |
Total Return Index Comparison
for Hypothetical $10,000 Investment (5/1/98–12/31/07)
The graph below shows the change in value of a hypothetical $10,000 investment in the Fund over the indicated period and includes reinvestment of any income or distributions. The Fund’s performance is compared to the performance of the Russell 2500™ Value Index. One cannot invest directly in an index, nor is an index representative of the Fund’s portfolio. Please see Important Notes to Performance Information preceding the Fund Summaries.
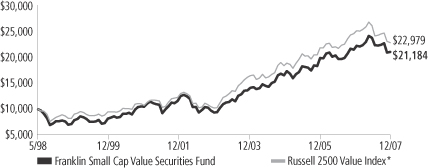
*Source: Standard & Poor’s Micropal. Please see Index Descriptions following the Fund Summaries.
Franklin Small Cap Value Securities Fund – Class 1
Performance reflects the Fund’s Class 1 operating expenses, but does not include any contract fees, expenses or sales charges. If they had been included, performance would be lower. These charges and deductions, particularly for variable life policies, can have a significant effect on contract values and insurance benefits. See the contract prospectus for a complete description of these expenses, including sales charges.
Performance data represent past performance, which does not guarantee future results. Investment return and principal value will fluctuate, and you may have a gain or loss when you sell your shares.
Current performance may differ from figures shown.
FSV-1
Fund Goal and Main Investments: Franklin Small Cap Value Securities Fund seeks long-term total return. The Fund normally invests at least 80% of its net assets in investments of small capitalization companies and normally invests predominantly in equity securities. For this Fund, small-capitalization companies are those with market capitalization values not exceeding $3.5 billion at the time of purchase. The Fund invests mainly in equity securities of companies that the manager believes are undervalued.
Performance Overview
You can find the Fund’s one-year total return in the Performance Summary. The Fund outperformed its benchmark, the Russell 2500 Value Index, which fell 7.27%.1 Please note that the Fund employs a bottom-up stock selection process, and the managers invest in securities without regard to benchmark comparisons.
Economic and Market Overview
During the 12 months ended December 31, 2007, the U.S. economy advanced at a moderate but uneven pace. Gross domestic product (GDP) grew an annualized 0.6% in the first quarter of 2007 but advanced in the second quarter at an annualized 3.8% rate. Federal defense spending, accelerating exports and declining imports, greater business inventory investment and increased spending for nonresidential structures supported growth. GDP grew an annualized 4.9% in the third quarter of 2007 despite a struggling housing market and the abrupt unraveling of the subprime mortgage market. The housing downturn affected the overall economy by fourth quarter 2007 as credit conditions worsened, consumer spending slowed, and GDP growth decelerated to an estimated 0.6% annualized rate.
The unemployment rate increased from 4.4% at the beginning of the period to 5.0% in December 2007.2 Although consumer confidence in July neared a six-year high, it declined through period-end largely due to rising mortgage and fuel costs, falling home prices and a weaker job market. Oil prices were volatile and established a new record high in November, nearing $99 per barrel. For the 12 months ended December 31, 2007, the core Consumer Price Index (CPI), which excludes food and energy costs, rose 2.4%, which was higher than its 10-year average rate.2
1. Source: Standard & Poor’s Micropal. One cannot invest directly in an index, nor is an index representative of the Fund’s portfolio. Please see Index Descriptions following the Fund Summaries.
2. Source: Bureau of Labor Statistics.
Fund Risks: The Fund’s investments in stocks offer the potential for long-term gains but can be subject to short-term price fluctuations. Smaller company securities can increase the risk of greater price volatility, particularly over the short term. Smaller or relatively new or unseasoned companies can be particularly sensitive to changing economic conditions, and their prospects for growth are less certain than those of larger, more established companies. Foreign investing, especially in emerging markets, involves additional risks, including currency fluctuations, economic instability, market volatility, and political and social instability. The Fund’s prospectus also includes a description of the main investment risks.
FSV-2
Facing the prospect of slower economic growth, the Federal Reserve Board lowered the federal funds target rate to 4.25% from 5.25% during the period. As investors fled riskier, poorer-performing assets, U.S. Treasuries rallied and the 10-year Treasury note yield fell from 4.71% at the beginning of the period to 4.04% on December 31, 2007.
Following sell-offs in late February and mid-March, stock markets rebounded amid generally strong first quarter corporate earnings reports. However, volatility picked up substantially in the latter half of the year due to investor concerns about slowing economic growth. The major stock indices recovered from a late-summer sell-off and a November correction, and the blue chip stocks of the Dow Jones Industrial Average posted a 12-month total return of +8.88%.3 The broader Standard & Poor’s 500 Index (S&P 500) returned +5.49%, and the technology-heavy NASDAQ Composite Index returned +11.53%.3 The energy, materials and utilities sectors performed particularly well. Large-capitalization stocks generally outperformed small caps, and growth stocks fared better than their value counterparts.
Investment Strategy
We are a research-driven, fundamental investment adviser, pursuing a disciplined, value-oriented strategy for the Fund. As a bottom-up adviser concentrating primarily on individual securities, we focus on the market price of a company’s securities relative to our evaluation of the company’s potential long-term earnings, asset value or cash flow. We seek bargains among the “unloved,” out-of-favor companies that offer, in our opinion, attractive long-term potential. These might include current growth companies that are being ignored by the market, former growth companies that have stumbled recently, dropping sharply in price but that still have significant growth potential, in our opinion, or companies that may be potential turnaround candidates or takeover targets.
Manager’s Discussion
During the 12 months under review, the Fund’s performance benefited from a variety of sectors. The portfolio’s best performing stock was farm equipment manufacturer CNH Global, which more than doubled in value during the period. The energy sector was a top contributor to
3. Source: Standard & Poor’s Micropal. Please see Index Descriptions following the Fund Summaries.

FSV-3
performance, mainly due to coal holdings CONSOL Energy and Arch Coal. The portfolio’s steel holdings also helped results, as Steel Dynamics, Gerdau AmeriSteel, and Reliance Steel & Aluminum each performed well.
The consumer discretionary sector detracted most from the Fund’s performance, mainly due to homebuilders M/I Homes, D.R. Horton and M.D.C. Holdings, which were hurt by weak home sales amid tighter credit standards and overbuilding. Another significant detractor from performance was the financials sector, mostly due to the effects of the subprime mortgage crisis, where Security Capital Assurance and PMI Group fell in value.
Four portfolio holdings announced takeovers during the fiscal year. In March, Lone Star Technologies, an oil-field equipment manufacturer, announced that it received a cash bid of $67.50 per share from U.S. Steel, a 39% increase over the prior day’s closing price. OMI announced in April that it received a cash bid from a joint venture formed by Teekay and A/S Dampskibsselskabet Torm to buy the company at a 5% increase over the prior day’s closing price for OMI’s shares. In July, First Indiana announced that Marshall & Isley bid $32.00 per share in cash, a 42% increase over the prior day’s closing price for First Indiana’s stock. Genlyte Group, a lighting fixture manufacturer, announced in November that Royal Philips offered $95.50 per share in cash for the company, a 51% premium over the prior day’s closing price. We view the merger and acquisition interest in the Fund’s portfolio as a measure of confirmation of our value stock selection.
The Fund initiated 14 positions in what we considered attractively valued securities including flexible packaging products manufacturer Bemis; electronics manufacturer Benchmark Electronics; bank holding company Corus Bankshares; electric motors and controls designer and manufacturer Franklin Electric; discount general merchandise store operator Fred’s; seaborne crude oil transportation provider General Maritime; automobile dealership operator Group 1 Automotive; health care equipment manufacturer Hillenbrand Industries; insurance holding company Old Republic International; semiconductor imaging devices provider Omnivision Technologies; financial guaranty insurer Security Capital Assurance; transportation, construction and industrial products manufacturer Trinity Industries; and TrustCo Bank Corp. NY. We also added significantly to several existing positions such as Brunswick, Protective Life and M.D.C. Holdings.
Top 10 Holdings
Franklin Small Cap Value
Securities Fund
12/31/07
| | |
Company
Sector/Industry | | % of Total
Net Assets |
| Steel Dynamics Inc. | | 3.7% |
| Materials | | |
| Mine Safety Appliances Co. | | 2.0% |
| Commercial Services & Supplies | | |
Aspen Insurance
Holdings Ltd. | | 1.9% |
| Insurance | | |
| CONSOL Energy Inc. | | 1.7% |
| Energy | | |
Reliance Steel
& Aluminum Co. | | 1.7% |
| Materials | | |
| Gerdau AmeriSteel Corp. (Canada) | | 1.6% |
| Materials | | |
| Old Republic International Corp. | | 1.6% |
| Insurance | | |
| Peabody Energy Corp. | | 1.5% |
| Energy | | |
| Mueller Industries Inc. | | 1.5% |
| Capital Goods | | |
| Thor Industries Inc. | | 1.5% |
| Automobiles & Components | | |
The dollar value, number of shares or principal amount, and names of all portfolio holdings are listed in the Fund’s Statement of Investments.
FSV-4
The Fund liquidated 15 positions during the period. As a result of previously announced takeovers, we tendered our shares of Aztar and Lone Star Technologies for cash. We sold the other positions because we believed they were fully valued or the fundamentals deteriorated. We also took profits in many positions including Kennametal, Omnivision and Steel Dynamics.
Thank you for your participation in Franklin Small Cap Value Securities Fund. We look forward to serving your future investment needs.
The foregoing information reflects our analysis, opinions and portfolio holdings as of December 31, 2007, the end of the reporting period. The way we implement our main investment strategies and the resulting portfolio holdings may change depending on factors such as market and economic conditions. These opinions may not be relied upon as investment advice or an offer for a particular security. The information is not a complete analysis of every aspect of any market, country, industry, security or the Fund. Statements of fact are from sources considered reliable, but the investment manager makes no representation or warranty as to their completeness or accuracy. Although historical performance is no guarantee of future results, these insights may help you understand our investment management philosophy.
FSV-5
Fund Expenses
As an investor in a variable insurance contract (Contract) that indirectly provides for investment in an underlying mutual fund, you can incur transaction and/or ongoing expenses at both the Fund level and the Contract level.
| • | | Transaction expenses can include sales charges (loads) on purchases, redemption fees, surrender fees, transfer fees and premium taxes. |
| • | | Ongoing expenses can include management fees, distribution and service (12b-1) fees, contract fees, annual maintenance fees, mortality and expense risk fees and other fees and expenses. All mutual funds and Contracts have some types of ongoing expenses. |
The expenses shown in the table are meant to highlight ongoing expenses at the Fund level only and do not include ongoing expenses at the Contract level, or transaction expenses at either the Fund or Contract level. While the Fund does not have transaction expenses, if the transaction and ongoing expenses at the Contract level were included, the expenses shown below would be higher. You should consult your Contract prospectus or disclosure document for more information.
The table shows Fund-level ongoing expenses and can help you understand these expenses and compare them with those of other mutual funds offered through the Contract. The table assumes a $1,000 investment held for the six months indicated. Please refer to the Fund prospectus for additional information on operating expenses.
Actual Fund Expenses
The first line (Actual) of the table provides actual account values and expenses. The “Ending Account Value” is derived from the Fund’s actual return, which includes the effect of ongoing Fund expenses, but does not include the effect of ongoing Contract expenses.
You can estimate the Fund-level expenses you incurred during the period by following these steps. Of course, your account value and expenses will differ from those in this illustration:
| 1. | Divide your account value by $1,000. |
If an account had an $8,600 value, then $8,600 ÷ $1,000 = 8.6.
| 2. | Multiply the result by the number under the heading “Fund-Level Expenses Incurred During Period.” |
If Fund-Level Expenses Incurred During Period were $7.50, then
8.6 x $7.50 = $64.50.
In this illustration, the estimated expenses incurred this period at the Fund level are $64.50.
Franklin Small Cap Value Securities Fund – Class 1
FSV-6
Hypothetical Example for Comparison with Other Mutual Funds
Information in the second line (Hypothetical) of the table can help you compare ongoing expenses of the Fund with those of other mutual funds offered through the Contract. This information may not be used to estimate the actual ending account balance or expenses you incurred during the period. The hypothetical “Ending Account Value” is based on the Fund’s actual expense ratio and an assumed 5% annual rate of return before expenses, which does not represent the Fund’s actual return. The figure under the heading “Fund-Level Expenses Incurred During Period” shows the hypothetical expenses your account would have incurred under this scenario. You can compare this figure with the 5% hypothetical examples that appear in shareholder reports of other funds offered through a Contract.
| | | | | | | | | |
| Class 1 | | Beginning
Account Value 7/1/07 | | Ending
Account
Value 12/31/07 | | Fund-Level
Expenses Incurred
During Period*
7/1/07–12/31/07 |
Actual | | $ | 1,000 | | $ | 884.00 | | $ | 3.09 |
Hypothetical (5% return before expenses) | | $ | 1,000 | | $ | 1,021.93 | | $ | 3.31 |
*Expenses are calculated using the most recent six-month annualized expense ratio for the Fund’s Class 1 shares (0.65%), which does not include any ongoing expenses of the Contract for which the Fund is an investment option, multiplied by the average account value over the period, multiplied by 184/365 to reflect the one-half year period.
FSV-7
Franklin Templeton Variable Insurance Products Trust
Financial Highlights
Franklin Small Cap Value Securities Fund
| | | | | | | | | | | | | | | | | | | | |
| | | Year Ended December 31, | |
| Class 1 | | 2007 | | | 2006 | | | 2005 | | | 2004 | | | 2003 | |
| | | | |
Per share operating performance | | | | | | | | | | | | | | | | | | | | |
(for a share outstanding throughout the year) | | | | | | | | | | | | | | | | | | | | |
Net asset value, beginning of year | | $ | 19.07 | | | $ | 17.02 | | | $ | 15.85 | | | $ | 12.81 | | | $ | 9.70 | |
| | | | |
Income from investment operationsa: | | | | | | | | | | | | | | | | | | | | |
Net investment incomeb | | | 0.22 | | | | 0.18 | | | | 0.17 | | | | 0.21 | | | | 0.06 | |
Net realized and unrealized gains (losses) | | | (0.44 | ) | | | 2.69 | | | | 1.24 | | | | 2.87 | | | | 3.08 | |
| | | | |
Total from investment operations | | | (0.22 | ) | | | 2.87 | | | | 1.41 | | | | 3.08 | | | | 3.14 | |
| | | | |
Less distributions from: | | | | | | | | | | | | | | | | | | | | |
Net investment income | | | (0.17 | ) | | | (0.16 | ) | | | (0.14 | ) | | | (0.04 | ) | | | (0.03 | ) |
Net realized gains | | | (1.30 | ) | | | (0.66 | ) | | | (0.10 | ) | | | — | | | | — | |
| | | | |
Total distributions | | | (1.47 | ) | | | (0.82 | ) | | | (0.24 | ) | | | (0.04 | ) | | | (0.03 | ) |
| | | | |
Net asset value, end of year | | $ | 17.38 | | | $ | 19.07 | | | $ | 17.02 | | | $ | 15.85 | | | $ | 12.81 | |
| | | | |
| | | | | |
Total returnc | | | (2.14)% | | | | 17.30% | | | | 8.99% | | | | 24.09% | | | | 32.47% | |
Ratios to average net assets | | | | | | | | | | | | | | | | | | | | |
Expenses | | | 0.64% | d | | | 0.65% | d | | | 0.64% | d | | | 0.67% | d | | | 0.74% | |
Net investment income | | | 1.13% | | | | 0.97% | | | | 1.05% | | | | 1.59% | | | | 0.63% | |
| | | | | |
Supplemental data | | | | | | | | | | | | | | | | | | | | |
Net assets, end of year (000’s) | | $ | 57,045 | | | $ | 73,154 | | | $ | 52,632 | | | $ | 50,401 | | | $ | 37,108 | |
Portfolio turnover rate | | | 16.27% | | | | 16.43% | e | | | 11.03% | | | | 9.50% | | | | 12.52% | |
a The amount shown for a share outstanding throughout the period may not correlate with the Statement of Operations for the period due to the timing of sales and repurchases of the Fund shares in relation to income earned and/or fluctuating market value of the investments of the Fund.
b Based on average daily shares outstanding.
c Total return does not include any fees, charges or expenses imposed by the variable annuity and life insurance contracts for which the Franklin Templeton Variable Insurance Products Trust serves as an underlying investment vehicle.
d Benefit of expense reduction rounds to less than 0.01%.
e Excludes the value of portfolio securities delivered as a result of a redemption in-kind. See Note 9.
The accompanying notes are an integral part of these financial statements.
FSV-8
Franklin Templeton Variable Insurance Products Trust
Financial Highlights (continued)
Franklin Small Cap Value Securities Fund
| | | | | | | | | | | | | | | | | | | | |
| | | Year Ended December 31, | |
| Class 2 | | 2007 | | | 2006 | | | 2005 | | | 2004 | | | 2003 | |
| | | | |
Per share operating performance | | | | | | | | | | | | | | | | | | | | |
(for a share outstanding throughout the year) | | | | | | | | | | | | | | | | | | | | |
Net asset value, beginning of year | | $ | 18.79 | | | $ | 16.79 | | | $ | 15.65 | | | $ | 12.67 | | | $ | 9.61 | |
| | | | |
Income from investment operationsa: | | | | | | | | | | | | | | | | | | | | |
Net investment incomeb | | | 0.17 | | | | 0.13 | | | | 0.13 | | | | 0.18 | | | | 0.04 | |
Net realized and unrealized gains (losses) | | | (0.43 | ) | | | 2.65 | | | | 1.23 | | | | 2.82 | | | | 3.04 | |
| | | | |
Total from investment operations | | | (0.26 | ) | | | 2.78 | | | | 1.36 | | | | 3.00 | | | | 3.08 | |
| | | | |
Less distributions from: | | | | | | | | | | | | | | | | | | | | |
Net investment income | | | (0.13 | ) | | | (0.12 | ) | | | (0.12 | ) | | | (0.02 | ) | | | (0.02 | ) |
Net realized gains | | | (1.30 | ) | | | (0.66 | ) | | | (0.10 | ) | | | — | | | | — | |
| | | | |
Total distributions | | | (1.43 | ) | | | (0.78 | ) | | | (0.22 | ) | | | (0.02 | ) | | | (0.02 | ) |
| | | | |
Net asset value, end of year | | $ | 17.10 | | | $ | 18.79 | | | $ | 16.79 | | | $ | 15.65 | | | $ | 12.67 | |
| | | | |
| | | | | |
Total returnc | | | (2.38)% | | | | 16.98% | | | | 8.77% | | | | 23.75% | | | | 32.12% | |
Ratios to average net assets | | | | | | | | | | | | | | | | | | | | |
Expenses | | | 0.89% | d | | | 0.90% | d | | | 0.89% | d | | | 0.92% | d | | | 0.99% | |
Net investment income | | | 0.88% | | | | 0.72% | | | | 0.80% | | | | 1.34% | | | | 0.38% | |
| | | | | |
Supplemental data | | | | | | | | | | | | | | | | | | | | |
Net assets, end of year (000’s) | | $ | 1,177,367 | | | $ | 1,240,892 | | | $ | 1,094,120 | | | $ | 748,762 | | | $ | 333,625 | |
Portfolio turnover rate | | | 16.27% | | | | 16.43% | e | | | 11.03% | | | | 9.50% | | | | 12.52% | |
a The amount shown for a share outstanding throughout the period may not correlate with the Statement of Operations for the period due to the timing of sales and repurchases of the Fund shares in relation to income earned and/or fluctuating market value of the investments of the Fund.
b Based on average daily shares outstanding.
c Total return does not include any fees, charges or expenses imposed by the variable annuity and life insurance contracts for which the Franklin Templeton Variable Insurance Products Trust serves as an underlying investment vehicle.
d Benefit of expense reduction rounds to less than 0.01%.
e Excludes the value of portfolio securities delivered as a result of a redemption in-kind. See Note 9.
The accompanying notes are an integral part of these financial statements.
FSV-9
Franklin Templeton Variable Insurance Products Trust
Statement of Investments, December 31, 2007
| | | | | |
| Franklin Small Cap Value Securities Fund | | Shares | | Value |
Long Term Investments 98.4% | | | | | |
Common Stocks 98.3% | | | | | |
Automobiles & Components 3.6% | | | | | |
Gentex Corp. | | 205,443 | | $ | 3,650,722 |
Monaco Coach Corp. | | 825,800 | | | 7,333,104 |
aSuperior Industries International Inc. | | 155,500 | | | 2,825,435 |
Thor Industries Inc. | | 483,300 | | | 18,370,233 |
aWinnebago Industries Inc. | | 600,000 | | | 12,612,000 |
| | | | | |
| | | | | 44,791,494 |
| | | | | |
Banks 3.6% | | | | | |
aChemical Financial Corp. | | 461,354 | | | 10,975,612 |
aCorus Bankshares Inc. | | 597,600 | | | 6,376,392 |
Peoples Bancorp Inc. | | 199,400 | | | 4,963,066 |
aThe PMI Group Inc. | | 508,000 | | | 6,746,240 |
aTrustCo Bank Corp. NY | | 1,580,000 | | | 15,673,600 |
| | | | | |
| | | | | 44,734,910 |
| | | | | |
Capital Goods 20.0% | | | | | |
A.O. Smith Corp. | | 112,500 | | | 3,943,125 |
aAmerican Woodmark Corp. | | 359,310 | | | 6,532,256 |
Apogee Enterprises Inc. | | 717,600 | | | 12,278,136 |
Brady Corp., A | | 522,600 | | | 18,338,034 |
Briggs & Stratton Corp. | | 342,100 | | | 7,751,986 |
Carlisle Cos. Inc. | | 311,000 | | | 11,516,330 |
CIRCOR International Inc. | | 273,600 | | | 12,684,096 |
CNH Global NV (Netherlands) | | 84,000 | | | 5,528,880 |
bEMCOR Group Inc. | | 169,600 | | | 4,007,648 |
aFranklin Electric Co. Inc. | | 131,232 | | | 5,022,249 |
bGenlyte Group Inc. | | 79,200 | | | 7,539,840 |
Gibraltar Industries Inc. | | 1,079,800 | | | 16,650,516 |
Graco Inc. | | 458,200 | | | 17,072,532 |
Kennametal Inc. | | 416,000 | | | 15,749,760 |
Mueller Industries Inc. | | 601,700 | | | 17,443,283 |
Nordson Corp. | | 120,000 | | | 6,955,200 |
bPowell Industries Inc. | | 62,600 | | | 2,758,782 |
Roper Industries Inc. | | 195,000 | | | 12,195,300 |
aSimpson Manufacturing Co. Inc. | | 353,000 | | | 9,386,270 |
Teleflex Inc. | | 150,000 | | | 9,451,500 |
Timken Co. | | 20,400 | | | 670,140 |
Trinity Industries Inc. | | 248,500 | | | 6,898,360 |
Universal Forest Products Inc. | | 575,000 | | | 16,939,500 |
Wabash National Corp. | | 1,259,200 | | | 9,683,248 |
aWatts Water Technologies Inc., A | | 341,300 | | | 10,170,740 |
| | | | | |
| | | | | 247,167,711 |
| | | | | |
Commercial Services & Supplies 3.0% | | | | | |
ABM Industries Inc. | | 584,552 | | | 11,919,015 |
Mine Safety Appliances Co. | | 475,000 | | | 24,638,250 |
| | | | | |
| | | | | 36,557,265 |
| | | | | |
Consumer Durables & Apparel 8.1% | | | | | |
Bassett Furniture Industries Inc. | | 256,200 | | | 2,392,908 |
Brunswick Corp. | | 601,300 | | | 10,252,165 |
D.R. Horton Inc. | | 270,600 | | | 3,563,802 |
Ethan Allen Interiors Inc. | | 442,000 | | | 12,597,000 |
FSV-10
Franklin Templeton Variable Insurance Products Trust
Statement of Investments, December 31, 2007 (continued)
| | | | | |
| Franklin Small Cap Value Securities Fund | | Shares | | Value |
Long Term Investments (continued) | | | | | |
Common Stocks (continued) | | | | | |
Consumer Durables & Apparel (continued) | | | | | |
Hooker Furniture Corp. | | 569,800 | | $ | 11,452,980 |
aLa-Z-Boy Inc. | | 1,098,500 | | | 8,711,105 |
aM/I Homes Inc. | | 593,700 | | | 6,233,850 |
M.D.C. Holdings Inc. | | 320,000 | | | 11,881,600 |
bRuss Berrie and Co. Inc. | | 649,200 | | | 10,620,912 |
bTimberland Co., A | | 277,200 | | | 5,011,776 |
bThe Warnaco Group Inc. | | 509,100 | | | 17,716,680 |
| | | | | |
| | | | | 100,434,778 |
| | | | | |
Consumer Services 1.3% | | | | | |
Regis Corp. | | 583,900 | | | 16,325,844 |
| | | | | |
Energy 13.0% | | | | | |
Arch Coal Inc. | | 280,600 | | | 12,607,358 |
bAtwood Oceanics Inc. | | 109,600 | | | 10,986,304 |
bBristow Group Inc. | | 287,500 | | | 16,286,875 |
CONSOL Energy Inc. | | 293,700 | | | 21,005,424 |
General Maritime Corp. | | 10,800 | | | 264,060 |
bGlobal Industries Ltd. | | 195,000 | | | 4,176,900 |
bHelix Energy Solutions Group Inc. | | 425,900 | | | 17,674,850 |
bOil States International Inc. | | 326,900 | | | 11,153,828 |
Overseas Shipholding Group Inc. | | 199,100 | | | 14,819,013 |
Peabody Energy Corp. | | 307,100 | | | 18,929,644 |
Rowan Cos. Inc. | | 222,600 | | | 8,783,796 |
Teekay Corp. (Bahamas) | | 234,654 | | | 12,485,939 |
Tidewater Inc. | | 81,700 | | | 4,482,062 |
bUnit Corp. | | 145,000 | | | 6,706,250 |
| | | | | |
| | | | | 160,362,303 |
| | | | | |
Food & Staples Retailing 1.2% | | | | | |
Casey’s General Stores Inc. | | 510,000 | | | 15,101,100 |
| | | | | |
Food, Beverage & Tobacco 0.3% | | | | | |
Bunge Ltd. | | 30,900 | | | 3,597,069 |
| | | | | |
Health Care Equipment & Services 2.2% | | | | | |
Hillenbrand Industries Inc. | | 127,200 | | | 7,088,856 |
STERIS Corp. | | 330,000 | | | 9,517,200 |
West Pharmaceutical Services Inc. | | 254,400 | | | 10,326,096 |
| | | | | |
| | | | | 26,932,152 |
| | | | | |
Insurance 10.0% | | | | | |
American National Insurance Co. | | 50,200 | | | 6,086,248 |
Arthur J. Gallagher & Co. | | 229,500 | | | 5,551,605 |
Aspen Insurance Holdings Ltd. | | 800,000 | | | 23,072,000 |
Erie Indemnity Co., A | | 3,700 | | | 191,993 |
IPC Holdings Ltd. | | 604,600 | | | 17,454,802 |
aMontpelier Re Holdings Ltd. (Bermuda) | | 1,022,300 | | | 17,389,323 |
Old Republic International Corp. | | 1,250,000 | | | 19,262,500 |
Protective Life Corp. | | 220,000 | | | 9,024,400 |
RLI Corp. | | 151,100 | | | 8,580,969 |
aSecurity Capital Assurance Ltd. | | 1,369,600 | | | 5,327,744 |
StanCorp Financial Group Inc. | | 232,000 | | | 11,688,160 |
| | | | | |
| | | | | 123,629,744 |
| | | | | |
FSV-11
Franklin Templeton Variable Insurance Products Trust
Statement of Investments, December 31, 2007 (continued)
| | | | | |
| Franklin Small Cap Value Securities Fund | | Shares | | Value |
Long Term Investments (continued) | | | | | |
Common Stocks (continued) | | | | | |
Materials 15.9% | | | | | |
aAbitibiBowater Inc. | | 249,288 | | $ | 5,137,826 |
Airgas Inc. | | 297,700 | | | 15,513,147 |
AptarGroup Inc. | | 337,900 | | | 13,823,489 |
Bemis Co. Inc. | | 184,000 | | | 5,037,920 |
Cabot Corp. | | 275,000 | | | 9,168,500 |
Gerdau Ameristeel Corp. (Canada) | | 1,428,000 | | | 20,306,160 |
Glatfelter | | 752,000 | | | 11,513,120 |
bMercer International Inc. (Germany) | | 599,100 | | | 4,690,953 |
Reliance Steel & Aluminum Co. | | 384,100 | | | 20,818,220 |
RPM International Inc. | | 791,500 | | | 16,067,450 |
Steel Dynamics Inc. | | 761,500 | | | 45,362,555 |
United States Steel Corp. | | 109,500 | | | 13,239,645 |
Westlake Chemical Corp. | | 795,400 | | | 15,104,646 |
| | | | | |
| | | | | 195,783,631 |
| | | | | |
Pharmaceuticals, Biotechnology & Life Sciences 0.5% | | | | | |
Pharmaceutical Product Development Inc. | | 145,600 | | | 5,877,872 |
| | | | | |
Real Estate 0.3% | | | | | |
aArbor Realty Trust Inc. | | 244,700 | | | 3,942,117 |
| | | | | |
Retailing 5.7% | | | | | |
Brown Shoe Co. Inc. | | 547,500 | | | 8,305,575 |
Christopher & Banks Corp. | | 803,100 | | | 9,195,495 |
Fred’s Inc. | | 384,800 | | | 3,705,624 |
Group 1 Automotive Inc. | | 349,000 | | | 8,288,750 |
bGymboree Corp. | | 146,200 | | | 4,453,252 |
bHot Topic Inc. | | 653,100 | | | 3,801,042 |
The Men’s Wearhouse Inc. | | 185,100 | | | 4,993,998 |
a,bPier 1 Imports Inc. | | 1,414,300 | | | 7,396,789 |
aTuesday Morning Corp. | | 1,159,200 | | | 5,877,144 |
bWest Marine Inc. | | 845,600 | | | 7,593,488 |
bZale Corp. | | 440,000 | | | 7,066,400 |
| | | | | |
| | | | | 70,677,557 |
| | | | | |
Semiconductors & Semiconductor Equipment 1.2% | | | | | |
Cohu Inc. | | 638,500 | | | 9,769,050 |
a,bOmniVision Technologies Inc. | | 300,000 | | | 4,695,000 |
| | | | | |
| | | | | 14,464,050 |
| | | | | |
Technology Hardware & Equipment 3.6% | | | | | |
bAvocent Corp. | | 606,000 | | | 14,125,860 |
bBenchmark Electronics Inc. | | 640,000 | | | 11,347,200 |
Diebold Inc. | | 46,400 | | | 1,344,672 |
bMettler-Toledo International Inc. (Switzerland) | | 155,000 | | | 17,639,000 |
| | | | | |
| | | | | 44,456,732 |
| | | | | |
Transportation 2.8% | | | | | |
bDollar Thrifty Automotive Group Inc. | | 167,800 | | | 3,973,504 |
bGenesee & Wyoming Inc. | | 535,200 | | | 12,935,784 |
bKansas City Southern | | 146,000 | | | 5,012,180 |
SkyWest Inc. | | 491,500 | | | 13,196,775 |
| | | | | |
| | | | | 35,118,243 |
| | | | | |
FSV-12
Franklin Templeton Variable Insurance Products Trust
Statement of Investments, December 31, 2007 (continued)
| | | | | | |
| Franklin Small Cap Value Securities Fund | | Shares | | Value | |
Long Term Investments (continued) | | | | | | |
Common Stocks (continued) | | | | | | |
Utilities 2.0% | | | | | | |
Atmos Energy Corp. | | 170,100 | | $ | 4,769,604 | |
Energen Corp. | | 175,000 | | | 11,240,250 | |
Sierra Pacific Resources | | 483,200 | | | 8,204,736 | |
| | | | | | |
| | | | | 24,214,590 | |
| | | | | | |
Total Common Stocks (Cost $1,062,734,937) | | | | | 1,214,169,162 | |
| | | | | | |
| | |
| | | Principal
Amount | | | |
Corporate Bond (Cost $1,477,264) 0.1% | | | | | | |
Capital Goods 0.1% | | | | | | |
Mueller Industries Inc., 6.00%, 11/01/14 | | $1,494,000 | | | 1,353,937 | |
| | | | | | |
Total Long Term Investments (Cost $1,064,212,201) | | | | | 1,215,523,099 | |
| | | | | | |
| | |
| | | Shares | | | |
Short Term Investments 10.0% | | | | | | |
Money Market Fund (Cost $18,429,361) 1.5% | | | | | | |
cFranklin Institutional Fiduciary Trust Money Market Portfolio, 4.58% | | 18,429,361 | | | 18,429,361 | |
| | | | | | |
dInvestments from Cash Collateral Received for Loaned Securities 8.5% | | | | | | |
Money Market Fund (Cost $104,707,000) 8.5% | | | | | | |
eBank of New York Institutional Cash Reserve Fund, 5.06% | | 104,707,000 | | | 104,707,000 | |
| | | | | | |
Total Investments (Cost $1,187,348,562) 108.4% | | | | | 1,338,659,460 | |
Other Assets, less Liabilities (8.4)% | | | | | (104,247,339 | ) |
| | | | | | |
Net Assets 100.0% | | | | $ | 1,234,412,121 | |
| | | | | | |
a A portion or all of the security is on loan as of December 31, 2007. See Note 1(d).
b Non-income producing for the twelve months ended December 31, 2007.
c See Note 7 regarding investments in the Franklin Institutional Fiduciary Trust Money Market Portfolio. The rate shown is the annualized seven-day yield at period end.
d See Note 1(d) regarding securities on loan.
e The rate shown is the annualized seven-day yield at period end.
The accompanying notes are an integral part of these financial statements.
FSV-13
Franklin Templeton Variable Insurance Products Trust
Financial Statements
Statement of Assets and Liabilities
December 31, 2007
| | | |
| | | Franklin Small
Cap Value
Securities Fund |
Assets: | | | |
Investments in securities: | | | |
Cost - Unaffiliated issuers | | $ | 1,168,919,201 |
Cost - Sweep Money Fund (Note 7) | | | 18,429,361 |
| | | |
Total cost of investments | | $ | 1,187,348,562 |
| | | |
Value - Unaffiliated issuers | | $ | 1,320,230,099 |
Value - Sweep Money Fund (Note 7) | | | 18,429,361 |
| | | |
Total value of investmentsa | | | 1,338,659,460 |
Receivables: | | | |
Investment securities sold | | | 97,574 |
Capital shares sold | | | 1,304,395 |
Dividends and interest | | | 1,435,165 |
| | | |
Total assets | | | 1,341,496,594 |
| | | |
Liabilities: | | | |
Payables: | | | |
Investment securities purchased | | | 321,887 |
Capital shares redeemed | | | 663,646 |
Affiliates | | | 1,167,647 |
Payable upon return of securities loaned | | | 104,707,000 |
Accrued expenses and other liabilities | | | 224,293 |
| | | |
Total liabilities | | | 107,084,473 |
| | | |
Net assets, at value | | $ | 1,234,412,121 |
| | | |
Net assets consist of: | | | |
Paid-in capital | | $ | 986,429,102 |
Undistributed net investment income | | | 12,271,143 |
Net unrealized appreciation (depreciation) | | | 151,310,898 |
Accumulated net realized gain (loss) | | | 84,400,978 |
| | | |
Net assets, at value | | $ | 1,234,412,121 |
| | | |
Class 1: | | | |
Net assets, at value | | $ | 57,045,460 |
| | | |
Shares outstanding | | | 3,282,137 |
| | | |
Net asset value and maximum offering price per share | | $ | 17.38 |
| | | |
Class 2: | | | |
Net assets, at value | | $ | 1,177,366,661 |
| | | |
Shares outstanding | | | 68,843,530 |
| | | |
Net asset value and maximum offering price per share | | $ | 17.10 |
| | | |
a | Includes $100,193,583 of securities loaned. |
The accompanying notes are an integral part of these financial statements.
FSV-14
Franklin Templeton Variable Insurance Products Trust
Financial Statements (continued)
Statement of Operations
for the year ended December 31, 2007
| | | | |
| | | Franklin Small
Cap Value
Securities Fund | |
Investment income: | | | | |
Dividends: | | | | |
Unaffiliated issuers | | $ | 18,921,156 | |
Non-controlled affiliated issuers (Note 8) | | | 277,002 | |
Sweep Money Fund (Note 7) | | | 3,222,074 | |
Interest | | | 91,544 | |
Income from securities loaned | | | 1,750,245 | |
| | | | |
Total investment income | | | 24,262,021 | |
| | | | |
Expenses: | | | | |
Management fees (Note 3a) | | | 6,764,154 | |
Administrative fees (Note 3b) | | | 1,606,224 | |
Distribution fees - Class 2 (Note 3c) | | | 3,263,851 | |
Unaffiliated transfer agent fees | | | 24,568 | |
Custodian fees (Note 4) | | | 23,250 | |
Reports to shareholders | | | 291,513 | |
Professional fees | | | 58,470 | |
Trustees’ fees and expenses | | | 5,950 | |
Other | | | 33,547 | |
| | | | |
Total expenses | | | 12,071,527 | |
Expense reductions (Note 4) | | | (11,659 | ) |
| | | | |
Net expenses | | | 12,059,868 | |
| | | | |
Net investment income | | | 12,202,153 | |
| | | | |
Realized and unrealized gains (losses): | | | | |
Net realized gain (loss) from: | | | | |
Investments: | | | | |
Unaffiliated Issuers | | | 84,483,802 | |
Non-controlled affiliated issuers (Note 8) | | | (39,135 | ) |
| | | | |
Net realized gain (loss) | | | 84,444,667 | |
| | | | |
Net change in unrealized appreciation (depreciation) on investments | | | (125,870,314 | ) |
| | | | |
Net realized and unrealized gain (loss) | | | (41,425,647 | ) |
| | | | |
Net increase (decrease) in net assets resulting from operations | | $ | (29,223,494 | ) |
| | | | |
The accompanying notes are an integral part of these financial statements.
FSV-15
Franklin Templeton Variable Insurance Products Trust
Financial Statements (continued)
Statements of Changes in Net Assets
| | | | | | | | |
| | | Franklin Small Cap Value
Securities Fund | |
| | | Year Ended December 31, | |
| | | 2007 | | | 2006 | |
| | | | |
Increase (decrease) in net assets: | | | | | | | | |
Operations: | | | | | | | | |
Net investment income | | $ | 12,202,153 | | | $ | 9,007,859 | |
Net realized gain (loss) from investments, foreign currency transactions and redemption in-kind (Note 9) | | | 84,444,667 | | | | 129,171,979 | |
Net change in unrealized appreciation (depreciation) on investments | | | (125,870,314 | ) | | | 60,596,649 | |
| | | | |
Net increase (decrease) in net assets resulting from operations | | | (29,223,494 | ) | | | 198,776,487 | |
| | | | |
Distributions to shareholders from: | | | | | | | | |
Net investment income: | | | | | | | | |
Class 1 | | | (643,430 | ) | | | (458,447 | ) |
Class 2 | | | (8,499,152 | ) | | | (7,048,261 | ) |
Net realized gains: | | | | | | | | |
Class 1 | | | (4,923,222 | ) | | | (1,928,529 | ) |
Class 2 | | | (87,395,798 | ) | | | (39,440,268 | ) |
| | | | |
Total distributions to shareholders | | | (101,461,602 | ) | | | (48,875,505 | ) |
| | | | |
Capital share transactions: (Note 2) | | | | | | | | |
Class 1 | | | (10,544,872 | ) | | | 13,405,343 | |
Class 2 | | | 61,595,731 | | | | 3,988,424 | |
| | | | |
Total capital share transactions | | | 51,050,859 | | | | 17,393,767 | |
| | | | |
Net increase (decrease) in net assets | | | (79,634,237 | ) | | | 167,294,749 | |
Net assets: | | | | | | | | |
Beginning of year | | | 1,314,046,358 | | | | 1,146,751,609 | |
| | | | |
End of year | | $ | 1,234,412,121 | | | $ | 1,314,046,358 | |
| | | | |
Undistributed net investment income included in net assets: | | | | | | | | |
End of year | | $ | 12,271,143 | | | $ | 9,206,329 | |
| | | | |
The accompanying notes are an integral part of these financial statements.
FSV-16
Franklin Templeton Variable Insurance Products Trust
Notes to Financial Statements
Franklin Small Cap Value Securities Fund
1. ORGANIZATION AND SIGNIFICANT ACCOUNTING POLICIES
Franklin Templeton Variable Insurance Products Trust (Trust) is registered under the Investment Company Act of 1940, as amended, (1940 Act) as an open-end investment company, consisting of twenty-three separate funds. The Franklin Small Cap Value Securities Fund (Fund) included in this report is diversified. The financial statements of the remaining funds in the Trust are presented separately. Shares of the Fund are sold only to insurance company separate accounts to fund the benefits of variable life insurance policies or variable annuity contracts. The Fund offers two classes of shares: Class 1 and Class 2. Each class of shares differs by its distribution fees, voting rights on matters affecting a single class and its exchange privilege.
The following summarizes the Fund’s significant accounting policies.
a. Security Valuation
Securities listed on a securities exchange or on the NASDAQ National Market System are valued at the last quoted sale price or the official closing price of the day, respectively. Over-the-counter securities and listed securities for which there is no reported sale are valued within the range of the most recent quoted bid and ask prices. Securities that trade in multiple markets or on multiple exchanges are valued according to the broadest and most representative market. Investments in open-end mutual funds are valued at the closing net asset value.
Corporate debt securities generally trade in the over-the-counter market rather than on a securities exchange. The Trust may utilize independent pricing services, quotations from bond dealers, and information with respect to bond and note transactions, to assist in determining a current market value for each security. The Trust’s pricing services may use valuation models or matrix pricing which considers information with respect to comparable bond and note transactions, quotations from bond dealers, or by reference to other securities that are considered comparable in such characteristics as rating, interest rate and maturity date, option adjusted spread models, prepayment projections, interest rate spreads and yield curves, to determine current value.
Foreign securities are valued as of the close of trading on the foreign stock exchange on which the security is primarily traded, or the NYSE, whichever is earlier. If no sale is reported at that time, the foreign security will be valued within the range of the most recent quoted bid and ask prices. The value is then converted into its U.S. dollar equivalent at the foreign exchange rate in effect at the close of the NYSE on the day that the value of the foreign security is determined.
The Trust has procedures to determine the fair value of individual securities and other assets for which market prices are not readily available or which may not be reliably priced. Methods for valuing these securities may include: fundamental analysis, matrix pricing, discounts from market prices of similar securities, or discounts applied due to the nature and duration of restrictions on the disposition of the securities. Due to the inherent uncertainty of valuations of such securities, the fair values may differ significantly from the values that would have been used had a ready market for such investments existed. Occasionally, events occur between the time at which trading in a security is completed and the close of the NYSE that might call into question the availability (including the reliability) of the value of a portfolio security held by the Fund. The investment manager monitors price movements following the close of trading in foreign stock markets through a series of country specific market proxies (such as baskets of American Depository Receipts, futures contracts and exchange traded funds). These price movements are measured against established trigger thresholds for each specific market proxy to assist in determining if an event has occurred. If such an event occurs, the securities may be valued using fair value procedures, which may include the use of independent pricing services. All security valuation procedures are approved by the Trust’s Board of Trustees.
b. Foreign Currency Translation
Portfolio securities and other assets and liabilities denominated in foreign currencies are translated into U.S. dollars based on the exchange rate of such currencies against U.S. dollars on the date of valuation. Purchases and sales of securities, income and expense items denominated in foreign currencies are translated into U.S. dollars at the exchange rate in effect on the transaction date. Occasionally, events may impact the availability or reliability of foreign exchange rates used to convert the U.S. dollar
FSV-17
Franklin Templeton Variable Insurance Products Trust
Notes to Financial Statements (continued)
Franklin Small Cap Value Securities Fund
1. ORGANIZATION AND SIGNIFICANT ACCOUNTING POLICIES (continued)
b. Foreign Currency Translation (continued)
equivalent value. If such an event occurs, the foreign exchange rate will be valued at fair value using procedures established and approved by the Trust’s Board of Trustees.
The Fund does not separately report the effect of changes in foreign exchange rates from changes in market prices on securities held. Such changes are included in net realized and unrealized gain or loss from investments on the Statement of Operations.
Realized foreign exchange gains or losses arise from sales of foreign currencies, currency gains or losses realized between the trade and settlement dates on securities transactions and the difference between the recorded amounts of dividends, interest, and foreign withholding taxes and the U.S. dollar equivalent of the amounts actually received or paid. Net unrealized foreign exchange gains and losses arise from changes in foreign exchange rates on foreign denominated assets and liabilities other than investments in securities held at the end of the reporting period.
c. Foreign Currency Contracts
When the Fund purchases or sells foreign securities it may enter into foreign exchange contracts to minimize foreign exchange risk from the trade date to the settlement date of the transactions. A foreign exchange contract is an agreement between two parties to exchange different currencies at an agreed upon exchange rate at a future date. Realized and unrealized gains and losses on these contracts are included in the Statement of Operations.
The risks of these contracts include movement in the values of the foreign currencies relative to the U.S. dollar and the possible inability of the counterparties to fulfill their obligations under the contracts, which may be in excess of the amount reflected in the Statement of Assets and Liabilities.
d. Securities Lending
The Fund participates in a principal based security lending program and receives a minimum guaranteed payment for their participation, and may receive additional payment based on actual securities loaned. The Fund receives cash collateral against the loaned securities in an amount equal to at least 102% of the market value of the loaned securities. Collateral is maintained over the life of the loan in an amount not less than 100% of the market value of loaned securities, as determined at the close of fund business each day; any additional collateral required due to changes in security values is delivered to the Fund on the next business day. The collateral is held in a segregated account with the Fund’s custodian on the Fund’s behalf. While the Fund continues to bear the market risk with respect to securities loaned and the risk that the principal may default on its obligations to the Fund, the principal bears the risk of default by any third party borrower.
e. Income Taxes
No provision has been made for U.S. income taxes because it is the Fund’s policy to qualify as a regulated investment company under the Internal Revenue Code and to distribute to shareholders substantially all of its taxable income and net realized gains.
f. Security Transactions, Investment Income, Expenses and Distributions
Security transactions are accounted for on trade date. Realized gains and losses on security transactions are determined on a specific identification basis. Interest income and estimated expenses are accrued daily. Amortization of premium and accretion of discount on debt securities are included in interest income. Dividend income is recorded on the ex-dividend date. Distributions to shareholders are recorded on the ex-dividend date and are determined according to income tax regulations (tax basis). Distributable earnings determined on a tax basis may differ from earnings recorded in accordance with accounting principles
FSV-18
Franklin Templeton Variable Insurance Products Trust
Notes to Financial Statements (continued)
Franklin Small Cap Value Securities Fund
1. ORGANIZATION AND SIGNIFICANT ACCOUNTING POLICIES (continued)
f. Security Transactions, Investment Income, Expenses and Distributions (continued)
generally accepted in the United States of America. These differences may be permanent or temporary. Permanent differences are reclassified among capital accounts to reflect their tax character. These reclassifications have no impact on net assets or the results of operations. Temporary differences are not reclassified, as they may reverse in subsequent periods.
Common expenses incurred by the Trust are allocated among the funds based on the ratio of net assets of each fund to the combined net assets of the Trust. Fund specific expenses are charged directly to the fund that incurred the expense.
Realized and unrealized gains and losses and net investment income, other than class specific expenses, are allocated daily to each class of shares based upon the relative proportion of net assets of each class. Differences in per share distributions, by class, are generally due to differences in class specific expenses.
g. Accounting Estimates
The preparation of financial statements in accordance with accounting principles generally accepted in the United States of America requires management to make estimates and assumptions that affect the reported amounts of assets and liabilities at the date of the financial statements and the amounts of income and expenses during the reporting period. Actual results could differ from those estimates.
h. Guarantees and Indemnifications
Under the Trust’s organizational documents, its officers and trustees are indemnified by the Trust against certain liabilities arising out of the performance of their duties to the Trust. Additionally, in the normal course of business, the Trust, on behalf of the Fund, enters into contracts with service providers that contain general indemnification clauses. The Trust’s maximum exposure under these arrangements is unknown as this would involve future claims that may be made against the Trust that have not yet occurred. Currently, the Trust expects the risk of loss to be remote.
2. SHARES OF BENEFICIAL INTEREST
At December 31, 2007, there were an unlimited number of shares authorized (without par value). Transactions in the Fund’s shares were as follows:
| | | | | | | | | | | | | | |
| | | Year Ended December 31, | |
| | | 2007 | | | 2006 | |
| Class 1 Shares: | | Shares | | | Amount | | | Shares | | | Amount | |
Shares sold | | 494,875 | | | $ | 9,549,933 | | | 1,388,086 | | | $ | 25,312,834 | |
Shares issued in reinvestment of distributions | | 280,013 | | | | 5,566,652 | | | 137,657 | | | | 2,386,976 | |
Shares redeemed | | (1,329,683 | ) | | | (25,661,457 | ) | | (781,544 | ) | | | (14,294,467 | ) |
| | | | |
Net increase (decrease) | | (554,795 | ) | | $ | (10,544,872 | ) | | 744,199 | | | $ | 13,405,343 | |
| | | | |
| Class 2 Shares: | | | | | | | | | | | | |
Shares sold | | 8,994,880 | | | $ | 170,296,248 | | | 14,334,899 | | | $ | 256,516,988 | |
Shares issued in reinvestment of distributions | | 4,895,097 | | | | 95,894,950 | | | 2,717,039 | | | | 46,488,529 | |
Shares redeemed in-kind (Note 9) | | — | | | | — | | | (6,891,626 | ) | | | (131,836,804 | ) |
Shares redeemed | | (11,093,846 | ) | | | (204,595,467 | ) | | (9,293,676 | ) | | | (167,180,289 | ) |
| | | | |
Net increase (decrease) | | 2,796,131 | | | $ | 61,595,731 | | | 866,636 | | | $ | 3,988,424 | |
| | | | |
FSV-19
Franklin Templeton Variable Insurance Products Trust
Notes to Financial Statements (continued)
Franklin Small Cap Value Securities Fund
3. TRANSACTIONS WITH AFFILIATES
Franklin Resources, Inc. is the holding company for various subsidiaries that together are referred to as Franklin Templeton Investments. Certain officers and trustees of the Trust are also officers and/or directors of the following subsidiaries:
| | |
| Subsidiary | | Affiliation |
Franklin Advisory Services, LLC (Advisory Services) | | Investment manager |
Franklin Templeton Services, LLC (FT Services) | | Administrative manager |
Franklin Templeton Distributors, Inc. (Distributors) | | Principal underwriter |
Franklin Templeton Investor Services, LLC (Investor Services) | | Transfer agent |
a. Management Fees
The Fund pays an investment management fee to Advisory Services based on the average daily net assets of the Fund as follows:
| | |
| Annualized Fee Rate | | Net Assets |
| 0.600% | | Up to and including $200 million |
| 0.500% | | Over $200 million, up to and including $1.3 billion |
| 0.400% | | In excess of $1.3 billion |
b. Administrative Fees
The Fund pays an administrative fee to FT Services based on the Fund’s average daily net assets as follows:
| | |
| Annualized Fee Rate | | Net Assets |
| 0.150% | | Up to and including $200 million |
| 0.135% | | Over $200 million, up to and including $700 million |
| 0.100% | | Over $700 million, up to and including $1.2 billion |
| 0.750% | | In excess of $1.2 billion |
c. Distribution Fees
The Fund’s Board of Trustees has adopted a distribution plan for Class 2 shares pursuant to Rule 12b-1 under the 1940 Act. Under the Fund’s compensation distribution plan, the Fund pays Distributors for costs incurred in connection with the servicing, sale and distribution of the Fund’s shares up to 0.35% per year of its average daily net assets. The Board of Trustees has agreed to limit the current rate to 0.25% per year.
d. Transfer Agent Fees
Investor Services, under terms of an agreement, performs shareholder servicing for the Fund and is not paid by the Fund for the services.
4. EXPENSE OFFSET ARRANGEMENT
The Fund has entered into an arrangement with its custodian whereby credits realized as a result of uninvested cash balances are used to reduce a portion of the Fund’s custodian expenses. During the year ended December 31, 2007, the custodian fees were reduced as noted in the Statement of Operations.
FSV-20
Franklin Templeton Variable Insurance Products Trust
Notes to Financial Statements (continued)
Franklin Small Cap Value Securities Fund
5. INCOME TAXES
The Fund has reviewed the tax positions taken on federal income tax returns, for each of the three open tax years and as of December 31, 2007 and has determined that no provision for income tax is required in the Fund’s financial statements.
The tax character of distributions paid during the years ended December 31, 2007 and 2006, was as follows:
| | | | | | |
| | | 2007 | | 2006 |
Distributions paid from: | | | | | | |
Ordinary income | | $ | 21,577,940 | | $ | 19,467,481 |
Long term capital gain | | | 79,883,662 | | | 29,408,024 |
| | | |
| | $ | 101,461,602 | | $ | 48,875,505 |
| | | |
At December 31, 2007, the cost of investments, net unrealized appreciation (depreciation), undistributed ordinary income and undistributed long term capital gains for income tax purposes were as follows:
| | | | |
Cost of investments | | $ | 1,187,358,675 | |
| | | | |
| |
Unrealized appreciation | | $ | 343,235,605 | |
Unrealized depreciation | | | (191,934,820 | ) |
| | | | |
Net unrealized appreciation (depreciation) | | $ | 151,300,785 | |
| | | | |
Undistributed ordinary income | | $ | 15,797,385 | |
Undistributed long term capital gains | | | 80,884,848 | |
| | | | |
Distributable earnings | | $ | 96,682,233 | |
| | | | |
Net investment income differs for financial statement and tax purposes primarily due to differing treatments of foreign currency transactions and bond discounts and premiums.
Net realized gains (losses) differ for financial statement and tax purposes primarily due to differing treatments of wash sales, foreign currency transactions, and bond discounts and premiums.
6. INVESTMENT TRANSACTIONS
Purchases and sales of investments (excluding short term securities) for the year ended December 31, 2007, aggregated $279,586,448 and $211,782,715, respectively.
7. INVESTMENTS IN FRANKLIN INSTITUTIONAL FIDUCIARY TRUST MONEY MARKET PORTFOLIO
The Fund may invest in the Franklin Institutional Fiduciary Trust Money Market Portfolio (Sweep Money Fund), an open-end investment company managed by Franklin Advisers, Inc. (an affiliate of the investment manager). Management fees paid by the Fund are reduced on assets invested in the Sweep Money Fund, in an amount not to exceed the management and administrative fees paid by the Sweep Money Fund.
FSV-21
Franklin Templeton Variable Insurance Products Trust
Notes to Financial Statements (continued)
Franklin Small Cap Value Securities Fund
8. HOLDINGS OF 5% VOTING SECURITIES OF PORTFOLIO COMPANIES
The 1940 Act defines “affiliated companies” to include investments in portfolio companies in which a fund owns 5% or more of the outstanding voting securities. Investments in “affiliated companies” for the Fund for the year ended December 31, 2007, were as shown below.
| | | | | | | | | | | | | | | | | |
| Name of Issuer | | Number of Shares
Held at Beginning
of Year | | Gross
Additions | | Gross
Reductions | | Number of Shares
Held at End of
Year | | Value at
End of
Year | | Investment
Income | | Realized Capital
Gain (Loss) | |
Non-Controlled Affiliates | | | | | | | | | | | | | | | | | |
Hooker Furniture Corp. | | 733,406 | | — | | 163,606 | | 569,800 | | a | | $ | 277,002 | | $ | (39,135 | ) |
| | | | | | | | | | | |
Total Affiliated Securities (0.00% of Net Assets) | | | | | | | | | | | | | |
a | As of December 31, 2007, no longer an affiliate. |
9. REDEMPTION IN-KIND
During the year ended December 31, 2006, the Fund realized $36,849,085 of net gains resulting from a redemption in-kind in which a shareholder redeemed fund shares for securities held by the Fund rather than for cash. Because such gains are not taxable to the Fund, and are not distributed to shareholders, they have been reclassified from accumulated net realized gains to paid-in capital.
10. REGULATORY AND LITIGATION MATTERS
As part of various investigations by a number of federal, state, and foreign regulators and governmental entities, including the Securities and Exchange Commission (“SEC”), relating to certain practices in the mutual fund industry, including late trading, market timing and marketing support payments to securities dealers who sell fund shares (“marketing support”), Franklin Resources, Inc. and certain of its subsidiaries (collectively, the “Company”), entered into settlements with certain of those regulators and governmental entities. Specifically, the Company entered into settlements with the SEC, among others, concerning market timing and marketing support.
On June 6, 2007, the SEC posted for public comment the proposed plan of distribution for the market timing settlement. Once the SEC approves the final plan of distribution, disbursements of settlement monies will be made promptly to individuals who were shareholders of the designated funds during the relevant period, in accordance with the terms and conditions of the settlement and plan.
In addition, the Company, as well as most of the mutual funds within Franklin Templeton Investments and certain current or former officers, Company directors, fund directors, and employees, have been named in private lawsuits (styled as shareholder class actions, or as derivative actions on behalf of either the named funds or Franklin Resources, Inc.). The lawsuits relate to the industry practices referenced above.
The Company and fund management believe that the claims made in each of the private lawsuits referenced above are without merit and intend to defend against them vigorously. The Company cannot predict with certainty the eventual outcome of these lawsuits, nor whether they will have a material negative impact on the Company. If it is determined that the Company bears responsibility for any unlawful or inappropriate conduct that caused losses to the Fund, it is committed to making the Trust or its shareholders whole, as appropriate.
FSV-22
Franklin Templeton Variable Insurance Products Trust
Notes to Financial Statements (continued)
Franklin Small Cap Value Securities Fund
11. NEW ACCOUNTING PRONOUNCEMENT
In September 2006, the Financial Accounting Standards Board (FASB) issued FASB Statement No. 157, “Fair Value Measurement” (SFAS 157), which defines fair value, establishes a framework for measuring fair value, and expands disclosures about fair value measurements. SFAS 157 is effective for fiscal years beginning after November 15, 2007, and interim periods within those fiscal years. The Trust believes the adoption of SFAS 157 will have no material impact on its financial statements.
FSV-23
Franklin Templeton Variable Insurance Products Trust
Franklin Small Cap Value Securities Fund
Report of Independent Registered Public Accounting Firm
To the Board of Trustees and Shareholders of
Franklin Templeton Variable Insurance Products Trust
In our opinion, the accompanying statement of assets and liabilities, including the statement of investments, and the related statements of operations and of changes in net assets and the financial highlights present fairly, in all material respects, the financial position of Franklin Small Cap Value Securities Fund (one of the funds constituting Franklin Templeton Variable Insurance Products Trust, hereafter referred to as the “Fund”) at December 31, 2007, the results of its operations for the year then ended, the changes in its net assets for each of the two years in the period then ended and the financial highlights for each of the five years in the period then ended, in conformity with accounting principles generally accepted in the United States of America. These financial statements and financial highlights (hereafter referred to as “financial statements”) are the responsibility of the Fund’s management. Our responsibility is to express an opinion on these financial statements based on our audits. We conducted our audits of these financial statements in accordance with the standards of the Public Company Accounting Oversight Board (United States). Those standards require that we plan and perform the audit to obtain reasonable assurance about whether the financial statements are free of material misstatement. An audit includes examining, on a test basis, evidence supporting the amounts and disclosures in the financial statements, assessing the accounting principles used and significant estimates made by management, and evaluating the overall financial statement presentation. We believe that our audits, which included confirmation of securities at December 31, 2007 by correspondence with the custodian and brokers, provide a reasonable basis for our opinion.
PricewaterhouseCoopers LLP
San Francisco, California
February 14, 2008
FSV-24
Franklin Templeton Variable Insurance Products Trust
Tax Designation (unaudited)
Franklin Small Cap Value Securities Fund
Under Section 852(b)(3)(C) of the Internal Revenue Code (Code), the Fund designates the maximum amount allowable but no less than $80,886,372 as a long term capital gain dividend for the fiscal year ended December 31, 2007.
Under Section 854(b)(2) of the Code, the Fund designates 67.39% of the ordinary income dividends as income qualifying for the dividends received deduction for the fiscal year ended December 31, 2007.
FSV-25
FRANKLIN SMALL-MID CAP GROWTH SECURITIES FUND
We are pleased to bring you Franklin Small-Mid Cap Growth Securities Fund’s annual report for the fiscal year ended December 31, 2007.
Performance Summary as of 12/31/07
Average annual total return of Class 1 shares represents the average annual change in value, assuming reinvestment of dividends and capital gains. Average returns smooth out variations in returns, which can be significant; they are not the same as year-by-year results.
Periods ended 12/31/07
| | | | | | |
| | | 1-Year | | 5-Year | | 10-Year |
Average Annual Total Return | | +11.51% | | +14.44% | | +7.10% |
Total Return Index Comparison for Hypothetical $10,000 Investment (1/1/98–12/31/07)
The graph below shows the change in value of a hypothetical $10,000 investment in the Fund over the indicated period and includes reinvestment of any income or distributions. The Fund’s performance is compared to the performance of the Standard & Poor’s 500 Index (S&P 500) and the Russell Midcap® Growth Index. One cannot invest directly in an index, nor is an index representative of the Fund’s portfolio. Please see Important Notes to Performance Information preceding the Fund Summaries.
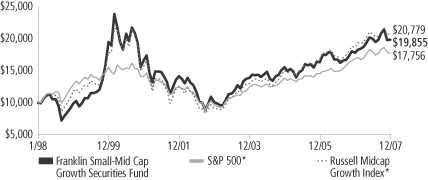
*Source: Standard & Poor’s Micropal. Please see Index Descriptions following the Fund Summaries.
Franklin Small-Mid Cap Growth Securities Fund Class 1
Performance reflects the Fund’s Class 1 operating expenses, but does not include any contract fees, expenses or sales charges. If they had been included, performance would be lower. These charges and deductions, particularly for variable life policies, can have a significant effect on contract values and insurance benefits. See the contract prospectus for a complete description of these expenses, including sales charges.
Performance data represent past performance, which does not guarantee future results. Investment return and principal value will fluctuate, and you may have a gain or loss when you sell your shares.
Current performance may differ from figures shown.
FSC-1
Fund Goal and Main Investments: Franklin Small-Mid Cap Growth Securities Fund seeks long-term capital growth. The Fund normally invests at least 80% of its net assets in investments of small capitalization (small cap) and mid capitalization (mid cap) companies. For this Fund, small cap companies are those within the market capitalization range of companies in the Russell 2500TM Index at the time of purchase; and mid cap companies are companies within the market capitalization range of companies in the Russell Midcap Index at the time of purchase.1
Performance Overview
You can find the Fund’s one-year total return in the Performance Summary. The Fund performed comparably to its narrow benchmark, the Russell Midcap Growth Index, which returned +11.43%, and outperformed its broad benchmark, the S&P 500, which returned +5.49%, for the same period.2
Economic and Market Overview
During the 12 months ended December 31, 2007, the U.S. economy advanced at a moderate but uneven pace. Gross domestic product (GDP) grew an annualized 0.6% in the first quarter of 2007 but advanced in the second quarter at an annualized 3.8% rate. Federal defense spending, accelerating exports and declining imports, greater business inventory investment and increased spending for nonresidential structures supported growth. GDP grew an annualized 4.9% in the third quarter of 2007 despite a struggling housing market and the abrupt unraveling of the subprime mortgage market. The housing downturn affected the overall economy by fourth quarter 2007 as credit conditions worsened, consumer spending slowed, and GDP growth decelerated to an estimated 0.6% annualized rate.
The unemployment rate increased from 4.4% at the beginning of the period to 5.0% in December 2007.3 Although consumer confidence in July neared a six-year high, it declined through period-end largely due to rising mortgage and fuel costs, falling home prices and a weaker job market. Oil prices were volatile and established a new record high in November, nearing $99 per barrel. For the 12 months ended December 31, 2007, the core Consumer Price Index (CPI), which excludes food and energy costs, rose 2.4%, which was higher than its 10-year average rate.3
1. Please see Index Descriptions following the Fund Summaries.
2. Source: Standard & Poor’s Micropal. One cannot invest directly in an index, nor is an index representative of the Fund’s portfolio. Please see Index Descriptions following the Fund Summaries.
3. Source: Bureau of Labor Statistics.
Fund Risks: The Fund’s investments in stocks offer the potential for long-term gains but can be subject to short-term price fluctuations. Smaller and midsize company securities can increase the risk of greater price fluctuations, particularly over the short term. Smaller or relatively new or unseasoned companies can also be particularly sensitive to changing economic conditions, and their prospects for growth are less certain than those of larger, more established companies. The Fund may have significant investments in the technology sector, which has been among the market’s most volatile sectors and involves special risks. The Fund’s prospectus also includes a description of the main investment risks.
FSC-2
Facing the prospect of slower economic growth, the Federal Reserve Board lowered the federal funds target rate to 4.25% from 5.25% during the period. As investors fled riskier, poorer-performing assets, U.S. Treasuries rallied and the 10-year Treasury note yield fell from 4.71% at the beginning of the period to 4.04% on December 31, 2007.
Following sell-offs in late February and mid-March, stock markets rebounded amid generally strong first quarter corporate earnings reports. However, volatility picked up substantially in the latter half of the year due to investor concerns about slowing economic growth. The major stock indexes recovered from a late-summer sell-off and a November correction, and the blue chip stocks of the Dow Jones Industrial Average posted a 12-month total return of +8.88%.4 The broader S&P 500 returned +5.49%, and the technology-heavy NASDAQ Composite Index returned +11.53%.4 The energy, materials and utilities sectors performed particularly well. Large-capitalization stocks generally outperformed small caps, and growth stocks fared better than their value counterparts.
Investment Strategy
We are research-driven, fundamental investors pursuing a growth strategy. As bottom-up investors focusing primarily on individual securities, we choose companies that have identifiable drivers of future earnings growth and that present, in our opinion, the best trade-off between that earnings growth, business and financial risk, and valuation. We rely on a team of analysts to provide in-depth industry expertise, and we use qualitative and quantitative analyses to evaluate companies for distinct and sustainable competitive advantages. Market opportunity, product niche, technological innovation, management and execution, and financial strength and profitability are all factors we believe may contribute to strong growth potential.
Manager’s Discussion
From a sector perspective, the electronic technology sector had the largest contribution to Fund performance relative to the Russell Midcap Growth Index for the period under review. Stock selection was a key driver for outperformance. Telecommunications equipment stocks performed well, and key contributors included navigation systems companies Garmin and Trimble Navigation. Aerospace and defense stocks
4. Source: Standard & Poor’s Micropal. Please see Index Descriptions following the Fund Summaries.
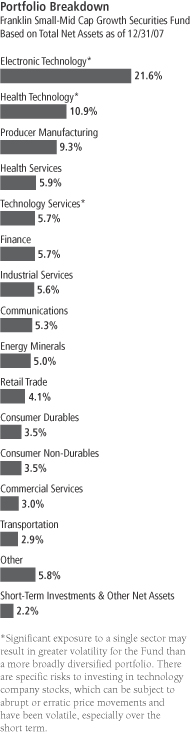
FSC-3
were also strong, and notably, thermal imaging systems designer FLIR Systems5 was the Fund’s top contributor to return.
Driven by stock selection, the consumer durables and consumer services sectors also benefited relative Fund performance. Key contributors in the consumer durables sector included video game maker Activision and high-end audio equipment manufacturer Harman International Industries. Restaurant chain Chipotle Mexican Grill5 and slot machine maker International Game Technology, in the consumer services sector, boosted the Fund’s relative results.
On the other hand, the Fund’s investments in the finance, industrial services and communications sectors detracted from relative performance during the reporting period. Stock selection in the finance sector was detrimental, and significant detractors included commercial and mortgage lender CapitalSource, retail bank East West Bancorp and online brokerage E*TRADE Financial, the Fund’s largest detractor.
The Fund’s underweighted allocation and stock selection in the industrial services sector dampened relative performance. Within the sector, our positions in oil and gas drilling equipment manufacturer National Oilwell Varco and contract driller Rowan Companies were detractors. Additionally, overweighting in the communications sector, particularly the wireless telecommunications industry, hurt relative results. Wireless telecommunications stocks, Leap Wireless International, NII Holdings and MetroPCS Communications, also weighed on Fund performance.
During the period under review, we sought to invest in companies that exhibited what we considered were clear growth drivers and thought would provide the best trade-off between growth opportunity, business risk and valuation.
Thank you for your participation in Franklin Small-Mid Cap Growth Securities Fund. We look forward to serving your future investment needs.
5. This holding is not an index component.
The foregoing information reflects our analysis, opinions and portfolio holdings as of December 31, 2007, the end of the reporting period. The way we implement our main investment strategies and the resulting portfolio holdings may change depending on factors such as market and economic conditions. These opinions may not be relied upon as investment advice or an offer for a particular security. The information is not a complete analysis of every aspect of any market, country, industry, security or the Fund. Statements of fact are from sources considered reliable, but the investment manager makes no representation or warranty as to their completeness or accuracy. Although historical performance is no guarantee of future results, these insights may help you understand our investment management philosophy.
Top 10 Holdings
Franklin Small-Mid Cap Growth Securities Fund
12/31/07
| | |
Company
Sector/Industry | | % of Total
Net Assets |
| |
| FLIR Systems Inc. | | 2.7% |
| Electronic Technology | | |
| |
| Harris Corp. | | 2.3% |
| Electronic Technology | | |
| |
| Smith International Inc. | | 2.1% |
| Industrial Services | | |
| |
| Bill Barrett Corp. | | 2.0% |
| Energy Minerals | | |
| |
| AMTEK Inc. | | 2.0% |
| Producer Manufacturing | | |
| |
| Microsemi Corp. | | 1.9% |
| Electronic Technology | | |
| |
| Express Scripts Inc. | | 1.9% |
| Health Services | | |
| |
| Affiliated Managers Group Inc. | | 1.9% |
| Finance | | |
| |
| Flowserve Corp. | | 1.9% |
| Producer Manufacturing | | |
| |
| C.R. Bard Inc. | | 1.8% |
| Health Technology | | |
The dollar value, number of shares or principal amount, and names of all portfolio holdings are listed in the Fund’s Statement of Investments.
FSC-4
Fund Expenses
As an investor in a variable insurance contract (Contract) that indirectly provides for investment in an underlying mutual fund, you can incur transaction and/or ongoing expenses at both the Fund level and the Contract level.
| • | | Transaction expenses can include sales charges (loads) on purchases, redemption fees, surrender fees, transfer fees and premium taxes. |
| • | | Ongoing expenses can include management fees, distribution and service (12b-1) fees, contract fees, annual maintenance fees, mortality and expense risk fees and other fees and expenses. All mutual funds and Contracts have some types of ongoing expenses. |
The expenses shown in the table are meant to highlight ongoing expenses at the Fund level only and do not include ongoing expenses at the Contract level, or transaction expenses at either the Fund or Contract level. While the Fund does not have transaction expenses, if the transaction and ongoing expenses at the Contract level were included, the expenses shown below would be higher. You should consult your Contract prospectus or disclosure document for more information.
The table shows Fund-level ongoing expenses and can help you understand these expenses and compare them with those of other mutual funds offered through the Contract. The table assumes a $1,000 investment held for the six months indicated. Please refer to the Fund prospectus for additional information on operating expenses.
Actual Fund Expenses
The first line (Actual) of the table provides actual account values and expenses. The “Ending Account Value” is derived from the Fund’s actual return, which includes the effect of ongoing Fund expenses, but does not include the effect of ongoing Contract expenses.
You can estimate the Fund-level expenses you incurred during the period by following these steps. Of course, your account value and expenses will differ from those in this illustration:
| 1. | Divide your account value by $1,000. |
If an account had an $8,600 value, then $8,600 ÷ $1,000 = 8.6.
| 2. | Multiply the result by the number under the heading “Fund-Level Expenses Incurred During Period.” |
If Fund-Level Expenses Incurred During Period were $7.50, then 8.6 × $7.50 = $64.50.
In this illustration, the estimated expenses incurred this period at the Fund level are $64.50.
Franklin Small-Mid Cap Growth Securities Fund Class 1
FSC-5
Hypothetical Example for Comparison with Other Mutual Funds
Information in the second line (Hypothetical) of the table can help you compare ongoing expenses of the Fund with those of other mutual funds offered through the Contract. This information may not be used to estimate the actual ending account balance or expenses you incurred during the period. The hypothetical “Ending Account Value” is based on the Fund’s actual expense ratio and an assumed 5% annual rate of return before expenses, which does not represent the Fund’s actual return. The figure under the heading “Fund-Level Expenses Incurred During Period” shows the hypothetical expenses your account would have incurred under this scenario. You can compare this figure with the 5% hypothetical examples that appear in shareholder reports of other funds offered through a Contract.
| | | | | | | | | |
| Class 1 | | Beginning
Account Value 7/1/07 | | Ending Account Value 12/31/07 | | Fund-Level
Expenses Incurred
During Period*
7/1/07–12/31/07 |
Actual | | $ | 1,000 | | $ | 991.50 | | $ | 3.76 |
Hypothetical (5% return before expenses) | | $ | 1,000 | | $ | 1,021.42 | | $ | 3.82 |
*Expenses are calculated using the most recent six-month annualized expense ratio for the Fund’s Class 1 shares (0.75%), which does not include any ongoing expenses of the Contract for which the Fund is an investment option, multiplied by the average account value over the period, multiplied by 184/365 to reflect the one-half year period.
FSC-6
Franklin Templeton Variable Insurance Products Trust
Financial Highlights
Franklin Small-Mid Cap Growth Securities Fund
| | | | | | | | | | | | | | | | | | | | |
| | | Year Ended December 31, | |
| Class 1 | | 2007 | | | 2006 | | | 2005 | | | 2004 | | | 2003 | |
| | | | |
Per share operating performance | | | | | | | | | | | | | | | | | | | | |
(for a share outstanding throughout the year) | | | | | | | | | | | | | | | | | | | | |
Net asset value, beginning of year | | $ | 22.51 | | | $ | 20.66 | | | $ | 19.66 | | | $ | 17.60 | | | $ | 12.79 | |
| | | | |
Income from investment operationsa: | | | | | | | | | | | | | | | | | | | | |
Net investment income (loss)b | | | (0.02 | ) | | | — | e | | | (0.02 | ) | | | (0.06 | ) | | | (0.03 | ) |
Net realized and unrealized gains (losses) | | | 2.65 | | | | 1.85 | | | | 1.02 | | | | 2.12 | | | | 4.84 | |
| | | | |
Total from investment operations | | | 2.63 | | | | 1.85 | | | | 1.00 | | | | 2.06 | | | | 4.81 | |
| | | | |
Less distributions from net realized gains | | | (1.75 | ) | | | — | | | | — | | | | — | | | | — | |
| | | | |
Net asset value, end of year | | $ | 23.39 | | | $ | 22.51 | | | $ | 20.66 | | | $ | 19.66 | | | $ | 17.60 | |
| | | | |
| | | | | |
Total returnc | | | 11.51% | | | | 8.95% | | | | 5.09% | | | | 11.70% | | | | 37.61% | |
Ratios to average net assets | | | | | | | | | | | | | | | | | | | | |
Expenses | | | 0.74% | d | | | 0.76% | d | | | 0.74% | d | | | 0.74% | d | | | 0.76% | |
Net investment income (loss) | | | (0.10)% | | | | (0.02)% | | | | (0.09)% | | | | (0.33)% | | | | (0.24)% | |
| | | | | |
Supplemental data | | | | | | | | | | | | | | | | | | | | |
Net assets, end of year (000’s) | | $ | 127,602 | | | $ | 135,402 | | | $ | 157,085 | | | $ | 184,513 | | | $ | 197,551 | |
Portfolio turnover rate | | | 66.94% | | | | 50.08% | | | | 74.39% | | | | 32.55% | | | | 45.00% | |
aThe amount shown for a share outstanding throughout the period may not correlate with the Statement of Operations for the period due to the timing of sales and repurchases of the Fund shares in relation to income earned and/or fluctuating market value of the investments of the Fund.
bBased on average daily shares outstanding.
cTotal return does not include any fees, charges or expenses imposed by the variable annuity and life insurance contracts for which the Franklin Templeton Variable Insurance Products Trust serves as an underlying investment vehicle.
dBenefit of expense reduction rounds to less than 0.01%.
eAmount rounds to less than $0.01 per share.
The accompanying notes are an integral part of these financial statements.
FSC-7
Franklin Templeton Variable Insurance Products Trust
Financial Highlights (continued)
Franklin Small-Mid Cap Growth Securities Fund
| | | | | | | | | | | | | | | | | | | | |
| | | Year Ended December 31, | |
| Class 2 | | 2007 | | | 2006 | | | 2005 | | | 2004 | | | 2003 | |
| | | | |
Per share operating performance | | | | | | | | | | | | | | | | | | | | |
(for a share outstanding throughout the year) | | | | | | | | | | | | | | | | | | | | |
Net asset value, beginning of year | | $ | 22.13 | | | $ | 20.36 | | | $ | 19.43 | | | $ | 17.43 | | | $ | 12.70 | |
| | | | |
Income from investment operationsa: | | | | | | | | | | | | | | | | | | | | |
Net investment income (loss)b | | | (0.08 | ) | | | (0.06 | ) | | | (0.07 | ) | | | (0.10 | ) | | | (0.07 | ) |
Net realized and unrealized gains (losses) | | | 2.61 | | | | 1.83 | | | | 1.00 | | | | 2.10 | | | | 4.80 | |
| | | | |
Total from investment operations | | | 2.53 | | | | 1.77 | | | | 0.93 | | | | 2.00 | | | | 4.73 | |
| | | | |
Less distributions from net realized gains | | | (1.75 | ) | | | — | | | | — | | | | — | | | | — | |
| | | | |
Net asset value, end of year | | $ | 22.91 | | | $ | 22.13 | | | $ | 20.36 | | | $ | 19.43 | | | $ | 17.43 | |
| | | | |
| | | | | |
Total returnc | | | 11.24% | | | | 8.69% | | | | 4.79% | | | | 11.47% | | | | 37.24% | |
Ratios to average net assets | | | | | | | | | | | | | | | | | | | | |
Expenses | | | 0.99% | d | | | 1.01% | d | | | 0.99% | d | | | 0.99% | d | | | 1.01% | |
Net investment income (loss) | | | (0.35)% | | | | (0.27)% | | | | (0.34)% | | | | (0.58)% | | | | (0.49)% | |
| | | | | |
Supplemental data | | | | | | | | | | | | | | | | | | | | |
Net assets, end of year (000’s) | | $ | 1,217,177 | | | $ | 1,184,521 | | | $ | 1,166,806 | | | $ | 1,142,048 | | | $ | 909,946 | |
Portfolio turnover rate | | | 66.94% | | | | 50.08% | | | | 74.39% | | | | 32.55% | | | | 45.00% | |
aThe amount shown for a share outstanding throughout the period may not correlate with the Statement of Operations for the period due to the timing of sales and repurchases of the Fund shares in relation to income earned and/or fluctuating market value of the investments of the Fund.
bBased on average daily shares outstanding.
cTotal return does not include any fees, charges or expenses imposed by the variable annuity and life insurance contracts for which the Franklin Templeton Variable Insurance Products Trust serves as an underlying investment vehicle.
dBenefit of expense reduction rounds to less than 0.01%.
The accompanying notes are an integral part of these financial statements.
FSC-8
Franklin Templeton Variable Insurance Products Trust
Statement of Investments, December 31, 2007
| | | | | |
| Franklin Small-Mid Cap Growth Securities Fund | | Shares | | Value |
Common Stocks 97.8% | | | | | |
Commercial Services 3.0% | | | | | |
aConcur Technologies Inc. | | 73,800 | | $ | 2,672,298 |
FactSet Research Systems Inc. | | 276,700 | | | 15,412,190 |
Robert Half International Inc. | | 392,100 | | | 10,602,384 |
SEI Investments Co. | | 353,400 | | | 11,368,878 |
| | | | | |
| | | | | 40,055,750 |
| | | | | |
Communications 5.3% | | | | | |
aCrown Castle International Corp. | | 388,000 | | | 16,140,800 |
aMetroPCS Communications Inc. | | 792,000 | | | 15,404,400 |
aNII Holdings Inc. | | 490,700 | | | 23,710,624 |
aSBA Communications Corp. | | 486,900 | | | 16,476,696 |
aTeleCorp PCS Inc., Escrow Account | | 262,900 | | | — |
| | | | | |
| | | | | 71,732,520 |
| | | | | |
Consumer Durables 3.5% | | | | | |
aActivision Inc. | | 690,500 | | | 20,507,850 |
aNVR Inc. | | 21,900 | | | 11,475,600 |
aScientific Games Corp., A | | 464,500 | | | 15,444,625 |
| | | | | |
| | | | | 47,428,075 |
| | | | | |
Consumer Non-Durables 3.5% | | | | | |
Guess? Inc. | | 370,500 | | | 14,038,245 |
aHansen Natural Corp. | | 489,400 | | | 21,675,526 |
Wolverine World Wide Inc. | | 474,400 | | | 11,632,288 |
| | | | | |
| | | | | 47,346,059 |
| | | | | |
Consumer Services 1.8% | | | | | |
aChipotle Mexican Grill Inc., B | | 92,800 | | | 11,419,040 |
International Game Technology | | 281,900 | | | 12,383,867 |
| | | | | |
| | | | | 23,802,907 |
| | | | | |
Distribution Services 0.8% | | | | | |
aHenry Schein Inc. | | 166,800 | | | 10,241,520 |
| | | | | |
Electronic Technology 21.6% | | | | | |
aF5 Networks Inc. | | 529,000 | | | 15,087,080 |
aFLIR Systems Inc. | | 1,150,600 | | | 36,013,780 |
aFormFactor Inc. | | 594,200 | | | 19,668,020 |
Garmin Ltd. (Cayman Islands) | | 166,700 | | | 16,169,900 |
Harris Corp. | | 499,400 | | | 31,302,392 |
aLam Research Corp. | | 205,700 | | | 8,892,411 |
aLogitech International SA (Switzerland) | | 534,300 | | | 19,576,752 |
Maxim Integrated Products Inc. | | 532,100 | | | 14,090,008 |
Microchip Technology Inc. | | 260,800 | | | 8,194,336 |
aMicrosemi Corp. | | 1,184,000 | | | 26,213,760 |
aNetwork Appliance Inc. | | 351,300 | | | 8,768,448 |
aOrbital Sciences Corp. | | 481,700 | | | 11,811,284 |
Precision Castparts Corp. | | 160,700 | | | 22,289,090 |
Rockwell Collins Inc. | | 204,700 | | | 14,732,259 |
aSilicon Laboratories Inc. | | 331,600 | | | 12,411,788 |
aTrimble Navigation Ltd. | | 460,700 | | | 13,931,568 |
aVeriFone Holdings Inc. | | 505,500 | | | 11,752,875 |
| | | | | |
| | | | | 290,905,751 |
| | | | | |
FSC-9
Franklin Templeton Variable Insurance Products Trust
Statement of Investments, December 31, 2007 (continued)
| | | | | |
| Franklin Small-Mid Cap Growth Securities Fund | | Shares | | Value |
Common Stocks (continued) | | | | | |
Energy Minerals 5.0% | | | | | |
aBill Barrett Corp. | | 657,600 | | $ | 27,533,712 |
aMariner Energy Inc. | | 272,700 | | | 6,239,376 |
Noble Energy Inc. | | 210,600 | | | 16,746,912 |
aSouthwestern Energy Co. | | 297,300 | | | 16,565,556 |
| | | | | |
| | | | | 67,085,556 |
| | | | | |
Finance 5.7% | | | | | |
aAffiliated Managers Group Inc. | | 220,300 | | | 25,876,438 |
CapitalSource Inc. | | 980,187 | | | 17,241,489 |
East West Bancorp Inc. | | 371,700 | | | 9,006,291 |
aGFI Group Inc. | | 93,461 | | | 8,946,087 |
optionsXpress Holdings Inc. | | 447,800 | | | 15,144,596 |
| | | | | |
| | | | | 76,214,901 |
| | | | | |
Health Services 5.9% | | | | | |
aAllscripts Healthcare Solutions Inc. | | 371,000 | | | 7,204,820 |
aCerner Corp. | | 249,400 | | | 14,066,160 |
aCommunity Health Systems Inc. | | 146,400 | | | 5,396,304 |
aCoventry Health Care Inc. | | 232,500 | | | 13,775,625 |
aExpress Scripts Inc. | | 358,000 | | | 26,134,000 |
Pharmaceutical Product Development Inc. | | 329,400 | | | 13,297,878 |
| | | | | |
| | | | | 79,874,787 |
| | | | | |
Health Technology 10.9% | | | | | |
aAdams Respiratory Therapeutics Inc. | | 299,500 | | | 17,892,130 |
aAmerican Medical Systems Holdings Inc. | | 737,500 | | | 10,664,250 |
C. R. Bard Inc. | | 256,900 | | | 24,354,120 |
aGen-Probe Inc. | | 143,185 | | | 9,010,632 |
aHologic Inc. | | 300,432 | | | 20,621,653 |
aKeryx Biopharmaceuticals Inc. | | 273,500 | | | 2,297,400 |
aMillennium Pharmaceuticals Inc. | | 684,200 | | | 10,249,316 |
aMyriad Genetics Inc. | | 124,500 | | | 5,779,290 |
aPDL BioPharma Inc. | | 345,000 | | | 6,044,400 |
aVarian Medical Systems Inc. | | 321,040 | | | 16,745,446 |
aWaters Corp. | | 295,900 | | | 23,396,813 |
| | | | | |
| | | | | 147,055,450 |
| | | | | |
Industrial Services 5.6% | | | | | |
aFMC Technologies Inc. | | 388,400 | | | 22,022,280 |
aNational-Oilwell Varco Inc. | | 244,800 | | | 17,983,008 |
Smith International Inc. | | 374,500 | | | 27,656,825 |
aSuperior Energy Services Inc. | | 214,800 | | | 7,393,416 |
| | | | | |
| | | | | 75,055,529 |
| | | | | |
Producer Manufacturing 9.3% | | | | | |
AMTEK Inc. | | 563,900 | | | 26,413,076 |
Flowserve Corp. | | 263,800 | | | 25,377,560 |
aJA Solar Holdings Co. Ltd., ADR (China) | | 103,424 | | | 7,220,030 |
aMettler-Toledo International Inc. (Switzerland) | | 173,900 | | | 19,789,820 |
aSunPower Corp., A | | 135,400 | | | 17,654,806 |
aTerex Corp. | | 266,400 | | | 17,467,848 |
Trinity Industries Inc. | | 390,300 | | | 10,834,728 |
| | | | | |
| | | | | 124,757,868 |
| | | | | |
FSC-10
Franklin Templeton Variable Insurance Products Trust
Statement of Investments, December 31, 2007 (continued)
| | | | | | |
| Franklin Small-Mid Cap Growth Securities Fund | | Shares | | Value | |
Common Stocks (continued) | | | | | | |
Real Estate Development 0.8% | | | | | | |
Jones Lang LaSalle Inc. | | 156,300 | | $ | 11,122,308 | |
| | | | | | |
Real Estate Investment Trusts 1.6% | | | | | | |
FelCor Lodging Trust Inc. | | 390,800 | | | 6,092,572 | |
iStar Financial Inc. | | 583,400 | | | 15,197,570 | |
| | | | | | |
| | | | | 21,290,142 | |
| | | | | | |
Retail Trade 4.1% | | | | | | |
aDick’s Sporting Goods Inc. | | 426,800 | | | 11,847,968 | |
The Men’s Wearhouse Inc. | | 281,700 | | | 7,600,266 | |
Nordstrom Inc. | | 272,800 | | | 10,019,944 | |
PetSmart Inc. | | 477,500 | | | 11,235,575 | |
aTractor Supply Co. | | 235,998 | | | 8,481,768 | |
aZumiez Inc. | | 255,600 | | | 6,226,416 | |
| | | | | | |
| | | | | 55,411,937 | |
| | | | | | |
Technology Services 5.7% | | | | | | |
aCognizant Technology Solutions Corp., A | | 534,400 | | | 18,137,536 | |
aEquinix Inc. | | 126,700 | | | 12,805,569 | |
Global Payments Inc. | | 343,000 | | | 15,956,360 | |
aInternap Network Services Corp. | | 393,700 | | | 3,279,521 | |
aNuance Communications Inc. | | 872,690 | | | 16,301,849 | |
aOmniture Inc. | | 115,200 | | | 3,835,008 | |
aSalesforce.com Inc. | | 99,000 | | | 6,206,310 | |
| | | | | | |
| | | | | 76,522,153 | |
| | | | | | |
Transportation 2.9% | | | | | | |
C.H. Robinson Worldwide Inc. | | 355,100 | | | 19,218,012 | |
Expeditors International of Washington Inc. | | 154,100 | | | 6,885,188 | |
aRyanair Holdings PLC, ADR (Ireland) | | 307,100 | | | 12,112,024 | |
| | | | | | |
| | | | | 38,215,224 | |
| | | | | | |
Utilities 0.8% | | | | | | |
International Power PLC (United Kingdom) | | 1,242,600 | | | 11,196,844 | |
| | | | | | |
Total Common Stocks (Cost $1,026,617,092) | | | | | 1,315,315,281 | |
| | | | | | |
Short Term Investment (Cost $35,199,041) 2.6% | | | | | | |
Money Market Fund 2.6% | | | | | | |
bFranklin Institutional Fiduciary Trust Money Market Portfolio, 4.58% | | 35,199,041 | | | 35,199,041 | |
| | | | | | |
Total Investments (Cost $1,061,816,133) 100.4% | | | | | 1,350,514,322 | |
Other Assets, less Liabilities (0.4)% | | | | | (5,734,828 | ) |
| | | | | | |
Net Assets 100.0% | | | | $ | 1,344,779,494 | |
| | | | | | |
Selected Portfolio Abbreviations
ADR - American Depository Receipt
aNon-income producing for the twelve months ended December 31, 2007.
bSee Note 7 regarding investments in the Franklin Institutional Fiduciary Trust Money Market Portfolio. The rate shown is the annualized seven-day yield at period end.
The accompanying notes are an integral part of these financial statements.
FSC-11
Franklin Templeton Variable Insurance Products Trust
Financial Statements
Statement of Assets and Liabilities
December 31, 2007
| | | |
| | | Franklin Small-Mid
Cap Growth
Securities Fund |
Assets: | | | |
Investments in securities: | | | |
Cost - Unaffiliated issuers | | $ | 1,026,617,092 |
Cost - Sweep Money Fund (Note 7) | | | 35,199,041 |
| | | |
Total cost of investments | | $ | 1,061,816,133 |
| | | |
Value - Unaffiliated issuers | | $ | 1,315,315,281 |
Value - Sweep Money Fund (Note 7) | | | 35,199,041 |
| | | |
Total value of investments | | | 1,350,514,322 |
Cash | | | 68 |
Receivables: | | | |
Investment securities sold | | | 2,631,499 |
Capital shares sold | | | 593,381 |
Dividends | | | 549,574 |
| | | |
Total assets | | | 1,354,288,844 |
| | | |
Liabilities: | | | |
Payables: | | | |
Investment securities purchased | | | 6,609,577 |
Capital shares redeemed | | | 1,353,030 |
Affiliates | | | 1,323,391 |
Accrued expenses and other liabilities | | | 223,352 |
| | | |
Total liabilities | | | 9,509,350 |
| | | |
Net assets, at value | | $ | 1,344,779,494 |
| | | |
Net assets consist of: | | | |
Paid-in capital | | $ | 928,073,394 |
Net unrealized appreciation (depreciation) | | | 288,698,189 |
Accumulated net realized gain (loss) | | | 128,007,911 |
| | | |
Net assets, at value | | $ | 1,344,779,494 |
| | | |
Class 1: | | | |
Net assets, at value | | $ | 127,602,419 |
| | | |
Shares outstanding | | | 5,455,492 |
| | | |
Net asset value and maximum offering price per share | | $ | 23.39 |
| | | |
Class 2: | | | |
Net assets, at value | | $ | 1,217,177,075 |
| | | |
Shares outstanding | | | 53,138,342 |
| | | |
Net asset value and maximum offering price per share | | $ | 22.91 |
| | | |
The accompanying notes are an integral part of these financial statements.
FSC-12
Franklin Templeton Variable Insurance Products Trust
Financial Statements (continued)
Statement of Operations
for the year ended December 31, 2007
| | | | |
| | | Franklin Small-Mid
Cap Growth
Securities Fund | |
Investment income: | | | | |
Dividends: | | | | |
Unaffiliated issuers | | $ | 5,519,394 | |
Sweep Money Fund (Note 7) | | | 3,428,916 | |
| | | | |
Total investment income | | | 8,948,310 | |
| | | | |
Expenses: | | | | |
Management fees (Note 3a) | | | 6,328,498 | |
Administrative fees (Note 3b) | | | 3,448,980 | |
Distribution fees - Class 2 (Note 3c) | | | 3,108,840 | |
Unaffiliated transfer agent fees | | | 14,616 | |
Custodian fees (Note 4) | | | 23,854 | |
Reports to shareholders | | | 355,700 | |
Professional fees | | | 53,403 | |
Trustees’ fees and expenses | | | 5,931 | |
Other | | | 32,551 | |
| | | | |
Total expenses | | | 13,372,373 | |
Expense reductions (Note 4) | | | (332 | ) |
| | | | |
Net expenses | | | 13,372,041 | |
| | | | |
Net investment income (loss) | | | (4,423,731 | ) |
| | | | |
Realized and unrealized gains (losses): | | | | |
Net realized gain (loss) from: | | | | |
Investments | | | 130,366,309 | |
Foreign currency transactions | | | 11,953 | |
| | | | |
Net realized gain (loss) | | | 130,378,262 | |
| | | | |
Net change in unrealized appreciation (depreciation) on investments | | | 18,672,522 | |
| | | | |
Net realized and unrealized gain (loss) | | | 149,050,784 | |
| | | | |
Net increase (decrease) in net assets resulting from operations | | $ | 144,627,053 | |
| | | | |
The accompanying notes are an integral part of these financial statements.
FSC-13
Franklin Templeton Variable Insurance Products Trust
Financial Statements (continued)
Statements of Changes in Net Assets
| | | | | | | | |
| | | Franklin Small-Mid Cap Growth
Securities Fund | |
| | | Year Ended December 31, | |
| | | 2007 | | | 2006 | |
| | | | |
Increase (decrease) in net assets: | | | | | | | | |
Operations: | | | | | | | | |
Net investment income (loss) | | $ | (4,423,731 | ) | | $ | (3,242,291 | ) |
Net realized gain (loss) from investments and foreign currency transactions | | | 130,378,262 | | | | 120,953,840 | |
Net change in unrealized appreciation (depreciation) on investments | | | 18,672,522 | | | | (7,466,762 | ) |
| | | | |
Net increase (decrease) in net assets resulting from operations | | | 144,627,053 | | | | 110,244,787 | |
| | | | |
Distributions to shareholders from: | | | | | | | | |
Net realized gains: | | | | | | | | |
Class 1 | | | (9,661,762 | ) | | | — | |
Class 2 | | | (90,011,100 | ) | | | — | |
| | | | |
Total distributions to shareholders | | | (99,672,862 | ) | | | — | |
| | | | |
Capital share transactions: (Note 2) | | | | | | | | |
Class 1 | | | (13,249,140 | ) | | | (34,244,740 | ) |
Class 2 | | | (6,848,695 | ) | | | (79,967,790 | ) |
| | | | |
Total capital share transactions | | | (20,097,835 | ) | | | (114,212,530 | ) |
| | | | |
Net increase (decrease) in net assets | | | 24,856,356 | | | | (3,967,743 | ) |
Net assets (there is no undistributed net investment income at beginning or end of year): | | | | | | | | |
Beginning of year | | | 1,319,923,138 | | | | 1,323,890,881 | |
| | | | |
End of year | | $ | 1,344,779,494 | | | $ | 1,319,923,138 | |
| | | | |
The accompanying notes are an integral part of these financial statements.
FSC-14
Franklin Templeton Variable Insurance Products Trust
Notes to Financial Statements
Franklin Small-Mid Cap Growth Securities Fund
1. ORGANIZATION AND SIGNIFICANT ACCOUNTING POLICIES
Franklin Templeton Variable Insurance Products Trust (Trust) is registered under the Investment Company Act of 1940, as amended, (1940 Act) as an open-end investment company, consisting of twenty-three separate funds. The Franklin Small-Mid Cap Growth Securities Fund (Fund) included in this report is diversified. The financial statements of the remaining funds in the Trust are presented separately. Shares of the Fund are sold only to insurance company separate accounts to fund the benefits of variable life insurance policies or variable annuity contracts. The Fund offers two classes of shares: Class 1 and Class 2. Each class of shares differs by its distribution fees, voting rights on matters affecting a single class and its exchange privilege.
The following summarizes the Fund’s significant accounting policies.
a. Security Valuation
Securities listed on a securities exchange or on the NASDAQ National Market System are valued at the last quoted sale price or the official closing price of the day, respectively. Over-the-counter securities and listed securities for which there is no reported sale are valued within the range of the most recent quoted bid and ask prices. Securities that trade in multiple markets or on multiple exchanges are valued according to the broadest and most representative market. Investments in open-end mutual funds are valued at the closing net asset value.
The Trust has procedures to determine the fair value of individual securities and other assets for which market prices are not readily available or which may not be reliably priced. Methods for valuing these securities may include: fundamental analysis, matrix pricing, discounts from market prices of similar securities, or discounts applied due to the nature and duration of restrictions on the disposition of the securities. Due to the inherent uncertainty of valuations of such securities, the fair values may differ significantly from the values that would have been used had a ready market for such investments existed. Occasionally, events occur between the time at which trading in a security is completed and the close of the NYSE that might call into question the availability (including the reliability) of the value of a portfolio security held by the Fund. If such an event occurs, the securities may be valued using fair value procedures, which may include the use of independent pricing services. All security valuation procedures are approved by the Trust’s Board of Trustees.
b. Foreign Currency Translation
Portfolio securities and other assets and liabilities denominated in foreign currencies are translated into U.S. dollars based on the exchange rate of such currencies against U.S. dollars on the date of valuation. Purchases and sales of securities, income and expense items denominated in foreign currencies are translated into U.S. dollars at the exchange rate in effect on the transaction date. Occasionally, events may impact the availability or reliability of foreign exchange rates used to convert the U.S. dollar equivalent value. If such an event occurs, the foreign exchange rate will be valued at fair value using procedures established and approved by the Trust’s Board of Trustees.
The Fund does not separately report the effect of changes in foreign exchange rates from changes in market prices on securities held. Such changes are included in net realized and unrealized gain or loss from investments on the Statement of Operations.
Realized foreign exchange gains or losses arise from sales of foreign currencies, currency gains or losses realized between the trade and settlement dates on securities transactions and the difference between the recorded amounts of dividends, interest, and foreign withholding taxes and the U.S. dollar equivalent of the amounts actually received or paid. Net unrealized foreign exchange gains and losses arise from changes in foreign exchange rates on foreign denominated assets and liabilities other than investments in securities held at the end of the reporting period.
c. Foreign Currency Contracts
When the Fund purchases or sells foreign securities it may enter into foreign exchange contracts to minimize foreign exchange risk from the trade date to the settlement date of the transactions. A foreign exchange contract is an agreement between two
FSC-15
Franklin Templeton Variable Insurance Products Trust
Notes to Financial Statements (continued)
Franklin Small-Mid Cap Growth Securities Fund
1. ORGANIZATION AND SIGNIFICANT ACCOUNTING POLICIES (continued)
c. Foreign Currency Contracts (continued)
parties to exchange different currencies at an agreed upon exchange rate at a future date. Realized and unrealized gains and losses on these contracts are included in the Statement of Operations.
The risks of these contracts include movement in the values of the foreign currencies relative to the U.S. dollar and the possible inability of the counterparties to fulfill their obligations under the contracts, which may be in excess of the amount reflected in the Statement of Assets and Liabilities.
d. Income Taxes
No provision has been made for U.S. income taxes because it is the Fund’s policy to qualify as a regulated investment company under the Internal Revenue Code and to distribute to shareholders substantially all of its taxable income and net realized gains.
e. Security Transactions, Investment Income, Expenses and Distributions
Security transactions are accounted for on trade date. Realized gains and losses on security transactions are determined on a specific identification basis. Estimated expenses are accrued daily. Dividend income is recorded on the ex-dividend date. Distributions to shareholders are recorded on the ex-dividend date and are determined according to income tax regulations (tax basis). Distributable earnings determined on a tax basis may differ from earnings recorded in accordance with accounting principles generally accepted in the United States of America. These differences may be permanent or temporary. Permanent differences are reclassified among capital accounts to reflect their tax character. These reclassifications have no impact on net assets or the results of operations. Temporary differences are not reclassified, as they may reverse in subsequent periods.
Common expenses incurred by the Trust are allocated among the funds based on the ratio of net assets of each fund to the combined net assets of the Trust. Fund specific expenses are charged directly to the fund that incurred the expense.
Realized and unrealized gains and losses and net investment income, other than class specific expenses, are allocated daily to each class of shares based upon the relative proportion of net assets of each class. Differences in per share distributions, by class, are generally due to differences in class specific expenses.
f. Accounting Estimates
The preparation of financial statements in accordance with accounting principles generally accepted in the United States of America requires management to make estimates and assumptions that affect the reported amounts of assets and liabilities at the date of the financial statements and the amounts of income and expenses during the reporting period. Actual results could differ from those estimates.
g. Guarantees and Indemnifications
Under the Trust’s organizational documents, its officers and trustees are indemnified by the Trust against certain liabilities arising out of the performance of their duties to the Trust. Additionally, in the normal course of business, the Trust, on behalf of the Fund, enters into contracts with service providers that contain general indemnification clauses. The Trust’s maximum exposure under these arrangements is unknown as this would involve future claims that may be made against the Trust that have not yet occurred. Currently, the Trust expects the risk of loss to be remote.
FSC-16
Franklin Templeton Variable Insurance Products Trust
Notes to Financial Statements (continued)
Franklin Small-Mid Cap Growth Securities Fund
2. SHARES OF BENEFICIAL INTEREST
At December 31, 2007, there were an unlimited number of shares authorized (without par value). Transactions in the Fund’s shares were as follows:
| | | | | | | | | | | | | | |
| | | Year Ended December 31, | |
| | | 2007 | | | 2006 | |
| Class 1 Shares: | | Shares | | | Amount | | | Shares | | | Amount | |
Shares sold | | 285,123 | | | $ | 6,820,258 | | | 271,880 | | | $ | 5,845,451 | |
Shares issued in reinvestment of distributions | | 402,909 | | | | 9,661,762 | | | — | | | | — | |
Shares redeemed | | (1,248,072 | ) | | | (29,731,160 | ) | | (1,858,715 | ) | | | (40,090,191 | ) |
| | | | |
Net increase (decrease) | | (560,040 | ) | | $ | (13,249,140 | ) | | (1,586,835 | ) | | $ | (34,244,740 | ) |
| | | | |
| Class 2 Shares: | | | | | | | | | | | | |
Shares sold | | 6,795,214 | | | $ | 159,505,591 | | | 13,612,701 | | | $ | 287,694,618 | |
Shares issued in reinvestment of distributions | | 3,827,003 | | | | 90,011,100 | | | — | | | | — | |
Shares redeemed | | (11,015,609 | ) | | | (256,365,386 | ) | | (17,380,315 | ) | | | (367,662,408 | ) |
| | | | |
Net increase (decrease) | | (393,392 | ) | | $ | (6,848,695 | ) | | (3,767,614 | ) | | $ | (79,967,790 | ) |
| | | | |
3. TRANSACTIONS WITH AFFILIATES
Franklin Resources, Inc. is the holding company for various subsidiaries that together are referred to as Franklin Templeton Investments. Certain officers and trustees of the Trust are also officers and/or directors of the following subsidiaries:
| | |
| Subsidiary | | Affiliation |
Franklin Advisers, Inc. (Advisers) | | Investment manager |
Franklin Templeton Services, LLC (FT Services) | | Administrative manager |
Franklin Templeton Distributors, Inc. (Distributors) | | Principal underwriter |
Franklin Templeton Investor Services, LLC (Investor Services) | | Transfer agent |
a. Management Fees
The Fund pays an investment management fee to Advisers based on the average daily net assets of the Fund as follows:
| | |
| Annualized Fee Rate | | Net Assets |
| 0.550% | | Up to and including $500 million |
| 0.450% | | Over $500 million, up to and including $1 billion |
| 0.400% | | Over $1 billion, up to and including $1.5 billion |
| 0.350% | | Over $1.5 billion, up to and including $6.5 billion |
| 0.325% | | Over $6.5 billion, up to and including $11.5 billion |
| 0.300% | | Over $11.5 billion, up to and including $16.5 billion |
| 0.290% | | Over $16.5 billion, up to and including $19 billion |
| 0.280% | | Over $19 billion, up to and including $21.5 billion |
| 0.270% | | In excess of $21.5 billion |
b. Administrative Fees
The Fund pays an administrative fee to FT Services of 0.25% per year of the average daily net assets of the Fund.
FSC-17
Franklin Templeton Variable Insurance Products Trust
Notes to Financial Statements (continued)
Franklin Small-Mid Cap Growth Securities Fund
3. TRANSACTIONS WITH AFFILIATES (continued)
c. Distribution Fees
The Fund’s Board of Trustees has adopted a distribution plan for Class 2 shares pursuant to Rule 12b-1 under the 1940 Act. Under the Fund’s compensation distribution plan, the Fund pays Distributors for costs incurred in connection with the servicing, sale and distribution of the Fund’s shares up to 0.35% per year of its average daily net assets. The Board of Trustees has agreed to limit the current rate to 0.25% per year.
d. Transfer Agent Fees
Investor Services, under terms of an agreement, performs shareholder servicing for the Fund and is not paid by the Fund for the services.
4. EXPENSE OFFSET ARRANGEMENT
The Fund has entered into an arrangement with its custodian whereby credits realized as a result of uninvested cash balances are used to reduce a portion of the Fund’s custodian expenses. During the year ended December 31, 2007, the custodian fees were reduced as noted in the Statement of Operations.
5. INCOME TAXES
The Fund has reviewed the tax positions taken on federal income tax returns, for each of the three open tax years and as of December 31, 2007 and has determined that no provision for income tax is required in the Fund’s financial statements.
For tax purposes, realized capital losses occurring subsequent to October 31, may be deferred and treated as occurring on the first day of the following fiscal year. At December 31, 2007, the Fund deferred realized capital losses of $3,762,591.
The tax character of distributions paid during the years ended December 31, 2007 and 2006, was as follows:
| | | | | | |
| | | 2007 | | 2006 |
Distributions paid from: | | | | | | |
Ordinary income | | $ | 6,620,243 | | $ | — |
Long term capital gain | | | 93,052,619 | | | — |
| | | |
| | $ | 99,672,862 | | $ | — |
| | | |
At December 31, 2007, the cost of investments, net unrealized appreciation (depreciation) and undistributed long term capital gains for income tax purposes were as follows:
| | | | |
Cost of investments | | $ | 1,062,548,816 | |
| | | | |
| |
Unrealized appreciation | | $ | 354,503,400 | |
Unrealized depreciation | | | (66,537,894 | ) |
| | | | |
Net unrealized appreciation (depreciation) | | $ | 287,965,506 | |
| | | | |
Distributable earnings-undistributed long term capital gains | | $ | 132,503,185 | |
| | | | |
Net investment income (loss) differs for financial statement and tax purposes primarily due to differing treatments of foreign currency transactions.
Net realized gains (losses) differ for financial statement and tax purposes primarily due to differing treatments of wash sales and foreign currency transactions.
FSC-18
Franklin Templeton Variable Insurance Products Trust
Notes to Financial Statements (continued)
Franklin Small-Mid Cap Growth Securities Fund
6. INVESTMENT TRANSACTIONS
Purchases and sales of investments (excluding short term securities) for the year ended December 31, 2007, aggregated $884,855,696 and $950,930,301, respectively.
7. INVESTMENTS IN FRANKLIN INSTITUTIONAL FIDUCIARY TRUST MONEY MARKET PORTFOLIO
The Fund may invest in the Franklin Institutional Fiduciary Trust Money Market Portfolio (Sweep Money Fund), an open-end investment company managed by Advisers. Management fees paid by the Fund are reduced on assets invested in the Sweep Money Fund, in an amount not to exceed the management and administrative fees paid by the Sweep Money Fund.
8. REGULATORY AND LITIGATION MATTERS
As part of various investigations by a number of federal, state, and foreign regulators and governmental entities, including the Securities and Exchange Commission (“SEC”), relating to certain practices in the mutual fund industry, including late trading, market timing and marketing support payments to securities dealers who sell fund shares (“marketing support”), Franklin Resources, Inc. and certain of its subsidiaries (collectively, the “Company”), entered into settlements with certain of those regulators and governmental entities. Specifically, the Company entered into settlements with the SEC, among others, concerning market timing and marketing support.
On June 6, 2007, the SEC posted for public comment the proposed plan of distribution for the market timing settlement. Once the SEC approves the final plan of distribution, disbursements of settlement monies will be made promptly to individuals who were shareholders of the designated funds during the relevant period, in accordance with the terms and conditions of the settlement and plan.
In addition, the Company, as well as most of the mutual funds within Franklin Templeton Investments and certain current or former officers, Company directors, fund directors, and employees, have been named in private lawsuits (styled as shareholder class actions, or as derivative actions on behalf of either the named funds or Franklin Resources, Inc.). The lawsuits relate to the industry practices referenced above.
The Company and fund management believe that the claims made in each of the private lawsuits referenced above are without merit and intend to defend against them vigorously. The Company cannot predict with certainty the eventual outcome of these lawsuits, nor whether they will have a material negative impact on the Company. If it is determined that the Company bears responsibility for any unlawful or inappropriate conduct that caused losses to the Trust, it is committed to making the Trust or its shareholders whole, as appropriate.
9. NEW ACCOUNTING PRONOUNCEMENT
In September 2006, the Financial Accounting Standards Board (FASB) issued FASB Statement No. 157, “Fair Value Measurement” (SFAS 157), which defines fair value, establishes a framework for measuring fair value, and expands disclosures about fair value measurements. SFAS 157 is effective for fiscal years beginning after November 15, 2007, and interim periods within those fiscal years. The Trust believes the adoption of SFAS 157 will have no material impact on its financial statements.
FSC-19
Franklin Templeton Variable Insurance Products Trust
Franklin Small-Mid Cap Growth Securities Fund
Report of Independent Registered Public Accounting Firm
To the Board of Trustees and Shareholders of
Franklin Templeton Variable Insurance Products Trust
In our opinion, the accompanying statement of assets and liabilities, including the statement of investments, and the related statements of operations and of changes in net assets and the financial highlights present fairly, in all material respects, the financial position of Franklin Small-Mid Cap Growth Securities Fund (one of the funds constituting Franklin Templeton Variable Insurance Products Trust, hereafter referred to as the “Fund”) at December 31, 2007, the results of its operations for the year then ended, the changes in its net assets for each of the two years in the period then ended and the financial highlights for each of the five years in the period then ended, in conformity with accounting principles generally accepted in the United States of America. These financial statements and financial highlights (hereafter referred to as “financial statements”) are the responsibility of the Fund’s management. Our responsibility is to express an opinion on these financial statements based on our audits. We conducted our audits of these financial statements in accordance with the standards of the Public Company Accounting Oversight Board (United States). Those standards require that we plan and perform the audit to obtain reasonable assurance about whether the financial statements are free of material misstatement. An audit includes examining, on a test basis, evidence supporting the amounts and disclosures in the financial statements, assessing the accounting principles used and significant estimates made by management, and evaluating the overall financial statement presentation. We believe that our audits, which included confirmation of securities at December 31, 2007 by correspondence with the custodian and brokers, provide a reasonable basis for our opinion.
PricewaterhouseCoopers LLP
San Francisco, California
February 14, 2008
FSC-20
Franklin Templeton Variable Insurance Products Trust
Tax Designation (unaudited)
Franklin Small-Mid Cap Growth Securities Fund
Under Section 852(b)(3)(C) of the Internal Revenue Code, the Fund designates the maximum amount allowable but no less than $132,507,097 as a long term capital gain dividend for the fiscal year ended December 31, 2007.
FSC-21
FRANKLIN STRATEGIC INCOME SECURITIES FUND
This annual report for Franklin Strategic Income Securities Fund covers the fiscal year ended December 31, 2007.
Performance Summary as of 12/31/07
Average annual total return of Class 1 shares represents the average annual change in value, assuming reinvestment of dividends and capital gains. Average returns smooth out variations in returns, which can be significant; they are not the same as year-by-year results.
Periods ended 12/31/07
| | | | | | |
| | | 1-Year | | 5-Year | | Since
Inception
(7/1/99) |
Average Annual Total Return | | +6.20% | | +9.19% | | +7.41% |
Total Return Index Comparison for Hypothetical $10,000 Investment (7/1/99–12/31/07)
The graph below shows the change in value of a hypothetical $10,000 investment in the Fund over the indicated period and includes reinvestment of any income or distributions. The Fund’s performance is compared to the performance of the Lehman Brothers (LB) U.S. Aggregate Index and the Lipper Multi-Sector Income Funds Classification Average. One cannot invest directly in an index, nor is an index representative of the Fund’s portfolio. Please see Important Notes to Performance Information preceding the Fund Summaries.
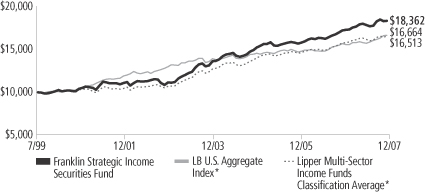
*Sources: Standard & Poor’s Micropal; Lipper Inc. Please see Index Descriptions following the Fund Summaries.
Franklin Strategic Income Securities Fund – Class 1
Performance reflects the Fund’s Class 1 operating expenses, but does not include any contract fees, expenses or sales charges. If they had been included, performance would be lower. These charges and deductions, particularly for variable life policies, can have a significant effect on contract values and insurance benefits. See the contract prospectus for a complete description of these expenses, including sales charges.
Performance data represent past performance, which does not guarantee future results. Investment return and principal value will fluctuate, and you may have a gain or loss when you sell your shares. Current performance may differ from figures shown.
FSI-1
Fund Goals and Main Investments: Franklin Strategic Income Securities Fund seeks a high level of current income, with capital appreciation over the long term as a secondary goal. The Fund normally invests primarily to predominantly in U.S. and foreign debt securities, including those in emerging markets. Debt securities may be high yield and lower rated and include all varieties of fixed and floating rate income securities, including bonds, mortgage securities and other asset-backed and convertible securities.
Performance Overview
You can find the Fund’s one-year total return in the Performance Summary. Compared with its benchmarks for the same period, the Fund underperformed the LB U.S. Aggregate Index’s +6.97% return, and outperformed the Lipper Multi-Sector Income Funds Classification Average’s +4.51% return.1
Economic and Market Overview
The U.S. economy grew at a moderate but uneven pace for the year ended December 31, 2007. After starting 2007 with first quarter gross domestic product (GDP) growth of 0.6% annualized, the economy accelerated to a strong second quarter growth rate of 3.8% annualized, fueled by a surge in exports. In the third quarter, GDP growth advanced at a 4.9% annualized rate, the fastest pace in four years. For most of the reporting period, consumer spending and personal income supported economic expansion, but signs of a slowing economy became evident as a number of indicators reflected a housing market correction, financial market strains and softening business and consumer spending, as well as upward inflation pressures from increasing food, energy and commodity prices and a weaker dollar. In the fourth quarter, GDP growth slowed to an estimated 0.6% annualized rate.
Oil prices exhibited continued volatility, reaching a historical high in November. Core inflation, which excludes food and energy costs, rose modestly for the year, signaling that inflation risk remains. For December 2007, core inflation had a 12-month increase of 2.4%.2 The Federal Reserve Board’s (Fed’s) preferred measure of inflation, the core personal consumption expenditures price index, reported a 12-month increase of 2.2%.3
1. Sources: Standard & Poor’s Micropal; Lipper Inc. One cannot invest directly in an index, nor is an index representative of the Fund’s portfolio. Please see Index Descriptions following the Fund Summaries.
2. Source: Bureau of Labor Statistics.
3. Source: Bureau of Economic Analysis.
Fund Risks: Because the Fund invests in bonds and other debt obligations, the Fund’s share price and yield will be affected by interest rate movements. Bond prices generally move in the opposite direction of interest rates. Thus, as prices of bonds in the Fund adjust to a rise in interest rates, the Fund’s share price may decline. High yield, lower-rated (junk) bonds generally have greater price swings and higher default risks than investment-grade bonds. Foreign investing, especially in emerging markets, involves additional risks, including currency fluctuations, economic instability, market volatility, and political and social developments. The Fund’s prospectus also includes a description of the main investment risks.
FSI-2
As investor uncertainty continued in the latter half of 2007, the Fed remained committed to act in an effort to restore normalcy to U.S. financial markets. The Fed cut the discount rate (the Fed’s interest rate charged to member banks) four times, bringing the rate to 4.75%. It also lowered the federal funds target rate three times. Minutes released from its December meeting, in which the Fed lowered the federal funds target rate to 4.25%, cited an uncertain outlook for economic growth and inflation and the need for the committee to be “exceptionally alert to economic and financial developments.”
Over the period, investors sought relative safety in short-term U.S. Treasuries, Treasury yields declined and the yield curve steepened. Short-term, two- and five-year yields declined significantly, with the two-year bill yielding 3.05% at the end of December, down from 4.82% a year earlier. The 10-year U.S. Treasury note ended December yielding 4.04%, compared with 4.71% at the beginning of the period.
Global economic growth remained strong during the reporting period despite a credit crunch in the second half of the year prompted by the deteriorating U.S. housing sector. Robust economic growth in many emerging markets contrasted with more moderate growth in developed markets where deficient financial liquidity had a larger impact. The rapid rise among developing economies resulted in increased demand from local consumers. Greater food and energy consumption led to high commodity prices throughout the year, benefiting countries exporting these goods. High prices also contributed to inflationary pressures already present in several economies after years of continued above-trend growth. Strong economic growth and rising interest rates in many economies contrasted with the U.S.’s weak growth and falling interest rates, which caused significant U.S. dollar depreciation during the year.
Investment Strategy
We allocate our investments among the various types of debt available based on our assessment of changing economic, global market, industry and issuer conditions. We use a top-down analysis of macroeconomic trends, combined with a bottom-up fundamental analysis of market sectors, industries and issuers, seeking to take advantage of varying sector reactions to economic events. For example, we may evaluate business cycles, yield curves, country risk, and the relative interest rates among currencies, and values between and within markets. In selecting debt securities, we generally conduct our own analysis of the security’s intrinsic value rather than simply relying on the coupon rate or rating.
FSI-3
Portfolio Breakdown
Franklin Strategic Income Securities Fund
Based on Total Net Assets
| | | | |
| | | 12/31/07 | | 12/31/06 |
| | |
| High Yield Corporate Bonds & Preferred Stocks | | 25.7% | | 30.8% |
| | |
| Mortgages & Other Asset-Backed Bonds | | 15.3% | | 12.2% |
| | |
| Floating Rate Bank Loans | | 15.2% | | 11.9% |
| | |
| Other International Bonds (non-$US) | | 12.7% | | 14.7% |
| | |
| International Developed Country Bonds (non-$US) | | 9.3% | | 9.8% |
| | |
| U.S. Government & Agency Bonds* | | 7.2% | | 8.8% |
| | |
| Investment Grade Corporate Bonds | | 6.2% | | 4.1% |
| | |
| Convertible Securities | | 2.9% | | 2.1% |
| | |
| Emerging Market Bonds ($US) | | 1.7% | | 3.2% |
| | |
| Short-Term Investments & Other Net Assets** | | 3.8% | | 2.4% |
*As of 12/31/07, includes 0.2% denominated in non-U.S. dollars, and 0.9% in TIPS. As of 12/31/06, includes 1.1% denominated in non-U.S. dollars and 2.1% in TIPS.
**Includes gains/losses on forward currency contracts.
The dollar value, number of shares or principal amount, and names of all portfolio holdings are listed in the Fund’s Statement of Investments.
Manager’s Discussion
During the fiscal year under review, Franklin Strategic Income Securities Fund underperformed the LB U.S. Aggregate Index, and outperformed the Lipper Multi-Sector Income Funds Classification Average. The Fund’s lower weighting in U.S. interest-rate-sensitive sectors, such as U.S. Treasury and agency debt, during a period of declining interest rates hindered results relative to the LB U.S. Aggregate Index. Compared to the Lipper Average, the Fund’s performance was aided by its non-U.S. dollar government bond positions, which benefited from significant U.S. dollar depreciation during the period.
During the first half of 2007, global fixed income markets generally experienced rising interest rates, which pressured fixed income returns. In addition, the Fed kept the federal funds target rate steady given expected healthy domestic economic growth. Beginning in June, however, global fixed income markets exhibited significant volatility stemming from U.S. housing market deterioration. Rising delinquencies and defaults, particularly for residential subprime mortgages, put pressure on prices and ratings of various structured vehicles that held these
FSI-4
instruments. This led to rising risk aversion across the credit markets as many financial institutions sought to reduce their overall credit risk.
A lower federal funds target rate combined with heightened investor risk aversion pushed U.S. Treasury prices higher and yields fell. Given the declines in U.S. interest rates, Treasury bonds provided above-coupon returns during the Fund’s fiscal year. Agency mortgage-backed securities lagged Treasury securities’ performance in light of widening mortgage market spreads and increased prepayment sensitivity. Asset-backed securities (ABS) significantly underperformed Treasuries, driven largely by weakness in securities tied to subprime home equity loans. Consequently, the Fund’s heavier exposure to agency mortgages than Treasuries hindered performance. During the reporting period, the Fund added to its holdings in commercial mortgage-backed securities and credit-card ABS as valuations fell in these sectors and our assessment of fundamentals remained supportive.
In terms of more credit-sensitive fixed income sectors, after experiencing strong relative performance during the first five months of the year, the high yield corporate bond and leveraged corporate bank loan sectors experienced declining prices and widening yield spreads during the latter half of the period. Although fundamentals for noninvestment-grade issuers remained supportive (with default rates near historical lows), a significant forward supply of lower-rated loans and corporate bond issues, primarily to fund announced leveraged buyout transactions, weighed on these markets. In addition, funding for structured vehicles, which had been the largest buyer of leveraged bank loans, dried up as their liability costs rose. Spreads for high yield corporate bonds rose from 3.2% to 5.9% by period-end, while secondary prices for leveraged bank loans fell below par.4 The Fund reduced exposure to high yield corporate bonds in favor of bank loans over the past several quarters. Overall, these sectors generated similar total returns over the past year. However, following the sell-off, we believed valuations for senior secured bank loans had become increasingly attractive. As a result, the Fund added to its loan exposure during the period.
4. Source: Credit Suisse.
FSI-5
Beginning in June 2007, spreads for U.S. dollar-denominated emerging market bonds also rose, although to a lesser extent than for high yield corporate bonds. The Fund’s low exposure to this sector, at 1.7% of total net assets at period-end, therefore benefited performance relative to certain of our peers. The Fund attempted to take advantage of dislocations in the investment-grade financial corporate sector by adding exposure to select bank and brokerage bonds at historically cheap valuations. We believed the earnings pressure and write-offs for the issuers would not ultimately threaten these institutions’ viability.
The non-U.S. dollar sovereign fixed income sector was the standout performer during the fiscal year as the U.S. dollar experienced significant, broad-based depreciation. The structural imbalances caused by the U.S. current account deficit as well as the reduction in short-term U.S. interest rates relative to certain other countries pressured the U.S. dollar. Throughout the period, we held a significant weighting in non-U.S. dollar-denominated bonds based on our belief that these trends could cause further longer-term U.S. dollar weakness. Over the period, gains in the Fund’s non-dollar bond positions included Canada, Brazil, Norway and Poland.
The Fund added exposure to the convertible securities sector during the fiscal year, leveraging the expertise of Franklin Templeton Investments’ equity and convertible research groups. However, overall exposure to this asset class compared with other asset classes remained relatively low at period-end.
Thank you for your participation in Franklin Strategic Income Securities Fund. We look forward to serving your future investment needs.
The foregoing information reflects our analysis, opinions and portfolio holdings as of December 31, 2007, the end of the reporting period. The way we implement our main investment strategies and the resulting portfolio holdings may change depending on factors such as market and economic conditions. These opinions may not be relied upon as investment advice or an offer for a particular security. The information is not a complete analysis of every aspect of any market, country, industry, security or the Fund. Statements of fact are from sources considered reliable, but the investment manager makes no representation or warranty as to their completeness or accuracy. Although historical performance is no guarantee of future results, these insights may help you understand our investment management philosophy.
FSI-6
Fund Expenses
As an investor in a variable insurance contract (Contract) that indirectly provides for investment in an underlying mutual fund, you can incur transaction and/or ongoing expenses at both the Fund level and the Contract level.
| • | | Transaction expenses can include sales charges (loads) on purchases, redemption fees, surrender fees, transfer fees and premium taxes. |
| • | | Ongoing expenses can include management fees, distribution and service (12b-1) fees, contract fees, annual maintenance fees, mortality and expense risk fees and other fees and expenses. All mutual funds and Contracts have some types of ongoing expenses. |
The expenses shown in the table are meant to highlight ongoing expenses at the Fund level only and do not include ongoing expenses at the Contract level, or transaction expenses at either the Fund or Contract level. While the Fund does not have transaction expenses, if the transaction and ongoing expenses at the Contract level were included, the expenses shown below would be higher. You should consult your Contract prospectus or disclosure document for more information.
The table shows Fund-level ongoing expenses and can help you understand these expenses and compare them with those of other mutual funds offered through the Contract. The table assumes a $1,000 investment held for the six months indicated. Please refer to the Fund prospectus for additional information on operating expenses.
Actual Fund Expenses
The first line (Actual) of the table provides actual account values and expenses. The “Ending Account Value” is derived from the Fund’s actual return, which includes the effect of ongoing Fund expenses, but does not include the effect of ongoing Contract expenses.
You can estimate the Fund-level expenses you incurred during the period by following these steps. Of course, your account value and expenses will differ from those in this illustration:
| 1. | Divide your account value by $1,000. |
If an account had an $8,600 value, then $8,600 ÷ $1,000 = 8.6.
| 2. | Multiply the result by the number under the heading “Fund-Level Expenses Incurred During Period.” |
If Fund-Level Expenses Incurred During Period were $7.50, then 8.6 x $7.50 = $64.50.
In this illustration, the estimated expenses incurred this period at the Fund level are $64.50.
Franklin Strategic Income Securities Fund – Class 1
FSI-7
Hypothetical Example for Comparison with Other Mutual Funds
Information in the second line (Hypothetical) of the table can help you compare ongoing expenses of the Fund with those of other mutual funds offered through the Contract. This information may not be used to estimate the actual ending account balance or expenses you incurred during the period. The hypothetical “Ending Account Value” is based on the Fund’s actual expense ratio and an assumed 5% annual rate of return before expenses, which does not represent the Fund’s actual return. The figure under the heading “Fund-Level Expenses Incurred During Period” shows the hypothetical expenses your account would have incurred under this scenario. You can compare this figure with the 5% hypothetical examples that appear in shareholder reports of other funds offered through a Contract.
| | | | | | | | | |
| Class 1 | | Beginning
Account Value 7/1/07 | | Ending
Account
Value 12/31/07 | | Fund-Level
Expenses Incurred
During Period*
7/1/07–12/31/07 |
Actual | | $ | 1,000 | | $ | 1,028.20 | | $ | 3.17 |
Hypothetical (5% return before expenses) | | $ | 1,000 | | $ | 1,022.08 | | $ | 3.16 |
*Expenses are calculated using the most recent six-month annualized expense ratio for the Fund’s Class 1 shares (0.62%), which does not include any ongoing expenses of the Contract for which the Fund is an investment option, multiplied by the average account value over the period, multiplied by 184/365 to reflect the one-half year period.
FSI-8
Franklin Templeton Variable Insurance Products Trust
Financial Highlights
Franklin Strategic Income Securities Fund
| | | | | | | | | | | | | | | | | | | | |
| | | Year Ended December 31, | |
| Class 1 | | 2007 | | | 2006 | | | 2005 | | | 2004 | | | 2003 | |
| | | | |
Per share operating performance | | | | | | | | | | | | | | | | | | | | |
(for a share outstanding throughout the year) | | | | | | | | | | | | | | | | | | | | |
Net asset value, beginning of year | | $ | 12.73 | | | $ | 12.43 | | | $ | 12.92 | | | $ | 12.16 | | | $ | 10.37 | |
| | | | |
Income from investment operationsa: | | | | | | | | | | | | | | | | | | | | |
Net investment incomeb | | | 0.73 | | | | 0.69 | | | | 0.65 | | | | 0.67 | | | | 0.65 | |
Net realized and unrealized gains (losses) | | | 0.04 | | | | 0.32 | | | | (0.44 | ) | | | 0.51 | | | | 1.44 | |
| | | | |
Total from investment operations | | | 0.77 | | | | 1.01 | | | | 0.21 | | | | 1.18 | | | | 2.09 | |
| | | | |
Less distributions from: | | | | | | | | | | | | | | | | | | | | |
Net investment income | | | (0.68 | ) | | | (0.63 | ) | | | (0.60 | ) | | | (0.40 | ) | | | (0.30 | ) |
Net realized gains | | | (0.04 | ) | | | (0.08 | ) | | | (0.10 | ) | | | (0.02 | ) | | | — | |
| | | | |
Total distributions | | | (0.72 | ) | | | (0.71 | ) | | | (0.70 | ) | | | (0.42 | ) | | | (0.30 | ) |
| | | | |
Net asset value, end of year | | $ | 12.78 | | | $ | 12.73 | | | $ | 12.43 | | | $ | 12.92 | | | $ | 12.16 | |
| | | | |
| | | | | |
Total returnc | | | 6.20% | | | | 8.51% | | | | 1.73% | | | | 10.01% | | | | 20.36% | |
Ratios to average net assets | | | | | | | | | | | | | | | | | | | | |
Expenses | | | 0.62% | e | | | 0.62% | e | | | 0.66% | e | | | 0.66% | e | | | 0.65% | |
Net investment income | | | 5.72% | | | | 5.51% | | | | 5.21% | | | | 5.45% | | | | 5.69% | |
| | | | | |
Supplemental data | | | | | | | | | | | | | | | | | | | | |
Net assets, end of year (000’s) | | $ | 1,086,850 | | | $ | 902,071 | | | $ | 740,352 | | | $ | 571,067 | | | $ | 359,947 | |
Portfolio turnover rate | | | 46.88% | | | | 47.88% | | | | 40.56% | | | | 50.21% | | | | 49.87% | |
Portfolio turnover rate excluding mortgage dollar rollsd | | | 46.43% | | | | 44.58% | | | | 40.07% | | | | 38.39% | | | | 32.74% | |
aThe amount shown for a share outstanding throughout the period may not correlate with the Statement of Operations for the period due to the timing of sales and repurchases of the Fund shares in relation to income earned and/or fluctuating market value of the investments of the Fund.
bBased on average daily shares outstanding.
cTotal return does not include any fees, charges or expenses imposed by the variable annuity and life insurance contracts for which the Franklin Templeton Variable Insurance Products Trust serves as an underlying investment vehicle.
dSee Note 1e regarding mortgage dollar rolls.
eBenefit of expense reduction rounds to less than 0.01%.
The accompanying notes are an integral part of these financial statements.
FSI-9
Franklin Templeton Variable Insurance Products Trust
Financial Highlights (continued)
Franklin Strategic Income Securities Fund
| | | | | | | | | | | | | | | | | | | | |
| | | Year Ended December 31, | |
| Class 2 | | 2007 | | | 2006 | | | 2005 | | | 2004 | | | 2003 | |
| | | | |
Per share operating performance | | | | | | | | | | | | | | | | | | | | |
(for a share outstanding throughout the year) | | | | | | | | | | | | | | | | | | | | |
Net asset value, beginning of year | | $ | 12.56 | | | $ | 12.27 | | | $ | 12.78 | | | $ | 12.05 | | | $ | 10.29 | |
| | | | |
Income from investment operationsa: | | | | | | | | | | | | | | | | | | | | |
Net investment incomeb | | | 0.69 | | | | 0.65 | | | | 0.61 | | | | 0.63 | | | | 0.62 | |
Net realized and unrealized gains (losses) | | | 0.05 | | | | 0.31 | | | | (0.44 | ) | | | 0.51 | | | | 1.43 | |
| | | | |
Total from investment operations | | | 0.74 | | | | 0.96 | | | | 0.17 | | | | 1.14 | | | | 2.05 | |
| | | | |
Less distributions from: | | | | | | | | | | | | | | | | | | | | |
Net investment income | | | (0.66 | ) | | | (0.59 | ) | | | (0.58 | ) | | | (0.39 | ) | | | (0.29 | ) |
Net realized gains | | | (0.04 | ) | | | (0.08 | ) | | | (0.10 | ) | | | (0.02 | ) | | | — | |
| | | | |
Total distributions | | | (0.70 | ) | | | (0.67 | ) | | | (0.68 | ) | | | (0.41 | ) | | | (0.29 | ) |
| | | | |
Net asset value, end of year | | $ | 12.60 | | | $ | 12.56 | | | $ | 12.27 | | | $ | 12.78 | | | $ | 12.05 | |
| | | | |
| | | | | |
Total returnc | | | 5.91% | | | | 8.24% | | | | 1.46% | | | | 9.80% | | | | 20.10% | |
Ratios to average net assets | | | | | | | | | | | | | | | | | | | | |
Expenses | | | 0.87% | e | | | 0.87% | e | | | 0.91% | e | | | 0.91% | e | | | 0.90% | |
Net investment income | | | 5.47% | | | | 5.26% | | | | 4.96% | | | | 5.20% | | | | 5.44% | |
| | | | | |
Supplemental data | | | | | | | | | | | | | | | | | | | | |
Net assets, end of year (000’s) | | $ | 24,613 | | | $ | 11,753 | | | $ | 19,514 | | | $ | 4,657 | | | $ | 1,841 | |
Portfolio turnover rate | | | 46.88% | | | | 47.88% | | | | 40.56% | | | | 50.21% | | | | 49.87% | |
Portfolio turnover rate excluding mortgage dollar rollsd | | | 46.43% | | | | 44.58% | | | | 40.07% | | | | 38.39% | | | | 32.74% | |
aThe amount shown for a share outstanding throughout the period may not correlate with the Statement of Operations for the period due to the timing of sales and repurchases of the Fund shares in relation to income earned and/or fluctuating market value of the investments of the Fund.
bBased on average daily shares outstanding.
cTotal return does not include any fees, charges or expenses imposed by the variable annuity and life insurance contracts for which the Franklin Templeton Variable Insurance Products Trust serves as an underlying investment vehicle.
dSee Note 1e regarding mortgage dollar rolls.
eBenefit of expense reduction rounds to less than 0.01%.
The accompanying notes are an integral part of these financial statements.
FSI-10
Franklin Templeton Variable Insurance Products Trust
Statement of Investments, December 31, 2007
| | | | | | | |
| Franklin Strategic Income Securities Fund | | Country/
Organization | | Shares | | Value |
Long Term Investments 93.5% | | | | | | | |
Convertible Preferred Stocks 1.3% | | | | | | | |
Consumer Durables 0.2% | | | | | | | |
General Motors Corp., 1.50%, cvt. pfd., D | | United States | | 104,000 | | $ | 2,535,000 |
| | | | | | | |
Finance 0.8% | | | | | | | |
Affiliated Managers Group Inc., 5.10%, cvt. pfd. | | United States | | 62,000 | | | 3,270,500 |
aCIT Group Inc., 7.75%, cvt. pfd., D | | United States | | 140,000 | | | 2,640,400 |
E*TRADE Financial Corp., 6.125%, cvt. pfd. | | United States | | 170,000 | | | 963,900 |
aWashington Mutual Inc., 7.75%, cvt. pfd., R | | United States | | 2,000 | | | 1,770,000 |
| | | | | | | |
| | | | | | | 8,644,800 |
| | | | | | | |
Non-Energy Minerals 0.3% | | | | | | | |
Freeport-McMoRan Copper & Gold Inc., 6.75%, cvt. pfd. | | United States | | 20,000 | | | 3,018,400 |
| | | | | | | |
Total Convertible Preferred Stocks (Cost $18,085,886) | | | | | | | 14,198,200 |
| | | | | | | |
Preferred Stocks 0.4% | | | | | | | |
Finance 0.4% | | | | | | | |
aFHLMC, 8.375%, pfd. | | United States | | 82,800 | | | 2,161,080 |
aFNMA, 8.25%, pfd. | | United States | | 80,000 | | | 2,056,000 |
| | | | | | | |
Total Preferred Stocks (Cost $4,070,000) | | | | | | | 4,217,080 |
| | | | | | | |
| | | |
| | | | | Principal
Amountb | | |
c,dSenior Floating Rate Interests 15.1% | | | | | | | |
Commercial Services 1.8% | | | | | | | |
Affiliated Computer Services Inc., | | | | | | | |
Additional Term Loan, 6.845% - 7.243%, 3/20/13 | | United States | | 3,161,943 | | | 3,065,513 |
Term Loan B, 6.865%, 3/20/13 | | United States | | 329,280 | | | 319,237 |
ARAMARK Corp., | | | | | | | |
Synthetic L/C, 5.198%, 1/26/14 | | United States | | 189,897 | | | 180,069 |
Term Loan B, 6.705%, 1/26/14 | | United States | | 2,656,975 | | | 2,519,476 |
Dealer Computer Services Inc. (Reynolds & Reynolds), First Lien Term Loan,
6.843%, 10/26/12 | | United States | | 2,655,053 | | | 2,561,170 |
First Data Corp., Term Loan B-2, 7.58% - 7.634%, 9/24/14 | | United States | | 4,089,750 | | | 3,879,128 |
IDEARC Inc., Term Loan B, 6.830%, 11/17/14 | | United States | | 2,882,392 | | | 2,752,051 |
Laureate Education Inc., Closing Date Term Loan, 8.729%, 9/25/14 | | United States | | 2,177,802 | | | 2,097,311 |
R.H. Donnelley Inc., Term Loan D-2, 6.33% - 6.66%, 6/30/11 | | United States | | 3,181,290 | | | 3,081,812 |
| | | | | | | |
| | | | | | | 20,455,767 |
| | | | | | | |
Communications 0.8% | | | | | | | |
Alaska Communications Systems Holdings Inc., | | | | | | | |
2005 Incremental Loan, 6.58%, 2/01/12 | | United States | | 54,400 | | | 51,567 |
2006 Incremental Loan, 6.58%, 2/01/12 | | United States | | 180,000 | | | 170,579 |
Term Loan, 6.58%, 2/01/12 | | United States | | 3,135,600 | | | 2,971,263 |
Alltel Communications Corp., Term Loan B-3, 7.778%, 6/30/15 | | United States | | 2,793,000 | | | 2,673,934 |
Windstream Corp., Tranche B-1, 6.714%, 7/17/13 | | United States | | 3,297,600 | | | 3,223,404 |
| | | | | | | |
| | | | | | | 9,090,747 |
| | | | | | | |
Consumer Durables 0.4% | | | | | | | |
Jarden Corp., | | | | | | | |
Term Loan B1, 6.58%, 1/24/12 | | United States | | 462,269 | | | 443,427 |
Term Loan B2, 6.58%, 1/24/12 | | United States | | 2,525,649 | | | 2,423,612 |
FSI-11
Franklin Templeton Variable Insurance Products Trust
Statement of Investments, December 31, 2007 (continued)
| | | | | | | |
| Franklin Strategic Income Securities Fund | | Country/
Organization | | Principal
Amountb | | Value |
Long Term Investments (continued) | | | | | | | |
c,dSenior Floating Rate Interests (continued) | | | | | | | |
Consumer Durables (continued) | | | | | | | |
Stile Acquisition Corp. (Masonite), Canadian Term Loan, 6.83% - 7.084%, 4/05/13 | | Canada | | 1,013,956 | | $ | 919,384 |
Stile U.S. Acquisition Corp. (Masonite), U.S. Term Loan, 6.83% - 7.084%, 4/05/13 | | United States | | 1,015,683 | | | 920,951 |
| | | | | | | |
| | | | | | | 4,707,374 |
| | | | | | | |
Consumer Non-Durables 1.0% | | | | | | | |
CBRL Group (Cracker Barrel), | | | | | | | |
Term Loan B1, 6.40%, 4/27/13 | | United States | | 2,451,992 | | | 2,327,259 |
Term Loan B2 (Delayed Draw), 6.38% - 6.40%, 4/27/13 | | United States | | 110,116 | | | 104,515 |
Constellation Brands Inc., Term Loan B, 6.438% - 6.688%, 6/05/13 | | United States | | 2,722,400 | | | 2,635,746 |
Dean Foods Co., Term Loan B, 6.58%, 4/02/14 | | United States | | 2,977,997 | | | 2,786,512 |
The William Carter Co., Term Loan B, 6.355% - 6.46%, 7/14/12 | | United States | | 3,122,697 | | | 3,006,220 |
| | | | | | | |
| | | | | | | 10,860,252 |
| | | | | | | |
Consumer Services 3.8% | | | | | | | |
Citadel Broadcasting Corp., Term Loan B, 6.455% - 6.475%, 6/12/14 | | United States | | 4,023,883 | | | 3,641,171 |
CSC Holdings Inc. (Cablevision), Incremental Term Loan, 6.896%, 3/29/13 | | United States | | 3,051,708 | | | 2,869,827 |
Green Valley Ranch Gaming LLC, Term Loan B, 6.843% - 7.081%, 2/16/14 | | United States | | 305,964 | | | 289,934 |
Insight Midwest Holdings, Term Loan B, 7.00%, 4/02/14 | | United States | | 3,073,000 | | | 2,953,552 |
MCC Iowa, | | | | | | | |
Term Loan D-1, 6.69%, 1/31/15 | | United States | | 876,122 | | | 807,443 |
Term Loan D-2 (Delayed Draw), 6.60% - 6.69%, 1/31/15 | | United States | | 850,014 | | | 783,381 |
Mediacom LLC, Term Loan C, 6.60% - 6.69%, 1/31/15 | | United States | | 1,991,976 | | | 1,835,825 |
National CineMedia LLC, Term Loan, 6.87%, 2/13/15 | | United States | | 3,090,000 | | | 2,893,136 |
OSI Restaurant Partners LLC (Outback), | | | | | | | |
Pre-Funded Revolving Credit, 4.878%, 6/14/13 | | United States | | 299,750 | | | 278,165 |
Term Loan B, 7.125%, 6/14/14 | | United States | | 3,776,846 | | | 3,499,588 |
Penn National Gaming Inc., Term Loan B, 6.58% - 6.76%, 10/03/12 | | United States | | 3,019,897 | | | 2,983,869 |
Regal Cinemas Corp., Term Loan, 6.33%, 10/27/13 | | United States | | 3,760,271 | | | 3,558,758 |
Sabre Inc., Term Loan B, 6.96%, 9/30/14 | | United States | | 2,235,158 | | | 2,043,873 |
Tribune Co., Term Loan B, 7.91%, 5/16/14 | | United States | | 4,029,750 | | | 3,409,410 |
Univision Communications Inc., Term Loan B, 7.095% - 7.21%, 9/29/14 | | United States | | 2,995,973 | | | 2,736,792 |
UPC Financing Partnership, Term Loan N, 7.13%, 12/31/14 | | Netherlands | | 2,970,000 | | | 2,775,881 |
VML U.S. Finance LLC (Venetian Macau), | | | | | | | |
Delay Draw, 7.08%, 5/25/12 | | Macau | | 1,281,852 | | | 1,226,642 |
New Project Term Loan, 7.08%, 5/25/13 | | Macau | | 702,778 | | | 669,579 |
Term Loan B, 7.08%, 5/24/13 | | Macau | | 2,230,370 | | | 2,128,955 |
| | | | | | | |
| | | | | | | 41,385,781 |
| | | | | | | |
Electronic Technology 0.5% | | | | | | | |
Flextronics International USA Inc., | | | | | | | |
Term Loan A, 7.394% - 7.395%, 10/01/14 | | United States | | 2,539,787 | | | 2,476,699 |
Term Loan A-1, 7.455%, 10/01/14 | | United States | | 729,824 | | | 711,695 |
Hawker Beechcraft Inc., | | | | | | | |
Synthetic L/C, 4.73%, 3/26/14 | | United States | | 173,852 | | | 166,394 |
Term Loan B, 6.83%, 3/26/14 | | United States | | 2,039,204 | | | 1,951,722 |
| | | | | | | |
| | | | | | | 5,306,510 |
| | | | | | | |
Energy Minerals 0.3% | | | | | | | |
Citgo Petroleum Corp., Term Loan B, 6.435%, 11/15/12 | | United States | | 2,328,531 | | | 2,260,189 |
Western Refining Inc., Term Loan B, 6.595%, 5/30/14 | | United States | | 808,438 | | | 776,860 |
| | | | | | | |
| | | | | | | 3,037,049 |
| | | | | | | |
FSI-12
Franklin Templeton Variable Insurance Products Trust
Statement of Investments, December 31, 2007 (continued)
| | | | | | | |
| Franklin Strategic Income Securities Fund | | Country/
Organization | | Principal
Amountb | | Value |
Long Term Investments (continued) | | | | | | | |
c,dSenior Floating Rate Interests (continued) | | | | | | | |
Finance 0.8% | | | | | | | |
Avis Budget Car Rental LLC, Term Loan, 6.21%, 4/19/12 | | United States | | 2,635,572 | | $ | 2,528,120 |
Hertz Corp., | | | | | | | |
Credit Link, 4.91%, 12/21/12 | | United States | | 277,778 | | | 270,611 |
Term Loan B, 6.75% - 6.92%, 12/21/12 | | United States | | 1,540,058 | | | 1,500,325 |
eNuveen Investments Inc., Term Loan B, 7.25%, 11/13/14 | | United States | | 2,200,000 | | | 2,169,838 |
TD Ameritrade Holding Corp., Term Loan B, 6.35%, 12/31/12 | | United States | | 2,118,539 | | | 2,064,410 |
| | | | | | | |
| | | | | | | 8,533,304 |
| | | | | | | |
Health Services 1.1% | | | | | | | |
Community Health Systems Inc., Term Loan, 7.331%, 7/25/14 | | United States | | 2,992,464 | | | 2,876,357 |
eDaVita Inc., Term Loan B-1, 6.35% - 6.74%, 10/05/12 | | United States | | 680,000 | | | 652,569 |
Fresenius Medical Care Holdings Inc., Term Loan B, 6.205% - 6.624%, 3/31/13 | | United States | | 2,646,573 | | | 2,552,329 |
HCA Inc., Term Loan B-1, 7.08%, 11/18/13 | | United States | | 3,641,782 | | | 3,490,502 |
Health Management Associates Inc., Term Loan B, 6.58% - 6.595%, 2/28/14 | | United States | | 1,826,118 | | | 1,698,837 |
LifePoint Hospitals Inc., Term Loan B, 6.715%, 4/15/12 | | United States | | 1,476,576 | | | 1,406,320 |
| | | | | | | |
| | | | | | | 12,676,914 |
| | | | | | | |
Health Technology 0.1% | | | | | | | |
Bausch and Lomb Inc., Parent Term Loan B, 8.08%, 4/28/15 | | United States | | 800,000 | | | 795,920 |
Carestream Health Inc., Term Loan, 6.83% - 7.327%, 4/30/13 | | United States | | 281,597 | | | 259,894 |
| | | | | | | |
| | | | | | | 1,055,814 |
| | | | | | | |
Industrial Services 0.3% | | | | | | | |
Allied Waste North America Inc., | | | | | | | |
Credit Link, 5.43%, 3/28/14 | | United States | | 658,354 | | | 632,349 |
Term Loan B, 6.36% - 6.88%, 3/28/14 | | United States | | 1,095,007 | | | 1,051,754 |
Knight Inc. (Kinder Morgan), Term Loan B, 6.35%, 5/30/14 | | United States | | 2,152,013 | | | 2,130,601 |
| | | | | | | |
| | | | | | | 3,814,704 |
| | | | | | | |
Process Industries 1.4% | | | | | | | |
Celanese U.S. Holdings LLC, Dollar Term Loan, 6.979%, 4/02/14 | | United States | | 2,512,375 | | | 2,412,558 |
eDomtar Corp., Term Loan, 6.403%, 3/07/14 | | United States | | 2,797,990 | | | 2,677,341 |
Georgia-Pacific Corp., | | | | | | | |
Additional Term Loan, 6.58% - 6.896%, 12/20/12 | | United States | | 638,259 | | | 604,674 |
Term Loan B, 6.58% - 6.896%, 12/20/12 | | United States | | 2,127,165 | | | 2,011,745 |
Hexion Specialty Chemicals B.V., | | | | | | | |
Term Loan C-1, 7.50%, 5/03/13 | | United States | | 2,795,777 | | | 2,714,168 |
Term Loan C-2, 7.125%, 5/03/13 | | United States | | 605,785 | | | 588,102 |
Ineos U.S. Finance LLC, | | | | | | | |
Term Loan B2, 7.357%, 12/16/13 | | United States | | 1,070,356 | | | 1,035,463 |
Term Loan C2, 7.857%, 12/23/14 | | United States | | 1,070,356 | | | 1,031,780 |
Nalco Co., Term Loan B, 6.48% - 7.12%, 11/04/10 | | United States | | 2,156,300 | | | 2,117,767 |
| | | | | | | |
| | | | | | | 15,193,598 |
| | | | | | | |
Producer Manufacturing 1.0% | | | | | | | |
Allison Transmission, Term Loan B, 7.90% - 8.00%, 8/07/14 | | United States | | 2,700,000 | | | 2,513,052 |
Baldor Electric Co., Term Loan B, 6.75% - 7.125%, 1/31/14 | | United States | | 2,404,433 | | | 2,353,459 |
Bucyrus International Inc., Tranche B Dollar Term Loan, 6.378% - 6.725%, 5/04/14 | | United States | | 272,318 | | | 265,286 |
Dresser Inc., Term Loan B, 6.449% - 7.345%, 5/04/14 | | United States | | 3,236,070 | | | 3,120,802 |
Key Safety Systems Inc., Term Loan B, 7.09% - 7.45%, 3/10/14 | | United States | | 288,550 | | | 267,930 |
Oshkosh Truck Corp., Term Loan B, 6.90%, 12/06/13 | | United States | | 3,113,106 | | | 2,967,942 |
| | | | | | | |
| | | | | | | 11,488,471 |
| | | | | | | |
FSI-13
Franklin Templeton Variable Insurance Products Trust
Statement of Investments, December 31, 2007 (continued)
| | | | | | | |
| Franklin Strategic Income Securities Fund | | Country/
Organization | | Principal
Amountb | | Value |
Long Term Investments (continued) | | | | | | | |
c,dSenior Floating Rate Interests (continued) | | | | | | | |
Real Estate Investment Trusts 0.4% | | | | | | | |
Capital Automotive REIT, Term Loan B, 6.98%, 12/15/10 | | United States | | 2,663,963 | | $ | 2,593,341 |
Macerich Co., Term Loan B, 6.75%, 4/25/10 | | United States | | 1,842,000 | | | 1,796,300 |
| | | | | | | |
| | | | | | | 4,389,641 |
| | | | | | | |
Technology Services 0.3% | | | | | | | |
SunGard Data Systems Inc., New U.S. Term Loan, 6.898%, 2/28/14 | | United States | | 3,838,164 | | | 3,696,996 |
| | | | | | | |
Utilities 1.1% | | | | | | | |
Dynegy Holdings Inc., | | | | | | | |
Term L/C Facility, 6.355%, 4/02/13 | | United States | | 2,724,468 | | | 2,547,487 |
Term Loan B, 6.752%, 4/02/13 | | United States | | 100,281 | | | 93,766 |
Niska Gas Storage Canada ULC (C/R Gas), | | | | | | | |
Asset Sale Term Loan, 6.741%, 5/13/11 | | Canada | | 269,614 | | | 260,560 |
Canadian Term Loan, 7.323%, 5/12/13 | | Canada | | 1,526,193 | | | 1,472,593 |
Niska Gas Storage U.S. LLC (C/R Gas), | | | | | | | |
Delay Draw, 6.808%, 5/12/13 | | United States | | 167,523 | | | 160,211 |
U.S. Term Loan, 7.323%, 5/12/13 | | United States | | 247,306 | | | 236,094 |
NRG Energy Inc., | | | | | | | |
Credit Link, 6.48%, 2/01/13 | | United States | | 890,930 | | | 848,174 |
Term Loan, 6.58%, 2/01/13 | | United States | | 1,929,689 | | | 1,837,083 |
Texas Competitive Electric Holdings Co. LLC, Term Loan B-2, 8.396%, 10/10/14 | | United States | | 4,100,000 | | | 4,018,041 |
TPF Generation Holdings LLC, | | | | | | | |
Synthetic L/C, 4.83%, 12/15/13 | | United States | | 136,618 | | | 131,739 |
Synthetic Revolver, 4.73%, 12/15/11 | | United States | | 42,827 | | | 40,803 |
Term Loan, 7.198%,12/15/13 | | United States | | 698,725 | | | 673,774 |
| | | | | | | |
| | | | | | | 12,320,325 |
| | | | | | | |
Total Senior Floating Rate Interests (Cost $175,222,428) | | | | | | | 168,013,247 |
| | | | | | | |
Corporate Bonds 31.9% | | | | | | | |
Commercial Services 2.1% | | | | | | | |
ARAMARK Corp., senior note, 8.50%, 2/01/15 | | United States | | 3,000,000 | | | 3,052,500 |
fCeva Group PLC, senior note, 144A, 10.00%, 9/01/14 | | United Kingdom | | 2,000,000 | | | 2,065,000 |
Dex Media West LLC, senior sub. note, 9.875%, 8/15/13 | | United States | | 2,200,000 | | | 2,293,500 |
IDEARC Inc., senior note, 8.00%, 11/15/16 | | United States | | 2,000,000 | | | 1,845,000 |
Iron Mountain Inc., senior sub. note, 8.75%, 7/15/18 | | United States | | 3,000,000 | | | 3,168,750 |
JohnsonDiversey Holdings Inc., senior disc. note, 10.67%, 5/15/13 | | United States | | 900,000 | | | 913,500 |
JohnsonDiversey Inc., senior sub. note, B, 9.625%, 5/15/12 | | United States | | 1,900,000 | | | 1,952,250 |
Lamar Media Corp., senior sub. note, | | | | | | | |
7.25%, 1/01/13 | | United States | | 2,800,000 | | | 2,814,000 |
6.625%, 8/15/15 | | United States | | 400,000 | | | 391,000 |
R.H. Donnelley Corp., senior note, | | | | | | | |
8.875%, 1/15/16 | | United States | | 1,100,000 | | | 1,034,000 |
f144A, 8.875%, 10/15/17 | | United States | | 1,100,000 | | | 1,023,000 |
RSC Equipment Rental Inc., senior note, 9.50%, 12/01/14 | | United States | | 2,900,000 | | | 2,610,000 |
| | | | | | | |
| | | | | | | 23,162,500 |
| | | | | | | |
Communications 3.4% | | | | | | | |
fAmerican Tower Corp., senior note, 144A, 7.00%, 10/15/17 | | United States | | 2,900,000 | | | 2,929,000 |
AT&T Inc., 4.95%, 1/15/13 | | United States | | 2,500,000 | | | 2,516,097 |
fDigicel Group Ltd., senior note, 144A, 8.875%, 1/15/15 | | Jamaica | | 2,900,000 | | | 2,660,750 |
Embarq Corp., senior note, 7.082%, 6/01/16 | | United States | | 3,300,000 | | | 3,405,620 |
Inmarsat Finance II PLC, senior note, zero cpn. to 11/15/08,
10.375% thereafter, 11/15/12 | | United Kingdom | | 2,800,000 | | | 2,733,500 |
FSI-14
Franklin Templeton Variable Insurance Products Trust
Statement of Investments, December 31, 2007 (continued)
| | | | | | | |
| Franklin Strategic Income Securities Fund | | Country/
Organization | | Principal
Amountb | | Value |
Long Term Investments (continued) | | | | | | | |
Corporate Bonds (continued) | | | | | | | |
Communications (continued) | | | | | | | |
Intelsat Intermediate, senior note, zero cpn. to 2/01/10, 9.25% thereafter, 2/01/15 | | Bermuda | | 400,000 | | $ | 329,000 |
Intelsat Subsidiary Holding Co. Ltd., senior note, 8.25%, 1/15/13 | | Bermuda | | 3,500,000 | | | 3,535,000 |
MetroPCS Wireless Inc., senior note, 9.25%, 11/01/14 | | United States | | 2,700,000 | | | 2,551,500 |
Millicom International Cellular SA, senior note, 10.00%, 12/01/13 | | Luxembourg | | 3,000,000 | | | 3,210,000 |
Qwest Communications International Inc., senior note, 7.50%, 2/15/14 | | United States | | 3,400,000 | | | 3,408,500 |
Telecom Italia Capital, senior note, 4.95%, 9/30/14 | | Italy | | 2,700,000 | | | 2,603,988 |
Verizon New York Inc., senior deb., | | | | | | | |
A, 6.875%, 4/01/12 | | United States | | 2,700,000 | | | 2,867,351 |
B, 7.375%, 4/01/32 | | United States | | 400,000 | | | 440,436 |
fWind Acquisition Finance SA, senior note, 144A, 10.75%, 12/01/15 | | Italy | | 2,700,000 | | | 2,956,500 |
Windstream Corp., senior note, 8.625%, 8/01/16 | | United States | | 1,700,000 | | | 1,793,500 |
| | | | | | | |
| | | | | | | 37,940,742 |
| | | | | | | |
Consumer Durables 1.7% | | | | | | | |
Beazer Homes USA Inc., senior note, 8.125%, 6/15/16 | | United States | | 600,000 | | | 450,000 |
D.R. Horton Inc., senior note, 6.50%, 4/15/16 | | United States | | 3,000,000 | | | 2,606,853 |
Ford Motor Credit Co. LLC, senior note, | | | | | | | |
5.80%, 1/12/09 | | United States | | 3,200,000 | | | 3,038,147 |
9.875%, 8/10/11 | | United States | | 3,000,000 | | | 2,839,563 |
General Motors Corp., senior deb., 8.25%, 7/15/23 | | United States | | 3,000,000 | | | 2,400,000 |
Jarden Corp., senior sub. note, 7.50%, 5/01/17 | | United States | | 2,900,000 | | | 2,508,500 |
Jostens IH Corp., senior sub. note, 7.625%, 10/01/12 | | United States | | 1,900,000 | | | 1,919,000 |
KB Home, senior note, | | | | | | | |
6.25%, 6/15/15 | | United States | | 1,800,000 | | | 1,575,000 |
7.25%, 6/15/18 | | United States | | 1,900,000 | | | 1,729,000 |
| | | | | | | |
| | | | | | | 19,066,063 |
| | | | | | | |
Consumer Non-Durables 0.8% | | | | | | | |
Dean Foods Inc., senior note, 7.00%, 6/01/16 | | United States | | 600,000 | | | 537,000 |
Dole Foods Co., senior note, 7.25%, 6/15/10 | | United States | | 100,000 | | | 91,500 |
Kraft Foods Inc., 6.125%, 2/01/18 | | United States | | 1,400,000 | | | 1,413,335 |
Reynolds American Inc., senior secured note, 7.625%, 6/01/16 | | United States | | 3,300,000 | | | 3,524,387 |
Smithfield Foods Inc., senior note, 7.75%, | | | | | | | |
5/15/13 | | United States | | 1,500,000 | | | 1,485,000 |
7/01/17 | | United States | | 1,700,000 | | | 1,653,250 |
| | | | | | | |
| | | | | | | 8,704,472 |
| | | | | | | |
Consumer Services 4.9% | | | | | | | |
Cablevision Systems Corp., senior note, B, 8.00%, 4/15/12 | | United States | | 400,000 | | | 390,000 |
CanWest Media Inc., senior sub. note, 8.00%, 9/15/12 | | Canada | | 2,800,000 | | | 2,656,500 |
CCH I LLC, senior secured note, 11.00%, 10/01/15 | | United States | | 1,400,000 | | | 1,148,000 |
CCH II LLC, senior note, 10.25%, 9/15/10 | | United States | | 3,700,000 | | | 3,644,500 |
Comcast Corp., senior note, 6.30%, 11/15/17 | | United States | | 3,000,000 | | | 3,118,293 |
CSC Holdings Inc., | | | | | | | |
senior deb., 7.625%, 7/15/18 | | United States | | 2,100,000 | | | 1,939,875 |
senior note, 6.75%, 4/15/12 | | United States | | 300,000 | | | 288,375 |
EchoStar DBS Corp., senior note, 6.375%, 10/01/11 | | United States | | 2,900,000 | | | 2,872,450 |
fFontainebleau Las Vegas, 144A, 10.25%, 6/15/15 | | United States | | 2,100,000 | | | 1,832,250 |
Harrah’s Operating Co. Inc., senior note, 6.50%, 6/01/16 | | United States | | 1,500,000 | | | 1,119,161 |
Liberty Media Corp., senior note, 5.70%, 5/15/13 | | United States | | 3,000,000 | | | 2,794,236 |
LIN Television Corp., senior sub. note, 6.50%, 5/15/13 | | United States | | 2,400,000 | | | 2,271,000 |
FSI-15
Franklin Templeton Variable Insurance Products Trust
Statement of Investments, December 31, 2007 (continued)
| | | | | | | |
| Franklin Strategic Income Securities Fund | | Country/
Organization | | Principal
Amountb | | Value |
Long Term Investments (continued) | | | | | | | |
Corporate Bonds (continued) | | | | | | | |
Consumer Services (continued) | | | | | | | |
MGM MIRAGE, senior note, 6.625%, 7/15/15 | | United States | | 4,100,000 | | $ | 3,864,250 |
fOutback Steakhouse Inc., senior note, 144A, 10.00%, 6/15/15 | | United States | | 2,100,000 | | | 1,543,500 |
Pinnacle Entertainment Inc., senior sub. note, | | | | | | | |
8.25%, 3/15/12 | | United States | | 200,000 | | | 203,000 |
8.75%, 10/01/13 | | United States | | 2,200,000 | | | 2,249,500 |
Quebecor Media Inc., | | | | | | | |
f144A, 7.75%, 3/15/16 | | Canada | | 200,000 | | | 193,000 |
senior note, 7.75%, 3/15/16 | | Canada | | 2,700,000 | | | 2,605,500 |
Radio One Inc., senior sub. note, 6.375%, 2/15/13 | | United States | | 2,800,000 | | | 2,327,500 |
fRainbow National Services LLC, senior sub. deb., 144A, 10.375%, 9/01/14 | | United States | | 1,535,000 | | | 1,671,231 |
Royal Caribbean Cruises Ltd., senior deb., 7.25%, 3/15/18 | | United States | | 3,300,000 | | | 3,184,540 |
Station Casinos Inc., | | | | | | | |
senior note, 6.00%, 4/01/12 | | United States | | 700,000 | | | 626,500 |
senior sub. note, 6.50%, 2/01/14 | | United States | | 700,000 | | | 528,500 |
senior sub. note, 6.875%, 3/01/16 | | United States | | 1,800,000 | | | 1,323,000 |
Time Warner Inc., 5.875%, 11/15/16 | | United States | | 3,500,000 | | | 3,484,435 |
fUnivision Communications Inc., senior note, 144A, PIK, 9.75%, 3/15/15 | | United States | | 3,500,000 | | | 3,206,875 |
Viacom Inc., senior note, 6.875%, 4/30/36 | | United States | | 3,300,000 | | | 3,319,302 |
| | | | | | | |
| | | | | | | 54,405,273 |
| | | | | | | |
Electronic Technology 1.4% | | | | | | | |
DRS Technologies Inc., senior sub. note, | | | | | | | |
6.875%, 11/01/13 | | United States | | 400,000 | | | 400,000 |
7.625%, 2/01/18 | | United States | | 2,500,000 | | | 2,543,750 |
Freescale Semiconductor Inc., senior note, 8.875%, 12/15/14 | | United States | | 2,900,000 | | | 2,602,750 |
L-3 Communications Corp., senior sub. note, | | | | | | | |
5.875%, 1/15/15 | | United States | | 2,000,000 | | | 1,940,000 |
6.375%, 10/15/15 | | United States | | 400,000 | | | 396,000 |
NXP BV/NXP Funding LLC, senior secured note, 7.875%, 10/15/14 | | Netherlands | | 1,400,000 | | | 1,337,000 |
Sanmina-SCI Corp., | | | | | | | |
c,fsenior note, 144A, FRN, 7.741%, 6/15/14 | | United States | | 1,000,000 | | | 968,750 |
senior sub. note, 6.75%, 3/01/13 | | United States | | 2,300,000 | | | 2,012,500 |
senior sub. note, 8.125%, 3/01/16 | | United States | | 400,000 | | | 356,500 |
TransDigm Inc., senior sub. note, 7.75%, 7/15/14 | | United States | | 2,500,000 | | | 2,550,000 |
| | | | | | | |
| | | | | | | 15,107,250 |
| | | | | | | |
Energy Minerals 1.6% | | | | | | | |
Chesapeake Energy Corp., senior note, | | | | | | | |
7.625%, 7/15/13 | | United States | | 700,000 | | | 726,250 |
6.625%, 1/15/16 | | United States | | 100,000 | | | 98,250 |
6.25%, 1/15/18 | | United States | | 3,300,000 | | | 3,184,500 |
Mariner Energy Inc., senior note, 7.50%, 4/15/13 | | United States | | 2,700,000 | | | 2,612,250 |
Peabody Energy Corp., senior note, | | | | | | | |
7.375%, 11/01/16 | | United States | | 1,200,000 | | | 1,236,000 |
B, 6.875%, 3/15/13 | | United States | | 1,600,000 | | | 1,616,000 |
fPetroplus Finance Ltd., senior note, 144A, 6.75%, 5/01/14 | | Switzerland | | 2,600,000 | | | 2,434,250 |
Tesoro Corp., senior note, 6.50%, 6/01/17 | | United States | | 2,700,000 | | | 2,686,500 |
XTO Energy Inc., senior note, 6.25%, 8/01/17 | | United States | | 3,000,000 | | | 3,153,033 |
| | | | | | | |
| | | | | | | 17,747,033 |
| | | | | | | |
FSI-16
Franklin Templeton Variable Insurance Products Trust
Statement of Investments, December 31, 2007 (continued)
| | | | | | | |
| Franklin Strategic Income Securities Fund | | Country/
Organization | | Principal
Amountb | | Value |
Long Term Investments (continued) | | | | | | | |
Corporate Bonds (continued) | | | | | | | |
Finance 3.8% | | | | | | | |
fCapmark Financial Group Inc., 144A, 6.30%, 5/10/17 | | United States | | 800,000 | | $ | 597,335 |
CIT Group Funding Co. of Canada, senior note, 4.65%, 7/01/10 | | United States | | 1,500,000 | | | 1,427,354 |
CIT Group Inc., senior note, 7.625%, 11/30/12 | | United States | | 1,200,000 | | | 1,217,557 |
cCitigroup Inc., junior sub. bond, FRN, 8.30%, 12/21/77, pfd. | | United States | | 3,000,000 | | | 3,141,462 |
E*TRADE Financial Corp., senior note, 8.00%, 6/15/11 | | United States | | 1,000,000 | | | 872,500 |
GMAC LLC, | | | | | | | |
7.25%, 3/02/11 | | United States | | 2,500,000 | | | 2,192,825 |
6.875%, 9/15/11 | | United States | | 1,700,000 | | | 1,455,472 |
6.875%, 8/28/12 | | United States | | 1,800,000 | | | 1,509,761 |
The Goldman Sachs Group Inc., sub. note, 6.75%, 10/01/37 | | United States | | 4,000,000 | | | 3,931,496 |
fICICI Bank Ltd., 144A, 6.625%, 10/03/12 | | India | | 1,000,000 | | | 991,906 |
JPMorgan Chase Capital XXII, sub. bond, 6.45%, 2/02/37 | | United States | | 5,000,000 | | | 4,464,535 |
Lehman Brothers Holdings Inc., sub. note, 6.50%, 7/19/17 | | United States | | 5,000,000 | | | 5,068,215 |
Merrill Lynch & Co. Inc., senior note, 6.40%, 8/28/17 | | United States | | 4,900,000 | | | 4,987,097 |
Morgan Stanley, sub. note, 4.75%, 4/01/14 | | United States | | 4,000,000 | | | 3,752,372 |
Residential Capital LLC, senior note, 6.50%, 6/01/12 | | United States | | 2,800,000 | | | 1,736,000 |
UBS AG Stamford, senior note, 5.875%, 12/20/17 | | United States | | 3,000,000 | | | 3,026,787 |
United Rentals North America Inc., senior sub. note, 7.75%, 11/15/13 | | United States | | 1,400,000 | | | 1,218,000 |
| | | | | | | |
| | | | | | | 41,590,674 |
| | | | | | | |
Health Services 2.2% | | | | | | | |
Coventry Health Care Inc., senior note, | | | | | | | |
6.30%, 8/15/14 | | United States | | 1,500,000 | | | 1,537,237 |
5.95%, 3/15/17 | | United States | | 1,300,000 | | | 1,276,890 |
DaVita Inc., senior sub. note, 7.25%, 3/15/15 | | United States | | 3,400,000 | | | 3,425,500 |
fFMC Finance III SA, senior note, 144A, 6.875%, 7/15/17 | | Germany | | 1,500,000 | | | 1,507,500 |
Fresenius Medical Care Capital Trust II, 7.875%, 2/01/08 | | Germany | | 1,000,000 | | | 1,002,500 |
HCA Inc., | | | | | | | |
senior note, 6.50%, 2/15/16 | | United States | | 800,000 | | | 680,000 |
senior secured note, 9.125%, 11/15/14 | | United States | | 3,500,000 | | | 3,648,750 |
Quest Diagnostics Inc., 6.40%, 7/01/17 | | United States | | 1,800,000 | | | 1,864,026 |
Tenet Healthcare Corp., senior note, | | | | | | | |
6.375%, 12/01/11 | | United States | | 2,300,000 | | | 2,104,500 |
9.875%, 7/01/14 | | United States | | 700,000 | | | 670,250 |
United Surgical Partners International Inc., senior sub. note, PIK, 9.25%, 5/01/17 | | United States | | 1,500,000 | | | 1,470,000 |
cU.S. Oncology Holdings Inc., senior note, FRN, PIK, 10.759%, 3/15/12 | | United States | | 2,900,000 | | | 2,421,500 |
Vanguard Health Holding Co. II LLC, senior sub. note, 9.00%, 10/01/14 | | United States | | 2,600,000 | | | 2,515,500 |
| | | | | | | |
| | | | | | | 24,124,153 |
| | | | | | | |
Health Technology 0.2% | | | | | | | |
Schering-Plough Corp., senior note, 6.00%, 9/15/17 | | United States | | 2,500,000 | | | 2,594,833 |
| | | | | | | |
Industrial Services 1.6% | | | | | | | |
Allied Waste North America Inc., senior secured note, 6.875%, 6/01/17 | | United States | | 2,900,000 | | | 2,842,000 |
Compagnie Generale de Geophysique-Veritas, senior note, | | | | | | | |
7.50%, 5/15/15 | | France | | 2,000,000 | | | 2,035,000 |
7.75%, 5/15/17 | | France | | 900,000 | | | 913,500 |
Copano Energy LLC, senior note, 8.125%, 3/01/16 | | United States | | 2,900,000 | | | 2,936,250 |
El Paso Corp., senior note, 6.875%, 6/15/14 | | United States | | 3,000,000 | | | 3,036,672 |
Markwest Energy Partners LP, senior note, 6.875%, 11/01/14 | | United States | | 2,700,000 | | | 2,585,250 |
FSI-17
Franklin Templeton Variable Insurance Products Trust
Statement of Investments, December 31, 2007 (continued)
| | | | | | | |
| Franklin Strategic Income Securities Fund | | Country/
Organization | | Principal
Amountb | | Value |
Long Term Investments (continued) | | | | | | | |
Corporate Bonds (continued) | | | | | | | |
Industrial Services (continued) | | | | | | | |
The Williams Cos. Inc., | | | | | | | |
8.75%, 3/15/32 | | United States | | 600,000 | | $ | 736,500 |
senior note, 7.625%, 7/15/19 | | United States | | 1,000,000 | | | 1,088,750 |
senior note, 7.875%, 9/01/21 | | United States | | 1,600,000 | | | 1,782,000 |
| | | | | | | |
| | | | | | | 17,955,922 |
| | | | | | | |
Non-Energy Minerals 0.6% | | | | | | | |
Freeport-McMoRan Copper & Gold Inc., senior note, 8.375%, 4/01/17 | | United States | | 2,700,000 | | | 2,902,500 |
Novelis Inc., senior note, 7.25%, 2/15/15 | | Canada | | 3,500,000 | | | 3,307,500 |
| | | | | | | |
| | | | | | | 6,210,000 |
| | | | | | | |
Process Industries 2.2% | | | | | | | |
fCargill Inc., 144A, 6.00%, 11/27/17 | | United States | | 2,000,000 | | | 1,999,118 |
Crown Americas Inc., senior note, 7.75%, 11/15/15 | | United States | | 3,200,000 | | | 3,312,000 |
Huntsman International LLC, senior sub. note, 7.875%, 11/15/14 | | United States | | 2,800,000 | | | 2,982,000 |
fIneos Group Holdings PLC, 144A, 8.50%, 2/15/16 | | United Kingdom | | 3,100,000 | | | 2,774,500 |
JSG Funding PLC, senior sub. note, 7.75%, 4/01/15 | | Ireland | | 2,900,000 | | | 2,769,500 |
fMacDermid Inc., senior sub. note, 144A, 9.50%, 4/15/17 | | United States | | 2,700,000 | | | 2,551,500 |
Nalco Co., senior sub. note, 8.875%, 11/15/13 | | United States | | 2,900,000 | | | 3,037,750 |
fNew Page Corp., senior secured note, 144A, 10.00%, 5/01/12 | | United States | | 2,000,000 | | | 2,020,000 |
Owens-Brockway Glass Container Inc., senior note, 6.75%, 12/01/14 | | United States | | 3,300,000 | | | 3,300,000 |
| | | | | | | |
| | | | | | | 24,746,368 |
| | | | | | | |
Producer Manufacturing 1.5% | | | | | | | |
fAllison Transmission Inc., senior note, 144A, 11.00%, 11/01/15 | | United States | | 900,000 | | | 823,500 |
Commercial Vehicle Group Inc., senior note, 8.00%, 7/01/13 | | United States | | 2,400,000 | | | 2,184,000 |
Greenbrier Cos. Inc., senior note, 8.375%, 5/15/15 | | United States | | 2,500,000 | | | 2,400,000 |
Nortek Inc., senior sub. note, 8.50%, 9/01/14 | | United States | | 3,100,000 | | | 2,495,500 |
RBS Global & Rexnord Corp., senior note, 9.50%, 8/01/14 | | United States | | 2,900,000 | | | 2,885,500 |
Terex Corp., senior sub. note, 8.00%, 11/15/17 | | United States | | 2,800,000 | | | 2,849,000 |
fTRW Automotive Inc., senior note, 144A, 7.25%, 3/15/17 | | United States | | 3,300,000 | | | 2,978,250 |
| | | | | | | |
| | | | | | | 16,615,750 |
| | | | | | | |
Real Estate Development 0.2% | | | | | | | |
Forest City Enterprises Inc., senior note, 7.625%, 6/01/15 | | United States | | 2,500,000 | | | 2,425,000 |
| | | | | | | |
Real Estate Investment Trusts 0.6% | | | | | | | |
Host Hotels & Resorts LP, senior note, 6.875%, 11/01/14 | | United States | | 200,000 | | | 200,000 |
Host Marriott LP, senior note, | | | | | | | |
K, 7.125%, 11/01/13 | | United States | | 2,400,000 | | | 2,430,000 |
M, 7.00%, 8/15/12 | | United States | | 1,100,000 | | | 1,105,500 |
iStar Financial Inc., senior note, 5.65%, 9/15/11 | | United States | | 2,700,000 | | | 2,414,726 |
| | | | | | | |
| | | | | | | 6,150,226 |
| | | | | | | |
Retail Trade 0.5% | | | | | | | |
fDollar General Corp., senior note, 144A, 10.625%, 7/15/15 | | United States | | 2,800,000 | | | 2,583,000 |
Michaels Stores Inc., senior note, 10.00%, 11/01/14 | | United States | | 3,300,000 | | | 3,151,500 |
| | | | | | | |
| | | | | | | 5,734,500 |
| | | | | | | |
Technology Services 0.3% | | | | | | | |
SunGard Data Systems Inc., | | | | | | | |
senior note, 9.125%, 8/15/13 | | United States | | 1,600,000 | | | 1,636,000 |
senior sub. note, 10.25%, 8/15/15 | | United States | | 1,900,000 | | | 1,952,250 |
| | | | | | | |
| | | | | | | 3,588,250 |
| | | | | | | |
FSI-18
Franklin Templeton Variable Insurance Products Trust
Statement of Investments, December 31, 2007 (continued)
| | | | | | | |
| Franklin Strategic Income Securities Fund | | Country/
Organization | | Principal
Amountb | | Value |
Long Term Investments (continued) | | | | | | | |
Corporate Bonds (continued) | | | | | | | |
Utilities 2.3% | | | | | | | |
fAES Corp., senior note, 144A, 8.00%, 10/15/17 | | United States | | 2,800,000 | | $ | 2,877,000 |
Aquila Inc., senior note, 9.95%, 2/01/11 | | United States | | 2,800,000 | | | 3,026,800 |
CenterPoint Energy Inc., senior note, 6.125%, 11/01/17 | | United States | | 800,000 | | | 815,646 |
Dynegy Holdings Inc., senior note, 8.375%, 5/01/16 | | United States | | 3,100,000 | | | 3,045,750 |
Edison Mission Energy, senior note, 7.00%, 5/15/17 | | United States | | 2,900,000 | | | 2,863,750 |
fIntergen NV, senior secured note, 144A, 9.00%, 6/30/17 | | Netherlands | | 2,500,000 | | | 2,643,750 |
Mirant North America LLC, senior note, 7.375%, 12/31/13 | | United States | | 2,900,000 | | | 2,921,750 |
NRG Energy Inc., senior note, | | | | | | | |
7.25%, 2/01/14 | | United States | | 400,000 | | | 391,000 |
7.375%, 2/01/16 | | United States | | 3,200,000 | | | 3,128,000 |
7.375%, 1/15/17 | | United States | | 600,000 | | | 586,500 |
fTexas Competitive Electric Holdings Co. LLC, senior note, 144A, 10.25%, 11/01/15 | | United States | | 3,700,000 | | | 3,681,500 |
| | | | | | | |
| | | | | | | 25,981,446 |
| | | | | | | |
Total Corporate Bonds (Cost $362,502,486) | | | | | | | 353,850,455 |
| | | | | | | |
Convertible Bonds 1.6% | | | | | | | |
Electronic Technology 0.2% | | | | | | | |
fMicrochip Technology Inc., cvt., junior sub. note, 144A, 2.125%, 12/15/37 | | United States | | 2,500,000 | | | 2,632,775 |
| | | | | | | |
Finance 0.6% | | | | | | | |
CapitalSource Inc., cvt., senior sub. note, 4.00%, 7/15/34 | | United States | | 3,400,000 | | | 3,186,385 |
Merrill Lynch & Co. Inc., cvt., senior note, zero cpn., 3/13/32 | | United States | | 2,900,000 | | | 3,156,679 |
| | | | | | | |
| | | | | | | 6,343,064 |
| | | | | | | |
Health Technology 0.3% | | | | | | | |
Amgen Inc., cvt., senior note, 0.375%, 2/01/13 | | United States | | 3,600,000 | | | 3,147,638 |
| | | | | | | |
Real Estate Investment Trust 0.2% | | | | | | | |
ciStar Financial Inc., senior note, cvt., FRN, 5.743%, 10/01/12 | | United States | | 2,900,000 | | | 2,581,000 |
| | | | | | | |
Retail Trade 0.3% | | | | | | | |
Best Buy Co. Inc., cvt., sub. deb., 2.25%, 1/15/22 | | United States | | 2,600,000 | | | 3,139,500 |
| | | | | | | |
Total Convertible Bonds (Cost $18,710,822) | | | | | | | 17,843,977 |
| | | | | | | |
Asset-Backed Securities and Commercial Mortgage-Backed Securities 4.1% | | | | | | | |
Finance 4.1% | | | | | | | |
cBanc of America Commercial Mortgage Inc., 2005-6, A4, FRN, 5.182%, 9/10/47 | | United States | | 2,000,000 | | | 1,994,812 |
cChase Credit Card Master Trust, 2003-6, A, FRN, 5.138%, 2/15/11 | | United States | | 3,300,000 | | | 3,299,737 |
cChase Issuance Trust, | | | | | | | |
2005-A9, A9, FRN, 5.048%, 11/15/11 | | United States | | 1,000,000 | | | 996,714 |
2007-A9, A, FRN, 5.058%, 6/16/14 | | United States | | 5,000,000 | | | 4,944,732 |
cCitigroup/Deutsche Bank Commercial Mortgage Trust, 2006-CD3, A5, FRN,
5.617%, 10/15/48 | | United States | | 9,800,000 | | | 10,009,039 |
Countrywide Asset-Backed Certificates, | | | | | | | |
2004-7, AF4, 4.774%, 8/25/32 | | United States | | 136,719 | | | 135,472 |
2005-11, AF4, 5.21%, 3/25/34 | | United States | | 1,275,000 | | | 1,182,467 |
GE Capital Commercial Mortgage Corp., 2003-C1, A4, 4.819%, 1/10/38 | | United States | | 934,225 | | | 932,099 |
FSI-19
Franklin Templeton Variable Insurance Products Trust
Statement of Investments, December 31, 2007 (continued)
| | | | | | | |
| Franklin Strategic Income Securities Fund | | Country/
Organization | | Principal
Amountb | | Value |
Long Term Investments (continued) | | | | | | | |
Asset-Backed Securities and Commercial Mortgage-Backed Securities (continued) | | | | | | | |
Finance (continued) | | | | | | | |
Greenwich Capital Commercial Funding Corp., | | | | | | | |
2004-GG1, A7, 5.317%, 6/10/36 | | United States | | 1,605,000 | | $ | 1,635,603 |
2005-GG5, A5, 5.224%, 4/10/37 | | United States | | 1,395,000 | | | 1,386,314 |
c2006-GG7, A4, FRN, 5.913%, 7/10/38 | | United States | | 4,000,000 | | | 4,187,502 |
cGS Mortgage Securities Corp. II, 2006-GG6, A4, FRN, 5.53%, 4/10/38 | | United States | | 4,000,000 | | | 4,068,744 |
JPMorgan Chase Commercial Mortgage Securities Corp., | | | | | | | |
c2004-CB9, A4, FRN, 5.377%, 6/12/41 | | United States | | 5,096,445 | | | 5,257,469 |
2004-LN2, A2, 5.115%, 7/15/41 | | United States | | 412,616 | | | 415,123 |
fKeystone Owner Trust, 1997-P3, M2, 144A, 7.98%, 12/25/24 | | United States | | 7,917 | | | 7,811 |
cLB-UBS Commercial Mortgage Trust, 2002-C2, A4, FRN, 5.594%, 6/15/31 | | United States | | 1,000,000 | | | 1,035,005 |
cMorgan Stanley Capital I, 2004-IQ7, A4, FRN, 5.431%, 6/15/38 | | United States | | 4,000,000 | | | 4,107,772 |
Residential Asset Securities Corp., 2004-KS1, AI4, 4.213%, 4/25/32 | | United States | | 259,614 | | | 257,013 |
| | | | | | | |
Total Asset-Backed Securities and Commercial Mortgage-Backed Securities (Cost $46,063,169) | | | | | | | 45,853,428 |
| | | | | | | |
Mortgage-Backed Securities 11.2% | | | | | | | |
cFederal Home Loan Mortgage Corp. (FHLMC) Adjustable Rate 0.0%g | | | | | | | |
FHLMC, 4.68%, 1/01/33 | | United States | | 236,026 | | | 238,018 |
| | | | | | | |
Federal Home Loan Mortgage Corp. (FHLMC) Fixed Rate 4.9% | | | | | | | |
FHLMC Gold 15 Year, 4.50%, 10/01/18 - 9/01/19 | | United States | | 3,857,650 | | | 3,793,340 |
FHLMC Gold 15 Year, 5.00%, 12/01/17 - 9/01/19 | | United States | | 4,287,987 | | | 4,296,551 |
FHLMC Gold 15 Year, 5.50%, 7/01/17 - 7/01/19 | | United States | | 1,087,486 | | | 1,102,246 |
FHLMC Gold 15 Year, 6.00%, 5/01/17 | | United States | | 39,678 | | | 40,639 |
FHLMC Gold 15 Year, 6.50%, 5/01/16 | | United States | | 16,635 | | | 17,242 |
FHLMC Gold 30 Year, 5.00%, 4/01/34 - 6/01/37 | | United States | | 8,354,249 | | | 8,155,640 |
FHLMC Gold 30 Year, 5.50%, 3/01/33 - 12/01/37 | | United States | | 16,031,842 | | | 16,008,556 |
FHLMC Gold 30 Year, 6.00%, 4/01/33 - 11/01/37 | | United States | | 15,094,816 | | | 15,330,034 |
FHLMC Gold 30 Year, 6.50%, 12/01/23 - 11/01/37 | | United States | | 4,781,923 | | | 4,919,615 |
FHLMC Gold 30 Year, 7.00%, 9/01/21 - 1/01/32 | | United States | | 151,328 | | | 158,883 |
FHLMC Gold 30 Year, 7.50%, 3/01/30 - 7/01/31 | | United States | | 3,149 | | | 3,363 |
| | | | | | | |
| | | | | | | 53,826,109 |
| | | | | | | |
cFederal National Mortgage Association (FNMA) Adjustable Rate 0.1% | | | | | | | |
FNMA, 4.548%, 4/01/20 | | United States | | 223,387 | | | 222,624 |
FNMA, 4.596%, 12/01/34 | | United States | | 1,077,372 | | | 1,080,015 |
| | | | | | | |
| | | | | | | 1,302,639 |
| | | | | | | |
Federal National Mortgage Association (FNMA) Fixed Rate 5.6% | | | | | | | |
FNMA 15 Year, 4.50%, 6/01/19 - 3/01/20 | | United States | | 753,953 | | | 741,718 |
FNMA 15 Year, 5.00%, 10/01/17 - 6/01/18 | | United States | | 839,990 | | | 842,212 |
FNMA 15 Year, 5.50%, 10/01/16 - 4/01/21 | | United States | | 2,271,889 | | | 2,302,249 |
FNMA 15 Year, 6.00%, 4/01/16 - 7/01/16 | | United States | | 36,026 | | | 36,930 |
FNMA 15 Year, 7.00%, 5/01/12 | | United States | | 3,463 | | | 3,585 |
FNMA 30 Year, 5.00%, 4/01/34 - 4/01/37 | | United States | | 12,619,159 | | | 12,317,421 |
FNMA 30 Year, 5.50%, 8/01/33 - 5/01/36 | | United States | | 21,112,913 | | | 21,106,266 |
FNMA 30 Year, 6.00%, 6/01/34 - 7/01/37 | | United States | | 21,315,488 | | | 21,658,092 |
FSI-20
Franklin Templeton Variable Insurance Products Trust
Statement of Investments, December 31, 2007 (continued)
| | | | | | | | |
| Franklin Strategic Income Securities Fund | | Country/
Organization | | Principal
Amountb | | | Value |
Long Term Investments (continued) | | | | | | | | |
Mortgage-Backed Securities (continued) | | | | | | | | |
Federal National Mortgage Association (FNMA) Fixed Rate (continued) | | | | | | | | |
FNMA 30 Year, 6.50%, 6/01/28 - 10/01/36 | | United States | | 3,419,098 | | | $ | 3,519,954 |
FNMA 30 Year, 7.50%, 9/01/31 | | United States | | 27,130 | | | | 28,942 |
| | | | | | | | |
| | | | | | | | 62,557,369 |
| | | | | | | | |
Government National Mortgage Association (GNMA) Fixed Rate 0.6% | | | | | | | | |
GNMA I SF 30 Year, 5.00%, 11/15/33 - 7/15/34 | | United States | | 2,018,141 | | | | 1,989,596 |
GNMA I SF 30 Year, 5.50%, 12/15/32 - 6/15/36 | | United States | | 2,731,338 | | | | 2,752,811 |
GNMA I SF 30 Year, 6.50%, 11/15/31 - 2/15/32 | | United States | | 22,278 | | | | 23,101 |
GNMA I SF 30 Year, 7.00%, 10/15/28 - 6/15/32 | | United States | | 117,958 | | | | 125,198 |
GNMA I SF 30 Year, 7.50%, 9/15/30 | | United States | | 3,471 | | | | 3,704 |
GNMA II SF 30 Year, 5.00%, 9/20/33 - 11/20/33 | | United States | | 543,929 | | | | 531,574 |
GNMA II SF 30 Year, 6.00%, 11/20/34 | | United States | | 715,302 | | | | 730,839 |
GNMA II SF 30 Year, 6.50%, 4/20/31 - 2/20/34 | | United States | | 275,059 | | | | 284,961 |
GNMA II SF 30 Year, 7.50%, 1/20/28 - 4/20/32 | | United States | | 72,151 | | | | 76,646 |
| | | | | | | | |
| | | | | | | | 6,518,430 |
| | | | | | | | |
Total Mortgage-Backed Securities (Cost $123,721,043) | | | | | | | | 124,442,565 |
| | | | | | | | |
U.S. Government and Agency Securities 6.8% | | | | | | | | |
FHLMC, | | | | | | | | |
4.375%, 7/17/15 | | United States | | 2,500,000 | | | | 2,524,743 |
4.50%, 1/15/13 | | United States | | 580,000 | | | | 594,461 |
4.75%, 1/19/16 | | United States | | 2,000,000 | | | | 2,066,696 |
4.875%, 11/15/13 | | United States | | 150,000 | | | | 156,609 |
5.125%, 10/18/16 | | United States | | 5,400,000 | | | | 5,665,378 |
5.50%, 9/15/11 | | United States | | 300,000 | | | | 318,175 |
6.625%, 9/15/09 | | United States | | 5,000,000 | | | | 5,249,840 |
7.00%, 3/15/10 | | United States | | 300,000 | | | | 321,687 |
FNMA, | | | | | | | | |
1.75%, 3/26/08 | | United States | | 270,000,000 | JPY | | | 2,425,862 |
4.25%, 5/15/09 | | United States | | 260,000 | | | | 261,960 |
4.375%, 10/15/15 | | United States | | 1,000,000 | | | | 1,009,880 |
5.00%, 4/15/15 | | United States | | 250,000 | | | | 262,686 |
5.25%, 1/15/09 | | United States | | 250,000 | | | | 253,237 |
5.375%, 11/15/11 | | United States | | 1,200,000 | | | | 1,269,365 |
5.50%, 3/15/11 | | United States | | 150,000 | | | | 158,245 |
6.00%, 5/15/11 | | United States | | 500,000 | | | | 536,963 |
6.125%, 3/15/12 | | United States | | 900,000 | | | | 978,704 |
6.625%, 11/15/10 | | United States | | 350,000 | | | | 378,675 |
U.S. Treasury Bond, | | | | | | | | |
6.125%, 11/15/27 | | United States | | 150,000 | | | | 181,699 |
6.25%, 8/15/23 | | United States | | 1,600,000 | | | | 1,916,127 |
6.88%, 8/15/25 | | United States | | 4,790,000 | | | | 6,160,390 |
7.125%, 2/15/23 | | United States | | 4,980,000 | | | | 6,428,094 |
U.S. Treasury Note, | | | | | | | | |
3.50%, 12/15/09 | | United States | | 2,500,000 | | | | 2,521,878 |
4.00%, 4/15/10 | | United States | | 350,000 | | | | 357,219 |
4.00%, 11/15/12 | | United States | | 150,000 | | | | 154,090 |
4.125%, 8/15/10 | | United States | | 1,300,000 | | | | 1,335,040 |
4.25%, 8/15/14 | | United States | | 2,000,000 | | | | 2,068,594 |
4.25%, 11/15/14 | | United States | | 600,000 | | | | 619,172 |
4.50%, 9/30/11 | | United States | | 500,000 | | | | 521,797 |
FSI-21
Franklin Templeton Variable Insurance Products Trust
Statement of Investments, December 31, 2007 (continued)
| | | | | | | | |
| Franklin Strategic Income Securities Fund | | Country/
Organization | | Principal
Amountb | | | Value |
Long Term Investments (continued) | | | | | | | | |
U.S. Government and Agency Securities (continued) | | | | | | | | |
U.S. Treasury Note (continued) | | | | | | | | |
4.50%, 3/31/12 | | United States | | 6,000,000 | | | $ | 6,272,814 |
4.625%, 11/15/16 | | United States | | 11,000,000 | | | | 11,523,369 |
4.75%, 5/15/14 | | United States | | 1,000,000 | | | | 1,063,672 |
hIndex Linked, 1.625%, 1/15/15 | | United States | | 3,282,434 | | | | 3,296,538 |
hIndex Linked, 2.00%, 1/15/14 | | United States | | 6,331,842 | | | | 6,542,085 |
| | | | | | | | |
Total U.S. Government and Agency Securities (Cost $72,273,341) | | | | | | | | 75,395,744 |
| | | | | | | | |
Foreign Government and Agency Securities 21.1% | | | | | | | | |
cEuropean Investment Bank, senior note, FRN, 0.75%, 9/21/11 | | Supranationali | | 660,000,000 | JPY | | | 5,920,138 |
c,jGovernment of Argentina, FRN, 5.475%, 8/03/12 | | Argentina | | 29,237,000 | | | | 15,897,538 |
Government of Canada, 4.25%, 12/01/08 | | Canada | | 15,900,000 | CAD | | | 16,051,902 |
Government of Indonesia, | | | | | | | | |
10.25%, 7/15/27 | | Indonesia | | 28,000,000,000 | IDR | | | 2,906,574 |
11.00%, 10/15/14 | | Indonesia | | 1,800,000,000 | IDR | | | 205,536 |
12.80%, 6/15/21 | | Indonesia | | 22,315,000,000 | IDR | | | 2,766,692 |
13.15%, 1/15/12 | | Indonesia | | 2,300,000,000 | IDR | | | 277,971 |
14.25%, 6/15/13 | | Indonesia | | 35,480,000,000 | IDR | | | 4,534,624 |
14.275%, 12/15/13 | | Indonesia | | 23,637,000,000 | IDR | | | 3,038,773 |
kGovernment of Iraq, Reg S, 5.80%, 1/15/28 | | Iraq | | 5,000,000 | | | | 3,325,000 |
Government of Malaysia, | | | | | | | | |
3.756%, 4/28/11 | | Malaysia | | 24,165,000 | MYR | | | 7,347,837 |
4.305%, 2/27/09 | | Malaysia | | 28,625,000 | MYR | | | 8,735,083 |
6.45%, 7/01/08 | | Malaysia | | 7,470,000 | MYR | | | 2,291,702 |
7.00%, 3/15/09 | | Malaysia | | 2,620,000 | MYR | | | 824,757 |
Government of Mexico, | | | | | | | | |
8.00%, 12/17/15 | | Mexico | | 350,000 | l MXN | | | 3,175,071 |
10.00%, 12/05/24 | | Mexico | | 1,174,000 | l MXN | | | 12,519,656 |
Government of New Zealand, | | | | | | | | |
6.00%, 11/15/11 | | New Zealand | | 1,600,000 | NZD | | | 1,179,483 |
6.50%, 4/15/13 | | New Zealand | | 2,960,000 | NZD | | | 2,209,840 |
Government of Norway, 5.50%, 5/15/09 | | Norway | | 33,760,000 | NOK | | | 6,279,888 |
Government of Poland, | | | | | | | | |
5.75%, 9/23/22 | | Poland | | 20,100,000 | PLN | | | 8,089,987 |
6.00%, 5/24/09 | | Poland | | 26,270,000 | PLN | | | 10,608,105 |
6.25%, 10/24/15 | | Poland | | 3,700,000 | PLN | | | 1,521,797 |
Government of Singapore, | | | | | | | | |
1.50%, 4/01/08 | | Singapore | | 870,000 | SGD | | | 603,046 |
4.375%, 1/15/09 | | Singapore | | 1,500,000 | SGD | | | 1,067,176 |
5.625%, 7/01/08 | | Singapore | | 7,450,000 | SGD | | | 5,262,645 |
Government of Sweden, | | | | | | | | |
5.00%, 1/28/09 | | Sweden | | 93,235,000 | SEK | | | 14,541,528 |
5.50%, 10/08/12 | | Sweden | | 13,990,000 | SEK | | | 2,282,618 |
6.50%, 5/05/08 | | Sweden | | 93,950,000 | SEK | | | 14,634,300 |
mStrip, 9/17/08 | | Sweden | | 12,000,000 | SEK | | | 1,802,663 |
cKfW Bankengruppe, FRN, 0.658%, 8/08/11 | | Germany | | 3,215,000,000 | JPY | | | 28,845,540 |
Korea Treasury Bond, | | | | | | | | |
5.25%, 9/10/12 | | South Korea | | 5,900,000,000 | KRW | | | 6,171,206 |
5.25%, 3/10/27 | | South Korea | | 5,861,000,000 | KRW | | | 5,975,161 |
5.50%, 9/10/17 | | South Korea | | 5,850,000,000 | KRW | | | 6,159,389 |
Korea Treasury Note, 4.75%, 6/10/09 | | South Korea | | 4,700,000,000 | KRW | | | 4,950,113 |
New South Wales Treasury Corp., 8.00%, 3/01/08 | | Australia | | 2,801,000 | AUD | | | 2,457,532 |
FSI-22
Franklin Templeton Variable Insurance Products Trust
Statement of Investments, December 31, 2007 (continued)
| | | | | | | | |
| Franklin Strategic Income Securities Fund | | Country/
Organization | | Principal
Amountb | | | Value |
Long Term Investments (continued) | | | | | | | | |
Foreign Government and Agency Securities (continued) | | | | | | | | |
Nota Do Tesouro Nacional, | | | | | | | | |
9.762%, 1/01/14 | | Brazil | | 2,700 | n BRL | | $ | 1,333,279 |
9.762%, 1/01/17 | | Brazil | | 23,200 | n BRL | | | 10,990,474 |
oIndex Linked, 6.00%, 5/15/15 | | Brazil | | 2,000 | n BRL | | | 1,739,070 |
oIndex Linked, 6.00%, 5/15/45 | | Brazil | | 1,725 | n BRL | | | 1,499,166 |
Queensland Treasury Corp., 6.00%, 7/14/09 | | Australia | | 5,300,000 | AUD | | | 4,573,421 |
| | | | | | | | |
Total Foreign Government and Agency Securities (Cost $223,284,495) | | | | | | | | 234,596,281 |
| | | | | | | | |
Total Long Term Investments (Cost $1,043,933,670) | | | | | | | | 1,038,410,977 |
| | | | | | | | |
Short Term Investments 4.8% | | | | | | | | |
Foreign Government and Agency Securities 2.6% | | | | | | | | |
mEgypt Treasury Bills, 1/08/08 - 12/16/08 | | Egypt | | 63,500,000 | EGP | | | 11,221,940 |
Government of Malaysia, | | | | | | | | |
3.17%, 5/15/08 | | Malaysia | | 12,840,000 | MYR | | | 3,877,913 |
3.546%, 1/11/08 | | Malaysia | | 5,400,000 | MYR | | | 1,632,965 |
3.562%, 7/15/08 | | Malaysia | | 2,005,000 | MYR | | | 606,335 |
3.569%, 2/14/08 | | Malaysia | | 6,640,000 | MYR | | | 2,007,862 |
mGovernment of Sweden, Strip, 6/18/08 | | Sweden | | 12,000,000 | SEK | | | 1,821,093 |
mMalaysia Treasury Bills, 2/28/08 - 6/17/08 | | Malaysia | | 24,980,000 | MYR | | | 7,483,441 |
mNorway Treasury Bills, 6/18/08 - 9/17/08 | | Norway | | 3,220,000 | NOK | | | 573,399 |
| | | | | | | | |
Total Foreign Government and Agency Securities (Cost $28,272,173) | | | | | | | | 29,224,948 |
| | | | | | | | |
Total Investments before Money Market Fund (Cost $1,072,205,843) | | | | | | | | 1,067,635,925 |
| | | | | | | | |
| | | |
| | | | | Shares | | | |
Money Market Fund (Cost $24,458,844) 2.2% | | | | | | | | |
pFranklin Institutional Fiduciary Trust Money Market Portfolio, 4.58% | | United States | | 24,458,844 | | | | 24,458,844 |
| | | | | | | | |
Total Investments (Cost $1,096,664,687) 98.3% | | | | | | | | 1,092,094,769 |
Net Unrealized Gain on Forward Exchange Contract 0.1% | | | | | | | | 1,098,980 |
Other Assets, less Liabilities 1.6% | | | | | | | | 18,268,918 |
| | | | | | | | |
Net Assets 100.0% | | | | | | | $ | 1,111,462,667 |
| | | | | | | | |
FSI-23
Franklin Templeton Variable Insurance Products Trust
Statement of Investments, December 31, 2007 (continued)
Currency Abbreviations
AUD - Australian Dollar
BRL - - Brazilian Real
CAD - Canadian Dollar
EGP - Egyptian Pound
IDR - Indonesian Rupiah
JPY - Japanese Yen
KRW - South Korean Won
MXN - Mexican Peso
MYR - Malaysian Ringgit
NOK - Norwegian Krone
NZD - New Zealand Dollar
PLN - Polish Zloty
SEK - Swedish Krona
SGD - Singapore Dollar
Selected Portfolio Abbreviations
FHLMC - Federal Home Loan Mortgage Corp.
FNMA - Federal National Mortgage Association
FRN - Floating Rate Note
GNMA - Government National Mortgage Association
L/C - Letter of Credit
PIK - Payment-In-Kind
REIT - Real Estate Investment Trust
SF - Single Family
aNon-income producing for the twelve months ended December 31, 2007.
bThe principal amount is stated in U.S. dollars unless otherwise indicated.
cThe coupon rate shown represents the rate at period end.
dSee Note 1(f) regarding senior floating rate interests.
eA portion or all of the securities purchased on a when-issued or delayed delivery basis. See Note 1(c).
fSecurity was purchased pursuant to Rule 144A under the Securities Act of 1933 and may be sold in transactions exempt from registration only to qualified institutional buyers or in a public offering registered under the Securities Act of 1933. These securities have been deemed liquid under guidelines approved by the Trust’s Board of Trustees. At December 31, 2007, the aggregate value of these securities was $54,153,551, representing 4.87% of net assets.
gRounds to less than 0.1% of net assets.
hPrincipal amount of security is adjusted for inflation. See Note 1(h).
iA supranational organization is an entity formed by two or more central governments through international treaties.
jThe principal amount is stated in original face, and scheduled paydowns are reflected in the market price on ex-date.
kSecurity was purchased pursuant to Regulation S under the Securities Act of 1933, which exempts from registration securities offered and sold outside of the United States. Such a security cannot be sold in the United States without either an effective registration statement filed pursuant to the Securities Act of 1933, or pursuant to an exemption from registration. This security has been deemed liquid under guidelines approved by the Trust’s Board of Trustees. At December 31, 2007, the value of this security was $3,325,000, representing 0.30% of net assets.
lPrincipal amount is stated in 100 Mexican Peso units.
mThe security is traded on a discount basis with no stated coupon rate.
nPrincipal amount is stated in 1,000 Brazilian Real units.
oRedemption price at maturity is adjusted for inflation. See Note 1(h).
pSee Note 7 regarding investments in the Franklin Institutional Fiduciary Trust Money Market Portfolio. The rate shown is the annualized seven-day yield at period end.
The accompanying notes are an integral part of these financial statements.
FSI-24
Franklin Templeton Variable Insurance Products Trust
Financial Statements
Statement of Assets and Liabilities
December 31, 2007
| | | | |
| | | Franklin
Strategic Income
Securities Fund | |
Assets: | | | | |
Investments in securities: | | | | |
Cost - Unaffiliated issuers | | $ | 1,072,205,843 | |
Cost - Sweep Money Fund (Note 7) | | | 24,458,844 | |
| | | | |
Total cost of investments | | $ | 1,096,664,687 | |
| | | | |
Value - Unaffiliated issuers | | $ | 1,067,635,925 | |
Value - Sweep Money Fund (Note 7) | | | 24,458,844 | |
| | | | |
Total value of investments | | | 1,092,094,769 | |
Cash | | | 2,639,981 | |
Foreign currency, at value (cost $5,193,790) | | | 5,695,799 | |
Receivables: | | | | |
Investment securities sold | | | 628,871 | |
Capital shares sold | | | 623,241 | |
Dividends and interest | | | 13,061,390 | |
Unrealized gain on forward exchange contracts (Note 8) | | | 1,233,466 | |
| | | | |
Total assets | | | 1,115,977,517 | |
| | | | |
Liabilities: | | | | |
Payables: | | | | |
Investment securities purchased | | | 3,620,497 | |
Capital shares redeemed | | | 33,003 | |
Affiliates | | | 536,872 | |
Unrealized loss on forward exchange contracts (Note 8) | | | 134,486 | |
Unrealized loss on unfunded loan commitments (Note 10) | | | 14,484 | |
Accrued expenses and other liabilities | | | 175,508 | |
| | | | |
Total liabilities | | | 4,514,850 | |
| | | | |
Net assets, at value | | $ | 1,111,462,667 | |
| | | | |
Net assets consist of: | | | | |
Paid-in capital | | $ | 1,037,294,197 | |
Undistributed net investment income | | | 74,316,140 | |
Net unrealized appreciation (depreciation) | | | (2,868,274 | ) |
Accumulated net realized gain (loss) | | | 2,720,604 | |
| | | | |
Net assets, at value | | $ | 1,111,462,667 | |
| | | | |
Class 1: | | | | |
Net assets, at value | | $ | 1,086,849,963 | |
| | | | |
Shares outstanding | | | 85,031,046 | |
| | | | |
Net asset value and maximum offering price per share | | $ | 12.78 | |
| | | | |
Class 2: | | | | |
Net assets, at value | | $ | 24,612,704 | |
| | | | |
Shares outstanding | | | 1,953,718 | |
| | | | |
Net asset value and maximum offering price per share | | $ | 12.60 | |
| | | | |
The accompanying notes are an integral part of these financial statements.
FSI-25
Franklin Templeton Variable Insurance Products Trust
Financial Statements (continued)
Statement of Operations
for the year ended December 31, 2007
| | | | |
| | | Franklin
Strategic Income
Securities Fund | |
Investment income: | | | | |
Dividends: | | | | |
Unaffiliated issuers | | $ | 1,255,609 | |
Sweep Money Fund (Note 7) | | | 562,672 | |
Interest | | | 63,110,606 | |
| | | | |
Total investment income | | | 64,928,887 | |
| | | | |
Expenses: | | | | |
Management fees (Note 3a) | | | 3,770,578 | |
Administrative fees (Note 3b) | | | 2,048,237 | |
Distribution fees - Class 2 (Note 3c) | | | 43,822 | |
Unaffiliated transfer agent fees | | | 10,309 | |
Custodian fees (Note 4) | | | 321,414 | |
Reports to shareholders | | | 94,640 | |
Professional fees | | | 57,687 | |
Trustees’ fees and expenses | | | 4,245 | |
Other | | | 49,725 | |
| | | | |
Total expenses | | | 6,400,657 | |
Expense reductions (Note 4) | | | (17,517 | ) |
| | | | |
Net expenses | | | 6,383,140 | |
| | | | |
Net investment income | | | 58,545,747 | |
| | | | |
Realized and unrealized gains (losses): | | | | |
Net realized gain (loss) from: | | | | |
Investments | | | 5,599,782 | |
Foreign currency transactions | | | 16,988,036 | |
| | | | |
Net realized gain (loss) | | | 22,587,818 | |
| | | | |
Net change in unrealized appreciation (depreciation) on: | | | | |
Investments | | | (20,912,128 | ) |
Translation of assets and liabilities denominated in foreign currencies | | | 513,370 | |
| | | | |
Net change in unrealized appreciation (depreciation) | | | (20,398,758 | ) |
| | | | |
Net realized and unrealized gain (loss) | | | 2,189,060 | |
| | | | |
Net increase (decrease) in net assets resulting from operations | | $ | 60,734,807 | |
| | | | |
The accompanying notes are an integral part of these financial statements.
FSI-26
Franklin Templeton Variable Insurance Products Trust
Financial Statements (continued)
Statements of Changes in Net Assets
| | | | | | | | |
| | | Franklin Strategic Income
Securities Fund | |
| | | Year Ended December 31, | |
| | | 2007 | | | 2006 | |
| | | | |
Increase (decrease) in net assets: | | | | | | | | |
Operations: | | | | | | | | |
Net investment income | | $ | 58,545,747 | | | $ | 45,454,682 | |
Net realized gain (loss) from investments and foreign currency transactions | | | 22,587,818 | | | | 10,305,625 | |
Net change in unrealized appreciation (depreciation) on investments and translation of assets and liabilities denominated in foreign currencies | | | (20,398,758 | ) | | | 12,642,537 | |
| | | | |
Net increase (decrease) in net assets resulting from operations | | | 60,734,807 | | | | 68,402,844 | |
| | | | |
Distributions to shareholders from: | | | | | | | | |
Net investment income and net foreign currency gains: | | | | | | | | |
Class 1 | | | (52,500,471 | ) | | | (39,519,783 | ) |
Class 2 | | | (878,649 | ) | | | (416,784 | ) |
Net realized gains: | | | | | | | | |
Class 1 | | | (2,882,439 | ) | | | (5,179,930 | ) |
Class 2 | | | (50,064 | ) | | | (58,574 | ) |
| | | | |
Total distributions to shareholders | | | (56,311,623 | ) | | | (45,175,071 | ) |
| | | | |
Capital share transactions: (Note 2) | | | | | | | | |
Class 1 | | | 180,376,622 | | | | 139,092,390 | |
Class 2 | | | 12,839,267 | | | | (8,362,526 | ) |
| | | | |
Total capital share transactions | | | 193,215,889 | | | | 130,729,864 | |
| | | | |
Net increase (decrease) in net assets | | | 197,639,073 | | | | 153,957,637 | |
Net assets: | | | | | | | | |
Beginning of year | | | 913,823,594 | | | | 759,865,957 | |
| | | | |
End of year | | $ | 1,111,462,667 | | | $ | 913,823,594 | |
| | | | |
Undistributed net investment income included in net assets: | | | | | | | | |
End of year | | $ | 74,316,140 | | | $ | 49,332,156 | |
| | | | |
The accompanying notes are an integral part of these financial statements.
FSI-27
Franklin Templeton Variable Insurance Products Trust
Notes to Financial Statements
Franklin Strategic Income Securities Fund
1. ORGANIZATION AND SIGNIFICANT ACCOUNTING POLICIES
Franklin Templeton Variable Insurance Products Trust (Trust) is registered under the Investment Company Act of 1940, as amended, (1940 Act) as an open-end investment company, consisting of twenty-three separate funds. The Franklin Strategic Income Securities Fund (Fund) included in this report is non-diversified. The financial statements of the remaining funds in the Trust are presented separately. Shares of the Fund are sold only to insurance company separate accounts to fund the benefits of variable life insurance policies or variable annuity contracts. As of December 31, 2007, 97.60% of the Fund’s shares were held through one insurance company. The Fund offers two classes of shares: Class 1 and Class 2. Each class of shares differs by its distribution fees, voting rights on matters affecting a single class and its exchange privilege.
The following summarizes the Fund’s significant accounting policies.
a. Security Valuation
Securities listed on a securities exchange or on the NASDAQ National Market System are valued at the last quoted sale price or the official closing price of the day, respectively. Over-the-counter securities and listed securities for which there is no reported sale are valued within the range of the most recent quoted bid and ask prices. Securities that trade in multiple markets or on multiple exchanges are valued according to the broadest and most representative market. Investments in open-end mutual funds are valued at the closing net asset value.
Corporate debt securities, government securities, mortgage pass-through securities, other mortgage-backed securities, collateralized mortgage obligations and asset-backed securities generally trade in the over-the-counter market rather than on a securities exchange. The Trust may utilize independent pricing services, quotations from bond dealers, and information with respect to bond and note transactions, to assist in determining a current market value for each security. The Trust’s pricing services may use valuation models or matrix pricing which considers information with respect to comparable bond and note transactions, quotations from bond dealers, or by reference to other securities that are considered comparable in such characteristics as rating, interest rate and maturity date, option adjusted spread models, prepayment projections, interest rate spreads and yield curves, to determine current value.
Senior secured corporate loans with floating or variable interest rates generally trade in the over-the-counter market rather than on a securities exchange. The Trust may utilize independent pricing services, quotations from loan dealers and other financial institutions, and information with respect to bond and note transactions, to assist in determining a current market value for each security. The Trust’s pricing services use independent market quotations from loan dealers or financial institutions and may incorporate valuation methodologies that consider multiple bond characteristics such as dealer quotes, issuer type, coupon, maturity, weighted average maturity, interest rate spreads and yield curves, cash flow and credit risk/quality analysis, to determine current value.
Foreign securities are valued as of the close of trading on the foreign stock exchange on which the security is primarily traded, or the NYSE, whichever is earlier. If no sale is reported at that time, the foreign security will be valued within the range of the most recent quoted bid and ask prices. The value is then converted into its U.S. dollar equivalent at the foreign exchange rate in effect at the close of the NYSE on the day that the value of the foreign security is determined.
The Trust has procedures to determine the fair value of individual securities and other assets for which market prices are not readily available or which may not be reliably priced. Methods for valuing these securities may include: fundamental analysis, matrix pricing, discounts from market prices of similar securities, or discounts applied due to the nature and duration of restrictions on the disposition of the securities. Due to the inherent uncertainty of valuations of such securities, the fair values may differ significantly from the values that would have been used had a ready market for such investments existed. Occasionally, events occur between the time at which trading in a security is completed and the close of the NYSE that might call into question the availability (including the reliability) of the value of a portfolio security held by the Fund. If such an event occurs, the securities may be valued using fair value procedures, which may include the use of independent pricing services. All security valuation procedures are approved by the Trust’s Board of Trustees.
FSI-28
Franklin Templeton Variable Insurance Products Trust
Notes to Financial Statements (continued)
Franklin Strategic Income Securities Fund
1. ORGANIZATION AND SIGNIFICANT ACCOUNTING POLICIES (continued)
b. Foreign Currency Translation
Portfolio securities and other assets and liabilities denominated in foreign currencies are translated into U.S. dollars based on the exchange rate of such currencies against U.S. dollars on the date of valuation. Purchases and sales of securities, income and expense items denominated in foreign currencies are translated into U.S. dollars at the exchange rate in effect on the transaction date. Occasionally, events may impact the availability or reliability of foreign exchange rates used to convert the U.S. dollar equivalent value. If such an event occurs, the foreign exchange rate will be valued at fair value using procedures established and approved by the Trust’s Board of Trustees.
The Fund does not separately report the effect of changes in foreign exchange rates from changes in market prices on securities held. Such changes are included in net realized and unrealized gain or loss from investments on the Statement of Operations.
Realized foreign exchange gains or losses arise from sales of foreign currencies, currency gains or losses realized between the trade and settlement dates on securities transactions and the difference between the recorded amounts of dividends, interest, and foreign withholding taxes and the U.S. dollar equivalent of the amounts actually received or paid. Net unrealized foreign exchange gains and losses arise from changes in foreign exchange rates on foreign denominated assets and liabilities other than investments in securities held at the end of the reporting period.
c. Securities Purchased on a When-Issued, Delayed Delivery, or TBA Basis
The Fund may purchase securities on a when-issued, delayed delivery, or to-be-announced (TBA) basis, with payment and delivery scheduled for a future date. These transactions are subject to market fluctuations and are subject to the risk that the value at delivery may be more or less than the trade date purchase price. Although the Fund will generally purchase these securities with the intention of holding the securities, it may sell the securities before the settlement date. Sufficient assets have been segregated for these securities.
d. Foreign Currency Contracts
When the Fund purchases or sells foreign securities it may enter into foreign exchange contracts to minimize foreign exchange risk from the trade date to the settlement date of the transactions. A foreign exchange contract is an agreement between two parties to exchange different currencies at an agreed upon exchange rate at a future date. Realized and unrealized gains and losses on these contracts are included in the Statement of Operations.
The Fund may also enter into forward exchange contracts to hedge against fluctuations in foreign exchange rates. These contracts are valued daily by the Fund and the unrealized gains or losses on the contracts, as measured by the difference between the contractual forward foreign exchange rates and the forward rates at the reporting date, are included in the Statement of Assets and Liabilities. Realized and unrealized gains and losses on these contracts are included in the Statement of Operations.
The risks of these contracts include movement in the values of the foreign currencies relative to the U.S. dollar and the possible inability of the counterparties to fulfill their obligations under the contracts, which may be in excess of the amount reflected in the Statement of Assets and Liabilities.
e. Mortgage Dollar Rolls
The Fund enters into mortgage dollar rolls, typically on a TBA basis. Mortgage dollar rolls are agreements between the Fund and a financial institution to simultaneously sell and repurchase mortgage-backed securities at a future date. Gains or losses are realized on the initial sale, and the difference between the repurchase price and the sale price is recorded as an unrealized gain or loss to the Fund upon entering into the mortgage dollar roll. In addition, the Fund may earn interest on the cash proceeds that are received from the initial sale. During the period between the sale and repurchase, the Fund is not entitled to principal and interest paid on the mortgage backed securities. The risks of mortgage dollar roll transactions include the potential inability of the counterparty to fulfill its obligations.
FSI-29
Franklin Templeton Variable Insurance Products Trust
Notes to Financial Statements (continued)
Franklin Strategic Income Securities Fund
1. ORGANIZATION AND SIGNIFICANT ACCOUNTING POLICIES (continued)
f. Senior Floating Rate Interests
Senior secured corporate loans pay interest at rates which are periodically reset by reference to a base lending rate plus a spread. These base lending rates are generally the prime rate offered by a designated U.S. bank or the London InterBank Offered Rate (LIBOR). Senior secured corporate loans often require prepayment of principal from excess cash flows or at the discretion of the borrower. As a result, actual maturity may be substantially less than the stated maturity.
Senior secured corporate loans in which the Fund invests are generally readily marketable, but may be subject to some restrictions on resale.
g. Income Taxes
No provision has been made for U.S. income taxes because it is the Fund’s policy to qualify as a regulated investment company under the Internal Revenue Code and to distribute to shareholders substantially all of its taxable income and net realized gains.
h. Security Transactions, Investment Income, Expenses and Distributions
Security transactions are accounted for on trade date. Realized gains and losses on security transactions are determined on a specific identification basis. Interest income and estimated expenses are accrued daily. Amortization of premium and accretion of discount on debt securities are included in interest income. Facility fees are recognized as income over the expected term of the loan. Dividend income is recorded on the ex-dividend date. Distributions to shareholders are recorded on the ex-dividend date and are determined according to income tax regulations (tax basis). Distributable earnings determined on a tax basis may differ from earnings recorded in accordance with accounting principles generally accepted in the United States of America. These differences may be permanent or temporary. Permanent differences are reclassified among capital accounts to reflect their tax character. These reclassifications have no impact on net assets or the results of operations. Temporary differences are not reclassified, as they may reverse in subsequent periods.
Common expenses incurred by the Trust are allocated among the funds based on the ratio of net assets of each fund to the combined net assets of the Trust. Fund specific expenses are charged directly to the fund that incurred the expense.
Realized and unrealized gains and losses and net investment income, other than class specific expenses, are allocated daily to each class of shares based upon the relative proportion of net assets of each class. Differences in per share distributions, by class, are generally due to differences in class specific expenses.
Inflation-indexed bonds provide an inflation hedge through periodic increases in the security’s interest accruals and principal redemption value, by amounts corresponding to the current rate of inflation. Any such adjustments, including adjustments to principal redemption value, are recorded as interest income.
i. Accounting Estimates
The preparation of financial statements in accordance with accounting principles generally accepted in the United States of America requires management to make estimates and assumptions that affect the reported amounts of assets and liabilities at the date of the financial statements and the amounts of income and expenses during the reporting period. Actual results could differ from those estimates.
j. Guarantees and Indemnifications
Under the Trust’s organizational documents, its officers and trustees are indemnified by the Trust against certain liabilities arising out of the performance of their duties to the Trust. Additionally, in the normal course of business, the Trust, on behalf of the Fund, enters into contracts with service providers that contain general indemnification clauses. The Trust’s maximum exposure under these arrangements is unknown as this would involve future claims that may be made against the Trust that have not yet occurred. Currently, the Trust expects the risk of loss to be remote.
FSI-30
Franklin Templeton Variable Insurance Products Trust
Notes to Financial Statements (continued)
Franklin Strategic Income Securities Fund
2. SHARES OF BENEFICIAL INTEREST
At December 31, 2007, there were an unlimited number of shares authorized (without par value). Transactions in the Fund’s shares were as follows:
| | | | | | | | | | | | | | |
| | | Year Ended December 31, | |
| | | 2007 | | | 2006 | |
| Class 1 Shares: | | Shares | | | Amount | | | Shares | | | Amount | |
Shares sold | | 11,675,973 | | | $ | 149,677,141 | | | 9,072,737 | | | $ | 113,566,999 | |
Shares issued in reinvestment of distributions | | 4,459,172 | | | | 55,382,910 | | | 3,743,695 | | | | 44,699,713 | |
Shares redeemed | | (1,960,490 | ) | | | (24,683,429 | ) | | (1,528,414 | ) | | | (19,174,322 | ) |
| | | | |
Net increase (decrease) | | 14,174,655 | | | $ | 180,376,622 | | | 11,288,018 | | | $ | 139,092,390 | |
| | | | |
| Class 2 Shares: | | | | | | | | | | | | |
Shares sold | | 1,114,032 | | | $ | 14,054,418 | | | 394,210 | | | $ | 4,840,124 | |
Shares issued in reinvestment of distributions | | 75,751 | | | | 928,713 | | | 40,284 | | | | 475,358 | |
Shares redeemed | | (171,480 | ) | | | (2,143,864 | ) | | (1,089,705 | ) | | | (13,678,008 | ) |
| | | | |
Net increase (decrease) | | 1,018,303 | | | $ | 12,839,267 | | | (655,211 | ) | | $ | (8,362,526 | ) |
| | | | |
3. TRANSACTIONS WITH AFFILIATES
Franklin Resources, Inc. is the holding company for various subsidiaries that together are referred to as Franklin Templeton Investments. Certain officers and trustees of the Trust are also officers and/or directors of the following subsidiaries:
| | |
| Subsidiary | | Affiliation |
Franklin Advisers, Inc. (Advisers) | | Investment manager |
Franklin Templeton Services, LLC (FT Services) | | Administrative manager |
Franklin Templeton Distributors, Inc. (Distributors) | | Principal underwriter |
Franklin Templeton Investor Services, LLC (Investor Services) | | Transfer agent |
a. Management Fees
The Fund pays an investment management fee to Advisers based on the average daily net assets of the Fund as follows:
| | |
| Annualized Fee Rate | | Net Assets |
| 0.425% | | Up to and including $500 million |
| 0.325% | | Over $500 million, up to and including $1 billion |
| 0.280% | | Over $1 billion, up to and including $1.5 billion |
| 0.235% | | Over $1.5 billion, up to and including $6.5 billion |
| 0.215% | | Over $6.5 billion, up to and including $11.5 billion |
| 0.200% | | Over $11.5 billion, up to and including $16.5 billion |
| 0.190% | | Over $16.5 billion, up to and including $19 billion |
| 0.180% | | Over $19 billion, up to and including $21.5 billion |
| 0.170% | | In excess of $21.5 billion |
b. Administrative Fees
The Fund pays an administrative fee to FT Services of 0.20% per year of the average daily net assets of the Fund.
FSI-31
Franklin Templeton Variable Insurance Products Trust
Notes to Financial Statements (continued)
Franklin Strategic Income Securities Fund
3. TRANSACTIONS WITH AFFILIATES (continued)
c. Distribution Fees
The Fund’s Board of Trustees has adopted a distribution plan for Class 2 shares pursuant to Rule 12b-1 under the 1940 Act. Under the Fund’s compensation distribution plan, the Fund pays Distributors for costs incurred in connection with the servicing, sale and distribution of the Fund’s shares up to 0.25% per year of its average daily net assets.
d. Transfer Agent Fees
Investor Services, under terms of an agreement, performs shareholder servicing for the Fund and is not paid by the Fund for the services.
4. EXPENSE OFFSET ARRANGEMENT
The Fund has entered into an arrangement with its custodian whereby credits realized as a result of uninvested cash balances are used to reduce a portion of the Fund’s custodian expenses. During the year ended December 31, 2007, the custodian fees were reduced as noted in the Statement of Operations.
5. INCOME TAXES
The Fund has reviewed the tax positions taken on federal income tax returns, for each of the three open tax years and as of December 31, 2007 and has determined that no provision for income tax is required in the Fund’s financial statements.
The tax character of distributions paid during the years ended December 31, 2007 and 2006, was as follows:
| | | | | | |
| | | 2007 | | 2006 |
Distributions paid from: | | | | | | |
Ordinary income | | $ | 54,516,053 | | $ | 41,610,596 |
Long term capital gain | | | 1,795,570 | | | 3,564,475 |
| | | |
| | $ | 56,311,623 | | $ | 45,175,071 |
| | | |
At December 31, 2007, the cost of investments, net unrealized appreciation (depreciation), undistributed ordinary income and undistributed long term capital gains for income tax purposes were as follows:
| | | | |
Cost of investments | | $ | 1,099,621,713 | |
| | | | |
| |
Unrealized appreciation | | $ | 23,901,458 | |
Unrealized depreciation | | | (31,428,402 | ) |
| | | | |
Net unrealized appreciation (depreciation) | | $ | (7,526,944 | ) |
| | | | |
Undistributed ordinary income | | $ | 79,701,345 | |
Undistributed long term capital gains | | | 870,922 | |
| | | | |
Distributable earnings | | $ | 80,572,267 | |
| | | | |
Net investment income differs for financial statement and tax purposes primarily due to differing treatments of foreign currency transactions, mortgage dollar roll, paydown losses, bond discounts and premiums, and inflation related adjustments on foreign securities.
Net realized gains (losses) differ for financial statement and tax purposes primarily due to differing treatments of wash sales, foreign currency transactions, mortgage dollar roll, paydown losses, bond discounts and premiums, and inflation related adjustments on foreign securities.
FSI-32
Franklin Templeton Variable Insurance Products Trust
Notes to Financial Statements (continued)
Franklin Strategic Income Securities Fund
6. INVESTMENT TRANSACTIONS
Purchases and sales of investments (excluding short term securities) for the year ended December 31, 2007, aggregated $642,641,587 and $453,685,377, respectively.
7. INVESTMENTS IN FRANKLIN INSTITUTIONAL FIDUCIARY TRUST MONEY MARKET PORTFOLIO
The Fund may invest in the Franklin Institutional Fiduciary Trust Money Market Portfolio (Sweep Money Fund), an open-end investment company managed by Advisers. Management fees paid by the Fund are reduced on assets invested in the Sweep Money Fund, in an amount not to exceed the management and administrative fees paid by the Sweep Money Fund.
8. FORWARD EXCHANGE CONTRACTS
At December 31, 2007, the Fund had the following forward exchange contracts outstanding:
| | | | | | | | | | | | | | |
| | | Contract Amounta | | | Settlement
Date | | Unrealized
Gain | | Unrealized
Loss | |
| Contracts to Buy | | | | | | | | | | |
| 95,000,000 | | Iceland Krona | | 1,473,897 | | | 1/28//08 | | $ | 27,924 | | $ | — | |
| 50,000,000 | | Norwegian Krone | | 8,941,665 | | | 1/28/08 | | | 251,488 | | | — | |
| 127,500,000 | | Indian Rupee | | 4,266,069 | NZD | | 2/29/08 | | | — | | | (21,053 | ) |
| 9,239,840 | | Iceland Krona | | 8,000,000 | | | 10/24/08 | | | 249,358 | | | — | |
| | | | |
| Contracts to Sell | | | | | | | | | | |
| 35,467,487 | | Mexican Peso | | 142,508,364 | INR | | 1/28/08 | | | 367,555 | | | — | |
| 26,512,592 | | Mexican Peso | | 104,952,749 | INR | | 2/28/08 | | | 237,022 | | | — | |
| 47,681,503 | | Mexican Peso | | 2,187,388,972 | CLP | | 6/12/08 | | | 66,701 | | | — | |
| 36,540,189 | | Mexican Peso | | 399,051,385 | KZT | | 6/30/08 | | | — | | | (113,433 | ) |
| 17,883,017 | | Mexican Peso | | 813,140,798 | CLP | | 9/15/08 | | | 22,867 | | | — | |
| 11,143,906 | | Mexican Peso | | 39,977,648 | INR | | 10/20/08 | | | 10,551 | | | | |
| | | | | | | | | | | |
| Unrealized gain (loss) on forward exchange contracts | | | | | | | | 1,233,466 | | | (134,486 | ) |
| | | | | | | | | | | |
| Net unrealized gain (loss) on forward exchange contracts | | | | | | | $ | 1,098,980 | | | | |
| | | | | | | | | | | | | | |
a | In U.S. dollars unless otherwise indicated. |
Currency Abbreviations
CLP - Chilean Peso
INR - Indian Rupee
KZT - Kazakhstan Tenge
NZD - New Zealand Dollar
9. CREDIT RISK
The Fund has 48.02% of its portfolio invested in below investment grade and comparable quality unrated high yield securities, which tend to be more sensitive to economic conditions than higher rated securities. The risk of loss due to default by the issuer may be significantly greater for the holders of high yielding securities because such securities are generally unsecured and are often subordinated to other creditors of the issuer.
FSI-33
Franklin Templeton Variable Insurance Products Trust
Notes to Financial Statements (continued)
Franklin Strategic Income Securities Fund
10. UNFUNDED LOAN COMMITMENTS
The Fund may enter into certain credit agreements, all or a portion of which may be unfunded. The Fund is obligated to fund these loan commitments at the borrowers’ discretion. Funded portions of credit agreements are presented on the Statement of Investments.
At December 31, 2007, unfunded commitments were as follows:
| | | |
| Borrower | | Unfunded
Commitment |
Bausch & Lomb Incorporated, Delayed Draw Term Loan | | $ | 200,000 |
Community Health Systems Inc., Delayed Draw Term Loan | | | 197,359 |
Laureate Education Inc., Delayed Draw Term Loan | | | 323,446 |
Univision Communications Inc., Delayed Draw Term Loan | | | 104,027 |
| | | |
| | $ | 824,832 |
| | | |
Unfunded loan commitments and funded portions of credit agreements are marked to market daily and any unrealized gain or loss is included in the Statement of Assets and Liabilities and Statement of Operations.
11. REGULATORY AND LITIGATION MATTERS
As part of various investigations by a number of federal, state, and foreign regulators and governmental entities, including the Securities and Exchange Commission (“SEC”), relating to certain practices in the mutual fund industry, including late trading, market timing and marketing support payments to securities dealers who sell fund shares (“marketing support”), Franklin Resources, Inc. and certain of its subsidiaries (collectively, the “Company”), entered into settlements with certain of those regulators and governmental entities. Specifically, the Company entered into settlements with the SEC, among others, concerning market timing and marketing support.
On June 6, 2007, the SEC posted for public comment the proposed plan of distribution for the market timing settlement. Once the SEC approves the final plan of distribution, disbursements of settlement monies will be made promptly to individuals who were shareholders of the designated funds during the relevant period, in accordance with the terms and conditions of the settlement and plan.
In addition, the Company, as well as most of the mutual funds within Franklin Templeton Investments and certain current or former officers, Company directors, fund directors, and employees, have been named in private lawsuits (styled as shareholder class actions, or as derivative actions on behalf of either the named funds or Franklin Resources, Inc.). The lawsuits relate to the industry practices referenced above.
The Company and fund management believe that the claims made in each of the private lawsuits referenced above are without merit and intend to defend against them vigorously. The Company cannot predict with certainty the eventual outcome of these lawsuits, nor whether they will have a material negative impact on the Company. If it is determined that the Company bears responsibility for any unlawful or inappropriate conduct that caused losses to the Trust, it is committed to making the Trust or its shareholders whole, as appropriate.
12. NEW ACCOUNTING PRONOUNCEMENT
In September 2006, the Financial Accounting Standards Board (FASB) issued FASB Statement No. 157, “Fair Value Measurement” (SFAS 157), which defines fair value, establishes a framework for measuring fair value, and expands disclosures about fair value measurements. SFAS 157 is effective for fiscal years beginning after November 15, 2007, and interim periods within those fiscal years. The Trust believes the adoption of SFAS 157 will have no material impact on its financial statements.
FSI-34
Franklin Templeton Variable Insurance Products Trust
Franklin Strategic Income Securities Fund
Report of Independent Registered Public Accounting Firm
To the Board of Trustees and Shareholders of
Franklin Templeton Variable Insurance Products Trust
In our opinion, the accompanying statement of assets and liabilities, including the statement of investments, and the related statements of operations and of changes in net assets and the financial highlights present fairly, in all material respects, the financial position of Franklin Strategic Income Securities Fund (one of the funds constituting Franklin Templeton Variable Insurance Products Trust, hereafter referred to as the “Fund”) at December 31, 2007, the results of its operations for the year then ended, the changes in its net assets for each of the two years in the period then ended and the financial highlights for each of the five years in the period then ended, in conformity with accounting principles generally accepted in the United States of America. These financial statements and financial highlights (hereafter referred to as “financial statements”) are the responsibility of the Fund’s management. Our responsibility is to express an opinion on these financial statements based on our audits. We conducted our audits of these financial statements in accordance with the standards of the Public Company Accounting Oversight Board (United States). Those standards require that we plan and perform the audit to obtain reasonable assurance about whether the financial statements are free of material misstatement. An audit includes examining, on a test basis, evidence supporting the amounts and disclosures in the financial statements, assessing the accounting principles used and significant estimates made by management, and evaluating the overall financial statement presentation. We believe that our audits, which included confirmation of securities at December 31, 2007 by correspondence with the custodian, agent banks and brokers, provide a reasonable basis for our opinion.
PricewaterhouseCoopers LLP
San Francisco, California
February 14, 2008
FSI-35
Franklin Templeton Variable Insurance Products Trust
Tax Designation (unaudited)
Franklin Strategic Income Securities Fund
Under Section 852(b)(3)(C) of the Internal Revenue Code, the Fund designates the maximum amount allowable but no less than $871,133 as a long term capital gain dividend for the fiscal year ended December 31, 2007.
FSI-36
FRANKLIN TEMPLETON VIP FOUNDING FUNDS ALLOCATION FUND
This annual report for Franklin Templeton VIP Founding Funds Allocation Fund covers the period since inception on July 2, 2007, through December 31, 2007.
Performance Summary as of 12/31/07
Aggregate total return of Class 1 shares represents the change in value, assuming reinvestment of dividends and capital gains.
Period ended 12/31/07
| | |
| | | Inception
(7/2/07) |
Aggregate Total Return | | -6.70% |
Total Return Index Comparison
for Hypothetical $10,000 Investment (7/2/07–12/31/07)
The graph below shows the change in value of a hypothetical $10,000 investment in the Fund over the indicated period and includes reinvestment of any income or distributions. The Fund’s performance is compared to the performance of the Standard & Poor’s 500 Index (S&P 500) and the Morgan Stanley Capital International (MSCI) World Index. One cannot invest directly in an index, nor is an index representative of the Fund’s portfolio. Please see Important Notes to Performance Information preceding the Fund Summaries.
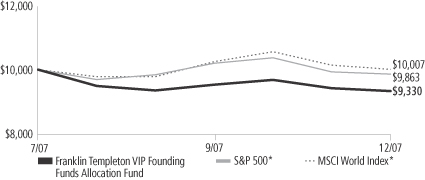
*Source: Standard & Poor’s Micropal. Please see Index Descriptions following the Fund Summaries.
Franklin Templeton VIP Founding Funds Allocation Fund – Class 1
Performance reflects the Fund’s Class 1 operating expenses, but does not include any contract fees, expenses or sales charges. If they had been included, performance would be lower. These charges and deductions, particularly for variable life policies, can have a significant effect on contract values and insurance benefits. See the contract prospectus for a complete description of these expenses, including sales charges.
Performance data represent past performance, which does not guarantee future results. Investment return and principal value will fluctuate, and you may have a gain or loss when you sell your shares.
Current performance may differ from figures shown.
FFA-1
Fund Goals and Main Investments: Franklin Templeton VIP Founding Funds Allocation Fund seeks capital appreciation, with income as a secondary goal. The Fund will normally invest equal portions in Class 1 shares of Franklin Income Securities Fund, Mutual Shares Securities Fund and Templeton Growth Securities Fund.
Performance Overview
You can find the Fund’s performance in the Performance Summary. During the period from inception on July 2, 2007, through December 31, 2007, the Fund underperformed its hybrid benchmark, a weighted combination of the S&P 500 and the MSCI World Index, which posted a -0.89% total return for the same period.1
Economic and Market Overview
During the six months ended December 31, 2007, the U.S. economy advanced at a moderate but uneven pace. Gross domestic product (GDP) grew an annualized 4.9% in the third quarter of 2007 despite a struggling housing market and the abrupt unraveling of the subprime mortgage market. Increased federal defense spending, accelerating exports, declining imports, nonresidential construction and greater business inventory investment supported growth. However, the housing downturn negatively affected the overall economy by fourth quarter 2007 as credit conditions worsened, consumer spending slowed, and GDP growth decelerated to an estimated 0.6% annualized rate.
The unemployment rate increased from 4.7% in July to 5.0% in December 2007.2 Although consumer confidence in July neared a six-year high, it declined through period-end largely due to rising mortgage and fuel costs, falling home prices and a weaker job market. Oil prices were volatile and established a new record high in November, nearing $99 per barrel. For the 12 months ended December 31, 2007, the core Consumer Price Index (CPI), which excludes food and energy costs, rose 2.4%, which was higher than its 10-year average rate.2
1. Source: Standard & Poor’s Micropal. One cannot invest directly in an index, nor is an index representative of the Fund’s portfolio. Please see Index Descriptions following the Fund Summaries. The benchmark index’s weightings are as follows: S&P 500 67% and MSCI World Index 33%.
2. Source: Bureau of Labor Statistics.
Fund Risks: Because the Fund invests in underlying funds that may engage in a variety of investment strategies involving certain risks, this Fund may be subject to those same risks. Investments in stocks offer the potential for long-term gains but can be subject to short-term price fluctuations. Because the underlying funds invest in bonds and other debt obligations, the Fund’s share price and yield will be affected by interest rate movements. Bond prices generally move in the opposite direction of interest rates. Thus, as prices of bonds in the Fund adjust to a rise in interest rates, the Fund’s share price may decline. High yield, lower-rated (junk) bonds generally have greater price swings and higher default risks than investment-grade bonds. Foreign investing, especially in emerging markets, involves additional risks, including currency fluctuations, economic instability, market volatility, and political and social instability. The Fund’s prospectus also includes a description of the main investment risks.
FFA-2
Facing the prospect of slower economic growth, the Federal Reserve Board lowered the federal funds target rate to 4.25% from 5.25% during the period. As investors fled riskier, poorer-performing assets, U.S. Treasuries rallied and the 10-year Treasury note yield fell from 5.03% at the beginning of the period to 4.04% on December 31, 2007.
The global economy remained resilient despite elevated energy prices and widespread fears of contagion from the deteriorating U.S. housing situation. Consumer and corporate demand strength, particularly in China and other developing economies, generally favorable employment, and accommodative monetary policies continued to underpin the current global expansionary period that began in 2002. For the period under review, domestic and most foreign equity markets were weak as investor risk aversion increased. Emerging markets, however, were generally stronger, as they were supported by economies growing at accelerated rates.
Investment Strategy
The Fund invests its assets in an equally weighted combination of Franklin Income Securities Fund, Mutual Shares Securities Fund and Templeton Growth Securities Fund. These underlying funds, in turn, invest in a variety of U.S. and foreign equity securities and, to a lesser extent, fixed income and money market securities. As market conditions affect the underlying funds, we rebalance the Fund’s allocations seeking to maintain equal weightings of approximately 33 1/ 3% of total net assets in each underlying fund whenever the actual allocations exceed plus or minus 3% of the fixed allocation percentages.
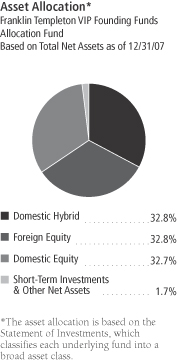
The dollar value, number of shares or principal amount, and names of all portfolio holdings are in the Fund’s Statement of Investments.
FFA-3
Manager’s Discussion
The Fund’s performance can be attributed largely to its allocation among the underlying funds and their investments in domestic and foreign equities, fixed income securities, and short-term investments and other net assets.
During the period under review, the Fund’s performance was hindered most by Mutual Shares Securities Fund – Class 1, followed by Templeton Growth Securities Fund – Class 1 and Franklin Income Securities Fund – Class 1.
Thank you for your participation in Franklin Templeton VIP Founding Funds Allocation Fund. We look forward to serving your future investment needs.
The foregoing information reflects our analysis, opinions and portfolio holdings as of December 31, 2007, the end of the reporting period. The way we implement our main investment strategies and the resulting portfolio holdings may change depending on factors such as market and economic conditions. These opinions may not be relied upon as investment advice or an offer for a particular security. The information is not a complete analysis of every aspect of any market, country, industry, security or the Fund. Statements of fact are from sources considered reliable, but the investment manager makes no representation or warranty as to their completeness or accuracy. Although historical performance is no guarantee of future results, these insights may help you understand our investment management philosophy.
FFA-4
Fund Expenses
As an investor in a variable insurance contract (Contract) that indirectly provides for investment in an underlying mutual fund, you can incur transaction and/or ongoing expenses at both the Fund level and the Contract level.
| • | | Transaction expenses can include sales charges (loads) on purchases, redemption fees, surrender fees, transfer fees and premium taxes. |
| • | | Ongoing expenses can include management fees, distribution and service (12b-1) fees, contract fees, annual maintenance fees, mortality and expense risk fees and other fees and expenses. All mutual funds and Contracts have some types of ongoing expenses. |
The expenses shown in the table are meant to highlight ongoing expenses at the Fund level only and do not include ongoing expenses at the Contract level, or transaction expenses at either the Fund or Contract level. While the Fund does not have transaction expenses, if the transaction and ongoing expenses at the Contract level were included, the expenses shown would be higher. You should consult your Contract prospectus or disclosure document for more information.
The table shows Fund-level ongoing expenses and can help you understand these expenses and compare them with those of other mutual funds offered through the Contract. The table assumes a $1,000 investment held for the six months indicated. Please refer to the Fund prospectus for additional information on operating expenses.
Actual Fund Expenses
The first line (Actual) of the table provides actual account values and expenses. The “Ending Account Value” is derived from the Fund’s actual return, which includes the effect of ongoing Fund expenses, but does not include the effect of ongoing Contract expenses.
You can estimate the Fund-level expenses you incurred during the period by following these steps. Of course, your account value and expenses will differ from those in this illustration:
| 1. | Divide your account value by $1,000. |
If an account had an $8,600 value, then $8,600 ÷ $1,000 = 8.6.
| 2. | Multiply the result by the number under the heading “Fund-Level Expenses Incurred During Period.” |
If Fund-Level Expenses Incurred During Period were $7.50, then
8.6 x $7.50 = $64.50.
In this illustration, the estimated expenses incurred this period at the Fund level are $64.50.
Franklin Templeton VIP Founding Funds Allocation Fund – Class 1
FFA-5
Hypothetical Example for Comparison with Other Mutual Funds
Information in the second line (Hypothetical) of the table can help you compare ongoing expenses of the Fund with those of other mutual funds offered through the Contract. This information may not be used to estimate the actual ending account balance or expenses you incurred during the period. The hypothetical “Ending Account Value” is based on the Fund’s actual expense ratio and an assumed 5% annual rate of return before expenses, which does not represent the Fund’s actual return. The figure under the heading “Fund-Level Expenses Incurred During Period” shows the hypothetical expenses your account would have incurred under this scenario. You can compare this figure with the 5% hypothetical examples that appear in shareholder reports of other funds offered through a Contract.
| | | | | | | | | |
| Class 1 | | Beginning
Account Value
Actual 7/2/07
Hypothetical 7/1/07 | | Ending
Account Value
12/31/07 | | Fund-Level
Expenses Incurred
During Period*
7/2/07–12/31/07 Hypothetical
7/1/07–12/31/07 |
Actual | | $ | 1,000 | | $ | 933.00 | | $ | 1.99 |
Hypothetical (5% return before expenses) | | $ | 1,000 | | $ | 1,023.14 | | $ | 2.09 |
*Expenses are calculated using the most recent six-month annualized expense ratio for the Fund’s Class 1 shares (0.41%), which does not include any ongoing expenses of the Contract for which the Fund is an investment option, multiplied by the average account value over the period, multiplied by 184/365 (Hypothetical) to reflect the one-half year period. For actual expenses, the multiplier is 183/365 to reflect the number of days since inception.
FFA-6
Franklin Templeton Variable Insurance Products Trust
Financial Highlights
Franklin Templeton VIP Founding Funds Allocation Fund
| | | | |
| Class 1 | | Period Ended
December 31,
2007g | |
| | | | |
Per share operating performance | | | | |
(for a share outstanding throughout the period) | | | | |
Net asset value, beginning of period | | $ | 10.00 | |
| | | | |
Income from investment operationsa: | | | | |
Net investment income (loss)b,c | | | (0.19 | ) |
Net realized and unrealized gains (losses) | | | (0.48 | ) |
| | | | |
Total from investment operations | | | (0.67 | ) |
| | | | |
Net asset value, end of period | | $ | 9.33 | |
| | | | |
| |
Total returnd | | | (6.70)% | |
Ratios to average net assetse | | | | |
Expensesf | | | 0.41% | |
Net investment income (loss) | | | (0.41)% | |
| |
Supplemental data | | | | |
Net assets, end of period (000’s) | | $ | 466 | |
Portfolio turnover rate | | | 0.04% | |
a The amount shown for a share outstanding throughout the period may not correlate with the Statement of Operations for the period due to the timing of sales and repurchases of the Fund shares in relation to income earned and/or fluctuating market value of the investments of the Fund.
b Based on average daily shares outstanding.
c Recognition of net investment income by the Fund is affected by the timing of declaration of dividends by the Underlying Funds in which the Fund invests.
d Total return does not include any fees, charges or expenses imposed by the variable annuity and life insurance contracts for which the Franklin Templeton Variable Insurance Products Trust serves as an underlying investment vehicle. Total return is not annualized for periods less than one year.
e Ratios are annualized for periods less than one year.
f Does not include expenses of the Underlying Funds in which the Fund invests. The annualized weighted average expense ratio of the Underlying Funds was 0.65% for the period ended December 31, 2007.
g For the period July 2, 2007 (commencement of operations) to December 31, 2007.
The accompanying notes are an integral part of these financial statements.
FFA-7
Franklin Templeton Variable Insurance Products Trust
Financial Highlights (continued)
Franklin Templeton VIP Founding Funds Allocation Fund
| | | | |
| Class 2 | | Period Ended
December 31,
2007g | |
| | | | |
Per share operating performance | | | | |
(for a share outstanding throughout the period) | | | | |
Net asset value, beginning of period | | $ | 10.00 | |
| | | | |
Income from investment operationsa: | | | | |
Net investment income (loss)b,c | | | (0.03 | ) |
Net realized and unrealized gains (losses) | | | (0.66 | ) |
| | | | |
Total from investment operations | | | (0.69 | ) |
| | | | |
Net asset value, end of period | | $ | 9.31 | |
| | | | |
| |
Total returnd | | | (6.90)% | |
Ratios to average net assetse | | | | |
Expensesf | | | 0.66% | |
Net investment income (loss) | | | (0.66)% | |
| |
Supplemental data | | | | |
Net assets, end of period (000’s) | | $ | 131,710 | |
Portfolio turnover rate | | | 0.04% | |
a The amount shown for a share outstanding throughout the period may not correlate with the Statement of Operations for the period due to the timing of sales and repurchases of the Fund shares in relation to income earned and/or fluctuating market value of the investments of the Fund.
b Based on average daily shares outstanding.
c Recognition of net investment income by the Fund is affected by the timing of declaration of dividends by the Underlying Funds in which the Fund invests.
d Total return does not include any fees, charges or expenses imposed by the variable annuity and life insurance contracts for which the Franklin Templeton Variable Insurance Products Trust serves as an underlying investment vehicle. Total return is not annualized for periods less than one year.
e Ratios are annualized for periods less than one year.
f Does not include expenses of the Underlying Funds in which the Fund invests. The annualized weighted average expense ratio of the Underlying Funds was 0.65% for the period ended December 31, 2007.
g For the period July 2, 2007 (commencement of operations) to December 31, 2007.
The accompanying notes are an integral part of these financial statements.
FFA-8
Franklin Templeton Variable Insurance Products Trust
Statement of Investments, December 31, 2007
| | | | | |
| Franklin Templeton VIP Founding Funds Allocation Fund | | Shares | | Value |
Investments in Underlying Fundsa | | | | | |
Long Term Investments 98.3% | | | | | |
Domestic Equity 32.7% | | | | | |
Mutual Shares Securities Fund, Class I | | 2,119,763 | | $ | 43,285,557 |
| | | | | |
Domestic Hybrid 32.8% | | | | | |
Franklin Income Securities Fund, Class I | | 2,460,854 | | | 43,384,859 |
| | | | | |
Foreign Equity 32.8% | | | | | |
Templeton Growth Securities Fund, Class I | | 2,758,664 | | | 43,255,852 |
| | | | | |
Total Investments in Underlying Funds (Cost $131,389,648) 98.3% | | | | | 129,926,268 |
Other Assets, less Liabilities 1.7% | | | | | 2,250,161 |
| | | | | |
Net Assets 100.0% | | | | $ | 132,176,429 |
| | | | | |
a | See Note 6 regarding investments in Underlying Funds. |
The accompanying notes are an integral part of these financial statements.
FFA-9
Franklin Templeton Variable Insurance Products Trust
Financial Statements
Statement of Assets and Liabilities
December 31, 2007
| | | | |
| | | Franklin
Templeton VIP
Founding Funds
Allocation Fund | |
Assets: | | | | |
Investments in Underlying Funds (Note 6): | | | | |
Cost | | $ | 131,389,648 | |
| | | | |
Value | | $ | 129,926,268 | |
Cash | | | 1,305,346 | |
Receivables: | | | | |
Investment securities sold | | | 9,677 | |
Capital shares sold | | | 2,322,196 | |
Offering costs | | | 12,615 | |
| | | | |
Total assets | | | 133,576,102 | |
| | | | |
Liabilities: | | | | |
Payables: | | | | |
Investment securities purchased | | | 1,300,000 | |
Affiliates | | | 50,208 | |
Accrued expenses and other liabilities | | | 49,465 | |
| | | | |
Total liabilities | | | 1,399,673 | |
| | | | |
Net assets, at value | | $ | 132,176,429 | |
| | | | |
Net assets consist of: | | | | |
Paid-in capital | | $ | 133,640,759 | |
Net unrealized appreciation (depreciation) | | | (1,463,380 | ) |
Accumulated net realized gain (loss) | | | (950 | ) |
| | | | |
Net assets, at value | | $ | 132,176,429 | |
| | | | |
Class 1: | | | | |
Net assets, at value | | $ | 466,356 | |
| | | | |
Shares outstanding | | | 50,000 | |
| | | | |
Net asset value and maximum offering price per share | | $ | 9.33 | |
| | | | |
Class 2: | | | | |
Net assets, at value | | $ | 131,710,073 | |
| | | | |
Shares outstanding | | | 14,139,750 | |
| | | | |
Net asset value and maximum offering price per share | | $ | 9.31 | |
| | | | |
The accompanying notes are an integral part of these financial statements.
FFA-10
Franklin Templeton Variable Insurance Products Trust
Financial Statements (continued)
Statement of Operations
for the period ended December 31, 2007a
| | | | |
| | | Franklin
Templeton VIP
Founding Funds
Allocation Fund | |
Investment income: | | | | |
Dividends from Underlying Funds (Note 6) | | $ | — | |
| | | | |
Expenses: | | | | |
Administrative fees (Note 3a) | | | 19,770 | |
Distribution fees - Class 2 (Note 3b) | | | 50,120 | |
Reports to shareholders | | | 29,454 | |
Registration and filing fees | | | 209 | |
Professional fees | | | 18,535 | |
Trustees’ fees and expenses | | | 6 | |
Amortization of offering costs | | | 12,117 | |
Other | | | 2,224 | |
| | | | |
Total expenses | | | 132,435 | |
| | | | |
Net investment income (loss) | | | (132,435 | ) |
| | | | |
Realized and unrealized gains (losses): | | | | |
Net realized gain (loss) from sale of investments in Underlying Funds | | | (950 | ) |
Net change in unrealized appreciation (depreciation) on investments in Underlying Funds | | | (1,463,380 | ) |
| | | | |
Net realized and unrealized gain (loss) | | | (1,464,330 | ) |
| | | | |
Net increase (decrease) in net assets resulting from operations | | $ | (1,596,765 | ) |
| | | | |
a | For the period July 2, 2007 (commencement of operations) to December 31, 2007. |
The accompanying notes are an integral part of these financial statements.
FFA-11
Franklin Templeton Variable Insurance Products Trust
Financial Statements (continued)
Statement of Changes in Net Assets
| | | | |
| | | Franklin
Templeton VIP
Founding Funds
Allocation Fund | |
| | | Period Ended
December 31,
2007a | |
| | | | |
Increase (decrease) in net assets: | | | | |
Operations: | | | | |
Net investment income (loss) | | $ | (132,435 | ) |
Net realized gain (loss) from Underlying Funds | | | (950 | ) |
Net change in unrealized appreciation (depreciation) on investments in Underlying Funds | | | (1,463,380 | ) |
| | | | |
Net increase (decrease) in net assets resulting from operations | | | (1,596,765 | ) |
| | | | |
Capital share transactions: (Note 2) | | | | |
Class 1 | | | 500,000 | |
Class 2 | | | 133,273,194 | |
| | | | |
Total capital share transactions | | | 133,773,194 | |
| | | | |
Net increase (decrease) in net assets | | | 132,176,429 | |
Net assets (there is no undistributed net investment income at beginning or end of period): | | | | |
Beginning of period | | | — | |
| | | | |
End of period | | $ | 132,176,429 | |
| | | | |
a | For the period July 2, 2007 (commencement of operations) to December 31, 2007. |
The accompanying notes are an integral part of these financial statements.
FFA-12
Franklin Templeton Variable Insurance Products Trust
Notes to Financial Statements
Franklin Templeton VIP Founding Funds Allocation Fund
1. ORGANIZATION AND SIGNIFICANT ACCOUNTING POLICIES
Franklin Templeton Variable Insurance Products Trust (Trust) is registered under the Investment Company Act of 1940, as amended, (1940 Act) as an open-end investment company, consisting of twenty-three separate funds. The Franklin Templeton VIP Founding Funds Allocation Fund (Fund) included in this report is diversified. The financial statements of the remaining funds in the Trust are presented separately. The Fund invests primarily in Franklin Templeton mutual funds (Underlying Funds). Shares of the Fund are sold only to insurance company separate accounts to fund the benefits of variable life insurance policies or variable annuity contracts. As of December 31, 2007, 66.43% of the Fund’s shares were held through one insurance company. The Fund offers two classes of shares: Class 1 and Class 2. Each class of shares differs by its distribution fees, voting rights on matters affecting a single class and its exchange privilege.
Effective July 2, 2007, the Trust began offering shares of the Fund.
The following summarizes the Fund’s significant accounting policies.
a. Security Valuation
Net asset value per share is calculated as of the close of trading of the NYSE. Investments in the Underlying Funds are valued at their closing net asset value each trading day.
b. Income Taxes
No provision has been made for U.S. income taxes because it is the Fund’s policy to qualify as a regulated investment company under the Internal Revenue Code and to distribute to shareholders substantially all of its taxable income and net realized gains.
c. Security Transactions, Investment Income, Expenses and Distributions
Security transactions are accounted for on trade date. Realized gains and losses on security transactions are determined on a specific identification basis. Estimated expenses are accrued daily. Dividend income and realized gain distributions by Underlying Funds are recorded on the ex-dividend date. Distributions to shareholders are recorded on the ex-dividend date and are determined according to income tax regulations (tax basis). Distributable earnings determined on a tax basis may differ from earnings recorded in accordance with accounting principles generally accepted in the United States of America. These differences may be permanent or temporary. Permanent differences are reclassified among capital accounts to reflect their tax character. These reclassifications have no impact on net assets or the results of operations. Temporary differences are not reclassified, as they may reverse in subsequent periods.
Common expenses incurred by the Trust are allocated among the funds based on the ratio of net assets of each fund to the combined net assets of the Trust. Fund specific expenses are charged directly to the fund that incurred the expense.
The Fund indirectly bears its proportionate share of expenses from the Underlying Funds. Since the Underlying Funds have varied expense levels and the Fund may own different proportions of the Underlying Funds at different times, the amount of expenses incurred by the Fund will vary.
Realized and unrealized gains and losses and net investment income, other than class specific expenses, are allocated daily to each class of shares based upon the relative proportion of net assets of each class. Differences in per share distributions, by class, are generally due to differences in class specific expenses.
d. Offering Costs
Offering costs are amortized on a straight line basis over twelve months.
FFA-13
Franklin Templeton Variable Insurance Products Trust
Notes to Financial Statements (continued)
Franklin Templeton VIP Founding Funds Allocation Fund
1. ORGANIZATION AND SIGNIFICANT ACCOUNTING POLICIES (continued)
e. Accounting Estimates
The preparation of financial statements in accordance with accounting principles generally accepted in the United States of America requires management to make estimates and assumptions that affect the reported amounts of assets and liabilities at the date of the financial statements and the amounts of income and expenses during the reporting period. Actual results could differ from those estimates.
f. Guarantees and Indemnifications
Under the Trust’s organizational documents, its officers and trustees are indemnified by the Trust against certain liabilities arising out of the performance of their duties to the Trust. Additionally, in the normal course of business, the Trust, on behalf of the Fund, enters into contracts with service providers that contain general indemnification clauses. The Trust’s maximum exposure under these arrangements is unknown as this would involve future claims that may be made against the Trust that have not yet occurred. Currently, the Trust expects the risk of loss to be remote.
2. SHARES OF BENEFICIAL INTEREST
At December 31, 2007, there were an unlimited number of shares authorized (without par value). Transactions in the Fund’s shares were as follows:
| | | | | | | |
| | | Period Ended
December 31, 2007a | |
| Class 1 Shares: | | Shares | | | Amount | |
Shares sold | | 50,000 | | | $ | 500,000 | |
Shares redeemed | | — | | | | — | |
| | | | | | | |
Net increase (decrease) | | 50,000 | | | $ | 500,000 | |
| | | | | | | |
| Class 2 Shares: | | | | | | |
Shares sold | | 14,284,933 | | | $ | 134,614,945 | |
Shares redeemed | | (145,183 | ) | | | (1,341,751 | ) |
| | | | | | | |
Net increase (decrease) | | 14,139,750 | | | $ | 133,273,194 | |
| | | | | | | |
a | For the period July 2, 2007 (commencement of operations) to December 31, 2007. |
3. TRANSACTIONS WITH AFFILIATES
Franklin Resources, Inc. is the holding company for various subsidiaries that together are referred to as Franklin Templeton Investments. Certain officers and trustees of the Trust are also officers and/or directors of the following subsidiaries:
| | |
| Subsidiary | | Affiliation |
Franklin Templeton Services, LLC (FT Services) | | Administrative manager |
Franklin Templeton Distributors, Inc. (Distributors) | | Principal underwriter |
Franklin Templeton Investor Services, LLC (Investor Services) | | Transfer agent |
a. Administrative Fees
The Fund pays an administrative fee to FT Services of 0.10% per year of the average daily net assets of the Fund for administrative services including monitoring and rebalancing the percentages of the Fund’s investments in the Underlying Funds.
FFA-14
Franklin Templeton Variable Insurance Products Trust
Notes to Financial Statements (continued)
Franklin Templeton VIP Founding Funds Allocation Fund
3. TRANSACTIONS WITH AFFILIATES (continued)
b. Distribution Fees
The Fund’s Board of Trustees has adopted a distribution plan for Class 2 shares pursuant to Rule 12b-1 under the 1940 Act. Under the Fund’s compensation distribution plan, the Fund pays Distributors for costs incurred in connection with the servicing, sale and distribution of the Fund’s shares up to 0.35% per year of its average daily net assets. The Board of Trustees has agreed to limit the current rate to 0.25% per year.
c. Transfer Agent Fees
Investor Services, under terms of an agreement, performs shareholder servicing for the Fund and is not paid by the Fund for the services.
4. INCOME TAXES
The Fund has reviewed the tax positions as of December 31, 2007 and has determined that no provision for income tax is required in the Fund’s financial statements.
At December 31, 2007, the cost of investments and net unrealized appreciation (depreciation) for income tax purposes were as follows:
| | | | |
Cost of investments | | $ | 131,390,598 | |
| | | | |
| |
Unrealized appreciation | | $ | — | |
Unrealized depreciation | | | (1,464,330 | ) |
| | | | |
Net unrealized appreciation (depreciation) | | $ | (1,464,330 | ) |
| | | | |
Net investment income (loss) differs for financial statement and tax purposes primarily due to differing treatment of offering costs.
Net realized gains (losses) differ for financial statement and tax purposes primarily due to differing treatment of wash sales.
5. INVESTMENT TRANSACTIONS
Purchases and sales of Underlying Funds (excluding short term securities) for the year ended December 31, 2007, were as follows:
| | | |
Purchases | | $ | 131,411,999 |
Sales | | $ | 21,401 |
6. INVESTMENTS IN UNDERLYING FUNDS
The Fund invests primarily in the Underlying Funds which are managed by Franklin Advisers, Inc., (Advisers), an affiliate of FT Services, or an affiliate of Advisers. The Fund does not invest in the Underlying Funds for the purpose of exercising management or control. At December 31, 2007, the Fund held no positions which exceed 5% of the Underlying Funds shares outstanding.
The Fund may invest in the Franklin Institutional Fiduciary Trust Money Market Portfolio (Sweep Money Fund), an open-end investment company managed by Advisers. Pursuant to a SEC exemptive order specific to the Fund’s investment in the Sweep Money Fund, administrative fees are reduced on assets invested in the Sweep Money Fund, in an amount not to exceed the management and administrative fees paid by the Sweep Money Fund.
FFA-15
Franklin Templeton Variable Insurance Products Trust
Notes to Financial Statements (continued)
Franklin Templeton VIP Founding Funds Allocation Fund
7. REGULATORY AND LITIGATION MATTERS
As part of various investigations by a number of federal, state, and foreign regulators and governmental entities, including the Securities and Exchange Commission (“SEC”), relating to certain practices in the mutual fund industry, including late trading, market timing and marketing support payments to securities dealers who sell fund shares (“marketing support”), Franklin Resources, Inc. and certain of its subsidiaries (collectively, the “Company”), entered into settlements with certain of those regulators and governmental entities. Specifically, the Company entered into settlements with the SEC, among others, concerning market timing and marketing support.
On June 6, 2007, the SEC posted for public comment the proposed plan of distribution for the market timing settlement. Once the SEC approves the final plan of distribution, disbursements of settlement monies will be made promptly to individuals who were shareholders of the designated funds during the relevant period, in accordance with the terms and conditions of the settlement and plan.
In addition, the Company, as well as most of the mutual funds within Franklin Templeton Investments and certain current or former officers, Company directors, fund directors, and employees, have been named in private lawsuits (styled as shareholder class actions, or as derivative actions on behalf of either the named funds or Franklin Resources, Inc.). The lawsuits relate to the industry practices referenced above.
The Company and fund management believe that the claims made in each of the private lawsuits referenced above are without merit and intend to defend against them vigorously. The Company cannot predict with certainty the eventual outcome of these lawsuits, nor whether they will have a material negative impact on the Company. If it is determined that the Company bears responsibility for any unlawful or inappropriate conduct that caused losses to the Fund, it is committed to making the Trust or its shareholders whole, as appropriate.
8. NEW ACCOUNTING PRONOUNCEMENT
In September 2006, the Financial Accounting Standards Board (FASB) issued FASB Statement No. 157, “Fair Value Measurement” (SFAS 157), which defines fair value, establishes a framework for measuring fair value, and expands disclosures about fair value measurements. SFAS 157 is effective for fiscal years beginning after November 15, 2007, and interim periods within those fiscal years. The Trust believes the adoption of SFAS 157 will have no material impact on its financial statements.
FFA-16
Franklin Templeton Variable Insurance Products Trust
Franklin Templeton VIP Founding Funds Allocation Fund
Report of Independent Registered Public Accounting Firm
To the Board of Trustees and Shareholders of
Franklin Templeton Variable Insurance Products Trust
In our opinion, the accompanying statement of assets and liabilities, including the statement of investments, and the related statements of operations and of changes in net assets and the financial highlights present fairly, in all material respects, the financial position of Franklin Templeton VIP Founding Funds Allocation Fund (one of the funds constituting Franklin Templeton Variable Insurance Products Trust, hereafter referred to as the “Fund”) at December 31, 2007, the results of its operations, the changes in its net assets and the financial highlights for the period from July 2, 2007 (commencement of operations) through December 31, 2007, in conformity with accounting principles generally accepted in the United States of America. These financial statements and financial highlights (hereafter referred to as “financial statements”) are the responsibility of the Fund’s management. Our responsibility is to express an opinion on these financial statements based on our audit. We conducted our audit of these financial statements in accordance with the standards of the Public Company Accounting Oversight Board (United States). Those standards require that we plan and perform the audit to obtain reasonable assurance about whether the financial statements are free of material misstatement. An audit includes examining, on a test basis, evidence supporting the amounts and disclosures in the financial statements, assessing the accounting principles used and significant estimates made by management, and evaluating the overall financial statement presentation. We believe that our audit, which included confirmation of investments in the Underlying Funds at December 31, 2007 by correspondence with the transfer agent of the Underlying Funds, provide a reasonable basis for our opinion.
PricewaterhouseCoopers LLP
San Francisco, California
February 14, 2008
FFA-17
FRANKLIN U.S. GOVERNMENT FUND
This annual report for Franklin U.S. Government Fund covers the fiscal year ended December 31, 2007.
Performance Summary as of 12/31/07
Average annual total return of Class 1 shares represents the average annual change in value, assuming reinvestment of dividends and capital gains. Average returns smooth out variations in returns, which can be significant; they are not the same as year-by-year results.
Periods ended 12/31/07
| | | | | | |
| | | 1-Year | | 5-Year | | 10-Year |
Average Annual Total Return | | +6.85% | | +3.98% | | +5.53% |
Total Return Index Comparison for Hypothetical $10,000 Investment (1/1/98–12/31/07)
The graph below shows the change in value of a hypothetical $10,000 investment in the Fund over the indicated period and includes reinvestment of any income or distributions. The Fund’s performance is compared to the performance of the Lehman Brothers (LB) U.S. Government: Intermediate Index and the Lipper VIP General U.S. Government Funds Classification Average, as well as the Consumer Price Index (CPI). One cannot invest directly in an index, nor is an index representative of the Fund’s portfolio. Please see Important Notes to Performance Information preceding the Fund Summaries.
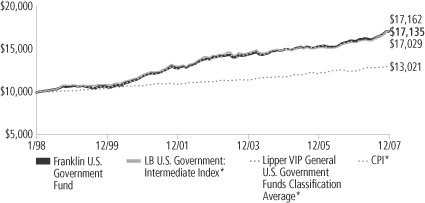
*Sources: Standard & Poor’s Micropal; Lipper Inc. Please see Index Descriptions following the Fund Summaries.
Franklin U.S. Government Fund – Class 1
Performance reflects the Fund’s Class 1 operating expenses, but does not include any contract fees, expenses or sales charges. If they had been included, performance would be lower. These charges and deductions, particularly for variable life policies, can have a significant effect on contract values and insurance benefits. See the contract prospectus for a complete description of these expenses, including sales charges.
Performance data represent past performance, which does not guarantee future results. Investment return and principal value will fluctuate, and you may have a gain or loss when you sell your shares. Current performance may differ from figures shown.
FUS-1
Fund Goal and Main Investments: Franklin U.S. Government Fund seeks income. The Fund normally invests at least 80% of its net assets in U.S. government securities and normally invests primarily in fixed and variable rate mortgage-backed securities, a substantial portion of which is Ginnie Maes.
Performance Overview
You can find the Fund’s one-year total return in the Performance Summary. Compared with its benchmarks for the same period, the Fund underperformed the LB U.S. Government: Intermediate Index’s +8.47% return and the Lipper VIP General U.S. Government Funds Classification Average’s +7.24% return.1
Economic and Market Overview
The U.S. economy grew at a moderate but uneven pace for the year ended December 31, 2007. After starting 2007 with first quarter gross domestic product (GDP) growth of 0.6% annualized, the economy accelerated to a strong second quarter growth rate of 3.8% annualized, fueled by a surge in exports. In the third quarter, GDP growth advanced at a 4.9% annualized rate, the fastest pace in four years. For most of the reporting period, consumer spending and personal income supported economic expansion, but signs of a slowing economy became evident as a number of indicators reflected a housing market correction, financial market strains and softening business and consumer spending, as well as upward inflation pressures from increasing food, energy and commodity prices and a weaker dollar. In the fourth quarter, GDP growth slowed to an estimated 0.6% annualized rate.
Oil prices exhibited continued volatility, reaching a historical high in November. Core inflation, which excludes food and energy costs, rose modestly for the year, signaling that inflation risk remains. For December 2007, core inflation had a 12-month increase of 2.4%.2 The Federal Reserve Board’s (Fed’s) preferred measure of inflation, the core personal consumption expenditures price index, reported a 12-month increase of 2.2%.3
1. Sources: Standard & Poor’s Micropal; Lipper Inc. One cannot invest directly in an index, nor is an index representative of the Fund’s portfolio. Please see Index Descriptions following the Fund Summaries.
2. Source: Bureau of Labor Statistics.
3. Source: Bureau of Economic Analysis.
Fund Risks: Interest rate movements and mortgage prepayment rates may impact the Fund’s share price and yield. Bond prices generally move in the opposite direction of interest rates. Thus, as prices of bonds in the Fund’s portfolio adjust to a rise in interest rates, the Fund’s share price may decline. U.S. government securities owned by the Fund, but not shares of the Fund, are guaranteed by the U.S. government, its agencies or instrumentalities as to the timely payment of principal and interest. The Fund’s yield and share price are not guaranteed and will fluctuate with market conditions. The Fund’s prospectus also includes a description of the main investment risks.
FUS-2
As investor uncertainty continued in the latter half of 2007, the Fed remained committed to act in an effort to restore normalcy to U.S. financial markets. The Fed cut the discount rate (the Fed’s interest rate charged to member banks) four times, bringing the rate to 4.75%. It also lowered the federal funds target rate three times. Minutes released from its December meeting, in which the Fed lowered the federal funds target rate to 4.25%, cited an uncertain outlook for economic growth and inflation and the need for the committee to be “exceptionally alert to economic and financial developments.”
Over the period, investors sought relative safety in short-term U.S. Treasuries, Treasury yields declined and the yield curve steepened. Short-term, two- and five-year yields declined significantly, with the two-year bill yielding 3.05% at the end of December, down from 4.82% a year earlier. The 10-year U.S. Treasury note ended December yielding 4.04%, compared with 4.71% at the beginning of the period.
Investment Strategy
Using our straightforward investment approach, we seek to produce current income with a high degree of credit safety from a conservatively managed portfolio of U.S. government and agency securities. Analyzing securities using proprietary and nonproprietary research, we seek to identify attractive investment opportunities.
Manager’s Discussion
After a mild start, the 12-month review period became one of heightened volatility, widespread uncertainty and risk reassessment.
For the first half of the year, Ginnie Mae (GNMA) mortgage-backed securities (MBS) generally outperformed comparable high credit-quality U.S. Treasuries as investors’ risk appetite was generally robust due to abundant liquidity and a continued solid economic environment. However, the trend reversed mid-year as increased delinquency and default activity in the lower credit-quality, subprime mortgage market created a challenging environment across much of the fixed income universe. What first appeared as an isolated incident in a narrow section of the debt market evolved into a much more complex situation, involving access to credit and capital market liquidity. Investors’ risk appetite suddenly and rapidly shifted. In an environment of heightened risk aversion, 30-year GNMA MBS generally outperformed their conventional Fannie Mae (FNMA) and Freddie Mac (FHLMC) MBS counterparts in the second half of the year as investors sought the safety of U.S. government guaranteed securities.
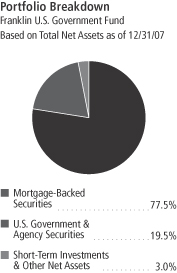
The dollar value, number of shares or principal amount, and names of all portfolio holdings are listed in the Fund’s Statement of Investments.
FUS-3
Mortgage prepayments across all coupons and program types fell with tightening credit standards and a pullback in housing and refinancing activity. Investors concerned with uncertain cash flows due to mortgage prepayments generally found MBS and GNMAs in particular attractive as GNMAs are sensitive to prepayment risk.
Consistent with our strategy, as we believed that income would continue to drive performance within the GNMA markets, we generally looked for opportunities in 30-year collateral bonds as opposed to their 15-year counterparts. At period-end, the Fund’s GNMA assets were allocated between the two tiers of the GNMA market, the GNMA I (comprising single-issuer pools) and GNMA II (comprising multiple-issuer pools) programs. However, over the reporting period, we made minor adjustments to the portfolio’s allocation and trimmed our exposure to GNMA II securities relative to our GNMA I holdings as yield spreads between those sectors remained at relatively tight levels. We also increased our allocation to higher coupon GNMAs, as we believed prepayment risk would continue to fall. Although we remained slightly overweighted in lower coupon securities than in past periods, we reduced our exposure.
Thank you for your participation in Franklin U.S. Government Fund. We look forward to serving your future investment needs.
The foregoing information reflects our analysis, opinions and portfolio holdings as of December 31, 2007, the end of the reporting period. The way we implement our main investment strategies and the resulting portfolio holdings may change depending on factors such as market and economic conditions. These opinions may not be relied upon as investment advice or an offer for a particular security. The information is not a complete analysis of every aspect of any market, country, industry, security or the Fund. Statements of fact are from sources considered reliable, but the investment manager makes no representation or warranty as to their completeness or accuracy. Although historical performance is no guarantee of future results, these insights may help you understand our investment management philosophy.
FUS-4
Fund Expenses
As an investor in a variable insurance contract (Contract) that indirectly provides for investment in an underlying mutual fund, you can incur transaction and/or ongoing expenses at both the Fund level and the Contract level.
| • | �� | Transaction expenses can include sales charges (loads) on purchases, redemption fees, surrender fees, transfer fees and premium taxes. |
| • | | Ongoing expenses can include management fees, distribution and service (12b-1) fees, contract fees, annual maintenance fees, mortality and expense risk fees and other fees and expenses. All mutual funds and Contracts have some types of ongoing expenses. |
The expenses shown in the table are meant to highlight ongoing expenses at the Fund level only and do not include ongoing expenses at the Contract level, or transaction expenses at either the Fund or Contract level. While the Fund does not have transaction expenses, if the transaction and ongoing expenses at the Contract level were included, the expenses shown below would be higher. You should consult your Contract prospectus or disclosure document for more information.
The table shows Fund-level ongoing expenses and can help you understand these expenses and compare them with those of other mutual funds offered through the Contract. The table assumes a $1,000 investment held for the six months indicated. Please refer to the Fund prospectus for additional information on operating expenses.
Actual Fund Expenses
The first line (Actual) of the table provides actual account values and expenses. The “Ending Account Value” is derived from the Fund’s actual return, which includes the effect of ongoing Fund expenses, but does not include the effect of ongoing Contract expenses.
You can estimate the Fund-level expenses you incurred during the period by following these steps. Of course, your account value and expenses will differ from those in this illustration:
| 1. | Divide your account value by $1,000. |
If an account had an $8,600 value, then $8,600 ÷ $1,000 = 8.6.
| 2. | Multiply the result by the number under the heading “Fund-Level Expenses Incurred During Period.” |
If Fund-Level Expenses Incurred During Period were $7.50, then 8.6 x $7.50 = $64.50.
In this illustration, the estimated expenses incurred this period at the Fund level are $64.50.
Franklin U.S. Government Fund – Class 1
FUS-5
Hypothetical Example for Comparison with Other Mutual Funds
Information in the second line (Hypothetical) of the table can help you compare ongoing expenses of the Fund with those of other mutual funds offered through the Contract. This information may not be used to estimate the actual ending account balance or expenses you incurred during the period. The hypothetical “Ending Account Value” is based on the Fund’s actual expense ratio and an assumed 5% annual rate of return before expenses, which does not represent the Fund’s actual return. The figure under the heading “Fund-Level Expenses Incurred During Period” shows the hypothetical expenses your account would have incurred under this scenario. You can compare this figure with the 5% hypothetical examples that appear in shareholder reports of other funds offered through a Contract.
| | | | | | | | | |
| Class 1 | | Beginning
Account Value 7/1/07 | | Ending Account Value 12/31/07 | | Fund-Level
Expenses Incurred
During Period*
7/1/07–12/31/07 |
Actual | | $ | 1,000 | | $ | 1,060.00 | | $ | 2.70 |
Hypothetical (5% return before expenses) | | $ | 1,000 | | $ | 1,022.58 | | $ | 2.65 |
*Expenses are calculated using the most recent six-month annualized expense ratio for the Fund’s Class 1 shares (0.52%), which does not include any ongoing expenses of the Contract for which the Fund is an investment option, multiplied by the average account value over the period, multiplied by 184/365 to reflect the one-half year period.
FUS-6
Franklin Templeton Variable Insurance Products Trust
Financial Highlights
Franklin U.S. Government Fund
| | | | | | | | | | | | | | | | | | | | |
| | | Year Ended December 31, | |
| Class 1 | | 2007 | | | 2006 | | | 2005 | | | 2004 | | | 2003 | |
| | | | |
Per share operating performance | | | | | | | | | | | | | | | | | | | | |
(for a share outstanding throughout the year) | | | | | | | | | | | | | | | | | | | | |
Net asset value, beginning of year | | $ | 12.69 | | | $ | 12.75 | | | $ | 12.99 | | | $ | 13.22 | | | $ | 13.61 | |
| | | | |
Income from investment operationsa: | | | | | | | | | | | | | | | | | | | | |
Net investment incomeb | | | 0.61 | | | | 0.59 | | | | 0.54 | | | | 0.51 | | | | 0.51 | |
Net realized and unrealized gains (losses) | | | 0.22 | | | | (0.07 | ) | | | (0.20 | ) | | | (0.05 | ) | | | (0.18 | ) |
| | | | |
Total from investment operations | | | 0.83 | | | | 0.52 | | | | 0.34 | | | | 0.46 | | | | 0.33 | |
| | | | |
Less distributions from net investment income | | | (0.63 | ) | | | (0.58 | ) | | | (0.58 | ) | | | (0.69 | ) | | | (0.72 | ) |
| | | | |
Net asset value, end of year | | $ | 12.89 | | | $ | 12.69 | | | $ | 12.75 | | | $ | 12.99 | | | $ | 13.22 | |
| | | | |
| | | | | |
Total returnc | | | 6.85% | | | | 4.31% | | | | 2.65% | | | | 3.71% | | | | 2.43% | |
Ratios to average net assets | | | | | | | | | | | | | | | | | | | | |
Expenses | | | 0.53% | e | | | 0.54% | e | | | 0.52% | e | | | 0.54% | e | | | 0.53% | |
Net investment income | | | 4.83% | | | | 4.67% | | | | 4.18% | | | | 3.90% | | | | 3.79% | |
| | | | | |
Supplemental data | | | | | | | | | | | | | | | | | | | | |
Net assets, end of year (000’s) | | $ | 167,700 | | | $ | 187,867 | | | $ | 217,165 | | | $ | 259,833 | | | $ | 311,864 | |
Portfolio turnover rate | | | 27.50% | | | | 23.46% | | | | 21.46% | | | | 75.93% | | | | 72.09% | |
Portfolio turnover rate excluding mortgage dollar rollsd | | | 27.50% | | | | 23.46% | | | | 15.62% | | | | 33.63% | | | | 23.26% | |
aThe amount shown for a share outstanding throughout the period may not correlate with the Statement of Operations for the period due to the timing of sales and repurchases of the Fund shares in relation to income earned and/or fluctuating market value of the investments of the Fund.
bBased on average daily shares outstanding.
cTotal return does not include any fees, charges or expenses imposed by the variable annuity and life insurance contracts for which the Franklin Templeton Variable Insurance Products Trust serves as an underlying investment vehicle.
dSee Note 1(c) regarding mortgage dollar rolls.
eBenefit of expense reduction rounds to less than 0.01%.
The accompanying notes are an integral part of these financial statements.
FUS-7
Franklin Templeton Variable Insurance Products Trust
Financial Highlights (continued)
Franklin U.S. Government Fund
| | | | | | | | | | | | | | | | | | | | |
| | | Year Ended December 31, | |
| Class 2 | | 2007 | | | 2006 | | | 2005 | | | 2004 | | | 2003 | |
| | | | |
Per share operating performance | | | | | | | | | | | | | | | | | | | | |
(for a share outstanding throughout the year) | | | | | | | | | | | | | | | | | | | | |
Net asset value, beginning of year | | $ | 12.52 | | | $ | 12.59 | | | $ | 12.84 | | | $ | 13.08 | | | $ | 13.49 | |
| | | | |
Income from investment operationsa: | | | | | | | | | | | | | | | | | | | | |
Net investment incomeb | | | 0.57 | | | | 0.55 | | | | 0.50 | | | | 0.47 | | | | 0.46 | |
Net realized and unrealized gains (losses) | | | 0.22 | | | | (0.07 | ) | | | (0.20 | ) | | | (0.04 | ) | | | (0.16 | ) |
| | | | |
Total from investment operations | | | 0.79 | | | | 0.48 | | | | 0.30 | | | | 0.43 | | | | 0.30 | |
| | | | |
Less distributions from net investment income | | | (0.60 | ) | | | (0.55 | ) | | | (0.55 | ) | | | (0.67 | ) | | | (0.71 | ) |
| | | | |
Net asset value, end of year | | $ | 12.71 | | | $ | 12.52 | | | $ | 12.59 | | | $ | 12.84 | | | $ | 13.08 | |
| | | | |
| | | | | |
Total returnc | | | 6.61% | | | | 4.02% | | | | 2.40% | | | | 3.48% | | | | 2.21% | |
Ratios to average net assets | | | | | | | | | | | | | | | | | | | | |
Expenses | | | 0.78% | e | | | 0.79% | e | | | 0.77% | e | | | 0.79% | e | | | 0.78% | |
Net investment income | | | 4.58% | | | | 4.42% | | | | 3.93% | | | | 3.65% | | | | 3.54% | |
| | | | | |
Supplemental data | | | | | | | | | | | | | | | | | | | | |
Net assets, end of year (000’s) | | $ | 379,386 | | | $ | 374,323 | | | $ | 379,662 | | | $ | 332,373 | | | $ | 240,047 | |
Portfolio turnover rate | | | 27.50% | | | | 23.46% | | | | 21.46% | | | | 75.93% | | | | 72.09% | |
Portfolio turnover rate excluding mortgage dollar rollsd | | | 27.50% | | | | 23.46% | | | | 15.62% | | | | 33.63% | | | | 23.26% | |
aThe amount shown for a share outstanding throughout the period may not correlate with the Statement of Operations for the period due to the timing of sales and repurchases of the Fund shares in relation to income earned and/or fluctuating market value of the investments of the Fund.
bBased on average daily shares outstanding.
cTotal return does not include any fees, charges or expenses imposed by the variable annuity and life insurance contracts for which the Franklin Templeton Variable Insurance Products Trust serves as an underlying investment vehicle.
dSee Note 1(c) regarding mortgage dollar rolls.
eBenefit of expense reduction rounds to less than 0.01%.
The accompanying notes are an integral part of these financial statements.
FUS-8
Franklin Templeton Variable Insurance Products Trust
Statement of Investments, December 31, 2007
| | | | | | |
| Franklin U.S. Government Fund | | Principal
Amount | | Value |
Long Term Investments 97.0% | | | | | | |
Mortgage-Backed Securities 77.5% | | | | | | |
aFederal Home Loan Mortgage Corp. (FHLMC) Adjustable Rate 0.1% | | | | | | |
FHLMC, 6.954%, 6/01/22 | | $ | 238,633 | | $ | 242,143 |
FHLMC, 7.151%, 2/01/19 | | | 165,707 | | | 168,096 |
| | | | | | |
| | | | | | 410,239 |
| | | | | | |
Federal Home Loan Mortgage Corp. (FHLMC) Fixed Rate 9.2% | | | | | | |
FHLMC Gold 15 Year, 6.50%, 6/01/08 - 7/01/08 | | | 23,644 | | | 23,795 |
FHLMC Gold 30 Year, 5.00%, 9/01/33 - 4/01/34 | | | 9,506,840 | | | 9,290,168 |
FHLMC Gold 30 Year, 5.00%, 6/01/37 | | | 6,886,821 | | | 6,720,880 |
FHLMC Gold 30 Year, 5.50%, 7/01/33 - 1/01/35 | | | 4,689,401 | | | 4,686,951 |
FHLMC Gold 30 Year, 5.50%, 11/01/34 | | | 10,140,979 | | | 10,133,532 |
FHLMC Gold 30 Year, 6.00%, 1/01/24 - 8/01/35 | | | 10,990,306 | | | 11,186,286 |
FHLMC Gold 30 Year, 6.50%, 11/01/23 - 5/01/35 | | | 4,358,373 | | | 4,508,928 |
FHLMC Gold 30 Year, 7.00%, 4/01/24 - 10/01/32 | | | 1,467,689 | | | 1,542,106 |
FHLMC Gold 30 Year, 7.50%, 12/01/22 - 5/01/24 | | | 79,014 | | | 84,550 |
FHLMC Gold 30 Year, 8.00%, 7/01/21 - 5/01/22 | | | 58,469 | | | 62,381 |
FHLMC Gold 30 Year, 8.50%, 7/01/21 - 7/01/31 | | | 2,075,976 | | | 2,235,194 |
FHLMC PC 30 Year, 8.00%, 1/01/17 - 9/01/17 | | | 18,929 | | | 20,016 |
FHLMC PC 30 Year, 8.50%, 9/01/20 | | | 3,261 | | | 3,499 |
| | | | | | |
| | | | | | 50,498,286 |
| | | | | | |
aFederal National Mortgage Association (FNMA) Adjustable Rate 0.5% | | | | | | |
FNMA, 6.777%, 3/01/20 | | | 204,565 | | | 212,170 |
FNMA, 6.873%, 1/01/18 | | | 1,579,882 | | | 1,595,458 |
FNMA, 6.947%, 9/01/18 | | | 499,157 | | | 505,282 |
FNMA, 7.00%, 2/01/19 | | | 227,090 | | | 229,058 |
FNMA, 7.194%, 7/01/19 | | | 243,650 | | | 245,867 |
| | | | | | |
| | | | | | 2,787,835 |
| | | | | | |
Federal National Mortgage Association (FNMA) Fixed Rate 14.0% | | | | | | |
FNMA 15 Year, 5.50%, 6/01/16 - 11/01/17 | | | 1,878,395 | | | 1,907,174 |
FNMA 15 Year, 6.00%, 8/01/17 - 9/01/17 | | | 1,877,577 | | | 1,925,008 |
FNMA 30 Year, 5.00%, 3/01/34 - 7/01/35 | | | 9,777,977 | | | 9,550,173 |
FNMA 30 Year, 5.50%, 12/01/32 - 8/01/35 | | | 17,818,324 | | | 17,828,400 |
FNMA 30 Year, 6.00%, 1/01/24 - 12/01/34 | | | 3,164,246 | | | 3,218,257 |
FNMA 30 Year, 6.00%, 2/01/36 | | | 8,168,509 | | | 8,297,980 |
FNMA 30 Year, 6.00%, 2/01/36 | | | 8,540,680 | | | 8,676,050 |
FNMA 30 Year, 6.00%, 3/01/36 | | | 14,331,617 | | | 14,558,775 |
FNMA 30 Year, 6.50%, 1/01/24 - 8/01/32 | | | 3,490,480 | | | 3,623,433 |
FNMA 30 Year, 7.50%, 4/01/23 - 8/01/25 | | | 164,227 | | | 175,792 |
FNMA 30 Year, 8.00%, 7/01/16 - 2/01/25 | | | 356,477 | | | 381,437 |
FNMA 30 Year, 8.50%, 10/01/19 - 8/01/21 | | | 6,932 | | | 7,449 |
FNMA 30 Year, 9.00%, 10/01/26 | | | 657,391 | | | 716,994 |
FNMA GL 30 Year, 8.00%, 8/01/19 - 6/01/20 | | | 74,635 | | | 80,161 |
FNMA PL 30 Year, 5.50%, 4/01/34 | | | 5,617,574 | | | 5,602,098 |
| | | | | | |
| | | | | | 76,549,181 |
| | | | | | |
Government National Mortgage Association (GNMA) Fixed Rate 53.7% | | | | | | |
GNMA I SF 30 Year, 5.00%, 6/15/30 - 9/15/36 | | | 34,722,817 | | | 34,232,017 |
GNMA I SF 30 Year, 5.50%, 11/15/28 - 6/15/37 | | | 46,624,806 | | | 46,990,823 |
GNMA I SF 30 Year, 5.50%, 4/15/37 | | | 9,744,112 | | | 9,817,554 |
GNMA I SF 30 Year, 6.00%, 11/15/23 - 4/15/37 | | | 26,757,008 | | | 27,424,544 |
GNMA I SF 30 Year, 6.00%, 1/15/37 | | | 5,365,735 | | | 5,495,046 |
FUS-9
Franklin Templeton Variable Insurance Products Trust
Statement of Investments, December 31, 2007 (continued)
| | | | | | |
| Franklin U.S. Government Fund | | Principal
Amount | | Value |
Long Term Investments (continued) | | | | | | |
Mortgage-Backed Securities (continued) | | | | | | |
Government National Mortgage Association (GNMA) Fixed Rate (continued) | | | | | | |
GNMA I SF 30 Year, 6.00%, 1/15/37 | | $ | 5,633,152 | | $ | 5,770,970 |
GNMA I SF 30 Year, 6.00%, 2/15/37 | | | 9,137,234 | | | 9,357,437 |
GNMA I SF 30 Year, 6.50%, 5/15/23 - 5/15/37 | | | 12,020,779 | | | 12,471,598 |
GNMA I SF 30 Year, 7.00%, 3/15/22 - 1/15/32 | | | 3,280,889 | | | 3,482,414 |
GNMA I SF 30 Year, 7.50%, 2/15/17 - 3/15/32 | | | 1,635,092 | | | 1,743,654 |
GNMA I SF 30 Year, 8.00%, 2/15/17 - 6/15/24 | | | 911,884 | | | 982,776 |
GNMA I SF 30 Year, 8.25%, 4/15/25 | | | 21,470 | | | 23,288 |
GNMA I SF 30 Year, 8.50%, 6/15/22 - 12/15/24 | | | 235,973 | | | 257,652 |
GNMA I SF 30 Year, 9.00%, 6/15/16 - 7/15/20 | | | 108,978 | | | 117,840 |
GNMA I SF 30 Year, 9.50%, 7/15/16 - 6/15/21 | | | 310,572 | | | 339,794 |
GNMA I SF 30 Year, 10.00%, 10/15/17 - 8/15/21 | | | 214,528 | | | 249,026 |
GNMA II SF 30 Year, 5.00%, 9/20/33 | | | 12,781,350 | | | 12,492,528 |
GNMA II SF 30 Year, 5.00%, 10/20/33 - 11/20/33 | | | 5,370,706 | | | 5,248,458 |
GNMA II SF 30 Year, 5.00%, 8/20/35 | | | 8,770,150 | | | 8,570,509 |
GNMA II SF 30 Year, 5.50%, 5/20/34 - 8/20/37 | | | 29,996,589 | | | 30,071,397 |
GNMA II SF 30 Year, 5.50%, 12/20/34 | | | 11,034,135 | | | 11,062,863 |
GNMA II SF 30 Year, 5.50%, 2/20/35 | | | 6,439,711 | | | 6,456,562 |
GNMA II SF 30 Year, 5.50%, 2/20/36 | | | 25,302,625 | | | 25,363,379 |
GNMA II SF 30 Year, 6.00%, 11/20/23 - 5/20/36 | | | 10,273,367 | | | 10,497,508 |
GNMA II SF 30 Year, 6.00%, 9/20/34 | | | 8,156,233 | | | 8,333,857 |
GNMA II SF 30 Year, 6.00%, 1/20/36 | | | 11,936,324 | | | 12,185,715 |
GNMA II SF 30 Year, 6.50%, 12/20/27 - 4/20/34 | | | 3,505,750 | | | 3,634,804 |
GNMA II SF 30 Year, 7.00%, 5/20/32 | | | 57,228 | | | 60,504 |
GNMA II SF 30 Year, 7.50%, 5/20/17 - 5/20/33 | | | 645,059 | | | 685,525 |
GNMA II SF 30 Year, 8.00%, 7/20/16 - 8/20/26 | | | 51,617 | | | 55,349 |
GNMA II SF 30 Year, 9.50%, 4/20/25 | | | 11,014 | | | 12,094 |
| | | | | | |
| | | | | | 293,487,485 |
| | | | | | |
Total Mortgage-Backed Securities (Cost $422,393,557) | | | | | | 423,733,026 |
| | | | | | |
U.S. Government and Agency Securities 19.5% | | | | | | |
FFCB, 4.45%, 8/27/10 | | | 15,000,000 | | | 15,323,745 |
FHLB, | | | | | | |
4.875%, 5/14/10 | | | 10,000,000 | | | 10,292,820 |
5.125%, 8/14/13 | | | 11,000,000 | | | 11,609,004 |
5.375%, 8/19/11 | | | 12,000,000 | | | 12,672,156 |
bFICO, | | | | | | |
15, Strip, 3/07/16 | | | 15,000,000 | | | 10,463,970 |
16, Strip, 10/05/10 | | | 4,745,000 | | | 4,319,454 |
HUD, 96-A, | | | | | | |
7.63%, 8/01/14 | | | 4,110,000 | | | 4,116,350 |
7.66%, 8/01/15 | | | 4,140,000 | | | 4,146,566 |
aSBA, FRN, | | | | | | |
7.35%, 6/25/19 | | | 480,118 | | | 472,499 |
7.625%, 3/25/18 | | | 786,413 | | | 804,029 |
SBA, PC, | | | | | | |
1995-20L, 1, 6.45%, 12/01/15 | | | 910,056 | | | 934,962 |
1996-20L, 1, 6.70%, 12/01/16 | | | 953,435 | | | 985,669 |
1997-20G, 1, 6.85%, 7/01/17 | | | 1,184,169 | | | 1,227,116 |
1998-20I, 1, 6.00%, 9/01/18 | | | 3,065,598 | | | 3,149,927 |
FUS-10
Franklin Templeton Variable Insurance Products Trust
Statement of Investments, December 31, 2007 (continued)
| | | | | | |
| Franklin U.S. Government Fund | | Principal
Amount | | Value |
Long Term Investments (continued) | | | | | | |
U.S. Government and Agency Securities (continued) | | | | | | |
TVA, | | | | | | |
5.88%, 4/01/36 | | $ | 10,000,000 | | $ | 11,528,290 |
zero cpn. to 4/15/12, 8.25% thereafter, 4/15/42 | | | 6,000,000 | | | 5,209,782 |
U.S. Treasury Note, | | | | | | |
3.75%, 5/15/08 | | | 1,000,000 | | | 1,001,485 |
4.75%, 5/15/14 | | | 8,000,000 | | | 8,509,376 |
| | | | | | |
Total U.S. Government and Agency Securities (Cost $99,255,397) | | | | | | 106,767,200 |
| | | | | | |
Total Long Term Investments (Cost $521,648,954) | | | | | | 530,500,226 |
| | | | | | |
Short Term Investment (Cost $14,350,597) 2.6% | | | | | | |
Repurchase Agreement 2.6% | | | | | | |
cJoint Repurchase Agreement, 3.773%, 1/02/08 (Maturity Value $14,353,605) | | | 14,350,597 | | | 14,350,597 |
ABN AMRO Bank NV, New York Branch (Maturity Value $1,412,395) | | | | | | |
Banc of America Securities LLC (Maturity Value $1,412,395) | | | | | | |
Barclays Capital Inc. (Maturity Value $650,505) | | | | | | |
BNP Paribas Securities Corp. (Maturity Value $1,412,395) | | | | | | |
Credit Suisse Securities (USA) LLC (Maturity Value $371,615) | | | | | | |
Deutsche Bank Securities Inc. (Maturity Value $1,412,395) | | | | | | |
Dresdner Kleinwort Wasserstein Securities LLC (Maturity Value $1,412,395) | | | | | | |
Goldman, Sachs & Co. (Maturity Value $1,709,658) | | | | | | |
Greenwich Capital Markets Inc. (Maturity Value $1,412,395) | | | | | | |
Lehman Brothers Inc. (Maturity Value $1,735,062) | | | | | | |
Merrill Lynch Government Securities Inc. (Maturity Value $1,412,395) | | | | | | |
Collateralized by U.S. Government Agency Securities, 3.00% - 6.25%, 1/15/08 - 11/14/12;
bU.S. Government Agency Discount Notes, 1/02/08 - 8/01/12; bU.S. Treasury Bill, 6/12/08;
and U.S. Treasury Notes, 3.25% - 4.625%, 3/31/08 - 8/15/10 | | | | | | |
| | | | | | |
Total Investments (Cost $535,999,551) 99.6% | | | | | | 544,850,823 |
Other Assets, less Liabilities 0.4% | | | | | | 2,235,252 |
| | | | | | |
Net Assets 100.0% | | | | | $ | 547,086,075 |
| | | | | | |
Selected Portfolio Abbreviations
FFCB - Federal Farm Credit Bank
FHLB - Federal Home Loan Bank
FICO - Financing Corp.
FRN - Floating Rate Note
GL - Government Loan
HUD - Housing and Urban Development
PC - Participation Certificate
PL - Project Loan
SBA - Small Business Administration
SF - Single Family
TVA - Tennessee Valley Authority
a | The coupon rate shown represents the rate at period end. |
b | The security is traded on a discount basis with no stated coupon rate. |
c | See Note 1(b) regarding joint repurchase agreement. |
The accompanying notes are an integral part of these financial statements.
FUS-11
Franklin Templeton Variable Insurance Products Trust
Financial Statements
Statement of Assets and Liabilities
December 31, 2007
| | | | |
| | | Franklin U.S.
Government Fund | |
Assets: | | | | |
Investments in securities: | | | | |
Cost - Unaffiliated issuers | | $ | 521,648,954 | |
Cost - Repurchase agreements | | | 14,350,597 | |
| | | | |
Total cost of investments | | $ | 535,999,551 | |
| | | | |
Value - Unaffiliated issuers | | $ | 530,500,226 | |
Value - Repurchase agreements | | | 14,350,597 | |
| | | | |
Total value of investments | | | 544,850,823 | |
Receivables: | | | | |
Investment securities sold | | | 17,708 | |
Capital shares sold | | | 126,983 | |
Interest | | | 3,248,913 | |
| | | | |
Total assets | | | 548,244,427 | |
| | | | |
Liabilities: | | | | |
Payables: | | | | |
Capital shares redeemed | | | 663,514 | |
Affiliates | | | 394,702 | |
Reports to shareholders | | | 58,620 | |
Accrued expenses and other liabilities | | | 41,516 | |
| | | | |
Total liabilities | | | 1,158,352 | |
| | | | |
Net assets, at value | | $ | 547,086,075 | |
| | | | |
Net assets consist of: | | | | |
Paid-in capital | | $ | 531,018,040 | |
Undistributed net investment income | | | 26,976,620 | |
Net unrealized appreciation (depreciation) | | | 8,851,272 | |
Accumulated net realized gain (loss) | | | (19,759,857 | ) |
| | | | |
Net assets, at value | | $ | 547,086,075 | |
| | | | |
Class 1: | | | | |
Net assets, at value | | $ | 167,700,322 | |
| | | | |
Shares outstanding | | | 13,007,634 | |
| | | | |
Net asset value and maximum offering price per share | | $ | 12.89 | |
| | | | |
Class 2: | | | | |
Net assets, at value | | $ | 379,385,753 | |
| | | | |
Shares outstanding | | | 29,853,131 | |
| | | | |
Net asset value and maximum offering price per share | | $ | 12.71 | |
| | | | |
The accompanying notes are an integral part of these financial statements.
FUS-12
Franklin Templeton Variable Insurance Products Trust
Financial Statements (continued)
Statement of Operations
for the year ended December 31, 2007
| | | | |
| | | Franklin U.S.
Government Fund | |
Investment income: | | | | |
Interest | | $ | 30,261,607 | |
| | | | |
Expenses: | | | | |
Management fees (Note 3a) | | | 2,790,208 | |
Distribution fees - Class 2 (Note 3c) | | | 970,933 | |
Unaffiliated transfer agent fees | | | 9,535 | |
Custodian fees (Note 4) | | | 9,824 | |
Reports to shareholders | | | 116,739 | |
Professional fees | | | 33,984 | |
Trustees’ fees and expenses | | | 2,464 | |
Other | | | 25,050 | |
| | | | |
Total expenses | | | 3,958,737 | |
Expense reductions (Note 4) | | | (1 | ) |
| | | | |
Net expenses | | | 3,958,736 | |
| | | | |
Net investment income | | | 26,302,871 | |
| | | | |
Realized and unrealized gains (losses): | | | | |
Net realized gain (loss) from investments | | | (209,663 | ) |
Net change in unrealized appreciation (depreciation) on investments | | | 10,101,095 | |
| | | | |
Net realized and unrealized gain (loss) | | | 9,891,432 | |
| | | | |
Net increase (decrease) in net assets resulting from operations | | $ | 36,194,303 | |
| | | | |
The accompanying notes are an integral part of these financial statements.
FUS-13
Franklin Templeton Variable Insurance Products Trust
Financial Statements (continued)
Statements of Changes in Net Assets
| | | | | | | | |
| | | Franklin U.S.
Government Fund | |
| | Year Ended December 31, | |
| | 2007 | | | 2006 | |
| | | | |
Increase (decrease) in net assets: | | | | | | | | |
Operations: | | | | | | | | |
Net investment income | | $ | 26,302,871 | | | $ | 25,671,937 | |
Net realized gain (loss) from investments | | | (209,663 | ) | | | 421 | |
Net change in unrealized appreciation (depreciation) on investments | | | 10,101,095 | | | | (2,945,389 | ) |
| | | | |
Net increase (decrease) in net assets resulting from operations | | | 36,194,303 | | | | 22,726,969 | |
| | | | |
Distributions to shareholders from: | | | | | | | | |
Net investment income: | | | | | | | | |
Class 1 | | | (8,563,032 | ) | | | (9,026,792 | ) |
Class 2 | | | (18,820,597 | ) | | | (16,056,330 | ) |
| | | | |
Total distributions to shareholders | | | (27,383,629 | ) | | | (25,083,122 | ) |
| | | | |
Capital share transactions: (Note 2) | | | | | | | | |
Class 1 | | | (23,075,720 | ) | | | (28,416,733 | ) |
Class 2 | | | (839,107 | ) | | | (3,863,133 | ) |
| | | | |
Total capital share transactions | | | (23,914,827 | ) | | | (32,279,866 | ) |
| | | | |
Net increase (decrease) in net assets | | | (15,104,153 | ) | | | (34,636,019 | ) |
Net assets: | | | | | | | | |
Beginning of year | | | 562,190,228 | | | | 596,826,247 | |
| | | | |
End of year | | $ | 547,086,075 | | | $ | 562,190,228 | |
| | | | |
Undistributed net investment income included in net assets: | | | | | | | | |
End of year | | $ | 26,976,620 | | | $ | 26,099,715 | |
| | | | |
The accompanying notes are an integral part of these financial statements.
FUS-14
Franklin Templeton Variable Insurance Products Trust
Notes to Financial Statements
Franklin U.S. Government Fund
1. ORGANIZATION AND SIGNIFICANT ACCOUNTING POLICIES
Franklin Templeton Variable Insurance Products Trust (Trust) is registered under the Investment Company Act of 1940, as amended, (1940 Act) as an open-end investment company, consisting of twenty-three separate funds. The Franklin U.S. Government Fund (Fund) included in this report is diversified. The financial statements of the remaining funds in the Trust are presented separately. Shares of the Fund are sold only to insurance company separate accounts to fund the benefits of variable life insurance policies or variable annuity contracts. As of December 31, 2007, 82.84% of the Fund’s shares were held through one insurance company. The Fund offers two classes of shares: Class 1 and Class 2. Each class of shares differs by its distribution fees, voting rights on matters affecting a single class and its exchange privilege.
The following summarizes the Fund’s significant accounting policies.
a. Security Valuation
Securities listed on a securities exchange or on the NASDAQ National Market System are valued at the last quoted sale price or the official closing price of the day, respectively. Over-the-counter securities and listed securities for which there is no reported sale are valued within the range of the most recent quoted bid and ask prices. Securities that trade in multiple markets or on multiple exchanges are valued according to the broadest and most representative market.
Government securities, mortgage pass-through securities, other mortgage-backed securities, collateralized mortgage obligations and asset-backed securities generally trade in the over-the-counter market rather than on a securities exchange. The Trust may utilize independent pricing services, quotations from bond dealers, and information with respect to bond and note transactions, to assist in determining a current market value for each security. The Trust’s pricing services may use valuation models or matrix pricing which considers information with respect to comparable bond and note transactions, quotations from bond dealers, or by reference to other securities that are considered comparable in such characteristics as rating, interest rate and maturity date, option adjusted spread models, prepayment projections, interest rate spreads and yield curves, to determine current value.
The Trust has procedures to determine the fair value of individual securities and other assets for which market prices are not readily available or which may not be reliably priced. Methods for valuing these securities may include: fundamental analysis, matrix pricing, discounts from market prices of similar securities, or discounts applied due to the nature and duration of restrictions on the disposition of the securities. Due to the inherent uncertainty of valuations of such securities, the fair values may differ significantly from the values that would have been used had a ready market for such investments existed. Occasionally, events occur between the time at which trading in a security is completed and the close of the NYSE that might call into question the availability (including the reliability) of the value of a portfolio security held by the Fund. If such an event occurs, the securities may be valued using fair value procedures, which may include the use of independent pricing services. All security valuation procedures are approved by the Trust’s Board of Trustees.
b. Joint Repurchase Agreement
The Fund may enter into a joint repurchase agreement whereby its uninvested cash balance is deposited into a joint cash account with other funds managed by the investment manager or an affiliate of the investment manager and is used to invest in one or more repurchase agreements. The value and face amount of the joint repurchase agreement are allocated to the funds based on their pro-rata interest. A repurchase agreement is accounted for as a loan by the fund to the seller, collateralized by securities which are delivered to the fund’s custodian. The market value, including accrued interest, of the initial collateralization is required to be at least 102% of the dollar amount invested by the funds, with the value of the underlying securities marked to market daily to maintain coverage of at least 100%. The joint repurchase agreement held by the Fund at year end had been entered into on December 31, 2007. The joint repurchase agreement is valued at cost.
FUS-15
Franklin Templeton Variable Insurance Products Trust
Notes to Financial Statements (continued)
Franklin U.S. Government Fund
1. ORGANIZATION AND SIGNIFICANT ACCOUNTING POLICIES (continued)
c. Mortgage Dollar Rolls
The Fund enters into mortgage dollar rolls, typically on a to-be announced basis. Mortgage dollar rolls are agreements between the fund and a financial institution to simultaneously sell and repurchase mortgage-backed securities at a future date. Gains or losses are realized on the initial sale, and the difference between the repurchase price and the sale price is recorded as an unrealized gain or loss to the fund upon entering into the mortgage dollar roll. In addition, the Fund may earn interest on the cash proceeds that are received from the initial sale. During the period between the sale and repurchase, the Fund is not entitled to principal and interest paid on the mortgage backed securities. The risks of mortgage dollar roll transactions include the potential inability of the counterparty to fulfill its obligations.
d. Income Taxes
No provision has been made for U.S. income taxes because it is the Fund’s policy to qualify as a regulated investment company under the Internal Revenue Code and to distribute to shareholders substantially all of its taxable income and net realized gains.
e. Security Transactions, Investment Income, Expenses and Distributions
Security transactions are accounted for on trade date. Realized gains and losses on security transactions are determined on a specific identification basis. Interest income and estimated expenses are accrued daily. Amortization of premium and accretion of discount on debt securities are included in interest income. Distributions to shareholders are recorded on the ex-dividend date and are determined according to income tax regulations (tax basis). Distributable earnings determined on a tax basis may differ from earnings recorded in accordance with accounting principles generally accepted in the United States of America. These differences may be permanent or temporary. Permanent differences are reclassified among capital accounts to reflect their tax character. These reclassifications have no impact on net assets or the results of operations. Temporary differences are not reclassified, as they may reverse in subsequent periods.
Common expenses incurred by the Trust are allocated among the funds based on the ratio of net assets of each fund to the combined net assets of the Trust. Fund specific expenses are charged directly to the fund that incurred the expense.
Realized and unrealized gains and losses and net investment income, other than class specific expenses, are allocated daily to each class of shares based upon the relative proportion of net assets of each class. Differences in per share distributions, by class, are generally due to differences in class specific expenses.
f. Accounting Estimates
The preparation of financial statements in accordance with accounting principles generally accepted in the United States of America requires management to make estimates and assumptions that affect the reported amounts of assets and liabilities at the date of the financial statements and the amounts of income and expenses during the reporting period. Actual results could differ from those estimates.
g. Guarantees and Indemnifications
Under the Trust’s organizational documents, its officers and trustees are indemnified by the Trust against certain liabilities arising out of the performance of their duties to the Trust. Additionally, in the normal course of business, the Trust, on behalf of the Fund, enters into contracts with service providers that contain general indemnification clauses. The Trust’s maximum exposure under these arrangements is unknown as this would involve future claims that may be made against the Trust that have not yet occurred. Currently, the Trust expects the risk of loss to be remote.
FUS-16
Franklin Templeton Variable Insurance Products Trust
Notes to Financial Statements (continued)
Franklin U.S. Government Fund
2. SHARES OF BENEFICIAL INTEREST
At December 31, 2007, there were an unlimited number of shares authorized (without par value). Transactions in the Fund’s shares were as follows:
| | | | | | | | | | | | | | |
| | | Year Ended December 31, | |
| | | 2007 | | | 2006 | |
| Class 1 Shares: | | Shares | | | Amount | | | Shares | | | Amount | |
Shares sold | | 191,572 | | | $ | 2,420,954 | | | 161,350 | | | $ | 2,036,467 | |
Shares issued in reinvestment of distributions | | 707,689 | | | | 8,563,032 | | | 745,400 | | | | 9,026,792 | |
Shares redeemed | | (2,694,671 | ) | | | (34,059,706 | ) | | (3,135,712 | ) | | | (39,479,992 | ) |
| | | | |
Net increase (decrease) | | (1,795,410 | ) | | $ | (23,075,720 | ) | | (2,228,962 | ) | | $ | (28,416,733 | ) |
| | | | |
| Class 2 Shares: | | | | | | | | | | | | |
Shares sold | | 6,944,293 | | | $ | 86,774,866 | | | 3,669,008 | | | $ | 45,693,189 | |
Shares issued in reinvestment of distributions | | 1,576,264 | | | | 18,820,597 | | | 1,341,381 | | | | 16,056,330 | |
Shares redeemed | | (8,564,549 | ) | | | (106,434,570 | ) | | (5,278,337 | ) | | | (65,612,652 | ) |
| | | | |
Net increase (decrease) | | (43,992 | ) | | $ | (839,107 | ) | | (267,948 | ) | | $ | (3,863,133 | ) |
| | | | |
3. TRANSACTIONS WITH AFFILIATES
Franklin Resources, Inc. is the holding company for various subsidiaries that together are referred to as Franklin Templeton Investments. Certain officers and trustees of the Trust are also officers and/or directors of the following subsidiaries:
| | |
| Subsidiary | | Affiliation |
Franklin Advisers, Inc. (Advisers) | | Investment manager |
Franklin Templeton Services, LLC (FT Services) | | Administrative manager |
Franklin Templeton Distributors, Inc. (Distributors) | | Principal underwriter |
Franklin Templeton Investor Services, LLC (Investor Services) | | Transfer agent |
a. Management Fees
The Fund pays an investment management fee to Advisers based on the average daily net assets of the Fund as follows:
| | |
| Annualized Fee Rate | | Net Assets |
| 0.625% | | Up to and including $100 million |
| 0.500% | | Over $100 million, up to and including $250 million |
| 0.450% | | Over $250 million, up to and including $10 billion |
| 0.440% | | Over $10 billion, up to and including $12.5 billion |
| 0.420% | | Over $12.5 billion, up to and including $15 billion |
| 0.400% | | In excess of $15 billion |
Effective January 1, 2008, the Fund will pay fees based on the average daily net assets of the Fund as follows:
| | |
| Annualized Fee Rate | | Net Assets |
| 0.625% | | Up to and including $100 million |
| 0.500% | | Over $100 million, up to and including $250 million |
| 0.450% | | Over $250 million, up to and including $7.5 billion |
| 0.440% | | Over $7.5 billion, up to and including $10 billion |
| 0.430% | | Over $10 billion, up to and including $12.5 billion |
| 0.420% | | Over $12.5 billion, up to and including $15 billion |
| 0.400% | | In excess of $15 billion |
FUS-17
Franklin Templeton Variable Insurance Products Trust
Notes to Financial Statements (continued)
Franklin U.S. Government Fund
3. TRANSACTIONS WITH AFFILIATES (continued)
b. Administrative Fees
Under an agreement with Advisers, FT Services provides administrative services to the Fund. The fee is paid by Advisers based on average daily net assets, and is not an additional expense of the Fund.
c. Distribution Fees
The Fund’s Board of Trustees has adopted a distribution plan for Class 2 shares pursuant to Rule 12b-1 under the 1940 Act. Under the Fund’s compensation distribution plan, the Fund pays Distributors for costs incurred in connection with the servicing, sale and distribution of the Fund’s shares up to 0.35% per year of its average daily net assets. The Board of Trustees has agreed to limit the current rate to 0.25% per year.
d. Transfer Agent Fees
Investor Services, under terms of an agreement, performs shareholder servicing for the Fund and is not paid by the Fund for the services.
4. EXPENSE OFFSET ARRANGEMENT
The Fund has entered into an arrangement with its custodian whereby credits realized as a result of uninvested cash balances are used to reduce a portion of the Fund’s custodian expenses. During the year ended December 31, 2007, the custodian fees were reduced as noted in the Statement of Operations.
5. INCOME TAXES
The Fund has reviewed the tax positions taken on federal income tax returns, for each of the three open tax years and as of December 31, 2007 and has determined that no provision for income tax is required in the Fund’s financial statements.
For tax purposes, capital losses may be carried over to offset future capital gains, if any. At December 31, 2007, the capital loss carryforwards were as follows:
| | | |
Capital loss carryforwards expiring in: | | | |
2008 | | $ | 5,752,213 |
2011 | | | 4,558,723 |
2012 | | | 3,331,578 |
2013 | | | 2,102,640 |
2014 | | | 1,618,397 |
2015 | | | 2,329,071 |
| | | |
| | $ | 19,692,622 |
| | | |
For tax purposes, realized capital losses, occurring subsequent to October 31, may be deferred and treated as occurring on the first day of the following fiscal year. At December 31, 2007, the Fund deferred realized capital losses of $65,879.
The tax character of distributions paid during the years ended December 31, 2007 and 2006, was as follows:
| | | | | | |
| | | 2007 | | 2006 |
Distributions paid from ordinary income | | $ | 27,383,629 | | $ | 25,083,122 |
| | | | | | |
FUS-18
Franklin Templeton Variable Insurance Products Trust
Notes to Financial Statements (continued)
Franklin U.S. Government Fund
5. INCOME TAXES (continued)
At December 31, 2007, the cost of investments, net unrealized appreciation (depreciation), and undistributed ordinary income for income tax purposes were as follows:
| | | | |
Cost of investments | | $ | 536,485,554 | |
| | | | |
| |
Unrealized appreciation | | $ | 11,372,757 | |
Unrealized depreciation | | | (3,007,488 | ) |
| | | | |
Net unrealized appreciation (depreciation) | | $ | 8,365,269 | |
| | | | |
Distributable earnings – undistributed ordinary income | | $ | 27,461,267 | |
| | | | |
Net investment income differs for financial statement and tax purposes primarily due to differing treatments of mortgage dollar rolls, paydown losses and bond discounts and premiums.
Net realized gains (losses) differ for financial statement and tax purposes primarily due to differing treatments of wash sales, mortgage dollar rolls, paydown losses and bond discounts and premiums.
6. INVESTMENT TRANSACTIONS
Purchases and sales of investments (excluding short term securities) for the year ended December 31, 2007, aggregated $146,473,311 and $158,925,945, respectively.
7. REGULATORY AND LITIGATION MATTERS
As part of various investigations by a number of federal, state, and foreign regulators and governmental entities, including the Securities and Exchange Commission (“SEC”), relating to certain practices in the mutual fund industry, including late trading, market timing and marketing support payments to securities dealers who sell fund shares (“marketing support”), Franklin Resources, Inc. and certain of its subsidiaries (collectively, the “Company”), entered into settlements with certain of those regulators and governmental entities. Specifically, the Company entered into settlements with the SEC, among others, concerning market timing and marketing support.
On June 6, 2007, the SEC posted for public comment the proposed plan of distribution for the market timing settlement. Once the SEC approves the final plan of distribution, disbursements of settlement monies will be made promptly to individuals who were shareholders of the designated funds during the relevant period, in accordance with the terms and conditions of the settlement and plan.
In addition, the Company, as well as most of the mutual funds within Franklin Templeton Investments and certain current or former officers, Company directors, fund directors, and employees, have been named in private lawsuits (styled as shareholder class actions, or as derivative actions on behalf of either the named funds or Franklin Resources, Inc.). The lawsuits relate to the industry practices referenced above.
The Company and fund management believe that the claims made in each of the private lawsuits referenced above are without merit and intend to defend against them vigorously. The Company cannot predict with certainty the eventual outcome of these lawsuits, nor whether they will have a material negative impact on the Company. If it is determined that the Company bears responsibility for any unlawful or inappropriate conduct that caused losses to the Fund, it is committed to making the Trust or its shareholders whole, as appropriate.
FUS-19
Franklin Templeton Variable Insurance Products Trust
Notes to Financial Statements (continued)
Franklin U.S. Government Fund
8. NEW ACCOUNTING PRONOUNCEMENT
In September 2006, the Financial Accounting Standards Board (FASB) issued FASB Statement No. 157, “Fair Value Measurement” (SFAS 157), which defines fair value, establishes a framework for measuring fair value, and expands disclosures about fair value measurements. SFAS 157 is effective for fiscal years beginning after November 15, 2007, and interim periods within those fiscal years. The Trust believes the adoption of SFAS 157 will have no material impact on its financial statements.
FUS-20
Franklin Templeton Variable Insurance Products Trust
Franklin U.S. Government Fund
Report of Independent Registered Public Accounting Firm
To the Board of Trustees and Shareholders of
Franklin Templeton Variable Insurance Products Trust
In our opinion, the accompanying statement of assets and liabilities, including the statement of investments, and the related statements of operations and of changes in net assets and the financial highlights present fairly, in all material respects, the financial position of Franklin U.S. Government Fund (one of the funds constituting Franklin Templeton Variable Insurance Products Trust, hereafter referred to as the “Fund”) at December 31, 2007, the results of its operations for the year then ended, the changes in its net assets for each of the two years in the period then ended and the financial highlights for each of the five years in the period then ended, in conformity with accounting principles generally accepted in the United States of America. These financial statements and financial highlights (hereafter referred to as “financial statements”) are the responsibility of the Fund’s management. Our responsibility is to express an opinion on these financial statements based on our audits. We conducted our audits of these financial statements in accordance with the standards of the Public Company Accounting Oversight Board (United States). Those standards require that we plan and perform the audit to obtain reasonable assurance about whether the financial statements are free of material misstatement. An audit includes examining, on a test basis, evidence supporting the amounts and disclosures in the financial statements, assessing the accounting principles used and significant estimates made by management, and evaluating the overall financial statement presentation. We believe that our audits, which included confirmation of securities at December 31, 2007 by correspondence with the custodian and brokers, provide a reasonable basis for our opinion.
PricewaterhouseCoopers LLP
San Francisco, California
February 14, 2008
FUS-21
FRANKLIN ZERO COUPON FUND 2010
This annual report for Franklin Zero Coupon Fund 2010 covers the fiscal year ended December 31, 2007.
Performance Summary as of 12/31/07
Average annual total return of Class 1 shares represents the average annual change in value, assuming reinvestment of dividends and capital gains. Average returns smooth out variations in returns, which can be significant; they are not the same as year-by-year results.
Periods ended 12/31/07
| | | | | | |
| | | 1-Year | | 5-Year | | 10-Year |
Average Annual Total Return | | +8.62% | | +4.21% | | +6.40% |
Total Return Index Comparison for Hypothetical $10,000 Investment (1/1/98–12/31/07)
The graph below shows the change in value of a hypothetical $10,000 investment in the Fund over the indicated period and includes reinvestment of any income or distributions. The Fund’s performance is compared to the performance of the Merrill Lynch (ML) 5-Year and 2-Year Zero Coupon Bond Indexes, as well as the Consumer Price Index (CPI). One cannot invest directly in an index, nor is an index representative of the Fund’s portfolio. Please see Important Notes to Performance Information preceding the Fund Summaries.
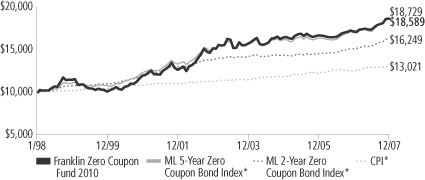
*Source: Standard & Poor’s Micropal. Please see Index Descriptions following the Fund Summaries.
Franklin Zero Coupon Fund 2010 – Class 1
Performance reflects the Fund’s Class 1 operating expenses, but does not include any contract fees, expenses or sales charges. If they had been included, performance would be lower. These charges and deductions, particularly for variable life policies, can have a significant effect on contract values and insurance benefits. See the contract prospectus for a complete description of these expenses, including sales charges.
Performance data represent past performance, which does not guarantee future results. Investment return and principal value will fluctuate, and you may have a gain or loss when you sell your shares. Current performance may differ from figures shown.
FZ10-1
Fund Goal and Main Investments: Franklin Zero Coupon Fund 2010 seeks as high an investment return as is consistent with capital preservation. The Fund normally invests at least 80% of its net assets in zero coupon debt securities and normally invests primarily to predominantly in U.S. Treasury issued stripped securities and stripped securities issued by the U.S. government, or its agencies and authorities.
Performance Overview
You can find the Fund’s one-year total return in the Performance Summary. For comparison, the Fund’s benchmarks, the ML 5-Year Zero Coupon Bond Index and ML 2-Year Zero Coupon Bond Index, had returns of +10.42% and +7.76% for the same period.1
Economic and Market Overview
The U.S. economy grew at a moderate but uneven pace for the year ended December 31, 2007. After starting 2007 with first quarter gross domestic product (GDP) growth of 0.6% annualized, the economy accelerated to a strong second quarter growth rate of 3.8% annualized, fueled by a surge in exports. In the third quarter, GDP growth advanced at a 4.9% annualized rate, the fastest pace in four years. For most of the reporting period, consumer spending and personal income supported economic expansion, but signs of a slowing economy became evident as a number of indicators reflected a housing market correction, financial market strains and softening business and consumer spending, as well as upward inflation pressures from increasing food, energy and commodity prices and a weaker dollar. In the fourth quarter, GDP growth slowed to an estimated 0.6% annualized rate.
Oil prices exhibited continued volatility, reaching a historical high in November. Core inflation, which excludes food and energy costs, rose modestly for the year, signaling that inflation risk remains. For December 2007, core inflation had a 12-month increase of 2.4%.2 The Federal Reserve Board’s (Fed’s) preferred measure of inflation, the core personal consumption expenditures price index, reported a 12-month increase of 2.2%.3
As investor uncertainty continued in the latter half of 2007, the Fed remained committed to act in an effort to restore normalcy to U.S. financial markets. The Fed cut the discount rate (the Fed’s interest rate charged to member banks) four times, bringing the rate to 4.75%. It
1. Source: Standard & Poor’s Micropal. One cannot invest directly in an index, nor is an index representative of the Fund’s portfolio. Please see Index Descriptions following the Fund Summaries.
2. Source: Bureau of Labor Statistics.
3. Source: Bureau of Economic Analysis.
Fund Risks: Changes in interest rates affect the prices of the Fund’s debt securities. If interest rates rise, the value of the Fund’s debt securities will fall and so will the Fund’s share price. Because zero coupon securities do not pay interest, their market value can fall more dramatically when interest rates rise than interest-paying securities of similar maturities. The Fund’s prospectus also includes a description of the main investment risks.
FZ10-2
also lowered the federal funds target rate three times. Minutes released from its December meeting, in which the Fed lowered the federal funds target rate to 4.25%, cited an uncertain outlook for economic growth and inflation and the need for the committee to be “exceptionally alert to economic and financial developments.”
Over the period, investors sought relative safety in short-term U.S. Treasuries, Treasury yields declined and the yield curve steepened. Short-term, two- and five-year yields declined significantly, with the two-year bill yielding 3.05% at the end of December, down from 4.82% a year earlier. The 10-year U.S. Treasury note ended December yielding 4.04%, compared with 4.71% at the beginning of the period.
Investment Strategy
In selecting investments for the Fund, we seek to keep the Fund’s average duration to within 12 months of its maturity Target Date. Duration is a measure of the length of an investment, taking into account the timing and amount of any interest payments and the principal repayment. Duration is also a measure of a bond’s price sensitivity to interest rates. We analyze securities using both proprietary and nonproprietary research to seek and identify attractive investment opportunities.
Manager’s Discussion
During the 12 months ended December 31, 2007, fixed income markets were characterized by increasing volatility, uncertainty and a general re-pricing of risk. During this period of heightened risk aversion, U.S. Treasuries generally outperformed other fixed income sectors as investors sought safety from volatile markets.
The Fund was substantially invested in zero coupon and stripped securities issued by government-related entities and other high-quality issuers, which generally outperformed lower-quality sectors such as corporate high yield bonds. However, within the government-related sector, Treasuries generally outperformed other issues. In some cases, the somewhat less-liquid zero coupon and stripped securities underperformed more liquid coupon-bearing bonds of similar durations.
During the review period, we remained committed to our investment process as we sought high-quality investments with what we believed were attractive valuations. Consistent with our investment strategy, we also continued to emphasize zero coupon and stripped securities with maturities near the Fund’s target date.
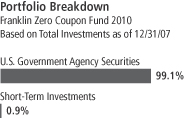
The dollar value, number of shares or principal amount, and names of all portfolio holdings are listed in the Fund’s Statement of Investments.
FZ10-3
Thank you for your participation in Franklin Zero Coupon Fund 2010. We look forward to serving your future investment needs.
The foregoing information reflects our analysis, opinions and portfolio holdings as of December 31, 2007, the end of the reporting period. The way we implement our main investment strategies and the resulting portfolio holdings may change depending on factors such as market and economic conditions. These opinions may not be relied upon as investment advice or an offer for a particular security. The information is not a complete analysis of every aspect of any market, country, industry, security or the Fund. Statements of fact are from sources considered reliable, but the investment manager makes no representation or warranty as to their completeness or accuracy. Although historical performance is no guarantee of future results, these insights may help you understand our investment management philosophy.
FZ10-4
Fund Expenses
As an investor in a variable insurance contract (Contract) that indirectly provides for investment in an underlying mutual fund, you can incur transaction and/or ongoing expenses at both the Fund level and the Contract level.
| • | | Transaction expenses can include sales charges (loads) on purchases, redemption fees, surrender fees, transfer fees and premium taxes. |
| • | | Ongoing expenses can include management fees, distribution and service (12b-1) fees, contract fees, annual maintenance fees, mortality and expense risk fees and other fees and expenses. All mutual funds and Contracts have some types of ongoing expenses. |
The expenses shown in the table are meant to highlight ongoing expenses at the Fund level only and do not include ongoing expenses at the Contract level, or transaction expenses at either the Fund or Contract level. While the Fund does not have transaction expenses, if the transaction and ongoing expenses at the Contract level were included, the expenses shown below would be higher. You should consult your Contract prospectus or disclosure document for more information.
The table shows Fund-level ongoing expenses and can help you understand these expenses and compare them with those of other mutual funds offered through the Contract. The table assumes a $1,000 investment held for the six months indicated. Please refer to the Fund prospectus for additional information on operating expenses.
Actual Fund Expenses
The first line (Actual) of the table provides actual account values and expenses. The “Ending Account Value” is derived from the Fund’s actual return, which includes the effect of ongoing Fund expenses, but does not include the effect of ongoing Contract expenses.
You can estimate the Fund-level expenses you incurred during the period by following these steps. Of course, your account value and expenses will differ from those in this illustration:
| 1. | Divide your account value by $1,000. |
If an account had an $8,600 value, then $8,600 ÷ $1,000 = 8.6.
| 2. | Multiply the result by the number under the heading “Fund-Level Expenses Incurred During Period.” |
If Fund-Level Expenses Incurred During Period were $7.50, then 8.6 x $7.50 = $64.50.
In this illustration, the estimated expenses incurred this period at the Fund level are $64.50.
Franklin Zero Coupon Fund 2010 – Class 1
FZ10-5
Hypothetical Example for Comparison with Other Mutual Funds
Information in the second line (Hypothetical) of the table can help you compare ongoing expenses of the Fund with those of other mutual funds offered through the Contract. This information may not be used to estimate the actual ending account balance or expenses you incurred during the period. The hypothetical “Ending Account Value” is based on the Fund’s actual expense ratio and an assumed 5% annual rate of return before expenses, which does not represent the Fund’s actual return. The figure under the heading “Fund-Level Expenses Incurred During Period” shows the hypothetical expenses your account would have incurred under this scenario. You can compare this figure with the 5% hypothetical examples that appear in shareholder reports of other funds offered through a Contract.
| | | | | | | | | |
| Class 1 | | Beginning
Account Value 7/1/07 | | Ending Account Value 12/31/07 | | Fund-Level
Expenses Incurred
During Period*
7/1/07–12/31/07 |
Actual | | $ | 1,000 | | $ | 1,071.00 | | $ | 3.34 |
Hypothetical (5% return before expenses) | | $ | 1,000 | | $ | 1,021.98 | | $ | 3.26 |
*Expenses are calculated using the most recent six-month annualized expense ratio for the Fund’s Class 1 shares (0.64%), which does not include any ongoing expenses of the Contract for which the Fund is an investment option, multiplied by the average account value over the period, multiplied by 184/365 to reflect the one-half year period.
FZ10-6
Franklin Templeton Variable Insurance Products Trust
Financial Highlights
Franklin Zero Coupon Fund – 2010
| | | | | | | | | | | | | | | | | | | | |
| | | Year Ended December 31, | |
| Class 1 | | 2007 | | | 2006 | | | 2005 | | | 2004 | | | 2003 | |
| | | | |
Per share operating performance | | | | | | | | | | | | | | | | | | | | |
(for a share outstanding throughout the year) | | | | | | | | | | | | | | | | | | | | |
Net asset value, beginning of year | | $ | 15.80 | | | $ | 16.02 | | | $ | 16.49 | | | $ | 16.55 | | | $ | 16.61 | |
| | | | |
Income from investment operationsa: | | | | | | | | | | | | | | | | | | | | |
Net investment incomeb | | | 0.78 | | | | 0.77 | | | | 0.80 | | | | 0.81 | | | | 0.82 | |
Net realized and unrealized gains (losses) | | | 0.52 | | | | (0.36 | ) | | | (0.54 | ) | | | (0.08 | ) | | | (0.20 | ) |
| | | | |
Total from investment operations | | | 1.30 | | | | 0.41 | | | | 0.26 | | | | 0.73 | | | | 0.62 | |
| | | | |
Less distributions from: | | | | | | | | | | | | | | | | | | | | |
Net investment income | | | (0.80 | ) | | | (0.63 | ) | | | (0.72 | ) | | | (0.79 | ) | | | (0.68 | ) |
Net realized gains | | | — | | | | — | | | | (0.01 | ) | | | — | | | | — | |
| | | | |
Total distributions | | | (0.80 | ) | | | (0.63 | ) | | | (0.73 | ) | | | (0.79 | ) | | | (0.68 | ) |
| | | | |
Net asset value, end of year | | $ | 16.30 | | | $ | 15.80 | | | $ | 16.02 | | | $ | 16.49 | | | $ | 16.55 | |
| | | | |
| | | | | |
Total returnc | | | 8.62% | | | | 2.71% | | | | 1.54% | | | | 4.72% | | | | 3.59% | |
Ratios to average net assets | | | | | | | | | | | | | | | | | | | | |
Expenses | | | 0.66% | d | | | 0.67% | d | | | 0.69% | | | | 0.68% | | | | 0.68% | |
Net investment income | | | 4.94% | | | | 4.89% | | | | 4.93% | | | | 4.91% | | | | 4.93% | |
| | | | | | | | | | | | | | | | | | | | |
Supplemental data | | | | | | | | | | | | | | | | | | | | |
Net assets, end of year (000’s) | | $ | 95,583 | | | $ | 93,184 | | | $ | 101,555 | | | $ | 78,978 | | | $ | 72,833 | |
Portfolio turnover rate | | | 4.49% | | | | 2.00% | | | | —% | | | | 11.74% | | | | 38.37% | |
aThe amount shown for a share outstanding throughout the period may not correlate with the Statement of Operations for the period due to the timing of sales and repurchases of the Fund shares in relation to income earned and/or fluctuating market value of the investments of the Fund.
bBased on average daily shares outstanding.
cTotal return does not include any fees, charges or expenses imposed by the variable annuity and life insurance contracts for which the Franklin Templeton Variable Insurance Products Trust serves as an underlying investment vehicle.
dBenefit of expense reduction rounds to less than 0.01%.
The accompanying notes are an integral part of these financial statements.
FZ10-7
Franklin Templeton Variable Insurance Products Trust
Financial Highlights (continued)
Franklin Zero Coupon Fund – 2010
| | | | | | | | | | | | | | | | | | | | |
| | | Year Ended December 31, | |
| Class 2 | | 2007 | | | 2006 | | | 2005 | | | 2004 | | | 2003f | |
| | | | |
Per share operating performance | | | | | | | | | | | | | | | | | | | | |
(for a share outstanding throughout the year) | | | | | | | | | | | | | | | | | | | | |
Net asset value, beginning of year | | $ | 15.72 | | | $ | 15.96 | | | $ | 16.43 | | | $ | 16.52 | | | $ | 17.39 | |
| | | | |
Income from investment operationsa: | | | | | | | | | | | | | | | | | | | | |
Net investment incomeb | | | 0.73 | | | | 0.73 | | | | 0.76 | | | | 0.77 | | | | 0.49 | |
Net realized and unrealized gains (losses) | | | 0.53 | | | | (0.37 | ) | | | (0.54 | ) | | | (0.08 | ) | | | (0.68 | ) |
| | | | |
Total from investment operations | | | 1.26 | | | | 0.36 | | | | 0.22 | | | | 0.69 | | | | (0.19 | ) |
| | | | |
Less distributions from: | | | | | | | | | | | | | | | | | | | | |
Net investment income | | | (0.76 | ) | | | (0.60 | ) | | | (0.68 | ) | | | (0.78 | ) | | | (0.68 | ) |
Net realized gains | | | — | | | | — | | | | (0.01 | ) | | | — | | | | — | |
| | | | |
Total distributions | | | (0.76 | ) | | | (0.60 | ) | | | (0.69 | ) | | | (0.78 | ) | | | (0.68 | ) |
| | | | |
Net asset value, end of year | | $ | 16.22 | | | $ | 15.72 | | | $ | 15.96 | | | $ | 16.43 | | | $ | 16.52 | |
| | | | |
| | | | | |
Total returnc | | | 8.41% | | | | 2.39% | | | | 1.32% | | | | 4.45% | | | | 3.40% | |
Ratios to average net assetsd | | | | | | | | | | | | | | | | | | | | |
Expenses | | | 0.91% | e | | | 0.92% | e | | | 0.94% | | | | 0.93% | | | | 0.93% | |
Net investment income | | | 4.69% | | | | 4.64% | | | | 4.68% | | | | 4.66% | | | | 4.68% | |
| | | | | |
Supplemental data | | | | | | | | | | | | | | | | | | | | |
Net assets, end of year (000’s) | | $ | 17,424 | | | $ | 25,982 | | | $ | 24,040 | | | $ | 14,251 | | | $ | 11,649 | |
Portfolio turnover rate | | | 4.49% | | | | 2.00% | | | | —% | | | | 11.74% | | | | 38.37% | |
aThe amount shown for a share outstanding throughout the period may not correlate with the Statement of Operations for the period due to the timing of sales and repurchases of the Fund shares in relation to income earned and/or fluctuating market value of the investments of the Fund.
bBased on average daily shares outstanding.
cTotal return does not include any fees, charges or expenses imposed by the variable annuity and life insurance contracts for which the Franklin Templeton Variable Insurance Products Trust serves as an underlying investment vehicle. Total return is not annualized for periods less than one year.
dRatios are annualized for periods less than one year.
eBenefit of expense reduction rounds to less than 0.01%.
fFor the period May 12, 2003 (effective date) to December 31, 2003.
The accompanying notes are an integral part of these financial statements.
FZ10-8
Franklin Templeton Variable Insurance Products Trust
Statement of Investments, December 31, 2007
| | | | | | | |
| Franklin Zero Coupon Fund – 2010 | | Principal
Amount | | Value | |
U.S. Government and Agency Securities 99.6% | | | | | | | |
FHLMC, Strip,
7/15/10 | | $ | 11,150,000 | | $ | 10,230,169 | |
1/15/11 | | | 10,629,000 | | | 9,568,247 | |
FICO, Strip,
19, 6/06/10 | | | 9,800,000 | | | 9,021,890 | |
A, 8/08/10 | | | 7,000,000 | | | 6,409,907 | |
FNMA, Strip,
8/12/09 | | | 1,975,000 | | | 1,870,615 | |
8/01/10 | | | 8,250,000 | | | 7,471,365 | |
8/12/10 | | | 1,230,000 | | | 1,125,927 | |
International Bank for Reconstruction & Development (Supranationala),
2, zero cpn., 2/15/11 | | | 500,000 | | | 445,647 | |
zero cpn., 2/15/11 | | | 1,392,000 | | | 1,240,683 | |
zero cpn., 2/15/12 | | | 2,800,000 | | | 2,385,936 | |
zero cpn., 2/15/13 | | | 3,287,000 | | | 2,678,080 | |
zero cpn., 8/15/13 | | | 4,100,000 | | | 3,263,522 | |
Resolution Funding, Strip, 10/15/10 | | | 10,000,000 | | | 9,168,650 | |
TVA, Strip,
1/01/10 | | | 412,000 | | | 381,523 | |
4/15/10 | | | 12,000,000 | | | 11,108,928 | |
10/15/10 | | | 1,320,000 | | | 1,200,341 | |
1/15/11 | | | 10,669,000 | | | 9,604,255 | |
10/15/11 | | | 7,295,000 | | | 6,371,847 | |
U.S. Treasury, Strip,
2/15/11 | | | 1,000,000 | | | 908,981 | |
2/15/11 | | | 20,000,000 | | | 18,107,121 | |
| | | | | | | |
Total U.S. Government and Agency Securities (Cost $104,458,610) | | | | | | 112,563,634 | |
| | | | | | | |
Short Term Investment (Cost $965,081) 0.9% | | | | | | | |
Repurchase Agreements 0.9% | | | | | | | |
bJoint Repurchase Agreement, 3.773%, 1/02/08 (Maturity Value $965,283) | | | 965,081 | | | 965,081 | |
ABN AMRO Bank NV, New York Branch (Maturity Value $94,984) | | | | | | | |
Banc of America Securities LLC (Maturity Value $94,984) | | | | | | | |
Barclays Capital Inc. (Maturity Value $43,747) | | | | | | | |
BNP Paribas Securities Corp. (Maturity Value $94,984) | | | | | | | |
Credit Suisse Securities (USA) LLC (Maturity Value $24,991) | | | | | | | |
Deutsche Bank Securities Inc. (Maturity Value $94,984) | | | | | | | |
Dresdner Kleinwort Wasserstein Securities LLC (Maturity Value $94,984) | | | | | | | |
Goldman, Sachs & Co. (Maturity Value $114,975) | | | | | | | |
Greenwich Capital Markets Inc. (Maturity Value $94,984) | | | | | | | |
Lehman Brothers Inc. (Maturity Value $116,682) | | | | | | | |
Merrill Lynch Government Securities Inc. (Maturity Value $94,984) | | | | | | | |
Collateralized by U.S. Government Agency Securities, 3.00% - 6.25%, 1/15/08 - 11/14/12; cU.S. Government Agency Discount Notes, 1/02/08 - 8/01/12; cU.S. Treasury Bill, 6/12/08; and U.S. Treasury Notes, 3.25% - 4.625%, 3/31/08 - 8/15/10 | | | | | | | |
| | | | | | | |
| | | | | | | |
Total Investments (Cost $105,423,691) 100.5% | | | | | | 113,528,715 | |
Other Assets, less Liabilities (0.5)% | | | | | | (521,643 | ) |
| | | | | | | |
Net Assets 100.0% | | | | | $ | 113,007,072 | |
| | | | | | | |
The accompanying notes are an integral part of these financial statements.
FZ10-9
Franklin Templeton Variable Insurance Products Trust
Statement of Investments, December 31, 2007 (continued)
Selected Portfolio Abbreviations
FHLMC - Federal Home Loan Mortgage Corp.
FICO - Financing Corp.
FNMA - Federal National Mortgage Association
TVA - Tennessee Valley Authority
aA | supranational organization is an entity formed by two or more central governments through international treaties. |
bSee | Note 1(b) regarding joint repurchase agreement. |
cThe | security is traded on a discount basis with no stated coupon rate. |
The accompanying notes are an integral part of these financial statements.
FZ10-10
Franklin Templeton Variable Insurance Products Trust
Financial Statements
Statement of Assets and Liabilities
December 31, 2007
| | | | |
| | | Franklin
Zero Coupon
Fund - 2010 | |
Assets: | | | | |
Investments in securities: | | | | |
Cost - Unaffiliated issuers | | $ | 104,458,610 | |
Cost - Repurchase agreements | | | 965,081 | |
| | | | |
Total cost of investments | | $ | 105,423,691 | |
| | | | |
Value - Unaffiliated issuers | | $ | 112,563,634 | |
Value - Repurchase agreements | | | 965,081 | |
| | | | |
Total value of investments | | | 113,528,715 | |
Receivables for capital shares sold | | | 228,156 | |
| | | | |
Total assets | | | 113,756,871 | |
| | | | |
Liabilities: | | | | |
Payables: | | | | |
Capital shares redeemed | | | 637,732 | |
Affiliates | | | 66,386 | |
Accrued expenses and other liabilities | | | 45,681 | |
| | | | |
Total liabilities | | | 749,799 | |
| | | | |
Net assets, at value | | $ | 113,007,072 | |
| | | | |
Net assets consist of: | | | | |
Paid-in capital | | $ | 99,807,811 | |
Undistributed net investment income | | | 5,713,683 | |
Net unrealized appreciation (depreciation) | | | 8,105,024 | |
Accumulated net realized gain (loss) | | | (619,446 | ) |
| | | | |
Net assets, at value | | $ | 113,007,072 | |
| | | | |
Class 1: | | | | |
Net assets, at value | | $ | 95,582,660 | |
| | | | |
Shares outstanding | | | 5,863,273 | |
| | | | |
Net asset value and maximum offering price per share | | $ | 16.30 | |
| | | | |
Class 2: | | | | |
Net assets, at value | | $ | 17,424,412 | |
| | | | |
Shares outstanding | | | 1,074,200 | |
| | | | |
Net asset value and maximum offering price per share | | $ | 16.22 | |
| | | | |
The accompanying notes are an integral part of these financial statements.
FZ10-11
Franklin Templeton Variable Insurance Products Trust
Financial Statements (continued)
Statement of Operations
for the year ended December 31, 2007
| | | | |
| | | Franklin
Zero Coupon
Fund - 2010 | |
Investment income: | | | | |
Interest | | $ | 6,538,261 | |
| | | | |
Expenses: | | | | |
Management fees (Note 3a) | | | 709,457 | |
Distribution fees - Class 2 (Note 3c) | | | 56,629 | |
Unaffiliated transfer agent fees | | | 2,041 | |
Custodian fees (Note 4) | | | 3,228 | |
Reports to shareholders | | | 21,988 | |
Professional fees | | | 24,125 | |
Trustees’ fees and expenses | | | 517 | |
Other | | | 7,260 | |
| | | | |
Total expenses | | | 825,245 | |
Expense reductions (Note 4) | | | (285 | ) |
| | | | |
Net expenses | | | 824,960 | |
| | | | |
Net investment income | | | 5,713,301 | |
| | | | |
Realized and unrealized gains (losses): | | | | |
Net realized gain (loss) from investments | | | (155,461 | ) |
Net change in unrealized appreciation (depreciation) on investments | | | 3,846,601 | |
| | | | |
Net realized and unrealized gain (loss) | | | 3,691,140 | |
| | | | |
Net increase (decrease) in net assets resulting from operations | | $ | 9,404,441 | |
| | | | |
The accompanying notes are an integral part of these financial statements.
FZ10-12
Franklin Templeton Variable Insurance Products Trust
Financial Statements (continued)
Statements of Changes in Net Assets
| | | | | | | | |
| | | Franklin Zero Coupon Fund - 2010 | |
| | | Year Ended December 31, | |
| | | 2007 | | | 2006 | |
| | | | |
Increase (decrease) in net assets: | | | | | | | | |
Operations: | | | | | | | | |
Net investment income | | $ | 5,713,301 | | | $ | 5,933,892 | |
Net realized gain (loss) from investments | | | (155,461 | ) | | | (403,673 | ) |
Net change in unrealized appreciation (depreciation) on investments | | | 3,846,601 | | | | (2,390,175 | ) |
| | | | |
Net increase (decrease) in net assets resulting from operations | | | 9,404,441 | | | | 3,140,044 | |
| | | | |
Distributions to shareholders from net investment income: | | | | | | | | |
Class 1 | | | (4,640,419 | ) | | | (3,866,133 | ) |
Class 2 | | | (1,293,395 | ) | | | (946,094 | ) |
| | | | |
Total distributions to shareholders | | | (5,933,814 | ) | | | (4,812,227 | ) |
| | | | |
Capital share transactions: (Note 2) | | | | | | | | |
Class 1 | | | (767,210 | ) | | | (7,018,065 | ) |
Class 2 | | | (8,861,810 | ) | | | 2,260,490 | |
| | | | |
Total capital share transactions | | | (9,629,020 | ) | | | (4,757,575 | ) |
| | | | |
Net increase (decrease) in net assets | | | (6,158,393 | ) | | | (6,429,758 | ) |
Net assets: | | | | | | | | |
Beginning of year | | | 119,165,465 | | | | 125,595,223 | |
| | | | |
End of year | | $ | 113,007,072 | | | $ | 119,165,465 | |
| | | | |
Undistributed net investment income included in net assets: | | | | | | | | |
End of year | | $ | 5,713,683 | | | $ | 5,934,196 | |
| | | | |
The accompanying notes are an integral part of these financial statements.
FZ10-13
Franklin Templeton Variable Insurance Products Trust
Notes to Financial Statements
Franklin Zero Coupon Fund – 2010
1. ORGANIZATION AND SIGNIFICANT ACCOUNTING POLICIES
Franklin Templeton Variable Insurance Products Trust (Trust) is registered under the Investment Company Act of 1940, as amended, (1940 Act) as an open-end investment company, consisting of twenty-three separate funds. The Franklin Zero Coupon Fund – 2010 (Fund) included in this report is diversified. The financial statements of the remaining funds in the Trust are presented separately. Shares of the Fund are sold only to insurance company separate accounts to fund the benefits of variable life insurance policies or variable annuity contracts. As of December 31, 2007, 84.52% of the Fund’s shares were held through one insurance company. The Fund offers two classes of shares: Class 1 and Class 2. Each class of shares differs by its distribution fees, voting rights on matters affecting a single class and its exchange privilege.
The following summarizes the Fund’s significant accounting policies.
a. Security Valuation
Securities listed on a securities exchange or on the NASDAQ National Market System are valued at the last quoted sale price or the official closing price of the day, respectively. Over-the-counter securities and listed securities for which there is no reported sale are valued within the range of the most recent quoted bid and ask prices. Securities that trade in multiple markets or on multiple exchanges are valued according to the broadest and most representative market.
Government securities generally trade in the over-the-counter market rather than on a securities exchange. The Trust may utilize independent pricing services, quotations from bond dealers, and information with respect to bond and note transactions, to assist in determining a current market value for each security. The Trust’s pricing services may use valuation models or matrix pricing which considers information with respect to comparable bond and note transactions, quotations from bond dealers, or by reference to other securities that are considered comparable in such characteristics as rating, interest rate and maturity date, option adjusted spread models, prepayment projections, interest rate spreads and yield curves, to determine current value.
The Trust has procedures to determine the fair value of individual securities and other assets for which market prices are not readily available or which may not be reliably priced. Methods for valuing these securities may include: fundamental analysis, matrix pricing, discounts from market prices of similar securities, or discounts applied due to the nature and duration of restrictions on the disposition of the securities. Due to the inherent uncertainty of valuations of such securities, the fair values may differ significantly from the values that would have been used had a ready market for such investments existed. Occasionally, events occur between the time at which trading in a security is completed and the close of the NYSE that might call into question the availability (including the reliability) of the value of a portfolio security held by the Fund. If such an event occurs, the securities may be valued using fair value procedures, which may include the use of independent pricing services. All security valuation procedures are approved by the Trust’s Board of Trustees.
b. Joint Repurchase Agreement
The Fund may enter into a joint repurchase agreement whereby its uninvested cash balance is deposited into a joint cash account with other funds managed by the investment manager or an affiliate of the investment manager and is used to invest in one or more repurchase agreements. The value and face amount of the joint repurchase agreement are allocated to the funds based on their pro-rata interest. A repurchase agreement is accounted for as a loan by the fund to the seller, collateralized by securities which are delivered to the fund’s custodian. The market value, including accrued interest, of the initial collateralization is required to be at least 102% of the dollar amount invested by the funds, with the value of the underlying securities marked to market daily to maintain coverage of at least 100%. The joint repurchase agreement held by the Fund at year end had been entered into on December 31, 2007. The joint repurchase agreement is valued at cost.
c. Income Taxes
No provision has been made for U.S. income taxes because it is the Fund’s policy to qualify as a regulated investment company under the Internal Revenue Code and to distribute to shareholders substantially all of its taxable income and net realized gains.
FZ10-14
Franklin Templeton Variable Insurance Products Trust
Notes to Financial Statements (continued)
Franklin Zero Coupon Fund – 2010
1. ORGANIZATION AND SIGNIFICANT ACCOUNTING POLICIES (continued)
d. Security Transactions, Investment Income, Expenses and Distributions
Security transactions are accounted for on trade date. Realized gains and losses on security transactions are determined on a specific identification basis. Interest income and estimated expenses are accrued daily. Amortization of premium and accretion of discount on debt securities are included in interest income. Distributions to shareholders are recorded on the ex-dividend date and are determined according to income tax regulations (tax basis). Distributable earnings determined on a tax basis may differ from earnings recorded in accordance with accounting principles generally accepted in the United States of America. These differences may be permanent or temporary. Permanent differences are reclassified among capital accounts to reflect their tax character. These reclassifications have no impact on net assets or the results of operations. Temporary differences are not reclassified, as they may reverse in subsequent periods.
Common expenses incurred by the Trust are allocated among the funds based on the ratio of net assets of each fund to the combined net assets of the Trust. Fund specific expenses are charged directly to the fund that incurred the expense.
Realized and unrealized gains and losses and net investment income, other than class specific expenses, are allocated daily to each class of shares based upon the relative proportion of net assets of each class. Differences in per share distributions, by class, are generally due to differences in class specific expenses.
e. Accounting Estimates
The preparation of financial statements in accordance with accounting principles generally accepted in the United States of America requires management to make estimates and assumptions that affect the reported amounts of assets and liabilities at the date of the financial statements and the amounts of income and expenses during the reporting period. Actual results could differ from those estimates.
f. Guarantees and Indemnifications
Under the Trust’s organizational documents, its officers and trustees are indemnified by the Trust against certain liabilities arising out of the performance of their duties to the Trust. Additionally, in the normal course of business, the Trust, on behalf of the Fund, enters into contracts with service providers that contain general indemnification clauses. The Trust’s maximum exposure under these arrangements is unknown as this would involve future claims that may be made against the Trust that have not yet occurred. Currently, the Trust expects the risk of loss to be remote.
2. SHARES OF BENEFICIAL INTEREST
At December 31, 2007, there were an unlimited number of shares authorized (without par value). Transactions in the Fund’s shares were as follows:
| | | | | | | | | | | | | | |
| | | Year Ended December 31, | |
| | | 2007 | | | 2006 | |
| Class 1 Shares: | | Shares | | | Amount | | | Shares | | | Amount | |
Shares sold | | 1,055,550 | | | $ | 16,696,122 | | | 621,605 | | | $ | 9,815,380 | |
Shares issued in reinvestment of distributions | | 307,110 | | | | 4,640,419 | | | 254,686 | | | | 3,866,133 | |
Shares redeemed | | (1,397,779 | ) | | | (22,103,751 | ) | | (1,317,302 | ) | | | (20,699,578 | ) |
| | | | |
Net increase (decrease) | | (35,119 | ) | | $ | (767,210 | ) | | (441,011 | ) | | $ | (7,018,065 | ) |
| | | | |
| Class 2 Shares: | | | | | | | | | | | | |
Shares sold | | 246,915 | | | $ | 3,891,533 | | | 378,878 | | | $ | 5,936,370 | |
Shares issued in reinvestment of distributions | | 85,940 | | | | 1,293,395 | | | 62,531 | | | | 946,094 | |
Shares redeemed | | (911,051 | ) | | | (14,046,738 | ) | | (295,758 | ) | | | (4,621,974 | ) |
| | | | |
Net increase (decrease) | | (578,196 | ) | | $ | (8,861,810 | ) | | 145,651 | | | $ | 2,260,490 | |
| | | | |
FZ10-15
Franklin Templeton Variable Insurance Products Trust
Notes to Financial Statements (continued)
Franklin Zero Coupon Fund – 2010
3. TRANSACTIONS WITH AFFILIATES
Franklin Resources, Inc. is the holding company for various subsidiaries that together are referred to as Franklin Templeton Investments. Certain officers and trustees of the Trust are also officers and/or directors of the following subsidiaries:
| | |
| Subsidiary | | Affiliation |
Franklin Advisers, Inc. (Advisers) | | Investment manager |
Franklin Templeton Services, LLC (FT Services) | | Administrative manager |
Franklin Templeton Distributors, Inc. (Distributors) | | Principal underwriter |
Franklin Templeton Investor Services, LLC (Investor Services) | | Transfer agent |
a. Management Fees
The Fund pays an investment management fee to Advisers based on the average daily net assets of the Fund as follows:
| | |
| Annualized Fee Rate | | Net Assets |
| 0.625% | | Up to and including $100 million |
| 0.500% | | Over $100 million, up to and including $250 million |
| 0.450% | | Over $250 million, up to and including $10 billion |
| 0.440% | | Over $10 billion, up to and including $12.5 billion |
| 0.420% | | Over $12.5 billion, up to and including $15 billion |
| 0.400% | | In excess of $15 billion |
Effective January 1, 2008, the Fund will pay fees based on the average daily net assets of the Fund as follows:
| | |
| Annualized Fee Rate | | Net Assets |
| 0.625% | | Up to and including $100 million |
| 0.500% | | Over $100 million, up to and including $250 million |
| 0.450% | | Over $250 million, up to and including $7.5 billion |
| 0.440% | | Over $7.5 billion, up to and including $10 billion |
| 0.430% | | Over $10 billion, up to and including $12.5 billion |
| 0.420% | | Over $12.5 billion, up to and including $15 billion |
| 0.400% | | In excess of $15 billion |
b. Administrative Fees
Under an agreement with Advisers, FT Services provides administrative services to the Fund. The fee is paid by Advisers based on average daily net assets, and is not an additional expense of the Fund.
c. Distribution Fees
The Fund’s Board of Trustees has adopted a distribution plan for Class 2 shares pursuant to Rule 12b-1 under the 1940 Act. Under the Fund’s compensation distribution plan, the Fund pays Distributors for costs incurred in connection with the servicing, sale and distribution of the Fund’s shares up to 0.35% per year of its average daily net assets. The Board of Trustees has agreed to limit the current rate to 0.25% per year.
d. Transfer Agent Fees
Investor Services, under terms of an agreement, performs shareholder servicing for the Fund and is not paid by the Fund for the services.
FZ10-16
Franklin Templeton Variable Insurance Products Trust
Notes to Financial Statements (continued)
Franklin Zero Coupon Fund – 2010
4. EXPENSE OFFSET ARRANGEMENT
The Fund has entered into an arrangement with its custodian whereby credits realized as a result of uninvested cash balances are used to reduce a portion of the Fund’s custodian expenses. During the year ended December 31, 2007, the custodian fees were reduced as noted in the Statement of Operations.
5. INCOME TAXES
The Fund has reviewed the tax positions taken on federal income tax returns, for each of the three open tax years and as of December 31, 2007 and has determined that no provision for income tax is required in the Fund’s financial statements.
For tax purposes, capital losses may be carried over to offset future capital gains, if any. At December 31, 2007, the capital loss carryforwards were as follows:
| | | |
Capital loss carryforwards expiring in: | | | |
2014 | | $ | 331,371 |
2015 | | | 222,565 |
| | | |
| | | $553,936 |
| | | |
The tax character of distributions paid during the years ended December 31, 2007 and 2006, was as follows:
| | | | | | |
| | | 2007 | | 2006 |
Distributions paid from ordinary income | | $ | 5,933,814 | | $ | 4,812,227 |
| | | |
At December 31, 2007, the cost of investments, net unrealized appreciation (depreciation) and undistributed ordinary income for income tax purposes were as follows:
| | | | |
Cost of investments | | $ | 105,488,463 | |
| | | | |
| |
Unrealized appreciation | | $ | 8,161,611 | |
Unrealized depreciation | | | (121,359 | ) |
| | | | |
Net unrealized appreciation (depreciation) | | $ | 8,040,252 | |
| | | | |
Distributable earnings – undistributed ordinary income | | $ | 5,712,942 | |
| | | | |
Net investment income differs for financial statement and tax purposes primarily due to differing treatment of bond discounts.
Net realized gains (losses) differ for financial statement and tax purposes primarily due to differing treatment of wash sales.
6. INVESTMENT TRANSACTIONS
Purchases and sales of investments (excluding short term securities) for the year ended December 31, 2007, aggregated $5,213,030 and $20,612,115, respectively.
FZ10-17
Franklin Templeton Variable Insurance Products Trust
Notes to Financial Statements (continued)
Franklin Zero Coupon Fund – 2010
7. REGULATORY AND LITIGATION MATTERS
As part of various investigations by a number of federal, state, and foreign regulators and governmental entities, including the Securities and Exchange Commission (“SEC”), relating to certain practices in the mutual fund industry, including late trading, market timing and marketing support payments to securities dealers who sell fund shares (“marketing support”), Franklin Resources, Inc. and certain of its subsidiaries (collectively, the “Company”), entered into settlements with certain of those regulators and governmental entities. Specifically, the Company entered into settlements with the SEC, among others, concerning market timing and marketing support.
On June 6, 2007, the SEC posted for public comment the proposed plan of distribution for the market timing settlement. Once the SEC approves the final plan of distribution, disbursements of settlement monies will be made promptly to individuals who were shareholders of the designated funds during the relevant period, in accordance with the terms and conditions of the settlement and plan.
In addition, the Company, as well as most of the mutual funds within Franklin Templeton Investments and certain current or former officers, Company directors, fund directors, and employees, have been named in private lawsuits (styled as shareholder class actions, or as derivative actions on behalf of either the named funds or Franklin Resources, Inc.). The lawsuits relate to the industry practices referenced above.
The Company and fund management believe that the claims made in each of the private lawsuits referenced above are without merit and intend to defend against them vigorously. The Company cannot predict with certainty the eventual outcome of these lawsuits, nor whether they will have a material negative impact on the Company. If it is determined that the Company bears responsibility for any unlawful or inappropriate conduct that caused losses to the Fund, it is committed to making the Trust or its shareholders whole, as appropriate.
8. NEW ACCOUNTING PRONOUNCEMENT
In September 2006, the Financial Accounting Standards Board (FASB) issued FASB Statement No. 157, “Fair Value Measurement” (SFAS 157), which defines fair value, establishes a framework for measuring fair value, and expands disclosures about fair value measurements. SFAS 157 is effective for fiscal years beginning after November 15, 2007, and interim periods within those fiscal years. The Trust believes the adoption of SFAS 157 will have no material impact on its financial statements.
FZ10-18
Franklin Templeton Variable Insurance Products Trust
Franklin Zero Coupon Fund – 2010
Report of Independent Registered Public Accounting Firm
To the Board of Trustees and Shareholders of Franklin Templeton Variable Insurance Products Trust
In our opinion, the accompanying statement of assets and liabilities, including the statement of investments, and the related statements of operations and of changes in net assets and the financial highlights present fairly, in all material respects, the financial position of Franklin Zero Coupon Fund – 2010 (one of the funds constituting Franklin Templeton Variable Insurance Products Trust, hereafter referred to as the “Fund”) at December 31, 2007, the results of its operations for the year then ended, the changes in its net assets for each of the two years in the period then ended and the financial highlights for each of the periods presented, in conformity with accounting principles generally accepted in the United States of America. These financial statements and financial highlights (hereafter referred to as “financial statements”) are the responsibility of the Fund’s management. Our responsibility is to express an opinion on these financial statements based on our audits. We conducted our audits of these financial statements in accordance with the standards of the Public Company Accounting Oversight Board (United States). Those standards require that we plan and perform the audit to obtain reasonable assurance about whether the financial statements are free of material misstatement. An audit includes examining, on a test basis, evidence supporting the amounts and disclosures in the financial statements, assessing the accounting principles used and significant estimates made by management, and evaluating the overall financial statement presentation. We believe that our audits, which included confirmation of securities at December 31, 2007 by correspondence with the custodian and brokers, provide a reasonable basis for our opinion.
PricewaterhouseCoopers LLP
San Francisco, California
February 14, 2008
FZ10-19
MUTUAL DISCOVERY SECURITIES FUND
This annual report for Mutual Discovery Securities Fund covers the fiscal year ended December 31, 2007.
Performance Summary as of 12/31/07
Average annual total return of Class 1 shares represents the average annual change in value, assuming reinvestment of dividends and capital gains. Average returns smooth out variations in returns, which can be significant; they are not the same as year-by-year results.
Periods ended 12/31/07
| | | | | | |
| | | 1-Year | | 5-Year | | 10-Year |
Average Annual Total Return | | +12.17% | | +19.76% | | +11.31% |
Total Return Index Comparison for Hypothetical $10,000 Investment (1/1/98–12/31/07)
The graph below shows the change in value of a hypothetical $10,000 investment in the Fund over the indicated period and includes reinvestment of any income or distributions. The Fund’s performance is compared to the performance of the Standard & Poor’s 500 Index (S&P 500) and the Morgan Stanley Capital International (MSCI) World Index. One cannot invest directly in an index, nor is an index representative of the Fund’s portfolio. Please see Important Notes to Performance Information preceding the Fund Summaries.
*Source: Standard & Poor’s Micropal. Please see Index Descriptions following the Fund Summaries.
Mutual Discovery Securities Fund – Class 1
Performance reflects the Fund’s Class 1 operating expenses, but does not include any contract fees, expenses or sales charges. If they had been included, performance would be lower. These charges and deductions, particularly for variable life policies, can have a significant effect on contract values and insurance benefits. See the contract prospectus for a complete description of these expenses, including sales charges.
Performance data represent past performance, which does not guarantee future results. Investment return and principal value will fluctuate, and you may have a gain or loss when you sell your shares. Current performance may differ from figures shown.
MD-1
Fund Goal and Main Investments: Mutual Discovery Securities Fund seeks capital appreciation. The Fund normally invests primarily in U.S. and foreign equity securities that the manager believes are undervalued. The Fund also invests, to a lesser extent, in risk arbitrage securities and distressed companies.
Performance Overview
You can find the Fund’s one-year total return in the Performance Summary. The Fund outperformed its benchmarks, the S&P 500 and the MSCI World Index, which returned +5.49% and +9.57% for the same period.1
Economic and Market Overview
In spite of elevated energy prices and widespread fears of contagion from the deteriorating U.S. housing situation, the global economy remained resilient in 2007. Consumer and corporate demand strength, particularly in China and other developing economies, generally favorable employment and accommodative monetary policies continued to underpin the current expansionary period that began in 2002.
These factors also contributed to the strength of global equity markets during 2007. However, concerns about slower growth and declining asset quality surfaced in the first quarter. These were initially centered on the U.S. subprime mortgage market but spread in August to global capital markets. Difficulties in assessing risk and the value of collateral in the structured finance industry contributed to declining risk appetite among lenders and investors. The private equity industry, which relies on the availability of cheap credit, played a pivotal role in several large and high-profile acquisitions and helped boost merger and acquisition activity in the first half of the year. This was an important driver of equity performance, but as liquidity dried up in the second half of the year, significantly slower money flows from private equity weighed on market performance. However, global merger and acquisition activity still reached record levels. The staggering $4.5 trillion of deals announced in 2007 eclipsed the previous record from 2006 by 24%.2
1. Source: Standard & Poor’s Micropal. One cannot invest directly in an index, nor is an index representative of the Fund’s portfolio. Please see Index Descriptions following the Fund Summaries.
2. Source: “For Deal Makers, Tale of Two Halves,” The Wall Street Journal, 1/2/08.
Fund Risks: The Fund’s investments in stocks offer the potential for long-term gains but can be subject to short-term price fluctuations. Investments in companies involved in mergers, liquidations, reorganizations and distressed bankruptcy, which may include defaulted debt, involve higher credit and other risks. Foreign investing, especially in emerging markets, involves additional risks, including currency fluctuations, economic instability, market volatility, and political and social instability. Smaller and midsize company securities involve special risks, such as relatively small revenues, limited product lines and small market share. The Fund’s prospectus also includes a description of the main investment risks.
MD-2
To alleviate the credit crunch and restore investor confidence, the world’s major central banks infused capital into the system, and the U.S. Federal Reserve Board reduced its target interest rate by a full percentage point. However, credit and equity markets continued to face headwinds as write-downs and losses from subprime mortgage financing affected many large financial institutions toward the end of the year, and equity prices remained volatile.
For the year, however, global and non-U.S. equity markets registered the fifth consecutive year of double-digit total returns, making this an exceptionally strong period for investors in global equities. Broad-based stock performance by European and Asian shares at least doubled that of U.S. stocks, while emerging market equity returns more than tripled those in developed markets. Led by the BRIC countries, Brazil, Russia, India and China, emerging market economies continued to grow at accelerated rates, supporting elevated prices for oil and other commodities. At the same time, investment inflows from developed economies continued to underpin equity prices in emerging markets. In addition, U.S. dollar weakness versus the currencies of many major trading partners enhanced equity returns for U.S.-based investors holding stocks denominated in these currencies.
Investment Strategy
At Mutual Series, we are committed to our distinctive value approach to investing. Our major investment strategy is investing in undervalued stocks. When selecting undervalued equities, we are attracted to fundamentally strong companies with healthy balance sheets, high-quality assets, substantial free cash flow and shareholder-oriented management teams and whose stocks are trading at discounts to our assessment of the companies’ intrinsic or business value. We also look for asset rich companies whose shares may be trading at depressed levels due to concerns over short-term earnings disappointments, litigation, management strategy or other perceived negatives. While the vast majority of our undervalued equity investments are made in publicly traded companies globally, we may invest occasionally in privately held companies as well.
We complement this more traditional investment strategy with two others. One is distressed investing, which is complex and can take many forms. The most common distressed investment the Fund undertakes is the purchase of financially troubled or bankrupt companies’ debt at a substantial discount to face value. After the financially distressed company is reorganized, often in bankruptcy court, the old debt is typically replaced with new securities issued by the financially stronger company.

MD-3
The other piece of our investment strategy is participating in arbitrage situations, another highly specialized field. When companies announce proposed mergers or takeovers, commonly referred to as “deals,” the target company may trade at a discount to the bid it ultimately accepts. One form of arbitrage involves purchasing the target company’s stock when it is trading below the value it would likely receive in a deal. In keeping with our commitment to a relatively conservative investment approach, we typically focus our arbitrage efforts on announced deals, and eschew rumored deals or other situations we consider relatively risky.
In addition, we will generally seek to hedge the Fund’s currency exposure when we deem it advantageous for our shareholders.
Manager’s Discussion
Among the Fund’s top contributors to performance in 2007 were KT&G, a South Korea-based cigarette manufacturer; Berkshire Hathaway, the well-known investment conglomerate; and German securities exchange platform provider Deutsche Boerse.
Shares of KT&G appreciated 41% in local currency during 2007, due largely to the company’s strong operating performance. Each division of KT&G reported positive news in 2007. The company’s domestic tobacco sales and operating margins expanded due to increased average selling prices for a pack of cigarettes. Overseas sales and revenues registered high double-digit increases. KT&G owns a 100% stake in KGC, South Korea’s leading red ginseng maker, which has a dominant position of more than 60% market share. Over the past five years, KGC’s sales and earnings have grown at 20% and 27% compounded annual growth rates, respectively. KT&G has announced that between 2006 and 2008 it will return 2.8 trillion won (the local currency) to shareholders.
Berkshire Hathaway stock appreciated 29% as the company benefited from a lack of catastrophe losses in 2007, resulting in large insurance profits after higher-than-average losses in 2004 and 2005 resulted in a favorable pricing environment for U.S. property insurers. Within Berkshire’s non-insurance operations, the company benefited from an
Top 10 Sectors/Industries
Mutual Discovery Securities Fund
Based on Equity Securities 12/31/07
| | |
| | | % of Total
Net Assets |
| |
| Tobacco | | 13.2% |
| |
| Commercial Banks | | 7.5% |
| |
| Food Products | | 6.6% |
| |
| Insurance | | 5.7% |
| |
| Energy Equipment & Services | | 5.2% |
| |
| Media | | 4.9% |
| |
| Diversified Financial Services | | 4.9% |
| |
| Beverages | | 4.3% |
| |
| Industrial Conglomerates | | 3.7% |
| |
| Real Estate | | 2.5% |
MD-4
improving contribution from its utility business, Mid-American Energy. Most significantly for its share price value, Berkshire’s cash stockpile of almost $40 billion, along with CEO Warren Buffett’s willingness to wait until a bargain emerged before deploying this capital, positioned the company as a safe haven for investors who perceived 2007’s subprime mortgage crisis as an investment opportunity rather than a threat. By the end of 2007 Berkshire management had successfully kept its capital mostly in reserve.
The Fund’s investment in Deutsche Boerse rose 97% in local currency as cash equity trading volumes surged 63%, the company resumed its buyback of shares, and investors appeared to recognize hidden potential embedded in the business. The exchange industry grew as it benefited from higher volumes in different product classes and generally beneficial pricing trends. Deutsche Boerse also tapped into the structural potential of its business by announcing future cost cutting of over 100 million euros per year to enhance profitability. We increased our holdings in Deutsche Boerse throughout 2007 when we found the price attractive.
Although the Fund performed well in 2007, some of our positions detracted from performance. Among them were Belgium-based Fortis, whose operations are focused in banking, insurance and investment management; Norway’s Marine Harvest, one of the world’s leading seafood companies; and Banca Popolare, an Italian financial services provider.
Fortis declined 30% in local currency as the company raised a significant amount of capital to fund its acquisition of some of ABN Amro’s Dutch retail banking, asset management and private banking units. Fortis was part of a consortium with Royal Bank of Scotland and Brazil’s Banco Santander, which together acquired these businesses and by year-end had completed the largest bank acquisition in European history. Fortis’ stock price also came under pressure after the company announced weak third quarter 2007 operating results for its banking and insurance businesses.
Marine Harvest, formerly known as Pan Fish, benefited from increased demand for salmon. But the company reported disappointing results in third quarter 2007 as it experienced difficult biological conditions due
Top 10 Holdings
Mutual Discovery Securities Fund 12/31/07
| | |
Company Sector/Industry,
Country | | % of Total
Net Assets |
| |
| British American Tobacco PLC | | 3.1% |
| Tobacco, U.K. | | |
| |
| KT&G Corp. | | 3.0% |
| Tobacco, South Korea | | |
| |
| Berkshire Hathaway Inc., A & B | | 2.9% |
| Insurance, U.S. | | |
| |
| Japan Tobacco Inc. | | 2.8% |
| Tobacco, Japan | | |
| |
| Imperial Tobacco Group PLC | | 2.4% |
| Tobacco, U.K. | | |
| |
| Carrefour SA | | 2.0% |
| Food & Staples Retailing, France | | |
| |
| Orkla ASA | | 1.9% |
| Industrial Conglomerates, Norway | | |
| |
| Pernod Ricard SA | | 1.8% |
| Beverages, France | | |
| |
| Carlsberg AS, A & B | | 1.8% |
| Beverages, Denmark | | |
| |
| Fortis | | 1.6% |
| Diversified Financial Services, Belgium | | |
The dollar value, number of shares or principal amount, and names of all portfolio holdings are listed in the Fund’s Statement of Investments.
MD-5
to a disease outbreak in its Chilean and Norwegian fisheries. Analysts responded by reducing the company’s earnings estimate, and for 2007 Marine Harvest shares fell 38% in local currency.
The Fund’s shares of Banca Popolare declined 34% in local currency during 2007. As global economic fears became more evident in the markets, Banca Popolare suffered as investors became hesitant about the bank’s growth prospects for the next few years. Also, concerns developed over the potential integration of its $10 billion BPI (Banca Popolare Italiana) acquisition and lost revenue stemming from the company’s Banca Italease subsidiary.
Finally, investors should note that we maintained our currency hedging posture of being generally hedged to the U.S. dollar for most of our non-U.S. holdings. Since the dollar was weaker compared with most foreign currencies during 2007, the Fund benefited to the extent it was not fully hedged.
Thank you for your participation in Mutual Discovery Securities Fund. We look forward to serving your future investment needs.
The foregoing information reflects our analysis, opinions and portfolio holdings as of December 31, 2007, the end of the reporting period. The way we implement our main investment strategies and the resulting portfolio holdings may change depending on factors such as market and economic conditions. These opinions may not be relied upon as investment advice or an offer for a particular security. The information is not a complete analysis of every aspect of any market, country, industry, security or the Fund. Statements of fact are from sources considered reliable, but the investment manager makes no representation or warranty as to their completeness or accuracy. Although historical performance is no guarantee of future results, these insights may help you understand our investment management philosophy.
MD-6
Fund Expenses
As an investor in a variable insurance contract (Contract) that indirectly provides for investment in an underlying mutual fund, you can incur transaction and/or ongoing expenses at both the Fund level and the Contract level.
| • | | Transaction expenses can include sales charges (loads) on purchases, redemption fees, surrender fees, transfer fees and premium taxes. |
| • | | Ongoing expenses can include management fees, distribution and service (12b-1) fees, contract fees, annual maintenance fees, mortality and expense risk fees and other fees and expenses. All mutual funds and Contracts have some types of ongoing expenses. |
The expenses shown in the table are meant to highlight ongoing expenses at the Fund level only and do not include ongoing expenses at the Contract level, or transaction expenses at either the Fund or Contract level. While the Fund does not have transaction expenses, if the transaction and ongoing expenses at the Contract level were included, the expenses shown below would be higher. You should consult your Contract prospectus or disclosure document for more information.
The table shows Fund-level ongoing expenses and can help you understand these expenses and compare them with those of other mutual funds offered through the Contract. The table assumes a $1,000 investment held for the six months indicated. Please refer to the Fund prospectus for additional information on operating expenses.
Actual Fund Expenses
The first line (Actual) of the table provides actual account values and expenses. The “Ending Account Value” is derived from the Fund’s actual return, which includes the effect of ongoing Fund expenses, but does not include the effect of ongoing Contract expenses.
You can estimate the Fund-level expenses you incurred during the period by following these steps. Of course, your account value and expenses will differ from those in this illustration:
| 1. | Divide your account value by $1,000. |
If an account had an $8,600 value, then $8,600 ÷ $1,000 = 8.6.
| 2. | Multiply the result by the number under the heading “Fund-Level Expenses Incurred During Period.” |
If Fund-Level Expenses Incurred During Period were $7.50, then 8.6 x $7.50 = $64.50.
In this illustration, the estimated expenses incurred this period at the Fund level are $64.50.
Mutual Discovery Securities Fund – Class 1
MD-7
Hypothetical Example for Comparison with Other Mutual Funds
Information in the second line (Hypothetical) of the table can help you compare ongoing expenses of the Fund with those of other mutual funds offered through the Contract. This information may not be used to estimate the actual ending account balance or expenses you incurred during the period. The hypothetical “Ending Account Value” is based on the Fund’s actual expense ratio and an assumed 5% annual rate of return before expenses, which does not represent the Fund’s actual return. The figure under the heading “Fund-Level Expenses Incurred During Period” shows the hypothetical expenses your account would have incurred under this scenario. You can compare this figure with the 5% hypothetical examples that appear in shareholder reports of other funds offered through a Contract.
| | | | | | | | | |
| Class 1 | | Beginning
Account Value 7/1/07 | | Ending Account Value 12/31/07 | | Fund-Level
Expenses Incurred
During Period*
7/1/07–12/31/07 |
Actual | | $ | 1,000 | | $ | 1,121.70 | | $ | 5.13 |
Hypothetical (5% return before expenses) | | $ | 1,000 | | $ | 1,020.37 | | $ | 4.89 |
*Expenses are calculated using the most recent six-month annualized expense ratio for the Fund’s Class 1 shares (0.96%), which does not include any ongoing expenses of the Contract for which the Fund is an investment option, multiplied by the average account value over the period, multiplied by 184/365 to reflect the one-half year period.
MD-8
SUPPLEMENT DATED JANUARY 23, 2008
TOTHE PROSPECTUSES DATED MAY 1, 2007
OF
MUTUAL DISCOVERY SECURITIES FUND (THE “FUND”)
A SERIESOF FRANKLIN TEMPLETON VARIABLE INSURANCE PRODUCTS TRUST
The Fund’s Class 1 and Class 2 prospectuses are amended as follows:
The seventh paragraph under the heading “Main Investments” on page MD-1 is replaced with the following:
The Fund may attempt, from time to time, to hedge (protect) against currency risks, largely using forward foreign currency exchange contracts, when, in the manager’s opinion, it would be advantageous to the Fund to do so. The Fund may also, from time to time, attempt to hedge against market risk using a variety of derivatives (together, Hedging Instruments).
The following paragraph is added as the second paragraph under the heading “Hedging Instruments” on page MD-5 and the paragraph thereafter is amended to read as follows:
The Fund may also attempt, from time to time, to hedge against market risks by using derivative investments, which may include purchasing put options. A put option gives the purchaser of the option, upon payment of a premium, the right to sell, and the seller of the option the obligation to buy, the underlying instrument at the exercise price.
Forward foreign currency exchange contracts and put options are considered derivative investments because their value and performance depend, at least in part, on the value and performance of an underlying asset. The Fund’s investments in derivatives may involve a small investment relative to the amount of risk assumed. To the extent the Fund enters into these transactions, its success will depend on the manager’s ability to predict market movements, and their use may have the opposite effect of that intended. Risks include potential loss due to the imposition of controls by a government on the exchange of foreign currencies, the loss of any premium paid to enter into the transaction, delivery failure or default by any other party, or inability to close out a position because the trading market became illiquid.
Please keep this supplement for future reference.
MD-9
Franklin Templeton Variable Insurance Products Trust
Financial Highlights
Mutual Discovery Securities Fund
| | | | | | | | | | | | | | | | | | | | |
| | | Year Ended December 31, | |
| Class 1 | | 2007 | | | 2006 | | | 2005 | | | 2004 | | | 2003 | |
| | | | |
Per share operating performance | | | | | | | | | | | | | | | | | | | | |
(for a share outstanding throughout the year) | | | | | | | | | | | | | | | | | | | | |
Net asset value, beginning of year | | $ | 22.05 | | | $ | 18.85 | | | $ | 16.44 | | | $ | 14.04 | | | $ | 11.06 | |
| | | | |
Income from investment operationsa: | | | | | | | | | | | | | | | | | | | | |
Net investment incomeb | | | 0.47 | | | | 0.52 | | | | 0.25 | | | | 0.26 | | | | 0.19 | |
Net realized and unrealized gains (losses) | | | 2.22 | | | | 3.69 | | | | 2.40 | | | | 2.31 | | | | 3.01 | |
| | | | |
Total from investment operations | | | 2.69 | | | | 4.21 | | | | 2.65 | | | | 2.57 | | | | 3.20 | |
| | | | |
Less distributions from: | | | | | | | | | | | | | | | | | | | | |
Net investment income | | | (0.38 | ) | | | (0.25 | ) | | | (0.24 | ) | | | (0.17 | ) | | | (0.22 | ) |
Net realized gains | | | (0.28 | ) | | | (0.76 | ) | | | — | | | | — | | | | — | |
| | | | |
Total distributions | | | (0.66 | ) | | | (1.01 | ) | | | (0.24 | ) | | | (0.17 | ) | | | (0.22 | ) |
| | | | |
Net asset value, end of year | | $ | 24.08 | | | $ | 22.05 | | | $ | 18.85 | | | $ | 16.44 | | | $ | 14.04 | |
| | | | |
| | | | | |
Total returnc | | | 12.17% | | | | 23.32% | | | | 16.28% | | | | 18.55% | | | | 29.19% | |
Ratios to average net assets | | | | | | | | | | | | | | | | | | | | |
Expensesd | | | 0.97% | e | | | 1.03% | e | | | 1.02% | e | | | 1.01% | e | | | 1.04% | |
Expenses - excluding dividend expense on securities sold short | | | 0.97% | e | | | 1.00% | e | | | 1.00% | e | | | 1.00% | e | | | 1.01% | |
Net investment income | | | 1.96% | | | | 2.44% | | | | 1.37% | | | | 1.71% | | | | 1.48% | |
| | | | | |
Supplemental data | | | | | | | | | | | | | | | | | | | | |
Net assets, end of year (000’s) | | $ | 142,751 | | | $ | 146,229 | | | $ | 136,508 | | | $ | 137,703 | | | $ | 134,332 | |
Portfolio turnover rate | | | 28.20% | | | | 19.83% | | | | 22.94% | | | | 29.81% | | | | 41.52% | |
aThe amount shown for a share outstanding throughout the period may not correlate with the Statement of Operations for the period due to the timing of sales and repurchase of the Fund shares in relation to income earned and/or fluctuating market value of the investments of the Fund.
bBased on average daily shares outstanding.
cTotal return does not include any fees, charges or expenses imposed by the variable annuity and life insurance contracts for which the Franklin Templeton Variable Insurance Products Trust serves as an underlying investment vehicle.
dIncludes dividend expenses on securities sold short which varies from period to period. See below for expense ratios that reflect only operating expenses.
eBenefit of expense reduction is less than 0.01%.
The accompanying notes are an integral part of these financial statements.
MD-10
Franklin Templeton Variable Insurance Products Trust
Financial Highlights (continued)
Mutual Discovery Securities Fund
| | | | | | | | | | | | | | | | | | | | |
| | | Year Ended December 31, | |
| Class 2 | | 2007 | | | 2006 | | | 2005 | | | 2004 | | | 2003 | |
| | | | |
Per share operating performance | | | | | | | | | | | | | | | | | | | | |
(for a share outstanding throughout the year) | | | | | | | | | | | | | | | | | | | | |
Net asset value, beginning of year | | $ | 21.73 | | | $ | 18.60 | | | $ | 16.25 | | | $ | 13.90 | | | $ | 10.97 | |
| | | | |
Income from investment operationsa: | | | | | | | | | | | | | | | | | | | | |
Net investment incomeb | | | 0.40 | | | | 0.43 | | | | 0.19 | | | | 0.21 | | | | 0.13 | |
Net realized and unrealized gains (losses) | | | 2.18 | | | | 3.68 | | | | 2.38 | | | | 2.30 | | | | 3.02 | |
| | | | |
Total from investment operations | | | 2.58 | | | | 4.11 | | | | 2.57 | | | | 2.51 | | | | 3.15 | |
| | | | |
Less distributions from: | | | | | | | | | | | | | | | | | | | | |
Net investment income | | | (0.34 | ) | | | (0.22 | ) | | | (0.22 | ) | | | (0.16 | ) | | | (0.22 | ) |
Net realized gains | | | (0.28 | ) | | | (0.76 | ) | | | — | | | | — | | | | — | |
| | | | |
Total distributions | | | (0.62 | ) | | | (0.98 | ) | | | (0.22 | ) | | | (0.16 | ) | | | (0.22 | ) |
| | | | |
Net asset value, end of year | | $ | 23.69 | | | $ | 21.73 | | | $ | 18.60 | | | $ | 16.25 | | | $ | 13.90 | |
| | | | |
| | | | | |
Total returnc | | | 11.85% | | | | 23.06% | | | | 15.97% | | | | 18.19% | | | | 28.99% | |
Ratios to average net assets | | | | | | | | | | | | | | | | | | | | |
Expensesd | | | 1.22% | e | | | 1.28% | e | | | 1.28% | e | | | 1.26% | e | | | 1.29% | |
Expenses - excluding dividend expense on securities sold short | | | 1.22% | e | | | 1.25% | e | | | 1.25% | e | | | 1.25% | e | | | 1.26% | |
Net investment income | | | 1.71% | | | | 2.19% | | | | 1.12% | | | | 1.46% | | | | 1.23% | |
| | | | | |
Supplemental data | | | | | | | | | | | | | | | | | | | | |
Net assets, end of year (000’s) | | $ | 1,867,484 | | | $ | 1,365,575 | | | $ | 811,975 | | | $ | 403,560 | | | $ | 160,371 | |
Portfolio turnover rate | | | 28.20% | | | | 19.83% | | | | 22.94% | | | | 29.81% | | | | 41.52% | |
aThe amount shown for a share outstanding throughout the period may not correlate with the Statement of Operations for the period due to the timing of sales and repurchase of the Fund shares in relation to income earned and/or fluctuating market value of the investments of the Fund.
bBased on average daily shares outstanding.
cTotal return does not include any fees, charges or expenses imposed by the variable annuity and life insurance contracts for which the Franklin Templeton Variable Insurance Products Trust serves as an underlying investment vehicle.
dIncludes dividend expenses on securities sold short which varies from period to period. See below for expense ratios that reflect only operating expenses.
eBenefit of expense reduction is less than 0.01%.
The accompanying notes are an integral part of these financial statements.
MD-11
Franklin Templeton Variable Insurance Products Trust
Statement of Investments, December 31, 2007
| | | | | | | |
| Mutual Discovery Securities Fund | | Country | | Shares/
Warrants/
Contracts | | Value |
Long Term Investment 84.8% | | | | | | | |
Common Stocks and Other Equity Interests 83.3% | | | | | | | |
Airlines 0.3% | | | | | | | |
aACE Aviation Holdings Inc., A | | Canada | | 106,080 | | $ | 3,026,282 |
a,bACE Aviation Holdings Inc., A, 144A | | Canada | | 5,465 | | | 155,907 |
aNorthwest Airlines Corp. | | United States | | 207,129 | | | 3,005,442 |
a,cNorthwest Airlines Corp., Contingent Distribution | | United States | | 8,167,000 | | | 275,636 |
| | | | | | | |
| | | | | | | 6,463,267 |
| | | | | | | |
Auto Components 0.0%d | | | | | | | |
a,cCollins & Aikman Products Co., Contingent Distribution | | United States | | 218,976 | | | 96,897 |
| | | | | | | |
Automobiles 0.3% | | | | | | | |
a,e,f,gInternational Automotive Components Group Brazil LLC | | Brazil | | 355,744 | | | 2,471,044 |
a,e,f,gInternational Automotive Components Group Japan LLC | | Japan | | 74,174 | | | 665,148 |
a,e,f,gInternational Automotive Components Group LLC | | Luxembourg | | 1,512,200 | | | 1,604,293 |
a,e,f,gInternational Automotive Components Group NA LLC | | United States | | 1,353,607 | | | 1,861,210 |
| | | | | | | |
| | | | | | | 6,601,695 |
| | | | | | | |
Beverages 4.3% | | | | | | | |
Brown-Forman Corp., A | | United States | | 7,400 | | | 553,816 |
Carlsberg AS, A | | Denmark | | 7,100 | | | 810,119 |
Carlsberg AS, B | | Denmark | | 286,147 | | | 34,553,811 |
Fomento Economico Mexicano SAB de CV, ADR | | Mexico | | 180,900 | | | 6,904,953 |
Lotte Chilsung Beverage Co. Ltd. | | South Korea | | 7,047 | | | 7,897,338 |
Pernod Ricard SA | | France | | 153,898 | | | 35,507,843 |
| | | | | | | |
| | | | | | | 86,227,880 |
| | | | | | | |
Building Products 0.6% | | | | | | | |
aArmstrong World Industries Inc. | | United States | | 18,780 | | | 753,266 |
a,cArmstrong World Industries Inc., Contingent Distribution | | United States | | 2,084,150 | | | 7,816 |
KCC Corp. | | South Korea | | 18,824 | | | 10,597,989 |
aOwens Corning Inc. | | United States | | 86,601 | | | 1,751,072 |
| | | | | | | |
| | | | | | | 13,110,143 |
| | | | | | | |
Capital Markets 1.1% | | | | | | | |
Legg Mason Inc. | | United States | | 97,620 | | | 7,140,903 |
Marfin Investment Group Holdings SA | | Greece | | 1,689,407 | | | 14,644,690 |
| | | | | | | |
| | | | | | | 21,785,593 |
| | | | | | | |
Chemicals 2.4% | | | | | | | |
a,cDow Corning Corp., Contingent Distribution | | United States | | 300,000 | | | 153,000 |
Linde AG | | Germany | | 190,227 | | | 25,120,727 |
Sika AG | | Switzerland | | 12,390 | | | 23,354,253 |
| | | | | | | |
| | | | | | | 48,627,980 |
| | | | | | | |
Commercial Banks 7.5% | | | | | | | |
aBanco Popolare SpA | | Italy | | 932,238 | | | 20,624,596 |
BNP Paribas SA | | France | | 215,306 | | | 23,320,429 |
Commerce Bancorp Inc. | | United States | | 427,030 | | | 16,286,924 |
Danske Bank AS | | Denmark | | 392,608 | | | 15,348,556 |
a,e,fElephant Capital Holdings Ltd. | | Japan | | 783 | | | 515,519 |
First Community Bancorp | | United States | | 58,619 | | | 2,417,448 |
Intesa Sanpaolo SpA | | Italy | | 1,657,231 | | | 13,083,977 |
MD-12
Franklin Templeton Variable Insurance Products Trust
Statement of Investments, December 31, 2007 (continued)
| | | | | | | |
| Mutual Discovery Securities Fund | | Country | | Shares/
Warrants/
Contracts | | Value |
Long Term Investment (continued) | | | | | | | |
Common Stocks and Other Equity Interests (continued) | | | | | | | |
Commercial Banks (continued) | | | | | | | |
Mitsubishi UFJ Financial Group Inc. | | Japan | | 616,703 | | $ | 5,790,145 |
a,e,fNCB Warrant Holdings Ltd., A | | Japan | | 3,830 | | | 227,241 |
Royal Bank of Scotland Group PLC | | United Kingdom | | 120,431 | | | 1,062,449 |
Societe Generale, A | | France | | 90,440 | | | 13,057,139 |
Sumitomo Mitsui Financial Group Inc. | | Japan | | 1,693 | | | 12,707,179 |
Svenska Handelsbanken AB, A | | Sweden | | 276,001 | | | 8,836,198 |
Swedbank AB, A | | Sweden | | 232,801 | | | 6,589,013 |
U.S. Bancorp | | United States | | 338,303 | | | 10,737,737 |
| | | | | | | |
| | | | | | | 150,604,550 |
| | | | | | | |
Commercial Services & Supplies 0.3% | | | | | | | |
aComdisco Holding Co. Inc. | | United States | | 44 | | | 401 |
a,cComdisco Holding Co. Inc., Contingent Distribution | | United States | | 2,066,357 | | | — |
aTechem AG | | Germany | | 72,500 | | | 6,348,172 |
| | | | | | | |
| | | | | | | 6,348,573 |
| | | | | | | |
Computers & Peripherals 0.2% | | | | | | | |
a,e,fDecisionOne Corp. | | United States | | 21,716 | | | — |
a,e,fDecisionOne Corp., wts., 6/08/17 | | United States | | 11,923 | | | — |
aDell Inc. | | United States | | 206,950 | | | 5,072,345 |
| | | | | | | |
| | | | | | | 5,072,345 |
| | | | | | | |
Construction Materials 0.4% | | | | | | | |
Ciments Francais SA | | France | | 22,650 | | | 3,890,819 |
Hanil Cement Co. Ltd. | | South Korea | | 37,479 | | | 4,344,289 |
| | | | | | | |
| | | | | | | 8,235,108 |
| | | | | | | |
Consumer Finance 0.5% | | | | | | | |
a,e,fCerberus CG Investor I LLC | | United States | | 1,897,400 | | | 1,597,566 |
a,e,fCerberus CG Investor II LLC | | United States | | 1,897,400 | | | 1,597,566 |
a,e,fCerberus CG Investor III LLC | | United States | | 948,700 | | | 798,783 |
a,e,fCerberus FIM Investors Auto Finance LLC | | United States | | 598,507 | | | 321,118 |
a,e,fCerberus FIM Investors Commercial Finance LLC | | United States | | 49,854 | | | 26,748 |
a,e,fCerberus FIM Investors Commercial Mortgage LLC | | United States | | 93,443 | | | 50,135 |
a,e,fCerberus FIM Investors Insurance LLC | | United States | | 457,037 | | | 245,215 |
a,e,fCerberus FIM Investors Rescap LLC | | United States | | 850,909 | | | 456,539 |
SLM Corp. | | United States | | 238,020 | | | 4,793,723 |
| | | | | | | |
| | | | | | | 9,887,393 |
| | | | | | | |
Diversified Banks 0.4% | | | | | | | |
a,e,f,hThe Bankshares Inc. | | United States | | 800,000 | | | 8,000,000 |
| | | | | | | |
Diversified Financial Services 4.9% | | | | | | | |
Citigroup Inc. | | United States | | 89,050 | | | 2,621,632 |
Deutsche Boerse AG | | Germany | | 145,650 | | | 28,854,249 |
Fortis | | Belgium | | 1,234,155 | | | 32,563,238 |
aFortis VVPR Strip | | Belgium | | 467,662 | | | 6,825 |
Guinness Peat Group PLC | | United Kingdom | | 2,285,196 | | | 3,047,789 |
Jardine Matheson Holdings Ltd. | | Hong Kong | | 429,664 | | | 11,901,692 |
Jardine Strategic Holdings Ltd. | | Hong Kong | | 1,191,700 | | | 18,709,690 |
a,cMarconi Corp., Contingent Distribution | | United Kingdom | | 1,739,100 | | | — |
| | | | | | | |
| | | | | | | 97,705,115 |
| | | | | | | |
MD-13
Franklin Templeton Variable Insurance Products Trust
Statement of Investments, December 31, 2007 (continued)
| | | | | | | |
| Mutual Discovery Securities Fund | | Country | | Shares/
Warrants/
Contracts | | Value |
Long Term Investment (continued) | | | | | | | |
Common Stocks and Other Equity Interests (continued) | | | | | | | |
Diversified Telecommunication Services 0.8% | | | | | | | |
a,e,f,gAboveNet Inc. | | United States | | 17,729 | | $ | 886,450 |
a,f,gAboveNet Inc., stock grant, grant price $20.95, expiration date 9/09/13 | | United States | | 23 | | | 953 |
a,e,f,gAboveNet Inc., wts., 9/08/08 | | United States | | 628 | | | 29,642 |
a,e,f,gAboveNet Inc., wts., 9/08/10 | | United States | | 739 | | | 32,280 |
Chunghwa Telecom Co. Ltd., ADR | | Taiwan | | 278,331 | | | 5,875,565 |
a,c,eGlobal Crossing Holdings Ltd., Contingent Distribution | | United States | | 2,236,777 | | | — |
Koninklijke (Royal) KPN NV | | Netherlands | | 561,200 | | | 10,188,201 |
| | | | | | | |
| | | | | | | 17,013,091 |
| | | | | | | |
Electric Utilities 0.8% | | | | | | | |
E.ON AG | | Germany | | 71,250 | | | 15,140,336 |
| | | | | | | |
Energy Equipment & Services 5.2% | | | | | | | |
aAker Drilling ASA | | Norway | | 1,583,061 | | | 12,380,181 |
Bourbon SA | | France | | 120,569 | | | 7,886,185 |
aBW Offshore Ltd. | | Norway | | 3,825,934 | | | 16,121,794 |
aCompagnie Generale de Geophysique SA | | France | | 69,088 | | | 19,660,596 |
aDockwise Ltd. | | Norway | | 1,450,420 | | | 6,005,051 |
a,e,fMPF Corp. Ltd. | | Norway | | 1,460,000 | | | 4,835,772 |
Petroleum Geo-Services ASA | | Norway | | 204,624 | | | 5,939,725 |
aSeadrill Ltd. | | Bermuda | | 913,347 | | | 22,268,558 |
aTransocean Inc. | | United States | | 65,223 | | | 9,336,672 |
| | | | | | | |
| | | | | | | 104,434,534 |
| | | | | | | |
Food & Staples Retailing 2.2% | | | | | | | |
Carrefour SA | | France | | 506,111 | | | 39,359,624 |
CVS Caremark Corp. | | United States | | 145,008 | | | 5,764,068 |
| | | | | | | |
| | | | | | | 45,123,692 |
| | | | | | | |
Food Products 6.6% | | | | | | | |
Cadbury Schweppes PLC | | United Kingdom | | 903,313 | | | 11,145,943 |
Cermaq ASA | | Norway | | 418,541 | | | 5,814,674 |
CSM NV | | Netherlands | | 441,585 | | | 14,886,265 |
Farmer Brothers Co. | | United States | | 61,700 | | | 1,418,483 |
Groupe Danone | | France | | 319,916 | | | 28,665,781 |
aLighthouse Caledonia ASA | | Norway | | 161,457 | | | 153,301 |
Lotte Confectionary Co. Ltd. | | South Korea | | 5,166 | | | 9,327,002 |
a,iMarine Harvest | | Norway | | 18,995,051 | | | 12,198,496 |
Nestle SA | | Switzerland | | 66,060 | | | 30,313,449 |
Nong Shim Co. Ltd. | | South Korea | | 24,215 | | | 5,031,587 |
Premier Foods PLC | | United Kingdom | | 2,390,464 | | | 9,713,203 |
Rieber & Son ASA | | Norway | | 400,605 | | | 3,851,617 |
| | | | | | | |
| | | | | | | 132,519,801 |
| | | | | | | |
Health Care Providers & Services 1.4% | | | | | | | |
a,e,f,gKindred Healthcare Inc. | | United States | | 69,402 | | | 1,646,979 |
a,e,f,gKindred Healthcare Inc., stock grant: | | | | | | | |
grant price $18.15, expiration date 7/17/11 | | United States | | 241 | | | 1,345 |
grant price $19.87, expiration date 1/01/12 | | United States | | 73 | | | 282 |
grant price $6.94, expiration date 1/01/13 | | United States | | 73 | | | 1,226 |
grant price $19.87, expiration date 1/01/14 | | United States | | 55 | | | 212 |
MD-14
Franklin Templeton Variable Insurance Products Trust
Statement of Investments, December 31, 2007 (continued)
| | | | | | | |
| Mutual Discovery Securities Fund | | Country | | Shares/
Warrants/
Contracts | | Value |
Long Term Investment (continued) | | | | | | | |
Common Stocks and Other Equity Interests (continued) | | | | | | | |
Health Care Providers & Services (continued) | | | | | | | |
a,e,f,gKindred Healthcare Inc., stock grant: (continued) | | | | | | | |
grant price $21.33, expiration date 1/10/15 | | United States | | 30 | | $ | 72 |
grant price $22.08, expiration date 1/10/16 | | United States | | 16 | | | 26 |
aMDS Inc. | | Canada | | 147,705 | | | 2,852,286 |
aPharMerica Inc. | | United States | | 25,402 | | | 352,580 |
Quest Diagnostics Inc. | | United States | | 154,000 | | | 8,146,600 |
Rhoen-Klinikum AG | | Germany | | 456,430 | | | 14,267,671 |
| | | | | | | |
| | | | | | | 27,269,279 |
| | | | | | | |
Hotels Restaurants & Leisure 0.0%d | | | | | | | |
aTrump Entertainment Resorts Inc. | | United States | | 67,079 | | | 288,440 |
| | | | | | | |
Household Durables 0.1% | | | | | | | |
Hunter Douglas NV | | Netherlands | | 17,849 | | | 1,320,109 |
| | | | | | | |
Independent Power Producers & Energy Traders 0.6% | | | | | | | |
Constellation Energy Group | | United States | | 125,720 | | | 12,890,072 |
| | | | | | | |
Industrial Conglomerates 3.7% | | | | | | | |
Keppel Corp. Ltd. | | Singapore | | 1,865,494 | | | 16,824,324 |
gOrkla ASA | | Norway | | 2,009,757 | | | 38,922,978 |
Siemens AG | | Germany | | 114,265 | | | 18,079,319 |
| | | | | | | |
| | | | | | | 73,826,621 |
| | | | | | | |
Insurance 5.7% | | | | | | | |
aAlleghany Corp. | | United States | | 3,910 | | | 1,571,820 |
Allianz SE | | Germany | | 68,510 | | | 14,805,048 |
Assicurazioni Generali SpA | | Italy | | 142,004 | | | 6,424,240 |
aBerkshire Hathaway Inc., A | | United States | | 45 | | | 6,372,000 |
aBerkshire Hathaway Inc., B | | United States | | 11,090 | | | 52,522,240 |
aConseco Inc. | | United States | | 306,820 | | | 3,853,659 |
E-L Financial Corp. Ltd. | | Canada | | 8,478 | | | 4,986,557 |
Hartford Financial Services Group Inc. | | United States | | 40,800 | | | 3,557,352 |
a,e,fImagine Group Holdings Ltd. | | Bermuda | | 451,787 | | | 5,168,443 |
Old Republic International Corp. | | United States | | 141,125 | | | 2,174,736 |
a,e,fOlympus Re Holdings Ltd. | | United States | | 2,140 | | | 7,009 |
White Mountains Insurance Group Ltd. | | United States | | 9,496 | | | 4,881,419 |
Zurich Financial Services AG | | Switzerland | | 28,287 | | | 8,299,883 |
| | | | | | | |
| | | | | | | 114,624,406 |
| | | | | | | |
Machinery 1.4% | | | | | | | |
jAker Yards ASA | | Norway | | 665,370 | | | 7,590,936 |
Schindler Holding AG | | Switzerland | | 308,446 | | | 19,869,889 |
| | | | | | | |
| | | | | | | 27,460,825 |
| | | | | | | |
Media 4.9% | | | | | | | |
aAdelphia Recovery Trust | | United States | | 5,379,562 | | | 376,569 |
a,cAdelphia Recovery Trust Arahova, Contingent Value Vehicle, Contingent Distribution | | United States | | 386,774 | | | 199,189 |
a,cCentury Communications Corp., Contingent Distribution | | United States | | 1,074,000 | | | — |
CJ CGV Co. Ltd. | | South Korea | | 92,310 | | | 1,272,153 |
Daekyo Co. Ltd. | | South Korea | | 37,430 | | | 3,550,862 |
MD-15
Franklin Templeton Variable Insurance Products Trust
Statement of Investments, December 31, 2007 (continued)
| | | | | | | |
| Mutual Discovery Securities Fund | | Country | | Shares/
Warrants/
Contracts | | Value |
Long Term Investment (continued) | | | | | | | |
Common Stocks and Other Equity Interests (continued) | | | | | | | |
Media (continued) | | | | | | | |
Eutelsat Communications | | France | | 785,069 | | $ | 23,314,800 |
aLiberty Media Holding Corp.-Capital, A | | United States | | 26,257 | | | 3,058,678 |
News Corp., A | | United States | | 661,780 | | | 13,559,872 |
aPremiere AG | | Germany | | 451,931 | | | 8,448,521 |
aSun-Times Media Group Inc., A | | United States | | 95,634 | | | 210,395 |
Teleperformance | | France | | 177,196 | | | 6,886,278 |
aTime Warner Cable Inc., A | | United States | | 115,093 | | | 3,176,567 |
Time Warner Inc. | | United States | | 825,810 | | | 13,634,123 |
a,eTVMAX Holdings Inc. | | United States | | 8,935 | | | — |
aViacom Inc., B | | United States | | 200,520 | �� | | 8,806,838 |
Virgin Media Inc. | | United Kingdom | | 391,938 | | | 6,717,817 |
WPP Group PLC | | United Kingdom | | 385,950 | | | 4,961,606 |
| | | | | | | |
| | | | | | | 98,174,268 |
| | | | | | | |
Metals & Mining 1.4% | | | | | | | |
Anglo American PLC | | United Kingdom | | 333,752 | | | 20,424,976 |
e,fEsmark Inc. | | United States | | 324,727 | | | 4,129,553 |
aGammon Gold Inc. | | Canada | | 348,835 | | | 2,794,191 |
| | | | | | | |
| | | | | | | 27,348,720 |
| | | | | | | |
Multi-Utilities 1.8% | | | | | | | |
Energy East Corp. | | United States | | 152,680 | | | 4,154,423 |
NorthWestern Corp. | | United States | | 18,443 | | | 544,068 |
a,cNorthWestern Corp., Contingent Distribution | | United States | | 552,880 | | | 39,195 |
RWE AG | | Germany | | 138,824 | | | 19,540,075 |
Suez SA | | France | | 169,467 | | | 11,517,304 |
| | | | | | | |
| | | | | | | 35,795,065 |
| | | | | | | |
Multiline Retail 0.3% | | | | | | | |
Jelmoli Holding AG | | Switzerland | | 2,285 | | | 5,474,563 |
| | | | | | | |
Oil, Gas & Consumable Fuels 1.8% | | | | | | | |
BP PLC | | United Kingdom | | 944,580 | | | 11,542,525 |
BP PLC, ADR | | United Kingdom | | 9,000 | | | 658,530 |
Eni SpA | | Italy | | 67,710 | | | 2,475,255 |
Royal Dutch Shell PLC, A | | United Kingdom | | 393,617 | | | 16,514,717 |
Total SA, B | | France | | 49,296 | | | 4,088,357 |
Total SA, B, ADR | | France | | 19,340 | | | 1,597,484 |
| | | | | | | |
| | | | | | | 36,876,868 |
| | | | | | | |
Paper & Forest Products 1.2% | | | | | | | |
aDomtar Corp. | | United States | | 320,506 | | | 2,464,691 |
Weyerhaeuser Co. | | United States | | 295,340 | | | 21,778,372 |
| | | | | | | |
| | | | | | | 24,243,063 |
| | | | | | | |
Personal Products 0.3% | | | | | | | |
Amorepacific Corp. | | South Korea | | 6,873 | | | 5,213,215 |
| | | | | | | |
Pharmaceuticals 1.7% | | | | | | | |
Novartis AG | | Switzerland | | 249,811 | | | 13,689,784 |
Pfizer Inc. | | United States | | 466,520 | | | 10,604,000 |
Sanofi-Aventis | | France | | 102,524 | | | 9,422,966 |
| | | | | | | |
| | | | | | | 33,716,750 |
| | | | | | | |
MD-16
Franklin Templeton Variable Insurance Products Trust
Statement of Investments, December 31, 2007 (continued)
| | | | | | | |
| Mutual Discovery Securities Fund | | Country | | Shares/
Warrants/
Contracts | | Value |
Long Term Investment (continued) | | | | | | | |
Common Stocks and Other Equity Interests (continued) | | | | | | | |
Real Estate 2.5% | | | | | | | |
a,eCanary Wharf Group PLC | | United Kingdom | | 185,900 | | $ | 1,857,951 |
Great Eagle Holdings Ltd. | | Hong Kong | | 1,590,342 | | | 5,944,842 |
Link REIT | | Hong Kong | | 9,928,781 | | | 21,492,136 |
Swire Pacific Ltd., A | | Hong Kong | | 950,615 | | | 13,104,617 |
Swire Pacific Ltd., B | | Hong Kong | | 2,440,700 | | | 6,478,820 |
Ventas Inc. | | United States | | 33,500 | | | 1,515,875 |
| | | | | | | |
| | | | | | | 50,394,241 |
| | | | | | | |
Semiconductors & Semiconductor Equipment 0.2% | | | | | | | |
aLSI Corp. | | United States | | 582,768 | | | 3,094,498 |
| | | | | | | |
Software 1.0% | | | | | | | |
Microsoft Corp. | | United States | | 564,890 | | | 20,110,084 |
| | | | | | | |
Thrifts & Mortgage Finance 0.6% | | | | | | | |
Hudson City Bancorp Inc. | | United States | | 245,760 | | | 3,691,315 |
Hypo Real Estate Holding AG | | Germany | | 161,219 | | | 8,538,128 |
| | | | | | | |
| | | | | | | 12,229,443 |
| | | | | | | |
Tobacco 13.2% | | | | | | | |
Altadis SA | | Spain | | 84,869 | | | 6,156,761 |
Altria Group Inc. | | United States | | 122,821 | | | 9,282,811 |
British American Tobacco PLC | | United Kingdom | | 1,610,201 | | | 62,867,995 |
Imperial Tobacco Group PLC | | United Kingdom | | 893,757 | | | 48,161,068 |
ITC Ltd. | | India | | 1,739,520 | | | 9,283,620 |
Japan Tobacco Inc. | | Japan | | 9,321 | | | 55,834,892 |
KT&G Corp. | | South Korea | | 707,558 | | | 60,245,043 |
Reynolds American Inc. | | United States | | 220,400 | | | 14,537,584 |
| | | | | | | |
| | | | | | | 266,369,774 |
| | | | | | | |
Trading Companies & Distributors 0.7% | | | | | | | |
Kloeckner & Co. AG | | Germany | | 365,696 | | | 14,569,421 |
| | | | | | | |
Transportation Infrastructure 0.0%d | | | | | | | |
aGroupe Eurotunnel SA, wts., 12/30/11 | | France | | 11,181 | | | 3,753 |
| | | | | | | |
Total Common Stocks and Other Equity Interests
(Cost $1,215,881,449) | | | | | | | 1,674,291,471 |
| | | | | | | |
Preferred Stocks 0.0%d | | | | | | | |
Auto Components 0.0%d | | | | | | | |
e,fDana Holding Corp., 4.00%, cvt. pfd., B | | United States | | 9,611 | | | 961,100 |
| | | | | | | |
Diversified Telecommunication Services 0.0%d | | | | | | | |
fPTV Inc., 10.00%, pfd., A | | United Kingdom | | 4,289 | | | 5,147 |
| | | | | | | |
Total Preferred Stocks (Cost $973,967) | | | | | | | 966,247 |
| | | | | | | |
Options Purchased 0.4% | | | | | | | |
Call Options 0.0%d | | | | | | | |
a,fOwens Corning Inc., exercise price $37.50, expiration date 1/02/08, shares | | United States | | 61,197 | | | 3,060 |
| | | | | | | |
MD-17
Franklin Templeton Variable Insurance Products Trust
Statement of Investments, December 31, 2007 (continued)
| | | | | | | | |
| Mutual Discovery Securities Fund | | Country | | Shares/
Warrants/
Contracts | | | Value |
Long Term Investment (continued) | | | | | | | | |
Options Purchased (continued) | | | | | | | | |
Put Options 0.4% | | | | | | | | |
aIndex basket consisting of 80% Dow Jones EUROSTOXX 50 (exercise price $4,018.50), 20% S&P 500 Index (exercise price $1,362.92), expiration date 5/23/08, contracts | | United States | | 517,000 | | | $ | 1,128,933 |
aIndex basket consisting of 80% Dow Jones EUROSTOXX 50 (exercise price $4,029.17), 20% S&P 500 Index (exercise price $1,368.36), expiration date 5/29/08, contracts | | United States | | 517,000 | | | | 1,241,834 |
aIndex basket consisting of 80% Dow Jones EUROSTOXX 50 (exercise price $4,059.77), 20% S&P 500 Index (exercise price $1,379.26), expiration date 6/20/08, contracts | | United States | | 517,000 | | | | 1,417,161 |
aIndex basket consisting of 80% Dow Jones EUROSTOXX 50 (exercise price $4,089.42), 20% S&P 500 Index (exercise price $1,380.37), expiration date 6/20/08, contracts | | United States | | 517,000 | | | | 1,559,789 |
aIndex basket consisting of 70% Dow Jones EUROSTOXX 50 (exercise price $4,083.52), 30% S&P 500 Index (exercise price $1,393.76), expiration date 7/18/08, contracts | | United States | | 520,000 | | | | 1,814,800 |
aIndex basket consisting of 70% Dow Jones EUROSTOXX 50 (exercise price $3,919.03), 30% S&P 500 Index (exercise price $1,343.00), expiration date 8/15/08, contracts | | United States | | 505,000 | | | | 1,497,830 |
| | | | | | | | |
| | | | | | | | 8,660,347 |
| | | | | | | | |
Total Options Purchased (Cost $8,942,429) | | | | | | | | 8,663,407 |
| | | | | | | | |
| | | |
| | | | | Principal
Amountk | | | |
Corporate Bonds & Notes 0.9% | | | | | | | | |
bACE Aviation Holdings Inc., cvt., 144A, 4.25%, 6/01/35 | | Canada | | 234,000 | CAD | | | 266,083 |
e,fCerberus CG Investor I LLC, 12.00%, 7/31/14 | | United States | | 1,897,400 | | | | 1,597,566 |
e,fCerberus CG Investor II LLC, 12.00%, 7/31/14 | | United States | | 1,897,400 | | | | 1,597,566 |
e,fCerberus CG Investor III LLC, 12.00%, 7/31/14 | | United States | | 948,700 | | | | 798,783 |
e,fCerberus FIM Investors Auto Finance LLC, 12.00%, 11/22/13 | | United States | | 1,794,300 | | | | 962,698 |
e,fCerberus FIM Investors Commercial Finance LLC, 12.00%, 11/22/13 | | United States | | 149,561 | | | | 80,244 |
e,fCerberus FIM Investors Commercial Mortgage LLC, 12.00%, 11/22/13 | | United States | | 280,330 | | | | 150,406 |
e,fCerberus FIM Investors Insurance LLC, 12.00%, 11/22/13 | | United States | | 1,371,111 | | | | 735,644 |
e,fCerberus FIM Investors Rescap LLC, 12.00%, 11/22/13 | | United States | | 2,552,726 | | | | 1,369,616 |
e,fDecisionOne Corp., | | | | | | | | |
12.00%, 4/15/10 | | United States | | 26,844 | | | | 26,844 |
lFRN, 9.50%, 5/12/09 | | United States | | 5,008 | | | | 5,008 |
Groupe Eurotunnel SA, cvt., | | | | | | | | |
3.00%, 6/28/09 | | France | | 500 | EUR | | | 1,605 |
3.00%, 6/28/09 | | France | | 682 | GBP | | | 2,981 |
3.00%, 7/28/10 | | France | | 394,500 | EUR | | | 1,137,034 |
3.00%, 7/28/10 | | France | | 267,617 | GBP | | | 1,050,189 |
6.00%, 7/28/10 | | France | | 921,000 | EUR | | | 1,807,763 |
6.00%, 7/28/10 | | France | | 689,297 | GBP | | | 1,842,111 |
sub bond, T1, 3.00%, 7/28/08 | | France | | 500 | EUR | | | 1,788 |
sub bond, T1, 3.00%, 7/28/08 | | France | | 682 | GBP | | | 3,320 |
e,f,gInternational Automotive Components Group NA LLC, 9.00%, 4/01/17 | | United States | | 407,500 | | | | 407,500 |
e,f,lMotor Coach Industries International Inc., FRN, 18.081%, 12/01/08 | | United States | | 2,243,221 | | | | 2,220,789 |
Trump Entertainment Resorts Inc., 8.50%, 5/20/15 | | United States | | 1,460,337 | | | | 1,118,983 |
eTVMAX Holdings Inc., PIK, | | | | | | | | |
11.50%, 2/28/08 | | United States | | 17,370 | | | | 12,159 |
14.00%, 2/28/08 | | United States | | 51,790 | | | | 36,253 |
| | | | | | | | |
Total Corporate Bonds & Notes (Cost $20,856,060) | | | | | | | | 17,232,933 |
| | | | | | | | |
MD-18
Franklin Templeton Variable Insurance Products Trust
Statement of Investments, December 31, 2007 (continued)
| | | | | | | | |
| Mutual Discovery Securities Fund | | Country | | Principal
Amountk | | Value | |
Long Term Investment (continued) | | | | | | | | |
Corporate Bonds & Notes in Reorganization 0.2% | | | | | | | | |
bCalpine Corp., senior secured note, 144A, | | | | | | | | |
8.50%, 7/15/10 | | United States | | 744,000 | | $ | 799,800 | |
9.875%, 12/01/11 | | United States | | 262,000 | | | 275,100 | |
8.75%, 7/15/13 | | United States | | 394,000 | | | 425,520 | |
mDana Corp., | | | | | | | | |
6.50%, 3/01/09 | | United States | | 562,000 | | | 424,310 | |
5.85%, 1/15/15 | | United States | | 1,607,000 | | | 1,181,145 | |
7.00%, 3/01/29 | | United States | | 388,000 | | | 292,940 | |
senior note, 7.00%, 3/15/28 | | United States | | 116,000 | | | 85,260 | |
e,mSafety Kleen Services, senior sub. note, 9.25%, 6/01/08 | | United States | | 3,000 | | | 15 | |
| | | | | | | | |
Total Corporate Bonds & Notes in Reorganization
(Cost $3,332,894) | | | | | | | 3,484,090 | |
| | | | | | | | |
Total Long Term Investments (Cost $1,249,986,799) | | | | | | | 1,704,638,148 | |
| | | | | | | | |
Short Term Investments 14.4% | | | | | | | | |
U.S. Government and Agency Securities 14.3% | | | | | | | | |
n,oFHLB, | | | | | | | | |
1/02/08 | | United States | | 33,000,000 | | | 33,000,000 | |
1/03/08 - 12/04/08 | | United States | | 179,218,000 | | | 175,553,348 | |
1/04/08 | | United States | | 60,000,000 | | | 60,000,000 | |
nU.S. Treasury Bills, 4/24/08 - 5/01/08 | | United States | | 19,500,000 | | | 19,294,697 | |
| | | | | | | | |
Total U.S. Government and Agency Securities (Cost $287,602,277) | | | | | | | 287,848,045 | |
| | | | | | | | |
Total Investments before Money Market Fund (Cost $1,537,589,076) | | | | | | | 1,992,486,193 | |
| | | | | | | | |
| | | |
| | | | | Shares | | | |
pInvestments from Cash Collateral Received for Loaned Securities 0.1% | | | | | | | | |
Money Market Fund (Cost $1,064,173) 0.1% | | | | | | | | |
qBank of New York Institutional Cash Reserve Fund, 5.06% | | United States | | 1,064,173 | | | 1,064,173 | |
| | | | | | | | |
Total Investments (Cost $1,538,653,249) 99.2% | | | | | | | 1,993,550,366 | |
Securities Sold Short (0.6)% | | | | | | | (12,372,476 | ) |
Net Unrealized Loss on Forward Exchange Contracts (0.1)% | | | | | | | (1,476,760 | ) |
Other Assets, less Liabilities 1.5% | | | | | | | 30,534,143 | |
| | | | | | | | |
Net Assets 100.0% | | | | | | $ | 2,010,235,273 | |
| | | | | | | | |
rSecurities Sold Short (Proceeds $12,961,549)0.6% | | | | | | | | |
Commercial Banks 0.6% | | | | | | | | |
Toronto-Dominion Bank | | Canada | | 176,876 | | $ | 12,372,476 | |
| | | | | | | | |
Currency Abbreviations
CAD - Canadian Dollar
EUR - Euro
GBP - British Pound
MD-19
Franklin Templeton Variable Insurance Products Trust
Statement of Investments, December 31, 2007 (continued)
Mutual Discovery Securities Fund
Selected Portfolio Abbreviations
ADR - American Depository Receipt
FHLB - Federal Home Loan Bank
FRN - Floating Rate Note
PIK - Payment-In-Kind
REIT - Real Estate Investment Trust
a Non-income producing for the twelve months ended December 31, 2007.
bSecurity was purchased pursuant to Rule 144A under the Securities Act of 1933 and may be sold in transactions exempt from registration only to qualified institutional buyers or in a public offering registered under the Securities Act of 1933. These securities have been deemed liquid under guidelines approved by the Trust’s Board of Trustees. At December 31, 2007, the aggregate value of these securities was $1,922,410, representing less than 0.1% of net assets.
cContingent distributions represent the right to receive additional distributions, if any, during the reorganization of the underlying company. Shares represent total underlying principal of debt securities.
dRounds to less than 0.1% of net assets.
eSecurity has been deemed illiquid because it may not be able to be sold within seven days. At December 31, 2007, the aggregate value of these securities was $49,997,558, representing 2.49% of net assets.
fSee Note 10 regarding restricted securities.
gSee Note 13 regarding other considerations.
hSee Note 12 regarding holdings of 5% voting securities.
iA portion or all of the security is on loan as of December 31, 2007. See Note 1(h).
jSee Note 1(c) regarding securities purchased on a delayed delivery basis.
kThe principal amount is stated in U.S. dollars unless otherwise indicated.
lThe coupon rate shown represents the rate at period end.
mSee Note 8 regarding defaulted securities.
nThe security is traded on a discount basis with no stated coupon rate.
oSecurity or a portion of the security has been segregated as collateral for securities sold short. At December 31, 2007, the value of these securities and cash pledged amounted to $9,873,680.
pSee Note 1(h) regarding securities on loan.
qThe rate shown is the annualized seven-day yield at period end.
rSee Note 1(g) regarding securities sold short.
The accompanying notes are an integral part of these financial statements.
MD-20
Franklin Templeton Variable Insurance Products Trust
Financial Statements
Statement of Assets and Liabilities
December 31, 2007
| | | |
| | | Mutual
Discovery
Securities Fund |
Assets: | | | |
Investments in securities: | | | |
Cost - Unaffiliated issuers | | $ | 1,530,653,249 |
Cost - Non-controlled affiliated issuers (Note 12) | | | 8,000,000 |
| | | |
Total cost of investments | | $ | 1,538,653,249 |
| | | |
Value - Unaffiliated issuers (includes securities loaned in the amount of $975,434) | | $ | 1,985,550,366 |
Value - Non-controlled affiliated issuers (Note 12) | | | 8,000,000 |
| | | |
Total value of investments | | | 1,993,550,366 |
Cash | | | 128,655 |
Cash on deposit with brokers for securities sold short | | | 13,722,744 |
Foreign currency, at value (cost $9,484,288) | | | 9,482,647 |
Receivables: | | | |
Capital shares sold | | | 9,187,975 |
Dividends and interest | | | 2,480,721 |
Unrealized gain on forward exchange contracts (Note 7) | | | 5,731,514 |
| | | |
Total assets | | | 2,034,284,622 |
| | | |
Liabilities: | | | |
Payables: | | | |
Investment securities purchased | | | 670,098 |
Capital shares redeemed | | | 70,540 |
Affiliates | | | 2,325,003 |
Securities sold short, at value (proceeds $12,961,549 ) | | | 12,372,476 |
Payable upon return of securities loaned | | | 1,064,173 |
Unrealized loss on forward exchange contracts (Note 7) | | | 7,208,274 |
Accrued expenses and other liabilities | | | 338,785 |
| | | |
Total liabilities | | | 24,049,349 |
| | | |
Net assets, at value | | $ | 2,010,235,273 |
| | | |
Net assets consist of: | | | |
Paid-in capital | | $ | 1,454,020,773 |
Undistributed net investment income | | | 33,940,612 |
Net unrealized appreciation (depreciation) | | | 454,043,029 |
Accumulated net realized gain (loss) | | | 68,230,859 |
| | | |
Net assets, at value | | $ | 2,010,235,273 |
| | | |
Class 1: | | | |
Net assets, at value | | $ | 142,750,884 |
| | | |
Shares outstanding | | | 5,928,370 |
| | | |
Net asset value and maximum offering price per share | | $ | 24.08 |
| | | |
Class 2: | | | |
Net assets, at value | | $ | 1,867,484,389 |
| | | |
Shares outstanding | | | 78,817,772 |
| | | |
Net asset value and maximum offering price per share | | $ | 23.69 |
| | | |
The accompanying notes are an integral part of these financial statements.
MD-21
Franklin Templeton Variable Insurance Products Trust
Financial Statements (continued)
Statement of Operations
for the year ended December 31, 2007
| | | | |
| | | Mutual
Discovery
Securities Fund | |
Investment Income: | | | | |
Dividends (net of foreign taxes of $2,819,714) | | $ | 42,830,464 | |
Interest (net of foreign taxes of $279) | | | 10,421,435 | |
Income from securities loaned | | | 461,359 | |
| | | | |
Total investment income | | | 53,713,258 | |
| | | | |
Expenses: | | | | |
Management fees (Note 3a) | | | 14,657,638 | |
Administrative fees (Note 3b) | | | 1,949,154 | |
Distribution fees - Class 2 (Note 3c) | | | 4,215,372 | |
Unaffiliated transfer agent fees | | | 26,067 | |
Custodian fees (Note 4) | | | 486,504 | |
Reports to shareholders | | | 326,396 | |
Professional fees | | | 248,648 | |
Trustees’ fees and expenses | | | 7,985 | |
Dividends on securities sold short | | | 75,539 | |
Other | | | 27,882 | |
| | | | |
Total expenses | | | 22,021,185 | |
Expense reductions (Note 4) | | | (8,544 | ) |
| | | | |
Net expenses | | | 22,012,641 | |
| | | | |
Net investment income | | | 31,700,617 | |
| | | | |
Realized and unrealized gains (losses): | | | | |
Net realized gain (loss) from: | | | | |
Investments | | | 125,663,869 | |
Written options | | | 10,666 | |
Foreign currency transactions | | | (48,568,198 | ) |
Securities sold short | | | (1,733,480 | ) |
Synthetic equity swaps | | | (98,379 | ) |
| | | | |
Net realized gain (loss) | | | 75,274,478 | |
| | | | |
Net change in unrealized appreciation (depreciation) on: | | | | |
Investments | | | 77,437,263 | |
Translation of assets and liabilities denominated in foreign currencies | | | 3,440,669 | |
| | | | |
Net change in unrealized appreciation (depreciation) | | | 80,877,932 | |
| | | | |
Net realized and unrealized gain (loss) | | | 156,152,410 | |
| | | | |
Net increase (decrease) in net assets resulting from operations | | $ | 187,853,027 | |
| | | | |
The accompanying notes are an integral part of these financial statements.
MD-22
Franklin Templeton Variable Insurance Products Trust
Financial Statements (continued)
Statements of Changes in Net Assets
| | | | | | | | |
| | | Mutual Discovery
Securities Fund | |
| | | Year Ended December 31, | |
| | | 2007 | | | 2006 | |
| | | | |
Increase (decrease) in net assets: | | | | | | | | |
Operations: | | | | | | | | |
Net investment income | | $ | 31,700,617 | | | $ | 26,631,756 | |
Net realized gain (loss) from investments, written options, securities sold short, synthetic equity swaps and foreign currency transactions | | | 75,274,478 | | | | 26,416,477 | |
Net change in unrealized appreciation (depreciation) on investments and translation of assets and liabilities denominated in foreign currencies | | | 80,877,932 | | | | 195,854,759 | |
| | | | |
Net increase (decrease) in net assets resulting from operations | | | 187,853,027 | | | | 248,902,992 | |
| | | | |
Distributions to shareholders from: | | | | | | | | |
Net investment income: | | | | | | | | |
Class 1 | | | (2,332,175 | ) | | | (1,654,863 | ) |
Class 2 | | | (24,421,554 | ) | | | (10,700,682 | ) |
Net realized gains: | | | | | | | | |
Class 1 | | | (1,723,058 | ) | | | (5,135,991 | ) |
Class 2 | | | (20,089,859 | ) | | | (37,836,145 | ) |
| | | | |
Total distributions to shareholders | | | (48,566,646 | ) | | | (55,327,681 | ) |
| | | | |
Capital share transactions: (Note 2) | | | | | | | | |
Class 1 | | | (16,311,111 | ) | | | (12,800,335 | ) |
Class 2 | | | 375,475,744 | | | | 382,526,706 | |
| | | | |
Total capital share transactions | | | 359,164,633 | | | | 369,726,371 | |
| | | | |
Net increase (decrease) in net assets | | | 498,451,014 | | | | 563,301,682 | |
Net assets | | | | | | | | |
Beginning of year | | | 1,511,784,259 | | | | 948,482,577 | |
| | | | |
End of year | | $ | 2,010,235,273 | | | $ | 1,511,784,259 | |
| | | | |
Undistributed net investment income included in net assets: | | | | | | | | |
End of year | | $ | 33,940,612 | | | $ | 23,989,880 | |
| | | | |
The accompanying notes are an integral part of these financial statements.
MD-23
Franklin Templeton Variable Insurance Products Trust
Notes to Financial Statements
Mutual Discovery Securities Fund
1. ORGANIZATION AND SIGNIFICANT ACCOUNTING POLICIES
Franklin Templeton Variable Insurance Products Trust (Trust) is registered under the Investment Company Act of 1940, as amended, (1940 Act) as an open-end investment company, consisting of twenty-three separate funds. The Mutual Discovery Securities Fund (Fund) included in this report is diversified. The financial statements of the remaining funds in the Trust are presented separately. Shares of the Fund are sold only to insurance company separate accounts to fund the benefits of variable life insurance policies or variable annuity contracts. The Fund offers two classes of shares: Class 1 and Class 2. Each class of shares differs by its distribution fees, voting rights on matters affecting a single class and its exchange privilege.
The following summarizes the Fund’s significant accounting policies.
a. Security Valuation
Securities listed on a securities exchange or on the NASDAQ National Market System are valued at the last quoted sale price or the official closing price of the day, respectively. Over-the-counter securities and listed securities for which there is no reported sale are valued within the range of the most recent quoted bid and ask prices. Securities that trade in multiple markets or on multiple exchanges are valued according to the broadest and most representative market. Investments in open-end mutual funds are valued at closing net asset value.
Corporate debt securities and government securities generally trade in the over-the-counter market rather than on a securities exchange. The Trust may utilize independent pricing services, quotations from bond dealers, and information with respect to bond and note transactions, to assist in determining a current market value for each security. The Trust’s pricing services may use valuation models or matrix pricing which considers information with respect to comparable bond and note transactions, quotations from bond dealers, or by reference to other securities that are considered comparable in such characteristics as rating, interest rate and maturity date, option adjusted spread models, prepayment projections, interest rate spreads and yield curves, to determine current value.
Foreign securities are valued as of the close of trading on the foreign stock exchange on which the security is primarily traded, or the NYSE, whichever is earlier. If no sale is reported at that time, the foreign security will be valued within the range of the most recent quoted bid and ask prices. The value is then converted into its U.S. dollar equivalent at the foreign exchange rate in effect at the close of the NYSE on the day that the value of the foreign security is determined.
The Trust has procedures to determine the fair value of individual securities and other assets for which market prices are not readily available or which may not be reliably priced. Methods for valuing these securities may include: fundamental analysis, matrix pricing, discounts from market prices of similar securities, or discounts applied due to the nature and duration of restrictions on the disposition of the securities. Due to the inherent uncertainty of valuations of such securities, the fair values may differ significantly from the values that would have been used had a ready market for such investments existed. Occasionally, events occur between the time at which trading in a security is completed and the close of the NYSE that might call into question the availability (including the reliability) of the value of a portfolio security held by the Fund. The investment manager monitors price movements following the close of trading in foreign stock markets through a series of country specific market proxies (such as baskets of American Depository Receipts, futures contracts and exchange traded funds). These price movements are measured against established trigger thresholds for each specific market proxy to assist in determining if an event has occurred. If such an event occurs, the securities may be valued using fair value procedures, which may include the use of independent pricing services. All security valuation procedures are approved by the Trust’s Board of Trustees.
b. Foreign Currency Translation
Portfolio securities and other assets and liabilities denominated in foreign currencies are translated into U.S. dollars based on the exchange rate of such currencies against U.S. dollars on the date of valuation. Purchases and sales of securities, income and expense items denominated in foreign currencies are translated into U.S. dollars at the exchange rate in effect on the transaction date. Occasionally, events may impact the availability or reliability of foreign exchange rates used to convert the U.S. dollar
MD-24
Franklin Templeton Variable Insurance Products Trust
Notes to Financial Statements (continued)
Mutual Discovery Securities Fund
1. ORGANIZATION AND SIGNIFICANT ACCOUNTING POLICIES (continued)
b. Foreign Currency Translation (continued)
equivalent value. If such an event occurs, the foreign exchange rate will be valued at fair value using procedures established and approved by the Trust’s Board of Trustees.
The Fund does not separately report the effect of changes in foreign exchange rates from changes in market prices on securities held. Such changes are included in net realized and unrealized gain or loss from investments on the Statement of Operations.
Realized foreign exchange gains or losses arise from sales of foreign currencies, currency gains or losses realized between the trade and settlement dates on securities transactions and the difference between the recorded amounts of dividends, interest, and foreign withholding taxes and the U.S. dollar equivalent of the amounts actually received or paid. Net unrealized foreign exchange gains and losses arise from changes in foreign exchange rates on foreign denominated assets and liabilities other than investments in securities held at the end of the reporting period.
c. Securities Purchased on a When-Issued or Delayed Delivery Basis
The Fund may purchase securities on a when-issued or delayed delivery basis, with payment and delivery scheduled for a future date. These transactions are subject to market fluctuations and are subject to the risk that the value at delivery may be more or less than the trade date purchase price. Although the Fund will generally purchase these securities with the intention of holding the securities, it may sell the securities before the settlement date. Sufficient assets have been segregated for these securities.
d. Foreign Currency Contracts
When the Fund purchases or sells foreign securities it may enter into foreign exchange contracts to minimize foreign exchange risk from the trade date to the settlement date of the transactions. A foreign exchange contract is an agreement between two parties to exchange different currencies at an agreed upon exchange rate at a future date. Realized and unrealized gains and losses on these contracts are included in the Statement of Operations.
The Fund may also enter into forward exchange contracts to hedge against fluctuations in foreign exchange rates. These contracts are valued daily by the Fund and the unrealized gains or losses on the contracts, as measured by the difference between the contractual forward foreign exchange rates and the forward rates at the reporting date, are included in the Statement of Assets and Liabilities. Realized and unrealized gains and losses on these contracts are included in the Statement of Operations.
The risks of these contracts include movement in the values of the foreign currencies relative to the U.S. dollar and the possible inability of the counterparties to fulfill their obligations under the contracts, which may be in excess of the amount reflected in the Statement of Assets and Liabilities.
e. Synthetic Equity Swaps
The Fund may engage in synthetic equity swaps. Synthetic equity swaps are contracts entered into between a broker and the Fund under which the parties agree to make payments to each other so as to replicate the economic consequences that would apply had a purchase or short sale of the underlying security taken place. Upon entering into synthetic equity swaps, the Fund is required to pledge to the broker an amount of cash and/or other assets equal to a certain percentage of the contract amount (margin account). Periodically, payments are made to recognize changes in value of the contract resulting from interest on the notional value of the contract, market value changes in the underlying security, and/or dividends paid by the issuer of the underlying security. The Fund recognizes a realized gain or loss when cash is received from, or paid to, the broker. Synthetic equity swaps are valued daily by the Fund and the unrealized gains or losses on the contracts (as measured by the difference between the contract amount plus or minus cash received or paid and the market value of the underlying securities) are recorded in the Statement of Operations. The margin account and any net unrealized gains or losses on open synthetic equity swaps are
MD-25
Franklin Templeton Variable Insurance Products Trust
Notes to Financial Statements (continued)
Mutual Discovery Securities Fund
1. ORGANIZATION AND SIGNIFICANT ACCOUNTING POLICIES (continued)
e. Synthetic Equity Swaps (continued)
included in the Statement of Assets and Liabilities. The risks of entering into synthetic equity swaps include unfavorable price movements in the underlying securities or the inability of the counterparties to fulfill their obligations under the contract.
f. Options
The Fund may purchase or write options. Options are contracts entitling the holder to purchase or sell a specified number of shares or units of a particular security or index at a specified price. Options purchased are recorded as investments; options written (sold) are recorded as liabilities. Upon closing of an option, other than by exercise, which results in a cash settlement, the difference between the premium (original option value) and the settlement proceeds is realized as a gain or loss. When securities are acquired or delivered upon exercise of an option, the acquisition cost or sale proceeds are adjusted by the amount of the premium. When an option is closed, the difference between the premium and the cost to close the position is realized as a gain or loss. When an option expires, the premium is realized as a gain for options written or as a loss for options purchased. The risks include the possibility there may be an illiquid options market or the inability of the counterparties to fulfill their obligations under the contract. Writing options involves, to varying degrees, elements of market risk in excess of the amount recognized in the Statement of Assets and Liabilities.
g. Securities Sold Short
The Fund is engaged in selling securities short, which obligates the fund to replace a borrowed security with the same security at current market value. The Fund incurs a loss if the price of the security increases between the date of the short sale and the date on which the Fund replaces the borrowed security. The Fund realizes a gain if the price of the security declines between those dates. Gains are limited to the price at which the Fund sold the security short, while losses are potentially unlimited in size.
The Fund is required to establish a margin account with the broker lending the security sold short. While the short sale is outstanding, the broker retains the proceeds of the short sale and the Fund must maintain a deposit with broker consisting of cash and securities having a value equal to a specified percentage of the value of the securities sold short. The Fund is obligated to pay the counterparty any dividends or interest due on securities sold short. Such dividends and interest are recorded as an expense to the Fund.
h. Securities Lending
The Fund may loan securities to certain brokers through a securities lending agent for which it receives initial cash collateral against the loaned securities in an amount equal to at least 102% of the market value of the loaned securities. Collateral is maintained over the life of the loan in an amount not less than 100% of the market value of loaned securities, as determined at the close of fund business each day; any additional collateral required due to changes in security values is delivered to the Fund on the next business day. The collateral is invested in short-term instruments as noted in the Statement of Investments. The Fund receives interest income from the investment of cash collateral, adjusted by lender fees and broker rebates. The Fund bears the risk of loss with respect to the investment of the collateral and the securities loaned. The securities lending agent has agreed to indemnify the Fund in the case of default of any securities borrower.
i. Income Taxes
No provision has been made for U.S. income taxes because it is the Fund’s policy to qualify as a regulated investment company under the Internal Revenue Code and to distribute to shareholders substantially all of its taxable income and net realized gains.
Foreign securities held by the Fund may be subject to foreign taxation on dividend and interest income received. Foreign taxes, if any, are recorded based on the tax regulations and rates that exist in the foreign markets in which the Fund invests
MD-26
Franklin Templeton Variable Insurance Products Trust
Notes to Financial Statements (continued)
Mutual Discovery Securities Fund
1. ORGANIZATION AND SIGNIFICANT ACCOUNTING POLICIES (continued)
j. Security Transactions, Investment Income, Expenses and Distributions
Security transactions are accounted for on trade date. Realized gains and losses on security transactions are determined on a specific identification basis. Interest income and estimated expenses are accrued daily. Amortization of premium and accretion of discount on debt securities are included in interest income. Dividend income and dividends declared on securities sold short are recorded on the ex-dividend date except that certain dividends from foreign securities are recognized as soon as the Fund is notified of the ex-dividend date. Distributions to shareholders are recorded on the ex-dividend date and are determined according to income tax regulations (tax basis). Distributable earnings determined on a tax basis may differ from earnings recorded in accordance with accounting principles generally accepted in the United States of America. These differences may be permanent or temporary. Permanent differences are reclassified among capital accounts to reflect their tax character. These reclassifications have no impact on net assets or the results of operations. Temporary differences are not reclassified, as they may reverse in subsequent periods.
Common expenses incurred by the Trust are allocated among the funds based on the ratio of net assets of each fund to the combined net assets of the Trust. Fund specific expenses are charged directly to the fund that incurred the expense.
Realized and unrealized gains and losses and net investment income, other than class specific expenses, are allocated daily to each class of shares based upon the relative proportion of net assets of each class. Differences in per share distributions, by class, are generally due to differences in class specific expenses.
k. Accounting Estimates
The preparation of financial statements in accordance with accounting principles generally accepted in the United States of America requires management to make estimates and assumptions that affect the reported amounts of assets and liabilities at the date of the financial statements and the amounts of income and expenses during the reporting period. Actual results could differ from those estimates.
l. Guarantees and Indemnifications
Under the Trust’s organizational documents, its officers and trustees are indemnified by the Trust against certain liabilities arising out of the performance of their duties to the Trust. Additionally, in the normal course of business, the Trust, on behalf of the Fund, enters into contracts with service providers that contain general indemnification clauses. The Trust’s maximum exposure under these arrangements is unknown as this would involve future claims that may be made against the Trust that have not yet occurred. Currently, the Trust expects the risk of loss to be remote.
2. SHARES OF BENEFICIAL INTEREST
At December 31, 2007, there were an unlimited number of shares authorized (without par value). Transactions in the Fund’s shares were as follows:
| | | | | | | | | | | | | | |
| | | Year Ended December 31, 2007 | |
| | | 2007 | | | 2006 | |
| Class 1 Shares: | | Shares | | | Amount | | | Shares | | | Amount | |
Shares sold | | 259,646 | | | $ | 6,152,126 | | | 560,215 | | | $ | 11,842,450 | |
Shares issued in reinvestment of distributions | | 167,641 | | | | 4,055,233 | | | 364,316 | | | | 6,790,854 | |
Shares redeemed | | (1,129,651 | ) | | | (26,518,470 | ) | | (1,535,410 | ) | | | (31,433,639 | ) |
| | | | |
Net increase (decrease) | | (702,364 | ) | | $ | (16,311,111 | ) | | (610,879 | ) | | $ | (12,800,335 | ) |
| | | | |
MD-27
Franklin Templeton Variable Insurance Products Trust
Notes to Financial Statements (continued)
Mutual Discovery Securities Fund
2. SHARES OF BENEFICIAL INTEREST (continued)
| | | | | | | | | | | | | | |
| | | Year Ended December 31, 2007 | |
| | | 2007 | | | 2006 | |
| Class 2 Shares: | | Shares | | | Amount | | | Shares | | | Amount | |
Shares sold | | 22,660,989 | | | $ | 527,810,165 | | | 20,972,557 | | | $ | 419,453,988 | |
Shares issued in reinvestment of distributions | | 1,867,089 | | | | 44,511,413 | | | 2,639,305 | | | | 48,536,827 | |
Shares redeemed | | (8,565,570 | ) | | | (196,845,834 | ) | | (4,402,792 | ) | | | (85,464,109 | ) |
| | | | |
Net increase (decrease) | | 15,962,508 | | | $ | 375,475,744 | | | 19,209,070 | | | $ | 382,526,706 | |
| | | | |
3. TRANSACTIONS WITH AFFILIATES
Franklin Resources, Inc. is the holding company for various subsidiaries that together are referred to as Franklin Templeton Investments. Certain officers and trustees of the Trust are also officers and/or directors of the following subsidiaries:
| | |
| Subsidiary | | Affiliation |
Franklin Mutual Advisers, LLC (Franklin Mutual) | | Investment manager |
Franklin Templeton Investment Management Limited (FTIML) | | Investment manager |
Franklin Templeton Services, LLC (FT Services) | | Administrative manager |
Franklin Templeton Distributors, Inc. (Distributors) | | Principal underwriter |
Franklin Templeton Investor Services, LLC (Investor Services) | | Transfer agent |
a. Management Fees
The Fund pays an investment management fee to Franklin Mutual based on the average daily net assets of the Funds as follows:
| | |
| Annualized Fee Rate | | Net Assets |
| 0.800% | | Up to and including $4 billion |
| 0.770% | | Over $4 billion, up to and including $7 billion |
| 0.750% | | Over $7 billion, up to and including $10 billion |
| 0.730% | | In excess of $10 billion |
Under a subadvisory agreement, FTIML, an affiliate of Franklin Mutual, provides subadvisory services to the Fund and receives from Franklin Mutual fees based on the average daily net assets of the Fund.
b. Administrative Fees
The Fund pays an administrative fee to FT Services based on the average daily net assets as follows:
| | |
| Annualized Fee Rate | | Net Assets |
| 0.150% | | Up to and including $200 million |
| 0.135% | | Over $200 million, up to and including $700 million |
| 0.100% | | Over $700 million, up to and including $1.2 billion |
| 0.075% | | In excess of $1.2 billion |
c. Distribution Fees
The Fund’s Board of Trustees has adopted a distribution plan for Class 2 shares pursuant to Rule 12b-1 under the 1940 Act. Under the Fund’s compensation distribution plan, the Fund pays Distributors for costs incurred in connection with the servicing, sale and distribution of the Fund’s shares up to 0.35% per year of its average daily net assets. The Board of Trustees has agreed to limit the current rate to 0.25% per year.
MD-28
Franklin Templeton Variable Insurance Products Trust
Notes to Financial Statements (continued)
Mutual Discovery Securities Fund
3. TRANSACTIONS WITH AFFILIATES (continued)
d. Transfer Agent Fees
Investor Services, under terms of an agreement, performs shareholder servicing for the Fund and is not paid by the Fund for the services.
4. EXPENSE OFFSET ARRANGEMENT
The Fund has entered into an arrangement with its custodian whereby credits realized as a result of uninvested cash balances are used to reduce a portion of the Fund’s custodian expenses. During the year ended December 31, 2007, the custodian fees were reduced as noted in the Statement of Operations.
5. INCOME TAXES
The Fund has reviewed the tax positions taken on federal income tax returns, for each of the three open tax years and as of December 31, 2007 and has determined that no provision for income tax is required in the Fund’s financial statements.
The tax character of distributions paid during the years ended December 31, 2007 and 2006, was as follows:
| | | | | | |
| | | 2007 | | 2006 |
Distributions paid from: | | | | | | |
Ordinary income | | $ | 27,339,679 | | $ | 22,191,727 |
Long term capital gain | | | 21,226,967 | | | 33,135,954 |
| | | |
| | $ | 48,566,646 | | $ | 55,327,681 |
| | | |
At December 31, 2007, the cost of investments, net unrealized appreciation (depreciation), undistributed ordinary income and undistributed long term capital gains for income tax purposes were as follows:
| | | | |
Cost of investments | | $ | 1,540,769,220 | |
| | | | |
| |
Unrealized appreciation | | $ | 528,576,230 | |
Unrealized depreciation | | | (75,795,084 | ) |
| | | | |
Net unrealized appreciation (depreciation) | | $ | 452,781,146 | |
| | | | |
| | | |
Undistributed ordinary income | | $ | 38,852,151 |
Undistributed long term capital gains | | | 65,158,713 |
| | | |
Distributable earnings | | $ | 104,010,864 |
| | | |
Net investment income differs for financial statement and tax purposes primarily due to differing treatment(s) of defaulted securities, foreign currency transactions, passive foreign investment company shares, pass-through entity income and bond discounts and premiums.
Net realized gains (losses) differ for financial statement and tax purposes primarily due to differing treatment(s) of wash sales, foreign currency transactions, pass-through entity income and bond discounts and premiums.
MD-29
Franklin Templeton Variable Insurance Products Trust
Notes to Financial Statements (continued)
Mutual Discovery Securities Fund
6. INVESTMENT TRANSACTIONS
Purchases and sales of investments (excluding short term securities and securities sold short) for the year ended December 31, 2007, aggregated $629,092,716 and $469,386,900, respectively.
Transactions in options written during the year ended December 31, 2007, were as follows:
| | | | | | | |
| | | Number of
Contracts | | | Premiums
Received | |
Options outstanding at December 31, 2006 | | 90 | | | $ | 10,274 | |
Options written | | 4 | | | | 392 | |
Options expired | | (94 | ) | | | (10,666 | ) |
Options exercised | | — | | | | — | |
Options closed | | — | | | | — | |
| | | |
Options outstanding at December 31, 2007 | | — | | | $ | — | |
| | | |
7. FORWARD EXCHANGE CONTRACTS
At December 31, 2007, the Fund had the following forward exchange contracts outstanding:
| | | | | | | | | | | | | | |
| | | | | Contract
Amount | | Settlement
Date | | Unrealized
Gain | | Unrealized
Loss | |
| Contracts to Buy | | | | | | | | | | | |
| 9,950,574 | | Swedish Krona | | $ | 1,560,397 | | 1/15/08 | | $ | — | | $ | (21,163 | ) |
| 10,230,870 | | Norwegian Krone | | | 1,850,000 | | 2/19/08 | | | 30,013 | | | — | |
| Contracts to Sell | | | | | | | | | | | |
| 39,994,929 | | British Pound | | | 80,649,190 | | 1/10/08 | | | 1,204,283 | | | — | |
| 2,200,000 | | British Pound | | | 4,360,092 | | 1/10/08 | | | — | | | (9,906 | ) |
| 29,897,031 | | Euro | | | 41,392,674 | | 1/14/08 | | | — | | | (2,249,065 | ) |
| 91,076,988 | | Swedish Krona | | | 14,268,153 | | 1/15/08 | | | 179,634 | | | — | |
| 8,289,256 | | Singapore Dollar | | | 5,557,257 | | 1/24/08 | | | — | | | (204,092 | ) |
| 2,782,445 | | New Zealand Dollar | | | 2,138,365 | | 2/08/08 | | | 15,578 | | | — | |
| 17,712,085 | | Euro | | | 25,082,879 | | 2/13/08 | | | — | | | (781,952 | ) |
| 195,200,000 | | Norwegian Krone | | | 36,026,888 | | 2/19/08 | | | 157,151 | | | — | |
| 116,743,147 | | Norwegian Krone | | | 21,325,160 | | 2/19/08 | | | — | | | (127,432 | ) |
| 30,500,000 | | Euro | | | 45,218,497 | | 2/25/08 | | | 676,484 | | | — | |
| 60,546,038 | | Swiss Franc | | | 54,175,683 | | 3/07/08 | | | 537,208 | | | — | |
| 23,099,862 | | British Pound | | | 46,735,430 | | 3/10/08 | | | 924,462 | | | — | |
| 19,187,316 | | Euro | | | 28,417,374 | | 3/13/08 | | | 395,981 | | | — | |
| 15,436,882 | | Euro | | | 21,944,379 | | 3/13/08 | | | — | | | (599,835 | ) |
| 4,371,863,300 | | Japanese Yen | | | 38,897,540 | | 3/19/08 | | | — | | | (645,851 | ) |
| 11,644,054 | | Canadian Dollar | | | 11,648,713 | | 3/26/08 | | | — | | | (78,547 | ) |
| 32,789,426,560 | | Korean Won | | | 35,931,000 | | 3/27/08 | | | 720,878 | | | — | |
| 608,237,500 | | Korean Won | | | 650,000 | | 3/27/08 | | | — | | | (3,141 | ) |
| 201,041,102 | | Danish Krone | | | 38,226,103 | | 4/23/08 | | | — | | | (1,141,120 | ) |
| 18,982,169 | | Euro | | | 26,956,958 | | 4/24/08 | | | — | | | (760,833 | ) |
| 2,700,000 | | Euro | | | 4,016,426 | | 5/19/08 | | | 74,397 | | | — | |
| 15,000,000 | | Euro | | | 21,315,747 | | 5/19/08 | | | — | | | (584,409 | ) |
| 61,088,249 | | Euro | | | 90,000,724 | | 5/28/08 | | | 815,445 | | | — | |
| 380,000 | | Euro | | | 553,850 | | 5/28/08 | | | — | | | (928 | ) |
| | | | | | | | | | | |
| Unrealized gain (loss) on forward exchange contracts | | | | | | | | 5,731,514 | | | (7,208,274 | ) |
| | | | | | | | | | | |
| Net unrealized gain (loss) on forward exchange contracts | | | | | | | | | | $ | (1,476,760 | ) |
| | | | | | | | | | | | | | |
MD-30
Franklin Templeton Variable Insurance Products Trust
Notes to Financial Statements (continued)
Mutual Discovery Securities Fund
8. CREDIT RISK AND DEFAULTED SECURITIES
The Fund may purchase the pre-default or defaulted debt of distressed companies. Distressed companies are financially troubled and are about to be/or are already involved in financial restructuring or bankruptcy. The Fund does not accrue income on these securities, if it becomes probable that the income will not be collected. Risks associated with purchasing these securities include the possibility that the bankruptcy or other restructuring process takes longer than expected, or that distributions in restructuring are less than anticipated, either or both of which may result in unfavorable consequences to the Fund. At December 31, 2007, the aggregate value of these securities was 1,983,670, representing 0.10% of the Fund’s net assets. For information as to specific securities, see the accompanying Statement of Investments.
9. CONCENTRATION OF RISK
Investing in foreign securities may include certain risks and considerations not typically associated with investing in U.S. securities, such as fluctuating currency values and changing local and regional economic, political and social conditions, which may result in greater market volatility. In addition, certain foreign securities may not be as liquid as U.S. securities.
10. RESTRICTED SECURITIES
The Fund may invest in securities that are restricted under the Securities Act of 1933 (1933 Act) or which are subject to legal, contractual, or other agreed upon restrictions on resale. Restricted securities are often purchased in private placement transactions, and cannot be sold without prior registration unless the sale is pursuant to an exemption under the 1933 Act. Disposal of these securities may require greater effort and expense, and prompt sale at an acceptable price may be difficult. The Fund may have registration rights for restricted securities. The issuer generally incurs all registration costs.
At December 31, 2007, the Fund held investments in restricted securities, excluding 144A securities deemed to be liquid, valued in accordance with procedures approved by the Trust’s Board of Trustees as reflecting fair value, as follows:
| | | | | | | | | | |
Principal
Amount/
Shares/
Warrants/
Contracts | | Issuer | | Acquisition
Dates | | Cost | | Value |
| 17,729 | | AboveNet Inc. | | 10/02/01 - 9/07/07 | | $ | 813,139 | | $ | 886,450 |
| 23 | | AboveNet Inc., stock grants, grant price $20.95,
expiration date, 9/09/13 | | 4/17/06 - 9/08/06 | | | — | | | 953 |
| 628 | | AboveNet Inc., wts., 9/08/08 | | 10/02/01 - 9/07/07 | | | 71,565 | | | 29,642 |
| 739 | | AboveNet Inc., wts., 9/08/10 | | 10/02/01 - 9/07/07 | | | 76,963 | | | 32,280 |
| 800,000 | | The Bankshares Inc. | | 3/22/07 | | | 8,000,000 | | | 8,000,000 |
| 1,897,400 | | Cerberus CG Investor I LLC | | 7/26/07 | | | 1,897,400 | | | 1,597,566 |
| 1,897,400 | | Cerberus CG Investor I LLC, 12.00%, 7/31/14 | | 7/26/07 | | | 1,897,400 | | | 1,597,566 |
| 1,897,400 | | Cerberus CG Investor II LLC | | 7/26/07 | | | 1,897,400 | | | 1,597,566 |
| 1,897,400 | | Cerberus CG Investor II LLC, 12.00%, 7/31/14 | | 7/26/07 | | | 1,897,400 | | | 1,597,566 |
| 948,700 | | Cerberus CG Investor III LLC | | 7/26/07 | | | 948,700 | | | 798,783 |
| 948,700 | | Cerberus CG Investor III LLC, 12.00% 7/13/14 | | 7/26/07 | | | 948,700 | | | 798,783 |
| 598,507 | | Cerberus FIM Investors Auto Finance LLC | | 11/22/06 | | | 598,507 | | | 321,118 |
| 1,794,300 | | Cerberus FIM Investors Auto Finance LLC, 12.00%, 11/22/13 | | 11/21/06 | | | 1,794,300 | | | 962,698 |
| 49,854 | | Cerberus FIM Investors Commercial Finance LLC | | 11/22/06 | | | 49,854 | | | 26,748 |
| 149,561 | | Cerberus FIM Investors Commercial Finance LLC, 12.00% 11/22/13 | | 11/21/06 | | | 149,561 | | | 80,244 |
| 93,443 | | Cerberus FIM Investors Commercial Mortgage LLC | | 11/22/06 | | | 93,443 | | | 50,135 |
| 280,330 | | Cerberus FIM Investors Commercial Mortgage LLC, 12.00%, 11/22/13 | | 11/21/06 | | | 280,330 | | | 150,406 |
| 457,037 | | Cerberus FIM Investors Insurance LLC | | 11/22/06 | | | 457,037 | | | 245,215 |
MD-31
Franklin Templeton Variable Insurance Products Trust
Notes to Financial Statements (continued)
Mutual Discovery Securities Fund
10. RESTRICTED SECURITIES (continued)
| | | | | | | | | | | |
Principal
Amount/
Shares/
Warrants/
Contracts | | | Issuer | | Acquisition
Dates | | Cost | | Value |
| 1,371,111 | | | Cerberus FIM Investors Insurance, LLC, 12.00%, 11/22/13 | | 11/21/06 | | $ | 1,371,111 | | $ | 735,644 |
| 850,909 | | | Cerberus FIM Investors Rescap LLC | | 11/22/06 | | | 850,909 | | | 456,539 |
| 2,552,726 | | | Cerberus FIM Investors Rescap LLC, 12.00%, 11/22/13 | | 11/21/06 | | | 2,552,726 | | | 1,369,616 |
| 9,611 | | | Dana Holding Corp., 4.00%, cvt. pfd., B | | | | | 961,100 | | | 961,100 |
| 21,716 | | | DecisionOne Corp. | | 9/28/99 - 7/18/00 | | | 16,482 | | | — |
| 11,923 | | | Decision One Corp., wts., 6/08/17 | | 7/09/07 | | | — | | | — |
| | | DecisionOne Corp.: | | | | | | | | |
| 26,844 | | | 12.00%, 4/15/10 | | 10/29/99 - 7/18/07 | | | 52,219 | | | 26,844 |
| 5,008 | | | FRN, 9.50%, 5/12/09. | | 7/09/07 | | | 5,008 | | | 5,008 |
| 783 | | | Elephant Capital Holdings Ltd. | | 8/23/04 - 3/22/07 | | | 27,891 | | | 515,519 |
| 324,747 | | | Esmark Inc. | | 7/28/06 | | | 6,014,604 | | | 4,129,553 |
| 451,787 | | | Imagine Group Holdings Ltd. | | 8/31/04 | | | 4,626,977 | | | 5,168,443 |
| 355,744 | | | International Automotive Components Group Brazil LLC | | 4/13/06 - 8/21/06 | | | 212,896 | | | 2,471,044 |
| 74,174 | | | International Automotive Components Group Japan LLC | | 9/26/06 - 3/27/07 | | | 644,542 | | | 665,148 |
| 1,512,200 | | | International Automotive Components Group LLC | | 1/12/06 - 10/16/06 | | | 1,512,946 | | | 1,604,293 |
| 1,353,607 | | | International Automotive Components Group NA LLC | | 3/30/07 | | | 1,351,311 | | | 1,861,210 |
| 407,500 | | | International Automotive Components Group NA LLC, 9.00%, 4/01/17 | | 3/30/07 | | | 413,613 | | | 407,500 |
| 69,402 | | | Kindred Healthcare Inc. | | 5/20/99 - 3/29/06 | | | 647,828 | | | 1,646,979 |
| | | Kindred Healthcare Inc., stock grants: | | | | | | | | |
| 241 | | | grant price $18.15, expiration date, | | 7/17/02 - 7/17/05 | | | — | | | 1,345 |
| 73 | | | grant price $19.87, expiration date, | | 1/13/03 - 1/01/06 | | | — | | | 282 |
| 73 | | | grant price $6.94, expiration date, | | 1/04/04 - 1/03/07 | | | — | | | 1,226 |
| 55 | | | grant price $19.87, expiration date, | | 1/01/05 - 1/03/07 | | | — | | | 212 |
| 30 | | | grant price $21.33, expiration date, | | 1/06/06 - 1/09/07 | | | — | | | 72 |
| 16 | | | grant price $22.08, expiration date, | | 1/09/07 | | | — | | | 26 |
| 2,243,221 | | | Motor Coach Industries International Inc., FRN, 16.32%, 12/01/08 | | 5/27/04 - 8/31/07 | | | 2,243,221 | | | 2,220,789 |
| 1,460,000 | | | MPF Corp. Ltd | | 5/08/06 | | | 7,500,856 | | | 4,835,772 |
| 3,830 | | | NCB Warrant Holdings Ltd., A | | 12/16/05 | | | — | | | 227,241 |
| 2,140 | | | Olympus Re Holdings Ltd. | | 12/19/01 | | | 214,000 | | | 7,009 |
| 61,197 | | | aOwens Corning Inc., exercise price $37.50,
expiration date, 1/02/08, shares | | 1/03/07 | | | 6,404 | | | 3,060 |
| 4,289 | | | PTV Inc., 10.00%, pfd., A | | 12/07/01 - 3/06/02 | | | 12,867 | | | 5,147 |
| | | | | | | | | | | |
| | | Total Restricted Securities (2.40% of Net Assets) | | | | | | | $ | 48,100,340 |
| | | | | | | | | | | |
aThe Fund also invests in unrestricted securities of the issuer, valued at $1,751,072 as of December 31, 2007.
11. UNFUNDED CAPITAL COMMITMENTS
At December 31, 2007, the Fund had total unfunded commitments to investments of $1,998,000.
MD-32
Franklin Templeton Variable Insurance Products Trust
Notes to Financial Statements (continued)
Mutual Discovery Securities Fund
12. HOLDINGS OF 5% VOTING SECURITIES OF PORTFOLIO COMPANIES
The 1940 Act defines “affiliated companies” to include investments in portfolio companies in which a fund owns 5% or more of the outstanding voting securities. Investments in “affiliated companies” for the Fund for the year ended December 31, 2007, were as shown below.
| | | | | | | | | | | | | | | | | | |
| Name of Issuer | | Number of
Shares
Held at
Beginning
of Year | | Gross
Additions | | Gross
Reductions | | Number
of
Shares
Held at
End of
Year | | Value at
End of Year | | Investment
Income | | Realized
Capital
Gain
(Loss) | |
Non-Controlled Affiliates | | | | | | | | | | | | | | | | | | |
The Bankshares Inc. | | — | | 800,000 | | — | | 800,000 | | $ | 8,000,000 | | $ | — | | $ | — | |
| | | | | | | | | | | | |
Total Non-Controlled Affiliates (0.40% of Net Assets) | | | | | | | | | | $ | 8,000,000 | | $ | — | | $ | — | |
| | | | | | | | | | | | |
13. OTHER CONSIDERATIONS
Officers, directors or employees of the Fund’s Investment Manager, may serve from time to time as members of boards of directors of companies in which the Fund invests. Such participation may result in the possession by the Investment Manager of material non-public information which, pursuant to the Fund’s policies and the requirements of applicable securities laws, could prevent the Fund from trading in the securities of such companies for limited or extended periods of time.
14. REGULATORY AND LITIGATION MATTERS
As part of various investigations by a number of federal, state, and foreign regulators and governmental entities, including the Securities and Exchange Commission (“SEC”), relating to certain practices in the mutual fund industry, including late trading, market timing and marketing support payments to securities dealers who sell fund shares (“marketing support”), Franklin Resources, Inc. and certain of its subsidiaries (collectively, the “Company”), entered into settlements with certain of those regulators and governmental entities. Specifically, the Company entered into settlements with the SEC, among others, concerning market timing and marketing support.
On June 6, 2007, the SEC posted for public comment the proposed plan of distribution for the market timing settlement. Once the SEC approves the final plan of distribution, disbursements of settlement monies will be made promptly to individuals who were shareholders of the designated funds during the relevant period, in accordance with the terms and conditions of the settlement and plan.
MD-33
Franklin Templeton Variable Insurance Products Trust
Notes to Financial Statements (continued)
Mutual Discovery Securities Fund
14. REGULATORY AND LITIGATION MATTERS (continued)
In addition, the Company, as well as most of the mutual funds within Franklin Templeton Investments and certain current or former officers, Company directors, fund directors, and employees, have been named in private lawsuits (styled as shareholder class actions, or as derivative actions on behalf of either the named funds or Franklin Resources, Inc.). The lawsuits relate to the industry practices referenced above.
The Company and fund management believe that the claims made in each of the private lawsuits referenced above are without merit and intend to defend against them vigorously. The Company cannot predict with certainty the eventual outcome of these lawsuits, nor whether they will have a material negative impact on the Company. If it is determined that the Company bears responsibility for any unlawful or inappropriate conduct that caused losses to the Fund, it is committed to making the Trust or its shareholders whole, as appropriate.
15. NEW ACCOUNTING PRONOUNCEMENT
In September 2006, Financial Accounting Standards Board (FASB) issued FASB Statement No. 157, “Fair Value Measurement” (SFAS 157), which defines fair value, establishes a framework for measuring fair value, and expands disclosures about fair value measurements. SFAS 157 is effective for fiscal years beginning after November 15, 2007, and interim periods within those fiscal years. The Trust believes the adoption of SFAS 157 will have no material impact on its financial statements.
MD-34
Franklin Templeton Variable Insurance Products Trust
Mutual Discovery Securities Fund
Report of Independent Registered Public Accounting Firm
To the Board of Trustees and Shareholders of
Franklin Templeton Variable Insurance Products Trust
In our opinion, the accompanying statement of assets and liabilities, including the statement of investments, and the related statements of operations and of changes in net assets and the financial highlights present fairly, in all material respects, the financial position of Mutual Discovery Securities Fund (one of the funds constituting Franklin Templeton Variable Insurance Products Trust, hereafter referred to as the “Fund”) at December 31, 2007, the results of its operations for the year then ended, the changes in its net assets for each of the two years in the period then ended and the financial highlights for each of the five years in the period then ended, in conformity with accounting principles generally accepted in the United States of America. These financial statements and financial highlights (hereafter referred to as “financial statements”) are the responsibility of the Fund’s management. Our responsibility is to express an opinion on these financial statements based on our audits. We conducted our audits of these financial statements in accordance with the standards of the Public Company Accounting Oversight Board (United States). Those standards require that we plan and perform the audit to obtain reasonable assurance about whether the financial statements are free of material misstatement. An audit includes examining, on a test basis, evidence supporting the amounts and disclosures in the financial statements, assessing the accounting principles used and significant estimates made by management, and evaluating the overall financial statement presentation. We believe that our audits, which included confirmation of securities at December 31, 2007 by correspondence with the custodian and brokers, provide a reasonable basis for our opinion.
PricewaterhouseCoopers LLP
San Francisco, California
February 14, 2008
MD-35
Franklin Templeton Variable Insurance Products Trust
Tax Designation (unaudited)
Mutual Discovery Securities Fund
Under Section 852(b)(3)(C) of the Internal Revenue Code (Code), the Fund designates the maximum amount allowable but no less than $66,053,769 as a long term capital gain dividend for the fiscal year ended December 31, 2007. Under Section 871(k)(2)(C) of the Code, the Fund designates the maximum amount allowable but no less than $3,711,788 as a short term capital gain dividend for purposes of the tax imposed under Section 871(a)(1)(A) of the Code for the fiscal year ended December 31, 2007.
Under Section 854(b)(2) of the Code, the Fund designates 29.65% of the ordinary income dividends as income qualifying for the dividends received deduction for the fiscal year ended December 31, 2007.
At December 31, 2007, more than 50% of the Fund’s total assets were invested in securities of foreign issuers. In most instances, foreign taxes were withheld from income paid to the Fund on these investments. The Fund elects to treat foreign taxes paid as allowed under Section 853 of the Code. This election will allow shareholders of record as of the 2008 distribution date, to treat their proportionate share of foreign taxes paid by the Fund as having been paid directly by them. The shareholder shall consider these amounts as foreign taxes paid in the tax year in which they receive the Fund distribution.
MD-36
MUTUAL SHARES SECURITIES FUND
This annual report for Mutual Shares Securities Fund covers the fiscal year ended December 31, 2007.
Performance Summary as of 12/31/07
Average annual total return of Class 1 shares represents the average annual change in value, assuming reinvestment of dividends and capital gains. Average returns smooth out variations in returns, which can be significant; they are not the same as year-by-year results.
Periods ended 12/31/07
| | | | | | |
| | | 1-Year | | 5-Year | | 10-Year |
Average Annual Total Return | | +3.72% | | +14.08% | | +8.99% |
Total Return Index Comparison for Hypothetical $10,000 Investment (1/1/98–12/31/07)
The graph below shows the change in value of a hypothetical $10,000 investment in the Fund over the indicated period and includes reinvestment of any income and distributions. The Fund’s performance is compared to the performance of the Standard & Poor’s 500 Index (S&P 500). One cannot invest directly in an index, nor is an index representative of the Fund’s portfolio. Please see Important Notes to Performance Information preceding the Fund Summaries.
*Source: Standard & Poor’s Micropal. Please see Index Descriptions following the Fund Summaries.
Mutual Shares Securities Fund – Class 1
Performance reflects the Fund’s Class 1 operating expenses, but does not include any contract fees, expenses or sales charges. If they had been included, performance would be lower. These charges and deductions, particularly for variable life policies, can have a significant effect on contract values and insurance benefits. See the contract prospectus for a complete description of these expenses, including sales charges.
Performance data represent past performance, which does not guarantee future results. Investment return and principal value will fluctuate, and you may have a gain or loss when you sell your shares. Current performance may differ from figures shown.
MS-1
Fund Goals and Main Investments: Mutual Shares Securities Fund seeks capital appreciation, with income as a secondary goal. The Fund normally invests primarily in equity securities of companies that the manager believes are undervalued. The Fund also invests, to a lesser extent, in risk arbitrage securities and distressed companies.
Performance Overview
You can find the Fund’s one-year total return in the Performance Summary. The Fund underperformed its benchmark, the S&P 500, which returned +5.49% for the period under review.1
Economic and Market Overview
During the 12 months ended December 31, 2007, the U.S. economy advanced at a moderate but uneven pace. After slow first quarter growth, gross domestic product (GDP) advanced solidly in the second quarter, supported by federal defense spending, accelerating exports and declining imports, and greater business spending. In the third quarter, growth accelerated despite a struggling housing market and the abrupt unraveling of the subprime mortgage market. The housing downturn affected the overall economy by fourth quarter 2007 when GDP growth decelerated as credit conditions worsened and consumer spending slowed.
Consumer confidence declined through period-end largely due to rising mortgage and fuel costs, falling home prices and a weaker job market. Oil prices were volatile and established a new record high in November, nearing $99 per barrel. For the 12 months ended December 31, 2007, the core Consumer Price Index (CPI), which excludes food and energy costs, rose 2.4%, which was higher than its 10-year average rate.2
Facing the prospect of slower economic growth, the Federal Reserve Board lowered the federal funds target rate to 4.25% from 5.25% during the period. As investors fled riskier, poorer-performing assets, U.S. Treasuries rallied and the 10-year Treasury note yield fell from 4.71% at the beginning of the period to 4.04% on December 31, 2007.
The global economy remained resilient despite elevated energy prices and widespread fears of contagion from the deteriorating U.S. housing
1. Source: Standard & Poor’s Micropal. One cannot invest directly in an index, nor is an index representative of the Fund’s portfolio. Please see Index Descriptions following the Fund Summaries.
2. Source: Bureau of Labor Statistics.
Fund Risks: The Fund’s investments in stocks offer the potential for long-term gains but can be subject to short-term price fluctuations. Investments in companies involved in mergers, liquidations, reorganizations and distressed bankruptcy, which may include defaulted debt, involve higher credit and other risks. Foreign investing, especially in emerging markets, involves additional risks, including currency fluctuations, economic instability, market volatility, and political and social instability. Smaller and midsize company securities involve special risks, such as relatively small revenues, limited product lines and small market share. The Fund’s prospectus also includes a description of the main investment risks.
MS-2
situation. Consumer and corporate demand strength, particularly in China and other developing economies, generally favorable employment and accommodative monetary policies continued to underpin the current global expansionary period that began in 2002.
These factors also contributed to the strength of global equity markets during 2007. However, concerns about slower growth and declining asset quality surfaced in the first quarter. Initially centered on the U.S. subprime mortgage market, they spread in August to global capital markets. Difficulties in assessing risk and the value of collateral in the structured finance industry contributed to declining risk appetite among lenders and investors. The private equity industry, which relies on the availability of cheap credit, played a pivotal role in several large and high-profile acquisitions, helped boost merger and acquisition activity in the first half of 2007, and was an important driver of equity performance. A second-half tightening of liquidity led to slower deal activity and weighed on market performance. However, in 2007, global merger and acquisition activity still reached record levels.
To alleviate the credit crunch and restore investor confidence, the world’s major central banks infused capital into the system. However, credit and equity markets continued to face headwinds as write-downs and losses from subprime mortgage financing affected many large financial institutions toward the end of the year, and equity prices remained volatile. For the year, however, most global equity markets posted strong total returns. Many stock market indexes in the U.S. and most European countries reached six-year highs, and many emerging market indexes in Asia, Europe and Latin America neared or reached all-time highs.
Investment Strategy
At Mutual Series, we are committed to our distinctive value approach to investing. Our major investment strategy is investing in undervalued stocks. When selecting undervalued equities, we are attracted to fundamentally strong companies with healthy balance sheets, high-quality assets, substantial free cash flow and shareholder-oriented management teams and whose stocks are trading at discounts to our assessment of the companies’ intrinsic or business value. We also look for asset rich companies whose shares may be trading at depressed levels due to concerns over short-term earnings disappointments, litigation, management strategy or other perceived negatives. While the
MS-3
vast majority of our undervalued equity investments are made in publicly traded companies globally, we may invest occasionally in privately held companies as well.
We complement this more traditional investment strategy with two others. One is distressed investing, which is complex and can take many forms. The most common distressed investment the Fund undertakes is the purchase of financially troubled or bankrupt companies’ debt at a substantial discount to face value. After the financially distressed company is reorganized, often in bankruptcy court, the old debt is typically replaced with new securities issued by the financially stronger company.
The other piece of our investment strategy is participating in arbitrage situations, another highly specialized field. When companies announce proposed mergers or takeovers, commonly referred to as “deals,” the target company may trade at a discount to the bid it ultimately accepts. One form of arbitrage involves purchasing the target company’s stock when it is trading below the value it would likely receive in a deal. In keeping with our commitment to a relatively conservative investment approach, we typically focus our arbitrage efforts on announced deals, and eschew rumored deals or other situations we consider relatively risky.
In addition, we will generally seek to hedge the Fund’s currency exposure when we deem it advantageous for our shareholders.
Manager’s Discussion
During the year under review, the largest contributor to Fund performance was our equity portfolio, most notably some of our long-term holdings. Three investments that performed well during 2007 were Orkla, Berkshire Hathaway and British American Tobacco (BAT).
Orkla is one of Norway’s largest conglomerates with operations in several industries including consumer goods, and metals and minerals. In 2007, Orkla was again among the top performing stocks, advancing 52% in local currency terms. Orkla shares performed well after the company reported strong operational performance, and its management pursued two transactions that we believe could create value. Orkla increased its stake in the solar energy solution company Renewable Energy Corp. (REC) from 27.5% to 40.0% in February 2007, at a discount of over 25% to REC’s market price at the time. As REC’s stock appreciated more than 142% in local currency during the reporting period, Orkla’s ownership in REC benefited its own share price. Orkla also merged its aluminum profile business, Sapa, with Alcoa’s aluminum extrusion business.
Top 10 Sectors/Industries
Mutual Shares Securities Fund
Based on Equity Securities 12/31/07
| | |
| | | % of Total
Net Assets |
| |
| Tobacco | | 10.5% |
| |
| Insurance | | 7.7% |
| |
| Media | | 7.7% |
| |
| Commercial Banks | | 6.2% |
| |
| Industrial Conglomerates | | 4.2% |
| |
| Paper & Forest Products | | 3.9% |
| |
| Food & Staples Retailing | | 3.8% |
| |
| Food Products | | 3.6% |
| |
| Pharmaceuticals | | 2.6% |
| |
| Software | | 2.2% |
MS-4
Berkshire Hathaway stock appreciated 29% as the company benefited from a lack of catastrophe losses in 2007, resulting in large insurance profits after higher-than-average losses in 2004 and 2005 resulted in a favorable pricing environment for U.S. property insurers. Within Berkshire’s non-insurance operations, the company benefited from an improving contribution from its utility business, Mid-American Energy. Most significantly for its share price value, Berkshire’s cash stockpile of almost $40 billion, along with CEO Warren Buffett’s willingness to wait until a bargain emerged before deploying this capital, positioned the company as a safe haven for investors who perceived 2007’s subprime mortgage crisis as an investment opportunity rather than a threat. By the end of 2007 Berkshire management had successfully kept its capital mostly in reserve.
Shares of U.K.-based BAT benefited from strong operations as well as tobacco’s traditional role as a defensive stock, and advanced 43% in local currency for the year under review. We believe that operationally, BAT has a strong business model. During 2007, the company’s topline growth was driven by increased volume and product mix improvement. As measured by volume and sales, BAT has a leadership position in the growing emerging markets, where cigarette consumption is increasing. Furthermore, BAT was able to grow its market share by refreshing all of its main brands, updating its packaging, and launching a variety of new products. BAT also continued to strengthen its distribution channels, further contributing to its market-share gains. In Europe, cigarette pricing remained strong in 2007.
Although many of our investments appreciated during the year, some of the Fund’s holdings underperformed. Three positions that declined in value included financial services conglomerate Citigroup; Belgium-based Fortis, whose operations are focused in banking, insurance and investment management; and Home Depot, the world’s largest home improvement chain.
Shares of Citigroup declined 44% in 2007 due largely to illiquidity in the credit markets that forced the company to take meaningful mark-to-market losses on leveraged loans and securitized products remaining on the company’s balance sheet. Further pressuring the company’s stock price were concerns about certain off-balance sheet exposures, lower capital levels stemming from write-downs, the lingering possibility of a dividend cut, and uncertainty surrounding Citigroup’s leadership.
Top 10 Holdings
Mutual Shares Securities Fund 12/31/07
| | |
Company Sector/Industry,
Country | | % of Total
Net Assets |
| |
| Berkshire Hathaway Inc., A & B | | 3.0% |
| Insurance, U.S. | | |
| |
| British American Tobacco PLC, ADR | | 2.7% |
| Tobacco, U.K. | | |
| |
| Imperial Tobacco Group PLC | | 1.8% |
| Tobacco, U.K. | | |
| |
| U.S. Bancorp | | 1.8% |
| Commercial Banks, U.S. | | |
| |
| News Corp., A | | 1.7% |
| Media, U.S. | | |
| |
| Orkla ASA | | 1.7% |
| Industrial Conglomerates, Norway | | |
| |
| Microsoft Corp. | | 1.5% |
| Software, U.S. | | |
| |
| KT&G Corp. | | 1.5% |
| Tobacco, South Korea | | |
| |
| Altria Group Inc. | | 1.5% |
| Tobacco, U.S. | | |
| |
| Siemens AG | | 1.5% |
| Industrial Conglomerates, Germany | | |
The dollar value, number of shares or principal amount, and names of all portfolio holdings are listed in the Fund’s Statement of Investments.
MS-5
Fortis declined 30% in local currency as the company raised a significant amount of capital to fund its acquisition of some of ABN Amro’s Dutch retail banking, asset management and private banking units. Fortis was part of a consortium with Royal Bank of Scotland and Brazil’s Banco Santander, which together acquired these businesses and by year-end had completed the largest bank acquisition in European history. Fortis’ stock price also came under pressure after the company announced weak third quarter 2007 operating results for its banking and insurance businesses.
Home Depot shares declined 31% in 2007 as the company lowered earnings guidance due to a weak housing market. In addition, the buyout purchase price for HD Supply, the company’s professional services division, was negotiated downward by three private equity firms after credit markets tightened substantially.
Finally, investors should note that we maintained our currency hedging posture of being generally hedged to the U.S. dollar for most of our non-U.S. holdings. Since the dollar was weaker compared with most foreign currencies during 2007, the Fund benefited to the extent it was not fully hedged.
Thank you for your participation in Mutual Shares Securities Fund. We look forward to serving your future investment needs.
The foregoing information reflects our analysis, opinions and portfolio holdings as of December 31, 2007, the end of the reporting period. The way we implement our main investment strategies and the resulting portfolio holdings may change depending on factors such as market and economic conditions. These opinions may not be relied upon as investment advice or an offer for a particular security. The information is not a complete analysis of every aspect of any market, country, industry, security or the Fund. Statements of fact are from sources considered reliable, but the investment manager makes no representation or warranty as to their completeness or accuracy. Although historical performance is no guarantee of future results, these insights may help you understand our investment management philosophy.
MS-6
Fund Expenses
As an investor in a variable insurance contract (Contract) that indirectly provides for investment in an underlying mutual fund, you can incur transaction and/or ongoing expenses at both the Fund level and the Contract level.
| • | | Transaction expenses can include sales charges (loads) on purchases, redemption fees, surrender fees, transfer fees and premium taxes. |
| • | | Ongoing expenses can include management fees, distribution and service (12b-1) fees, contract fees, annual maintenance fees, mortality and expense risk fees and other fees and expenses. All mutual funds and Contracts have some types of ongoing expenses. |
The expenses shown in the table are meant to highlight ongoing expenses at the Fund level only and do not include ongoing expenses at the Contract level, or transaction expenses at either the Fund or Contract level. While the Fund does not have transaction expenses, if the transaction and ongoing expenses at the Contract level were included, the expenses shown below would be higher. You should consult your Contract prospectus or disclosure document for more information.
The table shows Fund-level ongoing expenses and can help you understand these expenses and compare them with those of other mutual funds offered through the Contract. The table assumes a $1,000 investment held for the six months indicated. Please refer to the Fund prospectus for additional information on operating expenses.
Actual Fund Expenses
The first line (Actual) of the table provides actual account values and expenses. The “Ending Account Value” is derived from the Fund’s actual return, which includes the effect of ongoing Fund expenses, but does not include the effect of ongoing Contract expenses.
You can estimate the Fund-level expenses you incurred during the period by following these steps. Of course, your account value and expenses will differ from those in this illustration:
| 1. | Divide your account value by $1,000. |
If an account had an $8,600 value, then $8,600 ÷ $1,000 = 8.6.
| 2. | Multiply the result by the number under the heading “Fund-Level Expenses Incurred During Period.” |
If Fund-Level Expenses Incurred During Period were $7.50, then 8.6 x $7.50 = $64.50.
In this illustration, the estimated expenses incurred this period at the Fund level are $64.50.
Mutual Shares Securities Fund – Class 1
MS-7
Hypothetical Example for Comparison with Other Mutual Funds
Information in the second line (Hypothetical) of the table can help you compare ongoing expenses of the Fund with those of other mutual funds offered through the Contract. This information may not be used to estimate the actual ending account balance or expenses you incurred during the period. The hypothetical “Ending Account Value” is based on the Fund’s actual expense ratio and an assumed 5% annual rate of return before expenses, which does not represent the Fund’s actual return. The figure under the heading “Fund-Level Expenses Incurred During Period” shows the hypothetical expenses your account would have incurred under this scenario. You can compare this figure with the 5% hypothetical examples that appear in shareholder reports of other funds offered through a Contract.
| | | | | | | | | |
| Class 1 | | Beginning
Account Value 7/1/07 | | Ending Account Value 12/31/07 | | Fund-Level
Expenses Incurred
During Period*
7/1/07–12/31/07 |
Actual | | $ | 1,000 | | $ | 1,037.20 | | $ | 3.70 |
Hypothetical (5% return before expenses) | | $ | 1,000 | | $ | 1,021.58 | | $ | 3.67 |
*Expenses are calculated using the most recent six-month annualized expense ratio for the Fund’s Class 1 shares (0.72%), which does not include any ongoing expenses of the Contract for which the Fund is an investment option, multiplied by the average account value over the period, multiplied by 184/365 to reflect the one-half year period.
MS-8
SUPPLEMENT DATED JANUARY 23, 2008
TOTHE PROSPECTUSES DATED MAY 1, 2007
OF
MUTUAL SHARES SECURITIES FUND (THE “FUND”)
A SERIESOF FRANKLIN TEMPLETON VARIABLE INSURANCE PRODUCTS TRUST
The Fund’s Class 1 and Class 2 prospectuses are amended as follows:
The seventh paragraph under the heading “Main Investments” on page MS-1 is replaced with the following:
The Fund may attempt, from time to time, to hedge (protect) against currency risks, largely using forward foreign currency exchange contracts, when, in the manager’s opinion, it would be advantageous to the Fund to do so. The Fund may also, from time to time, attempt to hedge against market risk using a variety of derivatives (together, Hedging Instruments).
The following paragraph is added as the second paragraph under the heading “Hedging Instruments” on page MS-4 and the paragraph thereafter is amended to read as follows:
The Fund may also attempt, from time to time, to hedge against market risks by using derivative investments, which may include purchasing put options. A put option gives the purchaser of the option, upon payment of a premium, the right to sell, and the seller of the option the obligation to buy, the underlying instrument at the exercise price.
Forward foreign currency exchange contracts and put options are considered derivative investments because their value and performance depend, at least in part, on the value and performance of an underlying asset. The Fund’s investments in derivatives may involve a small investment relative to the amount of risk assumed. To the extent the Fund enters into these transactions, its success will depend on the manager’s ability to predict market movements, and their use may have the opposite effect of that intended. Risks include potential loss due to the imposition of controls by a government on the exchange of foreign currencies, the loss of any premium paid to enter into the transaction, delivery failure or default by any other party, or inability to close out a position because the trading market became illiquid.
Please keep this supplement for future reference.
MS-9
Franklin Templeton Variable Insurance Products Trust
Financial Highlights
Mutual Shares Securities Fund
| | | | | | | | | | | | | | | | | | | | |
| | | Year Ended December 31, | |
| Class 1 | | 2007 | | | 2006 | | | 2005 | | | 2004 | | | 2003 | |
| | | | |
Per share operating performance | | | | | | | | | | | | | | | | | | | | |
(for a share outstanding throughout the year) | | | | | | | | | | | | | | | | | | | | |
Net asset value, beginning of year | | $ | 20.67 | | | $ | 18.35 | | | $ | 16.78 | | | $ | 15.00 | | | $ | 12.09 | |
| | | | |
Income from investment operationsa: | | | | | | | | | | | | | | | | | | | | |
Net investment incomeb | | | 0.54 | | | | 0.40 | | | | 0.34 | | | | 0.21 | | | | 0.18 | |
Net realized and unrealized gains (losses) | | | 0.31 | | | | 2.86 | | | | 1.47 | | | | 1.71 | | | | 2.88 | |
| | | | |
Total from investment operations | | | 0.85 | | | | 3.26 | | | | 1.81 | | | | 1.92 | | | | 3.06 | |
| | | | |
Less distributions from: | | | | | | | | | | | | | | | | | | | | |
Net investment income | | | (0.35 | ) | | | (0.29 | ) | | | (0.18 | ) | | | (0.14 | ) | | | (0.15 | ) |
Net realized gains | | | (0.75 | ) | | | (0.65 | ) | | | (0.06 | ) | | | — | | | | — | |
| | | | |
Total distributions | | | (1.10 | ) | | | (0.94 | ) | | | (0.24 | ) | | | (0.14 | ) | | | (0.15 | ) |
| | | | |
Net asset value, end of year | | $ | 20.42 | | | $ | 20.67 | | | $ | 18.35 | | | $ | 16.78 | | | $ | 15.00 | |
| | | | |
| | | | | |
Total returnc | | | 3.72% | | | | 18.66% | | | | 10.83% | | | | 12.88% | | | | 25.48% | |
Ratios to average net assets | | | | | | | | | | | | | | | | | | | | |
| Expensesd | | | 0.72%e | | | | 0.81% | e | | | 0.78% | e | | | 0.75% | e | | | 0.80% | |
| Expenses – excluding dividend expense on securities sold short | | | 0.72%e | | | | 0.74% | e | | | 0.74% | e | | | 0.73% | e | | | 0.76% | |
| Net investment income | | | 2.58% | | | | 2.02% | | | | 1.97% | | | | 1.40% | | | | 1.33% | |
| | | | | |
Supplemental data | | | | | | | | | | | | | | | | | | | | |
Net assets, end of year (000’s) | | $ | 272,509 | | | $ | 259,943 | | | $ | 260,317 | | | $ | 287,324 | | | $ | 312,386 | |
Portfolio turnover rate | | | 41.73%f | | | | 19.75% | | | | 19.59% | | | | 31.49% | | | | 55.71% | |
aThe amount shown for a share outstanding throughout the period may not correlate with the Statement of Operations for the period due to the timing of sales and repurchase of the Fund shares in relation to income earned and/or fluctuating market value of the investments of the Fund.
bBased on average daily shares outstanding.
cTotal return does not include any fees, charges or expenses imposed by the variable annuity and life insurance contracts for which the Franklin Templeton Variable Insurance Products Trust serves as an underlying investment vehicle.
dIncludes dividend expenses on securities sold short which varies from period to period. See below for expense ratios that reflect only operating expenses.
e | Benefit of expense reduction is less than 0.01%. |
fExcludes | the value of portfolio securities delivered as a result of redemption in-kind. See Note 13 |
The accompanying notes are an integral part of these financial statements.
MS-10
Franklin Templeton Variable Insurance Products Trust
Financial Highlights (continued)
Mutual Shares Securities Fund
| | | | | | | | | | | | | | | | | | | | |
| | | Year Ended December 31, | |
| Class 2 | | 2007 | | | 2006 | | | 2005 | | | 2004 | | | 2003 | |
| | | | |
Per share operating performance | | | | | | | | | | | | | | | | | | | | |
(for a share outstanding throughout the year) | | | | | | | | | | | | | | | | | | | | |
Net asset value, beginning of year | | $ | 20.46 | | | $ | 18.18 | | | $ | 16.64 | | | $ | 14.90 | | | $ | 12.02 | |
| | | | |
Income from investment operationsa: | | | | | | | | | | | | | | | | | | | | |
Net investment incomeb | | | 0.48 | | | | 0.34 | | | | 0.29 | | | | 0.18 | | | | 0.14 | |
Net realized and unrealized gains (losses) | | | 0.31 | | | | 2.84 | | | | 1.46 | | | | 1.68 | | | | 2.88 | |
| | | | |
Total from investment operations | | | 0.79 | | | | 3.18 | | | | 1.75 | | | | 1.86 | | | | 3.02 | |
| | | | |
Less distributions from: | | | | | | | | | | | | | | | | | | | | |
Net investment income | | | (0.31 | ) | | | (0.25 | ) | | | (0.15 | ) | | | (0.12 | ) | | | (0.14 | ) |
Net realized gains | | | (0.75 | ) | | | (0.65 | ) | | | (0.06 | ) | | | — | | | | — | |
| | | | |
Total distributions | | | (1.06 | ) | | | (0.90 | ) | | | (0.21 | ) | | | (0.12 | ) | | | (0.14 | ) |
| | | | |
Net asset value, end of year | | $ | 20.19 | | | $ | 20.46 | | | $ | 18.18 | | | $ | 16.64 | | | $ | 14.90 | |
| | | | |
| | | | | |
Total returnc | | | 3.48% | | | | 18.38% | | | | 10.55% | | | | 12.63% | | | | 25.15% | |
Ratios to average net assets | | | | | | | | | | | | | | | | | | | | |
| Expensesd | | | 0.97% | e | | | 1.06% | e | | | 1.03% | e | | | 1.00% | e | | | 1.05% | |
| Expenses – excluding dividend expense on securities sold short | | | 0.97% | e | | | 0.99% | e | | | 0.99% | e | | | 0.98% | e | | | 1.01% | |
| Net investment income | | | 2.33% | | | | 1.77% | | | | 1.72% | | | | 1.15% | | | | 1.08% | |
Supplemental data | | | | | | | | | | | | | | | | | | | | |
Net assets, end of year (000’s) | | $ | 5,925,551 | | | $ | 5,140,878 | | | $ | 3,596,889 | | | $ | 2,464,374 | | | $ | 1,469,745 | |
Portfolio turnover rate | | | 41.73%f | | | | 19.75% | | | | 19.59% | | | | 31.49% | | | | 55.71% | |
aThe amount shown for a share outstanding throughout the period may not correlate with the Statement of Operations for the period due to the timing of sales and repurchase of the Fund shares in relation to income earned and/or fluctuating market value of the investments of the Fund.
bBased on average daily shares outstanding.
cTotal return does not include any fees, charges or expenses imposed by the variable annuity and life insurance contracts for which the Franklin Templeton Variable Insurance Products Trust serves as an underlying investment vehicle.
dIncludes dividend expenses on securities sold short which varies from period to period. See below for expense ratios that reflect only operating expenses.
eBenefit of expense reduction is less than 0.01%.
fExcludes the value of portfolio securities delivered as a result of redemption in-kind. See Note 13
The accompanying notes are an integral part of these financial statements.
MS-11
Franklin Templeton Variable Insurance Products Trust
Statement of Investments, December 31, 2007
| | | | | | | |
| Mutual Shares Securities Fund | | Country | | Shares/
Warrants/
Contracts | | Value |
Long Term Investments 92.0% | | | | | | | |
Common Stocks and Other Equity Interests 89.4% | | | | | | | |
Aerospace & Defense 0.1% | | | | | | | |
aGenCorp Inc. | | United States | | 494,180 | | $ | 5,762,139 |
| | | | | | | |
Air Freight & Logistics 1.1% | | | | | | | |
Deutsche Post AG | | Germany | | 1,593,038 | | | 54,191,086 |
TNT NV | | Netherlands | | 349,838 | | | 14,422,644 |
| | | | | | | |
| | | | | | | 68,613,730 |
| | | | | | | |
Airlines 0.5% | | | | | | | |
aACE Aviation Holdings Inc., A | | Canada | | 565,107 | | | 16,121,543 |
a,bACE Aviation Holdings Inc., A, 144A | | Canada | | 28,980 | | | 826,750 |
aNorthwest Airlines Corp. | | United States | | 701,752 | | | 10,182,422 |
a,cNorthwest Airlines Corp., Contingent Distribution | | United States | | 27,670,000 | | | 933,862 |
| | | | | | | |
| | | | | | | 28,064,577 |
| | | | | | | |
Auto Components 0.8% | | | | | | | |
a,cCollins & Aikman Products Co., Contingent Distribution | | United States | | 930,644 | | | 411,810 |
aGoodyear Tire & Rubber Co. | | United States | | 1,068,854 | | | 30,163,060 |
aLear Corp. | | United States | | 633,092 | | | 17,511,325 |
| | | | | | | |
| | | | | | | 48,086,195 |
| | | | | | | |
Automobiles 2.0% | | | | | | | |
Daimler AG | | Germany | | 350,712 | | | 33,887,042 |
General Motors Corp. | | United States | | 1,753,600 | | | 43,647,104 |
Harley-Davidson Inc. | | United States | | 401,759 | | | 18,766,163 |
a,d,e,fInternational Automotive Components Group Brazil LLC | | Brazil | | 1,451,684 | | | 10,083,586 |
a,d,e,fInternational Automotive Components Group Japan LLC | | Japan | | 269,643 | | | 2,417,998 |
a,d,e,fInternational Automotive Components Group LLC | | Luxembourg | | 6,170,474 | | | 6,546,256 |
a,d,e,fInternational Automotive Components Group NA LLC | | United States | | 4,838,052 | | | 6,652,321 |
| | | | | | | |
| | | | | | | 122,000,470 |
| | | | | | | |
Beverages 2.0% | | | | | | | |
Brown-Forman Corp., A | | United States | | 7,455 | | | 557,932 |
Brown-Forman Corp., B | | United States | | 84,285 | | | 6,246,361 |
Coca-Cola Enterprises Inc. | | United States | | 1,908,903 | | | 49,688,745 |
Pernod Ricard SA | | France | | 290,822 | | | 67,099,391 |
| | | | | | | |
| | | | | | | 123,592,429 |
| | | | | | | |
Building Products 0.3% | | | | | | | |
aArmstrong World Industries Inc. | | United States | | 87,406 | | | 3,505,855 |
a,cArmstrong World Industries Inc., Contingent Distribution | | United States | | 9,894,225 | | | 37,103 |
aOwens Corning Inc. | | United States | | 820,981 | | | 16,600,236 |
| | | | | | | |
| | | | | | | 20,143,194 |
| | | | | | | |
Capital Markets 0.2% | | | | | | | |
Legg Mason Inc. | | United States | | 183,840 | | | 13,447,896 |
| | | | | | | |
Chemicals 1.1% | | | | | | | |
a,cDow Corning Corp., Contingent Distribution | | United States | | 650,000 | | | 331,500 |
Koninklijke DSM NV | | Netherlands | | 565,862 | | | 26,697,813 |
Linde AG | | Germany | | 287,541 | | | 37,971,680 |
| | | | | | | |
| | | | | | | 65,000,993 |
| | | | | | | |
MS-12
Franklin Templeton Variable Insurance Products Trust
Statement of Investments, December 31, 2007 (continued)
| | | | | | | |
| Mutual Shares Securities Fund | | Country | | Shares/
Warrants/
Contracts | | Value |
Long Term Investments (continued) | | | | | | | |
Common Stocks and Other Equity Interests (continued) | | | | | | | |
Commercial Banks 6.2% | | | | | | | |
aBanco Popolare SpA | | Italy | | 1,077,265 | | $ | 23,833,137 |
aCentennial Bank Holdings Inc. | | United States | | 1,288,316 | | | 7,446,467 |
Commerce Bancorp Inc. | | United States | | 796,910 | | | 30,394,147 |
Danske Bank AS | | Denmark | | 1,257,361 | | | 49,155,076 |
a,d,eElephant Capital Holdings Ltd. | | Japan | | 4,825 | | | 3,177,409 |
Intesa Sanpaolo SpA | | Italy | | 6,106,392 | | | 48,210,473 |
Mitsubishi UFJ Financial Group Inc. | | Japan | | 1,575,707 | | | 14,794,111 |
a,d,eNCB Warrant Holdings Ltd., A | | Japan | | 23,570 | | | 1,398,451 |
Societe Generale, A | | France | | 190,202 | | | 27,460,127 |
Sumitomo Mitsui Financial Group Inc. | | Japan | | 1,388 | | | 10,417,935 |
Swedbank AB, A | | Sweden | | 962,179 | | | 27,232,745 |
U.S. Bancorp | | United States | | 3,501,795 | | | 111,146,973 |
UnionBanCal Corp. | | United States | | 243,152 | | | 11,892,564 |
Wachovia Corp. | | United States | | 488,275 | | | 18,569,098 |
| | | | | | | |
| | | | | | | 385,128,713 |
| | | | | | | |
Commercial Services & Supplies 0.0%g | | | | | | | |
aComdisco Holding Co. Inc. | | United States | | 177 | | | 1,612 |
a,cComdisco Holding Co. Inc., Contingent Distribution | | United States | | 8,175,255 | | | — |
| | | | | | | |
| | | | | | | 1,612 |
| | | | | | | |
Communications Equipment 1.6% | | | | | | | |
Motorola Inc. | | United States | | 4,756,113 | | | 76,288,053 |
Telefonaktiebolaget LM Ericsson, B | | Sweden | | 8,802,545 | | | 20,666,383 |
Telefonaktiebolaget LM Ericsson, B, ADR | | Sweden | | 40,000 | | | 934,000 |
| | | | | | | |
| | | | | | | 97,888,436 |
| | | | | | | |
Computers & Peripherals 1.5% | | | | | | | |
a,d,eDecisionOne Corp. | | United States | | 108,227 | | | — |
a,d,eDecisionOne Corp., wts., 6/08/17 | | United States | | 59,425 | | | — |
aDell Inc. | | United States | | 2,780,516 | | | 68,150,447 |
aLexmark International Inc., A | | United States | | 708,034 | | | 24,682,065 |
| | | | | | | |
| | | | | | | 92,832,512 |
| | | | | | | |
Consumer Finance 1.1% | | | | | | | |
a,d,eCerberus CG Investor I LLC | | United States | | 7,173,000 | | | 6,039,498 |
a,d,eCerberus CG Investor II LLC | | United States | | 7,173,000 | | | 6,039,498 |
a,d,eCerberus CG Investor III LLC | | United States | | 3,586,500 | | | 3,019,749 |
a,d,eCerberus FIM Investors Auto Finance LLC | | United States | | 2,306,869 | | | 1,237,706 |
a,d,eCerberus FIM Investors Commercial Finance LLC | | United States | | 192,155 | | | 103,097 |
a,d,eCerberus FIM Investors Commercial Mortgage LLC | | United States | | 360,165 | | | 193,240 |
a,d,eCerberus FIM Investors Insurance LLC | | United States | | 1,761,591 | | | 945,148 |
a,d,eCerberus FIM Investors Rescap LLC | | United States | | 3,279,720 | | | 1,759,671 |
SLM Corp. | | United States | | 2,387,117 | | | 48,076,536 |
| | | | | | | |
| | | | | | | 67,414,143 |
| | | | | | | |
Containers & Packaging 0.3% | | | | | | | |
Temple-Inland Inc. | | United States | | 901,989 | | | 18,806,471 |
| | | | | | | |
Diversified Consumer Services 0.3% | | | | | | | |
H&R Block Inc. | | United States | | 1,051,092 | | | 19,518,778 |
| | | | | | | |
MS-13
Franklin Templeton Variable Insurance Products Trust
Statement of Investments, December 31, 2007 (continued)
| | | | | | | |
| Mutual Shares Securities Fund | | Country | | Shares/
Warrants/
Contracts | | Value |
Long Term Investments (continued) | | | | | | | |
Common Stocks and Other Equity Interests (continued) | | | | | | | |
Diversified Financial Services 1.9% | | | | | | | |
Citigroup Inc. | | United States | | 1,194,338 | | $ | 35,161,311 |
Fortis | | Belgium | | 3,046,005 | | | 80,368,985 |
aFortis VVPR Strip | | Belgium | | 1,218,402 | | | 17,781 |
aGuaranty Financial Group Inc. | | United States | | 281,163 | | | 4,498,608 |
a,cMarconi Corp., Contingent Distribution | | United Kingdom | | 9,945,700 | | | — |
| | | | | | | |
| | | | | | | 120,046,685 |
| | | | | | | |
Diversified Telecommunication Services 2.1% | | | | | | | |
a,d,e,fAboveNet Inc. | | United States | | 59,723 | | | 2,986,150 |
a,d,fAboveNet Inc., stock grant, grant price $20.95, expiration date 9/09/13 | | United States | | 78 | | | 3,233 |
a,d,e,fAboveNet Inc., wts., 9/08/08 | | United States | | 2,546 | | | 120,171 |
a,d,e,fAboveNet Inc., wts., 9/08/10 | | United States | | 2,995 | | | 130,822 |
Embarq Corp. | | United States | | 354,583 | | | 17,562,496 |
a,c,eGlobal Crossing Holdings Ltd., Contingent Distribution | | United States | | 9,005,048 | | | — |
Koninklijke (Royal) KPN NV | | Netherlands | | 823,354 | | | 14,947,427 |
Telefonica SA | | Spain | | 1,182,590 | | | 38,347,557 |
Verizon Communications Inc. | | United States | | 1,271,173 | | | 55,537,548 |
| | | | | | | |
| | | | | | | 129,635,404 |
| | | | | | | |
Electric Utilities 0.8% | | | | | | | |
E.ON AG | | Germany | | 186,703 | | | 39,673,631 |
Exelon Corp. | | United States | | 153,797 | | | 12,555,987 |
| | | | | | | |
| | | | | | | 52,229,618 |
| | | | | | | |
Electronic Equipment & Instruments 0.7% | | | | | | | |
Tyco Electronics Ltd. | | United States | | 1,246,682 | | | 46,289,303 |
| | | | | | | |
Energy Equipment & Services 1.0% | | | | | | | |
aSeadrill Ltd. | | Bermuda | | 1,417,088 | | | 34,550,402 |
a,hTransocean Inc. | | United States | | 201,330 | | | 28,820,390 |
| | | | | | | |
| | | | | | | 63,370,792 |
| | | | | | | |
Food & Staples Retailing 3.8% | | | | | | | |
Carrefour SA | | France | | 689,846 | | | 53,648,467 |
CVS Caremark Corp. | | United States | | 1,670,318 | | | 66,395,141 |
Kroger Co. | | United States | | 1,816,387 | | | 48,515,697 |
Wal-Mart Stores Inc. | | United States | | 1,350,782 | | | 64,202,668 |
| | | | | | | |
| | | | | | | 232,761,973 |
| | | | | | | |
Food Products 3.6% | | | | | | | |
Cadbury Schweppes PLC | | United Kingdom | | 5,444,234 | | | 67,176,187 |
General Mills Inc. | | United States | | 281,699 | | | 16,056,843 |
Groupe Danone | | France | | 303,941 | | | 27,234,356 |
Kraft Foods Inc., A | | United States | | 1,573,564 | | | 51,345,393 |
Nestle SA | | Switzerland | | 138,993 | | | 63,780,762 |
| | | | | | | |
| | | | | | | 225,593,541 |
| | | | | | | |
Health Care Equipment & Supplies 1.0% | | | | | | | |
Covidien Ltd. | | United States | | 1,032,122 | | | 45,712,683 |
Hillenbrand Industries Inc. | | United States | | 342,585 | | | 19,092,262 |
| | | | | | | |
| | | | | | | 64,804,945 |
| | | | | | | |
MS-14
Franklin Templeton Variable Insurance Products Trust
Statement of Investments, December 31, 2007 (continued)
| | | | | | | |
| Mutual Shares Securities Fund | | Country | | Shares/
Warrants/
Contracts | | Value |
Long Term Investments (continued) | | | | | | | |
Common Stocks and Other Equity Interests (continued) | | | | | | | |
Health Care Providers & Services 2.0% | | | | | | | |
aCommunity Health Systems Inc. | | United States | | 1,204,704 | | $ | 44,405,389 |
a,d,e,fKindred Healthcare Inc. | | United States | | 166,003 | | | 3,939,417 |
a,d,e,fKindred Healthcare Inc., stock grant: | | | | | | | |
grant price $18.15, expiration date 7/17/11 | | United States | | 578 | | | 3,226 |
grant price $19.87, expiration date 1/01/12 | | United States | | 172 | | | 664 |
grant price $6.94, expiration date 1/01/13 | | United States | | 171 | | | 2,871 |
grant price $19.87, expiration date 1/01/14 | | United States | | 127 | | | 490 |
grant price $21.33, expiration date 1/10/15 | | United States | | 72 | | | 173 |
grant price $22.08, expiration date 1/10/16 | | United States | | 37 | | | 61 |
aMDS Inc. | | Canada | | 521,262 | | | 10,065,930 |
aPharMerica Inc. | | United States | | 60,761 | | | 843,363 |
Quest Diagnostics Inc. | | United States | | 638,453 | �� | | 33,774,164 |
aTenet Healthcare Corp. | | United States | | 6,379,987 | | | 32,410,334 |
| | | | | | | |
| | | | | | | 125,446,082 |
| | | | | | | |
Hotels, Restaurants & Leisure 0.2% | | | | | | | |
aTrump Entertainment Resorts Inc. | | United States | | 370,093 | | | 1,591,400 |
Wyndham Worldwide Corp. | | United States | | 432,314 | | | 10,185,318 |
| | | | | | | |
| | | | | | | 11,776,718 |
| | | | | | | |
Household Durables 1.0% | | | | | | | |
iBeazer Homes USA Inc. | | United States | | 527,656 | | | 3,920,484 |
Koninklijke Philips Electronics NV | | Netherlands | | 1,295,501 | | | 55,810,197 |
| | | | | | | |
| | | | | | | 59,730,681 |
| | | | | | | |
Independent Power Producers & Energy Traders 1.3% | | | | | | | |
Constellation Energy Group | | United States | | 774,016 | | | 79,359,860 |
| | | | | | | |
Industrial Conglomerates 4.2% | | | | | | | |
Keppel Corp. Ltd. | | Singapore | | 3,905,323 | | | 35,220,923 |
fOrkla ASA | | Norway | | 5,362,549 | | | 103,856,525 |
Siemens AG | | Germany | | 590,321 | | | 93,402,195 |
Tyco International Ltd. | | United States | | 667,699 | | | 26,474,265 |
| | | | | | | |
| | | | | | | 258,953,908 |
| | | | | | | |
Insurance 7.7% | | | | | | | |
aAlleghany Corp. | | United States | | 22,894 | | | 9,203,388 |
Allianz SE | | Germany | | 157,848 | | | 34,111,038 |
American International Group Inc. | | United States | | 635,838 | | | 37,069,355 |
aBerkshire Hathaway Inc., A | | United States | | 149 | | | 21,098,400 |
aBerkshire Hathaway Inc., B | | United States | | 34,960 | | | 165,570,560 |
aConseco Inc. | | United States | | 1,091,457 | | | 13,708,700 |
Hartford Financial Services Group Inc. | | United States | | 302,199 | | | 26,348,731 |
Old Republic International Corp. | | United States | | 2,329,142 | | | 35,892,078 |
a,d,eOlympus Re Holdings Ltd. | | United States | | 16,280 | | | 53,320 |
Prudential Financial Inc. | | United States | | 188,225 | | | 17,512,454 |
The Travelers Cos. Inc. | | United States | | 320,496 | | | 17,242,685 |
White Mountains Insurance Group Ltd. | | United States | | 126,185 | | | 64,865,399 |
jZurich Financial Services AG | | Switzerland | | 118,066 | | | 34,642,557 |
| | | | | | | |
| | | | | | | 477,318,665 |
| | | | | | | |
IT Services 0.6% | | | | | | | |
aAlliance Data Systems Corp. | | United States | | 480,456 | | | 36,029,395 |
| | | | | | | |
MS-15
Franklin Templeton Variable Insurance Products Trust
Statement of Investments, December 31, 2007 (continued)
| | | | | | | |
| Mutual Shares Securities Fund | | Country | | Shares/
Warrants/
Contracts | | Value |
Long Term Investments (continued) | | | | | | | |
Common Stocks and Other Equity Interests (continued) | | | | | | | |
Leisure Equipment & Products 0.7% | | | | | | | |
Mattel Inc. | | United States | | 2,382,250 | | $ | 45,358,040 |
| | | | | | | |
Machinery 0.2% | | | | | | | |
Federal Signal Corp. | | United States | | 930,921 | | | 10,444,934 |
aMotor Coach Industries International Inc., wts., 5/27/09 | | United States | | 2 | | | — |
| | | | | | | |
| | | | | | | 10,444,934 |
| | | | | | | |
Marine 0.8% | | | | | | | |
A.P. Moller - Maersk AS | | Denmark | | 4,478 | | | 47,676,524 |
| | | | | | | |
Media 7.7% | | | | | | | |
aAdelphia Recovery Trust | | United States | | 29,283,354 | | | 2,049,835 |
a,cAdelphia Recovery Trust Arahova, Contingent Value Vehicle, Contingent Distribution | | United States | | 1,955,453 | | | 1,007,058 |
aCablevision Systems Corp., A | | United States | | 628,581 | | | 15,400,234 |
a,cCentury Communications Corp., Contingent Distribution | | United States | | 5,487,000 | | | — |
Clear Channel Communications Inc. | | United States | | 871,680 | | | 30,090,394 |
aComcast Corp., A | | United States | | 4,825,187 | | | 87,432,388 |
aLiberty Media Holding Corp.-Capital, A | | United States | | 321,349 | | | 37,433,945 |
News Corp., A | | United States | | 5,275,372 | | | 108,092,372 |
aSun-Times Media Group Inc., A | | United States | | 598,729 | | | 1,317,204 |
aTime Warner Cable Inc., A | | United States | | 612,196 | | | 16,896,610 |
Time Warner Inc. | | United States | | 3,765,929 | | | 62,175,488 |
a,eTVMAX Holdings Inc. | | United States | | 35,609 | | | — |
aViacom Inc., B | | United States | | 1,131,397 | | | 49,690,956 |
Virgin Media Inc. | | United Kingdom | | 2,334,742 | | | 40,017,478 |
WPP Group PLC | | United Kingdom | | 1,740,452 | | | 22,374,498 |
| | | | | | | |
| | | | | | | 473,978,460 |
| | | | | | | |
Metals & Mining 1.9% | | | | | | | |
Alcoa Inc. | | United States | | 868,694 | | | 31,750,766 |
hAnglo American PLC | | United Kingdom | | 403,165 | | | 24,672,917 |
ArcelorMittal | | Netherlands | | 485,127 | | | 37,536,573 |
d,eEsmark Inc. | | United States | | 1,783,526 | | | 22,681,100 |
| | | | | | | |
| | | | | | | 116,641,356 |
| | | | | | | |
Multi-Utilities & Unregulated Power 1.5% | | | | | | | |
Energy East Corp. | | United States | | 897,373 | | | 24,417,519 |
NorthWestern Corp. | | United States | | 110,164 | | | 3,249,838 |
a,cNorthWestern Corp., Contingent Distribution | | United States | | 3,365,650 | | | 238,589 |
RWE AG | | Germany | | 357,511 | | | 50,321,212 |
Suez SA | | France | | 197,567 | | | 13,427,034 |
| | | | | | | |
| | | | | | | 91,654,192 |
| | | | | | | |
Multiline Retail 0.4% | | | | | | | |
a,iSears Holdings Corp. | | United States | | 260,950 | | | 26,629,948 |
| | | | | | | |
Oil, Gas & Consumable Fuels 2.2% | | | | | | | |
BP PLC | | United Kingdom | | 2,800,254 | | | 34,218,385 |
BP PLC, ADR | | United Kingdom | | 5,003 | | | 366,069 |
Royal Dutch Shell PLC, A | | United Kingdom | | 1,799,086 | | | 75,483,012 |
Total SA, B | | France | | 301,983 | | | 25,044,917 |
| | | | | | | |
| | | | | | | 135,112,383 |
| | | | | | | |
MS-16
Franklin Templeton Variable Insurance Products Trust
Statement of Investments, December 31, 2007 (continued)
| | | | | | | |
| Mutual Shares Securities Fund | | Country | | Shares/
Warrants/
Contracts | | Value |
Long Term Investments (continued) | | | | | | | |
Common Stocks and Other Equity Interests (continued) | | | | | | | |
Paper & Forest Products 3.9% | | | | | | | |
aDomtar Corp. | | United States | | 2,894,235 | | $ | 22,256,667 |
International Paper Co. | | United States | | 2,427,000 | | | 78,586,260 |
MeadWestvaco Corp. | | United States | | 1,553,006 | | | 48,609,088 |
Mondi Ltd. | | South Africa | | 55,042 | | | 520,034 |
Mondi PLC | | United Kingdom | | 36,842 | | | 311,113 |
Weyerhaeuser Co. | | United States | | 1,265,274 | | | 93,301,305 |
| | | | | | | |
| | | | | | | 243,584,467 |
| | | | | | | |
Pharmaceuticals 2.6% | | | | | | | |
Bristol-Myers Squibb Co. | | United States | | 943,859 | | | 25,031,141 |
Novartis AG | | Switzerland | | 605,496 | | | 33,181,523 |
Pfizer Inc. | | United States | | 2,784,652 | | | 63,295,140 |
Sanofi-Aventis | | France | | 357,367 | | | 32,845,551 |
aValeant Pharmaceuticals International | | United States | | 766,061 | | | 9,169,750 |
Watson Pharmaceuticals Inc. | | United States | | 1,600 | | | 43,424 |
| | | | | | | |
| | | | | | | 163,566,529 |
| | | | | | | |
Real Estate 0.7% | | | | | | | |
aAlexander’s Inc. | | United States | | 7,651 | | | 2,702,716 |
a,eCanary Wharf Group PLC | | United Kingdom | | 1,535,898 | | | 15,350,316 |
Link REIT | | Hong Kong | | 6,427,688 | | | 13,913,565 |
iThe St. Joe Co. | | United States | | 156,936 | | | 5,572,797 |
Ventas Inc. | | United States | | 57,870 | | | 2,618,618 |
| | | | | | | |
| | | | | | | 40,158,012 |
| | | | | | | |
Real Estate Management & Development 0.1% | | | | | | | |
aForestar Real Estate Group | | United States | | 281,163 | | | 6,632,635 |
| | | | | | | |
Semiconductors & Semiconductor Equipment 1.0% | | | | | | | |
aLSI Corp. | | United States | | 6,515,393 | | | 34,596,737 |
Maxim Integrated Products Inc. | | United States | | 1,062,758 | | | 28,141,832 |
| | | | | | | |
| | | | | | | 62,738,569 |
| | | | | | | |
Software 2.2% | | | | | | | |
aBEA Systems Inc. | | United States | | 1,988,420 | | | 31,377,268 |
Microsoft Corp. | | United States | | 2,665,626 | | | 94,896,285 |
aNAVTEQ Corp. | | United States | | 162,500 | | | 12,285,000 |
| | | | | | | |
| | | | | | | 138,558,553 |
| | | | | | | |
Specialty Retail 0.9% | | | | | | | |
The Home Depot Inc. | | United States | | 2,086,093 | | | 56,199,345 |
| | | | | | | |
Thrifts & Mortgage Finance 1.1% | | | | | | | |
Hudson City Bancorp Inc. | | United States | | 3,327,515 | | | 49,979,275 |
Sovereign Bancorp Inc. | | United States | | 1,789,267 | | | 20,397,644 |
| | | | | | | |
| | | | | | | 70,376,919 |
| | | | | | | |
Tobacco 10.5% | | | | | | | |
Altadis SA | | Spain | | 906,628 | | | 65,770,681 |
Altria Group Inc. | | United States | | 1,244,956 | | | 94,093,775 |
British American Tobacco PLC | | United Kingdom | | 4,320,987 | | | 168,706,757 |
British American Tobacco PLC, ADR | | United Kingdom | | 4,218 | | | 331,366 |
MS-17
Franklin Templeton Variable Insurance Products Trust
Statement of Investments, December 31, 2007 (continued)
| | | | | | | | |
| Mutual Shares Securities Fund | | Country | | Shares/
Warrants/
Contracts | | | Value |
Long Term Investments (continued) | | | | | | | | |
Common Stocks and Other Equity Interests (continued) | | | | | | | | |
Tobacco (continued) | | | | | | | | |
Imperial Tobacco Group PLC | | United Kingdom | | 2,099,706 | | | $ | 113,144,940 |
Japan Tobacco Inc. | | Japan | | 7,615 | | | | 45,615,567 |
KT&G Corp. | | South Korea | | 1,111,310 | | | | 94,622,517 |
Reynolds American Inc. | | United States | | 1,077,223 | | | | 71,053,629 |
| | | | | | | | |
| | | | | | | | 653,339,232 |
| | | | | | | | |
Transportation Infrastructure 0.0%g | | | | | | | | |
aGroupe Eurotunnel SA, wts., 12/30/11 | | France | | 160,159 | | | | 53,757 |
| | | | | | | | |
Total Common Stocks and Other Equity Interests
(Cost $4,645,552,221) | | | | | | | | 5,542,353,713 |
| | | | | | | | |
Preferred Stocks 0.4% | | | | | | | | |
Auto Components 0.1% | | | | | | | | |
d,eDana Holding Corp., 4.00%, cvt. pfd., B | | United States | | 37,154 | | | | 3,715,400 |
| | | | | | | | |
Diversified Telecommunication Services 0.0%g | | | | | | | | |
dPTV Inc., 10.00%, pfd., A | | United Kingdom | | 17,300 | | | | 20,760 |
| | | | | | | | |
Thrifts & Mortgage Finance 0.3% | | | | | | | | |
aWashington Mutual Inc., 7.75%, cvt. pfd., R | | United States | | 19,000 | | | | 16,815,000 |
| | | | | | | | |
Total Preferred Stocks
(Cost $22,272,071) | | | | | | | | 20,551,160 |
| | | | | | | | |
Options Purchased 0.4% | | | | | | | | |
Call Options 0.0%g | | | | | | | | |
a,dOwens Corning Inc., exercise price $37.50, expiration date 1/02/08, shares | | United States | | 223,431 | | | | 11,172 |
| | | | | | | | |
Put Options 0.4% | | | | | | | | |
aDow Jones EUROSTOXX 50, exercise price $4,088.73, expiration date 6/20/08, contracts | | United States | | 45,000 | | | | 5,981,053 |
aIndex basket consisting of 70% Dow Jones EUROSTOXX 50 (exercise price $4,083.52), 30% S&P 500 Index (exercise price $1,393.76), expiration date 7/18/08, contracts | | United States | | 515,460 | | | | 1,676,424 |
aS&P 500 Index, exercise price $1,250.00, expiration date 6/21/08, contracts | | United States | | 731 | | | | 2,002,940 |
aS&P 500 Index, exercise price $1,375.00, expiration date 6/21/08, contracts | | United States | | 2,818 | | | | 14,935,400 |
| | | | | | | | |
| | | | | | | | 24,595,817 |
| | | | | | | | |
Total Options Purchased
(Cost $19,917,679) | | | | | | | | 24,606,989 |
| | | | | | | | |
| | | |
| | | | | Principal
Amountk | | | |
Corporate Bonds & Notes 1.6% | | | | | | | | |
bACE Aviation Holdings Inc., cvt., 144A, 4.25%, 6/01/35 | | Canada | | 1,242,000 | CAD | | | 1,412,287 |
d,eCerberus CG Investor I LLC, 12.00%, 7/31/14 | | United States | | 7,173,000 | | | | 6,039,498 |
d,eCerberus CG Investor II LLC, 12.00%, 7/31/14 | | United States | | 7,173,000 | | | | 6,039,498 |
d,eCerberus CG Investor III LLC, 12.00%, 7/31/14 | | United States | | 3,586,500 | | | | 3,019,749 |
d,eCerberus FIM Investors Auto Finance LLC, 12.00%, 11/22/13 | | United States | | 6,915,902 | | | | 3,710,595 |
d,eCerberus FIM Investors Commercial Finance LLC, 12.00%, 11/22/13 | | United States | | 576,466 | | | | 309,292 |
d,eCerberus FIM Investors Commercial Mortgage LLC, 12.00%, 11/22/13 | | United States | | 1,080,497 | | | | 579,720 |
d,eCerberus FIM Investors Insurance LLC, 12.00%, 11/22/13 | | United States | | 5,284,774 | | | | 2,835,445 |
d,eCerberus FIM Investors Rescap LLC, 12.00%, 11/22/13 | | United States | | 9,839,154 | | | | 5,279,010 |
MS-18
Franklin Templeton Variable Insurance Products Trust
Statement of Investments, December 31, 2007 (continued)
| | | | | | | | |
| Mutual Shares Securities Fund | | Country | | Principal Amountk | | | Value |
Long Term Investments (continued) | | | | | | | | |
Corporate Bonds & Notes (continued) | | | | | | | | |
d,eDecisionOne Corp., | | | | | | | | |
12.00%, 4/15/10 | | United States | | 133,782 | | | $ | 133,782 |
lFRN, 9.50%, 5/12/09 | | United States | | 24,958 | | | | 24,958 |
Groupe Eurotunnel SA, cvt., | | | | | | | | |
3.00%, 6/28/09 | | France | | 4,300 | EUR | | | 13,805 |
3.00%, 6/28/09 | | France | | 4,979 | GBP | | | 21,763 |
3.00%, 7/28/10 | | France | | 2,425,100 | EUR | | | 6,989,662 |
3.00%, 7/28/10 | | France | | 1,688,564 | GBP | | | 6,626,307 |
6.00%, 7/28/10 | | France | | 5,618,700 | EUR | | | 11,028,529 |
6.00%, 7/28/10 | | France | | 4,367,869 | GBP | | | 11,672,902 |
sub bond, T1, 3.00%, 7/28/08 | | France | | 4,300 | EUR | | | 15,374 |
sub bond, T1, 3.00%, 7/28/08 | | France | | 4,979 | GBP | | | 24,236 |
d,e,fInternational Automotive Components Group NA LLC, 9.00%, 4/01/17 | | United States | | 1,456,500 | | | | 1,456,500 |
d,e,lMotor Coach Industries International Inc., FRN, 18.081%, 12/01/08 | | United States | | 13,014,519 | | | | 12,884,374 |
Trump Entertainment Resorts Inc., 8.50%, 5/20/15 | | United States | | 7,582,630 | | | | 5,810,190 |
eTVMAX Holdings Inc., PIK, | | | | | | | | |
11.50%, 2/28/08 | | United States | | 36,643 | | | | 25,650 |
14.00%, 2/28/08 | | United States | | 179,010 | | | | 125,307 |
Wimar OPCO LLC/Finance Corp., senior sub. note, 9.625%, 12/15/14 | | United States | | 18,305,000 | | | | 11,715,200 |
| | | | | | | | |
Total Corporate Bonds & Notes (Cost $111,582,293) | | | | | | | | 97,793,633 |
| | | | | | | | |
Corporate Bonds & Notes in Reorganization 0.2% | | | | | | | | |
bCalpine Corp., senior secured note, 144A,
8.50%, 7/15/10 | | United States | | 2,422,000 | | | | 2,603,650 |
9.875%, 12/01/11 | | United States | | 853,000 | | | | 895,650 |
8.75%, 7/15/13 | | United States | | 1,280,000 | | | | 1,382,400 |
mDana Corp., | | | | | | | | |
6.50%, 3/01/09 | | United States | | 1,946,000 | | | | 1,469,230 |
5.85%, 1/15/15 | | United States | | 6,458,000 | | | | 4,746,630 |
7.00%, 3/01/29 | | United States | | 1,531,000 | | | | 1,155,905 |
senior note, 7.00%, 3/15/28 | | United States | | 404,000 | | | | 296,940 |
e,mSafety Kleen Services, senior sub. note, 9.25%, 6/01/08 | | United States | | 5,000 | | | | 25 |
| | | | | | | | |
Total Corporate Bonds & Notes in Reorganization
(Cost $11,973,068) | | | | | | | | 12,550,430 |
| | | | | | | | |
Companies in Liquidation 0.0%g | | | | | | | | |
e,mPeregrine Investments Holdings Ltd., 6.70%, 1/15/98 | | Hong Kong | | 5,000,000 | JPY | | | 336 |
e,mPIV Investment Finance (Cayman) Ltd. | | Hong Kong | | 12,200,000 | | | | 244,000 |
| | | | | | | | |
Total Companies in Liquidation (Cost $—) | | | | | | | | 244,336 |
| | | | | | | | |
Total Long Term Investments (Cost $4,811,297,332) | | | | | | | | 5,698,100,261 |
| | | | | | | | |
Short Term Investments 8.9% | | | | | | | | |
U.S. Government and Agency Securities 8.4% | | | | | | | | |
n,oFHLB, 1/02/08 - 12/04/08 | | United States | | 395,370,000 | | | | 392,240,490 |
nFHLB, 1/04/08 | | United States | | 100,000,000 | | | | 100,000,000 |
nU.S. Treasury Bill, 5/01/08 | | United States | | 30,750,000 | | | | 30,419,960 |
| | | | | | | | |
Total U.S. Government and Agency Securities
(Cost $522,208,521) | | | | | | | | 522,660,450 |
| | | | | | | | |
MS-19
Franklin Templeton Variable Insurance Products Trust
Statement of Investments, December 31, 2007 (continued)
| | | | | | | | |
| Mutual Shares Securities Fund | | Country | | Shares/
Contracts | | Value | |
Total Investments before Money Market Fund
(Cost $5,333,505,853) | | | | | | $ | 6,220,760,711 | |
| | | | | | | | |
pInvestments from Cash Collateral Received for
Loaned Securities 0.5% | | | | | | | | |
Money Market Fund (Cost $30,865,031) 0.5% | | | | | | | | |
qBank of New York Institutional Cash Reserve Fund, 5.06% | | United States | | 30,865,031 | | | 30,865,031 | |
| | | | | | | | |
Total Investments (Cost $5,364,370,884) 100.9% | | | | | | | 6,251,625,742 | |
Options Written 0.0%g | | | | | | | (1,978,587 | ) |
Securities Sold Short (0.4)% | | | | | | | (23,089,096 | ) |
Net Unrealized Loss on Forward Exchange Contracts (0.2)% | | | | | | | (13,600,736 | ) |
Other Assets, less Liabilities (0.3)% | | | | | | | (14,897,804 | ) |
| | | | | | | | |
Net Assets 100.0% | | | | | | $ | 6,198,059,519 | |
| | | | | | | | |
rOptions Written 0.0%g | | | | | | | | |
Energy Equipment & Services 0.0%g | | | | | | | | |
Transocean Inc., Feb. $120.00, Calls 2/16/08 | | United States | | 1,134 | | $ | 1,644,300 | |
Transocean Inc., Feb. $130.00, Calls 2/16/08 | | United States | | 288 | | | 205,632 | |
| | | | | | | | |
| | | | | | | 1,849,932 | |
| | | | | | | | |
Metals & Mining 0.0%g | | | | | | | | |
Anglo American PLC, Mar. $34.00, Calls 3/20/08 | | United Kingdom | | 50,000 | | | 128,655 | |
| | | | | | | | |
Total Options Written (Premiums received $1,337,174) | | | | | | | 1,978,587 | |
| | | | | | | | |
| | | |
sSecurities Sold Short (Proceeds $24,064,281) 0.4% | | | | | | | | |
Commercial Banks 0.4% | | | | | | | | |
Toronto-Dominion Bank | | Canada | | 330,080 | | $ | 23,089,096 | |
| | | | | | | | |
Currency Abbreviations
CAD - Canadian Dollar
EUR - Euro
GBP - British Pound
JPY - Japanese Yen
Selected Portfolio Abbreviations
ADR - American Depository Receipt
FHLB - Federal Home Loan Bank
FRN - Floating Rate Note
PIK - Payment-In-Kind
REIT - Real Estate Investment Trust
MS-20
Franklin Templeton Variable Insurance Products Trust
Statement of Investments, December 31, 2007 (continued)
Mutual Shares Securities Fund
aNon-income producing for the twelve months ended December 31, 2007.
bSecurity was purchased pursuant to Rule 144A under the Securities Act of 1933 and may be sold in transactions exempt from registration only to qualified institutional buyers or in a public offering registered under the Securities Act of 1933. These securities have been deemed liquid under guidelines approved by the Trust’s Board of Trustees. At December 31, 2007, the aggregate value of these securities was $7,120,737 representing 0.11% of net assets.
cContingent distributions represent the right to receive additional distributions, if any, during the reorganization of the underlying company. Shares represent total underlying principal of debt securities.
dSee Note 10 regarding restricted securities.
eSecurity has been deemed illiquid because it may not be able to be sold within seven days. At December 31, 2007, the aggregate value of these securities was $141,305,548, representing 2.28% of net assets.
fSee Note 12 regarding other considerations.
gRounds to less than 0.1% of net assets.
hA portion or all of the security is held in connection with written option contracts open at year end.
iA portion or all of the security is on loan as of December 31, 2007. See Note 1(h).
jSee Note 1(c) regarding securities purchased on a delayed delivery basis.
kThe principal amount is stated in U.S. dollars unless otherwise indicated.
lThe coupon rate shown represents the rate at period end.
mSee Note 8 regarding defaulted securities.
nThe security is traded on a discount basis with no stated coupon rate.
oSecurity or a portion of the security has been segregated as collateral for securities sold short. At December 31, 2007, the value of these securities and cash pledged amounted to $19,648,390.
pSee Note 1(h) regarding securities on loan.
qThe rate shown is the annualized seven-day yield at period end.
rSee Note 1(f) regarding written options.
sSee Note 1(g) regarding securities sold short.
The accompanying notes are an integral part of these financial statements.
MS-21
Franklin Templeton Variable Insurance Products Trust
Financial Statements
Statement of Assets and Liabilities
December 31, 2007
| | | |
| | | Mutual Shares
Securities Fund |
Assets: | | | |
Investments in securities: | | | |
Cost | | $ | 5,364,370,884 |
| | | |
Value - (includes securities loaned in the amount of $29,867,564) | | $ | 6,251,625,742 |
Cash | | | 2,617,805 |
Cash on deposit with brokers for securities sold short | | | 24,176,003 |
Foreign currency, at value (cost $12,946,980) | | | 13,046,110 |
Receivables: | | | |
Investment securities sold | | | 1,679,139 |
Capital shares sold | | | 3,116,320 |
Dividends and interest | | | 11,510,453 |
Unrealized gain on forward exchange contracts (Note 7) | | | 11,393,553 |
| | | |
Total assets | | | 6,319,165,125 |
| | | |
Liabilities: | | | |
Payables: | | | |
Investment securities purchased | | | 32,351,181 |
Capital shares redeemed | | | 1,000,274 |
Affiliates | | | 6,188,089 |
Securities sold short, at value (proceeds $24,064,281) | | | 23,089,096 |
Payable upon return of securities loaned | | | 30,865,031 |
Options written, at value (proceeds $1,337,174) | | | 1,978,587 |
Unrealized loss on forward exchange contracts (Note 7) | | | 24,994,289 |
Accrued expenses and other liabilities | | | 639,059 |
| | | |
Total liabilities | | | 121,105,606 |
| | | |
Net assets, at value | | $ | 6,198,059,519 |
| | | |
Net assets consist of: | | | |
Paid-in capital | | $ | 4,950,661,802 |
Undistributed net investment income | | | 149,427,434 |
Net unrealized appreciation (depreciation) | | | 874,089,529 |
Accumulated net realized gain (loss) | | | 223,880,754 |
| | | |
Net assets, at value | | $ | 6,198,059,519 |
| | | |
Class 1: | | | |
Net assets, at value | | $ | 272,508,515 |
| | | |
Shares outstanding | | | 13,344,177 |
| | | |
Net asset value and maximum offering price per share | | $ | 20.42 |
| | | |
Class 2: | | | |
Net assets, at value | | $ | 5,925,551,004 |
| | | |
Shares outstanding | | | 293,535,881 |
| | | |
Net asset value and maximum offering price per share | | $ | 20.19 |
| | | |
The accompanying notes are an integral part of these financial statements.
MS-22
Franklin Templeton Variable Insurance Products Trust
Financial Statements (continued)
Statement of Operations
for the year ended December 31, 2007
| | | | |
| | | Mutual Shares
Securities Fund | |
Investment income: | | | | |
Dividends (net of foreign taxes of $5,848,121) | | $ | 165,714,938 | |
Interest (net of foreign taxes of $1,198) | | | 35,087,451 | |
Income from securities loaned | | | 1,622,122 | |
| | | | |
Total investment income | | | 202,424,511 | |
| | | | |
Expenses: | | | | |
Management fees (Note 3a) | | | 36,470,027 | |
Administrative fees (Note 3b) | | | 5,176,319 | |
Distribution fees - Class 2 (Note 3c) | | | 14,705,429 | |
Unaffiliated transfer agent fees | | | 95,012 | |
Custodian fees (Note 4) | | | 728,208 | |
Reports to shareholders | | | 726,320 | |
Registration and filing fees | | | 3,157 | |
Professional fees | | | 382,169 | |
Trustees’ fees and expenses | | | 23,063 | |
Dividends on securities sold short | | | 369,411 | |
Other | | | 206,035 | |
| | | | |
Total expenses | | | 58,885,150 | |
Expense reductions (Note 4) | | | (43,432 | ) |
| | | | |
Net expenses | | | 58,841,718 | |
| | | | |
Net investment income | | | 143,582,793 | |
| | | | |
Realized and unrealized gains (losses): | | | | |
Net realized gain (loss) from: | | | | |
Investments (including gains from redemption in-kind of $14,084,559 - Note 13) | | | 371,156,986 | |
Written options | | | 132,041 | |
Securities sold short | | | (9,779,544 | ) |
Synthetic equity swaps | | | (528,945 | ) |
Foreign currency transactions | | | (102,066,135 | ) |
| | | | |
Net realized gain (loss) | | | 258,914,403 | |
| | | | |
Net change in unrealized appreciation (depreciation) on: | | | | |
Investments | | | (226,702,191 | ) |
Translation of assets and liabilities denominated in foreign currencies | | | (1,796,243 | ) |
| | | | |
Net unrealized depreciation | | | (228,498,434 | ) |
| | | | |
Net realized and unrealized gain (loss) | | | 30,415,969 | |
| | | | |
Net increase (decrease) in net assets resulting from operations | | $ | 173,998,762 | |
| | | | |
The accompanying notes are an integral part of these financial statements.
MS-23
Franklin Templeton Variable Insurance Products Trust
Financial Statements (continued)
Statements of Changes in Net Assets
| | | | | | | | |
| | | Mutual Shares
Securities Fund | |
| | | Year Ended December 31, | |
| | | 2007 | | | 2006 | |
| | | | |
Increase (decrease) in net assets: | | | | | | | | |
Operations: | | | | | | | | |
Net investment income | | $ | 143,582,793 | | | $ | 79,563,136 | |
Net realized gain (loss) from investments, written options, securities sold short, synthetic equity swaps and foreign currency transactions | | | 258,914,403 | | | | 231,700,658 | |
Net change in unrealized appreciation (depreciation) on investments and translation of assets and liabilities denominated in foreign currencies | | | (228,498,434 | ) | | | 456,274,565 | |
| | | | |
Net increase (decrease) in net assets resulting from operations | | | 173,998,762 | | | | 767,538,359 | |
| | | | |
Distributions to shareholders from: | | | | | | | | |
Net investment income: | | | | | | | | |
Class A | | | (3,972,937 | ) | | | (3,777,264 | ) |
Class B | | | (85,861,035 | ) | | | (52,312,087 | ) |
Net realized gains: | | | | | | | | |
Class A | | | (8,639,670 | ) | | | (8,422,207 | ) |
Class B | | | (210,215,361 | ) | | | (133,225,285 | ) |
| | | | |
Total distributions to shareholders | | | (308,689,003 | ) | | | (197,736,843 | ) |
| | | | |
Capital share transactions: (Note 2) | | | | | | | | |
Class A | | | 15,525,183 | | | | (31,807,250 | ) |
Class B | | | 916,403,514 | | | | 1,005,621,060 | |
| | | | |
Total capital share transactions | | | 931,928,697 | | | | 973,813,810 | |
| | | | |
Net increase (decrease) in net assets | | | 797,238,456 | | | | 1,543,615,326 | |
Net assets | | | | | | | | |
Beginning of year | | | 5,400,821,063 | | | | 3,857,205,737 | |
| | | | |
End of year | | $ | 6,198,059,519 | | | $ | 5,400,821,063 | |
| | | | |
Undistributed net investment income included in net assets: | | | | | | | | |
End of year | | $ | 149,427,434 | | | $ | 80,251,154 | |
| | | | |
The accompanying notes are an integral part of these financial statements.
MS-24
Franklin Templeton Variable Insurance Products Trust
Notes to Financial Statements
Mutual Shares Securities Fund
1. ORGANIZATION AND SIGNIFICANT ACCOUNTING POLICIES
Franklin Templeton Variable Insurance Products Trust (Trust) is registered under the Investment Company Act of 1940, as amended, (1940 Act) as an open-end investment company, consisting of twenty-three separate funds. The Mutual Shares Securities Fund (Fund) included in this report is diversified. The financial statements of the remaining funds in the Trust are presented separately. Shares of the Fund are sold only to insurance company separate accounts to fund the benefits of variable life insurance policies or variable annuity contracts. The Fund offers two classes of shares: Class 1 and Class 2. Each class of shares differs by its distribution fees, voting rights on matters affecting a single class and its exchange privilege.
The following summarizes the Fund’s significant accounting policies.
a. Security Valuation
Securities listed on a securities exchange or on the NASDAQ National Market System are valued at the last quoted sale price or the official closing price of the day, respectively. Over-the-counter securities and listed securities for which there is no reported sale are valued within the range of the most recent quoted bid and ask prices. Securities that trade in multiple markets or on multiple exchanges are valued according to the broadest and most representative market. Investments in open-end mutual funds are valued at closing net asset values.
Corporate debt securities and government securities generally trade in the over-the-counter market rather than on a securities exchange. The Trust may utilize independent pricing services, quotations from bond dealers, and information with respect to bond and note transactions, to assist in determining a current market value for each security. The Trust’s pricing services may use valuation models or matrix pricing which considers information with respect to comparable bond and note transactions, quotations from bond dealers, or by reference to other securities that are considered comparable in such characteristics as rating, interest rate and maturity date, option adjusted spread models, prepayment projections, interest rate spreads and yield curves, to determine current value.
Foreign securities are valued as of the close of trading on the foreign stock exchange on which the security is primarily traded, or the NYSE, whichever is earlier. If no sale is reported at that time, the foreign security will be valued within the range of the most recent quoted bid and ask prices. The value is then converted into its U.S. dollar equivalent at the foreign exchange rate in effect at the close of the NYSE on the day that the value of the foreign security is determined.
The Trust has procedures to determine the fair value of individual securities and other assets for which market prices are not readily available or which may not be reliably priced. Methods for valuing these securities may include: fundamental analysis, matrix pricing, discounts from market prices of similar securities, or discounts applied due to the nature and duration of restrictions on the disposition of the securities. Due to the inherent uncertainty of valuations of such securities, the fair values may differ significantly from the values that would have been used had a ready market for such investments existed. Occasionally, events occur between the time at which trading in a security is completed and the close of the NYSE that might call into question the availability (including the reliability) of the value of a portfolio security held by the Fund. The investment manager monitors price movements following the close of trading in foreign stock markets through a series of country specific market proxies (such as baskets of American Depository Receipts, futures contracts and exchange traded funds). These price movements are measured against established trigger thresholds for each specific market proxy to assist in determining if an event has occurred. If such an event occurs, the securities may be valued using fair value procedures, which may include the use of independent pricing services. All security valuation procedures are approved by the Trust’s Board of Trustees.
b. Foreign Currency Translation
Portfolio securities and other assets and liabilities denominated in foreign currencies are translated into U.S. dollars based on the exchange rate of such currencies against U.S. dollars on the date of valuation. Purchases and sales of securities, income and expense items denominated in foreign currencies are translated into U.S. dollars at the exchange rate in effect on the transaction date. Occasionally, events may impact the availability or reliability of foreign exchange rates used to convert the U.S. dollar
MS-25
Franklin Templeton Variable Insurance Products Trust
Notes to Financial Statements (continued)
Mutual Shares Securities Fund
1. ORGANIZATION AND SIGNIFICANT ACCOUNTING POLICIES (continued)
b. Foreign Currency Translation (continued)
equivalent value. If such an event occurs, the foreign exchange rate will be valued at fair value using procedures established and approved by the Trust’s Board of Trustees.
The Fund does not separately report the effect of changes in foreign exchange rates from changes in market prices on securities held. Such changes are included in net realized and unrealized gain or loss from investments on the Statement of Operations.
Realized foreign exchange gains or losses arise from sales of foreign currencies, currency gains or losses realized between the trade and settlement dates on securities transactions and the difference between the recorded amounts of dividends, interest, and foreign withholding taxes and the U.S. dollar equivalent of the amounts actually received or paid. Net unrealized foreign exchange gains and losses arise from changes in foreign exchange rates on foreign denominated assets and liabilities other than investments in securities held at the end of the reporting period.
c. Securities Purchased on a When-Issued or Delayed Delivery Basis
The Fund may purchase securities on a when-issued or delayed delivery basis, with payment and delivery scheduled for a future date. These transactions are subject to market fluctuations and are subject to the risk that the value at delivery may be more or less than the trade date purchase price. Although the Fund will generally purchase these securities with the intention of holding the securities, it may sell the securities before the settlement date. Sufficient assets have been segregated for these securities.
d. Foreign Currency Contracts
When the Fund purchases or sells foreign securities it may enter into foreign exchange contracts to minimize foreign exchange risk from the trade date to the settlement date of the transactions. A foreign exchange contract is an agreement between two parties to exchange different currencies at an agreed upon exchange rate at a future date. Realized and unrealized gains and losses on these contracts are included in the Statement of Operations.
The Fund may also enter into forward exchange contracts to hedge against fluctuations in foreign exchange rates. These contracts are valued daily by the Fund and the unrealized gains or losses on the contracts, as measured by the difference between the contractual forward foreign exchange rates and the forward rates at the reporting date, are included in the Statement of Assets and Liabilities. Realized and unrealized gains and losses on these contracts are included in the Statement of Operations.
The risks of these contracts include movement in the values of the foreign currencies relative to the U.S. dollar and the possible inability of the counterparties to fulfill their obligations under the contracts, which may be in excess of the amount reflected in the Statement of Assets and Liabilities.
e. Synthetic Equity Swaps
The Fund may engage in synthetic equity swaps. Synthetic equity swaps are contracts entered into between a broker and the Fund under which the parties agree to make payments to each other so as to replicate the economic consequences that would apply had a purchase or short sale of the underlying security taken place. Upon entering into synthetic equity swaps, the Fund is required to pledge to the broker an amount of cash and/or other assets equal to a certain percentage of the contract amount (margin account). Periodically, payments are made to recognize changes in value of the contract resulting from interest on the notional value of the contract, market value changes in the underlying security, and/or dividends paid by the issuer of the underlying security. The Fund recognizes a realized gain or loss when cash is received from, or paid to, the broker. Synthetic equity swaps are valued daily by the Fund and the unrealized gains or losses on the contracts (as measured by the difference
MS-26
Franklin Templeton Variable Insurance Products Trust
Notes to Financial Statements (continued)
Mutual Shares Securities Fund
1. ORGANIZATION AND SIGNIFICANT ACCOUNTING POLICIES (continued)
e. Synthetic Equity Swaps (continued)
between the contract amount plus or minus cash received or paid and the market value of the underlying securities) are recorded in the Statement of Operations. The margin account and any net unrealized gains or losses on open synthetic equity swaps are included in the Statement of Assets and Liabilities. The risks of entering into synthetic equity swaps include unfavorable price movements in the underlying securities or the inability of the counterparties to fulfill their obligations under the contract.
f. Options
The Fund may purchase or write options. Options are contracts entitling the holder to purchase or sell a specified number of shares or units of a particular security or index at a specified price. Options purchased are recorded as investments; options written (sold) are recorded as liabilities. Upon closing of an option, other than by exercise, which results in a cash settlement, the difference between the premium (original option value) and the settlement proceeds is realized as a gain or loss. When securities are acquired or delivered upon exercise of an option, the acquisition cost or sale proceeds are adjusted by the amount of the premium. When an option is closed, the difference between the premium and the cost to close the position is realized as a gain or loss. When an option expires, the premium is realized as a gain for options written or as a loss for options purchased. The risks include the possibility there may be an illiquid options market or the inability of the counterparties to fulfill their obligations under the contract. Writing options involves, to varying degrees, elements of market risk in excess of the amount recognized in the Statement of Assets and Liabilities.
g. Securities Sold Short
The Fund is engaged in selling securities short, which obligates the Fund to replace a borrowed security with the same security at current market value. The Fund incurs a loss if the price of the security increases between the date of the short sale and the date on which the Fund replaces the borrowed security. The Fund realizes a gain if the price of the security declines between those dates. Gains are limited to the price at which the Fund sold the security short, while losses are potentially unlimited in size.
The Fund is required to establish a margin account with the broker lending the security sold short. While the short sale is outstanding, the broker retains the proceeds of the short sale and the Fund must maintain a deposit with broker consisting of cash and securities having a value equal to a specified percentage of the value of the securities sold short. The Fund is obligated to pay the counterparty any dividends or interest due on securities sold short. Such dividends and interest are recorded as an expense to the Fund.
h. Securities Lending
The Fund may loan securities to certain brokers through a securities lending agent for which it receives initial cash collateral against the loaned securities in an amount equal to at least 102% of the market value of the loaned securities. Collateral is maintained over the life of the loan in an amount not less than 100% of the market value of loaned securities, as determined at the close of Fund business each day; any additional collateral required due to changes in security values is delivered to the Fund on the next business day. The collateral is invested in short-term instruments as noted in the Statement of Investments. The Fund receives interest income from the investment of cash collateral, adjusted by lender fees and broker rebates. The Fund bears the risk of loss with respect to the investment of the collateral and the securities loaned. The securities lending agent has agreed to indemnify the Fund in the case of default of any securities borrower.
i. Income Taxes
No provision has been made for U.S. income taxes because it is the Fund’s policy to qualify as a regulated investment company under the Internal Revenue Code and to distribute to shareholders substantially all of its taxable income and net realized gains.
MS-27
Franklin Templeton Variable Insurance Products Trust
Notes to Financial Statements (continued)
Mutual Shares Securities Fund
1. ORGANIZATION AND SIGNIFICANT ACCOUNTING POLICIES (continued)
i. Income Taxes (continued)
Foreign securities held by the Fund may be subject to foreign taxation on dividend and interest income received. Foreign taxes, if any, are recorded based on the tax regulations and rates that exist in the foreign markets in which the Fund invests
j. Security Transactions, Investment Income, Expenses and Distributions
Security transactions are accounted for on trade date. Realized gains and losses on security transactions are determined on a specific identification basis. Interest income and estimated expenses are accrued daily. Amortization of premium and accretion of discount on debt securities are included in interest income. Dividend income and dividends declared on securities sold short are recorded on the ex-dividend date except that certain dividends from foreign securities are recognized as soon as the Fund is notified of the ex-dividend date. Distributions to shareholders are recorded on the ex-dividend date and are determined according to income tax regulations (tax basis). Distributable earnings determined on a tax basis may differ from earnings recorded in accordance with accounting principles generally accepted in the United States of America. These differences may be permanent or temporary. Permanent differences are reclassified among capital accounts to reflect their tax character. These reclassifications have no impact on net assets or the results of operations. Temporary differences are not reclassified, as they may reverse in subsequent periods.
Common expenses incurred by the Trust are allocated among the funds based on the ratio of net assets of each fund to the combined net assets of the Trust. Fund specific expenses are charged directly to the fund that incurred the expense.
Realized and unrealized gains and losses and net investment income, other than class specific expenses, are allocated daily to each class of shares based upon the relative proportion of net assets of each class. Differences in per share distributions, by class, are generally due to differences in class specific expenses.
k. Accounting Estimates
The preparation of financial statements in accordance with accounting principles generally accepted in the United States of America requires management to make estimates and assumptions that affect the reported amounts of assets and liabilities at the date of the financial statements and the amounts of income and expenses during the reporting period. Actual results could differ from those estimates.
l. Guarantees and Indemnifications
Under the Trust’s organizational documents, its officers and trustees are indemnified by the Trust against certain liabilities arising out of the performance of their duties to the Trust. Additionally, in the normal course of business, the Trust, on behalf of the Fund, enters into contracts with service providers that contain general indemnification clauses. The Trust’s maximum exposure under these arrangements is unknown as this would involve future claims that may be made against the Trust that have not yet occurred. Currently, the Trust expects the risk of loss to be remote.
MS-28
Franklin Templeton Variable Insurance Products Trust
Notes to Financial Statements (continued)
Mutual Shares Securities Fund
2. SHARES OF BENEFICIAL INTEREST
At December 31, 2007, there were an unlimited number of shares authorized (without par value). Transactions in the Fund’s shares were as follows:
| | | | | | | | | | | | | | |
| | | Year Ended December 31, | |
| | | 2007 | | | 2006 | |
| Class 1 Shares: | | Shares | | | Amount | | | Shares | | | Amount | |
Shares sold | | 2,778,546 | | | $ | 57,615,881 | | | 242,465 | | | $ | 4,724,220 | |
Shares issued in reinvestment of distributions | | 580,157 | | | | 12,612,607 | | | 680,015 | | | | 12,199,471 | |
Shares redeemed | | (2,589,646 | ) | | | (54,703,305 | ) | | (2,537,171 | ) | | | (48,730,941 | ) |
| | | | |
Net increase (decrease) | | 769,057 | | | $ | 15,525,183 | | | (1,614,691 | ) | | $ | (31,807,250 | ) |
| | | | |
| Class 2 Shares: | | | | | | | | | | | | |
Shares sold | | 60,311,785 | | | $ | 1,269,429,065 | | | 60,971,125 | | | $ | 1,161,327,145 | |
Shares issued in reinvestment of distributions | | 13,758,197 | | | | 296,076,396 | | | 10,435,173 | | | | 185,537,372 | |
Shares redeemed in-kind (Note 13) | | (5,519,424 | ) | | | (109,229,391 | ) | | — | | | | — | |
Shares redeemed | | (26,278,440 | ) | | | (539,872,556 | ) | | (18,030,230 | ) | | | (341,243,457 | ) |
| | | | |
Net increase (decrease) | | 42,272,118 | | | $ | 916,403,514 | | | 53,376,068 | | | $ | 1,005,621,060 | |
| | | | |
3. TRANSACTIONS WITH AFFILIATES
Franklin Resources, Inc. is the holding company for various subsidiaries that together are referred to as Franklin Templeton Investments. Certain officers and trustees of the Trust are also officers and/or directors of the following subsidiaries:
| | |
| Subsidiary | | Affiliation |
Franklin Mutual Advisers, LLC (Franklin Mutual) | | Investment manager |
Franklin Templeton Services, LLC (FT Services) | | Administrative manager |
Franklin Templeton Distributors, Inc. (Distributors) | | Principal underwriter |
Franklin Templeton Investor Services, LLC (Investor Services) | | Transfer agent |
a. Management Fees
The Fund pays an investment management fee to Franklin Mutual based on the average daily net assets of the Fund as follows:
| | |
| Annualized Fee Rate | | Net Assets |
| 0.600% | | Up to and including $5 billion |
| 0.570% | | Over $5 billion, up to and including $10 billion |
| 0.550% | | Over $10 billion, up to and including $15 billion |
| 0.530% | | Over $15 billion, up to and including $20 billion |
| 0.510% | | In excess of $20 billion |
b. Administrative Fees
The Fund pays an administrative fee to FT Services based on the average daily net assets as follows:
| | |
| Annualized Fee Rate | | Net Assets |
| 0.150% | | Up to and including $200 million |
| 0.135% | | Over $200 million, up to and including $700 million |
| 0.100% | | Over $700 million, up to and including $1.2 billion |
| 0.075% | | In excess of $1.2 billion |
MS-29
Franklin Templeton Variable Insurance Products Trust
Notes to Financial Statements (continued)
Mutual Shares Securities Fund
3. TRANSACTIONS WITH AFFILIATES (continued)
c. Distribution Fees
The Fund’s Board of Trustees has adopted a distribution plan for Class 2 shares pursuant to Rule 12b-1 under the 1940 Act. Under the Fund’s compensation distribution plan, the Fund pays Distributors for costs incurred in connection with the servicing, sale and distribution of the Fund’s shares up to 0.35% per year of its average daily net assets. The Board of Trustees has agreed to limit the current rate to 0.25% per year.
d. Transfer Agent Fees
Investor Services, under terms of an agreement, performs shareholder servicing for the Fund and is not paid by the Fund for the services.
4. EXPENSE OFFSET ARRANGEMENT
The Fund has entered into an arrangement with its custodian whereby credits realized as a result of uninvested cash balances are used to reduce a portion of the Fund’s custodian expenses. During the year ended December 31, 2007, the custodian fees were reduced as noted in the Statement of Operations.
5. INCOME TAXES
The Fund has reviewed the tax positions taken on federal income tax returns, for each of the three open tax years and as of December 31, 2007 and has determined that no provision for income tax is required in the Fund’s financial statements.
For tax purposes, realized currency losses occurring subsequent to October 31, may be deferred and treated as occurring on the first day of the following fiscal year. At December 31, 2007, the Fund deferred realized currency losses of $850,204.
The tax character of distributions paid during the years ended December 31, 2007 and 2006, was as follows:
| | | | | | |
| | | 2007 | | 2006 |
Distributions paid from: | | | | | | |
Ordinary Income | | $ | 129,617,847 | | $ | 89,185,580 |
Long term capital gain | | | 179,071,156 | | | 108,551,263 |
| | | |
| | $ | 308,689,003 | | $ | 197,736,843 |
| | | |
At December 31, 2007, the cost of investments, net unrealized appreciation (depreciation), undistributed ordinary income and undistributed long term capital gains for income tax purposes were as follows:
| | | | |
Cost of investments | | $ | 5,368,193,537 | |
| | | | |
| |
Unrealized appreciation | | $ | 1,284,708,909 | |
Unrealized depreciation | | | (401,276,704 | ) |
| | | | |
Net unrealized appreciation (depreciation) | | $ | 883,432,205 | |
| | | | |
| |
Undistributed ordinary income | | $ | 206,573,782 | |
Undistributed long term capital gains | | | 159,245,849 | |
| | | | |
Distributable earnings | | $ | 365,819,631 | |
| | | | |
MS-30
Franklin Templeton Variable Insurance Products Trust
Notes to Financial Statements (continued)
Mutual Shares Securities Fund
5. INCOME TAXES (continued)
Net investment income differs for financial statement and tax purposes primarily due to differing treatments of defaulted securities, foreign currency transactions, passive foreign investment company shares, pass-through entity income, bond discounts and premiums, and certain dividends on securities sold short.
Net realized gains (losses) differ for financial statement and tax purposes primarily due to differing treatments of wash sales, foreign currency transactions, pass-through entity income, bond discounts and premiums, and gains realized on in-kind shareholder redemptions.
6. INVESTMENT TRANSACTIONS
Purchases and sales of investments (excluding short term securities and securities sold short) for the year ended December 31, 2007, aggregated $3,134,681,354 and $2,375,217,654, respectively.
Transactions in options written during the year ended December 31, 2007, were as follows:
| | | | | | | |
| | | Number of
Contracts | | | Premiums
Received | |
Options outstanding at December 31, 2006 | | 388 | | | $ | 45,600 | |
Options written | | 153,450 | | | | 1,954,428 | |
Options expired | | (102,088 | ) | | | (559,967 | ) |
Options exercised | | (328 | ) | | | (102,887 | ) |
Options closed | | — | | | | — | |
| | | | |
Options outstanding at December 31, 2007 | | 51,422 | | | $ | 1,337,174 | |
| | | | |
7. FORWARD EXCHANGE CONTRACTS
At December 31, 2007, the Fund had the following forward exchange contracts outstanding:
| | | | | | | | | | | | | | |
| | | Contract
Amount | | Settlement
Date | | Unrealized
Gain | | Unrealized
Loss | |
| Contracts to Buy | | | | | | | | | |
| 324,000,000 | | Japanese Yen | | $ | 2,824,908 | | 3/19/08 | | $ | 105,668 | | $ | — | |
| 7,740,453 | | Canadian Dollar | | | 7,838,751 | | 3/26/08 | | | — | | | (42,986 | ) |
| 19,795,190 | | Canadian Dollar | | | 19,830,001 | | 3/26/08 | | | 106,643 | | | — | |
| | | | |
| Contracts to Sell | | | | | | | | | |
| 259,325,134 | | Norwegian Krone | | | 47,628,647 | | 1/09/08 | | | — | | | (77,440 | ) |
| 6,400,000 | | British Pound | | | 12,685,151 | | 1/10/08 | | | — | | | (27,569 | ) |
| 62,402,690 | | British Pound | | | 126,182,745 | | 1/10/08 | | | 2,228,195 | | | — | |
| 94,206,714 | | Euro | | | 130,524,477 | | 1/14/08 | | | — | | | (6,992,348 | ) |
| 284,047,875 | | Swedish Krona | | | 44,527,348 | | 1/15/08 | | | 588,547 | | | — | |
| 26,718,340 | | Singapore Dollar | | | 17,982,333 | | 1/24/08 | | | — | | | (587,932 | ) |
| 48,950,626 | | Euro | | | 67,992,419 | | 2/13/08 | | | — | | | (3,489,830 | ) |
| 31,033,355 | | Euro | | | 45,320,273 | | 2/13/08 | | | 2,487 | | | — | |
| 66,981,051 | | Norwegian Krone | | | 12,234,641 | | 2/19/08 | | | — | | | (73,723 | ) |
| 112,000,000 | | Norwegian Krone | | | 20,671,165 | | 2/19/08 | | | 90,168 | | | — | |
| 61,169,592 | | Euro | | | 90,675,750 | | 2/25/08 | | | 1,344,054 | | | — | |
| 2,957,030 | | Swiss Franc | | | 2,578,640 | | 3/07/08 | | | — | | | (41,029 | ) |
| 87,482,384 | | Swiss Franc | | | 78,249,005 | | 3/07/08 | | | 747,359 | | | — | |
| 90,240,923 | | British Pound | | | 182,574,995 | | 3/10/08 | | | 3,611,843 | | | — | |
| 51,420,261 | | Euro | | | 71,718,972 | | 3/13/08 | | | — | | | (3,375,813 | ) |
MS-31
Franklin Templeton Variable Insurance Products Trust
Notes to Financial Statements (continued)
Mutual Shares Securities Fund
7. FORWARD EXCHANGE CONTRACTS (continued)
| | | | | | | | | | | | | | |
| | | Contract
Amount | | Settlement
Date | | Unrealized
Gain | | Unrealized
Loss | |
| Contracts to Sell (continued) | | | | | | | | | | | | |
| 39,813,118 | | Euro | | $ | 58,964,037 | | 3/13/08 | | $ | 820,467 | | $ | — | |
| 6,154,942,741 | | Japanese Yen | | | 54,800,985 | | 3/19/08 | | | — | | | (870,398 | ) |
| 52,214,609 | | Canadian Dollar | | | 52,222,698 | | 3/26/08 | | | — | | | (365,030 | ) |
| 1,200,000 | | Canadian Dollar | | | 1,299,250 | | 3/26/08 | | | 90,675 | | | — | |
| 1,871,500,000 | | Korean Won | | | 2,000,000 | | 3/27/08 | | | — | | | (9,664 | ) |
| 37,268,618,810 | | Korean Won | | | 40,838,500 | | 3/27/08 | | | 818,507 | | | — | |
| 235,369,022 | | Korean Won | | | 44,753,175 | | 4/23/08 | | | — | | | (1,336,032 | ) |
| 87,099,562 | | Euro | | | 122,912,106 | | 4/24/08 | | | — | | | (4,270,802 | ) |
| 94,784,842 | | Euro | | | 134,955,116 | | 5/19/08 | | | — | | | (3,431,740 | ) |
| 16,000,000 | | Euro | | | 23,801,040 | | 5/19/08 | | | 440,873 | | | — | |
| 800,000 | | Euro | | | 1,166,000 | | 5/28/08 | | | — | | | (1,953 | ) |
| 43,403,105 | | Euro | | | 63,764,066 | | 5/28/08 | | | 398,067 | | | — | |
| | | | | | | | | | | |
| Unrealized gain (loss) on forward exchange contracts | | | | | | | | 11,393,553 | | | (24,994,289 | ) |
| | | | | | | | | | | |
| Net unrealized gain (loss) on forward exchange contracts | | | | | | | | | | $ | (13,600,736 | ) |
| | | | | | | | | | | | | | |
8. CREDIT RISK AND DEFAULTED SECURITIES
The Fund may purchase the pre-default or defaulted debt of distressed companies. Distressed companies are financially troubled and are about to be/or are already involved in financial restructuring or bankruptcy. The Fund does not accrue income on these securities, if it becomes probable that the income will not be collected. Risks associated with purchasing these securities include the possibility that the bankruptcy or other restructuring process takes longer than expected, or that distributions in restructuring are less than anticipated, either or both of which may result in unfavorable consequences to the Fund. At December 31, 2007, the aggregate value of these securities was $7,668,730, representing 0.12% of the Fund’s net assets. For information as to specific securities, see the accompanying Statement of Investments.
9. CONCENTRATION OF RISK
Investing in foreign securities may include certain risks and considerations not typically associated with investing in U.S. securities, such as fluctuating currency values and changing local and regional economic, political and social conditions, which may result in greater market volatility. In addition, certain foreign securities may not be as liquid as U.S. securities.
10. RESTRICTED SECURITIES
The Fund may invest in securities that are restricted under the Securities Act of 1933 (1933 Act) or which are subject to legal, contractual, or other agreed upon restrictions on resale. Restricted securities are often purchased in private placement transactions, and cannot be sold without prior registration unless the sale is pursuant to an exemption under the 1933 Act. Disposal of these securities may require greater effort and expense, and prompt sale at an acceptable price may be difficult. The Fund may have registration rights for restricted securities. The issuer generally incurs all registration costs.
MS-32
Franklin Templeton Variable Insurance Products Trust
Notes to Financial Statements (continued)
Mutual Shares Securities Fund
10. RESTRICTED SECURITIES (continued)
At December 31, 2007, the Fund held investments in restricted securities, excluding 144A securities deemed to be liquid, valued in accordance with procedures approved by the Trust’s Board of Trustees as reflecting fair value, as follows:
| | | | | | | | | | | |
Principal
Amount/
Shares/Warrants/ Contracts | | | Issuer | | Acquisition
Dates | | Cost | | Value |
| 59,723 | | | AboveNet Inc. | | 10/02/01-09/07/07 | | $ | 3,108,481 | | $ | 2,986,150 |
| 78 | | | AboveNet Inc., stock grant, grant price $20.95, expiration date 9/09/13 | | 10/02/01-09/07/07 | | | — | | | 3,233 |
| 2,546 | | | AboveNet Inc., wts., 9/08/08 | | 10/02/01-09/07/07 | | | 293,521 | | | 120,171 |
| 2,995 | | | AboveNet Inc., wts., 9/08/10 | | 4/17/06-09/08/06 | | | 315,092 | | | 130,822 |
| 7,173,000 | | | Cerberus CG Investor I LLC | | 7/26/07 | | | 7,173,000 | | | 6,039,498 |
| 7,173,000 | | | Cerberus CG Investor I LLC, 12.00%, 7/31/14 | | 7/26/07 | | | 7,173,000 | | | 6,039,498 |
| 7,173,000 | | | Cerberus CG Investor II LLC | | 7/26/07 | | | 7,173,000 | | | 6,039,498 |
| 7,173,000 | | | Cerberus CG Investor II LLC, 12.00%, 7/31/14 | | 7/26/07 | | | 7,173,000 | | | 6,039,498 |
| 3,586,500 | | | Cerberus CG Investor III LLC | | 7/26/07 | | | 3,586,500 | | | 3,019,749 |
| 3,586,500 | | | Cerberus CG Investor III LLC, 12.00%, 7/31/14 | | 7/26/07 | | | 3,586,500 | | | 3,019,749 |
| 2,306,869 | | | Cerberus FIM Investors Auto Finance LLC | | 11/21/06 | | | 2,306,870 | | | 1,237,706 |
| 6,915,902 | | | Cerberus FIM Investors Auto Finance LLC, 12.00%, 11/22/13 | | 11/20/06 | | | 6,915,902 | | | 3,710,595 |
| 192,155 | | | Cerberus FIM Investors Commercial Finance LLC | | 11/20/06 | | | 192,155 | | | 103,097 |
| 576,466 | | | Cerberus FIM Investors Commercial Finance LLC, 12.00% 11/22/13 | | 11/20/06 | | | 576,466 | | | 309,292 |
| 360,165 | | | Cerberus FIM Investors Commercial Mortgage LLC | | 11/20/06 | | | 360,166 | | | 193,240 |
| 1,080,497 | | | Cerberus FIM Investors Commercial Mortgage LLC, 12.00% 11/22/13 | | 11/20/06 | | | 1,080,497 | | | 579,720 |
| 1,761,591 | | | Cerberus FIM Investors Insurance LLC | | 11/20/06 | | | 1,761,591 | | | 945,148 |
| 5,284,774 | | | Cerberus FIM Investors Insurance LLC, 12.00% 11/22/13 | | 11/20/06 | | | 5,284,774 | | | 2,835,445 |
| 3,279,720 | | | Cerberus FIM Investors Rescap LLC | | 11/20/06 | | | 3,279,719 | | | 1,759,671 |
| 9,839,154 | | | Cerberus FIM Investors Rescap LLC, 12.00%, 11/22/13 | | 11/20/06 | | | 9,839,156 | | | 5,279,010 |
| 37,154 | | | Dana Holding Corp., 4.00%, cvt. pfd., B | | 3/12/99-7/18/00 | | | 3,715,400 | | | 3,715,400 |
| 108,227 | | | DecisionOne Corp. | | 3/12/99-7/18/07 | | | 76,619 | | | — |
| 59,425 | | | DecisionOne Corp., wts., 6/08/17 | | 8/29/03-3/22/07 | | | — | | | — |
| | | DecisionOne Corp.: | | | | | | | | |
| 133,782 | | | 12.00%, 4/15/10 | | 7/09/07 | | | 515,025 | | | 133,782 |
| 24,958 | | | FRN, 9.50%, 5/12/09 | | 7/09/07 | | | 24,958 | | | 24,958 |
| 4,825 | | | Elephant Capital Holdings Ltd. | | 7/28/06 | | | 171,909 | | | 3,177,409 |
| 1,783,526 | | | Esmark Inc. | | 11/08/04-1/11/07 | | | 33,034,512 | | | 22,681,100 |
| 1,451,684 | | | International Automotive Components Group Brazil LLC | | 4/13/06-8/21/06 | | | 868,763 | | | 10,083,586 |
| 269,643 | | | International Automotive Components Group Japan LLC | | 9/26/06-3/27/07 | | | 2,343,097 | | | 2,417,998 |
| 6,170,474 | | | International Automotive Components Group LLC | | 1/12/06-10/16/06 | | | 6,173,501 | | | 6,546,256 |
| 4,838,052 | | | International Automotive Components Group NA LLC | | 3/30/07 | | | 4,831,541 | | | 6,652,321 |
| 1,456,500 | | | International Automotive Components Group NA LLC, 9.00%, 4/01/17 | | 3/30/07 | | | 1,478,348 | | | 1,456,500 |
| 166,003 | | | Kindred Healthcare Inc. | | 4/28/99-3/29/06 | | | 1,540,145 | | | 3,939,417 |
| | | Kindred Healthcare Inc., stock grant: | | | | | | | | |
| 578 | | | grant price $18.15, expiration date 7/17/11 | | 7/17/02-7/17/05 | | | — | | | 3,226 |
| 172 | | | grant price $19.87, expiration date 1/01/12 | | 1/01/03-1/01/06 | | | 16 | | | 664 |
| 171 | | | grant price $6.94, expiration date 1/01/13 | | 1/01/04-1/01/07 | | | — | | | 2,871 |
| 127 | | | grant price $19.87, expiration date 1/01/14 | | 1/01/05-1/01/06 | | | — | | | 490 |
| 72 | | | grant price $21.33, expiration date 1/10/15 | | 1/06/06 | | | — | | | 173 |
| 37 | | | grant price $22.08, expiration date 1/10/16 | | 1/09/07 | | | — | | | 61 |
| 13,014,519 | | | Motor Coach Industries International Inc., FRN, 18.081%, 12/01/08 | | 5/07/04-8/31/07 | | | 13,014,519 | | | 12,884,374 |
| 2 | | | Motor Coach Industries International Inc., wts., 5/27/09 | | 3/30/07 | | | — | | | — |
| 23,570 | | | NCB Warrant Holdings Ltd., A | | 12/16/05 | | | — | | | 1,398,451 |
| 16,280 | | | Olympus Re Holdings Ltd. | | 12/19/01 | | | 1,628,000 | | | 53,320 |
| 223,431 | | | aOwens Corning Inc., exercise price $37.50, expiration date, 1/02/08, shares | | 1/03/07 | | | 23,382 | | | 11,172 |
| 17,300 | | | PTV Inc., 10.00%, pfd., A | | 12/07/01-3/06/02 | | | 51,900 | | | 20,760 |
| | | | | | | | | | | |
| | | Total Restricted Securities (2.03% of Net Assets) | | | | | | | $ | 125,595,079 |
| | | | | | | | | | | |
a | The Fund also invests in unrestricted securities of the issuer, valued at $16,600,236 as of December 31, 2007. |
MS-33
Franklin Templeton Variable Insurance Products Trust
Notes to Financial Statements (continued)
Mutual Shares Securities Fund
11. UNFUNDED CAPITAL COMMITMENTS
At December 31, 2007, the Fund had total unfunded commitments to investments of $13,636,000.
12. OTHER CONSIDERATIONS
Officers, directors or employees of the Fund’s Investment Manager, may serve from time to time as members of boards of directors of companies in which the Fund invests. Such participation may result in the possession by the Investment Manager of material non-public information which, pursuant to the Fund’s policies and the requirements of applicable securities laws, could prevent the Fund from trading in the securities of such companies for limited or extended periods of time.
13. REDEMPTION IN-KIND
During the year ended December 31, 2007, the Fund realized $14,084,559 of net gains resulting from a redemption in-kind in which a shareholder redeemed fund shares for securities held by the Fund rather than for cash. Because such gains are not taxable to the Fund, and are not distributed to shareholders, they have been reclassified from accumulated net realized gains to paid-in capital.
14. REGULATORY AND LITIGATION MATTERS
As part of various investigations by a number of federal, state, and foreign regulators and governmental entities, including the Securities and Exchange Commission (“SEC”), relating to certain practices in the mutual fund industry, including late trading, market timing and marketing support payments to securities dealers who sell fund shares (“marketing support”), Franklin Resources, Inc. and certain of its subsidiaries (collectively, the “Company”), entered into settlements with certain of those regulators and governmental entities. Specifically, the Company entered into settlements with the SEC, among others, concerning market timing and marketing support.
On June 6, 2007, the SEC posted for public comment the proposed plan of distribution for the market timing settlement. Once the SEC approves the final plan of distribution, disbursements of settlement monies will be made promptly to individuals who were shareholders of the designated funds during the relevant period, in accordance with the terms and conditions of the settlement and plan.
In addition, the Company, as well as most of the mutual funds within Franklin Templeton Investments and certain current or former officers, Company directors, fund directors, and employees, have been named in private lawsuits (styled as shareholder class actions, or as derivative actions on behalf of either the named funds or Franklin Resources, Inc.). The lawsuits relate to the industry practices referenced above.
The Company and fund management believe that the claims made in each of the private lawsuits referenced above are without merit and intend to defend against them vigorously. The Company cannot predict with certainty the eventual outcome of these lawsuits, nor whether they will have a material negative impact on the Company. If it is determined that the Company bears responsibility for any unlawful or inappropriate conduct that caused losses to the Fund, it is committed to making the Trust or its shareholders whole, as appropriate.
MS-34
Franklin Templeton Variable Insurance Products Trust
Notes to Financial Statements (continued)
Mutual Shares Securities Fund
15. NEW ACCOUNTING PRONOUNCEMENT
In September 2006, Financial Accounting Standards Board (FASB) issued FASB Statement No. 157, “Fair Value Measurement” (SFAS 157), which defines fair value, establishes a framework for measuring fair value, and expands disclosures about fair value measurements. SFAS 157 is effective for fiscal years beginning after November 15, 2007, and interim periods within those fiscal years. The Trust believes the adoption of SFAS 157 will have no material impact on its financial statements.
MS-35
Franklin Templeton Variable Insurance Products Trust
Mutual Shares Securities Fund
Report of Independent Registered Public Accounting Firm
To the Board of Trustees and Shareholders of
Franklin Templeton Variable Insurance Products Trust
In our opinion, the accompanying statement of assets and liabilities, including the statement of investments, and the related statements of operations and of changes in net assets and the financial highlights present fairly, in all material respects, the financial position of Mutual Shares Securities Fund (one of the funds constituting Franklin Templeton Variable Insurance Products Trust, hereafter referred to as the “Fund”) at December 31, 2007, the results of its operations for the year then ended, the changes in its net assets for each of the two years in the period then ended and the financial highlights for each of the five years in the period then ended, in conformity with accounting principles generally accepted in the United States of America. These financial statements and financial highlights (hereafter referred to as “financial statements”) are the responsibility of the Fund’s management. Our responsibility is to express an opinion on these financial statements based on our audits. We conducted our audits of these financial statements in accordance with the standards of the Public Company Accounting Oversight Board (United States). Those standards require that we plan and perform the audit to obtain reasonable assurance about whether the financial statements are free of material misstatement. An audit includes examining, on a test basis, evidence supporting the amounts and disclosures in the financial statements, assessing the accounting principles used and significant estimates made by management, and evaluating the overall financial statement presentation. We believe that our audits, which included confirmation of securities at December 31, 2007 by correspondence with the custodian and brokers, provide a reasonable basis for our opinion.
PricewaterhouseCoopers LLP
San Francisco, California
February 14, 2008
MS-36
Franklin Templeton Variable Insurance Products Trust
Tax Designation (unaudited)
Mutual Shares Securities Fund
Under Section 852(b)(3)(C) of the Internal Revenue Code (Code), the Fund designates the maximum amount allowable but no less than $164,719,919 as a long term capital gain dividend for the fiscal year ended December 31, 2007. Under Section 871(k)(2)(C) of the Code, the Fund designates the maximum amount allowable but no less than $57,654,440 as a short term capital gain dividend for purposes of the tax imposed under Section 871(a)(1)(A) of the Code for the fiscal year ended December 31, 2007.
Under Section 854(b)(2) of the Code, the Fund designates 72.88% of the ordinary income dividends as income qualifying for the dividends received deduction for the fiscal year ended December 31, 2007.
At December 31, 2007, more than 50% of the Fund’s total assets were invested in securities of foreign issuers. In most instances, foreign taxes were withheld from income paid to the Fund on these investments. The Fund elects to treat foreign taxes paid as allowed under Section 853 of the Code. This election will allow shareholders of record as of the 2008 distribution date, to treat their proportionate share of foreign taxes paid by the Fund as having been paid directly by them. The shareholder shall consider these amounts as foreign taxes paid in the tax year in which they receive the Fund distribution.
MS-37
TEMPLETON DEVELOPING MARKETS SECURITIES FUND
This annual report for Templeton Developing Markets Securities Fund covers the fiscal year ended December 31, 2007.
Performance Summary as of 12/31/07
Average annual total return of Class 1 shares* represents the average annual change in value, assuming reinvestment of dividends and capital gains. Average returns smooth out variations in returns, which can be significant; they are not the same as year-by-year results.
Periods ended 12/31/07
| | | | | | |
| | | 1-Year | | 5-Year | | 10-Year |
Average Annual Total Return | | +29.09% | | +32.38% | | +11.99% |
*Performance prior to the 5/1/00 merger reflects historical performance of Templeton Developing Markets Fund.
Total Return Index Comparison for Hypothetical $10,000 Investment (1/1/98–12/31/07)
The graph below shows the change in value of a hypothetical $10,000 investment in the Fund over the indicated period and includes reinvestment of any income or distributions. The Fund’s performance* is compared to the performance of the Morgan Stanley Capital International (MSCI) Emerging Markets (EM) Index and the Standard & Poor’s/International Finance Corporation Investable (S&P/IFCI) Composite Index. One cannot invest directly in an index, nor is an index representative of the Fund’s portfolio. Please see Important Notes to Performance Information preceding the Fund Summaries.
**Source: Standard & Poor’s Micropal. Please see Index Descriptions following the Fund Summaries.
Templeton Developing Markets Securities Fund Class 1
Performance reflects the Fund’s Class 1 operating expenses, but does not include any contract fees, expenses or sales charges. If they had been included, performance would be lower. These charges and deductions, particularly for variable life policies, can have a significant effect on contract values and insurance benefits. See the contract prospectus for a complete description of these expenses, including sales charges.
Performance data represent past performance, which does not guarantee future results. Investment return and principal value will fluctuate, and you may have a gain or loss when you sell your shares.
Current performance may differ from figures shown.
TD-1
Fund Goal and Main Investments: Templeton Developing Markets Securities Fund seeks long-term capital appreciation. The Fund normally invests at least 80% of its net assets in emerging market investments and normally invests primarily to predominantly in equity securities.
Performance Overview
You can find the Fund’s one-year total return in the Performance Summary. The Fund underperformed the MSCI EM Index’s +39.78% return, and the S&P/IFCI Composite Index’s +40.28% return for the same period.1 Please note that index performance numbers are purely for reference and that we do not attempt to track an index, but rather undertake investments on the basis of fundamental research.
Economic and Market Overview
In 2007, emerging markets equities had another positive year. Despite problems brought on by the U.S. subprime lending crisis, emerging markets registered a +39.78% gain for the year, bringing cumulative return for the past five years to +390.79% in U.S. dollar terms, as measured by the MSCI EM Index.2 Most stock markets were supported by a robust macroeconomic environment, surging money supply, rising commodity prices, stronger emerging market currencies, improved corporate earnings and significant investment inflows. Periods of increased volatility, however, occurred during the year as nervous investors reacted to subprime concerns and their impact on the global economy as well as overheating concerns in China.
In Asia, India and China were among the top performing markets as both economies continued to benefit from strong economic growth, a large consumer base and vast foreign reserves. Moreover, Chinese stocks listed in Hong Kong were key beneficiaries of the expansion of China’s Qualified Domestic Institutional Investor (QDII) program, which allowed domestic fund managers and brokerages to invest in foreign securities. Neighboring markets in Indonesia, Thailand and South Korea also recorded respectable gains.
Market returns in Latin America benefited from high commodity prices and stronger regional currencies. Accelerating economic growth, high
1. Source: Standard & Poor’s Micropal. One cannot invest directly in an index, nor is an index representative of the Fund’s portfolio. Please see Index Descriptions following the Fund Summaries.
2. Source: Standard & Poor’s Micropal. Please see Index Descriptions following the Fund Summaries.
Fund Risks: The Fund’s investments in stocks offer the potential for long-term gains but can be subject to short-term price fluctuations. Investing in emerging markets is subject to all the risks of foreign investing generally as well as additional, heightened risks, including currency fluctuations, economic instability, market volatility, political and social instability, the relatively smaller size and lesser liquidity of these markets, and less effective or irregular government supervision and regulation of business and industry practices. The Fund’s prospectus also includes a description of the main investment risks.
TD-2
foreign investment flows and lower interest rates pushed the Brazilian stock market to end the year at record high levels. However, Mexico underperformed its regional peers as concerns of slowing growth in the U.S. led investors to stay on the sidelines.
Despite recording double-digit returns, European and African markets underperformed their emerging market counterparts during the year. Turkey, however, significantly outperformed global markets as investors responded favorably to the central bank’s adoption of a loosening monetary policy, improvement in the country’s public finances, as well as the completion of parliamentary and presidential elections. A stronger lira also boosted stock returns in U.S. dollar terms.
Investment Strategy
Our investment philosophy is bottom-up, value-oriented and long-term. In choosing investments, we may make onsite visits to companies to assess critical factors such as management strength and local conditions. In addition, we focus on the market price of a company’s securities relative to our evaluation of the company’s potential long-term (typically five years) earnings, asset value and cash flow potential. Among factors we consider are a company’s historical value measures, including price/earnings ratio, profit margins and liquidation value. We perform in-depth research to construct an action list from which we make our investment decisions.
Manager’s Discussion
For the 12 months under review, the Fund’s exposure to the materials, energy, telecommunication services and bank sectors contributed significantly to absolute performance.3 Within the materials and energy sectors, holdings in Chalco (Aluminum Corp. of China), CVRD (Companhia Vale do Rio Doce), Petrobras (Petroleo Brasileiro) and Tupras (Tupras-Turkiye Petrol Rafinerileri) were among the largest contributors to performance. Rising oil and commodity prices coupled with growing demand for oil, coal and metals in China as well as other emerging markets benefited these companies.
Additional key contributors included Turkcell (Turkcell Iletisim Hizmetleri) and America Movil in the telecommunication services
3. The materials sector comprises chemicals, construction materials, metals and mining, and paper and forest products and in the SOI. The energy sector comprises energy equipment and services; and oil, gas and consumable fuels in the SOI. The telecommunication services sector comprises diversified telecommunication services and wireless telecommunication services in the SOI. The bank sector comprises commercial banks in the SOI.
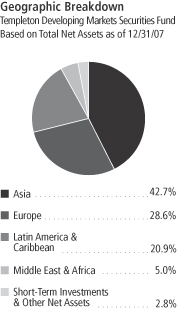
TD-3
sector. Turkish and Brazilian banks, Akbank, Vakifbank (Turkiye Vakiflar Bankasi), Unibanco (Unibanco-Uniao de Bancos Brasileiros) and Banco Bradesco, also boosted Fund performance during the period.
Sectors that detracted from Fund performance included retail and real estate.4 South African stocks Foschini and JD Group declined in value and were the largest detractors in the retail sector during the period. In the real estate sector, Emaar Properties was a major detractor, and we sold it during the period.
Geographically, investments in Brazil, Turkey and China made noteworthy contributions to Fund performance. In addition to stocks discussed earlier, THY (Turk Hava Yollari Anonim Ortakligi), Turkey’s national airline; Souza Cruz, Brazil’s leading major tobacco company; Sinopec (China Petroleum and Chemical), the largest integrated energy company in China; and PetroChina, a dominant player in the upstream oil and gas sector, also supported performance.
It is important to recognize the effect of currency movements on the Fund’s performance. In general, if the value of the U.S. dollar goes up compared with a foreign currency, an investment traded in that foreign currency will go down in value because it will be worth fewer U.S. dollars. This can have a negative effect on Fund performance. Conversely, when the U.S. dollar weakens in relation to a foreign currency, an investment traded in that foreign currency will increase in value, which can contribute to Fund performance. For the 12 months ended December 31, 2007, the U.S. dollar declined in value relative to most non-U.S. currencies. As a result, the Fund’s performance was positively affected by the portfolio’s investments predominantly in securities with non-U.S. currency exposure. However, one cannot expect the same result in future periods.
During the reporting period, we made significant purchases in Russia, India, Mexico and China (via Hong Kong-listed China H shares).5 Major investments included shares of America Movil, UES (Unified Energy Systems), China Telecom and Sberbank (Savings Bank of Russia).
4. The retail sector comprises specialty retail in the SOI. The real estate sector comprises real estate management and development in the SOI.
5. “China H” denotes shares of China-incorporated, Hong Kong-listed companies with most businesses in China.
Top 10 Holdings
Templeton Developing Markets Securities Fund
12/31/07
| | |
Company
Sector/Industry,
Country | | % of Total
Net Assets |
| |
CVRD (Companhia Vale do Rio Doce), ADR,
pfd., A | | 5.4% |
| Metals & Mining, Brazil | | |
| |
| Petrobras (Petroleo Brasileiro SA), ADR, pfd. | | 4.9% |
| Oil, Gas & Consumable Fuels, Brazil | | |
| |
| Chalco (Aluminum Corp. of China Ltd.), H & 144A | | 3.8% |
| Metals & Mining, China | | |
| |
| Akbank TAS | | 3.5% |
| Commercial Banks, Turkey | | |
| |
| UES (Unified Energy Systems) | | 3.4% |
| Electric Utilities, Russia | | |
| |
| Gazprom OAO, ord. & ADR | | 3.3% |
| Oil, Gas & Consumable Fuels, Russia | | |
| |
| SK Energy Co. Ltd. | | 3.1% |
| Oil, Gas & Consumable Fuels, South Korea | | |
| |
| Norilsk Nickel (Mining and Metallurgical Co. Norilsk Nickel) | | 3.1% |
| Metals & Mining, Russia | | |
| |
| PetroChina Co. Ltd., H | | 2.7% |
| Oil, Gas & Consumable Fuels, China | | |
| |
| America Movil SAB de CV, L, ADR | | 2.5% |
| Wireless Telecommunication Services, Mexico | | |
The dollar value, number of shares or principal amount, and names of all portfolio holdings are listed in the Fund’s Statement of Investments (SOI).
TD-4
We also made select additions in Pakistan, Peru and Chile as we continued to search for undervalued stocks trading at attractive valuations.
From a sector perspective, we increased the Fund’s allocations to several sectors based on what we considered favorable market trends. We expected commodity prices to stay at relatively high levels amid growing global energy demand, so we increased our investments in coal and diversified metals and mining companies.6 Greater global demand for consumer products and services also led us to increase our allocation to integrated telecommunication services, home furnishings and automobile manufacturing companies.7 We also increased the Fund’s exposure to the information technology (IT) consulting industry because of strong demand for outsourcing services.8 We initiated a position in Tata Consultancy Services, India’s leading IT consulting and outsourcing services provider.
To raise funds for redemptions during the reporting period, we sold a number of holdings. These sales also allowed the Fund to focus on stocks we considered relatively more attractively valued within our investment universe. We sold select positions as stocks reached sale price targets. As a result, the Fund’s exposure to the tobacco, semiconductors, diversified banking, and life and health insurance industries fell.9 Major sales included all or part of Remgro, Old Mutual, Samsung Electronics and Hana Financial Group.
Thank you for your participation in Templeton Developing Markets Securities Fund. We look forward to serving your future investment needs.
6. The coal industry is part of oil, gas and consumable fuels in the SOI. The diversified metals and mining industry is part of metals and mining in the SOI.
7. The integrated telecommunication services industry is part of diversified telecommunication services in the SOI. The home furnishings industry is part of household durables in the SOI. The automobile manufacturing industry is part of automobiles in the SOI.
8. The IT consulting industry is part of IT services in the SOI.
9. The semiconductors industry is part of semiconductors and semiconductor equipment in the SOI. The diversified banking industry is part of commercial banks in the SOI. The life and health insurance industry is part of insurance in the SOI.
The foregoing information reflects our analysis, opinions and portfolio holdings as of December 31, 2007, the end of the reporting period. The way we implement our main investment strategies and the resulting portfolio holdings may change depending on factors such as market and economic conditions. These opinions may not be relied upon as investment advice or an offer for a particular security. The information is not a complete analysis of every aspect of any market, country, industry, security or the Fund. Statements of fact are from sources considered reliable, but the investment manager makes no representation or warranty as to their completeness or accuracy. Although historical performance is no guarantee of future results, these insights may help you understand our investment management philosophy.
Top 10 Countries
Templeton Developing Markets Securities Fund 12/31/07
| | |
| | | % of Total
Net Assets |
| |
| China | | 19.7% |
| |
| Brazil | | 15.9% |
| |
| Russia | | 13.0% |
| |
| Turkey | | 9.4% |
| |
| South Korea | | 8.0% |
| |
| India | | 5.5% |
| |
| South Africa | | 4.6% |
| |
| Mexico | | 4.5% |
| |
| Taiwan | | 2.9% |
| |
| Thailand | | 2.5% |
TD-5
Fund Expenses
As an investor in a variable insurance contract (Contract) that indirectly provides for investment in an underlying mutual fund, you can incur transaction and/or ongoing expenses at both the Fund level and the Contract level.
| • | | Transaction expenses can include sales charges (loads) on purchases, redemption fees, surrender fees, transfer fees and premium taxes. |
| • | | Ongoing expenses can include management fees, distribution and service (12b-1) fees, contract fees, annual maintenance fees, mortality and expense risk fees and other fees and expenses. All mutual funds and Contracts have some types of ongoing expenses. |
The expenses shown in the table are meant to highlight ongoing expenses at the Fund level only and do not include ongoing expenses at the Contract level, or transaction expenses at either the Fund or Contract level. While the Fund does not have transaction expenses, if the transaction and ongoing expenses at the Contract level were included, the expenses shown below would be higher. You should consult your Contract prospectus or disclosure document for more information.
The table shows Fund-level ongoing expenses and can help you understand these expenses and compare them with those of other mutual funds offered through the Contract. The table assumes a $1,000 investment held for the six months indicated. Please refer to the Fund prospectus for additional information on operating expenses.
Actual Fund Expenses
The first line (Actual) of the table provides actual account values and expenses. The “Ending Account Value” is derived from the Fund’s actual return, which includes the effect of ongoing Fund expenses, but does not include the effect of ongoing Contract expenses.
You can estimate the Fund-level expenses you incurred during the period by following these steps. Of course, your account value and expenses will differ from those in this illustration:
| 1. | Divide your account value by $1,000. |
If an account had an $8,600 value, then $8,600 ÷ $1,000 = 8.6.
| 2. | Multiply the result by the number under the heading “Fund-Level Expenses Incurred During Period.” |
If Fund-Level Expenses Incurred During Period were $7.50, then 8.6 x $7.50 = $64.50.
In this illustration, the estimated expenses incurred this period at the Fund level are $64.50.
Templeton Developing Markets Securities Fund Class 1
TD-6
Hypothetical Example for Comparison with Other Mutual Funds
Information in the second line (Hypothetical) of the table can help you compare ongoing expenses of the Fund with those of other mutual funds offered through the Contract. This information may not be used to estimate the actual ending account balance or expenses you incurred during the period. The hypothetical “Ending Account Value” is based on the Fund’s actual expense ratio and an assumed 5% annual rate of return before expenses, which does not represent the Fund’s actual return. The figure under the heading “Fund-Level Expenses Incurred During Period” shows the hypothetical expenses your account would have incurred under this scenario. You can compare this figure with the 5% hypothetical examples that appear in shareholder reports of other funds offered through a Contract.
| | | | | | | | | |
| Class 1 | | Beginning
Account Value 7/1/07 | | Ending Account Value 12/31/07 | | Fund-Level
Expenses Incurred
During Period*
7/1/07–12/31/07 |
Actual | | $ | 1,000 | | $ | 1,120.60 | | $ | 7.96 |
Hypothetical (5% return before expenses) | | $ | 1,000 | | $ | 1,017.69 | | $ | 7.58 |
*Expenses are calculated using the most recent six-month annualized expense ratio for the Fund’s Class 1 shares (1.49%), which does not include any ongoing expenses of the Contract for which the Fund is an investment option, multiplied by the average account value over the period, multiplied by 184/365 to reflect the one-half year period.
TD-7
Franklin Templeton Variable Insurance Products Trust
Financial Highlights
Templeton Developing Markets Securities Fund
| | | | | | | | | | | | | | | | | | | | |
| | | Year Ended December 31, | |
| Class 1 | | 2007 | | | 2006 | | | 2005 | | | 2004 | | | 2003 | |
| | | | |
Per share operating performance | | | | | | | | | | | | | | | | | | | | |
(for a share outstanding throughout the year) | | | | | | | | | | | | | | | | | | | | |
Net asset value, beginning of year | | $ | 13.92 | | | $ | 10.99 | | | $ | 8.73 | | | $ | 7.14 | | | $ | 4.71 | |
| | | | |
Income from investment operationsa: | | | | | | | | | | | | | | | | | | | | |
Net investment incomeb | | | 0.32 | | | | 0.24 | | | | 0.17 | | | | 0.11 | | | | 0.13 | |
Net realized and unrealized gains (losses) | | | 3.51 | | | | 2.84 | | | | 2.23 | | | | 1.62 | | | | 2.38 | |
| | | | |
Total from investment operations | | | 3.83 | | | | 3.08 | | | | 2.40 | | | | 1.73 | | | | 2.51 | |
| | | | |
Less distributions from: | | | | | | | | | | | | | | | | | | | | |
Net investment income | | | (0.38 | ) | | | (0.15 | ) | | | (0.14 | ) | | | (0.14 | ) | | | (0.08 | ) |
Net realized gains | | | (1.21 | ) | | | — | | | | — | | | | — | | | | — | |
| | | | |
Total distributions | | | (1.59 | ) | | | (0.15 | ) | | | (0.14 | ) | | | (0.14 | ) | | | (0.08 | ) |
| | | | |
Redemption fees | | | — | d | | | — | d | | | — | d | | | — | | | | — | |
| | | | |
Net asset value, end of year | | $ | 16.16 | | | $ | 13.92 | | | $ | 10.99 | | | $ | 8.73 | | | $ | 7.14 | |
| | | | |
| | | | | |
Total returnc | | | 29.09% | | | | 28.43% | | | | 27.76% | | | | 24.83% | | | | 53.74% | |
Ratios to average net assets | | | | | | | | | | | | | | | | | | | | |
Expenses | | | 1.48% | e | | | 1.47% | e | | | 1.53% | e | | | 1.54% | e | | | 1.55% | |
Net investment income | | | 2.07% | | | | 1.93% | | | | 1.77% | | | | 1.52% | | | | 2.35% | |
| | | | | |
Supplemental data | | | | | | | | | | | | | | | | | | | | |
Net assets, end of year (000’s) | | $ | 753,843 | | | $ | 749,120 | | | $ | 651,826 | | | $ | 477,290 | | | $ | 359,299 | |
Portfolio turnover rate | | | 98.32% | | | | 53.65% | | | | 31.24% | | | | 55.67% | | | | 46.20% | |
a The amount shown for a share outstanding throughout the period may not correlate with the Statement of Operations for the period due to the timing of sales and repurchases of the Fund shares in relation to income earned and/or fluctuating market value of the investments of the Fund.
b Based on average daily shares outstanding.
c Total return does not include any fees, charges or expenses imposed by the variable annuity and life insurance contracts for which the Franklin Templeton Variable Insurance Products Trust serves as an underlying investment vehicle.
d Amount rounds to less than $0.01 per share.
e Benefit of expense reduction rounds to less than 0.01%.
The accompanying notes are an integral part of these financial statements.
TD-8
Franklin Templeton Variable Insurance Products Trust
Financial Highlights (continued)
Templeton Developing Markets Securities Fund
| | | | | | | | | | | | | | | | | | | | |
| | | Year Ended December 31, | |
| Class 2 | | 2007 | | | 2006 | | | 2005 | | | 2004 | | | 2003 | |
| | | | |
Per share operating performance | | | | | | | | | | | | | | | | | | | | |
(for a share outstanding throughout the year) | | | | | | | | | | | | | | | | | | | | |
Net asset value, beginning of year | | $ | 13.79 | | | $ | 10.90 | | | $ | 8.67 | | | $ | 7.09 | | | $ | 4.69 | |
| | | | |
Income from investment operationsa: | | | | | | | | | | | | | | | | | | | | |
Net investment incomeb | | | 0.27 | | | | 0.20 | | | | 0.14 | | | | 0.09 | | | | 0.11 | |
Net realized and unrealized gains (losses) | | | 3.49 | | | | 2.82 | | | | 2.21 | | | | 1.63 | | | | 2.35 | |
| | | | |
Total from investment operations | | | 3.76 | | | | 3.02 | | | | 2.35 | | | | 1.72 | | | | 2.46 | |
| | | | |
Less distributions from: | | | | | | | | | | | | | | | | | | | | |
Net investment income | | | (0.35 | ) | | | (0.13 | ) | | | (0.12 | ) | | | (0.14 | ) | | | (0.06 | ) |
Net realized gains | | | (1.21 | ) | | | — | | | | — | | | | — | | | | — | |
| | | | |
Total distributions | | | (1.56 | ) | | | (0.13 | ) | | | (0.12 | ) | | | (0.14 | ) | | | (0.06 | ) |
| | | | |
Redemption fees | | | — | d | | | — | d | | | — | d | | | — | | | | — | |
| | | | |
Net asset value, end of year | | $ | 15.99 | | | $ | 13.79 | | | $ | 10.90 | | | $ | 8.67 | | | $ | 7.09 | |
| | | | |
| | | | | |
Total returnc | | | 28.78% | | | | 28.09% | | | | 27.43% | | | | 24.71% | | | | 52.99% | |
Ratios to average net assets | | | | | | | | | | | | | | | | | | | | |
Expenses | | | 1.73% | e | | | 1.72% | e | | | 1.78% | e | | | 1.79% | e | | | 1.80% | |
Net investment income | | | 1.82% | | | | 1.68% | | | | 1.52% | | | | 1.27% | | | | 2.10% | |
| | | | | |
Supplemental data | | | | | | | | | | | | | | | | | | | | |
Net assets, end of year (000’s) | | $ | 1,090,549 | | | $ | 857,514 | | | $ | 650,646 | | | $ | 327,569 | | | $ | 170,953 | |
Portfolio turnover rate | | | 98.32% | | | | 53.65% | | | | 31.24% | | | | 55.67% | | | | 46.20% | |
a The amount shown for a share outstanding throughout the period may not correlate with the Statement of Operations for the period due to the timing of sales and repurchases of the Fund shares in relation to income earned and/or fluctuating market value of the investments of the Fund.
b Based on average daily shares outstanding.
c Total return does not include any fees, charges or expenses imposed by the variable annuity and life insurance contracts for which the Franklin Templeton Variable Insurance Products Trust serves as an underlying investment vehicle.
d Amount rounds to less than $0.01 per share.
e Benefit of expense reduction rounds to less than 0.01%.
The accompanying notes are an integral part of these financial statements.
TD-9
Franklin Templeton Variable Insurance Products Trust
Financial Highlights (continued)
Templeton Developing Markets Securities Fund
| | | | | | | | | | | | | | | | |
| | | Year Ended December 31, | |
| Class 3 | | 2007 | | | 2006 | | | 2005 | | | 2004g | |
| | | | |
Per share operating performance | | | | | | | | | | | | | | | | |
(for a share outstanding throughout the year) | | | | | | | | | | | | | | | | |
Net asset value, beginning of year | | $ | 13.78 | | | $ | 10.90 | | | $ | 8.68 | | | $ | 7.13 | |
| | | | |
Income from investment operationsa: | | | | | | | | | | | | | | | | |
Net investment incomeb | | | 0.24 | | | | 0.20 | | | | 0.04 | | | | 0.08 | |
Net realized and unrealized gains (losses) | | | 3.52 | | | | 2.83 | | | | 2.32 | | | | 1.61 | |
| | | | |
Total from investment operations | | | 3.76 | | | | 3.03 | | | | 2.36 | | | | 1.69 | |
| | | | |
Less distributions from: | | | | | | | | | | | | | | | | |
Net investment income | | | (0.37 | ) | | | (0.15 | ) | | | (0.14 | ) | | | (0.14 | ) |
Net realized gains | | | (1.21 | ) | | | — | | | | — | | | | — | |
| | | | |
Total distributions | | | (1.58 | ) | | | (0.15 | ) | | | (0.14 | ) | | | (0.14 | ) |
| | | | |
Redemption fees | | | — | e | | | — | e | | | — | e | | | — | |
| | | | |
Net asset value, end of year | | $ | 15.96 | | | $ | 13.78 | | | $ | 10.90 | | | $ | 8.68 | |
| | | | |
| | | | |
Total returnc | | | 28.70% | | | | 28.17% | | | | 27.45% | | | | 24.15% | |
Ratios to average net assetsd | | | | | | | | | | | | | | | | |
Expenses | | | 1.73% | f | | | 1.72% | f | | | 1.78% | f | | | 1.54% | f |
Net investment income | | | 1.82% | | | | 1.68% | | | | 1.52% | | | | 1.52% | |
| | | | |
Supplemental data | | | | | | | | | | | | | | | | |
Net assets, end of year (000’s) | | $ | 100,961 | | | $ | 43,372 | | | $ | 11,521 | | | $ | 12 | |
Portfolio turnover rate | | | 98.32% | | | | 53.65% | | | | 31.24% | | | | 55.67% | |
aThe amount shown for a share outstanding throughout the period may not correlate with the Statement of Operations for the period due to the timing of sales and repurchases of the Fund shares in relation to income earned and/or fluctuating market value of the investments of the Fund.
bBased on average daily shares outstanding.
cTotal return does not include any fees, charges or expenses imposed by the variable annuity and life insurance contracts for which the Franklin Templeton Variable Insurance Products Trust serves as an underlying investment vehicle. Total return is not annualized for periods less than one year.
dRatios are annualized for periods less than one year.
eAmount rounds to less than $0.01 per share.
fBenefit of expense reduction rounds to less than 0.01%.
gFor the period May 1, 2004 (effective date) to December 31, 2004.
The accompanying notes are an integral part of these financial statements.
TD-10
Franklin Templeton Variable Insurance Products Trust
Statement of Investments, December 31, 2007
| | | | | | | |
| Templeton Developing Markets Securities Fund | | Industry | | Shares/
Rights | | Value |
Long Term Investments 97.2% | | | |
Common Stocks and Rights 82.9% | | | |
Austria 1.0% | | | | | | | |
Erste Bank der oesterreichischen Sparkassen AG | | Commercial Banks | | 41,280 | | $ | 2,921,736 |
aIMMOEAST AG | | Real Estate Management &
Development | | 93,380 | | | 1,004,340 |
aMeinl European Land Ltd. | | Real Estate Management &
Development | | 91,625 | | | 1,260,913 |
OMV AG | | Oil, Gas & Consumable Fuels | | 136,419 | | | 11,033,183 |
Wienerberger AG | | Building Products | | 65,200 | | | 3,609,025 |
| | | | | | | |
| | | | | | | 19,829,197 |
| | | | | | | |
Brazil 1.8% | | | | | | | |
AES Tiete SA | | Independent Power Producers &
Energy Traders | | 155,680,382 | | | 6,909,410 |
Companhia de Bebidas das Americas (AmBev) | | Beverages | | 29,645 | | | 2,081,812 |
bCompanhia Energetica de Minas Gerais | | Electric Utilities | | 36,432 | | | 691,594 |
Energias do Brasil SA | | Electrical Equipment | | 133,775 | | | 2,171,965 |
cMarfrig Frigorificos e Comercio De Alimentos SA, 144A | | Food Products | | 396,359 | | | 3,395,772 |
Natura Cosmeticos SA | | Personal Products | | 252,304 | | | 2,409,645 |
Porto Seguro SA | | Insurance | | 83,300 | | | 3,088,652 |
Souza Cruz SA | | Tobacco | | 506,617 | | | 13,718,505 |
| | | | | | | |
| | | | | | | 34,467,355 |
| | | | | | | |
China 19.7% | | | | | | | |
Air China Ltd., H | | Airlines | | 5,102,000 | | | 7,602,524 |
Aluminum Corp. of China Ltd., H | | Metals & Mining | | 33,453,000 | | | 69,067,247 |
cAluminum Corp. of China Ltd., H, 144A | | Metals & Mining | | 1,954,000 | | | 4,034,239 |
Beijing Capital Land Ltd., H | | Real Estate Management &
Development | | 3,840,000 | | | 2,334,107 |
China Construction Bank Corp., H | | Commercial Banks | | 7,486,000 | | | 6,345,451 |
China International Marine Containers (Group) Co. Ltd., B | | Machinery | | 1,778,449 | | | 3,300,055 |
China Mobile Ltd. | | Wireless Telecommunication Services | | 2,230,500 | | | 39,443,704 |
China Netcom Group Corp. (Hong Kong) Ltd. | | Diversified Telecommunication Services | | 3,791,000 | | | 11,400,078 |
China Petroleum and Chemical Corp., H | | Oil, Gas & Consumable Fuels | | 30,418,000 | | | 45,950,172 |
China Shenhua Energy Co. Ltd., H | | Oil, Gas & Consumable Fuels | | 1,298,000 | | | 7,756,607 |
China Telecom Corp. Ltd., H | | Diversified Telecommunication Services | | 47,082,000 | | | 37,433,272 |
CNOOC Ltd. | | Oil, Gas & Consumable Fuels | | 17,006,000 | | | 28,960,860 |
Denway Motors Ltd. | | Automobiles | | 27,738,234 | | | 17,820,822 |
Dongfeng Motor Corp., H | | Automobiles | | 13,846,000 | | | 9,765,584 |
aHidili Industry International Development | | Metals & Mining | | 5,172,000 | | | 7,945,597 |
a,cHidili Industry International Development, 144A | | Metals & Mining | | 940,000 | | | 1,444,095 |
Huaneng Power International Inc., H | | Independent Power Producers &
Energy Traders | | 2,286,000 | | | 2,406,748 |
Industrial and Commercial Bank of China, H | | Commercial Banks | | 1,363,000 | | | 978,803 |
Jiangxi Copper Co. Ltd., H | | Metals & Mining | | 3,230,000 | | | 7,927,854 |
Nine Dragons Paper Holdings Ltd. | | Paper & Forest Products | | 894,000 | | | 2,260,766 |
PetroChina Co. Ltd., H | | Oil, Gas & Consumable Fuels | | 29,290,000 | | | 52,209,000 |
Shanghai Industrial Holdings Ltd. | | Industrial Conglomerates | | 2,797,000 | | | 12,195,022 |
aSoho China Ltd. | | Real Estate Management &
Development | | 3,231,500 | | | 3,335,886 |
a,cSoho China Ltd., 144A | | Real Estate Management &
Development | | 1,094,000 | | | 1,129,339 |
Travelsky Technology Ltd., H | | IT Services | | 788,000 | | | 837,707 |
| | | | | | | |
| | | | | | | 383,885,539 |
| | | | | | | |
TD-11
Franklin Templeton Variable Insurance Products Trust
Statement of Investments, December 31, 2007 (continued)
| | | | | | | |
| Templeton Developing Markets Securities Fund | | Industry | | Shares/
Rights | | Value |
Long Term Investments (continued) | | | |
Common Stocks and Rights (continued) | | | |
Egypt 0.2% | | | | | | | |
Orascom Construction Industries | | Construction & Engineering | | 28,719 | | $ | 2,988,338 |
Telecom Egypt | | Diversified Telecommunication
Services | | 344,639 | | | 1,307,644 |
| | | | | | | |
| | | | | | | 4,295,982 |
| | | | | | | |
Hong Kong 1.4% | | | | | | | |
Citic Pacific Ltd. | | Industrial Conglomerates | | 1,012,000 | | | 5,651,710 |
Dairy Farm International Holdings Ltd. | | Food & Staples Retailing | | 958,033 | | | 4,177,024 |
GOME Electrical Appliances Holdings Ltd. | | Specialty Retail | | 3,925,000 | | | 9,965,889 |
Hopson Development Holdings Ltd. | | Real Estate Management &
Development | | 814,000 | | | 2,249,484 |
Hutchison Whampoa Ltd. | | Industrial Conglomerates | | 381,000 | | | 4,321,495 |
VTech Holdings Ltd. | | Communications Equipment | | 220,000 | | | 1,579,872 |
| | | | | | | |
| | | | | | | 27,945,474 |
| | | | | | | |
Hungary 1.3% | | | | | | | |
Magyar Telekom PLC | | Diversified Telecommunication
Services | | 260,980 | | | 1,354,880 |
MOL Hungarian Oil and Gas Nyrt. | | Oil, Gas & Consumable Fuels | | 155,903 | | | 22,028,403 |
OTP Bank Ltd. | | Commercial Banks | | 48,284 | | | 2,448,179 |
| | | | | | | |
| | | | | | | 25,831,462 |
| | | | | | | |
India 5.5% | | | | | | | |
Ashok Leyland Ltd. | | Machinery | | 2,441,613 | | | 3,222,024 |
aBharti Airtel Ltd. | | Wireless Telecommunication Services | | 174,350 | | | 4,400,452 |
Dr. Reddy’s Laboratories Ltd. | | Pharmaceuticals | | 102,515 | | | 1,913,067 |
Gail India Ltd. | | Gas Utilities | | 741,937 | | | 10,205,988 |
Grasim Industries Ltd. | | Construction Materials | | 975 | | | 90,352 |
Hindalco Industries Ltd. | | Metals & Mining | | 1,474,292 | | | 8,038,362 |
Hindustan Unilever Ltd. | | Household Products | | 890,042 | | | 4,831,366 |
Maruti Suzuki India Ltd. | | Automobiles | | 69,329 | | | 1,741,890 |
National Aluminium Co. Ltd. | | Metals & Mining | | 531,656 | | | 6,640,134 |
Oil & Natural Gas Corp. Ltd. | | Oil, Gas & Consumable Fuels | | 880,633 | | | 27,633,618 |
Reliance Industries Ltd. | | Oil, Gas & Consumable Fuels | | 105,798 | | | 7,735,296 |
Satyam Computer Services Ltd. | | IT Services | | 180,985 | | | 2,062,921 |
Tata Chemicals Ltd. | | Chemicals | | 288,562 | | | 3,021,461 |
Tata Consultancy Services Ltd. | | IT Services | | 585,450 | | | 16,095,604 |
Tata Motors Ltd. | | Machinery | | 74,900 | | | 1,410,564 |
Tata Steel Ltd. | | Metals & Mining | | 326,300 | | | 7,740,775 |
| | | | | | | |
| | | | | | | 106,783,874 |
| | | | | | | |
Indonesia 0.4% | | | | | | | |
PT Bank Central Asia Tbk | | Commercial Banks | | 3,686,500 | | | 2,865,206 |
PT Telekomunikasi Indonesia, B | | Diversified Telecommunication
Services | | 5,136,000 | | | 5,550,216 |
| | | | | | | |
| | | | | | | 8,415,422 |
| | | | | | | |
Israel 0.2% | | | | | | | |
aTaro Pharmaceutical Industries Ltd. | | Pharmaceuticals | | 421,589 | | | 3,246,235 |
| | | | | | | |
Mexico 4.5% | | | | | | | |
Alfa SAB de CV | | Industrial Conglomerates | | 314,900 | | | 2,033,567 |
America Movil SAB de CV, L, ADR | | Wireless Telecommunication Services | | 785,958 | | | 48,249,961 |
Cemex SAB de CV, CPO, ADR | | Construction Materials | | 72,810 | | | 1,882,138 |
TD-12
Franklin Templeton Variable Insurance Products Trust
Statement of Investments, December 31, 2007 (continued)
| | | | | | | |
| Templeton Developing Markets Securities Fund | | Industry | | Shares/
Rights | | Value |
Long Term Investments (continued) | | | | | | | |
Common Stocks and Rights (continued) | | | | | | | |
Mexico (continued) | | | | | | | |
Consorcio ARA SAB de CV | | Household Durables | | 608,239 | | $ | 679,721 |
Fomento Economico Mexicano SAB de CV, ADR | | Beverages | | 59,900 | | | 2,286,383 |
Grupo Televisa SA | | Media | | 1,758,426 | | | 8,390,255 |
Kimberly Clark de Mexico SAB de CV, A | | Household Products | | 3,444,116 | | | 15,035,868 |
Telefonos de Mexico SAB de CV, L, ADR | | Diversified Telecommunication
Services | | 217,164 | | | 8,000,322 |
| | | | | | | |
| | | | | | | 86,558,215 |
| | | | | | | |
Pakistan 1.0% | | | | | | | |
MCB Bank Ltd. | | Commercial Banks | | 1,347,758 | | | 8,743,484 |
Oil & Gas Development Co. Ltd. | | Oil, Gas & Consumable Fuels | | 1,471,000 | | | 2,850,137 |
Pakistan Telecommunications Corp., A | | Diversified Telecommunication
Services | | 10,629,808 | | | 7,250,340 |
| | | | | | | |
| | | | | | | 18,843,961 |
| | | | | | | |
Peru 0.4% | | | | | | | |
Compania de Minas Buenaventura SA, ADR | | Metals & Mining | | 130,510 | | | 7,386,866 |
| | | | | | | |
Philippines 0.4% | | | | | | | |
San Miguel Corp., B | | Beverages | | 5,635,093 | | | 8,132,138 |
| | | | | | | |
Poland 0.6% | | | | | | | |
aPolski Koncern Naftowy Orlen SA | | Oil, Gas & Consumable Fuels | | 572,544 | | | 12,035,738 |
| | | | | | | |
Russia 13.0% | | | | | | | |
Bank Of Moscow | | Commercial Banks | | 24,838 | | | 1,297,786 |
Fifth Power Generation Co. | | Electric Utilities | | 1,192,148 | | | 208,864 |
Gazprom, ADR | | Oil, Gas & Consumable Fuels | | 564,100 | | | 31,674,215 |
Gazprom OAO | | Oil, Gas & Consumable Fuels | | 872,000 | | | 12,286,480 |
Gazprom OAO, ADR | | Oil, Gas & Consumable Fuels | | 358,500 | | | 20,326,950 |
LUKOIL, ADR | | Oil, Gas & Consumable Fuels | | 195,908 | | | 16,857,883 |
LUKOIL, ADR | | Oil, Gas & Consumable Fuels | | 93,368 | | | 8,066,995 |
Mining and Metallurgical Co. Norilsk Nickel | | Metals & Mining | | 226,087 | | | 59,913,055 |
OAO TMK, GDR | | Energy Equipment & Services | | 46,000 | | | 2,047,000 |
Sberbank RF | | Commercial Banks | | 4,750,220 | | | 20,045,928 |
TGC-5 JSC | | Independent Power Producers
& Energy Traders | | 39,352,044 | | | 35,614 |
TNK-BP | | Oil, Gas & Consumable Fuels | | 6,726,760 | | | 15,000,675 |
aUnified Energy Systems | | Electric Utilities | | 49,702,100 | | | 65,308,560 |
| | | | | | | |
| | | | | | | 253,070,005 |
| | | | | | | |
Singapore 0.8% | | | | | | | |
ComfortDelGro Corp. Ltd. | | Road & Rail | | 3,250,654 | | | 4,126,884 |
Fraser and Neave Ltd. | | Industrial Conglomerates | | 2,473,005 | | | 10,122,258 |
Keppel Corp. Ltd. | | Industrial Conglomerates | | 143,000 | | | 1,289,674 |
| | | | | | | |
| | | | | | | 15,538,816 |
| | | | | | | |
South Africa 4.6% | | | | | | | |
Barloworld Ltd. | | Industrial Conglomerates | | 160,000 | | | 2,510,124 |
Foschini Ltd. | | Specialty Retail | | 1,324,826 | | | 9,321,063 |
aFreeworld Coatings Ltd. | | Specialty Retail | | 160,000 | | | 245,885 |
Imperial Holdings Ltd. | | Air Freight & Logistics | | 387,779 | | | 5,896,048 |
JD Group Ltd. | | Specialty Retail | | 858,339 | | | 6,376,590 |
Lewis Group Ltd. | | Specialty Retail | | 1,182,661 | | | 7,915,990 |
TD-13
Franklin Templeton Variable Insurance Products Trust
Statement of Investments, December 31, 2007 (continued)
| | | | | | | |
| Templeton Developing Markets Securities Fund | | Industry | | Shares/
Rights | | Value |
Long Term Investments (continued) | | | |
Common Stocks and Rights (continued) | | | |
South Africa (continued) | | | | | | | |
MTN Group Ltd. | | Wireless Telecommunication
Services | | 1,228,460 | | $ | 22,915,745 |
Remgro Ltd. | | Diversified Financial Services | | 715,439 | | | 20,694,060 |
Standard Bank Group Ltd. | | Commercial Banks | | 434,688 | | | 6,337,010 |
Tiger Brands Ltd. | | Food Products | | 294,700 | | | 7,211,886 |
| | | | | | | |
| | | | | | | 89,424,401 |
| | | | | | | |
South Korea 8.0% | | | | | | | |
aDaewoo Shipbuilding & Marine Engineering Co. Ltd. | | Machinery | | 97,330 | | | 5,365,342 |
aGS Holdings Corp. | | Oil, Gas & Consumable Fuels | | 179,110 | | | 11,117,238 |
aKangwon Land Inc. | | Hotels Restaurants & Leisure | | 471,405 | | | 12,388,829 |
bPOSCO | | Metals & Mining | | 15,750 | | | 9,674,964 |
Samsung Electronics Co. Ltd. | | Semiconductors & Semiconductor
Equipment | | 21,974 | | | 13,052,234 |
a,bSamsung Heavy Industries Co. Ltd. | | Machinery | | 194,290 | | | 8,344,061 |
a,bSK Energy Co. Ltd. | | Oil, Gas & Consumable Fuels | | 313,791 | | | 60,676,429 |
aSK Holdings Co. Ltd. | | Industrial Conglomerates | | 120,935 | | | 25,581,037 |
aSKC Co. Ltd. | | Household Durables | | 29,380 | | | 878,842 |
a,bWoori Finance Holdings Co. Ltd. | | Commercial Banks | | 426,000 | | | 8,578,708 |
| | | | | | | |
| | | | | | | 155,657,684 |
| | | | | | | |
Sweden 1.2% | | | | | | | |
Oriflame Cosmetics SA, SDR | | Personal Products | | 349,538 | | | 22,326,924 |
| | | | | | | |
Taiwan 2.9% | | | | | | | |
Compal Communications Inc. | | Communications Equipment | | 1,207,000 | | | 2,996,099 |
MediaTek Inc. | | Semiconductors & Semiconductor
Equipment | | 348,000 | | | 4,517,669 |
Novatek Microelectronics Corp. Ltd. | | Semiconductors & Semiconductor
Equipment | | 2,219,574 | | | 8,486,808 |
President Chain Store Corp. | | Food & Staples Retailing | | 6,552,144 | | | 17,213,773 |
Siliconware Precision Industries Co. | | Semiconductors & Semiconductor
Equipment | | 6,282,666 | | | 11,294,463 |
Sunplus Technology Co. Ltd. | | Semiconductors & Semiconductor
Equipment | | 3,226,485 | | | 4,835,251 |
Taiwan Semiconductor Manufacturing Co. Ltd. | | Semiconductors & Semiconductor
Equipment | | 3,855,414 | | | 7,370,819 |
| | | | | | | |
| | | | | | | 56,714,882 |
| | | | | | | |
Thailand 2.5% | | | | | | | |
Kasikornbank Public Co. Ltd., fgn. | | Commercial Banks | | 4,150,367 | | | 10,780,974 |
aPTT Aromatics & Refining Public Co. Ltd., fgn. | | Oil, Gas & Consumable Fuels | | 1,675,803 | | | 2,139,217 |
PTT Public Co. Ltd., fgn. | | Oil, Gas & Consumable Fuels | | 1,088,000 | | | 12,144,515 |
Siam Cement Public Co. Ltd., fgn. | | Construction Materials | | 2,082,014 | | | 14,463,152 |
Siam Commercial Bank Public Co. Ltd., fgn. | | Commercial Banks | | 1,165,957 | | | 3,011,378 |
Thai Beverages Co. Ltd.,fgn. | | Beverages | | 36,319,000 | | | 6,425,020 |
aTrue Corp. Public Co. Ltd., fgn., rts., 3/28/08 | | Diversified Telecommunication
Services | | 344,616 | | | — |
| | | | | | | |
| | | | | | | 48,964,256 |
| | | | | | | |
Turkey 9.4% | | | | | | | |
Akbank TAS | | Commercial Banks | | 9,133,220 | | | 68,044,542 |
Anadolu Efes Biracilik Ve Malt Sanayii AS | | Beverages | | 615,365 | | | 7,324,833 |
TD-14
Franklin Templeton Variable Insurance Products Trust
Statement of Investments, December 31, 2007 (continued)
| | | | | | | | |
| Templeton Developing Markets Securities Fund | | Industry | | Shares/
Rights | | Value | |
Long Term Investments (continued) | | | | |
Common Stocks and Rights (continued) | | | | |
Turkey (continued) | | | | | | | | |
Arcelik AS, Br. | | Household Durables | | 2,505,906 | | $ | 17,489,303 | |
Tupras-Turkiye Petrol Rafineleri AS | | Oil, Gas & Consumable Fuels | | 1,072,929 | | | 31,468,909 | |
aTurk Hava Yollari Anonim Ortakligi | | Airlines | | 307,000 | | | 2,260,929 | |
a,cTurk Hava Yollari Anonim Ortakligi, 144A | | Airlines | | 1,467,000 | | | 10,803,854 | |
Turkcell Iletisim Hizmetleri AS | | Wireless Telecommunication Services | | 2,388,856 | | | 26,184,848 | |
Turkiye Vakiflar Bankasi T.A.O., D | | Commercial Banks | | 5,243,624 | | | 18,590,112 | |
| | | | | | | | |
| | | | | | | 182,167,330 | |
| | | | | | | | |
United Kingdom 2.1% | | | | | | | | |
Anglo American PLC | | Metals & Mining | | 619,738 | | | 37,465,938 | |
HSBC Holdings PLC | | Commercial Banks | | 224,400 | | | 3,789,831 | |
| | | | | | | | |
| | | | | | | 41,255,769 | |
| | | | | | | | |
Total Common Stocks and Rights
(Cost $1,110,779,407) | | | | | | | 1,612,777,525 | |
| | | | | | | | |
Preferred Stocks 14.3% | | | | | | | | |
Brazil 14.1% | | | | | | | | |
Banco Bradesco SA, ADR, pfd. | | Commercial Banks | | 957,944 | | | 30,654,208 | |
Companhia Vale do Rio Doce, ADR, pfd., A | | Metals & Mining | | 3,725,875 | | | 104,249,982 | |
Itausa - Investimentos Itau SA, pfd. | | Commercial Banks | | 333,100 | | | 2,198,834 | |
Metalurgica Gerdau SA, pfd. | | Metals & Mining | | 167,002 | | | 6,661,316 | |
Petroleo Brasileiro SA, ADR, pfd. | | Oil, Gas & Consumable Fuels | | 1,000,344 | | | 96,253,100 | |
Unibanco - Uniao de Bancos Brasileiros SA, GDR, pfd. | | Commercial Banks | | 159,100 | | | 22,216,724 | |
Usinas Siderurgicas de Minas Gerais SA, pfd., A | | Metals & Mining | | 254,879 | | | 11,669,999 | |
| | | | | | | | |
| | | | | | | 273,904,163 | |
| | | | | | | | |
Chile 0.2% | | | | | | | | |
Embotelladora Andina SA, pfd., A | | Beverages | | 1,409,151 | | | 3,792,072 | |
| | | | | | | | |
Total Preferred Stocks (Cost $117,139,210) | | | | | | | 277,696,235 | |
| | | | | | | | |
Total Long Term Investments (Cost $1,227,918,617) | | | | | | | 1,890,473,760 | |
| | | | | | | | |
| | | |
| | | | | Principal
Amount | | | |
Short Term Investments 3.1% | | | | | | | | |
U.S. Government and Agency Securities 3.1% | | | | | | | | |
dFHLB, 1/02/08 - 4/16/08 | | | | $48,994,000 | | | 48,646,881 | |
dFNMA, 3/28/08 | | | | 11,411,000 | | | 11,299,640 | |
| | | | | | | | |
Total U.S. Government and Agency Securities
(Cost$ 59,914,779) | | | | | | | 59,946,521 | |
| | | | | | | | |
Total Investments (Cost $1,287,833,396) 100.3% | | | | | | | 1,950,420,281 | |
Other Assets, less Liabilities (0.3)% | | | | | | | (5,066,932 | ) |
| | | | | | | | |
Net Assets 100.0% | | | | | | $ | 1,945,353,349 | |
| | | | | | | | |
TD-15
Franklin Templeton Variable Insurance Products Trust
Statement of Investments, December 31, 2007 (continued)
Selected Portfolio Abbreviations
ADR - American Depository Receipt
CPO - Certificates of Ordinary Participation [(usually Mexico)]
FHLB - Federal Home Loan Bank
FNMA - Federal National Mortgage Association
GDR - Global Depository Receipt
SDR - Swedish Depository Receipt
a Non-income producing for the twelve months ended December 31, 2007.
b A portion or all of the securities purchased on a when-issued or delayed delivery basis. See Note 1(c).
c Security was purchased pursuant to Rule 144A under the Securities Act of 1933 and may be sold in transactions exempt from registration only to qualified institutional buyers or in a public offering registered under the Securities Act of 1933. These securities have been deemed liquid under guidelines approved by the Trust’s Board of Trustees. At December 31, 2007, the aggregate value of these securities was $20,807,299, representing 1.07% of net assets.
d The security is traded on a discount basis with no stated coupon rate.
The accompanying notes are an integral part of these financial statements.
TD-16
Franklin Templeton Variable Insurance Products Trust
Financial Statements
Statement of Assets and Liabilities
December 31, 2007
| | | |
| | | Templeton
Developing Markets
Securities Fund |
Assets: | | | |
Investments in securities: | | | |
Cost | | $ | 1,287,833,396 |
| | | |
Value | | $ | 1,950,420,281 |
Foreign currency, at value (cost $4,254,193) | | | 4,308,609 |
Receivables: | | | |
Investment securities sold | | | 9,467,571 |
Capital shares sold | | | 958,184 |
Dividends | | | 3,611,026 |
Other assets | �� | | 292,069 |
| | | |
Total assets | | | 1,969,057,740 |
| | | |
Liabilities: | | | |
Payables: | | | |
Investment securities purchased | | | 17,008,973 |
Capital shares redeemed | | | 1,798,240 |
Affiliates | | | 2,695,654 |
Funds advanced by custodian | | | 626,251 |
Deferred taxes | | | 714,983 |
Accrued expenses and other liabilities | | | 860,290 |
| | | |
Total liabilities | | | 23,704,391 |
| | | |
Net assets, at value | | $ | 1,945,353,349 |
| | | |
Net assets consist of: | | | |
Paid-in capital | | $ | 1,020,585,189 |
Undistributed net investment income | | | 18,501,125 |
Net unrealized appreciation (depreciation) | | | 661,943,163 |
Accumulated net realized gain (loss) | | | 244,323,872 |
| | | |
Net assets, at value | | $ | 1,945,353,349 |
| | | |
Class 1: | | | |
Net assets, at value | | $ | 753,843,041 |
| | | |
Shares outstanding | | | 46,635,825 |
| | | |
Net asset value and maximum offering price per share | | $ | 16.16 |
| | | |
Class 2: | | | |
Net assets, at value | | $ | 1,090,549,048 |
| | | |
Shares outstanding | | | 68,185,986 |
| | | |
Net asset value and maximum offering price per share | | $ | 15.99 |
| | | |
Class 3: | | | |
Net assets, at value | | $ | 100,961,260 |
| | | |
Shares outstanding | | | 6,325,771 |
| | | |
Net asset value and maximum offering price per sharea | | $ | 15.96 |
| | | |
a | Redemption price is equal to net asset value less any redemption fees retained by the Fund. |
The accompanying notes are an integral part of these financial statements.
TD-17
Franklin Templeton Variable Insurance Products Trust
Financial Statements (continued)
Statement of Operations
for the year ended December 31, 2007
| | | | |
| | | Templeton
Developing Markets
Securities Fund | |
Investment income: | | | | |
Dividends (net of foreign taxes of $3,899,118) | | $ | 58,535,649 | |
Interest | | | 4,409,555 | |
| | | | |
Total investment income | | | 62,945,204 | |
| | | | |
Expenses: | | | | |
Management fees (Note 3a) | | | 21,755,769 | |
Administrative fees (Note 3b) | | | 1,903,487 | |
Distribution fees: (Note 3c) | | | | |
Class 2 | | | 2,373,558 | |
Class 3 | | | 169,148 | |
Unaffiliated transfer agent fees | | | 30,176 | |
Custodian fees (Note 4) | | | 1,835,113 | |
Reports to shareholders | | | 456,417 | |
Professional fees | | | 170,780 | |
Trustees’ fees and expenses | | | 7,219 | |
Other | | | 48,472 | |
| | | | |
Total expenses | | | 28,750,139 | |
Expense reductions (Note 4) | | | (27,725 | ) |
| | | | |
Net expenses | | | 28,722,414 | |
| | | | |
Net investment income | | | 34,222,790 | |
| | | | |
Realized and unrealized gains (losses): | | | | |
Net realized gain (loss) from: | | | | |
Investments | | | 259,937,730 | |
Foreign currency transactions | | | (953,749 | ) |
Swap agreements | | | 958 | |
| | | | |
Net realized gain (loss) | | | 258,984,939 | |
| | | | |
Net change in unrealized appreciation (depreciation) on: | | | | |
Investments | | | 151,070,273 | |
Translation of assets and liabilities denominated in foreign currencies | | | 16,448 | |
Change in deferred taxes on unrealized appreciation (depreciation) | | | (495,514 | ) |
| | | | |
Net change in unrealized appreciation (depreciation) | | | 150,591,207 | |
| | | | |
Net realized and unrealized gain (loss) | | | 409,576,146 | |
| | | | |
Net increase (decrease) in net assets resulting from operations | | $ | 443,798,936 | |
| | | | |
The accompanying notes are an integral part of these financial statements.
TD-18
Franklin Templeton Variable Insurance Products Trust
Financial Statements (continued)
Statements of Changes in Net Assets
| | | | | | | | |
| | | Templeton Developing
Markets Securities Fund | |
| | | Year Ended December 31, | |
| | | 2007 | | | 2006 | |
| | | | |
Increase (decrease) in net assets: | | | | | | | | |
Operations: | | | | | | | | |
Net investment income | | $ | 34,222,790 | | | $ | 27,347,665 | |
Net realized gain (loss) from investments and foreign currency transactions | | | 258,984,939 | | | | 178,863,896 | |
Net change in unrealized appreciation (depreciation) on investments, translation of assets and liabilities denominated in foreign currencies, and deferred taxes | | | 150,591,207 | | | | 155,105,624 | |
| | | | |
Net increase (decrease) in net assets resulting from operations | | | 443,798,936 | | | | 361,317,185 | |
| | | | |
Distributions to shareholders from: | | | | | | | | |
Net investment income: | | | | | | | | |
Class 1 | | | (18,593,912 | ) | | | (8,939,497 | ) |
Class 2 | | | (20,981,252 | ) | | | (8,560,133 | ) |
Class 3 | | | (1,312,631 | ) | | | (315,203 | ) |
Net realized gains: | | | | | | | | |
Class 1 | | | (58,468,438 | ) | | | — | |
Class 2 | | | (72,094,329 | ) | | | — | |
Class 3 | | | (4,338,794 | ) | | | — | |
| | | | |
Total distributions to shareholders | | | (175,789,356 | ) | | | (17,814,833 | ) |
| | | | |
Capital share transactions: (Note 2) | | | | | | | | |
Class 1 | | | (114,240,767 | ) | | | (65,550,558 | ) |
Class 2 | | | 94,364,085 | | | | 32,574,378 | |
Class 3 | | | 47,175,082 | | | | 25,467,947 | |
| | | | |
Total capital share transactions | | | 27,298,400 | | | | (7,508,233 | ) |
| | | | |
Redemption fees | | | 39,617 | | | | 19,233 | |
| | | | |
Net increase (decrease) in net assets | | | 295,347,597 | | | | 336,013,352 | |
Net assets: | | | | | | | | |
Beginning of year | | | 1,650,005,752 | | | | 1,313,992,400 | |
| | | | |
End of year | | $ | 1,945,353,349 | | | $ | 1,650,005,752 | |
| | | | |
Undistributed net investment income included in net assets: | | | | | | | | |
End of year | | $ | 18,501,125 | | | $ | 14,021,116 | |
| | | | |
The accompanying notes are an integral part of these financial statements.
TD-19
Franklin Templeton Variable Insurance Products Trust
Notes to Financial Statements
Templeton Developing Markets Securities Fund
1. ORGANIZATION AND SIGNIFICANT ACCOUNTING POLICIES
Franklin Templeton Variable Insurance Products Trust (Trust) is registered under the Investment Company Act of 1940, as amended, (1940 Act) as an open-end investment company, consisting of twenty-three separate funds. The Templeton Developing Markets Securities Fund (Fund) included in this report is diversified. The financial statements of the remaining funds in the Trust are presented separately. Shares of the Fund are sold only to insurance company separate accounts to fund the benefits of variable life insurance policies or variable annuity contracts. The Fund offers three classes of shares: Class 1, Class 2, and Class 3. Each class of shares differs by its distribution fees, voting rights on matters affecting a single class and its exchange privilege.
The following summarizes the Fund’s significant accounting policies.
a. Security Valuation
Securities listed on a securities exchange or on the NASDAQ National Market System are valued at the last quoted sale price or the official closing price of the day, respectively. Over-the-counter securities and listed securities for which there is no reported sale are valued within the range of the most recent quoted bid and ask prices. Securities that trade in multiple markets or on multiple exchanges are valued according to the broadest and most representative market.
Government securities generally trade in the over-the-counter market rather than on a securities exchange. The Trust may utilize independent pricing services, quotations from bond dealers, and information with respect to bond and note transactions, to assist in determining a current market value for each security. The Trust’s pricing services may use valuation models or matrix pricing which considers information with respect to comparable bond and note transactions, quotations from bond dealers, or by reference to other securities that are considered comparable in such characteristics as rating, interest rate and maturity date, option adjusted spread models, prepayment projections, interest rate spreads and yield curves, to determine current value.
Foreign securities are valued as of the close of trading on the foreign stock exchange on which the security is primarily traded, or the NYSE, whichever is earlier. If no sale is reported at that time, the foreign security will be valued within the range of the most recent quoted bid and ask prices. The value is then converted into its U.S. dollar equivalent at the foreign exchange rate in effect at the close of the NYSE on the day that the value of the foreign security is determined.
The Trust has procedures to determine the fair value of individual securities and other assets for which market prices are not readily available or which may not be reliably priced. Methods for valuing these securities may include: fundamental analysis, matrix pricing, discounts from market prices of similar securities, or discounts applied due to the nature and duration of restrictions on the disposition of the securities. Due to the inherent uncertainty of valuations of such securities, the fair values may differ significantly from the values that would have been used had a ready market for such investments existed. Occasionally, events occur between the time at which trading in a security is completed and the close of the NYSE that might call into question the availability (including the reliability) of the value of a portfolio security held by the Fund. The investment manager monitors price movements following the close of trading in foreign stock markets through a series of country specific market proxies (such as baskets of American Depository Receipts, futures contracts and exchange traded funds). These price movements are measured against established trigger thresholds for each specific market proxy to assist in determining if an event has occurred. If such an event occurs, the securities may be valued using fair value procedures, which may include the use of independent pricing services. All security valuation procedures are approved by the Trust’s Board of Trustees.
b. Foreign Currency Translation
Portfolio securities and other assets and liabilities denominated in foreign currencies are translated into U.S. dollars based on the exchange rate of such currencies against U.S. dollars on the date of valuation. Purchases and sales of securities, income and expense items denominated in foreign currencies are translated into U.S. dollars at the exchange rate in effect on the transaction date. Occasionally, events may impact the availability or reliability of foreign exchange rates used to convert the U.S. dollar equivalent value. If such an event occurs, the foreign exchange rate will be valued at fair value using procedures established and approved by the Trust’s Board of Trustees.
TD-20
Franklin Templeton Variable Insurance Products Trust
Notes to Financial Statements (continued)
Templeton Developing Markets Securities Fund
1. ORGANIZATION AND SIGNIFICANT ACCOUNTING POLICIES (continued)
b. Foreign Currency Translation (continued)
The Fund does not separately report the effect of changes in foreign exchange rates from changes in market prices on securities held. Such changes are included in net realized and unrealized gain or loss from investments on the Statement of Operations.
Realized foreign exchange gains or losses arise from sales of foreign currencies, currency gains or losses realized between the trade and settlement dates on securities transactions and the difference between the recorded amounts of dividends, interest, and foreign withholding taxes and the U.S. dollar equivalent of the amounts actually received or paid. Net unrealized foreign exchange gains and losses arise from changes in foreign exchange rates on foreign denominated assets and liabilities other than investments in securities held at the end of the reporting period.
c. Securities Purchased on a When-Issued or Delayed Delivery Basis
The Fund may purchase securities on a when-issued or delayed delivery basis, with payment and delivery scheduled for a future date. These transactions are subject to market fluctuations and are subject to the risk that the value at delivery may be more or less than the trade date purchase price. Although the Fund will generally purchase these securities with the intention of holding the securities, it may sell the securities before the settlement date. Sufficient assets have been segregated for these securities.
d. Foreign Currency Contracts
When the Fund purchases or sells foreign securities it may enter into foreign exchange contracts to minimize foreign exchange risk from the trade date to the settlement date of the transactions. A foreign exchange contract is an agreement between two parties to exchange different currencies at an agreed upon exchange rate at a future date. Realized and unrealized gains and losses on these contracts are included in the Statement of Operations.
The risks of these contracts include movement in the values of the foreign currencies relative to the U.S. dollar and the possible inability of the counterparties to fulfill their obligations under the contracts, which may be in excess of the amount reflected in the Statement of Assets and Liabilities.
e. Total Return Swaps
The Fund may enter into total return swaps. A total return swap is an agreement between the Fund and a counterparty to exchange a market linked return for a floating rate payment, both based on a notional principal amount. Total return swaps are marked to market daily based upon quotations from the market makers and the change in value, if any, is recorded as an unrealized gain or loss in the Statement of Operations. Payments received or paid are recorded as a realized gain or loss. The risks of entering into a total return swap include the unfavorable fluctuation of interest rates or the price of the underlying security or index, as well as the potential inability of the counterparty to fulfill their obligations under the swap agreement.
f. Income and Deferred Taxes
No provision has been made for U.S. income taxes because it is the Fund’s policy to qualify as a regulated investment company under the Internal Revenue Code and to distribute to shareholders substantially all of its taxable income and net realized gains.
Foreign securities held by the Fund may be subject to foreign taxation on dividend income received. Foreign taxes, if any, are recorded based on the tax regulations and rates that exist in the foreign markets in which the Fund invests.
The Fund may be subject to a tax imposed on net realized gains on securities of certain foreign countries. The Fund records an estimated deferred tax liability for net unrealized gains on these securities in an amount that would be payable if the securities were disposed of on the valuation date.
TD-21
Franklin Templeton Variable Insurance Products Trust
Notes to Financial Statements (continued)
Templeton Developing Markets Securities Fund
1. ORGANIZATION AND SIGNIFICANT ACCOUNTING POLICIES (continued)
g. Security Transactions, Investment Income, Expenses and Distributions
Security transactions are accounted for on trade date. Realized gains and losses on security transactions are determined on a specific identification basis. Interest income and estimated expenses are accrued daily. Dividend income is recorded on the ex-dividend date except that certain dividends from foreign securities are recognized as soon as the Fund is notified of the ex-dividend date. Distributions to shareholders are recorded on the ex-dividend date and are determined according to income tax regulations (tax basis). Distributable earnings determined on a tax basis may differ from earnings recorded in accordance with accounting principles generally accepted in the United States of America. These differences may be permanent or temporary. Permanent differences are reclassified among capital accounts to reflect their tax character. These reclassifications have no impact on net assets or the results of operations. Temporary differences are not reclassified, as they may reverse in subsequent periods.
Common expenses incurred by the Trust are allocated among the funds based on the ratio of net assets of each fund to the combined net assets of the Trust. Fund specific expenses are charged directly to the fund that incurred the expense.
Realized and unrealized gains and losses and net investment income, other than class specific expenses, are allocated daily to each class of shares based upon the relative proportion of net assets of each class. Differences in per share distributions, by class, are generally due to differences in class specific expenses.
h. Accounting Estimates
The preparation of financial statements in accordance with accounting principles generally accepted in the United States of America requires management to make estimates and assumptions that affect the reported amounts of assets and liabilities at the date of the financial statements and the amounts of income and expenses during the reporting period. Actual results could differ from those estimates.
i. Redemption Fees
Redemptions and exchanges of Class 3 shares held 60 days or less may be subject to the Fund’s redemption fee, which is 1% of the amount redeemed. Such fees are retained by the Fund and accounted for as an addition to paid-in capital.
j. Guarantees and Indemnifications
Under the Trust’s organizational documents, its officers and trustees are indemnified by the Trust against certain liabilities arising out of the performance of their duties to the Trust. Additionally, in the normal course of business, the Trust, on behalf of the Fund, enters into contracts with service providers that contain general indemnification clauses. The Trust’s maximum exposure under these arrangements is unknown as this would involve future claims that may be made against the Trust that have not yet occurred. Currently, the Trust expects the risk of loss to be remote.
TD-22
Franklin Templeton Variable Insurance Products Trust
Notes to Financial Statements (continued)
Templeton Developing Markets Securities Fund
2. SHARES OF BENEFICIAL INTEREST
At December 31, 2007, there were an unlimited number of shares authorized (without par value). Transactions in the Fund’s shares were as follows:
| | | | | | | | | | | | | | |
| | | Year Ended December 31, | |
| | | 2007 | | | 2006 | |
| Class 1 Shares: | | Shares | | | Amount | | | Shares | | | Amount | |
Shares sold | | 4,490,443 | | | $ | 69,191,583 | | | 8,227,856 | | | $ | 99,913,441 | |
Shares issued in reinvestment of distributions | | 5,385,210 | | | | 77,062,349 | | | 823,158 | | | | 8,939,497 | |
Shares redeemed | | (17,058,565 | ) | | | (260,494,699 | ) | | (14,545,716 | ) | | | (174,403,496 | ) |
| | | | |
Net increase (decrease) | | (7,182,912 | ) | | $ | (114,240,767 | ) | | (5,494,702 | ) | | $ | (65,550,558 | ) |
| | | | |
| Class 2 Shares: | | | | | | | | | | | | |
Shares sold | | 16,188,250 | | | $ | 242,521,079 | | | 18,145,883 | | | $ | 219,369,554 | |
Shares issued in reinvestment of distributions | | 6,563,863 | | | | 93,075,581 | | | 794,812 | | | | 8,560,133 | |
Shares redeemed | | (16,746,979 | ) | | | (241,232,575 | ) | | (16,460,489 | ) | | | (195,355,309 | ) |
| | | | |
Net increase (decrease) | | 6,005,134 | | | $ | 94,364,085 | | | 2,480,206 | | | $ | 32,574,378 | |
| | | | |
| Class 3 Shares: | | | | | | | | | | | | |
Shares sold | | 4,138,936 | | | $ | 61,021,476 | | | 2,626,549 | | | $ | 31,906,146 | |
Shares issued in reinvestment of distributions | | 399,394 | | | | 5,651,425 | | | 29,294 | | | | 315,203 | |
Shares redeemed | | (1,360,665 | ) | | | (19,497,819 | ) | | (564,285 | ) | | | (6,753,402 | ) |
| | | | |
Net increase (decrease) | | 3,177,665 | | | $ | 47,175,082 | | | 2,091,558 | | | $ | 25,467,947 | |
| | | | |
3. TRANSACTIONS WITH AFFILIATES
Franklin Resources, Inc. is the holding company for various subsidiaries that together are referred to as Franklin Templeton Investments. Certain officers and trustees of the Trust are also officers and/or directors of the following subsidiaries:
| | |
| Subsidiary | | Affiliation |
Templeton Asset Management Ltd. (TAML) | | Investment manager |
Franklin Templeton Services, LLC (FT Services) | | Administrative manager |
Franklin Templeton Distributors, Inc. (Distributors) | | Principal underwriter |
Franklin Templeton Investor Services, LLC (Investor Services) | | Transfer agent |
a. Management Fees
The Fund pays an investment management fee to TAML based on the average daily net assets of the Fund as follows:
| | |
| Annualized Fee Rate | | Net Assets |
| 1.250% | | Up to and including $1 billion |
| 1.200% | | Over $1 billion, up to and including $5 billion |
| 1.150% | | Over $5 billion, up to and including $10 billion |
| 1.100% | | Over $10 billion, up to and including $15 billion |
| 1.050% | | Over $15 billion, up to and including $20 billion |
| 1.000% | | In excess of $20 billion |
TD-23
Franklin Templeton Variable Insurance Products Trust
Notes to Financial Statements (continued)
Templeton Developing Markets Securities Fund
3. TRANSACTIONS WITH AFFILIATES (continued)
b. Administrative Fees
The Fund pays an administrative fee to FT Services based on the Fund’s average daily net assets as follows:
| | |
| Annualized Fee Rate | | Net Assets |
| 0.150% | | Up to and including $200 million |
| 0.135% | | Over $200 million, up to and including $700 million |
| 0.100% | | Over $700 million, up to and including $1.2 billion |
| 0.075% | | In excess of $1.2 billion |
c. Distribution Fees
The Fund’s Board of Trustees has adopted distribution plans for Class 2 and Class 3 shares pursuant to Rule 12b-1 under the 1940 Act. Under the Fund’s compensation distribution plans, the Fund pays Distributors for costs incurred in connection with the servicing, sale and distribution of the Fund’s shares up to 0.25% and 0.35% per year of its average daily net assets of Class 2 and Class 3, respectively. The Board of Trustees has agreed to limit the current rate to 0.25% per year for Class 3.
d. Transfer Agent Fees
Investor Services, under terms of an agreement, performs shareholder servicing for the Fund and is not paid by the Fund for the services.
4. EXPENSE OFFSET ARRANGEMENT
The Fund has entered into an arrangement with its custodian whereby credits realized as a result of uninvested cash balances are used to reduce a portion of the Fund’s custodian expenses. During the year ended December 31, 2007, the custodian fees were reduced as noted in the Statement of Operations.
5. INCOME TAXES
The Fund has reviewed the tax positions taken on federal income tax returns, for each of the three open tax years and as of December 31, 2007 and has determined that no provision for income tax is required in the Fund’s financial statements.
For tax purposes, realized currency losses occurring subsequent to October 31, may be deferred and treated as occurring on the first day of the following fiscal year. At December 31, 2007, the Fund deferred realized currency losses of $1,080,193.
The tax character of distributions paid during the years ended December 31, 2007 and 2006, was as follows:
| | | | | | |
| | | 2007 | | 2006 |
Distributions paid from: | | | | | | |
Ordinary income | | $ | 46,036,795 | | $ | 17,814,833 |
Long term capital gain | | | 129,752,561 | | | — |
| | | |
| | | 175,789,356 | | | 17,814,833 |
| | | |
TD-24
Franklin Templeton Variable Insurance Products Trust
Notes to Financial Statements (continued)
Templeton Developing Markets Securities Fund
5. INCOME TAXES (continued)
At December 31, 2007, the cost of investments, net unrealized appreciation (depreciation), undistributed ordinary income and undistributed long term capital gains for income tax purposes were as follows:
| | | | |
Cost of investments | | $ | 1,310,370,388 | |
| | | | |
| |
Unrealized appreciation | | $ | 676,242,874 | |
Unrealized depreciation | | | (36,192,981 | ) |
| | | | |
Net unrealized appreciation (depreciation) | | $ | 640,049,893 | |
| | | | |
Undistributed ordinary income | | $ | 54,789,462 | |
Undistributed long term capital gains | | | 231,690,488 | |
| | | | |
Distributable earnings | | $ | 286,479,950 | |
| | | | |
Net investment income differs for financial statement and tax purposes primarily due to differing treatments of foreign currency transactions, passive foreign investment company shares, and foreign capital gain taxes.
Net realized gains (losses) differ for financial statement and tax purposes primarily due to differing treatments of wash sales, foreign currency transactions, passive foreign investment company shares, and foreign capital gain taxes.
6. INVESTMENT TRANSACTIONS
Purchases and sales of investments (excluding short term securities) for the year ended December 31, 2007, aggregated $1,671,935,243 and $1,811,445,079, respectively.
7. CONCENTRATION OF RISK
Investing in foreign securities may include certain risks and considerations not typically associated with investing in U.S. securities, such as fluctuating currency values and changing local and regional economic, political and social conditions, which may result in greater market volatility. In addition, certain foreign securities may not be as liquid as U.S. securities.
8. REGULATORY AND LITIGATION MATTERS
As part of various investigations by a number of federal, state, and foreign regulators and governmental entities, including the Securities and Exchange Commission (“SEC”), relating to certain practices in the mutual fund industry, including late trading, market timing and marketing support payments to securities dealers who sell fund shares (“marketing support”), Franklin Resources, Inc. and certain of its subsidiaries (collectively, the “Company”), entered into settlements with certain of those regulators and governmental entities. Specifically, the Company entered into settlements with the SEC, among others, concerning market timing and marketing support.
On June 6, 2007, the SEC posted for public comment the proposed plan of distribution for the market timing settlement. Once the SEC approves the final plan of distribution, disbursements of settlement monies will be made promptly to individuals who were shareholders of the designated funds during the relevant period, in accordance with the terms and conditions of the settlement and plan.
TD-25
Franklin Templeton Variable Insurance Products Trust
Notes to Financial Statements (continued)
Templeton Developing Markets Securities Fund
8. REGULATORY AND LITIGATION MATTERS (continued)
In addition, the Company, as well as most of the mutual funds within Franklin Templeton Investments and certain current or former officers, Company directors, fund directors, and employees, have been named in private lawsuits (styled as shareholder class actions, or as derivative actions on behalf of either the named funds or Franklin Resources, Inc.). The lawsuits relate to the industry practices referenced above.
The Company and fund management believe that the claims made in each of the private lawsuits referenced above are without merit and intend to defend against them vigorously. The Company cannot predict with certainty the eventual outcome of these lawsuits, nor whether they will have a material negative impact on the Company. If it is determined that the Company bears responsibility for any unlawful or inappropriate conduct that caused losses to the Fund, it is committed to making the Fund or its shareholders whole, as appropriate.
9. NEW ACCOUNTING PRONOUNCEMENT
In September 2006, the Financial Accounting Standards Board (FASB) issued FASB Statement No. 157, “Fair Value Measurement” (SFAS 157), which defines fair value, establishes a framework for measuring fair value, and expands disclosures about fair value measurements. SFAS 157 is effective for fiscal years beginning after November 15, 2007, and interim periods within those fiscal years. The Trust believes the adoption of SFAS 157 will have no material impact on its financial statements.
TD-26
Franklin Templeton Variable Insurance Products Trust
Templeton Developing Markets Securities Fund
Report of Independent Registered Public Accounting Firm
To the Board of Trustees and Shareholders of
Franklin Templeton Variable Insurance Products Trust
In our opinion, the accompanying statement of assets and liabilities, including the statement of investments, and the related statements of operations and of changes in net assets and the financial highlights present fairly, in all material respects, the financial position of Templeton Developing Markets Securities Fund (one of the funds constituting Franklin Templeton Variable Insurance Products Trust, hereafter referred to as the “Fund”) at December 31, 2007, the results of its operations for the year then ended, the changes in its net assets for each of the two years in the period then ended and the financial highlights for each of the periods presented, in conformity with accounting principles generally accepted in the United States of America. These financial statements and financial highlights (hereafter referred to as “financial statements”) are the responsibility of the Fund’s management. Our responsibility is to express an opinion on these financial statements based on our audits. We conducted our audits of these financial statements in accordance with the standards of the Public Company Accounting Oversight Board (United States). Those standards require that we plan and perform the audit to obtain reasonable assurance about whether the financial statements are free of material misstatement. An audit includes examining, on a test basis, evidence supporting the amounts and disclosures in the financial statements, assessing the accounting principles used and significant estimates made by management, and evaluating the overall financial statement presentation. We believe that our audits, which included confirmation of securities at December 31, 2007 by correspondence with the custodian and brokers, provide a reasonable basis for our opinion.
PricewaterhouseCoopers LLP
San Francisco, California
February 14, 2008
TD-27
Franklin Templeton Variable Insurance Products Trust
Tax Designation (unaudited)
Templeton Developing Markets Securities Fund
Under Section 852(b)(3)(C) of the Internal Revenue Code (Code), the Fund designates the maximum amount allowable but no less than $231,696,782 as a long term capital gain dividend for the fiscal year ended December 31, 2007.
At December 31, 2007, more than 50% of the Fund’s total assets were invested in securities of foreign issuers. In most instances, foreign taxes were withheld from income paid to the Fund on these investments. The Fund elects to treat foreign taxes paid as allowed under Section 853 of the Code. This election will allow shareholders of record as of the 2008 distribution date, to treat their proportionate share of foreign taxes paid by the Fund as having been paid directly by them. The shareholder shall consider these amounts as foreign taxes paid in the tax year in which they receive the Fund distribution.
TD-28
TEMPLETON FOREIGN SECURITIES FUND
We are pleased to bring you Templeton Foreign Securities Fund’s annual report for the fiscal year ended December 31, 2007.
Performance Summary as of 12/31/07
Average annual total return of Class 1 shares* represents the average annual change in value, assuming reinvestment of dividends and capital gains. Average returns smooth out variations in returns, which can be significant; they are not the same as year-by-year results.
Periods ended 12/31/07
| | | | | | |
| | | 1-Year | | 5-Year | | 10-Year |
Average Annual Total Return | | +15.79% | | +19.66% | | +8.35% |
*Performance prior to the 5/1/00 merger reflects historical performance of Templeton International Fund.
Total Return Index Comparison
for Hypothetical $10,000 Investment (1/1/98–12/31/07)
The graph below shows the change in value of a hypothetical $10,000 investment in the Fund over the indicated period and includes reinvestment of any income or distributions. The Fund’s performance* is compared to the performance of the Morgan Stanley Capital International (MSCI) Europe, Australasia, Far East (EAFE) Index. One cannot invest directly in an index, nor is an index representative of the Fund’s portfolio. Please see Important Notes to Performance Information preceding the Fund Summaries.
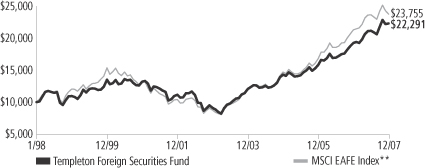
**Source: Standard & Poor’s Micropal. Please see Index Descriptions following the Fund Summaries.
Templeton Foreign Securities Fund – Class 1
Performance reflects the Fund’s Class 1 operating expenses, but does not include any contract fees, expenses or sales charges. If they had been included, performance would be lower. These charges and deductions, particularly for variable life policies, can have a significant effect on contract values and insurance benefits. See the contract prospectus for a complete description of these expenses, including sales charges.
Performance data represent past performance, which does not guarantee future results. Investment return and principal value will fluctuate, and you may have a gain or loss when you sell your shares.
Current performance may differ from figures shown.
TF-1
Fund Goal and Main Investments: Templeton Foreign Securities Fund seeks long-term capital growth. The Fund normally invests at least 80% of its net assets in investments of issuers located outside the U.S., including those in emerging markets, and normally invests predominantly in equity securities.
Performance Overview
You can find the Fund’s one-year total return in the Performance Summary. The Fund outperformed its benchmark, the MSCI EAFE Index, which returned +11.63% for the same period.1 Please note that index performance information is provided for reference and that we do not attempt to track the index but rather undertake investments on the basis of fundamental research.
Economic and Market Overview
In spite of elevated energy prices and widespread fears of contagion from the deteriorating U.S. housing situation, the global economy remained resilient in 2007. Consumer and corporate demand strength, particularly in China and other developing economies, generally favorable employment and accommodative monetary policies continued to underpin the current expansionary period that began in 2002.
These factors also contributed to the strength of global equity markets during 2007. However, concerns about slower growth and declining asset quality surfaced in the first quarter. These were initially centered on the U.S. subprime mortgage market but spread in August to global capital markets. Difficulties in assessing risk and the value of collateral in the structured finance industry contributed to declining risk appetite among lenders and investors. The private equity industry, which relies on the availability of cheap credit, played a pivotal role in several large and high-profile acquisitions and helped boost merger and acquisition activity in the first half of the year. This was an important driver of equity performance, but as liquidity dried up in the second half of the year, significantly slower money flows from private equity weighed on market performance. However, global merger and acquisition activity still reached record levels. The staggering $4.5 trillion of deals announced in 2007 eclipsed the previous record from 2006 by 24%.2
1. Source: Standard & Poor’s Micropal. One cannot invest directly in an index, nor is an index representative of the Fund’s portfolio. Please see Index Descriptions following the Fund Summaries.
2. Source: “For Deal Makers, Tale of Two Halves,” The Wall Street Journal, 1/2/08.
Fund Risks: The Fund’s investments in stocks offer the potential for long-term gains but can be subject to short-term price fluctuations. Foreign investing, especially in emerging markets, involves additional risks, including currency fluctuations, economic instability, market volatility, and political and social instability. By having significant investments in one or more countries or in particular sectors from time to time, the Fund may carry greater risk of adverse developments in a country or sector than a fund that invests more broadly. The Fund’s prospectus also includes a description of the main investment risks.
TF-2
To alleviate the credit crunch and restore investor confidence, the world’s major central banks infused capital into the system, and the U.S. Federal Reserve Board reduced its target interest rate by a full percentage point. However, credit and equity markets continued to face headwinds as write-downs and losses from subprime mortgage financing affected many large financial institutions toward the end of the year, and equity prices remained volatile.
For the year, however, global and non-U.S. equity markets registered the fifth consecutive year of double-digit total returns, making this an exceptionally strong period for investors in global equities. Broad-based stock performance by European and Asian shares at least doubled that of U.S. stocks, while emerging market equity returns more than tripled those in developed markets. Led by the BRIC countries, Brazil, Russia, India and China, emerging market economies continued to grow at accelerated rates, supporting elevated prices for oil and other commodities. At the same time, investment inflows from developed economies continued to underpin equity prices in emerging markets. In addition, U.S. dollar weakness versus the currencies of many major trading partners enhanced equity returns for U.S.-based investors holding stocks denominated in these currencies.
Investment Strategy
Our investment philosophy is bottom-up, value-oriented and long-term. In choosing investments, we generally focus on the market price of a company’s securities relative to our evaluation of the company’s potential long-term earnings, asset value and cash flow. Among factors we consider are a company’s historical value measures, including price/earnings ratio, profit margins and liquidation value. We do in-depth research to construct a bargain list from which we buy.
Manager’s Discussion
The Fund’s performance relative to the benchmark index was positively affected by its overweighted exposure to the consumer discretionary sector.3 The best performing stocks in the sector included French satellite operator Eutelsat Communications, U.K.-based British Sky Broadcasting Group, Dutch publisher Reed Elsevier and Japanese consumer electronics firm Sony (sold by period-end).
3. The consumer discretionary sector comprises auto components; hotels, restaurants and leisure; household durables; media; specialty retail; and textiles, apparel and luxury goods in the SOI.

TF-3
The Fund’s overweighting in the energy sector also boosted relative performance for the year.4 Top performers included Indian energy companies Reliance Industries, Hindustan Petroleum and Indian Oil. In the industrials sector, German conglomerate Siemens as well as wind turbine manufacturers Vestas Wind Systems (Denmark) and Gamesa (Spain) also benefited the Fund.5
Additionally, our overweighted telecommunications services sector exposure also aided relative returns.6 Standout performers included European wireless operators Vodafone Group (U.K.), Turkcell Iletism Hizmetleri (Turkey) and Mobile Telesystems (Russia), European fixed-line operators Telefonica (Spain), Telenor (Norway) and France Telecom, and Asian operators Singapore Telecommunications and China Telecom.
It is important to recognize the effect of currency movements on the Fund’s performance. In general, if the value of the U.S. dollar goes up compared with a foreign currency, an investment traded in that foreign currency will go down in value because it will be worth fewer U.S. dollars. This can have a negative effect on Fund performance. Conversely, when the U.S. dollar weakens in relation to a foreign currency, an investment traded in that foreign currency will increase in value, which can contribute to Fund performance. For the 12 months ended December 31, 2007, the U.S. dollar fell in value relative to most non-U.S. currencies. As a result, the Fund’s performance was positively affected by the portfolio’s investment predominantly in securities with non-U.S. currency exposure. However, one cannot expect the same result in future periods.
In contrast, returns relative to the benchmark suffered from the Fund’s overweighted position in the information technology sector, which underperformed the index.7 Stocks that lost value in this sector included German semiconductor companies Qimonda and Infineon
4. The energy sector comprises oil, gas and consumable fuels in the SOI.
5. The industrials sector comprises aerospace and defense, air freight and logistics, commercial services and supplies, electrical equipment, and industrial conglomerates in the SOI.
6. The telecommunication services sector comprises diversified telecommunication services and wireless telecommunication services in the SOI.
7. The information technology sector comprises computers and peripherals, electronic equipment and instruments, semiconductors and semiconductor equipment, and software in the SOI.
Top 10 Holdings
Templeton Foreign Securities Fund
12/31/07
| | |
Company
Sector/Industry,
Country | | % of Total
Net Assets |
| |
| Siemens AG | | 2.6% |
| Industrial Conglomerates, Germany | | |
| |
Cheung Kong
(Holdings) Ltd. | | 2.5% |
| Real Estate Management & Development, Hong Kong | | |
| |
| Reliance Industries Ltd. | | 2.5% |
| Oil, Gas & Consumable Fuels, India | | |
| |
| Sanofi-Aventis | | 2.4% |
| Pharmaceuticals, France | | |
| |
| Royal Dutch Shell PLC, B | | 2.4% |
| Oil, Gas & Consumable Fuels, U.K. | | |
| |
| GlaxoSmithKline PLC | | 2.2% |
| Pharmaceuticals, U.K. | | |
| |
| France Telecom SA | | 2.1% |
| Diversified Telecommunication Services, France | | |
| |
| BP PLC | | 2.0% |
| Oil, Gas & Consumable Fuels, U.K. | | |
| |
| Telefonica SA, ADR | | 2.0% |
| Diversified Telecommunication Services, Spain | | |
| |
| ING Groep NV | | 2.0% |
| Diversified Financial Services, Netherlands | | |
The dollar value, number of shares or principal amount, and names of all portfolio holdings are listed in the Fund’s Statement of Investments (SOI).
TF-4
Technologies, Asian semiconductor manufacturers Samsung Electronics and Taiwan Semiconductor Manufacturing, and Japanese companies NEC (sold by period-end) and FUJIFILM Holdings.
The Fund’s relative performance was also negatively impacted by its underweighting in the materials sector, which outperformed the index.8 Specifically, limited exposure to the outperforming metals and mining industry and holdings in European paper companies Stora Enso (Finland), Norske Skogindustrier (Norway) and UPM-Kymmene (Finland) hampered the Fund.
Although the Fund was slightly underweighted in the underperforming financials sector, a number of individual financial holdings declined sharply in value and hurt Fund performance.9 These included U.K.-based Royal Bank of Scotland Group as well as Japan’s Shinsei Bank and Sumitomo Mitsui Financial Group.
Thank you for your participation in Templeton Foreign Securities Fund. We look forward to serving your future investment needs.
8. The materials sector comprises chemicals, containers and packaging, metals and mining, and paper and forest products in the SOI.
9. The financials sector comprises capital markets, commercial banks, diversified financial services, insurance, and real estate management and development in the SOI.
The foregoing information reflects our analysis, opinions and portfolio holdings as of December 31, 2007, the end of the reporting period. The way we implement our main investment strategies and the resulting portfolio holdings may change depending on factors such as market and economic conditions. These opinions may not be relied upon as investment advice or an offer for a particular security. The information is not a complete analysis of every aspect of any market, country, industry, security or the Fund. Statements of fact are from sources considered reliable, but the investment manager makes no representation or warranty as to their completeness or accuracy. Although historical performance is no guarantee of future results, these insights may help you understand our investment management philosophy.
TF-5
Fund Expenses
As an investor in a variable insurance contract (Contract) that indirectly provides for investment in an underlying mutual fund, you can incur transaction and/or ongoing expenses at both the Fund level and the Contract level.
| • | | Transaction expenses can include sales charges (loads) on purchases, redemption fees, surrender fees, transfer fees and premium taxes. |
| • | | Ongoing expenses can include management fees, distribution and service (12b-1) fees, contract fees, annual maintenance fees, mortality and expense risk fees and other fees and expenses. All mutual funds and Contracts have some types of ongoing expenses. |
The expenses shown in the table are meant to highlight ongoing expenses at the Fund level only and do not include ongoing expenses at the Contract level, or transaction expenses at either the Fund or Contract level. While the Fund does not have transaction expenses, if the transaction and ongoing expenses at the Contract level were included, the expenses shown below would be higher. You should consult your Contract prospectus or disclosure document for more information.
The table shows Fund-level ongoing expenses and can help you understand these expenses and compare them with those of other mutual funds offered through the Contract. The table assumes a $1,000 investment held for the six months indicated. Please refer to the Fund prospectus for additional information on operating expenses.
Actual Fund Expenses
The first line (Actual) of the table provides actual account values and expenses. The “Ending Account Value” is derived from the Fund’s actual return, which includes the effect of ongoing Fund expenses, but does not include the effect of ongoing Contract expenses.
You can estimate the Fund-level expenses you incurred during the period by following these steps. Of course, your account value and expenses will differ from those in this illustration:
| 1. | Divide your account value by $1,000. |
If an account had an $8,600 value, then $8,600 ÷ $1,000 = 8.6.
| 2. | Multiply the result by the number under the heading “Fund-Level Expenses Incurred During Period.” |
If Fund-Level Expenses Incurred During Period were $7.50, then
8.6 x $7.50 = $64.50.
In this illustration, the estimated expenses incurred this period at the Fund level are $64.50.
Templeton Foreign Securities Fund – Class 1
TF-6
Hypothetical Example for Comparison with Other Mutual Funds
Information in the second line (Hypothetical) of the table can help you compare ongoing expenses of the Fund with those of other mutual funds offered through the Contract. This information may not be used to estimate the actual ending account balance or expenses you incurred during the period. The hypothetical “Ending Account Value” is based on the Fund’s actual expense ratio and an assumed 5% annual rate of return before expenses, which does not represent the Fund’s actual return. The figure under the heading “Fund-Level Expenses Incurred During Period” shows the hypothetical expenses your account would have incurred under this scenario. You can compare this figure with the 5% hypothetical examples that appear in shareholder reports of other funds offered through a Contract.
| | | | | | | | | |
| Class 1 | | Beginning
Account Value 7/1/07 | | Ending Account Value 12/31/07 | | Fund-Level
Expenses Incurred
During Period*
7/1/07–12/31/07 |
Actual | | $ | 1,000 | | $ | 1,157.90 | | $ | 4.13 |
Hypothetical (5% return before expenses) | | $ | 1,000 | | $ | 1,021.37 | | $ | 3.87 |
*Expenses are calculated using the most recent six-month annualized expense ratio for the Fund’s Class 1 shares (0.76%), which does not include any ongoing expenses of the Contract for which the Fund is an investment option, multiplied by the average account value over the period, multiplied by 184/365 to reflect the one-half year period.
TF-7
Franklin Templeton Variable Insurance Products Trust
Financial Highlights
Templeton Foreign Securities Fund
| | | | | | | | | | | | | | | | | | | | |
| | | Year Ended December 31, | |
| Class 1 | | 2007 | | | 2006 | | | 2005 | | | 2004 | | | 2003 | |
| | | | |
Per share operating performance | | | | | | | | | | | | | | | | | | | | |
(for a share outstanding throughout the year) | | | | | | | | | | | | | | | | | | | | |
Net asset value, beginning of year | | $ | 19.00 | | | $ | 15.84 | | | $ | 14.53 | | | $ | 12.37 | | | $ | 9.51 | |
| | | | |
Income from investment operationsa: | | | | | | | | | | | | | | | | | | | | |
Net investment incomeb | | | 0.45 | | | | 0.46 | | | | 0.30 | | | | 0.26 | | | | 0.19 | |
Net realized and unrealized gains (losses) | | | 2.46 | | | | 2.94 | | | | 1.20 | | | | 2.05 | | | | 2.87 | |
| | | | |
Total from investment operations | | | 2.91 | | | | 3.40 | | | | 1.50 | | | | 2.31 | | | | 3.06 | |
| | | | |
Less distributions from: | | | | | | | | | | | | | | | | | | | | |
Net investment income | | | (0.44 | ) | | | (0.24 | ) | | | (0.19 | ) | | | (0.15 | ) | | | (0.20 | ) |
Net realized gains | | | (0.90 | ) | | | — | | | | — | | | | — | | | | — | |
| | | | |
Total distributions | | | (1.34 | ) | | | (0.24 | ) | | | (0.19 | ) | | | (0.15 | ) | | | (0.20 | ) |
| | | | |
Redemption fees | | | — | d | | | — | d | | | — | d | | | — | d | | | — | |
| | | | |
Net asset value, end of year | | $ | 20.57 | | | $ | 19.00 | | | $ | 15.84 | | | $ | 14.53 | | | $ | 12.37 | |
| | | | |
| | | | | |
Total returnc | | | 15.79% | | | | 21.70% | | | | 10.48% | | | | 18.87% | | | | 32.55% | |
Ratios to average net assets | | | | | | | | | | | | | | | | | | | | |
Expenses | | | 0.75% | e | | | 0.75% | e | | | 0.77% | e | | | 0.82% | e | | | 0.87% | |
Net investment income | | | 2.22% | | | | 2.63% | | | | 2.03% | | | | 1.95% | | | | 1.81% | |
| | | | | |
Supplemental data | | | | | | | | | | | | | | | | | | | | |
Net assets, end of year (000’s) | | $ | 531,377 | | | $ | 594,991 | | | $ | 531,775 | | | $ | 506,456 | | | $ | 472,665 | |
Portfolio turnover rate | | | 26.74% | | | | 18.97% | f | | | 14.61% | | | | 10.91% | | | | 18.01% | |
a The amount shown for a share outstanding throughout the period may not correlate with the Statement of Operations for the period due to the timing of sales and repurchases of the Fund shares in relation to income earned and/or fluctuating market value of the investments of the Fund.
b Based on average daily shares outstanding.
c Total return does not include any fees, charges or expenses imposed by the variable annuity and life insurance contracts for which the Franklin Templeton Variable Insurance Products Trust serves as an underlying investment vehicle.
d Amount rounds to less than $0.01 per share.
e Benefit of expense reduction rounds to less than 0.01%.
f Excludes the value of portfolio securities delivered as a result of a redemption in-kind. See Note 9.
The accompanying notes are an integral part of these financial statements.
TF-8
Franklin Templeton Variable Insurance Products Trust
Financial Highlights (continued)
Templeton Foreign Securities Fund
| | | | | | | | | | | | | | | | | | | | |
| | | Year Ended December 31, | |
| Class 2 | | 2007 | | | 2006 | | | 2005 | | | 2004 | | | 2003 | |
| | | | |
Per share operating performance | | | | | | | | | | | | | | | | | | | | |
(for a share outstanding throughout the year) | | | | | | | | | | | | | | | | | | | | |
Net asset value, beginning of year | | $ | 18.73 | | | $ | 15.63 | | | $ | 14.35 | | | $ | 12.24 | | | $ | 9.42 | |
| | | | |
Income from investment operationsa: | | | | | | | | | | | | | | | | | | | | |
Net investment incomeb | | | 0.38 | | | | 0.40 | | | | 0.26 | | | | 0.22 | | | | 0.15 | |
Net realized and unrealized gains (losses) | | | 2.44 | | | | 2.91 | | | | 1.19 | | | | 2.03 | | | | 2.85 | |
| | | | |
Total from investment operations | | | 2.82 | | | | 3.31 | | | | 1.45 | | | | 2.25 | | | | 3.00 | |
| | | | |
Less distributions from: | | | | | | | | | | | | | | | | | | | | |
Net investment income | | | (0.40 | ) | | | (0.21 | ) | | | (0.17 | ) | | | (0.14 | ) | | | (0.18 | ) |
Net realized gains | | | (0.90 | ) | | | — | | | | — | | | | — | | | | — | |
| | | | |
Total distributions | | | (1.30 | ) | | | (0.21 | ) | | | (0.17 | ) | | | (0.14 | ) | | | (0.18 | ) |
| | | | |
Redemption fees | | | — | d | | | — | d | | | — | d | | | — | d | | | — | |
| | | | |
Net asset value, end of year | | $ | 20.25 | | | $ | 18.73 | | | $ | 15.63 | | | $ | 14.35 | | | $ | 12.24 | |
| | | | |
| | | | | |
Total returnc | | | 15.46% | | | | 21.44% | | | | 10.17% | | | | 18.53% | | | | 32.21% | |
Ratios to average net assets | | | | | | | | | | | | | | | | | | | | |
Expenses | | | 1.00% | e | | | 1.00% | e | | | 1.02% | e | | | 1.07% | e | | | 1.12% | |
Net investment income | | | 1.97% | | | | 2.38% | | | | 1.78% | | | | 1.70% | | | | 1.56% | |
| | | | | |
Supplemental data | | | | | | | | | | | | | | | | | | | | |
Net assets, end of year (000’s) | | $ | 3,255,154 | | | $ | 2,941,374 | | | $ | 2,232,990 | | | $ | 1,445,928 | | | $ | 653,594 | |
Portfolio turnover rate | | | 26.74% | | | | 18.97% | f | | | 14.61% | | | | 10.91% | | | | 18.01% | |
a The amount shown for a share outstanding throughout the period may not correlate with the Statement of Operations for the period due to the timing of sales and repurchases of the Fund shares in relation to income earned and/or fluctuating market value of the investments of the Fund.
b Based on average daily shares outstanding.
c Total return does not include any fees, charges or expenses imposed by the variable annuity and life insurance contracts for which the Franklin Templeton Variable Insurance Products Trust serves as an underlying investment vehicle.
d Amount rounds to less than $0.01 per share.
e Benefit of expense reduction rounds to less than 0.01%.
f Excludes the value of portfolio securities delivered as a result of a redemption in-kind. See Note 9.
The accompanying notes are an integral part of these financial statements.
TF-9
Franklin Templeton Variable Insurance Products Trust
Financial Highlights (continued)
Templeton Foreign Securities Fund
| | | | | | | | | | | | | | | | |
| | | Year Ended December 31, | |
| Class 3 | | 2007 | | | 2006 | | | 2005 | | | 2004h | |
| | | | |
Per share operating performance | | | | | | | | | | | | | | | | |
(for a share outstanding throughout the year) | | | | | | | | | | | | | | | | |
Net asset value, beginning of year | | $ | 18.68 | | | $ | 15.60 | | | $ | 14.35 | | | $ | 12.48 | |
| | | | |
Income from investment operationsa: | | | | | | | | | | | | | | | | |
Net investment incomeb | | | 0.37 | | | | 0.37 | | | | 0.25 | | | | 0.09 | |
Net realized and unrealized gains (losses) | | | 2.45 | | | | 2.94 | | | | 1.18 | | | | 1.92 | |
| | | | |
Total from investment operations | | | 2.82 | | | | 3.31 | | | | 1.43 | | | | 2.01 | |
| | | | |
Less distributions from: | | | | | | | | | | | | | | | | |
Net investment income | | | (0.42 | ) | | | (0.23 | ) | | | (0.18 | ) | | | (0.14 | ) |
Net realized gains | | | (0.90 | ) | | | — | | | | — | | | | — | |
| | | | |
Total distributions | | | (1.32 | ) | | | (0.23 | ) | | | (0.18 | ) | | | (0.14 | ) |
| | | | |
Redemption fees | | | — | e | | | — | e | | | — | e | | | — | e |
| | | | |
Net asset value, end of year | | $ | 20.18 | | | $ | 18.68 | | | $ | 15.60 | | | $ | 14.35 | |
| | | | |
| | | | |
Total returnc | | | 15.45% | | | | 21.46% | | | | 10.13% | | | | 16.25% | |
Ratios to average net assetsd | | | | | | | | | | | | | | | | |
Expenses | | | 1.00% | f | | | 1.00% | f | | | 1.02% | f | | | 1.07% | f |
Net investment income | | | 1.97% | | | | 2.38% | | | | 1.78% | | | | 1.70% | |
| | | | |
Supplemental data | | | | | | | | | | | | | | | | |
Net assets, end of year (000’s) | | $ | 313,505 | | | $ | 150,417 | | | $ | 47,462 | | | $ | 16,559 | |
Portfolio turnover rate | | | 26.74% | | | | 18.97%g | | | | 14.61% | | | | 10.91% | |
aThe amount shown for a share outstanding throughout the period may not correlate with the Statement of Operations for the period due to the timing of sales and repurchases of the Fund shares in relation to income earned and/or fluctuating market value of the investments of the Fund.
bBased on average daily shares outstanding.
cTotal return does not include any fees, charges or expenses imposed by the variable annuity and life insurance contracts for which the Franklin Templeton Variable Insurance Products Trust serves as an underlying investment vehicle. Total return is not annualized for periods less than one year.
dRatios are annualized for periods less than one year.
eAmount rounds to less than $0.01 per share.
fBenefit of expense reduction rounds to less than 0.01%.
gExcludes the value of portfolio securities delivered as a result of a redemption in-kind. See Note 9.
hFor the period May 1, 2004 (effective date) to December 31, 2004.
The accompanying notes are an integral part of these financial statements.
TF-10
Franklin Templeton Variable Insurance Products Trust
Statement of Investments, December 31, 2007
| | | | | | | |
| Templeton Foreign Securities Fund | | Country | | Shares | | Value |
Long Term Investments 95.9% | | | | | | | |
Common Stocks 95.0% | | | | | | | |
Aerospace & Defense 1.9% | | | | | | | |
BAE Systems PLC | | United Kingdom | | 4,494,870 | | $ | 44,476,790 |
Embraer-Empresa Brasileira de Aeronautica SA, ADR | | Brazil | | 700,030 | | | 31,914,368 |
| | | | | | | |
| | | | | | | 76,391,158 |
| | | | | | | |
Air Freight & Logistics 0.9% | | | | | | | |
Deutsche Post AG | | Germany | | 1,087,912 | | | 37,007,990 |
| | | | | | | |
Auto Components 1.1% | | | | | | | |
NOK Corp. | | Japan | | 2,198,155 | | | 46,815,389 |
| | | | | | | |
Capital Markets 2.4% | | | | | | | |
Invesco Ltd. | | Bermuda | | 2,403,147 | | | 75,410,753 |
aKKR Private Equity Investors LP, 144A | | United States | | 1,155,000 | | | 20,974,800 |
| | | | | | | |
| | | | | | | 96,385,553 |
| | | | | | | |
Chemicals 0.6% | | | | | | | |
Ciba Specialty Chemicals AG | | Switzerland | | 550,500 | | | 25,504,103 |
| | | | | | | |
Commercial Banks 10.2% | | | | | | | |
DBS Group Holdings Ltd. | | Singapore | | 1,240,347 | | | 17,812,052 |
Hana Financial Group Inc. | | South Korea | | 672,040 | | | 36,184,836 |
Kookmin Bank, ADR | | South Korea | | 295,869 | | | 21,693,115 |
Mega Financial Holding Co. Ltd. | | Taiwan | | 34,084,000 | | | 20,967,493 |
Mitsubishi UFJ Financial Group Inc. | | Japan | | 7,454,000 | | | 69,984,648 |
Royal Bank of Scotland Group PLC | | United Kingdom | | 4,311,704 | | | 38,038,105 |
Shinhan Financial Group Co. Ltd. | | South Korea | | 762,930 | | | 43,605,315 |
Shinsei Bank Ltd. | | Japan | | 8,731,478 | | | 31,945,864 |
Sumitomo Mitsui Financial Group Inc. | | Japan | | 9,191 | | | 68,985,042 |
UniCredito Italiano SpA | | Italy | | 8,344,507 | | | 69,168,518 |
| | | | | | | |
| | | | | | | 418,384,988 |
| | | | | | | |
Commercial Services & Supplies 1.2% | | | | | | | |
Adecco SA | | Switzerland | | 527,850 | | | 28,530,544 |
Securitas AB, B | | Sweden | | 1,278,238 | | | 17,792,570 |
Securitas Systems AB, B | | Sweden | | 1,103,738 | | | 3,926,253 |
| | | | | | | |
| | | | | | | 50,249,367 |
| | | | | | | |
Computers & Peripherals 1.3% | | | | | | | |
Compal Electronics Inc. | | Taiwan | | 12,852,983 | | | 14,069,716 |
Lite-On Technology Corp. | | Taiwan | | 22,703,166 | | | 39,623,780 |
| | | | | | | |
| | | | | | | 53,693,496 |
| | | | | | | |
Containers & Packaging 0.9% | | | | | | | |
Amcor Ltd. | | Australia | | 5,968,788 | | | 36,136,215 |
| | | | | | | |
Diversified Financial Services 2.0% | | | | | | | |
ING Groep NV | | Netherlands | | 2,046,888 | | | 79,905,618 |
| | | | | | | |
Diversified Telecommunication Services 10.3% | | | | | | | |
China Telecom Corp. Ltd., H | | China | | 76,952,357 | | | 61,182,161 |
Chunghwa Telecom Co. Ltd., ADR | | Taiwan | | 2,589,183 | | | 54,657,647 |
France Telecom SA | | France | | 2,431,453 | | | 87,360,151 |
KT Corp., ADR | | South Korea | | 397,895 | | | 10,265,691 |
Singapore Telecommunications Ltd. | | Singapore | | 20,278,000 | | | 56,271,116 |
Telefonica SA, ADR | | Spain | | 829,094 | | | 80,911,283 |
TF-11
Franklin Templeton Variable Insurance Products Trust
Statement of Investments, December 31, 2007 (continued)
| | | | | | | |
| Templeton Foreign Securities Fund | | Country | | Shares | | Value |
Long Term Investments (continued) | | | | | | | |
Common Stocks (continued) | | | | | | | |
Diversified Telecommunication Services (continued) | | | | | | | |
Telekom Austria AG | | Austria | | 727,240 | | $ | 20,196,495 |
Telenor ASA | | Norway | | 2,169,354 | | | 51,793,851 |
| | | | | | | |
| | | | | | | 422,638,395 |
| | | | | | | |
Electric Utilities 2.0% | | | | | | | |
British Energy Group PLC | | United Kingdom | | 5,766,390 | | | 62,729,972 |
Hong Kong Electric Holdings Ltd. | | Hong Kong | | 3,453,969 | | | 19,865,161 |
| | | | | | | |
| | | | | | | 82,595,133 |
| | | | | | | |
Electrical Equipment 1.5% | | | | | | | |
Gamesa Corp. Tecnologica SA | | Spain | | 606,877 | | | 28,322,957 |
bVestas Wind Systems AS | | Denmark | | 298,648 | | | 32,264,154 |
| | | | | | | |
| | | | | | | 60,587,111 |
| | | | | | | |
Electronic Equipment & Instruments 2.5% | | | | | | | |
bFlextronics International Ltd. | | Singapore | | 2,282,540 | | | 27,527,432 |
FUJIFILM Holdings Corp. | | Japan | | 921,374 | | | 39,080,832 |
Hitachi Ltd. | | Japan | | 3,178,263 | | | 23,741,139 |
Venture Corp. Ltd. | | Singapore | | 1,339,613 | | | 11,895,693 |
| | | | | | | |
| | | | | | | 102,245,096 |
| | | | | | | |
Food Products 2.2% | | | | | | | |
Nestle SA | | Switzerland | | 103,509 | | | 47,497,953 |
Unilever PLC | | United Kingdom | | 1,170,483 | | | 43,955,566 |
| | | | | | | |
| | | | | | | 91,453,519 |
| | | | | | | |
Health Care Providers & Services 0.7% | | | | | | | |
Celesio AG | | Germany | | 440,310 | | | 27,283,368 |
| | | | | | | |
Hotels Restaurants & Leisure 2.0% | | | | | | | |
Compass Group PLC | | United Kingdom | | 9,792,178 | | | 60,023,516 |
bTUI AG | | Germany | | 792,560 | | | 22,172,451 |
| | | | | | | |
| | | | | | | 82,195,967 |
| | | | | | | |
Household Durables 0.3% | | | | | | | |
Husqvarna AB, A | | Sweden | | 235,727 | | | 2,798,157 |
Husqvarna AB, B | | Sweden | | 785,757 | | | 9,327,196 |
| | | | | | | |
| | | | | | | 12,125,353 |
| | | | | | | |
Industrial Conglomerates 4.4% | | | | | | | |
Hutchison Whampoa Ltd. | | Hong Kong | | 3,276,709 | | | 37,166,093 |
Koninklijke Philips Electronics NV | | Netherlands | | 899,289 | | | 38,741,380 |
Siemens AG | | Germany | | 661,824 | | | 104,715,595 |
| | | | | | | |
| | | | | | | 180,623,068 |
| | | | | | | |
Insurance 4.1% | | | | | | | |
ACE Ltd. | | Bermuda | | 729,799 | | | 45,086,982 |
Aviva PLC | | United Kingdom | | 2,795,400 | | | 37,380,576 |
AXA SA | | France | | 453,589 | | | 18,130,676 |
aAXA SA, 144A | | France | | 38,270 | | | 1,529,713 |
Old Mutual PLC | | United Kingdom | | 19,529,314 | | | 65,035,123 |
| | | | | | | |
| | | | | | | 167,163,070 |
| | | | | | | |
TF-12
Franklin Templeton Variable Insurance Products Trust
Statement of Investments, December 31, 2007 (continued)
| | | | | | | |
| Templeton Foreign Securities Fund | | Country | | Shares | | Value |
Long Term Investments (continued) | | | | | | | |
Common Stocks (continued) | | | | | | | |
Life Sciences Tools & Services 1.1% | | | | | | | |
Lonza Group AG | | Switzerland | | 367,800 | | $ | 44,595,588 |
| | | | | | | |
Media 5.1% | | | | | | | |
British Sky Broadcasting Group PLC | | United Kingdom | | 2,941,216 | | | 36,174,666 |
Eutelsat Communications | | France | | 2,081,860 | | | 61,826,603 |
Pearson PLC | | United Kingdom | | 3,409,246 | | | 49,585,692 |
Reed Elsevier NV | | Netherlands | | 2,012,869 | | | 40,096,606 |
Vivendi SA | | France | | 444,350 | | | 20,348,742 |
| | | | | | | |
| | | | | | | 208,032,309 |
| | | | | | | |
Metals & Mining 1.6% | | | | | | | |
Barrick Gold Corp. | | Canada | | 663,561 | | | 27,897,941 |
POSCO, ADR | | South Korea | | 255,230 | | | 38,389,144 |
| | | | | | | |
| | | | | | | 66,287,085 |
| | | | | | | |
Multi-Utilities 1.5% | | | | | | | |
Centrica PLC | | United Kingdom | | 2,772,071 | | | 19,759,831 |
Suez SA | | France | | 630,996 | | | 42,883,704 |
| | | | | | | |
| | | | | | | 62,643,535 |
| | | | | | | |
Oil, Gas & Consumable Fuels 12.8% | | | | | | | |
BP PLC | | United Kingdom | | 6,622,666 | | | 80,927,278 |
Eni SpA | | Italy | | 1,275,111 | | | 46,613,871 |
Gazprom, ADR | | Russia | | 643,700 | | | 36,143,755 |
Hindustan Petroleum Corp. Ltd. | | India | | 2,415,168 | | | 22,628,601 |
Indian Oil Corp. Ltd. | | India | | 1,194,026 | | | 24,066,874 |
Reliance Industries Ltd. | | India | | 1,374,378 | | | 100,486,023 |
Royal Dutch Shell PLC, B | | United Kingdom | | 2,327,407 | | | 96,650,829 |
Sasol, ADR | | South Africa | | 971,480 | | | 48,059,116 |
Total SA, B | | France | | 846,266 | | | 70,184,950 |
| | | | | | | |
| | | | | | | 525,761,297 |
| | | | | | | |
Paper & Forest Products 2.3% | | | | | | | |
Norske Skogindustrier ASA | | Norway | | 1,362,151 | | | 11,329,327 |
Stora Enso OYJ, R | | Finland | | 2,665,971 | | | 40,098,625 |
UPM-Kymmene OYJ | | Finland | | 2,066,829 | | | 41,684,254 |
| | | | | | | |
| | | | | | | 93,112,206 |
| | | | | | | |
Pharmaceuticals 6.7% | | | | | | | |
GlaxoSmithKline PLC | | United Kingdom | | 3,611,345 | | | 91,775,442 |
Novartis AG | | Switzerland | | 1,093,760 | | | 59,938,666 |
Sanofi-Aventis | | France | | 1,066,665 | | | 98,037,031 |
Takeda Pharmaceutical Co. Ltd. | | Japan | | 421,454 | | | 24,830,317 |
| | | | | | | |
| | | | | | | 274,581,456 |
| | | | | | | |
Real Estate Management & Development 2.5% | | | | | | | |
Cheung Kong (Holdings) Ltd. | | Hong Kong | | 5,503,922 | | | 101,776,786 |
| | | | | | | |
Semiconductors & Semiconductor Equipment 4.1% | | | | | | | |
bInfineon Technologies AG | | Germany | | 3,757,123 | | | 44,521,613 |
bQimonda AG, ADR | | Germany | | 1,849,390 | | | 13,223,139 |
Samsung Electronics Co. Ltd. | | South Korea | | 98,969 | | | 58,786,137 |
Taiwan Semiconductor Manufacturing Co. Ltd. | | Taiwan | | 26,887,711 | | | 51,404,196 |
| | | | | | | |
| | | | | | | 167,935,085 |
| | | | | | | |
TF-13
Franklin Templeton Variable Insurance Products Trust
Statement of Investments, December 31, 2007 (continued)
| | | | | | | | |
| Templeton Foreign Securities Fund | | Country | | Shares | | Value | |
Long Term Investments (continued) | | | | | | | | |
Common Stocks (continued) | | | | | | | | |
Software 0.8% | | | | | | | | |
bCheck Point Software Technologies Ltd. | | Israel | | 1,448,281 | | $ | 31,804,251 | |
| | | | | | | | |
Specialty Retail 0.4% | | | | | | | | |
Kingfisher PLC | | United Kingdom | | 5,676,856 | | | 16,423,141 | |
| | | | | | | | |
Textiles, Apparel & Luxury Goods 0.4% | | | | | | | | |
Burberry Group PLC | | United Kingdom | | 1,512,618 | | | 17,116,303 | |
| | | | | | | | |
Wireless Telecommunication Services 3.2% | | | | | | | | |
Mobile TeleSystems, ADR | | Russia | | 434,900 | | | 44,268,471 | |
Turkcell Iletisim Hizmetleri AS, ADR | | Turkey | | 823,650 | | | 22,708,031 | |
Vodafone Group PLC, ADR | | United Kingdom | | 1,773,520 | | | 66,187,765 | |
| | | | | | | | |
| | | | | | | 133,164,267 | |
| | | | | | | | |
Total Common Stocks (Cost $2,922,550,906) | | | | | | | 3,892,617,266 | |
| | | | | | | | |
Preferred Stock (Cost $2,340,943) 0.9% | | | | | | | | |
Metals & Mining 0.9% | | | | | | | | |
Companhia Vale do Rio Doce, ADR, pfd., A | | Brazil | | 1,296,112 | | | 36,265,214 | |
| | | | | | | | |
Total Long Term Investments (Cost $2,924,891,849) | | | | | | | 3,928,882,480 | |
| | | | | | | | |
Short Term Investment (Cost $177,468,579) 4.3% | | | | | | | | |
Money Market Fund 4.3% | | | | | | | | |
cFranklin Institutional Fiduciary Trust Money Market Portfolio, 4.58% | | United States | | 177,468,579 | | | 177,468,579 | |
| | | | | | | | |
Total Investments (Cost $3,102,360,428) 100.2% | | | | | | | 4,106,351,059 | |
Other Assets, less Liabilities (0.2)% | | | | | | | (6,315,408 | ) |
| | | | | | | | |
Net Assets 100.0% | | | | | | $ | 4,100,035,651 | |
| | | | | | | | |
Selected Portfolio Abbreviation
ADR - American Depository Receipt
aSecurity was purchased pursuant to Rule 144A under the Securities Act of 1933 and may be sold in transactions exempt from registration only to qualified institutional buyers or in a public offering registered under the Securities Act of 1933. These securities have been deemed liquid under guidelines approved by the Trust’s Board of Trustees. At December 31, 2007, the aggregate value of these securities was $22,504,513, representing 0.55% of net assets.
bNon-income producing for the twelve months ended December 31, 2007.
cSee Note 7 regarding investments in the Franklin Institutional Fiduciary Trust Money Market Portfolio. The rate shown is the annualized seven-day yield at period end.
The accompanying notes are an integral part of these financial statements.
TF-14
Franklin Templeton Variable Insurance Products Trust
Financial Statements
Statement of Assets and Liabilities
December 31, 2007
| | | |
| | | Templeton
Foreign
Securities Fund |
Assets: | | | |
Investments in securities: | | | |
Cost - Unaffiliated issuers | | $ | 2,924,891,849 |
Cost - Sweep Money Fund (Note 7) | | | 177,468,579 |
| | | |
Total cost of investments | | $ | 3,102,360,428 |
| | | |
Value - Unaffiliated issuers | | $ | 3,928,882,480 |
Value - Sweep Money Fund (Note 7) | | | 177,468,579 |
| | | |
Total value of investments | | | 4,106,351,059 |
Foreign currency, at value (cost $61,607) | | | 61,451 |
Receivables: | | | |
Capital shares sold | | | 2,021,896 |
Dividends | | | 4,658,756 |
| | | |
Total assets | | | 4,113,093,162 |
| | | |
Liabilities: | | | |
Payables: | | | |
Capital shares redeemed | | | 7,263,709 |
Affiliates | | | 3,927,375 |
Deferred taxes | | | 997,091 |
Accrued expenses and other liabilities | | | 869,336 |
| | | |
Total liabilities | | | 13,057,511 |
| | | |
Net assets, at value | | $ | 4,100,035,651 |
| | | |
Net assets consist of: | | | |
Paid-in capital | | $ | 2,699,600,752 |
Undistributed net investment income | | | 79,657,780 |
Net unrealized appreciation (depreciation) | | | 1,003,049,810 |
Accumulated net realized gain (loss) | | | 317,727,309 |
| | | |
Net assets, at value | | $ | 4,100,035,651 |
| | | |
Class 1: | | | |
Net assets, at value | | $ | 531,376,696 |
| | | |
Shares outstanding | | | 25,827,290 |
| | | |
Net asset value and maximum offering price per share | | $ | 20.57 |
| | | |
Class 2: | | | |
Net assets, at value | | $ | 3,255,154,238 |
| | | |
Shares outstanding | | | 160,727,412 |
| | | |
Net asset value and maximum offering price per share | | $ | 20.25 |
| | | |
Class 3: | | | |
Net assets, at value | | $ | 313,504,717 |
| | | |
Shares outstanding | | | 15,535,675 |
| | | |
Net asset value and maximum offering price per sharea | | $ | 20.18 |
| | | |
a | Redemption price is equal to net asset value less any redemption fees retained by the Fund. |
The accompanying notes are an integral part of these financial statements.
TF-15
Franklin Templeton Variable Insurance Products Trust
Financial Statements (continued)
Statement of Operations
for the year ended December 31, 2007
| | | | |
| | | Templeton
Foreign
Securities Fund | |
Investment income: | | | | |
Dividends (net of foreign taxes of $8,216,242) | | | | |
Unaffiliated issuers | | $ | 105,905,206 | |
Sweep Money Fund (Note 7) | | | 12,133,090 | |
Interest (net of foreign taxes of $199) | | | 929 | |
| | | | |
Total investment income | | | 118,039,225 | |
| | | | |
Expenses: | | | | |
Management fees (Note 3a) | | | 24,092,917 | |
Administrative fees (Note 3b) | | | 3,553,533 | |
Distribution fees: (Note 3c) | | | | |
Class 2 | | | 7,886,342 | |
Class 3 | | | 576,111 | |
Unaffiliated transfer agent fees | | | 65,714 | |
Custodian fees (Note 4) | | | 1,034,043 | |
Reports to shareholders | | | 891,521 | |
Professional fees | | | 167,113 | |
Trustees’ fees and expenses | | | 16,559 | |
Other | | | 88,114 | |
| | | | |
Total expenses | | | 38,371,967 | |
Expense reductions (Note 4) | | | (11,975 | ) |
| | | | |
Net expenses | | | 38,359,992 | |
| | | | |
Net investment income | | | 79,679,233 | |
| | | | |
Realized and unrealized gains (losses): | | | | |
Net realized gain (loss) from: | | | | |
Investments | | | 318,979,414 | |
Foreign currency transactions | | | 688,164 | |
| | | | |
Net realized gain (loss) | | | 319,667,578 | |
| | | | |
Net change in unrealized appreciation (depreciation) on: | | | | |
Investments | | | 172,139,703 | |
Translation of assets and liabilities denominated in foreign currencies | | | (19,932 | ) |
Change in deferred taxes on unrealized appreciation (depreciation) | | | (96,863 | ) |
| | | | |
Net change in unrealized appreciation (depreciation) | | | 172,022,908 | |
| | | | |
Net realized and unrealized gain (loss) | | | 491,690,486 | |
| | | | |
Net increase (decrease) in net assets resulting from operations | | $ | 571,369,719 | |
| | | | |
The accompanying notes are an integral part of these financial statements.
TF-16
Franklin Templeton Variable Insurance Products Trust
Financial Statements (continued)
Statements of Changes in Net Assets
| | | | | | | | |
| | | Templeton Foreign
Securities Fund | |
| | | Year Ended December 31, | |
| | | 2007 | | | 2006 | |
| | | | |
Increase (decrease) in net assets: | | | | | | | | |
Operations: | | | | | | | | |
Net investment income | | $ | 79,679,233 | | | $ | 77,320,581 | |
Net realized gain (loss) from investments, foreign currency transactions and redemption in-kind (Note 9) | | | 319,667,578 | | | | 216,717,127 | |
Net change in unrealized appreciation (depreciation) on investments and translation of assets and liabilities denominated in foreign currencies, and deferred taxes | | | 172,022,908 | | | | 342,405,989 | |
| | | | |
Net increase (decrease) in net assets resulting from operations | | | 571,369,719 | | | | 636,443,697 | |
| | | | |
Distributions to shareholders from: | | | | | | | | |
Net investment income: | | | | | | | | |
Class 1 | | | (13,007,672 | ) | | | (7,899,286 | ) |
Class 2 | | | (62,378,038 | ) | | | (30,532,245 | ) |
Class 3 | | | (4,668,468 | ) | | | (1,067,001 | ) |
Net realized gains: | | | | | | | | |
Class 1 | | | (26,934,025 | ) | | | — | |
Class 2 | | | (142,276,757 | ) | | | — | |
Class 3 | | | (10,123,984 | ) | | | — | |
| | | | |
Total distributions to shareholders | | | (259,388,944 | ) | | | (39,498,532 | ) |
| | | | |
Capital share transactions: (Note 2) | | | | | | | | |
Class 1 | | | (110,488,366 | ) | | | (39,662,208 | ) |
Class 2 | | | 66,307,351 | | | | 232,018,498 | |
Class 3 | | | 145,429,492 | | | | 85,243,717 | |
| | | | |
Total capital share transactions | | | 101,248,477 | | | | 277,600,007 | |
| | | | |
Redemption fees | | | 24,688 | | | | 9,162 | |
| | | | |
Net increase (decrease) in net assets | | | 413,253,940 | | | | 874,554,334 | |
Net assets: | | | | | | | | |
Beginning of year | | | 3,686,781,711 | | | | 2,812,227,377 | |
| | | | |
End of year | | $ | 4,100,035,651 | | | $ | 3,686,781,711 | |
| | | | |
Undistributed net investment income included in net assets: | | | | | | | | |
End of year | | $ | 79,657,780 | | | $ | 79,126,854 | |
| | | | |
The accompanying notes are an integral part of these financial statements.
TF-17
Franklin Templeton Variable Insurance Products Trust
Notes to Financial Statements
Templeton Foreign Securities Fund
1. ORGANIZATION AND SIGNIFICANT ACCOUNTING POLICIES
Franklin Templeton Variable Insurance Products Trust (Trust) is registered under the Investment Company Act of 1940, as amended, (1940 Act) as an open-end investment company, consisting of twenty-three separate funds. The Templeton Foreign Securities Fund (Fund) included in this report is diversified. The financial statements of the remaining funds in the Trust are presented separately. Shares of the Fund are sold only to insurance company separate accounts to fund the benefits of variable life insurance policies or variable annuity contracts. The Fund offers three classes of shares: Class 1, Class 2, and Class 3. Each class of shares differs by its distribution fees, voting rights on matters affecting a single class and its exchange privilege.
The following summarizes the Fund’s significant accounting policies.
a. Security Valuation
Securities listed on a securities exchange or on the NASDAQ National Market System are valued at the last quoted sale price or the official closing price of the day, respectively. Over-the-counter securities and listed securities for which there is no reported sale are valued within the range of the most recent quoted bid and ask prices. Securities that trade in multiple markets or on multiple exchanges are valued according to the broadest and most representative market. Investments in open-end mutual funds are valued at the closing net asset value.
Foreign securities are valued as of the close of trading on the foreign stock exchange on which the security is primarily traded, or the NYSE, whichever is earlier. If no sale is reported at that time, the foreign security will be valued within the range of the most recent quoted bid and ask prices. The value is then converted into its U.S. dollar equivalent at the foreign exchange rate in effect at the close of the NYSE on the day that the value of the foreign security is determined.
The Trust has procedures to determine the fair value of individual securities and other assets for which market prices are not readily available or which may not be reliably priced. Methods for valuing these securities may include: fundamental analysis, matrix pricing, discounts from market prices of similar securities, or discounts applied due to the nature and duration of restrictions on the disposition of the securities. Due to the inherent uncertainty of valuations of such securities, the fair values may differ significantly from the values that would have been used had a ready market for such investments existed. Occasionally, events occur between the time at which trading in a security is completed and the close of the NYSE that might call into question the availability (including the reliability) of the value of a portfolio security held by the Fund. The investment manager monitors price movements following the close of trading in foreign stock markets through a series of country specific market proxies (such as baskets of American Depository Receipts, futures contracts and exchange traded funds). These price movements are measured against established trigger thresholds for each specific market proxy to assist in determining if an event has occurred. If such an event occurs, the securities may be valued using fair value procedures, which may include the use of independent pricing services. All security valuation procedures are approved by the Trust’s Board of Trustees.
b. Foreign Currency Translation
Portfolio securities and other assets and liabilities denominated in foreign currencies are translated into U.S. dollars based on the exchange rate of such currencies against U.S. dollars on the date of valuation. Purchases and sales of securities, income and expense items denominated in foreign currencies are translated into U.S. dollars at the exchange rate in effect on the transaction date. Occasionally, events may impact the availability or reliability of foreign exchange rates used to convert the U.S. dollar equivalent value. If such an event occurs, the foreign exchange rate will be valued at fair value using procedures established and approved by the Trust’s Board of Trustees.
The Fund does not separately report the effect of changes in foreign exchange rates from changes in market prices on securities held. Such changes are included in net realized and unrealized gain or loss from investments on the Statement of Operations.
TF-18
Franklin Templeton Variable Insurance Products Trust
Notes to Financial Statements (continued)
Templeton Foreign Securities Fund
1. ORGANIZATION AND SIGNIFICANT ACCOUNTING POLICIES (continued)
b. Foreign Currency Translation (continued)
Realized foreign exchange gains or losses arise from sales of foreign currencies, currency gains or losses realized between the trade and settlement dates on securities transactions and the difference between the recorded amounts of dividends, interest, and foreign withholding taxes and the U.S. dollar equivalent of the amounts actually received or paid. Net unrealized foreign exchange gains and losses arise from changes in foreign exchange rates on foreign denominated assets and liabilities other than investments in securities held at the end of the reporting period.
c. Foreign Currency Contracts
When the Fund purchases or sells foreign securities it may enter into foreign exchange contracts to minimize foreign exchange risk from the trade date to the settlement date of the transactions. A foreign exchange contract is an agreement between two parties to exchange different currencies at an agreed upon exchange rate at a future date. Realized and unrealized gains and losses on these contracts are included in the Statement of Operations.
The risks of these contracts include movement in the values of the foreign currencies relative to the U.S. dollar and the possible inability of the counterparties to fulfill their obligations under the contracts, which may be in excess of the amount reflected in the Statement of Assets and Liabilities.
d. Income and Deferred Taxes
No provision has been made for U.S. income taxes because it is the Fund’s policy to qualify as a regulated investment company under the Internal Revenue Code and to distribute to shareholders substantially all of its taxable income and net realized gains.
Foreign securities held by the Fund may be subject to foreign taxation on dividend income received. Foreign taxes, if any, are recorded based on the tax regulations and rates that exist in the foreign markets in which the Fund invests.
The Fund may be subject to a tax imposed on net realized gains on securities of certain foreign countries. The Fund records an estimated deferred tax liability for net unrealized gains on these securities in an amount that would be payable if the securities were disposed of on the valuation date.
e. Security Transactions, Investment Income, Expenses and Distributions
Security transactions are accounted for on trade date. Realized gains and losses on security transactions are determined on a specific identification basis. Interest income and estimated expenses are accrued daily. Dividend income is recorded on the ex-dividend date except that certain dividends from foreign securities are recognized as soon as the Fund is notified of the ex-dividend date. Distributions to shareholders are recorded on the ex-dividend date and are determined according to income tax regulations (tax basis). Distributable earnings determined on a tax basis may differ from earnings recorded in accordance with accounting principles generally accepted in the United States of America. These differences may be permanent or temporary. Permanent differences are reclassified among capital accounts to reflect their tax character. These reclassifications have no impact on net assets or the results of operations. Temporary differences are not reclassified, as they may reverse in subsequent periods.
Common expenses incurred by the Trust are allocated among the funds based on the ratio of net assets of each fund to the combined net assets of the Trust. Fund specific expenses are charged directly to the fund that incurred the expense.
Realized and unrealized gains and losses and net investment income, other than class specific expenses, are allocated daily to each class of shares based upon the relative proportion of net assets of each class. Differences in per share distributions, by class, are generally due to differences in class specific expenses.
TF-19
Franklin Templeton Variable Insurance Products Trust
Notes to Financial Statements (continued)
Templeton Foreign Securities Fund
1. ORGANIZATION AND SIGNIFICANT ACCOUNTING POLICIES (continued)
f. Accounting Estimates
The preparation of financial statements in accordance with accounting principles generally accepted in the United States of America requires management to make estimates and assumptions that affect the reported amounts of assets and liabilities at the date of the financial statements and the amounts of income and expenses during the reporting period. Actual results could differ from those estimates.
g. Redemption Fees
Redemptions and exchanges of Class 3 shares held 60 days or less may be subject to the fund’s redemption fee, which is 1% of the amount redeemed. Such fees are retained by the fund and accounted for as an addition to paid-in capital.
h. Guarantees and Indemnifications
Under the Trust’s organizational documents, its officers and trustees are indemnified by the Trust against certain liabilities arising out of the performance of their duties to the Trust. Additionally, in the normal course of business, the Trust, on behalf of the Fund, enters into contracts with service providers that contain general indemnification clauses. The Trust’s maximum exposure under these arrangements is unknown as this would involve future claims that may be made against the Trust that have not yet occurred. Currently, the Trust expects the risk of loss to be remote.
2. SHARES OF BENEFICIAL INTEREST
At December 31, 2007, there were an unlimited number of shares authorized (without par value). Transactions in the Fund’s shares were as follows:
| | | | | | | | | | | | | | |
| | | Year Ended December 31, | |
| | | 2007 | | | 2006 | |
| Class 1 Shares: | | Shares | | | Amount | | | Shares | | | Amount | |
Shares sold | | 1,232,157 | | | $ | 24,254,763 | | | 2,328,810 | | | $ | 39,073,549 | |
Shares issued in reinvestment of distributions | | 2,040,966 | | | | 39,941,697 | | | 492,781 | | | | 7,899,286 | |
Shares redeemed | | (8,769,318 | ) | | | (174,684,826 | ) | | (5,075,580 | ) | | | (86,635,043 | ) |
| | | | |
Net increase (decrease) | | (5,496,195 | ) | | $ | (110,488,366 | ) | | (2,253,989 | ) | | $ | (39,662,208 | ) |
| | | | |
| Class 2 Shares: | | | | | | | | | | | | |
Shares sold | | 20,015,006 | | | $ | 388,403,751 | | | 43,227,824 | | | $ | 728,731,224 | |
Shares issued in reinvestment of distributions | | 10,576,152 | | | | 204,013,968 | | | 1,925,158 | | | | 30,455,999 | |
Shares redeemed in-kind (Note 10) | | — | | | | — | | | (8,720,489 | ) | | | (151,213,281 | ) |
Shares redeemed | | (26,940,536 | ) | | | (526,110,368 | ) | | (22,264,085 | ) | | | (375,955,444 | ) |
| | | | |
Net increase (decrease) | | 3,650,622 | | | $ | 66,307,351 | | | 14,168,408 | | | $ | 232,018,498 | |
| | | | |
| Class 3 Shares: | | | | | | | | | | | | |
Shares sold | | 7,292,215 | | | $ | 141,648,697 | | | 5,176,865 | | | $ | 88,136,330 | |
Shares issued in reinvestment of distributions | | 769,639 | | | | 14,792,452 | | | 67,617 | | | | 1,067,001 | |
Shares redeemed | | (578,013 | ) | | | (11,011,657 | ) | | (234,367 | ) | | | (3,959,614 | ) |
| | | | |
Net increase (decrease) | | 7,483,841 | | | $ | 145,429,492 | | | 5,010,115 | | | $ | 85,243,717 | |
| | | | |
TF-20
Franklin Templeton Variable Insurance Products Trust
Notes to Financial Statements (continued)
Templeton Foreign Securities Fund
3. TRANSACTIONS WITH AFFILIATES
Franklin Resources, Inc. is the holding company for various subsidiaries that together are referred to as Franklin Templeton Investments. Certain officers and trustees of the Trust are also officers and/or directors of the following subsidiaries:
| | |
| Subsidiary | | Affiliation |
Templeton Investment Counsel, LLC (TIC) | | Investment manager |
Franklin Templeton Services, LLC (FT Services) | | Administrative manager |
Franklin Templeton Distributors, Inc. (Distributors) | | Principal underwriter |
Franklin Templeton Investor Services, LLC (Investor Services) | | Transfer agent |
a. Management Fees
The Fund pays an investment management fee to TIC based on the average daily net assets of the Fund as follows:
| | |
| Annualized Fee Rate | | Net Assets |
| 0.750% | | Up to and including $200 million |
| 0.675% | | Over $200 million, up to and including $1.3 billion |
| 0.600% | | Over $1.3 billion, up to and including $10 billion |
| 0.580% | | Over $10 billion, up to and including $ 15 billion |
| 0.560% | | Over $15 billion, up to and including $ 20 billion |
| 0.540% | | In excess of $20 billion |
b. Administrative Fees
The Fund pays an administrative fee to FT Services based on the average daily net assets as follows:
| | |
| Annualized Fee Rate | | Net Assets |
| 0.150% | | Up to and including $200 million |
| 0.135% | | Over $200 million, up to and including $700 million |
| 0.100% | | Over $700 million, up to and including $1.2 billion |
| 0.075% | | In excess of $1.2 billion |
c. Distribution Fees
The Fund’s Board of Trustees has adopted distribution plans for Class 2 and Class 3 shares pursuant to Rule 12b-1 under the 1940 Act. Under the Fund’s compensation distribution plans, the Fund pays Distributors for costs incurred in connection with the servicing, sale and distribution of the Fund’s shares up to 0.25% and 0.35% per year of its average daily net assets of Class 2 and Class 3, respectively. The Board of Trustees has agreed to limit the current rate to 0.25% per year for Class 3.
d. Transfer Agent Fees
Investor Services, under terms of an agreement, performs shareholder servicing for the Fund and is not paid by the Fund for the services.
4. EXPENSE OFFSET ARRANGEMENT
The Fund has entered into an arrangement with its custodian whereby credits realized as a result of uninvested cash balances are used to reduce a portion of the Fund’s custodian expenses. During the year ended December 31, 2007, the custodian fees were reduced as noted in the Statement of Operations.
TF-21
Franklin Templeton Variable Insurance Products Trust
Notes to Financial Statements (continued)
Templeton Foreign Securities Fund
5. INCOME TAXES
The Fund has reviewed the tax positions taken on federal income tax returns, for each of the three open tax years and as of December 31, 2007 and has determined that no provision for income tax is required in the Fund’s financial statements.
The tax character of distributions paid during the years ended December 31, 2007 and 2006, was as follows:
| | | | | | |
| | | 2007 | | 2006 |
Distributions paid from: | | | | | | |
Ordinary income | | $ | 89,150,006 | | $ | 39,498,532 |
Long term capital gain | | | 170,238,938 | | | — |
| | | |
| | $ | 259,388,944 | | $ | 39,498,532 |
| | | |
At December 31, 2007, the cost of investments, net unrealized appreciation (depreciation), undistributed ordinary income and undistributed long term capital gains for income tax purposes were as follows:
| | | | |
Cost of investments | | $ | 3,102,347,243 | |
| | | | |
| |
Unrealized appreciation | | $ | 1,125,280,198 | |
Unrealized depreciation | | | (121,276,382 | ) |
| | | | |
Net unrealized appreciation (depreciation) | | $ | 1,004,003,816 | |
| | | | |
Undistributed ordinary income | | $ | 108,967,521 | |
Undistributed long term capital gains | | | 288,404,384 | |
| | | | |
Distributable earnings | | $ | 397,371,905 | |
| | | | |
Net investment income differs for financial statement and tax purposes primarily due to differing treatments of foreign currency transactions and pass-through entity income.
Net realized gains (losses) differ for financial statement and tax purposes primarily due to differing treatments of wash sales, foreign currency transactions and pass-through entity income.
6. INVESTMENT TRANSACTIONS
Purchases and sales of investments (excluding short term securities) for the year ended December 31, 2007, aggregated $997,801,739 and $1,004,038,466, respectively.
7. INVESTMENTS IN FRANKLIN INSTITUTIONAL FIDUCIARY TRUST MONEY MARKET PORTFOLIO
The Fund may invest in the Franklin Institutional Fiduciary Trust Money Market Portfolio (Sweep Money Fund), an open-end investment company managed by Franklin Advisers, Inc. (an affiliate of the investment manager. Management fees paid by the Fund are reduced on assets invested in the Sweep Money Fund, in an amount not to exceed the management and administrative fees paid by the Sweep Money Fund.
8. CONCENTRATION OF RISK
Investing in foreign securities may include certain risks and considerations not typically associated with investing in U.S. securities, such as fluctuating currency values and changing local and regional economic, political and social conditions, which may result in greater market volatility. In addition, certain foreign securities may not be as liquid as U.S. securities.
TF-22
Franklin Templeton Variable Insurance Products Trust
Notes to Financial Statements (continued)
Templeton Foreign Securities Fund
9. REDEMPTION IN-KIND
During the year ended December 31, 2006, the Fund realized $34,808,242 of net gains resulting from a redemption in-kind in which a shareholder redeemed fund shares for securities held by the Fund rather than for cash. Because such gains are not taxable to the Fund, and are not distributed to shareholders, they have been reclassified from accumulated net realized gains to paid-in capital.
10. REGULATORY AND LITIGATION MATTERS
As part of various investigations by a number of federal, state, and foreign regulators and governmental entities, including the Securities and Exchange Commission (“SEC”), relating to certain practices in the mutual fund industry, including late trading, market timing and marketing support payments to securities dealers who sell fund shares (“marketing support”), Franklin Resources, Inc. and certain of its subsidiaries (collectively, the “Company”), entered into settlements with certain of those regulators and governmental entities. Specifically, the Company entered into settlements with the SEC, among others, concerning market timing and marketing support.
On June 6, 2007, the SEC posted for public comment the proposed plan of distribution for the market timing settlement. Once the SEC approves the final plan of distribution, disbursements of settlement monies will be made promptly to individuals who were shareholders of the designated funds during the relevant period, in accordance with the terms and conditions of the settlement and plan.
In addition, the Company, as well as most of the mutual funds within Franklin Templeton Investments and certain current or former officers, Company directors, fund directors, and employees, have been named in private lawsuits (styled as shareholder class actions, or as derivative actions on behalf of either the named funds or Franklin Resources, Inc.). The lawsuits relate to the industry practices referenced above.
The Company and fund management believe that the claims made in each of the private lawsuits referenced above are without merit and intend to defend against them vigorously. The Company cannot predict with certainty the eventual outcome of these lawsuits, nor whether they will have a material negative impact on the Company. If it is determined that the Company bears responsibility for any unlawful or inappropriate conduct that caused losses to the Fund, it is committed to making the Trust or its shareholders whole, as appropriate.
11. NEW ACCOUNTING PRONOUNCEMENT
In September 2006, the Financial Accounting Standards Board (FASB) issued FASB Statement No. 157, “Fair Value Measurement” (SFAS 157), which defines fair value, establishes a framework for measuring fair value, and expands disclosures about fair value measurements. SFAS 157 is effective for fiscal years beginning after November 15, 2007, and interim periods within those fiscal years. The Trust believes the adoption of SFAS 157 will have no material impact on its financial statements.
TF-23
Franklin Templeton Variable Insurance Products Trust
Templeton Foreign Securities Fund
Report of Independent Registered Public Accounting Firm
To the Board of Trustees and Shareholders of
Franklin Templeton Variable Insurance Products Trust
In our opinion, the accompanying statement of assets and liabilities, including the statement of investments, and the related statements of operations and of changes in net assets and the financial highlights present fairly, in all material respects, the financial position of Templeton Foreign Securities Fund (one of the funds constituting Franklin Templeton Variable Insurance Products Trust, hereafter referred to as the “Fund”) at December 31, 2007, the results of its operations for the year then ended, the changes in its net assets for each of the two years in the period then ended and the financial highlights for each of the periods presented, in conformity with accounting principles generally accepted in the United States of America. These financial statements and financial highlights (hereafter referred to as “financial statements”) are the responsibility of the Fund’s management. Our responsibility is to express an opinion on these financial statements based on our audits. We conducted our audits of these financial statements in accordance with the standards of the Public Company Accounting Oversight Board (United States). Those standards require that we plan and perform the audit to obtain reasonable assurance about whether the financial statements are free of material misstatement. An audit includes examining, on a test basis, evidence supporting the amounts and disclosures in the financial statements, assessing the accounting principles used and significant estimates made by management, and evaluating the overall financial statement presentation. We believe that our audits, which included confirmation of securities at December 31, 2007 by correspondence with the custodian, provide a reasonable basis for our opinion.
PricewaterhouseCoopers LLP
San Francisco, California
February 14, 2008
TF-24
Franklin Templeton Variable Insurance Products Trust
Tax Designation (unaudited)
Templeton Foreign Securities Fund
Under Section 852(b)(3)(C) of the Internal Revenue Code (Code), the Fund designates the maximum amount allowable but no less than $288,404,747 as a long term capital gain dividend for the fiscal year ended December 31, 2007.
At December 31, 2007, more than 50% of the Fund’s total assets were invested in securities of foreign issuers. In most instances, foreign taxes were withheld from income paid to the Fund on these investments. The Fund elects to treat foreign taxes paid as allowed under Section 853 of the Code. This election will allow shareholders of record as of the 2008 distribution date, to treat their proportionate share of foreign taxes paid by the Fund as having been paid directly by them. The shareholder shall consider these amounts as foreign taxes paid in the tax year in which they receive the Fund distribution.
TF-25
TEMPLETON GLOBAL ASSET ALLOCATION FUND
This annual report for Templeton Global Asset Allocation Fund covers the fiscal year ended December 31, 2007.
Performance Summary as of 12/31/07
Average annual total return of Class 1 shares* represents the average annual change in value, assuming reinvestment of dividends and capital gains. Average returns smooth out variations in returns, which can be significant; they are not the same as year-by-year results.
Periods ended 12/31/07
| | | | | | | | |
| | | | | 1-Year | | 5-Year | | 10-Year |
Average Annual Total Return | | | | +10.32% | | +16.36% | | +9.24% |
*Performance prior to the 5/1/00 merger reflects historical performance of Templeton Asset Allocation Fund. The manager and administrator have contractually agreed to waive or limit their respective fees so that total annual Fund operating expenses for Class 1 shares do not exceed 0.83% (other than (i) acquired fund fees and expenses and (ii) certain non-routine expenses) until 4/30/09. If the manager and administrator had not waived fees, the Fund’s total returns would have been lower.
Total Return Index Comparison
for Hypothetical $10,000 Investment (1/1/98–12/31/07)
The graph below shows the change in value of a hypothetical $10,000 investment in the Fund over the indicated period and includes reinvestment of any income or distributions. The Fund’s performance* is compared to the performance of the Morgan Stanley Capital International (MSCI) All Country (AC) World Index and the J.P. Morgan (JPM) Government Bond Index (GBI) Global. One cannot invest directly in an index, nor is an index representative of the Fund’s portfolio. Please see Important Notes to Performance Information preceding the Fund Summaries.
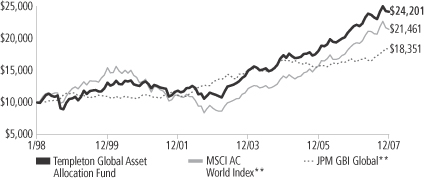
**Sources: Standard & Poor’s Micropal; J.P. Morgan. Please see Index Descriptions following the Fund Summaries.
Templeton Global Asset Allocation Fund – Class 1
Performance reflects the Fund’s Class 1 operating expenses, but does not include any contract fees, expenses or sales charges. If they had been included, performance would be lower. These charges and deductions, particularly for variable life policies, can have a significant effect on contract values and insurance benefits. See the contract prospectus for a complete description of these expenses, including sales charges.
Performance data represent past performance, which does not guarantee future results. Investment return and principal value will fluctuate, and you may have a gain or loss when you sell your shares.
Current performance may differ from figures shown.
TGA-1
Fund Goal and Main Investments: Templeton Global Asset Allocation Fund seeks high total return. The Fund normally invests in equity securities of companies of any country, debt securities of companies and governments of any country, and in money market securities. The Fund normally invests substantially to primarily in equity securities.
Performance Overview
You can find the Fund’s one-year total return in the Performance Summary. The Fund underperformed its broad equity benchmark, the MSCI AC World Index, which returned +12.18% for the period under review, and underperformed its fixed income benchmark, the JPM GBI Global, which had a +10.81% total return for the same period.1
Economic and Market Overview
In spite of elevated energy prices and widespread fears of contagion from the deteriorating U.S. housing situation, the global economy remained resilient in 2007. Consumer and corporate demand strength, particularly in China and other developing economies, generally favorable employment and accommodative monetary policies continued to underpin the current expansionary period that began in 2002.
These factors also contributed to the strength of global equity markets during 2007. However, concerns about slower growth and declining asset quality surfaced in the first quarter. These were initially centered on the U.S. subprime mortgage market but spread in August to global capital markets. Difficulties in assessing risk and the value of collateral in the structured finance industry contributed to declining risk appetite among lenders and investors. The private equity industry, which relies on the availability of cheap credit, played a pivotal role in several large and high-profile acquisitions and helped boost merger and acquisition activity in the first half of the year. This was an important driver of equity performance, but as liquidity dried up in the second half of the year, significantly slower money flows from private equity weighed on market performance. However, global merger and acquisition activity still reached record levels. The staggering $4.5 trillion of deals announced in 2007 eclipsed the previous record from 2006 by 24%.2
1. Sources: Standard & Poor’s Micropal; J.P. Morgan. One cannot invest directly in an index, nor is an index representative of the Fund’s portfolio. Please see Index Descriptions following the Fund Summaries.
2. Source: “For Deal Makers, Tale of Two Halves,” The Wall Street Journal, 1/2/08.
Fund Risks: The Fund’s investments in stocks offer the potential for long-term gains but can be subject to short-term price fluctuations. Foreign investing, especially in emerging markets, involves additional risks, including currency fluctuations, economic instability, market volatility, and political and social instability. Because the Fund invests in bonds and other debt obligations, its share price and yield will be affected by interest rate movements. Bond prices generally move in the opposite direction of interest rates. Thus, as prices of bonds in the Fund adjust to a rise in interest rates, the Fund’s share price may decline. The Fund’s prospectus also includes a description of the main investment risks.
TGA-2
To alleviate the credit crunch and restore investor confidence, the world’s major central banks infused capital into the system, and the U.S. Federal Reserve Board reduced its target interest rate by a full percentage point. However, credit and equity markets continued to face headwinds as write-downs and losses from subprime mortgage financing affected many large financial institutions toward the end of the year, and equity prices remained volatile.
For the year, however, global and non-U.S. equity markets registered the fifth consecutive year of double-digit total returns, making this an exceptionally strong period for investors in global equities. Broad-based stock performance by European and Asian shares at least doubled that of U.S. stocks, while emerging market equity returns more than tripled those in developed markets. Led by the BRIC countries, Brazil, Russia, India and China, emerging market economies continued to grow at accelerated rates, supporting elevated prices for oil and other commodities. At the same time, investment inflows from developed economies continued to underpin equity prices in emerging markets. In addition, U.S. dollar weakness versus the currencies of many major trading partners enhanced equity returns for U.S.-based investors holding stocks denominated in these currencies.
China continued to lead the Asian region’s economic expansion, where the country’s surging domestic demand became an increasingly important growth source for other Asian economies through trade. Continued rapid expansion led to fears China’s economy was overheating as inflation picked up during the year. Thus, monetary authorities increased interest rates and even allowed the yuan to appreciate slightly. India encountered similar conditions, and Indian monetary authorities responded by increasing the target interest rate. However, this had little effect on slowing private investment growth. Japan’s economy continued to lag. Consequently, the Japanese central bank kept rates on hold for the second half of the year after raising them 25 basis points (one-quarter percentage point) earlier. Low growth levels and interest rates by international standards led to continued weakness in the yen until risk aversion rose at the end of the year, prompting carry trades to unwind.
European economic growth remained quite strong in 2007, although fears regarding the U.K.’s and eurozone’s future growth paths emerged following the credit crunch. Labor markets strengthened across the region and monetary conditions tightened. The European Central Bank raised rates 50 basis points during the period as growth was strong in
What is a carry trade?
Carry trade is a strategy in which an investor sells a certain currency with a relatively low interest rate and uses the funds to purchase a different currency yielding a higher interest rate. A trader using this strategy attempts to capture the difference between the rates, which can often be substantial, depending on the amount of leverage the investor chooses to use.
TGA-3
the first half of the year, particularly in Germany. Much of non-euro Europe enjoyed even stronger growth, although some economies were hurt as negative sentiment spread from the U.S. housing market across the Atlantic. In the U.K., housing market weakness combined with financial market troubles caused enough worries for the Bank of England to cut interest rates 25 basis points in December after just raising them in July.
Investment Strategy
Our investment philosophy is bottom-up, value-oriented and long-term. In choosing equity investments, we will focus on the market price of a company’s securities relative to our evaluation of the company’s potential long-term earnings, asset value and cash flow. Among factors we may consider are a company’s historical value measures, including price/earnings ratio, profit margins and liquidation value.
In choosing debt investments, we allocate our assets among issuers, geographic regions and currencies based upon our assessment of relative interest rates among currencies, our outlook for changes in interest rates among currencies, and credit risks. With respect to debt securities, we may also from time to time make use of forward currency exchange contracts (hedging instruments) to protect against currency risk.
Manager’s Discussion
Equity
The Fund’s performance relative to its equity benchmark index benefited from its overweighting in the industrials sector, which outperformed the index.3 The Fund’s best performing stocks in the sector included wind turbine manufacturers Gamesa (Spain) and Vestas Wind Systems (Denmark), as well as U.K. aerospace operators BAE Systems and Rolls-Royce Group, and German conglomerate Siemens.
The Fund’s overweighted exposure to the telecommunication services sector also aided relative performance.4 Top performers in the Fund included Telefonica (Spain), Singapore Telecommunications, France Telecom, Vodafone Group (U.K.), Telenor (Norway) and Telefonos de Mexico (sold by period-end).
3. The industrials sector comprises aerospace and defense, air freight and logistics, commercial services and supplies, electrical equipment, and industrial conglomerates in the SOI.
4. The telecommunication services sector comprises diversified telecommunication services and wireless telecommunication services in the SOI.
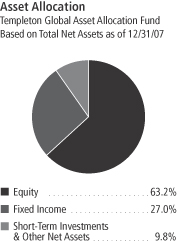
TGA-4
Additionally, our overweighted information technology sector exposure contributed to relative Fund results.5 Standout performers included Japanese software maker Nintendo, U.S. software companies Oracle and Microsoft, and Japanese industrial electronics company Hitachi.
It is important to recognize the effect of currency movements on the Fund’s performance. In general, if the value of the U.S. dollar goes up compared with a foreign currency, an investment traded in that foreign currency will go down in value because it will be worth fewer U.S. dollars. This can have a negative effect on Fund performance. Conversely, when the U.S. dollar weakens in relation to a foreign currency, an investment traded in that foreign currency will increase in value, which can contribute to Fund performance. For the 12 months ended December 31, 2007, the U.S. dollar declined in value relative to most non-U.S. currencies. As a result, the Fund’s performance (equity portion) was positively affected by the portfolio’s investment primarily in securities with non-U.S. currency exposure. However, one cannot expect the same result in future periods.
In contrast, performance relative to the equity benchmark was hurt by the Fund’s overweighted exposure to the consumer discretionary sector, which underperformed the index.6 The Fund’s stocks that lost value in this sector included U.S. retailers Chico’s FAS and Target as well as U.S. media companies Comcast, The DIRECTV Group and Time Warner.
Overweighted exposure to the lagging health care sector was also detrimental.7 Within this sector, the Fund suffered from weak U.S. holdings such as medical products company Boston Scientific, hospital operator Tenet Healthcare, pharmaceutical manufacturer Pfizer and biotechnology firm Amgen.
The Fund’s relative performance was also negatively impacted by its underweighting in the materials sector, which outperformed the equity index.8 Specifically, limited exposure to the outperforming metals and
5. The information technology sector comprises computers and peripherals, electronic equipment and instruments, semiconductors and semiconductor equipment, and software in the SOI.
6. The consumer discretionary sector comprises automobiles; hotels, restaurants and leisure; household durables; media; multiline retail; and specialty retail in the SOI.
7. The health care sector comprises biotechnology, health care equipment and supplies, health care providers and services, and pharmaceuticals in the SOI.
8. The materials sector comprises chemicals, metals and mining, and paper and forest products in the SOI.
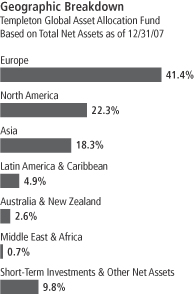
TGA-5
mining industry and holdings in Finnish paper companies Stora Enso and UPM-Kymmene hampered the Fund.
Fixed Income
Interest Rate Strategy
For most of the 12-month reporting period, the Fund maintained its overall short duration positioning seeking to take advantage of global interest rate tightening resulting from strong economic growth in most economies. However, we found some opportunities to take advantage of local interest rate reductions. For example, the Indonesian central bank reduced interest rates 175 basis points over the period, continuing its interest rate normalization process as inflation remained under control. Indonesia returned +11.07% in local currency terms over the period, as measured by the JPM GBI–Emerging Markets.9 Another positive local market was Brazil, where its central bank reduced interest rates 200 basis points during the period to 11.25%, which supported local bond market returns of +9.81% in local currency terms.9 The central bank held interest rates constant throughout the fourth quarter as the economy accelerated, inflation picked up, and the large monetary action’s impact began to be felt. As global growth concerns surfaced later in the year, the Fund selectively increased its interest rate exposure, which lengthened the portfolio’s duration.
Currency Strategy
Our currency strategy remained relatively unchanged over the period, predicated on our medium-term view on the gradual unwinding of global imbalances, which began during the period. These imbalances centered on strong U.S. consumption growth and, consequently, a large U.S. current account deficit, versus low domestic demand in most Asian countries and corresponding Asian current account surpluses. As a result, the Fund benefited from its significantly underweighted U.S. dollar exposure relative to the JPM GBI Global, as the dollar depreciated 10.00% against the U.S.’s major trading partners.10 The imbalance began unwinding as the U.S. trade deficit contracted toward year-end because of U.S. exports’ improved competitiveness due to a weaker dollar. However, the deficit was still quite large on a historical basis. The U.S. dollar weakened further when the Federal Reserve Board cut interest rates during the period, well ahead of other central banks, as the credit crunch affected the U.S. economy more than other countries.
9. Source: J.P. Morgan. Please see Index Descriptions following the Fund Summaries.
10. Source: Federal Reserve H10 Report.
What is a current account?
A current account is that part of the balance of payments where all of one country’s international transactions in goods and services are recorded.
What is balance of payments?
Balance of payments is a record of all of a country’s exports and imports of goods and services, borrowing and lending with the rest of the world during a particular time period. It helps a country evaluate its competitive strengths and weaknesses and forecast the strength of its currency.
What is duration?
Duration is a measure of a bond’s price sensitivity to interest rate changes. In general, a portfolio of securities with a lower duration can be expected to be less sensitive to interest rate changes than a portfolio with a higher duration.
TGA-6
One currency that appreciated strongly against the U.S. dollar was the Canadian dollar, which rose 17.91% against the U.S. dollar during the period and contributed to relative performance because of the Fund’s overweighted exposure.11 The Canadian dollar benefited from high prices for many of the country’s natural resource exports and a strong domestic economy. Toward period-end, the weak U.S. economy began to negatively impact Canada’s growth prospects and led us to reduce the Fund’s Canadian dollar allocation prior to the Canadian dollar’s poor performance during the last quarter of 2007. The Fund’s overweighted exposure to the Brazilian real boosted the Fund’s relative performance even more as the currency appreciated 19.94% against the U.S. dollar during the year.11, 12 The real benefited from very strong inflows from trade and investment.
European currencies also appreciated against the U.S. dollar over the period. The Fund had limited direct exposure to the euro, and was instead positioned to capture the benefit of euro appreciation through exposure to non-euro European currencies that are closely linked to the euro region. The euro appreciated 10.87% versus the U.S. dollar during the period as growth remained strong and the interest rate differential with the U.S. shrank significantly.11 Although our limited exposure to the euro’s strong return hurt relative performance, the Fund benefited from its overweighted exposures to the Polish zloty and Norwegian krone.12 Similar to the Scandinavian economies, the Polish economy also exhibited tightening labor market conditions given strong GDP growth of more than 6% in the third quarter of 2007 compared with the same period in 2006.13 Strong economic growth created jobs at the same time that there was significant emigration from Poland. Prospects for wage pressures prompted the central bank to raise interest rates during the period, supporting currency performance. The Swedish krona detracted from relative performance as it appreciated only 5.88% against the U.S. dollar over the period.11 The Fund’s biggest allocation change during the period was the addition of the Swiss franc, which appreciated 3.18% during the fourth quarter benefiting from increased risk aversion.11
Asian currency performance was mixed during the year. The currency that comprised the largest portion of the Fund was the Japanese yen, though our exposure was still substantially below the benchmark’s. The yen, which appreciated 6.66% against the U.S. dollar over the period,
11. Source: Exshare (via Compustat via FactSet).
12. These countries are not components of the JPM GBI Global.
13. Source: National Bank of Poland.
Top 5 Country Holdings
Templeton Global Asset Allocation Fund 12/31/07
| | |
| | | % of Total
Net Assets |
| |
| U.S. | | 19.0% |
| |
| U.K. | | 12.3% |
| |
| Germany | | 5.9% |
| |
| South Korea | | 5.5% |
| |
| France | | 4.3% |
Top 5 Sectors/Industries
Templeton Global Asset Allocation Fund Based on Equity Securities 12/31/07
| | |
| | | % of Total
Net Assets |
| |
| Media | | 6.6% |
| |
| Diversified Telecommunication Services | | 5.9% |
| |
| Pharmaceuticals | | 5.6% |
| |
| Oil, Gas & Consumable Fuels | | 5.0% |
| |
| Insurance | | 4.0% |
The dollar value, number of shares or principal amount, and names of all portfolio holdings are listed in the Fund’s Statement of Investments (SOI).
TGA-7
lagged other major currencies until risk aversion increased in the second half of the year leading to the unwinding of carry trades.11 Among other Asian currencies, the Malaysian ringgit appreciated 6.68% against the U.S. dollar, the South Korean won depreciated 0.65%, and the Indonesian rupiah depreciated 4.25%.11 Our overweighted allocations in these currencies hurt the Fund’s relative performance.12
Global Sovereign Debt Strategy
The Fund purchased investment-grade and subinvestment-grade sovereign debt that typically compensates for greater credit risk by offering higher yields relative to U.S. and European benchmark Treasury securities. Tighter credit conditions resulted in wider sovereign credit spreads despite improving fundamentals in most economies. Sovereign interest rate credit spreads increased from 171 basis points at the beginning of the reporting period to 255 basis points by period-end. However, declining U.S. interest rates benefited the performance of these dollar-denominated bonds. Largely as a result, U.S. dollar-denominated emerging market debt returned +6.28% over the period, as measured by the JPM Emerging Markets Bond Index (EMBI) Global.9 Regionally, Latin American sovereign debt returned +5.15%, Asian +6.14%, and central and eastern European +7.91%.9 Euro-denominated markets underperformed the index, returning 1.22% in euro terms, as measured by the JPM Euro EMBI Global.9 The Fund maintained limited exposure to sovereign debt during the period.
Thank you for your participation in Templeton Global Asset Allocation Fund. We look forward to serving your future investment needs.
The foregoing information reflects our analysis, opinions and portfolio holdings as of December 31, 2007, the end of the reporting period. The way we implement our main investment strategies and the resulting portfolio holdings may change depending on factors such as market and economic conditions. These opinions may not be relied upon as investment advice or an offer for a particular security. The information is not a complete analysis of every aspect of any market, country, industry, security or the Fund. Statements of fact are from sources considered reliable, but the investment manager makes no representation or warranty as to their completeness or accuracy. Although historical performance is no guarantee of future results, these insights may help you understand our investment management philosophy.
TGA-8
Fund Expenses
As an investor in a variable insurance contract (Contract) that indirectly provides for investment in an underlying mutual fund, you can incur transaction and/or ongoing expenses at both the Fund level and the Contract level.
| • | | Transaction expenses can include sales charges (loads) on purchases, redemption fees, surrender fees, transfer fees and premium taxes. |
| • | | Ongoing expenses can include management fees, distribution and service (12b-1) fees, contract fees, annual maintenance fees, mortality and expense risk fees and other fees and expenses. All mutual funds and Contracts have some types of ongoing expenses. |
The expenses shown in the table are meant to highlight ongoing expenses at the Fund level only and do not include ongoing expenses at the Contract level, or transaction expenses at either the Fund or Contract level. While the Fund does not have transaction expenses, if the transaction and ongoing expenses at the Contract level were included, the expenses shown below would be higher. You should consult your Contract prospectus or disclosure document for more information.
The table shows Fund-level ongoing expenses and can help you understand these expenses and compare them with those of other mutual funds offered through the Contract. The table assumes a $1,000 investment held for the six months indicated. Please refer to the Fund prospectus for additional information on operating expenses.
Actual Fund Expenses
The first line (Actual) of the table provides actual account values and expenses. The “Ending Account Value” is derived from the Fund’s actual return, which includes the effect of ongoing Fund expenses, but does not include the effect of ongoing Contract expenses.
You can estimate the Fund-level expenses you incurred during the period by following these steps. Of course, your account value and expenses will differ from those in this illustration:
| 1. | Divide your account value by $1,000. |
If an account had an $8,600 value, then $8,600 ÷ $1,000 = 8.6.
| 2. | Multiply the result by the number under the heading “Fund-Level Expenses Incurred During Period.” |
If Fund-Level Expenses Incurred During Period were $7.50, then 8.6 x $7.50 = $64.50.
In this illustration, the estimated expenses incurred this period at the Fund level are $64.50.
Templeton Global Asset Allocation Fund – Class 1
TGA-9
Hypothetical Example for Comparison with Other Mutual Funds
Information in the second line (Hypothetical) of the table can help you compare ongoing expenses of the Fund with those of other mutual funds offered through the Contract. This information may not be used to estimate the actual ending account balance or expenses you incurred during the period. The hypothetical “Ending Account Value” is based on the Fund’s actual expense ratio and an assumed 5% annual rate of return before expenses, which does not represent the Fund’s actual return. The figure under the heading “Fund-Level Expenses Incurred During Period” shows the hypothetical expenses your account would have incurred under this scenario. You can compare this figure with the 5% hypothetical examples that appear in shareholder reports of other funds offered through a Contract.
| | | | | | | | | |
| Class 1 | | Beginning
Account Value 7/1/07 | | Ending Account Value 12/31/07 | | Fund-Level
Expenses Incurred
During Period*
7/1/07–12/31/07 |
Actual | | $ | 1,000 | | $ | 1,022.20 | | $ | 4.28 |
Hypothetical (5% return before expenses) | | $ | 1,000 | | $ | 1,020.97 | | $ | 4.28 |
*Expenses are calculated using the most recent six-month annualized expense ratio, net of expense waiver, for the Fund’s Class 1 shares (0.84%), which does not include any ongoing expenses of the Contract for which the Fund is an investment option, multiplied by the average account value over the period, multiplied by 184/365 to reflect the one-half year period.
TGA-10
Franklin Templeton Variable Insurance Products Trust
Financial Highlights
Templeton Global Asset Allocation Fund
| | | | | | | | | | | | | | | | | | | | |
| | | Year Ended December 31, | |
| Class 1 | | 2007 | | | 2006 | | | 2005 | | | 2004 | | | 2003 | |
| | | | |
Per share operating performance | | | | | | | | | | | | | | | | | | | | |
(for a share outstanding throughout the year) | | | | | | | | | | | | | | | | | | | | |
Net asset value, beginning of year | | $ | 21.96 | | | $ | 21.06 | | | $ | 21.11 | | | $ | 18.78 | | | $ | 14.59 | |
| | | | |
Income from investment operationsa: | | | | | | | | | | | | | | | | | | | | |
Net investment incomeb | | | 0.53 | | | | 0.64 | | | | 0.49 | | | | 0.48 | | | | 0.41 | |
Net realized and unrealized gains (losses) | | | 1.58 | | | | 3.36 | | | | 0.28 | | | | 2.42 | | | | 4.23 | |
| | | | |
Total from investment operations | | | 2.11 | | | | 4.00 | | | | 0.77 | | | | 2.90 | | | | 4.64 | |
| | | | |
Less distributions from: | | | | | | | | | | | | | | | | | | | | |
Net investment income and net foreign currency gains | | | (4.06 | ) | | | (1.66 | ) | | | (0.82 | ) | | | (0.57 | ) | | | (0.45 | ) |
Net realized gains | | | (5.26 | ) | | | (1.44 | ) | | | — | | | | — | | | | — | |
| | | | |
Total distributions | | | (9.32 | ) | | | (3.10 | ) | | | (0.82 | ) | | | (0.57 | ) | | | (0.45 | ) |
| | | | |
Net asset value, end of year | | $ | 14.75 | | | $ | 21.96 | | | $ | 21.06 | | | $ | 21.11 | | | $ | 18.78 | |
| | | | |
| | | | | |
Total returnc | | | 10.32% | | | | 21.39% | | | | 3.85% | | | | 15.94% | | | | 32.31% | |
Ratios to average net assets | | | | | | | | | | | | | | | | | | | | |
Expenses before waiver and payments by affiliates | | | 0.88% | | | | 0.84% | | | | 0.85% | | | | 0.84% | | | | 0.81% | |
Expenses net of waiver and payments by affiliates | | | 0.85% | d | | | 0.84% | d | | | 0.85% | d | | | 0.84% | d | | | 0.81% | |
Net investment income | | | 2.77% | | | | 2.91% | | | | 2.36% | | | | 2.52% | | | | 2.54% | |
| | | | | |
Supplemental data | | | | | | | | | | | | | | | | | | | | |
Net assets, end of year (000’s) | | $ | 63,316 | | | $ | 276,790 | | | $ | 638,006 | | | $ | 625,728 | | | $ | 572,798 | |
Portfolio turnover rate | | | 30.08% | e | | | 23.74% | e | | | 26.23% | | | | 27.43% | | | | 34.25% | |
aThe amount shown for a share outstanding throughout the period may not correlate with the Statement of Operations for the period due to the timing of sales and repurchases of the Fund shares in relation to income earned and/or fluctuating market value of the investments of the Fund.
bBased on average daily shares outstanding.
cTotal return does not include any fees, charges or expenses imposed by the variable annuity and life insurance contracts for which the Franklin Templeton Variable Insurance Products Trust serves as an underlying investment vehicle.
dBenefit of expense reduction rounds to less than 0.01%.
eExcludes the value of portfolio securities delivered as a result of a redemption in-kind. See Note 10.
The accompanying notes are an integral part of these financial statements.
TGA-11
Franklin Templeton Variable Insurance Products Trust
Financial Highlights (continued)
Templeton Global Asset Allocation Fund
| | | | | | | | | | | | | | | | | | | | |
| | | Year Ended December 31, | |
| Class 2 | | 2007 | | | 2006 | | | 2005 | | | 2004 | | | 2003 | |
| | | | |
Per share operating performance | | | | | | | | | | | | | | | | | | | | |
(for a share outstanding throughout the year) | | | | | | | | | | | | | | | | | | | | |
Net asset value, beginning of year | | $ | 21.75 | | | $ | 20.88 | | | $ | 20.94 | | | $ | 18.64 | | | $ | 14.49 | |
| | | | |
Income from investment operationsa: | | | | | | | | | | | | | | | | | | | | |
Net investment incomeb | | | 0.46 | | | | 0.52 | | | | 0.43 | | | | 0.43 | | | | 0.36 | |
Net realized and unrealized gains (losses) | | | 1.58 | | | | 3.40 | | | | 0.29 | | | | 2.41 | | | | 4.20 | |
| | | | |
Total from investment operations | | | 2.04 | | | | 3.92 | | | | 0.72 | | | | 2.84 | | | | 4.56 | |
| | | | |
Less distributions from: | | | | | | | | | | | | | | | | | | | | |
Net investment income and net foreign currency gains | | | (4.01 | ) | | | (1.61 | ) | | | (0.78 | ) | | | (0.54 | ) | | | (0.41 | ) |
Net realized gains | | | (5.26 | ) | | | (1.44 | ) | | | — | | | | — | | | | — | |
| | | | |
Total distributions | | | (9.27 | ) | | | (3.05 | ) | | | (0.78 | ) | | | (0.54 | ) | | | (0.41 | ) |
| | | | |
Net asset value, end of year | | $ | 14.52 | | | $ | 21.75 | | | $ | 20.88 | | | $ | 20.94 | | | $ | 18.64 | |
| | | | |
| | | | | |
Total returnc | | | 10.01% | | | | 21.11% | | | | 3.55% | | | | 15.72% | | | | 31.95% | |
Ratios to average net assets | | | | | | | | | | | | | | | | | | | | |
Expenses before waiver and payments by affiliates | | | 1.13% | | | | 1.09% | | | | 1.10% | | | | 1.09% | | | | 1.06% | |
Expenses net of waiver and payments by affiliates | | | 1.10% | d | | | 1.09% | d | | | 1.10% | d | | | 1.09% | d | | | 1.06% | |
Net investment income | | | 2.52% | | | | 2.66% | | | | 2.11% | | | | 2.27% | | | | 2.29% | |
| | | | | |
Supplemental data | | | | | | | | | | | | | | | | | | | | |
Net assets, end of year (000’s) | | $ | 78,613 | | | $ | 78,021 | | | $ | 68,385 | | | $ | 65,806 | | | $ | 55,754 | |
Portfolio turnover rate | | | 30.08% | e | | | 23.74% | e | | | 26.23% | | | | 27.43% | | | | 34.25% | |
aThe amount shown for a share outstanding throughout the period may not correlate with the Statement of Operations for the period due to the timing of sales and repurchases of the Fund shares in relation to income earned and/or fluctuating market value of the investments of the Fund.
bBased on average daily shares outstanding.
cTotal return does not include any fees, charges or expenses imposed by the variable annuity and life insurance contracts for which the Franklin Templeton Variable Insurance Products Trust serves as an underlying investment vehicle.
dBenefit of expense reduction rounds to less than 0.01%.
eExcludes the value of portfolio securities delivered as a result of a redemption in-kind. See Note 10.
The accompanying notes are an integral part of these financial statements.
TGA-12
Franklin Templeton Variable Insurance Products Trust
Statement of Investments, December 31, 2007
| | | | | | | |
| Templeton Global Asset Allocation Fund | | Country | | Shares/
Warrants | | Value |
Long Term Investments 90.2% | | | | | | | |
Common Stocks and Warrants 62.5% | | | | | | | |
Aerospace & Defense 1.4% | | | | | | | |
BAE Systems PLC | | United Kingdom | | 117,072 | | $ | 1,158,429 |
aRaytheon Co., wts., 6/16/11 | | United States | | 63 | | | 1,588 |
aRolls-Royce Group PLC | | United Kingdom | | 81,424 | | | 883,348 |
aRolls-Royce Group PLC, B | | United Kingdom | | 3,289,529 | | | 7,190 |
| | | | | | | |
| | | | | | | 2,050,555 |
| | | | | | | |
Air Freight & Logistics 1.5% | | | | | | | |
Deutsche Post AG | | Germany | | 44,767 | | | 1,522,859 |
United Parcel Service Inc., B | | United States | | 9,570 | | | 676,790 |
| | | | | | | |
| | | | | | | 2,199,649 |
| | | | | | | |
Automobiles 0.7% | | | | | | | |
Bayerische Motoren Werke AG | | Germany | | 17,098 | | | 1,066,197 |
| | | | | | | |
Biotechnology 0.7% | | | | | | | |
aAmgen Inc. | | United States | | 20,510 | | | 952,484 |
| | | | | | | |
Capital Markets 1.0% | | | | | | | |
Invesco Ltd. | | Bermuda | | 38,489 | | | 1,207,769 |
Morgan Stanley | | United States | | 5,420 | | | 287,856 |
Nomura Holdings Inc. | | Japan | | 6 | | | 102 |
| | | | | | | |
| | | | | | | 1,495,727 |
| | | | | | | |
Chemicals 0.6% | | | | | | | |
The Dow Chemical Co. | | United States | | 20,486 | | | 807,558 |
| | | | | | | |
Commercial Banks 3.2% | | | | | | | |
DBS Group Holdings Ltd. | | Singapore | | 59,486 | | | 854,251 |
HSBC Holdings PLC | | United Kingdom | | 77,523 | | | 1,309,265 |
Intesa Sanpaolo SpA | | Italy | | 111,770 | | | 882,434 |
Kookmin Bank, ADR | | South Korea | | 10,329 | | | 757,322 |
Mitsubishi UFJ Financial Group Inc. | | Japan | | 36,000 | | | 337,999 |
Sumitomo Mitsui Financial Group Inc. | | Japan | | 48 | | | 360,275 |
| | | | | | | |
| | | | | | | 4,501,546 |
| | | | | | | |
Commercial Services & Supplies 0.9% | | | | | | | |
G4S PLC | | United Kingdom | | 264,658 | | | 1,287,048 |
| | | | | | | |
Computers & Peripherals 1.7% | | | | | | | |
aLexmark International Inc., A | | United States | | 11,370 | | | 396,358 |
Lite-On Technology Corp. | | Taiwan | | 421,822 | | | 736,205 |
Seagate Technology | | United States | | 50,128 | | | 1,278,264 |
| | | | | | | |
| | | | | | | 2,410,827 |
| | | | | | | |
Consumer Finance 0.5% | | | | | | | |
Aiful Corp. | | Japan | | 16,449 | | | 294,419 |
Discover Financial Services | | United States | | 2,710 | | | 40,867 |
Promise Co. Ltd. | | Japan | | 14,250 | | | 355,244 |
| | | | | | | |
| | | | | | | 690,530 |
| | | | | | | |
Diversified Financial Services 1.6% | | | | | | | |
ING Groep NV | | Netherlands | | 36,961 | | | 1,442,869 |
JPMorgan Chase & Co. | | United States | | 19,993 | | | 872,695 |
| | | | | | | |
| | | | | | | 2,315,564 |
| | | | | | | |
TGA-13
Franklin Templeton Variable Insurance Products Trust
Statement of Investments, December 31, 2007 (continued)
| | | | | | | |
| Templeton Global Asset Allocation Fund | | Country | | Shares/
Warrants | | Value |
Long Term Investments (continued) | | | | | | | |
Common Stocks and Warrants (continued) | | | | | | | |
Diversified Telecommunication Services 5.9% | | | | | | | |
Chunghwa Telecom Co. Ltd., ADR | | Taiwan | | 25,260 | | $ | 533,239 |
France Telecom SA, ADR | | France | | 47,413 | | | 1,689,325 |
Singapore Telecommunications Ltd. | | Singapore | | 721,525 | | | 2,002,220 |
Telefonica SA, ADR | | Spain | | 17,573 | | | 1,714,949 |
Telekom Austria AG, ADR | | Austria | | 12,980 | | | 720,714 |
Telenor ASA | | Norway | | 74,594 | | | 1,780,950 |
| | | | | | | |
| | | | | | | 8,441,397 |
| | | | | | | |
Electric Utilities 0.9% | | | | | | | |
E.ON AG | | Germany | | 5,710 | | | 1,213,352 |
| | | | | | | |
Electrical Equipment 1.0% | | | | | | | |
Gamesa Corp. Tecnologica SA | | Spain | | 11,275 | | | 526,205 |
aVestas Wind Systems AS | | Denmark | | 7,702 | | | 832,078 |
| | | | | | | |
| | | | | | | 1,358,283 |
| | | | | | | |
Electronic Equipment & Instruments 1.7% | | | | | | | |
FUJIFILM Holdings Corp. | | Japan | | 15,011 | | | 636,704 |
Hitachi Ltd. | | Japan | | 118,330 | | | 883,914 |
Tyco Electronics Ltd. | | United States | | 8,326 | | | 309,144 |
Venture Corp. Ltd. | | Singapore | | 60,159 | | | 534,209 |
| | | | | | | |
| | | | | | | 2,363,971 |
| | | | | | | |
Food Products 0.8% | | | | | | | |
Unilever PLC | | United Kingdom | | 30,710 | | | 1,153,264 |
| | | | | | | |
Health Care Equipment & Supplies 0.7% | | | | | | | |
aBoston Scientific Corp. | | United States | | 56,897 | | | 661,712 |
Covidien Ltd. | | United States | | 8,326 | | | 368,759 |
| | | | | | | |
| | | | | | | 1,030,471 |
| | | | | | | |
Health Care Providers & Services 1.0% | | | | | | | |
Quest Diagnostics Inc. | | United States | | 17,660 | | | 934,214 |
aTenet Healthcare Corp. | | United States | | 103,385 | | | 525,196 |
| | | | | | | |
| | | | | | | 1,459,410 |
| | | | | | | |
Hotels, Restaurants & Leisure 1.0% | | | | | | | |
Compass Group PLC | | United Kingdom | | 226,518 | | | 1,388,497 |
| | | | | | | |
Household Durables 0.5% | | | | | | | |
Sony Corp., ADR | | Japan | | 11,955 | | | 649,157 |
| | | | | | | |
Industrial Conglomerates 3.2% | | | | | | | |
General Electric Co. | | United States | | 23,450 | | | 869,291 |
Koninklijke Philips Electronics NV | | Netherlands | | 31,730 | | | 1,366,929 |
Siemens AG, ADR | | Germany | | 12,220 | | | 1,922,939 |
Tyco International Ltd. | | United States | | 8,326 | | | 330,126 |
| | | | | | | |
| | | | | | | 4,489,285 |
| | | | | | | |
Insurance 4.0% | | | | | | | |
ACE Ltd. | | Bermuda | | 17,838 | | | 1,102,032 |
American International Group Inc. | | United States | | 14,068 | | | 820,164 |
Aviva PLC | | United Kingdom | | 55,739 | | | 745,352 |
AXA SA | | France | | 36,961 | | | 1,477,390 |
TGA-14
Franklin Templeton Variable Insurance Products Trust
Statement of Investments, December 31, 2007 (continued)
| | | | | | | |
| Templeton Global Asset Allocation Fund | | Country | | Shares/
Warrants | | Value |
Long Term Investments (continued) | | | | | | | |
Common Stocks and Warrants (continued) | | | | | | | |
Insurance (continued) | | | | | | | |
Old Mutual PLC | | United Kingdom | | 259,095 | | $ | 862,820 |
Torchmark Corp. | | United States | | 10,120 | | | 612,563 |
| | | | | | | |
| | | | | | | 5,620,321 |
| | | | | | | |
Media 6.6% | | | | | | | |
British Sky Broadcasting Group PLC | | United Kingdom | | 68,871 | | | 847,060 |
aComcast Corp., A | | United States | | 53,133 | | | 962,770 |
aThe DIRECTV Group Inc. | | United States | | 38,637 | | | 893,287 |
Mediaset SpA | | Italy | | 67,250 | | | 677,666 |
News Corp., A | | United States | | 64,570 | | | 1,323,039 |
Pearson PLC | | United Kingdom | | 63,912 | | | 929,566 |
Reed Elsevier NV | | Netherlands | | 43,836 | | | 873,219 |
Time Warner Inc. | | United States | | 60,448 | | | 997,996 |
aViacom Inc., B | | United States | | 28,204 | | | 1,238,720 |
Vivendi SA | | France | | 14,980 | | | 686,000 |
| | | | | | | |
| | | | | | | 9,429,323 |
| | | | | | | |
Multi-Utilities & Unregulated Power 0.4% | | | | | | | |
Centrica PLC | | United Kingdom | | 84,222 | | | 600,350 |
| | | | | | | |
Multiline Retail 0.7% | | | | | | | |
Target Corp. | | United States | | 18,767 | | | 938,350 |
| | | | | | | |
Oil, Gas & Consumable Fuels 5.0% | | | | | | | |
BP PLC | | United Kingdom | | 121,707 | | | 1,487,228 |
El Paso Corp. | | United States | | 90,472 | | | 1,559,737 |
Eni SpA | | Italy | | 39,292 | | | 1,436,386 |
Royal Dutch Shell PLC, B | | United Kingdom | | 38,104 | | | 1,582,355 |
Total SA, B | | France | | 12,240 | | | 1,015,123 |
| | | | | | | |
| | | | | | | 7,080,829 |
| | | | | | | |
Paper & Forest Products 1.4% | | | | | | | |
Stora Enso OYJ, R | | Finland | | 60,927 | | | 910,477 |
UPM-Kymmene OYJ | | Finland | | 52,175 | | | 1,052,277 |
| | | | | | | |
| | | | | | | 1,962,754 |
| | | | | | | |
Pharmaceuticals 5.6% | | | | | | | |
Abbott Laboratories | | United States | | 15,877 | | | 891,493 |
Bristol-Myers Squibb Co. | | United States | | 23,584 | | | 625,448 |
GlaxoSmithKline PLC | | United Kingdom | | 50,997 | | | 1,295,991 |
Novartis AG | | Switzerland | | 11,760 | | | 644,455 |
Pfizer Inc. | | United States | | 60,304 | | | 1,370,710 |
Sanofi-Aventis | | France | | 13,311 | | | 1,223,412 |
Takeda Pharmaceutical Co. Ltd. | | Japan | | 14,786 | | | 871,130 |
aWatson Pharmaceuticals Inc. | | United States | | 40,492 | | | 1,098,953 |
| | | | | | | |
| | | | | | | 8,021,592 |
| | | | | | | |
Real Estate Management & Development 1.0% | | | | | | | |
Cheung Kong (Holdings) Ltd. | | Hong Kong | | 75,748 | | | 1,400,708 |
| | | | | | | |
Semiconductors & Semiconductor Equipment 1.3% | | | | | | | |
aInfineon Technologies AG, ADR | | Germany | | 51,804 | | | 602,998 |
Samsung Electronics Co. Ltd. | | South Korea | | 2,200 | | | 1,306,768 |
| | | | | | | |
| | | | | | | 1,909,766 |
| | | | | | | |
TGA-15
Franklin Templeton Variable Insurance Products Trust
Statement of Investments, December 31, 2007 (continued)
| | | | | | | | |
| Templeton Global Asset Allocation Fund | | Country | | Shares/
Warrants | | | Value |
Long Term Investments (continued) | | | | | | | | |
Common Stocks and Warrants (continued) | | | | | | | | |
Software 3.9% | | | | | | | | |
aCheck Point Software Technologies Ltd. | | Israel | | 37,146 | | | $ | 815,726 |
Microsoft Corp. | | United States | | 39,012 | | | | 1,388,827 |
Nintendo Co. Ltd. | | Japan | | 2,341 | | | | 1,404,411 |
aOracle Corp. | | United States | | 82,887 | | | | 1,871,589 |
| | | | | | | | |
| | | | | | | | 5,480,553 |
| | | | | | | | |
Specialty Retail 0.8% | | | | | | | | |
aChico’s FAS Inc. | | United States | | 36,461 | | | | 329,243 |
The Gap Inc. | | United States | | 36,569 | | | | 778,188 |
| | | | | | | | |
| | | | | | | | 1,107,431 |
| | | | | | | | |
Wireless Telecommunication Services 1.3% | | | | | | | | |
Vodafone Group PLC, ADR | | United Kingdom | | 50,593 | | | | 1,888,130 |
| | | | | | | | |
Total Common Stocks and Warrants (Cost $63,418,544) | | | | | | | | 88,764,879 |
| | | | | | | | |
Preferred Stock (Cost $73,607) 0.7% | | | | | | | | |
Metals & Mining 0.7% | | | | | | | | |
Companhia Vale do Rio Doce, ADR, pfd., A | | Brazil | | 33,728 | | | | 943,709 |
| | | | | | | | |
| | | |
| | | | | Principal
Amountb | | | |
Foreign Government and Agency Securities 27.0% | | | | | | | | |
c,dGovernment of Argentina, FRN, 5.389%, 8/03/12 | | Argentina | | 1,334,000 | | | | 725,359 |
Government of Canada, | | | | | | | | |
6.00%, 6/01/08 | | Canada | | 389,000 | CAD | | | 394,610 |
4.25%, 12/01/08 | | Canada | | 690,000 | CAD | | | 696,592 |
6.00%, 6/01/11 | | Canada | | 1,202,000 | CAD | | | 1,292,369 |
Government of Indonesia, | | | | | | | | |
11.00%, 11/15/20 | | Indonesia | | 12,000,000,000 | IDR | | | 1,329,385 |
11.00%, 9/15/25 | | Indonesia | | 9,900,000,000 | IDR | | | 1,078,514 |
12.00%, 9/15/26 | | Indonesia | | 8,540,000,000 | IDR | | | 1,022,890 |
eGovernment of Iraq, 144A, 5.80%, 1/15/28 | | Iraq | | 239,000 | | | | 158,935 |
Government of Malaysia, | | | | | | | | |
6.45%, 7/01/08 | | Malaysia | | 5,885,000 | MYR | | | 1,805,444 |
3.756%, 4/28/11 | | Malaysia | | 980,000 | MYR | | | 297,988 |
Government of Mexico, 10.00%, 12/05/24 | | Mexico | | 133,000 | f MXN | | | 1,418,326 |
Government of New Zealand, 7.00%, 7/15/09 | | New Zealand | | 3,204,000 | NZD | | | 2,442,913 |
Government of Norway, 5.50%, 5/15/09 | | Norway | | 5,740,000 | NOK | | | 1,067,730 |
Government of Poland, | | | | | | | | |
6.00%, 5/24/09 | | Poland | | 9,900,000 | PLN | | | 3,997,725 |
5.75%, 9/23/22 | | Poland | | 4,075,000 | PLN | | | 1,640,134 |
Government of Singapore, | | | | | | | | |
1.50%, 4/01/08 | | Singapore | | 80,000 | SGD | | | 55,452 |
5.625%, 7/01/08 | | Singapore | | 777,000 | SGD | | | 548,869 |
4.375%, 1/15/09 | | Singapore | | 200,000 | SGD | | | 142,290 |
Government of Sweden, | | | | | | | | |
6.50%, 5/05/08 | | Sweden | | 7,170,000 | SEK | | | 1,116,849 |
5.00%, 1/28/09 | | Sweden | | 14,200,000 | SEK | | | 2,214,723 |
5.50%, 10/08/12 | | Sweden | | 8,620,000 | SEK | | | 1,406,445 |
gStrip, 9/17/08 | | Sweden | | 3,000,000 | SEK | | | 450,666 |
cKfW Bankengruppe, FRN, 0.658%, 8/08/11 | | Germany | | 235,000,000 | JPY | | | 2,108,461 |
TGA-16
Franklin Templeton Variable Insurance Products Trust
Statement of Investments, December 31, 2007 (continued)
| | | | | | | | |
| Templeton Global Asset Allocation Fund | | Country | | Principal
Amountb | | | Value |
Long Term Investments (continued) | | | | | | | | |
Foreign Government and Agency Securities (continued) | | | | | | | | |
Korea Treasury Bond, | | | | | | | | |
5.25%, 9/10/12 | | South Korea | | 1,840,000,000 | KRW | | $ | 1,924,579 |
5.50%, 9/10/17 | | South Korea | | 1,800,000,000 | KRW | | | 1,895,197 |
5.25%, 3/10/27 | | South Korea | | 1,895,000,000 | KRW | | | 1,931,911 |
New South Wales Treasury Corp., 8.00%, 3/01/08 | | Australia | | 985,000 | AUD | | | 864,216 |
Nota Do Tesouro Nacional, | | | | | | | | |
9.762%, 1/01/12 | | Brazil | | 3,450 | h BRL | | | 1,771,596 |
iIndex Linked, 6.00%, 5/15/15 | | Brazil | | 1,000 | h BRL | | | 869,536 |
iIndex Linked, 6.00%, 5/15/45 | | Brazil | | 1,430 | h BRL | | | 1,242,787 |
Queensland Treasury Corp., 6.00%, 7/14/09 | | Australia | | 540,000 | AUD | | | 465,971 |
| | | | | | | | |
Total Foreign Government and Agency Securities (Cost $33,486,261) | | | | | | | | 38,378,462 |
| | | | | | | | |
Total Long Term Investments (Cost $96,978,412) | | | | | | | | 128,087,050 |
| | | | | | | | |
Short Term Investments 6.6% | | | | | | | | |
Foreign Government and Agency Securities 4.6% | | | | | | | | |
gEgypt Treasury Bill, | | | | | | | | |
7/01/08 | | Egypt | | 1,150,000 | EGP | | | 201,425 |
8/05/08 | | Egypt | | 4,500,000 | EGP | | | 783,183 |
9/16/08 | | Egypt | | 1,700,000 | EGP | | | 293,622 |
9/30/08 | | Egypt | | 2,650,000 | EGP | | | 454,816 |
12/16/08 | | Egypt | | 25,000 | EGP | | | 4,228 |
Government of Malaysia, | | | | | | | | |
3.546%, 1/11/08 | | Malaysia | | 5,360,000 | MYR | | | 1,620,869 |
3.569%, 2/14/08 | | Malaysia | | 2,800,000 | MYR | | | 846,689 |
gGovernment of Sweden, Strip, 6/18/08 | | Sweden | | 3,000,000 | SEK | | | 455,273 |
gMalaysia Treasury Bill, | | | | | | | | |
2/28/08 | | Malaysia | | 5,220,000 | MYR | | | 1,570,023 |
4/03/08 | | Malaysia | | 100,000 | MYR | | | 29,962 |
4/10/08 | | Malaysia | | 95,000 | MYR | | | 28,445 |
5/08/08 | | Malaysia | | 40,000 | MYR | | | 11,943 |
5/15/08 | | Malaysia | | 285,000 | MYR | | | 85,038 |
6/17/08 | | Malaysia | | 130,000 | MYR | | | 38,667 |
gNorway Treasury Bill, | | | | | | | | |
6/18/08 | | Norway | | 100,000 | NOK | | | 17,987 |
9/17/08 | | Norway | | 430,000 | NOK | | | 76,387 |
| | | | | | | | |
Total Foreign Government and Agency Securities
(Cost $6,269,065) | | | | | | | | 6,518,557 |
| | | | | | | | |
Total Investments before Money Market Fund
(Cost $103,247,477) | | | | | | | | 134,605,607 |
| | | | | | | | |
| | | |
| | | | | Shares | | | |
Money Market Fund (Cost $2,779,999) 2.0% | | | | | | | | |
jFranklin Institutional Fiduciary Trust Money Market Portfolio, 4.58% | | United States | | 2,779,999 | | | | 2,779,999 |
| | | | | | | | |
Total Investments (Cost $106,027,476) 96.8% | | | | | | | | 137,385,606 |
Net Unrealized Gain on Forward Exchange Contracts 0.1% | | | | | | | | 65,918 |
Other Assets, less Liabilities 3.1% | | | | | | | | 4,477,176 |
| | | | | | | | |
Net Assets 100.0% | | | | | | | $ | 141,928,700 |
| | | | | | | | |
TGA-17
Franklin Templeton Variable Insurance Products Trust
Statement of Investments, December 31, 2007 (continued)
Currency Abbreviations
AUD - Australian Dollar
BRL - Brazilian Real
CAD - Canadian Dollar
EGP - Egyptian Pound
IDR - Indonesian Rupiah
JPY - Japanese Yen
KRW - South Korean Won
MXN - Mexican Peso
MYR - Malaysian Ringgit
NOK - Norwegian Krone
NZD - New Zealand Dollar
PLN - Polish Zloty
SEK - Swedish Krona
SGD - Singapore Dollar
Selected Portfolio Abbreviations
ADR - American Depository Receipt
FRN - Floating Rate Note
aNon-income producing for the twelve months ended December 31, 2007.
bThe principal amount is stated in U.S. dollars unless otherwise indicated.
cThe coupon rate shown represents the rate at period end.
dThe principal amount is stated in original face, and scheduled paydowns are reflected in the market price on ex-date.
eSecurity was purchased pursuant to Rule 144A under the Securities Act of 1933 and may be sold in transactions exempt from registration only to qualified institutional buyers or in a public offering registered under the Securities Act of 1933. This security has been deemed liquid under guidelines approved by the Trust’s Board of Trustees. At December 31, 2007, the value of this security was $158,935, representing 0.11% of net assets.
fPrincipal amount is stated in 100 Mexican Peso Units.
gThe security is traded on a discount basis with no stated coupon rate.
hPrincipal amount is stated in 1,000 Brazilian Real Units.
iRedemption price at maturity is adjusted for inflation. See Note 1(e).
jSee Note 7 regarding investments in the Franklin Institutional Fiduciary Trust Money Market Portfolio. The rate shown is the annualized seven-day yield at period end.
The accompanying notes are an integral part of these financial statements.
TGA-18
Franklin Templeton Variable Insurance Products Trust
Financial Statements
Statement of Assets and Liabilities
December 31, 2007
| | | |
| | | Templeton
Global Asset
Allocation Fund |
Assets: | | | |
Investments in securities: | | | |
Cost - Unaffiliated issuers | | $ | 103,247,477 |
Cost - Sweep Money Fund (Note 7) | | | 2,779,999 |
| | | |
Total cost of investments | | $ | 106,027,476 |
| | | |
Value - Unaffiliated issuers | | $ | 134,605,607 |
Value - Sweep Money Fund (Note 7) | | | 2,779,999 |
| | | |
Total value of investments | | | 137,385,606 |
Foreign currency, at value (cost $3,718,758) | | | 3,793,847 |
Receivables: | | | |
Capital shares sold | | | 30,467 |
Dividends and interest | | | 1,141,775 |
Unrealized gain on forward exchange contracts (Note 8) | | | 226,643 |
| | | |
Total assets | | | 142,578,338 |
| | | |
Liabilities: | | | |
Payables: | | | |
Capital shares redeemed | | | 320,334 |
Affiliates | | | 113,275 |
Reports to shareholders | | | 34,250 |
Unrealized loss on forward exchange contracts (Note 8) | | | 160,725 |
Accrued expenses and other liabilities | | | 21,054 |
| | | |
Total liabilities | | | 649,638 |
| | | |
Net assets, at value | | $ | 141,928,700 |
| | | |
Net assets consist of: | | | |
Paid-in capital | | $ | 82,594,462 |
Undistributed net investment income | | | 12,217,627 |
Net unrealized appreciation (depreciation) | | | 31,546,108 |
Accumulated net realized gain (loss) | | | 15,570,503 |
| | | |
Net assets, at value | | $ | 141,928,700 |
| | | |
Class 1: | | | |
Net assets, at value | | $ | 63,315,738 |
| | | |
Shares outstanding | | | 4,292,824 |
| | | |
Net asset value and maximum offering price per share | | $ | 14.75 |
| | | |
Class 2: | | | |
Net assets, at value | | $ | 78,612,962 |
| | | |
Shares outstanding | | | 5,412,792 |
| | | |
Net asset value and maximum offering price per share | | $ | 14.52 |
| | | |
The accompanying notes are an integral part of these financial statements.
TGA-19
Franklin Templeton Variable Insurance Products Trust
Financial Statements (continued)
Statement of Operations
for the year ended December 31, 2007
| | | | |
| | | Templeton
Global Asset
Allocation Fund | |
Investment income: | | | | |
Dividends: (net of foreign taxes of $240,366) | | | | |
Unaffiliated issuers | | $ | 3,729,943 | |
Sweep Money Fund (Note 7) | | | 272,177 | |
Interest (net of foreign taxes of $121,322) | | | 3,778,712 | |
| | | | |
Total investment income | | | 7,780,832 | |
| | | | |
Expenses: | | | | |
Management fees (Note 3a) | | | 1,347,712 | |
Administrative fees (Note 3b) | | | 315,415 | |
Distribution fees - Class 2 (Note 3c) | | | 199,699 | |
Unaffiliated transfer agent fees | | | 6,814 | |
Custodian fees (Note 4) | | | 119,942 | |
Reports to shareholders | | | 55,180 | |
Professional fees | | | 41,401 | |
Trustees’ fees and expenses | | | 1,085 | |
Other | | | 16,987 | |
| | | | |
Total expenses | | | 2,104,235 | |
Expense reductions (Note 4) | | | (4,929 | ) |
Expenses waived/paid by affiliates (Note 3e) | | | (82,157 | ) |
| | | | |
Net expenses | | | 2,017,149 | |
| | | | |
Net investment income | | | 5,763,683 | |
| | | | |
Realized and unrealized gains (losses): | | | | |
Net realized gain (loss) from: | | | | |
Investments (includes gains from a redemption in-kind of $51,446,118) (Note 10) | | | 67,870,166 | |
Foreign currency transactions | | | 7,114,102 | |
| | | | |
Net realized gain (loss) | | | 74,984,268 | |
| | | | |
Net change in unrealized appreciation (depreciation) on: | | | | |
Investments | | | (53,256,260 | ) |
Translation of assets and liabilities denominated in foreign currencies | | | 71,548 | |
| | | | |
Net change in unrealized appreciation (depreciation) | | | (53,184,712 | ) |
| | | | |
Net realized and unrealized gain (loss) | | | 21,799,556 | |
| | | | |
Net increase (decrease) in net assets resulting from operations | | $ | 27,563,239 | |
| | | | |
The accompanying notes are an integral part of these financial statements.
TGA-20
Franklin Templeton Variable Insurance Products Trust
Financial Statements (continued)
Statements of Changes in Net Assets
| | | | | | | | |
| | | Templeton Global Asset
Allocation Fund | |
| | | Year Ended December 31, | |
| | | 2007 | | | 2006 | |
| | | | |
Increase (decrease) in net assets: | | | | | | | | |
Operations: | | | | | | | | |
Net investment income | | $ | 5,763,683 | | | $ | 14,103,670 | |
Net realized gain (loss) from investments, foreign currency transactions and redemption in-kind | | | 74,984,268 | | | | 111,939,026 | |
Net change in unrealized appreciation (depreciation) on investments and translation of assets and liabilities denominated in foreign currencies | | | (53,184,712 | ) | | | (29,884,803 | ) |
| | | | |
Net increase (decrease) in net assets resulting from operations | | | 27,563,239 | | | | 96,157,893 | |
| | | | |
Distributions to shareholders from: | | | | | | | | |
Net investment income and net foreign currency gains: | | | | | | | | |
Class 1 | | | (11,357,897 | ) | | | (18,191,422 | ) |
Class 2 | | | (14,016,851 | ) | | | (5,009,742 | ) |
Net realized gains: | | | | | | | | |
Class 1 | | | (14,706,218 | ) | | | (15,734,572 | ) |
Class 2 | | | (18,379,776 | ) | | | (4,478,496 | ) |
| | | | |
Total distributions to shareholders | | | (58,460,742 | ) | | | (43,414,232 | ) |
| | | | |
Capital share transactions: (Note 2) | | | | | | | | |
Class 1 | | | (207,311,609 | ) | | | (409,674,691 | ) |
Class 2 | | | 25,326,890 | | | | 5,351,089 | |
| | | | |
Total capital share transactions | | | (181,984,719 | ) | | | (404,323,602 | ) |
| | | | |
Net increase (decrease) in net assets | | | (212,882,222 | ) | | | (351,579,941 | ) |
Net assets: | | | | | | | | |
Beginning of year | | | 354,810,922 | | | | 706,390,863 | |
| | | | |
End of year | | $ | 141,928,700 | | | $ | 354,810,922 | |
| | | | |
Undistributed net investment income included in net assets: | | | | | | | | |
End of year | | $ | 12,217,627 | | | $ | 23,255,087 | |
| | | | |
The accompanying notes are an integral part of these financial statements.
TGA-21
Franklin Templeton Variable Insurance Products Trust
Notes to Financial Statements (continued)
Templeton Global Asset Allocation Fund
1. ORGANIZATION AND SIGNIFICANT ACCOUNTING POLICIES
Franklin Templeton Variable Insurance Products Trust (Trust) is registered under the Investment Company Act of 1940, as amended, (1940 Act) as an open-end investment company, consisting of twenty-three separate funds. The Templeton Global Asset Allocation Fund (Fund) included in this report is diversified. The financial statements of the remaining funds in the Trust are presented separately. Shares of the Fund are sold only to insurance company separate accounts to fund the benefits of variable life insurance policies or variable annuity contracts. The Fund offers two classes of shares: Class 1 and Class 2. Each class of shares differs by its distribution fees, voting rights on matters affecting a single class and its exchange privilege.
The following summarizes the Fund’s significant accounting policies.
a. Security Valuation
Securities listed on a securities exchange or on the NASDAQ National Market System are valued at the last quoted sale price or the official closing price of the day, respectively. Over-the-counter securities and listed securities for which there is no reported sale are valued within the range of the most recent quoted bid and ask prices. Securities that trade in multiple markets or on multiple exchanges are valued according to the broadest and most representative market. Investments in open-end mutual funds are valued at the closing net asset value.
Government securities generally trade in the over-the-counter market rather than on a securities exchange. The Trust may utilize independent pricing services, quotations from bond dealers, and information with respect to bond and note transactions, to assist in determining a current market value for each security. The Trust’s pricing services may use valuation models or matrix pricing which considers information with respect to comparable bond and note transactions, quotations from bond dealers, or by reference to other securities that are considered comparable in such characteristics as rating, interest rate and maturity date, option adjusted spread models, prepayment projections, interest rate spreads and yield curves, to determine current value.
Foreign securities are valued as of the close of trading on the foreign stock exchange on which the security is primarily traded, or the NYSE, whichever is earlier. If no sale is reported at that time, the foreign security will be valued within the range of the most recent quoted bid and ask prices. The value is then converted into its U.S. dollar equivalent at the foreign exchange rate in effect at the close of the NYSE on the day that the value of the foreign security is determined.
The Trust has procedures to determine the fair value of individual securities and other assets for which market prices are not readily available or which may not be reliably priced. Methods for valuing these securities may include: fundamental analysis, matrix pricing, discounts from market prices of similar securities, or discounts applied due to the nature and duration of restrictions on the disposition of the securities. Due to the inherent uncertainty of valuations of such securities, the fair values may differ significantly from the values that would have been used had a ready market for such investments existed. Occasionally, events occur between the time at which trading in a security is completed and the close of the NYSE that might call into question the availability (including the reliability) of the value of a portfolio security held by the Fund. The investment manager monitors price movements following the close of trading in foreign stock markets through a series of country specific market proxies (such as baskets of American Depository Receipts, futures contracts and exchange traded funds). These price movements are measured against established trigger thresholds for each specific market proxy to assist in determining if an event has occurred. If such an event occurs, the securities may be valued using fair value procedures, which may include the use of independent pricing services. All security valuation procedures are approved by the Trust’s Board of Trustees.
b. Foreign Currency Translation
Portfolio securities and other assets and liabilities denominated in foreign currencies are translated into U.S. dollars based on the exchange rate of such currencies against U.S. dollars on the date of valuation. Purchases and sales of securities, income and expense items denominated in foreign currencies are translated into U.S. dollars at the exchange rate in effect on the transaction
TGA-22
Franklin Templeton Variable Insurance Products Trust
Notes to Financial Statements (continued)
Templeton Global Asset Allocation Fund
1. ORGANIZATION AND SIGNIFICANT ACCOUNTING POLICIES (continued)
b. Foreign Currency Translation (continued)
date. Occasionally, events may impact the availability or reliability of foreign exchange rates used to convert the U.S. dollar equivalent value. If such an event occurs, the foreign exchange rate will be valued at fair value using procedures established and approved by the Trust’s Board of Trustees.
The Fund does not separately report the effect of changes in foreign exchange rates from changes in market prices on securities held. Such changes are included in net realized and unrealized gain or loss from investments on the Statement of Operations.
Realized foreign exchange gains or losses arise from sales of foreign currencies, currency gains or losses realized between the trade and settlement dates on securities transactions and the difference between the recorded amounts of dividends, interest, and foreign withholding taxes and the U.S. dollar equivalent of the amounts actually received or paid. Net unrealized foreign exchange gains and losses arise from changes in foreign exchange rates on foreign denominated assets and liabilities other than investments in securities held at the end of the reporting period.
c. Foreign Currency Contracts
When the Fund purchases or sells foreign securities it may enter into foreign exchange contracts to minimize foreign exchange risk from the trade date to the settlement date of the transactions. A foreign exchange contract is an agreement between two parties to exchange different currencies at an agreed upon exchange rate at a future date. Realized and unrealized gains and losses on these contracts are included in the Statement of Operations.
The Fund may also enter into forward exchange contracts to hedge against fluctuations in foreign exchange rates. These contracts are valued daily by the Fund and the unrealized gains or losses on the contracts, as measured by the difference between the contractual forward foreign exchange rates and the forward rates at the reporting date, are included in the Statement of Assets and Liabilities. Realized and unrealized gains and losses on these contracts are included in the Statement of Operations.
The risks of these contracts include movement in the values of the foreign currencies relative to the U.S. dollar and the possible inability of the counterparties to fulfill their obligations under the contracts, which may be in excess of the amount reflected in the Statement of Assets and Liabilities.
d. Income Taxes
No provision has been made for U.S. income taxes because it is the Fund’s policy to qualify as a regulated investment company under the Internal Revenue Code and to distribute to shareholders substantially all of its taxable income and net realized gains.
Foreign securities held by the Fund may be subject to foreign taxation on dividend and interest income received. Foreign taxes, if any, are recorded based on the tax regulations and rates that exist in the foreign markets in which the Fund invests.
e. Security Transactions, Investment Income, Expenses and Distributions
Security transactions are accounted for on trade date. Realized gains and losses on security transactions are determined on a specific identification basis. Interest income and estimated expenses are accrued daily. Amortization of premium and accretion of discount on debt securities are included in interest income. Dividend income is recorded on the ex-dividend date except that certain dividends from foreign securities are recognized as soon as the Fund is notified of the ex-dividend date. Distributions to shareholders are recorded on the ex-dividend date and are determined according to income tax regulations (tax basis). Distributable earnings determined on a tax basis may differ from earnings recorded in accordance with accounting principles generally accepted in the United States of America. These differences may be permanent or temporary. Permanent differences are reclassified among capital accounts to reflect their tax character.
TGA-23
Franklin Templeton Variable Insurance Products Trust
Notes to Financial Statements (continued)
Templeton Global Asset Allocation Fund
1. ORGANIZATION AND SIGNIFICANT ACCOUNTING POLICIES (continued)
e. Security Transactions, Investment Income, Expenses and Distributions (continued)
These reclassifications have no impact on net assets or the results of operations. Temporary differences are not reclassified, as they may reverse in subsequent periods.
Common expenses incurred by the Trust are allocated among the funds based on the ratio of net assets of each fund to the combined net assets of the Trust. Fund specific expenses are charged directly to the fund that incurred the expense.
Realized and unrealized gains and losses and net investment income, other than class specific expenses, are allocated daily to each class of shares based upon the relative proportion of net assets of each class. Differences in per share distributions, by class, are generally due to differences in class specific expenses.
Inflation-indexed bonds provide an inflation hedge through periodic increases in the security’s interest accruals and principal redemption value, by amounts corresponding to the current rate of inflation. Any such adjustments, including adjustments to principal redemption value, are recorded as interest income.
f. Accounting Estimates
The preparation of financial statements in accordance with accounting principles generally accepted in the United States of America requires management to make estimates and assumptions that affect the reported amounts of assets and liabilities at the date of the financial statements and the amounts of income and expenses during the reporting period. Actual results could differ from those estimates.
g. Guarantees and Indemnifications
Under the Trust’s organizational documents, its officers and trustees are indemnified by the Trust against certain liabilities arising out of the performance of their duties to the Trust. Additionally, in the normal course of business, the Trust, on behalf of the Fund, enters into contracts with service providers that contain general indemnification clauses. The Trust’s maximum exposure under these arrangements is unknown as this would involve future claims that may be made against the Trust that have not yet occurred. Currently, the Trust expects the risk of loss to be remote.
2. SHARES OF BENEFICIAL INTEREST
At December 31, 2007, there were an unlimited number of shares authorized (without par value). Transactions in the Fund’s shares were as follows:
| | | | | | | | | | | | | | |
| | | Year Ended December 31, | |
| | | 2007 | | | 2006 | |
| Class 1 Shares: | | Shares | | | Amount | | | Shares | | | Amount | |
Shares sold | | 345,235 | | | $ | 6,915,166 | | | 671,163 | | | $ | 14,177,128 | |
Shares issued in reinvestment of distributions | | 1,796,286 | | | | 26,064,115 | | | 1,797,880 | | | | 33,925,994 | |
Shares redeemed in-kind (Note 10) | | (7,596,834 | ) | | | (177,462,049 | ) | | (14,967,877 | ) | | | (342,015,981 | ) |
Shares redeemed | | (2,857,358 | ) | | | (62,828,841 | ) | | (5,187,026 | ) | | | (115,761,832 | ) |
| | | | |
Net increase (decrease) | | (8,312,671 | ) | | $ | (207,311,609 | ) | | (17,685,860 | ) | | $ | (409,674,691 | ) |
| | | | |
| Class 2 Shares: | | | | | | | | | | | | |
Shares sold | | 547,052 | | | $ | 9,586,666 | | | 978,403 | | | $ | 19,484,840 | |
Shares issued in reinvestment of distributions | | 2,263,915 | | | | 32,396,627 | | | 507,121 | | | | 9,488,238 | |
Shares redeemed | | (985,730 | ) | | | (16,656,403 | ) | | (1,172,793 | ) | | | (23,621,989 | ) |
| | | | |
Net increase (decrease) | | 1,825,237 | | | $ | 25,326,890 | | | 312,731 | | | $ | 5,351,089 | |
| | | | |
TGA-24
Franklin Templeton Variable Insurance Products Trust
Notes to Financial Statements (continued)
Templeton Global Asset Allocation Fund
3. TRANSACTIONS WITH AFFILIATES
Franklin Resources, Inc. is the holding company for various subsidiaries that together are referred to as Franklin Templeton Investments. Certain officers and trustees of the Trust are also officers and/or directors of the following subsidiaries:
| | |
| Subsidiary | | Affiliation |
Templeton Investment Counsel, LLC (TIC) | | Investment manager |
Franklin Advisers, Inc. (Advisers) | | Investment manager |
Franklin Templeton Services, LLC (FT Services) | | Administrative manager |
Franklin Templeton Distributors, Inc. (Distributors) | | Principal underwriter |
Franklin Templeton Investor Services, LLC (Investor Services) | | Transfer agent |
a. Management Fees
The Fund pays an investment management fee to TIC based on the average daily net assets of the Fund as follows:
| | |
| Annualized Fee Rate | | Net Assets |
| 0.650% | | Up to and including $200 million |
| 0.585% | | Over $200 million, up to and including $1.3 billion |
| 0.520% | | In excess of $1.3 billion |
Under a subadvisory agreement, Advisers, an affiliate of TIC, provides subadvisory services to the Fund and receives from TIC fees based on the average daily net assets of the Fund.
b. Administrative Fees
The Fund pays an administrative fee to FT Services based on the Fund’s average daily net assets as follows:
| | |
| Annualized Fee Rate | | Net Assets |
| 0.150% | | Up to and including $200 million |
| 0.135% | | Over $200 million, up to and including $700 million |
| 0.100% | | Over $700 million, up to and including $1.2 billion |
| 0.075% | | In excess of $1.2 billion |
c. Distribution Fees
The Fund’s Board of Trustees has adopted a distribution plan for Class 2 shares pursuant to Rule 12b-1 under the 1940 Act. Under the Fund’s compensation distribution plan, the Fund pays Distributors for costs incurred in connection with the servicing, sale and distribution of the Fund’s shares up to 0.25% per year of its average daily net assets.
d. Transfer Agent Fees
Investor Services, under terms of an agreement, performs shareholder servicing for the Fund and is not paid by the Fund for the services.
e. Waiver and Expense Reimbursements
FT Services and TIC have agreed in advance to waive all or a portion of their respective fees and to assume payment of other expenses through April 30, 2009. Total expenses waived are not subject to reimbursement by the Fund subsequent to the Fund’s fiscal year end. After April 30, 2009, FT Services and TIC may discontinue this waiver at any time upon notice to the Fund’s Board of Trustees.
TGA-25
Franklin Templeton Variable Insurance Products Trust
Notes to Financial Statements (continued)
Templeton Global Asset Allocation Fund
4. EXPENSE OFFSET ARRANGEMENT
The Fund has entered into an arrangement with its custodian whereby credits realized as a result of uninvested cash balances are used to reduce a portion of the Fund’s custodian expenses. During the year ended December 31, 2007, the custodian fees were reduced as noted in the Statement of Operations.
5. INCOME TAXES
The Fund has reviewed the tax positions taken on federal income tax returns, for each of the three open tax years and as of December 31, 2007 and has determined that no provision for income tax is required in the Fund’s financial statements.
The tax character of distributions paid during the years ended December 31, 2007 and 2006, was as follows:
| | | | | | |
| | | 2007 | | 2006 |
Distributions paid from: | | | | | | |
Ordinary income | | $ | 26,602,578 | | $ | 23,239,156 |
Long term capital gain | | | 31,858,164 | | | 20,175,076 |
| | | |
| | $ | 58,460,742 | | | 43,414,232 |
| | | |
At December 31, 2007, the cost of investments, net unrealized appreciation (depreciation), undistributed ordinary income and undistributed long term capital gains for income tax purposes were as follows:
| | | | |
Cost of investments | | $ | 106,349,558 | |
| | | | |
| |
Unrealized appreciation | | $ | 34,462,892 | |
Unrealized depreciation | | | (3,426,844 | ) |
| | | | |
Net unrealized appreciation (depreciation) | | $ | 31,036,048 | |
| | | | |
Undistributed ordinary income | | $ | 13,668,350 | |
Undistributed long term capital gains | | | 14,502,473 | |
| | | | |
Distributable earnings | | $ | 28,170,823 | |
| | | | |
Net investment income (loss) differs for financial statement and tax purposes primarily due to differing treatments of foreign currency transactions, bond discounts and premiums and inflation related adjustments on foreign securities.
Net realized gains (losses) differ for financial statement and tax purposes primarily due to differing treatments of foreign currency transactions, bond discounts and premiums, gains realized on in-kind shareholder redemptions and inflation related adjustments on foreign securities.
6. INVESTMENT TRANSACTIONS
Purchases and sales of investments (excluding short term securities) for the year ended December 31, 2007, aggregated $57,972,807 and $102,681,048, respectively. Sales of investments excludes $177,462,049 of an in-kind redemption.
7. INVESTMENTS IN FRANKLIN INSTITUTIONAL FIDUCIARY TRUST MONEY MARKET PORTFOLIO
The Fund may invest in the Franklin Institutional Fiduciary Trust Money Market Portfolio (Sweep Money Fund), an open-end investment company managed by Advisers. Management fees paid by the Fund are reduced on assets invested in the Sweep Money Fund, in an amount not to exceed the management and administrative fees paid by the Sweep Money Fund.
TGA-26
Franklin Templeton Variable Insurance Products Trust
Notes to Financial Statements (continued)
Templeton Global Asset Allocation Fund
8. FORWARD EXCHANGE CONTRACTS
At December 31, 2007, the Fund had the following forward exchange contracts outstanding:
| | | | | | | | | | | | | | |
| | | Contract Amounta | | | Settlement
Date | | Unrealized
Gain | | Unrealized
Loss | |
| Contracts to Buy | | | | | | | | |
| 250,565,000 | | Japanese Yen | | 1,639,609 | EUR | | 1/04/08 | | $ | — | | $ | (145,000 | ) |
| 127,176,500 | | Kazakhstan Tenge | | 1,045,000 | | | 1/16/08 | | | 5,212 | | | — | |
| 121,800,000 | | Kazakhstan Tenge | | 1,000,000 | | | 1/18/08 | | | 5,382 | | | — | |
| 121,450,000 | | Kazakhstan Tenge | | 1,000,000 | | | 1/18/08 | | | 2,493 | | | — | |
| 9,000,000 | | Norwegian Krone | | 1,609,500 | | | 1/28/08 | | | 45,268 | | | — | |
| 81,000,000 | | Indian Rupee | | 2,710,208 | NZD | | 2/29/08 | | | — | | | (13,375 | ) |
| 13,756,216 | | Mexican Peso | | 2,510,509,398 | COP | | 4/22/08 | | | 25,589 | | | — | |
| 22,282,800 | | Japanese Yen | | 200,000 | | | 8/20/08 | | | 4,371 | | | — | |
| 22,358,000 | | Japanese Yen | | 200,000 | | | 8/20/08 | | | 5,061 | | | — | |
| 22,139,600 | | Japanese Yen | | 200,000 | | | 8/25/08 | | | 3,140 | | | — | |
| 825,000 | | Swiss Franc | | 712,054 | | | 10/20/08 | | | 24,457 | | | — | |
| | | | |
| Contracts to Sell | | | | | | | | | | |
| 22,656,216 | | Mexican Peso | | 4,426,571,459 | COP | | 4/22/08 | | | 100,071 | | | — | |
| 4,002,526 | | Mexican Peso | | 183,615,857 | CLP | | 6/12/08 | | | 5,599 | | | — | |
| 642,600 | | Euro | | 100,848,359 | JPY | | 12/08/08 | | | — | | | (2,350 | ) |
| | | | | | | | | | | | | | |
| Unrealized gain (loss) on forward exchange contracts | | | | | | | | 226,643 | | | (160,725 | ) |
| | | | | | | | | | | | |
| Net unrealized gain (loss) on forward exchange contracts | | | | | | | $ | 65,918 | | | | |
| | | | | | | | | | | | |
a | In U.S. dollars unless otherwise indicated. |
Currency Abbreviations
CLP - Chilean Peso
COP - Columbian Peso
EUR - Euro
JPY - Japanese Yen
NZD - New Zealand Dollar
9. CONCENTRATION OF RISK
Investing in foreign securities may include certain risks and considerations not typically associated with investing in U.S. securities, such as fluctuating currency values and changing local and regional economic, political and social conditions, which may result in greater market volatility. In addition, certain foreign securities may not be as liquid as U.S. securities.
10. REDEMPTION IN-KIND
During the years ended December 31, 2007 and 2006, the Fund realized $51,446,118 and $67,648,833, respectively, of net gains resulting from redemptions in-kind in which a shareholder redeemed fund shares for securities held by the Fund rather
TGA-27
Franklin Templeton Variable Insurance Products Trust
Notes to Financial Statements (continued)
Templeton Global Asset Allocation Fund
10. REDEMPTION IN-KIND (continued)
than for cash. Because such gains are not taxable to the Fund, and are not distributed to shareholders, they have been reclassified from accumulated net realized gains to paid-in capital.
11. REGULATORY AND LITIGATION MATTERS
As part of various investigations by a number of federal, state, and foreign regulators and governmental entities, including the Securities and Exchange Commission (“SEC”), relating to certain practices in the mutual fund industry, including late trading, market timing and marketing support payments to securities dealers who sell fund shares (“marketing support”), Franklin Resources, Inc. and certain of its subsidiaries (collectively, the “Company”), entered into settlements with certain of those regulators and governmental entities. Specifically, the Company entered into settlements with the SEC, among others, concerning market timing and marketing support.
On June 6, 2007, the SEC posted for public comment the proposed plan of distribution for the market timing settlement. Once the SEC approves the final plan of distribution, disbursements of settlement monies will be made promptly to individuals who were shareholders of the designated funds during the relevant period, in accordance with the terms and conditions of the settlement and plan.
In addition, the Company, as well as most of the mutual funds within Franklin Templeton Investments and certain current or former officers, Company directors, fund directors, and employees, have been named in private lawsuits (styled as shareholder class actions, or as derivative actions on behalf of either the named funds or Franklin Resources, Inc.). The lawsuits relate to the industry practices referenced above.
The Company and fund management believe that the claims made in each of the private lawsuits referenced above are without merit and intend to defend against them vigorously. The Company cannot predict with certainty the eventual outcome of these lawsuits, nor whether they will have a material negative impact on the Company. If it is determined that the Company bears responsibility for any unlawful or inappropriate conduct that caused losses to the Trust, it is committed to making the Trust or its shareholders whole, as appropriate.
12. NEW ACCOUNTING PRONOUNCEMENT
In September 2006, the Financial Accounting Standards Board (FASB) issued FASB Statement No. 157, “Fair Value Measurement” (SFAS 157), which defines fair value, establishes a framework for measuring fair value, and expands disclosures about fair value measurements. SFAS 157 is effective for fiscal years beginning after November 15, 2007, and interim periods within those fiscal years. The Trust believes the adoption of SFAS 157 will have no material impact on its financial statements.
TGA-28
Franklin Templeton Variable Insurance Products Trust
Templeton Global Asset Allocation Fund
Report of Independent Registered Public Accounting Firm
To the Board of Trustees and Shareholders of
Franklin Templeton Variable Insurance Products Trust
In our opinion, the accompanying statement of assets and liabilities, including the statement of investments, and the related statements of operations and of changes in net assets and the financial highlights present fairly, in all material respects, the financial position of Templeton Global Asset Allocation Fund (one of the funds constituting Franklin Templeton Variable Insurance Products Trust, hereafter referred to as the “Fund”) at December 31, 2007, the results of its operations for the year then ended, the changes in its net assets for each of the two years in the period then ended and the financial highlights for each of the five years in the period then ended, in conformity with accounting principles generally accepted in the United States of America. These financial statements and financial highlights (hereafter referred to as “financial statements”) are the responsibility of the Fund’s management. Our responsibility is to express an opinion on these financial statements based on our audits. We conducted our audits of these financial statements in accordance with the standards of the Public Company Accounting Oversight Board (United States). Those standards require that we plan and perform the audit to obtain reasonable assurance about whether the financial statements are free of material misstatement. An audit includes examining, on a test basis, evidence supporting the amounts and disclosures in the financial statements, assessing the accounting principles used and significant estimates made by management, and evaluating the overall financial statement presentation. We believe that our audits, which included confirmation of securities at December 31, 2007 by correspondence with the custodian, provide a reasonable basis for our opinion.
PricewaterhouseCoopers LLP
San Francisco, California
February 14, 2008
TGA-29
Franklin Templeton Variable Insurance Products Trust
Notes to Financial Statements (continued)
Templeton Global Asset Allocation Fund
Under Section 852(b)(3)(C) of the Internal Revenue Code (Code), the Fund designates the maximum amount allowable but no less than $14,502,614 as a long term capital gain dividend for the fiscal year ended December 31, 2007.
Under Section 854(b)(2) of the Code, the Fund designates 2.08% of the ordinary income dividends as income qualifying for the dividends received deduction for the fiscal year ended December 31, 2007.
At December 31, 2007, more than 50% of the Fund’s total assets were invested in securities of foreign issuers. In most instances, foreign taxes were withheld from income paid to the Fund on these investments. The Fund elects to treat foreign taxes paid as allowed under Section 853 of the Code. This election will allow shareholders of record as of the 2008 distribution date, to treat their proportionate share of foreign taxes paid by the Fund as having been paid directly by them. The shareholder shall consider these amounts as foreign taxes paid in the tax year in which they receive the Fund distribution.
TGA-30
TEMPLETON GLOBAL INCOME SECURITIES FUND
We are pleased to bring you Templeton Global Income Securities Fund’s annual report for the fiscal year ended December 31, 2007.
Performance Summary as of 12/31/07
Average annual total return of Class 1 shares represents the average annual change in value, assuming reinvestment of dividends and capital gains. Average returns smooth out variations in returns, which can be significant; they are not the same as year-by-year results.
Periods ended 12/31/07
| | | | | | | | |
| | | | | 1-Year | | 5-Year | | 10-Year |
Average Annual Total Return | | | | +11.27% | | +11.54% | | +8.51% |
Total Return Index Comparison
for Hypothetical $10,000 Investment (1/1/98–12/31/07)
The graph below shows the change in value of a hypothetical $10,000 investment in the Fund over the indicated period and includes reinvestment of any income or distributions. The Fund’s performance is compared to the performance of the J.P. Morgan (JPM) Government Bond Index (GBI) Global, as well as the Consumer Price Index (CPI). One cannot invest directly in an index, nor is an index representative of the Fund’s portfolio. Please see Important Notes to Performance Information preceding the Fund Summaries.
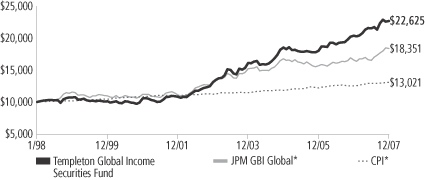
*Sources: J.P. Morgan; Standard & Poor’s Micropal. Please see Index Descriptions following the Fund Summaries.
Templeton Global Income Securities Fund – Class 1
Performance reflects the Fund’s Class 1 operating expenses, but does not include any contract fees, expenses or sales charges. If they had been included, performance would be lower. These charges and deductions, particularly for variable life policies, can have a significant effect on contract values and insurance benefits. See the contract prospectus for a complete description of these expenses, including sales charges.
Performance data represent past performance, which does not guarantee future results. Investment return and principal value will fluctuate, and you may have a gain or loss when you sell your shares.
Current performance may differ from figures shown.
TGI-1
Fund Goal and Main Investments: Templeton Global Income Securities Fund seeks high current income, consistent with preservation of capital, with capital appreciation as a secondary consideration. The Fund normally invests mainly in debt securities of governments and their political subdivisions and agencies, supranational organizations and companies located anywhere in the world, including emerging markets.
Performance Overview
You can find the Fund’s one-year total return in the Performance Summary. The Fund performed comparably to its benchmark, the JPM GBI Global, which had a +10.81% total return in U.S. dollar terms for the year under review.1
Economic and Market Overview
Global economic growth remained strong during the reporting period despite a credit crunch in the second half of the year prompted by the deteriorating U.S. housing sector. Robust economic growth in many emerging markets contrasted with more moderate growth in developed markets where lack of financial liquidity had a larger impact. The rapid rise among developing economies resulted in increased demand from local consumers. Increased food and energy consumption led to high commodity prices throughout the year, benefiting countries exporting these goods. High prices also contributed to inflationary pressures already present in several economies after years of continued above-trend growth. Strong economic growth and rising interest rates in many economies contrasted with the U.S.’s weak growth and falling interest rates, which caused significant U.S. dollar depreciation during the year.
China continued to lead the Asian region’s economic expansion, posting greater than 11% increases in gross domestic product (GDP) in the first three quarters of 2007 compared with the same period in 2006 (year-over-year).2 China’s surging domestic demand became an increasingly important growth source for other Asian economies through trade. For example, Chinese imports from Asia increased 18% in the first 11 months of 2007 year-over-year.2 Continued rapid expansion led to fears China’s economy was overheating as inflation picked up. The potential repercussions of allowing the expansion to continue unchecked were compounded by the local equity markets’ solid performance. Thus, monetary authorities increased interest rates and even allowed the yuan
1. Source: J.P. Morgan. One cannot invest directly in an index, nor is an index representative of the Fund’s portfolio. Please see Index Descriptions following the Fund Summaries.
2. Source: EcoWin.
Fund Risks: Because the Fund invests in bonds and other debt obligations, its share price and yield will be affected by interest rate movements. Bond prices generally move in the opposite direction of interest rates. Thus, as prices of bonds in the Fund adjust to a rise in interest rates, the Fund’s share price may decline. High yield, lower-rated (junk) bonds generally have greater price swings and higher default risks than investment-grade bonds. Foreign investing, especially in emerging markets, involves additional risks including currency fluctuations, economic instability, market volatility, and political and social instability. The Fund’s prospectus also includes a description of the main investment risks.
TGI-2
to appreciate slightly. India encountered similar conditions as it posted around 9% GDP growth in the first three quarters of 2007 year-over-year.2 Indian monetary authorities responded by raising the target interest rate 50 basis points (half a percentage point) during the year. However, this had little effect on private investment growth. Japan continued to fall behind as the country registered GDP growth below 2% in the second and third quarters of 2007 year-over-year.3 Consequently, the Japanese central bank kept rates on hold for the second half of the year after raising them 25 basis points earlier. Low growth levels and interest rates by international standards led to continued yen weakness until risk aversion rose at the end of the year, prompting carry trades to unwind.
European economic growth remained quite strong in 2007, although fears regarding the U.K.’s and eurozone’s future growth paths emerged following the credit crunch. Labor markets strengthened across the region and monetary conditions tightened. The European Central Bank raised rates 50 basis points during the period as growth was strong in the first half of the year, particularly in Germany. Non-euro Europe enjoyed even stronger growth. Norway grew 6.6% in the third quarter year-over-year, prompting the central bank to raise interest rates 25 basis points in December despite financial market volatility.2 The labor market underpinned the nation’s growth as the unemployment rate fell to 1.6% in December from 2.1% a year earlier.4 Some European economies expanded more modestly, particularly where the housing market slowed, such as in Spain and the U.K. These residential markets, after recently showing some of the strongest growth, were hurt as negative sentiment spread from the U.S. housing market across the Atlantic. In the U.K., housing market weakness combined with financial market troubles caused enough worries for the Bank of England to cut interest rates 25 basis points in December after just raising them in July.
3. Source: Economic & Social Research Institute.
4. Source: Norway Ministry of Labour.
What is a carry trade?
Carry trade is a strategy in which an investor sells a certain currency with a relatively low interest rate and uses the funds to purchase a different currency yielding a higher interest rate. A trader using this strategy attempts to capture the difference between the rates, which can often be substantial, depending on the amount of leverage the investor chooses to use.
TGI-3
Investment Strategy
We allocate the Fund’s assets among issuers, geographic regions, and currencies based upon our assessment of relative interest rates among currencies, our outlook for changes in interest rates and currencies, and credit risks. In considering these factors, we may evaluate a country’s changing market, economic and political conditions, such as inflation rate, growth prospects, global trade patterns and government policies. We seek to manage the Fund’s exposure to various currencies, and may from time to time seek to hedge (protect) against currency risk by using forward currency exchange contracts.
Manager’s Discussion
The Fund’s total return was influenced by various factors, including interest rate developments, currency movements, and exposure to sovereign debt markets.
Interest Rate Strategy
For most of the 12-month reporting period, the Fund maintained its overall short duration positioning seeking to take advantage of global interest rate tightening resulting from strong economic growth in most economies. However, we found some opportunities to take advantage of local interest rate reductions. For example, the Indonesian central bank reduced interest rates 175 basis points over the period, continuing its interest rate normalization process as inflation remained under control. Indonesia returned +11.07% in local currency terms over the period, as measured by the JPM GBI–Emerging Markets.5 Another positive local market was Brazil, where its central bank reduced interest rates 200 basis points during the period to 11.25%, which supported local bond market returns of +9.81% in local currency terms.5 The central bank held interest rates constant throughout the fourth quarter as the economy accelerated, inflation picked up, and the large monetary action’s impact began to be felt. As global growth concerns surfaced later in the year, the Fund selectively increased its interest rate exposure, which lengthened the portfolio’s duration.
Currency Strategy
Our currency strategy remained relatively unchanged over the period, predicated on our medium-term view on the gradual unwinding of global imbalances, which began during the period. These imbalances centered on strong U.S. consumption growth and, consequently, a large
5. Source: J.P. Morgan. Please see Index Descriptions following the Fund Summaries.
Currency Breakdown
Templeton Global Income Securities Fund 12/31/07
| | |
| | | % of Total
Net Assets |
| |
| Asia Pacific | | 49.4% |
| Japanese Yen | | 16.2% |
| Malaysian Ringgit | | 11.2% |
| Indonesian Rupiah | | 5.2% |
| South Korean Won | | 4.3% |
| Kazakhstan Tenge | | 4.3% |
| Singapore Dollar | | 4.1% |
| Indian Rupee | | 3.0% |
| Australian Dollar | | 1.2% |
| New Zealand Dollar* | | -0.1% |
| |
| Europe | | 33.5% |
| Swedish Krona | | 13.8% |
| Swiss Franc | | 9.6% |
| Norwegian Krone | | 6.1% |
| Polish Zloty | | 5.4% |
| Euro | | 1.0% |
| Iceland Krona | | 0.1% |
| Romanian Lei* | | -2.5% |
| |
| Americas | | 13.0% |
| Brazilian Real | | 5.7% |
| Canadian Dollar | | 2.9% |
| Chilean Peso | | 1.8% |
| U.S. Dollar | | 1.1% |
| Colombian Peso | | 0.9% |
| Peruvian Nuevo Sol | | 0.9% |
| Mexican Peso* | | -0.3% |
| |
| Middle East & Africa | | 4.1% |
| Egyptian Pound | | 4.1% |
*The Mexican peso = -0.3%, New Zealand dollar = -0.1%, and the Romanian lei = -2.5% due to forward currency exchange contracts.
The dollar value, number of shares or principal amount, and names of all portfolio holdings are listed in the Fund’s Statement of Investments.
TGI-4
U.S. current account deficit, versus low domestic demand in most Asian countries and corresponding Asian current account surpluses. As a result, the Fund benefited from its significantly underweighted U.S. dollar exposure relative to the JPM GBI Global, as the dollar depreciated 10.00% against the U.S.’s major trading partners.6 The imbalance began unwinding as the U.S. trade deficit contracted toward year-end because of U.S. exports’ improved competitiveness due to a weaker dollar. However, the deficit was still quite large on a historical basis. The U.S. dollar weakened further when the Federal Reserve Board cut interest rates during the period, well ahead of other central banks, as the credit crunch affected the U.S. economy more than other countries. One currency that appreciated strongly against the U.S. dollar was the Canadian dollar, which rose 17.91% against the U.S. dollar during the period and contributed to relative performance because of the Fund’s overweighted exposure.7 The Canadian dollar benefited from high prices for many of the country’s natural resource exports and a strong domestic economy. Toward period-end, the weak U.S. economy began to negatively impact Canada’s growth prospects and led us to reduce the Fund’s Canadian dollar allocation prior to the Canadian dollar’s poor performance during the last quarter of 2007. The Fund’s overweighted exposure to the Brazilian real boosted the Fund’s relative performance even more as the currency appreciated 19.94% against the U.S. dollar during the year.7, 8 The real benefited from very strong inflows from trade and investment.
European currencies also appreciated against the U.S. dollar over the period. The Fund had limited direct exposure to the euro, and was instead positioned to capture the benefit of euro appreciation through exposure to non-euro European currencies that are closely linked to the euro region. The euro appreciated 10.87% versus the U.S. dollar during the period as growth remained strong and the interest rate differential with the U.S. shrank significantly.7 Although our limited exposure to the euro’s strong return hurt relative performance, the Fund benefited from its overweighted exposures to the Polish zloty and Norwegian krone.8 Similar to the Scandinavian economies, the Polish economy also exhibited tightening labor market conditions given strong GDP growth
6. Source: Federal Reserve H10 Report.
7. Source: Exshare (via Compustat via FactSet).
8. These countries are not components of the JPM GBI Global.
What is a current account?
A current account is that part of the balance of payments where all of one country’s international transactions in goods and services are recorded.
What is balance of payments?
Balance of payments is a record of all of a country’s exports and imports of goods and services, borrowing and lending with the rest of the world during a particular time period. It helps a country evaluate its competitive strengths and weaknesses and forecast the strength of its currency.
What is duration?
Duration is a measure of a bond’s price sensitivity to interest rate changes. In general, a portfolio of securities with a lower duration can be expected to be less sensitive to interest rate changes than a portfolio with a higher duration.
TGI-5
of more than 6% year-over-year in the third quarter of 2007.9 Strong economic growth created jobs at the same time that there was significant emigration from Poland. Prospects for wage pressures prompted the central bank to raise interest rates during the period, supporting currency performance. The Swedish krona detracted from relative performance as it appreciated only 5.88% against the U.S. dollar over the period.7 The Fund’s biggest allocation change during the period was the addition of the Swiss franc, which appreciated 3.18% during the fourth quarter benefiting from increased risk aversion.7
Asian currency performance was mixed during the year. The currency that comprised the largest portion of the Fund was the Japanese yen, though our exposure was still substantially below the benchmark’s. The yen, which appreciated 6.66% against the U.S. dollar over the period, lagged other major currencies until risk aversion increased in the second half of the year leading to the unwinding of carry trades.7 Among other Asian currencies, the Malaysian ringgit appreciated 6.68% against the U.S. dollar, the South Korean won depreciated 0.65%, and the Indonesian rupiah depreciated 4.25%.7 Our overweighted allocations in these currencies hurt the Fund’s relative performance.8
Global Sovereign Debt Strategy
The Fund purchased investment-grade and subinvestment-grade sovereign debt that typically compensates for greater credit risk by offering higher yields relative to U.S. and European benchmark Treasury securities. Tighter credit conditions resulted in wider sovereign credit spreads despite improving fundamentals in most economies. Sovereign interest rate credit spreads increased from 171 basis points at the beginning of the reporting period to 255 basis points by period-end. However, declining U.S. interest rates benefited the performance of these dollar-denominated bonds. Largely as a result, U.S. dollar-denominated emerging market debt returned +6.28% over the period, as measured by the JPM Emerging Markets Bond Index (EMBI) Global.5 Regionally, Latin American sovereign debt returned +5.15%, Asian +6.14%, and central and eastern European +7.91%.5
9. Source: National Bank of Poland.
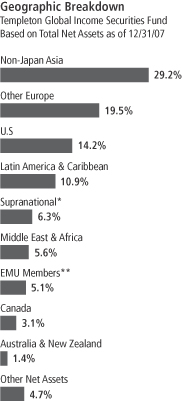
*The Fund’s supranational investments were denominated in the Japanese yen, Mexican peso, New Zealand dollar and Polish zloty.
**The Fund’s EMU investments were in Austria, Belgium, Finland, France, Germany and Spain.
TGI-6
Euro-denominated markets underperformed the index, returning 1.22% in euro terms, as measured by the JPM Euro EMBI Global.5 The Fund maintained limited exposure to sovereign debt during the period.
Thank you for your participation in Templeton Global Income Securities Fund. We look forward to serving your future investment needs.
The foregoing information reflects our analysis, opinions and portfolio holdings as of December 31, 2007, the end of the reporting period. The way we implement our main investment strategies and the resulting portfolio holdings may change depending on factors such as market and economic conditions. These opinions may not be relied upon as investment advice or an offer for a particular security. The information is not a complete analysis of every aspect of any market, country, industry, security or the Fund. Statements of fact are from sources considered reliable, but the investment manager makes no representation or warranty as to their completeness or accuracy. Although historical performance is no guarantee of future results, these insights may help you understand our investment management philosophy.
TGI-7
Fund Expenses
As an investor in a variable insurance contract (Contract) that indirectly provides for investment in an underlying mutual fund, you can incur transaction and/or ongoing expenses at both the Fund level and the Contract level.
| • | | Transaction expenses can include sales charges (loads) on purchases, redemption fees, surrender fees, transfer fees and premium taxes. |
| • | | Ongoing expenses can include management fees, distribution and service (12b-1) fees, contract fees, annual maintenance fees, mortality and expense risk fees and other fees and expenses. All mutual funds and Contracts have some types of ongoing expenses. |
The expenses shown in the table are meant to highlight ongoing expenses at the Fund level only and do not include ongoing expenses at the Contract level, or transaction expenses at either the Fund or Contract level. While the Fund does not have transaction expenses, if the transaction and ongoing expenses at the Contract level were included, the expenses shown would be higher. You should consult your Contract prospectus or disclosure document for more information.
The table shows Fund-level ongoing expenses and can help you understand these expenses and compare them with those of other mutual funds offered through the Contract. The table assumes a $1,000 investment held for the six months indicated. Please refer to the Fund prospectus for additional information on operating expenses.
Actual Fund Expenses
The first line (Actual) of the table provides actual account values and expenses. The “Ending Account Value” is derived from the Fund’s actual return, which includes the effect of ongoing Fund expenses, but does not include the effect of ongoing Contract expenses.
You can estimate the Fund-level expenses you incurred during the period by following these steps. Of course, your account value and expenses will differ from those in this illustration:
| 1. | Divide your account value by $1,000. |
If an account had an $8,600 value, then $8,600 ÷ $1,000 = 8.6.
| 2. | Multiply the result by the number under the heading “Fund-Level Expenses Incurred During Period.” |
If Fund-Level Expenses Incurred During Period were $7.50, then 8.6 x $7.50 = $64.50.
In this illustration, the estimated expenses incurred this period at the Fund level are $64.50.
Templeton Global Income Securities Fund – Class 1
TGI-8
Hypothetical Example for Comparison with Other Mutual Funds
Information in the second line (Hypothetical) of the table can help you compare ongoing expenses of the Fund with those of other mutual funds offered through the Contract. This information may not be used to estimate the actual ending account balance or expenses you incurred during the period. The hypothetical “Ending Account Value” is based on the Fund’s actual expense ratio for each class and an assumed 5% annual rate of return before expenses, which does not represent the Fund’s actual return. The figure under the heading “Fund-Level Expenses Incurred During Period” shows the hypothetical expenses your account would have incurred under this scenario. You can compare this figure with the 5% hypothetical examples that appear in shareholder reports of other funds offered through a Contract.
| | | | | | | | | |
| Class 1 | | Beginning
Account
Value 7/1/07 | | Ending
Account
Value 12/31/07 | | Fund-Level
Expenses Incurred
During Period*
7/1/07–12/31/07 |
Actual | | $ | 1,000 | | $ | 1,052.60 | | $ | 3.21 |
Hypothetical (5% return before expenses) | | $ | 1,000 | | $ | 1,022.08 | | $ | 3.16 |
*Expenses are calculated using the most recent six-month annualized expense ratio, for the Fund’s Class 1 shares (0.62%), which does not include any ongoing expenses of the Contract for which the Fund is an investment option, multiplied by the average account value over the period, multiplied by 184/365 to reflect the one-half year period.
TGI-9
Franklin Templeton Variable Insurance Products Trust
Financial Highlights
Templeton Global Income Securities Fund
| | | | | | | | | | | | | | | | | | | | |
| | | Year Ended December 31, | |
| Class 1 | | 2007 | | | 2006 | | | 2005 | | | 2004 | | | 2003 | |
| | | | |
Per share operating performance | | | | | | | | | | | | | | | | | | | | |
(for a share outstanding throughout the year) | | | | | | | | | | | | | | | | | | | | |
Net asset value, beginning of year | | $ | 15.73 | | | $ | 14.36 | | | $ | 15.80 | | | $ | 15.54 | | | $ | 13.67 | |
| | | | |
Income from investment operationsa: | | | | | | | | | | | | | | | | | | | | |
Net investment incomeb | | | 0.77 | | | | 0.61 | | | | 0.57 | | | | 0.66 | | | | 0.69 | |
Net realized and unrealized gains (losses) | | | 0.97 | | | | 1.24 | | | | (1.03 | ) | | | 1.37 | | | | 2.35 | |
| | | | |
Total from investment operations | | | 1.74 | | | | 1.85 | | | | (0.46 | ) | | | 2.03 | | | | 3.04 | |
| | | | |
Less distributions from net investment income | | | (0.47 | ) | | | (0.48 | ) | | | (0.98 | ) | | | (1.77 | ) | | | (1.17 | ) |
| | | | |
Redemption fees | | | — | d | | | — | d | | | — | d | | | — | | | | — | |
| | | | |
Net asset value, end of year | | $ | 17.00 | | | $ | 15.73 | | | $ | 14.36 | | | $ | 15.80 | | | $ | 15.54 | |
| | | | |
| | | | | |
Total returnc | | | 11.27% | | | | 13.14% | | | | (2.91)% | | | | 15.09% | | | | 22.72% | |
Ratios to average net assets | | | | | | | | | | | | | | | | | | | | |
Expenses before expense reduction | | | 0.64% | | | | 0.80% | | | | 0.78% | | | | 0.79% | | | | 0.76% | |
Expenses net of expense reduction | | | 0.64% | | | | 0.72% | | | | 0.74% | | | | 0.78% | | | | 0.76% | |
Net investment income | | | 4.70% | | | | 4.09% | | | | 3.81% | | | | 4.40% | | | | 4.72% | |
| | | | | |
Supplemental data | | | | | | | | | | | | | | | | | | | | |
Net assets, end of year (000’s) | | $ | 137,700 | | | $ | 75,843 | | | $ | 53,115 | | | $ | 49,845 | | | $ | 52,842 | |
Portfolio turnover rate | | | 47.33% | | | | 30.65% | | | | 30.28% | | | | 37.39% | | | | 53.01% | |
aThe amount shown for a share outstanding throughout the period may not correlate with the Statement of Operations for the period due to the timing of sales and repurchases of the Fund shares in relation to income earned and/or fluctuating market value of the investments of the Fund.
bBased on average daily shares outstanding.
cTotal return does not include any fees, charges or expenses imposed by the variable annuity and life insurance contracts for which the Franklin Templeton Variable Insurance Products Trust serves as an underlying investment vehicle.
dAmount rounds to less than $0.01 per share.
The accompanying notes are an integral part of these financial statements.
TGI-10
Franklin Templeton Variable Insurance Products Trust
Financial Highlights (continued)
Templeton Global Income Securities Fund
| | | | | | | | | | | | | | | | | | | | |
| | | Year Ended December 31, | |
| Class 2 | | 2007 | | | 2006 | | | 2005 | | | 2004 | | | 2003 | |
| | | | |
Per share operating performance | | | | | | | | | | | | | | | | | | | | |
(for a share outstanding throughout the year) | | | | | | | | | | | | | | | | | | | | |
Net asset value, beginning of year | | $ | 15.50 | | | $ | 14.19 | | | $ | 15.64 | | | $ | 15.42 | | | $ | 13.59 | |
| | | | |
Income from investment operationsa: | | | | | | | | | | | | | | | | | | | | |
Net investment incomeb | | | 0.72 | | | | 0.57 | | | | 0.52 | | | | 0.60 | | | | 0.65 | |
Net realized and unrealized gains (losses) | | | 0.96 | | | | 1.21 | | | | (1.00 | ) | | | 1.36 | | | | 2.33 | |
| | | | |
Total from investment operations | | | 1.68 | | | | 1.78 | | | | (0.48 | ) | | | 1.96 | | | | 2.98 | |
| | | | |
Less distributions from net investment income | | | (0.46 | ) | | | (0.47 | ) | | | (0.97 | ) | | | (1.74 | ) | | | (1.15 | ) |
| | | | |
Redemption fees | | | — | d | | | — | d | | | — | d | | | — | | | | — | |
| | | | |
Net asset value, end of year | | $ | 16.72 | | | $ | 15.50 | | | $ | 14.19 | | | $ | 15.64 | | | $ | 15.42 | |
| | | | |
| | | | | |
Total returnc | | | 11.00% | | | | 12.77% | | | | (3.08)% | | | | 14.74% | | | | 22.44% | |
Ratios to average net assets | | | | | | | | | | | | | | | | | | | | |
Expenses before expense reduction | | | 0.89% | | | | 1.05% | | | | 1.03% | | | | 1.04% | | | | 1.01% | |
Expenses net of expense reduction | | | 0.89% | | | | 0.97% | | | | 0.99% | | | | 1.03% | | | | 1.01% | |
Net investment income | | | 4.45% | | | | 3.84% | | | | 3.56% | | | | 4.15% | | | | 4.47% | |
| | | | | |
Supplemental data | | | | | | | | | | | | | | | | | | | | |
Net assets, end of year (000’s) | | $ | 480,649 | | | $ | 205,768 | | | $ | 61,255 | | | $ | 19,779 | | | $ | 5,181 | |
Portfolio turnover rate | | | 47.33% | | | | 30.65% | | | | 30.28% | | | | 37.39% | | | | 53.01% | |
aThe amount shown for a share outstanding throughout the period may not correlate with the Statement of Operations for the period due to the timing of sales and repurchases of the Fund shares in relation to income earned and/or fluctuating market value of the investments of the Fund.
bBased on average daily shares outstanding.
cTotal return does not include any fees, charges or expenses imposed by the variable annuity and life insurance contracts for which the Franklin Templeton Variable Insurance Products Trust serves as an underlying investment vehicle.
dAmount rounds to less than $0.01 per share.
The accompanying notes are an integral part of these financial statements.
TGI-11
Franklin Templeton Variable Insurance Products Trust
Financial Highlights (continued)
Templeton Global Income Securities Fund
| | | | | | | | | | | | |
| | | Year Ended December 31, | |
| Class 3 | | 2007 | | | 2006 | | | 2005f | |
| | | | |
Per share operating performance | | | | | | | | | | | | |
(for a share outstanding throughout the year) | | | | | | | | | | | | |
Net asset value, beginning of year | | $ | 15.49 | | | $ | 14.18 | | | $ | 15.27 | |
| | | | |
Income from investment operationsa: | | | | | | | | | | | | |
Net investment incomeb | | | 0.72 | | | | 0.58 | | | | 0.38 | |
Net realized and unrealized gains (losses) | | | 0.95 | | | | 1.21 | | | | (0.50 | ) |
| | | | |
Total from investment operations | | | 1.67 | | | | 1.79 | | | | (0.12 | ) |
| | | | |
Less distributions from net investment income | | | (0.46 | ) | | | (0.48 | ) | | | (0.97 | ) |
| | | | |
Redemption fees | | | — | e | | | — | e | | | — | e |
| | | | |
Net asset value, end of year | | $ | 16.70 | | | $ | 15.49 | | | $ | 14.18 | |
| | | | |
| | | |
Total returnc | | | 11.03% | | | | 12.84% | | | | (0.80)% | |
Ratios to average net assetsd | | | | | | | | | | | | |
Expenses before expense reduction | | | 0.89% | | | | 1.05% | | | | 1.03% | |
Expenses net of expense reduction | | | 0.89% | | | | 0.97% | | | | 0.99% | |
Net investment income | | | 4.45% | | | | 3.84% | | | | 3.56% | |
Supplemental data | | | | | | | | | | | | |
Net assets, end of year (000’s) | | $ | 91,162 | | | $ | 35,572 | | | $ | 5,769 | |
Portfolio turnover rate | | | 47.33% | | | | 30.65% | | | | 30.28% | |
aThe amount shown for a share outstanding throughout the period may not correlate with the Statement of Operations for the period due to the timing of sales and repurchases of the Fund shares in relation to income earned and/or fluctuating market value of the investments of the Fund.
bBased on average daily shares outstanding.
cTotal return does not include any fees, charges or expenses imposed by the variable annuity and life insurance contracts for which the Franklin Templeton Variable Insurance Products Trust serves as an underlying investment vehicle. Total return is not annualized for periods less than one year.
dRatios are annualized for periods less than one year.
eAmount rounds to less than $0.01 per share.
fFor the period April 1, 2005 (effective date) to December 31, 2005.
The accompanying notes are an integral part of these financial statements.
TGI-12
Franklin Templeton Variable Insurance Products Trust
Statement of Investments, December 31, 2007
| | | | | | |
| Templeton Global Income Securities Fund | | Principal
Amounta | | | Value |
Government and Agency Securities 68.6% | | | | | | |
Argentina 1.7% | | | | | | |
b,cGovernment of Argentina, FRN, 5.389%, 8/03/12 | | 21,792,000 | | | $ | 11,849,340 |
| | | | | | |
Australia 1.1% | | | | | | |
New South Wales Treasury Corp., 8.00%, 3/01/08 | | 5,990,000 | AUD | | | 5,255,486 |
Queensland Treasury Corp., 6.00%, 7/14/09 | | 3,195,000 | AUD | | | 2,756,996 |
| | | | | | |
| | | | | | 8,012,482 |
| | | | | | |
Austria 0.1% | | | | | | |
Government of Austria, 5.00%, 7/15/12 | | 400,000 | EUR | | | 602,618 |
| | | | | | |
Belgium 0.2% | | | | | | |
Government of Belgium, 7.50%, 7/29/08 | | 686,000 | EUR | | | 1,019,949 |
| | | | | | |
Brazil 5.1% | | | | | | |
Nota Do Tesouro Nacional, | | | | | | |
9.762%, 1/01/12 | | 20,470 | d BRL | | | 10,511,467 |
9.762%, 1/01/14 | | 7,100 | d BRL | | | 3,506,031 |
9.762%, 1/01/17 | | 22,490 | d BRL | | | 10,654,128 |
eIndex Linked, 6.00%, 5/15/15 | | 2,750 | d BRL | | | 2,391,221 |
eIndex Linked, 6.00%, 5/15/45 | | 10,825 | d BRL | | | 9,407,813 |
| | | | | | |
| | | | | | 36,470,660 |
| | | | | | |
Canada 3.1% | | | | | | |
Government of Canada, 4.25%, 12/01/08 | | 14,500,000 | CAD | | | 14,638,527 |
Province of Alberta, 5.00%, 12/16/08 | | 1,405,000 | CAD | | | 1,426,435 |
Province of Manitoba, 6.375%, 9/01/15 | | 1,638,000 | NZD | | | 1,154,776 |
Province of Ontario, | | | | | | |
3.875%, 3/08/08 | | 1,925,000 | CAD | | | 1,936,312 |
5.70%, 12/01/08 | | 2,200,000 | CAD | | | 2,246,422 |
6.25%, 6/16/15 | | 925,000 | NZD | | | 645,202 |
| | | | | | |
| | | | | | 22,047,674 |
| | | | | | |
France 0.0%f | | | | | | |
Government of France, 4.00%, 10/25/09 | | 195,000 | EUR | | | 284,124 |
| | | | | | |
Germany 4.7% | | | | | | |
bKfW Bankengruppe, FRN, 0.658%, 8/08/11 | | 3,725,000,000 | JPY | | | 33,421,349 |
| | | | | | |
Indonesia 5.1% | | | | | | |
Government of Indonesia, | | | | | | |
14.275%, 12/15/13 | | 14,267,000,000 | IDR | | | 1,834,165 |
11.50%, 9/15/19 | | 30,075,000,000 | IDR | | | 3,484,105 |
11.00%, 11/15/20 | | 31,230,000,000 | IDR | | | 3,459,725 |
12.80%, 6/15/21 | | 74,215,000,000 | IDR | | | 9,201,435 |
12.90%, 6/15/22 | | 10,710,000,000 | IDR | | | 1,331,812 |
10.25%, 7/15/22 | | 52,500,000,000 | IDR | | | 5,519,698 |
11.75%, 8/15/23 | | 5,491,000,000 | IDR | | | 629,893 |
10.00%, 9/15/24 | | 5,000,000,000 | IDR | | | 502,416 |
11.00%, 9/15/25 | | 39,400,000,000 | IDR | | | 4,292,267 |
12.00%, 9/15/26 | | 8,230,000,000 | IDR | | | 985,760 |
10.25%, 7/15/27 | | 48,220,000,000 | IDR | | | 5,005,535 |
| | | | | | |
| | | | | | 36,246,811 |
| | | | | | |
Iraq 0.9% | | | | | | |
gGovernment of Iraq, Reg S, 5.80%, 1/15/28 | | 9,300,000 | | | | 6,184,500 |
| | | | | | |
TGI-13
Franklin Templeton Variable Insurance Products Trust
Statement of Investments, December 31, 2007 (continued)
| | | | | | |
| Templeton Global Income Securities Fund | | Principal
Amounta | | | Value |
Government and Agency Securities (continued) | | | | | | |
Malaysia 4.0% | | | | | | |
Government of Malaysia, | | | | | | |
6.45%, 7/01/08 | | 14,772,000 | MYR | | $ | 4,531,864 |
3.917%, 9/30/08 | | 400,000 | MYR | | | 121,211 |
4.305%, 2/27/09 | | 4,210,000 | MYR | | | 1,284,705 |
7.00%, 3/15/09 | | 12,234,000 | MYR | | | 3,851,174 |
6.844%, 10/01/09 | | 2,800,000 | MYR | | | 894,663 |
3.756%, 4/28/11 | | 57,160,000 | MYR | | | 17,380,607 |
| | | | | | |
| | | | | | 28,064,224 |
| | | | | | |
Mexico 3.5% | | | | | | |
Government of Mexico, | | | | | | |
h144A, 7.50%, 3/08/10 | | 450,000 | EUR | | | 695,322 |
8.00%, 12/17/15 | | 726,000i | MXN | | | 6,586,004 |
10.00%, 12/05/24 | | 1,655,000i | MXN | | | 17,649,089 |
| | | | | | |
| | | | | | 24,930,415 |
| | | | | | |
New Zealand 0.3% | | | | | | |
Government of New Zealand, 7.00%, 7/15/09 | | 2,435,000 | NZD | | | 1,856,583 |
| | | | | | |
Norway 2.0% | | | | | | |
Government of Norway, 5.50%, 5/15/09 | | 76,360,000 | NOK | | | 14,204,154 |
| | | | | | |
Peru 0.6% | | | | | | |
Government of Peru, | | | | | | |
7, 8.60%, 8/12/17 | | 6,185,000 | PEN | | | 2,397,085 |
7.84%, 8/12/20 | | 4,945,000 | PEN | | | 1,856,671 |
| | | | | | |
| | | | | | 4,253,756 |
| | | | | | |
Philippines 0.1% | | | | | | |
gGovernment of the Philippines, Reg S, 9.125%, 2/22/10 | | 330,000 | EUR | | | 513,635 |
| | | | | | |
Poland 3.0% | | | | | | |
Government of Poland, | | | | | | |
6.00%, 5/24/09 | | 4,045,000 | PLN | | | 1,633,414 |
5.75%, 9/23/22 | | 48,750,000 | PLN | | | 19,621,238 |
| | | | | | |
| | | | | | 21,254,652 |
| | | | | | |
Singapore 3.6% | | | | | | |
Government of Singapore, | | | | | | |
1.50%, 4/01/08 | | 350,000 | SGD | | | 242,605 |
5.625%, 7/01/08 | | 8,370,000 | SGD | | | 5,912,529 |
4.375%, 1/15/09 | | 27,640,000 | SGD | | | 19,664,495 |
| | | | | | |
| | | | | | 25,819,629 |
| | | | | | |
South Africa 0.1% | | | | | | |
Government of South Africa, 5.25%, 5/16/13 | | 200,000 | EUR | | | 288,951 |
| | | | | | |
South Korea 10.9% | | | | | | |
Korea Treasury Bond, | | | | | | |
4.75%, 3/10/12 | | 2,184,000,000 | KRW | | | 2,247,021 |
5.25%, 9/10/12 | | 14,139,000,000 | KRW | | | 14,788,929 |
5.00%, 9/10/16 | | 2,806,000,000 | KRW | | | 2,853,143 |
5.50%, 9/10/17 | | 39,555,600,000 | KRW | | | 41,647,581 |
5.25%, 3/10/27 | | 9,463,500,000 | KRW | | | 9,647,831 |
Korea Treasury Note, 4.75%, 6/10/09 | | 5,925,000,000 | KRW | | | 6,240,303 |
| | | | | | |
| | | | | | 77,424,808 |
| | | | | | |
TGI-14
Franklin Templeton Variable Insurance Products Trust
Statement of Investments, December 31, 2007 (continued)
| | | | | | |
| Templeton Global Income Securities Fund | | Principal
Amounta | | | Value |
Government and Agency Securities (continued) | | | | | | |
Spain 0.1% | | | | | | |
Government of Spain, 6.00%, 1/31/08 | | 390,000 | EUR | | $ | 569,976 |
| | | | | | |
jSupranational 6.3% | | | | | | |
European Bank For Reconstruction & Development, senior note, 5.10%, 6/12/09 | | 40,000,000 | PLN | | | 16,111,143 |
bEuropean Investment Bank, senior note, FRN, 0.75%, 9/21/11 | | 1,340,000,000 | JPY | | | 12,019,673 |
Inter-American Development Bank,
6.00%, 12/15/17 | | 575,000 | NZD | | | 395,615 |
senior note, 7.50%, 12/05/24 | | 200,000,000 | MXN | | | 16,268,205 |
| | | | | | |
| | | | | | 44,794,636 |
| | | | | | |
Sweden 11.9% | | | | | | |
Government of Sweden,
6.50%, 5/05/08 | | 151,000,000 | SEK | | | 23,520,801 |
5.00%, 1/28/09 | | 363,050,000 | SEK | | | 56,623,604 |
kStrip, 9/17/08 | | 30,000,000 | SEK | | | 4,506,658 |
| | | | | | |
| | | | | | 84,651,063 |
| | | | | | |
United States 0.2% | | | | | | |
FNMA, 1.75%, 3/26/08 | | 180,000,000 | JPY | | | 1,617,241 |
| | | | | | |
Total Government and Agency Securities (Cost $470,307,729) | | | | | | 486,383,230 |
| | | | | | |
Short Term Investments 26.7% | | | | | | |
Government and Agency Securities 12.7% | | | | | | |
Egypt 4.6% | | | | | | |
k,lEgypt Treasury Bills, 1/01/08 – 12/30/08 | | 185,275,000 | EGP | | | 32,231,090 |
| | | | | | |
Malaysia 5.5% | | | | | | |
Government of Malaysia,
3.546%, 1/11/08 | | 8,890,000 | MYR | | | 2,688,345 |
3.569%, 2/14/08 | | 17,280,000 | MYR | | | 5,225,280 |
7.60%, 3/15/08 | | 5,000,000 | MYR | | | 1,524,493 |
3.17%, 5/15/08 | | 16,610,000 | MYR | | | 5,016,521 |
3.541%, 7/08/08 | | 6,100,000 | MYR | | | 1,844,572 |
3.562%, 7/15/08 | | 10,550,000 | MYR | | | 3,190,439 |
kMalaysia Treasury Bills, 1/04/08 – 9/23/08 | | 66,235,000 | MYR | | | 19,796,132 |
| | | | | | |
| | | | | | 39,285,782 |
| | | | | | |
Norway 2.0% | | | | | | |
kNorway Treasury Bills, 3/19/08 – 6/18/08 | | 77,955,000 | NOK | | | 14,113,514 |
| | | | | | |
Sweden 0.6% | | | | | | |
kGovernment of Sweden, Strip, 6/18/08 | | 30,000,000 | SEK | | | 4,552,732 |
| | | | | | |
Total Government and Agency Securities (Cost $86,747,759) | | | | | | 90,183,118 |
| | | | | | |
Total Investment before Repurchase Agreement (Cost $557,055,488) | | | | | | 576,566,348 |
| | | | | | |
United States 14.0% | | | | | | |
Repurchase Agreement (Cost $99,770,604) 14.0% | | | | | | |
mJoint Repurchase Agreement, 3.773%, 1/02/08 (Maturity Value $99,791,515) | | 99,770,604 | | | | 99,770,604 |
ABN AMRO Bank NV, New York Branch (Maturity Value $9,819,485) | | | | | | |
Banc of America Securities LLC (Maturity Value $9,819,485) | | | | | | |
TGI-15
Franklin Templeton Variable Insurance Products Trust
Statement of Investments, December 31, 2007 (continued)
| | | |
| Templeton Global Income Securities Fund | | Value |
United States (continued) | | | |
Repurchase Agreement (continued) | | | |
Barclays Capital Inc. (Maturity Value $4,522,551) | | | |
BNP Paribas Securities Corp. (Maturity Value $9,819,485) | | | |
Credit Suisse Securities (USA) LLC (Maturity Value $2,583,602) | | | |
Deutsche Bank Securities Inc. (Maturity Value $9,819,485) | | | |
Dresdner Kleinwort Wasserstein Securities LLC (Maturity Value $9,819,485) | | | |
Goldman, Sachs & Co. (Maturity Value $11,886,167) | | | |
Greenwich Capital Markets Inc. (Maturity Value $9,819,485) | | | |
Lehman Brothers Inc. (Maturity Value $12,062,800) | | | |
Merrill Lynch Government Securities Inc. (Maturity Value $9,819,485) | | | |
Collateralized by U.S. Government Agency Securities, 3.00% - 6.25%, 1/15/08 - 11/14/12;
kU.S. Government Agency Discount Notes, 1/02/08 - 8/01/12; kU.S. Treasury Bill, 6/12/08;
and U.S. Treasury Notes, 3.25% - 4.625%, 3/31/08 - 8/15/10 | | | |
| | | |
Total Investments (Cost $656,826,092) 95.3% | | | 676,336,952 |
Net Unrealized Gain on Forward Exchange Contracts 0.5% | | | 3,595,078 |
Other Assets, less Liabilities 4.2% | | | 29,579,498 |
| | | |
Net Assets 100.0% | | $ | 709,511,528 |
| | | |
Currency Abbreviations
AUD - Australian Dollar
BRL - Brazilian Real
CAD - Canadian Dollar
EGP - Egyptian Pound
EUR - Euro
IDR - Indonesian Rupiah
JPY - Japanese Yen
KRW - South Korean Won
MXN - Mexican Peso
MYR - Malaysian Ringgit
NOK - Norwegian Krone
NZD - New Zealand Dollar
PEN - Peruvian Nuevo Sol
PLN - Polish Zloty
SEK - Swedish Krona
SGD - Singapore Dollar
Selected Portfolio Abbreviations
FNMA - Federal National Mortgage Association
FRN - Floating Rate Note
aThe principal amount is stated in U.S. dollars unless otherwise indicated.
bThe coupon rate shown represents the rate at period end.
cThe principal amount is stated in original face, and scheduled paydowns are reflected in the market price on ex-date.
dPrincipal amount is stated in 1,000 Brazilian Real units.
ePrincipal amount of security is adjusted for inflation. See Note 1(g).
fRounds to less than 0.1% of net assets.
gSecurity was purchased pursuant to Regulation S under the Securities Act of 1933, which exempts from registration securities offered and sold outside of the United States. Such a security cannot be sold in the United States without either an effective registration statement filed pursuant to the Securities Act of 1933, or pursuant to an exemption from registration. These securities have been deemed liquid under guidelines approved by the Trust’s Board of Trustees. At December 31, 2007, the aggregate value of these securities was $6,698,135, representing 0.94% of net assets.
hSecurity was purchased pursuant to Rule 144A under the Securities Act of 1933 and may be sold in transactions exempt from registration only to qualified institutional buyers or in a public offering registered under the Securities Act of 1933. This security has been deemed liquid under guidelines approved by the Trust’s Board of Trustees. At December 31, 2007, the value of this security was $695,322, representing 0.10% of net assets.
iPrincipal amount is stated in 100 Mexican Peso units.
jA supranational organization is an entity formed by two or more central governments through international treaties.
kThe security is traded on a discount basis with no stated coupon rate.
lA portion or all of the securities purchased on a when-issued or delayed delivery basis. See Note 1(d).
mSee Note 1(c) regarding joint repurchase agreement.
The accompanying notes are an integral part of these financial statements.
TGI-16
Franklin Templeton Variable Insurance Products Trust
Financial Statements
Statement of Assets and Liabilities
December 31, 2007
| | | | |
| | | Templeton
Global Income
Securities Fund | |
Assets: | | | | |
Investments in securities: | | | | |
Cost - Unaffiliated issuers | | $ | 557,055,488 | |
Cost - Repurchase agreement | | | 99,770,604 | |
| | | | |
Total cost of investments | | $ | 656,826,092 | |
| | | | |
Value - Unaffiliated issuers | | $ | 576,566,348 | |
Value - Repurchase agreement | | | 99,770,604 | |
| | | | |
Total value of investments | | | 676,336,952 | |
Foreign currency, at value (cost $21,899,060) | | | 23,012,645 | |
Receivables: | | | | |
Capital shares sold | | | 1,309,564 | |
Interest | | | 11,108,000 | |
Unrealized gain on forward exchange contracts (Note 7) | | | 5,049,276 | |
| | | | |
Total assets | | | 716,816,437 | |
| | | | |
Liabilities: | | | | |
Payables: | | | | |
Investment securities purchased | | | 4,969,036 | |
Capital shares redeemed | | | 92,398 | |
Affiliates | | | 515,344 | |
Unrealized loss on forward exchange contracts (Note 7) | | | 1,454,198 | |
Accrued expenses and other liabilities | | | 273,933 | |
| | | | |
Total liabilities | | | 7,304,909 | |
| | | | |
Net assets, at value | | $ | 709,511,528 | |
| | | | |
Net assets consist of: | | | | |
Paid-in capital | | $ | 653,607,990 | |
Undistributed net investment income | | | 35,686,615 | |
Net unrealized appreciation (depreciation) | | | 24,416,313 | |
Accumulated net realized gain (loss) | | | (4,199,390 | ) |
| | | | |
Net assets, at value | | $ | 709,511,528 | |
| | | | |
Class 1: | | | | |
Net assets, at value | | $ | 137,700,254 | |
| | | | |
Shares outstanding | | | 8,102,207 | |
| | | | |
Net asset value and maximum offering price per share | | $ | 17.00 | |
| | | | |
Class 2: | | | | |
Net assets, at value | | $ | 480,648,788 | |
| | | | |
Shares outstanding | | | 28,745,875 | |
| | | | |
Net asset value and maximum offering price per share | | $ | 16.72 | |
| | | | |
Class 3: | | | | |
Net assets, at value | | $ | 91,162,486 | |
| | | | |
Shares outstanding | | | 5,457,279 | |
| | | | |
Net asset value and maximum offering price per sharea | | $ | 16.70 | |
| | | | |
aRedemption | price is equal to net asset value less any redemption fees retained by the Fund. |
The accompanying notes are an integral part of these financial statements.
TGI-17
Franklin Templeton Variable Insurance Products Trust
Financial Statements (continued)
Statement of Operations
for the year ended December 31, 2007
| | | | |
| | | Templeton
Global Income
Securities Fund | |
Investment income: | | | | |
Interest (net of foreign taxes of $688,223) | | $ | 25,268,490 | |
| | | | |
Expenses: | | | | |
Management fees (Note 3a) | | | 2,376,316 | |
Distribution fees: (Note 3c) | | | | |
Class 2 | | | 802,153 | |
Class 3 | | | 154,518 | |
Unaffiliated transfer agent fees | | | 6,765 | |
Custodian fees (Note 4) | | | 459,998 | |
Reports to shareholders | | | 132,349 | |
Professional fees | | | 36,546 | |
Trustees’ fees and expenses | | | 1,697 | |
Other | | | 21,230 | |
| | | | |
Total expenses | | | 3,991,572 | |
Expense reductions (Note 4) | | | (5,199 | ) |
| | | | |
Net expenses | | | 3,986,373 | |
| | | | |
Net investment income | | | 21,282,117 | |
| | | | |
Realized and unrealized gains (losses): | | | | |
Net realized gain (loss) from: | | | | |
Investments | | | 18,145,387 | |
Foreign currency transactions | | | (262,750 | ) |
| | | | |
Net realized gain (loss) | | | 17,882,637 | |
| | | | |
Net change in unrealized appreciation (depreciation) on:
Investments | | | 7,705,155 | |
Translation of assets and liabilities denominated in foreign currencies | | | 1,209,672 | |
| | | | |
Net change in unrealized appreciation (depreciation) | | | 8,914,827 | |
| | | | |
Net realized and unrealized gain (loss) | | | 26,797,464 | |
| | | | |
Net increase (decrease) in net assets resulting from operations | | $ | 48,079,581 | |
| | | | |
The accompanying notes are an integral part of these financial statements.
TGI-18
Franklin Templeton Variable Insurance Products Trust
Financial Statements (continued)
Statements of Changes in Net Assets
| | | | | | | | |
| | | Templeton Global Income
Securities Fund | |
| | Year Ended December 31, | |
| | 2007 | | | 2006 | |
| | | | |
Increase (decrease) in net assets: | | | | | | | | |
Operations: | | | | | | | | |
Net investment income | | $ | 21,282,117 | | | $ | 7,811,021 | |
Net realized gain (loss) from investments and foreign currency transactions | | | 17,882,637 | | | | 4,248,556 | |
Net change in unrealized appreciation (depreciation) on investments and translation of assets and
liabilities denominated in foreign currencies | | | 8,914,827 | | | | 12,273,367 | |
| | | | |
Net increase (decrease) in net assets resulting from operations | | | 48,079,581 | | | | 24,332,944 | |
| | | | |
Distributions to shareholders from net investment income: | | | | | | | | |
Class 1 | | | (2,456,235 | ) | | | (2,013,759 | ) |
Class 2 | | | (8,266,690 | ) | | | (3,259,404 | ) |
Class 3 | | | (1,628,484 | ) | | | (431,514 | ) |
| | | | |
Total distributions to shareholders | | | (12,351,409 | ) | | | (5,704,677 | ) |
| | | | |
Capital share transactions: (Note 2) | | | | | | | | |
Class 1 | | | 55,559,172 | | | | 16,986,934 | |
Class 2 | | | 250,108,969 | | | | 133,487,737 | |
Class 3 | | | 50,922,791 | | | | 27,934,695 | |
| | | | |
Total capital share transactions | | | 356,590,932 | | | | 178,409,366 | |
| | | | |
Redemption fees | | | 9,428 | | | | 6,342 | |
| | | | |
Net increase (decrease) in net assets | | | 392,328,532 | | | | 197,043,975 | |
Net assets: | | | | | | | | |
Beginning of year | | | 317,182,996 | | | | 120,139,021 | |
| | | | |
End of year | | $ | 709,511,528 | | | $ | 317,182,996 | |
| | | | |
Undistributed net investment income included in net assets: | | | | | | | | |
End of year | | $ | 35,686,615 | | | $ | 9,842,829 | |
| | | | |
The accompanying notes are an integral part of these financial statements.
TGI-19
Franklin Templeton Variable Insurance Products Trust
Notes to Financial Statements
Templeton Global Income Securities Fund
1. ORGANIZATION AND SIGNIFICANT ACCOUNTING POLICIES
Franklin Templeton Variable Insurance Products Trust (Trust) is registered under the Investment Company Act of 1940, as amended, (1940 Act) as an open-end investment company, consisting of twenty-three separate funds. The Templeton Global Income Securities Fund (Fund) included in this report is non-diversified. The financial statements of the remaining funds in the Trust are presented separately. Shares of the Fund are sold only to insurance company separate accounts to fund the benefits of variable life insurance policies or variable annuity contracts. The Fund offers three classes of shares: Class 1, Class 2, and Class 3. Each class of shares differs by its distribution fees, voting rights on matters affecting a single class and its exchange privilege.
The following summarizes the Fund’s significant accounting policies.
a. Security Valuation
Securities listed on a securities exchange or on the NASDAQ National Market System are valued at the last quoted sale price or the official closing price of the day, respectively. Over-the-counter securities and listed securities for which there is no reported sale are valued within the range of the most recent quoted bid and ask prices. Securities that trade in multiple markets or on multiple exchanges are valued according to the broadest and most representative market.
Corporate debt securities and government securities generally trade in the over-the-counter market rather than on a securities exchange. The Trust may utilize independent pricing services, quotations from bond dealers, and information with respect to bond and note transactions, to assist in determining a current market value for each security. The Trust’s pricing services may use valuation models or matrix pricing which considers information with respect to comparable bond and note transactions, quotations from bond dealers, or by reference to other securities that are considered comparable in such characteristics as rating, interest rate and maturity date, option adjusted spread models, prepayment projections, interest rate spreads and yield curves, to determine current value.
Foreign securities are valued as of the close of trading on the foreign stock exchange on which the security is primarily traded, or the NYSE, whichever is earlier. If no sale is reported at that time, the foreign security will be valued within the range of the most recent quoted bid and ask prices. The value is then converted into its U.S. dollar equivalent at the foreign exchange rate in effect at the close of the NYSE on the day that the value of the foreign security is determined.
The Trust has procedures to determine the fair value of individual securities and other assets for which market prices are not readily available or which may not be reliably priced. Methods for valuing these securities may include: fundamental analysis, matrix pricing, discounts from market prices of similar securities, or discounts applied due to the nature and duration of restrictions on the disposition of the securities. Due to the inherent uncertainty of valuations of such securities, the fair values may differ significantly from the values that would have been used had a ready market for such investments existed. Occasionally, events occur between the time at which trading in a security is completed and the close of the NYSE that might call into question the availability (including the reliability) of the value of a portfolio security held by the Fund. The investment manager monitors price movements following the close of trading in foreign stock markets through a series of country specific market proxies (such as baskets of American Depository Receipts, futures contracts and exchange traded funds). These price movements are measured against established trigger thresholds for each specific market proxy to assist in determining if an event has occurred. If such an event occurs, the securities may be valued using fair value procedures, which may include the use of independent pricing services. All security valuation procedures are approved by the Trust’s Board of Trustees.
b. Foreign Currency Translation
Portfolio securities and other assets and liabilities denominated in foreign currencies are translated into U.S. dollars based on the exchange rate of such currencies against U.S. dollars on the date of valuation. Purchases and sales of securities, income and expense items denominated in foreign currencies are translated into U.S. dollars at the exchange rate in effect on the transaction
TGI-20
Franklin Templeton Variable Insurance Products Trust
Notes to Financial Statements (continued)
Templeton Global Income Securities Fund
1. ORGANIZATION AND SIGNIFICANT ACCOUNTING POLICIES (continued)
b. Foreign Currency Translation (continued)
date. Occasionally, events may impact the availability or reliability of foreign exchange rates used to convert the U.S. dollar equivalent value. If such an event occurs, the foreign exchange rate will be valued at fair value using procedures established and approved by the Trust’s Board of Trustees.
The Fund does not separately report the effect of changes in foreign exchange rates from changes in market prices on securities held. Such changes are included in net realized and unrealized gain or loss from investments on the Statement of Operations.
Realized foreign exchange gains or losses arise from sales of foreign currencies, currency gains or losses realized between the trade and settlement dates on securities transactions and the difference between the recorded amounts of dividends, interest, and foreign withholding taxes and the U.S. dollar equivalent of the amounts actually received or paid. Net unrealized foreign exchange gains and losses arise from changes in foreign exchange rates on foreign denominated assets and liabilities other than investments in securities held at the end of the reporting period.
c. Joint Repurchase Agreement
The Fund may enter into a joint repurchase agreement whereby its uninvested cash balance is deposited into a joint cash account with other funds managed by the investment manager or an affiliate of the investment manager and is used to invest in one or more repurchase agreements. The value and face amount of the joint repurchase agreement are allocated to the funds based on their pro-rata interest. A repurchase agreement is accounted for as a loan by the fund to the seller, collateralized by securities which are delivered to the fund’s custodian. The market value, including accrued interest, of the initial collateralization is required to be at least 102% of the dollar amount invested by the funds, with the value of the underlying securities marked to market daily to maintain coverage of at least 100%. The joint repurchase agreement held by the Fund at year end had been entered into on December 31, 2007. The joint repurchase agreement is valued at cost.
d. Securities Purchased on a When-Issued or Delayed Delivery Basis
The Fund may purchase securities on a when-issued or delayed delivery basis, with payment and delivery scheduled for a future date. These transactions are subject to market fluctuations and are subject to the risk that the value at delivery may be more or less than the trade date purchase price. Although the Fund will generally purchase these securities with the intention of holding the securities, it may sell the securities before the settlement date. Sufficient assets have been segregated for these securities.
e. Foreign Currency Contracts
When the Fund purchases or sells foreign securities it may enter into foreign exchange contracts to minimize foreign exchange risk from the trade date to the settlement date of the transactions. A foreign exchange contract is an agreement between two parties to exchange different currencies at an agreed upon exchange rate at a future date. Realized and unrealized gains and losses on these contracts are included in the Statement of Operations.
The Fund may also enter into forward exchange contracts to hedge against fluctuations in foreign exchange rates. These contracts are valued daily by the Fund and the unrealized gains or losses on the contracts, as measured by the difference between the contractual forward foreign exchange rates and the forward rates at the reporting date, are included in the Statement of Assets and Liabilities. Realized and unrealized gains and losses on these contracts are included in the Statement of Operations.
The risks of these contracts include movement in the values of the foreign currencies relative to the U.S. dollar and the possible inability of the counterparties to fulfill their obligations under the contracts, which may be in excess of the amount reflected in the Statement of Assets and Liabilities.
TGI-21
Franklin Templeton Variable Insurance Products Trust
Notes to Financial Statements (continued)
Templeton Global Income Securities Fund
1. ORGANIZATION AND SIGNIFICANT ACCOUNTING POLICIES (continued)
f. Income Taxes
No provision has been made for U.S. income taxes because it is the Fund’s policy to qualify as a regulated investment company under the Internal Revenue Code and to distribute to shareholders substantially all of its taxable income and net realized gains.
Foreign securities held by the Fund may be subject to foreign taxation on dividend and interest income received. Foreign taxes, if any, are recorded based on the tax regulations and rates that exist in the foreign markets in which the Fund invests.
g. Security Transactions, Investment Income, Expenses and Distributions
Security transactions are accounted for on trade date. Realized gains and losses on security transactions are determined on a specific identification basis. Interest income and estimated expenses are accrued daily. Amortization of premium and accretion of discount on debt securities are included in interest income. Distributions to shareholders are recorded on the ex-dividend date and are determined according to income tax regulations (tax basis). Distributable earnings determined on a tax basis may differ from earnings recorded in accordance with accounting principles generally accepted in the United States of America. These differences may be permanent or temporary. Permanent differences are reclassified among capital accounts to reflect their tax character. These reclassifications have no impact on net assets or the results of operations. Temporary differences are not reclassified, as they may reverse in subsequent periods.
Common expenses incurred by the Trust are allocated among the funds based on the ratio of net assets of each fund to the combined net assets of the Trust. Fund specific expenses are charged directly to the fund that incurred the expense.
Realized and unrealized gains and losses and net investment income, other than class specific expenses, are allocated daily to each class of shares based upon the relative proportion of net assets of each class. Differences in per share distributions, by class, are generally due to differences in class specific expenses.
Inflation-indexed bonds provide an inflation hedge through periodic increases in the security’s interest accruals and principal redemption value, by amounts corresponding to the current rate of inflation. Any such adjustments, including adjustments to principal redemption value, are recorded as interest income.
h. Accounting Estimates
The preparation of financial statements in accordance with accounting principles generally accepted in the United States of America requires management to make estimates and assumptions that affect the reported amounts of assets and liabilities at the date of the financial statements and the amounts of income and expenses during the reporting period. Actual results could differ from those estimates.
i. Redemption Fees
Redemptions and exchanges of Class 3 shares held 60 days or less may be subject to the fund’s redemption fee, which is 1% of the amount redeemed. Such fees are retained by the fund and accounted for as an addition to paid-in capital.
j. Guarantees and Indemnifications
Under the Trust’s organizational documents, its officers and trustees are indemnified by the Trust against certain liabilities arising out of the performance of their duties to the Trust. Additionally, in the normal course of business, the Trust, on behalf of the Fund, enters into contracts with service providers that contain general indemnification clauses. The Trust’s maximum exposure under these arrangements is unknown as this would involve future claims that may be made against the Trust that have not yet occurred. Currently, the Trust expects the risk of loss to be remote.
TGI-22
Franklin Templeton Variable Insurance Products Trust
Notes to Financial Statements (continued)
Templeton Global Income Securities Fund
2. SHARES OF BENEFICIAL INTEREST
At December 31, 2007, there were an unlimited number of shares authorized (without par value). Transactions in the Fund’s shares were as follows:
| | | | | | | | | | | | | | |
| | | Year Ended December 31, | |
| | | 2007 | | | 2006 | |
| Class 1 Shares: | | Shares | | | Amount | | | Shares | | | Amount | |
Shares sold | | 5,103,718 | | | $ | 85,032,506 | | | 2,027,528 | | | $ | 30,612,502 | |
Shares issued in reinvestment of distributions | | 153,227 | | | | 2,456,235 | | | 137,929 | | | | 2,013,759 | |
Shares redeemed | | (1,977,376 | ) | | | (31,929,569 | ) | | (1,040,680 | ) | | | (15,639,327 | ) |
| | | | |
Net increase (decrease) | | 3,279,569 | | | $ | 55,559,172 | | | 1,124,777 | | | $ | 16,986,934 | |
| | | | |
Class 2 Shares: | | | | | | | | | | | | | | |
Shares sold | | 16,336,797 | | | $ | 264,154,676 | | | 8,960,584 | | | $ | 133,647,009 | |
Shares issued in reinvestment of distributions | | 523,540 | | | | 8,266,690 | | | 226,190 | | | | 3,259,404 | |
Shares redeemed | | (1,388,223 | ) | | | (22,312,397 | ) | | (230,816 | ) | | | (3,418,676 | ) |
| | | | |
Net increase (decrease) | | 15,472,114 | | | $ | 250,108,969 | | | 8,955,958 | | | $ | 133,487,737 | |
| | | | |
Class 3 Shares: | | | | | | | | | | | | | | |
Shares sold | | 3,533,597 | | | $ | 56,987,401 | | | 2,255,932 | | | $ | 33,481,415 | |
Shares issued in reinvestment of distributions | | 103,199 | | | | 1,628,484 | | | 29,966 | | | | 431,514 | |
Shares redeemed | | (475,906 | ) | | | (7,693,094 | ) | | (396,229 | ) | | | (5,978,234 | ) |
| | | | |
Net increase (decrease) | | 3,160,890 | | | $ | 50,922,791 | | | 1,889,669 | | | $ | 27,934,695 | |
| | | | |
3. TRANSACTIONS WITH AFFILIATES
Franklin Resources, Inc. is the holding company for various subsidiaries that together are referred to as Franklin Templeton Investments. Certain officers and trustees of the Trust are also officers and/or directors of the following subsidiaries:
| | |
| Subsidiary | | Affiliation |
Franklin Advisers, Inc. (Advisers) | | Investment manager |
Franklin Templeton Services, LLC (FT Services) | | Administrative manager |
Franklin Templeton Distributors, Inc. (Distributors) | | Principal underwriter |
Franklin Templeton Investor Services, LLC (Investor Services) | | Transfer agent |
a. Management Fees
The Fund pays an investment management fee to Advisers based on the average daily net assets of the Fund as follows:
| | |
| Annualized Fee Rate | | Net Assets |
| 0.625% | | Up to and including $100 million |
| 0.500% | | Over $100 million, up to and including $250 million |
| 0.450% | | Over $250 million, up to and including $10 billion |
| 0.440% | | Over $10 billion, up to and including $12.5 billion |
| 0.420% | | Over $12.5 billion, up to and including $15 billion |
| 0.400% | | In excess of $15 billion |
TGI-23
Franklin Templeton Variable Insurance Products Trust
Notes to Financial Statements (continued)
Templeton Global Income Securities Fund
3. TRANSACTIONS WITH AFFILIATES (continued)
Effective January 1, 2008, the Fund will pay fees based on the average daily net assets of the Fund as follows:
| | |
| Annualized Fee Rate | | Net Assets |
| 0.625% | | Up to and including $100 million |
| 0.500% | | Over $100 million, up to and including $250 million |
| 0.450% | | Over $250 million, up to and including $7.5 billion |
| 0.440% | | Over $7.5 billion, up to and including $10 billion |
| 0.430% | | Over $10 billion, up to and including $12.5 billion |
| 0.420% | | Over $12.5 billion, up to and including $15 billion |
| 0.400% | | In excess of $15 billion |
b. Administrative Fees
Under an agreement with Advisers, FT Services provides administrative services to the Fund. The fee is paid by Advisers based on average daily net assets, and is not an additional expense of the Fund.
c. Distribution Fees
The Fund’s Board of Trustees has adopted distribution plans for Class 2 and Class 3 shares pursuant to Rule 12b-1 under the 1940 Act. Under the Fund’s compensation distribution plans, the Fund pays Distributors for costs incurred in connection with the servicing, sale and distribution of the Fund’s shares up to 0.25% and 0.35% per year of its average daily net assets of Class 2 and Class 3, respectively. The Board of Trustees has agreed to limit the current rate to 0.25% per year for Class 3.
d. Transfer Agent Fees
Investor Services, under terms of an agreement, performs shareholder servicing for the Fund and is not paid by the Fund for the services.
4. EXPENSE OFFSET ARRANGEMENT
The Fund has entered into an arrangement with its custodian whereby credits realized as a result of uninvested cash balances are used to reduce a portion of the Fund’s custodian expenses. During the year ended December 31, 2007, the custodian fees were reduced as noted in the Statement of Operations.
5. INCOME TAXES
The Fund has reviewed the tax positions taken on federal income tax returns, for each of the three open tax years and as of December 31, 2007 and has determined that no provision for income tax is required in the Fund’s financial statements.
For tax purposes, capital losses may be carried over to offset future capital gains, if any. At December 31, 2007, the capital loss carryforwards were as follows:
| | | |
| Capital loss carryforwards expiring in: | | |
2008 | | $ | 2,370,518 |
2009 | | | 1,649,033 |
2010 | | | 177,731 |
| | | |
| | $ | 4,197,282 |
| | | |
During the year ended December 31, 2007, the Fund utilized $969,560 of capital loss carryforwards.
On December 31, 2007, the Fund had expired capital loss carryforwards of $1,600,297, which were reclassified to paid-in capital.
TGI-24
Franklin Templeton Variable Insurance Products Trust
Notes to Financial Statements (continued)
Templeton Global Income Securities Fund
5. INCOME TAXES (continued)
The tax character of distributions paid during the years ended December 31, 2007 and 2006, was as follows:
| | | | | | |
| | | 2007 | | 2006 |
Distributions paid from ordinary income | | $ | 12,351,409 | | $ | 5,704,677 |
| | | | | | |
At December 31, 2007, the cost of investments, net unrealized appreciation (depreciation) and undistributed ordinary income for income tax purposes were as follows:
| | | | |
Cost of investments | | $ | 658,663,346 | |
| | | | |
| |
Unrealized appreciation | | $ | 24,152,942 | |
Unrealized depreciation | | | (6,479,336 | ) |
| | | | |
Net unrealized appreciation (depreciation) | | $ | 17,673,606 | |
| | | | |
Distributable earnings – undistributed ordinary income | | $ | 39,667,569 | |
| | | | |
Net investment income differs for financial statement and tax purposes primarily due to differing treatments of foreign currency transactions, bond discounts and premiums and inflation related adjustments on foreign securities.
Net realized gains (losses) differ for financial statement and tax purposes primarily due to differing treatments of wash sales, foreign currency transactions, bond discounts and premiums and inflation related adjustments on foreign securities.
6. INVESTMENT TRANSACTIONS
Purchases and sales of investments (excluding short term securities) for the year ended December 31, 2007, aggregated $401,340,329 and $163,318,439, respectively.
7. FORWARD EXCHANGE CONTRACTS
At December 31, 2007, the Fund had the following forward exchange contracts outstanding:
| | | | | | | | | | | | | | |
| | | Contract
Amounta | | | Settlement
Date | | Unrealized
Gain | | Unrealized
(Loss) | |
| Contracts to Buy | | | | | | | | | | | | |
| 33,600,000 | | Japanese Yen | | 292,601 | | | 1/22/08 | | | 9,461 | | | — | |
| 64,500,000 | | Iceland Krona | | 1,000,698 | | | 1/28/08 | | $ | 18,959 | | $ | — | |
| 45,000,000 | | Norwegian Krone | | 8,047,498 | | | 1/28/08 | | | 226,339 | | | — | |
| 34,696,800 | | Japanese Yen | | 220,102 | EUR | | 1/31/08 | | | — | | | (9,148 | ) |
| 57,427,500 | | Kazakhstan Tenge | | 465,000 | | | 2/06/08 | | | 7,320 | | | — | |
| 49,956,750 | | Kazakhstan Tenge | | 405,000 | | | 2/06/08 | | | 5,876 | | | — | |
| 28,395,800 | | Kazakhstan Tenge | | 230,000 | | | 2/07/08 | | | 3,510 | | | — | |
| 88,025,000 | | Indian Rupee | | 2,945,260 | NZD | | 2/29/08 | | | — | | | (14,535 | ) |
| 773,199,000 | | Kazakhstan Tenge | | 6,300,000 | | | 3/25/08 | | | 4,752 | | | — | |
| 101,142,000 | | Japanese Yen | | 869,956 | | | 5/27/08 | | | 50,956 | | | — | |
| 531,699,750 | | Japanese Yen | | 4,500,000 | | | 6/30/08 | | | 356,576 | | | — | |
| 426,288,750 | | Japanese Yen | | 3,640,631 | | | 7/07/08 | | | 255,310 | | | — | |
| 433,331,250 | | Japanese Yen | | 3,698,786 | | | 7/17/08 | | | 264,709 | | | — | |
| 175,000,000 | | Japanese Yen | | 1,502,339 | | | 7/18/08 | | | 98,440 | | | — | |
| 293,932,800 | | Kazakhstan Tenge | | 2,400,000 | | | 7/25/08 | | | — | | | (66,153 | ) |
| 125,841,100 | | Japanese Yen | | 1,100,000 | | | 8/07/08 | | | 52,966 | | | — | |
TGI-25
Franklin Templeton Variable Insurance Products Trust
Notes to Financial Statements (continued)
Templeton Global Income Securities Fund
7. FORWARD EXCHANGE CONTRACTS (continued)
| | | | | | | | | | | | | | |
| | | Contract
Amounta | | | Settlement
Date | | Unrealized
Gain | | Unrealized
(Loss) | |
| Contracts to Buy | | | | | | | | | | |
| 154,044,450 | | Japanese Yen | | 1,350,000 | | | 8/08/08 | | $ | 61,481 | | $ | — | |
| 154,325,250 | | Japanese Yen | | 1,350,000 | | | 8/11/08 | | | 64,397 | | | — | |
| 144,838,200 | | Japanese Yen | | 1,300,000 | | | 8/20/08 | | | 28,413 | | | — | |
| 145,327,000 | | Japanese Yen | | 1,300,000 | | | 8/20/08 | | | 32,896 | | | — | |
| 143,907,400 | | Japanese Yen | | 1,300,000 | | | 8/25/08 | | | 20,409 | | | — | |
| 27,917,500 | | Japanese Yen | | 251,283 | | | 9/04/08 | | | 5,079 | | | — | |
| 422,114,000 | | Japanese Yen | | 2,800,000 | EUR | | 9/12/08 | | | — | | | (202,974 | ) |
| 25,000,000 | | Indian Rupee | | 868,538 | NZD | | 9/24/08 | | | — | | | (15,860 | ) |
| 167,701,600 | | Japanese Yen | | 1,520,000 | | | 9/25/08 | | | 22,597 | | | — | |
| 167,587,600 | | Japanese Yen | | 1,520,000 | | | 9/25/08 | | | 21,548 | | | — | |
| 334,510,300 | | Japanese Yen | | 3,020,000 | | | 9/26/08 | | | 57,230 | | | — | |
| 167,957,300 | | Japanese Yen | | 1,510,000 | | | 9/26/08 | | | 35,074 | | | — | |
| 361,308,750 | | Kazakhstan Tenge | | 2,850,000 | | | 10/10/08 | | | — | | | (21,766 | ) |
| 724,140,625 | | Chilean Peso | | 1,437,500 | | | 10/20/08 | | | 5,634 | | | — | |
| 724,284,375 | | Chilean Peso | | 1,437,500 | | | 10/20/08 | | | 5,921 | | | — | |
| 6,050,000 | | Swiss Franc | | 5,221,729 | | | 10/20/08 | | | 179,349 | | | — | |
| 646,280,000 | | Chilean Peso | | 1,280,000 | | | 10/22/08 | | | 7,895 | | | — | |
| 882,350,000 | | Chilean Peso | | 1,750,000 | | | 10/23/08 | | | 8,282 | | | — | |
| 6,729,255 | | Swiss Franc | | 5,850,000 | | | 10/23/08 | | | 157,794 | | | — | |
| 1,703,596 | | Swiss Franc | | 1,475,000 | | | 10/24/08 | | | 45,975 | | | — | |
| 1,699,532 | | Swiss Franc | | 1,475,000 | | | 10/27/08 | | | 42,428 | | | — | |
| 192,000,000 | | Kazakhstan Tenge | | 1,500,000 | | | 11/03/08 | | | — | | | (4,611 | ) |
| 3,423,150 | | Swiss Franc | | 3,000,000 | | | 11/03/08 | | | 56,737 | | | — | |
| 1,342,374,000 | | Japanese Yen | | 12,100,000 | | | 11/04/08 | | | 284,720 | | | — | |
| 5,200,000 | | Swiss Franc | | 4,705,137 | | | 11/06/08 | | | — | | | (61,498 | ) |
| 144,407,250 | | Japanese Yen | | 1,362,076 | | | 11/14/08 | | | — | | | (28,782 | ) |
| 2,670,000 | | Euro | | 9,865,650 | RON | | 12/03/08 | | | — | | | (47,260 | ) |
| 2,225,000 | | Euro | | 8,068,963 | RON | | 12/04/08 | | | 21,531 | | | — | |
| 345,000,000 | | Japanese Yen | | 3,124,123 | | | 12/04/08 | | | 65,984 | | | — | |
| 38,027,500 | | Japanese Yen | | 355,790 | | | 12/05/08 | | | — | | | (4,135 | ) |
| 186,512,000 | | Japanese Yen | | 1,745,027 | | | 12/05/08 | | | — | | | (20,281 | ) |
| 673,264,800 | | Kazakhstan Tenge | | 5,200,000 | | | 12/12/08 | | | 1,319 | | | — | |
| 280,943,000 | | Japanese Yen | | 2,600,000 | | | 12/15/08 | | | — | | | (69 | ) |
| 281,190,000 | | Japanese Yen | | 2,600,000 | | | 12/17/08 | | | 2,606 | | | — | |
| 142,890,000 | | Kazakhstan Tenge | | 1,100,000 | | | 12/22/08 | | | 1,616 | | | — | |
| | | | |
| Contracts to Sell | | | | | | | | | | |
| 35,571,270 | | Mexican Peso | | 143,000,063 | INR | | 1/22/08 | | | 370,549 | | | — | |
| 30,321,722 | | Mexican Peso | | 121,514,299 | INR | | 1/25/08 | | | 306,174 | | | — | |
| 19,609,025 | | Mexican Peso | | 78,255,696 | INR | | 2/27/08 | | | 191,227 | | | — | |
| 39,305,785 | | Mexican Peso | | 155,595,882 | INR | | 2/28/08 | | | 351,393 | | | — | |
| 10,166,171 | | Mexican Peso | | 40,344,448 | INR | | 3/03/08 | | | 93,598 | | | — | |
| 10,703,553 | | Mexican Peso | | 2,035,283 | BRL | | 4/22/08 | | | 153,032 | | | — | |
| 22,656,216 | | Mexican Peso | | 4,426,571,459 | COP | | 4/22/08 | | | 100,071 | | | — | |
| 2,329,569 | | New Zealand Dollar | | 74,243,350 | INR | | 4/28/08 | | | 114,116 | | | — | |
| 12,477,832 | | Mexican Peso | | 2,353,693,412 | COP | | 5/06/08 | | | 13,222 | | | — | |
| 12,494,827 | | Mexican Peso | | 2,368,373 | BRL | | 5/07/08 | | | 173,027 | | | — | |
| 9,640,135 | | Mexican Peso | | 447,379,362 | CLP | | 5/16/08 | | | 22,095 | | | — | |
| 6,597,015 | | Mexican Peso | | 302,613,010 | CLP | | 5/20/08 | | | 8,202 | | | — | |
TGI-26
Franklin Templeton Variable Insurance Products Trust
Notes to Financial Statements (continued)
Templeton Global Income Securities Fund
7. FORWARD EXCHANGE CONTRACTS (continued)
| | | | | | | | | | | | | | |
| | | Contract
Amounta | | | Settlement
Date | | Unrealized
Gain | | Unrealized
(Loss) | |
| Contracts to Sell | | | | | | | | | | |
| 7,962,312 | | Mexican Peso | | 365,240,813 | CLP | | 5/20/08 | | $ | 9,900 | | $ | — | |
| 30,000,000 | | Mexican Peso | | 113,235,000 | INR | | 5/21/08 | | | 139,020 | | | — | |
| 46,737,959 | | Mexican Peso | | 507,359,240 | KZT | | 5/27/08 | | | — | | | (152,042 | ) |
| 40,184,041 | | Mexican Peso | | 435,289,606 | KZT | | 5/29/08 | | | — | | | (139,067 | ) |
| 5,422,023 | | Mexican Peso | | 248,735,300 | CLP | | 6/12/08 | | | 7,585 | | | — | |
| 11,184,356 | | Mexican Peso | | 123,232,028 | KZT | | 6/25/08 | | | — | | | (25,521 | ) |
| 6,853,159 | | Mexican Peso | | 75,609,535 | KZT | | 6/25/08 | | | — | | | (14,842 | ) |
| 10,925,894 | | Mexican Peso | | 120,542,108 | KZT | | 6/25/08 | | | — | | | (23,671 | ) |
| 31,357,983 | | Mexican Peso | | 5,629,698,616 | COP | | 6/27/08 | | | — | | | (112,277 | ) |
| 23,073,608 | | Mexican Peso | | 6,530,985 | PEN | | 6/30/08 | | | 111,579 | | | — | |
| 2,017,928 | | Mexican Peso | | 91,755,188 | CLP | | 9/15/08 | | | 2,580 | | | — | |
| 22,711,151 | | Mexican Peso | | 1,037,699,748 | CLP | | 10/01/08 | | | 41,848 | | | — | |
| 23,225,918 | | Mexican Peso | | 1,057,613,091 | CLP | | 10/02/08 | | | 35,800 | | | — | |
| 2,888,971,900 | | South Korean Won | | 3,505,821 | CHF | | 11/13/08 | | | 17,945 | | | — | |
| 14,750,000 | | Romanian Lei | | 32,712,353 | NOK | | 11/17/08 | | | 53,822 | | | — | |
| 2,722,612,000 | | South Korean Won | | 3,359,632 | CHF | | 11/17/08 | | | 66,822 | | | — | |
| 5,797,680,000 | | South Korean Won | | 6,831,892 | CHF | | 11/25/08 | | | — | | | (144,886 | ) |
| 6,526,957,500 | | South Korean Won | | 7,700,789 | CHF | | 11/25/08 | | | — | | | (154,599 | ) |
| 2,307,240,000 | | South Korean Won | | 2,746,093 | CHF | | 11/26/08 | | | — | | | (33,255 | ) |
| 4,575,729,600 | | South Korean Won | | 5,432,165 | CHF | | 11/28/08 | | | — | | | (78,234 | ) |
| 1,819,958,400 | | South Korean Won | | 2,184,404 | CHF | | 11/28/08 | | | — | | | (9,849 | ) |
| 2,435,035,200 | | South Korean Won | | 2,944,527 | CHF | | 12/02/08 | | | 6,514 | | | — | |
| 7,728,240,000 | | South Korean Won | | 9,251,942 | CHF | | 12/03/08 | | | — | | | (62,570 | ) |
| 357,000 | | Euro | | 56,026,866 | JPY | | 12/08/08 | | | — | | | (1,305 | ) |
| 3,734,309,600 | | South Korean Won | | 4,513,743 | CHF | | 12/09/08 | | | 8,683 | | | — | |
| 2,671,578,000 | | South Korean Won | | 4,119,944 | SGD | | 12/10/08 | | | 27,503 | | | — | |
| 12,319,825 | | Romanian Lei | | 31,800,179 | SEK | | 12/15/08 | | | — | | | (5,008 | ) |
| 2,136,044,750 | | South Korean Won | | 2,610,663 | CHF | | 12/15/08 | | | 30,880 | | | — | |
| | | | | | | | | | | | | | |
| Unrealized gain (loss) on forward exchange contracts | | | | | | | | 5,049,276 | | | (1,454,198 | ) |
| | | | | | | | | | | | | | |
| Net unrealized gain (loss) on forward exchange contracts | | | | | | | $ | 3,595,078 | | | | |
| | | | | | | | | | | | | | |
aIn | U.S. dollars unless otherwise indicated. |
Currency Abbreviations
BRL - Brazilian Real
CHF - Swiss Franc
CLP - Chiliean Peso
COP - Colombian Peso
EUR - Euro
INR - Indian Rupee
JPY - Japanese Yen
KZT - Kazakhstan Tenge
MXN - Mexican Peso
NOK - Norwegian Krone
NZD - New Zealand Dollar
PEN - Peruvian Nuevo Sol
RON - Romanian Lei
SEK - Swedish Krona
SGD - Singapore Dollar
TGI-27
Franklin Templeton Variable Insurance Products Trust
Notes to Financial Statements (continued)
Templeton Global Income Securities Fund
8. CREDIT RISK
The Fund has 13.98% of its portfolio invested in below investment grade and comparable quality unrated high yield securities, which tend to be more sensitive to economic conditions than higher rated securities. The risk of loss due to default by the issuer may be significantly greater for the holders of high yielding securities because such securities are generally unsecured and are often subordinated to other creditors of the issuer.
9. CONCENTRATION OF RISK
Investing in foreign securities may include certain risks and considerations not typically associated with investing in U.S. securities, such as fluctuating currency values and changing local and regional economic, political and social conditions, which may result in greater market volatility. In addition, certain foreign securities may not be as liquid as U.S. securities.
10. REGULATORY AND LITIGATION MATTERS
As part of various investigations by a number of federal, state, and foreign regulators and governmental entities, including the Securities and Exchange Commission (“SEC”), relating to certain practices in the mutual fund industry, including late trading, market timing and marketing support payments to securities dealers who sell fund shares (“marketing support”), Franklin Resources, Inc. and certain of its subsidiaries (collectively, the “Company”), entered into settlements with certain of those regulators and governmental entities. Specifically, the Company entered into settlements with the SEC, among others, concerning market timing and marketing support.
On June 6, 2007, the SEC posted for public comment the proposed plan of distribution for the market timing settlement. Once the SEC approves the final plan of distribution, disbursements of settlement monies will be made promptly to individuals who were shareholders of the designated funds during the relevant period, in accordance with the terms and conditions of the settlement and plan.
In addition, the Company, as well as most of the mutual funds within Franklin Templeton Investments and certain current or former officers, Company directors, fund directors, and employees, have been named in private lawsuits (styled as shareholder class actions, or as derivative actions on behalf of either the named funds or Franklin Resources, Inc.). The lawsuits relate to the industry practices referenced above.
The Company and fund management believe that the claims made in each of the private lawsuits referenced above are without merit and intend to defend against them vigorously. The Company cannot predict with certainty the eventual outcome of these lawsuits, nor whether they will have a material negative impact on the Company. If it is determined that the Company bears responsibility for any unlawful or inappropriate conduct that caused losses to the Fund, it is committed to making the Trust or its shareholders whole, as appropriate.
11. NEW ACCOUNTING PRONOUNCEMENT
In September 2006, the Financial Accounting Standards Board (FASB) issued FASB Statement No. 157, “Fair Value Measurement” (SFAS 157), which defines fair value, establishes a framework for measuring fair value, and expands disclosures about fair value measurements. SFAS 157 is effective for fiscal years beginning after November 15, 2007, and interim periods within those fiscal years. The Trust believes the adoption of SFAS 157 will have no material impact on its financial statements.
TGI-28
Franklin Templeton Variable Insurance Products Trust
Templeton Global Income Securities Fund
Report of Independent Registered Public Accounting Firm
To the Board of Trustees and Shareholders of
Franklin Templeton Variable Insurance Products Trust
In our opinion, the accompanying statement of assets and liabilities, including the statement of investments, and the related statements of operations and of changes in net assets and the financial highlights present fairly, in all material respects, the financial position of Templeton Global Income Securities Fund (one of the funds constituting Franklin Templeton Variable Insurance Products Trust, hereafter referred to as the “Fund”) at December 31, 2007, the results of its operations for the year then ended, the changes in its net assets for each of the two years in the period then ended and the financial highlights for each of the periods presented, in conformity with accounting principles generally accepted in the United States of America. These financial statements and financial highlights (hereafter referred to as “financial statements”) are the responsibility of the Fund’s management. Our responsibility is to express an opinion on these financial statements based on our audits. We conducted our audits of these financial statements in accordance with the standards of the Public Company Accounting Oversight Board (United States). Those standards require that we plan and perform the audit to obtain reasonable assurance about whether the financial statements are free of material misstatement. An audit includes examining, on a test basis, evidence supporting the amounts and disclosures in the financial statements, assessing the accounting principles used and significant estimates made by management, and evaluating the overall financial statement presentation. We believe that our audits, which included confirmation of securities at December 31, 2007 by correspondence with the custodian and brokers, provide a reasonable basis for our opinion.
PricewaterhouseCoopers LLP
San Francisco, California
February 14, 2008
TGI-29
Franklin Templeton Variable Insurance Products Trust
Tax Designation (unaudited)
Templeton Global Income Securities Fund
At December 31, 2007, more than 50% of the Fund’s total assets were invested in securities of foreign issuers. In most instances, foreign taxes were withheld from income paid to the Fund on these investments. The Fund elects to treat foreign taxes paid as allowed under Section 853 of the Internal Revenue Code. This election will allow shareholders of record as of the 2008 distribution date, to treat their proportionate share of foreign taxes paid by the Fund as having been paid directly by them. The shareholder shall consider these amounts as foreign taxes paid in the tax year in which they receive the Fund distribution.
TGI-30
TEMPLETON GROWTH SECURITIES FUND
This annual report for Templeton Growth Securities Fund covers the fiscal year ended December 31, 2007.
Performance Summary as of 12/31/07
Average annual total return of Class 1 shares represents the average annual change in value, assuming reinvestment of dividends and capital gains. Average returns smooth out variations in returns, which can be significant; they are not the same as year-by-year results.
Periods ended 12/31/07
| | | | | | |
| | | 1-Year | | 5-Year | | 10-Year |
Average Annual Total Return | | +2.55% | | +16.07% | | +8.62% |
Total Return Index Comparison for Hypothetical $10,000 Investment (1/1/98–12/31/07)
The graph below shows the change in value of a hypothetical $10,000 investment in the Fund over the indicated period and includes reinvestment of any income or distributions. The Fund’s performance is compared to the performance of the Morgan Stanley Capital International (MSCI) World Index. One cannot invest directly in an index, nor is an index representative of the Fund’s portfolio. Please see Important Notes to Performance Information preceding the Fund Summaries.
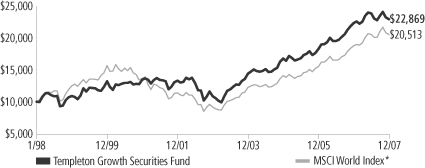
*Source: Standard & Poor’s Micropal. Please see Index Descriptions following the Fund Summaries.
Templeton Growth Securities Fund – Class 1
Performance reflects the Fund’s Class 1 operating expenses, but does not include any contract fees, expenses or sales charges. If they had been included, performance would be lower. These charges and deductions, particularly for variable life policies, can have a significant effect on contract values and insurance benefits. See the contract prospectus for a complete description of these expenses, including sales charges.
Performance data represent past performance, which does not guarantee future results. Investment return and principal value will fluctuate, and you may have a gain or loss when you sell your shares.
Current performance may differ from figures shown.
TG-1
Fund Goal and Main Investments: Templeton Growth Securities Fund seeks long-term capital growth. The Fund normally invests primarily in equity securities of companies located anywhere in the world, including those in the U.S. and in emerging markets.
Performance Overview
You can find the Fund’s one-year total return in the Performance Summary. The Fund underperformed the +9.57% return of the MSCI World Index for the period under review.1
Economic and Market Overview
In spite of elevated energy prices and widespread fears of contagion from the deteriorating U.S. housing situation, the global economy remained resilient in 2007. Consumer and corporate demand strength, particularly in China and other developing economies, generally favorable employment and accommodative monetary policies continued to underpin the current expansionary period that began in 2002.
These factors also contributed to the strength of global equity markets during 2007. However, concerns about slower growth and declining asset quality surfaced in the first quarter. These were initially centered on the U.S. subprime mortgage market but spread in August to global capital markets. Difficulties in assessing risk and the value of collateral in the structured finance industry contributed to declining risk appetite among lenders and investors. The private equity industry, which relies on the availability of cheap credit, played a pivotal role in several large and high-profile acquisitions and helped boost merger and acquisition activity in the first half of the year. This was an important driver of equity performance, but as liquidity dried up in the second half of the year, significantly slower money flows from private equity weighed on market performance. However, global merger and acquisition activity still reached record levels. The staggering $4.5 trillion of deals announced in 2007 eclipsed the previous record from 2006 by 24%.2
To alleviate the credit crunch and restore investor confidence, the world’s major central banks infused capital into the system, and the U.S. Federal Reserve Board reduced its target interest rate by a full
1. Source: Standard & Poor’s Micropal. One cannot invest directly in an index, nor is an index representative of the Fund’s portfolio. Please see Index Descriptions following the Fund Summaries.
2. Source: “For Deal Makers, Tale of Two Halves,” The Wall Street Journal, 1/2/08.
Fund Risks: The Fund’s investments in stocks offer the potential for long-term gains but can be subject to short-term price fluctuations. Foreign investing, especially in emerging markets, involves additional risks, including currency fluctuations, economic instability, market volatility, and political and social instability. By having significant investments in one or more countries or in particular sectors from time to time, the Fund may be at greater risk of adverse developments in a country or sector than a fund that invests more broadly. The Fund’s prospectus also includes a description of the main investment risks.
TG-2
percentage point. However, credit and equity markets continued to face headwinds as write-downs and losses from subprime mortgage financing affected many large financial institutions toward the end of the year, and equity prices remained volatile.
For the year, however, global and non-U.S. equity markets registered the fifth consecutive year of double-digit total returns, making this an exceptionally strong period for investors in global equities. Broad-based stock performance by European and Asian shares at least doubled that of U.S. stocks, while emerging market equity returns more than tripled those in developed markets. Led by the BRIC countries, Brazil, Russia, India and China, emerging market economies continued to grow at accelerated rates, supporting elevated prices for oil and other commodities. At the same time, investment inflows from developed economies continued to underpin equity prices in emerging markets. In addition, U.S. dollar weakness versus the currencies of many major trading partners enhanced equity returns for U.S.-based investors holding stocks denominated in these currencies.
Investment Strategy
Our investment philosophy is bottom-up, value-oriented and long-term. In choosing investments, we will focus on the market price of a company’s securities relative to our evaluation of the company’s potential long-term earnings, asset value and cash flow. Among factors we may consider are a company’s historical value measures, including price/earnings ratio, profit margins and liquidation value. We do in-depth research to construct a bargain list from which we buy.
Manager’s Discussion
Among the most significant contributors to the Fund’s performance relative to the MSCI World Index for the year under review were German electronics and industrial engineering conglomerate Siemens, U.S. enterprise software giant Oracle and U.K. wireless phone services carrier Vodafone Group. However, the Fund also had some major detractors from relative performance during the period including U.S. medical device supplier Boston Scientific, U.S. wireless telecommunications service provider Sprint Nextel and U.K-based Royal Bank of Scotland Group.
From a sector perspective, the financials sector was the largest contributor to relative performance for the reporting period.3 Although stock
3. The financials sector comprises capital markets, commercial banks, diversified financial services, insurance, and real estate management and development in the SOI.
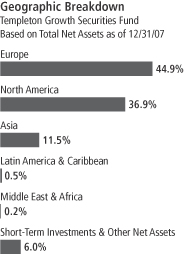
TG-3
selection detracted, our underweighted position benefited the Fund’s performance overall. Within the sector, Hong Kong-based real estate development firm Cheung Kong (Holdings) and Italian bank Intesa Sanpaolo were among the best performers. Our overweighted allocation relative to the index in the telecommunication services sector also boosted Fund performance.4 Significant contributors within the sector were France Telecom and Singapore Telecommunications. Driven by stock selection, the industrials sector, which includes Siemens, also positively affected relative performance for the period.5
On the other hand, some sectors weighed on the Fund’s relative performance for the year. Our underweighted allocation and stock selection in the materials sector hampered Fund returns relative to the index.6 Within the sector, our holding in Finnish paper and forest products manufacturer UPM-Kymmene was a notable detractor. Our overweighted allocation in the consumer discretionary sector also impaired relative performance.7 Within the sector, U.S. companies Time Warner, Chico’s FAS and Comcast detracted from Fund returns. Additionally, overweighting and stock selection in the health care sector weighed on the Fund’s relative results.8 Most detractors within the sector were U.S. based and included pharmaceutical company Pfizer and biotechnology firm Amgen.
From a geographic perspective, our holdings in France, underweighting in Japan and position in Mexico (not part of the index) contributed the most to relative Fund performance. Conversely, stock selection in the U.S. and Finland, and underweighting in Canada detracted.
It is important to recognize the effect of currency movements on the Fund’s performance. In general, if the value of the U.S. dollar goes up
4. The telecommunication services sector comprises diversified telecommunication services and wireless telecommunication services in the SOI.
5. The industrials sector comprises aerospace and defense, air freight and logistics, building products, commercial services and supplies, electrical equipment, and industrial conglomerates in the SOI.
6. The materials sector comprises paper and forest products in the SOI.
7. The consumer discretionary sector comprises auto components; automobiles; hotels, restaurants and leisure; Internet and catalog retail; leisure equipment and products; media; and specialty retail in the SOI.
8. The health care sector comprises biotechnology, health care equipment and supplies, health care providers and services, and pharmaceuticals in the SOI.
Top 10 Holdings
Templeton Growth Securities Fund
12/31/07
| | |
Company
Sector/Industry,
Country | | % of Total
Net Assets |
| |
| Microsoft Corp. | | 3.0% |
| Software, U.S. | | |
| |
| Siemens AG | | 2.7% |
| Industrial Conglomerates, Germany | | |
| |
| Oracle Corp. | | 2.2% |
| Software, U.S. | | |
| |
| General Electric Co. | | 2.2% |
| Industrial Conglomerates, U.S. | | |
| |
| Seagate Technology | | 2.2% |
| Computers & Peripherals, U.S. | | |
| |
| News Corp., A | | 2.1% |
| Media, U.S. | | |
| |
| Pfizer Inc. | | 2.0% |
| Pharmaceuticals, U.S. | | |
| |
| Vodafone Group PLC | | 1.9% |
| Wireless Telecommunication Services, U.K. | | |
| |
| Intesa Sanpaolo SpA | | 1.9% |
| Commercial Banks, Italy | | |
| |
| BP PLC | | 1.8% |
| Oil, Gas & Consumable Fuels, U.K. | | |
The dollar value, number of shares or principal amount, and names of portfolio holdings are listed in the Fund’s Statement of Investments (SOI).
TG-4
compared with a foreign currency, an investment traded in that foreign currency will go down in value because it will be worth fewer U.S. dollars. This can have a negative effect on Fund performance. Conversely, when the U.S. dollar weakens in relation to a foreign currency, an investment traded in that foreign currency will increase in value, which can contribute to Fund performance. For the 12 months ended December 31, 2007, the U.S. dollar fell in value relative to most non-U.S. currencies. As a result, the Fund’s performance was positively affected by the Fund’s substantial investment in securities with non-U.S. currency exposure. However, one cannot expect the same result in future periods.
Thank you for your participation in Templeton Growth Securities Fund. We look forward to serving your future investment needs.
The foregoing information reflects our analysis, opinions and portfolio holdings as of December 31, 2007, the end of the reporting period. The way we implement our main investment strategies and the resulting portfolio holdings may change depending on factors such as market and economic conditions. These opinions may not be relied upon as investment advice or an offer for a particular security. The information is not a complete analysis of every aspect of any market, country, industry, security or the Fund. Statements of fact are from sources considered reliable, but the investment manager makes no representation or warranty as to their completeness or accuracy. Although historical performance is no guarantee of future results, these insights may help you understand our investment management philosophy.
TG-5
Fund Expenses
As an investor in a variable insurance contract (Contract) that indirectly provides for investment in an underlying mutual fund, you can incur transaction and/or ongoing expenses at both the Fund level and the Contract level.
| • | | Transaction expenses can include sales charges (loads) on purchases, redemption fees, surrender fees, transfer fees and premium taxes. |
| • | | Ongoing expenses can include management fees, distribution and service (12b-1) fees, contract fees, annual maintenance fees, mortality and expense risk fees and other fees and expenses. All mutual funds and Contracts have some types of ongoing expenses. |
The expenses shown in the table are meant to highlight ongoing expenses at the Fund level only and do not include ongoing expenses at the Contract level, or transaction expenses at either the Fund or Contract level. While the Fund does not have transaction expenses, if the transaction and ongoing expenses at the Contract level were included, the expenses shown below would be higher. You should consult your Contract prospectus or disclosure document for more information.
The table shows Fund-level ongoing expenses and can help you understand these expenses and compare them with those of other mutual funds offered through the Contract. The table assumes a $1,000 investment held for the six months indicated. Please refer to the Fund prospectus for additional information on operating expenses.
Actual Fund Expenses
The first line (Actual) of the table provides actual account values and expenses. The “Ending Account Value” is derived from the Fund’s actual return, which includes the effect of ongoing Fund expenses, but does not include the effect of ongoing Contract expenses.
You can estimate the Fund-level expenses you incurred during the period by following these steps. Of course, your account value and expenses will differ from those in this illustration:
| 1. | Divide your account value by $1,000. |
If an account had an $8,600 value, then $8,600 ÷ $1,000 = 8.6.
| 2. | Multiply the result by the number under the heading “Fund-Level Expenses Incurred During Period.” |
If Fund-Level Expenses Incurred During Period were $7.50, then 8.6 x $7.50 = $64.50.
In this illustration, the estimated expenses incurred this period at the Fund level are $64.50.
Templeton Growth Securities Fund – Class 1
TG-6
Hypothetical Example for Comparison with Other Mutual Funds
Information in the second line (Hypothetical) of the table can help you compare ongoing expenses of the Fund with those of other mutual funds offered through the Contract. This information may not be used to estimate the actual ending account balance or expenses you incurred during the period. The hypothetical “Ending Account Value” is based on the Fund’s actual expense ratio and an assumed 5% annual rate of return before expenses, which does not represent the Fund’s actual return. The figure under the heading “Fund-Level Expenses Incurred During Period” shows the hypothetical expenses your account would have incurred under this scenario. You can compare this figure with the 5% hypothetical examples that appear in shareholder reports of other funds offered through a Contract.
| | | | | | | | | |
| Class 1 | | Beginning
Account Value 7/1/07 | | Ending Account Value 12/31/07 | | Fund-Level
Expenses Incurred
During Period*
7/1/07–12/31/07 |
Actual | | $ | 1,000 | | $ | 960.80 | | $ | 3.76 |
Hypothetical (5% return before expenses) | | $ | 1,000 | | $ | 1,021.37 | | $ | 3.87 |
*Expenses are calculated using the most recent six-month annualized expense ratio for the Fund’s Class 1 shares (0.76%), which does not include any ongoing expenses of the Contract for which the Fund is an investment option, multiplied by the average account value over the period, multiplied by 184/365 to reflect the one-half year period.
TG-7
SUPPLEMENT DATED DECEMBER 10, 2007
TOTHE PROSPECTUSES DATED MAY 1, 2007
OF
TEMPLETON GROWTH SECURITIES FUND (FUND)
A SERIESOF FRANKLIN TEMPLETON VARIABLE INSURANCE PRODUCTS TRUST
The Fund’s Class 1 and Class 2 prospectuses are amended by replacing the portfolio management line-up in the “Management” section on page TG-6 with the following:
The Fund is managed by a team of dedicated professionals focused on investments in equity securities of companies anywhere in the world. The portfolio managers of the team are as follows:
Alan Chua CFA®¹
PORTFOLIO MANAGER OF ASSET MANAGEMENT
Mr. Chua has been a manager of the Fund since 2003. He has primary responsibility for the investments of the Fund. Mr. Chua has final authority over all aspects of the Fund’s investment portfolio, including but not limited to, purchases and sales of individual securities, portfolio risk assessment, and the management of daily cash balances in accordance with anticipated investment management requirements. The degree to which he may perform these functions, and the nature of these functions, may change from time to time. He joined Franklin Templeton Investments in 1995.
Cindy L. Sweeting CFA®¹
PRESIDENT OF GLOBAL ADVISORS
Ms. Sweeting has been a manager of the Fund since December 2007, providing research and advice on the purchases and sales of individual securities, and portfolio risk assessment. She joined Franklin Templeton Investments in 1997.
The Fund’s SAI provides additional information about the portfolio managers’ compensation, other accounts that they manage and their ownership of Fund shares.
1. | CFA® and Chartered Financial Analyst® are trademarks owned by CFA Institute. |
Please keep this supplement for future reference.
TG-8
Franklin Templeton Variable Insurance Products Trust
Financial Highlights
Templeton Growth Securities Fund
| | | | | | | | | | | | | | | | | | | | |
| | | Year Ended December 31, | |
| Class 1 | | 2007 | | | 2006 | | | 2005 | | | 2004 | | | 2003 | |
| | | | |
Per share operating performance | | | | | | | | | | | | | | | | | | | | |
(for a share outstanding throughout the year) | | | | | | | | | | | | | | | | | | | | |
Net asset value, beginning of year | | $ | 16.16 | | | $ | 13.98 | | | $ | 12.98 | | | $ | 11.31 | | | $ | 8.67 | |
| | | | |
Income from investment operationsa: | | | | | | | | | | | | | | | | | | | | |
Net investment incomeb | | | 0.27 | | | | 0.29 | | | | 0.24 | | | | 0.21 | | | | 0.17 | |
Net realized and unrealized gains (losses) | | | 0.19 | | | | 2.67 | | | | 0.92 | | | | 1.61 | | | | 2.63 | |
| | | | |
Total from investment operations | | | 0.46 | | | | 2.96 | | | | 1.16 | | | | 1.82 | | | | 2.80 | |
| | | | |
Less distributions from: | | | | | | | | | | | | | | | | | | | | |
Net investment income | | | (0.25 | ) | | | (0.23 | ) | | | (0.16 | ) | | | (0.15 | ) | | | (0.16 | ) |
Net realized gains | | | (0.69 | ) | | | (0.55 | ) | | | — | | | | — | | | | — | |
| | | | |
Total distributions | | | (0.94 | ) | | | (0.78 | ) | | | (0.16 | ) | | | (0.15 | ) | | | (0.16 | ) |
| | | | |
Net asset value, end of year | | $ | 15.68 | | | $ | 16.16 | | | $ | 13.98 | | | $ | 12.98 | | | $ | 11.31 | |
| | | | |
| | | | | |
Total returnc | | | 2.55% | | | | 22.20% | | | | 9.06% | | | | 16.25% | | | | 32.62% | |
Ratios to average net assets | | | | | | | | | | | | | | | | | | | | |
Expenses before expense reduction | | | 0.77% | | | | 0.78% | | | | 0.82% | | | | 0.86% | | | | 0.88% | |
Expenses net of expense reduction | | | 0.76% | | | | 0.78% | d | | | 0.82% | d | | | 0.86% | d | | | 0.88% | |
Net investment income | | | 1.64% | | | | 1.93% | | | | 1.81% | | | | 1.75% | | | | 1.74% | |
| | | | | |
Supplemental data | | | | | | | | | | | | | | | | | | | | |
Net assets, end of year (000’s) | | $ | 406,538 | | | $ | 413,871 | | | $ | 779,347 | | | $ | 800,118 | | | $ | 769,339 | |
Portfolio turnover rate | | | 20.45% | | | | 20.29% | e | | | 22.16% | | | | 19.13% | | | | 37.43% | |
a The amount shown for a share outstanding throughout the period may not correlate with the Statement of Operations for the period due to the timing of sales and repurchases of the Fund shares in relation to income earned and/or fluctuating market value of the investments of the Fund.
b Based on average daily shares outstanding.
c Total return does not include any fees, charges or expenses imposed by the variable annuity and life insurance contracts for which the Franklin Templeton Variable Insurance Products Trust serves as an underlying investment vehicle.
d Benefit of expense reduction rounds to less than 0.01%.
e Excludes the value of portfolio securities delivered as a result of a redemption in-kind. See Note 8.
The accompanying notes are an integral part of these financial statements.
TG-9
Franklin Templeton Variable Insurance Products Trust
Financial Highlights (continued)
Templeton Growth Securities Fund
| | | | | | | | | | | | | | | | | | | | |
| | | Year Ended December 31, | |
| Class 2 | | 2007 | | | 2006 | | | 2005 | | | 2004 | | | 2003 | |
| | | | |
Per share operating performance | | | | | | | | | | | | | | | | | | | | |
(for a share outstanding throughout the year) | | | | | | | | | | | | | | | | | | | | |
Net asset value, beginning of year | | $ | 15.93 | | | $ | 13.81 | | | $ | 12.83 | | | $ | 11.19 | | | $ | 8.59 | |
| | | | |
Income from investment operationsa: | | | | | | | | | | | | | | | | | | | | |
Net investment incomeb | | | 0.22 | | | | 0.24 | | | | 0.20 | | | | 0.17 | | | | 0.13 | |
Net realized and unrealized gains (losses) | | | 0.20 | | | | 2.63 | | | | 0.93 | | | | 1.61 | | | | 2.62 | |
| | | | |
Total from investment operations | | | 0.42 | | | | 2.87 | | | | 1.13 | | | | 1.78 | | | | 2.75 | |
| | | | |
Less distributions from: | | | | | | | | | | | | | | | | | | | | |
Net investment income | | | (0.22 | ) | | | (0.20 | ) | | | (0.15 | ) | | | (0.14 | ) | | | (0.15 | ) |
Net realized gains | | | (0.69 | ) | | | (0.55 | ) | | | — | | | | — | | | | — | |
| | | | |
Total distributions | | | (0.91 | ) | | | (0.75 | ) | | | (0.15 | ) | | | (0.14 | ) | | | (0.15 | ) |
| | | | |
Net asset value, end of year | | $ | 15.44 | | | $ | 15.93 | | | $ | 13.81 | | | $ | 12.83 | | | $ | 11.19 | |
| | | | |
| | | | | |
Total returnc | | | 2.35% | | | | 21.81% | | | | 8.86% | | | | 16.03% | | | | 32.13% | |
Ratios to average net assets | | | | | | | | | | | | | | | | | | | | |
Expenses before expense reduction | | | 1.02% | | | | 1.03% | | | | 1.07% | | | | 1.11% | | | | 1.13% | |
Expenses net of expense reduction | | | 1.01% | | | | 1.03% | d | | | 1.07% | d | | | 1.11% | d | | | 1.13% | |
Net investment income | | | 1.39% | | | | 1.68% | | | | 1.56% | | | | 1.50% | | | | 1.49% | |
| | | | | |
Supplemental data | | | | | | | | | | | | | | | | | | | | |
Net assets, end of year (000’s) | | $ | 3,182,203 | | | $ | 2,821,818 | | | $ | 1,912,825 | | | $ | 1,189,112 | | | $ | 511,659 | |
Portfolio turnover rate | | | 20.45% | | | | 20.29% | e | | | 22.16% | | | | 19.13% | | | | 37.43% | |
a The amount shown for a share outstanding throughout the period may not correlate with the Statement of Operations for the period due to the timing of sales and repurchases of the Fund shares in relation to income earned and/or fluctuating market value of the investments of the Fund.
b Based on average daily shares outstanding.
c Total return does not include any fees, charges or expenses imposed by the variable annuity and life insurance contracts for which the Franklin Templeton Variable Insurance Products Trust serves as an underlying investment vehicle.
d Benefit of expense reduction rounds to less than 0.01%.
e Excludes the value of portfolio securities delivered as a result of a redemption in-kind. See Note 8.
The accompanying notes are an integral part of these financial statements.
TG-10
Franklin Templeton Variable Insurance Products Trust
Statement of Investments, December 31, 2007
| | | | | | | |
| Templeton Growth Securities Fund | | Country | | Shares | | Value |
Common Stocks 94.0% | | | | | | | |
Aerospace & Defense 0.7% | | | | | | | |
aBAE Systems PLC, 144A | | United Kingdom | | 369 | | $ | 3,651 |
Raytheon Co. | | United States | | 186,177 | | | 11,300,944 |
bRolls-Royce Group PLC | | United Kingdom | | 1,349,842 | | | 14,644,095 |
bRolls-Royce Group PLC, B | | United Kingdom | | 54,533,616 | | | 119,192 |
| | | | | | | |
| | | | | | | 26,067,882 |
| | | | | | | |
Air Freight & Logistics 2.6% | | | | | | | |
Deutsche Post AG | | Germany | | 1,373,042 | | | 46,707,384 |
United Parcel Service Inc., B | | United States | | 657,270 | | | 46,482,134 |
| | | | | | | |
| | | | | | | 93,189,518 |
| | | | | | | |
Auto Components 0.4% | | | | | | | |
bLear Corp. | | United States | | 240,108 | | | 6,641,387 |
Valeo SA | | France | | 202,767 | | | 8,344,606 |
| | | | | | | |
| | | | | | | 14,985,993 |
| | | | | | | |
Automobiles 3.3% | | | | | | | |
Bayerische Motoren Werke AG | | Germany | | 859,457 | | | 53,594,040 |
Harley-Davidson Inc. | | United States | | 299,480 | | | 13,988,711 |
bHyundai Motor Co. Ltd. | | South Korea | | 268,950 | | | 20,572,426 |
Peugeot SA | | France | | 416,122 | | | 31,486,826 |
| | | | | | | |
| | | | | | | 119,642,003 |
| | | | | | | |
Biotechnology 1.3% | | | | | | | |
bAmgen Inc. | | United States | | 1,032,850 | | | 47,965,554 |
| | | | | | | |
Building Products 0.5% | | | | | | | |
Assa Abloy AB, B | | Sweden | | 886,200 | | | 17,783,759 |
| | | | | | | |
Capital Markets 1.3% | | | | | | | |
Nomura Holdings Inc. | | Japan | | 433,174 | | | 7,361,025 |
UBS AG | | Switzerland | | 822,844 | | | 38,048,911 |
| | | | | | | |
| | | | | | | 45,409,936 |
| | | | | | | |
Commercial Banks 9.2% | | | | | | | |
HSBC Holdings PLC | | United Kingdom | | 2,959,079 | | | 49,975,084 |
Intesa Sanpaolo SpA | | Italy | | 8,424,310 | | | 66,510,629 |
bKookmin Bank | | South Korea | | 426,140 | | | 31,412,489 |
Mitsubishi UFJ Financial Group Inc. | | Japan | | 3,810,370 | | | 35,775,074 |
Royal Bank of Scotland Group PLC | | United Kingdom | | 4,925,001 | | | 43,448,647 |
Shinsei Bank Ltd. | | Japan | | 6,411,000 | | | 23,455,930 |
Sumitomo Mitsui Financial Group Inc. | | Japan | | 3,814 | | | 28,626,803 |
UniCredito Italiano SpA | | Italy | | 6,063,647 | | | 50,262,223 |
| | | | | | | |
| | | | | | | 329,466,879 |
| | | | | | | |
Commercial Services & Supplies 0.3% | | | | | | | |
Pitney Bowes Inc. | | United States | | 288,990 | | | 10,993,180 |
| | | | | | | |
Computers & Peripherals 2.2% | | | | | | | |
Seagate Technology | | United States | | 3,071,238 | | | 78,316,569 |
| | | | | | | |
Diversified Financial Services 1.6% | | | | | | | |
ING Groep NV | | Netherlands | | 1,483,770 | | | 57,922,836 |
| | | | | | | |
Diversified Telecommunication Services 5.3% | | | | | | | |
BCE Inc. | | Canada | | 374,423 | | | 14,939,242 |
Belgacom | | Belgium | | 233,162 | | | 11,480,540 |
TG-11
Franklin Templeton Variable Insurance Products Trust
Statement of Investments, December 31, 2007 (continued)
| | | | | | | |
| Templeton Growth Securities Fund | | Country | | Shares | | Value |
Common Stocks (continued) | | | | | | | |
Diversified Telecommunication Services (continued) | | | | | | | |
France Telecom SA | | France | | 1,428,670 | | $ | 51,330,964 |
KT Corp., ADR | | South Korea | | 862,201 | | | 22,244,786 |
Singapore Telecommunications Ltd. | | Singapore | | 12,064,000 | | | 33,477,401 |
Telefonos de Mexico SAB de CV (Telmex), L, ADR | | Mexico | | 471,465 | | | 17,368,771 |
Telekom Austria AG | | Austria | | 122,140 | | | 3,392,002 |
Telenor ASA | | Norway | | 1,478,027 | | | 35,288,252 |
| | | | | | | |
| | | | | | | 189,521,958 |
| | | | | | | |
Electric Utilities 0.3% | | | | | | | |
Hong Kong Electric Holdings Ltd. | | Hong Kong | | 1,821,181 | | | 10,474,342 |
| | | | | | | |
Electronic Equipment & Instruments 2.3% | | | | | | | |
bCelestica Inc. | | Canada | | 343,812 | | | 1,994,110 |
bFlextronics International Ltd. | | Singapore | | 641,110 | | | 7,731,787 |
FUJIFILM Holdings Corp. | | Japan | | 643,837 | | | 27,308,873 |
Hitachi Ltd. | | Japan | | 1,996,278 | | | 14,911,891 |
Tyco Electronics Ltd. | | United States | | 847,788 | | | 31,478,368 |
| | | | | | | |
| | | | | | | 83,425,029 |
| | | | | | | |
Food Products 1.1% | | | | | | | |
Nestle SA | | Switzerland | | 86,034 | | | 39,479,068 |
| | | | | | | |
Health Care Equipment & Supplies 1.7% | | | | | | | |
bBoston Scientific Corp. | | United States | | 3,115,270 | | | 36,230,590 |
Covidien Ltd. | | United States | | 594,418 | | | 26,326,773 |
Olympus Corp. | | Japan | | 800 | | | 33,144 |
| | | | | | | |
| | | | | | | 62,590,507 |
| | | | | | | |
Health Care Providers & Services 0.4% | | | | | | | |
bTenet Healthcare Corp. | | United States | | 2,881,768 | | | 14,639,381 |
| | | | | | | |
Hotels Restaurants & Leisure 1.4% | | | | | | | |
Accor SA | | France | | 184,940 | | | 14,763,102 |
Compass Group PLC | | United Kingdom | | 5,578,849 | | | 34,196,900 |
| | | | | | | |
| | | | | | | 48,960,002 |
| | | | | | | |
Industrial Conglomerates 6.6% | | | | | | | |
General Electric Co. | | United States | | 2,123,410 | | | 78,714,809 |
Koninklijke Philips Electronics NV | | Netherlands | | 912,198 | | | 39,297,499 |
Siemens AG | | Germany | | 602,004 | | | 95,250,711 |
Tyco International Ltd. | | United States | | 594,418 | | | 23,568,674 |
| | | | | | | |
| | | | | | | 236,831,693 |
| | | | | | | |
Insurance 5.7% | | | | | | | |
American International Group Inc. | | United States | | 1,023,745 | | | 59,684,334 |
Aviva PLC | | United Kingdom | | 3,808,161 | | | 50,923,392 |
Muenchener Rueckversicherungs-Gesellschaft AG | | Germany | | 95,260 | | | 18,468,498 |
Old Mutual PLC | | United Kingdom | | 7,445,420 | | | 24,794,205 |
Standard Life PLC | | United Kingdom | | 2,504,813 | | | 12,579,212 |
Torchmark Corp. | | United States | | 253,277 | | | 15,330,857 |
Willis Group Holdings Ltd. | | United States | | 586,490 | | | 22,269,025 |
| | | | | | | |
| | | | | | | 204,049,523 |
| | | | | | | |
Internet & Catalog Retail 0.6% | | | | | | | |
bExpedia Inc. | | United States | | 694,780 | | | 21,968,944 |
| | | | | | | |
TG-12
Franklin Templeton Variable Insurance Products Trust
Statement of Investments, December 31, 2007 (continued)
| | | | | | | |
| Templeton Growth Securities Fund | | Country | | Shares | | Value |
Common Stocks (continued) | | | | | | | |
IT Services 2.2% | | | | | | | |
Accenture Ltd., A | | United States | | 1,143,107 | | $ | 41,186,145 |
Electronic Data Systems Corp. | | United States | | 1,762,290 | | | 36,532,272 |
| | | | | | | |
| | | | | | | 77,718,417 |
| | | | | | | |
Leisure Equipment & Products 0.9% | | | | | | | |
Eastman Kodak Co. | | United States | | 1,484,649 | | | 32,469,274 |
| | | | | | | |
Media 10.7% | | | | | | | |
bComcast Corp., A | | United States | | 1,293,102 | | | 23,431,008 |
bThe Interpublic Group of Cos. Inc. | | United States | | 2,797,188 | | | 22,685,195 |
Mediaset SpA | | Italy | | 1,867,440 | | | 18,817,841 |
News Corp., A | | United States | | 3,701,922 | | | 75,852,382 |
Pearson PLC | | United Kingdom | | 1,864,688 | | | 27,120,907 |
Reed Elsevier NV | | Netherlands | | 2,518,906 | | | 50,176,927 |
Time Warner Inc. | | United States | | 3,275,372 | | | 54,076,392 |
bViacom Inc., B | | United States | | 1,325,938 | | | 58,235,197 |
Vivendi SA | | France | | 1,126,740 | | | 51,598,384 |
| | | | | | | |
| | | | | | | 381,994,233 |
| | | | | | | |
Office Electronics 0.9% | | | | | | | |
Konica Minolta Holdings Ltd. | | Japan | | 1,733,800 | | | 30,768,867 |
| | | | | | | |
Oil, Gas & Consumable Fuels 7.4% | | | | | | | |
BP PLC | | United Kingdom | | 5,341,037 | | | 65,266,101 |
El Paso Corp. | | United States | | 2,309,384 | | | 39,813,780 |
Eni SpA | | Italy | | 863,977 | | | 31,584,162 |
Gazprom, ADR | | Russia | | 330,460 | | | 18,555,329 |
Royal Dutch Shell PLC, B | | United Kingdom | | 1,489,450 | | | 61,852,773 |
Total SA, B | | France | | 600,930 | | | 49,838,044 |
| | | | | | | |
| | | | | | | 266,910,189 |
| | | | | | | |
Paper & Forest Products 2.4% | | | | | | | |
International Paper Co. | | United States | | 465,453 | | | 15,071,368 |
Sappi Ltd. | | South Africa | | 539,361 | | | 7,644,548 |
Stora Enso OYJ, R | | Finland | | 1,117,082 | | | 16,693,387 |
Svenska Cellulosa AB, B | | Sweden | | 1,357,173 | | | 24,033,950 |
UPM-Kymmene OYJ | | Finland | | 1,087,262 | | | 21,928,135 |
| | | | | | | |
| | | | | | | 85,371,388 |
| | | | | | | |
Pharmaceuticals 7.6% | | | | | | | |
Bristol-Myers Squibb Co. | | United States | | 238,151 | | | 6,315,765 |
GlaxoSmithKline PLC | | United Kingdom | | 2,245,569 | | | 57,066,851 |
Merck & Co. Inc. | | United States | | 647,601 | | | 37,632,094 |
Novartis AG | | Switzerland | | 762,074 | | | 41,762,086 |
Pfizer Inc. | | United States | | 3,182,513 | | | 72,338,520 |
Sanofi-Aventis | | France | | 640,537 | | | 58,871,666 |
| | | | | | | |
| | | | | | | 273,986,982 |
| | | | | | | |
Real Estate Management & Development 1.2% | | | | | | | |
Cheung Kong (Holdings) Ltd. | | Hong Kong | | 1,199,833 | | | 22,186,933 |
Swire Pacific Ltd., A | | Hong Kong | | 1,408,516 | | | 19,416,969 |
| | | | | | | |
| | | | | | | 41,603,902 |
| | | | | | | |
Semiconductors & Semiconductor Equipment 2.2% | | | | | | | |
bInfineon Technologies AG | | Germany | | 2,227,809 | | | 26,399,362 |
Samsung Electronics Co. Ltd. | | South Korea | | 87,480 | | | 51,961,840 |
| | | | | | | |
| | | | | | | 78,361,202 |
| | | | | | | |
TG-13
Franklin Templeton Variable Insurance Products Trust
Statement of Investments, December 31, 2007 (continued)
| | | | | | | | |
| Templeton Growth Securities Fund | | Country | | Shares | | Value |
Common Stocks (continued) | | | | | | | | |
Software 5.5% | | | | | | | | |
bCadence Design Systems Inc. | | United States | | | 789,718 | | $ | 13,433,103 |
Microsoft Corp. | | United States | | | 2,981,829 | | | 106,153,113 |
bOracle Corp. | | United States | | | 3,491,900 | | | 78,847,102 |
| | | | | | | | |
| | | | | | | | 198,433,318 |
| | | | | | | | |
Specialty Retail 0.6% | | | | | | | | |
bChico’s FAS Inc. | | United States | | | 1,293,800 | | | 11,683,014 |
Kingfisher PLC | | United Kingdom | | | 3,744,140 | | | 10,831,795 |
| | | | | | | | |
| | | | | | | | 22,514,809 |
| | | | | | | | |
Wireless Telecommunication Services 3.6% | | | | | | | | |
SK Telecom Co. Ltd. | | South Korea | | | 80,853 | | | 21,507,822 |
SK Telecom Co. Ltd., ADR | | South Korea | | | 108,491 | | | 3,237,372 |
Sprint Nextel Corp. | | United States | | | 2,792,710 | | | 36,668,282 |
Vodafone Group PLC | | United Kingdom | | | 18,210,261 | | | 67,951,449 |
| | | | | | | | |
| | | | | | | | 129,364,925 |
| | | | | | | | |
Total Common Stocks (Cost $2,873,084,467) | | | | | | | | 3,373,182,062 |
| | | | | | | | |
| | | |
| | | | | Principal
Amount | | |
Short Term Investments 6.0% | | | | | | | | |
U.S. Government and Agency Securities 6.0% | | | | | | | | |
cFFCB, 8/25/08 | | United States | | $ | 25,000,000 | | | 24,379,675 |
cFHLB,
1/02/08 | | United States | | | 1,502,000 | | | 1,502,000 |
3/12/08 | | United States | | | 23,985,000 | | | 23,794,487 |
4/04/08 | | United States | | | 80,000,000 | | | 79,157,840 |
4/14/08 | | United States | | | 6,000,000 | | | 5,930,046 |
4/16/08 | | United States | | | 50,000,000 | | | 49,405,750 |
cFNMA,
1/02/08 | | United States | | | 130,000 | | | 130,000 |
1/04/08 | | United States | | | 15,000,000 | | | 15,000,000 |
2/28/08 | | United States | | | 15,000,000 | | | 14,902,740 |
| | | | | | | | |
Total U.S. Government and Agency Securities (Cost $213,997,809) | | | | | | | | 214,202,538 |
| | | | | | | | |
Total Investments (Cost $3,087,082,276) 100.0% | | | | | | | | 3,587,384,600 |
Other Assets, less Liabilities 0.0%d | | | | | | | | 1,356,297 |
| | | | | | | | |
Net Assets 100.0% | | | | | | | $ | 3,588,740,897 |
| | | | | | | | |
Selected Portfolio Abbreviations
ADR - American Depository Receipt
FFCB - Federal Farm Credit Bank
FHLB - Federal Home Loan Bank
FNMA - Federal National Mortgage Association
a Security was purchased pursuant to Rule 144A under the Securities Act of 1933 and may be sold in transactions exempt from registration only to qualified institutional buyers or in a public offering registered under the Securities Act of 1933. These securities have been deemed liquid under guidelines approved by the Trust’s Board of Trustees. At December 31, 2007, the value of this security was $3,651, representing less than 0.01% of net assets.
b Non-income producing for the twelve months ended December 31, 2007.
c The security is traded on a discount basis with no stated coupon rate.
d Rounds to less than 0.1% of net assets.
The accompanying notes are an integral part of these financial statements.
TG-14
Franklin Templeton Variable Insurance Products Trust
Financial Statements
Statement of Assets and Liabilities
December 31, 2007
| | | |
| | | Templeton
Growth
Securities Fund |
Assets: | | | |
Investments in securities: | | | |
Cost | | $ | 3,087,082,276 |
| | | |
Value | | $ | 3,587,384,600 |
Cash | | | 1,539 |
Receivables: | | | |
Capital shares sold | | | 1,604,221 |
Dividends | | | 5,202,583 |
| | | |
Total assets | | | 3,594,192,943 |
| | | |
Liabilities: | | | |
Payables: | | | |
Capital shares redeemed | | | 1,274,971 |
Affiliates | | | 3,588,740 |
Accrued expenses and other liabilities | | | 588,335 |
| | | |
Total liabilities | | | 5,452,046 |
| | | |
Net assets, at value | | $ | 3,588,740,897 |
| | | |
Net assets consist of: | | | |
Paid-in capital | | $ | 2,845,394,013 |
Undistributed net investment income | | | 50,572,388 |
Net unrealized appreciation (depreciation) | | | 500,314,974 |
Accumulated net realized gain (loss) | | | 192,459,522 |
| | | |
Net assets, at value | | $ | 3,588,740,897 |
| | | |
Class 1: | | | |
Net assets, at value | | $ | 406,537,913 |
| | | |
Shares outstanding | | | 25,927,374 |
| | | |
Net asset value and maximum offering price per share | | $ | 15.68 |
| | | |
Class 2: | | | |
Net assets, at value | | $ | 3,182,202,984 |
| | | |
Shares outstanding | | | 206,123,519 |
| | | |
Net asset value and maximum offering price per share | | $ | 15.44 |
| | | |
The accompanying notes are an integral part of these financial statements.
TG-15
Franklin Templeton Variable Insurance Products Trust
Financial Statements (continued)
Statement of Operations
for the year ended December 31, 2007
| | | | |
| | | Templeton
Growth
Securities Fund | |
Investment income: | | | | |
Dividends (net of foreign taxes of $5,071,854) | | $ | 75,567,119 | |
Interest | | | 9,990,667 | |
| | | | |
Total investment income | | | 85,557,786 | |
| | | | |
Expenses: | | | | |
Management fees (Note 3a) | | | 25,986,128 | |
Distribution fees - Class 2 (Note 3c) | | | 7,884,754 | |
Unaffiliated transfer agent fees | | | 55,033 | |
Custodian fees (Note 4) | | | 545,858 | |
Reports to shareholders | | | 391,150 | |
Professional fees | | | 145,433 | |
Trustees’ fees and expenses | | | 14,790 | |
Other | | | 77,308 | |
| | | | |
Total expenses | | | 35,100,454 | |
Expense reductions (Note 4) | | | (22,993 | ) |
| | | | |
Net expenses | | | 35,077,461 | |
| | | | |
Net investment income | | | 50,480,325 | |
| | | | |
Realized and unrealized gains (losses): | | | | |
Net realized gain (loss) from: | | | | |
Investments | | | 193,121,773 | |
Foreign currency transactions | | | 154,081 | |
| | | | |
Net realized gain (loss) | | | 193,275,854 | |
| | | | |
Net change in unrealized appreciation (depreciation) on: | | | | |
Investments | | | (172,679,431 | ) |
Translation of assets and liabilities denominated in foreign currencies | | | (57,163 | ) |
| | | | |
Net change in unrealized appreciation (depreciation) | | | (172,736,594 | ) |
| | | | |
Net realized and unrealized gain (loss) | | | 20,539,260 | |
| | | | |
Net increase (decrease) in net assets resulting from operations | | $ | 71,019,585 | |
| | | | |
The accompanying notes are an integral part of these financial statements.
TG-16
Franklin Templeton Variable Insurance Products Trust
Financial Statements (continued)
Statements of Changes in Net Assets
| | | | | | | | |
| | | Templeton Growth
Securities Fund | |
| | | Year Ended December 31, | |
| | | 2007 | | | 2006 | |
| | | | |
Increase (decrease) in net assets: | | | | | | | | |
Operations: | | | | | | | | |
Net investment income | | $ | 50,480,325 | | | $ | 48,615,354 | |
Net realized gain (loss) from investments and foreign currency transactions and redemption in-kind (Note 8) | | | 193,275,854 | | | | 220,506,727 | |
Net change in unrealized appreciation (depreciation) on investments and translation of assets and liabilities denominated in foreign currencies | | | (172,736,594 | ) | | | 311,063,570 | |
| | | | |
Net increase (decrease) in net assets resulting from operations | | | 71,019,585 | | | | 580,185,651 | |
| | | | |
Distributions to shareholders from: | | | | | | | | |
Net investment income: | | | | | | | | |
Class 1 | | | (5,889,701 | ) | | | (6,338,891 | ) |
Class 2 | | | (42,446,708 | ) | | | (29,026,054 | ) |
Net realized gains: | | | | | | | | |
Class 1 | | | (16,577,798 | ) | | | (15,619,027 | ) |
Class 2 | | | (135,434,521 | ) | | | (80,864,543 | ) |
| | | | |
Total distributions to shareholders | | | (200,348,728 | ) | | | (131,848,515 | ) |
| | | | |
Capital share transactions: (Note 2) | | | | | | | | |
Class 1 | | | 4,489,795 | | | | (460,756,992 | ) |
Class 2 | | | 477,890,822 | | | | 555,937,357 | |
| | | | |
Total capital share transactions | | | 482,380,617 | | | | 95,180,365 | |
| | | | |
Net increase (decrease) in net assets | | | 353,051,474 | | | | 543,517,501 | |
Net assets: | | | | | | | | |
Beginning of year | | | 3,235,689,423 | | | | 2,692,171,922 | |
| | | | |
End of year | | $ | 3,588,740,897 | | | $ | 3,235,689,423 | |
| | | | |
Undistributed net investment income included in net assets: | | | | | | | | |
End of year | | $ | 50,572,388 | | | $ | 48,319,480 | |
| | | | |
The accompanying notes are an integral part of these financial statements.
TG-17
Franklin Templeton Variable Insurance Products Trust
Notes to Financial Statements
Templeton Growth Securities Fund
1. ORGANIZATION AND SIGNIFICANT ACCOUNTING POLICIES
Franklin Templeton Variable Insurance Products Trust (Trust) is registered under the Investment Company Act of 1940, as amended, (1940 Act) as an open-end investment company, consisting of twenty-three separate funds. The Templeton Growth Securities Fund (Fund) included in this report is diversified. The financial statements of the remaining funds in the Trust are presented separately. Shares of the Fund are sold only to insurance company separate accounts to fund the benefits of variable life insurance policies or variable annuity contracts. As of December 31, 2007, 50.96% of the Fund’s shares were held through one insurance company. The Fund offers two classes of shares: Class 1 and Class 2. Each class of shares differs by its distribution fees, voting rights on matters affecting a single class and its exchange privilege.
The following summarizes the Fund’s significant accounting policies.
a. Security Valuation
Securities listed on a securities exchange or on the NASDAQ National Market System are valued at the last quoted sale price or the official closing price of the day, respectively. Over-the-counter securities and listed securities for which there is no reported sale are valued within the range of the most recent quoted bid and ask prices. Securities that trade in multiple markets or on multiple exchanges are valued according to the broadest and most representative market.
Government securities generally trade in the over-the-counter market rather than on a securities exchange. The Trust may utilize independent pricing services, quotations from bond dealers, and information with respect to bond and note transactions, to assist in determining a current market value for each security. The Trust’s pricing services may use valuation models or matrix pricing which considers information with respect to comparable bond and note transactions, quotations from bond dealers, or by reference to other securities that are considered comparable in such characteristics as rating, interest rate and maturity date, option adjusted spread models, prepayment projections, interest rate spreads and yield curves, to determine current value.
Foreign securities are valued as of the close of trading on the foreign stock exchange on which the security is primarily traded, or the NYSE, whichever is earlier. If no sale is reported at that time, the foreign security will be valued within the range of the most recent quoted bid and ask prices. The value is then converted into its U.S. dollar equivalent at the foreign exchange rate in effect at the close of the NYSE on the day that the value of the foreign security is determined.
The Trust has procedures to determine the fair value of individual securities and other assets for which market prices are not readily available or which may not be reliably priced. Methods for valuing these securities may include: fundamental analysis, matrix pricing, discounts from market prices of similar securities, or discounts applied due to the nature and duration of restrictions on the disposition of the securities. Due to the inherent uncertainty of valuations of such securities, the fair values may differ significantly from the values that would have been used had a ready market for such investments existed. Occasionally, events occur between the time at which trading in a security is completed and the close of the NYSE that might call into question the availability (including the reliability) of the value of a portfolio security held by the Fund. The investment manager monitors price movements following the close of trading in foreign stock markets through a series of country specific market proxies (such as baskets of American Depository Receipts, futures contracts and exchange traded funds). These price movements are measured against established trigger thresholds for each specific market proxy to assist in determining if an event has occurred. If such an event occurs, the securities may be valued using fair value procedures, which may include the use of independent pricing services. All security valuation procedures are approved by the Trust’s Board of Trustees.
b. Foreign Currency Translation
Portfolio securities and other assets and liabilities denominated in foreign currencies are translated into U.S. dollars based on the exchange rate of such currencies against U.S. dollars on the date of valuation. Purchases and sales of securities, income and expense items denominated in foreign currencies are translated into U.S. dollars at the exchange rate in effect on the transaction date. Occasionally, events may impact the availability or reliability of foreign exchange rates used to convert the U.S. dollar equivalent value. If such an event occurs, the foreign exchange rate will be valued at fair value using procedures established and approved by the Trust’s Board of Trustees.
TG-18
Franklin Templeton Variable Insurance Products Trust
Notes to Financial Statements (continued)
Templeton Growth Securities Fund
1. ORGANIZATION AND SIGNIFICANT ACCOUNTING POLICIES (continued)
b. Foreign Currency Translation (continued)
The Fund does not separately report the effect of changes in foreign exchange rates from changes in market prices on securities held. Such changes are included in net realized and unrealized gain or loss from investments on the Statement of Operations.
Realized foreign exchange gains or losses arise from sales of foreign currencies, currency gains or losses realized between the trade and settlement dates on securities transactions and the difference between the recorded amounts of dividends, interest, and foreign withholding taxes and the U.S. dollar equivalent of the amounts actually received or paid. Net unrealized foreign exchange gains and losses arise from changes in foreign exchange rates on foreign denominated assets and liabilities other than investments in securities held at the end of the reporting period.
c. Foreign Currency Contracts
When the Fund purchases or sells foreign securities it may enter into foreign exchange contracts to minimize foreign exchange risk from the trade date to the settlement date of the transactions. A foreign exchange contract is an agreement between two parties to exchange different currencies at an agreed upon exchange rate at a future date. Realized and unrealized gains and losses on these contracts are included in the Statement of Operations.
The risks of these contracts include movement in the values of the foreign currencies relative to the U.S. dollar and the possible inability of the counterparties to fulfill their obligations under the contracts, which may be in excess of the amount reflected in the Statement of Assets and Liabilities.
d. Income Taxes
No provision has been made for U.S. income taxes because it is the Fund’s policy to qualify as a regulated investment company under the Internal Revenue Code and to distribute to shareholders substantially all of its taxable income and net realized gains.
Foreign securities held by the Fund may be subject to foreign taxation on dividend income received. Foreign taxes, if any, are recorded based on the tax regulations and rates that exist in the foreign markets in which the Fund invests.
e. Security Transactions, Investment Income, Expenses and Distributions
Security transactions are accounted for on trade date. Realized gains and losses on security transactions are determined on a specific identification basis. Interest income and estimated expenses are accrued daily. Amortization of premium and accretion of discount on debt securities are included in interest income. Dividend income is recorded on the ex-dividend date except that certain dividends from foreign securities are recognized as soon as the Fund is notified of the ex-dividend date. Distributions to shareholders are recorded on the ex-dividend date and are determined according to income tax regulations (tax basis). Distributable earnings determined on a tax basis may differ from earnings recorded in accordance with accounting principles generally accepted in the United States of America. These differences may be permanent or temporary. Permanent differences are reclassified among capital accounts to reflect their tax character. These reclassifications have no impact on net assets or the results of operations. Temporary differences are not reclassified, as they may reverse in subsequent periods.
Common expenses incurred by the Trust are allocated among the funds based on the ratio of net assets of each fund to the combined net assets of the Trust. Fund specific expenses are charged directly to the fund that incurred the expense.
Realized and unrealized gains and losses and net investment income, other than class specific expenses, are allocated daily to each class of shares based upon the relative proportion of net assets of each class. Differences in per share distributions, by class, are generally due to differences in class specific expenses.
TG-19
Franklin Templeton Variable Insurance Products Trust
Notes to Financial Statements (continued)
Templeton Growth Securities Fund
1. ORGANIZATION AND SIGNIFICANT ACCOUNTING POLICIES (continued)
f. Accounting Estimates
The preparation of financial statements in accordance with accounting principles generally accepted in the United States of America requires management to make estimates and assumptions that affect the reported amounts of assets and liabilities at the date of the financial statements and the amounts of income and expenses during the reporting period. Actual results could differ from those estimates.
g. Guarantees and Indemnifications
Under the Trust’s organizational documents, its officers and trustees are indemnified by the Trust against certain liabilities arising out of the performance of their duties to the Trust. Additionally, in the normal course of business, the Trust, on behalf of the Fund, enters into contracts with service providers that contain general indemnification clauses. The Trust’s maximum exposure under these arrangements is unknown as this would involve future claims that may be made against the Trust that have not yet occurred. Currently, the Trust expects the risk of loss to be remote.
2. SHARES OF BENEFICIAL INTEREST
At December 31, 2007, there were an unlimited number of shares authorized (without par value). Transactions in the Fund’s shares were as follows:
| | | | | | | | | | | | | | |
| | | Year Ended December 31, | |
| | | 2007 | | | 2006 | |
| Class 1 Shares: | | Shares | | | Amount | | | Shares | | | Amount | |
Shares sold | | 3,270,092 | | | $ | 52,030,675 | | | 816,455 | | | $ | 12,140,817 | |
Shares issued in reinvestment of distributions | | 1,362,492 | | | | 22,467,499 | | | 1,610,999 | | | | 21,957,918 | |
Shares redeemed in-kind (Note 8) | | — | | | | — | | | (24,637,081 | ) | | | (376,956,857 | ) |
Shares redeemed | | (4,322,603 | ) | | | (70,008,379 | ) | | (7,904,739 | ) | | | (117,898,870 | ) |
| | | | |
Net increase (decrease) | | 309,981 | | | $ | 4,489,795 | | | (30,114,366 | ) | | $ | (460,756,992 | ) |
| | | | |
| Class 2 Shares: | | | | | | | | | | | | |
Shares sold | | 40,286,926 | | | $ | 647,823,344 | | | 44,417,686 | | | $ | 652,914,455 | |
Shares issued in reinvestment of distributions | | 10,921,155 | | | | 177,577,983 | | | 8,154,097 | | | | 109,754,141 | |
Shares redeemed in-kind (Note 8) | | — | | | | — | | | (1,903,026 | ) | | | (28,650,852 | ) |
Shares redeemed | | (22,199,545 | ) | | | (347,510,505 | ) | | (12,095,685 | ) | | | (178,080,387 | ) |
| | | | |
Net increase (decrease) | | 29,008,536 | | | $ | 477,890,822 | | | 38,573,072 | | | $ | 555,937,357 | |
| | | | |
3. TRANSACTIONS WITH AFFILIATES
Franklin Resources, Inc. is the holding company for various subsidiaries that together are referred to as Franklin Templeton Investments. Certain officers and trustees of the Trust are also officers and/or directors of the following subsidiaries:
| | |
| Subsidiary | | Affiliation |
Templeton Global Advisors Limited (TGAL) | | Investment manager |
Templeton Asset Management Ltd. (TAML) | | Investment manager |
Franklin Templeton Services, LLC (FT Services) | | Administrative manager |
Franklin Templeton Distributors, Inc. (Distributors) | | Principal underwriter |
Franklin Templeton Investor Services, LLC (Investor Services) | | Transfer agent |
TG-20
Franklin Templeton Variable Insurance Products Trust
Notes to Financial Statements (continued)
Templeton Growth Securities Fund
3. TRANSACTIONS WITH AFFILIATES (continued)
a. Management Fees
The Fund pays an investment management fee to TGAL based on the average daily net assets of the Fund as follows:
| | |
| Annualized Fee Rate | | Net Assets |
| 1.000% | | Up to and including $100 million |
| 0.900% | | Over $100 million, up to and including $250 million |
| 0.800% | | Over $250 million, up to and including $500 million |
| 0.750% | | Over $500 million, up to and including $1 billion |
| 0.700% | | Over $1 billion, up to and including $5 billion |
| 0.675% | | Over $5 billion, up to and including $10 billion |
| 0.655% | | Over $10 billion, up to and including $15 billion |
| 0.635% | | Over $15 billion, up to and including $20 billion |
| 0.615% | | In excess of $20 billion |
Under a subadvisory agreement, TAML, an affiliate of TGAL, provides subadvisory services to the Fund and receives from TGAL fees based on the average daily net assets of the Fund.
b. Administrative Fees
Under an agreement with TGAL, FT Services provides administrative services to the Fund. The fee is paid by TGAL based on average daily net assets, and is not an additional expense of the Fund
c. Distribution Fees
The Fund’s Board of Trustees has adopted a distribution plan for Class 2 shares pursuant to Rule 12b-1 under the 1940 Act. Under the Fund’s compensation distribution plan, the Fund pays Distributors for costs incurred in connection with the servicing, sale and distribution of the Fund’s shares up to 0.35% per year of its average daily net assets. The Board of Trustees has agreed to limit the current rate to 0.25% per year.
d. Transfer Agent Fees
Investor Services, under terms of an agreement, performs shareholder servicing for the Fund and is not paid by the Fund for the services.
4. EXPENSE OFFSET ARRANGEMENT
The Fund has entered into an arrangement with its custodian whereby credits realized as a result of uninvested cash balances are used to reduce a portion of the Fund’s custodian expenses. During the year ended December 31, 2007, the custodian fees were reduced as noted in the Statement of Operations.
5. INCOME TAXES
The Fund has reviewed the tax positions taken on federal income tax returns, for each of the three open tax years and as of December 31, 2007 and has determined that no provision for income tax is required in the Fund’s financial statements.
For tax purposes, realized capital losses occurring subsequent to October 31, may be deferred and treated as occurring on the first day of the following fiscal year. At December 31, 2007, the Fund deferred realized capital losses of $1,891,663.
TG-21
Franklin Templeton Variable Insurance Products Trust
Notes to Financial Statements (continued)
Templeton Growth Securities Fund
5. INCOME TAXES (continued)
The tax character of distributions paid during the years ended December 31, 2007 and 2006, was as follows:
| | | | | | |
| | | 2007 | | 2006 |
Distributions paid from: | | | | | | |
Ordinary income | | $ | 60,581,663 | | $ | 35,364,945 |
Long term capital gain | | | 139,767,065 | | | 96,483,570 |
| | | |
| | $ | 200,348,728 | | $ | 131,848,515 |
| | | |
At December 31, 2007, the cost of investments, net unrealized appreciation (depreciation), undistributed ordinary income and undistributed long term capital gains for income tax purposes were as follows:
| | | | |
Cost of investments | | $ | 3,087,082,276 | |
| | | | |
| |
Unrealized appreciation | | $ | 680,441,553 | |
Unrealized depreciation | | | (180,139,229 | ) |
| | | | |
Net unrealized appreciation (depreciation) | | $ | 500,302,324 | |
| | | | |
Undistributed ordinary income | | $ | 58,637,144 | |
Undistributed long term capital gains | | | 186,286,427 | |
| | | | |
Distributable earnings | | $ | 244,923,571 | |
| | | | |
Net investment income differs for financial statement and tax purposes primarily due to differing treatment of foreign currency transactions.
Net realized gains (losses) differ for financial statement and tax purposes primarily due to differing treatments of wash sales and foreign currency transactions.
6. INVESTMENT TRANSACTIONS
Purchases and sales of investments (excluding short term securities) for the year ended December 31, 2007, aggregated $1,108,601,380 and $683,685,656, respectively.
7. CONCENTRATION OF RISK
Investing in foreign securities may include certain risks and considerations not typically associated with investing in U.S. securities, such as fluctuating currency values and changing local and regional economic, political and social conditions, which may result in greater market volatility. In addition, certain foreign securities may not be as liquid as U.S. securities.
8. REDEMPTION IN-KIND
During the year ended December 31, 2006, the Fund realized $68,398,083 of net gains resulting from a redemption in-kind in which a shareholder redeemed fund shares for securities held by the Fund rather than for cash. Because such gains are not taxable to the Fund, and are not distributed to shareholders, they have been reclassified from accumulated net realized gains to paid-in capital.
9. REGULATORY AND LITIGATION MATTERS
As part of various investigations by a number of federal, state, and foreign regulators and governmental entities, including the Securities and Exchange Commission (“SEC”), relating to certain practices in the mutual fund industry, including late trading,
TG-22
Franklin Templeton Variable Insurance Products Trust
Notes to Financial Statements (continued)
Templeton Growth Securities Fund
9. REGULATORY AND LITIGATION MATTERS (continued)
market timing and marketing support payments to securities dealers who sell fund shares (“marketing support”), Franklin Resources, Inc. and certain of its subsidiaries (collectively, the “Company”), entered into settlements with certain of those regulators and governmental entities. Specifically, the Company entered into settlements with the SEC, among others, concerning market timing and marketing support.
On June 6, 2007, the SEC posted for public comment the proposed plan of distribution for the market timing settlement. Once the SEC approves the final plan of distribution, disbursements of settlement monies will be made promptly to individuals who were shareholders of the designated funds during the relevant period, in accordance with the terms and conditions of the settlement and plan.
In addition, the Company, as well as most of the mutual funds within Franklin Templeton Investments and certain current or former officers, Company directors, fund directors, and employees, have been named in private lawsuits (styled as shareholder class actions, or as derivative actions on behalf of either the named funds or Franklin Resources, Inc.). The lawsuits relate to the industry practices referenced above.
The Company and fund management believe that the claims made in each of the private lawsuits referenced above are without merit and intend to defend against them vigorously. The Company cannot predict with certainty the eventual outcome of these lawsuits, nor whether they will have a material negative impact on the Company. If it is determined that the Company bears responsibility for any unlawful or inappropriate conduct that caused losses to the Fund, it is committed to making the Trust or its shareholders whole, as appropriate.
10. NEW ACCOUNTING PRONOUNCEMENT
In September 2006, the Financial Accounting Standards Board (FASB) issued FASB Statement No. 157, “Fair Value Measurement” (SFAS 157), which defines fair value, establishes a framework for measuring fair value, and expands disclosures about fair value measurements. SFAS 157 is effective for fiscal years beginning after November 15, 2007, and interim periods within those fiscal years. The Trust believes the adoption of SFAS 157 will have no material impact on its financial statements.
TG-23
Franklin Templeton Variable Insurance Products Trust
Templeton Growth Securities Fund
Report of Independent Registered Public Accounting Firm
To the Board of Trustees and Shareholders of
Franklin Templeton Variable Insurance Products Trust
In our opinion, the accompanying statement of assets and liabilities, including the statement of investments, and the related statements of operations and of changes in net assets and the financial highlights present fairly, in all material respects, the financial position of Templeton Growth Securities Fund (one of the funds constituting Franklin Templeton Variable Insurance Products Trust, hereafter referred to as the “Fund”) at December 31, 2007, the results of its operations for the year then ended, the changes in its net assets for each of the two years in the period then ended and the financial highlights for each of the five years in the period then ended, in conformity with accounting principles generally accepted in the United States of America. These financial statements and financial highlights (hereafter referred to as “financial statements”) are the responsibility of the Fund’s management. Our responsibility is to express an opinion on these financial statements based on our audits. We conducted our audits of these financial statements in accordance with the standards of the Public Company Accounting Oversight Board (United States). Those standards require that we plan and perform the audit to obtain reasonable assurance about whether the financial statements are free of material misstatement. An audit includes examining, on a test basis, evidence supporting the amounts and disclosures in the financial statements, assessing the accounting principles used and significant estimates made by management, and evaluating the overall financial statement presentation. We believe that our audits, which included confirmation of securities at December 31, 2007 by correspondence with the custodian and brokers, provide a reasonable basis for our opinion.
PricewaterhouseCoopers LLP
San Francisco, California
February 14, 2008
TG-24
Franklin Templeton Variable Insurance Products Trust
Tax Designation (unaudited)
Templeton Growth Securities Fund
Under Section 852(b)(3)(C) of the Internal Revenue Code (Code), the Fund designates the maximum amount allowable but no less than $186,296,390 as a long term capital gain dividend for the fiscal year ended December 31, 2007.
Under Section 854(b)(2) of the Code, the Fund designates 29.51% of the ordinary income dividends as income qualifying for the dividends received deduction for the fiscal year ended December 31, 2007.
At December 31, 2007, more than 50% of the Fund’s total assets were invested in securities of foreign issuers. In most instances, foreign taxes were withheld from income paid to the Fund on these investments. The Fund elects to treat foreign taxes paid as allowed under Section 853 of the Code. This election will allow shareholders of record as of the 2008 distribution date, to treat their proportionate share of foreign taxes paid by the Fund as having been paid directly by them. The shareholder shall consider these amounts as foreign taxes paid in the tax year in which they receive the Fund distribution.
TG-25
INDEX DESCRIPTIONS
The indexes are unmanaged and include reinvested distributions.
Bloomberg World Communications Index is a market capitalization-weighted index designed to measure equity performance of the communications sector of the Bloomberg World Index.
Consumer Price Index (CPI), calculated by the U.S. Bureau of Labor Statistics, is a commonly used measure of the inflation rate.
CS High Yield Index is designed to mirror the investible universe of the U.S. dollar-denominated high yield debt market.
Dow Jones Industrial Average (the Dow) is price weighted based on the average market price of 30 blue chip stocks of companies that are generally industry leaders.
Dow Jones Wilshire Real Estate Securities Index is a broad measure of the performance of publicly traded real estate securities, such as real estate investment trusts and real estate operating companies. The index is float adjusted, capitalization weighted and rebalanced monthly, and returns are calculated on a buy-and-hold basis.
J.P. Morgan (JPM) Emerging Markets Bond Index (EMBI) Global tracks total returns for U.S. dollar-denominated debt instruments issued by emerging market sovereign and quasi-sovereign entities: Brady bonds, loans and Eurobonds. Regional market returns are from subindexes of the JPM EMBI Global.
J.P. Morgan (JPM) Euro Emerging Markets Bond Index (EMBI) Global tracks total returns for euro-denominated, straight fixed coupon instruments issued by emerging market sovereign and quasi-sovereign entities.
J.P. Morgan (JPM) Government Bond Index (GBI)-Emerging Markets (EM) tracks total returns for liquid, fixed-rate, local currency emerging market government bonds. Local bond market returns are from country subindexes of the JPM GBI-EM.
J.P. Morgan (JPM) Government Bond Index (GBI) Global tracks total returns for liquid, fixed-rate, domestic government bonds with maturities greater than one year issued by developed countries globally.
Lehman Brothers (LB) U.S. Aggregate Index represents securities that are SEC-registered, taxable and dollar denominated. The index covers the U.S. investment grade fixed-rate bond market, with index components for government and corporate securities, mortgage pass-through securities and asset-backed securities. All issues included must have at least one year to final maturity and must be rated investment grade (Baa3 or better) by Moody’s Investors Service. They must also be dollar denominated and nonconvertible. Total return includes price appreciation/depreciation and income as a percentage of the original investment. The index is rebalanced monthly by market capitalization.
Lehman Brothers (LB) U.S. Government: Intermediate Index is the intermediate component of the LB U.S. Government Index. The index includes securities issued by the U.S. government or agency. These include obligations of the U.S. Treasury with remaining maturity of one year or more and publicly issued debt of U.S. governmental agencies, quasi-federal corporations, and corporate or foreign debt guaranteed by the U.S. government.
Lipper High Current Yield Funds Classification Average is an equally weighted average calculation of performance figures for all funds within the Lipper High Current Yield Funds classification in the Lipper Open-End underlying funds universe. Lipper High Current Yield Funds aim at high (relative) current yield from fixed income securities, have no quality or maturity restrictions, and tend to invest in lower grade debt issues. For the 12-month period ended 12/31/07, there were 455 funds in this category. Lipper calculations do not include contract fees, expenses or sales charges, and may have been different if such charges had been considered.
Lipper Multi-Sector Income Funds Classification Average is an equally weighted average calculation of performance figures for all funds within the Lipper Multi-Sector Income Funds classification in the Lipper Open-End underlying funds universe. Lipper Multi-Sector Income Funds are defined as funds that seek current income by allocating assets among different fixed income securities sectors (not primarily in one sector except for defensive purposes), including U.S. and foreign governments, with a significant portion rated below investment grade. For the 12-month period ended 12/31/07, there were 124 funds in this category. Lipper calculations do not include contract fees, expenses or sales charges, and may have been different if such charges had been considered.
Lipper VIP Equity Income Funds Classification Average is an equally weighted average calculation of performance figures for all funds within the Lipper Equity Income Funds classification in the Lipper VIP underlying funds universe. Lipper Equity Income Funds seek relatively high current income and growth of income through investing 65% or more of their portfolios in equities. For the 12-month period ended 12/31/07, there were 58 funds in this category. Lipper calculations do not include contract fees, expenses or sales charges, and may have been different if such charges had been considered.
I-1
Lipper VIP General U.S. Government Funds Classification Average is an equally weighted average calculation of performance figures for all funds within the Lipper U.S. Government Funds classification in the Lipper VIP underlying funds universe. Lipper U.S. Government Funds invest primarily in U.S. government and agency issues. For the 12-month period ended 12/31/07, there were 69 funds in this category. Lipper calculations do not include contract fees, expenses or sales charges, and may have been different if such charges had been considered.
Lipper VIP High Current Yield Funds Classification Average is an equally weighted average calculation of performance figures for all funds within the Lipper High Current Yield Funds in the Lipper VIP underlying funds universe. Lipper High Current Yield Funds aim at high (relative) current yield from fixed income securities, have no quality or maturity restrictions, and tend to invest in lower grade debt issues. For the 12-month period ended 12/31/07, there were 108 funds in this category. Lipper calculations do not include contract fees, expenses or sales charges, and may have been different if such charges had been considered.
Merrill Lynch 2- and 5-Year Zero Coupon Bond Indexes include zero coupon bonds that pay no interest and are issued at a discount from redemption price.
Morgan Stanley Capital International (MSCI) All Country (AC) World Index is a free float-adjusted, market capitalization-weighted index designed to measure equity market performance in global developed and emerging markets.
Morgan Stanley Capital International (MSCI) Emerging Markets (EM) Index is a free float-adjusted, market capitalization-weighted index designed to measure equity market performance in global emerging markets.
Morgan Stanley Capital International (MSCI) Europe, Australasia, Far East (EAFE) Index is a free float-adjusted, market capitalization-weighted index designed to measure equity market performance in global developed markets excluding the U.S. and Canada.
Morgan Stanley Capital International (MSCI) World Index is a free float-adjusted, market capitalization-weighted index designed to measure equity market performance in global developed markets.
NASDAQ Composite Index measures all NASDAQ domestic and international based common type stocks listed on The NASDAQ Stock Market. The index is market value weighted and includes more than 3,000 companies.
Russell 1000® Growth Index is market capitalization weighted and measures performance of those Russell 1000 Index companies with higher price-to-book ratios and higher forecasted growth values.
Russell 1000 Index is market capitalization weighted and measures performance of the 1,000 largest companies in the Russell 3000 Index, which represent approximately 92% of total market capitalization of the Russell 3000 Index.
Russell 1000 Value Index is market capitalization weighted and measures performance of those Russell 1000 Index companies with lower price-to-book ratios and lower forecasted growth values.
Russell 2500™ Index is market capitalization weighted and measures performance of the 2,500 smallest companies in the Russell 3000 Index, which represent approximately 17% of total market capitalization of the Russell 3000 Index.
Russell 2500 Value Index is market capitalization weighted and measures performance of those Russell 2500 Index companies with lower price-to-book ratios and lower forecasted growth values.
Russell 3000® Growth Index is market capitalization weighted and measures performance of those Russell 3000 Index companies with higher price-to-book ratios and higher forecasted growth values.
Russell 3000 Index is market capitalization weighted and measures performance of the 3,000 largest U.S. companies based on total market capitalization, which represent approximately 98% of the investible U.S. equity market.
Russell Midcap® Growth Index is market capitalization weighted and measures performance of those Russell Midcap Index companies with higher price-to-book ratios and higher forecasted growth values.
Russell Midcap Index is market capitalization weighted and measures performance of the 800 smallest companies in the Russell 1000 Index, which represent approximately 26% of total market capitalization of the Russell 1000 Index.
Standard & Poor’s 500 Index (S&P 500) consists of 500 stocks chosen for market size, liquidity and industry group representation. Each stock’s weight in the index is proportionate to its market value. The S&P 500 is one of the most widely used benchmarks of U.S. equity performance.
I-2
Standard & Poor’s/Citigroup BMI Global REIT Index is designed to measure performance of the investible universe of publicly traded real estate investment trusts. Index constituents generally derive more than 60% of revenue from real estate development, management, rental, and/or direct investment in physical property and with local REIT or property trust tax status.
Standard & Poor’s/International Finance Corporation Investable (S&P/IFCI) Composite Index is a free float-adjusted, market capitalization-weighted index designed to measure equity performance in global emerging markets.
I-3
Board Members and Officers
The name, year of birth and address of the officers and board members, as well as their affiliations, positions held with the Trust, principal occupation during the past five years and number of portfolios overseen in the Franklin Templeton Investments fund complex are shown below. Generally, each board member serves until that person’s successor is elected and qualified.
Independent Board Members
| | | | | | | | |
| Name, Year of Birth and Address | | Position | | Length of
Time Served | | Number of
Portfolios in Fund
Complex Overseen
by Board Member* | | Other Directorships Held |
HARRIS J. ASHTON (1932) One Franklin Parkway San Mateo, CA 94403-1906 | | Trustee | | Since 1988 | | 141 | | Bar-S Foods (meat packing company). |
|
Principal Occupation During Past 5 Years: Director of various companies; and formerly, Director, RBC Holdings, Inc. (bank holding company) (until 2002); and President, Chief Executive Officer and Chairman of the Board, General Host Corporation (nursery and craft centers) (until 1998). |
ROBERT F. CARLSON (1928) One Franklin Parkway San Mateo, CA 94403-1906 | | Trustee | | Since 1998 | | 121 | | None |
|
Principal Occupation During Past 5 Years: Vice President, senior member and past President, Board of Administration, California Public Employees Retirement Systems (CALPERS); and formerly, member and Chairman of the Board, Sutter Community Hospitals; member, Corporate Board, Blue Shield of California; and Chief Counsel, California Department of Transportation. |
SAM GINN (1937) One Franklin Parkway San Mateo, CA 94403-1906 | | Trustee | | Since March 2007 | | 121 | | Chevron Corporation (global energy company) and ICO Global Communications (Holdings) Limited (satellite company). |
|
Principal Occupation During Past 5 Years: Private investor; and formerly, Chairman of the Board, Vodafone AirTouch, PLC (wireless company); Chairman of the Board and Chief Executive Officer, AirTouch Communications (cellular communications) (1993-1998) and Pacific Telesis Groups (telephone holding company) (1988-1994). |
EDITH E. HOLIDAY (1952) One Franklin Parkway San Mateo, CA 94403-1906 | | Trustee | | Since 2005 | | 141 | | Hess Corporation (exploration and refining of oil and gas), H.J. Heinz Company (processed foods and allied products), RTI International Metals, Inc. (manufacture and distribution of titanium), Canadian National Railway (railroad) and White Mountains Insurance Group, Ltd. (holding company). |
|
Principal Occupation During Past 5 Years: Director or Trustee of various companies and trusts; and formerly, Assistant to the President of the United States and Secretary of the Cabinet (1990-1993); General Counsel to the United States Treasury Department (1989-1990); and Counselor to the Secretary and Assistant Secretary for Public Affairs and Public Liaison-United States Treasury Department (1988-1989). |
FRANK W.T. LAHAYE (1929) One Franklin Parkway San Mateo, CA 94403-1906 | | Trustee | | Since 1988 | | 121 | | Center for Creative Land Recycling (brownfield redevelopment). |
|
Principal Occupation During Past 5 Years: General Partner, Las Olas L.P. (Asset Management); and formerly, Chairman, Peregrine Venture Management Company (venture capital). |
BOD-1
| | | | | | | | |
| Name, Year of Birth and Address | | Position | | Length of
Time Served | | Number of
Portfolios in Fund
Complex Overseen
by Board Member* | | Other Directorships Held |
FRANK A. OLSON (1932) One Franklin Parkway San Mateo, CA 94403-1906 | | Trustee | | Since 2005 | | 141 | | Hess Corporation (exploration and refining of oil and gas) and Sentient Jet (private jet service). |
|
Principal Occupation During Past 5 Years: Chairman Emeritus, The Hertz Corporation (car rental) (since 2000) (Chairman of the Board (1980-2000) and Chief Executive Officer (1977-1999)); and formerly, Chairman of the Board, President and Chief Executive Officer, UAL Corporation (airlines). |
LARRY D. THOMPSON (1945) One Franklin Parkway San Mateo, CA 94403-1906 | | Trustee | | Since March 2007 | | 141 | | None |
Principal Occupation During Past 5 Years: Senior Vice President—Government Affairs, General Counsel and Secretary, PepsiCo, Inc. (consumer products); and formerly, Director, Delta Airlines (aviation) (2003-2005) and Providian Financial Corp. (credit card provider) (1997-2001); Senior Fellow of The Brookings Institution (2003-2004); Visiting Professor, University of Georgia School of Law (2004); and Deputy Attorney General, U.S. Department of Justice (2001-2003). |
JOHN B. WILSON (1959) One Franklin Parkway San Mateo, CA 94403-1906 | | Lead Independent Trustee | | Trustee since March 2007 and Lead Independent Trustee since January 2008 | | 121 | | None |
Principal Occupation During Past 5 Years: President and Founder, Hyannis Port Capital, Inc. (real estate and private equity investing); serves on private and non-profit boards; and formerly, Chief Operating Officer and Executive Vice President, Gap, Inc. (retail) (1996-2000); Chief Financial Officer and Executive Vice President—Finance and Strategy, Staples, Inc. (office supplies) (1992-1996); Executive vice President—Corporate Planning, Northwest Airlines, Inc. (airlines) (1990-1992); and Vice President and Partner, Bain & Company (consulting firm) (1986-1990). |
Interested Board Members and Officers
| | | | | | | | |
| Name, Year of Birth and Address | | Position | | Length of
Time Served | | Number of
Portfolios in Fund
Complex Overseen
by Board Member* | | Other Directorships Held |
**CHARLES B. JOHNSON (1933) One Franklin Parkway San Mateo, CA 94403-1906 | | Trustee and Chairman of the Board | | Since 1988 | | 142 | | None |
Principal Occupation During Past 5 Years: Chairman of the Board, Member—Office of the Chairman and Director, Franklin Resources, Inc.; Director, Templeton Worldwide, Inc.; and officer and/or director or trustee, as the case may be, of some of the other subsidiaries of Franklin Resources, Inc. and of 42 of the investment companies in Franklin Templeton Investments. |
**RUPERT H. JOHNSON, JR. (1940) One Franklin Parkway San Mateo, CA 94403-1906 | | Trustee, President and Chief Executive Officer—Investment Management | | Trustee since 1988 and President and Chief Executive Officer—Investment Management since 2002 | | 126 | | None |
Principal Occupation During Past 5 Years: Vice Chairman, Member—Office of the Chairman and Director, Franklin Resources, Inc.; Director, Franklin Advisers, Inc. and Templeton Worldwide, Inc.; Senior Vice President, Franklin Advisory Services, LLC; and officer and/or director or trustee, as the case may be, of some of the other subsidiaries of Franklin Resources, Inc. and of 44 of the investment companies in Franklin Templeton Investments. |
BOD-2
| | | | | | | | |
| Name, Year of Birth and Address | | Position | | Length of
Time Served | | Number of
Portfolios in Fund
Complex Overseen
by Board Member* | | Other Directorships Held |
JAMES M. DAVIS (1952) One Franklin Parkway San Mateo, CA 94403-1906 | | Chief Compliance Officer and Vice President—AML Compliance | | Chief Compliance Officer since 2004 and Vice President—AML Compliance since 2006 | | Not
Applicable | | Not Applicable |
Principal Occupation During Past 5 Years: Director, Global Compliance, Franklin Resources, Inc.; officer of some of the other subsidiaries of Franklin Resources, Inc. and of 46 of the investment companies in Franklin Templeton Investments; and formerly, Director of Compliance, Franklin Resources, Inc. (1994-2001). |
LAURA FERGERSON (1962) One Franklin Parkway San Mateo, CA 94403-1906 | | Treasurer | | Since 2004 | | Not
Applicable | | Not Applicable |
|
Principal Occupation During Past 5 Years: Vice President, Franklin Templeton Services, LLC; officer of 28 of the investment companies in Franklin Templeton Investments; and formerly, Director and member of Audit and Valuation Committees, Runkel Funds, Inc. (2003-2004); Assistant Treasurer of most of the investment companies in Franklin Templeton Investments (1997-2003); and Vice President, Franklin Templeton Services, LLC (1997-2003). |
JIMMY D. GAMBILL (1947) 500 East Broward Blvd. Suite 2100 Fort Lauderdale, FL 33394-3091 | | Senior Vice President and Chief Executive Officer—Finance and Administration | | Since 2002 | | Not
Applicable | | Not Applicable |
|
Principal Occupation During Past 5 Years: President, Franklin Templeton Services, LLC; Senior Vice President, Templeton Worldwide, Inc.; and officer of some of the other subsidiaries of Franklin Resources, Inc. and of 46 of the investment companies in Franklin Templeton Investments. |
DAVID P. GOSS (1947) One Franklin Parkway San Mateo, CA 94403-1906 | | Vice President | | Since 2000 | | Not
Applicable | | Not Applicable |
|
Principal Occupation During Past 5 Years: Senior Associate General Counsel, Franklin Templeton Investments; officer and director of one of the subsidiaries of Franklin Resources, Inc.; and officer of 46 of the investment companies in Franklin Templeton Investments. |
KAREN L. SKIDMORE (1952) One Franklin Parkway San Mateo, CA 94403-1906 | | Vice President
and Secretary | | Since 2006 | | Not
Applicable | | Not Applicable |
|
Principal Occupation During Past 5 Years: Senior Associate General Counsel, Franklin Templeton Investments; and officer of 30 of the investment companies in Franklin Templeton Investments. |
BOD-3
| | | | | | | | |
| Name, Year of Birth and Address | | Position | | Length of
Time Served | | Number of
Portfolios in Fund
Complex Overseen
by Board Member* | | Other Directorships Held |
CRAIG S. TYLE (1960) One Franklin Parkway San Mateo, CA 94403-1906 | | Vice President | | Since 2005 | | Not
Applicable | | Not Applicable |
|
Principal Occupation During Past 5 Years: General Counsel and Executive Vice President, Franklin Resources, Inc.; officer of some of the other subsidiaries of Franklin Resources, Inc. and of 46 of the investment companies in Franklin Templeton Investments; and formerly, Partner, Shearman & Sterling, LLP (2004-2005); and General Counsel, Investment Company Institute (ICI) (1997-2004). |
GALEN G. VETTER (1951) 500 East Broward Blvd. Suite 2100 Fort Lauderdale, FL 33394-3091 | | Chief Financial Officer and Chief Accounting Officer | | Since 2004 | | Not
Applicable | | Not Applicable |
|
Principal Occupation During Past 5 Years: Senior Vice President, Franklin Templeton Services, LLC; officer of some of the other subsidiaries of Franklin Resources, Inc. and of 46 of the investment companies in Franklin Templeton Investments; and formerly, Managing Director, RSM McGladrey, Inc. (1999-2004); and Partner, McGladrey & Pullen, LLP (1979-1987 and 1991-2004). |
| *We | base the number of portfolios on each separate series of the U.S. registered investment companies within the Franklin Templeton Investments fund complex. These portfolios have a common investment manager or affiliated investment managers. |
| **Charles | B. Johnson and Rupert H. Johnson, Jr. are considered to be interested persons of the Fund under the federal securities laws due to their positions as officers and directors and major shareholders of Franklin Resources, Inc., which is the parent company of the Trust’s manager and distributor. |
Note 1: Charles B. Johnson and Rupert H. Johnson, Jr. are brothers.
Note 2: Officer information is current as of the date of this report. It is possible that after this date, information about officers may change.
The Sarbanes-Oxley Act of 2002 and Rules adopted by the Securities and Exchange Commission require the Fund to disclose whether the Fund’s Audit Committee includes at least one member who is an audit committee financial expert within the meaning of such Act and Rules. The Fund’s Board has determined that there is at least one such financial expert on the Audit Committee and has designated John B. Wilson as its audit committee financial expert. The Board believes that Mr. Wilson qualifies as such an expert in view of his extensive business background and experience, including service as chief financial officer of Staples, Inc. from 1992 to 1996. Mr. Wilson has been a Member and Chairman of the Fund’s Audit Committee since 2006. As a result of such background and experience, the Board believes that Mr. Wilson has acquired an understanding of generally accepted accounting principles and financial statements, the general application of such principles in connection with the accounting estimates, accruals and reserves, and analyzing and evaluating financial statements that present a breadth and level of complexity of accounting issues generally comparable to those of the Fund, as well as an understanding of internal controls and procedures for financial reporting and an understanding of audit committee functions. Mr. Wilson is an independent Board member as that term is defined under the relevant Securities and Exchange Commission Rules and Releases.
The Statement of Additional Information (SAI) includes additional information about the board members and is available, without charge, upon request. Shareholders may call 1-800/321-8563 or their insurance companies to request the SAI.
BOD-4
Franklin Templeton Variable Insurance Products Trust
Shareholder Information
Proxy Voting Policies and Procedures
The Trust has established Proxy Voting Policies and Procedures (Policies) that the Trust uses to determine how to vote proxies relating to portfolio securities. Shareholders may view the Trust’s complete Policies online at franklintempleton.com. Alternatively, shareholders may request copies of the Policies free of charge by calling the Proxy Group collect at 1-954/527-7678 or by sending a written request to: Franklin Templeton Companies, LLC, 500 East Broward Boulevard, Suite 1500, Fort Lauderdale, FL 33394, Attention: Proxy Group. Copies of the Trust’s proxy voting records are also made available online at franklintempleton.com and posted on the U.S. Securities and Exchange Commission’s website at sec.gov and reflect the most recent 12-month period ended June 30.
Quarterly Statement of Investments
The Trust files a complete statement of investments with the U.S. Securities and Exchange Commission for the first and third quarters for each fiscal year on Form N-Q. Shareholders may view the filed Form N-Q by visiting the Commission’s website at sec.gov. The filed form may also be viewed and copied at the Commission’s Public Reference Room in Washington, DC. Information regarding the operations of the Public Reference Room may be obtained by calling 1-800/SEC-0330.
SI-1
| | |
 | | One Franklin Parkway San Mateo, CA 94403-1906 |
Annual Report
FRANKLIN TEMPLETON
VARIABLE INSURANCE PRODUCTS TRUST
Investment Managers
Franklin Advisers, Inc.
Franklin Advisory Services, LLC
Franklin Mutual Advisers, LLC
Franklin Templeton Institutional, LLC
Templeton Asset Management, Ltd., Singapore
Templeton Global Advisors Limited
Templeton Investment Counsel, LLC
Distributor
Franklin Templeton Distributors, Inc.
Franklin Templeton Variable Insurance Products Trust (FTVIP) shares are sold only to insurance company separate accounts (Separate Account) to serve as the investment vehicles for both variable annuity and variable life insurance contracts.
Authorized for distribution to investors in Separate Accounts only when accompanied or preceded by the current prospectus for the applicable contract, which includes the Separate Account and the FTVIP prospectuses. Investors should carefully consider a fund’s investment goals, risks, charges and expenses before investing. The prospectus contains this and other information; please read it carefully before investing.
To ensure the highest quality of service, telephone calls to or from our service departments may be monitored, recorded and accessed. These calls can be identified by the presence of a regular beeping tone.
FTVIP A2007 02/08
| (a) | The Registrant has adopted a code of ethics that applies to its principal executive officers and principal financial and accounting officer. |
| (f) | Pursuant to Item 12(a)(1), the Registrant is attaching as an exhibit a copy of its code of ethics that applies to its principal executive officers and principal financial and accounting officer. |
| Item 3. | Audit Committee Financial Expert. |
| (a) | (1) The Registrant has an audit committee financial expert serving on its audit committee. |
| | |
| (2) | | The audit committee financial expert is John B. Wilson and he is “independent” as defined under the relevant Securities and Exchange Commission Rules and Releases. |
| Item 4. | Principal Accountant Fees and Services. |
(a) Audit Fees
The aggregate fees paid to the principal accountant for professional services rendered by the principal accountant for the audit of the registrant’s annual financial statements or for services that are normally provided by the principal accountant in connection with statutory and regulatory filings or engagements were $851,956 for the fiscal year ended December 31, 2007 and $771,869 for the fiscal year ended December 31, 2006.
(b) Audit-Related Fees
There were no fees paid to the principal accountant for assurance and related services rendered by the principal accountant to the registrant that are reasonably related to the performance of the audit of the registrant’s financial statements and are not reported under paragraph (a) of Item 4.
There were no fees paid to the principal accountant for assurance and related services rendered by the principal accountant to the registrant’s investment adviser and any entity controlling, controlled by or under common control with the investment adviser that provides ongoing services to the registrant that are reasonably related to the performance of the audit of their financial statements.
(c) Tax Fees
There were no fees paid to the principal accountant for professional services rendered by the principal accountant to the registrant for tax compliance, tax advice and tax planning.
The aggregate fees paid to the principal accountant for professional services rendered by the principal accountant to the registrant’s investment adviser and any entity controlling, controlled by or under common control with the investment adviser that provides ongoing services to the registrant for tax compliance, tax advice and tax planning were $46,000 for the fiscal year ended December 31, 2007 and $3,961 for the fiscal year ended December 31, 2006. The services for which these fees were paid included tax compliance and advice.
(d) All Other Fees
The aggregate fees paid to the principal accountant for products and services rendered by the principal accountant to the registrant not reported in paragraphs (a)-(c) of Item 4 were $0 for the fiscal year ended December 31, 2007 and $14,799 for the fiscal year ended December 31, 2006. The services for which these fees were paid included review of materials provided to the fund Board in connection with the investment management contract renewal process.
The aggregate fees paid to the principal accountant for products and services rendered by the principal accountant to the registrant’s investment adviser and any entity controlling, controlled by or under common control with the investment adviser that provides ongoing
services to the registrant other than services reported in paragraphs (a)-(c) of Item 4 were $0 for the fiscal year ended December 31, 2007 and $161,062 for the fiscal year ended December 31, 2006. The services for which these fees were paid included review of materials provided to the fund Board in connect with the investment management contract renewal process.
(e) (1) The registrant’s audit committee is directly responsible for approving the services to be provided by the auditors, including:
(i) pre-approval of all audit and audit related services;
(ii) pre-approval of all non-audit related services to be provided to the Fund by the auditors;
(iii) pre-approval of all non-audit related services to be provided to the registrant by the auditors to the registrant’s investment adviser or to any entity that controls, is controlled by or is under common control with the registrant’s investment adviser and that provides ongoing services to the registrant where the non-audit services relate directly to the operations or financial reporting of the registrant; and
(iv) establishment by the audit committee, if deemed necessary or appropriate, as an alternative to committee pre-approval of services to be provided by the auditors, as required by paragraphs (ii) and (iii) above, of policies and procedures to permit such services to be pre-approved by other means, such as through establishment of guidelines or by action of a designated member or members of the committee; provided the policies and procedures are detailed as to the particular service and the committee is informed of each service and such policies and procedures do not include delegation of audit committee responsibilities, as contemplated under the Securities Exchange Act of 1934, to management; subject, in the case of (ii) through (iv), to any waivers, exceptions or exemptions that may be available under applicable law or rules.
(e) (2) None of the services provided to the registrant described in paragraphs (b)-(d) of Item 4 were approved by the audit committee pursuant to paragraph (c)(7)(i)(C) of Rule 2-01 of regulation S-X.
(f) No disclosures are required by this Item 4(f).
(g) The aggregate non-audit fees paid to the principal accountant for services rendered by the principal accountant to the registrant and the registrant’s investment adviser and any entity controlling, controlled by or under common control with the investment adviser that provides ongoing services to the registrant were $46,000 for the fiscal year ended December 31, 2007 and $179,822 for the fiscal year ended December 31, 2006.
(h) The registrant’s audit committee of the board has considered whether the provision of non-audit services that were rendered to the registrant’s investment adviser (not including any sub-adviser whose role is primarily portfolio management and is subcontracted with or overseen by another investment adviser), and any entity controlling, controlled by, or under common control with the investment adviser that
provides ongoing services to the registrant that were not pre-approved pursuant to paragraph (c)(7)(ii) of Rule 2-01 of Regulation S-X is compatible with maintaining the principal accountant’s independence.
| Item 5. | Audit Committee of Listed Registrants. |
N/A
| Item 6. | Schedule of Investments. |
N/A
| Item 7. | Disclosure of Proxy Voting Policies and Procedures for Closed-End Management Investment Companies. |
N/A
| Item 8. | Portfolio Managers of Closed-End Management Investment Companies. |
N/A
| Item 9. | Purchases of Equity Securities by Closed-End Management Investment Companies and Affiliated Purchases. |
N/A
| Item 10. | Submission of Matters to a vote of Security Holders. |
There have been no changes to the procedures by which shareholders may recommend nominees to the Registrant’s Board of Trustees that would require disclosure herein.
| Item 11. | Controls and Procedures. |
(a) Evaluation of Disclosure Controls and Procedures. The Registrant maintains disclosure controls and procedures that are designed to ensure that information required to be disclosed in the Registrant’s filings under the Securities Exchange Act of 1934 and the Investment Company Act of 1940 is recorded, processed, summarized and reported within the periods specified in the rules and forms of the Securities and Exchange Commission. Such information is accumulated and communicated to the Registrant’s management, including its principal executive officer and principal financial officer, as appropriate, to allow timely decisions regarding required disclosure. The Registrant’s management, including the principal executive officer and the principal financial officer, recognizes that any set of controls and procedures, no matter how well designed and operated, can provide only reasonable assurance of achieving the desired control objectives.
Within 90 days prior to the filing date of this Shareholder Report on Form N-CSR, the Registrant had carried out an evaluation, under the supervision and with the participation of the Registrant’s management, including the Registrant’s principal executive officer and the Registrant’s principal financial officer, of the effectiveness of the design and operation of the Registrant’s disclosure controls and procedures. Based on such evaluation, the Registrant’s principal executive officer and principal financial officer concluded that the Registrant’s disclosure controls and procedures are effective.
(b) Changes in Internal Controls. There have been no significant changes in the Registrant’s internal controls or in other factors that
could significantly affect the internal controls subsequent to the date of their evaluation in connection with the preparation of this Shareholder Report on Form N-CSR.
(a) (1) Code of Ethics
(a) (2) Certifications pursuant to Section 302 of the Sarbanes-Oxley Act of 2002 of Galen G. Vetter, Chief Executive Officer—Finance and Administration, and Laura Fergerson, Chief Financial Officer and Chief Accounting Officer
(b) Certifications pursuant to Section 906 of the Sarbanes-Oxley Act of 2002 of Galen G. Vetter, Chief Executive Officer—Finance and Administration, and Laura Fergerson, Chief Financial Officer and Chief Accounting Officer
SIGNATURES
Pursuant to the requirements of the Securities Exchange Act of 1934 and the Investment Company Act of 1940, the registrant has duly caused this report to be signed on its behalf by the undersigned, thereunto duly authorized.
FRANKLIN TEMPLETON VARIABLE INSURANCE PRODUCTS TRUST
| | |
| By: | | /s/ GALEN G. VETTER |
| | Galen G. Vetter |
| | Chief Executive Officer – Finance and Administration |
| | Date February 27, 2008 |
Pursuant to the requirements of the Securities Exchange Act of 1934 and the Investment Company Act of 1940, this report has been signed below by the following persons on behalf of the registrant and in the capacities and on the dates indicated.
| | |
| By: | | /s/ GALEN G. VETTER |
| | Galen G. Vetter |
| | Chief Executive Officer – Finance and Administration |
| | Date February 27, 2008 |
| |
| By: | | /s/ LAURA FERGERSON |
| | Laura Fergerson |
| | Chief Financial Officer and Chief Accounting Officer |
| | Date February 27, 2008 |