UNITED STATES
SECURITIES AND EXCHANGE COMMISSION
Washington, D.C. 20549
FORM N-CSR
CERTIFIED SHAREHOLDER REPORT OF REGISTERED
MANAGEMENT INVESTMENT COMPANIES
Investment Company Act file number 811-05583
Franklin Templeton Variable Insurance Products Trust
(Exact name of registrant as specified in charter)
One Franklin Parkway,
San Mateo, CA 94403-1906
(Address of principal executive offices) (Zip code)
Craig S. Tyle,
One Franklin Parkway,
San Mateo, CA 94403-1906
(Name and address of agent for service)
Registrant’s telephone number, including area code: (650) 312-2000
Date of fiscal year end: 12/31
Date of reporting period: 12/31/11
| Item 1. | Reports to Stockholders. |

DECEMBER 31, 2011
FRANKLIN TEMPLETON
VARIABLE INSURANCE PRODUCTS TRUST
ANNUAL
REPORT

FRANKLIN TEMPLETON VARIABLE INSURANCE
PRODUCTS TRUST ANNUAL REPORT
TABLEOF CONTENTS
*Not part of the annual report
NOT FDIC INSURED | MAY LOSE VALUE | NO BANK GUARANTEE
MASTER CLASS – 3
IMPORTANT NOTESTOPERFORMANCE INFORMATION
Performance data is historical and cannot predict or guarantee future results. Principal value and investment return will fluctuate with market conditions, and you may have a gain or loss when you withdraw your money. Inception dates of the funds may have preceded the effective dates of the subaccounts, contracts, or their availability in all states.
When reviewing the index comparisons, please keep in mind that indexes have a number of inherent performance differentials over the funds. First, unlike the funds, which must hold a minimum amount of cash to maintain liquidity, indexes do not have a cash component. Second, the funds are actively managed and, thus, are subject to management fees to cover salaries of securities analysts or portfolio managers in addition to other expenses. Indexes are unmanaged and do not include any commissions or other expenses typically associated with investing in securities. Third, indexes often contain a different mix of securities than the fund to which they are compared. Additionally, please remember that indexes are simply a measure of performance and cannot be invested in directly.
i
SUPPLEMENT DATED JANUARY 3, 2012
TOTHE PROSPECTUS
DATED MAY 1, 2011
(Franklin Templeton Variable Insurance Products Trust)
In the section titled “Additional Information, All Funds” the following replaces all text under the heading “Market Timing Trading Policy”:
The board of trustees has adopted the following policies and procedures with respect to market timing (Market Timing Trading Policy):
Market timing generally. The Fund discourages and does not intend to accommodate short-term or frequent purchases and redemptions of fund shares, often referred to as “market timing,” and asks its Fund of Fund investors and participating Insurers for their cooperation in trying to discourage such activity in their separate accounts by Contract Owners and their financial advisors. The Fund intends to seek to restrict or reject such trading or take other action, as described below, if in the judgment of the Fund manager or transfer agent such trading may interfere with the efficient management of the Fund’s portfolio, may materially increase the Fund’s transaction costs, administrative costs or taxes, or may otherwise be detrimental to the interests of the Fund and its shareholders.
Market timing consequences. If information regarding trading activity in the Fund or in any other Franklin Templeton fund or non-Franklin Templeton fund is brought to the attention of the Fund’s manager or transfer agent and based on that information the Fund or its manager or transfer agent in their sole discretion conclude that such trading may be detrimental to the Fund as described in this Market Timing Trading Policy, the Fund may temporarily or permanently bar future purchases into the Fund or, alternatively, may limit the amount, number or frequency of any future purchases and/or the method by which an Insurer or a Fund of Funds may request future purchases and redemptions (including purchases and/or redemptions by an exchange or transfer between the Fund and any other mutual fund). In determining what actions should be taken, the Fund’s transfer agent may consider a variety of factors, including the potential impact of such remedial actions on the Fund and its shareholders. If the Fund is a “fund of funds,” the Fund’s transfer agent may take into account the impact of the trading activity and of any proposed remedial action on both the Fund and the underlying funds in which the Fund invests.
In considering trading activity, the Fund may consider, among other factors, trading history both directly and, if known, through financial intermediaries, in the Fund, in other Franklin Templeton funds, in non-Franklin Templeton mutual funds, or in accounts under common control or ownership.
Market timing through Insurers. As a Contract Owner you are also subject to this policy. An Insurer’s order for purchases and/or redemptions pursuant to a Contract Owner’s instructions (including purchases and/or redemptions by an exchange or transfer between the Fund and any mutual fund) are submitted pursuant to aggregated orders (Aggregated Orders). A fund of fund’s order for purchases and/or redemptions pursuant to its investors’ instructions are also submitted pursuant to Aggregated Orders. While the Fund will encourage Insurers and funds of funds to apply the Fund’s Market Timing Trading Policy to their investors, the Fund is limited in its ability to monitor the trading activity or enforce the Fund’s Market Timing
P-1
Trading Policy because Insurers and funds of funds have the relationships with, and are responsible for maintaining the account records of, the individual investors. For example, should it occur, the Fund may not be able to detect market timing that may be facilitated by financial intermediaries or made difficult to identify in the Aggregated Orders used by Insurers and Fund of Fund investors.
Therefore, the Fund or its agent selectively monitor the Aggregated Orders used by Insurers and Fund of Fund investors for purchases, exchange and redemptions in respect of all their investors and seek the cooperation of Insurers and Fund of Fund investors to apply the Fund’s Market Timing Trading Policy. There may be legal and technological limitations on the ability of an Insurer or Fund of Fund to impose trading restrictions and to apply the Fund’s Market Timing Trading Policy to their investors through such methods as implementing short-term trading limitations or restrictions, assessing the Fund’s redemption fee (if applicable) and monitoring trading activity for what might be market timing. As a result, the Fund may not be able to determine whether trading by Insurers or funds of funds in respect of their investors is contrary to the Fund’s Market Timing Trading Policy.
Risks from market timers. Depending on various factors, including the size of the Fund, the amount of assets the portfolio manager typically maintains in cash or cash equivalents and the dollar amount and number and frequency of trades and the types of securities in which the Fund typically invests, short-term or frequent trading may interfere with the efficient management of the Fund’s portfolio, increase the Fund’s transaction costs, administrative costs and taxes and/or impact Fund performance.
In addition, if the nature of the Fund’s portfolio holdings exposes the Fund to “arbitrage market timers,” the value of the Fund’s shares may be diluted if redeeming shareholders receive proceeds (and buying shareholders receive shares) based upon net asset values which do not reflect appropriate fair value prices. Arbitrage market timing occurs when an investor seeks to take advantage of the possible delay between the change in the value of a mutual fund’s portfolio holdings and the reflection of the change in the fund’s net asset value per share. A fund that invests significantly in foreign securities may be particularly vulnerable to arbitrage market timing. Arbitrage market timing in foreign investments may occur because of time zone differences between the foreign markets on which the Fund’s international portfolio securities trade and the time as of which the Fund’s NAV is calculated. Arbitrage market timers may purchase shares of the Fund based on events occurring after foreign market closing prices are established, but before calculation of the Fund’s NAV. One of the objectives of the Trust’s fair value pricing procedures is to minimize the possibilities of this type of arbitrage market timing (please see “Valuation – Foreign Securities – Potential Impact of Time Zones and Market Holidays”).
Since the Fund may invest significantly in securities that are, or may be, restricted, unlisted, traded infrequently, thinly traded, or relatively illiquid (relatively illiquid securities), the Fund may be particularly vulnerable to arbitrage market timing. An arbitrage market timer may seek to take advantage of a possible differential between the last available market prices for one or more of these relatively illiquid securities that are used to calculate the Fund’s net asset value and the latest indications of market values for those securities. One of the objectives of the Fund’s fair value pricing procedures is to minimize the possibilities of this type of arbitrage market timing (please see “Fair Valuation – Individual Securities” under the heading “Fund Account Policies”, below).
P-2
The Fund is currently using several methods to reduce the risk of market timing. These methods include:
| • | | seeking the cooperation of Insurers and funds of funds to assist the Fund in identifying potential market timing activity; |
| • | | committing staff to selectively review on a continuing basis recent trading activity in order to identify trading activity that may be contrary to the Fund’s Market Timing Trading Policy; |
| • | | monitoring potential price differentials following the close of trading in foreign markets to determine whether the application of fair value pricing procedures is warranted; and |
| • | | seeking the cooperation of financial intermediaries to assist the Fund in identifying market timing activity. |
Though these methods involve judgments that are inherently subjective and involve some selectivity in their application, the Fund seeks to make judgments and applications that are consistent with the interests of the Fund’s shareholders. There is no assurance that the Fund or its agents will gain access to any or all information necessary to detect market timing in Insurers’ separate accounts. While the Fund will seek to take actions (directly and with the assistance of Insurers) that will detect market timing, it cannot represent that such trading activity can be minimized or completely eliminated.
Revocation of market timing trades. Transactions placed in violation of a Fund’s Market Timing Trading Policy or exchange limit guidelines are not necessarily deemed accepted by the Fund and may be cancelled or revoked by the Fund, in full or in part, as soon as practicable following receipt by the Fund and prompt inquiry of the intermediary.
Please keep this supplement for future reference.
P-3
SUPPLEMENT DATED JANUARY 3, 2012
TOTHE STATEMENTOF ADDITIONAL INFORMATION
DATED MAY 1, 2011
(Franklin Templeton Variable Insurance Products Trust)
The Statement of Additional Information is amended as follows:
I. The section entitled “Glossary of Investments, Techniques, Strategies and Their Risks – Derivative instruments – Credit default swaps” is revised to read as follows:
Credit default swaps. The “buyer” of protection in a credit default swap agreement is obligated to pay the “seller” a periodic stream of payments over the term of the agreement in return for a payment by the “seller” that is contingent upon the occurrence of a credit event with respect to a specific underlying reference debt obligation (whether as a single debt instrument or as part of an index of debt instruments). The contingent payment by the seller generally is the face amount of the debt obligation, in return for the buyer’s obligation to make periodic cash payments and deliver in physical form the reference debt obligation or a cash payment equal to the then-current market value of that debt obligation at the time of the credit event. If no credit event occurs, the seller would receive a fixed rate of income throughout the term of the contract, while the buyer would lose the amount of its payments and recover nothing. The buyer is also subject to the risk that the seller will not satisfy its contingent payment obligation, if and when due.
Purchasing protection through a credit default swap may be used to attempt to hedge against a decline in the value of debt security or securities due to a credit event. The seller of protection under a credit default swap receives periodic payments from the buyer but is exposed to the risk that the value of the reference debt obligation declines due to a credit event and that it will have to pay the face amount of the reference obligation to the buyer. Selling protection under a credit default swap may also permit the seller to gain exposure that is similar to owning the reference debt obligation directly. As the seller of protection, the Fund would effectively add leverage to its portfolio because, in addition to its total assets, the Fund would be subject to the risk that there would be a credit event and the Fund would have to make a substantial payment in the future.
Generally, a credit event means bankruptcy, failure to timely pay interest or principal, obligation acceleration, or modified restructuring of the reference debt obligation. There may be disputes between the buyer or seller of a credit default swap agreement or within the swaps market as a whole as to whether or not a credit event has occurred or what the payout should be which could result in litigation. In some instances where there is a dispute in the credit default swap market, a regional Determinations Committee set up by ISDA may make an official binding determination regarding the existence of credit events under the terms of the ISDA Master Agreement.
ISDA’s Determination Committees are comprised principally of dealers in the OTC derivatives markets which may have a conflicting interest in the determination regarding the existence of a particular credit event. In addition, in the sovereign debt market, a credit default swap agreement may not provide the protection generally anticipated because the government issuer of the sovereign debt instruments may be able to restructure or renegotiate the debt in such a manner as to avoid triggering a credit event.
SAI-1
Moreover, (1) sovereign debt obligations may not incorporate common, commercially acceptable provisions, such as collective action clauses, or (2) the negotiated restructuring of the sovereign debt may be deemed non-mandatory on all holders. As a result, the determination committee might then not be able to determine, or may be able to avoid having to determine, that a credit event under the credit default agreement has occurred.
For these and other reasons, the buyer of protection in a credit default swap agreement is subject to the risk that certain occurrences, such as particular restructuring events affecting the value of the underlying reference debt obligation, or the restructuring of sovereign debt, may not be deemed credit events under the credit default swap agreement. Therefore, if the credit default swap was purchased as a hedge or to take advantage of an anticipated increase in the value of credit protection for the underlying reference obligation, it may not provide any hedging benefit or otherwise increase in value as anticipated. Similarly, the seller of protection in a credit default swap agreement is subject to the risk that certain occurrences may be deemed to be credit events under the credit default swap agreement, even if these occurrences do not adversely impact the value or creditworthiness of the underlying reference debt obligation.
Please keep this supplement for future reference.
SAI-2
TEMPLETON DEVELOPING MARKETS SECURITIES FUND
This annual report for Templeton Developing Markets Securities Fund covers the fiscal year ended December 31, 2011.
Performance Summary as of 12/31/11
Average annual total return of Class 3* shares represents the average annual change in value, assuming reinvestment of dividends and capital gains. Average returns smooth out variations in returns, which can be significant; they are not the same as year-by-year results.
Periods ended 12/31/11
| | | | | | | | | | | | |
| | | 1-Year | | | 5-Year | | | 10-Year | |
Average Annual Total Return | | | -15.86% | | | | +0.78% | | | | +12.47% | |
*Since Class 3 shares were not offered until 5/1/04, performance prior to that date represents historical Class 2 performance. Since 5/1/04 (effective date), the average annual total return of Class 3 shares was +10.23%.
Total Return Index Comparison for a Hypothetical $10,000 Investment (1/1/02–12/31/11)
The graph below shows the change in value of a hypothetical $10,000 investment in the Fund over the indicated period and includes reinvestment of any income or distributions. The Fund’s performance* is compared to the performance of the MSCI Emerging Markets (EM) Index and the Standard & Poor’s®/International Finance Corporation Investable (S&P®/IFCI) Composite Index. One cannot invest directly in an index, and an index is not representative of the Fund’s portfolio. Please see Important Notes to Performance Information preceding the Fund Summaries.
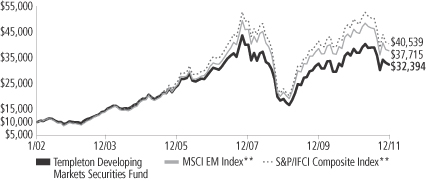
**Source: © 2012 Morningstar. Please see Index Descriptions following the Fund Summaries.
Templeton Developing Markets Securities Fund Class 3
Performance reflects the Fund’s Class 3 operating expenses, but does not include any contract fees, expenses or sales charges. If they had been included, performance would be lower. These charges and deductions, particularly for variable life policies, can have a significant effect on contract values and insurance benefits. See the contract prospectus for a complete description of these expenses, including sales charges.
Performance data represent past performance, which does not guarantee future results. Investment return and principal value will fluctuate, and you may have a gain or loss when you sell your shares.
Current performance may differ from figures shown.
TD-1
Fund Goal and Main Investments: Franklin Templeton Developing Markets Securities Fund seeks long-term capital appreciation. The Fund normally invests at least 80% of its net assets in emerging market investments.
Performance Overview
You can find the Fund’s one-year total return in the Performance Summary. In comparison, the MSCI EM Index had a -18.17% total return, and the S&P/IFCI Composite Index had a -19.03% total return for the same period.1 Please note that index performance numbers are for reference and we do not attempt to track an index but rather undertake investments on the basis of fundamental research.
Economic and Market Overview
The fundamental and financial strength of emerging markets was evident in 2011, as emerging market countries continued to report generally strong economic data, albeit a moderation from 2010. This strength, however, was not reflected in emerging market equity prices as the eurozone sovereign debt crisis and U.S. fiscal concerns led many investors to hold cash, shying away from many investments in developed and emerging markets.
Global stock prices were largely range bound in the first half of 2011. Markets, however, declined in August, largely due to S&P’s downgrade of the U.S. long-term sovereign credit rating to AA+ from AAA, and then again in September, as the prolonged eurozone sovereign debt crisis and lack of a comprehensive solution created significant confusion and volatility in global financial markets.
In October, however, global equity prices rallied, and emerging markets as measured by the MSCI EM Index recorded a double-digit return for the month. Investors welcomed strong corporate earnings reports, the release of positive U.S. economic data, and the European Union’s plans to recapitalize its banks and leverage the European Financial Stability Facility. This rally proved short-lived, and global equity markets corrected again in the final two months of 2011, largely due to the slow progress by European leaders to resolve the eurozone debt crisis.
Heightened volatility and increased uncertainty also gave investors reasons to lock in profits from 2009 and 2010, when many emerging
1. Source: © 2012 Morningstar. One cannot invest directly in an index, and an index is not representative of the Fund’s portfolio. Please see Index Descriptions following the Fund Summaries.
Fund Risks: All investments involve risks. Stock prices fluctuate, sometimes rapidly and dramatically, due to factors affecting individual companies, particular industries or sectors, or general market conditions. Investing in emerging or developing markets is subject to all the risks of foreign investing generally as well as additional, heightened risks, including currency fluctuations, economic instability, market volatility, political and social instability, the relatively smaller size and lesser liquidity of these markets, and less government supervision and regulation of business and industry practices. The Fund may have significant investments in one or more countries or in particular sectors or industries from time to time, and may carry greater risk of adverse developments in a country, sector or industry than a fund that invests more broadly. Smaller and midsize company securities can increase the risk of greater price fluctuations, particularly over the short term. The Fund is actively managed but there is no guarantee that the manager’s investment decisions will produce the desired results. The Fund’s prospectus also includes a description of the main investment risks.
TD-2
markets returned more than 100% in U.S. dollar (USD) terms, as measured by the components of the MSCI EM Index.1 Against this backdrop, emerging markets, as represented by the MSCI EM Index, declined -18.17% in USD terms in 2011.1
Within emerging markets, Southeast Asian stocks were among the better performers in 2011. Strong domestic demand, rising disposable incomes and relatively low unemployment made the region’s economies more resilient to global uncertainties. Relatively more export-dependent markets such as China and Taiwan, however, underperformed their regional peers. India was among the worst emerging market performers for the year due to high inflation and interest rates, a weak rupee and global economic uncertainties. Generally weaker emerging market currencies and a global commodity price correction adversely impacted Latin American markets.
Eastern European markets were among the poorest performers, largely due to their proximity to their western counterparts and a weaker euro rather than a significant deterioration in the region’s economies. South Africa significantly outperformed most of its emerging market counterparts in local currency terms but ended the period with double-digit declines in USD terms due to a weaker rand.
Investment Strategy
We employ a fundamental research, value-oriented, long-term investment approach. We focus on the market price of a company’s securities relative to our evaluation of its long-term earnings, asset value and cash flow potential. We also consider a company’s profit and loss outlook, balance sheet strength, cash flow trends and asset value in relation to the current price. Our analysis considers the company’s corporate governance behavior as well as its position in its sector, the economic framework and political environment. We invest in securities without regard to benchmark comparisons.
Manager’s Discussion
During the 12 months under review, major detractors from the Fund’s absolute performance were Brazil-based Vale, the world’s largest iron ore producer and second-largest nickel producer; Norilsk Nickel (Mining and Metallurgical Co. Norilsk Nickel), a Russia-based major producer of nickel, palladium, and other base and precious metals; and Tata Consultancy Services, one of India’s largest information technology consulting and services firms, with outsourcing services primarily in the
TD-3
Americas, Europe and India. Weak commodity metal prices and higher raw material costs weighed on Vale’s share price. However, at year-end we believed Vale could benefit from the long-term uptrend in commodity demand due to emerging market industrialization. Vale’s strong cash flow and attractive valuations, in our view, underscored our belief in its long-term potential. Investor concerns that Norilsk Nickel could become embroiled in Russian domestic politics after a major shareholder’s December announcement of his intention to run in the presidential election added to the adverse effects of metal price weakness on the company’s shares. In our long-term view, Norilsk Nickel’s strong global market share in base metal and platinum group metal production, huge reserves and low-cost nickel production put the company in a strong position. Tata’s share price performed poorly in U.S. dollar terms due to weakness in the Indian rupee, which reached a record low against the dollar in December. Based on our analysis, we believed Tata remained well positioned to benefit from the global outsourcing trend of services to Indian consulting companies.
Major contributors to absolute performance during the reporting period were Astra International, Indonesia’s leading car and motorcycle company; Brazil-based AmBev (Companhia de Bebidas das Americas), one of the world’s largest beer and soft drink producers; and Souza Cruz, Brazil’s major cigarette company. Astra is a leader in the Indonesian car and motorcycle markets, which have been enjoying strong secular growth trends. The company continued to benefit from Indonesia’s robust economic growth, higher incomes and affordable credit. The strong market positions of AmBev and Souza Cruz have allowed their businesses to achieve superior returns and build market share as consumers become wealthier and more discerning. In our view, the companies’ strong operations, low debt levels, good dividend yield and strong brands made them attractive investments.
It is important to recognize the effect of currency movements on the Fund’s performance. In general, if the value of the U.S. dollar goes up compared with a foreign currency, an investment traded in that foreign currency will go down in value because it will be worth fewer U.S. dollars. This can have a negative effect on Fund performance. Conversely, when the U.S. dollar weakens in relation to a foreign currency, an investment traded in that foreign currency will increase in value, which can contribute to Fund performance. For the 12 months ended December 31, 2011, the U.S. dollar rose in value relative to most
Top 10 Holdings
Templeton Developing Markets
Securities Fund
12/31/11
| | | | |
Company
Sector/Industry,
Country | | % of Total
Net Assets | |
| AmBev (Companhia de Bebidas das Americas) | | | 6.7% | |
| Beverages, Brazil | |
| PT Astra International Tbk | | | 6.3% | |
| Automobiles, Indonesia | |
| Vale SA, ADR, pfd., A | | | 5.0% | |
| Metals & Mining, Brazil | |
| Tata Consultancy Services Ltd. | | | 4.6% | |
| IT Services, India | |
| Souza Cruz SA | | | 3.9% | |
| Tobacco, Brazil | |
| LUKOIL Holdings, ADR | | | 3.5% | |
Oil, Gas & Consumable Fuels,
Russia | |
| President Chain Store Corp. | | | 3.3% | |
| Food & Staples Retailing, Taiwan | | | | |
| Itau Unibanco Holding SA, ADR | | | 3.3% | |
| Commercial Banks, Brazil | |
| Gazprom, ADR | | | 3.0% | |
Oil, Gas & Consumable Fuels,
Russia | |
| PT Bank Central Asia Tbk | | | 2.9% | |
| Commercial Banks, Indonesia | |
The dollar value, number of shares or principal amount, and names of all portfolio holdings are listed in the Fund’s Statement of Investments.
TD-4
currencies. As a result, the Fund’s performance was negatively affected by the portfolio’s investment predominantly in securities with non-U.S. currency exposure.
During the 12-month reporting period, we initiated positions in Australia, Malaysia and Qatar as we continued to search for what we considered to be attractive investment opportunities. We added construction, casinos and gaming, Internet software and services, specialty store and apparel retail companies. Key purchases included new positions in Australia-based BHP Billiton, a major diversified natural resources company with significant sales in emerging markets; Singapore-based SembCorp Marine, a premier global marine and offshore engineering group; and Anhui Conch Cement, one of China’s largest cement producers.
Conversely, we reduced the Fund’s investments in India, Brazil, Russia and China via Hong Kong-listed China H shares to focus on stocks we considered more attractively valued within our investment universe and raise funds for redemptions.2 We reduced the Fund’s holdings largely in diversified banks, oil and gas, diversified metals and mining, and automobile companies. Additionally, we sold our holdings in select companies that reached their target prices during the reporting period. Key sales included reductions of our positions in Brazilian financial conglomerate Itau Unibanco Holding and Chinese automobile manufacturer Guangzhou Automobile Group, as well as elimination of our holding in Brazilian cosmetics company Natura Cosmeticos.
Thank you for your participation in Templeton Developing Markets Securities Fund. We look forward to serving your future investment needs.
2. “China-H” denotes shares of China-incorporated, Hong Kong Stock Exchange-listed companies with most businesses in China.
The foregoing information reflects our analysis, opinions and portfolio holdings as of December 31, 2011, the end of the reporting period. The way we implement our main investment strategies and the resulting portfolio holdings may change depending on factors such as market and economic conditions. These opinions may not be relied upon as investment advice or an offer for a particular security. The information is not a complete analysis of every aspect of any market, country, industry, security or the Fund. Statements of fact are from sources considered reliable, but the investment manager makes no representation or warranty as to their completeness or accuracy. Although historical performance is no guarantee of future results, these insights may help you understand our investment management philosophy.
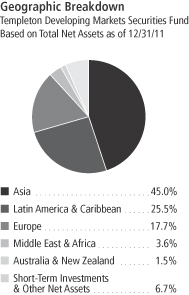
Top 10 Countries
Templeton Developing Markets
Securities Fund
12/31/11
| | | | |
| | | % of Total
Net Assets | |
| Brazil | | | 20.7% | |
| Russia | | | 14.8% | |
| Indonesia | | | 11.1% | |
| China | | | 8.8% | |
| India | | | 8.8% | |
| Thailand | | | 5.7% | |
| Hong Kong | | | 3.9% | |
| Chile | | | 3.3% | |
| Taiwan | | | 3.3% | |
| Singapore | | | 2.3% | |
TD-5
Fund Expenses
As an investor in a variable insurance contract (Contract) that indirectly provides for investment in an underlying mutual fund, you can incur transaction and/or ongoing expenses at both the Fund level and the Contract level.
| • | | Transaction expenses can include sales charges (loads) on purchases, redemption fees, surrender fees, transfer fees and premium taxes. |
| • | | Ongoing expenses can include management fees, distribution and service (12b-1) fees, contract fees, annual maintenance fees, mortality and expense risk fees and other fees and expenses. All mutual funds and Contracts have some types of ongoing expenses. |
The expenses shown in the table are meant to highlight ongoing expenses at the Fund level only and do not include ongoing expenses at the Contract level, or transaction expenses at either the Fund or Contract level. While the Fund does not have transaction expenses, if the transaction and ongoing expenses at the Contract level were included, the expenses shown below would be higher. You should consult your Contract prospectus or disclosure document for more information.
The table shows Fund-level ongoing expenses and can help you understand these expenses and compare them with those of other mutual funds offered through the Contract. The table assumes a $1,000 investment held for the six months indicated. Please refer to the Fund prospectus for additional information on operating expenses.
Actual Fund Expenses
The first line (Actual) of the table provides actual account values and expenses. The “Ending Account Value” is derived from the Fund’s actual return, which includes the effect of ongoing Fund expenses, but does not include the effect of ongoing Contract expenses.
You can estimate the Fund-level expenses you incurred during the period by following these steps. Of course, your account value and expenses will differ from those in this illustration:
| 1. | Divide your account value by $1,000. |
If an account had an $8,600 value, then $8,600 ÷ $1,000 = 8.6.
| 2. | Multiply the result by the number under the heading “Fund-Level Expenses Incurred During Period.” |
If Fund-Level Expenses Incurred During Period were $7.50, then 8.6 x $7.50 = $64.50.
In this illustration, the estimated expenses incurred this period at the Fund level are $64.50.
Templeton Developing Markets Securities Fund Class 3
TD-6
Hypothetical Example for Comparison with Other Mutual Funds
Information in the second line (Hypothetical) of the table can help you compare ongoing expenses of the Fund with those of other mutual funds offered through the Contract. This information may not be used to estimate the actual ending account balance or expenses you incurred during the period. The hypothetical “Ending Account Value” is based on the Fund’s actual expense ratio and an assumed 5% annual rate of return before expenses, which does not represent the Fund’s actual return. The figure under the heading “Fund-Level Expenses Incurred During Period” shows the hypothetical expenses your account would have incurred under this scenario. You can compare this figure with the 5% hypothetical examples that appear in shareholder reports of other funds offered through a Contract.
| | | | | | | | | | | | |
| Class 3 | | Beginning
Account Value 7/1/11 | | | Ending
Account Value 12/31/11 | | | Fund-Level Expenses Incurred
During Period* 7/1/11–12/31/11 | |
Actual | | $ | 1,000 | | | $ | 832.00 | | | $ | 7.48 | |
Hypothetical (5% return before expenses) | | $ | 1,000 | | | $ | 1,017.04 | | | $ | 8.24 | |
*Expenses are calculated using the most recent six-month annualized expense ratio for the Fund’s Class 3 shares (1.62%), which does not include any ongoing expenses of the Contract for which the Fund is an investment option, multiplied by the average account value over the period, multiplied by 184/365 to reflect the one-half year period.
TD-7
Franklin Templeton Variable Insurance Products Trust
Financial Highlights
Templeton Developing Markets Securities Fund
| | | | | | | | | | | | | | | | | | | | |
| | | Year Ended December 31, | |
| Class 1 | | 2011 | | | 2010 | | | 2009 | | | 2008 | | | 2007 | |
| | | | |
Per share operating performance | | | | | | | | | | | | | | | | | | | | |
(for a share outstanding throughout the year) | | | | | | | | | | | | | | | | | | | | |
Net asset value, beginning of year | | $ | 11.40 | | | $ | 9.86 | | | $ | 6.11 | | | $ | 16.16 | | | $ | 13.92 | |
| | | | |
Income from investment operationsa: | | | | | | | | | | | | | | | | | | | | |
Net investment incomeb | | | 0.17 | | | | 0.09 | | | | 0.12 | | | | 0.16 | | | | 0.32 | |
Net realized and unrealized gains (losses) | | | (1.94 | ) | | | 1.63 | | | | 4.02 | | | | (7.40 | ) | | | 3.51 | |
| | | | |
Total from investment operations | | | (1.77 | ) | | | 1.72 | | | | 4.14 | | | | (7.24 | ) | | | 3.83 | |
| | | | |
Less distributions from: | | | | | | | | | | | | | | | | | | | | |
Net investment income | | | (0.13 | ) | | | (0.18 | ) | | | (0.36 | ) | | | (0.37 | ) | | | (0.38 | ) |
Net realized gains | | | — | | | | — | | | | (0.03 | ) | | | (2.44 | ) | | | (1.21 | ) |
| | | | |
Total distributions | | | (0.13 | ) | | | (0.18 | ) | | | (0.39 | ) | | | (2.81 | ) | | | (1.59 | ) |
| | | | |
Redemption feesc | | | — | | | | — | | | | — | | | | — | | | | — | |
| | | | |
Net asset value, end of year | | $ | 9.50 | | | $ | 11.40 | | | $ | 9.86 | | | $ | 6.11 | | | $ | 16.16 | |
| | | | |
| | | | | |
Total returnd | | | (15.67)% | | | | 17.83% | | | | 73.32% | | | | (52.62)% | | | | 29.09% | |
Ratios to average net assets | | | | | | | | | | | | | | | | | | | | |
Expenses | | | 1.40% | | | | 1.49% | e | | | 1.45% | e | | | 1.52% | e | | | 1.48% | e |
Net investment income | | | 1.57% | | | | 0.87% | | | | 1.64% | | | | 1.52% | | | | 2.07% | |
| | | | | |
Supplemental data | | | | | | | | | | | | | | | | | | | | |
Net assets, end of year (000’s) | | $ | 232,544 | | | $ | 347,242 | | | $ | 325,927 | | | $ | 234,213 | | | $ | 753,843 | |
Portfolio turnover rate | | | 14.90% | | | | 24.41% | | | | 56.58% | f | | | 75.11% | f | | | 98.32% | |
aThe amount shown for a share outstanding throughout the period may not correlate with the Statement of Operations for the period due to the timing of sales and repurchases of the Fund shares in relation to income earned and/or fluctuating market value of the investments of the Fund.
bBased on average daily shares outstanding.
cAmount rounds to less than $0.01 per share.
dTotal return does not include fees, charges or expenses imposed by the variable annuity and life insurance contracts for which the Franklin Templeton Variable Insurance Products Trust serves as an underlying investment vehicle.
eBenefit of expense reduction rounds to less than 0.01%.
fExcludes the value of portfolio securities delivered as a result of redemptions in-kind.
The accompanying notes are an integral part of these financial statements.
TD-8
Franklin Templeton Variable Insurance Products Trust
Financial Highlights (continued)
Templeton Developing Markets Securities Fund
| | | | | | | | | | | | | | | | | | | | |
| | | Year Ended December 31, | |
| Class 2 | | 2011 | | | 2010 | | | 2009 | | | 2008 | | | 2007 | |
| | | | |
Per share operating performance | | | | | | | | | | | | | | | | | | | | |
(for a share outstanding throughout the year) | | | | | | | | | | | | | | | | | | | | |
Net asset value, beginning of year | | $ | 11.30 | | | $ | 9.78 | | | $ | 6.04 | | | $ | 15.99 | | | $ | 13.79 | |
| | | | |
Income from investment operationsa: | | | | | | | | | | | | | | | | | | | | |
Net investment incomeb | | | 0.14 | | | | 0.06 | | | | 0.11 | | | | 0.15 | | | | 0.27 | |
Net realized and unrealized gains (losses) | | | (1.92 | ) | | | 1.62 | | | | 3.98 | | | | (7.33 | ) | | | 3.49 | |
| | | | |
Total from investment operations | | | (1.78 | ) | | | 1.68 | | | | 4.09 | | | | (7.18 | ) | | | 3.76 | |
| | | | |
Less distributions from: | | | | | | | | | | | | | | | | | | | | |
Net investment income | | | (0.10 | ) | | | (0.16 | ) | | | (0.32 | ) | | | (0.33 | ) | | | (0.35 | ) |
Net realized gains | | | — | | | | — | | | | (0.03 | ) | | | (2.44 | ) | | | (1.21 | ) |
| | | | |
Total distributions | | | (0.10 | ) | | | (0.16 | ) | | | (0.35 | ) | | | (2.77 | ) | | | (1.56 | ) |
| | | | |
Redemption feesc | | | — | | | | — | | | | — | | | | — | | | | — | |
| | | | |
Net asset value, end of year | | $ | 9.42 | | | $ | 11.30 | | | $ | 9.78 | | | $ | 6.04 | | | $ | 15.99 | |
| | | | |
| | | | | |
Total returnd | | | (15.86)% | | | | 17.58% | | | | 72.59% | | | | (52.70)% | | | | 28.78% | |
Ratios to average net assets | | | | | | | | | | | | | | | | | | | | |
Expenses | | | 1.65% | | | | 1.74% | e | | | 1.70% | e | | | 1.77% | e | | | 1.73% | e |
Net investment income | | | 1.32% | | | | 0.62% | | | | 1.39% | | | | 1.27% | | | | 1.82% | |
| | | | | |
Supplemental data | | | | | | | | | | | | | | | | | | | | |
Net assets, end of year (000’s) | | $ | 295,223 | | | $ | 392,546 | | | $ | 435,947 | | | $ | 264,186 | | | $ | 1,090,549 | |
Portfolio turnover rate | | | 14.90% | | | | 24.41% | | | | 56.58% | f | | | 75.11% | f | | | 98.32% | |
aThe amount shown for a share outstanding throughout the period may not correlate with the Statement of Operations for the period due to the timing of sales and repurchases of the Fund shares in relation to income earned and/or fluctuating market value of the investments of the Fund.
bBased on average daily shares outstanding.
cAmount rounds to less than $0.01 per share.
dTotal return does not include fees, charges or expenses imposed by the variable annuity and life insurance contracts for which the Franklin Templeton Variable Insurance Products Trust serves as an underlying investment vehicle.
eBenefit of expense reduction rounds to less than 0.01%.
fExcludes the value of portfolio securities delivered as a result of redemptions in-kind.
The accompanying notes are an integral part of these financial statements.
TD-9
Franklin Templeton Variable Insurance Products Trust
Financial Highlights (continued)
Templeton Developing Markets Securities Fund
| | | | | | | | | | | | | | | | | | | | |
| | | Year Ended December 31, | |
| Class 3 | | 2011 | | | 2010 | | | 2009 | | | 2008 | | | 2007 | |
| | | | |
Per share operating performance | | | | | | | | | | | | | | | | | | | | |
(for a share outstanding throughout the year) | | | | | | | | | | | | | | | | | | | | |
Net asset value, beginning of year | | $ | 11.23 | | | $ | 9.73 | | | $ | 6.02 | | | $ | 15.96 | | | $ | 13.78 | |
| | | | |
Income from investment operationsa: | | | | | | | | | | | | | | | | | | | | |
Net investment incomeb | | | 0.14 | | | | 0.06 | | | | 0.10 | | | | 0.11 | | | | 0.24 | |
Net realized and unrealized gains (losses) | | | (1.91 | ) | | | 1.60 | | | | 3.97 | | | | (7.27 | ) | | | 3.52 | |
| | | | |
Total from investment operations | | | (1.77 | ) | | | 1.66 | | | | 4.07 | | | | (7.16 | ) | | | 3.76 | |
| | | | |
Less distributions from: | | | | | | | | | | | | | | | | | | | | |
Net investment income | | | (0.10 | ) | | | (0.16 | ) | | | (0.33 | ) | | | (0.34 | ) | | | (0.37 | ) |
Net realized gains | | | — | | | | — | | | | (0.03 | ) | | | (2.44 | ) | | | (1.21 | ) |
| | | | |
Total distributions | | | (0.10 | ) | | | (0.16 | ) | | | (0.36 | ) | | | (2.78 | ) | | | (1.58 | ) |
| | | | |
Redemption feesc | | | — | | | | — | | | | — | | | | — | | | | — | |
| | | | |
Net asset value, end of year | | $ | 9.36 | | | $ | 11.23 | | | $ | 9.73 | | | $ | 6.02 | | | $ | 15.96 | |
| | | | |
| | | | | |
Total returnd | | | (15.86)% | | | | 17.51% | | | | 72.63% | | | | (52.67)% | | | | 28.70% | |
Ratios to average net assets | | | | | | | | | | | | | | | | | | | | |
Expenses | | | 1.65% | | | | 1.74% | e | | | 1.70% | e | | | 1.77% | e | | | 1.73% | e |
Net investment income | | | 1.32% | | | | 0.62% | | | | 1.39% | | | | 1.27% | | | | 1.82% | |
| | | | | |
Supplemental data | | | | | | | | | | | | | | | | | | | | |
Net assets, end of year (000’s) | | $ | 44,702 | | | $ | 66,484 | | | $ | 66,718 | | | $ | 32,953 | | | $ | 100,961 | |
Portfolio turnover rate | | | 14.90% | | | | 24.41% | | | | 56.58% | f | | | 75.11% | f | | | 98.32% | |
aThe amount shown for a share outstanding throughout the period may not correlate with the Statement of Operations for the period due to the timing of sales and repurchases of the Fund shares in relation to income earned and/or fluctuating market value of the investments of the Fund.
bBased on average daily shares outstanding.
cAmount rounds to less than $0.01 per share.
dTotal return does not include fees, charges or expenses imposed by the variable annuity and life insurance contracts for which the Franklin Templeton Variable Insurance Products Trust serves as an underlying investment vehicle.
eBenefit of expense reduction rounds to less than 0.01%.
fExcludes the value of portfolio securities delivered as a result of redemptions in-kind.
The accompanying notes are an integral part of these financial statements.
TD-10
Franklin Templeton Variable Insurance Products Trust
Financial Highlights (continued)
Templeton Developing Markets Securities Fund
| | | | | | | | | | | | | | | | |
| | | Year Ended December 31, | |
| Class 4 | | 2011 | | | 2010 | | | 2009 | | | 2008a | |
| | | | |
Per share operating performance | | | | | | | | | | | | | | | | |
(for a share outstanding throughout the year) | | | | | | | | | | | | | | | | |
Net asset value, beginning of year | | $ | 11.30 | | | $ | 9.80 | | | $ | 6.09 | | | $ | 14.88 | |
| | | | |
Income from investment operationsb: | | | | | | | | | | | | | | | | |
Net investment income (loss)c | | | 0.13 | | | | 0.05 | | | | 0.09 | | | | (0.33 | ) |
Net realized and unrealized gains (losses) | | | (1.91 | ) | | | 1.61 | | | | 4.00 | | | | (5.65 | ) |
| | | | |
Total from investment operations | | | (1.78 | ) | | | 1.66 | | | | 4.09 | | | | (5.98 | ) |
| | | | |
Less distributions from: | | | | | | | | | | | | | | | | |
Net investment income | | | (0.10 | ) | | | (0.16 | ) | | | (0.35 | ) | | | (0.37 | ) |
Net realized gains | | | — | | | | — | | | | (0.03 | ) | | | (2.44 | ) |
| | | | |
Total distributions | | | (0.10 | ) | | | (0.16 | ) | | | (0.38 | ) | | | (2.81 | ) |
| | | | |
Redemption feesd | | | — | | | | — | | | | — | | | | — | |
| | | | |
Net asset value, end of year | | $ | 9.42 | | | $ | 11.30 | | | $ | 9.80 | | | $ | 6.09 | |
| | | | |
| | | | |
Total returne | | | (15.88)% | | | | 17.41% | | | | 72.45% | | | | (48.66)% | |
Ratios to average net assetsf | | | | | | | | | | | | | | | | |
Expenses | | | 1.75% | | | | 1.84% | g | | | 1.80% | g | | | 1.87% | g |
Net investment income | | | 1.22% | | | | 0.52% | | | | 1.29% | | | | 1.17% | |
| | | | |
Supplemental data | | | | | | | | | | | | | | | | |
Net assets, end of year (000’s) | | $ | 24,380 | | | $ | 37,198 | | | $ | 26,362 | | | $ | 7,208 | |
Portfolio turnover rate | | | 14.90% | | | | 24.41% | | | | 56.58% | h | | | 75.11% | h |
aFor the period February 29, 2008 (effective date) to December 31, 2008.
bThe amount shown for a share outstanding throughout the period may not correlate with the Statement of Operations for the period due to the timing of sales and repurchases of the Fund shares in relation to income earned and/or fluctuating market value of the investments of the Fund.
cBased on average daily shares outstanding.
dAmount rounds to less than $0.01 per share.
eTotal return does not include fees, charges or expenses imposed by the variable annuity and life insurance contracts for which the Franklin Templeton Variable Insurance Products Trust serves as an underlying investment vehicle. Total return is not annualized for periods less than one year.
fRatios are annualized for periods less than one year.
gBenefit of expense reduction rounds to less than 0.01%.
hExcludes the value of portfolio securities delivered as a result of redemptions in-kind.
The accompanying notes are an integral part of these financial statements.
TD-11
Franklin Templeton Variable Insurance Products Trust
Statement of Investments, December 31, 2011
| | | | | | | | | | |
| Templeton Developing Markets Securities Fund | | Industry | | Shares | | | Value | |
Common Stocks 85.4% | | | | | | | | | | |
Australia 1.5% | | | | | | | | | | |
BHP Billiton Ltd. | | Metals & Mining | | | 250,162 | | | $ | 8,809,050 | |
| | | | | | | | | | |
Brazil 13.9% | | | | | | | | | | |
Companhia de Bebidas das Americas (AmBev) | | Beverages | | | 1,362,350 | | | | 39,922,880 | |
Itau Unibanco Holding SA, ADR | | Commercial Banks | | | 1,053,474 | | | | 19,552,477 | |
Souza Cruz SA | | Tobacco | | | 1,888,597 | | | | 23,222,283 | |
| | | | | | | | | | |
| | | | | | | | | 82,697,640 | |
| | | | | | | | | | |
Chile 2.2% | | | | | | | | | | |
Antofagasta PLC | | Metals & Mining | | | 704,479 | | | | 13,322,274 | |
| | | | | | | | | | |
China 8.8% | | | | | | | | | | |
Anhui Conch Cement Co. Ltd., H | | Construction Materials | | | 1,725,000 | | | | 5,119,518 | |
CNOOC Ltd. | | Oil, Gas & Consumable Fuels | | | 7,181,000 | | | | 12,593,055 | |
aGreat Wall Motor Co. Ltd., H | | Automobiles | | | 2,460,677 | | | | 3,592,830 | |
Guangzhou Automobile Group Co. Ltd., H | | Automobiles | | | 916,396 | | | | 764,588 | |
PetroChina Co. Ltd., H | | Oil, Gas & Consumable Fuels | | | 13,880,000 | | | | 17,317,385 | |
Tencent Holdings Ltd. | | Internet Software & Services | | | 137,000 | | | | 2,751,783 | |
aUni-President China Holdings Ltd. | | Food Products | | | 927,675 | | | | 555,415 | |
Yantai Changyu Pioneer Wine Co. Ltd., B | | Beverages | | | 532,700 | | | | 5,830,029 | |
Yanzhou Coal Mining Co. Ltd., H | | Oil, Gas & Consumable Fuels | | | 1,948,000 | | | | 4,158,556 | |
| | | | | | | | | | |
| | | | | | | | | 52,683,159 | |
| | | | | | | | | | |
Hong Kong 3.9% | | | | | | | | | | |
Dairy Farm International Holdings Ltd. | | Food & Staples Retailing | | | 1,014,733 | | | | 9,467,459 | |
Giordano International Ltd. | | Specialty Retail | | | 474,000 | | | | 342,992 | |
I.T Ltd. | | Specialty Retail | | | 3,540,000 | | | | 1,950,815 | |
Luk Fook Holdings (International) Ltd. | | Specialty Retail | | | 999,000 | | | | 3,485,811 | |
SJM Holdings Ltd. | | Hotels, Restaurants & Leisure | | | 1,885,000 | | | | 3,058,095 | |
VTech Holdings Ltd. | | Communications Equipment | | | 506,300 | | | | 5,078,254 | |
| | | | | | | | | | |
| | | | | | | | | 23,383,426 | |
| | | | | | | | | | |
India 8.8% | | | | | | | | | | |
Grasim Industries Ltd. | | Construction Materials | | | 31,224 | | | | 1,477,449 | |
Infosys Ltd. | | IT Services | | | 169,190 | | | | 8,824,273 | |
National Aluminium Co. Ltd. | | Metals & Mining | | | 1,578,595 | | | | 1,508,174 | |
Oil & Natural Gas Corp. Ltd. | | Oil, Gas & Consumable Fuels | | | 1,826,624 | | | | 8,853,174 | |
Tata Chemicals Ltd. | | Chemicals | | | 701,855 | | | | 4,121,900 | |
Tata Consultancy Services Ltd. | | IT Services | | | 1,258,688 | | | | 27,570,526 | |
| | | | | | | | | | |
| | | | | | | | | 52,355,496 | |
| | | | | | | | | | |
Indonesia 11.1% | | | | | | | | | | |
PT Astra International Tbk | | Automobiles | | | 4,610,000 | | | | 37,622,277 | |
PT Bank Central Asia Tbk | | Commercial Banks | | | 19,763,532 | | | | 17,436,808 | |
PT Bank Rakyat Indonesia (Persero) Tbk | | Commercial Banks | | | 15,197,500 | | | | 11,313,276 | |
| | | | | | | | | | |
| | | | | | | | | 66,372,361 | |
| | | | | | | | | | |
Malaysia 0.1% | | | | | | | | | | |
Genting Bhd. | | Hotels, Restaurants & Leisure | | | 179,000 | | | | 621,136 | |
| | | | | | | | | | |
Mexico 1.5% | | | | | | | | | | |
America Movil SAB de CV, L, ADR | | Wireless Telecommunication Services | | | 246,434 | | | | 5,569,409 | |
Kimberly Clark de Mexico SAB de CV, A | | Household Products | | | 650,871 | | | | 3,540,105 | |
| | | | | | | | | | |
| | | | | | | | | 9,109,514 | |
| | | | | | | | | | |
TD-12
Franklin Templeton Variable Insurance Products Trust
Statement of Investments, December 31, 2011 (continued)
| | | | | | | | | | |
| Templeton Developing Markets Securities Fund | | Industry | | Shares | | | Value | |
Common Stocks (continued) | | | | | | | | | | |
Nigeria 0.2% | | | | | | | | | | |
Nigerian Breweries PLC | | Beverages | | | 1,629,905 | | | $ | 948,117 | |
| | | | | | | | | | |
Pakistan 0.0%† | | | | | | | | | | |
MCB Bank Ltd. | | Commercial Banks | | | 126,042 | | | | 187,913 | |
| | | | | | | | | | |
Qatar 0.1% | | | | | | | | | | |
Industries Qatar | | Industrial Conglomerates | | | 20,901 | | | | 763,397 | |
| | | | | | | | | | |
Russia 14.8% | | | | | | | | | | |
Gazprom, ADR | | Oil, Gas & Consumable Fuels | | | 1,193,200 | | | | 12,744,569 | |
Gazprom, ADR (London Stock Exchange) | | Oil, Gas & Consumable Fuels | | | 470,200 | | | | 5,014,683 | |
bLUKOIL Holdings, ADR | | Oil, Gas & Consumable Fuels | | | 75,208 | | | | 4,001,066 | |
bLUKOIL Holdings, ADR (London Stock Exchange) | | Oil, Gas & Consumable Fuels | | | 317,168 | | | | 16,786,117 | |
Mining and Metallurgical Co. Norilsk Nickel, ADR | | Metals & Mining | | | 636,443 | | | | 9,756,671 | |
Sberbank RF | | Commercial Banks | | | 6,061,420 | | | | 14,842,988 | |
TNK-BP | | Oil, Gas & Consumable Fuels | | | 5,340,274 | | | | 13,760,276 | |
cUralkali OJSC, GDR, Reg S | | Chemicals | | | 311,996 | | | | 11,227,176 | |
| | | | | | | | | | |
| | | | | | | | | 88,133,546 | |
| | | | | | | | | | |
Singapore 2.3% | | | | | | | | | | |
Keppel Corp. Ltd. | | Industrial Conglomerates | | | 1,006,557 | | | | 7,216,853 | |
SembCorp Marine Ltd. | | Machinery | | | 2,165,000 | | | | 6,375,993 | |
| | | | | | | | | | |
| | | | | | | | | 13,592,846 | |
| | | | | | | | | | |
South Africa 2.3% | | | | | | | | | | |
Exxaro Resources Ltd. | | Metals & Mining | | | 94,600 | | | | 1,965,787 | |
Remgro Ltd. | | Diversified Financial Services | | | 504,061 | | | | 7,395,663 | |
Tiger Brands Ltd. | | Food Products | | | 130,520 | | | | 4,050,226 | |
| | | | | | | | | | |
| | | | | | | | | 13,411,676 | |
| | | | | | | | | | |
South Korea 0.9% | | | | | | | | | | |
SK Innovation Co. Ltd. | | Oil, Gas & Consumable Fuels | | | 43,125 | | | | 5,282,510 | |
| | | | | | | | | | |
Taiwan 3.3% | | | | | | | | | | |
President Chain Store Corp. | | Food & Staples Retailing | | | 3,628,075 | | | | 19,766,629 | |
| | | | | | | | | | |
Thailand 5.7% | | | | | | | | | | |
Kasikornbank PCL, fgn. | | Commercial Banks | | | 3,116,500 | | | | 12,292,230 | |
PTT Exploration and Production PCL, fgn. | | Oil, Gas & Consumable Fuels | | | 2,021,223 | | | | 10,789,675 | |
PTT PCL, fgn. | | Oil, Gas & Consumable Fuels | | | 938,100 | | | | 9,450,841 | |
Supalai PCL, fgn. | | Real Estate Management & Development | | | 3,888,100 | | | | 1,761,439 | |
| | | | | | | | | | |
| | | | | | | | | 34,294,185 | |
| | | | | | | | | | |
Turkey 1.5% | | | | | | | | | | |
Tupras-Turkiye Petrol Rafinerileri AS | | Oil, Gas & Consumable Fuels | | | 423,426 | | | | 8,985,167 | |
| | | | | | | | | | |
United Arab Emirates 1.1% | | | | | | | | | | |
Emaar Properties PJSC | | Real Estate Management & Development | | | 8,942,377 | | | | 6,256,730 | |
| | | | | | | | | | |
United Kingdom 1.4% | | | | | | | | | | |
Anglo American PLC | | Metals & Mining | | | 230,149 | | | | 8,426,299 | |
| | | | | | | | | | |
Total Common Stocks (Cost $346,162,340) | | | | | | | | | 509,403,071 | |
| | | | | | | | | | |
TD-13
Franklin Templeton Variable Insurance Products Trust
Statement of Investments, December 31, 2011 (continued)
| | | | | | | | | | |
| Templeton Developing Markets Securities Fund | | Industry | | Shares | | | Value | |
Preferred Stocks 7.9% | | | | | | | | | | |
Brazil 6.8% | | | | | | | | | | |
Banco Bradesco SA, ADR, pfd. | | Commercial Banks | | | 418,531 | | | $ | 6,981,097 | |
Itausa - Investimentos Itau SA, pfd. | | Commercial Banks | | | 642,096 | | | | 3,887,314 | |
Vale SA, ADR, pfd., A | | Metals & Mining | | | 1,440,625 | | | | 29,676,875 | |
| | | | | | | | | | |
| | | | | | | | | 40,545,286 | |
| | | | | | | | | | |
Chile 1.1% | | | | | | | | | | |
Embotelladora Andina SA, pfd., A | | Beverages | | | 1,918,947 | | | | 6,833,593 | |
| | | | | | | | | | |
Total Preferred Stocks (Cost $23,121,348) | | | | | | | | | 47,378,879 | |
| | | | | | | | | | |
Total Investments before Short Term Investments
(Cost $369,283,688) | | | | | | | | | 556,781,950 | |
| | | | | | | | | | |
Short Term Investments 7.1% | | | | | | | | | | |
Money Market Funds (Cost $40,518,516) 6.8% | | | | | | | | | | |
United States 6.8% | | | | | | | | | | |
d,eInstitutional Fiduciary Trust Money Market Portfolio | | | | | 40,518,516 | | | | 40,518,516 | |
| | | | | | | | | | |
fInvestments from Cash Collateral Received for Loaned Securities
(Cost $2,122,374) 0.3% | | | | | | | | | | |
Money Market Funds 0.3% | | | | | | | | | | |
United States 0.3% | | | | | | | | | | |
gBNY Mellon Overnight Government Fund, 0.039% | | | | | 2,122,374 | | | | 2,122,374 | |
| | | | | | | | | | |
Total Investments (Cost $411,924,578) 100.4% | | | | | | | | | 599,422,840 | |
Other Assets, less Liabilities (0.4)% | | | | | | | | | (2,573,365 | ) |
| | | | | | | | | | |
Net Assets 100.0% | | | | | | | | $ | 596,849,475 | |
| | | | | | | | | | |
See Abbreviations on page TD-26.
†Rounds to less than 0.1% of net assets.
aA portion or all of the security is on loan at December 31, 2011. See Note 1(c).
bAt December 31, 2011, pursuant to the Fund’s policies and the requirements of applicable securities law, the Fund may be restricted from trading these securities for a limited or extended period of time due to ownership limits and/or potential possession of material non-public information.
cSecurity was purchased pursuant to Regulation S under the Securities Act of 1933, which exempts from registration securities offered and sold outside of the United States. Such a security cannot be sold in the United States without either an effective registration statement filed pursuant to the Securities Act of 1933, or pursuant to an exemption from registration. This security has been deemed liquid under guidelines approved by the Trust’s Board of Trustees. At December 31, 2011, the value of this security was $11,227,176, representing 1.88% of net assets.
dNon-income producing.
eSee Note 7 regarding investments in the Institutional Fiduciary Trust Money Market Portfolio.
fSee Note 1(c) regarding securities on loan.
gThe rate shown is the annualized seven-day yield at period end.
The accompanying notes are an integral part of these financial statements.
TD-14
Franklin Templeton Variable Insurance Products Trust
Financial Statements
Statement of Assets and Liabilities
December 31, 2011
| | | | |
| | | Templeton
Developing Markets
Securities Fund | |
Assets: | | | | |
Investments in securities: | | | | |
Cost - Unaffiliated issuers | | $ | 371,406,062 | |
Cost - Sweep Money Fund (Note 7) | | | 40,518,516 | |
| | | | |
Total cost of investments | | $ | 411,924,578 | |
| | | | |
Value - Unaffiliated issuers | | $ | 558,904,324 | |
Value - Sweep Money Fund (Note 7) | | | 40,518,516 | |
| | | | |
Total value of investments (includes securities loaned in the amount of $1,993,705) | | | 599,422,840 | |
Foreign currency, at value and cost | | | 27,953 | |
Receivables: | | | | |
Investment securities sold | | | 298,006 | |
Capital shares sold | | | 1,044,669 | |
Dividends | | | 567,788 | |
Foreign tax | | | 51,726 | |
Other assets | | | 23 | |
| | | | |
Total assets | | | 601,413,005 | |
| | | | |
Liabilities: | | | | |
Payables: | | | | |
Investment securities purchased | | | 238,923 | |
Capital shares redeemed | | | 969,695 | |
Affiliates | | | 794,283 | |
Reports to shareholders | | | 297,351 | |
Payable upon return of securities loaned | | | 2,122,374 | |
Accrued expenses and other liabilities | | | 140,904 | |
| | | | |
Total liabilities | | | 4,563,530 | |
| | | | |
Net assets, at value | | $ | 596,849,475 | |
| | | | |
Net assets consist of: | | | | |
Paid-in capital | | $ | 538,777,200 | |
Undistributed net investment income | | | 2,273,752 | |
Net unrealized appreciation (depreciation) | | | 187,475,625 | |
Accumulated net realized gain (loss) | | | (131,677,102 | ) |
| | | | |
Net assets, at value | | $ | 596,849,475 | |
| | | | |
The accompanying notes are an integral part of these financial statements.
TD-15
Franklin Templeton Variable Insurance Products Trust
Financial Statements (continued)
Statement of Assets and Liabilities (continued)
December 31, 2011
| | | | |
| | | Templeton
Developing Markets
Securities Fund | |
Class 1: | | | | |
Net assets, at value | | $ | 232,543,859 | |
| | | | |
Shares outstanding | | | 24,477,057 | |
| | | | |
Net asset value and maximum offering price per share | | $ | 9.50 | |
| | | | |
Class 2: | | | | |
Net assets, at value | | $ | 295,223,498 | |
| | | | |
Shares outstanding | | | 31,333,936 | |
| | | | |
Net asset value and maximum offering price per share | | $ | 9.42 | |
| | | | |
Class 3: | | | | |
Net assets, at value | | $ | 44,702,020 | |
| | | | |
Shares outstanding | | | 4,773,813 | |
| | | | |
Net asset value and maximum offering price per sharea | | $ | 9.36 | |
| | | | |
Class 4: | | | | |
Net assets, at value | | $ | 24,380,098 | |
| | | | |
Shares outstanding | | | 2,588,782 | |
| | | | |
Net asset value and maximum offering price per share | | $ | 9.42 | |
| | | | |
aRedemption price is equal to net asset value less redemption fees retained by the Fund.
The accompanying notes are an integral part of these financial statements.
TD-16
Franklin Templeton Variable Insurance Products Trust
Financial Statements (continued)
Statement of Operations
for the year ended December 31, 2011
| | | | |
| | | Templeton
Developing Markets
Securities Fund | |
Investment income: | | | | |
Dividends (net of foreign taxes of $2,230,499) | | $ | 21,338,029 | |
Interest | | | 22,148 | |
Income from securities loaned | | | 88,114 | |
| | | | |
Total investment income | | | 21,448,291 | |
| | | | |
Expenses: | | | | |
Management fees (Note 3a) | | | 8,287,243 | |
Administrative fees (Note 3b) | | | 985,804 | |
Distribution fees: (Note 3c) | | | | |
Class 2 | | | 855,545 | |
Class 3 | | | 140,593 | |
Class 4 | | | 112,586 | |
Unaffiliated transfer agent fees | | | 2,549 | |
Custodian fees (Note 4) | | | 481,218 | |
Reports to shareholders | | | 260,457 | |
Professional fees | | | 74,918 | |
Trustees’ fees and expenses | | | 2,872 | |
Other | | | 27,374 | |
| | | | |
Total expenses | | | 11,231,159 | |
| | | | |
Net investment income | | | 10,217,132 | |
| | | | |
Realized and unrealized gains (losses): | | | | |
Net realized gain (loss) from: | | | | |
Investments | | | 41,497,378 | |
Foreign currency transactions | | | (405,209 | ) |
| | | | |
Net realized gain (loss) | | | 41,092,169 | |
| | | | |
Net change in unrealized appreciation (depreciation) on: | | | | |
Investments | | | (168,785,410 | ) |
Translation of other assets and liabilities denominated in foreign currencies | | | (3,998 | ) |
Change in deferred taxes on unrealized appreciation | | | 53,321 | |
| | | | |
Net change in unrealized appreciation (depreciation) | | | (168,736,087 | ) |
| | | | |
Net realized and unrealized gain (loss) | | | (127,643,918 | ) |
| | | | |
Net increase (decrease) in net assets resulting from operations | | $ | (117,426,786 | ) |
| | | | |
The accompanying notes are an integral part of these financial statements.
TD-17
Franklin Templeton Variable Insurance Products Trust
Financial Statements (continued)
Statements of Changes in Net Assets
| | | | | | | | |
| | | Templeton Developing Markets
Securities Fund | |
| | | Year Ended December 31, | |
| | | 2011 | | | 2010 | |
| | | | |
Increase (decrease) in net assets: | | | | | | | | |
Operations: | | | | | | | | |
Net investment income | | $ | 10,217,132 | | | $ | 5,592,076 | |
Net realized gain (loss) from investments and foreign currency transactions | | | 41,092,169 | | | | 49,761,078 | |
Net change in unrealized appreciation (depreciation) on investments, translation of other assets and liabilities denominated in foreign currencies and deferred taxes | | | (168,736,087 | ) | | | 68,457,067 | |
| | | | |
Net increase (decrease) in net assets resulting from operations | | | (117,426,786 | ) | | | 123,810,221 | |
| | | | |
Distributions to shareholders from: | | | | | | | | |
Net investment income: | | | | | | | | |
Class 1 | | | (3,575,470 | ) | | | (5,483,924 | ) |
Class 2 | | | (3,331,863 | ) | | | (5,656,521 | ) |
Class 3 | | | (556,039 | ) | | | (947,886 | ) |
Class 4 | | | (314,405 | ) | | | (471,295 | ) |
| | | | |
Total distributions to shareholders | | | (7,777,777 | ) | | | (12,559,626 | ) |
| | | | |
Capital share transactions: (Note 2) | | | | | | | | |
Class 1 | | | (64,505,854 | ) | | | (22,233,537 | ) |
Class 2 | | | (37,899,841 | ) | | | (97,764,544 | ) |
Class 3 | | | (11,807,405 | ) | | | (9,001,736 | ) |
Class 4 | | | (7,237,721 | ) | | | 6,238,252 | |
| | | | |
Total capital share transactions | | | (121,450,821 | ) | | | (122,761,565 | ) |
| | | | |
Redemption fees | | | 34,912 | | | | 26,367 | |
| | | | |
Net increase (decrease) in net assets | | | (246,620,472 | ) | | | (11,484,603 | ) |
Net assets: | | | | | | | | |
Beginning of year | | | 843,469,947 | | | | 854,954,550 | |
| | | | |
End of year | | $ | 596,849,475 | | | $ | 843,469,947 | |
| | | | |
Undistributed net investment income included in net assets: | | | | | | | | |
End of year | | $ | 2,273,752 | | | $ | 163,727 | |
| | | | |
The accompanying notes are an integral part of these financial statements.
TD-18
Franklin Templeton Variable Insurance Products Trust
Notes to Financial Statements
Templeton Developing Markets Securities Fund
1. ORGANIZATION AND SIGNIFICANT ACCOUNTING POLICIES
Franklin Templeton Variable Insurance Products Trust (Trust) is registered under the Investment Company Act of 1940, as amended, (1940 Act) as an open-end investment company, consisting of twenty separate funds. The Templeton Developing Markets Securities Fund (Fund) is included in this report. The financial statements of the remaining funds in the Trust are presented separately. Shares of the Fund are generally sold only to insurance company separate accounts to fund the benefits of variable life insurance policies or variable annuity contracts. The Fund offers four classes of shares: Class 1, Class 2, Class 3, and Class 4. Each class of shares differs by its distribution fees, voting rights on matters affecting a single class and its exchange privilege.
The following summarizes the Fund’s significant accounting policies.
a. Financial Instrument Valuation
The Fund’s investments in securities and other financial instruments are carried at fair value daily. Fair value is the price that would be received to sell an asset or paid to transfer a liability in an orderly transaction between market participants on the measurement date. Under procedures approved by the Trust’s Board of Trustees, the Fund may utilize independent pricing services, quotations from securities and financial instrument dealers, and other market sources to determine fair value.
Equity securities listed on an exchange or on the NASDAQ National Market System are valued at the last quoted sale price or the official closing price of the day, respectively. Foreign equity securities are valued as of the close of trading on the foreign stock exchange on which the security is primarily traded, or the NYSE, whichever is earlier. The value is then converted into its U.S. dollar equivalent at the foreign exchange rate in effect at the close of the NYSE on the day that the value of the security is determined. Over-the-counter securities are valued within the range of the most recent quoted bid and ask prices. Securities that trade in multiple markets or on multiple exchanges are valued according to the broadest and most representative market. Certain equity securities are valued based upon fundamental characteristics or relationships to similar securities. Investments in open-end mutual funds and non-registered money market funds are valued at the closing net asset value.
The Fund has procedures to determine the fair value of securities and other financial instruments for which market prices are not readily available or which may not be reliably priced. Under these procedures, the Fund primarily employs a market-based approach which may use related or comparable assets or liabilities, recent transactions, market multiples, book values, and other relevant information for the investment to determine the fair value of the investment. The Fund may also use an income-based valuation approach in which the anticipated future cash flows of the investment are discounted to calculate fair value. Discounts may also be applied due to the nature or duration of any restrictions on the disposition of the investments. Due to the inherent uncertainty of valuations of such investments, the fair values may differ significantly from the values that would have been used had an active market existed.
Trading in securities on foreign securities stock exchanges and over-the-counter markets may be completed before the daily close of business on the NYSE. Occasionally, events occur between the time at which trading in a foreign security is completed and the close of the NYSE that might call into question the reliability of the value of a portfolio security held by the Fund. As a result, differences may arise between the value of the Fund’s portfolio securities as determined at the foreign market close and the latest indications of value at the close of the NYSE. In order to minimize the potential for these differences, the investment manager monitors price movements following the close of trading in foreign stock markets through a series of country specific market proxies (such as baskets of American Depositary Receipts, futures contracts and exchange traded funds). These price movements are measured against established trigger thresholds for each specific market proxy to assist in determining if an event has occurred that may call into question the reliability of the values of the foreign securities held by the Fund. If such an event occurs, the securities may be valued using fair value procedures, which may include the use of independent pricing services.
TD-19
Franklin Templeton Variable Insurance Products Trust
Notes to Financial Statements (continued)
Templeton Developing Markets Securities Fund
1. ORGANIZATION AND SIGNIFICANT ACCOUNTING POLICIES (continued)
b. Foreign Currency Translation
Portfolio securities and other assets and liabilities denominated in foreign currencies are translated into U.S. dollars based on the exchange rate of such currencies against U.S. dollars on the date of valuation. The Fund may enter into foreign currency exchange contracts to facilitate transactions denominated in a foreign currency. Purchases and sales of securities, income and expense items denominated in foreign currencies are translated into U.S. dollars at the exchange rate in effect on the transaction date. Portfolio securities and assets and liabilities denominated in foreign currencies contain risks that those currencies will decline in value relative to the U.S. dollar. Occasionally, events may impact the availability or reliability of foreign exchange rates used to convert the U.S. dollar equivalent value. If such an event occurs, the foreign exchange rate will be valued at fair value using procedures established and approved by the Trust’s Board of Trustees.
The Fund does not separately report the effect of changes in foreign exchange rates from changes in market prices on securities held. Such changes are included in net realized and unrealized gain or loss from investments on the Statement of Operations.
Realized foreign exchange gains or losses arise from sales of foreign currencies, currency gains or losses realized between the trade and settlement dates on securities transactions and the difference between the recorded amounts of dividends, interest, and foreign withholding taxes and the U.S. dollar equivalent of the amounts actually received or paid. Net unrealized foreign exchange gains and losses arise from changes in foreign exchange rates on foreign denominated assets and liabilities other than investments in securities held at the end of the reporting period.
c. Securities Lending
The Fund participates in an agency based security lending program. The fund receives cash collateral against the loaned securities in an amount equal to at least 102% of the market value of the loaned securities. Collateral is maintained over the life of the loan in an amount not less than 100% of the market value of loaned securities, as determined at the close of fund business each day; any additional collateral required due to changes in security values is delivered to the fund on the next business day. The collateral is invested in a non-registered money fund by the fund’s custodian on the fund’s behalf. The fund receives income from the investment of cash collateral, in addition to lending fees and rebates paid by the borrower. The fund bears the market risk with respect to the collateral investment, securities loaned, and the risk that the agent may default on its obligations to the fund. The securities lending agent has agreed to indemnify the fund in the event of default by a third party borrower.
d. Income and Deferred Taxes
It is the Fund’s policy to qualify as a regulated investment company under the Internal Revenue Code. The Fund intends to distribute to shareholders substantially all of its taxable income and net realized gains to relieve it from federal income and excise taxes. As a result, no provision for U.S. federal income taxes is required.
The Fund may be subject to foreign taxation related to income received, capital gains on the sale of securities and certain foreign currency transactions in the foreign jurisdictions in which it invests. Foreign taxes, if any, are recorded based on the tax regulations and rates that exist in the foreign markets in which the Fund invests. When a capital gain tax is determined to apply the Fund records an estimated deferred tax liability in an amount that would be payable if the securities were disposed of on the valuation date.
The Fund recognizes the tax benefits of uncertain tax positions only when the position is “more likely than not” to be sustained upon examination by the tax authorities based on the technical merits of the tax position. As of December 31, 2011, and for all open tax years, the Fund has determined that no liability for unrecognized tax benefits is required in the Fund’s financial statements related to uncertain tax positions taken on a tax return (or expected to be taken on future tax returns). Open tax years are those that remain subject to examination and are based on each tax jurisdiction statute of limitation.
TD-20
Franklin Templeton Variable Insurance Products Trust
Notes to Financial Statements (continued)
Templeton Developing Markets Securities Fund
1. ORGANIZATION AND SIGNIFICANT ACCOUNTING POLICIES (continued)
e. Security Transactions, Investment Income, Expenses and Distributions
Security transactions are accounted for on trade date. Realized gains and losses on security transactions are determined on a specific identification basis. Dividend income is recorded on the ex-dividend date except that certain dividends from foreign securities are recognized as soon as the Fund is notified of the ex-dividend date. Distributions to shareholders are recorded on the ex-dividend date and are determined according to income tax regulations (tax basis). Distributable earnings determined on a tax basis may differ from earnings recorded in accordance with accounting principles generally accepted in the United States of America. These differences may be permanent or temporary. Permanent differences are reclassified among capital accounts to reflect their tax character. These reclassifications have no impact on net assets or the results of operations. Temporary differences are not reclassified, as they may reverse in subsequent periods.
Common expenses incurred by the Trust are allocated among the funds based on the ratio of net assets of each fund to the combined net assets of the Trust. Fund specific expenses are charged directly to the fund that incurred the expense.
Realized and unrealized gains and losses and net investment income, not including class specific expenses, are allocated daily to each class of shares based upon the relative proportion of net assets of each class. Differences in per share distributions, by class, are generally due to differences in class specific expenses.
f. Accounting Estimates
The preparation of financial statements in accordance with accounting principles generally accepted in the United States of America requires management to make estimates and assumptions that affect the reported amounts of assets and liabilities at the date of the financial statements and the amounts of income and expenses during the reporting period. Actual results could differ from those estimates.
g. Redemption Fees
Redemptions and exchanges of interests in an insurance company subaccount that invests in Class 3 shares of the Fund will be subject to a 1.0% short term trading fee if the interest in the subaccount has been held for less than 60 days. Such fees are retained by the Fund and accounted for as an addition to paid-in capital, allocated to each class of shares based upon the relative proportion of net assets of each class.
h. Guarantees and Indemnifications
Under the Trust’s organizational documents, its officers and trustees are indemnified by the Trust against certain liabilities arising out of the performance of their duties to the Trust. Additionally, in the normal course of business, the Trust, on behalf of the Fund, enters into contracts with service providers that contain general indemnification clauses. The Trust’s maximum exposure under these arrangements is unknown as this would involve future claims that may be made against the Trust that have not yet occurred. Currently, the Trust expects the risk of loss to be remote.
TD-21
Franklin Templeton Variable Insurance Products Trust
Notes to Financial Statements (continued)
Templeton Developing Markets Securities Fund
2. SHARES OF BENEFICIAL INTEREST
At December 31, 2011, there were an unlimited number of shares authorized (without par value). Transactions in the Fund’s shares were as follows:
| | | | | | | | | | | | | | | | |
| | | Year Ended December 31, | |
| | | 2011 | | | 2010 | |
| Class 1 Shares: | | Shares | | | Amount | | | Shares | | | Amount | |
Shares sold | | | 2,813,987 | | | $ | 30,009,154 | | | | 4,235,745 | | | $ | 44,045,245 | |
Shares issued in reinvestment of distributions | | | 324,453 | | | | 3,575,470 | | | | 603,956 | | | | 5,483,924 | |
Shares redeemed | | | (9,124,103 | ) | | | (98,090,478 | ) | | | (7,418,014 | ) | | | (71,762,706 | ) |
| | | | |
Net increase (decrease) | | | (5,985,663 | ) | | $ | (64,505,854 | ) | | | (2,578,313 | ) | | $ | (22,233,537 | ) |
| | | | |
Class 2 Shares: | | | | | | | | | | | | | | | | |
Shares sold | | | 6,746,331 | | | $ | 70,699,788 | | | | 9,770,557 | | | $ | 97,538,996 | |
Shares issued in reinvestment of distributions | | | 304,558 | | | | 3,331,863 | | | | 627,805 | | | | 5,656,521 | |
Shares redeemed | | | (10,448,699 | ) | | | (111,931,492 | ) | | | (20,231,375 | ) | | | (200,960,061 | ) |
| | | | |
Net increase (decrease) | | | (3,397,810 | ) | | $ | (37,899,841 | ) | | | (9,833,013 | ) | | $ | (97,764,544 | ) |
| | | | |
Class 3 Shares: | | | | | | | | | | | | | | | | |
Shares sold | | | 848,211 | | | $ | 9,362,399 | | | | 1,343,547 | | | $ | 13,467,640 | |
Shares issued in reinvestment of distributions | | | 51,154 | | | | 556,039 | | | | 105,791 | | | | 947,886 | |
Shares redeemed | | | (2,043,372 | ) | | | (21,725,843 | ) | | | (2,390,224 | ) | | | (23,417,262 | ) |
| | | | |
Net increase (decrease) | | | (1,144,007 | ) | | $ | (11,807,405 | ) | | | (940,886 | ) | | $ | (9,001,736 | ) |
| | | | |
Class 4 Shares: | | | | | | | | | | | | | | | | |
Shares sold | | | 464,313 | | | $ | 5,040,717 | | | | 1,189,893 | | | $ | 11,893,157 | |
Shares issued on reinvestment of distributions | | | 28,739 | | | | 314,405 | | | | 52,250 | | | | 471,295 | |
Shares redeemed | | | (1,194,944 | ) | | | (12,592,843 | ) | | | (641,932 | ) | | | (6,126,200 | ) |
| | | | |
Net increase (decrease) | | | (701,892 | ) | | $ | (7,237,721 | ) | | | 600,211 | | | $ | 6,238,252 | |
| | | | |
3. TRANSACTIONS WITH AFFILIATES
Franklin Resources, Inc. is the holding company for various subsidiaries that together are referred to as Franklin Templeton Investments. Certain officers and trustees of the Fund are also officers and/or directors of the following subsidiaries:
| | |
| Subsidiary | | Affiliation |
Templeton Asset Management Ltd. (TAML) | | Investment manager |
Franklin Templeton Services, LLC (FT Services) | | Administrative manager |
Franklin Templeton Distributors, Inc. (Distributors) | | Principal underwriter |
Franklin Templeton Investor Services, LLC (Investor Services) | | Transfer agent |
TD-22
Franklin Templeton Variable Insurance Products Trust
Notes to Financial Statements (continued)
Templeton Developing Markets Securities Fund
3. TRANSACTIONS WITH AFFILIATES (continued)
a. Management Fees
Effective May 1, 2011, the Fund pays an investment management fee to TAML based on the average daily net assets of the Fund as follows:
| | |
| Annualized Fee Rate | | Net Assets |
| 1.100% | | Up to and including $1 billion |
| 1.050% | | Over $1 billion, up to and including $5 billion |
| 1.000% | | Over $5 billion, up to and including $10 billion |
| 0.950% | | Over $10 billion, up to and including $15 billion |
| 0.900% | | Over $15 billion, up to and including $20 billion |
| 0.850% | | In excess of $20 billion |
Prior to May 1, 2011, the Fund paid an investment management fee to TAML based on the average daily net assets of the Fund as follows:
| | |
| Annualized Fee Rate | | Net Assets |
| 1.250% | | Up to and including $500 million |
| 1.200% | | Over $500 million, up to and including $3 billion |
| 1.150% | | Over $3 billion, up to and including $4 billion |
| 1.100% | | Over $4 billion, up to and including $15 billion |
| 1.050% | | Over $15 billion, up to and including $20 billion |
| 1.000% | | In excess of $20 billion |
b. Administrative Fees
The Fund pays an administrative fee to FT Services based on the Fund’s average daily net assets as follows:
| | |
| Fee Rate | | Net Assets |
| 0.150% | | Up to and including $200 million |
| 0.135% | | Over $200 million, up to and including $700 million |
| 0.100% | | Over $700 million, up to and including $1.2 billion |
| 0.075% | | In excess of $1.2 billion |
c. Distribution Fees
The Fund’s Board of Trustees has adopted distribution plans for Class 2, Class 3, and Class 4 shares pursuant to Rule 12b-1 under the 1940 Act. Under the Fund’s compensation distribution plans, the Fund pays Distributors for costs incurred in connection with the servicing, sale and distribution of the Fund’s shares up to 0.25%, 0.35%, and 0.35% per year of its average daily net assets of Class 2, Class 3, and Class 4, respectively. The Board of Trustees has agreed to limit the current rate to 0.25% per year for Class 3.
d. Transfer Agent Fees
Investor Services, under terms of an agreement, performs shareholder servicing for the Fund and is not paid by the Fund for the services.
TD-23
Franklin Templeton Variable Insurance Products Trust
Notes to Financial Statements (continued)
Templeton Developing Markets Securities Fund
4. EXPENSE OFFSET ARRANGEMENT
The Fund has entered into an arrangement with its custodian whereby credits realized as a result of uninvested cash balances are used to reduce a portion of the Fund’s custodian expenses. During the year ended December 31, 2011, there were no credits earned.
5. INCOME TAXES
For tax purposes, capital losses may be carried over to offset future capital gains, if any. Under the Regulated Investment Company Modernization Act of 2010, capital losses incurred by the Fund in taxable years beginning after December 22, 2010 are not subject to expiration and such losses retain their character as either short-term or long-term, rather than being considered short-term as under previous law. Post-enactment capital losses must be fully utilized prior to utilizing any losses incurred in pre-enactment tax years.
At December 31, 2011, the Fund had capital loss carryforwards of $125,392,863 expiring in 2017. During the year ended December 31, 2011, the Fund utilized $41,015,504 of capital loss carryforwards.
The tax character of distributions paid during the years ended December 31, 2011 and 2010, was as follows:
| | | | | | | | |
| | | 2011 | | | 2010 | |
Distributions paid from ordinary income | | $ | 7,777,777 | | | $ | 12,559,626 | |
| | | | |
At December 31, 2011, the cost of investments, net unrealized appreciation (depreciation), and undistributed ordinary income for income tax purposes were as follows:
| | | | |
Cost of investments | | $ | 424,579,565 | |
| | | | |
| |
Unrealized appreciation | | $ | 194,161,792 | |
Unrealized depreciation | | $ | (19,318,517 | ) |
| | | | |
Net unrealized appreciation (depreciation) | | $ | 174,843,275 | |
| | | | |
Distributable earnings - undistributed ordinary income | | $ | 8,644,499 | |
| | | | |
Differences between income and/or capital gains as determined on a book basis and a tax basis are primarily due to differing treatments of foreign currency transactions, passive foreign investment company shares, corporate actions, foreign capital gains tax, and wash sales.
6. INVESTMENT TRANSACTIONS
Purchases and sales of investments (excluding short term securities) for the year ended December 31, 2011, aggregated $107,148,613 and $255,595,141, respectively.
7. INVESTMENTS IN INSTITUTIONAL FIDUCIARY TRUST MONEY MARKET PORTFOLIO
The Fund invests in the Institutional Fiduciary Trust Money Market Portfolio (Sweep Money Fund), an open-end investment company managed by Franklin Advisers, Inc. (an affiliate of the investment manager). Management fees paid by the Fund are reduced on assets invested in the Sweep Money Fund, in an amount not to exceed the management and administrative fees paid by the Sweep Money Fund.
TD-24
Franklin Templeton Variable Insurance Products Trust
Notes to Financial Statements (continued)
Templeton Developing Markets Securities Fund
8. CONCENTRATION OF RISK
Investing in foreign securities may include certain risks and considerations not typically associated with investing in U.S. securities, such as fluctuating currency values and changing local and regional economic, political and social conditions, which may result in greater market volatility. In addition, certain foreign securities may not be as liquid as U.S. securities.
9. CREDIT FACILITY
The Fund, together with other U.S. registered and foreign investment funds (collectively, Borrowers), managed by Franklin Templeton Investments, are borrowers in a joint syndicated senior unsecured credit facility totaling $750 million (Global Credit Facility) which matured on January 20, 2012. This Global Credit Facility provides a source of funds to the Borrowers for temporary and emergency purposes, including the ability to meet future unanticipated or unusually large redemption requests. Effective January 20, 2012, the Borrowers renewed the Global Credit Facility for a total of $1.5 billion, maturing January 18, 2013.
Under the terms of the Global Credit Facility, the Fund shall, in addition to interest charged on any borrowings made by the Fund and other costs incurred by the Fund, pay its share of fees and expenses incurred in connection with the implementation and maintenance of the Global Credit Facility, based upon its relative share of the aggregate net assets of all of the Borrowers, including an annual commitment fee of 0.08% based upon the unused portion of the Global Credit Facility, which is reflected in other expenses on the Statement of Operations. During the year ended December 31, 2011, the Fund did not use the Global Credit Facility.
10. FAIR VALUE MEASUREMENTS
The Fund follows a fair value hierarchy that distinguishes between market data obtained from independent sources (observable inputs) and the Fund’s own market assumptions (unobservable inputs). These inputs are used in determining the value of the Fund’s investments and are summarized in the following fair value hierarchy:
| | • | | Level 1 – quoted prices in active markets for identical securities |
| | • | | Level 2 – other significant observable inputs (including quoted prices for similar securities, interest rates, prepayment speed, credit risk, etc.) |
| | • | | Level 3 – significant unobservable inputs (including the Fund’s own assumptions in determining the fair value of investments) |
The inputs or methodology used for valuing securities are not an indication of the risk associated with investing in those securities.
For movements between the levels within the fair value hierarchy, the Fund has adopted a policy of recognizing the transfers as of the date of the underlying event which caused the movement.
The following is a summary of the inputs used as of December 31, 2011, in valuing the Fund’s assets and liabilities carried at fair value:
| | | | | | | | | | | | | | | | |
| | | Level 1 | | | Level 2 | | | Level 3 | | | Total | |
| | | | |
Assets: | | | | | | | | | | | | | | | | |
Investments in Securities: | | | | | | | | | | | | | | | | |
Equity Investmentsa,b | | $ | 556,781,950 | | | $ | — | | | $ | — | | | $ | 556,781,950 | |
Short Term Investments | | | 40,518,516 | | | | 2,122,374 | | | | — | | | | 42,640,890 | |
| | | | |
Total Investments in Securities | | $ | 597,300,466 | | | $ | 2,122,374 | | | $ | — | | | $ | 599,422,840 | |
| | | | |
aFor detailed categories, see the accompanying Statement of Investments.
bIncludes common and preferred stocks.
TD-25
Franklin Templeton Variable Insurance Products Trust
Notes to Financial Statements (continued)
Templeton Developing Markets Securities Fund
11. NEW ACCOUNTING PRONOUNCEMENTS
In May 2011, the Financial Accounting Standards Board (FASB) issued Accounting Standards Update (ASU) No. 2011-04, Fair Value Measurement (Topic 820): Amendments to Achieve Common Fair Value Measurement and Disclosure Requirements in U.S. GAAP and IFRSs. The amendments in the ASU will improve the comparability of fair value measurements presented and disclosed in financial statements prepared in accordance with U.S. GAAP (Generally Accepted Accounting Principles) and IFRS (International Financial Reporting Standards) and include new guidance for certain fair value measurement principles and disclosure requirements. The ASU is effective for interim and annual periods beginning after December 15, 2011. The Fund believes the adoption of this ASU will not have a material impact on its financial statements.
12. SUBSEQUENT EVENTS
The Fund has evaluated subsequent events through the issuance of the financial statements and determined that no events have occurred that require disclosure other than those already disclosed in the financial statements.
| | | | |
ABBREVIATIONS | | | | |
| Selected Portfolio | | | | |
| | | | |
| ADR - American Depositary Receipt | | | | |
| GDR - Global Depositary Receipt | | | | |
TD-26
Franklin Templeton Variable Insurance Products Trust
Templeton Developing Markets Securities Fund
Report of Independent Registered Public Accounting Firm
To the Board of Trustees and Shareholders of Franklin Templeton Variable Insurance Products Trust
In our opinion, the accompanying statement of assets and liabilities, including the statement of investments, and the related statements of operations and of changes in net assets and the financial highlights present fairly, in all material respects, the financial position of Templeton Developing Markets Securities Fund (the “Fund”) at December 31, 2011, the results of its operations for the year then ended, the changes in its net assets for each of the two years in the period then ended and the financial highlights for each of the periods presented, in conformity with accounting principles generally accepted in the United States of America. These financial statements and financial highlights (hereafter referred to as “financial statements”) are the responsibility of the Fund’s management. Our responsibility is to express an opinion on these financial statements based on our audits. We conducted our audits of these financial statements in accordance with the standards of the Public Company Accounting Oversight Board (United States). Those standards require that we plan and perform the audit to obtain reasonable assurance about whether the financial statements are free of material misstatement. An audit includes examining, on a test basis, evidence supporting the amounts and disclosures in the financial statements, assessing the accounting principles used and significant estimates made by management, and evaluating the overall financial statement presentation. We believe that our audits, which included confirmation of securities at December 31, 2011 by correspondence with the custodian and brokers, provide a reasonable basis for our opinion.
PricewaterhouseCoopers LLP
San Francisco, California
February 13, 2012
TD-27
Franklin Templeton Variable Insurance Products Trust
Tax Information (unaudited)
Templeton Developing Markets Securities Fund
At December 31, 2011, more than 50% of the Fund’s total assets were invested in securities of foreign issuers. In most instances, foreign taxes were withheld from income paid to the Fund on these investments. The Fund elects to treat foreign taxes paid as allowed under Section 853 of the Internal Revenue Code. This election will allow shareholders of record as of the 2012 distribution date, to treat their proportionate share of foreign taxes paid by the Funds as having been paid directly by them. The shareholder shall consider these amounts as foreign taxes paid in the tax year in which they receive the Fund distribution.
TD-28
TEMPLETON FOREIGN SECURITIES FUND
This annual report for Templeton Foreign Securities Fund covers the fiscal year ended December 31, 2011.
Performance Summary as of 12/31/11
Average annual total return of Class 3 shares* represents the average annual change in value, assuming reinvestment of dividends and capital gains. Average returns smooth out variations in returns, which can be significant; they are not the same as year-by-year results.
Periods ended 12/31/11
| | | | | | | | | | | | |
| | | 1-Year | | | 5-Year | | | 10-Year | |
Average Annual Total Return | | | -10.68% | | | | -1.78% | | | | +4.55% | |
*Since Class 3 shares were not offered until 5/1/04, performance prior to that date represents historical Class 2 performance. Since 5/1/04 (effective date), the average annual total return of Class 3 shares was +4.70%.
Total Return Index Comparison for a Hypothetical $10,000 Investment (1/1/02–12/31/11)
The graph below shows the change in value of a hypothetical $10,000 investment in the Fund over the indicated period and includes reinvestment of any income or distributions. The Fund’s performance* is compared to the performance of the MSCI Europe, Australasia, Far East (EAFE) Index. One cannot invest directly in an index, and an index is not representative of the Fund’s portfolio. Please see Important Notes to Performance Information preceding the Fund Summaries.
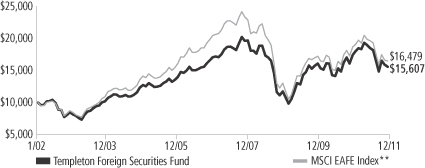
**Source: © 2012 Morningstar. Please see Index Descriptions following the Fund Summaries.
Templeton Foreign Securities Fund – Class 3
Performance reflects the Fund’s Class 3 operating expenses, but does not include any contract fees, expenses or sales charges. If they had been included, performance would be lower. These charges and deductions, particularly for variable life policies, can have a significant effect on contract values and insurance benefits. See the contract prospectus for a complete description of these expenses, including sales charges.
Performance data represent past performance, which does not guarantee future results. Investment return and principal value will fluctuate, and you may have a gain or loss when you sell your shares.
Current performance may differ from figures shown.
TF-1
Fund Goal and Main Investments: Templeton Foreign Securities Fund seeks long-term capital growth. The Fund normally invests at least 80% of its net assets in investments of issuers located outside the U.S., including those in emerging markets.
Performance Overview
You can find the Fund’s one-year total return in the Performance Summary. The Fund performed better than its benchmark, the MSCI EAFE Index, which had a -11.73% total return for the same period.1 Please note, index performance information is provided for reference and we do not attempt to track the index but rather undertake investments on the basis of fundamental research.
Economic and Market Overview
Global stocks declined in 2011 as deepening sovereign debt, political paralysis and economic growth concerns led to escalating investor anxiety and severe market volatility. Stocks entered the year supported by positive momentum in corporate earnings and renewed economic stimulus measures in the developed world. However, a number of events interrupted the market’s rise early in 2011, including a severe natural disaster and nuclear crisis in Japan and populist uprisings across the oil-and-gas-producing regions of the Middle East and North Africa. Global markets recovered quickly from these setbacks but soon faced more significant turmoil as Europe’s sovereign debt crisis worsened in the summer. Portugal, Greece and Ireland received bailouts and had their credit ratings slashed to junk grade, while rising bond yields in the larger economies of Italy and Spain, and eventually in the critical core economies of Germany and France, threatened the survival of the European Monetary Union. The U.S.’s sovereign debt issues and political dysfunction, accompanied by the downgrade of its AAA credit rating to AA+, further pressured investor sentiment during the summer months. Additionally, the precarious state of the global banking system as well as emerging signs of a renewed global economic slowdown and possible hard landing in China weighed on the markets.
Despite these global challenges, corporate profits remained remarkably resilient, some signs of U.S. economic improvement emerged toward year-end, and European policymakers ultimately stepped up their response to their sovereign debt and banking crisis. Greek and Italian
1. Source: © 2012 Morningstar. One cannot invest directly in an index, and an index is not representative of the Fund’s portfolio. Please see Index Descriptions following the Fund Summaries.
Fund Risks: All investments involve risks. Stock prices fluctuate, sometimes rapidly and dramatically, due to factors affecting individual companies, particular industries or sectors, or general market conditions. Foreign investing, especially in emerging or developing markets, involves additional risks, including currency fluctuations, economic instability, market volatility, and political and social instability. The Fund may have significant investments in one or more countries or in particular sectors, such as technology and financial services, from time to time, and may carry greater risk of adverse developments in a country or sector than a fund that invests more broadly. Smaller and midsize company securities can increase the risk of greater price fluctuations, particularly over the short term. The Fund is actively managed but there is no guarantee that the manager’s investment decisions will produce the desired results. The Fund’s prospectus also includes a description of the main investment risks.
TF-2
prime ministers were replaced with technocrats tasked with arresting a debt spiral, the European Central Bank cut short-term interest rates and expanded bank lending facilities, and six key global central banks agreed to lower dollar funding costs for Europe’s distressed commercial banks. Meanwhile, the Federal Reserve Board increased purchases of long-dated bonds to reduce key borrowing costs and hinted at “additional policy accommodation.” Chinese policymakers lowered commercial bank reserve requirements and the International Monetary Fund revamped its credit line and eased its lending terms. Commodities initially rallied due to the coordinated monetary stimulus, but most ultimately declined as global economic prospects weakened. Gold and oil, however, made annual gains. In currency markets, the euro declined with escalating weakness at year-end, while the dollar ultimately rose after a late surge. Amid general global market declines, perceived safe-haven currencies such as the Japanese yen and Swiss franc rallied strongly, and U.S. Treasuries posted their best one-year return since 2008.
Investment Strategy
Our investment philosophy is bottom up, value oriented and long term. In choosing investments, we generally focus on the market price of a company’s securities relative to our evaluation of the company’s potential long-term earnings, asset value and cash flow. Among factors we consider are a company’s historical value measures, including price/earnings ratio, profit margins and liquidation value. We do in-depth research to construct a bargain list from which we buy.
Manager’s Discussion
During the year under review, our underweighting in the consumer staples sector was a key detractor from the Fund’s performance relative to the MSCI EAFE Index.2 Stock selection in the financials sector, which was negatively affected by the European sovereign debt and banking crisis, also weighed on relative results.3 Notable detractors included commercial banks KB Financial Group (South Korea)4 and UniCredit (Italy), as well as financial services companies Credit Suisse Group (Switzerland), ING Groep (Netherlands) and Nomura Holdings (Japan). Stock selection in the energy sector also weighed on relative results, particularly oil and gas companies Talisman Energy (Canada)4
2. The consumer staples sector comprises food and staples retailing in the SOI.
3. The financials sector comprises capital markets, commercial banks, diversified financial services, insurance, and real estate management and development in the SOI.
4. Not an index component.
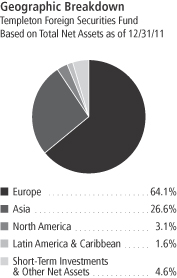
TF-3
and Reliance Industries4 (India).5 Other detractors included video game hardware and software manufacturer Nintendo (Japan) in the information technology (IT) sector and specialist recruitment company Hays4 (U.K.) in the industrials sector.6
Our stock selection and overweighting in the traditionally defensive health care sector was a major contributor to the Fund’s relative performance.7 Within the sector, our positions in pharmaceutical manufacturers Sanofi (France), Roche Holding (Switzerland), Merck KGaA (Germany) and GlaxoSmithKline (U.K.) boosted relative returns. Underweighting and stock selection in the economically sensitive materials sector, which suffered from a global commodity price correction, aided relative results.8 Overweighting in the telecommunication services sector helped relative returns, and major contributors included mobile telecommunication services provider Vodafone Group (U.K.) and diversified telecommunications companies Telenor (Norway) and Singapore Telecommunications.9 Stock selection in the IT sector enhanced relative returns, particularly two companies that benefited from global demand for smartphones and tablet PCs: semiconductor, telecommunication and digital media products manufacturer Samsung Electronics (South Korea) and integrated circuit and semiconductor devices company Taiwan Semiconductor Manufacturing.4 Another key contributor was oil and gas company Statoil (Norway) in the energy sector.
It is important to recognize the effect of currency movements on the Fund’s absolute performance. In general, if the value of the U.S. dollar goes up compared with a foreign currency, an investment traded in that foreign currency will go down in value because it will be worth fewer U.S. dollars. This can have a negative effect on Fund performance. Conversely, when the U.S. dollar weakens in relation to a foreign currency, an investment traded in that foreign currency will increase in value, which can contribute to Fund performance. For the 12 months ended December 31, 2011, the U.S. dollar rose in value relative to most
5. The energy sector comprises energy equipment and services and oil, gas and consumable fuels in the SOI
6. The IT sector comprises communications equipment; computers and peripherals; electronic equipment, instruments and components; semiconductors and semiconductor equipment; and software in the SOI. The industrials sector comprises aerospace and defense, airlines, automobiles, commercial services and supplies, industrial conglomerates, professional services, and trading companies and distributors in the SOI.
7. The health care sector comprises life sciences tools and services and pharmaceuticals in the SOI.
8. The materials sector comprises chemicals, construction materials, containers and packaging, and metals and mining in the SOI.
9. The telecommunication services sector comprises diversified telecommunication services and wireless telecommunication services in the SOI.
Top 10 Holdings
Templeton Foreign Securities Fund 12/31/11
| | | | |
Company
Sector/Industry,
Country | | % of Total
Net Assets | |
| Sanofi | | | 3.5% | |
| Pharmaceuticals, France | | | | |
| Samsung Electronics Co. Ltd. | | | 3.4% | |
| Semiconductors & Semiconductor Equipment, South Korea | | | | |
| Roche Holding AG | | | 3.3% | |
Pharmaceuticals,
Switzerland | | | | |
| Vodafone Group PLC, ADR | | | 2.7% | |
| Wireless Telecommunication Services, U.K. | | | | |
| GlaxoSmithKline PLC | | | 2.7% | |
| Pharmaceuticals, U.K. | | | | |
| Statoil ASA | | | 2.7% | |
| Oil, Gas & Consumable Fuels, Norway | | | | |
| Tesco PLC | | | 2.5% | |
| Food & Staples Retailing, U.K. | | | | |
| Telenor ASA | | | 2.2% | |
| Diversified Telecommunication Services, Norway | | | | |
| Taiwan Semiconductor Manufacturing Co. Ltd. | | | 2.2% | |
| Semiconductors & Semiconductor Equipment, Taiwan | | | | |
| Total SA, B | | | 2.1% | |
| Oil, Gas & Consumable Fuels, France | | | | |
The dollar value, number of shares or principal amount, and names of all portfolio holdings are listed in the Fund’s Statement of Investments (SOI).
TF-4
currencies. As a result, the Fund’s performance was negatively affected by the portfolio’s investment predominantly in securities with non-U.S. currency exposure.
From a geographic perspective, the Fund’s holdings in North America hindered relative results mainly due to the poor performance of our investments in Canada.4 Our positions in Brazil4 and Australia also weighed on relative performance. In contrast, our stock selection in Europe boosted the Fund’s relative performance, as a number of our investments in France, Germany, Norway and the U.K. outperformed. Our overweighting and stock selection in Asia were also beneficial, particularly our positions in China,4 Taiwan,4 and Hong Kong.
Thank you for your participation in Templeton Foreign Securities Fund. We look forward to serving your future investment needs.
The foregoing information reflects our analysis, opinions and portfolio holdings as of December 31, 2011, the end of the reporting period. The way we implement our main investment strategies and the resulting portfolio holdings may change depending on factors such as market and economic conditions. These opinions may not be relied upon as investment advice or an offer for a particular security. The information is not a complete analysis of every aspect of any market, country, industry, security or the Fund. Statements of fact are from sources considered reliable, but the investment manager makes no representation or warranty as to their completeness or accuracy. Although historical performance is no guarantee of future results, these insights may help you understand our investment management philosophy.
TF-5
Fund Expenses
As an investor in a variable insurance contract (Contract) that indirectly provides for investment in an underlying mutual fund, you can incur transaction and/or ongoing expenses at both the Fund level and the Contract level.
| • | | Transaction expenses can include sales charges (loads) on purchases, redemption fees, surrender fees, transfer fees and premium taxes. |
| • | | Ongoing expenses can include management fees, distribution and service (12b-1) fees, contract fees, annual maintenance fees, mortality and expense risk fees and other fees and expenses. All mutual funds and Contracts have some types of ongoing expenses. |
The expenses shown in the table are meant to highlight ongoing expenses at the Fund level only and do not include ongoing expenses at the Contract level, or transaction expenses at either the Fund or Contract level. While the Fund does not have transaction expenses, if the transaction and ongoing expenses at the Contract level were included, the expenses shown below would be higher. You should consult your Contract prospectus or disclosure document for more information.
The table shows Fund-level ongoing expenses and can help you understand these expenses and compare them with those of other mutual funds offered through the Contract. The table assumes a $1,000 investment held for the six months indicated. Please refer to the Fund prospectus for additional information on operating expenses.
Actual Fund Expenses
The first line (Actual) of the table provides actual account values and expenses. The “Ending Account Value” is derived from the Fund’s actual return, which includes the effect of ongoing Fund expenses, but does not include the effect of ongoing Contract expenses.
You can estimate the Fund-level expenses you incurred during the period by following these steps. Of course, your account value and expenses will differ from those in this illustration:
| 1. | Divide your account value by $1,000. |
If an account had an $8,600 value, then $8,600 ÷ $1,000 = 8.6.
| 2. | Multiply the result by the number under the heading “Fund-Level Expenses Incurred During Period.” |
If Fund-Level Expenses Incurred During Period were $7.50, then 8.6 x $7.50 = $64.50.
In this illustration, the estimated expenses incurred this period at the Fund level are $64.50.
Templeton Foreign Securities Fund – Class 3
TF-6
Hypothetical Example for Comparison with Other Mutual Funds
Information in the second line (Hypothetical) of the table can help you compare ongoing expenses of the Fund with those of other mutual funds offered through the Contract. This information may not be used to estimate the actual ending account balance or expenses you incurred during the period. The hypothetical “Ending Account Value” is based on the Fund’s actual expense ratio and an assumed 5% annual rate of return before expenses, which does not represent the Fund’s actual return. The figure under the heading “Fund-Level Expenses Incurred During Period” shows the hypothetical expenses your account would have incurred under this scenario. You can compare this figure with the 5% hypothetical examples that appear in shareholder reports of other funds offered through a Contract.
| | | | | | | | | | | | |
| Class 3 | | Beginning
Account Value 7/1/11 | | | Ending
Account Value 12/31/11 | | | Fund-Level Expenses Incurred
During Period* 7/1/11–12/31/11 | |
Actual | | $ | 1,000 | | | $ | 842.40 | | | $ | 4.88 | |
Hypothetical (5% return before expenses) | | $ | 1,000 | | | $ | 1,019.91 | | | $ | 5.35 | |
*Expenses are calculated using the most recent six-month annualized expense ratio for the Fund’s Class 3 shares (1.05%), which does not include any ongoing expenses of the Contract for which the Fund is an investment option, multiplied by the average account value over the period, multiplied by 184/365 to reflect the one-half year period.
TF-7
Franklin Templeton Variable Insurance Products Trust
Financial Highlights
Templeton Foreign Securities Fund
| | | | | | | | | | | | | | | | | | | | |
| | | Year Ended December 31, | |
| Class 1 | | 2011 | | | 2010 | | | 2009 | | | 2008 | | | 2007 | |
| | | | |
Per share operating performance | | | | | | | | | | | | | | | | | | | | |
(for a share outstanding throughout the year) | | | | | | | | | | | | | | | | | | | | |
Net asset value, beginning of year | | $ | 14.54 | | | $ | 13.68 | | | $ | 10.95 | | | $ | 20.57 | | | $ | 19.00 | |
| | | | |
Income from investment operationsa: | | | | | | | | | | | | | | | | | | | | |
Net investment incomeb | | | 0.42 | | | | 0.28 | | | | 0.25 | | | | 0.45 | | | | 0.45 | |
Net realized and unrealized gains (losses) | | | (1.90 | ) | | | 0.86 | | | | 3.39 | | | | (8.01 | ) | | | 2.46 | |
| | | | |
Total from investment operations | | | (1.48 | ) | | | 1.14 | | | | 3.64 | | | | (7.56 | ) | | | 2.91 | |
| | | | |
Less distributions from: | | | | | | | | | | | | | | | | | | | | |
Net investment income | | | (0.28 | ) | | | (0.28 | ) | | | (0.43 | ) | | | (0.45 | ) | | | (0.44 | ) |
Net realized gains | | | — | | | | — | | | | (0.48 | ) | | | (1.61 | ) | | | (0.90 | ) |
| | | | |
Total distributions | | | (0.28 | ) | | | (0.28 | ) | | | (0.91 | ) | | | (2.06 | ) | | | (1.34 | ) |
| | | | |
Redemption feesc | | | — | | | | — | | | | — | | | | — | | | | — | |
| | | | |
Net asset value, end of year | | $ | 12.78 | | | $ | 14.54 | | | $ | 13.68 | | | $ | 10.95 | | | $ | 20.57 | |
| | | | |
| | | | | |
Total returnd | | | (10.44)% | | | | 8.67% | | | | 37.34% | | | | (40.23)% | | | | 15.79% | |
Ratios to average net assets | | | | | | | | | | | | | | | | | | | | |
Expensese | | | 0.79% | | | | 0.78% | | | | 0.78% | | | | 0.77% | | | | 0.75% | |
Net investment income | | | 2.92% | | | | 2.10% | | | | 2.28% | | | | 2.82% | | | | 2.22% | |
| | | | | |
Supplemental data | | | | | | | | | | | | | | | | | | | | |
Net assets, end of year (000’s) | | $ | 254,292 | | | $ | 321,282 | | | $ | 318,173 | | | $ | 262,725 | | | $ | 531,377 | |
Portfolio turnover rate | | | 21.09% | | | | 19.16% | | | | 22.50% | | | | 18.27% | | | | 26.74% | |
aThe amount shown for a share outstanding throughout the period may not correlate with the Statement of Operations for the period due to the timing of sales and repurchases of the Fund shares in relation to income earned and/or fluctuating market value of the investments of the Fund.
bBased on average daily shares outstanding.
cAmount rounds to less than $0.01 per share.
dTotal return does not include fees, charges or expenses imposed by the variable annuity and life insurance contracts for which the Franklin Templeton Variable Insurance Products Trust serves as an underlying investment vehicle.
eBenefit of expense reduction rounds to less than 0.01%.
The accompanying notes are an integral part of these financial statements.
TF-8
Franklin Templeton Variable Insurance Products Trust
Financial Highlights (continued)
Templeton Foreign Securities Fund
| | | | | | | | | | | | | | | | | | | | |
| | | Year Ended December 31, | |
| Class 2 | | 2011 | | | 2010 | | | 2009 | | | 2008 | | | 2007 | |
| | | | |
Per share operating performance | | | | | | | | | | | | | | | | | | | | |
(for a share outstanding throughout the year) | | | | | | | | | | | | | | | | | | | | |
Net asset value, beginning of year | | $ | 14.29 | | | $ | 13.45 | | | $ | 10.76 | | | $ | 20.25 | | | $ | 18.73 | |
| | | | |
Income from investment operationsa: | | | | | | | | | | | | | | | | | | | | |
Net investment incomeb | | | 0.37 | | | | 0.25 | | | | 0.22 | | | | 0.40 | | | | 0.38 | |
Net realized and unrealized gains (losses) | | | (1.86 | ) | | | 0.84 | | | | 3.34 | | | | (7.89 | ) | | | 2.44 | |
| | | | |
Total from investment operations | | | (1.49 | ) | | | 1.09 | | | | 3.56 | | | | (7.49 | ) | | | 2.82 | |
| | | | |
Less distributions from: | | | | | | | | | | | | | | | | | | | | |
Net investment income | | | (0.24 | ) | | | (0.25 | ) | | | (0.39 | ) | | | (0.39 | ) | | | (0.40 | ) |
Net realized gains | | | — | | | | — | | | | (0.48 | ) | | | (1.61 | ) | | | (0.90 | ) |
| | | | |
Total distributions | | | (0.24 | ) | | | (0.25 | ) | | | (0.87 | ) | | | (2.00 | ) | | | (1.30 | ) |
| | | | |
Redemption feesc | | | — | | | | — | | | | — | | | | — | | | | — | |
| | | | |
Net asset value, end of year | | $ | 12.56 | | | $ | 14.29 | | | $ | 13.45 | | | $ | 10.76 | | | $ | 20.25 | |
| | | | |
| | | | | |
Total returnd | | | (10.63)% | | | | 8.41% | | | | 37.04% | | | | (40.38)% | | | | 15.46% | |
Ratios to average net assets | | | | | | | | | | | | | | | | | | | | |
Expensese | | | 1.04% | | | | 1.03% | | | | 1.03% | | | | 1.02% | | | | 1.00% | |
Net investment income | | | 2.67% | | | | 1.85% | | | | 2.03% | | | | 2.57% | | | | 1.97% | |
| | | | | |
Supplemental data | | | | | | | | | | | | | | | | | | | | |
Net assets, end of year (000’s) | | $ | 1,679,412 | | | $ | 2,090,757 | | | $ | 2,010,268 | | | $ | 1,702,038 | | | $ | 3,255,154 | |
Portfolio turnover rate | | | 21.09% | | | | 19.16% | | | | 22.50% | | | | 18.27% | | | | 26.74% | |
aThe amount shown for a share outstanding throughout the period may not correlate with the Statement of Operations for the period due to the timing of sales and repurchases of the Fund shares in relation to income earned and/or fluctuating market value of the investments of the Fund.
bBased on average daily shares outstanding.
cAmount rounds to less than $0.01 per share.
dTotal return does not include fees, charges or expenses imposed by the variable annuity and life insurance contracts for which the Franklin Templeton Variable Insurance Products Trust serves as an underlying investment vehicle.
eBenefit of expense reduction rounds to less than 0.01%.
The accompanying notes are an integral part of these financial statements.
TF-9
Franklin Templeton Variable Insurance Products Trust
Financial Highlights (continued)
Templeton Foreign Securities Fund
| | | | | | | | | | | | | | | | | | | | |
| | | Year Ended December 31, | |
| Class 3 | | 2011 | | | 2010 | | | 2009 | | | 2008 | | | 2007 | |
| | | | |
Per share operating performance | | | | | | | | | | | | | | | | | | | | |
(for a share outstanding throughout the year) | | | | | | | | | | | | | | | | | | | | |
Net asset value, beginning of year | | $ | 14.24 | | | $ | 13.37 | | | $ | 10.70 | | | $ | 20.18 | | | $ | 18.68 | |
| | | | |
Income from investment operationsa: | | | | | | | | | | | | | | | | | | | | |
Net investment incomeb | | | 0.37 | | | | 0.25 | | | | 0.25 | | | | 0.39 | | | | 0.37 | |
Net realized and unrealized gains (losses) | | | (1.86 | ) | | | 0.84 | | | | 3.30 | | | | (7.84 | ) | | | 2.45 | |
| | | | |
Total from investment operations | | | (1.49 | ) | | | 1.09 | | | | 3.55 | | | | (7.45 | ) | | | 2.82 | |
| | | | |
Less distributions from: | | | | | | | | | | | | | | | | | | | | |
Net investment income | | | (0.24 | ) | | | (0.22 | ) | | | (0.40 | ) | | | (0.42 | ) | | | (0.42 | ) |
Net realized gains | | | — | | | | — | | | | (0.48 | ) | | | (1.61 | ) | | | (0.90 | ) |
| | | | |
Total distributions | | | (0.24 | ) | | | (0.22 | ) | | | (0.88 | ) | | | (2.03 | ) | | | (1.32 | ) |
| | | | |
Redemption feesc | | | — | | | | — | | | | — | | | | — | | | | — | |
| | | | |
Net asset value, end of year | | $ | 12.51 | | | $ | 14.24 | | | $ | 13.37 | | | $ | 10.70 | | | $ | 20.18 | |
| | | | |
| | | | | |
Total returnd | | | (10.68)% | | | | 8.41% | | | | 37.20% | | | | (40.39)% | | | | 15.45% | |
Ratios to average net assets | | | | | | | | | | | | | | | | | | | | |
Expensese | | | 1.04% | | | | 1.03% | | | | 1.03% | | | | 1.02% | | | | 1.00% | |
Net investment income | | | 2.67% | | | | 1.85% | | | | 2.03% | | | | 2.57% | | | | 1.97% | |
| | | | | |
Supplemental data | | | | | | | | | | | | | | | | | | | | |
Net assets, end of year (000’s) | | $ | 88,380 | | | $ | 108,766 | | | $ | 115,364 | | | $ | 271,061 | | | $ | 313,505 | |
Portfolio turnover rate | | | 21.09% | | | | 19.16% | | | | 22.50% | | | | 18.27% | | | | 26.74% | |
aThe amount shown for a share outstanding throughout the period may not correlate with the Statement of Operations for the period due to the timing of sales and repurchases of the Fund shares in relation to income earned and/or fluctuating market value of the investments of the Fund.
bBased on average daily shares outstanding.
cAmount rounds to less than $0.01 per share.
dTotal return does not include fees, charges or expenses imposed by the variable annuity and life insurance contracts for which the Franklin Templeton Variable Insurance Products Trust serves as an underlying investment vehicle.
eBenefit of expense reduction rounds to less than 0.01%.
The accompanying notes are an integral part of these financial statements.
TF-10
Franklin Templeton Variable Insurance Products Trust
Financial Highlights (continued)
Templeton Foreign Securities Fund
| | | | | | | | | | | | | | | | |
| | | Year Ended December 31, | |
| Class 4 | | 2011 | | | 2010 | | | 2009 | | | 2008a | |
| | | | |
Per share operating performance | | | | | | | | | | | | | | | | |
(for a share outstanding throughout the year) | | | | | | | | | | | | | | | | |
Net asset value, beginning of year | | $ | 14.43 | | | $ | 13.59 | | | $ | 10.91 | | | $ | 18.90 | |
| | | | |
Income from investment operationsb: | | | | | | | | | | | | | | | | |
Net investment incomec | | | 0.36 | | | | 0.17 | | | | 0.21 | | | | 0.15 | |
Net realized and unrealized gains (losses) | | | (1.88 | ) | | | 0.92 | | | | 3.37 | | | | (6.08 | ) |
| | | | |
Total from investment operations | | | (1.52 | ) | | | 1.09 | | | | 3.58 | | | | (5.93 | ) |
| | | | |
Less distributions from: | | | | | | | | | | | | | | | | |
Net investment income | | | (0.25 | ) | | | (0.25 | ) | | | (0.42 | ) | | | (0.45 | ) |
Net realized gains | | | — | | | | — | | | | (0.48 | ) | | | (1.61 | ) |
| | | | |
Total distributions | | | (0.25 | ) | | | (0.25 | ) | | | (0.90 | ) | | | (2.06 | ) |
| | | | |
Redemption feesd | | | — | | | | — | | | | — | | | | — | |
| | | | |
Net asset value, end of year | | $ | 12.66 | | | $ | 14.43 | | | $ | 13.59 | | | $ | 10.91 | |
| | | | |
| | | | |
Total returne | | | (10.74)% | | | | 8.38% | | | | 36.84% | | | | (35.15)% | |
Ratios to average net assetsf | | | | | | | | | | | | | | | | |
Expensesg | | | 1.14% | | | | 1.13% | | | | 1.13% | | | | 1.12% | |
Net investment income | | | 2.57% | | | | 1.75% | | | | 1.93% | | | | 2.47% | |
| | | | |
Supplemental data | | | | | | | | | | | | | | | | |
Net assets, end of year (000’s) | | $ | 353,346 | | | $ | 305,505 | | | $ | 48,501 | | | $ | 14,287 | |
Portfolio turnover rate | | | 21.09% | | | | 19.16% | | | | 22.50% | | | | 18.27% | |
aFor the period February 29, 2008 (effective date) to December 31, 2008.
bThe amount shown for a share outstanding throughout the period may not correlate with the Statement of Operations for the period due to the timing of sales and repurchases of the Fund shares in relation to income earned and/or fluctuating market value of the investments of the Fund.
cBased on average daily shares outstanding.
dAmount rounds to less than $0.01 per share.
eTotal return does not include fees, charges or expenses imposed by the variable annuity and life insurance contracts for which the Franklin Templeton Variable Insurance Products Trust serves as an underlying investment vehicle.
fRatios are annualized for periods less than one year.
gBenefit of expense reduction rounds to less than 0.01%.
The accompanying notes are an integral part of these financial statements.
TF-11
Franklin Templeton Variable Insurance Products Trust
Statement of Investments, December 31, 2011
| | | | | | | | | | |
| Templeton Foreign Securities Fund | | Country | | Shares/
Units | | | Value | |
Common Stocks and Other Equity Interests 93.8% | | | | | | | | | | |
Aerospace & Defense 0.8% | | | | | | | | | | |
BAE Systems PLC | | United Kingdom | | | 4,453,130 | | | $ | 19,699,114 | |
| | | | | | | | | | |
Airlines 0.4% | | | | | | | | | | |
Deutsche Lufthansa AG | | Germany | | | 871,940 | | | | 10,326,250 | |
| | | | | | | | | | |
Automobiles 1.6% | | | | | | | | | | |
aMazda Motor Corp. | | Japan | | | 5,453,000 | | | | 9,635,652 | |
Toyota Motor Corp., ADR | | Japan | | | 440,460 | | | | 29,127,620 | |
| | | | | | | | | | |
| | | | | | | | | 38,763,272 | |
| | | | | | | | | | |
Capital Markets 4.6% | | | | | | | | | | |
Credit Suisse Group AG | | Switzerland | | | 1,969,870 | | | | 46,331,359 | |
KKR & Co., LP | | United States | | | 1,155,000 | | | | 14,818,650 | �� |
Nomura Holdings Inc. | | Japan | | | 5,636,100 | | | | 17,062,448 | |
aUBS AG | | Switzerland | | | 2,504,440 | | | | 29,839,228 | |
| | | | | | | | | | |
| | | | | | | | | 108,051,685 | |
| | | | | | | | | | |
Chemicals 0.9% | | | | | | | | | | |
Akzo Nobel NV | | Netherlands | | | 454,250 | | | | 21,965,281 | |
| | | | | | | | | | |
Commercial Banks 6.5% | | | | | | | | | | |
BNP Paribas SA | | France | | | 786,460 | | | | 30,893,726 | |
DBS Group Holdings Ltd. | | Singapore | | | 2,993,520 | | | | 26,586,501 | |
HSBC Holdings PLC | | United Kingdom | | | 3,065,200 | | | | 23,285,196 | |
KB Financial Group Inc., ADR | | South Korea | | | 1,220,681 | | | | 38,256,143 | |
UniCredit SpA | | Italy | | | 2,788,463 | | | | 23,170,463 | |
United Overseas Bank Ltd. | | Singapore | | | 985,000 | | | | 11,595,829 | |
| | | | | | | | | | |
| | | | | | | | | 153,787,858 | |
| | | | | | | | | | |
Commercial Services & Supplies 0.9% | | | | | | | | | | |
G4S PLC | | United Kingdom | | | 5,045,810 | | | | 21,258,958 | |
| | | | | | | | | | |
Communications Equipment 0.7% | | | | | | | | | | |
Telefonaktiebolaget LM Ericsson, B, ADR | | Sweden | | | 1,675,840 | | | | 16,976,259 | |
| | | | | | | | | | |
Computers & Peripherals 1.8% | | | | | | | | | | |
Compal Electronics Inc. | | Taiwan | | | 28,536,431 | | | | 28,456,339 | |
Lite-On Technology Corp. | | Taiwan | | | 11,802,124 | | | | 13,288,837 | |
| | | | | | | | | | |
| | | | | | | | | 41,745,176 | |
| | | | | | | | | | |
Construction Materials 0.6% | | | | | | | | | | |
CRH PLC | | Ireland | | | 659,820 | | | | 13,117,517 | |
| | | | | | | | | | |
Containers & Packaging 0.7% | | | | | | | | | | |
Rexam PLC | | United Kingdom | | | 3,021,290 | | | | 16,528,106 | |
| | | | | | | | | | |
Diversified Financial Services 1.8% | | | | | | | | | | |
aING Groep NV | | Netherlands | | | 5,880,644 | | | | 42,318,926 | |
| | | | | | | | | | |
Diversified Telecommunication Services 10.0% | | | | | | | | | | |
China Telecom Corp. Ltd., H | | China | | | 69,378,357 | | | | 39,483,473 | |
France Telecom SA | | France | | | 2,164,143 | | | | 33,990,745 | |
Singapore Telecommunications Ltd. | | Singapore | | | 16,934,000 | | | | 40,340,806 | |
Telefonica SA, ADR | | Spain | | | 1,813,382 | | | | 31,172,037 | |
Telekom Austria AG | | Austria | | | 1,711,400 | | | | 20,462,771 | |
Telenor ASA | | Norway | | | 3,226,804 | | | | 52,928,941 | |
Vivendi SA | | France | | | 898,479 | | | | 19,676,291 | |
| | | | | | | | | | |
| | | | | | | | | 238,055,064 | |
| | | | | | | | | | |
TF-12
Franklin Templeton Variable Insurance Products Trust
Statement of Investments, December 31, 2011 (continued)
| | | | | | | | | | |
| Templeton Foreign Securities Fund | | Country | | Shares/
Units | | | Value | |
Common Stocks and Other Equity Interests (continued) | | | | | | | | | | |
Electric Utilities 0.8% | | | | | | | | | | |
E.ON AG | | Germany | | | 917,590 | | | $ | 19,631,635 | |
| | | | | | | | | | |
Electronic Equipment, Instruments & Components 1.2% | | | | | | | | | | |
aFlextronics International Ltd. | | Singapore | | | 4,961,670 | | | | 28,083,052 | |
| | | | | | | | | | |
Energy Equipment & Services 0.7% | | | | | | | | | | |
Aker Solutions ASA | | Norway | | | 1,617,940 | | | | 17,029,808 | |
| | | | | | | | | | |
Food & Staples Retailing 2.5% | | | | | | | | | | |
Tesco PLC | | United Kingdom | | | 9,326,670 | | | | 58,457,252 | |
| | | | | | | | | | |
Industrial Conglomerates 3.3% | | | | | | | | | | |
Hutchison Whampoa Ltd. | | Hong Kong | | | 2,500,239 | | | | 21,021,503 | |
Koninklijke Philips Electronics NV | | Netherlands | | | 1,473,320 | | | | 31,044,627 | |
Siemens AG | | Germany | | | 285,414 | | | | 27,275,117 | |
| | | | | | | | | | |
| | | | | | | | | 79,341,247 | |
| | | | | | | | | | |
Insurance 10.4% | | | | | | | | | | |
ACE Ltd. | | United States | | | 377,449 | | | | 26,466,724 | |
AIA Group Ltd. | | Hong Kong | | | 11,111,000 | | | | 34,692,369 | |
Aviva PLC | | United Kingdom | | | 9,269,960 | | | | 43,267,686 | |
AXA SA | | France | | | 2,547,968 | | | | 33,126,752 | |
Muenchener Rueckversicherungs-Gesellschaft AG | | Germany | | | 249,150 | | | | 30,504,186 | |
NKSJ Holdings Inc. | | Japan | | | 1,054,500 | | | | 20,688,560 | |
PartnerRe Ltd. | | Bermuda | | | 196,480 | | | | 12,615,981 | |
aSwiss Re Ltd. | | Switzerland | | | 917,340 | | | | 46,798,173 | |
| | | | | | | | | | |
| | | | | | | | | 248,160,431 | |
| | | | | | | | | | |
Life Sciences Tools & Services 0.4% | | | | | | | | | | |
Lonza Group AG | | Switzerland | | | 175,440 | | | | 10,376,640 | |
| | | | | | | | | | |
Media 1.0% | | | | | | | | | | |
Reed Elsevier NV | | Netherlands | | | 2,017,693 | | | | 23,521,781 | |
| | | | | | | | | | |
Metals & Mining 0.9% | | | | | | | | | | |
POSCO | | South Korea | | | 66,052 | | | | 21,651,723 | |
| | | | | | | | | | |
Multi-Utilities 0.8% | | | | | | | | | | |
GDF Suez | | France | | | 697,431 | | | | 19,064,706 | |
| | | | | | | | | | |
Multiline Retail 0.5% | | | | | | | | | | |
Marks & Spencer Group PLC | | United Kingdom | | | 2,350,320 | | | | 11,333,394 | |
| | | | | | | | | | |
Oil, Gas & Consumable Fuels 10.7% | | | | | | | | | | |
BP PLC | | United Kingdom | | | 4,406,715 | | | | 31,496,024 | |
Gazprom, ADR | | Russia | | | 2,623,000 | | | | 28,016,263 | |
Reliance Industries Ltd. | | India | | | 998,145 | | | | 13,045,641 | |
Royal Dutch Shell PLC, A | | United Kingdom | | | 16,803 | | | | 618,030 | |
Royal Dutch Shell PLC, B | | United Kingdom | | | 1,292,973 | | | | 49,278,912 | |
Statoil ASA | | Norway | | | 2,455,740 | | | | 63,029,284 | |
Talisman Energy Inc. | | Canada | | | 1,506,600 | | | | 19,188,214 | |
bTotal SA, B | | France | | | 979,926 | | | | 50,098,570 | |
| | | | | | | | | | |
| | | | | | | | | 254,770,938 | |
| | | | | | | | | | |
Pharmaceuticals 12.1% | | | | | | | | | | |
GlaxoSmithKline PLC | | United Kingdom | | | 2,772,585 | | | | 63,359,637 | |
Merck KGaA | | Germany | | | 405,300 | | | | 40,448,774 | |
Novartis AG | | Switzerland | | | 360,330 | | | | 20,621,006 | |
Roche Holding AG | | Switzerland | | | 468,100 | | | | 79,417,616 | |
TF-13
Franklin Templeton Variable Insurance Products Trust
Statement of Investments, December 31, 2011 (continued)
| | | | | | | | | | |
| Templeton Foreign Securities Fund | | Country | | Shares/
Units | | | Value | |
Common Stocks and Other Equity Interests (continued) | | | | | | | | | | |
Pharmaceuticals (continued) | | | | | | | | | | |
Sanofi | | France | | | 1,127,925 | | | $ | 82,847,812 | |
| | | | | | | | | | |
| | | | | | | | | 286,694,845 | |
| | | | | | | | | | |
Professional Services 1.1% | | | | | | | | | | |
Hays PLC | | United Kingdom | | | 11,353,070 | | | | 11,343,170 | |
Randstad Holding NV | | Netherlands | | | 477,910 | | | | 14,140,257 | |
| | | | | | | | | | |
| | | | | | | | | 25,483,427 | |
| | | | | | | | | | |
Real Estate Management & Development 0.0%† | | | | | | | | | | |
Cheung Kong (Holdings) Ltd. | | Hong Kong | | | 922 | | | | 10,987 | |
| | | | | | | | | | |
Semiconductors & Semiconductor Equipment 6.5% | | | | | | | | | | |
Infineon Technologies AG | | Germany | | | 1,103,225 | | | | 8,281,844 | |
Samsung Electronics Co. Ltd. | | South Korea | | | 89,088 | | | | 81,306,969 | |
Siliconware Precision Industries Co. | | Taiwan | | | 14,515,000 | | | | 12,988,493 | |
Taiwan Semiconductor Manufacturing Co. Ltd. | | Taiwan | | | 20,849,526 | | | | 52,184,054 | |
| | | | | | | | | | |
| | | | | | | | | 154,761,360 | |
| | | | | | | | | | |
Software 2.9% | | | | | | | | | | |
Nintendo Co. Ltd. | | Japan | | | 166,400 | | | | 22,917,430 | |
SAP AG, ADR | | Germany | | | 370,760 | | | | 19,631,742 | |
Trend Micro Inc. | | Japan | | | 868,100 | | | | 25,953,331 | |
| | | | | | | | | | |
| | | | | | | | | 68,502,503 | |
| | | | | | | | | | |
Specialty Retail 1.5% | | | | | | | | | | |
Kingfisher PLC | | United Kingdom | | | 9,366,486 | | | | 36,465,799 | |
| | | | | | | | | | |
Trading Companies & Distributors 0.9% | | | | | | | | | | |
Itochu Corp. | | Japan | | | 2,102,500 | | | | 21,362,373 | |
| | | | | | | | | | |
Wireless Telecommunication Services 4.3% | | | | | | | | | | |
China Mobile Ltd. | | China | | | 2,340,000 | | | | 22,867,922 | |
Mobile TeleSystems, ADR | | Russia | | | 914,865 | | | | 13,430,218 | |
Vodafone Group PLC, ADR | | United Kingdom | | | 2,323,300 | | | | 65,122,099 | |
| | | | | | | | | | |
| | | | | | | | | 101,420,239 | |
| | | | | | | | | | |
Total Common Stocks and Other Equity Interests
(Cost $2,388,902,314) | | | | | | | | | 2,228,717,606 | |
| | | | | | | | | | |
Preferred Stocks 1.6% | | | | | | | | | | |
Metals & Mining 1.1% | | | | | | | | | | |
Vale SA, ADR, pfd., A | | Brazil | | | 1,210,222 | | | | 24,930,573 | |
| | | | | | | | | | |
Oil, Gas & Consumable Fuels 0.5% | | | | | | | | | | |
Petroleo Brasileiro SA, ADR, pfd. | | Brazil | | | 517,880 | | | | 12,165,001 | |
| | | | | | | | | | |
Total Preferred Stocks (Cost $13,315,242) | | | | | | | | | 37,095,574 | |
| | | | | | | | | | |
Total Investments before Short Term Investments
(Cost $2,402,217,556) | | | | | | | | | 2,265,813,180 | |
| | | | | | | | | | |
TF-14
Franklin Templeton Variable Insurance Products Trust
Statement of Investments, December 31, 2011 (continued)
| | | | | | | | | | |
| Templeton Foreign Securities Fund | | Country | | Shares/
Units | | | Value | |
Short Term Investments 4.5% | | | | | | | | | | |
Money Market Funds (Cost $106,174,453) 4.5% | | | | | | | | | | |
a,cInstitutional Fiduciary Trust Money Market Portfolio | | United States | | | 106,174,453 | | | $ | 106,174,453 | |
| | | | | | | | | | |
dInvestments from Cash Collateral Received for Loaned Securities
(Cost $138,503) 0.0%† | | | | | | | | | | |
Money Market Funds 0.0%† | | | | | | | | | | |
eBNY Mellon Overnight Government Fund, 0.039% | | United States | | | 138,503 | | | | 138,503 | |
| | | | | | | | | | |
Total Investments (Cost $2,508,530,512) 99.9% | | | | | | | | | 2,372,126,136 | |
Other Assets, less Liabilities 0.1% | | | | | | | | | 3,303,938 | |
| | | | | | | | | | |
Net Assets 100.0% | | | | | | | | $ | 2,375,430,074 | |
| | | | | | | | | | |
See Abbreviations on page TF-26.
†Rounds to less than 0.1% of net assets.
aNon-income producing.
bA portion or all of the security is on loan at December 31, 2011. See Note 1(c).
cSee Note 7 regarding investments in the Institutional Fiduciary Trust Money Market Portfolio.
dSee Note 1(c) regarding securities on loan.
eThe rate shown is the annualized seven-day yield at period end.
The accompanying notes are an integral part of these financial statements.
TF-15
Franklin Templeton Variable Insurance Products Trust
Financial Statements
Statements of Assets and Liabilities
December 31, 2011
| | | | |
| | | Templeton
Foreign
Securities Fund | |
Assets: | | | | |
Investments in securities: | | | | |
Cost - Unaffiliated issuers | | $ | 2,402,356,059 | |
Cost - Sweep Money Fund (Note 7) | | | 106,174,453 | |
| | | | |
Total cost of investments | | $ | 2,508,530,512 | |
| | | | |
Value - Unaffiliated issuers | | $ | 2,265,951,683 | |
Value - Sweep Money Fund (Note 7) | | | 106,174,453 | |
| | | | |
Total value of investments (includes securities loaned in the amount $131,856) | | | 2,372,126,136 | |
Cash | | | 172,980 | |
Receivables: | | | | |
Capital shares sold | | | 1,547,647 | |
Dividends and interest | | | 6,865,931 | |
Other assets | | | 75 | |
| | | | |
Total assets | | | 2,380,712,769 | |
| | | | |
Liabilities: | | | | |
Payables: | | | | |
Capital shares redeemed | | | 1,877,410 | |
Affiliates | | | 2,452,002 | |
Reports to shareholders | | | 640,351 | |
Payable upon return of securities loaned | | | 138,503 | |
Accrued expenses and other liabilities | | | 174,429 | |
| | | | |
Total liabilities | | | 5,282,695 | |
| | | | |
Net assets, at value | | $ | 2,375,430,074 | |
| | | | |
Net assets consist of: | | | | |
Paid-in capital | | $ | 2,569,122,780 | |
Undistributed net investment income | | | 72,574,104 | |
Net unrealized appreciation (depreciation) | | | (136,417,326 | ) |
Accumulated net realized gain (loss) | | | (129,849,484 | ) |
| | | | |
Net assets, at value | | $ | 2,375,430,074 | |
| | | | |
The accompanying notes are an integral part of these financial statements.
TF-16
Franklin Templeton Variable Insurance Products Trust
Financial Statements (continued)
Statements of Assets and Liabilities (continued)
December 31, 2011
| | | | |
| | | Templeton
Foreign
Securities Fund | |
Class 1: | | | | |
Net assets, at value | | $ | 254,292,005 | |
| | | | |
Shares outstanding | | | 19,894,351 | |
| | | | |
Net asset value and maximum offering price per share | | $ | 12.78 | |
| | | | |
Class 2: | | | | |
Net assets, at value | | $ | 1,679,411,889 | |
| | | | |
Shares outstanding | | | 133,750,747 | |
| | | | |
Net asset value and maximum offering price per share | | $ | 12.56 | |
| | | | |
Class 3: | | | | |
Net assets, at value | | $ | 88,380,234 | |
| | | | |
Shares outstanding | | | 7,064,247 | |
| | | | |
Net asset value and maximum offering price per sharea | | $ | 12.51 | |
| | | | |
Class 4: | | | | |
Net assets, at value | | $ | 353,345,946 | |
| | | | |
Shares outstanding | | | 27,919,791 | |
| | | | |
Net asset value and maximum offering price per share | | $ | 12.66 | |
| | | | |
aRedemption price is equal to net asset value less any redemption fees retained by the fund.
The accompanying notes are an integral part of these financial statements.
TF-17
Franklin Templeton Variable Insurance Products Trust
Financial Statements (continued)
Statement of Operations
for the year ended December 31, 2011
| | | | |
| | | Templeton
Foreign
Securities Fund | |
Investment income: | | | | |
Dividends (net of foreign taxes of $10,047,845) | | $ | 95,839,331 | |
Income from securities loaned | | | 3,918,257 | |
| | | | |
Total investment income | | | 99,757,588 | |
| | | | |
Expenses: | | | | |
Management fees (Note 3a) | | | 17,160,771 | |
Administrative fees (Note 3b) | | | 2,592,887 | |
Distribution fees: (Note 3c) | | | | |
Class 2 | | | 4,871,796 | |
Class 3 | | | 255,374 | |
Class 4 | | | 1,189,998 | |
Unaffiliated transfer agent fees | | | 7,664 | |
Custodian fees (Note 4) | | | 571,227 | |
Reports to shareholders | | | 674,731 | |
Professional fees | | | 131,433 | |
Trustees’ fees and expenses | | | 9,695 | |
Other | | | 52,264 | |
| | | | |
Total expenses | | | 27,517,840 | |
Expense reductions (Note 4) | | | (18 | ) |
| | | | |
Net expenses | | | 27,517,822 | |
| | | | |
Net investment income | | | 72,239,766 | |
| | | | |
Realized and unrealized gains (losses): | | | | |
Net realized gain (loss) from: | | | | |
Investments | | | 136,320,840 | |
Foreign currency transactions | | | 677,995 | |
| | | | |
Net realized gain (loss) | | | 136,998,835 | |
| | | | |
Net change in unrealized appreciation (depreciation) on: | | | | |
Investments | | | (482,109,964 | ) |
Translation of other assets and liabilities denominated in foreign currencies | | | (202,130 | ) |
| | | | |
Net change in unrealized appreciation (depreciation) | | | (482,312,094 | ) |
| | | | |
Net realized and unrealized gain (loss) | | | (345,313,259 | ) |
| | | | |
Net increase (decrease) in net assets resulting from operations | | $ | (273,073,493 | ) |
| | | | |
The accompanying notes are an integral part of these financial statements.
TF-18
Franklin Templeton Variable Insurance Products Trust
Financial Statements (continued)
Statements of Changes in Net Assets
| | | | | | | | |
| | | Templeton Foreign
Securities Fund | |
| | | Year Ended December 31, | |
| | | 2011 | | | 2010 | |
| | | | |
Increase (decrease) in net assets: | | | | | | | | |
Operations: | | | | | | | | |
Net investment income | | $ | 72,239,766 | | | $ | 47,212,887 | |
Net realized gain (loss) from investments and foreign currency transactions | | | 136,998,835 | | | | 35,915,484 | |
Net change in unrealized appreciation (depreciation) on investments and translation of other assets and liabilities denominated in foreign currencies | | | (482,312,094 | ) | | | 171,263,300 | |
| | | | |
Net increase (decrease) in net assets resulting from operations | | | (273,073,493 | ) | | | 254,391,671 | |
| | | | |
Distributions to shareholders from: | | | | | | | | |
Net investment income: | | | | | | | | |
Class 1 | | | (5,782,491 | ) | | | (6,186,591 | ) |
Class 2 | | | (33,309,204 | ) | | | (35,909,578 | ) |
Class 3 | | | (1,749,311 | ) | | | (1,738,264 | ) |
Class 4 | | | (5,966,192 | ) | | | (1,159,055 | ) |
| | | | |
Total distributions to shareholders | | | (46,807,198 | ) | | | (44,993,488 | ) |
| | | | |
Capital share transactions: (Note 2) | | | | | | | | |
Class 1 | | | (31,404,883 | ) | | | (16,391,025 | ) |
Class 2 | | | (183,781,604 | ) | | | (56,686,127 | ) |
Class 3 | | | (8,583,165 | ) | | | (13,133,254 | ) |
Class 4 | | | 92,765,363 | | | | 210,807,534 | |
| | | | |
Total capital share transactions | | | (131,004,289 | ) | | | 124,597,128 | |
| | | | |
Redemption fees | | | 4,895 | | | | 9,228 | |
| | | | |
Net increase (decrease) in net assets | | | (450,880,085 | ) | | | 334,004,539 | |
Net assets: | | | | | | | | |
Beginning of year | | | 2,826,310,159 | | | | 2,492,305,620 | |
| | | | |
End of year | | $ | 2,375,430,074 | | | $ | 2,826,310,159 | |
| | | | |
Undistributed net investment income included in net assets: | | | | | | | | |
End of year | | $ | 72,574,104 | | | $ | 46,209,487 | |
| | | | |
The accompanying notes are an integral part of these financial statements.
TF-19
Franklin Templeton Variable Insurance Products Trust
Notes to Financial Statements
Templeton Foreign Securities Fund
1. ORGANIZATION AND SIGNIFICANT ACCOUNTING POLICIES
Franklin Templeton Variable Insurance Products Trust (Trust) is registered under the Investment Company Act of 1940, as amended, (1940 Act) as an open-end investment company, consisting of twenty separate funds. The Templeton Foreign Securities (Fund) is included in this report. The financial statements of the remaining funds in the Trust are presented separately. Shares of the Fund are generally sold only to insurance company separate accounts to fund the benefits of variable life insurance policies or variable annuity contracts. The Fund offers four classes of shares: Class 1, Class 2, Class 3, and Class 4. Each class of shares differs by its distribution fees, voting rights on matters affecting a single class and its exchange privilege.
The following summarizes the Fund’s significant accounting policies.
a. Financial Instrument Valuation
The Fund’s investments in securities and other financial instruments are carried at fair value daily. Fair value is the price that would be received to sell an asset or paid to transfer a liability in an orderly transaction between market participants on the measurement date. Under procedures approved by the Trust’s Board of Trustees, the Fund may utilize independent pricing services, quotations from securities and financial instrument dealers, and other market sources to determine fair value.
Equity securities listed on an exchange or on the NASDAQ National Market System are valued at the last quoted sale price or the official closing price of the day, respectively. Foreign equity securities are valued as of the close of trading on the foreign stock exchange on which the security is primarily traded, or the NYSE, whichever is earlier. The value is then converted into its U.S. dollar equivalent at the foreign exchange rate in effect at the close of the NYSE on the day that the value of the security is determined. Over-the-counter securities are valued within the range of the most recent quoted bid and ask prices. Securities that trade in multiple markets or on multiple exchanges are valued according to the broadest and most representative market. Certain equity securities are valued based upon fundamental characteristics or relationships to similar securities. Investments in open-end mutual funds and non-registered money market funds are valued at the closing net asset value.
The Fund has procedures to determine the fair value of securities and other financial instruments for which market prices are not readily available or which may not be reliably priced. Under these procedures, the Fund primarily employs a market-based approach which may use related or comparable assets or liabilities, recent transactions, market multiples, book values, and other relevant information for the investment to determine the fair value of the investment. The Fund may also use an income-based valuation approach in which the anticipated future cash flows of the investment are discounted to calculate fair value. Discounts may also be applied due to the nature or duration of any restrictions on the disposition of the investments. Due to the inherent uncertainty of valuations of such investments, the fair values may differ significantly from the values that would have been used had an active market existed.
Trading in securities on foreign securities stock exchanges and over-the-counter markets may be completed before the daily close of business on the NYSE. Occasionally, events occur between the time at which trading in a foreign security is completed and the close of the NYSE that might call into question the reliability of the value of a portfolio security held by the Fund. As a result, differences may arise between the value of the Fund’s portfolio securities as determined at the foreign market close and the latest indications of value at the close of the NYSE. In order to minimize the potential for these differences, the investment manager monitors price movements following the close of trading in foreign stock markets through a series of country specific market proxies (such as baskets of American Depositary Receipts, futures contracts and exchange traded funds). These price movements are measured against established trigger thresholds for each specific market proxy to assist in determining if an event has occurred that may call into question the reliability of the values of the foreign securities held by the Fund. If such an event occurs, the securities may be valued using fair value procedures, which may include the use of independent pricing services.
b. Foreign Currency Translation
Portfolio securities and other assets and liabilities denominated in foreign currencies are translated into U.S. dollars based on the exchange rate of such currencies against U.S. dollars on the date of valuation. The Fund may enter into foreign currency
TF-20
Franklin Templeton Variable Insurance Products Trust
Notes to Financial Statements (continued)
Templeton Foreign Securities Fund
1. ORGANIZATION AND SIGNIFICANT ACCOUNTING POLICIES (continued)
b. Foreign Currency Translation (continued)
exchange contracts to facilitate transactions denominated in a foreign currency. Purchases and sales of securities, income and expense items denominated in foreign currencies are translated into U.S. dollars at the exchange rate in effect on the transaction date. Portfolio securities and assets and liabilities denominated in foreign currencies contain risks that those currencies will decline in value relative to the U.S. dollar. Occasionally, events may impact the availability or reliability of foreign exchange rates used to convert the U.S. dollar equivalent value. If such an event occurs, the foreign exchange rate will be valued at fair value using procedures established and approved by the Trust’s Board of Trustees.
The Fund does not separately report the effect of changes in foreign exchange rates from changes in market prices on securities held. Such changes are included in net realized and unrealized gain or loss from investments on the Statement of Operations.
Realized foreign exchange gains or losses arise from sales of foreign currencies, currency gains or losses realized between the trade and settlement dates on securities transactions and the difference between the recorded amounts of dividends, interest, and foreign withholding taxes and the U.S. dollar equivalent of the amounts actually received or paid. Net unrealized foreign exchange gains and losses arise from changes in foreign exchange rates on foreign denominated assets and liabilities other than investments in securities held at the end of the reporting period.
c. Securities Lending
The Fund participates in an agency based security lending program. The Fund receives cash collateral against the loaned securities in an amount equal to at least 102% of the market value of the loaned securities. Collateral is maintained over the life of the loan in an amount not less than 100% of the market value of loaned securities, as determined at the close of Fund business each day; any additional collateral required due to changes in security values is delivered to the Fund on the next business day. The collateral is invested in a money market fund managed by the Fund’s custodian on the fund’s behalf. The Fund receives income from the investment of cash collateral, in addition to lending fees and rebates paid by the borrower. The Fund bears the market risk with respect to the collateral investment, securities loaned, and the risk that the agent may default on its obligations to the Fund. The securities lending agent has agreed to indemnify the Fund in the event of default by a third party borrower.
d. Income Taxes
It is the Fund’s policy to qualify as a regulated investment company under the Internal Revenue Code. The Fund intends to distribute to shareholders substantially all of its taxable income and net realized gains to relieve it from federal income and excise taxes. As a result, no provision for U.S. federal income taxes is required.
The Fund may be subject to foreign taxation related to income received, capital gains on the sale of securities and certain foreign currency transactions in the foreign jurisdictions in which it invests. Foreign taxes, if any, are recorded based on the tax regulations and rates that exist in the foreign markets in which the Fund invests. When a capital gain tax is determined to apply the Fund records an estimated deferred tax liability in an amount that would be payable if the securities were disposed of on the valuation date.
The Fund recognizes the tax benefits of uncertain tax positions only when the position is “more likely than not” to be sustained upon examination by the tax authorities based on the technical merits of the tax position. As of December 31, 2011, and for all open tax years, the Fund has determined that no liability for unrecognized tax benefits is required in the Fund’s financial statements related to uncertain tax positions taken on a tax return (or expected to be taken on future tax returns). Open tax years are those that remain subject to examination and are based on each tax jurisdiction statute of limitation.
TF-21
Franklin Templeton Variable Insurance Products Trust
Notes to Financial Statements (continued)
Templeton Foreign Securities Fund
1. ORGANIZATION AND SIGNIFICANT ACCOUNTING POLICIES (continued)
e. Security Transactions, Investment Income, Expenses and Distributions
Security transactions are accounted for on trade date. Realized gains and losses on security transactions are determined on a specific identification basis . Estimated expenses are accrued daily. Dividend income is recorded on the ex-dividend date except that certain dividends from foreign securities are recognized as soon as the Fund is notified of the ex-dividend date. Distributions to shareholders are recorded on the ex-dividend date and are determined according to income tax regulations (tax basis). Distributable earnings determined on a tax basis may differ from earnings recorded in accordance with accounting principles generally accepted in the United States of America. These differences may be permanent or temporary. Permanent differences are reclassified among capital accounts to reflect their tax character. These reclassifications have no impact on net assets or the results of operations. Temporary differences are not reclassified, as they may reverse in subsequent periods.
Common expenses incurred by the Trust are allocated among the funds based on the ratio of net assets of each fund to the combined net assets of the Trust. Fund specific expenses are charged directly to the fund that incurred the expense.
Realized and unrealized gains and losses and net investment income, not including class specific expenses, are allocated daily to each class of shares based upon the relative proportion of net assets of each class. Differences in per share distributions, by class, are generally due to differences in class specific expenses.
f. Accounting Estimates
The preparation of financial statements in accordance with accounting principles generally accepted in the United States of America requires management to make estimates and assumptions that affect the reported amounts of assets and liabilities at the date of the financial statements and the amounts of income and expenses during the reporting period. Actual results could differ from those estimates.
g. Redemption Fees
Redemptions and exchanges of interests in an insurance company subaccount that invests in Class 3 shares of the Fund will be subject to a 1.0% short term trading fee if the interest in the subaccount has been held for less than 60 days. Such fees are retained by the Fund and accounted for as an addition to paid-in capital, allocated to each class of shares based upon the relative proportion of net assets of each class.
h. Guarantees and Indemnifications
Under the Trust’s organizational documents, its officers and trustees are indemnified by the Trust against certain liabilities arising out of the performance of their duties to the Trust. Additionally, in the normal course of business, the Trust, on behalf of the Fund, enters into contracts with service providers that contain general indemnification clauses. The Trust’s maximum exposure under these arrangements is unknown as this would involve future claims that may be made against the Trust that have not yet occurred. Currently, the Trust expects the risk of loss to be remote.
TF-22
Franklin Templeton Variable Insurance Products Trust
Notes to Financial Statements (continued)
Templeton Foreign Securities Fund
2. SHARES OF BENEFICIAL INTEREST
At December 31, 2011, there were an unlimited number of shares authorized (without par value). Transactions in the Fund’s shares were as follows:
| | | | | | | | | | | | | | | | |
| | | Year Ended December 31, | |
| | | 2011 | | | 2010 | |
| Class 1 Shares: | | Shares | | | Amount | | | Shares | | | Amount | |
Shares sold | | | 596,966 | | | $ | 8,620,768 | | | | 1,834,739 | | | $ | 24,009,210 | |
Shares issued in reinvestment of distributions | | | 392,832 | | | | 5,782,491 | | | | 500,533 | | | | 6,186,591 | |
Shares redeemed | | | (3,184,900 | ) | | | (45,808,142 | ) | | | (3,507,687 | ) | | | (46,586,826 | ) |
| | | | |
Net increase (decrease) | | | (2,195,102 | ) | | $ | (31,404,883 | ) | | | (1,172,415 | ) | | $ | (16,391,025 | ) |
| | | | |
Class 2 Shares: | | | | | | | | | | | | | | | | |
Shares sold | | | 14,900,290 | | | $ | 201,768,630 | | | | 24,359,823 | | | $ | 304,453,001 | |
Shares issued in reinvestment of distributions | | | 2,300,359 | | | | 33,309,204 | | | | 2,950,664 | | | | 35,909,578 | |
Shares redeemed | | | (29,726,460 | ) | | | (418,859,438 | ) | | | (30,526,296 | ) | | | (397,048,706 | ) |
| | | | |
Net increase (decrease) | | | (12,525,811 | ) | | $ | (183,781,604 | ) | | | (3,215,809 | ) | | $ | (56,686,127 | ) |
| | | | |
Class 3 Shares: | | | | | | | | | | | | | | | | |
Shares sold | | | 712,054 | | | $ | 9,594,087 | | | | 488,049 | | | $ | 6,145,010 | |
Shares issued in reinvestment of distributions | | | 121,227 | | | | 1,749,311 | | | | 143,421 | | | | 1,738,264 | |
Shares redeemed | | | (1,406,375 | ) | | | (19,926,563 | ) | | | (1,625,745 | ) | | | (21,016,528 | ) |
| | | | |
Net increase (decrease) | | | (573,094 | ) | | $ | (8,583,165 | ) | | | (994,275 | ) | | $ | (13,133,254 | ) |
| | | | |
Class 4 Shares: | | | | | | | | | | | | | | | | |
Shares sold | | | 10,343,049 | | | $ | 143,108,311 | | | | 19,836,996 | | | $ | 240,414,850 | |
Shares issued on reinvestment of distributions | | | 408,643 | | | | 5,966,192 | | | | 94,309 | | | | 1,159,055 | |
Shares redeemed | | | (4,003,106 | ) | | | (56,309,140 | ) | | | (2,328,115 | ) | | | (30,766,371 | ) |
| | | | |
Net increase (decrease) | | | 6,748,586 | | | $ | 92,765,363 | | | | 17,603,190 | | | $ | 210,807,534 | |
| | | | |
3. TRANSACTIONS WITH AFFILIATES
Franklin Resources, Inc. is the holding company for various subsidiaries that together are referred to as Franklin Templeton Investments. Certain officers and trustees of the Fund are also officers and/or directors of the following subsidiaries:
| | |
| Subsidiary | | Affiliation |
Templeton Investment Counsel, LLC (TIC) | | Investment manager |
Franklin Templeton Services, LLC (FT Services) | | Administrative manager |
Franklin Templeton Distributors, Inc. (Distributors) | | Principal underwriter |
Franklin Templeton Investor Services, LLC (Investor Services) | | Transfer agent |
a. Management Fees
The Fund pays an investment management fee to TIC based on the average daily net assets of the Fund as follows:
| | |
| Annualized Fee Rate | | Net Assets |
| 0.750% | | Up to and including $200 million |
| 0.675% | | Over $200 million, up to and including $1.3 billion |
| 0.600% | | Over $1.3 billion, up to and including $10 billion |
| 0.580% | | Over $10 billion, up to and including $15 billion |
| 0.560% | | Over $15 billion, up to and including $20 billion |
| 0.540% | | In excess of $20 billion |
TF-23
Franklin Templeton Variable Insurance Products Trust
Notes to Financial Statements (continued)
Templeton Foreign Securities Fund
3. TRANSACTIONS WITH AFFILIATES (continued)
b. Administrative Fees
The Fund pays an administrative fee to FT Services based on the Fund’s average daily net assets as follows:
| | |
| Annualized Fee Rate | | Net Assets |
| 0.150% | | Up to and including $200 million |
| 0.135% | | Over $200 million, up to and including $700 million |
| 0.100% | | Over $700 million, up to and including $1.2 billion |
| 0.075% | | In excess of $1.2 billion |
c. Distribution Fees
The Fund’s Board of Trustees has adopted distribution plans for Class 2, Class 3, and Class 4 shares pursuant to Rule 12b-1 under the 1940 Act. Under the Fund’s compensation distribution plans, the Fund pays Distributors for costs incurred in connection with the servicing, sale and distribution of the Fund’s shares up to 0.25%, 0.35%, and 0.35% per year of its average daily net assets of Class 2, Class 3, and Class 4, respectively. The Board of Trustees has agreed to limit the current rate to 0.25% per year for Class 3.
d. Transfer Agent Fees
Investor Services, under terms of an agreement, performs shareholder servicing for the Fund and is not paid by the Fund for the services.
4. EXPENSE OFFSET ARRANGEMENT
The Fund has entered into an arrangement with its custodian whereby credits realized as a result of uninvested cash balances are used to reduce a portion of the Fund’s custodian expenses. During the year ended December 31, 2011, the custodian fees were reduced as noted in the Statement of Operations.
5. INCOME TAXES
For tax purposes, capital losses may be carried over to offset future capital gains, if any. Under the Regulated Investment Company Modernization Act of 2010, capital losses incurred by the Fund in taxable years beginning after December 22, 2010 are not subject to expiration and such losses retain their character as either short-term or long-term, rather than being considered short-term as under previous law. Post-enactment capital losses must be fully utilized prior to utilizing any losses incurred in pre-enactment tax years.
At December 31, 2011, the Fund had capital loss carryforwards of $128,971,444 expiring in 2017. During the year ended December 31, 2011, the Fund utilized $136,320,840 of capital loss carryforwards.
The tax character of distributions paid during the years ended December 31, 2011 and 2010, was as follows:
| | | | | | | | |
| | | 2011 | | | 2010 | |
Distributions paid from ordinary income | | $ | 46,807,198 | | | $ | 44,993,488 | |
| | | | |
TF-24
Franklin Templeton Variable Insurance Products Trust
Notes to Financial Statements (continued)
Templeton Foreign Securities Fund
5. INCOME TAXES (continued)
At December 31, 2011, the cost of investments, net unrealized appreciation (depreciation), undistributed ordinary income for income tax purposes were as follows:
| | | | |
Cost of investments | | $ | 2,509,847,444 | |
| | | | |
| |
Unrealized appreciation | | $ | 303,823,609 | |
Unrealized depreciation | | | (441,544,917 | ) |
| | | | |
Net unrealized appreciation (depreciation) | | $ | (137,721,308 | ) |
| | | | |
Distributable earnings – undistributed ordinary income | | $ | 73,012,989 | |
| | | | |
Differences between income and/or capital gains as determined on a book basis and a tax basis are primarily due to differing treatment of pass-through entity income.
6. INVESTMENT TRANSACTIONS
Purchases and sales of investments (excluding short term securities) for the year ended December 31, 2011, aggregated $555,333,584 and $693,180,056, respectively.
7. INVESTMENTS IN INSTITUTIONAL FIDUCIARY TRUST MONEY MARKET PORTFOLIO
The Fund invests in the Institutional Fiduciary Trust Money Market Portfolio (Sweep Money Fund), an open-end investment company managed by Franklin Advisers, Inc. (an affiliate of the investment manager). Management fees paid by the Fund are reduced on assets invested in the Sweep Money Fund, in an amount not to exceed the management and administrative fees paid by the Sweep Money Fund.
8. CONCENTRATION OF RISK
Investing in foreign securities may include certain risks and considerations not typically associated with investing in U.S. securities, such as fluctuating currency values and changing local and regional economic, political and social conditions, which may result in greater market volatility. In addition, certain foreign securities may not be as liquid as U.S. securities.
9. CREDIT FACILITY
The Fund, together with other U.S. registered and foreign investment funds (collectively, Borrowers), managed by Franklin Templeton Investments, are borrowers in a joint syndicated senior unsecured credit facility totaling $750 million (Global Credit Facility) which matured on January 20, 2012. This Global Credit Facility provides a source of funds to the Borrowers for temporary and emergency purposes, including the ability to meet future unanticipated or unusually large redemption requests. Effective January 20, 2012, the Borrowers renewed the Global Credit Facility for a total of $1.5 billion, maturing January 18, 2013.
Under the terms of the Global Credit Facility, the Fund shall, in addition to interest charged on any borrowings made by the Fund and other costs incurred by the Fund, pay its share of fees and expenses incurred in connection with the implementation and maintenance of the Global Credit Facility, based upon its relative share of the aggregate net assets of all of the Borrowers, including an annual commitment fee of 0.08% based upon the unused portion of the Global Credit Facility, which is reflected in other expenses on the Statement of Operations. During the year ended December 31, 2011, the Fund did not use the Global Credit Facility.
TF-25
Franklin Templeton Variable Insurance Products Trust
Notes to Financial Statements (continued)
Templeton Foreign Securities Fund
10. FAIR VALUE MEASUREMENTS
The Fund follows a fair value hierarchy that distinguishes between market data obtained from independent sources (observable inputs) and the Fund’s own market assumptions (unobservable inputs). These inputs are used in determining the value of the Fund’s investments and are summarized in the following fair value hierarchy:
| | • | | Level 1 – quoted prices in active markets for identical securities |
| | • | | Level 2 – other significant observable inputs (including quoted prices for similar securities, interest rates, prepayment speed, credit risk, etc.) |
| | • | | Level 3 – significant unobservable inputs (including the Fund’s own assumptions in determining the fair value of investments) |
The inputs or methodology used for valuing securities are not an indication of the risk associated with investing in those securities.
For movements between the levels within the fair value hierarchy, the Fund has adopted a policy of recognizing the transfers as of the date of the underlying event which caused the movement.
The following is a summary of the inputs used as of December 31, 2011, in valuing the Fund’s assets and liabilities carried at fair value:
| | | | | | | | | | | | | | | | |
| | | Level 1 | | | Level 2 | | | Level 3 | | | Total | |
| | | | |
Assets: | | | | | | | | | | | | | | | | |
Investments in Securities | | | | | | | | | | | | | | | | |
Equity Investmentsa,b | | $ | 2,265,813,180 | | | $ | — | | | $ | — | | | $ | 2,265,813,180 | |
Short Term Investments | | | 106,174,453 | | | | 138,503 | | | | — | | | | 106,312,956 | |
| | | | |
Total Investments in Securities | | $ | 2,371,987,633 | | | $ | 138,503 | | | $ | — | | | $ | 2,372,126,136 | |
| | | | |
aIncludes common and preferred stock as well as other equity investments.
bFor detailed categories, see the accompanying Statement of Investments.
11. NEW ACCOUNTING PRONOUNCEMENTS
In May 2011, the Financial Accounting Standards Board (FASB) issued Accounting Standards Update (ASU) No. 2011-04, Fair Value Measurement (Topic 820): Amendments to Achieve Common Fair Value Measurement and Disclosure Requirements in U.S. GAAP and IFRSs. The amendments in the ASU will improve the comparability of fair value measurements presented and disclosed in financial statements prepared in accordance with U.S. GAAP (Generally Accepted Accounting Principles) and IFRS (International Financial Reporting Standards) and include new guidance for certain fair value measurement principles and disclosure requirements. The ASU is effective for interim and annual periods beginning after December 15, 2011. The Fund believes the adoption of this ASU will not have a material impact on its financial statements.
12. SUBSEQUENT EVENTS
The Fund has evaluated subsequent events through the issuance of the financial statements and determined that no events have occurred that require disclosure other than those already disclosed in the financial statements.
| | |
ABBREVIATIONS | | |
| Selected Portfolio | | |
| | |
| ADR - American Depositary Receipt | | |
TF-26
Franklin Templeton Variable Insurance Products Trust
Templeton Foreign Securities Fund
Report of Independent Registered Public Accounting Firm
To the Board of Trustees and Shareholders of
Franklin Templeton Variable Insurance Products Trust
In our opinion, the accompanying statement of assets and liabilities, including the statement of investments, and the related statements of operations and of changes in net assets and the financial highlights present fairly, in all material respects, the financial position of Templeton Foreign Securities Fund (the “Fund”) at December 31, 2011, the results of its operations for the year then ended, the changes in its net assets for each of the two years in the period then ended and the financial highlights for the periods presented, in conformity with accounting principles generally accepted in the United States of America. These financial statements and financial highlights (hereafter referred to as “financial statements”) are the responsibility of the Fund’s management. Our responsibility is to express an opinion on these financial statements based on our audits. We conducted our audits of these financial statements in accordance with the standards of the Public Company Accounting Oversight Board (United States). Those standards require that we plan and perform the audit to obtain reasonable assurance about whether the financial statements are free of material misstatement. An audit includes examining, on a test basis, evidence supporting the amounts and disclosures in the financial statements, assessing the accounting principles used and significant estimates made by management, and evaluating the overall financial statement presentation. We believe that our audits, which included confirmation of securities at December 31, 2011 by correspondence with the custodian and brokers, provide a reasonable basis for our opinion.
PricewaterhouseCoopers LLP
San Francisco, California
February 13, 2012
TF-27
Franklin Templeton Variable Insurance Products Trust
Tax Information (unaudited)
Templeton Foreign Securities Fund
At December 31, 2011, more than 50% of the Fund’s total assets were invested in securities of foreign issuers. In most instances, foreign taxes were withheld from income paid to the Fund on these investments. The Fund elects to treat foreign taxes paid as allowed under Section 853 of the Internal Revenue Code. This election will allow shareholders of record as of the 2012 distribution date, to treat their proportionate share of foreign taxes paid by the Fund as having been paid directly by them. The shareholder shall consider these amounts as foreign taxes paid in the tax year in which they receive the Fund distribution.
TF-28
TEMPLETON GLOBAL BOND SECURITIES FUND
This annual report for Templeton Global Bond Securities Fund covers the fiscal year ended December 31, 2011.
Performance Summary as of 12/31/11
Average annual total return of Class 3 shares* represents the average annual change in value, assuming reinvestment of dividends and capital gains. Average returns smooth out variations in returns, which can be significant; they are not the same as year-by-year results.
Periods ended 12/31/11
| | | | | | | | | | | | |
| | | 1-Year | | | 5-Year | | | 10-Year | |
Average Annual Total Return | | | -0.83% | | | | +9.68% | | | | +11.44% | |
*Class 3 performance prior to 4/1/05 reflects historical Class 2 performance. Since 4/1/05 (effective date), the average annual total return of Class 3 shares was +8.89%.
Total Return Index Comparison for a Hypothetical $10,000 Investment (1/1/02–12/31/11)
The graph below shows the change in value of a hypothetical $10,000 investment in the Fund over the indicated period and includes reinvestment of any income or distributions. The Fund’s performance* is compared to the performance of the J.P. Morgan (JPM) Global Government Bond Index (GGBI), the Citigroup World Government Bond Index (WGBI) and the Consumer Price Index (CPI). One cannot invest directly in an index, and an index is not representative of the Fund’s portfolio. Please see Important Notes to Performance Information preceding the Fund Summaries.
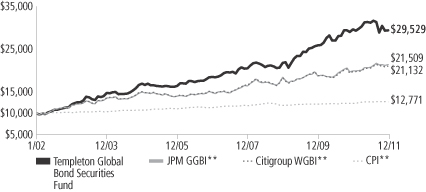
**Source: © 2012 Morningstar. Please see Index Descriptions following the Fund Summaries.
Templeton Global Bond Securities Fund – Class 3
Performance reflects the Fund’s Class 3 operating expenses, but does not include any contract fees, expenses or sales charges. If they had been included, performance would be lower. These charges and deductions, particularly for variable life policies, can have a significant effect on contract values and insurance benefits. See the contract prospectus for a complete description of these expenses, including sales charges.
Performance data represent past performance, which does not guarantee future results. Investment return and principal value will fluctuate, and you may have a gain or loss when you sell your shares.
Current performance may differ from figures shown.
TGB-1
Fund Goal and Main Investments: Templeton Global Bond Securities Fund seeks high current income, consistent with preservation of capital, with capital appreciation as a secondary consideration. The Fund normally invests at least 80% of its net assets in bonds, which include debt securities of any maturity, such as bonds, notes, bills and debentures.
Performance Overview
You can find the Fund’s one-year total return in the Performance Summary. The Fund underperformed its benchmarks, the JPM GGBI, which posted a +7.22% total return in U.S. dollar terms, and the Citigroup WGBI, which produced a +6.35% total return for the same period.1
Economic and Market Overview
Early in the year under review, emerging markets continued to lead the global recovery as several emerging economies returned to or exceeded their respective pre-crisis activity levels. Where recoveries were strong, monetary authorities tightened policy as output gaps closed and early indicators of inflationary pressure became more pronounced. In much of the developed world, however, economic growth was below trend and significant slack remained. Although some developed economies, such as those of Australia and some Scandinavian nations, enjoyed relatively strong recoveries, growth in the G-3 (U.S., eurozone and Japan) was slow by the standards of previous recoveries. Therefore, G-3 policymakers sought to maintain historically accommodative monetary policy.
This divergence in economic conditions and the subsequent policy responses supported a further increase of capital flows to emerging markets. Although increased foreign investment supported recovery in these economies, it also prompted fears of potential asset price bubbles, economic overheating and currency overvaluation. Overall, these conditions supported risk assets, as equity markets performed well and bond yields generally rose for much of the period.
Toward the latter half of the year, softer economic reports in most advanced and some emerging economies raised concerns that the global recovery might be faltering. Markets seemed to price in an end to the current recovery phase rather than a mid-business-cycle slowdown. However, neither the traditional signs of U.S. overcapacity nor evidence
1. Source: © 2012 Morningstar. One cannot invest directly in an index, and an index is not representative of the Fund’s portfolio. Please see Index Descriptions following the Fund Summaries.
Fund Risks: All investments involve risks. Because the Fund invests in bonds and other debt obligations, its share price and yield will be affected by interest rate movements. Bond prices generally move in the opposite direction of interest rates. Thus, as prices of bonds in the Fund adjust to a rise in interest rates, the Fund’s share price may decline. High yield, lower rated (junk) bonds generally have greater price swings and higher default risks than investment-grade bonds. Foreign investing, especially in emerging or developing markets, involves additional risks, including currency fluctuations, economic instability, market volatility, and political and social instability. The Fund’s investment in certain hedging and derivative instruments may involve a small investment relative to the risk assumed. As a nondiversified fund, the Fund may be more sensitive to economic, business, political or other changes affecting similar issuers or securities, which may result in greater fluctuation in the value of the Fund’s shares. The Fund is actively managed but there is no guarantee that the manager’s investment decisions will produce the desired results. The Fund’s prospectus also includes a description of the main investment risks.
TGB-2
of housing or other asset bubbles were present. Despite strong fundamentals, corporations remained restrained in hiring and capacity-building and a tendency toward leaner staffing stymied recovery in the labor market. We were not surprised by this soft patch in the recovery, given the degree of leverage that had developed in the system in the years leading up to the global financial crisis. There was some moderation in the trajectories of emerging economies, but we believe this allowed growth to ease to more sustainable levels and reduced the potential for overheating.
Economic performance in Asia excluding Japan was stronger than in other regions, even as economic activity in the region showed signs of moderating toward the end of the Fund’s fiscal year.
In the third quarter of 2011, real gross domestic product (GDP) grew 9.1% in China, 5.8% in Malaysia and 3.5% in South Korea from the same period a year ago.2 Asian policymakers generally tightened monetary policy as measures of economic slack decreased. China reined in liquidity seeking to prevent the formation of asset bubbles and to encourage a more sustainable economic growth rate. Elsewhere in the region, policymakers hiked interest rates 225 basis points (bps; 100 bps equal one percentage point) in India, 75 bps in South Korea, 50 bps in the Philippines and 25 bps in Malaysia. In contrast, third-quarter year-over-year GDP growth was 1.5% in the U.S., 1.3% in the eurozone and -0.7% in Japan, leading U.S. and Japanese policymakers to maintain historically low interest rates.3
Against this economic backdrop, markets absorbed several shocks throughout the review period. Populist uprisings in Tunisia, Egypt and Libya led to the fall of those countries’ long-time rulers and helped inspire a wave of regional unrest. An earthquake and subsequent tsunami struck serious blows to Japan’s economy and led to global supply-chain disruptions. Global economic activity began to normalize as Japan began reconstruction and firms attempted to recover. These events contributed to significant short-term market volatility. Particularly, oil prices rose during the period as Libyan exports declined and investors became skittish due to fears about the potential effects of regional instability.
2. Sources: National Bureau of Statistics (China), Department of Statistics (Malaysia), Bank of Korea (South Korea).
3. Sources: Bureau of Economic Analysis (U.S.), Eurostat (eurozone), Economic and Social Research Institute (Japan).
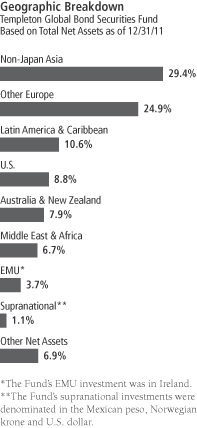
TGB-3
Separately, concerns about the solvency of highly indebted eurozone governments resurfaced as policymakers struggled to develop a coordinated plan to address the significant fiscal challenges in Ireland, Portugal, Greece, Spain and Italy. The persistent eurozone sovereign debt crisis contributed to periods of elevated risk aversion, during which yields declined, equity markets sold off and perceived safe-haven assets rallied. These alternated with periods of heightened risk appetite, during which yields increased and investors again favored risk assets. Meanwhile, an extended and confrontational debate in Congress regarding an increase to the U.S. debt ceiling led Standard & Poor’s to downgrade its rating of long-term U.S. sovereign debt. The downgrade elevated investor risk aversion, and this sentiment became particularly strong in September as the eurozone crisis spread to Italy. Toward the end of the year, the European Central Bank (ECB) announced two long-term refinancing operations (LTRO), a broadening of the collateral pool, and a decrease in reserve requirements. The impact of these operations was a 20% increase in the ECB balance sheet over the fourth quarter. In the first of the two LTROs alone, the ECB injected nearly 500 billion euros into the banking sector overnight with the aim of easing pressure on the credit markets and mitigating the risk of financial contagion.
Investment Strategy
We invest selectively in bonds around the world based upon our assessment of changing market, political and economic conditions. While seeking opportunities, we monitor various factors including changes in interest rates, currency exchange rates and credit risks. We seek to manage the Fund’s exposure to various currencies and may utilize currency forward contracts.
Manager’s Discussion
The Fund’s total return was influenced by various factors, including interest rate developments, currency movements and exposure to sovereign debt markets. During the period under review, interest rate strategies and sovereign credit exposures contributed to absolute results, while currency positions detracted.
Interest Rate Strategy
During the Fund’s fiscal year, we shortened the portfolio’s duration as many policymakers around the world, including in the eurozone, hiked interest rates in attempts to prevent potential inflationary effects and as concerns grew surrounding the sustainability of historically
What is a currency forward contract?
A currency forward contract is an agreement between the Fund and a counterparty to buy or sell a foreign currency for a specific exchange rate on a future date.
What is duration?
Duration is a measure of a bond’s price sensitivity to interest rate changes. In general, a portfolio of securities with a lower duration can be expected to be less sensitive to interest rate changes than a portfolio with a higher duration.
TGB-4
accommodative monetary and fiscal policies in the U.S. By period-end, we generally held shorter duration positioning in Latin America, given our outlook for some countries to tighten interest rates in the region. With U.S. and Japanese interest rates at historically low levels, the Federal Reserve (Fed) and Bank of Japan supplying significant liquidity to the financial sector, and rising fiscal deficits in both countries, we saw limited value in American and Japanese government bonds. Our exposure to these countries detracted from relative performance as yields did not increase significantly during the review period. The Fund maintained little duration exposure in emerging markets, except in a select few countries where rates were already quite high. The decline of long-term bond yields in Latin America and Asia excluding Japan, and the correspondingly high returns generated by our holdings in these regions, contributed to relative performance.
Currency Strategy
The Fund’s diversified currency exposure overall detracted from relative performance. As part of the Fund’s investment strategy, the Fund utilized currency forward contracts to hedge or gain exposure to various currencies during the review period. The U.S. dollar was broadly unchanged during the year even as most foreign economies grew at faster rates and attracted more substantial foreign investment than the U.S. economy. For the year, the U.S. dollar rose 0.18% against its major trading partners.4 The dollar was particularly weak early in the period as the market priced in Fed Chairman Bernanke’s announcement of a second round of quantitative easing shortly before 2011 began.
However, as the sovereign debt crisis in Europe played out, risk aversion increased among investors, contributing to a depreciation of most currencies against those of the largest developed economies. The U.S. dollar, historically seen as a safe-haven asset, appreciated as a result of this trend. The Fund’s currency exposures to Latin America detracted from absolute performance. During the fiscal year, the Mexican peso depreciated 11.62% against the U.S. dollar, underperforming the Brazilian real and Chilean peso, which were down 11.00% and 9.91% against the U.S. dollar, respectively.5
The Fund’s exposure to Asian currencies also detracted from performance during the period. The Japanese yen gained 5.41%5 against the U.S. dollar during the period as yields on 10-year U.S. government
4. Source: Federal Reserve H10 Report.
5. Source: IDC/Exshare.
Currency Breakdown
Templeton Global Bond Securities Fund
12/31/11
| | | | |
| | | % of Total Net Assets | |
| |
Americas | | | 58.3% | |
| U.S. Dollar | | | 42.6% | |
| Mexican Peso | | | 6.7% | |
| Chilean Peso | | | 5.3% | |
| Brazilian Real | | | 3.5% | |
| Peruvian Nuevo Sol | | | 0.2% | |
| |
Asia Pacific | | | 41.8% | |
| South Korean Won | | | 14.7% | |
| Malaysian Ringgit | | | 10.8% | |
| Australian Dollar | | | 10.4% | |
| Singapore Dollar | | | 7.7% | |
| Indonesian Rupiah | | | 6.7% | |
| Philippine Peso | | | 4.6% | |
| Indian Rupee | | | 3.6% | |
| Sri Lankan Rupee | | | 1.6% | |
| Japanese Yen* | | | -18.3% | |
| |
Middle East & Africa | | | 4.0% | |
| New Israeli Shekel | | | 3.8% | |
| Egyptian Pound | | | 0.2% | |
| |
Europe* | | | -4.1% | |
| Swedish Krona | | | 11.1% | |
| Polish Zloty | | | 8.5% | |
| Norwegian Krone | | | 6.1% | |
| British Pound | | | 4.1% | |
| Hungarian Forint | | | 1.3% | |
| Euro* | | | -35.2% | |
*Holding is a negative percentage because of the Fund’s holdings of currency forward contracts.
The dollar value, number of shares or principal amount, and names of all portfolio holdings are listed in the Fund’s Statement of Investments.
TGB-5
bonds fell 141 bps. Our net negative yen exposure, through the use of currency forwards, hindered relative performance. While the Australian dollar appreciated 0.01% against the U.S. dollar, supported by high Chinese demand for Australian exports as well as domestic strength, currencies elsewhere in Asia excluding Japan declined against the U.S. dollar.5 Central Banks in South Korea and the Philippines tightened monetary policy as capital flowed into these economies, but the South Korean won and Philippine peso finished the period down 1.48% and 0.10% for the year, respectively, against the dollar.5 The Indian rupee, Indonesian rupiah and Malaysian ringgit depreciated 15.80%, 0.63% and 2.73%, respectively, against the U.S. dollar.5
The euro strengthened against the dollar as building inflationary pressures and the strength of large, regional economies such as Germany’s led the ECB to hike policy rates in the early part of 2011, although the rate hikes were subsequently reversed toward year-end. The euro depreciated 3.24% against the U.S. dollar for the year, and the Fund’s net negative position, through the use of currency forwards, added to relative performance.5 However, this effect was partially offset by the Fund’s exposure to some other European currencies that depreciated against the U.S. dollar. For example, the Polish zloty, Swedish krona and Norwegian krone depreciated 13.96%, 1.93% and 2.60%, respectively, against the U.S. dollar.5
Global Sovereign Debt Strategy
The Fund purchased investment grade and sub-investment grade hard currency-denominated sovereign debt that typically compensates for greater credit risk by offering higher yields relative to U.S. Treasury and European benchmark bonds. Although risk aversion during the year led spreads to widen between high yielding sovereign credits and the underlying “risk-free assets,” such as U.S. Treasuries and German bunds, declining yields on U.S. Treasuries and the correspondingly high returns from these positions led sovereign credit exposures to benefit the Fund’s relative performance overall. As financial markets began reflecting the underlying strength of emerging economies, governments of some countries traditionally considered emerging markets could borrow more cheaply than some eurozone members and, in several cases, U.S. states. U.S. dollar-denominated emerging market debt posted a total return of +8.46% during the period, as measured by the JPM Emerging Markets Bond Index (EMBI) Global.1 Sovereign
TGB-6
interest rate credit spreads rose 137 bps during the period.6 Regionally, Latin American sovereign debt posted a +13.43% total return, Asian debt a +9.04% total return, and central and eastern European debt a +2.19% total return, as measured by subindexes of the JPM EMBI Global.6
Thank you for your participation in the Templeton Global Bond Securities Fund. We look forward to serving your future investment needs.
6. Source: J.P. Morgan.
The foregoing information reflects our analysis, opinions and portfolio holdings as of December 31, 2011, the end of the reporting period. The way we implement our main investment strategies and the resulting portfolio holdings may change depending on factors such as market and economic conditions. These opinions may not be relied upon as investment advice or an offer for a particular security. The information is not a complete analysis of every aspect of any market, country, industry, security or the Fund. Statements of fact are from sources considered reliable, but the investment manager makes no representation or warranty as to their completeness or accuracy. Although historical performance is no guarantee of future results, these insights may help you understand our investment management philosophy.
TGB-7
Fund Expenses
As an investor in a variable insurance contract (Contract) that indirectly provides for investment in an underlying mutual fund, you can incur transaction and/or ongoing expenses at both the Fund level and the Contract level.
| • | | Transaction expenses can include sales charges (loads) on purchases, redemption fees, surrender fees, transfer fees and premium taxes. |
| • | | Ongoing expenses can include management fees, distribution and service (12b-1) fees, contract fees, annual maintenance fees, mortality and expense risk fees and other fees and expenses. All mutual funds and Contracts have some types of ongoing expenses. |
The expenses shown in the table are meant to highlight ongoing expenses at the Fund level only and do not include ongoing expenses at the Contract level, or transaction expenses at either the Fund or Contract level. While the Fund does not have transaction expenses, if the transaction and ongoing expenses at the Contract level were included, the expenses shown below would be higher. You should consult your Contract prospectus or disclosure document for more information.
The table shows Fund-level ongoing expenses and can help you understand these expenses and compare them with those of other mutual funds offered through the Contract. The table assumes a $1,000 investment held for the six months indicated. Please refer to the Fund prospectus for additional information on operating expenses.
Actual Fund Expenses
The first line (Actual) of the table provides actual account values and expenses. The “Ending Account Value” is derived from the Fund’s actual return, which includes the effect of ongoing Fund expenses, but does not include the effect of ongoing Contract expenses.
You can estimate the Fund-level expenses you incurred during the period by following these steps. Of course, your account value and expenses will differ from those in this illustration:
| 1. | Divide your account value by $1,000. |
If an account had an $8,600 value, then $8,600 ÷ $1,000 = 8.6.
| 2. | Multiply the result by the number under the heading “Fund-Level Expenses Incurred During Period.” |
If Fund-Level Expenses Incurred During Period were $7.50, then 8.6 x $7.50 = $64.50.
In this illustration, the estimated expenses incurred this period at the Fund level are $64.50.
Templeton Global Bond Securities Fund – Class 3
TGB-8
Hypothetical Example for Comparison with Other Mutual Funds
Information in the second line (Hypothetical) of the table can help you compare ongoing expenses of the Fund with those of other mutual funds offered through the Contract. This information may not be used to estimate the actual ending account balance or expenses you incurred during the period. The hypothetical “Ending Account Value” is based on the Fund’s actual expense ratio for each class and an assumed 5% annual rate of return before expenses, which does not represent the Fund’s actual return. The figure under the heading “Fund-Level Expenses Incurred During Period” shows the hypothetical expenses your account would have incurred under this scenario. You can compare this figure with the 5% hypothetical examples that appear in shareholder reports of other funds offered through a Contract.
| | | | | | | | | | | | |
| Class 3 | | Beginning
Account Value 7/1/11 | | | Ending
Account Value 12/31/11 | | | Fund-Level Expenses Incurred
During Period* 7/1/11–12/31/11 | |
Actual | | $ | 1,000 | | | $ | 941.90 | | | $ | 3.96 | |
Hypothetical (5% return before expenses) | | $ | 1,000 | | | $ | 1,021.12 | | | $ | 4.13 | |
*Expenses are calculated using the most recent six-month annualized expense ratio for the Fund’s Class 3 shares (0.81%), which does not include any ongoing expenses of the Contract for which the Fund is an investment option, multiplied by the average account value over the period, multiplied by 184/365 to reflect the one-half year period.
TGB-9
SUPPLEMENT DATED JANUARY 3, 2012
TOTHE PROSPECTUS
DATED MAY 1, 2011
TEMPLETON GLOBAL BOND SECURITIES FUND
(Franklin Templeton Variable Insurance Products Trust)
I. The “FUND SUMMARY – Principal Investment Strategies” and the “FUND DETAILS – Principal Investment Policies and Practices” sections are revised by adding the following:
For purposes of pursuing its investment goals, the Fund regularly uses various currency related transactions involving derivative instruments, principally currency and cross currency forwards, but may also use currency and currency index futures contracts. The Fund maintains significant positions in currency related derivative instruments as a hedging technique or to implement a currency investment strategy, which could expose a large amount of the Fund’s assets to obligations under the instruments. The use of these derivative transactions may allow the Fund to obtain net long or net negative (short) exposure to selected currencies.
II. The “FUND SUMMARY – Principal Risks” and the “FUND DETAILS – Principal Risks” sections are revised by adding the following:
Currency Management Strategies Currency management strategies may substantially change the Fund’s exposure to currency exchange rates and could result in losses to the Fund if currencies do not perform as the investment manager expects. In addition, currency management strategies, to the extent that they reduce the Fund’s exposure to currency risks, may also reduce the Fund’s ability to benefit from favorable changes in currency exchange rates. Using currency management strategies for purposes other than hedging further increases the Fund’s exposure to foreign investment losses. Currency markets generally are not as regulated as securities markets. In addition, currency rates may fluctuate significantly over short periods of time, and can reduce returns.
III. The “FUND SUMMARY – Principal Risks” and the “FUND DETAILS – Principal Risks” sections are revised by replacing the disclosure under the heading “Derivative Instruments” with the following:
Derivative Instruments The performance of derivative instruments (including currency related derivatives) depends largely on the performance of an underlying currency, security or index and such instruments often have risks similar to their underlying instrument, in addition to other risks. Derivatives involve costs and can create economic leverage in the portfolio which may result in significant volatility and cause the fund to participate in losses (as well as enable gains) on an amount that exceeds the Fund’s initial investment. Other risks include illiquidity in the Fund, mispricing or improper valuation, and imperfect correlation between the value of the derivative and the underlying instrument so that the Fund may not realize the intended benefits. When used for hedging, the change in value of the derivative may also not correlate specifically with the currency, security or other risk being hedged. With over-the-counter derivatives, there is the risk that the other party to the transaction will fail to perform.
Please keep this supplement for future reference.
TGB-10
Franklin Templeton Variable Insurance Products Trust
Financial Highlights
Templeton Global Bond Securities Fund
| | | | | | | | | | | | | | | | | | | | |
| | | Year Ended December 31, | |
| Class 1 | | 2011 | | | 2010 | | | 2009 | | | 2008 | | | 2007 | |
| | | | |
Per share operating performance | | | | | | | | | | | | | | | | | | | | |
(for a share outstanding throughout the year) | | | | | | | | | | | | | | | | | | | | |
Net asset value, beginning of year | | $ | 19.94 | | | $ | 17.72 | | | $ | 17.42 | | | $ | 17.00 | | | $ | 15.73 | |
| | | | |
Income from investment operationsa: | | | | | | | | | | | | | | | | | | | | |
Net investment incomeb | | | 0.87 | | | | 1.00 | | | | 0.99 | | | | 0.80 | | | | 0.77 | |
Net realized and unrealized gains (losses) | | | (0.92 | ) | | | 1.58 | | | | 2.01 | | | | 0.27 | | | | 0.97 | |
| | | | |
Total from investment operations | | | (0.05 | ) | | | 2.58 | | | | 3.00 | | | | 1.07 | | | | 1.74 | |
| | | | |
Less distributions from: | | | | | | | | | | | | | | | | | | | | |
Net investment income and net foreign currency gains | | | (1.15 | ) | | | (0.31 | ) | | | (2.70 | ) | | | (0.65 | ) | | | (0.47 | ) |
Net realized gains | | | (0.13 | ) | | | (0.05 | ) | | | — | | | | — | | | | — | |
| | | | |
Total distributions | | | (1.28 | ) | | | (0.36 | ) | | | (2.70 | ) | | | (0.65 | ) | | | (0.47 | ) |
| | | | |
Redemption feesc | | | — | | | | — | | | | — | | | | — | | | | — | |
| | | | |
Net asset value, end of year | | $ | 18.61 | | | $ | 19.94 | | | $ | 17.72 | | | $ | 17.42 | | | $ | 17.00 | |
| | | | |
| | | | | |
Total returnd | | | (0.61)% | | | | 14.71% | | | | 18.98% | | | | 6.46% | | | | 11.27% | |
Ratios to average net assets | | | | | | | | | | | | | | | | | | | | |
Expensese | | | 0.56% | | | | 0.55% | | | | 0.54% | | | | 0.58% | | | | 0.64% | |
Net investment income | | | 4.40% | | | | 5.27% | | | | 5.73% | | | | 4.66% | | | | 4.70% | |
| | | | | |
Supplemental data | | | | | | | | | | | | | | | | | | | | |
Net assets, end of year (000’s) | | $ | 269,819 | | | $ | 272,232 | | | $ | 195,662 | | | $ | 220,588 | | | $ | 137,700 | |
Portfolio turnover rate | | | 34.18% | | | | 8.77% | | | | 20.84% | | | | 28.46% | | | | 47.33% | |
aThe amount shown for a share outstanding throughout the period may not correlate with the Statement of Operations for the period due to the timing of sales and repurchases of the Fund shares in relation to income earned and/or fluctuating market value of the investments of the Fund.
bBased on average daily shares outstanding.
cAmount rounds to less than $0.01 per share.
dTotal return does not include fees, charges or expenses imposed by the variable annuity and life insurance contracts for which the Franklin Templeton Variable Insurance Products Trust serves as an underlying investment vehicle.
eBenefit of expense reduction rounds to less than 0.01%.
The accompanying notes are an integral part of these financial statements.
TGB-11
Franklin Templeton Variable Insurance Products Trust
Financial Highlights (continued)
Templeton Global Bond Securities Fund
| | | | | | | | | | | | | | | | | | | | |
| | | Year Ended December 31, | |
| Class 2 | | 2011 | | | 2010 | | | 2009 | | | 2008 | | | 2007 | |
| | | | |
Per share operating performance | | | | | | | | | | | | | | | | | | | | |
(for a share outstanding throughout the year) | | | | | | | | | | | | | | | | | | | | |
Net asset value, beginning of year | | $ | 19.49 | | | $ | 17.34 | | | $ | 17.10 | | | $ | 16.72 | | | $ | 15.50 | |
| | | | |
Income from investment operationsa: | | | | | | | | | | | | | | | | | | | | |
Net investment incomeb | | | 0.79 | | | | 0.93 | | | | 0.93 | | | | 0.74 | | | | 0.72 | |
Net realized and unrealized gains (losses) | | | (0.89 | ) | | | 1.54 | | | | 1.98 | | | | 0.27 | | | | 0.96 | |
| | | | |
Total from investment operations | | | (0.10 | ) | | | 2.47 | | | | 2.91 | | | | 1.01 | | | | 1.68 | |
| | | | |
Less distributions from: | | | | | | | | | | | | | | | | | | | | |
Net investment income and net foreign currency gains | | | (1.11 | ) | | | (0.27 | ) | | | (2.67 | ) | | | (0.63 | ) | | | (0.46 | ) |
Net realized gains | | | (0.13 | ) | | | (0.05 | ) | | | — | | | | — | | | | — | |
| | | | |
Total distributions | | | (1.24 | ) | | | (0.32 | ) | | | (2.67 | ) | | | (0.63 | ) | | | (0.46 | ) |
| | | | |
Redemption feesc | | | — | | | | — | | | | — | | | | — | | | | — | |
| | | | |
Net asset value, end of year | | $ | 18.15 | | | $ | 19.49 | | | $ | 17.34 | | | $ | 17.10 | | | $ | 16.72 | |
| | | | |
| | | | | |
Total returnd | | | (0.87)% | | | | 14.45% | | | | 18.68% | | | | 6.21% | | | | 11.00% | |
Ratios to average net assets | | | | | | | | | | | | | | | | | | | | |
Expensese | | | 0.81% | | | | 0.80% | | | | 0.79% | | | | 0.83% | | | | 0.89% | |
Net investment income | | | 4.15% | | | | 5.02% | | | | 5.48% | | | | 4.41% | | | | 4.45% | |
| | | | | |
Supplemental data | | | | | | | | | | | | | | | | | | | | |
Net assets, end of year (000’s) | | $ | 1,812,814 | | | $ | 1,490,794 | | | $ | 1,262,783 | | | $ | 793,773 | | | $ | 480,649 | |
Portfolio turnover rate | | | 34.18% | | | | 8.77% | | | | 20.84% | | | | 28.46% | | | | 47.33% | |
aThe amount shown for a share outstanding throughout the period may not correlate with the Statement of Operations for the period due to the timing of sales and repurchases of the Fund shares in relation to income earned and/or fluctuating market value of the investments of the Fund.
bBased on average daily shares outstanding.
cAmount rounds to less than $0.01 per share.
dTotal return does not include fees, charges or expenses imposed by the variable annuity and life insurance contracts for which the Franklin Templeton Variable Insurance Products Trust serves as an underlying investment vehicle.
eBenefit of expense reduction rounds to less than 0.01%.
The accompanying notes are an integral part of these financial statements.
TGB-12
Franklin Templeton Variable Insurance Products Trust
Financial Highlights (continued)
Templeton Global Bond Securities Fund
| | | | | | | | | | | | | | | | | | | | |
| | | Year Ended December 31, | |
| Class 3 | | 2011 | | | 2010 | | | 2009 | | | 2008 | | | 2007 | |
| | | | |
Per share operating performance | | | | | | | | | | | | | | | | | | | | |
(for a share outstanding throughout the year) | | | | | | | | | | | | | | | | | | | | |
Net asset value, beginning of year | | $ | 19.48 | | | $ | 17.33 | | | $ | 17.08 | | | $ | 16.70 | | | $ | 15.49 | |
| | | | |
Income from investment operationsa: | | | | | | | | | | | | | | | | | | | | |
Net investment incomeb | | | 0.80 | | | | 0.93 | | | | 0.93 | | | | 0.74 | | | | 0.72 | |
Net realized and unrealized gains (losses) | | | (0.90 | ) | | | 1.54 | | | | 1.98 | | | | 0.27 | | | | 0.95 | |
| | | | |
Total from investment operations | | | (0.10 | ) | | | 2.47 | | | | 2.91 | | | | 1.01 | | | | 1.67 | |
| | | | |
Less distributions from: | | | | | | | | | | | | | | | | | | | | |
Net investment income and net foreign currency gains | | | (1.10 | ) | | | (0.27 | ) | | | (2.66 | ) | | | (0.63 | ) | | | (0.46 | ) |
Net realized gains | | | (0.13 | ) | | | (0.05 | ) | | | — | | | | — | | | | — | |
| | | | |
Total distributions | | | (1.23 | ) | | | (0.32 | ) | | | (2.66 | ) | | | (0.63 | ) | | | (0.46 | ) |
| | | | |
Redemption feesc | | | — | | | | — | | | | — | | | | — | | | | — | |
| | | | |
Net asset value, end of year | | $ | 18.15 | | | $ | 19.48 | | | $ | 17.33 | | | $ | 17.08 | | | $ | 16.70 | |
| | | | |
| | | | | |
Total returnd | | | (0.83)% | | | | 14.38% | | | | 18.69% | | | | 6.21% | | | | 11.03% | |
Ratios to average net assets | | | | | | | | | | | | | | | | | | | | |
Expensese | | | 0.81% | | | | 0.80% | | | | 0.79% | | | | 0.83% | | | | 0.89% | |
Net investment income | | | 4.15% | | | | 5.02% | | | | 5.48% | | | | 4.41% | | | | 4.45% | |
| | | | | |
Supplemental data | | | | | | | | | | | | | | | | | | | | |
Net assets, end of year (000’s) | | $ | 185,811 | | | $ | 183,380 | | | $ | 143,264 | | | $ | 128,155 | | | $ | 91,162 | |
Portfolio turnover rate | | | 34.18% | | | | 8.77% | | | | 20.84% | | | | 28.46% | | | | 47.33% | |
aThe amount shown for a share outstanding throughout the period may not correlate with the Statement of Operations for the period due to the timing of sales and repurchases of the Fund shares in relation to income earned and/or fluctuating market value of the investments of the Fund.
bBased on average daily shares outstanding.
cAmount rounds to less than $0.01 per share.
dTotal return does not include fees, charges or expenses imposed by the variable annuity and life insurance contracts for which the Franklin Templeton Variable Insurance Products Trust serves as an underlying investment vehicle.
eBenefit of expense reduction rounds to less than 0.01%.
The accompanying notes are an integral part of these financial statements.
TGB-13
Franklin Templeton Variable Insurance Products Trust
Financial Highlights (continued)
Templeton Global Bond Securities Fund
| | | | | | | | | | | | | | | | |
| | | Year Ended December 31, | |
| Class 4 | | 2011 | | | 2010 | | | 2009 | | | 2008a | |
| | | | |
Per share operating performance | | | | | | | | | | | | | | | | |
(for a share outstanding throughout the year) | | | | | | | | | | | | | | | | |
Net asset value, beginning of year | | $ | 19.78 | | | $ | 17.61 | | | $ | 17.37 | | | $ | 18.00 | |
| | | | |
Income from investment operationsb: | | | | | | | | | | | | | | | | |
Net investment incomec | | | 0.79 | | | | 0.93 | | | | 0.93 | | | | 0.66 | |
Net realized and unrealized gains (losses) | | | (0.91 | ) | | | 1.56 | | | | 2.00 | | | | (0.64 | ) |
| | | | |
Total from investment operations | | | (0.12 | ) | | | 2.49 | | | | 2.93 | | | | 0.02 | |
| | | | |
Less distributions from: | | | | | | | | | | | | | | | | |
Net investment income and net foreign currency gains | | | (1.09 | ) | | | (0.27 | ) | | | (2.69 | ) | | | (0.65 | ) |
Net realized gains | | | (0.13 | ) | | | (0.05 | ) | | | — | | | | — | |
| | | | |
Total distributions | | | (1.22 | ) | | | (0.32 | ) | | | (2.69 | ) | | | (0.65 | ) |
| | | | |
Redemption feesd | | | — | | | | — | | | | — | | | | — | |
| | | | |
Net asset value, end of year | | $ | 18.44 | | | $ | 19.78 | | | $ | 17.61 | | | $ | 17.37 | |
| | | | |
| | | | |
Total returne | | | (0.96)% | | | | 14.28% | | | | 18.58% | | | | 0.26% | |
Ratios to average net assetsf | | | | | | | | | | | | | | | | |
Expensesg | | | 0.91% | | | | 0.90% | | | | 0.89% | | | | 0.93% | |
Net investment income | | | 4.05% | | | | 4.92% | | | | 5.38% | | | | 4.31% | |
| | | | |
Supplemental data | | | | | | | | | | | | | | | | |
Net assets, end of year (000’s) | | $ | 151,695 | | | $ | 150,891 | | | $ | 108,910 | | | $ | 43,069 | |
Portfolio turnover rate | | | 34.18% | | | | 8.77% | | | | 20.84% | | | | 28.46% | |
aFor the period February 29, 2008 (effective date) to December 31, 2008.
bThe amount shown for a share outstanding throughout the period may not correlate with the Statement of Operations for the period due to the timing of sales and repurchases of the Fund shares in relation to income earned and/or fluctuating market value of the investments of the Fund.
cBased on average daily shares outstanding.
dAmount rounds to less than $0.01 per share.
eTotal return does not include fees, charges or expenses imposed by the variable annuity and life insurance contracts for which the Franklin Templeton Variable Insurance Products Trust serves as an underlying investment vehicle. Total return is not annualized for periods less than one year.
fRatios are annualized for periods less than one year.
gBenefit of expense reduction rounds to less than 0.01%.
The accompanying notes are an integral part of these financial statements.
TGB-14
Franklin Templeton Variable Insurance Products Trust
Statement of Investments, December 31, 2011
| | | | | | | | |
| Templeton Global Bond Securities Fund | | Principal
Amount* | | | Value | |
Foreign Government and Agency Securities 76.2% | | | | | | | | |
Argentina 0.5% | | | | | | | | |
a,bGovernment of Argentina, senior bond, FRN, 0.439%, 8/03/12 | | | 107,485,000 | | | $ | 13,073,503 | |
| | | | | | | | |
Australia 7.9% | | | | | | | | |
Government of Australia, senior bond, 5.75%, 4/15/12 | | | 43,700,000 | AUD | | | 44,932,969 | |
New South Wales Treasury Corp., | | | | | | | | |
6.00%, 5/01/12 | | | 10,590,000 | AUD | | | 10,900,253 | |
6.00%, 5/01/12 (London Exchange) | | | 13,180,000 | AUD | | | 13,565,376 | |
5.50%, 8/01/13 | | | 3,710,000 | AUD | | | 3,891,330 | |
senior note, 5.50%, 3/01/17 | | | 32,225,000 | AUD | | | 35,002,163 | |
Queensland Treasury Corp., | | | | | | | | |
6.00%, 8/14/13 | | | 24,450,000 | AUD | | | 25,869,263 | |
6.00%, 9/14/17 | | | 13,160,000 | AUD | | | 14,577,214 | |
senior note, 6.00%, 8/21/13 | | | 8,888,000 | AUD | | | 9,352,552 | |
Western Australia Treasury Corp., | | | | | | | | |
5.50%, 7/17/12 | | | 26,480,000 | AUD | | | 27,297,146 | |
8.00%, 6/15/13 | | | 4,350,000 | AUD | | | 4,710,083 | |
| | | | | | | | |
| | | | | | | 190,098,349 | |
| | | | | | | | |
Brazil 3.5% | | | | | | | | |
Nota Do Tesouro Nacional, | | | | | | | | |
10.00%, 1/01/12 | | | 38,245 | c BRL | | | 20,525,589 | |
10.00%, 1/01/14 | | | 7,100 | c BRL | | | 3,774,205 | |
10.00%, 1/01/17 | | | 22,490 | c BRL | | | 11,613,794 | |
dIndex Linked, 6.00%, 5/15/15 | | | 29,822 | c BRL | | | 34,556,113 | |
dIndex Linked, 6.00%, 5/15/45 | | | 10,825 | c BRL | | | 13,087,225 | |
| | | | | | | | |
| | | | | | | 83,556,926 | |
| | | | | | | | |
Hungary 2.8% | | | | | | | | |
Government of Hungary, | | | | | | | | |
5.50%, 2/12/14 | | | 608,600,000 | HUF | | | 2,335,185 | |
5.50%, 2/12/16 | | | 436,800,000 | HUF | | | 1,571,560 | |
6.50%, 6/24/19 | | | 389,700,000 | HUF | | | 1,335,072 | |
7.50%, 11/12/20 | | | 28,000,000 | HUF | | | 100,095 | |
A, 8.00%, 2/12/15 | | | 280,000,000 | HUF | | | 1,113,076 | |
A, 6.75%, 11/24/17 | | | 1,443,600,000 | HUF | | | 5,183,575 | |
A, 7.00%, 6/24/22 | | | 249,200,000 | HUF | | | 842,228 | |
B, 6.75%, 2/24/17 | | | 394,700,000 | HUF | | | 1,437,819 | |
D, 6.75%, 2/12/13 | | | 310,800,000 | HUF | | | 1,256,350 | |
D, 6.75%, 8/22/14 | | | 1,760,900,000 | HUF | | | 6,851,660 | |
E, 7.50%, 10/24/13 | | | 248,600,000 | HUF | | | 1,004,047 | |
senior note, 3.50%, 7/18/16 | | | 1,055,000 | EUR | | | 1,097,988 | |
senior note, 4.375%, 7/04/17 | | | 5,380,000 | EUR | | | 5,588,076 | |
senior note, 5.75%, 6/11/18 | | | 13,795,000 | EUR | | | 14,944,436 | |
senior note, 6.25%, 1/29/20 | | | 6,420,000 | | | | 5,907,684 | |
senior note, 3.875%, 2/24/20 | | | 3,120,000 | EUR | | | 2,935,480 | |
senior note, 6.375%, 3/29/21 | | | 14,820,000 | | | | 13,566,969 | |
| | | | | | | | |
| | | | | | | 67,071,300 | |
| | | | | | | | |
Indonesia 7.9% | | | | | | | | |
Government of Indonesia, | | | | | | | | |
FR20, 14.275%, 12/15/13 | | | 14,267,000,000 | IDR | | | 1,841,462 | |
FR31, 11.00%, 11/15/20 | | | 167,351,000,000 | IDR | | | 24,745,054 | |
FR34, 12.80%, 6/15/21 | | | 207,810,000,000 | IDR | | | 33,985,497 | |
TGB-15
Franklin Templeton Variable Insurance Products Trust
Statement of Investments, December 31, 2011 (continued)
| | | | | | | | |
| Templeton Global Bond Securities Fund | | Principal
Amount* | | | Value | |
Foreign Government and Agency Securities (continued) | | | | | | | | |
Indonesia (continued) | | | | | | | | |
Government of Indonesia (continued) | | | | | | | | |
FR35, 12.90%, 6/15/22 | | | 66,582,000,000 | IDR | | $ | 10,978,739 | |
FR36, 11.50%, 9/15/19 | | | 30,075,000,000 | IDR | | | 4,440,023 | |
FR37, 12.00%, 9/15/26 | | | 8,230,000,000 | IDR | | | 1,350,065 | |
FR39, 11.75%, 8/15/23 | | | 5,491,000,000 | IDR | | | 860,569 | |
FR40, 11.00%, 9/15/25 | | | 61,856,000,000 | IDR | | | 9,495,261 | |
FR42, 10.25%, 7/15/27 | | | 88,574,000,000 | IDR | | | 12,845,303 | |
FR43, 10.25%, 7/15/22 | | | 68,340,000,000 | IDR | | | 9,814,546 | |
FR44, 10.00%, 9/15/24 | | | 4,454,000,000 | IDR | | | 635,447 | |
FR46, 9.50%, 7/15/23 | | | 226,780,000,000 | IDR | | | 31,004,137 | |
FR47, 10.00%, 2/15/28 | | | 61,737,000,000 | IDR | | | 8,764,339 | |
FR48, 9.00%, 9/15/18 | | | 16,920,000,000 | IDR | | | 2,188,086 | |
FR49, 9.00%, 9/15/13 | | | 35,030,000,000 | IDR | | | 4,116,754 | |
esenior bond, 144A, 8.50%, 10/12/35 | | | 7,259,000 | | | | 10,525,550 | |
esenior bond, 144A, 6.625%, 2/17/37 | | | 1,930,000 | | | | 2,355,208 | |
esenior bond, 144A, 7.75%, 1/17/38 | | | 8,650,000 | | | | 11,745,835 | |
esenior note, 144A, 11.625%, 3/04/19 | | | 6,410,000 | | | | 9,484,332 | |
| | | | | | | | |
| | | | | | | 191,176,207 | |
| | | | | | | | |
Iraq 0.3% | | | | | | | | |
Government of Iraq, | | | | | | | | |
e144A, 5.80%, 1/15/28 | | | 5,055,000 | | | | 4,160,113 | |
fReg S, 5.80%, 1/15/28 | | | 3,440,000 | | | | 2,831,017 | |
| | | | | | | | |
| | | | | | | 6,991,130 | |
| | | | | | | | |
Ireland 3.7% | | | | | | | | |
Government of Ireland, | | | | | | | | |
4.00%, 1/15/14 | | | 14,291,000 | EUR | | | 17,307,495 | |
4.60%, 4/18/16 | | | 9,213,000 | EUR | | | 10,775,114 | |
5.90%, 10/18/19 | | | 10,562,000 | EUR | | | 11,862,145 | |
4.50%, 4/18/20 | | | 6,289,000 | EUR | | | 6,308,386 | |
5.00%, 10/18/20 | | | 9,329,000 | EUR | | | 9,666,623 | |
senior bond, 4.50%, 10/18/18 | | | 7,339,000 | EUR | | | 7,748,701 | |
senior bond, 4.40%, 6/18/19 | | | 12,246,000 | EUR | | | 12,698,067 | |
senior bond, 5.40%, 3/13/25 | | | 12,847,000 | EUR | | | 13,162,208 | |
| | | | | | | | |
| | | | | | | 89,528,739 | |
| | | | | | | | |
Israel 1.7% | | | | | | | | |
Government of Israel, | | | | | | | | |
5.00%, 3/31/13 | | | 53,945,000 | ILS | | | 14,549,343 | |
3.50%, 9/30/13 | | | 101,009,000 | ILS | | | 26,853,183 | |
| | | | | | | | |
| | | | | | | 41,402,526 | |
| | | | | | | | |
Lithuania 1.5% | | | | | | | | |
eGovernment of Lithuania, 144A, | | | | | | | | |
6.75%, 1/15/15 | | | 19,480,000 | | | | 20,478,350 | |
7.375%, 2/11/20 | | | 12,690,000 | | | | 13,797,139 | |
6.125%, 3/09/21 | | | 3,240,000 | | | | 3,251,421 | |
| | | | | | | | |
| | | | | | | 37,526,910 | |
| | | | | | | | |
Malaysia 2.5% | | | | | | | | |
Government of Malaysia, senior bond, | | | | | | | | |
2.711%, 2/14/12 | | | 720,000 | MYR | | | 227,060 | |
3.718%, 6/15/12 | | | 51,643,000 | MYR | | | 16,347,095 | |
TGB-16
Franklin Templeton Variable Insurance Products Trust
Statement of Investments, December 31, 2011 (continued)
| | | | | | | | |
| Templeton Global Bond Securities Fund | | Principal
Amount* | | | Value | |
Foreign Government and Agency Securities (continued) | | | | | | | | |
Malaysia (continued) | | | | | | | | |
Government of Malaysia, senior bond (continued) | | | | | | | | |
2.509%, 8/27/12 | | | 26,335,000 | MYR | | $ | 8,285,631 | |
3.702%, 2/25/13 | | | 27,704,000 | MYR | | | 8,818,000 | |
3.70%, 5/15/13 | | | 210,000 | MYR | | | 66,943 | |
3.21%, 5/31/13 | | | 2,950,000 | MYR | | | 934,415 | |
3.461%, 7/31/13 | | | 13,390,000 | MYR | | | 4,259,034 | |
3.814%, 2/15/17 | | | 18,885,000 | MYR | | | 6,081,869 | |
4.24%, 2/07/18 | | | 44,360,000 | MYR | | | 14,609,413 | |
| | | | | | | | |
| | | | | | | 59,629,460 | |
| | | | | | | | |
Mexico 5.9% | | | | | | | | |
Government of Mexico, | | | | | | | | |
M, 9.00%, 6/20/13 | | | 2,982,300 | g MXN | | | 22,621,301 | |
M, 8.00%, 12/17/15 | | | 726,000 | g MXN | | | 5,690,235 | |
M, 7.25%, 12/15/16 | | | 250,000 | g MXN | | | 1,921,127 | |
M, 7.75%, 12/14/17 | | | 4,473,000 | g MXN | | | 35,204,832 | |
MI, 9.00%, 12/20/12 | | | 265,000 | g MXN | | | 1,976,937 | |
MI, 8.00%, 12/19/13 | | | 9,939,900 | g MXN | | | 75,374,625 | |
| | | | | | | | |
| | | | | | | 142,789,057 | |
| | | | | | | | |
Norway 0.4% | | | | | | | | |
Government of Norway, 6.50%, 5/15/13 | | | 49,400,000 | NOK | | | 8,842,713 | |
| | | | | | | | |
Peru 0.2% | | | | | | | | |
Government of Peru, 7.84%, 8/12/20 | | | 11,090,000 | PEN | | | 4,700,285 | |
| | | | | | | | |
Philippines 0.3% | | | | | | | | |
Government of the Philippines, senior bond, | | | | | | | | |
5.75%, 2/21/12 | | | 134,520,000 | PHP | | | 3,081,319 | |
5.25%, 1/07/13 | | | 61,770,000 | PHP | | | 1,449,265 | |
8.75%, 3/03/13 | | | 162,650,000 | PHP | | | 3,949,133 | |
R3-7, 5.25%, 9/24/12 | | | 2,090,000 | PHP | | | 48,688 | |
| | | | | | | | |
| | | | | | | 8,528,405 | |
| | | | | | | | |
Poland 7.9% | | | | | | | | |
Government of Poland, | | | | | | | | |
4.75%, 4/25/12 | | | 58,025,000 | PLN | | | 16,833,808 | |
5.25%, 4/25/13 | | | 22,950,000 | PLN | | | 6,698,932 | |
5.00%, 10/24/13 | | | 16,810,000 | PLN | | | 4,891,610 | |
5.75%, 4/25/14 | | | 92,590,000 | PLN | | | 27,328,205 | |
6.25%, 10/24/15 | | | 44,730,000 | PLN | | | 13,463,399 | |
5.75%, 9/23/22 | | | 48,750,000 | PLN | | | 13,988,163 | |
senior note, 6.375%, 7/15/19 | | | 27,200,000 | | | | 30,298,896 | |
Strip, 1/25/12 | | | 7,670,000 | PLN | | | 2,217,365 | |
Strip, 7/25/12 | | | 11,905,000 | PLN | | | 3,366,039 | |
Strip, 10/25/12 | | | 90,245,000 | PLN | | | 25,218,515 | |
Strip, 1/25/13 | | | 99,335,000 | PLN | | | 27,456,390 | |
Strip, 7/25/13 | | | 76,175,000 | PLN | | | 20,544,953 | |
| | | | | | | | |
| | | | | | | 192,306,275 | |
| | | | | | | | |
Qatar 0.6% | | | | | | | | |
eGovernment of Qatar, senior note, 144A, 6.55%, 4/09/19 | | | 11,830,000 | | | | 14,018,964 | |
| | | | | | | | |
Russia 2.8% | | | | | | | | |
eGovernment of Russia, 144A, 7.50%, 3/31/30 | | | 59,148,895 | | | | 68,797,559 | |
| | | | | | | | |
TGB-17
Franklin Templeton Variable Insurance Products Trust
Statement of Investments, December 31, 2011 (continued)
| | | | | | | | |
| Templeton Global Bond Securities Fund | | Principal
Amount* | | | Value | |
Foreign Government and Agency Securities (continued) | | | | | | | | |
Singapore 1.3% | | | | | | | | |
Government of Singapore, senior bond, | | | | | | | | |
2.50%, 10/01/12 | | | 6,340,000 | SGD | | $ | 4,965,988 | |
1.625%, 4/01/13 | | | 34,700,000 | SGD | | | 27,182,692 | |
| | | | | | | | |
| | | | | | | 32,148,680 | |
| | | | | | | | |
South Africa 1.6% | | | | | | | | |
Government of South Africa, | | | | | | | | |
5.25%, 5/16/13 | | | 3,590,000 | EUR | | | 4,780,304 | |
4.50%, 4/05/16 | | | 1,874,000 | EUR | | | 2,500,910 | |
6.875%, 5/27/19 | | | 21,215,000 | | | | 25,535,591 | |
senior note, 6.50%, 6/02/14 | | | 805,000 | | | | 885,500 | |
senior note, 5.875%, 5/30/22 | | | 3,485,000 | | | | 4,020,434 | |
| | | | | | | | |
| | | | | | | 37,722,739 | |
| | | | | | | | |
South Korea 11.0% | | | | | | | | |
The Export-Import Bank of Korea, senior note, 4.625%, 2/20/17 | | | 230,000 | EUR | | | 309,939 | |
KDICB Redemption Fund Bond, senior bond, | | | | | | | | |
07-1, 5.57%, 9/14/12 | | | 6,600,000,000 | KRW | | | 5,771,111 | |
08-1, 5.28%, 2/15/13 | | | 880,000,000 | KRW | | | 773,165 | |
Korea Treasury Bond, | | | | | | | | |
5.25%, 9/10/12 | | | 28,539,000,000 | KRW | | | 24,925,032 | |
5.25%, 3/10/13 | | | 6,483,790,000 | KRW | | | 5,710,879 | |
5.00%, 9/10/16 | | | 2,806,000,000 | KRW | | | 2,573,856 | |
senior bond, 4.00%, 6/10/12 | | | 134,277,650,000 | KRW | | | 116,131,059 | |
senior bond, 4.25%, 12/10/12 | | | 23,404,000,000 | KRW | | | 20,340,922 | |
senior bond, 3.75%, 6/10/13 | | | 57,125,360,000 | KRW | | | 49,523,049 | |
senior bond, 3.00%, 12/10/13 | | | 47,514,850,000 | KRW | | | 40,734,690 | |
| | | | | | | | |
| | | | | | | 266,793,702 | |
| | | | | | | | |
Sri Lanka 1.5% | | | | | | | | |
Government of Sri Lanka, | | | | | | | | |
A, 6.90%, 8/01/12 | | | 14,600,000 | LKR | | | 126,843 | |
A, 8.50%, 1/15/13 | | | 694,400,000 | LKR | | | 6,076,183 | |
A, 13.50%, 2/01/13 | | | 674,300,000 | LKR | | | 6,172,065 | |
A, 7.00%, 3/01/14 | | | 43,380,000 | LKR | | | 361,560 | |
A, 11.25%, 7/15/14 | | | 773,000,000 | LKR | | | 7,020,116 | |
A, 11.75%, 3/15/15 | | | 8,520,000 | LKR | | | 78,798 | |
A, 6.50%, 7/15/15 | | | 218,480,000 | LKR | | | 1,734,691 | |
A, 11.00%, 8/01/15 | | | 1,349,700,000 | LKR | | | 12,249,505 | |
A, 6.40%, 8/01/16 | | | 109,200,000 | LKR | | | 835,735 | |
B, 6.60%, 6/01/14 | | | 56,800,000 | LKR | | | 466,109 | |
B, 6.40%, 10/01/16 | | | 119,100,000 | LKR | | | 910,901 | |
| | | | | | | | |
| | | | | | | 36,032,506 | |
| | | | | | | | |
hSupranational 1.1% | | | | | | | | |
Corporacion Andina De Fomento, 8.125%, 6/04/19 | | | 5,260,000 | | | | 6,471,168 | |
European Investment Bank, senior note, 4.50%, 5/15/13 | | | 33,700,000 | NOK | | | 5,785,522 | |
Inter-American Development Bank, senior note, 7.50%, 12/05/24 | | | 200,000,000 | MXN | | | 13,415,695 | |
| | | | | | | | |
| | | | | | | 25,672,385 | |
| | | | | | | | |
Sweden 4.3% | | | | | | | | |
Government of Sweden, | | | | | | | | |
5.50%, 10/08/12 | | | 509,640,000 | SEK | | | 76,607,652 | |
1.50%, 8/30/13 | | | 166,040,000 | SEK | | | 24,456,498 | |
TGB-18
Franklin Templeton Variable Insurance Products Trust
Statement of Investments, December 31, 2011 (continued)
| | | | | | | | |
| Templeton Global Bond Securities Fund | | Principal
Amount* | | | Value | |
Foreign Government and Agency Securities (continued) | | | | | | | | |
Sweden (continued) | | | | | | | | |
Kommuninvest I Sverige AB, senior note, 1.75%, 10/08/12 | | | 24,400,000 | SEK | | $ | 3,524,671 | |
| | | | | | | | |
| | | | | | | 104,588,821 | |
| | | | | | | | |
Ukraine 0.7% | | | | | | | | |
eFinancing of Infrastructure Projects State Enterprise, 144A, 7.40%, 4/20/18 | | | 840,000 | | | | 690,375 | |
eGovernment of Ukraine, | | | | | | | | |
144A, 7.65%, 6/11/13 | | | 760,000 | | | | 734,350 | |
144A, 6.25%, 6/17/16 | | | 1,210,000 | | | | 1,065,556 | |
144A, 7.75%, 9/23/20 | | | 480,000 | | | | 417,600 | |
senior note, 144A, 4.95%, 10/13/15 | | | 290,000 | EUR | | | 310,118 | |
senior note, 144A, 7.95%, 2/23/21 | | | 16,530,000 | | | | 14,587,725 | |
| | | | | | | | |
| | | | | | | 17,805,724 | |
| | | | | | | | |
United Arab Emirates 0.6% | | | | | | | | |
eEmirate of Abu Dhabi, 144A, 6.75%, 4/08/19 | | | 11,840,000 | | | | 14,533,600 | |
| | | | | | | | |
United Kingdom 2.6% | | | | | | | | |
United Kingdom Treasury Bond, 5.00%, 3/07/12 | | | 17,642,000 | GBP | | | 27,627,053 | |
United Kingdom Treasury Note, 5.25%, 6/07/12 | | | 22,260,000 | GBP | | | 35,302,289 | |
| | | | | | | | |
| | | | | | | 62,929,342 | |
| | | | | | | | |
Venezuela 0.6% | | | | | | | | |
Government of Venezuela, 10.75%, 9/19/13 | | | 13,570,000 | | | | 13,756,927 | |
| | | | | | | | |
Vietnam 0.5% | | | | | | | | |
eGovernment of Vietnam, 144A, 6.75%, 1/29/20 | | | 13,110,000 | | | | 13,167,356 | |
| | | | | | | | |
Total Foreign Government and Agency Securities (Cost $1,794,910,963) | | | | | | | 1,845,190,090 | |
| | | | | | | | |
Municipal Bonds 1.1% | | | | | | | | |
United States 1.1% | | | | | | | | |
Alabama State University Revenue, General Tuition and Fee, Assured Guaranty, 5.00%, 9/01/29 | | | 175,000 | | | | 190,892 | |
Bexar County Revenue, Venue Project, Refunding, Series A, BHAC Insured, 5.25%, 8/15/47 | | | 1,450,000 | | | | 1,585,125 | |
California State GO, | | | | | | | | |
7.625%, 3/01/40 | | | 1,320,000 | | | | 1,625,382 | |
Refunding, 5.125%, 4/01/33 | | | 3,800,000 | | | | 3,967,580 | |
Refunding, 5.00%, 4/01/38 | | | 1,370,000 | | | | 1,398,592 | |
Various Purpose, 6.00%, 4/01/38 | | | 10,740,000 | | | | 12,128,145 | |
Illinois Municipal Electricity Agency Power Supply Revenue, Series A, BHAC Insured, 5.00%, 2/01/35 | | | 2,155,000 | | | | 2,227,990 | |
Philadelphia GO, Refunding, Series A, Assured Guaranty, 5.00%, 8/01/24 | | | 500,000 | | | | 536,085 | |
Tarrant County Cultural Education Facilities Finance Corp. Revenue, Christus Health, Refunding, Series A, Assured Guaranty, 6.25%, 7/01/28 | | | 1,500,000 | | | | 1,715,790 | |
| | | | | | | | |
Total Municipal Bonds (Cost $22,747,056) | | | | | | | 25,375,581 | |
| | | | | | | | |
Total Investments before Short Term Investments (Cost $1,817,658,019) | | | | | | $ | 1,870,565,671 | |
| | | | | | | | |
Short Term Investments 15.8% | | | | | | | | |
Foreign Government and Agency Securities 8.1% | | | | | | | | |
Egypt 0.2% | | | | | | | | |
iEgypt Treasury Bill, 2/21/12 | | | 26,475,000 | EGP | | | 4,311,376 | |
| | | | | | | | |
Hungary 0.1% | | | | | | | | |
iHungary Treasury Bill, 8/22/12 | | | 502,600,000 | HUF | | | 1,964,800 | |
| | | | | | | | |
TGB-19
Franklin Templeton Variable Insurance Products Trust
Statement of Investments, December 31, 2011 (continued)
| | | | | | | | |
| Templeton Global Bond Securities Fund | | Principal
Amount* | | | Value | |
Short Term Investments (continued) | | | | | | | | |
Foreign Government and Agency Securities (continued) | | | | | | | | |
Israel 1.8% | | | | | | | | |
Government of Israel, 4.00%, 3/30/12 | | | 26,865,000 | ILS | | $ | 7,071,820 | |
iIsrael Treasury Bills, 1/04/12 - 5/02/12 | | | 140,940,000 | ILS | | | 36,839,081 | |
| | | | | | | | |
| | | | | | | 43,910,901 | |
| | | | | | | | |
Malaysia 2.3% | | | | | | | | |
iBank of Negara Monetary Note, 1/03/12 - 6/14/12 | | | 170,890,000 | MYR | | | 53,638,717 | |
iMalaysia Treasury Bills, 1/20/12 - 7/27/12 | | | 7,680,000 | MYR | | | 2,401,595 | |
| | | | | | | | |
| | | | | | | 56,040,312 | |
| | | | | | | | |
Norway 1.7% | | | | | | | | |
iNorway Treasury Bill, 3/21/12 | | | 240,230,000 | NOK | | | 40,060,627 | |
| | | | | | | | |
Philippines 0.1% | | | | | | | | |
iPhilippine Treasury Bills, 1/11/12 - 8/22/12 | | | 116,440,000 | PHP | | | 2,646,732 | |
| | | | | | | | |
Singapore 1.8% | | | | | | | | |
Government of Singapore, senior bond, | | | | | | | | |
2.625%, 4/01/12 | | | 37,720,000 | SGD | | | 29,231,561 | |
3.50%, 7/01/12 | | | 2,120,000 | SGD | | | 1,660,031 | |
iSingapore Treasury Bills, 5/02/12 - 11/01/12 | | | 17,140,000 | SGD | | | 13,186,884 | |
| | | | | | | | |
| | | | | | | 44,078,476 | |
| | | | | | | | |
Sri Lanka 0.1% | | | | | | | | |
iSri Lanka Treasury Bills, 1/27/12 - 9/28/12 | | | 213,370,000 | LKR | | | 1,832,844 | |
| | | | | | | | |
Total Foreign Government and Agency Securities (Cost $210,293,047) | | | | | | | 194,846,068 | |
| | | | | | | | |
Total Investments before Repurchase Agreements (Cost $2,027,951,066) | | | | | | | 2,065,411,739 | |
| | | | | | | | |
Repurchase Agreements (Cost $186,697,298) 7.7% | | | | | | | | |
United States 7.7% | | | | | | | | |
jJoint Repurchase Agreement, 0.011%, 1/03/12 (Maturity Value $186,697,523) | | | 186,697,298 | | | | 186,697,298 | |
BNP Paribas Securities Corp. (Maturity Value $22,590,400) | | | | | | | | |
Credit Suisse Securities (USA) LLC (Maturity Value $27,106,613) | | | | | | | | |
Deutsche Bank Securities Inc. (Maturity Value $28,570,322) | | | | | | | | |
HSBC Securities (USA) Inc. (Maturity Value $45,180,802) | | | | | | | | |
Merrill Lynch, Pierce, Fenner & Smith Inc. (Maturity Value $27,106,613) | | | | | | | | |
Morgan Stanley & Co. LLC (Maturity Value $9,036,160) | | | | | | | | |
UBS Securities LLC (Maturity Value $27,106,613) | | | | | | | | |
Collateralized by U.S. Government Agency Securities, 0.16% - 5.25%, 6/07/12 - 2/05/14;
iU.S. Treasury Bills, 1/12/12 - 9/20/12; U.S. Treasury Bonds, 0.50% - 11.25%, 5/31/13 - 2/15/16; and U.S. Treasury Notes, 0.125% - 4.875%, 12/31/11 - 5/15/19 (valued at $190,529,923) | | | | | | | | |
| | | | | | | | |
Total Investments (Cost $2,214,648,364) 93.1% | | | | | | | 2,252,109,037 | |
Other Assets, less Liabilities 6.9% | | | | | | | 168,028,522 | |
| | | | | | | | |
Net Assets 100.0% | | | | | | $ | 2,420,137,559 | |
| | | | | | | | |
See Abbreviations on page TGB-43.
TGB-20
Franklin Templeton Variable Insurance Products Trust
Statement of Investments, December 31, 2011 (continued)
| | | | |
| Templeton Global Bond Securities Fund | | | | |
*The principal amount is stated in U.S. dollars unless otherwise indicated.
aThe coupon rate shown represents the rate at period end.
bThe principal amount is stated in original face, and scheduled paydowns are reflected in the market price on ex-date.
cPrincipal amount is stated in 1,000 Brazilian Real Units.
dRedemption price at maturity is adjusted for inflation. See Note 1(g).
eSecurity was purchased pursuant to Rule 144A under the Securities Act of 1933 and may be sold in transactions exempt from registration only to qualified institutional buyers or in a public offering registered under the Securities Act of 1933. These securities have been deemed liquid under guidelines approved by the Trust’s Board of Trustees. At December 31, 2011, the aggregate value of these securities was $204,121,151, representing 8.43% of net assets.
fSecurity was purchased pursuant to Regulation S under the Securities Act of 1933, which exempts from registration securities offered and sold outside of the United States. Such a security cannot be sold in the United States without either an effective registration statement filed pursuant to the Securities Act of 1933, or pursuant to an exemption from registration. This security has been deemed liquid under guidelines approved by the Trust’s Board of Trustees. At December 31, 2011, the value of this security was $2,831,017, representing 0.12% of net assets.
gPrincipal amount is stated in 100 Mexican Peso Units.
hA supranational organization is an entity formed by two or more central governments through international treaties.
iThe security is traded on a discount basis with no stated coupon rate.
jSee Note 1(c) regarding joint repurchase agreement.
TGB-21
Franklin Templeton Variable Insurance Products Trust
Statement of Investments, December 31, 2011 (continued)
| | | | | | |
| Templeton Global Bond Securities Fund | | | | | | |
At December 31, 2011, the Fund had the following forward exchange contracts outstanding. See Note 1(d).
Forward Exchange Contracts
| | | | | | | | | | | | | | | | | | | | | | | | | | | | | | |
| Currency | | Counterparty | | | Type | | | Quantity | | | Contract
Amount* | | | | | Settlement
Date | | | Unrealized
Appreciation | | | Unrealized
Depreciation | |
Japanese Yen | | | DBAB | | | | Sell | | | | 770,370,000 | | | | 9,941,541 | | | | | | 1/04/12 | | | $ | — | | | $ | (68,590 | ) |
Swedish Krona | | | DBAB | | | | Buy | | | | 136,332,733 | | | | 15,020,408 | | | EUR | | | 1/05/12 | | | | 365,426 | | | | — | |
Euro | | | CITI | | | | Sell | | | | 5,040,000 | | | | 6,519,290 | | | | | | 1/10/12 | | | | — | | | | (4,469 | ) |
Japanese Yen | | | BZWS | | | | Sell | | | | 277,330,000 | | | | 3,353,446 | | | | | | 1/10/12 | | | | — | | | | (250,495 | ) |
Japanese Yen | | | UBSW | | | | Sell | | | | 138,650,000 | | | | 1,676,805 | | | | | | 1/10/12 | | | | — | | | | (124,970 | ) |
Japanese Yen | | | CITI | | | | Sell | | | | 138,680,000 | | | | 1,677,960 | | | | | | 1/10/12 | | | | — | | | | (124,206 | ) |
Euro | | | BZWS | | | | Sell | | | | 1,726,000 | | | | 2,233,444 | | | | | | 1/11/12 | | | | — | | | | (700 | ) |
Euro | | | UBSW | | | | Sell | | | | 13,846,000 | | | | 17,922,609 | | | | | | 1/11/12 | | | | 271 | | | | — | |
Euro | | | DBAB | | | | Sell | | | | 9,460,000 | | | | 12,259,119 | | | | | | 1/11/12 | | | | 14,044 | | | | — | |
Japanese Yen | | | DBAB | | | | Sell | | | | 139,110,000 | | | | 1,682,491 | | | | | | 1/12/12 | | | | — | | | | (125,319 | ) |
Japanese Yen | | | HSBC | | | | Sell | | | | 139,250,000 | | | | 1,687,572 | | | | | | 1/12/12 | | | | — | | | | (122,057 | ) |
Chilean Peso | �� | | MSCO | | | | Buy | | | | 2,254,600,000 | | | | 4,442,999 | | | | | | 1/13/12 | | | | — | | | | (112,471 | ) |
Euro | | | JPHQ | | | | Sell | | | | 937,000 | | | | 1,211,775 | | | | | | 1/13/12 | | | | — | | | | (1,099 | ) |
Japanese Yen | | | BZWS | | | | Sell | | | | 394,150,000 | | | | 4,771,792 | | | | | | 1/13/12 | | | | — | | | | (350,479 | ) |
Japanese Yen | | | HSBC | | | | Sell | | | | 397,130,000 | | | | 4,811,539 | | | | | | 1/13/12 | | | | — | | | | (349,459 | ) |
Japanese Yen | | | UBSW | | | | Sell | | | | 313,510,000 | | | | 3,797,176 | | | | | | 1/13/12 | | | | — | | | | (277,119 | ) |
Philippine Peso | | | JPHQ | | | | Buy | | | | 374,905,000 | | | | 8,515,730 | | | | | | 1/13/12 | | | | 30,477 | | | | — | |
Philippine Peso | | | HSBC | | | | Buy | | | | 60,160,000 | | | | 1,367,801 | | | | | | 1/17/12 | | | | 3,336 | | | | — | |
Euro | | | DBAB | | | | Sell | | | | 4,856,000 | | | | 6,438,109 | | | | | | 1/18/12 | | | | 152,178 | | | | — | |
Philippine Peso | | | HSBC | | | | Buy | | | | 115,942,000 | | | | 2,602,806 | | | | | | 1/18/12 | | | | 39,566 | | | | — | |
Philippine Peso | | | DBAB | | | | Buy | | | | 66,125,000 | | | | 1,484,121 | | | | | | 1/18/12 | | | | 22,899 | | | | — | |
Philippine Peso | | | JPHQ | | | | Buy | | | | 165,119,000 | | | | 3,670,535 | | | | | | 1/19/12 | | | | 92,433 | | | | — | |
Philippine Peso | | | DBAB | | | | Buy | | | | 41,372,000 | | | | 931,592 | | | | | | 1/19/12 | | | | 11,252 | | | | — | |
British Pound | | | BZWS | | | | Buy | | | | 906,238 | | | | 1,435,872 | | | | | | 1/24/12 | | | | — | | | | (28,590 | ) |
British Pound | | | DBAB | | | | Buy | | | | 903,679 | | | | 1,430,452 | | | | | | 1/24/12 | | | | — | | | | (27,144 | ) |
British Pound | | | CITI | | | | Buy | | | | 603,463 | | | | 953,634 | | | | | | 1/24/12 | | | | — | | | | (16,527 | ) |
British Pound | | | DBAB | | | | Buy | | | | 474,519 | | | | 755,031 | | | | | | 1/26/12 | | | | — | | | | (18,172 | ) |
Japanese Yen | | | BZWS | | | | Sell | | | | 1,079,470,000 | | | | 13,122,660 | | | | | | 1/26/12 | | | | — | | | | (908,680 | ) |
Japanese Yen | | | UBSW | | | | Sell | | | | 944,420,000 | | | | 11,488,596 | | | | | | 1/26/12 | | | | — | | | | (787,316 | ) |
Japanese Yen | | | DBAB | | | | Sell | | | | 897,860,782 | | | | 10,935,263 | | | | | | 1/26/12 | | | | — | | | | (735,456 | ) |
Philippine Peso | | | HSBC | | | | Buy | | | | 154,149,000 | | | | 3,423,251 | | | | | | 1/26/12 | | | | 88,596 | | | | — | |
British Pound | | | BZWS | | | | Buy | | | | 601,378 | | | | 945,862 | | | | | | 1/27/12 | | | | — | | | | (12,019 | ) |
British Pound | | | MSCO | | | | Buy | | | | 358,395 | | | | 564,198 | | | | | | 1/27/12 | | | | — | | | | (7,668 | ) |
British Pound | | | JPHQ | | | | Buy | | | | 119,423 | | | | 190,002 | | | | | | 1/27/12 | | | | — | | | | (4,557 | ) |
Chilean Peso | | | DBAB | | | | Buy | | | | 2,227,910,000 | | | | 4,404,290 | | | | | | 1/27/12 | | | | — | | | | (134,289 | ) |
Euro | | | CITI | | | | Sell | | | | 4,998,400 | | | | 6,758,487 | | | | | | 1/27/12 | | | | 287,828 | | | | — | |
Japanese Yen | | | HSBC | | | | Sell | | | | 1,162,462,488 | | | | 14,183,290 | | | | | | 1/27/12 | | | | — | | | | (927,050 | ) |
British Pound | | | JPHQ | | | | Buy | | | | 237,230 | | | | 373,367 | | | | | | 1/30/12 | | | | — | | | | (4,997 | ) |
Chilean Peso | | | DBAB | | | | Buy | | | | 5,127,860,000 | | | | 10,218,932 | | | | | | 1/30/12 | | | | — | | | | (394,837 | ) |
Chilean Peso | | | JPHQ | | | | Buy | | | | 675,370,000 | | | | 1,337,102 | | | | | | 1/30/12 | | | | — | | | | (43,209 | ) |
British Pound | | | MSCO | | | | Buy | | | | 116,956 | | | | 185,153 | | | | | | 1/31/12 | | | | — | | | | (3,546 | ) |
Chilean Peso | | | DBAB | | | | Buy | | | | 3,093,470,000 | | | | 6,161,677 | | | | | | 1/31/12 | | | | — | | | | (235,663 | ) |
Euro | | | DBAB | | | | Sell | | | | 31,205,000 | | | | 42,438,800 | | | | | | 1/31/12 | | | | 2,041,161 | | | | — | |
Philippine Peso | | | DBAB | | | | Buy | | | | 128,745,000 | | | | 2,986,361 | | | | | | 1/31/12 | | | | — | | | | (53,985 | ) |
British Pound | | | CITI | | | | Buy | | | | 391,619 | | | | 619,451 | | | | | | 2/01/12 | | | | — | | | | (11,359 | ) |
British Pound | | | MSCO | | | | Buy | | | | 450,886 | | | | 710,738 | | | | | | 2/01/12 | | | | — | | | | (10,618 | ) |
British Pound | | | BZWS | | | | Buy | | | | 48,594 | | | | 76,617 | | | | | | 2/01/12 | | | | — | | | | (1,162 | ) |
Euro | | | UBSW | | | | Sell | | | | 5,540,000 | | | | 7,543,763 | | | | | | 2/01/12 | | | | 371,672 | | | | — | |
Philippine Peso | | | DBAB | | | | Buy | | | | 155,800,000 | | | | 3,505,772 | | | | | | 2/03/12 | | | | 42,260 | | | | — | |
Philippine Peso | | | HSBC | | | | Buy | | | | 99,500,000 | | | | 2,237,354 | | | | | | 2/03/12 | | | | 28,559 | | | | — | |
Indian Rupee | | | JPHQ | | | | Buy | | | | 21,500,000 | | | | 445,873 | | | | | | 2/06/12 | | | | — | | | | (43,618 | ) |
TGB-22
Franklin Templeton Variable Insurance Products Trust
Statement of Investments, December 31, 2011 (continued)
| | | | | | |
| Templeton Global Bond Securities Fund | | | | | | |
Forward Exchange Contracts (continued)
| | | | | | | | | | | | | | | | | | | | | | | | | | | | | | | | |
| Currency | | Counterparty | | | Type | | | Quantity | | | Contract
Amount* | | | | | | Settlement
Date | | | Unrealized
Appreciation | | | Unrealized
Depreciation | |
Philippine Peso | | | HSBC | | | | Buy | | | | 84,800,000 | | | | 1,916,384 | | | | | | | | 2/06/12 | | | $ | 14,458 | | | $ | — | |
Philippine Peso | | | JPHQ | | | | Buy | | | | 60,500,000 | | | | 1,362,613 | | | | | | | | 2/07/12 | | | | 14,861 | | | | — | |
Singapore Dollar | | | HSBC | | | | Buy | | | | 6,206,000 | | | | 4,860,284 | | | | | | | | 2/07/12 | | | | — | | | | (76,226 | ) |
Singapore Dollar | | | DBAB | | | | Buy | | | | 6,207,000 | | | | 4,860,459 | | | | | | | | 2/07/12 | | | | — | | | | (75,629 | ) |
Australian Dollar | | | UBSW | | | | Buy | | | | 10,557,970 | | | | 10,238,591 | | | | | | | | 2/08/12 | | | | 510,979 | | | | — | |
Australian Dollar | | | MSCO | | | | Buy | | | | 10,560,886 | | | | 10,268,877 | | | | | | | | 2/08/12 | | | | 483,661 | | | | — | |
Euro | | | UBSW | | | | Sell | | | | 4,929,000 | | | | 6,676,084 | | | | | | | | 2/08/12 | | | | 294,562 | | | | — | |
Euro | | | CITI | | | | Sell | | | | 6,572,000 | | | | 8,878,181 | | | | | | | | 2/08/12 | | | | 369,484 | | | | — | |
Euro | | | HSBC | | | | Sell | | | | 1,200,000 | | | | 1,621,680 | | | | | | | | 2/08/12 | | | | 68,053 | | | | — | |
Norwegian Krone | | | UBSW | | | | Buy | | | | 72,121,400 | | | | 9,100,722 | | | | EUR | | | | 2/08/12 | | | | 259,205 | | | | — | |
Singapore Dollar | | | DBAB | | | | Buy | | | | 12,363,000 | | | | 9,721,129 | | | | | | | | 2/08/12 | | | | — | | | | (190,785 | ) |
Australian Dollar | | | DBAB | | | | Buy | | | | 3,351,000 | | | | 265,995,678 | | | | JPY | | | | 2/09/12 | | | | — | | | | (46,932 | ) |
Australian Dollar | | | CITI | | | | Buy | | | | 3,351,000 | | | | 265,901,850 | | | | JPY | | | | 2/09/12 | | | | — | | | | (45,712 | ) |
Australian Dollar | | | BZWS | | | | Buy | | | | 3,351,000 | | | | 265,734,300 | | | | JPY | | | | 2/09/12 | | | | — | | | | (43,533 | ) |
Euro | | | JPHQ | | | | Sell | | | | 300,000 | | | | 405,840 | | | | | | | | 2/09/12 | | | | 17,430 | | | | — | |
Euro | | | HSBC | | | | Sell | | | | 600,000 | | | | 806,880 | | | | | | | | 2/09/12 | | | | 30,059 | | | | — | |
Euro | | | BZWS | | | | Sell | | | | 800,000 | | | | 1,078,400 | | | | | | | | 2/09/12 | | | | 42,639 | | | | — | |
Euro | | | DBAB | | | | Sell | | | | 180,000 | | | | 242,431 | | | | | | | | 2/09/12 | | | | 9,385 | | | | — | |
Norwegian Krone | | | UBSW | | | | Buy | | | | 100,802,700 | | | | 12,673,686 | | | | EUR | | | | 2/09/12 | | | | 421,309 | | | | — | |
Norwegian Krone | | | DBAB | | | | Buy | | | | 144,025,000 | | | | 18,112,935 | | | | EUR | | | | 2/09/12 | | | | 595,472 | | | | — | |
Polish Zloty | | | DBAB | | | | Buy | | | | 17,528,000 | | | | 4,407,896 | | | | EUR | | | | 2/09/12 | | | | — | | | | (647,273 | ) |
Singapore Dollar | | | BZWS | | | | Buy | | | | 1,717,028 | | | | 1,347,894 | | | | | | | | 2/09/12 | | | | — | | | | (24,278 | ) |
Chilean Peso | | | DBAB | | | | Buy | | | | 1,145,000,000 | | | | 2,326,290 | | | | | | | | 2/10/12 | | | | — | | | | (134,869 | ) |
Euro | | | BZWS | | | | Sell | | | | 612,000 | | | | 829,872 | | | | | | | | 2/10/12 | | | | 37,507 | | | | — | |
Japanese Yen | | | HSBC | | | | Sell | | | | 413,563,000 | | | | 5,052,077 | | | | | | | | 2/10/12 | | | | — | | | | (325,026 | ) |
Japanese Yen | | | MSCO | | | | Sell | | | | 394,373,000 | | | | 4,826,319 | | | | | | | | 2/10/12 | | | | — | | | | (301,278 | ) |
Polish Zloty | | | BZWS | | | | Buy | | | | 17,528,000 | | | | 4,405,238 | | | | EUR | | | | 2/10/12 | | | | — | | | | (644,368 | ) |
Chilean Peso | | | BZWS | | | | Buy | | | | 1,142,900,000 | | | | 2,319,196 | | | | | | | | 2/13/12 | | | | — | | | | (132,393 | ) |
Chilean Peso | | | DBAB | | | | Buy | | | | 1,058,220,000 | | | | 2,149,980 | | | | | | | | 2/13/12 | | | | — | | | | (125,201 | ) |
Euro | | | UBSW | | | | Sell | | | | 657,000 | | | | 892,055 | | | | | | | | 2/13/12 | | | | 41,403 | | | | — | |
Singapore Dollar | | | HSBC | | | | Buy | | | | 6,117,200 | | | | 4,803,595 | | | | | | | | 2/13/12 | | | | — | | | | (87,991 | ) |
British Pound | | | BZWS | | | | Buy | | | | 2,562,230 | | | | 4,082,606 | | | | | | | | 2/14/12 | | | | — | | | | (104,567 | ) |
Chilean Peso | | | MSCO | | | | Buy | | | | 1,963,430,000 | | | | 4,038,733 | | | | | | | | 2/14/12 | | | | — | | | | (282,285 | ) |
Chilean Peso | | | DBAB | | | | Buy | | | | 1,130,600,000 | | | | 2,305,465 | | | | | | | | 2/14/12 | | | | — | | | | (142,393 | ) |
Malaysian Ringgit | | | DBAB | | | | Buy | | | | 97,443,480 | | | | 31,603,632 | | | | | | | | 2/14/12 | | | | — | | | | (954,218 | ) |
Polish Zloty | | | DBAB | | | | Buy | | | | 17,528,000 | | | | 4,365,194 | | | | EUR | | | | 2/14/12 | | | | — | | | | (594,669 | ) |
Singapore Dollar | | | HSBC | | | | Buy | | | | 4,404,400 | | | | 3,458,582 | | | | | | | | 2/14/12 | | | | — | | | | (63,334 | ) |
Japanese Yen | | | JPHQ | | | | Sell | | | | 144,920,000 | | | | 1,765,595 | | | | | | | | 2/15/12 | | | | — | | | | (118,817 | ) |
Japanese Yen | | | DBAB | | | | Sell | | | | 123,057,280 | | | | 1,497,958 | | | | | | | | 2/15/12 | | | | — | | | | (102,170 | ) |
Chilean Peso | | | MSCO | | | | Buy | | | | 3,554,470,000 | | | | 7,382,077 | | | | | | | | 2/16/12 | | | | — | | | | (582,881 | ) |
Euro | | | JPHQ | | | | Sell | | | | 1,971,000 | | | | 2,636,410 | | | | | | | | 2/16/12 | | | | 84,380 | | | | — | |
Euro | | | UBSW | | | | Sell | | | | 1,971,000 | | | | 2,637,533 | | | | | | | | 2/16/12 | | | | 85,503 | | | | — | |
Euro | | | DBAB | | | | Sell | | | | 2,038,000 | | | | 2,734,629 | | | | | | | | 2/17/12 | | | | 95,823 | | | | — | |
Malaysian Ringgit | | | HSBC | | | | Buy | | | | 4,899,000 | | | | 1,582,569 | | | | | | | | 2/17/12 | | | | — | | | | (41,869 | ) |
Singapore Dollar | | | HSBC | | | | Buy | | | | 7,334,000 | | | | 5,736,724 | | | | | | | | 2/17/12 | | | | — | | | | (83,117 | ) |
Singapore Dollar | | | DBAB | | | | Buy | | | | 7,334,000 | | | | 5,736,544 | | | | | | | | 2/17/12 | | | | — | | | | (82,938 | ) |
Singapore Dollar | | | BZWS | | | | Buy | | | | 4,886,000 | | | | 3,824,209 | | | | | | | | 2/17/12 | | | | — | | | | (57,707 | ) |
Chilean Peso | | | DBAB | | | | Buy | | | | 1,455,470,000 | | | | 3,009,657 | | | | | | | | 2/21/12 | | | | — | | | | (226,818 | ) |
Chilean Peso | | | JPHQ | | | | Buy | | | | 1,055,800,000 | | | | 2,167,411 | | | | | | | | 2/21/12 | | | | — | | | | (148,736 | ) |
Euro | | | UBSW | | | | Sell | | | | 2,038,000 | | | | 2,728,495 | | | | | | | | 2/21/12 | | | | 89,586 | | | | — | |
Chilean Peso | | | JPHQ | | | | Buy | | | | 1,792,000,000 | | | | 3,719,772 | | | | | | | | 2/22/12 | | | | — | | | | (293,805 | ) |
Japanese Yen | | | HSBC | | | | Sell | | | | 385,460,000 | | | | 4,651,662 | | | | | | | | 2/22/12 | | | | — | | | | (361,179 | ) |
TGB-23
Franklin Templeton Variable Insurance Products Trust
Statement of Investments, December 31, 2011 (continued)
| | | | | | |
| Templeton Global Bond Securities Fund | | | | | | |
Forward Exchange Contracts (continued)
| | | | | | | | | | | | | | | | | | | | | | | | | | | | | | |
| Currency | | Counterparty | | | Type | | | Quantity | | | Contract
Amount* | | | | | Settlement
Date | | | Unrealized
Appreciation | | | Unrealized
Depreciation | |
Chilean Peso | | | DBAB | | | | Buy | | | | 1,435,490,000 | | | | 2,965,643 | | | | | | 2/23/12 | | | $ | — | | | $ | (221,506 | ) |
Japanese Yen | | | JPHQ | | | | Sell | | | | 385,700,000 | | | | 4,652,313 | | | | | | 2/23/12 | | | | — | | | | (363,744 | ) |
Singapore Dollar | | | DBAB | | | | Buy | | | | 9,547,000 | | | | 7,468,688 | | | | | | 2/24/12 | | | | — | | | | (109,132 | ) |
Chilean Peso | | | CITI | | | | Buy | | | | 2,285,090,000 | | | | 4,709,098 | | | | | | 2/27/12 | | | | — | | | | (342,426 | ) |
Chilean Peso | | | MSCO | | | | Buy | | | | 2,254,540,000 | | | | 4,646,859 | | | | | | 2/27/12 | | | | — | | | | (338,566 | ) |
Chilean Peso | | | DBAB | | | | Buy | | | | 2,094,920,000 | | | | 4,297,757 | | | | | | 2/27/12 | | | | — | | | | (294,488 | ) |
Euro | | | DBAB | | | | Sell | | | | 5,346,000 | | | | 7,284,299 | | | | | | 2/27/12 | | | | 361,617 | | | | — | |
Singapore Dollar | | | DBAB | | | | Buy | | | | 5,952,000 | | | | 4,667,869 | | | | | | 2/27/12 | | | | — | | | | (79,613 | ) |
Chilean Peso | | | MSCO | | | | Buy | | | | 1,559,200,000 | | | | 3,181,392 | | | | | | 2/28/12 | | | | — | | | | (202,123 | ) |
Chilean Peso | | | JPHQ | | | | Buy | | | | 593,800,000 | | | | 1,223,069 | | | | | | 2/28/12 | | | | — | | | | (88,455 | ) |
Chilean Peso | | | BZWS | | | | Buy | | | | 2,006,200,000 | | | | 4,086,779 | | | | | | 2/29/12 | | | | — | | | | (253,847 | ) |
Chilean Peso | | | DBAB | | | | Buy | | | | 790,050,000 | | | | 1,632,200 | | | | | | 2/29/12 | | | | — | | | | (122,775 | ) |
Euro | | | DBAB | | | | Sell | | | | 3,252,140 | | | | 4,444,049 | | | | | | 2/29/12 | | | | 232,673 | | | | — | |
Singapore Dollar | | | DBAB | | | | Buy | | | | 5,960,000 | | | | 4,668,212 | | | | | | 2/29/12 | | | | — | | | | (73,754 | ) |
Chilean Peso | | | DBAB | | | | Buy | | | | 1,253,970,000 | | | | 2,553,390 | | | | | | 3/01/12 | | | | — | | | | (157,907 | ) |
Chilean Peso | | | BZWS | | | | Buy | | | | 1,004,500,000 | | | | 2,043,328 | | | | | | 3/01/12 | | | | — | | | | (124,412 | ) |
Euro | | | DBAB | | | | Sell | | | | 1,530,900 | | | | 2,087,306 | | | | | | 3/01/12 | | | | 104,835 | | | | — | |
Japanese Yen | | | UBSW | | | | Sell | | | | 447,200,000 | | | | 5,501,021 | | | | | | 3/01/12 | | | | — | | | | (315,662 | ) |
Japanese Yen | | | JPHQ | | | | Sell | | | | 401,100,000 | | | | 4,934,793 | | | | | | 3/01/12 | | | | — | | | | (282,272 | ) |
Japanese Yen | | | HSBC | | | | Sell | | | | 400,800,000 | | | | 4,932,923 | | | | | | 3/01/12 | | | | — | | | | (280,240 | ) |
Chilean Peso | | | DBAB | | | | Buy | | | | 1,253,970,000 | | | | 2,553,390 | | | | | | 3/02/12 | | | | — | | | | (158,188 | ) |
Chilean Peso | | | DBAB | | | | Buy | | | | 1,328,230,000 | | | | 2,706,255 | | | | | | 3/05/12 | | | | — | | | | (170,100 | ) |
Euro | | | DBAB | | | | Sell | | | | 1,536,000 | | | | 2,099,251 | | | | | | 3/05/12 | | | | 110,083 | | | | — | |
Chilean Peso | | | DBAB | | | | Buy | | | | 1,320,220,000 | | | | 2,682,556 | | | | | | 3/07/12 | | | | — | | | | (162,286 | ) |
Euro | | | UBSW | | | | Sell | | | | 6,915,000 | | | | 9,567,248 | | | | | | 3/08/12 | | | | 611,791 | | | | — | |
Euro | | | MSCO | | | | Sell | | | | 5,225,000 | | | | 7,228,526 | | | | | | 3/08/12 | | | | 461,749 | | | | — | |
Euro | | | HSBC | | | | Sell | | | | 1,844,000 | | | | 2,548,408 | | | | | | 3/08/12 | | | | 160,286 | | | | — | |
Chilean Peso | | | DBAB | | | | Buy | | | | 1,284,460,000 | | | | 2,629,396 | | | | | | 3/09/12 | | | | — | | | | (177,965 | ) |
Chilean Peso | | | MSCO | | | | Buy | | | | 662,100,000 | | | | 1,346,279 | | | | | | 3/12/12 | | | | — | | | | (83,085 | ) |
Chilean Peso | | | DBAB | | | | Buy | | | | 2,600,220,000 | | | | 5,301,695 | | | | | | 3/15/12 | | | | — | | | | (342,579 | ) |
Japanese Yen | | | CITI | | | | Sell | | | | 286,112,008 | | | | 3,688,722 | | | | | | 3/15/12 | | | | — | | | | (33,907 | ) |
Australian Dollar | | | CITI | | | | Buy | | | | 16,742,000 | | | | 15,737,313 | | | | | | 3/19/12 | | | | 1,237,293 | | | | — | |
Japanese Yen | | | CITI | | | | Sell | | | | 407,702,000 | | | | 5,074,644 | | | | | | 3/19/12 | | | | — | | | | (230,491 | ) |
Japanese Yen | | | UBSW | | | | Sell | | | | 330,530,000 | | | | 4,114,396 | | | | | | 3/19/12 | | | | — | | | | (186,555 | ) |
Japanese Yen | | | MSCO | | | | Sell | | | | 244,700,000 | | | | 3,044,896 | | | | | | 3/19/12 | | | | — | | | | (139,211 | ) |
Singapore Dollar | | | JPHQ | | | | Buy | | | | 11,426,000 | | | | 8,934,240 | | | | | | 3/19/12 | | | | — | | | | (124,850 | ) |
Singapore Dollar | | | HSBC | | | | Buy | | | | 9,120,000 | | | | 7,147,559 | | | | | | 3/19/12 | | | | — | | | | (116,084 | ) |
Singapore Dollar | | | DBAB | | | | Buy | | | | 7,978,100 | | | | 6,254,047 | | | | | | 3/19/12 | | | | — | | | | (102,970 | ) |
Australian Dollar | | | DBAB | | | | Buy | | | | 8,192,166 | | | | 7,679,992 | | | | | | 3/21/12 | | | | 624,272 | | | | — | |
Chilean Peso | | | JPHQ | | | | Buy | | | | 1,065,000,000 | | | | 2,137,481 | | | | | | 3/21/12 | | | | — | | | | (107,747 | ) |
Singapore Dollar | | | DBAB | | | | Buy | | | | 8,589,700 | | | | 6,700,757 | | | | | | 3/21/12 | | | | — | | | | (78,037 | ) |
Singapore Dollar | | | HSBC | | | | Buy | | | | 6,864,000 | | | | 5,360,615 | | | | | | 3/21/12 | | | | — | | | | (68,423 | ) |
Australian Dollar | | | DBAB | | | | Buy | | | | 537,776 | | | | 503,606 | | | | | | 3/22/12 | | | | 41,472 | | | | — | |
Japanese Yen | | | UBSW | | | | Sell | | | | 242,774,840 | | | | 3,005,643 | | | | | | 3/23/12 | | | | — | | | | (153,703 | ) |
Euro | | | DBAB | | | | Sell | | | | 2,736,000 | | | | 3,829,333 | | | | | | 3/26/12 | | | | 285,253 | | | | — | |
Malaysian Ringgit | | | DBAB | | | | Buy | | | | 16,025,000 | | | | 5,047,403 | | | | | | 3/26/12 | | | | — | | | | (14,070 | ) |
Malaysian Ringgit | | | HSBC | | | | Buy | | | | 7,634,000 | | | | 2,403,463 | | | | | | 3/26/12 | | | | — | | | | (5,681 | ) |
Singapore Dollar | | | MSCO | | | | Buy | | | | 10,570,700 | | | | 8,235,134 | | | | | | 3/26/12 | | | | — | | | | (84,735 | ) |
Singapore Dollar | | | FBCO | | | | Buy | | | | 10,578,000 | | | | 8,235,111 | | | | | | 3/26/12 | | | | — | | | | (79,084 | ) |
British Pound | | | MSCO | | | | Buy | | | | 2,852,773 | | | | 4,545,238 | | | | | | 3/29/12 | | | | — | | | | (118,112 | ) |
British Pound | | | DBAB | | | | Buy | | | | 2,853,149 | | | | 4,545,238 | | | | | | 3/29/12 | | | | — | | | | (117,528 | ) |
British Pound | | | BZWS | | | | Buy | | | | 5,722,896 | | | | 9,090,477 | | | | | | 3/30/12 | | | | — | | | | (209,396 | ) |
TGB-24
Franklin Templeton Variable Insurance Products Trust
Statement of Investments, December 31, 2011 (continued)
| | | | | | |
| Templeton Global Bond Securities Fund | | | | | | |
Forward Exchange Contracts (continued)
| | | | | | | | | | | | | | | | | | | | | | | | | | | | | | | | |
| Currency | | Counterparty | | | Type | | | Quantity | | | Contract
Amount* | | | | | | Settlement
Date | | | Unrealized
Appreciation | | | Unrealized
Depreciation | |
Chilean Peso | | | DBAB | | | | Buy | | | | 1,252,750,000 | | | | 2,510,018 | | | | | | | | 3/30/12 | | | $ | — | | | $ | (124,883 | ) |
New Israeli Shekel | | | MSCO | | | | Buy | | | | 9,296,110 | | | | 2,596,996 | | | | | | | | 3/30/12 | | | | — | | | | (161,179 | ) |
British Pound | | | FBCO | | | | Buy | | | | 3,431,879 | | | | 5,454,285 | | | | | | | | 4/02/12 | | | | — | | | | (128,694 | ) |
Chilean Peso | | | DBAB | | | | Buy | | | | 1,330,940,000 | | | | 2,656,408 | | | | | | | | 4/02/12 | | | | — | | | | (123,018 | ) |
Euro | | | DBAB | | | | Sell | | | | 3,712,000 | | | | 5,214,432 | | | | | | | | 4/04/12 | | | | 405,455 | | | | — | |
Euro | | | DBAB | | | | Sell | | | | 2,488,000 | | | | 3,482,304 | | | | | | | | 4/05/12 | | | | 258,994 | | | | — | |
Euro | | | DBAB | | | | Sell | | | | 7,243,000 | | | | 10,201,041 | | | | | | | | 4/10/12 | | | | 816,668 | | | | — | |
Euro | | | HSBC | | | | Sell | | | | 8,692,000 | | | | 12,212,434 | | | | | | | | 4/10/12 | | | | 950,667 | | | | — | |
Euro | | | UBSW | | | | Sell | | | | 4,346,000 | | | | 6,102,436 | | | | | | | | 4/10/12 | | | | 471,553 | | | | — | |
Indian Rupee | | | DBAB | | | | Buy | | | | 159,915,000 | | | | 3,413,340 | | | | | | | | 4/11/12 | | | | — | | | | (453,447 | ) |
Euro | | | UBSW | | | | Sell | | | | 3,907,000 | | | | 5,569,722 | | | | | | | | 4/12/12 | | | | 507,464 | | | | — | |
Indian Rupee | | | DBAB | | | | Buy | | | | 342,913,000 | | | | 7,346,037 | | | | | | | | 4/13/12 | | | | — | | | | (1,000,986 | ) |
Chilean Peso | | | MSCO | | | | Buy | | | | 2,645,530,000 | | | | 5,374,363 | | | | | | | | 4/16/12 | | | | — | | | | (344,379 | ) |
Euro | | | HSBC | | | | Sell | | | | 6,919,000 | | | | 9,915,481 | | | | | | | | 4/16/12 | | | | 950,029 | | | | — | |
Indian Rupee | | | JPHQ | | | | Buy | | | | 230,330,000 | | | | 4,921,581 | | | | | | | | 4/16/12 | | | | — | | | | (661,693 | ) |
Indian Rupee | | | JPHQ | | | | Buy | | | | 226,092,000 | | | | 4,802,294 | | | | | | | | 4/18/12 | | | | — | | | | (622,093 | ) |
Indian Rupee | | | JPHQ | | | | Buy | | | | 112,941,000 | | | | 2,396,880 | | | | | | | | 4/19/12 | | | | — | | | | (309,047 | ) |
Indian Rupee | | | DBAB | | | | Buy | | | | 79,271,000 | | | | 1,678,404 | | | | | | | | 4/19/12 | | | | — | | | | (212,996 | ) |
Malaysian Ringgit | | | JPHQ | | | | Buy | | | | 4,069,213 | | | | 1,329,330 | | | | | | | | 4/19/12 | | | | — | | | | (51,795 | ) |
Chilean Peso | | | MSCO | | | | Buy | | | | 2,370,410,000 | | | | 4,788,707 | | | | | | | | 4/20/12 | | | | — | | | | (283,263 | ) |
Japanese Yen | | | UBSW | | | | Sell | | | | 261,900,000 | | | | 3,188,653 | | | | | | | | 4/20/12 | | | | — | | | | (221,992 | ) |
Japanese Yen | | | CITI | | | | Sell | | | | 261,800,000 | | | | 3,189,299 | | | | | | | | 4/20/12 | | | | — | | | | (220,044 | ) |
Euro | | | DBAB | | | | Sell | | | | 4,545,000 | | | | 6,425,948 | | | | | | | | 4/23/12 | | | | 535,996 | | | | — | |
Malaysian Ringgit | | | JPHQ | | | | Buy | | | | 11,659,000 | | | | 3,812,498 | | | | | | | | 4/23/12 | | | | — | | | | (152,390 | ) |
Indian Rupee | | | DBAB | | | | Buy | | | | 160,601,000 | | | | 3,410,512 | | | | | | | | 4/26/12 | | | | — | | | | (444,874 | ) |
Chilean Peso | | | JPHQ | | | | Buy | | | | 1,501,938,000 | | | | 3,045,910 | | | | | | | | 4/27/12 | | | | — | | | | (192,780 | ) |
Indian Rupee | | | JPHQ | | | | Buy | | | | 136,582,000 | | | | 2,896,755 | | | | | | | | 4/27/12 | | | | — | | | | (375,042 | ) |
Chilean Peso | | | CITI | | | | Buy | | | | 2,420,966,000 | | | | 4,976,292 | | | | | | | | 4/30/12 | | | | — | | | | (378,456 | ) |
Indian Rupee | | | JPHQ | | | | Buy | | | | 113,782,000 | | | | 2,415,754 | | | | | | | | 4/30/12 | | | | — | | | | (315,979 | ) |
Indian Rupee | | | DBAB | | | | Buy | | | | 71,377,981 | | | | 1,505,547 | | | | | | | | 4/30/12 | | | | — | | | | (188,312 | ) |
Swedish Krona | | | BZWS | | | | Buy | | | | 122,773,200 | | | | 13,607,901 | | | | EUR | | | | 4/30/12 | | | | 118,922 | | | | — | |
Euro | | | DBAB | | | | Sell | | | | 2,045,000 | | | | 2,991,017 | | | | | | | | 5/07/12 | | | | 340,263 | | | | — | |
Euro | | | FBCO | | | | Sell | | | | 1,731,000 | | | | 2,537,646 | | | | | | | | 5/07/12 | | | | 293,903 | | | | — | |
Euro | | | BZWS | | | | Sell | | | | 1,259,000 | | | | 1,850,818 | | | | | | | | 5/07/12 | | | | 218,887 | | | | — | |
Euro | | | MSCO | | | | Sell | | | | 1,259,000 | | | | 1,851,970 | | | | | | | | 5/07/12 | | | | 220,039 | | | | — | |
Euro | | | DBAB | | | | Sell | | | | 1,259,000 | | | | 1,816,422 | | | | | | | | 5/09/12 | | | | 184,439 | | | | — | |
Euro | | | UBSW | | | | Sell | | | | 629,000 | | | | 902,238 | | | | | | | | 5/09/12 | | | | 86,894 | | | | — | |
Japanese Yen | | | CITI | | | | Sell | | | | 733,721,000 | | | | 9,128,949 | | | | | | | | 5/10/12 | | | | — | | | | (431,032 | ) |
Chilean Peso | | | MSCO | | | | Buy | | | | 1,150,200,000 | | | | 2,368,958 | | | | | | | | 5/11/12 | | | | — | | | | (186,458 | ) |
Japanese Yen | | | UBSW | | | | Sell | | | | 733,361,000 | | | | 9,122,540 | | | | | | | | 5/11/12 | | | | — | | | | (432,997 | ) |
Japanese Yen | | | DBAB | | | | Sell | | | | 490,555,000 | | | | 6,101,962 | | | | | | | | 5/11/12 | | | | — | | | | (289,865 | ) |
Euro | | | DBAB | | | | Sell | | | | 1,812,000 | | | | 2,538,521 | | | | | | | | 5/18/12 | | | | 189,368 | | | | — | |
Euro | | | DBAB | | | | Sell | | | | 2,642,000 | | | | 3,691,346 | | | | | | | | 5/21/12 | | | | 265,979 | | | | — | |
Euro | | | UBSW | | | | Sell | | | | 1,812,000 | | | | 2,531,002 | | | | | | | | 5/21/12 | | | | 181,734 | | | | — | |
Chilean Peso | | | MSCO | | | | Buy | | | | 420,740,000 | | | | 852,512 | | | | | | | | 5/22/12 | | | | — | | | | (54,864 | ) |
Euro | | | DBAB | | | | Sell | | | | 1,300,570 | | | | 1,740,065 | | | | | | | | 5/25/12 | | | | 53,761 | | | | — | |
Indian Rupee | | | DBAB | | | | Buy | | | | 217,594,000 | | | | 4,559,807 | | | | | | | | 6/01/12 | | | | — | | | | (564,173 | ) |
Indian Rupee | | | HSBC | | | | Buy | | | | 251,448,000 | | | | 5,326,160 | | | | | | | | 6/04/12 | | | | — | | | | (711,019 | ) |
Euro | | | DBAB | | | | Sell | | | | 785,200 | | | | 1,123,692 | | | | | | | | 6/06/12 | | | | 105,413 | | | | — | |
Euro | | | DBAB | | | | Sell | | | | 2,033,100 | | | | 2,927,969 | | | | | | | | 6/07/12 | | | | 291,321 | | | | — | |
Euro | | | UBSW | | | | Sell | | | | 1,057,200 | | | | 1,517,505 | | | | | | | | 6/07/12 | | | | 146,463 | | | | — | |
Indian Rupee | | | DBAB | | | | Buy | | | | 160,277,000 | | | | 3,379,945 | | | | | | | | 6/07/12 | | | | — | | | | (439,547 | ) |
TGB-25
Franklin Templeton Variable Insurance Products Trust
Statement of Investments, December 31, 2011 (continued)
| | | | | | |
| Templeton Global Bond Securities Fund | | | | | | |
Forward Exchange Contracts (continued)
| | | | | | | | | | | | | | | | | | | | | | | | | | | | | | | | |
| Currency | | Counterparty | | | Type | | | Quantity | | | Contract
Amount* | | | | | | Settlement
Date | | | Unrealized
Appreciation | | | Unrealized
Depreciation | |
Indian Rupee | | | HSBC | | | | Buy | | | | 42,784,000 | | | | 908,558 | | | | | | | | 6/08/12 | | | $ | — | | | $ | (123,776 | ) |
Polish Zloty | | | DBAB | | | | Buy | | | | 30,704,000 | | | | 7,583,856 | | | | EUR | | | | 6/08/12 | | | | — | | | | (1,059,465 | ) |
Polish Zloty | | | CITI | | | | Buy | | | | 5,990,000 | | | | 1,480,328 | | | | EUR | | | | 6/08/12 | | | | — | | | | (207,733 | ) |
Euro | | | DBAB | | | | Sell | | | | 16,210,600 | | | | 23,377,407 | | | | | | | | 6/11/12 | | | | 2,353,154 | | | | — | |
Indian Rupee | | | DBAB | | | | Buy | | | | 43,392,000 | | | | 921,078 | | | | | | | | 6/11/12 | | | | — | | | | (125,514 | ) |
Swedish Krona | | | DBAB | | | | Buy | | | | 41,300,000 | | | | 4,531,649 | | | | EUR | | | | 6/11/12 | | | | 88,274 | | | | — | |
Swedish Krona | | | MSCO | | | | Buy | | | | 55,369,800 | | | | 6,074,660 | | | | EUR | | | | 6/11/12 | | | | 119,384 | | | | — | |
Euro | | | DBAB | | | | Sell | | | | 6,935,000 | | | | 9,949,645 | | | | | | | | 6/13/12 | | | | 955,042 | | | | — | |
Indian Rupee | | | HSBC | | | | Buy | | | | 108,000,000 | | | | 2,292,994 | | | | | | | | 6/13/12 | | | | — | | | | (313,495 | ) |
Swedish Krona | | | BZWS | | | | Buy | | | | 24,372,000 | | | | 2,664,986 | | | | EUR | | | | 6/13/12 | | | | 63,754 | | | | — | |
Swedish Krona | | | MSCO | | | | Buy | | | | 27,990,100 | | | | 3,064,681 | | | | EUR | | | | 6/13/12 | | | | 67,940 | | | | — | |
Euro | | | DBAB | | | | Sell | | | | 1,448,000 | | | | 2,068,989 | | | | | | | | 6/14/12 | | | | 190,922 | | | | — | |
Swedish Krona | | | MSCO | | | | Buy | | | | 21,992,000 | | | | 2,398,444 | | | | EUR | | | | 6/14/12 | | | | 65,555 | | | | — | |
Japanese Yen | | | CITI | | | | Sell | | | | 310,702,000 | | | | 4,014,341 | | | | | | | | 6/15/12 | | | | — | | | | (37,715 | ) |
Indian Rupee | | | DBAB | | | | Buy | | | | 108,614,000 | | | | 2,300,657 | | | | | | | | 6/18/12 | | | | — | | | | (311,444 | ) |
Indian Rupee | | | DBAB | | | | Buy | | | | 98,937,000 | | | | 2,087,719 | | | | | | | | 6/20/12 | | | | — | | | | (276,296 | ) |
Indian Rupee | | | JPHQ | | | | Buy | | | | 79,054,000 | | | | 1,669,567 | | | | | | | | 6/22/12 | | | | — | | | | (222,626 | ) |
Indian Rupee | | | DBAB | | | | Buy | | | | 119,627,000 | | | | 2,538,773 | | | | | | | | 6/25/12 | | | | — | | | | (350,232 | ) |
Indian Rupee | | | HSBC | | | | Buy | | | | 80,337,000 | | | | 1,702,416 | | | | | | | | 6/27/12 | | | | — | | | | (233,128 | ) |
South Korean Won | | | DBAB | | | | Buy | | | | 10,730,000,000 | | | | 9,225,346 | | | | | | | | 6/27/12 | | | | — | | | | (52,446 | ) |
South Korean Won | | | DBAB | | | | Buy | | | | 10,710,000,000 | | | | 9,129,267 | | | | | | | | 6/27/12 | | | | 26,535 | | | | — | |
Malaysian Ringgit | | | JPHQ | | | | Buy | | | | 14,772,000 | | | | 4,766,853 | | | | | | | | 6/29/12 | | | | — | | | | (134,922 | ) |
Swedish Krona | | | UBSW | | | | Buy | | | | 302,991,000 | | | | 32,586,637 | | | | EUR | | | | 6/29/12 | | | | 1,467,682 | | | | — | |
Indian Rupee | | | DBAB | | | | Buy | | | | 79,423,000 | | | | 1,704,455 | | | | | | | | 7/11/12 | | | | — | | | | (254,307 | ) |
Indian Rupee | | | JPHQ | | | | Buy | | | | 127,745,000 | | | | 2,753,345 | | | | | | | | 7/12/12 | | | | — | | | | (421,185 | ) |
Indian Rupee | | | DBAB | | | | Buy | | | | 40,128,000 | | | | 861,351 | | | | | | | | 7/12/12 | | | | — | | | | (128,759 | ) |
Malaysian Ringgit | | | DBAB | | | | Buy | | | | 18,006,622 | | | | 5,897,043 | | | | | | | | 7/12/12 | | | | — | | | | (252,777 | ) |
Malaysian Ringgit | | | DBAB | | | | Buy | | | | 13,610,000 | | | | 4,466,835 | | | | | | | | 7/13/12 | | | | — | | | | (200,823 | ) |
Euro | | | DBAB | | | | Sell | | | | 2,243,000 | | | | 3,142,533 | | | | | | | | 7/16/12 | | | | 231,680 | | | | — | |
Euro | | | UBSW | | | | Sell | | | | 8,965,000 | | | | 12,558,620 | | | | | | | | 7/16/12 | | | | 924,294 | | | | — | |
Euro | | | MSCO | | | | Sell | | | | 7,888,000 | | | | 11,004,746 | | | | | | | | 7/16/12 | | | | 768,096 | | | | — | |
Euro | | | UBSW | | | | Sell | | | | 8,965,000 | | | | 12,571,171 | | | | | | | | 7/18/12 | | | | 936,401 | | | | — | |
Euro | | | DBAB | | | | Sell | | | | 3,518,000 | | | | 4,934,663 | | | | | | | | 7/18/12 | | | | 369,006 | | | | — | |
Euro | | | MSCO | | | | Sell | | | | 1,791,000 | | | | 2,507,400 | | | | | | | | 7/18/12 | | | | 183,042 | | | | — | |
Malaysian Ringgit | | | DBAB | | | | Buy | | | | 2,637,000 | | | | 865,896 | | | | | | | | 7/18/12 | | | | — | | | | (39,445 | ) |
Malaysian Ringgit | | | DBAB | | | | Buy | | | | 11,455,000 | | | | 2,669,790 | | | | EUR | | | | 7/18/12 | | | | 125,214 | | | | — | |
Euro | | | BZWS | | | | Sell | | | | 2,638,000 | | | | 3,696,102 | | | | | | | | 7/19/12 | | | | 272,442 | | | | — | |
Indian Rupee | | | JPHQ | | | | Buy | | | | 39,422,000 | | | | 848,332 | | | | | | | | 7/19/12 | | | | — | | | | (129,230 | ) |
Euro | | | MSCO | | | | Sell | | | | 12,182,000 | | | | 16,976,226 | | | | | | | | 7/20/12 | | | | 1,165,834 | | | | — | |
Euro | | | DBAB | | | | Sell | | | | 1,935,000 | | | | 2,699,035 | | | | | | | | 7/20/12 | | | | 187,698 | | | | — | |
Malaysian Ringgit | | | DBAB | | | | Buy | | | | 4,160,000 | | | | 1,361,880 | | | | | | | | 7/20/12 | | | | — | | | | (58,180 | ) |
Malaysian Ringgit | | | DBAB | | | | Buy | | | | 12,933,000 | | | | 3,036,058 | | | | EUR | | | | 7/20/12 | | | | 112,723 | | | | — | |
Euro | | | DBAB | | | | Sell | | | | 1,759,000 | | | | 2,467,437 | | | | | | | | 7/23/12 | | | | 184,391 | | | | — | |
Malaysian Ringgit | | | DBAB | | | | Buy | | | | 5,058,000 | | | | 1,667,216 | | | | | | | | 7/25/12 | | | | — | | | | (82,299 | ) |
Malaysian Ringgit | | | DBAB | | | | Buy | | | | 16,628,000 | | | | 3,885,501 | | | | EUR | | | | 7/25/12 | | | | 167,089 | | | | — | |
Malaysian Ringgit | | | JPHQ | | | | Buy | | | | 5,318,000 | | | | 1,763,964 | | | | | | | | 7/27/12 | | | | — | | | | (97,663 | ) |
Malaysian Ringgit | | | JPHQ | | | | Buy | | | | 16,628,000 | | | | 3,875,268 | | | | EUR | | | | 7/27/12 | | | | 179,907 | | | | — | |
Malaysian Ringgit | | | HSBC | | | | Buy | | | | 3,005,000 | | | | 1,009,745 | | | | | | | | 7/31/12 | | | | — | | | | (68,279 | ) |
Euro | | | BZWS | | | | Sell | | | | 185,174 | | | | 262,429 | | | | | | | | 8/01/12 | | | | 22,046 | | | | — | |
Euro | | | BZWS | | | | Sell | | | | 97,724 | | | | 139,325 | | | | | | | | 8/02/12 | | | | 12,463 | | | | — | |
Euro | | | DBAB | | | | Sell | | | | 5,724,900 | | | | 8,099,168 | | | | | | | | 8/06/12 | | | | 666,706 | | | | — | |
Euro | | | BZWS | | | | Sell | | | | 2,762,518 | | | | 3,924,433 | | | | | | | | 8/06/12 | | | | 337,941 | | | | — | |
TGB-26
Franklin Templeton Variable Insurance Products Trust
Statement of Investments, December 31, 2011 (continued)
| | | | | | |
| Templeton Global Bond Securities Fund | | | | | | |
Forward Exchange Contracts (continued)
| | | | | | | | | | | | | | | | | | | | | | | | | | | | | | | | |
| Currency | | Counterparty | | | Type | | | Quantity | | | Contract
Amount* | | | | | | Settlement
Date | | | Unrealized
Appreciation | | | Unrealized
Depreciation | |
Malaysian Ringgit | | | JPHQ | | | | Buy | | | | 1,100,000 | | | | 365,509 | | | | | | | | 8/06/12 | | | $ | — | | | $ | (20,934 | ) |
Euro | | | CITI | | | | Sell | | | | 1,210,637 | | | | 1,699,674 | | | | | | | | 8/08/12 | | | | 127,881 | | | | — | |
Euro | | | DBAB | | | | Sell | | | | 6,343,900 | | | | 8,927,453 | | | | | | | | 8/08/12 | | | | 691,049 | | | | — | |
Malaysian Ringgit | | | HSBC | | | | Buy | | | | 6,100,000 | | | | 2,030,220 | | | | | | | | 8/08/12 | | | | — | | | | (119,492 | ) |
Euro | | | CITI | | | | Sell | | | | 351,512 | | | | 494,595 | | | | | | | | 8/09/12 | | | | 38,212 | | | | — | |
Euro | | | DBAB | | | | Sell | | | | 4,845,000 | | | | 6,861,651 | | | | | | | | 8/09/12 | | | | 571,177 | | | | — | |
South Korean Won | | | HSBC | | | | Buy | | | | 21,363,430,000 | | | | 19,660,804 | | | | | | | | 8/09/12 | | | | — | | | | (1,409,747 | ) |
Euro | | | DBAB | | | | Sell | | | | 2,166,000 | | | | 3,061,186 | | | | | | | | 8/10/12 | | | | 248,920 | | | | — | |
Euro | | | DBAB | | | | Sell | | | | 4,115,000 | | | | 5,828,152 | | | | | | | | 8/13/12 | | | | 485,061 | | | | — | |
Polish Zloty | | | DBAB | | | | Buy | | | | 59,155,000 | | | | 13,945,073 | | | | EUR | | | | 8/16/12 | | | | — | | | | (1,278,338 | ) |
Euro | | | BZWS | | | | Sell | | | | 19,627,000 | | | | 28,201,112 | | | | | | | | 8/20/12 | | | | 2,713,177 | | | | — | |
Euro | | | FBCO | | | | Sell | | | | 7,851,000 | | | | 11,275,606 | | | | | | | | 8/20/12 | | | | 1,080,173 | | | | — | |
Euro | | | DBAB | | | | Sell | | | | 7,851,000 | | | | 11,258,098 | | | | | | | | 8/20/12 | | | | 1,062,665 | | | | — | |
Euro | | | MSCO | | | | Sell | | | | 3,925,000 | | | | 5,631,786 | | | | | | | | 8/20/12 | | | | 534,719 | | | | — | |
Japanese Yen | | | UBSW | | | | Sell | | | | 758,781,000 | | | | 9,947,313 | | | | | | | | 8/20/12 | | | | 33,913 | | | | — | |
Japanese Yen | | | JPHQ | | | | Sell | | | | 377,047,000 | | | | 4,932,265 | | | | | | | | 8/20/12 | | | | 6,183 | | | | — | |
Japanese Yen | | | DBAB | | | | Sell | | | | 461,885,000 | | | | 6,045,536 | | | | | | | | 8/20/12 | | | | 11,054 | | | | — | |
Japanese Yen | | | HSBC | | | | Sell | | | | 1,621,372,000 | | | | 21,274,729 | | | | | | | | 8/20/12 | | | | 91,663 | | | | — | |
Japanese Yen | | | BZWS | | | | Sell | | | | 376,247,000 | | | | 4,942,165 | | | | | | | | 8/22/12 | | | | 26,266 | | | | — | |
Japanese Yen | | | MSCO | | | | Sell | | | | 300,000,000 | | | | 3,940,421 | | | | | | | | 8/22/12 | | | | 20,736 | | | | — | |
Japanese Yen | | | DBAB | | | | Sell | | | | 376,727,000 | | | | 4,947,885 | | | | | | | | 8/22/12 | | | | 25,715 | | | | — | |
Euro | | | BZWS | | | | Sell | | | | 1,002,141 | | | | 1,441,079 | | | | | | | | 8/23/12 | | | | 139,608 | | | | — | |
Japanese Yen | | | FBCO | | | | Sell | | | | 746,218,000 | | | | 9,807,044 | | | | | | | | 8/23/12 | | | | 56,981 | | | | — | |
Japanese Yen | | | CITI | | | | Sell | | | | 751,731,000 | | | | 9,896,406 | | | | | | | | 8/23/12 | | | | 74,310 | | | | — | |
Japanese Yen | | | DBAB | | | | Sell | | | | 371,821,000 | | | | 4,902,929 | | | | | | | | 8/23/12 | | | | 44,727 | | | | — | |
Euro | | | BZWS | | | | Sell | | | | 1,678,784 | | | | 2,408,384 | | | | | | | | 8/24/12 | | | | 228,122 | | | | — | |
Indian Rupee | | | HSBC | | | | Buy | | | | 143,891,000 | | | | 3,048,648 | | | | | | | | 8/24/12 | | | | — | | | | (435,114 | ) |
Indian Rupee | | | DBAB | | | | Buy | | | | 124,700,000 | | | | 2,639,248 | | | | | | | | 8/24/12 | | | | — | | | | (374,286 | ) |
Japanese Yen | | | JPHQ | | | | Sell | | | | 750,133,000 | | | | 9,833,296 | | | | | | | | 8/24/12 | | | | 31,812 | | | | — | |
Euro | | | BZWS | | | | Sell | | | | 8,738,369 | | | | 12,570,326 | | | | | | | | 8/27/12 | | | | 1,221,027 | | | | — | |
Euro | | | HSBC | | | | Sell | | | | 18,537,726 | | | | 26,609,988 | | | | | | | | 8/27/12 | | | | 2,533,388 | | | | — | |
Japanese Yen | | | BZWS | | | | Sell | | | | 1,085,075,000 | | | | 14,227,693 | | | | | | | | 8/27/12 | | | | 48,586 | | | | — | |
Japanese Yen | | | DBAB | | | | Sell | | | | 685,950,000 | | | | 9,026,608 | | | | | | | | 8/27/12 | | | | 63,026 | | | | — | |
Japanese Yen | | | UBSW | | | | Sell | | | | 937,086,000 | | | | 12,324,808 | | | | | | | | 8/27/12 | | | | 79,533 | | | | — | |
Japanese Yen | | | JPHQ | | | | Sell | | | | 751,903,000 | | | | 9,886,956 | | | | | | | | 8/27/12 | | | | 61,540 | | | | — | |
Japanese Yen | | | HSBC | | | | Sell | | | | 1,247,125,000 | | | | 16,361,102 | | | | | | | | 8/27/12 | | | | 64,423 | | | | — | |
Malaysian Ringgit | | | JPHQ | | | | Buy | | | | 8,340,000 | | | | 2,788,645 | | | | | | | | 8/27/12 | | | | — | | | | (177,567 | ) |
Swedish Krona | | | UBSW | | | | Buy | | | | 30,000,000 | | | | 3,253,973 | | | | EUR | | | | 8/27/12 | | | | 99,551 | | | | — | |
United States Dollar | | | CITI | | | | Buy | | | | 7,760,297 | | | | 5,387,112 | | | | EUR | | | | 8/27/12 | | | | 763,573 | | | | — | |
United States Dollar | | | UBSW | | | | Buy | | | | 16,993,151 | | | | 11,812,119 | | | | EUR | | | | 8/27/12 | | | | 1,651,697 | | | | — | |
United States Dollar | | | JPHQ | | | | Buy | | | | 11,099,031 | | | | 7,711,034 | | | | EUR | | | | 8/27/12 | | | | 1,084,023 | | | | — | |
Euro | | | JPHQ | | | | Sell | | | | 6,190,317 | | | | 8,900,685 | | | | | | | | 8/29/12 | | | | 860,461 | | | | — | |
Euro | | | DBAB | | | | Sell | | | | 1,011,997 | | | | 1,448,775 | | | | | | | | 8/29/12 | | | | 134,354 | | | | — | |
Japanese Yen | | | BZWS | | | | Sell | | | | 890,300,000 | | | | 11,683,727 | | | | | | | | 8/30/12 | | | | 48,870 | | | | — | |
Euro | | | DBAB | | | | Sell | | | | 46,315 | | | | 66,985 | | | | | | | | 8/31/12 | | | | 6,827 | | | | — | |
Japanese Yen | | | JPHQ | | | | Sell | | | | 372,662,000 | | | | 4,883,848 | | | | | | | | 8/31/12 | | | | 13,593 | | | | — | |
Euro | | | DBAB | | | | Sell | | | | 541,000 | | | | 767,582 | | | | | | | | 9/06/12 | | | | 64,803 | | | | — | |
Indian Rupee | | | DBAB | | | | Buy | | | | 88,183,000 | | | | 1,858,088 | | | | | | | | 9/06/12 | | | | — | | | | (258,860 | ) |
Euro | | | BZWS | | | | Sell | | | | 1,033,224 | | | | 1,450,750 | | | | | | | | 9/10/12 | | | | 108,451 | | | | — | |
Euro | | | DBAB | | | | Sell | | | | 1,191,000 | | | | 1,665,983 | | | | | | | | 9/10/12 | | | | 118,712 | | | | — | |
Euro | | | BZWS | | | | Sell | | | | 1,012,110 | | | | 1,414,930 | | | | | | | | 9/12/12 | | | | 100,011 | | | | — | |
Euro | | | DBAB | | | | Sell | | | | 541,000 | | | | 740,256 | | | | | | | | 9/13/12 | | | | 37,383 | | | | — | |
TGB-27
Franklin Templeton Variable Insurance Products Trust
Statement of Investments, December 31, 2011 (continued)
| | | | | | |
| Templeton Global Bond Securities Fund | | | | | | |
Forward Exchange Contracts (continued)
| | | | | | | | | | | | | | | | | | | | | | | | | | | | | | | | |
| Currency | | Counterparty | | | Type | | | Quantity | | | Contract
Amount* | | | | | | Settlement
Date | | | Unrealized
Appreciation | | | Unrealized
Depreciation | |
Euro | | | BZWS | | | | Sell | | | | 2,890,070 | | | | 3,953,110 | | | | | | | | 9/14/12 | | | $ | 198,229 | | | $ | — | |
Euro | | | UBSW | | | | Sell | | | | 2,694,506 | | | | 3,693,359 | | | | | | | | 9/17/12 | | | | 192,362 | | | | — | |
Japanese Yen | | | BZWS | | | | Sell | | | | 285,057,504 | | | | 3,677,924 | | | | | | | | 9/18/12 | | | | — | | | | (49,274 | ) |
Euro | | | BZWS | | | | Sell | | | | 678,250 | | | | 940,190 | | | | | | | | 9/19/12 | | | | 58,900 | | | | — | |
Euro | | | BZWS | | | | Sell | | | | 1,647,381 | | | | 2,241,295 | | | | | | | | 9/24/12 | | | | 100,551 | | | | — | |
Euro | | | DBAB | | | | Sell | | | | 8,070,000 | | | | 11,027,953 | | | | | | | | 9/24/12 | | | | 541,124 | | | | — | |
Philippine Peso | | | DBAB | | | | Buy | | | | 165,158,000 | | | | 3,711,833 | | | | | | | | 9/24/12 | | | | 10,951 | | | | — | |
Euro | | | DBAB | | | | Sell | | | | 3,753,000 | | | | 5,077,396 | | | | | | | | 9/26/12 | | | | 200,241 | | | | — | |
Malaysian Ringgit | | | HSBC | | | | Buy | | | | 11,490,000 | | | | 3,605,271 | | | | | | | | 9/26/12 | | | | — | | | | (10,765 | ) |
Malaysian Ringgit | | | DBAB | | | | Buy | | | | 3,068,000 | | | | 961,349 | | | | | | | | 9/26/12 | | | | — | | | | (1,562 | ) |
South Korean Won | | | HSBC | | | | Buy | | | | 21,510,000,000 | | | | 18,213,995 | | | | | | | | 9/26/12 | | | | 148,507 | | | | — | |
Indian Rupee | | | DBAB | | | | Buy | | | | 25,000,000 | | | | 485,692 | | | | | | | | 9/27/12 | | | | — | | | | (33,404 | ) |
Euro | | | HSBC | | | | Sell | | | | 5,430,000 | | | | 7,294,553 | | | | | | | | 9/28/12 | | | | 237,782 | | | | — | |
Euro | | | DBAB | | | | Sell | | | | 14,880,000 | | | | 20,050,113 | | | | | | | | 9/28/12 | | | | 712,220 | | | | — | |
Euro | | | MSCO | | | | Sell | | | | 4,020,000 | | | | 5,461,472 | | | | | | | | 9/28/12 | | | | 237,121 | | | | — | |
Euro | | | FBCO | | | | Sell | | | | 12,170,000 | | | | 16,453,565 | | | | | | | | 9/28/12 | | | | 637,560 | | | | — | |
Hungary Forint | | | DBAB | | | | Buy | | | | 1,517,800,000 | | | | 6,921,755 | | | | | | | | 9/28/12 | | | | — | | | | (856,503 | ) |
Japanese Yen | | | JPHQ | | | | Sell | | | | 172,207,000 | | | | 2,268,867 | | | | | | | | 9/28/12 | | | | 16,585 | | | | — | |
Philippine Peso | | | HSBC | | | | Buy | | | | 49,600,000 | | | | 1,134,648 | | | | | | | | 9/28/12 | | | | — | | | | (16,692 | ) |
Philippine Peso | | | HSBC | | | | Buy | | | | 39,700,000 | | | | 904,431 | | | | | | | | 10/03/12 | | | | — | | | | (9,671 | ) |
Swedish Krona | | | DBAB | | | | Buy | | | | 340,320,000 | | | | 49,645,514 | | | | | | | | 10/03/12 | | | | — | | | | (611,724 | ) |
Philippine Peso | | | DBAB | | | | Buy | | | | 195,560,000 | | | | 4,490,471 | | | | | | | | 10/04/12 | | | | — | | | | (82,988 | ) |
Philippine Peso | | | HSBC | | | | Buy | | | | 156,866,000 | | | | 3,558,585 | | | | | | | | 10/04/12 | | | | — | | | | (23,179 | ) |
Euro | | | UBSW | | | | Sell | | | | 6,370,000 | | | | 8,488,184 | | | | | | | | 10/05/12 | | | | 208,586 | | | | — | |
Philippine Peso | | | DBAB | | | | Buy | | | | 233,811,000 | | | | 5,368,794 | | | | | | | | 10/05/12 | | | | — | | | | (99,286 | ) |
Philippine Peso | | | HSBC | | | | Buy | | | | 233,867,000 | | | | 5,271,906 | | | | | | | | 10/05/12 | | | | — | | | | (1,135 | ) |
Euro | | | DBAB | | | | Sell | | | | 12,680,000 | | | | 16,748,632 | | | | | | | | 10/09/12 | | | | 266,041 | | | | — | |
Philippine Peso | | | DBAB | | | | Buy | | | | 191,936,000 | | | | 4,409,787 | | | | | | | | 10/09/12 | | | | — | | | | (84,253 | ) |
Philippine Peso | | | JPHQ | | | | Buy | | | | 61,767,000 | | | | 1,416,025 | | | | | | | | 10/09/12 | | | | — | | | | (24,023 | ) |
Philippine Peso | | | HSBC | | | | Buy | | | | 230,704,000 | | | | 5,304,638 | | | | | | | | 10/11/12 | | | | — | | | | (105,544 | ) |
Philippine Peso | | | DBAB | | | | Buy | | | | 153,588,000 | | | | 3,528,325 | | | | | | | | 10/11/12 | | | | — | | | | (67,101 | ) |
Philippine Peso | | | JPHQ | | | | Buy | | | | 76,627,000 | | | | 1,756,694 | | | | | | | | 10/11/12 | | | | — | | | | (29,845 | ) |
Malaysian Ringgit | | | DBAB | | | | Buy | | | | 11,434,805 | | | | 3,598,680 | | | | | | | | 10/12/12 | | | | — | | | | (22,236 | ) |
Philippine Peso | | | JPHQ | | | | Buy | | | | 108,152,000 | | | | 2,500,624 | | | | | | | | 10/12/12 | | | | — | | | | (63,366 | ) |
Philippine Peso | | | DBAB | | | | Buy | | | | 45,732,000 | | | | 1,047,698 | | | | | | | | 10/12/12 | | | | — | | | | (17,104 | ) |
Malaysian Ringgit | | | DBAB | | | | Buy | | | | 4,934,783 | | | | 1,552,893 | | | | | | | | 10/15/12 | | | | — | | | | (9,514 | ) |
Philippine Peso | | | JPHQ | | | | Buy | | | | 194,374,000 | | | | 4,458,552 | | | | | | | | 10/15/12 | | | | — | | | | (78,403 | ) |
Philippine Peso | | | HSBC | | | | Buy | | | | 76,252,000 | | | | 1,747,496 | | | | | | | | 10/15/12 | | | | — | | | | (29,184 | ) |
Euro | | | HSBC | | | | Sell | | | | 12,569,000 | | | | 17,260,839 | | | | | | | | 10/17/12 | | | | 919,799 | | | | — | |
Norwegian Krone | | | BZWS | | | | Buy | | | | 61,773,000 | | | | 7,840,706 | | | | EUR | | | | 10/18/12 | | | | 38,348 | | | | — | |
Philippine Peso | | | HSBC | | | | Buy | | | | 154,149,000 | | | | 3,574,801 | | | | | | | | 10/19/12 | | | | — | | | | (101,282 | ) |
Philippine Peso | | | DBAB | | | | Buy | | | | 41,880,000 | | | | 959,011 | | | | | | | | 10/19/12 | | | | — | | | | (15,307 | ) |
Philippine Peso | | | DBAB | | | | Buy | | | | 167,411,000 | | | | 3,834,425 | | | | | | | | 10/22/12 | | | | — | | | | (62,208 | ) |
Philippine Peso | | | JPHQ | | | | Buy | | | | 84,061,000 | | | | 1,935,551 | | | | | | | | 10/22/12 | | | | — | | | | (41,432 | ) |
Chilean Peso | | | CITI | | | | Buy | | | | 921,291,798 | | | | 1,731,752 | | | | | | | | 10/24/12 | | | | — | | | | (5,680 | ) |
Euro | | | BZWS | | | | Sell | | | | 649,907 | | | | 893,037 | | | | | | | | 10/24/12 | | | | 47,965 | | | | — | |
Euro | | | BZWS | | | | Sell | | | | 4,954,399 | | | | 6,873,733 | | | | | | | | 10/25/12 | | | | 431,408 | | | | — | |
Euro | | | CITI | | | | Sell | | | | 1,935,410 | | | | 2,694,420 | | | | | | | | 10/26/12 | | | | 177,706 | | | | — | |
Chilean Peso | | | DBAB | | | | Buy | | | | 398,486,000 | | | | 763,749 | | | | | | | | 10/29/12 | | | | — | | | | (17,401 | ) |
Chilean Peso | | | BZWS | | | | Buy | | | | 199,342,000 | | | | 382,028 | | | | | | | | 10/29/12 | | | | — | | | | (8,668 | ) |
Indian Rupee | | | HSBC | | | | Buy | | | | 213,392,000 | | | | 4,137,549 | | | | | | | | 10/29/12 | | | | — | | | | (287,680 | ) |
Indian Rupee | | | DBAB | | | | Buy | | | | 208,500,000 | | | | 4,036,434 | | | | | | | | 10/29/12 | | | | — | | | | (274,824 | ) |
TGB-28
Franklin Templeton Variable Insurance Products Trust
Statement of Investments, December 31, 2011 (continued)
| | | | | | |
| Templeton Global Bond Securities Fund | | | | | | |
Forward Exchange Contracts (continued)
| | | | | | | | | | | | | | | | | | | | | | | | | | | | | | | | |
| Currency | | Counterparty | | | Type | | | Quantity | | | Contract
Amount* | | | | | | Settlement
Date | | | Unrealized
Appreciation | | | Unrealized
Depreciation | |
Norwegian Krone | | | BZWS | | | | Buy | | | | 61,766,000 | | | | 7,904,530 | | | | EUR | | | | 10/29/12 | | | $ | — | | | $ | (51,441 | ) |
Philippine Peso | | | JPHQ | | | | Buy | | | | 82,631,000 | | | | 1,919,821 | | | | | | | | 10/29/12 | | | | — | | | | (58,087 | ) |
Philippine Peso | | | MSCO | | | | Buy | | | | 17,610,000 | | | | 407,639 | | | | | | | | 10/29/12 | | | | — | | | | (10,873 | ) |
Euro | | | DBAB | | | | Sell | | | | 3,319,244 | | | | 4,679,503 | | | | | | | | 10/31/12 | | | | 362,867 | | | | — | |
Indian Rupee | | | DBAB | | | | Buy | | | | 440,314,000 | | | | 8,559,792 | | | | | | | | 10/31/12 | | | | — | | | | (617,334 | ) |
Indian Rupee | | | HSBC | | | | Buy | | | | 317,880,000 | | | | 6,178,426 | | | | | | | | 10/31/12 | | | | — | | | | (444,453 | ) |
Euro | | | DBAB | | | | Sell | | | | 224,556 | | | | 312,344 | | | | | | | | 11/02/12 | | | | 20,299 | | | | — | |
Euro | | | BZWS | | | | Sell | | | | 1,581,109 | | | | 2,179,717 | | | | | | | | 11/05/12 | | | | 123,289 | | | | — | |
Euro | | | BZWS | | | | Sell | | | | 8,969,211 | | | | 12,334,011 | | | | | | | | 11/08/12 | | | | 667,707 | | | | — | |
Japanese Yen | | | CITI | | | | Sell | | | | 341,992,119 | | | | 4,415,023 | | | | | | | | 11/08/12 | | | | — | | | | (63,356 | ) |
Norwegian Krone | | | UBSW | | | | Buy | | | | 47,173,200 | | | | 5,985,687 | | | | EUR | | | | 11/08/12 | | | | 23,547 | | | | — | |
Japanese Yen | | | BZWS | | | | Sell | | | | 335,950,000 | | | | 4,355,069 | | | | | | | | 11/13/12 | | | | — | | | | (44,847 | ) |
Japanese Yen | | | BZWS | | | | Sell | | | | 429,663,000 | | | | 5,572,802 | | | | | | | | 11/14/12 | | | | — | | | | (54,636 | ) |
Japanese Yen | | | UBSW | | | | Sell | | | | 340,600,700 | | | | 4,423,099 | | | | | | | | 11/14/12 | | | | — | | | | (37,861 | ) |
Philippine Peso | | | DBAB | | | | Buy | | | | 48,500,000 | | | | 1,121,647 | | | | | | | | 11/14/12 | | | | — | | | | (29,126 | ) |
Euro | | | BZWS | | | | Sell | | | | 10,778,730 | | | | 14,705,960 | | | | | | | | 11/15/12 | | | | 683,949 | | | | — | |
Japanese Yen | | | DBAB | | | | Sell | | | | 796,770,000 | | | | 10,433,980 | | | | | | | | 11/16/12 | | | | — | | | | (2,202 | ) |
Euro | | | UBSW | | | | Sell | | | | 4,794,427 | | | | 6,515,147 | | | | | | | | 11/19/12 | | | | 277,571 | | | | — | |
Euro | | | BZWS | | | | Sell | | | | 3,019,521 | | | | 4,139,310 | | | | | | | | 11/19/12 | | | | 210,897 | | | | — | |
Euro | | | DBAB | | | | Sell | | | | 933,877 | | | | 1,266,617 | | | | | | | | 11/19/12 | | | | 51,638 | | | | — | |
Japanese Yen | | | JPHQ | | | | Sell | | | | 397,873,000 | | | | 5,207,421 | | | | | | | | 11/19/12 | | | | — | | | | (4,432 | ) |
Japanese Yen | | | UBSW | | | | Sell | | | | 317,836,000 | | | | 4,168,341 | | | | | | | | 11/19/12 | | | | 4,915 | | | | — | |
Japanese Yen | | | HSBC | | | | Sell | | | | 207,909,000 | | | | 2,723,818 | | | | | | | | 11/19/12 | | | | 357 | | | | — | |
Japanese Yen | | | BZWS | | | | Sell | | | | 986,239,000 | | | | 12,942,769 | | | | | | | | 11/19/12 | | | | 23,738 | | | | — | |
Euro | | | BZWS | | | | Sell | | | | 10,515,154 | | | | 14,269,064 | | | | | | | | 11/21/12 | | | | 588,219 | | | | — | |
Japanese Yen | | | BZWS | | | | Sell | | | | 1,107,834,000 | | | | 14,557,608 | | | | | | | | 11/21/12 | | | | 44,900 | | | | — | |
Euro | | | BZWS | | | | Sell | | | | 4,730,771 | | | | 6,421,075 | | | | | | | | 11/23/12 | | | | 265,801 | | | | — | |
Euro | | | DBAB | | | | Sell | | | | 5,440,000 | | | | 7,321,696 | | | | | | | | 12/03/12 | | | | 242,150 | | | | — | |
Euro | | | HSBC | | | | Sell | | | | 2,155,292 | | | | 2,897,574 | | | | | | | | 12/07/12 | | | | 92,470 | | | | — | |
Euro | | | UBSW | | | | Sell | | | | 1,343,551 | | | | 1,798,948 | | | | | | | | 12/10/12 | | | | 50,210 | | | | — | |
Euro | | | BZWS | | | | Sell | | | | 5,095,000 | | | | 6,861,437 | | | | | | | | 12/12/12 | | | | 229,617 | | | | — | |
Malaysian Ringgit | | | JPHQ | | | | Buy | | | | 13,361,013 | | | | 4,138,330 | | | | | | | | 12/17/12 | | | | 36,739 | | | | — | |
Japanese Yen | | | JPHQ | | | | Sell | | | | 285,510,329 | | | | 3,694,970 | | | | | | | | 12/27/12 | | | | — | | | | (49,273 | ) |
| | | | | | | | | | | | | | | | | | | | | | | | | | | | |
Unrealized appreciation (depreciation) | | | | 58,119,290 | | | | (44,123,134 | ) |
| | | | | | | | | | | | | | | | | | | | | | | | | | | | |
Net unrealized appreciation (depreciation) | | | $ | 13,996,156 | | | | | |
| | | | | | | | | | | | | | | | | | | | | | | | | | | | | | | | |
*In U.S. dollars unless otherwise indicated.
At December 31, 2011, the Fund had the following interest rate swap contracts outstanding. See Note 1(d).
Interest Rate Swap Contracts
| | | | | | | | | | | | | | | | | | | | | | | | | | |
| Counterparty | | Pay/Receive
Floating Rate | | | Fixed
Rate | | | Floating Rate | | Notional
Amount* | | | Expiration
Date | | | Unrealized
Appreciation | | | Unrealized
Depreciation | |
JPHQ | | | Receive | | | | 3.558% | | | 3-month USD BBA LIBOR | | | 3,240,000 | | | | 3/4/21 | | | $ | — | | | $ | (479,748 | ) |
DBAB | | | Receive | | | | 3.523% | | | 3-month USD BBA LIBOR | | | 14,630,000 | | | | 3/28/21 | | | | — | | | | (2,100,146 | ) |
CITI | | | Receive | | | | 4.347% | | | 3-month USD BBA LIBOR | | | 7,460,000 | | | | 2/25/41 | | | | — | | | | (2,802,849 | ) |
JPHQ | | | Receive | | | | 4.349% | | | 3-month USD BBA LIBOR | | | 7,460,000 | | | | 2/25/41 | | | | — | | | | (2,888,155 | ) |
JPHQ | | | Receive | | | | 4.320% | | | 3-month USD BBA LIBOR | | | 5,600,000 | | | | 2/28/41 | | | | — | | | | (2,079,888 | ) |
JPHQ | | | Receive | | | | 4.299% | | | 3-month USD BBA LIBOR | | | 1,870,000 | | | | 3/1/41 | | | | — | | | | (682,813 | ) |
| | | | | | | | | | | | | | | | | | | | | | |
Net unrealized appreciation (depreciation) | | | | | | | | | | | | | | | | | $ | — | | | $ | (11,033,599 | ) |
| | | | | | | | | | | | | | | | | | | | | | |
*In U.S. Dollars unless otherwise indicated.
The accompanying notes are an integral part of these financial statements.
TGB-29
Franklin Templeton Variable Insurance Products Trust
Financial Statements
Statement of Assets and Liabilities
December 31, 2011
| | | | |
| | | Templeton
Global Bond
Securities Fund | |
Assets: | | | | |
Investments in securities: | | | | |
Cost - Unaffiliated issuers | | $ | 2,027,951,066 | |
Cost - Repurchase agreements | | | 186,697,298 | |
| | | | |
Total cost of investments | | $ | 2,214,648,364 | |
| | | | |
Value - Unaffiliated issuers | | $ | 2,065,411,739 | |
Value - Repurchase agreements | | | 186,697,298 | |
| | | | |
Total value of investments | | | 2,252,109,037 | |
Restricted cash (Note 1e) | | | 6,920,000 | |
Foreign currency, at value (cost $124,578,395) | | | 124,679,223 | |
Receivables: | | | | |
Investment securities sold | | | 121,134 | |
Capital shares sold | | | 9,296,517 | |
Interest | | | 29,257,286 | |
Due from brokers | | | 12,205,000 | |
Unrealized appreciation on forward exchange contracts | | | 58,119,290 | |
Other assets | | | 55 | |
| | | | |
Total assets | | | 2,492,707,542 | |
| | | | |
Liabilities: | | | | |
Payables: | | | | |
Capital shares redeemed | | | 1,815,032 | |
Affiliates | | | 1,854,413 | |
Funds advanced by custodian | | | 82,618 | |
Due to brokers | | | 6,920,000 | |
Unrealized depreciation on forward exchange contracts | | | 44,123,134 | |
Unrealized depreciation on swap contracts | | | 11,033,599 | |
Deferred tax | | | 5,397,098 | |
Accrued expenses and other liabilities | | | 1,344,089 | |
| | | | |
Total liabilities | | | 72,569,983 | |
| | | | |
Net assets, at value | | $ | 2,420,137,559 | |
| | | | |
Net assets consist of: | | | | |
Paid-in capital | | $ | 2,263,842,907 | |
Undistributed net investment income | | | 117,957,425 | |
Net unrealized appreciation (depreciation) | | | 34,069,657 | |
Accumulated net realized gain (loss) | | | 4,267,570 | |
| | | | |
Net assets, at value | | $ | 2,420,137,559 | |
| | | | |
The accompanying notes are an integral part of these financial statements.
TGB-30
Franklin Templeton Variable Insurance Products Trust
Financial Statements (continued)
Statement of Assets and Liabilities (continued)
December 31, 2011
| | | | |
| | | Templeton
Global Bond
Securities Fund | |
Class 1: | | | | |
Net assets, at value | | $ | 269,818,678 | |
| | | | |
Shares outstanding | | | 14,495,798 | |
| | | | |
Net asset value and maximum offering price per share | | $ | 18.61 | |
| | | | |
Class 2: | | | | |
Net assets, at value | | $ | 1,812,813,528 | |
| | | | |
Shares outstanding | | | 99,856,649 | |
| | | | |
Net asset value and maximum offering price per share | | $ | 18.15 | |
| | | | |
Class 3: | | | | |
Net assets, at value | | $ | 185,810,513 | |
| | | | |
Shares outstanding | | | 10,236,976 | |
| | | | |
Net asset value and maximum offering price per sharea | | $ | 18.15 | |
| | | | |
Class 4: | | | | |
Net assets, at value | | $ | 151,694,840 | |
| | | | |
Shares outstanding | | | 8,224,200 | |
| | | | |
Net asset value and maximum offering price per share | | $ | 18.44 | |
| | | | |
aRedemption price is equal to net asset value less redemption fees retained by the Fund.
The accompanying notes are an integral part of these financial statements.
TGB-31
Franklin Templeton Variable Insurance Products Trust
Financial Statements (continued)
Statement of Operations
for the year ended December 31, 2011
| | | | |
| | | Templeton
Global Bond
Securities Fund | |
Investment income: | | | | |
Interest (net of foreign taxes of $4,220,818) | | $ | 115,048,301 | |
| | | | |
Expenses: | | | | |
Management fees (Note 3a) | | | 10,704,656 | |
Distribution fees: (Note 3c) | | | | |
Class 2 | | | 4,232,572 | |
Class 3 | | | 481,772 | |
Class 4 | | | 557,170 | |
Unaffiliated transfer agent fees | | | 4,571 | |
Custodian fees (Note 4) | | | 1,534,910 | |
Reports to shareholders | | | 526,303 | |
Professional fees | | | 75,763 | |
Trustees’ fees and expenses | | | 8,325 | |
Other | | | 47,441 | |
| | | | |
Total expenses | | | 18,173,483 | |
Expense reductions (Note 4) | | | (19 | ) |
| | | | |
Net expenses | | | 18,173,464 | |
| | | | |
Net investment income | | | 96,874,837 | |
| | | | |
Realized and unrealized gains (losses): | | | | |
Net realized gain (loss) from: | | | | |
Investments | | | 53,540,262 | |
Foreign currency transactions | | | (227,615 | ) |
Futures contracts | | | 3,393 | |
Swap contracts | | | (711,473 | ) |
| | | | |
Net realized gain (loss) | | | 52,604,567 | |
| | | | |
Net change in unrealized appreciation (depreciation) on: | | | | |
Investments | | | (165,488,912 | ) |
Translation of other assets and liabilities denominated in foreign currencies | | | (9,182,902 | ) |
Change in deferred taxes on unrealized appreciation | | | (5,397,098 | ) |
| | | | |
Net change in unrealized appreciation (depreciation) | | | (180,068,912 | ) |
| | | | |
Net realized and unrealized gain (loss) | | | (127,464,345 | ) |
| | | | |
Net increase (decrease) in net assets resulting from operations | | $ | (30,589,508 | ) |
| | | | |
The accompanying notes are an integral part of these financial statements.
TGB-32
Franklin Templeton Variable Insurance Products Trust
Financial Statements (continued)
Statements of Changes in Net Assets
| | | | | | | | |
| | | Templeton Global Bond
Securities Fund | |
| | | Year Ended December 31, | |
| | | 2011 | | | 2010 | |
| | | | |
Increase (decrease) in net assets: | | | | | | | | |
Operations: | | | | | | | | |
Net investment income | | $ | 96,874,837 | | | $ | 93,415,601 | |
Net realized gain (loss) from investments, foreign currency transactions, futures contracts and swap contracts | | | 52,604,567 | | | | 26,725,973 | |
Net change in unrealized appreciation (depreciation) on investments, translation of other assets and liabilities denominated in foreign currencies and deferred taxes | | | (180,068,912 | ) | | | 123,023,722 | |
| | | | |
Net increase (decrease) in net assets resulting from operations | | | (30,589,508 | ) | | | 243,165,296 | |
| | | | |
Distributions to shareholders from: | | | | | | | | |
Net investment income and net foreign currency gains: | | | | | | | | |
Class 1 | | | (15,683,467 | ) | | | (3,860,853 | ) |
Class 2 | | | (93,946,669 | ) | | | (17,334,382 | ) |
Class 3 | | | (10,753,201 | ) | | | (2,167,994 | ) |
Class 4 | | | (8,615,701 | ) | | | (1,885,595 | ) |
Net realized gains: | | | | | | | | |
Class 1 | | | (1,762,080 | ) | | | (610,541 | ) |
Class 2 | | | (10,925,216 | ) | | | (3,135,836 | ) |
Class 3 | | | (1,252,885 | ) | | | (394,847 | ) |
Class 4 | | | (1,020,280 | ) | | | (338,834 | ) |
| | | | |
Total distributions to shareholders | | | (143,959,499 | ) | | | (29,728,882 | ) |
| | | | |
Capital share transactions: (Note 2) | | | | | | | | |
Class 1 | | | 17,171,380 | | | | 48,911,860 | |
Class 2 | | | 451,366,379 | | | | 75,615,219 | |
Class 3 | | | 16,706,473 | | | | 21,722,929 | |
Class 4 | | | 12,126,720 | | | | 26,968,281 | |
| | | | |
Total capital share transactions | | | 497,370,952 | | | | 173,218,289 | |
| | | | |
Redemption fees | | | 18,113 | | | | 23,708 | |
| | | | |
Net increase (decrease) in net assets | | | 322,840,058 | | | | 386,678,411 | |
Net assets: | | | | | | | | |
Beginning of year | | | 2,097,297,501 | | | | 1,710,619,090 | |
| | | | |
End of year | | $ | 2,420,137,559 | | | $ | 2,097,297,501 | |
| | | | |
Undistributed net investment income included in net assets: | | | | | | | | |
End of year | | $ | 117,957,425 | | | $ | 102,069,075 | |
| | | | |
The accompanying notes are an integral part of these financial statements.
TGB-33
Franklin Templeton Variable Insurance Products Trust
Notes to Financial Statements
Templeton Global Bond Securities Fund
1. ORGANIZATION AND SIGNIFICANT ACCOUNTING POLICIES
Franklin Templeton Variable Insurance Products Trust (Trust) is registered under the Investment Company Act of 1940, as amended, (1940 Act) as an open-end investment company, consisting of twenty separate funds. The Templeton Global Bond Securities Fund (Fund) is included in this report. The financial statements of the remaining funds in the Trust are presented separately. Shares of the Fund are generally sold only to insurance company separate accounts to fund the benefits of variable life insurance policies or variable annuity contracts. The Fund offers four classes of shares: Class 1, Class 2, Class 3, and Class 4. Each class of shares differs by its distribution fees, voting rights on matters affecting a single class and its exchange privilege.
The following summarizes the Fund’s significant accounting policies.
a. Financial Instrument Valuation
The Fund’s investments in securities and other financial instruments are carried at fair value daily. Fair value is the price that would be received to sell an asset or paid to transfer a liability in an orderly transaction between market participants on the measurement date. Under procedures approved by the Trust’s Board of Trustees, the Fund may utilize independent pricing services, quotations from securities and financial instrument dealers, and other market sources to determine fair value.
Debt securities generally trade in the over-the-counter market rather than on a securities exchange. The Fund’s pricing services use multiple valuation techniques to determine fair value. In instances where sufficient market activity exists, the pricing services may utilize a market-based approach through which quotes from market makers are used to determine fair value. In instances where sufficient market activity may not exist or is limited, the pricing services also utilize proprietary valuation models which may consider market characteristics such as benchmark yield curves, option-adjusted spreads, credit spreads, estimated default rates, coupon rates, anticipated timing of principal repayments, underlying collateral, and other unique security features in order to estimate the relevant cash flows, which are then discounted to calculate the fair value. Securities denominated in a foreign currency are converted into their U.S. dollar equivalent at the foreign exchange rate in effect at the close of the NYSE on the date that the values of the foreign debt securities are determined. Repurchase agreements are valued at cost, which approximates market value.
Certain derivative financial instruments (derivatives) trade in the over-the-counter market. The Fund’s pricing services use various techniques including industry standard option pricing models and proprietary discounted cash flow models to determine the fair value of those instruments. The Fund’s net benefit or obligation under the derivative contract, as measured by the fair market value of the contract, is included in net assets.
The Fund has procedures to determine the fair value of securities and other financial instruments for which market prices are not readily available or which may not be reliably priced. Under these procedures, the Fund primarily employs a market-based approach which may use related or comparable assets or liabilities, recent transactions, market multiples, book values, and other relevant information for the investment to determine the fair value of the investment. The Fund may also use an income-based valuation approach in which the anticipated future cash flows of the investment are discounted to calculate fair value. Discounts may also be applied due to the nature or duration of any restrictions on the disposition of the investments. Due to the inherent uncertainty of valuations of such investments, the fair values may differ significantly from the values that would have been used had an active market existed.
Trading in securities on foreign securities stock exchanges and over-the-counter markets may be completed before the daily close of business on the NYSE. Occasionally, events occur between the time at which trading in a foreign security is completed and the close of the NYSE that might call into question the reliability of the value of a portfolio security held by the Fund. As a result, differences may arise between the value of the Fund’s portfolio securities as determined at the foreign market close and the latest indications of value at the close of the NYSE. In order to minimize the potential for these differences, the investment manager monitors price movements following the close of trading in foreign stock markets through a series of country specific market proxies (such as baskets of American Depositary Receipts, futures contracts and exchange traded funds). These price movements
TGB-34
Franklin Templeton Variable Insurance Products Trust
Notes to Financial Statements (continued)
Templeton Global Bond Securities Fund
1. ORGANIZATION AND SIGNIFICANT ACCOUNTING POLICIES (continued)
a. Financial Instrument Valuation (continued)
are measured against established trigger thresholds for each specific market proxy to assist in determining if an event has occurred that may call into question the reliability of the values of the foreign securities held by the Fund. If such an event occurs, the securities may be valued using fair value procedures, which may include the use of independent pricing services.
b. Foreign Currency Translation
Portfolio securities and other assets and liabilities denominated in foreign currencies are translated into U.S. dollars based on the exchange rate of such currencies against U.S. dollars on the date of valuation. The Fund may enter into foreign currency exchange contracts to facilitate transactions denominated in a foreign currency. Purchases and sales of securities, income and expense items denominated in foreign currencies are translated into U.S. dollars at the exchange rate in effect on the transaction date. Portfolio securities and assets and liabilities denominated in foreign currencies contain risks that those currencies will decline in value relative to the U.S. dollar. Occasionally, events may impact the availability or reliability of foreign exchange rates used to convert the U.S. dollar equivalent value. If such an event occurs, the foreign exchange rate will be valued at fair value using procedures established and approved by the Trust’s Board of Trustees.
The Fund does not separately report the effect of changes in foreign exchange rates from changes in market prices on securities held. Such changes are included in net realized and unrealized gain or loss from investments on the Statement of Operations.
Realized foreign exchange gains or losses arise from sales of foreign currencies, currency gains or losses realized between the trade and settlement dates on securities transactions and the difference between the recorded amounts of dividends, interest, and foreign withholding taxes and the U.S. dollar equivalent of the amounts actually received or paid. Net unrealized foreign exchange gains and losses arise from changes in foreign exchange rates on foreign denominated assets and liabilities other than investments in securities held at the end of the reporting period.
c. Joint Repurchase Agreement
The Fund enters into a joint repurchase agreement whereby its uninvested cash balance is deposited into a joint cash account with other funds managed by the investment manager or an affiliate of the investment manager and is used to invest in one or more repurchase agreements. The value and face amount of the joint repurchase agreement are allocated to the funds based on their pro-rata interest. A repurchase agreement is accounted for as a loan by the fund to the seller, collateralized by securities which are delivered to the fund’s custodian. The market value, including accrued interest, of the initial collateralization is required to be at least 102% of the dollar amount invested by the funds, with the value of the underlying securities marked to market daily to maintain coverage of at least 100%. The joint repurchase agreement held by the Fund at year end had been entered into on December 30, 2011.
d. Derivative Financial Instruments
The Fund invested in derivatives in order to manage risk or gain exposure to various other investments or markets. Derivatives are financial contracts based on an underlying or notional amount, require no initial investment or an initial net investment that is smaller than would normally be required to have a similar response to changes in market factors, and require or permit net settlement. Derivatives contain various risks including the potential inability of the counterparty to fulfill their obligations under the terms of the contract, the potential for an illiquid secondary market, and/or the potential for market movements which expose the Fund to gains or losses in excess of the amounts shown on the Statement of Assets and Liabilities. Realized gain and loss and unrealized appreciation and depreciation on these contracts for the period are included in the Statement of Operations.
TGB-35
Franklin Templeton Variable Insurance Products Trust
Notes to Financial Statements (continued)
Templeton Global Bond Securities Fund
1. ORGANIZATION AND SIGNIFICANT ACCOUNTING POLICIES (continued)
d. Derivative Financial Instruments (continued)
The Fund entered into futures contracts primarily to manage interest rate and/or foreign exchange rate risk. A futures contract is an agreement between the Fund and a counterparty to buy or sell an asset for a specified price on a future date. Required initial margin deposits of cash or securities are pledged by the Fund. Subsequent payments, known as variation margin, are made or received by the Fund, depending on fluctuations in the value of the underlying security. Such variation margin is accounted for as unrealized appreciation or depreciation until the contract is closed, at which time the gains or losses are realized.
The Fund entered into forward exchange contracts primarily to manage and/or gain exposure to certain foreign currencies. A forward exchange contract is an agreement between the Fund and a counterparty to buy or sell a foreign currency for a specific exchange rate on a future date. Pursuant to the terms of the forward exchange contracts, cash or securities may be required to be deposited as collateral. Unrestricted cash may be invested according to the Fund’s investment objectives.
The Fund entered into interest rate swap contracts primarily to manage interest rate risk. An interest rate swap is an agreement between the Fund and a counterparty to exchange cash flows based on the difference between two interest rates, applied to a notional principal amount. Over the term of the contract, contractually required payments to be paid and to be received are accrued daily and recorded as unrealized depreciation and appreciation until the payments are made, at which time they are realized. Pursuant to the terms of the interest rate swap contract, cash or securities may be required to be deposited as collateral. Unrestricted cash may be invested according to the Fund’s investment objectives.
At December 31, 2011, the Fund holds $10,141,489 in U.S. treasury bills, bonds, and notes and Government National Mortgage Association bonds as collateral for derivatives.
See Note 9 regarding other derivative information.
e. Restricted Cash
At December 31, 2011, the Fund held restricted cash in connection with investments in certain derivative securities. Restricted cash is held in a segregated account with the Fund’s custodian/counterparty broker and is reflected in the Statement of Assets and Liabilities.
f. Income and Deferred Taxes
It is the Fund’s policy to qualify as a regulated investment company under the Internal Revenue Code. The Fund intends to distribute to shareholders substantially all of its taxable income and net realized gains to relieve it from federal income and excise taxes. As a result, no provision for U.S. federal income taxes is required.
The Fund may be subject to foreign taxation related to income received, capital gains on the sale of securities and certain foreign currency transactions in the foreign jurisdictions in which it invests. Foreign taxes, if any, are recorded based on the tax regulations and rates that exist in the foreign markets in which the Fund invests. When a capital gain tax is determined to apply the Fund records an estimated deferred tax liability in an amount that would be payable if the securities were disposed of on the valuation date.
The Fund recognizes the tax benefits of uncertain tax positions only when the position is “more likely than not” to be sustained upon examination by the tax authorities based on the technical merits of the tax position. As of December 31, 2011, and for all open tax years, the Fund has determined that no liability for unrecognized tax benefits is required in the Fund’s financial statements related to uncertain tax positions taken on a tax return (or expected to be taken on future tax returns). Open tax years are those that remain subject to examination and are based on each tax jurisdiction statute of limitation.
TGB-36
Franklin Templeton Variable Insurance Products Trust
Notes to Financial Statements (continued)
Templeton Global Bond Securities Fund
1. ORGANIZATION AND SIGNIFICANT ACCOUNTING POLICIES (continued)
g. Security Transactions, Investment Income, Expenses and Distributions
Security transactions are accounted for on trade date. Realized gains and losses on security transactions are determined on a specific identification basis. Interest income and estimated expenses are accrued daily. Amortization of premium and accretion of discount on debt securities are included in interest income. Distributions to shareholders are recorded on the ex-dividend date and are determined according to income tax regulations (tax basis). Distributable earnings determined on a tax basis may differ from earnings recorded in accordance with accounting principles generally accepted in the United States of America. These differences may be permanent or temporary. Permanent differences are reclassified among capital accounts to reflect their tax character. These reclassifications have no impact on net assets or the results of operations. Temporary differences are not reclassified, as they may reverse in subsequent periods.
Common expenses incurred by the Trust are allocated among the funds based on the ratio of net assets of each fund to the combined net assets of the Trust. Fund specific expenses are charged directly to the fund that incurred the expense.
Realized and unrealized gains and losses and net investment income, not including class specific expenses, are allocated daily to each class of shares based upon the relative proportion of net assets of each class. Differences in per share distributions, by class, are generally due to differences in class specific expenses.
Inflation-indexed bonds are adjusted for inflation through periodic increases or decreases in the security’s interest accruals, face amount, or principal redemption value, by amounts corresponding to the rate of inflation as measured by an index. Any increase or decrease in the face amount or principal redemption value will be included as interest income on the Statement of Operations.
h. Accounting Estimates
The preparation of financial statements in accordance with accounting principles generally accepted in the United States of America requires management to make estimates and assumptions that affect the reported amounts of assets and liabilities at the date of the financial statements and the amounts of income and expenses during the reporting period. Actual results could differ from those estimates.
i. Redemption Fees
Redemptions and exchanges of interests in an insurance company subaccount that invests in Class 3 shares of the Fund will be subject to a 1.0% short term trading fee if the interest in the subaccount has been held for less than 60 days. Such fees are retained by the Fund and accounted for as an addition to paid-in capital, allocated to each class of shares based upon the relative proportion of net assets of each class.
j. Guarantees and Indemnifications
Under the Trust’s organizational documents, its officers and trustees are indemnified by the Trust against certain liabilities arising out of the performance of their duties to the Trust. Additionally, in the normal course of business, the Trust, on behalf of the Fund, enters into contracts with service providers that contain general indemnification clauses. The Trust’s maximum exposure under these arrangements is unknown as this would involve future claims that may be made against the Trust that have not yet occurred. Currently, the Trust expects the risk of loss to be remote.
TGB-37
Franklin Templeton Variable Insurance Products Trust
Notes to Financial Statements (continued)
Templeton Global Bond Securities Fund
2. SHARES OF BENEFICIAL INTEREST
At December 31, 2011, there were an unlimited number of shares authorized (without par value). Transactions in the Fund’s shares were as follows:
| | | | | | | | | | | | | | | | |
| | | Year Ended December 31, | |
| | | 2011 | | | 2010 | |
| Class 1 Shares: | | Shares | | | Amount | | | Shares | | | Amount | |
Shares sold | | | 2,403,657 | | | $ | 47,343,365 | | | | 4,522,323 | | | $ | 85,300,049 | |
Shares issued in reinvestment of distributions | | | 889,172 | | | | 17,445,546 | | | | 243,806 | | | | 4,471,394 | |
Shares redeemed | | | (2,450,491 | ) | | | (47,617,531 | ) | | | (2,152,653 | ) | | | (40,859,583 | ) |
| | | | |
Net increase (decrease) | | | 842,338 | | | $ | 17,171,380 | | | | 2,613,476 | | | $ | 48,911,860 | |
| | | | |
Class 2 Shares: | | | | | | | | | | | | | | | | |
Shares sold | | | 29,318,184 | | | $ | 564,580,203 | | | | 23,116,184 | | | $ | 432,400,311 | |
Shares issued in reinvestment of distributions | | | 5,473,480 | | | | 104,871,884 | | | | 1,140,402 | | | | 20,470,218 | |
Shares redeemed | | | (11,438,342 | ) | | | (218,085,708 | ) | | | (20,598,509 | ) | | | (377,255,310 | ) |
| | | | |
Net increase (decrease) | | | 23,353,322 | | | $ | 451,366,379 | | | | 3,658,077 | | | $ | 75,615,219 | |
| | | | |
Class 3 Shares: | | | | | | | | | | | | | | | | |
Shares sold | | | 1,851,973 | | | $ | 36,090,442 | | | | 2,390,123 | | | $ | 44,722,862 | |
Shares issued in reinvestment of distributions | | | 626,622 | | | | 12,006,087 | | | | 142,856 | | | | 2,562,841 | |
Shares redeemed | | | (1,654,785 | ) | | | (31,390,056 | ) | | | (1,387,144 | ) | | | (25,562,774 | ) |
| | | | |
Net increase (decrease) | | | 823,810 | | | $ | 16,706,473 | | | | 1,145,835 | | | $ | 21,722,929 | |
| | | | |
Class 4 Shares: | | | | | | | | | | | | | | | | |
Shares sold | | | 1,191,215 | | | $ | 23,562,082 | | | | 1,871,353 | | | $ | 34,938,015 | |
Shares issued on reinvestment of distributions | | | 494,660 | | | | 9,635,982 | | | | 122,020 | | | | 2,224,429 | |
Shares redeemed | | | (1,090,109 | ) | | | (21,071,344 | ) | | | (549,061 | ) | | | (10,194,163 | ) |
| | | | |
Net increase (decrease) | | | 595,766 | | | $ | 12,126,720 | | | | 1,444,312 | | | $ | 26,968,281 | |
| | | | |
3. TRANSACTIONS WITH AFFILIATES
Franklin Resources, Inc. is the holding company for various subsidiaries that together are referred to as Franklin Templeton Investments. Certain officers and trustees of the Fund are also officers and/or directors of the following subsidiaries:
| | |
| Subsidiary | | Affiliation |
Franklin Advisers, Inc. (Advisers) | | Investment manager |
Franklin Templeton Services, LLC (FT Services) | | Administrative manager |
Franklin Templeton Distributors, Inc. (Distributors) | | Principal underwriter |
Franklin Templeton Investor Services, LLC (Investor Services) | | Transfer agent |
a. Management Fees
The Fund pays an investment management fee to Advisers based on the average daily net assets of the Fund as follows:
| | |
| Annualized Fee Rate | | Net Assets |
| 0.625% | | Up to and including $100 million |
| 0.500% | | Over $100 million, up to and including $250 million |
| 0.450% | | Over $250 million, up to and including $7.5 billion |
| 0.440% | | Over $7.5 billion, up to and including $10 billion |
TGB-38
Franklin Templeton Variable Insurance Products Trust
Notes to Financial Statements (continued)
Templeton Global Bond Securities Fund
3. TRANSACTIONS WITH AFFILIATES (continued)
a. Management Fees (continued)
| | |
| Annualized Fee Rate | | Net Assets |
| 0.430% | | Over $10 billion, up to and including $12.5 billion |
| 0.420% | | Over $12.5 billion, up to and including $15 billion |
| 0.400% | | In excess of $15 billion |
b. Administrative Fees
Under an agreement with Advisers, FT Services provides administrative services to the Fund. The fee is paid by Advisers based on average daily net assets, and is not an additional expense of the Fund.
c. Distribution Fees
The Fund’s Board of Trustees has adopted distribution plans for Class 2, Class 3, and Class 4 shares pursuant to Rule 12b-1 under the 1940 Act. Under the Fund’s compensation distribution plans, the Fund pays Distributors for costs incurred in connection with the servicing, sale and distribution of the Fund’s shares up to 0.25%, 0.35%, and 0.35% per year of its average daily net assets of Class 2, Class 3, and Class 4, respectively. The Board of Trustees has agreed to limit the current rate to 0.25% per year for Class 3.
d. Transfer Agent Fees
Investor Services, under terms of an agreement, performs shareholder servicing for the Fund and is not paid by the Fund for the services.
4. EXPENSE OFFSET ARRANGEMENT
The Fund has entered into an arrangement with its custodian whereby credits realized as a result of uninvested cash balances are used to reduce a portion of the Fund’s custodian expenses. During the year ended December 31, 2011, the custodian fees were reduced as noted in the Statement of Operations.
5. INCOME TAXES
The tax character of distributions paid during the years ended December 31, 2011 and 2010, was as follows:
| | | | | | | | |
| | | 2011 | | | 2010 | |
Distributions paid from: | | | | | | | | |
Ordinary Income | | $ | 130,777,554 | | | $ | 25,248,824 | |
Long term capital gain | | | 13,181,945 | | | | 4,480,058 | |
| | | | |
| | $ | 143,959,499 | | | $ | 29,728,882 | |
| | | | |
TGB-39
Franklin Templeton Variable Insurance Products Trust
Notes to Financial Statements (continued)
Templeton Global Bond Securities Fund
5. INCOME TAXES (continued)
At December 31, 2011, the cost of investments, net unrealized appreciation (depreciation), undistributed ordinary income and undistributed long term capital gains for income tax purposes were as follows:
| | | | |
Cost of investments | | $ | 2,228,846,787 | |
| | | | |
| |
Unrealized appreciation | | $ | 149,299,655 | |
Unrealized depreciation | | | (126,037,405 | ) |
| | | | |
Net unrealized appreciation (depreciation) | | $ | 23,262,250 | |
| | | | |
Undistributed ordinary income | | $ | 173,648,253 | |
Undistributed long term capital gains | | | 4,334,661 | |
| | | | |
Distributable earnings | | $ | 177,982,914 | |
| | | | |
Differences between income and/or capital gains as determined on a book basis and a tax basis are primarily due to differing treatments of foreign currency transactions, bond discounts and premiums, tax straddles, and inflation related adjustments on foreign securities.
6. INVESTMENT TRANSACTIONS
Purchases and sales of investments (excluding short term securities) for the year ended December 31, 2011, aggregated $893,596,104 and $637,958,693, respectively.
7. CREDIT RISK
At December 31, 2011, the Fund had 16.71% of its portfolio invested in high yield or other securities rated below investment grade. These securities may be more sensitive to economic conditions causing greater price volatility and are potentially subject to a greater risk of loss due to default than higher rated securities.
8. CONCENTRATION OF RISK
Investing in foreign securities may include certain risks and considerations not typically associated with investing in U.S. securities, such as fluctuating currency values and changing local and regional economic, political and social conditions, which may result in greater market volatility. In addition, certain foreign securities may not be as liquid as U.S. securities.
9. OTHER DERIVATIVE INFORMATION
At December 31, 2011, the Fund has invested in derivative contracts which are reflected on the Statement of Assets and Liabilities as follows:
| | | | | | | | | | | | |
| | | Asset Derivatives | | | Liability Derivatives | |
Derivative Contracts Not Accounted
for as Hedging Instruments | | Statement of Assets and
Liabilities Location | | Fair
Value
Amount | | | Statement of Assets and
Liabilities Location | | Fair
Value
Amount | |
Interest rate contracts | | Unrealized appreciation on swap contracts | | $ | — | | | Unrealized depreciation on swap contracts | | $ | 11,033,599 | |
Foreign exchange contracts | | Unrealized appreciation on forward exchange contracts | | | 58,119,290 | | | Unrealized depreciation on forward exchange contracts | | | 44,123,134 | |
TGB-40
Franklin Templeton Variable Insurance Products Trust
Notes to Financial Statements (continued)
Templeton Global Bond Securities Fund
9. OTHER DERIVATIVE INFORMATION (continued)
For the period ended December 31, 2011, the effect of derivative contracts on the Fund’s Statement of Operations was as follows:
| | | | | | | | | | |
Derivative Contracts Not Accounted
for as Hedging Instruments | | Statement of Operations Locations | | Realized Gain
(Loss) for the
Year Ended
December 31, 2011 | | | Change in
Unrealized
Appreciation
(Depreciation)
for the
Year Ended
December 31, 2011 | |
Interest rate contracts | | Net realized gain (loss) from futures/swap contracts/Net change in unrealized appreciation (depreciation) on investments | | $ | (708,080 | ) | | $ | (11,036,651 | ) |
Foreign exchange contracts | | Net realized gain (loss) from foreign currency transactions / Net change in unrealized appreciation (depreciation) on translation of other assets and liabilities denominated in foreign currencies | | | (2,279,806 | ) | | | (7,512,599 | ) |
For the year ended December 31, 2011, the average month end market value of derivatives represented 3.40% of average month end net assets. The average month end number of open derivative contracts for the year was 412.
See Note 1(d) regarding derivative financial instruments.
10. CREDIT FACILITY
The Fund, together with other U.S. registered and foreign investment funds (collectively, Borrowers), managed by Franklin Templeton Investments, are borrowers in a joint syndicated senior unsecured credit facility totaling $750 million (Global Credit Facility) which matured on January 20, 2012. This Global Credit Facility provides a source of funds to the Borrowers for temporary and emergency purposes, including the ability to meet future unanticipated or unusually large redemption requests. Effective January 20, 2012, the Borrowers renewed the Global Credit Facility for a total of $1.5 billion, maturing January 18, 2013.
Under the terms of the Global Credit Facility, the Fund shall, in addition to interest charged on any borrowings made by the Fund and other costs incurred by the Fund, pay its share of fees and expenses incurred in connection with the implementation and maintenance of the Global Credit Facility, based upon its relative share of the aggregate net assets of all of the Borrowers, including an annual commitment fee of 0.08% based upon the unused portion of the Global Credit Facility, which is reflected in other expenses on the Statement of Operations. During the year ended December 31, 2011, the Fund did not use the Global Credit Facility.
11. FAIR VALUE MEASUREMENTS
The Fund follows a fair value hierarchy that distinguishes between market data obtained from independent sources (observable inputs) and the Fund’s own market assumptions (unobservable inputs). These inputs are used in determining the value of the Fund’s investments and are summarized in the following fair value hierarchy:
| | • | | Level 1 – quoted prices in active markets for identical securities |
| | • | | Level 2 – other significant observable inputs (including quoted prices for similar securities, interest rates, prepayment speed, credit risk, etc.) |
| | • | | Level 3 – significant unobservable inputs (including the Fund’s own assumptions in determining the fair value of investments) |
TGB-41
Franklin Templeton Variable Insurance Products Trust
Notes to Financial Statements (continued)
Templeton Global Bond Securities Fund
11. FAIR VALUE MEASUREMENTS (continued)
The inputs or methodology used for valuing securities are not an indication of the risk associated with investing in those securities.
For movements between the levels within the fair value hierarchy, the Fund has adopted a policy of recognizing the transfers as of the date of the underlying event which caused the movement.
The following is a summary of the inputs used as of December 31, 2011, in valuing the Fund’s assets and liabilities carried at fair value:
| | | | | | | | | | | | | | | | |
| | | Level 1 | | | Level 2 | | | Level 3 | | | Total | |
| | | | |
Assets: | | | | | | | | | | | | | | | | |
Investments in Securities: | | | | | | | | | | | | | | | | |
Foreign Government and Agency Securities | | $ | — | | | $ | 1,845,190,090 | | | $ | — | | | $ | 1,845,190,090 | |
Municipal Bonds | | | — | | | | 25,375,581 | | | | — | | | | 25,375,581 | |
Short Term Investments | | | — | | | | 381,543,366 | | | | — | | | | 381,543,366 | |
| | | | |
Total Investments in Securities | | $ | — | | | $ | 2,252,109,037 | | | $ | — | | | $ | 2,252,109,037 | |
| | | | |
Forward Exchange Contracts | | | — | | | | 58,119,290 | | | | — | | | | 58,119,290 | |
Liabilities: | | | | | | | | | | | | | | | | |
Swaps | | | — | | | | 11,033,599 | | | | — | | | | 11,033,599 | |
Forward Exchange Contracts | | | — | | | | 44,123,134 | | | | — | | | | 44,123,134 | |
12. NEW ACCOUNTING PRONOUNCEMENTS
In May 2011, the Financial Accounting Standards Board (FASB) issued Accounting Standards Update (ASU) No. 2011-04, Fair Value Measurement (Topic 820): Amendments to Achieve Common Fair Value Measurement and Disclosure Requirements in U.S. GAAP and IFRSs. The amendments in the ASU will improve the comparability of fair value measurements presented and disclosed in financial statements prepared in accordance with U.S. GAAP (Generally Accepted Accounting Principles) and IFRS (International Financial Reporting Standards) and include new guidance for certain fair value measurement principles and disclosure requirements. The ASU is effective for interim and annual periods beginning after December 15, 2011. The Fund believes the adoption of this ASU will not have a material impact on its financial statements.
13. SUBSEQUENT EVENTS
The Fund has evaluated subsequent events through the issuance of the financial statements and determined that no events have occurred that require disclosure other than those already disclosed in the financial statements.
TGB-42
Franklin Templeton Variable Insurance Products Trust
Notes to Financial Statements (continued)
Templeton Global Bond Securities Fund
| | | | |
ABBREVIATIONS | | | | |
| Counterparty | | Currency | | Selected Portfolio |
| | | | |
BZWS - Barclays Bank PLC | | AUD - Australian Dollar | | BHAC - Berkshire Hathaway Assurance Corp. |
CITI - Citigroup, Inc. | | BRL - Brazilian Real | | FRN - Floating Rate Note |
DBAB - Deutsche Bank AG | | EGP - Egyptian Pound | | GO - General Obligation |
FBCO - Credit Suisse Group AG | | EUR - Euro | | |
HSBC - HSBC Bank USA, N.A. | | GBP - British Pound | | |
JPHQ - JP Morgan Chase & Co. | | HUF - Hungarian Forint | | |
MSCO - Morgan Stanley | | IDR - Indonesian Rupiah | | |
UBSW - UBS AG | | ILS - New Israeli Shekel | | |
| | JPY - Japanese Yen | | |
| | KRW - South Korean Won | | |
| | LKR - Sri Lankan Rupee | | |
| | MXN - Mexican Peso | | |
| | MYR - Malaysian Ringgit | | |
| | NOK - Norwegian Krone | | |
| | PEN - Peruvian Nuevo Sol | | |
| | PHP - Philippine Peso | | |
| | PLN - Polish Zloty | | |
| | SEK - Swedish Krona | | |
| | SGD - Singapore Dollar | | |
TGB-43
Franklin Templeton Variable Insurance Products Trust
Templeton Global Bond Securities Fund
Report of Independent Registered Public Accounting Firm
To the Board of Trustees and Shareholders of Franklin Templeton Variable Insurance Products Trust
In our opinion, the accompanying statement of assets and liabilities, including the statement of investments, and the related statements of operations and of changes in net assets and the financial highlights present fairly, in all material respects, the financial position of Templeton Global Bond Securities Fund (the “Fund”) at December 31, 2011, the results of its operations for the year then ended, the changes in its net assets for each of the two years in the period then ended and the financial highlights for the periods presented, in conformity with accounting principles generally accepted in the United States of America. These financial statements and financial highlights (hereafter referred to as “financial statements”) are the responsibility of the Fund’s management. Our responsibility is to express an opinion on these financial statements based on our audits. We conducted our audits of these financial statements in accordance with the standards of the Public Company Accounting Oversight Board (United States). Those standards require that we plan and perform the audit to obtain reasonable assurance about whether the financial statements are free of material misstatement. An audit includes examining, on a test basis, evidence supporting the amounts and disclosures in the financial statements, assessing the accounting principles used and significant estimates made by management, and evaluating the overall financial statement presentation. We believe that our audits, which included confirmation of securities at December 31, 2011 by correspondence with the custodian and brokers, provide a reasonable basis for our opinion.
PricewaterhouseCoopers LLP
San Francisco, California
February 13, 2012
TGB-44
Franklin Templeton Variable Insurance Products Trust
Tax Information (unaudited)
Templeton Global Bond Securities Fund
Under Section 852(b)(3)(C) of the Internal Revenue Code (Code), the Fund hereby reports the maximum amount allowable but no less than $13,181,945 as a long term capital gain dividend for the fiscal year ended December 31, 2011.
At December 31, 2011, more than 50% of the Fund’s total assets were invested in securities of foreign issuers. In most instances, foreign taxes were withheld from income paid to the Fund on these investments. The Fund elects to treat foreign taxes paid as allowed under Section 853 of the Code. This election will allow shareholders of record as of the 2012 distribution date, to treat their proportionate share of foreign taxes paid by the Fund as having been paid directly by them. The shareholder shall consider these amounts as foreign taxes paid in the tax year in which they receive the Fund distribution.
TGB-45
INDEX DESCRIPTIONS
The indexes are unmanaged and include reinvested distributions.
For indexes sourced by Morningstar: © 2012 Morningstar. All Rights Reserved. The information contained herein: (1) is proprietary to Morningstar and/or its content providers; (2) may not be copied or distributed; and (3) is not warranted to be accurate, complete or timely. Neither Morningstar nor its content providers are responsible for any damages or losses arising from any use of this information.
Russell® is a trademark and RussellTM is a servicemark of the Frank Russell Company.
Barclays Capital (BC) U.S. Aggregate Index is a market capitalization-weighted index representing the U.S. investment-grade, fixed-rate, taxable bond market with index components for government and corporate, mortgage pass-through and asset-backed securities. All issues included are SEC registered, taxable, dollar denominated and nonconvertible, must have at least one year to final maturity and must be rated investment grade (Baa3/BBB-/BBB- or higher) using the middle rating of Moody’s, Standard & Poor’s and Fitch, respectively.
Barclays Capital (BC) U.S. Government Index: Intermediate Component is the intermediate component of the BC U.S. Government Index, which includes public obligations of the U.S. Treasury with at least one year to final maturity and publicly issued debt of U.S. government agencies, quasi-federal corporations, and corporate or foreign debt guaranteed by the U.S. government.
Citigroup World Government Bond Index is a market capitalization-weighted index consisting of investment-grade world government bond markets.
Consumer Price Index (CPI), calculated by the U.S. Bureau of Labor Statistics, is a commonly used measure of the inflation rate.
Credit Suisse (CS) High Yield Index is designed to mirror the investable universe of the U.S. dollar-denominated high yield debt market.
Dow Jones Industrial Average is a price-weighted average of blue-chip stocks that are generally the leaders in their industry.
FTSE EPRA/NAREIT Developed Index is a free float-adjusted index designed to measure the performance of publicly traded real estate securities in the North American, European and Asian real estate markets. FTSE® is a trademark of London Stock Exchange Plc and The Financial Times Limited and is used by FTSE under license. All rights in and to the FTSE MPF Index series (including currency adjusted indices) are vested in FTSE. All information is provided for information purposes only. Every effort is made to ensure that all information given in this publication is accurate, but no responsibility or liability can be accepted by FTSE for any errors or for any loss arising from use of this publication.
J.P. Morgan Emerging Markets Bond Index (EMBI) Global tracks total returns for U.S. dollar denominated debt instruments issued by emerging market sovereign and quasi-sovereign entities: Brady bonds, loans and Eurobonds.
J.P. Morgan (JPM) Global Government Bond Index (GGBI) tracks total returns for liquid, fixed-rate, domestic government bonds with maturities greater than one year issued by developed countries globally.
Lipper Multi-Sector Income Funds Classification Average is calculated by averaging the total returns of all funds within the Lipper Multi-Sector Income Funds classification in the Lipper Open-End underlying funds universe. Lipper Multi-Sector Income Funds are defined as funds that seek current income by allocating assets among different fixed income securities sectors (not primarily in one sector except for defensive purposes), including U.S. and foreign governments, with a significant portion rated below investment grade. For the 12-month period ended 12/31/11, there were 192 funds in this category. Lipper calculations do not include contract fees, expenses or sales charges, and may have been different if such charges had been considered.
Lipper VIP Equity Income Funds Classification Average is an equally weighted average calculation of performance figures for all funds within the Lipper Equity Income Funds classification in the Lipper VIP underlying funds universe. Lipper Equity Income Funds seek relatively high current income and growth of income through investing 60% or more of their portfolios in equities. For the 12-month period ended 12/31/11, there were 61 funds in this category. Lipper calculations do not include contract fees, expenses or sales charges, and may have been different if such charges had been considered.
Lipper VIP General U.S. Government Funds Classification Average is an equally weighted average calculation of performance figures for all funds within the Lipper General U.S. Government Funds classification in the Lipper VIP underlying funds universe. Lipper General U.S. Government Funds invest primarily in U.S. government and agency issues. For the 12-month period ended 12/31/11, there were 78 funds in this category. Lipper calculations do not include contract fees, expenses or sales charges, and may have been different if such charges had been considered.
I-1
Lipper VIP High Current Yield Funds Classification Average is an equally weighted average calculation of performance figures for all funds within the Lipper High Current Yield Funds Classification in the Lipper VIP underlying funds universe. Lipper High Current Yield Funds aim at high (relative) current yield from fixed income securities, have no quality or maturity restrictions, and tend to invest in lower grade debt issues. For the 12-month period ended 12/31/11, there were 123 funds in this category. Lipper calculations do not include contract fees, expenses or sales charges, and may have been different if such charges had been considered.
MSCI All Country (AC) World Index is a free float-adjusted, market capitalization-weighted index designed to measure equity market performance in global developed and emerging markets.
MSCI Emerging Markets (EM) Index is a free float-adjusted, market capitalization-weighted index designed to measure equity market performance in global emerging markets.
MSCI Europe, Australasia, Far East (EAFE) Index is a free float-adjusted, market capitalization-weighted index designed to measure equity market performance in global developed markets excluding the U.S. and Canada.
MSCI Europe, Australasia, Far East (EAFE) Index Net Return (Local Currency) is a free float-adjusted, market capitalization-weighted index designed to measure equity market performance of global developed markets excluding the U.S. and Canada. The index is calculated in local currency and includes reinvested daily net dividends.
MSCI World Index is a free float-adjusted, market capitalization-weighted index designed to measure equity market performance in global developed markets.
Russell 1000® Growth Index is market capitalization weighted and measures performance of those Russell 1000 Index companies with higher price-to-book ratios and higher forecasted growth values.
Russell 1000® Index is market capitalization weighted and measures performance of the largest companies in the Russell 3000® Index, which represents the majority of the U.S. market’s total capitalization.
Russell 1000® Value Index is market capitalization weighted and measures performance of those Russell 1000® Index companies with lower price-to-book ratios and lower forecasted growth values.
Russell 2500™ Index is market capitalization weighted and measures performance of the smallest companies in the Russell 3000® Index, which represent a modest amount of the Russell 3000® Index’s total market capitalization.
Russell 2500™ Value Index is market capitalization weighted and measures performance of those Russell 2500™ Index companies with lower price-to-book ratios and lower forecasted growth values.
Russell 3000® Growth Index is market capitalization weighted and measures performance of those Russell 3000® Index companies with higher price-to-book ratios and higher forecasted growth values.
Russell 3000® Index is market capitalization weighted and measures performance of the largest U.S. companies based on total market capitalization and represents the majority of the investable U.S. equity market.
Russell Midcap® Growth Index is market capitalization weighted and measures performance of those Russell Midcap® Index companies with higher price-to-book ratios and higher forecasted growth values.
Russell Midcap® Index is market capitalization weighted and measures performance of the smallest companies in the Russell 1000® Index, which represent a modest amount of the Russell 1000® Index’s total market capitalization.
Standard & Poor’s 500 Index (S&P 500) is a market capitalization-weighted index of 500 stocks designed to measure total U.S. equity market performance. STANDARD & POOR’S®, S&P® and S&P 500® are registered trademarks of Standard & Poor’s Financial Services LLC. Standard & Poor’s does not sponsor, endorse, sell or promote any S&P index-based product.
Standard & Poor’s Global REIT Index is designed to measure performance of the investable universe of publicly traded real estate investment trusts. Index constituents generally derive the majority of their revenue from real estate development, management, rental, and/or direct investment in physical property and with local REIT or property trust tax status.
Standard & Poor’s/International Finance Corporation Investable (S&P/IFCI) Composite Index is a free float-adjusted, market capitalization-weighted index designed to measure equity performance in global emerging markets.
I-2
Board Members and Officers
The name, year of birth and address of the officers and board members, as well as their affiliations, positions held with the Trust, principal occupation during at least the past five years and number of portfolios overseen in the Franklin Templeton Investments fund complex are shown below. Generally, each board member serves until that person’s successor is elected and qualified.
Independent Board Members
| | | | | | | | |
| Name, Year of Birth and Address | | Position | | Length of
Time Served | | Number of
Portfolios in Fund
Complex Overseen
by Board Member* | | Other Directorships Held
During at Least the Past 5 Years |
Harris J. Ashton (1932) One Franklin Parkway San Mateo, CA 94403-1906 | | Trustee | | Since 1988 | | 132 | | Bar-S Foods (meat packing company) (1981-2010). |
|
Principal Occupation During at Least the Past 5 Years: Director of various companies; and formerly, Director, RBC Holdings, Inc. (bank holding company) (until 2002); and President, Chief Executive Officer and Chairman of the Board, General Host Corporation (nursery and craft centers) (until 1998). |
Sam Ginn (1937) One Franklin Parkway San Mateo, CA 94403-1906 | | Trustee | | Since 2007 | | 107 | | ICO Global Communications (Holdings) Limited (satellite company) (2006-2010), Chevron Corporation (global energy company) (1989-2009), Hewlett-Packard Company (technology company) (1996-2002), Safeway, Inc. (grocery retailer) (1991-1998) and TransAmerica Corporation (insurance company) (1989-1999). |
|
Principal Occupation During at Least the Past 5 Years: Private investor; and formerly, Chairman of the Board, Vodafone AirTouch, PLC (wireless company); Chairman of the Board and Chief Executive Officer, AirTouch Communications (cellular communications) (1993-1998) and Pacific Telesis Group (telephone holding company) (1988-1994). |
Edith E. Holiday (1952) One Franklin Parkway San Mateo, CA 94403-1906 | | Trustee | | Since 2005 | | 132 | | Hess Corporation (exploration and refining of oil and gas), H.J. Heinz Company (processed foods and allied products), RTI International Metals, Inc. (manufacture and distribution of titanium), Canadian National Railway (railroad) and White Mountains Insurance Group, Ltd. (holding company). |
|
Principal Occupation During at Least the Past 5 Years: Director or Trustee of various companies and trusts; and formerly, Assistant to the President of the United States and Secretary of the Cabinet (1990-1993); General Counsel to the United States Treasury Department (1989-1990); and Counselor to the Secretary and Assistant Secretary for Public Affairs and Public Liaison-United States Treasury Department (1988-1989). |
J. Michael Luttig (1954) One Franklin Parkway San Mateo, CA 94403-1906 | | Trustee | | Since 2009 | | 132 | | Boeing Capital Corporation (aircraft financing). |
|
Principal Occupation During at Least the Past 5 Years: Executive Vice President, General Counsel and member of Executive Council, The Boeing Company; and formerly, Federal Appeals Court Judge, U.S. Court of Appeals for the Fourth Circuit (1991-2006). |
Frank A. Olson (1932) One Franklin Parkway San Mateo, CA 94403-1906 | | Trustee | | Since 2005 | | 132 | | Hess Corporation (exploration and refining of oil and gas). |
|
Principal Occupation During at Least the Past 5 Years: Chairman Emeritus, The Hertz Corporation (car rental) (since 2000) (Chairman of the Board (1980-2000) and Chief Executive Officer (1977-1999)); and formerly, Chairman of the Board, President and Chief Executive Officer, UAL Corporation (airlines). |
BOD-1
| | | | | | | | |
| Name, Year of Birth and Address | | Position | | Length of
Time Served | | Number of
Portfolios in Fund
Complex Overseen
by Board Member* | | Other Directorships Held
During at Least the Past 5 Years |
Larry D. Thompson (1945) One Franklin Parkway San Mateo, CA 94403-1906 | | Trustee | | Since 2007 | | 142 | | Cbeyond, Inc. (business communications provider), The Southern Company (energy company) and The Washington Post Company (education and media organization). |
|
Principal Occupation During at Least the Past 5 Years: John A. Sibley Professor of Corporate and Business Law, University of Georgia School of Law (2011); and formerly, Senior Vice President—Government Affairs, General Counsel and Secretary, PepsiCo, Inc. (consumer products) (2004-May 2011); Senior Fellow of The Brookings Institution (2003-2004); Visiting Professor, University of Georgia School of Law (2004); and Deputy Attorney General, U.S. Department of Justice (2001-2003). |
John B. Wilson (1959) One Franklin Parkway San Mateo, CA 94403-1906 | | Lead Independent Trustee | | Trustee since 2007 and Lead Independent Trustee since 2008 | | 107 | | None |
|
Principal Occupation During at Least the Past 5 Years: President and Founder, Hyannis Port Capital, Inc. (real estate and private equity investing); serves on private and non-profit boards; and formerly, Chief Operating Officer and Executive Vice President, Gap, Inc. (retail) (1996-2000); Chief Financial Officer and Executive Vice President—Finance and Strategy, Staples, Inc. (office supplies) (1992-1996); Senior Vice President—Corporate Planning, Northwest Airlines, Inc. (airlines) (1990-1992); and Vice President and Partner, Bain & Company (consulting firm) (1986-1990). |
Interested Board Members and Officers
| | | | | | | | |
| Name, Year of Birth and Address | | Position | | Length of
Time Served | | Number of
Portfolios in Fund
Complex Overseen
by Board Member* | | Other Directorships Held
During at Least the Past 5 Years |
**Charles B. Johnson (1933) One Franklin Parkway San Mateo, CA 94403-1906 | | Trustee and Chairman of the Board | | Trustee since 1988 and Chairman of the Board since 1993 | | 132 | | None |
|
Principal Occupation During at Least the Past 5 Years: Chairman of the Board, Member—Office of the Chairman and Director, Franklin Resources, Inc.; and officer and/or director or trustee, as the case may be, of some of the other subsidiaries of Franklin Resources, Inc. and of 41 of the investment companies in Franklin Templeton Investments. |
**Rupert H. Johnson, Jr. (1940) One Franklin Parkway San Mateo, CA 94403-1906 | | Trustee | | Since 1988 | | 50 | | None |
|
Principal Occupation During at Least the Past 5 Years: Vice Chairman, Member—Office of the Chairman and Director, Franklin Resources, Inc.; Director, Franklin Advisers, Inc.; Senior Vice President, Franklin Advisory Services, LLC; and officer and/or director or trustee, as the case may be, of some of the other subsidiaries of Franklin Resources, Inc. and of 25 of the investment companies in Franklin Templeton Investments. |
James M. Davis (1952) One Franklin Parkway San Mateo, CA 94403-1906 | | Chief Compliance Officer and Vice President— AML Compliance | | Chief Compliance Officer since 2004 and Vice President— AML Compliance since 2006 | | Not
Applicable | | Not Applicable |
|
Principal Occupation During at Least the Past 5 Years: Director, Global Compliance, Franklin Resources, Inc.; and officer of 46 of the investment companies in Franklin Templeton Investments. |
BOD-2
| | | | | | | | |
| Name, Year of Birth and Address | | Position | | Length of
Time Served | | Number of
Portfolios in Fund
Complex Overseen
by Board Member* | | Other Directorships Held
During at Least the Past 5 Years |
Laura F. Fergerson (1962) One Franklin Parkway San Mateo, CA 94403-1906 | | Chief Executive Officer— Finance and Administration | | Since 2009 | | Not
Applicable | | Not Applicable |
|
Principal Occupation During at Least the Past 5 Years: Senior Vice President, Franklin Templeton Services, LLC; officer of 46 of the investment companies in Franklin Templeton Investments; and formerly, Director and member of Audit and Valuation Committees, Runkel Funds, Inc. (2003-2004); Assistant Treasurer of most of the investment companies in Franklin Templeton Investments (1997-2003); and Vice President, Franklin Templeton Services, LLC (1997-2003). |
Gaston Gardey (1967) One Franklin Parkway San Mateo, CA 94403-1906 | | Treasurer, Chief Financial Officer and Chief Accounting Officer | | Since 2009 | | Not
Applicable | | Not Applicable |
|
Principal Occupation During at Least the Past 5 Years: Director, Fund Accounting, Franklin Templeton Investments; and officer of 27 of the investment companies in Franklin Templeton Investments. |
Aliya S. Gordon (1973) One Franklin Parkway San Mateo, CA 94403-1906 | | Vice President | | Since 2009 | | Not
Applicable | | Not Applicable |
|
Principal Occupation During at Least the Past 5 Years: Senior Associate General Counsel, Franklin Templeton Investments; officer of 46 of the investment companies in Franklin Templeton Investments; and formerly, Litigation Associate, Steefel, Levitt & Weiss, LLP (2000-2004). |
David P. Goss (1947) One Franklin Parkway San Mateo, CA 94403-1906 | | Vice President | | Since 2000 | | Not
Applicable | | Not Applicable |
|
Principal Occupation During at Least the Past 5 Years: Senior Associate General Counsel, Franklin Templeton Investments; and officer and/or director, as the case may be, of some of the other subsidiaries of Franklin Resources, Inc. and of 46 of the investment companies in Franklin Templeton Investments. |
Steven J. Gray (1955) One Franklin Parkway San Mateo, CA 94403-1906 | | Vice President | | Since 2009 | | Not
Applicable | | Not Applicable |
|
Principal Occupation During at Least the Past 5 Years: Senior Associate General Counsel, Franklin Templeton Investments; Vice President, Franklin Templeton Distributors, Inc.; and officer of 46 of the investment companies in Franklin Templeton Investments. |
Edward B. Jamieson (1948) One Franklin Parkway San Mateo, CA 94403-1906 | | President and Chief Executive Officer—Investment Management | | Since 2010 | | Not
Applicable | | Not Applicable |
|
Principal Occupation During at Least the Past 5 Years: President, Chief Investment Officer and Director, Franklin Advisers, Inc.; Executive Vice President, Franklin Templeton Institutional, LLC; and officer and/or trustee, as the case may be, of some of the other subsidiaries of Franklin Resources, Inc. and of 10 of the investment companies in Franklin Templeton Investments. |
BOD-3
| | | | | | | | |
| Name, Year of Birth and Address | | Position | | Length of
Time Served | | Number of
Portfolios in Fund
Complex Overseen
by Board Member* | | Other Directorships Held
During at Least the Past 5 Years |
Robert C. Rosselot (1960) 300 S.E. 2nd Street Fort Lauderdale, FL 33301-1923 | | Vice President | | Since 2009 | | Not
Applicable | | Not Applicable |
|
Principal Occupation During at Least the Past 5 Years: Senior Associate General Counsel, Franklin Templeton Investments; Assistant Secretary, Franklin Resources, Inc.; Vice President and Secretary, Templeton Investment Counsel, LLC; Vice President, Secretary and Trust Officer, Fiduciary Trust International of the South; and officer of 46 of the investment companies in Franklin Templeton Investments. |
Karen L. Skidmore (1952) One Franklin Parkway San Mateo, CA 94403-1906 | | Vice President and Secretary | | Since 2006 | | Not
Applicable | | Not Applicable |
|
Principal Occupation During at Least the Past 5 Years: Senior Associate General Counsel, Franklin Templeton Investments; and officer of 46 of the investment companies in Franklin Templeton Investments. |
Craig S. Tyle (1960) One Franklin Parkway San Mateo, CA 94403-1906 | | Vice President | | Since 2005 | | Not
Applicable | | Not Applicable |
|
Principal Occupation During at Least the Past 5 Years: General Counsel and Executive Vice President, Franklin Resources, Inc.; officer of some of the other subsidiaries of Franklin Resources, Inc. and of 46 of the investment companies in Franklin Templeton Investments; and formerly, Partner, Shearman & Sterling, LLP (2004-2005); and General Counsel, Investment Company Institute (ICI) (1997-2004). |
Lori A. Weber (1964) 300 S.E. 2nd Street Fort Lauderdale, FL 33301-1923 | | Vice President | | Since May 2011 | | Not
Applicable | | Not Applicable |
|
Principal Occupation During at Least the Past 5 Years: Associate General Counsel, Franklin Templeton Investments; Assistant Secretary, Franklin Resources, Inc.; Vice President and Assistant Secretary, Templeton Investment Counsel, LLC; and officer of 45 of the investment companies in Franklin Templeton Investments. |
| * | We base the number of portfolios on each separate series of the U.S. registered investment companies within the Franklin Templeton Investments fund complex. These portfolios have a common investment manager or affiliated investment managers. |
| ** | Charles B. Johnson and Rupert H. Johnson, Jr. are considered to be interested persons of the Trust under the federal securities laws due to their positions as officers and directors and major shareholders of Franklin Resources, Inc., which is the parent company of the Trust’s investment manager and distributor. |
Note 1: Charles B. Johnson and Rupert H. Johnson, Jr. are brothers.
Note 2: Officer information is current as of the date of this report. It is possible that after this date, information about officers may change.
The Sarbanes-Oxley Act of 2002 and Rules adopted by the Securities and Exchange Commission require the Fund to disclose whether the Fund’s Audit Committee includes at least one member who is an audit committee financial expert within the meaning of such Act and Rules. The Fund’s Board has determined that there is at least one such financial expert on the Audit Committee and has designated John B. Wilson as its audit committee financial expert. The Board believes that Mr. Wilson qualifies as such an expert in view of his extensive business background and experience, including service as chief financial officer of Staples, Inc. from 1992 to 1996. Mr. Wilson has been a Member and Chairman of the Fund’s Audit Committee since 2007. As a result of such background and experience, the Board believes that Mr. Wilson has acquired an understanding of generally accepted accounting principles and financial statements, the general application of such principles in connection with the accounting estimates, accruals and reserves, and analyzing and evaluating financial statements that present a breadth and level of complexity of accounting issues generally comparable to those of the Fund, as well as an understanding of internal controls and procedures for financial reporting and an understanding of audit committee functions. Mr. Wilson is an independent Board member as that term is defined under the relevant Securities and Exchange Commission Rules and Releases.
The Statement of Additional Information (SAI) includes additional information about the board members and is available, without charge, upon request. Shareholders may call (800) 321-8563 or their insurance companies to request the SAI.
BOD-4
Franklin Templeton Variable Insurance Products Trust
Shareholder Information
Proxy Voting Policies and Procedures
The Trust’s investment manager has established Proxy Voting Policies and Procedures (Policies) that the Trust uses to determine how to vote proxies relating to portfolio securities. Shareholders may view the Trust’s complete Policies online at franklintempleton.com. Alternatively, shareholders may request copies of the Policies free of charge by calling the Proxy Group collect at (954) 527-7678 or by sending a written request to: Franklin Templeton Companies, LLC, 300 S.E. 2nd Street, Fort Lauderdale, FL 33301, Attention: Proxy Group. Copies of the Trust’s proxy voting records are also made available online at franklintempleton.com and posted on the U.S. Securities and Exchange Commission’s website at sec.gov and reflect the most recent 12-month period ended June 30.
Quarterly Statement of Investments
The Trust files a complete statement of investments with the U.S. Securities and Exchange Commission for the first and third quarters for each fiscal year on Form N-Q. Shareholders may view the filed Form N-Q by visiting the Commission’s website at sec.gov. The filed form may also be viewed and copied at the Commission’s Public Reference Room in Washington, DC. Information regarding the operations of the Public Reference Room may be obtained by calling (800) SEC-0330.
SI-1
| | | | | | | | | | | | | | | | |
| VALUE | | BLEND | | GROWTH | | SECTOR | | GLOBAL | | INTERNATIONAL | | HYBRID | | ASSET ALLOCATION | | FIXED INCOME |
| | |
 | | < GAIN FROM OUR PERSPECTIVE® > |
Annual Report
FRANKLIN TEMPLETON
VARIABLE INSURANCE PRODUCTS TRUST
Investment Managers
Franklin Advisers, Inc.
Franklin Advisory Services, LLC
Franklin Mutual Advisers, LLC
Franklin Templeton Institutional, LLC
Templeton Asset Management, Ltd.
Templeton Global Advisors Limited
Templeton Investment Counsel, LLC
Fund Administrator
Franklin Templeton Services, LLC
Distributor
Franklin Templeton Distributors, Inc.
Franklin Templeton Variable Insurance Products Trust (FTVIP) shares are not offered to the public; they are offered and sold only to: (1) insurance company separate accounts (Separate Account) to serve as the underlying investment vehicle for variable contracts; (2) certain qualified plans; and (3) other mutual funds (funds of funds).
Authorized for distribution to investors in Separate Accounts only when accompanied or preceded by the current prospectus for the applicable contract, which includes the Separate Account and the FTVIP prospectuses. Investors should carefully consider a fund’s investment goals, risks, charges and expenses before investing. The prospectus contains this and other information; please read it carefully before investing.
To ensure the highest quality of service, telephone calls to or from our service departments may be monitored, recorded and accessed. These calls can be identified by the presence of a regular beeping tone.
| | |
| © 2012 Franklin Templeton Investments. All rights reserved. | | FTVIP A 02/12 |
| (a) | The Registrant has adopted a code of ethics that applies to its principal executive officers and principal financial and accounting officer. |
| (f) | Pursuant to Item 12(a)(1), the Registrant is attaching as an exhibit a copy of its code of ethics that applies to its principal executive officers and principal financial and accounting officer. |
| Item 3. | Audit Committee Financial Expert. |
| (a)(1) | The Registrant has an audit committee financial expert serving on its audit committee. |
| (2) | The audit committee financial expert is John B. Wilson and he is “independent” as defined under the relevant Securities and Exchange Commission Rules and Releases. |
| Item 4. | Principal Accountant Fees and Services. |
The aggregate fees paid to the principal accountant for professional services rendered by the principal accountant for the audit of the registrant’s annual financial statements or for services that are normally provided by the principal accountant in connection with statutory and regulatory filings or engagements were $912,438 for the fiscal year ended December 31, 2011 and $849,457 for the fiscal year ended December 31, 2010.
The aggregate fees paid to the principal accountant for assurance and related services rendered by the principal accountant to the registrant that are reasonably related to the performance of the audit of the registrant’s financial statements and are not reported under paragraph (a) of Item 4 were $10,000 for the fiscal year ended December 31, 2011 and $0 for the fiscal year ended December 31, 2010. The services for which these fees were paid included attestation services.
There were no fees paid to the principal accountant for assurance and related services rendered by the principal accountant to the registrant’s investment adviser and any entity controlling, controlled by or under common control with the investment adviser that provides ongoing services to the registrant that are reasonably related to the performance of the audit of their financial statements.
The aggregate fees paid to the principal accountant for professional services rendered by the principal accountant to the registrant for tax compliance, tax advice and tax planning were $1,295 for the fiscal year ended December 31, 2011 and $1,290 for the fiscal year ended December 31, 2010. The services for which these fees were paid included preparation of tax returns for foreign governments.
The aggregate fees paid to the principal accountant for professional services rendered by the principal accountant to the registrant’s investment adviser and any entity controlling, controlled by or under common control with the investment adviser that provides ongoing services to the registrant for tax compliance, tax advice and tax planning were $100,000 for the fiscal year ended December 31, 2011 and $35,000 for the fiscal year ended December 31, 2010. The services for which these fees were paid included technical tax consultation for capital gain tax reporting to foreign governments and derivative instruments.
The aggregate fees paid to the principal accountant for products and services rendered by the principal accountant to the registrant not reported in paragraphs (a)-(c) of Item 4 were $0 for the fiscal year ended December 31, 2011 and $12,501 for the fiscal year ended December 31, 2010. The services for which these fees were paid include review of materials provided to the fund Board in connection with the investment management contract renewal process.
The aggregate fees paid to the principal accountant for products and services rendered by the principal accountant to the registrant’s investment adviser and any entity controlling, controlled by or under common control with the investment adviser that provides ongoing services to the registrant other than services reported in paragraphs (a)-(c) of Item 4 were $0 for the fiscal year ended December 31, 2011 and $132,299 for the fiscal year ended December 31, 2010. The services for which these fees were paid include review of materials provided to the fund Board in connection with the investment management contract renewal process.
(e) (1) The registrant’s audit committee is directly responsible for approving the services to be provided by the auditors, including:
(i) pre-approval of all audit and audit related services;
(ii) pre-approval of all non-audit related services to be provided to the Fund by the auditors;
(iii) pre-approval of all non-audit related services to be provided to the registrant by the auditors to the registrant’s investment adviser or to any entity that controls, is controlled by or is under common control with the registrant’s investment adviser and that provides ongoing services to the registrant where the non-audit services relate directly to the operations or financial reporting of the registrant; and
(iv) establishment by the audit committee, if deemed necessary or appropriate, as an alternative to committee pre-approval of services to be provided by the auditors, as required by paragraphs (ii) and (iii) above, of policies and procedures to permit such services to be pre-approved by other means, such as through establishment of guidelines or by action of a designated member or members of the committee; provided the policies and procedures are detailed as to the particular service and the committee is informed of each service and such policies and procedures do not include delegation of audit committee responsibilities, as contemplated under the Securities Exchange Act of 1934, to management; subject, in the case of (ii) through (iv), to any waivers, exceptions or exemptions that may be available under applicable law or rules.
(e) (2) None of the services provided to the registrant described in paragraphs (b)-(d) of Item 4 were approved by the audit committee pursuant to paragraph (c)(7)(i)(C) of Rule 2-01 of regulation S-X.
(f) No disclosures are required by this Item 4(f).
(g) The aggregate non-audit fees paid to the principal accountant for services rendered by the principal accountant to the registrant and the registrant’s investment adviser and any entity controlling, controlled by or under common control with the investment adviser that provides ongoing services to the registrant were $111,295 for the fiscal year ended December 31, 2011 and $181,090 for the fiscal year ended December 31, 2010.
(h) The registrant’s audit committee of the board has considered whether the provision of non-audit services that were rendered to the registrant’s investment adviser (not including any sub-adviser whose role is primarily portfolio management and is subcontracted with or overseen by another investment adviser), and any entity controlling, controlled by, or under common control with the investment adviser that provides ongoing services to the registrant that were not pre-approved pursuant to paragraph (c)(7)(ii) of Rule 2-01 of Regulation S-X is compatible with maintaining the principal accountant’s independence.
| Item 5. | Audit Committee of Listed Registrants. N/A |
| Item 6. | Schedule of Investments. N/A |
| Item 7. | Disclosure of Proxy Voting Policies and Procedures for Closed-End Management Investment Companies. N/A |
| Item 8. | Portfolio Managers of Closed-End Management Investment Companies. N/A |
| Item 9. | Purchases of Equity Securities by Closed-End Management Investment Companies and Affiliated Purchasers. N/A |
| Item 10. | Submission of Matters to a vote of Security Holders. |
There have been no changes to the procedures by which shareholders may recommend nominees to the Registrant’s Board of Trustees that would require disclosure herein.
| Item 11. | Controls and Procedures. |
(a) Evaluation of Disclosure Controls and Procedures. The Registrant maintains disclosure controls and procedures that are designed to ensure that information required to be disclosed in the Registrant’s filings under the Securities Exchange Act of 1934 and the Investment Company Act of 1940 is recorded, processed, summarized and reported within the periods specified in the rules and forms of the Securities and Exchange Commission. Such information is accumulated and communicated to the Registrant’s management, including its principal executive officer and principal financial officer, as appropriate, to allow timely decisions regarding required disclosure. The Registrant’s management, including the principal executive officer and the principal financial officer, recognizes that any set of controls and procedures, no matter how well designed and operated, can provide only reasonable assurance of achieving the desired control objectives.
Within 90 days prior to the filing date of this Shareholder Report on Form N-CSR, the Registrant had carried out an evaluation, under the supervision and with the participation of the Registrant’s management, including the Registrant’s principal executive officer and the Registrant’s principal financial officer, of the effectiveness of the design and operation of the Registrant’s disclosure controls and procedures. Based on such evaluation, the Registrant’s principal executive officer and principal financial officer concluded that the Registrant’s disclosure controls and procedures are effective.
(b) Changes in Internal Controls. There have been no significant changes in the Registrant’s internal controls or in other factors that could significantly affect the internal controls subsequent to the date of their evaluation in connection with the preparation of this Shareholder Report on Form N-CSR.
(a)(1) Code of Ethics
(a) (2) Certifications pursuant to Section 302 of the Sarbanes-Oxley Act of 2002 of Laura F. Fergerson, Chief Executive Officer—Finance and Administration, and Gaston Gardey, Chief Financial Officer and Chief Accounting Officer
(b) Certifications pursuant to Section 906 of the Sarbanes-Oxley Act of 2002 of Laura F. Fergerson, Chief Executive Officer—Finance and Administration, and Gaston Gardey, Chief Financial Officer and Chief Accounting Officer
SIGNATURES
Pursuant to the requirements of the Securities Exchange Act of 1934 and the Investment Company Act of 1940, the registrant has duly caused this report to be signed on its behalf by the undersigned, thereunto duly authorized.
FRANKLIN TEMPLETON VARIABLE INSURANCE PRODUCTS TRUST
| | |
| |
| By: | | /S/ LAURA F. FERGERSON |
| | Laura F. Fergerson Chief Executive Officer – Finance and Administration |
Date February 24, 2012
Pursuant to the requirements of the Securities Exchange Act of 1934 and the Investment Company Act of 1940, this report has been signed below by the following persons on behalf of the registrant and in the capacities and on the dates indicated.
| | |
| By: | | /S/ LAURA F. FERGERSON |
| | Laura F. Fergerson Chief Executive Officer – Finance and Administration |
Date February 24, 2012
| | |
| |
| By: | | /S/ GASTON GARDEY |
| | Gaston Gardey Chief Financial Officer and Chief Accounting Officer |
Date February 24, 2012