UNITED STATES
SECURITIES AND EXCHANGE COMMISSION
Washington, DC 20549
FORM N-CSR
CERTIFIED SHAREHOLDER REPORT OF REGISTERED
MANAGEMENT INVESTMENT COMPANIES
Investment Company Act file number 811-05583
Franklin Templeton Variable Insurance Products Trust
(Exact name of registrant as specified in charter)
One Franklin Parkway, San Mateo, CA 94403-1906
(Address of principal executive offices) (Zip code)
Craig S. Tyle, One Franklin Parkway, San Mateo, CA 94403-1906
(Name and address of agent for service)
Registrant’s telephone number, including area code: (650) 312-2000
Date of fiscal year end: 12/31
Date of reporting period: 12/31/13
| Item 1. | Reports to Stockholders. |

DECEMBER 31, 2013
FRANKLIN TEMPLETON
VARIABLE INSURANCE PRODUCTS TRUST
ANNUAL
REPORT

FRANKLIN TEMPLETON VARIABLE INSURANCE
PRODUCTS TRUST ANNUAL REPORT
TABLEOF CONTENTS
| | | | |
Important Notes to Performance Information | | | i | |
Fund Summaries | | | | |
Franklin Flex Cap Growth Securities Fund | | | FFC-1 | |
*Prospectus Supplement | | | FFC-8 | |
*Summary Prospectus Supplement | | | FFC-10 | |
Franklin High Income Securities Fund | | | FH-1 | |
Franklin Income Securities Fund | | | FI-1 | |
*Prospectus Supplement | | | FI-8 | |
*Statement of Additional Information Supplement | | | FI-10 | |
Franklin Rising Dividends Securities Fund | | | FRD-1 | |
*Prospectus Supplement | | | FRD-8 | |
Franklin Small Cap Value Securities Fund | | | FSV-1 | |
Franklin Small-Mid Cap Growth Securities Fund | | | FSC-1 | |
Franklin Strategic Income Securities Fund | | | FSI-1 | |
Franklin Templeton VIP Founding Funds Allocation Fund | | | FFA-1 | |
Mutual Global Discovery Securities Fund | | | MGD-1 | |
*Prospectus Supplement | | | MGD-9 | |
Mutual Shares Securities Fund | | | MS-1 | |
Templeton Developing Markets Securities Fund | | | TD-1 | |
Templeton Foreign Securities Fund | | | TF-1 | |
Templeton Global Bond Securities Fund | | | TGB-1 | |
Templeton Growth Securities Fund | | | TG-1 | |
Index Descriptions | | | I-1 | |
Board Members and Officers | | | BOD-1 | |
Shareholder Information | | | SI-1 | |
*Not part of the annual report. Retain for your records.
NOT FDIC INSURED | MAY LOSE VALUE | NO BANK GUARANTEE
MASTER CLASS – 4
IMPORTANT NOTESTO
PERFORMANCE INFORMATION
Performance data is historical and cannot predict or guarantee future results. Principal value and investment return will fluctuate with market conditions, and you may have a gain or loss when you withdraw your money. Inception dates of the funds may have preceded the effective dates of the subaccounts, contracts, or their availability in all states.
When reviewing the index comparisons, please keep in mind that indexes have a number of inherent performance differentials over the funds. First, unlike the funds, which must hold a minimum amount of cash to maintain liquidity, indexes do not have a cash component. Second, the funds are actively managed and, thus, are subject to management fees to cover salaries of securities analysts or portfolio managers in addition to other expenses. Indexes are unmanaged and do not include any commissions or other expenses typically associated with investing in securities. Third, indexes often contain a different mix of securities than the fund to which they are compared. Additionally, please remember that indexes are simply a measure of performance and cannot be invested in directly.
i
FRANKLIN FLEX CAP GROWTH SECURITIES FUND
We are pleased to bring you Franklin Flex Cap Growth Securities Fund’s annual report for the fiscal year ended December 31, 2013.
Performance Summary as of 12/31/13
Average annual total return of Class 4 shares* represents the average annual change in value, assuming reinvestment of dividends and capital gains. Average returns smooth out variations in returns, which can be significant; they are not the same as year-by-year results.
Periods ended 12/31/13
| | | | | | | | | | | | |
| | | 1-Year | | | 5-Year | | | Since Inception
(3/1/05) | |
Average Annual Total Return | | | +37.28% | | | | +17.04% | | | | +6.95% | |
*For the period beginning 2/29/08, Class 4 performance reflects a 12b-1 fee expense of 0.35% per year, which affects future performance. Class 4 performance prior to 2/29/08 reflects historical Class 1 performance, which does not have a 12b-1 fee expense. Since 2/29/08 (effective date), the average annual total return of Class 4 shares was +8.51%. The Fund has an expense reduction contractually guaranteed through at least 4/30/14, and a fee waiver associated with its investments in a Franklin Templeton money fund, contractually guaranteed through at least its current fiscal year end. Fund investment results reflect the expense reduction and fee waiver, to the extent applicable; without these reductions, the results would have been lower.
Total Return Index Comparison
for a Hypothetical $10,000 Investment (3/1/05–12/31/13)
The graph below shows the change in value of a hypothetical $10,000 investment in the Fund over the indicated period and includes reinvestment of any income or distributions. The Fund’s performance* is compared to the performance of the Russell 1000® Growth Index and the Russell 3000® Growth Index. One cannot invest directly in an index, and an index is not representative of the Fund’s portfolio. Please see Important Notes to Performance Information preceding the Fund Summaries.
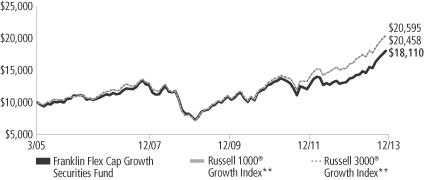
**Source: © 2014 Morningstar. Please see Index Descriptions following the Fund Summaries.
Franklin Flex Cap Growth Securities Fund – Class 4
Performance reflects the Fund’s Class 4 operating expenses, but does not include any contract fees, expenses or sales charges. If they had been included, performance would be lower. These charges and deductions, particularly for variable life policies, can have a significant effect on contract values and insurance benefits. See the contract prospectus for a complete description of these expenses, including sales charges.
Performance data represent past performance, which does not guarantee future results. Investment return and principal value will fluctuate, and you may have a gain or loss when you sell your shares.
Current performance may differ from figures shown.
FFC-1
Fund Goal and Main Investments: Franklin Flex Cap Growth Securities Fund seeks capital appreciation. Under normal market conditions, the Fund invests predominantly in equity securities of companies that the investment manager believes have the potential for capital appreciation.
Performance Overview
You can find the Fund’s one-year total return in the Performance Summary. In comparison, the Russell 1000® Growth Index generated a +33.48% total return, and the Russell 3000® Growth Index delivered a +34.23% total return, for the same period.1
Economic and Market Overview
The U.S. economy showed ongoing signs of recovery during the 12-month period ended December 31, 2013, especially in the second half of the year. Business investment, net exports, and state and local government spending picked up in the second quarter, somewhat offsetting the impact of federal budget cuts. During the third quarter, the economy, as measured by gross domestic product, expanded at the strongest pace since the fourth quarter of 2011, underpinned by consumer spending and rising inventories. Historically low mortgage rates and improving sentiment aided the housing market recovery, evidenced by solid new and existing home sales, rising home prices, low inventories and multi-year lows in new foreclosures. Manufacturing expanded for most of the period under review, and the unemployment rate declined to 6.7% in December from 7.8% a year earlier.2 Inflation remained well below the Federal Reserve Board’s (Fed’s) 2.0% target.
The year started on a positive note with Congress passing a budget bill that averted automatic federal budget cuts and income tax increases. However, Washington’s lack of consensus on proposed expenditure reductions resulted in federal spending cuts starting in March. Fed Chairman Ben Bernanke indicated in May that the Fed might reduce monthly asset purchases, assuming ongoing U.S. recovery. In September, however, he announced that any reduction of Fed purchases would be postponed until U.S. economic growth strengthened. A U.S. budget impasse, which led to a temporary shutdown of non-essential government services in October, ended after Congress agreed to fund the government until January 2014 and raise the debt limit until February. U.S. equity markets reached new highs after the resolution of the
1. Source: © 2014 Morningstar. One cannot invest directly in an index, and an index is not representative of the Fund’s portfolio. Please see Index Descriptions following the Fund Summaries.
2. Source: Bureau of Labor Statistics.
Fund Risks: All investments involve risks, including possible loss of principal. Investors should be comfortable with fluctuations in the value of their investments, as small and midsized company stocks can be volatile, especially over the short term. Smaller, midsized and relatively new or unseasoned companies can be particularly sensitive to changing economic conditions, and their prospects for growth are less certain than those of larger, more established companies. The Fund includes investments in technology securities, which can be highly volatile and involve special risks. The Fund is actively managed but there is no guarantee that the manager’s investment decisions will produce the desired results. The Fund’s prospectus also includes a description of the main investment risks.
FFC-2
budget impasse and the Fed’s reassurance at its October meeting that it would continue its supportive monetary programs. In December, Congress passed a two-year budget deal that would ease automatic spending cuts in 2014 and lower the risk of another government shutdown. Meanwhile, the Fed announced it would reduce its monthly bond purchases by $10 billion beginning in January 2014. The Fed, however, committed to keeping interest rates low as long as the unemployment rate remained over 6.5% and inflation expectations remained low.
Rising corporate profits and generally favorable economic data bolstered investor confidence, helping markets overcome brief periods of sell-offs in reaction to Fed statements and to Washington’s fiscal negotiations. U.S. stocks generated strong 12-month returns as the Standard & Poor’s® 500 Index and Dow Jones Industrial Average reached all-time highs during the period.3
Investment Strategy
We use fundamental, bottom-up research to seek companies meeting our criteria of growth potential, quality and valuation. In seeking sustainable growth characteristics, we look for companies we believe can produce sustainable earnings and cash flow growth, evaluating the long-term market opportunity and competitive structure of an industry to target leaders and emerging leaders. We define quality companies as those with strong and improving competitive positions in attractive markets. We also believe important attributes of quality are experienced and talented management teams as well as financial strength reflected in the capital structure, gross and operating margins, free cash flow generation and returns on capital employed. Our valuation analysis includes a range of potential outcomes based on an assessment of multiple scenarios. In assessing value, we consider whether security prices fully reflect the balance of the sustainable growth opportunities relative to business and financial risks.
Manager’s Discussion
During the 12 months under review, nearly all sectors contributed to performance relative to the Russell 3000® Growth Index. Stock selection and overweightings in the information technology (IT) and health care sectors drove relative performance.4 In the IT sector,
3. Please see Index Descriptions following the Fund Summaries.
4. The information technology sector comprises semiconductors and semiconductor equipment, software and services, and technology hardware and equipment in the SOI. The health care sector comprises health care equipment and services; and pharmaceuticals, biotechnology and life sciences in the SOI.
FFC-3
personal computing and mobile communication device manufacturer Apple and global payments and technology company MasterCard were among the top performers. Apple’s share price rallied late in the year based on strong sales of its new phones, a new sales agreement with China Mobile, and market expectations that the company could buy back more stock than originally announced. MasterCard’s share price rose after the company reported better-than-expected second- and third-quarter results driven by volume and transaction growth across geographies. The stock rose again after the company announced a new share repurchase program and an increased quarterly dividend toward year-end. In the health care sector, generic pharmaceutical company Actavis and biotechnology firms Celgene and Biogen Idec contributed to relative returns. The share price of Actavis rose after the company announced a merger with specialty drug maker Warner Chilcott and raised its 2013 earnings outlook. Celgene announced strong earnings that were driven by increased sales of its flagship drug Revlimid, which treats multiple myeloma, and company management was hopeful about favorable trial data for drugs in development, including psoriasis drug Apremilast. Multiple sclerosis drug Tecfidera increased sales and earnings for Biogen Idec after it received Food and Drug Administration (FDA) approval and was granted U.S. and European patents. Also supporting relative returns were an underweighting in consumer staples, particularly a lack of exposure to the tobacco industry, and stock selection in the beverage industry.5 Elsewhere, apparel and footwear manufacturer Under Armour in the consumer durables and apparel industry was a notable individual contributor to Fund performance.
In contrast, stock selection in the energy sector detracted from the Fund’s relative performance. Oil exploration and production company Cobalt International Energy, a key detractor, could not find commercially viable oil at one of its Gulf of Mexico wells, and toward year-end, its stock fell amid concerns the company may be unable to profit from its larger-than-expected natural gas discovery in Angola. IT companies F5 Networks6 and Nuance Communications,6 pharmaceutical companies ARIAD Pharmaceuticals6 and Allergan,6 and off-benchmark consumer durables and apparel company Lululemon Athletica (Canada) detracted from relative returns. The share price of computer network optimization products manufacturer F5 Networks declined amid slowing revenue growth based on reduced or delayed orders by its largest
5. The consumer staples sector comprises food and staples retailing; and food, beverage and tobacco in the SOI.
6. Sold by period-end.
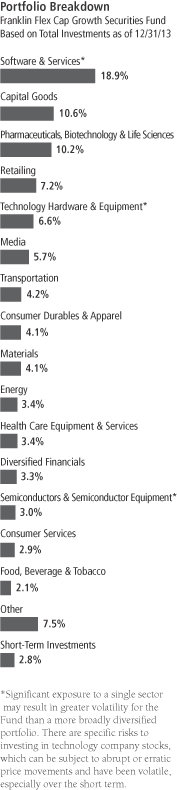
Top 10 Holdings
Franklin Flex Cap Growth Securities Fund
12/31/13
| | | | |
Company
Sector/Industry | | % of Total
Investments | |
| Google Inc., A | | | 3.0% | |
| Software & Services | | | | |
| Apple Inc. | | | 2.9% | |
| Technology Hardware & Equipment | | | | |
| MasterCard Inc., A | | | 2.5% | |
| Software & Services | | | | |
| Gilead Sciences Inc. | | | 2.1% | |
| Pharmaceuticals, Biotechnology & Life Sciences | | | | |
| Celgene Corp. | | | 1.9% | |
| Pharmaceuticals, Biotechnology & Life Sciences | | | | |
| Ecolab Inc. | | | 1.9% | |
| Materials | | | | |
| Amazon.com Inc. | | | 1.8% | |
| Retailing | | | | |
| Visa Inc., A | | | 1.8% | |
| Software & Services | | | | |
| Actavis PLC | | | 1.7% | |
| Pharmaceuticals, Biotechnology & Life Sciences | | | | |
| Precision Castparts Corp. | | | 1.6% | |
| Capital Goods | | | | |
The dollar value, number of shares or principal amount, and names of all portfolio holdings are listed in the Fund’s Statement of Investments (SOI).
FFC-4
customers and loss of market share to software-oriented businesses. Speech-software maker Nuance struggled with quarterly losses resulting from acquisition costs, higher expenses and lower margins despite revenue growth. ARIAD Pharmaceuticals’ share price fell after the biotechnology company halted trials on its leukemia drug Iclusig and the FDA suspended sales in response to reports of harmful side effects. Earnings for beauty drug maker Allergan were impacted by the sale of its obesity prevention business and the delay of new drug treatments pending FDA approval. The potential for earlier-than-expected FDA approval of generic alternatives to its eye drug Restasis also caused concern. The share price of technical athletic apparel maker Lululemon Athletica declined amid weak earnings after the company recalled a yoga pants line and endured related public relations issues that resulted in senior management turnover.
Thank you for your participation in Franklin Flex Cap Growth Securities Fund. We look forward to serving your future investment needs.
The foregoing information reflects our analysis, opinions and portfolio holdings as of December 31, 2013, the end of the reporting period. The way we implement our main investment strategies and the resulting portfolio holdings may change depending on factors such as market and economic conditions. These opinions may not be relied upon as investment advice or an offer for a particular security. The information is not a complete analysis of every aspect of any market, country, industry, security or the Fund. Statements of fact are from sources considered reliable, but the investment manager makes no representation or warranty as to their completeness or accuracy. Although historical performance is no guarantee of future results, these insights may help you understand our investment management philosophy.
FFC-5
Fund Expenses
As an investor in a variable insurance contract (Contract) that indirectly provides for investment in an underlying mutual fund, you can incur transaction and/or ongoing expenses at both the Fund level and the Contract level.
| • | | Transaction expenses can include sales charges (loads) on purchases, redemption fees, surrender fees, transfer fees and premium taxes. |
| • | | Ongoing expenses can include management fees, distribution and service (12b-1) fees, contract fees, annual maintenance fees, mortality and expense risk fees and other fees and expenses. All mutual funds and Contracts have some types of ongoing expenses. |
The expenses shown in the table are meant to highlight ongoing expenses at the Fund level only and do not include ongoing expenses at the Contract level, or transaction expenses at either the Fund or Contract level. While the Fund does not have transaction expenses, if the transaction and ongoing expenses at the Contract level were included, the expenses shown below would be higher. You should consult your Contract prospectus or disclosure document for more information.
The table shows Fund-level ongoing expenses and can help you understand these expenses and compare them with those of other mutual funds offered through the Contract. The table assumes a $1,000 investment held for the six months indicated. Please refer to the Fund prospectus for additional information on operating expenses.
Actual Fund Expenses
The first line (Actual) of the table provides actual account values and expenses. The “Ending Account Value” is derived from the Fund’s actual return, which includes the effect of ongoing Fund expenses, but does not include the effect of ongoing Contract expenses.
You can estimate the Fund-level expenses you incurred during the period by following these steps. Of course, your account value and expenses will differ from those in this illustration:
| 1. | Divide your account value by $1,000. |
If an account had an $8,600 value, then $8,600 ÷ $1,000 = 8.6.
| 2. | Multiply the result by the number under the heading “Fund-Level Expenses Incurred During Period.” |
If Fund-Level Expenses Incurred During Period were $7.50, then 8.6 x $7.50 = $64.50.
In this illustration, the estimated expenses incurred this period at the Fund level are $64.50.
Franklin Flex Cap Growth Securities Fund – Class 4
FFC-6
Hypothetical Example for Comparison with Other Mutual Funds
Information in the second line (Hypothetical) of the table can help you compare ongoing expenses of the Fund with those of other mutual funds offered through the Contract. This information may not be used to estimate the actual ending account balance or expenses you incurred during the period. The hypothetical “Ending Account Value” is based on the Fund’s actual expense ratio and an assumed 5% annual rate of return before expenses, which does not represent the Fund’s actual return. The figure under the heading “Fund-Level Expenses Incurred During Period” shows the hypothetical expenses your account would have incurred under this scenario. You can compare this figure with the 5% hypothetical examples that appear in shareholder reports of other funds offered through a Contract.
| | | | | | | | | | | | |
| Class 4 | | Beginning
Account Value 7/1/13 | | | Ending
Account Value 12/31/13 | | | Fund-Level Expenses Incurred
During Period* 7/1/13–12/31/13 | |
Actual | | $ | 1,000 | | | $ | 1,237.80 | | | $ | 5.81 | |
Hypothetical (5% return before expenses) | | $ | 1,000 | | | $ | 1,020.01 | | | $ | 5.24 | |
*Expenses are calculated using the most recent six-month annualized expense ratio, net of expense waivers, for the Fund’s Class 4 shares (1.03%), which does not include any ongoing expenses of the Contract for which the Fund is an investment option, multiplied by the average account value over the period, multiplied by 184/365 to reflect the one-half year period.
FFC-7
SUPPLEMENT DATED SEPTEMBER 1, 2013
TOTHE PROSPECTUS DATED MAY 1, 2013
OF
FRANKLIN FLEX CAP GROWTH SECURITIES FUND
(A series of Franklin Templeton Variable Insurance Products Trust)
The prospectus is amended as follows:
I. The Fund Summary “Portfolio Managers” section on page FFC-S4 is revised to read as follows:
Portfolio Managers
CONRAD B. HERRMANN, CFA Senior Vice President of Advisers and portfolio manager of the Fund since inception (2005).
MATTHEW J. MOBERG, CPA Vice President of Advisers and portfolio manager of the Fund since inception (2005).
ROBERT STEVENSON, CFA Portfolio Manager and Research Analyst of Advisers and portfolio manager of the Fund since September 2013.
II. For the Fund Details “Management” section disclosure concerning the portfolio management team beginning on page FFC-D4 is revised to read as follows:
The Fund is managed by a team of dedicated professionals focused on investments in sectors believed to have growth potential. The portfolio managers of the team are as follows:
| | |
CONRAD B. HERRMANN, CFA Senior Vice President of Advisers | | Mr. Herrmann has been the lead portfolio manager of the Fund since its inception (2005). He has primary responsibility for the investments of the Fund. He has final authority over all aspects of the Fund’s investment portfolio, including but not limited to, purchases and sales of individual securities, portfolio risk assessment, and the management of daily cash balances in accordance with anticipated investment management requirements. The degree to which he may perform these functions, and the nature of these functions, may change from time to time. He joined Franklin Templeton Investments in 1989. |
FFC-8
| | |
MATTHEW J. MOBERG, CPA Vice President of Advisers | | Mr. Moberg has been a portfolio manager of the Fund since its inception (2005), providing research and advice on the purchases and sales of individual securities, and portfolio risk assessment. He joined Franklin Templeton Investments in 1998. |
ROBERT STEVENSON, CFA Portfolio Manager and Research Analyst of Advisers | | Mr. Stevenson has been a portfolio manager of the Fund since September 2013, providing research and advice on the purchases and sales of individual securities, and portfolio risk assessment. He joined Franklin Templeton Investments in 2004. |
CFA® and Chartered Financial Analyst® are trademarks owned by CFA Institute.
Please keep this supplement for future reference.
FFC-9
SUPPLEMENT DATED SEPTEMBER 1, 2013
TOTHE SUMMARY PROSPECTUS DATED MAY 1, 2013
OF
FRANKLIN FLEX CAP GROWTH SECURITIES FUND
(A series of Franklin Templeton Variable Insurance Products Trust)
The summary prospectus is amended as follows:
The “Portfolio Managers” section on page FFC-S4 is revised to read as follows:
Portfolio Managers
CONRAD B. HERRMANN, CFA Senior Vice President of Advisers and portfolio manager of the Fund since inception (2005).
MATTHEW J. MOBERG, CPA Vice President of Advisers and portfolio manager of the Fund since inception (2005).
ROBERT STEVENSON, CFA Portfolio Manager and Research Analyst of Advisers and portfolio manager of the Fund since September 2013.
Please keep this supplement for future reference.
FFC-10
Franklin Templeton Variable Insurance Products Trust
Financial Highlights
Franklin Flex Cap Growth Securities Fund
| | | | | | | | | | | | | | | | | | | | |
| | | Year Ended December 31, | |
| Class 2 | | 2013 | | | 2012 | | | 2011 | | | 2010 | | | 2009 | |
| | | | |
Per share operating performance | | | | | | | | | | | | | | | | | | | | |
(for a share outstanding throughout the year) | | | | | | | | | | | | | | | | | | | | |
Net asset value, beginning of year | | $ | 13.21 | | | $ | 12.09 | | | $ | 12.70 | | | $ | 10.93 | | | $ | 8.22 | |
| | | | |
Income from investment operationsa: | | | | | | | | | | | | | | | | | | | | |
Net investment income (loss)b | | | (0.01 | ) | | | 0.01 | | | | (0.02 | ) | | | (0.02 | ) | | | (— | )c |
Net realized and unrealized gains (losses) | | | 4.95 | | | | 1.11 | | | | (0.59 | ) | | | 1.79 | | | | 2.71 | |
| | | | |
Total from investment operations | | | 4.94 | | | | 1.12 | | | | (0.61 | ) | | | 1.77 | | | | 2.71 | |
| | | | |
Less distributions from: | | | | | | | | | | | | | | | | | | | | |
Net investment income | | | (— | )c | | | — | | | | — | | | | — | | | | — | |
Net realized gains | | | (0.04 | ) | | | — | | | | — | | | | — | | | | — | |
| | | | |
Total distributions | | | (0.04 | ) | | | — | | | | — | | | | — | | | | — | |
| | | | |
Net asset value, end of year | | $ | 18.11 | | | $ | 13.21 | | | $ | 12.09 | | | $ | 12.70 | | | $ | 10.93 | |
| | | | |
| | | | | |
Total returnd | | | 37.48% | | | | 9.26% | | | | (4.80)% | | | | 16.19% | | | | 32.97% | |
Ratios to average net assets | | | | | | | | | | | | | | | | | | | | |
Expenses before waiver and payments by affiliates | | | 1.18% | | | | 1.18% | | | | 1.16% | | | | 1.18% | | | | 1.19% | |
Expenses net of waiver and payments by affiliates | | | 0.93% | | | | 0.93% | | | | 0.93% | | | | 0.93% | | | | 0.93% | e |
Net investment income (loss) | | | (0.09)% | | | | 0.09% | | | | (0.14)% | | | | (0.17)% | | | | (0.01)% | |
| | | | | |
Supplemental data | | | | | | | | | | | | | | | | | | | | |
Net assets, end of year (000’s) | | $ | 169,123 | | | $ | 159,122 | | | $ | 188,527 | | | $ | 227,774 | | | $ | 244,768 | |
Portfolio turnover rate | | | 52.15% | | | | 43.50% | | | | 63.99% | | | | 60.00% | | | | 33.64% | |
aThe amount shown for a share outstanding throughout the period may not correlate with the Statement of Operations for the period due to the timing of sales and repurchases of the Fund shares in relation to income earned and/or fluctuating market value of the investments of the Fund.
bBased on average daily shares outstanding.
cAmount rounds to less than $0.01 per share.
dTotal return does not include fees, charges or expenses imposed by the variable annuity and life insurance contracts for which the Franklin Templeton Variable Insurance Products Trust serves as an underlying investment vehicle.
eBenefit of expense reduction rounds to less than 0.01%.
The accompanying notes are an integral part of these financial statements.
FFC-11
Franklin Templeton Variable Insurance Products Trust
Financial Highlights (continued)
Franklin Flex Cap Growth Securities Fund
| | | | | | | | | | | | | | | | | | | | |
| | | Year Ended December 31, | |
| Class 4 | | 2013 | | | 2012 | | | 2011 | | | 2010 | | | 2009 | |
| | | | |
Per share operating performance | | | | | | | | | | | | | | | | | | | | |
(for a share outstanding throughout the year) | | | | | | | | | | | | | | | | | | | | |
Net asset value, beginning of year | | $ | 13.12 | | | $ | 12.01 | | | $ | 12.63 | | | $ | 10.88 | | | $ | 8.21 | |
| | | | |
Income from investment operationsa: | | | | | | | | | | | | | | | | | | | | |
Net investment income (loss)b | | | (0.03 | ) | | | (— | )c | | | (0.03 | ) | | | (0.03 | ) | | | (0.01 | ) |
Net realized and unrealized gains (losses) | | | 4.91 | | | | 1.11 | | | | (0.59 | ) | | | 1.78 | | | | 2.69 | |
| | | | |
Total from investment operations | | | 4.88 | | | | 1.11 | | | | (0.62 | ) | | | 1.75 | | | | 2.68 | |
| | | | |
Less distributions from: | | | | | | | | | | | | | | | | | | | | |
Net investment income | | | — | | | | — | | | | — | | | | — | | | | (0.01 | ) |
Net realized gains | | | (0.04 | ) | | | — | | | | — | | | | — | | | | — | |
| | | | |
Total distributions | | | (0.04 | ) | | | — | | | | — | | | | — | | | | (0.01 | ) |
| | | | |
Net asset value, end of year | | $ | 17.96 | | | $ | 13.12 | | | $ | 12.01 | | | $ | 12.63 | | | $ | 10.88 | |
| | | | |
| | | | | |
Total returnd | | | 37.28% | | | | 9.24% | | | | (4.91)% | | | | 16.08% | | | | 32.69% | |
Ratios to average net assets | | | | | | | | | | | | | | | | | | | | |
Expenses before waiver and payments by affiliates | | | 1.28% | | | | 1.28% | | | | 1.26% | | | | 1.28% | | | | 1.29% | |
Expenses net of waiver and payments by affiliates | | | 1.03% | | | | 1.03% | | | | 1.03% | | | | 1.03% | | | | 1.03% | e |
Net investment income (loss) | | | (0.19)% | | | | (0.01)% | | | | (0.24)% | | | | (0.27)% | | | | (0.11)% | |
| | | | | |
Supplemental data | | | | | | | | | | | | | | | | | | | | |
Net assets, end of year (000’s) | | $ | 251,339 | | | $ | 216,607 | | | $ | 270,598 | | | $ | 263,746 | | | $ | 218,798 | |
Portfolio turnover rate | | | 52.15% | | | | 43.50% | | | | 63.99% | | | | 60.00% | | | | 33.64% | |
aThe amount shown for a share outstanding throughout the period may not correlate with the Statement of Operations for the period due to the timing of sales and repurchases of the Fund shares in relation to income earned and/or fluctuating market value of the investments of the Fund.
bBased on average daily shares outstanding.
cAmount rounds to less than $0.01 per share.
dTotal return does not include fees, charges or expenses imposed by the variable annuity and life insurance contracts for which the Franklin Templeton Variable Insurance Products Trust serves as an underlying investment vehicle.
eBenefit of expense reduction rounds to less than 0.01%.
The accompanying notes are an integral part of these financial statements.
FFC-12
Franklin Templeton Variable Insurance Products Trust
Statement of Investments, December 31, 2013
| | | | | | | | |
| Franklin Flex Cap Growth Securities Fund | | Shares | | | Value | |
Common Stocks 100.4% | | | | | | | | |
Automobiles & Components 0.9% | | | | | | | | |
BorgWarner Inc. | | | 56,650 | | | $ | 3,167,302 | |
a Tesla Motors Inc. | | | 4,880 | | | | 733,854 | |
| | | | | | | | |
| | | | | | | 3,901,156 | |
| | | | | | | | |
Banks 1.7% | | | | | | | | |
a Signature Bank/New York NY | | | 39,070 | | | | 4,196,899 | |
Wells Fargo & Co. | | | 66,410 | | | | 3,015,014 | |
| | | | | | | | |
| | | | | | | 7,211,913 | |
| | | | | | | | |
Capital Goods 11.0% | | | | | | | | |
a Chart Industries Inc. | | | 39,070 | | | | 3,736,655 | |
Danaher Corp. | | | 48,830 | | | | 3,769,676 | |
a DigitalGlobe Inc. | | | 36,630 | | | | 1,507,325 | |
Fastenal Co. | | | 41,020 | | | | 1,948,860 | |
aHD Supply Holdings Inc. | | | 28,570 | | | | 685,966 | |
Honeywell International Inc. | | | 48,830 | | | | 4,461,597 | |
aJacobs Engineering Group Inc. | | | 34,180 | | | | 2,152,998 | |
aThe Keyw Holding Corp. | | | 24,420 | | | | 328,205 | |
The Manitowoc Co. Inc. | | | 141,620 | | | | 3,302,578 | |
Pall Corp. | | | 47,620 | | | | 4,064,367 | |
Precision Castparts Corp. | | | 25,690 | | | | 6,918,317 | |
aProto Labs Inc. | | | 29,300 | | | | 2,085,574 | |
Rockwell Automation Inc. | | | 20,570 | | | | 2,430,551 | |
Roper Industries Inc. | | | 26,370 | | | | 3,656,992 | |
aUnited Rentals Inc. | | | 64,830 | | | | 5,053,498 | |
| | | | | | | | |
| | | | | | | 46,103,159 | |
| | | | | | | | |
Commercial & Professional Services 1.9% | | | | | | | | |
a IHS Inc., A | | | 16,600 | | | | 1,987,020 | |
Nielsen Holdings NV | | | 58,600 | | | | 2,689,154 | |
aStericycle Inc. | | | 19,530 | | | | 2,268,800 | |
aVerisk Analytics Inc., A | | | 16,120 | | | | 1,059,406 | |
| | | | | | | | |
| | | | | | | 8,004,380 | |
| | | | | | | | |
Consumer Durables & Apparel 4.3% | | | | | | | | |
a Lululemon Athletica Inc. (Canada) | | | 20,510 | | | | 1,210,705 | |
aMichael Kors Holdings Ltd. | | | 45,020 | | | | 3,655,174 | |
NIKE Inc., B | | | 56,160 | | | | 4,416,422 | |
Ralph Lauren Corp. | | | 18,010 | | | | 3,180,026 | |
aTRI Pointe Homes Inc. | | | 76,190 | | | | 1,518,467 | |
aUnder Armour Inc., A | | | 46,390 | | | | 4,049,847 | |
| | | | | | | | |
| | | | | | | 18,030,641 | |
| | | | | | | | |
Consumer Services 3.0% | | | | | | | | |
a Bally Technologies Inc. | | | 33,330 | | | | 2,614,738 | |
aChipotle Mexican Grill Inc. | | | 3,860 | | | | 2,056,531 | |
aChuy’s Holdings Inc. | | | 28,570 | | | | 1,029,091 | |
aHilton Worldwide Holdings Inc. | | | 35,590 | | | | 791,878 | |
Las Vegas Sands Corp. | | | 18,910 | | | | 1,491,432 | |
aNoodles & Co. | | | 21,490 | | | | 771,921 | |
Wynn Resorts Ltd. | | | 19,050 | | | | 3,699,700 | |
| | | | | | | | |
| | | | | | | 12,455,291 | |
| | | | | | | | |
Diversified Financials 3.4% | | | | | | | | |
a Affiliated Managers Group Inc. | | | 4,385 | | | | 951,019 | |
FFC-13
Franklin Templeton Variable Insurance Products Trust
Statement of Investments, December 31, 2013 (continued)
| | | | | | | | |
| Franklin Flex Cap Growth Securities Fund | | Shares | | | Value | |
Common Stocks (continued) | | | | | | | | |
Diversified Financials (continued) | | | | | | | | |
Discover Financial Services | | | 48,830 | | | $ | 2,732,039 | |
Evercore Partners Inc. | | | 22,500 | | | | 1,345,050 | |
Financial Engines Inc. | | | 23,440 | | | | 1,628,611 | |
IntercontinentalExchange Group Inc. | | | 14,210 | | | | 3,196,113 | |
T. Rowe Price Group Inc. | | | 54,030 | | | | 4,526,093 | |
| | | | | | | | |
| | | | | | | 14,378,925 | |
| | | | | | | | |
Energy 3.5% | | | | | | | | |
Anadarko Petroleum Corp. | | | 24,420 | | | | 1,936,995 | |
aCobalt International Energy Inc. | | | 35,000 | | | | 575,750 | |
aDiamondback Energy Inc. | | | 23,440 | | | | 1,239,038 | |
aFMC Technologies Inc. | | | 41,020 | | | | 2,141,654 | |
National Oilwell Varco Inc. | | | 25,210 | | | | 2,004,951 | |
Noble Energy Inc. | | | 36,140 | | | | 2,461,496 | |
Oceaneering International Inc. | | | 13,180 | | | | 1,039,638 | |
Schlumberger Ltd. | | | 38,270 | | | | 3,448,510 | |
| | | | | | | | |
| | | | | | | 14,848,032 | |
| | | | | | | | |
Food & Staples Retailing 1.1% | | | | | | | | |
a,b Fairway Group Holdings Corp. | | | 18,470 | | | | 334,676 | |
aSprouts Farmers Markets LLC | | | 4,200 | | | | 161,406 | |
Whole Foods Market Inc. | | | 69,520 | | | | 4,020,342 | |
| | | | | | | | |
| | | | | | | 4,516,424 | |
| | | | | | | | |
Food, Beverage & Tobacco 2.2% | | | | | | | | |
aBoston Beer Inc., A | | | 8,060 | | | | 1,948,827 | |
Mead Johnson Nutrition Co., A | | | 32,180 | | | | 2,695,397 | |
aMonster Beverage Corp. | | | 34,760 | | | | 2,355,685 | |
PepsiCo Inc. | | | 24,420 | | | | 2,025,395 | |
| | | | | | | | |
| | | | | | | 9,025,304 | |
| | | | | | | | |
Health Care Equipment & Services 3.5% | | | | | | | | |
Abbott Laboratories | | | 78,130 | | | | 2,994,723 | |
aCerner Corp. | | | 56,160 | | | | 3,130,358 | |
aDaVita HealthCare Partners Inc. | | | 38,100 | | | | 2,414,397 | |
aEnvision Healthcare Holdings Inc. | | | 21,490 | | | | 763,325 | |
aExpress Scripts Holding Co. | | | 36,630 | | | | 2,572,891 | |
McKesson Corp. | | | 14,650 | | | | 2,364,510 | |
a,b Veeva Systems Inc. | | | 11,720 | | | | 376,212 | |
| | | | | | | | |
| | | | | | | 14,616,416 | |
| | | | | | | | |
Insurance 0.5% | | | | | | | | |
Aflac Inc. | | | 31,740 | | | | 2,120,232 | |
| | | | | | | | |
Materials 4.2% | | | | | | | | |
Airgas Inc. | | | 18,070 | | | | 2,021,130 | |
Cytec Industries Inc. | | | 48,830 | | | | 4,549,003 | |
Ecolab Inc. | | | 78,130 | | | | 8,146,615 | |
Praxair Inc. | | | 23,440 | | | | 3,047,903 | |
| | | | | | | | |
| | | | | | | 17,764,651 | |
| | | | | | | | |
Media 5.9% | | | | | | | | |
aCharter Communications Inc., A | | | 19,530 | | | | 2,670,923 | |
aDiscovery Communications Inc., C | | | 53,720 | | | | 4,504,959 | |
aImax Corp. (Canada) | | | 56,270 | | �� | | 1,658,840 | |
FFC-14
Franklin Templeton Variable Insurance Products Trust
Statement of Investments, December 31, 2013 (continued)
| | | | | | | | |
| Franklin Flex Cap Growth Securities Fund | | Shares | | | Value | |
Common Stocks (continued) | | | | | | | | |
Media (continued) | | | | | | | | |
aSirius XM Holdings Inc. | | | 1,269,680 | | | $ | 4,431,183 | |
Twenty-First Century Fox Inc., A | | | 131,850 | | | | 4,638,483 | |
The Walt Disney Co. | | | 87,900 | | | | 6,715,560 | |
| | | | | | | | |
| | | | | | | 24,619,948 | |
| | | | | | | | |
Pharmaceuticals, Biotechnology & Life Sciences 10.6% | | | | | | | | |
aActavis PLC | | | 43,950 | | | | 7,383,600 | |
aAlnylam Pharmaceuticals Inc. | | | 29,300 | | | | 1,884,869 | |
aBiogen Idec Inc. | | | 21,980 | | | | 6,148,905 | |
Bristol-Myers Squibb Co. | | | 81,040 | | | | 4,307,276 | |
aCelgene Corp. | | | 48,830 | | | | 8,250,317 | |
aCelldex Therapeutics Inc. | | | 97,670 | | | | 2,364,591 | |
aGilead Sciences Inc. | | | 122,090 | | | | 9,175,063 | |
aIllumina Inc. | | | 25,390 | | | | 2,808,642 | |
aQuintiles Transnational Holdings Inc. | | | 45,900 | | | | 2,127,006 | |
| | | | | | | | |
| | | | | | | 44,450,269 | |
| | | | | | | | |
Real Estate 0.5% | | | | | | | | |
American Tower Corp. | | | 28,570 | | | | 2,280,457 | |
| | | | | | | | |
Retailing 7.4% | | | | | | | | |
aAmazon.com Inc. | | | 19,530 | | | | 7,788,369 | |
aThe Container Store Group Inc. | | | 14,650 | | | | 682,837 | |
Dick’s Sporting Goods Inc. | | | 53,720 | | | | 3,121,132 | |
aDollar General Corp. | | | 33,750 | | | | 2,035,800 | |
aHomeAway Inc. | | | 71,300 | | | | 2,914,744 | |
Lithia Motors Inc. | | | 14,650 | | | | 1,017,003 | |
aLKQ Corp. | | | 38,100 | | | | 1,253,490 | |
aNetflix Inc. | | | 2,930 | | | | 1,078,738 | |
aPriceline.com Inc. | | | 4,690 | | | | 5,451,656 | |
Ross Stores Inc. | | | 14,650 | | | | 1,097,725 | |
aShutterfly Inc. | | | 19,530 | | | | 994,663 | |
Tractor Supply Co. | | | 34,180 | | | | 2,651,684 | |
aTripAdvisor Inc. | | | 14,450 | | | | 1,196,893 | |
| | | | | | | | |
| | | | | | | 31,284,734 | |
| | | | | | | | |
Semiconductors & Semiconductor Equipment 3.1% | | | | | | | | |
aCavium Inc. | | | 31,740 | | | | 1,095,347 | |
Microchip Technology Inc. | | | 75,690 | | | | 3,387,128 | |
aNXP Semiconductors NV (Netherlands) | | | 102,550 | | | | 4,710,122 | |
Xilinx Inc. | | | 83,020 | | | | 3,812,278 | |
| | | | | | | | |
| | | | | | | 13,004,875 | |
| | | | | | | | |
Software & Services 19.5% | | | | | | | | |
aAlliance Data Systems Corp. | | | 12,210 | | | | 3,210,375 | |
aANSYS Inc. | | | 34,670 | | | | 3,023,224 | |
aBottomline Technologies Inc. | | | 34,180 | | | | 1,235,949 | |
aBroadSoft Inc. | | | 41,510 | | | | 1,134,883 | |
aDemandware Inc. | | | 17,380 | | | | 1,114,406 | |
aeBay Inc. | | | 58,600 | | | | 3,216,554 | |
aElectronic Arts Inc. | | | 34,180 | | | | 784,089 | |
aFacebook Inc., A | | | 97,670 | | | | 5,338,642 | |
aFireEye Inc. | | | 9,760 | | | | 425,634 | |
aFleetCor Technologies Inc. | | | 26,860 | | | | 3,147,186 | |
aFortinet Inc. | | | 49,520 | | | | 947,318 | |
FFC-15
Franklin Templeton Variable Insurance Products Trust
Statement of Investments, December 31, 2013 (continued)
| | | | | | | | |
| Franklin Flex Cap Growth Securities Fund | | Shares | | | Value | |
Common Stocks (continued) | | | | | | | | |
Software & Services (continued) | | | | | | | | |
aGlobal Eagle Entertainment Inc. | | | 48,830 | | | $ | 726,102 | |
aGoogle Inc., A | | | 11,720 | | | | 13,134,721 | |
aGuidewire Software Inc. | | | 34,180 | | | | 1,677,213 | |
aLinkedIn Corp., A | | | 18,560 | | | | 4,024,365 | |
MasterCard Inc., A | | | 13,190 | | | | 11,019,717 | |
aNetSuite Inc. | | | 40,950 | | | | 4,218,669 | |
aPandora Media Inc. | | | 37,820 | | | | 1,006,012 | |
aSalesforce.com Inc. | | | 81,040 | | | | 4,472,598 | |
aServiceNow Inc. | | | 45,240 | | | | 2,533,892 | |
aSplunk Inc. | | | 18,000 | | | | 1,236,060 | |
a,b Twitter Inc. | | | 19,530 | | | | 1,243,084 | |
Visa Inc., A | | | 34,180 | | | | 7,611,202 | |
aWorkday Inc. | | | 14,280 | | | | 1,187,525 | |
aYahoo! Inc. | | | 87,900 | | | | 3,554,676 | |
aYelp Inc. | | | 12,110 | | | | 834,985 | |
| | | | | | | | |
| | | | | | | 82,059,081 | |
| | | | | | | | |
Technology Hardware & Equipment 6.8% | | | | | | | | |
Apple Inc. | | | 22,460 | | | | 12,602,531 | |
National Instruments Corp. | | | 61,370 | | | | 1,965,068 | |
aPalo Alto Networks Inc. | | | 17,090 | | | | 982,162 | |
QUALCOMM Inc. | | | 92,780 | | | | 6,888,915 | |
aStratasys Ltd. | | | 19,530 | | | | 2,630,691 | |
aTrimble Navigation Ltd. | | | 85,570 | | | | 2,969,279 | |
a,b Ubiquiti Networks Inc. | | | 12,690 | | | | 583,232 | |
| | | | | | | | |
| | | | | | | 28,621,878 | |
| | | | | | | | |
Telecommunication Services 0.9% | | | | | | | | |
aSBA Communications Corp. | | | 43,950 | | | | 3,948,468 | |
| | | | | | | | |
Transportation 4.3% | | | | | | | | |
Canadian Pacific Railway Ltd. (Canada) | | | 16,120 | | | | 2,439,278 | |
Expeditors International of Washington Inc. | | | 27,010 | | | | 1,195,193 | |
aGenesee & Wyoming Inc. | | | 32,720 | | | | 3,142,756 | |
aHub Group Inc., A | | | 72,040 | | | | 2,872,955 | |
Kansas City Southern | | | 23,440 | | | | 2,902,575 | |
aKirby Corp. | | | 8,990 | | | | 892,258 | |
aSpirit Airlines Inc. | | | 31,740 | | | | 1,441,313 | |
Union Pacific Corp. | | | 19,530 | | | | 3,281,040 | |
| | | | | | | | |
| | | | | | | 18,167,368 | |
| | | | | | | | |
Utilities 0.2% | | | | | | | | |
a Calpine Corp. | | | 47,620 | | | | 929,066 | |
| | | | | | | | |
Total Common Stocks (Cost $252,878,108) | | | | | | | 422,342,668 | |
| | | | | | | | |
Short Term Investments 3.0% | | | | | | | | |
Money Market Funds (Cost $10,328,559) 2.5% | | | | | | | | |
a,c Institutional Fiduciary Trust Money Market Portfolio | | | 10,328,559 | | | | 10,328,559 | |
| | | | | | | | |
FFC-16
Franklin Templeton Variable Insurance Products Trust
Statement of Investments, December 31, 2013 (continued)
| | | | | | |
| Franklin Flex Cap Growth Securities Fund | | Shares | | Value | |
dInvestments from Cash Collateral Received for Loaned Securities 0.5% | | | | | | |
Money Market Funds (Cost $2,060,390) 0.5% | | | | | | |
e BNY Mellon Overnight Government Fund, 0.017% | | 2,060,390 | | $ | 2,060,390 | |
| | | | | | |
Total Investments (Cost $265,267,057) 103.4% | | | | | 434,731,617 | |
Other Assets, less Liabilities (3.4)% | | | | | (14,270,104 | ) |
| | | | | | |
Net Assets 100.0% | | | | $ | 420,461,513 | |
| | | | | | |
aNon-income producing.
bA portion or all of the security is on loan at December 31, 2013. See Note 1(b).
cSee Note 7 regarding investments in the Institutional Fiduciary Trust Money Market Portfolio.
dSee Note 1(b) regarding securities on loan.
eThe rate shown is the annualized seven-day yield at period end.
The accompanying notes are an integral part of these financial statements.
FFC-17
Franklin Templeton Variable Insurance Products Trust
Financial Statements
Statement of Assets and Liabilities
December 31, 2013
| | | | |
| | | Franklin Flex
Cap Growth
Securities Fund | |
Assets: | | | | |
Investments in securities: | | | | |
Cost - Unaffiliated issuers | | $ | 254,938,498 | |
Cost - Sweep Money Fund (Note 7) | | | 10,328,559 | |
| | | | |
Total cost of investments | | $ | 265,267,057 | |
| | | | |
Value - Unaffiliated issuers | | $ | 424,403,058 | |
Value - Sweep Money Fund (Note 7) | | | 10,328,559 | |
| | | | |
Total value of investments (Includes securities loaned in the amount of $2,015,270) | | | 434,731,617 | |
Receivables: | | | | |
Investment securities sold | | | 1,512,567 | |
Capital shares sold | | | 119,568 | |
Dividends and interest | | | 243,501 | |
Other assets | | | 9 | |
| | | | |
Total assets | | | 436,607,262 | |
| | | | |
Liabilities: | | | | |
Payables: | | | | |
Capital shares redeemed | | | 13,550,514 | |
Management fees | | | 246,150 | |
Distribution fees | | | 217,410 | |
Payable upon return of securities loaned | | | 2,060,390 | |
Accrued expenses and other liabilities | | | 71,285 | |
| | | | |
Total liabilities | | | 16,145,749 | |
| | | | |
Net assets, at value | | $ | 420,461,513 | |
| | | | |
Net assets consist of: | | | | |
Paid-in capital | | $ | 193,788,468 | |
Undistributed net investment income (loss) | | | — | |
Net unrealized appreciation (depreciation) | | | 169,464,560 | |
Accumulated net realized gain (loss) | | | 57,208,485 | |
| | | | |
Net assets, at value | | $ | 420,461,513 | |
| | | | |
Class 2: | | | | |
Net assets, at value | | $ | 169,122,581 | |
| | | | |
Shares outstanding | | | 9,339,577 | |
| | | | |
Net asset value and maximum offering price per share | | $ | 18.11 | |
| | | | |
Class 4: | | | | |
Net assets, at value | | $ | 251,338,932 | |
| | | | |
Shares outstanding | | | 13,993,419 | |
| | | | |
Net asset value and maximum offering price per share | | $ | 17.96 | |
| | | | |
The accompanying notes are an integral part of these financial statements.
FFC-18
Franklin Templeton Variable Insurance Products Trust
Financial Statements (continued)
Statement of Operations
for the year ended December 31, 2013
| | | | |
| | | Franklin Flex
Cap Growth
Securities Fund | |
Investment income: | | | | |
Dividends | | $ | 3,248,936 | |
Income from securities loaned | | | 125,937 | |
| | | | |
Total investment income | | | 3,374,873 | |
| | | | |
Expenses: | | | | |
Management fees (Note 3a) | | | 3,303,802 | |
Administrative fees (Note 3b) | | | 321,920 | |
Distribution fees: (Note 3c) | | | | |
Class 2 | | | 410,341 | |
Class 4 | | | 828,555 | |
Unaffiliated transfer agent fees | | | 122 | |
Custodian fees (Note 4) | | | 3,411 | |
Reports to shareholders | | | 68,126 | |
Professional fees | | | 40,107 | |
Trustees’ fees and expenses | | | 1,567 | |
Other | | | 7,096 | |
| | | | |
Total expenses | | | 4,985,047 | |
Expenses waived/paid by affiliates (Note 3f) | | | (1,019,759 | ) |
| | | | |
Net expenses | | | 3,965,288 | |
| | | | |
Net investment income (loss) | | | (590,415 | ) |
| | | | |
Realized and unrealized gains (losses): | | | | |
Net realized gain (loss) from investments | | | 60,105,842 | |
Net change in unrealized appreciation (depreciation) on investments | | | 67,788,666 | |
| | | | |
Net realized and unrealized gain (loss) | | | 127,894,508 | |
| | | | |
Net increase (decrease) in net assets resulting from operations | | $ | 127,304,093 | |
| | | | |
The accompanying notes are an integral part of these financial statements.
FFC-19
Franklin Templeton Variable Insurance Products Trust
Financial Statements (continued)
Statements of Changes in Net Assets
| | | | | | | | |
| | | Franklin Flex Cap Growth
Securities Fund | |
| | | Year Ended December 31, | |
| | | 2013 | | | 2012 | |
| | | | |
Increase (decrease) in net assets: | | | | | | | | |
Operations: | | | | | | | | |
Net investment income (loss) | | $ | (590,415 | ) | | $ | 121,580 | |
Net realized gain (loss) from investments | | | 60,105,842 | | | | 31,233,189 | |
Net change in unrealized appreciation (depreciation) on investments | | | 67,788,666 | | | | 10,611,218 | |
| | | | |
Net increase (decrease) in net assets resulting from operations | | | 127,304,093 | | | | 41,965,987 | |
| | | | |
Distributions to shareholders from: | | | | | | | | |
Net investment income: | | | | | | | | |
Class 2 | | | (6,555 | ) | | | — | |
Net realized gains: | | | | | | | | |
Class 2 | | | (449,397 | ) | | | — | |
Class 4 | | | (654,813 | ) | | | — | |
| | | | |
Total distributions to shareholders | | | (1,110,765 | ) | | | — | |
| | | | |
Capital share transactions: (Note 2) | | | | | | | | |
Class 2 | | | (41,676,643 | ) | | | (46,599,479 | ) |
Class 4 | | | (39,784,837 | ) | | | (78,761,409 | ) |
| | | | |
Total capital share transactions | | | (81,461,480 | ) | | | (125,360,888 | ) |
| | | | |
Net increase (decrease) in net assets | | | 44,731,848 | | | | (83,394,901 | ) |
Net assets: | | | | | | | | |
Beginning of year | | | 375,729,665 | | | | 459,124,566 | |
| | | | |
End of year | | $ | 420,461,513 | | | $ | 375,729,665 | |
| | | | |
Undistributed net investment income (loss) included in net assets: | | | | | | | | |
End of year | | $ | — | | | $ | 170,117 | |
| | | | |
The accompanying notes are an integral part of these financial statements.
FFC-20
Franklin Templeton Variable Insurance Products Trust
Notes to Financial Statements
Franklin Flex Cap Growth Securities Fund
1. ORGANIZATION AND SIGNIFICANT ACCOUNTING POLICIES
Franklin Templeton Variable Insurance Products Trust (Trust) is registered under the Investment Company Act of 1940, as amended, (1940 Act) as an open-end investment company, consisting of twenty separate funds. The Franklin Flex Cap Growth Securities Fund (Fund) is included in this report. The financial statements of the remaining funds in the Trust are presented separately. Shares of the Fund are generally sold only to insurance company separate accounts to fund the benefits of variable life insurance policies or variable annuity contracts. At December 31, 2013, 77.84% of the Fund’s shares were held through one insurance company. Investment activities of these insurance company separate accounts could have a material impact on the Fund. The Fund offers two classes of shares: Class 2 and Class 4. Each class of shares differs by its distribution fees, voting rights on matters affecting a single class and its exchange privilege.
The following summarizes the Fund’s significant accounting policies.
a. Financial Instrument Valuation
The Fund’s investments in financial instruments are carried at fair value daily. Fair value is the price that would be received to sell an asset or paid to transfer a liability in an orderly transaction between market participants on the measurement date. The Fund calculates the net asset value (NAV) per share at the close of the New York Stock Exchange (NYSE), generally at 4p.m. Eastern time (NYSE close) on each day the NYSE is open for trading. Under procedures approved by the Trust’s Board of Trustees (the Board), the Fund’s administrator, investment manager and other affiliates have formed the Valuation and Liquidity Oversight Committee (VLOC). The VLOC provides administration and oversight of the Fund’s valuation policies and procedures, which are approved annually by the Board. Among other things, these procedures allow the Fund to utilize independent pricing services, quotations from securities and financial instrument dealers, and other market sources to determine fair value.
Equity securities listed on an exchange or on the NASDAQ National Market System are valued at the last quoted sale price or the official closing price of the day, respectively. Foreign equity securities are valued as of the close of trading on the foreign stock exchange on which the security is primarily traded or as of the NYSE close, whichever is earlier. The value is then converted into its U.S. dollar equivalent at the foreign exchange rate in effect at the NYSE close on the day that the value of the security is determined. Over-the-counter (OTC) securities are valued within the range of the most recent quoted bid and ask prices. Securities that trade in multiple markets or on multiple exchanges are valued according to the broadest and most representative market. Certain equity securities are valued based upon fundamental characteristics or relationships to similar securities. Investments in open-end mutual funds and non regulated money funds are valued at the closing net asset value.
The Fund has procedures to determine the fair value of financial instruments for which market prices are not reliable or readily available. Under these procedures, the VLOC convenes on a regular basis to review such financial instruments and considers a number of factors, including significant unobservable valuation inputs, when arriving at fair value. The VLOC primarily employs a market-based approach which may use related or comparable assets or liabilities, recent transactions, market multiples, book values, and other relevant information for the investment to determine the fair value of the investment. An income-based valuation approach may also be used in which the anticipated future cash flows of the investment are discounted to calculate fair value. Discounts may also be applied due to the nature or duration of any restrictions on the disposition of the investments. Due to the inherent uncertainty of valuations of such investments, the fair values may differ significantly from the values that would have been used had an active market existed. The VLOC employs various methods for calibrating these valuation approaches including a regular review of key inputs and assumptions, transactional back-testing or disposition analysis, and reviews of any related market activity.
b. Securities Lending
The Fund participates in an agency based securities lending program. The Fund receives cash collateral against the loaned securities in an amount equal to at least 102% of the market value of the loaned securities. Collateral is maintained over the life
FFC-21
Franklin Templeton Variable Insurance Products Trust
Notes to Financial Statements (continued)
Franklin Flex Cap Growth Securities Fund
1. ORGANIZATION AND SIGNIFICANT ACCOUNTING POLICIES (continued)
b. Securities Lending (continued)
of the loan in an amount not less than 100% of the market value of loaned securities, as determined at the close of fund business each day; any additional collateral required due to changes in security values is delivered to the Fund on the next business day. The collateral is invested in a non-registered money fund as indicated on the Statement of Investments. The Fund receives income from the investment of cash collateral, in addition to lending fees and rebates paid by the borrower. The Fund bears the market risk with respect to the collateral investment, securities loaned, and the risk that the agent may default on its obligations to the Fund. The securities lending agent has agreed to indemnify the Fund in the event of default by a third party borrower.
c. Income and Deferred Taxes
It is the Fund’s policy to qualify as a regulated investment company under the Internal Revenue Code. The Fund intends to distribute to shareholders substantially all of its taxable income and net realized gains to relieve it from federal income and if applicable, excise taxes. As a result, no provision for U.S. federal income taxes is required.
The Fund may be subject to foreign taxation related to income received, capital gains on the sale of securities and certain foreign currency transactions in the foreign jurisdictions in which it invests. Foreign taxes, if any, are recorded based on the tax regulations and rates that exist in the foreign markets in which the Fund invests. When a capital gain tax is determined to apply the Fund records an estimated deferred tax liability in an amount that would be payable if the securities were disposed of on the valuation date.
The Fund recognizes the tax benefits of uncertain tax positions only when the position is “more likely than not” to be sustained upon examination by the tax authorities based on the technical merits of the tax position. As of December 31, 2013, and for all open tax years, the Fund has determined that no liability for unrecognized tax benefits is required in the Fund’s financial statements related to uncertain tax positions taken on a tax return (or expected to be taken on future tax returns). Open tax years are those that remain subject to examination and are based on each tax jurisdiction statute of limitation.
d. Security Transactions, Investment Income, Expenses and Distributions
Security transactions are accounted for on trade date. Realized gains and losses on security transactions are determined on a specific identification basis. Dividend income is recorded on the ex-dividend date except that certain dividends from foreign securities are recognized as soon as the Fund is notified of the ex-dividend date. Distributions to shareholders are recorded on the ex-dividend date and are determined according to income tax regulations (tax basis). Distributable earnings determined on a tax basis may differ from earnings recorded in accordance with accounting principles generally accepted in the United States of America. These differences may be permanent or temporary. Permanent differences are reclassified among capital accounts to reflect their tax character. These reclassifications have no impact on net assets or the results of operations. Temporary differences are not reclassified, as they may reverse in subsequent periods.
Common expenses incurred by the Trust are allocated among the funds based on the ratio of net assets of each fund to the combined net assets of the Trust. Fund specific expenses are charged directly to the fund that incurred the expense.
Realized and unrealized gains and losses and net investment income, not including class specific expenses, are allocated daily to each class of shares based upon the relative proportion of net assets of each class. Differences in per share distributions, by class, are generally due to differences in class specific expenses.
e. Accounting Estimates
The preparation of financial statements in accordance with accounting principles generally accepted in the United States of America requires management to make estimates and assumptions that affect the reported amounts of assets and liabilities at the
FFC-22
Franklin Templeton Variable Insurance Products Trust
Notes to Financial Statements (continued)
Franklin Flex Cap Growth Securities Fund
1. ORGANIZATION AND SIGNIFICANT ACCOUNTING POLICIES (continued)
e. Accounting Estimates (continued)
date of the financial statements and the amounts of income and expenses during the reporting period. Actual results could differ from those estimates.
f. Guarantees and Indemnifications
Under the Trust’s organizational documents, its officers and trustees are indemnified by the Trust against certain liabilities arising out of the performance of their duties to the Trust. Additionally, in the normal course of business, the Trust, on behalf of the Fund, enters into contracts with service providers that contain general indemnification clauses. The Trust’s maximum exposure under these arrangements is unknown as this would involve future claims that may be made against the Trust that have not yet occurred. Currently, the Trust expects the risk of loss to be remote.
2. SHARES OF BENEFICIAL INTEREST
At December 31, 2013, there were an unlimited number of shares authorized (without par value). Transactions in the Fund’s shares were as follows:
| | | | | | | | | | | | | | | | |
| | | Year Ended December 31, | |
| | | 2013 | | | 2012 | |
| Class 2 Shares: | | Shares | | | Amount | | | Shares | | | Amount | |
Shares sold | | | 1,113,999 | | | $ | 16,865,422 | | | | 2,132,121 | | | $ | 28,565,855 | |
Shares issued in reinvestment of distributions | | | 30,996 | | | | 455,952 | | | | — | | | | — | |
Shares redeemed | | | (3,846,981 | ) | | | (58,998,017 | ) | | | (5,689,199 | ) | | | (75,165,334 | ) |
| | | | |
Net increase (decrease) | | | (2,701,986 | ) | | $ | (41,676,643 | ) | | | (3,557,078 | ) | | $ | (46,599,479 | ) |
| | | | |
Class 4 Shares: | | | | | | | | | | | | | | | | |
Shares sold | | | 1,584,158 | | | $ | 24,181,871 | | | | 3,802,626 | | | $ | 49,894,849 | |
Shares issued on reinvestment of distributions | | | 44,850 | | | | 654,813 | | | | — | | | | — | |
Shares redeemed | | | (4,145,079 | ) | | | (64,621,521 | ) | | | (9,818,530 | ) | | | (128,656,258 | ) |
| | | | |
Net increase (decrease) | | | (2,516,071 | ) | | $ | (39,784,837 | ) | | | (6,015,904 | ) | | $ | (78,761,409 | ) |
| | | | |
3. TRANSACTIONS WITH AFFILIATES
Franklin Resources, Inc. is the holding company for various subsidiaries that together are referred to as Franklin Templeton Investments. Certain officers and trustees of the Fund are also officers and/or directors of the following subsidiaries:
| | |
| Subsidiary | | Affiliation |
Franklin Advisers, Inc. (Advisers) | | Investment manager |
Franklin Templeton Services, LLC (FT Services) | | Administrative manager |
Franklin Templeton Distributors, Inc. (Distributors) | | Principal underwriter |
Franklin Templeton Investor Services, LLC (Investor Services) | | Transfer agent |
FFC-23
Franklin Templeton Variable Insurance Products Trust
Notes to Financial Statements (continued)
Franklin Flex Cap Growth Securities Fund
3. TRANSACTIONS WITH AFFILIATES (continued)
a. Management Fees
The Fund pays an investment management fee to Advisers based on the average daily net assets of the Fund as follows:
| | |
| Annualized Fee Rate | | Net Assets |
| 1.000% | | Up to and including $100 million |
| 0.900% | | Over $100 million, up to and including $250 million |
| 0.850% | | Over $250 million, up to and including $10 billion |
| 0.800% | | Over $10 billion, up to and including $12.5 billion |
| 0.775% | | Over $12.5 billion, up to and including $15 billion |
| 0.750% | | In excess of $15 billion |
Effective May 1, 2013, the Fund combined its investment management and administration agreements as approved by the Board. The fees paid under the combined agreement do not exceed the aggregate fees that were paid under the separate agreements.
Prior to May 1, 2013, the Fund paid an investment management fee to Advisers based on the average daily net assets of the Fund as follows:
| | |
| Annualized Fee Rate | | Net Assets |
| 0.750% | | Up to and including $100 million |
| 0.650% | | Over $100 million, up to and including $250 million |
| 0.600% | | Over $250 million, up to and including $10 billion |
| 0.550% | | Over $10 billion, up to and including $12.5 billion |
| 0.525% | | Over $12.5 billion, up to and including $15 billion |
| 0.500% | | In excess of $15 billion |
b. Administrative Fees
Effective May 1, 2013, under an agreement with Advisers, FT Services provides administrative services to the Fund. The fee is paid by Advisers based on the average daily net assets, and is not an additional expense of the Fund.
Prior to May 1, 2013, the Fund paid an administrative fee to FT Services of 0.25% per year of the average daily net assets of the Fund.
c. Distribution Fees
The Board has adopted distribution plans for Class 2 and Class 4 shares pursuant to Rule 12b-1 under the 1940 Act. Under the Fund’s compensation distribution plans, the Fund pays Distributors for costs incurred in connection with the servicing, sale and distribution of the Fund’s shares up to 0.35% per year of its average daily net assets of each class. Some distribution fees are not charged on shares held by affiliates. The Board has agreed to limit the current rate to 0.25% per year for Class 2. The plan year, for purposes of monitoring compliance with the maximum annual plan rates, is February 1 through January 31.
e. Transfer Agent Fees
Investor Services, under terms of an agreement, performs shareholder servicing for the Fund and is not paid by the Fund for the services.
FFC-24
Franklin Templeton Variable Insurance Products Trust
Notes to Financial Statements (continued)
Franklin Flex Cap Growth Securities Fund
3. TRANSACTIONS WITH AFFILIATES (continued)
f. Waiver and Expense Reimbursements
Advisers and FT Services have contractually agreed in advance to waive or limit their respective fees and to assume as their own expense certain expenses otherwise payable by the Fund so that the expenses (excluding distribution fees, and acquired fund fees and expenses) for Class 2 and Class 4 of the Fund does not exceed 0.68% based on the average net assets of each class (other than certain non-routine expenses or costs, including those relating to litigation, indemnification, reorganizations, and liquidations) until April 30, 2014.
4. EXPENSE OFFSET ARRANGEMENT
The Fund has entered into an arrangement with its custodian whereby credits realized as a result of uninvested cash balances are used to reduce a portion of the Fund’s custodian expenses. During the year ended December 31, 2013, there were no credits earned.
5. INCOME TAXES
The tax character of distributions paid during the years ended December 31, 2013 and 2012 was as follows:
| | | | | | | | |
| | | 2013 | | | 2012 | |
Distributions paid from: | | | | | | | | |
Ordinary income | | $ | 6,555 | | | $ | — | |
Long term capital gain | | | 1,104,210 | | | | — | |
| | | | |
| | $ | 1,110,765 | | | $ | — | |
| | | | |
At December 31, 2013, the cost of investments, net unrealized appreciation (depreciation), and undistributed ordinary income and undistributed long term capital gains for income tax purposes were as follows:
| | | | |
Cost of investments | | $ | 266,248,173 | |
| | | | |
| |
Unrealized appreciation | | $ | 169,890,224 | |
Unrealized depreciation | | | (1,406,780 | ) |
| | | | |
Net unrealized appreciation (depreciation) | | $ | 168,483,444 | |
| | | | |
Undistributed ordinary income | | $ | 5,891,303 | |
Undistributed long term capital gains | | | 52,298,301 | |
| | | | |
Distributable earnings | | $ | 58,189,604 | |
| | | | |
Differences between income and/or capital gains as determined on a book basis and a tax basis are primarily due to differing treatments of wash sales.
6. INVESTMENT TRANSACTIONS
Purchases and sales of investments (excluding short term securities) for the year ended December 31, 2013, aggregated $204,366,802 and $ 269,694,947, respectively.
FFC-25
Franklin Templeton Variable Insurance Products Trust
Notes to Financial Statements (continued)
Franklin Flex Cap Growth Securities Fund
7. INVESTMENTS IN INSTITUTIONAL FIDUCIARY TRUST MONEY MARKET PORTFOLIO
The Fund invests in the Institutional Fiduciary Trust Money Market Portfolio (Sweep Money Fund), an open-end investment company managed by Advisers. Management fees paid by the Fund are reduced on assets invested in the Sweep Money Fund, in an amount not to exceed the management and administrative fees paid by the Sweep Money Fund.
8. CREDIT FACILITY
The Fund, together with other U.S. registered and foreign investment funds (collectively, Borrowers), managed by Franklin Templeton Investments, are borrowers in a joint syndicated senior unsecured credit facility totaling $1.5 billion (Global Credit Facility) which, after an extension of the original terms matured on February 14, 2014. This Global Credit Facility provides a source of funds to the Borrowers for temporary and emergency purposes, including the ability to meet future unanticipated or unusually large redemption requests. Effective February 14, 2014, the Borrowers renewed the Global Credit Facility which matures on February 13, 2015.
Under the terms of the Global Credit Facility, the Fund shall, in addition to interest charged on any borrowings made by the Fund and other costs incurred by the Fund, pay its share of fees and expenses incurred in connection with the implementation and maintenance of the Global Credit Facility, based upon its relative share of the aggregate net assets of all of the Borrowers, including an annual commitment fee of 0.07% based upon the unused portion of the Global Credit Facility. These fees are reflected in other expenses on the Statement of Operations. During the year ended December 31, 2013, the Fund did not use the Global Credit Facility.
9. FAIR VALUE MEASUREMENTS
The Fund follows a fair value hierarchy that distinguishes between market data obtained from independent sources (observable inputs) and the Fund’s own market assumptions (unobservable inputs). These inputs are used in determining the value of the Fund’s financial instruments and are summarized in the following fair value hierarchy:
| | • | | Level 1 – quoted prices in active markets for identical financial instruments |
| | • | | Level 2 – other significant observable inputs (including quoted prices for similar financial instruments, interest rates, prepayment speed, credit risk, etc.) |
| | • | | Level 3 – significant unobservable inputs (including the Fund’s own assumptions in determining the fair value of financial instruments) |
The input levels are not necessarily an indication of the risk or liquidity associated with financial instruments at that level.
For movements between the levels within the fair value hierarchy, the Fund has adopted a policy of recognizing the transfers as of the date of the underlying event which caused the movement.
A summary of inputs used as of December 31, 2013, in valuing the Fund’s assets and liabilities carried at fair value, is as follows:
| | | | | | | | | | | | | | | | |
| | | Level 1 | | | Level 2 | | | Level 3 | | | Total | |
| | | | |
Assets: | | | | | | | | | | | | | | | | |
Investments in Securities: | | | | | | | | | | | | | | | | |
Equity Investmentsa,b | | $ | 422,342,668 | | | $ | — | | | $ | — | | | $ | 422,342,668 | |
Short Term Investments | | | 10,328,559 | | | | 2,060,390 | | | | — | | | | 12,388,949 | |
| | | | |
Total Investments in Securities | | $ | 432,671,227 | | | $ | 2,060,390 | | | $ | — | | | $ | 434,731,617 | |
| | | | |
aIncludes common stocks.
bFor detailed categories, see the accompanying Statement of Investments.
FFC-26
Franklin Templeton Variable Insurance Products Trust
Notes to Financial Statements (continued)
Franklin Flex Cap Growth Securities Fund
10. NEW ACCOUNTING PRONOUNCEMENTS
In June 2013, the Financial Accounting Standards Board issued Accounting Standards Update (ASU) No. 2013-08, Investment Companies (Topic 946): Amendments to the Scope, Measurement, and Disclosure Requirements. The ASU modifies the criteria used in defining an investment company under U.S. Generally Accepted Accounting Principles and also sets forth certain measurement and disclosure requirements. Under the ASU, an entity that is registered under the 1940 Act automatically qualifies as an investment company. The ASU is effective for interim and annual reporting periods beginning after December 15, 2013. Management has reviewed the requirements and believes the adoption of this ASU will not have a material impact on the financial statements.
11. SUBSEQUENT EVENTS
The Fund has evaluated subsequent events through the issuance of the financial statements and determined that no events have occurred that require disclosure other than those already disclosed in the financial statements.
FFC-27
Franklin Templeton Variable Insurance Products Trust
Franklin Flex Cap Growth Securities Fund
Report of Independent Registered Public Accounting Firm
To the Board of Trustees and Shareholders of
Franklin Templeton Variable Insurance Products Trust
In our opinion, the accompanying statement of assets and liabilities, including the statement of investments, and the related statements of operations and of changes in net assets and the financial highlights present fairly, in all material respects, the financial position of Franklin Flex Cap Growth Securities Fund (the “Fund”) at December 31, 2013, the results of its operations for the year then ended, the changes in its net assets for each of the two years in the period then ended and the financial highlights for each of the five years in the period then ended, in conformity with accounting principles generally accepted in the United States of America. These financial statements and financial highlights (hereafter referred to as “financial statements”) are the responsibility of the Fund’s management. Our responsibility is to express an opinion on these financial statements based on our audits. We conducted our audits of these financial statements in accordance with the standards of the Public Company Accounting Oversight Board (United States). Those standards require that we plan and perform the audit to obtain reasonable assurance about whether the financial statements are free of material misstatement. An audit includes examining, on a test basis, evidence supporting the amounts and disclosures in the financial statements, assessing the accounting principles used and significant estimates made by management, and evaluating the overall financial statement presentation. We believe that our audits, which included confirmation of securities at December 31, 2013 by correspondence with the custodian, transfer agent and brokers, provide a reasonable basis for our opinion.
PricewaterhouseCoopers LLP
San Francisco, California
February 14, 2014
FFC-28
Franklin Templeton Variable Insurance Products Trust
Tax Information (unaudited)
Franklin Flex Cap Growth Securities Fund
Under Section 852(b)(3)(C) of the Internal Revenue Code (Code), the Fund hereby reports the maximum amount allowable but no less than $1,104,210 as a long term capital gain dividend for the fiscal year ended December 31, 2013.
Under Section 854(b)(1)(A) of the Code, the Fund hereby reports 100.00% of the ordinary income dividends as income qualifying for the dividends received deduction for the fiscal year ended December 31, 2013.
FFC-29
FRANKLIN HIGH INCOME SECURITIES FUND
We are pleased to bring you Franklin High Income Securities Fund’s annual report for the fiscal year ended December 31, 2013.
Performance Summary as of 12/31/13
Average annual total return of Class 4 shares* represents the average annual change in value, assuming reinvestment of dividends and capital gains. Average returns smooth out variations in returns, which can be significant; they are not the same as year-by-year results.
Periods ended 12/31/13
| | | | | | | | | | | | |
| | | 1-Year | | | 5-Year | | | 10-Year | |
Average Annual Total Return | | | +7.72% | | | | +15.94% | | | | +7.53% | |
*For the period beginning 2/29/08, Class 4 performance reflects a 12b-1 fee expense of 0.35% per year, which affects future performance. Class 4 performance prior to 2/29/08 reflects historical Class 1 performance, which does not have a 12b-1 fee expense. Since 2/29/08 (effective date), the average annual total return of Class 4 shares was +8.93%.
Total Return Index Comparison
for a Hypothetical $10,000 Investment (1/1/04–12/31/13)
The graph below shows the change in value of a hypothetical $10,000 investment in the Fund over the indicated period and includes reinvestment of any income or distributions. The Fund’s performance* is compared to the performance of the Credit Suisse (CS) High Yield Index and the Lipper VIP High Yield Funds Classification Average. One cannot invest directly in an index, and an index is not representative of the Fund’s portfolio. Please see Important Notes to Performance Information preceding the Fund Summaries.
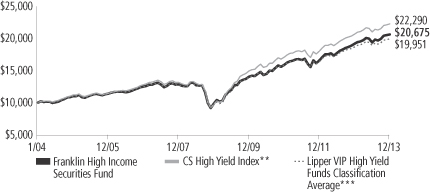
**Source: © 2014 Morningstar. Please see Index Descriptions following the Fund Summaries.
***Source: Lipper Inc. Please see Index Descriptions following the Fund Summaries.
Franklin High Income Securities Fund – Class 4
Performance reflects the Fund’s Class 4 operating expenses, but does not include any contract fees, expenses or sales charges. If they had been included, performance would be lower. These charges and deductions, particularly for variable life policies, can have a significant effect on contract values and insurance benefits. See the contract prospectus for a complete description of these expenses, including sales charges.
Performance data represent past performance, which does not guarantee future results. Investment return and principal value will fluctuate, and you may have a gain or loss when you sell your shares.
Current performance may differ from figures shown.
FH-1
Fund Goals and Main Investments: Franklin High Income Securities Fund seeks a high level of current income with capital appreciation as a secondary goal. Under normal market conditions, the Fund invests predominantly in high yield, lower rated debt securities and preferred stocks.
Performance Overview
You can find the Fund’s one-year total return in the Performance Summary. In comparison, the Fund’s benchmark, the Credit Suisse (CS) High Yield Index, posted a +7.53% total return for the period under review.1 The Fund’s peers, as measured by the Lipper VIP High Yield Funds Classification Average, delivered a +6.51% total return.2
Economic and Market Overview
The U.S. economy showed ongoing signs of recovery during the 12-month period ended December 31, 2013, especially in the second half, driven by consumer spending and rising inventories. In addition, business investment, net exports, and state and local government spending picked up in the second quarter, somewhat offsetting the impact of federal budget cuts. Historically low mortgage rates and improving sentiment aided the housing market recovery, evidenced by solid new and existing home sales, rising home prices, low inventories and multi-year lows in new foreclosures. Manufacturing expanded for most of the period under review, and the unemployment rate declined to 6.7% in December from 7.8% a year earlier.3 Inflation remained well below the Federal Reserve Board’s (Fed’s) 2.0% target.
At the start of 2013, the Fed expanded its asset purchase program to $85 billion per month from $40 billion of mortgage-backed securities. Fed Chairman Ben Bernanke indicated in May that the Fed might reduce monthly asset purchases, triggering a bond market sell-off that raised long-term U.S. Treasury yields to a two-year high. In September and October, long-term yields retreated after the Fed reassured investors it would maintain its current pace of purchases as it awaited more evidence of a sustainable economic expansion. In December, the Fed announced it would reduce its bond purchases $10 billion a month beginning in January 2014 while keeping interest rates low. After the announcement, yields on U.S. Treasuries remained largely stable.
1. Source: © 2014 Morningstar.
2. Source: Lipper Inc.
One cannot invest directly in an index, and an index is not representative of the Fund’s portfolio. Please see Index Descriptions following the Fund Summaries.
3. Source: Bureau of Labor Statistics.
Fund Risks: All investments involve risks, including possible loss of principal. The risks associated with higher yielding, lower rated securities include higher risk of default and loss of principal. Investment in foreign securities also involves special risks, including currency fluctuations, and political and economic uncertainty. In addition, interest rate movements will affect the Fund’s share price and yield. Bond prices generally move in the opposite direction of interest rates. Thus, as prices of bonds in the Fund adjust to a rise in interest rates, the Fund’s share price may decline. Changes in the financial strength of a bond issuer or in a bond’s credit rating may affect its value. The Fund is actively managed but there is no guarantee that the manager’s investment decisions will produce the desired results. The Fund’s prospectus also includes a description of the main investment risks.
FH-2
The year started on a positive note with Congress passing a budget bill that averted automatic federal budget cuts and income tax increases. However, Washington’s lack of consensus on proposed expenditure reductions resulted in federal spending cuts starting in March. A U.S. budget impasse, which led to a temporary shutdown of non-essential government services in October, ended after Congress agreed to fund the government until January 2014 and raise the debt limit until February. Congress passed a two-year budget deal in December that would ease automatic spending cuts in 2014 and reduce the risk of another government shutdown.
Although the Fed’s asset purchase program continued to put downward pressure on long-term interest rates, investor concerns about the eventual reduction of asset purchases pushed the 10-year U.S. Treasury note yield to 3.04% at period-end from 1.78% on December 31, 2012. Investors also anticipated higher interest rates and pulled back from the fixed income markets overall. For the year under review, most fixed income markets declined in value.
Investment Strategy
We are research-driven, fundamental investors who rely on a team of analysts to provide in-depth industry expertise and use qualitative and quantitative analyses to evaluate companies. As bottom-up investors, we focus primarily on individual securities. We also consider sectors when choosing investments. In selecting securities for the Fund’s investment portfolio, we do not rely principally on ratings assigned by rating agencies, but perform our own independent analysis to evaluate an issuer’s creditworthiness. We consider a variety of factors, including an issuer’s experience and managerial strength, its sensitivity to economic conditions and its current financial condition. We may also enter into various transactions involving certain currency-, interest rate- or credit-related derivative instruments for hedging purposes, to enhance returns or to obtain exposure to various market sectors.
Manager’s Discussion
High yield bonds’ lower interest rate sensitivity compared to the broader bond market helped the high yield market generate solid absolute and relative performance, even as the benchmark 10-year Treasury rate rose. In our view, investors seemed mainly focused on the fundamental credit outlook, which allowed improving U.S. and European economic growth, healthy corporate balance sheets and liquidity, low default rates and rising equity markets to support the high yield sector.
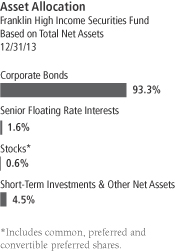
FH-3
Indicative of what we viewed as fixed income investors’ aggressive search for yield, lower rated high yield bonds generally outperformed higher rated high yield bonds during the period. Although we were cognizant of rising valuations following a brief spring sell-off, our overall favorable view of the high yield market led us to underweight BB-rated bonds. This ratings positioning aided relative Fund performance, given the outperformance of bonds rated B and CCC.
Our fundamental research process guided the Fund’s industry allocations. As a result, we over- and underweighted certain industries relative to the Fund’s benchmark. For example, our utilities sector underweighting contributed to relative performance. Low natural gas prices continued to depress electricity costs and pressure utility company margins. In contrast, we maintained an overweighted chemicals industry position.4 We found the sector attractively valued as fundamentals slowly improved and its valuation remained below its historical average. The chemicals industry outperformed the benchmark. Although we remained favorable toward the industry, the Fund did not hold a certain chemical issuer that performed well, and our chemical holdings underperformed those in the benchmark index. Finally, we avoided the textile and apparel sector, which benefited relative returns. The industry continued to struggle with weak demand and underperformed the broader high yield market.
Conversely, certain industry weightings weighed on relative performance. For example, the supermarket sector faced pricing pressures and stiff competition, leading us to avoid the industry. However, the food retailing industry was buoyed by a rebound in the high yield bond prices for a supermarket chain that was not owned by the Fund, so our lack of exposure weighed on relative results. In contrast, we overweighted the wireless industry.5 With still significant capital spending demands and often volatile results, wireless industry bonds underperformed, and our industry positioning detracted from relative performance. Still, security selection within the sector aided the Fund’s relative performance. For example, Cricket Communications, which rallied based on AT&T’s purchase offer, was a positive contributor. We held a detractive overweighting to the cable sector as merger and acquisition activity, and its potential for increasing debt, pressured industry valuations.6 In addition, the industry generally offered lower
4. Chemicals are part of materials in the SOI.
5. Wireless is part of telecommunication services in the SOI.
6. Cable is part of media in the SOI.
Top 10 Sectors/Industries
Franklin High Income Securities Fund
12/31/13
| | | | |
| | | % of Total
Net Assets | |
| Energy | | | 22.2% | |
| Materials | | | 12.0% | |
| Telecommunication Services | | | 11.0% | |
| Media | | | 8.3% | |
| Diversified Financials | | | 5.5% | |
| Health Care Equipment & Services | | | 5.3% | |
| Software & Services | | | 3.5% | |
| Consumer Services | | | 3.4% | |
| Consumer Durables & Apparel | | | 3.2% | |
| Pharmaceuticals, Biotechnology & Life Sciences | | | 2.9% | |
The dollar value, number of shares or principal amount, and names of all portfolio holdings are listed in the Fund’s Statement of Investments (SOI).
FH-4
coupon, longer maturity bonds, which the rising interest rate environment impacted more adversely.
To a small extent, the portfolio utilized derivatives, including currency forwards and credit derivatives via a high yield derivatives index. Currency forwards are principally used by the Fund as a tool to hedge currency risk. Credit derivatives are used to hedge against credit risk, to gain or increase exposure to certain high yield securities or segments of the high yield bond markets, or to otherwise enhance Fund returns. By period-end, the Fund held no credit derivatives.
Thank you for your participation in Franklin High Income Securities Fund. We look forward to serving your future investment needs.
The foregoing information reflects our analysis, opinions and portfolio holdings as of December 31, 2013, the end of the reporting period. The way we implement our main investment strategies and the resulting portfolio holdings may change depending on factors such as market and economic conditions. These opinions may not be relied upon as investment advice or an offer for a particular security. The information is not a complete analysis of every aspect of any market, country, industry, security or the Fund. Statements of fact are from sources considered reliable, but the investment manager makes no representation or warranty as to their completeness or accuracy. Although historical performance is no guarantee of future results, these insights may help you understand our investment management philosophy.
What is a currency forward contract?
A currency forward contract is an agreement between the Fund and a counterparty to buy or sell a foreign currency at a specific exchange rate on a future date.
What is a credit derivative?
A credit derivative is a contract agreement between the Fund and a counterparty that is principally used by the Fund to gain or increase exposure to certain high yield securities or segments of the high yield bond market and/or to hedge against credit risk.
FH-5
Fund Expenses
As an investor in a variable insurance contract (Contract) that indirectly provides for investment in an underlying mutual fund, you can incur transaction and/or ongoing expenses at both the Fund level and the Contract level.
| • | | Transaction expenses can include sales charges (loads) on purchases, redemption fees, surrender fees, transfer fees and premium taxes. |
| • | | Ongoing expenses can include management fees, distribution and service (12b-1) fees, contract fees, annual maintenance fees, mortality and expense risk fees and other fees and expenses. All mutual funds and Contracts have some types of ongoing expenses. |
The expenses shown in the table are meant to highlight ongoing expenses at the Fund level only and do not include ongoing expenses at the Contract level, or transaction expenses at either the Fund or Contract level. While the Fund does not have transaction expenses, if the transaction and ongoing expenses at the Contract level were included, the expenses shown would be higher. You should consult your Contract prospectus or disclosure document for more information.
The table shows Fund-level ongoing expenses and can help you understand these expenses and compare them with those of other mutual funds offered through the Contract. The table assumes a $1,000 investment held for the six months indicated. Please refer to the Fund prospectus for additional information on operating expenses.
Actual Fund Expenses
The first line (Actual) of the table provides actual account values and expenses. The “Ending Account Value” is derived from the Fund’s actual return, which includes the effect of ongoing Fund expenses, but does not include the effect of ongoing Contract expenses.
You can estimate the Fund-level expenses you incurred during the period by following these steps. Of course, your account value and expenses will differ from those in this illustration:
| 1. | Divide your account value by $1,000. |
If an account had an $8,600 value, then $8,600 ÷ $1,000 = 8.6.
| 2. | Multiply the result by the number under the heading “Fund-Level Expenses Incurred During Period.” |
If Fund-Level Expenses Incurred During Period were $7.50, then 8.6 x $7.50 = $64.50.
In this illustration, the estimated expenses incurred this period at the Fund level are $64.50.
Franklin High Income Securities Fund – Class 4
FH-6
Hypothetical Example for Comparison with Other Mutual Funds
Information in the second line (Hypothetical) of the table can help you compare ongoing expenses of the Fund with those of other mutual funds offered through the Contract. This information may not be used to estimate the actual ending account balance or expenses you incurred during the period. The hypothetical “Ending Account Value” is based on the Fund’s actual expense ratio and an assumed 5% annual rate of return before expenses, which does not represent the Fund’s actual return. The figure under the heading “Fund-Level Expenses Incurred During Period” shows the hypothetical expenses your account would have incurred under this scenario. You can compare this figure with the 5% hypothetical examples that appear in shareholder reports of other funds offered through a Contract.
| | | | | | | | | | | | |
| Class 4 | | Beginning
Account Value 7/1/13 | | | Ending
Account
Value 12/31/13 | | | Fund-Level Expenses Incurred
During Period* 7/1/13–12/31/13 | |
Actual | | $ | 1,000 | | | $ | 1,064.40 | | | $ | 4.84 | |
Hypothetical (5% return before expenses) | | $ | 1,000 | | | $ | 1,020.52 | | | $ | 4.74 | |
*Expenses are calculated using the most recent six-month annualized expense ratio for the Fund’s Class 4 shares (0.93%), which does not include any ongoing expenses of the Contract for which the Fund is an investment option, multiplied by the average account value over the period, multiplied by 184/365 to reflect the one-half year period.
FH-7
Franklin Templeton Variable Insurance Products Trust
Financial Highlights
Franklin High Income Securities Fund
| | | | | | | | | | | | | | | | | | | | |
| | | Year Ended December 31, | |
| Class 1 | | 2013 | | | 2012 | | | 2011 | | | 2010 | | | 2009 | |
| | | | |
Per share operating performance | | | | | | | | | | | | | | | | | | | | |
(for a share outstanding throughout the year) | | | | | | | | | | | | | | | | | | | | |
Net asset value, beginning of year | | $ | 7.01 | | | $ | 6.52 | | | $ | 6.63 | | | $ | 6.26 | | | $ | 4.68 | |
| | | | |
Income from investment operationsa: | | | | | | | | | | | | | | | | | | | | |
Net investment incomeb | | | 0.46 | | | | 0.48 | | | | 0.50 | | | | 0.49 | | | | 0.46 | |
Net realized and unrealized gains (losses) | | | 0.09 | | | | 0.51 | | | | (0.19 | ) | | | 0.32 | | | | 1.50 | |
| | | | |
Total from investment operations | | | 0.55 | | | | 0.99 | | | | 0.31 | | | | 0.81 | | | | 1.96 | |
| | | | |
Less distributions from net investment income | | | (0.54 | ) | | | (0.50 | ) | | | (0.42 | ) | | | (0.44 | ) | | | (0.38 | ) |
| | | | |
Net asset value, end of year | | $ | 7.02 | | | $ | 7.01 | | | $ | 6.52 | | | $ | 6.63 | | | $ | 6.26 | |
| | | | |
| | | | | |
Total returnc | | | 8.17% | | | | 15.94% | | | | 4.63% | | | | 13.71% | | | | 42.99% | |
Ratios to average net assets | | | | | | | | | | | | | | | | | | | | |
Expenses | | | 0.58% | d | | | 0.58% | | | | 0.58% | | | | 0.61% | | | | 0.63% | d |
Net investment income | | | 6.63% | | | | 7.15% | | | | 7.52% | | | | 7.71% | | | | 8.33% | |
| | | | | |
Supplemental data | | | | | | | | | | | | | | | | | | | | |
Net assets, end of year (000’s) | | $ | 39,300 | | | $ | 42,166 | | | $ | 41,971 | | | $ | 48,051 | | | $ | 48,855 | |
Portfolio turnover rate | | | 30.78% | | | | 37.03% | | | | 45.11% | | | | 60.80% | �� | | | 26.41% | |
aThe amount shown for a share outstanding throughout the period may not correlate with the Statement of Operations for the period due to the timing of sales and repurchases of the Fund shares in relation to income earned and/or fluctuating market value of the investments of the Fund.
bBased on average daily shares outstanding.
cTotal return does not include fees, charges or expenses imposed by the variable annuity and life insurance contracts for which the Franklin Templeton Variable Insurance Products Trust serves as an underlying investment vehicle.
dBenefit of expense reduction rounds to less than 0.01%.
The accompanying notes are an integral part of these financial statements.
FH-8
Franklin Templeton Variable Insurance Products Trust
Financial Highlights (continued)
Franklin High Income Securities Fund
| | | | | | | | | | | | | | | | | | | | |
| | | Year Ended December 31, | |
| Class 2 | | 2013 | | | 2012 | | | 2011 | | | 2010 | | | 2009 | |
| | | | |
Per share operating performance | | | | | | | | | | | | | | | | | | | | |
(for a share outstanding throughout the year) | | | | | | | | | | | | | | | | | | | | |
Net asset value, beginning of year | | $ | 6.82 | | | $ | 6.36 | | | $ | 6.47 | | | $ | 6.13 | | | $ | 4.59 | |
| | | | |
Income from investment operationsa: | | | | | | | | | | | | | | | | | | | | |
Net investment incomeb | | | 0.43 | | | | 0.46 | | | | 0.47 | | | | 0.47 | | | | 0.44 | |
Net realized and unrealized gains (losses) | | | 0.08 | | | | 0.48 | | | | (0.18 | ) | | | 0.30 | | | | 1.47 | |
| | | | |
Total from investment operations | | | 0.51 | | | | 0.94 | | | | 0.29 | | | | 0.77 | | | | 1.91 | |
| | | | |
Less distributions from net investment income | | | (0.52 | ) | | | (0.48 | ) | | | (0.40 | ) | | | (0.43 | ) | | | (0.37 | ) |
| | | | |
Net asset value, end of year | | $ | 6.81 | | | $ | 6.82 | | | $ | 6.36 | | | $ | 6.47 | | | $ | 6.13 | |
| | | | |
| | | | | |
Total returnc | | | 7.83% | | | | 15.56% | | | | 4.56% | | | | 13.26% | | | | 42.70% | |
Ratios to average net assets | | | | | | | | | | | | | | | | | | | | |
Expenses | | | 0.83% | d | | | 0.83% | | | | 0.83% | | | | 0.86% | | | | 0.88% | d |
Net investment income | | | 6.38% | | | | 6.90% | | | | 7.27% | | | | 7.46% | | | | 8.08% | |
| | | | | |
Supplemental data | | | | | | | | | | | | | | | | | | | | |
Net assets, end of year (000’s) | | $ | 291,826 | | | $ | 281,851 | | | $ | 249,452 | | | $ | 239,824 | | | $ | 198,567 | |
Portfolio turnover rate | | | 30.78% | | | | 37.03% | | | | 45.11% | | | | 60.80% | | | | 26.41% | |
aThe amount shown for a share outstanding throughout the period may not correlate with the Statement of Operations for the period due to the timing of sales and repurchases of the Fund shares in relation to income earned and/or fluctuating market value of the investments of the Fund.
bBased on average daily shares outstanding.
cTotal return does not include fees, charges or expenses imposed by the variable annuity and life insurance contracts for which the Franklin Templeton Variable Insurance Products Trust serves as an underlying investment vehicle.
dBenefit of expense reduction rounds to less than 0.01%.
The accompanying notes are an integral part of these financial statements.
FH-9
Franklin Templeton Variable Insurance Products Trust
Financial Highlights (continued)
Franklin High Income Securities Fund
| | | | | | | | | | | | | | | | | | | | |
| | | Year Ended December 31, | |
| Class 4 | | 2013 | | | 2012 | | | 2011 | | | 2010 | | | 2009 | |
| | | | |
Per share operating performance | | | | | | | | | | | | | | | | | | | | |
(for a share outstanding throughout the year) | | | | | | | | | | | | | | | | | | | | |
Net asset value, beginning of year | | $ | 6.94 | | | $ | 6.46 | | | $ | 6.57 | | | $ | 6.22 | | | $ | 4.67 | |
| | | | |
Income from investment operationsa: | | | | | | | | | | | | | | | | | | | | |
Net investment incomeb | | | 0.43 | | | | 0.46 | | | | 0.47 | | | | 0.47 | | | | 0.45 | |
Net realized and unrealized gains (losses) | | | 0.08 | | | | 0.49 | | | | (0.18 | ) | | | 0.31 | | | | 1.48 | |
| | | | |
Total from investment operations | | | 0.51 | | | | 0.95 | | | | 0.29 | | | | 0.78 | | | | 1.93 | |
| | | | |
Less distributions from net investment income | | | (0.51 | ) | | | (0.47 | ) | | | (0.40 | ) | | | (0.43 | ) | | | (0.38 | ) |
| | | | |
Net asset value, end of year | | $ | 6.94 | | | $ | 6.94 | | | $ | 6.46 | | | $ | 6.57 | | | $ | 6.22 | |
| | | | |
| | | | | |
Total returnc | | | 7.72% | | | | 15.50% | | | | 4.39% | | | | 13.31% | | | | 42.36% | |
Ratios to average net assets | | | | | | | | | | | | | | | | | | | | |
Expenses | | | 0.93% | d | | | 0.93% | | | | 0.93% | | | | 0.96% | | | | 0.98% | d |
Net investment income | | | 6.28% | | | | 6.80% | | | | 7.17% | | | | 7.36% | | | | 7.98% | |
| | | | | |
Supplemental data | | | | | | | | | | | | | | | | | | | | |
Net assets, end of year (000’s) | | $ | 27,789 | | | $ | 27,664 | | | $ | 27,055 | | | $ | 25,934 | | | $ | 15,105 | |
Portfolio turnover rate | | | 30.78% | | | | 37.03% | | | | 45.11% | | | | 60.80% | | | | 26.41% | |
aThe amount shown for a share outstanding throughout the period may not correlate with the Statement of Operations for the period due to the timing of sales and repurchases of the Fund shares in relation to income earned and/or fluctuating market value of the investments of the Fund.
bBased on average daily shares outstanding.
cTotal return does not include fees, charges or expenses imposed by the variable annuity and life insurance contracts for which the Franklin Templeton Variable Insurance Products Trust serves as an underlying investment vehicle.
dBenefit of expense reduction rounds to less than 0.01%.
The accompanying notes are an integral part of these financial statements.
FH-10
Franklin Templeton Variable Insurance Products Trust
Statement of Investments, December 31, 2013
| | | | | | | | | | |
| Franklin High Income Securities Fund | | Country | | Shares | | | Value | |
Common Stocks 0.3% | | | | | | | | | | |
Materials 0.2% | | | | | | | | | | |
a,b NewPage Holdings Inc. | | United States | | | 10,000 | | | $ | 900,000 | |
| | | | | | | | | | |
Transportation 0.1% | | | | | | | | | | |
a CEVA Holdings LLC | | United Kingdom | | | 224 | | | | 213,067 | |
| | | | | | | | | | |
Total Common Stocks (Cost $2,606,786) | | | | | | | | | 1,113,067 | |
| | | | | | | | | | |
Convertible Preferred Stocks 0.1% | | | | | | | | | | |
Transportation 0.1% | | | | | | | | | | |
a CEVA Holdings LLC, cvt. pfd., A-1 | | United Kingdom | | | 6 | | | | 7,800 | |
a CEVA Holdings LLC, cvt. pfd., A-2 | | United Kingdom | | | 486 | | | | 461,235 | |
| | | | | | | | | | |
Total Convertible Preferred Stocks (Cost $731,856) | | | | | | | | | 469,035 | |
| | | | | | | | | | |
Preferred Stocks (Cost $770,000) 0.2% | | | | | | | | | | |
Diversified Financials 0.2% | | | | | | | | | | |
GMAC Capital Trust I, 8.125%, pfd. | | United States | | | 30,800 | | | | 823,592 | |
| | | | | | | | | | |
| | | |
| | | | | Principal
Amount* | | | | |
Corporate Bonds 93.3% | | | | | | | | | | |
Automobiles & Components 1.1% | | | | | | | | | | |
The Goodyear Tire & Rubber Co., senior note, 6.50%, 3/01/21 | | United States | | | 2,200,000 | | | | 2,343,000 | |
c International Automotive Components Group SL, senior secured note, 144A, | | | | | | | | | | |
9.125%, 6/01/18 | | United States | | | 1,600,000 | | | | 1,679,000 | |
| | | | | | | | | | |
| | | | | | | | | 4,022,000 | |
| | | | | | | | | | |
Banks 1.8% | | | | | | | | | | |
CIT Group Inc., senior note, | | | | | | | | | | |
5.375%, 5/15/20 | | United States | | | 1,700,000 | | | | 1,814,750 | |
5.00%, 8/15/22 | | United States | | | 2,700,000 | | | | 2,643,740 | |
Royal Bank of Scotland Group PLC, sub. note, 6.125%, 12/15/22 | | United Kingdom | | | 2,000,000 | | | | 2,051,250 | |
| | | | | | | | | | |
| | | | | | | | | 6,509,740 | |
| | | | | | | | | | |
Capital Goods 2.6% | | | | | | | | | | |
c Abengoa Finance SAU, senior note, 144A, | | | | | | | | | | |
8.875%, 11/01/17 | | Spain | | | 2,500,000 | | | | 2,700,000 | |
7.75%, 2/01/20 | | Spain | | | 400,000 | | | | 416,500 | |
Meritor Inc., senior note, 10.625%, 3/15/18 | | United States | | | 1,900,000 | | | | 2,028,250 | |
Navistar International Corp., senior note, 8.25%, 11/01/21 | | United States | | | 1,500,000 | | | | 1,560,000 | |
Terex Corp., senior note, 6.00%, 5/15/21 | | United States | | | 1,200,000 | | | | 1,246,500 | |
c Zachry Holdings Inc., senior note, 144A, 7.50%, 2/01/20 | | United States | | | 1,400,000 | | | | 1,470,000 | |
| | | | | | | | | | |
| | | | | | | | | 9,421,250 | |
| | | | | | | | | | |
Commercial & Professional Services 1.6% | | | | | | | | | | |
ADS Waste Holdings Inc., senior note, 8.25%, 10/01/20 | | United States | | | 2,500,000 | | | | 2,725,000 | |
c Algeco Scotsman Global Finance PLC, senior secured note, first lien, 144A, 8.50%, 10/15/18 | | United Kingdom | | | 1,700,000 | | | | 1,829,625 | |
c,d Darling Escrow Corp., senior note, 144A, 5.375%, 1/15/22 | | United States | | | 500,000 | | | | 504,375 | |
e,f Goss Graphic Systems Inc., senior sub. note, 12.25%, 11/19/05 | | United States | | | 1,912,374 | | | | 191 | |
c,g Igloo Holdings Corp., senior note, 144A, PIK, 8.25%, 12/15/17 | | United States | | | 600,000 | | | | 612,000 | |
| | | | | | | | | | |
| | | | | | | | | 5,671,191 | |
| | | | | | | | | | |
Consumer Durables & Apparel 3.2% | | | | | | | | | | |
KB Home, | | | | | | | | | | |
senior bond, 7.50%, 9/15/22 | | United States | | | 2,100,000 | | | | 2,220,750 | |
senior note, 7.00%, 12/15/21 | | United States | | | 700,000 | | | | 731,500 | |
FH-11
Franklin Templeton Variable Insurance Products Trust
Statement of Investments, December 31, 2013 (continued)
| | | | | | | | | | |
| Franklin High Income Securities Fund | | Country | | Principal
Amount* | | | Value | |
Corporate Bonds (continued) | | | | | | | | | | |
Consumer Durables & Apparel (continued) | | | | | | | | | | |
M/I Homes Inc., senior note, 8.625%, 11/15/18 | | United States | | | 1,000,000 | | | $ | 1,087,500 | |
c SIWF Merger Sub Inc./Springs Industries Inc., senior secured note, 144A, 6.25%, 6/01/21 | | United States | | | 700,000 | | | | 707,875 | |
Standard Pacific Corp., senior note, 6.25%, 12/15/21 | | United States | | | 1,500,000 | | | | 1,565,625 | |
c Taylor Morrison Communities Inc./Monarch Communities Inc., senior note, 144A, | | | | | | | | | | |
7.75%, 4/15/20 | | United States | | | 1,140,000 | | | | 1,259,700 | |
5.25%, 4/15/21 | | United States | | | 900,000 | | | | 877,500 | |
Toll Brothers Finance Corp., senior bond, 5.625%, 1/15/24 | | United States | | | 1,200,000 | | | | 1,212,000 | |
Visant Corp., senior note, 10.00%, 10/01/17 | | United States | | | 2,000,000 | | | | 1,950,000 | |
| | | | | | | | | | |
| | | | | | | | | 11,612,450 | |
| | | | | | | | | | |
Consumer Services 3.4% | | | | | | | | | | |
Caesars Entertainment Operating Co. Inc., | | | | | | | | | | |
first lien, 9.00%, 2/15/20 | | United States | | | 800,000 | | | | 782,000 | |
senior secured note, 11.25%, 6/01/17 | | United States | | | 3,000,000 | | | | 3,060,000 | |
c,e Fontainebleau Las Vegas, 144A, 11.00%, 6/15/15 | | United States | | | 1,700,000 | | | | 170 | |
c Landry’s Inc., senior note, 144A, 9.375%, 5/01/20 | | United States | | | 1,600,000 | | | | 1,752,000 | |
MGM Resorts International, senior note, | | | | | | | | | | |
6.625%, 7/15/15 | | United States | | | 2,000,000 | | | | 2,155,000 | |
6.875%, 4/01/16 | | United States | | | 1,200,000 | | | | 1,326,000 | |
8.625%, 2/01/19 | | United States | | | 400,000 | | | | 471,000 | |
6.625%, 12/15/21 | | United States | | | 300,000 | | | | 317,625 | |
c Paris Las Vegas Holding LLC, senior secured note, first lien, 144A, 8.00%, 10/01/20 | | United States | | | 500,000 | | | | 522,500 | |
Pinnacle Entertainment Inc., senior sub. note, 7.75%, 4/01/22 | | United States | | | 1,100,000 | | | | 1,204,500 | |
c PNK Finance Corp., senior note, 144A, 6.375%, 8/01/21 | | United States | | | 600,000 | | | | 616,500 | |
| | | | | | | | | | |
| | | | | | | | | 12,207,295 | |
| | | | | | | | | | |
Diversified Financials 5.3% | | | | | | | | | | |
Ally Financial Inc., senior note, 7.50%, 9/15/20 | | United States | | | 1,500,000 | | | | 1,753,125 | |
h Bank of America Corp., pfd., sub. bond, M, 8.125% to 5/15/18, FRN thereafter, Perpetual | | United States | | | 2,500,000 | | | | 2,809,882 | |
E*TRADE Financial Corp., senior note, 6.375%, 11/15/19 | | United States | | | 1,400,000 | | | | 1,510,250 | |
c General Motors Financial Co. Inc., senior note, 144A, 3.25%, 5/15/18 | | United States | | | 900,000 | | | | 902,250 | |
GMAC Inc., sub. note, 8.00%, 12/31/18 | | United States | | | 800,000 | | | | 948,000 | |
h JPMorgan Chase & Co., junior sub. bond, 6.00% to 8/01/23, FRN thereafter, Perpetual | | United States | | | 2,500,000 | | | | 2,403,125 | |
c Neuberger Berman Group LLC/Finance Corp., senior note, 144A, | | | | | | | | | | |
5.625%, 3/15/20 | | United States | | | 500,000 | | | | 527,500 | |
5.875%, 3/15/22 | | United States | | | 600,000 | | | | 621,000 | |
c Nuveen Investments Inc., senior note, 144A, 9.50%, 10/15/20 | | United States | | | 2,000,000 | | | | 2,015,000 | |
c Provident Fund Associates LP/Finance Corp., senior note, 144A, 6.75%, 6/15/21 | | United States | | | 700,000 | | | | 700,000 | |
SLM Corp., senior note, | | | | | | | | | | |
8.45%, 6/15/18 | | United States | | | 1,800,000 | | | | 2,103,750 | |
5.50%, 1/15/19 | | United States | | | 2,500,000 | | | | 2,595,908 | |
| | | | | | | | | | |
| | | | | | | | | 18,889,790 | |
| | | | | | | | | | |
Energy 22.2% | | | | | | | | | | |
c Antero Resources Corp., senior note, 144A, 5.375%, 11/01/21 | | United States | | | 800,000 | | | | 808,500 | |
BreitBurn Energy Partners LP/Finance Corp., senior bond, 7.875%, 4/15/22 | | United States | | | 1,000,000 | | | | 1,045,000 | |
Calumet Specialty Products Partners LP/Finance Corp., senior note, | | | | | | | | | | |
9.375%, 5/01/19 | | United States | | | 1,700,000 | | | | 1,895,500 | |
9.625%, 8/01/20 | | United States | | | 600,000 | | | | 676,500 | |
Carrizo Oil & Gas Inc., senior note, | | | | | | | | | | |
8.625%, 10/15/18 | | United States | | | 2,000,000 | | | | 2,175,000 | |
7.50%, 9/15/20 | | United States | | | 500,000 | | | | 550,000 | |
FH-12
Franklin Templeton Variable Insurance Products Trust
Statement of Investments, December 31, 2013 (continued)
| | | | | | | | | | |
| Franklin High Income Securities Fund | | Country | | Principal
Amount* | | | Value | |
Corporate Bonds (continued) | | | | | | | | | | |
Energy (continued) | | | | | | | | | | |
Chaparral Energy Inc., senior note, | | | | | | | | | | |
9.875%, 10/01/20 | | United States | | | 1,400,000 | | | $ | 1,589,000 | |
8.25%, 9/01/21 | | United States | | | 600,000 | | | | 654,000 | |
CHC Helicopter SA, | | | | | | | | | | |
senior note, 9.375%, 6/01/21 | | Canada | | | 400,000 | | | | 412,000 | |
senior secured note, first lien, 9.25%, 10/15/20 | | Canada | | | 3,000,000 | | | | 3,236,250 | |
Chesapeake Energy Corp., senior note, | | | | | | | | | | |
6.625%, 8/15/20 | | United States | | | 3,000,000 | | | | 3,367,500 | |
6.125%, 2/15/21 | | United States | | | 1,000,000 | | | | 1,077,500 | |
Clayton Williams Energy Inc., senior note, 7.75%, 4/01/19 | | United States | | | 2,400,000 | | | | 2,478,000 | |
CONSOL Energy Inc., senior note, | | | | | | | | | | |
8.00%, 4/01/17 | | United States | | | 500,000 | | | | 528,750 | |
8.25%, 4/01/20 | | United States | | | 1,000,000 | | | | 1,087,500 | |
6.375%, 3/01/21 | | United States | | | 300,000 | | | | 311,250 | |
c Drill Rigs Holdings Inc., secured note, 144A, 6.50%, 10/01/17 | | United States | | | 1,700,000 | | | | 1,844,500 | |
Eagle Rock Energy Partners LP/Finance Corp., senior note, 8.375%, 6/01/19 | | United States | | | 2,500,000 | | | | 2,737,500 | |
Energy Transfer Equity LP, senior note, 7.50%, 10/15/20 | | United States | | | 3,000,000 | | | | 3,382,500 | |
EPL Oil & Gas Inc., senior note, 8.25%, 2/15/18 | | United States | | | 1,400,000 | | | | 1,512,000 | |
Goodrich Petroleum Corp., senior note, 8.875%, 3/15/19 | | United States | | | 2,500,000 | | | | 2,612,500 | |
Halcon Resources Corp., senior note, | | | | | | | | | | |
8.875%, 5/15/21 | | United States | | | 1,500,000 | | | | 1,522,500 | |
c 144A, 9.25%, 2/15/22 | | United States | | | 1,100,000 | | | | 1,124,750 | |
c Kinder Morgan Finance Co. LLC, senior secured note, 144A, 6.00%, 1/15/18 | | United States | | | 1,500,000 | | | | 1,650,491 | |
c Kinder Morgan Inc., senior secured note, 144A, 5.00%, 2/15/21 | | United States | | | 600,000 | | | | 593,275 | |
Kodiak Oil & Gas Corp., senior note, | | | | | | | | | | |
8.125%, 12/01/19 | | United States | | | 1,400,000 | | | | 1,561,000 | |
5.50%, 1/15/21 | | United States | | | 500,000 | | | | 501,250 | |
Linn Energy LLC/Finance Corp., senior note, | | | | | | | | | | |
6.50%, 5/15/19 | | United States | | | 600,000 | | | | 615,000 | |
8.625%, 4/15/20 | | United States | | | 2,000,000 | | | | 2,170,000 | |
7.75%, 2/01/21 | | United States | | | 700,000 | | | | 743,750 | |
Martin Midstream Partners LP/Martin Midstream Finance Corp., senior note, | | | | | | | | | | |
8.875%, 4/01/18 | | United States | | | 1,316,000 | | | | 1,394,960 | |
7.25%, 2/15/21 | | United States | | | 1,100,000 | | | | 1,127,500 | |
Midstates Petroleum Co. Inc./LLC, senior note, 9.25%, 6/01/21 | | United States | | | 1,000,000 | | | | 1,050,000 | |
c Murray Energy Corp., senior secured note, 144A, 8.625%, 6/15/21 | | United States | | | 1,200,000 | | | | 1,248,000 | |
c Oasis Petroleum Inc., senior note, 144A, 6.875%, 3/15/22 | | United States | | | 1,500,000 | | | | 1,597,500 | |
Offshore Group Investment Ltd., | | | | | | | | | | |
senior bond, first lien, 7.125%, 4/01/23 | | United States | | | 1,000,000 | | | | 1,025,000 | |
senior secured note, first lien, 7.50%, 11/01/19 | | United States | | | 1,400,000 | | | | 1,522,500 | |
PBF Holding Co. LLC, first lien, 8.25%, 2/15/20 | | United States | | | 2,500,000 | | | | 2,725,000 | |
Peabody Energy Corp., senior note, | | | | | | | | | | |
6.50%, 9/15/20 | | United States | | | 1,700,000 | | | | 1,797,750 | |
6.25%, 11/15/21 | | United States | | | 1,700,000 | | | | 1,725,500 | |
Penn Virginia Corp., senior note, 8.50%, 5/01/20 | | United States | | | 1,200,000 | | | | 1,296,000 | |
Penn Virginia Resource Partners LP/Finance Corp. II, senior note, | | | | | | | | | | |
8.375%, 6/01/20 | | United States | | | 1,094,000 | | | | 1,211,605 | |
c 144A, 6.50%, 5/15/21 | | United States | | | 600,000 | | | | 624,000 | |
QEP Resources Inc., senior note, | | | | | | | | | | |
5.375%, 10/01/22 | | United States | | | 1,500,000 | | | | 1,451,250 | |
5.25%, 5/01/23 | | United States | | | 800,000 | | | | 754,000 | |
QR Energy LP/QRE Finance, senior note, 9.25%, 8/01/20 | | United States | | | 1,800,000 | | | | 1,872,000 | |
FH-13
Franklin Templeton Variable Insurance Products Trust
Statement of Investments, December 31, 2013 (continued)
| | | | | | | | | | |
| Franklin High Income Securities Fund | | Country | | Principal
Amount* | | | Value | |
Corporate Bonds (continued) | | | | | | | | | | |
Energy (continued) | | | | | | | | | | |
Quicksilver Resources Inc., | | | | | | | | | | |
c,i secured note, second lien, 144A, FRN, 7.00%, 6/21/19 | | United States | | | 1,300,000 | | | $ | 1,280,500 | |
senior note, 9.125%, 8/15/19 | | United States | | | 1,000,000 | | | | 1,020,000 | |
c Sabine Pass Liquefaction LLC, | | | | | | | | | | |
secured note, 144A, 5.625%, 2/01/21 | | United States | | | 2,400,000 | | | | 2,358,000 | |
senior secured note, 144A, 5.625%, 4/15/23 | | United States | | | 900,000 | | | | 846,000 | |
c Samson Investment Co., senior note, 144A, 9.75%, 2/15/20 | | United States | | | 2,500,000 | | | | 2,737,500 | |
c Sanchez Energy Corp., senior note, 144A, 7.75%, 6/15/21 | | United States | | | 1,800,000 | | | | 1,849,500 | |
W&T Offshore Inc., senior note, 8.50%, 6/15/19 | | United States | | | 2,600,000 | | | | 2,762,500 | |
| | | | | | | | | | |
| | | | | | | | | 79,739,831 | |
| | | | | | | | | | |
Food & Staples Retailing 0.3% | | | | | | | | | | |
Rite Aid Corp., senior secured note, 8.00%, 8/15/20 | | United States | | | 1,000,000 | | | | 1,130,000 | |
| | | | | | | | | | |
Food, Beverage & Tobacco 2.8% | | | | | | | | | | |
Del Monte Corp., senior note, 7.625%, 2/15/19 | | United States | | | 3,000,000 | | | | 3,123,750 | |
c Dole Food Co. Inc., senior secured note, 144A, 7.25%, 5/01/19 | | United States | | | 900,000 | | | | 898,875 | |
c JBS USA LLC/Finance Inc., senior note, 144A, | | | | | | | | | | |
8.25%, 2/01/20 | | United States | | | 2,600,000 | | | | 2,834,000 | |
7.25%, 6/01/21 | | United States | | | 400,000 | | | | 418,000 | |
c Post Holdings Inc., senior note, 144A, | | | | | | | | | | |
6.75%, 12/01/21 | | United States | | | 200,000 | | | | 207,500 | |
7.375%, 2/15/22 | | United States | | | 1,600,000 | | | | 1,720,000 | |
c Sun Merger Sub Inc., senior note, 144A, 5.875%, 8/01/21 | | United States | | | 700,000 | | | | 721,437 | |
| | | | | | | | | | |
| | | | | | | | | 9,923,562 | |
| | | | | | | | | | |
Health Care Equipment & Services 5.3% | | | | | | | | | | |
Alere Inc., | | | | | | | | | | |
senior note, 7.25%, 7/01/18 | | United States | | | 2,200,000 | | | | 2,428,250 | |
senior sub. note, 6.50%, 6/15/20 | | United States | | | 300,000 | | | | 308,250 | |
Aviv Healthcare Properties LP/Aviv Healthcare Capital Corp., senior note, | | | | | | | | | | |
7.75%, 2/15/19 | | United States | | | 1,500,000 | | | | 1,620,000 | |
c 144A, 6.00%, 10/15/21 | | United States | | | 400,000 | | | | 409,000 | |
CHS/Community Health Systems Inc., | | | | | | | | | | |
senior note, 8.00%, 11/15/19 | | United States | | | 1,700,000 | | | | 1,853,000 | |
senior note, 7.125%, 7/15/20 | | United States | | | 700,000 | | | | 727,125 | |
senior secured note, 5.125%, 8/15/18 | | United States | | | 1,500,000 | | | | 1,552,500 | |
ExamWorks Group Inc., senior note, 9.00%, 7/15/19 | | United States | | | 1,300,000 | | | | 1,413,750 | |
HCA Inc., | | | | | | | | | | |
senior note, 7.50%, 2/15/22 | | United States | | | 800,000 | | | | 880,000 | |
senior note, 5.875%, 5/01/23 | | United States | | | 2,500,000 | | | | 2,475,000 | |
senior secured bond, 7.25%, 9/15/20 | | United States | | | 900,000 | | | | 983,250 | |
senior secured note, 7.875%, 2/15/20 | | United States | | | 1,000,000 | | | | 1,076,250 | |
senior secured note, 5.875%, 3/15/22 | | United States | | | 1,000,000 | | | | 1,035,000 | |
Tenet Healthcare Corp., senior note, 8.125%, 4/01/22 | | United States | | | 2,000,000 | | | | 2,160,000 | |
| | | | | | | | | | |
| | | | | | | | | 18,921,375 | |
| | | | | | | | | | |
Materials 11.8% | | | | | | | | | | |
ArcelorMittal, senior note, 6.00%, 3/01/21 | | Luxembourg | | | 1,400,000 | | | | 1,483,587 | |
c Ardagh Packaging Finance PLC, senior note, 144A, 9.125%, 10/15/20 | | Luxembourg | | | 600,000 | | | | 658,500 | |
cArdagh Packaging Finance PLC/Ardagh MP Holdings USA Inc., | | | | | | | | | | |
secured note, 144A, 4.875%, 11/15/22 | | Luxembourg | | | 200,000 | | | | 198,875 | |
senior note, 144A, 7.00%, 11/15/20 | | Luxembourg | | | 1,000,000 | | | | 1,010,000 | |
senior secured note, first lien, 144A, 7.375%, 10/15/17 | | Luxembourg | | | 600,000 | | | | 645,750 | |
FH-14
Franklin Templeton Variable Insurance Products Trust
Statement of Investments, December 31, 2013 (continued)
| | | | | | | | | | |
| Franklin High Income Securities Fund | | Country | | Principal
Amount* | | | Value | |
Corporate Bonds (continued) | | | | | | | | | | |
Materials (continued) | | | | | | | | | | |
c Barminco Finance Pty. Ltd., senior note, 144A, 9.00%, 6/01/18 | | Australia | | | 1,500,000 | | | $ | 1,389,787 | |
c BlueScope Steel Ltd./BlueScope Steel Finance, senior note, 144A, 7.125%, 5/01/18 | | Australia | | | 2,000,000 | | | | 2,095,000 | |
c Cemex SAB de CV, senior secured note, 144A, 9.00%, 1/11/18 | | Mexico | | | 3,500,000 | | | | 3,863,125 | |
c Eldorado Gold Corp., senior note, 144A, 6.125%, 12/15/20 | | Canada | | | 2,000,000 | | | | 1,935,000 | |
Euramax International Inc., senior secured note, 9.50%, 4/01/16 | | United States | | | 800,000 | | | | 806,000 | |
c Exopack Holding Corp., senior note, 144A, 10.00%, 6/01/18 | | United States | | | 1,600,000 | | | | 1,744,000 | |
c FMG Resources (August 2006) Pty. Ltd., senior note, 144A, | | | | | | | | | | |
6.875%, 2/01/18 | | Australia | | | 2,000,000 | | | | 2,110,000 | |
8.25%, 11/01/19 | | Australia | | | 500,000 | | | | 563,125 | |
6.875%, 4/01/22 | | Australia | | | 200,000 | | | | 219,000 | |
c Ineos Finance PLC, senior secured note, 144A, | | | | | | | | | | |
8.375%, 2/15/19 | | Switzerland | | | 200,000 | | | | 223,250 | |
7.50%, 5/01/20 | | Switzerland | | | 500,000 | | | | 547,813 | |
c Ineos Group Holdings SA, senior note, 144A, 6.125%, 8/15/18 | | Switzerland | | | 1,300,000 | | | | 1,314,625 | |
c Inmet Mining Corp., senior note, 144A, | | | | | | | | | | |
8.75%, 6/01/20 | | Canada | | | 2,500,000 | | | | 2,725,000 | |
7.50%, 6/01/21 | | Canada | | | 300,000 | | | | 315,000 | |
Novelis Inc., senior note, 8.75%, 12/15/20 | | Canada | | | 1,300,000 | | | | 1,452,750 | |
Olin Corp., senior bond, 5.50%, 8/15/22 | | United States | | | 3,200,000 | | | | 3,208,000 | |
c Orion Engineered Carbons Bondco GmbH, senior secured note, first lien, 144A, | | | | | | | | | | |
9.625%, 6/15/18 | | Germany | | | 1,600,000 | | | | 1,768,000 | |
c,g Orion Engineered Carbons Finance & Co. SCA, senior note, 144A, PIK, 9.25%, 8/01/19 | | Germany | | | 500,000 | | | | 525,000 | |
c Perstorp Holding AB, first lien, 144A, 8.75%, 5/15/17 | | Sweden | | | 2,500,000 | | | | 2,691,072 | |
c Rain CII Carbon LLC/Corp., second lien, 144A, 8.25%, 1/15/21 | | United States | | | 700,000 | | | | 717,500 | |
Reynolds Group Issuer Inc./LLC/SA, | | | | | | | | | | |
first lien, 5.75%, 10/15/20 | | United States | | | 1,400,000 | | | | 1,435,000 | |
senior note, 8.50%, 5/15/18 | | United States | | | 2,800,000 | | | | 2,968,000 | |
senior note, 9.00%, 4/15/19 | | United States | | | 200,000 | | | | 215,500 | |
senior note, 9.875%, 8/15/19 | | United States | | | 200,000 | | | | 223,500 | |
senior note, 8.25%, 2/15/21 | | United States | | | 400,000 | | | | 429,000 | |
c Sealed Air Corp., senior note, 144A, | | | | | | | | | | |
8.125%, 9/15/19 | | United States | | | 800,000 | | | | 902,000 | |
6.50%, 12/01/20 | | United States | | | 500,000 | | | | 540,000 | |
8.375%, 9/15/21 | | United States | | | 600,000 | | | | 684,000 | |
c U.S. Coatings Acquisition Inc./Flash Dutch 2 BV, senior note, 144A, 7.375%, 5/01/21 | | United States | | | 700,000 | | | | 749,875 | |
| | | | | | | | | | |
| | | | | | | | | 42,356,634 | |
| | | | | | | | | | |
Media 8.3% | | | | | | | | | | |
Cablevision Systems Corp., senior note, 7.75%, 4/15/18 | | United States | | | 1,000,000 | | | | 1,120,000 | |
CCO Holdings LLC/CCO Holdings Capital Corp., | | | | | | | | | | |
senior bond, 5.25%, 9/30/22 | | United States | | | 900,000 | | | | 844,875 | |
senior note, 6.50%, 4/30/21 | | United States | | | 1,500,000 | | | | 1,548,750 | |
Clear Channel Communications Inc., senior secured bond, first lien, 9.00%, 3/01/21 | | United States | | | 3,800,000 | | | | 3,857,000 | |
Clear Channel Worldwide Holdings Inc., | | | | | | | | | | |
senior note, 6.50%, 11/15/22 | | United States | | | 1,000,000 | | | | 1,026,250 | |
senior sub. note, 7.625%, 3/15/20 | | United States | | | 200,000 | | | | 209,000 | |
senior sub. note, 7.625%, 3/15/20 | | United States | | | 1,100,000 | | | | 1,161,875 | |
CSC Holdings LLC, senior note, 6.75%, 11/15/21 | | United States | | | 1,500,000 | | | | 1,623,750 | |
DISH DBS Corp., senior note, | | | | | | | | | | |
7.125%, 2/01/16 | | United States | | | 3,000,000 | | | | 3,330,000 | |
6.75%, 6/01/21 | | United States | | | 1,500,000 | | | | 1,597,500 | |
FH-15
Franklin Templeton Variable Insurance Products Trust
Statement of Investments, December 31, 2013 (continued)
| | | | | | | | | | |
| Franklin High Income Securities Fund | | Country | | Principal
Amount* | | | Value | |
Corporate Bonds (continued) | | | | | | | | | | |
Media (continued) | | | | | | | | | | |
c Gannett Co. Inc., | | | | | | | | | | |
senior bond, 144A, 6.375%, 10/15/23 | | United States | | | 2,000,000 | | | $ | 2,075,000 | |
senior note, 144A, 5.125%, 7/15/20 | | United States | | | 700,000 | | | | 712,250 | |
c The Nielsen Co. (Luxembourg) Sarl, senior note, 144A, 5.50%, 10/01/21 | | United States | | | 900,000 | | | | 916,312 | |
g Radio One Inc., senior sub. note, PIK, 12.50%, 5/24/16 | | United States | | | 1,676,514 | | | | 1,684,897 | |
c Univision Communications Inc., senior secured note, 144A, | | | | | | | | | | |
6.875%, 5/15/19 | | United States | | | 2,500,000 | | | | 2,684,375 | |
7.875%, 11/01/20 | | United States | | | 700,000 | | | | 772,625 | |
c UPCB Finance III Ltd., senior secured note, 144A, 6.625%, 7/01/20 | | Netherlands | | | 1,000,000 | | | | 1,067,500 | |
c UPCB Finance VI Ltd., senior secured note, 144A, 6.875%, 1/15/22 | | Netherlands | | | 500,000 | | | | 532,188 | |
c WMG Acquisition Corp., secured note, 144A, 6.00%, 1/15/21 | | United States | | | 2,782,000 | | | | 2,903,712 | |
| | | | | | | | | | |
| | | | | | | | | 29,667,859 | |
| | | | | | | | | | |
Pharmaceuticals, Biotechnology & Life Sciences 2.9% | | | | | | | | | | |
c inVentiv Health Inc., senior secured note, 144A, 9.00%, 1/15/18 | | United States | | | 600,000 | | | | 630,000 | |
c,g Jaguar Holding Co. I, senior note, 144A, PIK, 9.375%, 10/15/17 | | United States | | | 1,200,000 | | | | 1,275,000 | |
c Jaguar Holding Co. II/Merger Sub Inc., senior note, 144A, 9.50%, 12/01/19 | | United States | | | 700,000 | | | | 791,000 | |
Par Pharmaceutical Cos. Inc., senior note, 7.375%, 10/15/20 | | United States | | | 3,300,000 | | | | 3,427,875 | |
c Salix Pharmaceuticals Ltd., senior note, 144A, 6.00%, 1/15/21 | | United States | | | 400,000 | | | | 411,000 | |
c Valeant Pharmaceuticals International Inc., senior note, 144A, | | | | | | | | | | |
7.50%, 7/15/21 | | United States | | | 200,000 | | | | 220,500 | |
5.625%, 12/01/21 | | United States | | | 300,000 | | | | 302,250 | |
c VPI Escrow Corp., senior note, 144A, 6.375%, 10/15/20 | | United States | | | 3,000,000 | | | | 3,176,250 | |
| | | | | | | | | | |
| | | | | | | | | 10,233,875 | |
| | | | | | | | | | |
Retailing 0.9% | | | | | | | | | | |
c American Builders & Contractors Supply Co. Inc., senior note, 144A, 5.625%, 4/15/21 | | United States | | | 2,100,000 | | | | 2,115,750 | |
c New Look Bondco I PLC, secured note, 144A, 8.375%, 5/14/18 | | United Kingdom | | | 1,000,000 | | | | 1,041,250 | |
| | | | | | | | | | |
| | | | | | | | | 3,157,000 | |
| | | | | | | | | | |
Semiconductors & Semiconductor Equipment 1.0% | | | | | | | | | | |
Freescale Semiconductor Inc., senior note, | | | | | | | | | | |
8.05%, 2/01/20 | | United States | | | 2,000,000 | | | | 2,160,000 | |
10.75%, 8/01/20 | | United States | | | 1,104,000 | | | | 1,258,560 | |
| | | | | | | | | | |
| | | | | | | | | 3,418,560 | |
| | | | | | | | | | |
Software & Services 3.5% | | | | | | | | | | |
c BMC Software Finance Inc., senior note, 144A, 8.125%, 7/15/21 | | United States | | | 1,400,000 | | | | 1,449,000 | |
Equinix Inc., senior bond, 5.375%, 4/01/23 | | United States | | | 2,500,000 | | | | 2,456,250 | |
First Data Corp., | | | | | | | | | | |
senior bond, 12.625%, 1/15/21 | | United States | | | 1,500,000 | | | | 1,768,125 | |
c senior note, 144A, 11.25%, 1/15/21 | | United States | | | 1,000,000 | | | | 1,108,750 | |
c senior secured bond, 144A, 8.25%, 1/15/21 | | United States | | | 2,500,000 | | | | 2,671,875 | |
c Sitel LLC/Finance Corp., senior secured note, 144A, 11.00%, 8/01/17 | | United States | | | 200,000 | | | | 214,500 | |
Sterling International Inc., senior note, 11.00%, 10/01/19 | | United States | | | 1,200,000 | | | | 1,254,000 | |
West Corp., senior note, 7.875%, 1/15/19 | | United States | | | 1,500,000 | | | | 1,627,500 | |
| | | | | | | | | | |
| | | | | | | | | 12,550,000 | |
| | | | | | | | | | |
Technology Hardware & Equipment 1.5% | | | | | | | | | | |
c Alcatel-Lucent USA Inc., senior note, 144A, 6.75%, 11/15/20 | | United States | | | 2,400,000 | | | | 2,502,000 | |
c Blackboard Inc., senior note, 144A, 7.75%, 11/15/19 | | United States | | | 700,000 | | | | 698,250 | |
c,g CommScope Holdings Co. Inc., senior note, 144A, PIK, 6.625%, 6/01/20 | | United States | | | 400,000 | | | | 418,000 | |
c CommScope Inc., senior note, 144A, 8.25%, 1/15/19 | | United States | | | 1,746,000 | | | | 1,922,783 | |
| | | | | | | | | | |
| | | | | | | | | 5,541,033 | |
| | | | | | | | | | |
FH-16
Franklin Templeton Variable Insurance Products Trust
Statement of Investments, December 31, 2013 (continued)
| | | | | | | | | | |
| Franklin High Income Securities Fund | | Country | | Principal
Amount* | | | Value | |
Corporate Bonds (continued) | | | | | | | | | | |
Telecommunication Services 10.5% | | | | | | | | | | |
c Altice Financing SA, secured note, 144A, 6.50%, 1/15/22 | | Luxembourg | | | 800,000 | | | $ | 808,000 | |
CenturyLink Inc., | | | | | | | | | | |
senior bond, 6.75%, 12/01/23 | | United States | | | 100,000 | | | | 101,750 | |
senior note, 6.45%, 6/15/21 | | United States | | | 400,000 | | | | 418,000 | |
senior note, 5.80%, 3/15/22 | | United States | | | 2,500,000 | | | | 2,481,250 | |
Cricket Communications Inc., senior note, 7.75%, 10/15/20 | | United States | | | 1,500,000 | | | | 1,715,625 | |
c Digicel Group Ltd., senior note, 144A, 8.25%, 9/30/20 | | Bermuda | | | 2,000,000 | | | | 2,081,250 | |
c Digicel Ltd., senior note, 144A, 6.00%, 4/15/21 | | Bermuda | | | 1,200,000 | | | | 1,163,388 | |
c eAccess Ltd., senior note, 144A, 8.25%, 4/01/18 | | Japan | | | 1,800,000 | | | | 1,974,375 | |
Frontier Communications Corp., | | | | | | | | | | |
senior bond, 7.625%, 4/15/24 | | United States | | | 200,000 | | | | 200,500 | |
senior note, 8.50%, 4/15/20 | | United States | | | 2,000,000 | | | | 2,250,000 | |
senior note, 8.75%, 4/15/22 | | United States | | | 900,000 | | | | 1,003,500 | |
senior note, 7.875%, 1/15/27 | | United States | | | 200,000 | | | | 193,000 | |
Intelsat Jackson Holdings SA, | | | | | | | | | | |
c senior bond, 144A, 5.50%, 8/01/23 | | Luxembourg | | | 500,000 | | | | 475,000 | |
senior note, 7.25%, 10/15/20 | | Luxembourg | | | 900,000 | | | | 988,875 | |
senior note, 7.50%, 4/01/21 | | Luxembourg | | | 3,800,000 | | | | 4,208,500 | |
c Lynx II Corp., senior bond, 144A, 6.375%, 4/15/23 | | United Kingdom | | | 1,700,000 | | | | 1,738,250 | |
c Millicom International Cellular SA, senior note, 144A, 6.625%, 10/15/21 | | Luxembourg | | | 1,300,000 | | | | 1,353,625 | |
c Sprint Corp., | | | | | | | | | | |
senior bond, 144A, 7.125%, 6/15/24 | | United States | | | 500,000 | | | | 508,750 | |
senior note, 144A, 7.875%, 9/15/23 | | United States | | | 500,000 | | | | 538,750 | |
Sprint Nextel Corp., senior note, | | | | | | | | | | |
8.375%, 8/15/17 | | United States | | | 3,000,000 | | | | 3,487,500 | |
c 144A, 9.00%, 11/15/18 | | United States | | | 3,000,000 | | | | 3,622,500 | |
c 144A, 7.00%, 3/01/20 | | United States | | | 300,000 | | | | 336,000 | |
T-Mobile USA Inc., | | | | | | | | | | |
senior bond, 6.50%, 1/15/24 | | United States | | | 400,000 | | | | 406,000 | |
senior note, 6.542%, 4/28/20 | | United States | | | 1,600,000 | | | | 1,710,000 | |
senior note, 6.125%, 1/15/22 | | United States | | | 200,000 | | | | 204,000 | |
c Wind Acquisition Finance SA, senior secured note, 144A, 11.75%, 7/15/17 | | Italy | | | 2,000,000 | | | | 2,130,000 | |
c,g Wind Acquisition Holdings Finance SA, senior secured note, 144A, PIK, 12.25%, | | | | | | | | | | |
7/15/17 | | Italy | | | 612,263 | EUR | | | 840,916 | |
7/15/17 | | Italy | | | 634,219 | | | | 634,862 | |
| | | | | | | | | | |
| | | | | | | | | 37,574,166 | |
| | | | | | | | | | |
Transportation 1.3% | | | | | | | | | | |
c CEVA Group PLC, senior note, first lien, 144A, 4.00%, 5/01/18 | | United Kingdom | | | 1,500,000 | | | | 1,252,500 | |
Hertz Corp., senior note, | | | | | | | | | | |
7.50%, 10/15/18 | | United States | | | 1,100,000 | | | | 1,190,750 | |
6.75%, 4/15/19 | | United States | | | 2,200,000 | | | | 2,381,500 | |
| | | | | | | | | | |
| | | | | | | | | 4,824,750 | |
| | | | | | | | | | |
Utilities 2.0% | | | | | | | | | | |
c Calpine Corp., | | | | | | | | | | |
senior secured bond, first lien, 144A, 5.875%, 1/15/24 | | United States | | | 400,000 | | | | 393,000 | |
senior secured note, 144A, 7.875%, 7/31/20 | | United States | | | 654,000 | | | | 719,400 | |
senior secured note, 144A, 7.50%, 2/15/21 | | United States | | | 1,170,000 | | | | 1,282,613 | |
senior secured note, 144A, 7.875%, 1/15/23 | | United States | | | 782,000 | | | | 858,245 | |
senior secured, first lien, 144A, 6.00%, 1/15/22 | | United States | | | 100,000 | | | | 103,000 | |
c InterGen NV, secured bond, 144A, 7.00%, 6/30/23 | | Netherlands | | | 1,700,000 | | | | 1,768,000 | |
FH-17
Franklin Templeton Variable Insurance Products Trust
Statement of Investments, December 31, 2013 (continued)
| | | | | | | | | | |
| Franklin High Income Securities Fund | | Country | | Principal
Amount* | | | Value | |
Corporate Bonds (continued) | | | | | | | | | | |
Utilities (continued) | | | | | | | | | | |
c Texas Competitive Electric Holdings Co. LLC/Texas Competitive Electric Holdings Finance Inc., | | | | | | | | | | |
senior secured note, 144A, 11.50%, 10/01/20 | | United States | | | 3,000,000 | | | $ | 2,220,000 | |
| | | | | | | | | | |
| | | | | | | | | 7,344,258 | |
| | | | | | | | | | |
Total Corporate Bonds (Cost $318,832,679) | | | | | | | | | 334,716,619 | |
| | | | | | | | | | |
i,jSenior Floating Rate Interests 1.6% | | | | | | | | | | |
Capital Goods 0.2% | | | | | | | | | | |
Navistar Inc., Tranche B Term Loan, 5.75%, 8/17/17 | | United States | | | 760,128 | | | | 773,193 | |
| | | | | | | | | | |
Household & Personal Products 0.6% | | | | | | | | | | |
Sun Products Corp., Tranche B Term Loan, 5.50%, 3/23/20 | | United States | | | 2,382,000 | | | | 2,262,900 | |
| | | | | | | | | | |
Telecommunication Services 0.5% | | | | | | | | | | |
Altice Financing SA, Loans, 5.50%, 6/24/19 | | Luxembourg | | | 1,700,000 | | | | 1,712,750 | |
| | | | | | | | | | |
Utilities 0.3% | | | | | | | | | | |
Texas Competitive Electric Holdings Co. LLC, 2017 Term Loan, 4.668% - 4.739%, 10/10/17 | | United States | | | 1,431,288 | | | | 988,662 | |
| | | | | | | | | | |
Total Senior Floating Rate Interests (Cost $5,970,459) | | | | | | | | | 5,737,505 | |
| | | | | | | | | | |
| | | |
| | | | | Shares | | | | |
Litigation Trust (Cost $—) 0.0% | | | | | | | | | | |
a,b,f NewPage Corp., Litigation Trust | | United States | | | 2,500,000 | | | | — | |
| | | | | | | | | | |
Total Investments before Short Term Investments
(Cost $328,911,780) | | | | | | | | | 342,859,818 | |
| | | | | | | | | | |
| | | |
| | | | | Principal
Amount* | | | | |
Short Term Investments (Cost $10,915,352) 3.1% | | | | | | | | | | |
Repurchase Agreements 3.1% | | | | | | | | | | |
k Joint Repurchase Agreement, 0.008%, 1/02/14 (Maturity Value $10,915,357) | | United States | | | 10,915,352 | | | | 10,915,352 | |
BNP Paribas Securities Corp. (Maturity Value $832,951) | | | | | | | | | | |
Credit Suisse Securities (USA) LLC (Maturity Value $2,498,853) | | | | | | | | | | |
Deutsche Bank Securities Inc. (Maturity Value $1,461,239) | | | | | | | | | | |
HSBC Securities (USA) Inc. (Maturity Value $3,498,481) | | | | | | | | | | |
Merrill Lynch, Pierce, Fenner & Smith Inc. (Maturity Value $1,624,314) | | | | | | | | | | |
Morgan Stanley & Co. LLC (Maturity Value $999,519) | | | | | | | | | | |
Collateralized by U.S. Government Agency Securities, 0.00% - 4.125%, 1/15/14 - 3/07/18; lU.S. Government Agency Discount Notes, 8/19/14; lU.S. Treasury Bills, 9/18/14; U.S. Treasury Bonds, 8.875% - 9.125%, 5/15/17 - 5/15/18; U.S. Treasury Notes, 0.25% - 4.75%, 1/15/15 - 12/31/18; and U.S. Treasury Notes, Index Linked, 1.375% - 1.625%, 1/15/18 - 7/15/18 (valued at $11,134,031) | | | | | | | | | | |
| | | | | | | | | | |
Total Investments (Cost $339,827,132) 98.6% | | | | | | | | | 353,775,170 | |
Other Assets, less Liabilities 1.4% | | | | | | | | | 5,139,879 | |
| | | | | | | | | | |
Net Assets 100.0% | | | | | | | | $ | 358,915,049 | |
| | | | | | | | | | |
FH-18
Franklin Templeton Variable Insurance Products Trust
Statement of Investments, December 31, 2013 (continued)
|
| Franklin High Income Securities Fund |
*The principal amount is stated in U.S. dollars unless otherwise indicated.
aNon-income producing.
bAt December 31, 2013, pursuant to the Fund’s policies and the requirements of applicable securities law, the Fund may be restricted from trading these securities for a limited or extended period of time due to ownership limits and/or potential possession of material non-public information.
cSecurity was purchased pursuant to Rule 144A under the Securities Act of 1933 and may be sold in transactions exempt from registration only to qualified institutional buyers or in a public offering registered under the Securities Act of 1933. These securities have been deemed liquid under guidelines approved by the Trust’s Board of Trustees. At December 31, 2013, the aggregate value of these securities was $135,034,664, representing 37.62% of net assets.
dSecurity purchased on a when-issued basis. See Note 1(d).
eSee Note 7 regarding defaulted securities.
fSecurity has been deemed illiquid because it may not be able to be sold within seven days. At December 31, 2013, the aggregate value of these securities was $191, representing less than 0.01% of net assets.
gIncome may be received in additional securities and/or cash.
hPerpetual security with no stated maturity date.
iThe coupon rate shown represents the rate at period end.
jSee Note 1(f) regarding senior floating rate interests.
kSee Note 1(c) regarding joint repurchase agreement.
lThe security is traded on a discount basis with no stated coupon rate.
The accompanying notes are an integral part of these financial statements.
FH-19
Franklin Templeton Variable Insurance Products Trust
Statement of Investments, December 31, 2013 (continued)
|
| Franklin High Income Securities Fund |
Forward Exchange Contracts
At December 31, 2013, the Fund had the following forward exchange contracts outstanding. See Note 1(e).
| | | | | | | | | | | | | | | | | | | | | | | | | | | | |
| Currency | | Counterpartya | | | Type | | | Quantity | | | Contract
Amount | | | Settlement
Date | | | Unrealized
Appreciation | | | Unrealized
Depreciation | |
Euro | | | DBAB | | | | Sell | | | | 600,000 | | | $ | 823,230 | | | | 12/17/14 | | | $ | — | | | $ | (2,567 | ) |
| | | | | | | | | | | | | | | | | | | | | | | | |
aMay be comprised of multiple contracts using the same currency and settlement date.
See Abbreviations on page FH-34.
The accompanying notes are an integral part of these financial statements.
FH-20
Franklin Templeton Variable Insurance Products Trust
Financial Statements
Statement of Assets and Liabilities
December 31, 2013
| | | | |
| | | Franklin
High Income
Securities Fund | |
Assets: | | | | |
Investments in securities: | | | | |
Cost - Unaffiliated issuers | | $ | 328,911,780 | |
Cost - Repurchase agreements | | | 10,915,352 | |
| | | | |
Total cost of investments | | $ | 339,827,132 | |
| | | | |
Value - Unaffiliated issuers | | $ | 342,859,818 | |
Value - Repurchase agreements | | | 10,915,352 | |
| | | | |
Total value of investments | | | 353,775,170 | |
Cash | | | 39,626 | |
Receivables: | | | | |
Capital shares sold | | | 273,060 | |
Interest | | | 5,978,665 | |
Other assets | | | 8 | |
| | | | |
Total assets | | | 360,066,529 | |
| | | | |
Liabilities: | | | | |
Payables: | | | | |
Investment securities purchased | | | 500,000 | |
Capital shares redeemed | | | 252,507 | |
Management fees | | | 158,686 | |
Distribution fees | | | 137,782 | |
Unrealized depreciation on forward exchange contracts | | | 2,567 | |
Accrued expenses and other liabilities | | | 99,938 | |
| | | | |
Total liabilities | | | 1,151,480 | |
| | | | |
Net assets, at value | | $ | 358,915,049 | |
| | | | |
Net assets consist of: | | | | |
Paid-in capital | | $ | 347,687,410 | |
Undistributed net investment income | | | 20,624,091 | |
Net unrealized appreciation (depreciation) | | | 13,945,476 | |
Accumulated net realized gain (loss) | | | (23,341,928 | ) |
| | | | |
Net assets, at value | | $ | 358,915,049 | |
| | | | |
The accompanying notes are an integral part of these financial statements.
FH-21
Franklin Templeton Variable Insurance Products Trust
Financial Statements (continued)
Statement of Assets and Liabilities (continued)
December 31, 2013
| | | | |
| | | Franklin
High Income
Securities Fund | |
Class 1: | | | | |
Net assets, at value | | $ | 39,300,391 | |
| | | | |
Shares outstanding | | | 5,600,886 | |
| | | | |
Net asset value and maximum offering price per share | | $ | 7.02 | |
| | | | |
Class 2: | | | | |
Net assets, at value | | $ | 291,825,563 | |
| | | | |
Shares outstanding | | | 42,845,091 | |
| | | | |
Net asset value and maximum offering price per share | | $ | 6.81 | |
| | | | |
Class 4: | | | | |
Net assets, at value | | $ | 27,789,095 | |
| | | | |
Shares outstanding | | | 4,004,010 | |
| | | | |
Net asset value and maximum offering price per share | | $ | 6.94 | |
| | | | |
The accompanying notes are an integral part of these financial statements.
FH-22
Franklin Templeton Variable Insurance Products Trust
Financial Statements (continued)
Statement of Operations
for the year ended December 31, 2013
| | | | |
| | | Franklin
High Income
Securities Fund | |
Investment income: | | | | |
Dividends | | $ | 169,842 | |
Interest | | | 25,236,130 | |
| | | | |
Total investment income | | | 25,405,972 | |
| | | | |
Expenses: | | | | |
Management fees (Note 3a) | | | 1,836,744 | |
Distribution fees: (Note 3c) | | | | |
Class 2 | | | 708,598 | |
Class 4 | | | 97,469 | |
Unaffiliated transfer agent fees | | | 87 | |
Custodian fees (Note 4) | | | 3,352 | |
Reports to shareholders | | | 98,619 | |
Professional fees | | | 47,237 | |
Trustees’ fees and expenses | | | 1,420 | |
Other | | | 50,417 | |
| | | | |
Total expenses | | | 2,843,943 | |
Expense reductions (Note 4) | | | (29 | ) |
| | | | |
Net expenses | | | 2,843,914 | |
| | | | |
Net investment income | | | 22,562,058 | |
| | | | |
Realized and unrealized gains (losses): | | | | |
Net realized gain (loss) from: | | | | |
Investments | | | 5,567,320 | |
Foreign currency transactions | | | (20,520 | ) |
| | | | |
Net realized gain (loss) | | | 5,546,800 | |
| | | | |
Net change in unrealized appreciation (depreciation) on: | | | | |
Investments | | | (1,215,896 | ) |
Translation of other assets and liabilities denominated in foreign currencies | | | (1,022 | ) |
| | | | |
Net change in unrealized appreciation (depreciation) | | | (1,216,918 | ) |
| | | | |
Net realized and unrealized gain (loss) | | | 4,329,882 | |
| | | | |
Net increase (decrease) in net assets resulting from operations | | $ | 26,891,940 | |
| | | | |
The accompanying notes are an integral part of these financial statements.
FH-23
Franklin Templeton Variable Insurance Products Trust
Financial Statements (continued)
Statements of Changes in Net Assets
| | | | | | | | |
| | | Franklin High Income
Securities Fund | |
| | | Year Ended December 31, | |
| | | 2013 | | | 2012 | |
| | | | |
Increase (decrease) in net assets: | | | | | | | | |
Operations: | | | | | | | | |
Net investment income | | $ | 22,562,058 | | | $ | 23,416,924 | |
Net realized gain (loss) from investments and foreign currency transactions and swap contracts | | | 5,546,800 | | | | 3,511,154 | |
Net change in unrealized appreciation (depreciation) on investments and translation of other assets and liabilities denominated in foreign currencies | | | (1,216,918 | ) | | | 21,969,531 | |
| | | | |
Net increase (decrease) in net assets resulting from operations | | | 26,891,940 | | | | 48,897,609 | |
| | | | |
Distributions to shareholders from: | | | | | | | | |
Net investment income: | | | | | | | | |
Class 1 | | | (2,998,716 | ) | | | (2,935,357 | ) |
Class 2 | | | (20,021,935 | ) | | | (18,731,686 | ) |
Class 4 | | | (1,982,283 | ) | | | (1,858,828 | ) |
| | | | |
Total distributions to shareholders | | | (25,002,934 | ) | | | (23,525,871 | ) |
| | | | |
Capital share transactions: (Note 2) | | | | | | | | |
Class 1 | | | (3,089,037 | ) | | | (3,084,036 | ) |
Class 2 | | | 8,408,156 | | | | 12,381,383 | |
Class 4 | | | 25,255 | | | | (1,465,915 | ) |
| | | | |
Total capital share transactions | | | 5,344,374 | | | | 7,831,432 | |
| | | | |
Net increase (decrease) in net assets | | | 7,233,380 | | | | 33,203,170 | |
Net assets: | | | | | | | | |
Beginning of year | | | 351,681,669 | | | | 318,478,499 | |
| | | | |
End of year | | $ | 358,915,049 | | | $ | 351,681,669 | |
| | | | |
Undistributed net investment income included in net assets: | | | | | | | | |
End of year | | $ | 20,624,091 | | | $ | 22,935,694 | |
| | | | |
The accompanying notes are an integral part of these financial statements.
FH-24
Franklin Templeton Variable Insurance Products Trust
Notes to Financial Statements
Franklin High Income Securities Fund
1. ORGANIZATION AND SIGNIFICANT ACCOUNTING POLICIES
Franklin Templeton Variable Insurance Products Trust (Trust) is registered under the Investment Company Act of 1940, as amended, (1940 Act) as an open-end investment company, consisting of twenty separate funds. The Franklin High Income Securities Fund (Fund) is included in this report. The financial statements of the remaining funds in the Trust are presented separately. Shares of the Fund are generally sold only to insurance company separate accounts to fund the benefits of variable life insurance policies or variable annuity contracts. At December 31, 2013, 83.96% of the Fund’s shares were held through one insurance company. Investment activities of these insurance company separate accounts could have a material impact on the Fund. The Fund offers three classes of shares: Class 1, Class 2, and Class 4. Each class of shares differs by its distribution fees, voting rights on matters affecting a single class and its exchange privilege.
The following summarizes the Fund’s significant accounting policies.
a. Financial Instrument Valuation
The Fund’s investments in financial instruments are carried at fair value daily. Fair value is the price that would be received to sell an asset or paid to transfer a liability in an orderly transaction between market participants on the measurement date. The Fund calculates the net asset value (NAV) per share at the close of the New York Stock Exchange (NYSE), generally at 4p.m. Eastern time (NYSE close) on each day the NYSE is open for trading. Under procedures approved by the Trust’s Board of Trustees (the Board), the Fund’s administrator, investment manager and other affiliates have formed the Valuation and Liquidity Oversight Committee (VLOC). The VLOC provides administration and oversight of the Fund’s valuation policies and procedures, which are approved annually by the Board. Among other things, these procedures allow the Fund to utilize independent pricing services, quotations from securities and financial instrument dealers, and other market sources to determine fair value.
Equity securities listed on an exchange or on the NASDAQ National Market System are valued at the last quoted sale price or the official closing price of the day, respectively. Foreign equity securities are valued as of the close of trading on the foreign stock exchange on which the security is primarily traded or as of the NYSE close, whichever is earlier. The value is then converted into its U.S. dollar equivalent at the foreign exchange rate in effect at the NYSE close on the day that the value of the security is determined. Over-the-counter (OTC) securities are valued within the range of the most recent quoted bid and ask prices. Securities that trade in multiple markets or on multiple exchanges are valued according to the broadest and most representative market. Certain equity securities are valued based upon fundamental characteristics or relationships to similar securities.
Debt securities generally trade in the OTC market rather than on a securities exchange. The Fund’s pricing services use multiple valuation techniques to determine fair value. In instances where sufficient market activity exists, the pricing services may utilize a market-based approach through which quotes from market makers are used to determine fair value. In instances where sufficient market activity may not exist or is limited, the pricing services also utilize proprietary valuation models which may consider market characteristics such as benchmark yield curves, credit spreads, estimated default rates, anticipated market interest rate volatility, coupon rates, anticipated timing of principal repayments, underlying collateral, and other unique security features in order to estimate the relevant cash flows, which are then discounted to calculate the fair value. Securities denominated in a foreign currency are converted into their U.S. dollar equivalent at the foreign exchange rate in effect at the NYSE close on the date that the values of the foreign debt securities are determined. Repurchase agreements are valued at cost, which approximates market value.
Certain derivative financial instruments (derivatives) trade in the OTC market. The Fund’s pricing services use various techniques including industry standard option pricing models and proprietary discounted cash flow models to determine the fair value of those instruments. The Fund’s net benefit or obligation under the derivative contract, as measured by the fair value of the contract, is included in net assets.
The Fund has procedures to determine the fair value of financial instruments for which market prices are not reliable or readily available. Under these procedures, the VLOC convenes on a regular basis to review such financial instruments and considers a
FH-25
Franklin Templeton Variable Insurance Products Trust
Notes to Financial Statements (continued)
Franklin High Income Securities Fund
1. ORGANIZATION AND SIGNIFICANT ACCOUNTING POLICIES (continued)
a. Financial Instrument Valuation (continued)
number of factors, including significant unobservable valuation inputs, when arriving at fair value. The VLOC primarily employs a market-based approach which may use related or comparable assets or liabilities, recent transactions, market multiples, book values, and other relevant information for the investment to determine the fair value of the investment. An income-based valuation approach may also be used in which the anticipated future cash flows of the investment are discounted to calculate fair value. Discounts may also be applied due to the nature or duration of any restrictions on the disposition of the investments. Due to the inherent uncertainty of valuations of such investments, the fair values may differ significantly from the values that would have been used had an active market existed. The VLOC employs various methods for calibrating these valuation approaches including a regular review of key inputs and assumptions, transactional back-testing or disposition analysis, and reviews of any related market activity.
Trading in securities on foreign securities stock exchanges and OTC markets may be completed before the daily NYSE close. In addition, trading in certain foreign markets may not take place on every NYSE business day. Occasionally, events occur between the time at which trading in a foreign security is completed and the close of the NYSE that might call into question the reliability of the value of a portfolio security held by the Fund. As a result, differences may arise between the value of the Fund’s portfolio securities as determined at the foreign market close and the latest indications of value at the close of the NYSE. In order to minimize the potential for these differences, the VLOC monitors price movements following the close of trading in foreign stock markets through a series of country specific market proxies (such as baskets of American Depositary Receipts, futures contracts and exchange traded funds). These price movements are measured against established trigger thresholds for each specific market proxy to assist in determining if an event has occurred that may call into question the reliability of the values of the foreign securities held by the Fund. If such an event occurs, the securities may be valued using fair value procedures, which may include the use of independent pricing services.
Also, when the last day of the reporting period is a non-business day, certain foreign markets may be open on those days that the NYSE is closed, which could result in differences between the value of the Fund’s portfolio securities on the last business day and the last calendar day of the reporting period. Any significant security valuation changes due to an open foreign market are adjusted and reflected by the Fund for financial reporting purposes.
b. Foreign Currency Translation
Portfolio securities and other assets and liabilities denominated in foreign currencies are translated into U.S. dollars based on the exchange rate of such currencies against U.S. dollars on the date of valuation. The Fund may enter into foreign currency exchange contracts to facilitate transactions denominated in a foreign currency. Purchases and sales of securities, income and expense items denominated in foreign currencies are translated into U.S. dollars at the exchange rate in effect on the transaction date. Portfolio securities and assets and liabilities denominated in foreign currencies contain risks that those currencies will decline in value relative to the U.S. dollar. Occasionally, events may impact the availability or reliability of foreign exchange rates used to convert the U.S. dollar equivalent value. If such an event occurs, the foreign exchange rate will be valued at fair value using procedures established and approved by the Board.
The Fund does not separately report the effect of changes in foreign exchange rates from changes in market prices on securities held. Such changes are included in net realized and unrealized gain or loss from investments on the Statement of Operations.
Realized foreign exchange gains or losses arise from sales of foreign currencies, currency gains or losses realized between the trade and settlement dates on securities transactions and the difference between the recorded amounts of dividends, interest, and foreign withholding taxes and the U.S. dollar equivalent of the amounts actually received or paid. Net unrealized foreign exchange gains and losses arise from changes in foreign exchange rates on foreign denominated assets and liabilities other than investments in securities held at the end of the reporting period.
FH-26
Franklin Templeton Variable Insurance Products Trust
Notes to Financial Statements (continued)
Franklin High Income Securities Fund
1. ORGANIZATION AND SIGNIFICANT ACCOUNTING POLICIES (continued)
c. Joint Repurchase Agreement
The Fund enters into a joint repurchase agreement whereby its uninvested cash balance is deposited into a joint cash account with other funds managed by the investment manager or an affiliate of the investment manager and is used to invest in one or more repurchase agreements. The value and face amount of the joint repurchase agreement are allocated to the funds based on their pro-rata interest. A repurchase agreement is accounted for as a loan by the Fund to the seller, collateralized by securities which are delivered to the Fund’s custodian. The market value, including accrued interest, of the initial collateralization is required to be at least 102% of the dollar amount invested by the funds, with the value of the underlying securities marked to market daily to maintain coverage of at least 100%. Repurchase agreements are subject to the terms of Master Repurchase Agreements (MRAs) with approved counterparties (sellers). The MRAs contain various provisions, including but not limited to events of default and maintenance of collateral for repurchase agreements. In the event of default by either the seller or the Fund, certain MRAs may permit the non-defaulting party to net and close-out all transactions, if any, traded under such agreements. The Fund may sell securities it holds as collateral and apply the proceeds towards the repurchase price and any other amounts owed by the seller to the Fund in the event of default by the seller. This could involve costs or delays in addition to a loss on the securities if their value falls below the repurchase price owed by the seller. The joint repurchase agreement held by the Fund at year end, as indicated in the Statement of Investments, had been entered into on December 31, 2013.
d. Securities Purchased on a When-Issued Basis
The Fund purchases securities on a when-issued basis, with payment and delivery scheduled for a future date. These transactions are subject to market fluctuations and are subject to the risk that the value at delivery may be more or less than the trade date purchase price. Although the Fund will generally purchase these securities with the intention of holding the securities, it may sell the securities before the settlement date. Sufficient assets have been segregated for these securities.
e. Derivative Financial Instruments
The Fund invested in derivatives in order to manage risk or gain exposure to various other investments or markets. Derivatives are financial contracts based on an underlying or notional amount, require no initial investment or an initial net investment that is smaller than would normally be required to have a similar response to changes in market factors, and require or permit net settlement. Derivatives contain various risks including the potential inability of the counterparty to fulfill their obligations under the terms of the contract, the potential for an illiquid secondary market, and/or the potential for market movements which expose the Fund to gains or losses in excess of the amounts shown on the Statement of Assets and Liabilities. Realized gain and loss and unrealized appreciation and depreciation on these contracts for the period are included in the Statement of Operations.
Derivative counterparty credit risk is managed through a formal evaluation of the creditworthiness of all potential counterparties. The Fund attempts to reduce its exposure to counterparty credit risk on OTC derivatives, whenever possible, by entering into International Swaps and Derivatives Association (ISDA) master agreements with certain counterparties. These agreements contain various provisions, including but not limited to collateral requirements, events of default, or early termination. Termination events applicable to the counterparty include certain deteriorations in the credit quality of the counterparty. Termination events applicable to the Fund include failure of the Fund to maintain certain net asset levels and/or limit the decline in net assets over various periods of time. In the event of default or early termination, the ISDA master agreement gives the non-defaulting party the right to net and close-out all transactions traded, whether or not arising under the ISDA agreement, to one net amount payable by one counterparty to the other. However, absent an event of default or early termination, OTC derivative assets and liabilities are presented gross and not offset in the Statement of Assets and Liabilities. Early termination by the counterparty may result in an immediate payment by the Fund of any net liability owed to that counterparty under the ISDA agreement. At December 31, 2013, the Fund had OTC derivatives in a net liability position for such contracts of $2,567.
FH-27
Franklin Templeton Variable Insurance Products Trust
Notes to Financial Statements (continued)
Franklin High Income Securities Fund
1. ORGANIZATION AND SIGNIFICANT ACCOUNTING POLICIES (continued)
e. Derivative Financial Instruments (continued)
Collateral requirements differ by type of derivative. Collateral terms are contract specific for OTC derivatives. For OTC derivatives traded under an ISDA master agreement, posting of collateral is required by either the fund or the applicable counterparty if the total net exposure of all OTC derivatives with the applicable counterparty exceeds the minimum transfer amount, which typically ranges from $100,000 to $250,000, and can vary depending on the counterparty and the type of the agreement. Generally, collateral is determined at the close of fund business each day and any additional collateral required due to changes in derivative values may be delivered by the fund or the counterparty within a few business days. Collateral pledged and/or received by the fund, if any, is held in segregated accounts with the fund’s custodian/counterparty broker and can be in the form of cash and/or securities. Unrestricted cash may be invested according to the Fund’s investment objectives.
The Fund entered into OTC forward exchange contracts primarily to manage and/or gain exposure to certain foreign currencies. A forward exchange contract is an agreement between the Fund and a counterparty to buy or sell a foreign currency at a specific exchange rate on a future date.
The Fund entered into credit default swap contracts primarily to manage and/or gain exposure to credit risk. A credit default swap is an agreement between the Fund and a counterparty whereby the buyer of the contract receives credit protection and the seller of the contract guarantees the credit worthiness of a referenced debt obligation. These agreements may be privately negotiated in the over-the-counter market (“OTC credit default swaps”) or may be executed in a multilateral trade facility platform, such as a registered exchange (“centrally cleared credit default swaps”). The underlying referenced debt obligation may be a single issuer of corporate or sovereign debt, a credit index, or a tranche of a credit index. In the event of a default of the underlying referenced debt obligation, the buyer is entitled to receive the notional amount of the credit default swap contract from the seller in exchange for the referenced debt obligation, a net settlement amount equal to the notional amount of the credit default swap less the recovery value of the referenced debt obligation, or other agreed upon amount. For centrally cleared credit default swaps, required initial margins are pledged by the Fund, and the daily change in fair value is accounted for as a variation margin payable or receivable. Over the term of the contract, the buyer pays the seller a periodic stream of payments, provided that no event of default has occurred. Such periodic payments are accrued daily as an unrealized appreciation or depreciation until the payments are made, at which time they are realized. Payments received or paid to initiate a credit default swap contract are reflected on the Statement of Assets and Liabilities and represent compensating factors between stated terms of the credit default swap agreement and prevailing market conditions (credit spreads and other relevant factors). These upfront payments are amortized over the term of the contract as a realized gain or loss on the Statement of Operations.
See Note 8 regarding other derivative information.
f. Senior Floating Rate Interests
The Fund invests in senior secured corporate loans that pay interest at rates which are periodically reset by reference to a base lending rate plus a spread. These base lending rates are generally the prime rate offered by a designated U.S. bank or the London InterBank Offered Rate (LIBOR). Senior secured corporate loans often require prepayment of principal from excess cash flows or at the discretion of the borrower. As a result, actual maturity may be substantially less than the stated maturity.
Senior secured corporate loans in which the Fund invests are generally readily marketable, but may be subject to certain restrictions on resale.
g. Income and Deferred Taxes
It is the Fund’s policy to qualify as a regulated investment company under the Internal Revenue Code. The Fund intends to distribute to shareholders substantially all of its taxable income and net realized gains to relieve it from federal income and if applicable, excise taxes. As a result, no provision for U.S. federal income taxes is required.
FH-28
Franklin Templeton Variable Insurance Products Trust
Notes to Financial Statements (continued)
Franklin High Income Securities Fund
1. ORGANIZATION AND SIGNIFICANT ACCOUNTING POLICIES (continued)
g. Income and Deferred Taxes (continued)
The Fund may be subject to foreign taxation related to income received, capital gains on the sale of securities and certain foreign currency transactions in the foreign jurisdictions in which it invests. Foreign taxes, if any, are recorded based on the tax regulations and rates that exist in the foreign markets in which the Fund invests. When a capital gain tax is determined to apply the Fund records an estimated deferred tax liability in an amount that would be payable if the securities were disposed of on the valuation date.
The Fund recognizes the tax benefits of uncertain tax positions only when the position is “more likely than not” to be sustained upon examination by the tax authorities based on the technical merits of the tax position. As of December 31, 2013, and for all open tax years, the Fund has determined that no liability for unrecognized tax benefits is required in the Fund’s financial statements related to uncertain tax positions taken on a tax return (or expected to be taken on future tax returns). Open tax years are those that remain subject to examination and are based on each tax jurisdiction statute of limitation.
h. Security Transactions, Investment Income, Expenses and Distributions
Security transactions are accounted for on trade date. Realized gains and losses on security transactions are determined on a specific identification basis. Interest income and estimated expenses are accrued daily. Amortization of premium and accretion of discount on debt securities are included in interest income. Facility fees are recognized as income over the expected term of the loan. Dividend income is recorded on the ex-dividend date except that certain dividends from foreign securities are recognized as soon as the Fund is notified of the ex-dividend date. Distributions to shareholders are recorded on the ex-dividend date and are determined according to income tax regulations (tax basis). Distributable earnings determined on a tax basis may differ from earnings recorded in accordance with accounting principles generally accepted in the United States of America. These differences may be permanent or temporary. Permanent differences are reclassified among capital accounts to reflect their tax character. These reclassifications have no impact on net assets or the results of operations. Temporary differences are not reclassified, as they may reverse in subsequent periods.
Common expenses incurred by the Trust are allocated among the funds based on the ratio of net assets of each fund to the combined net assets of the Trust. Fund specific expenses are charged directly to the fund that incurred the expense.
Realized and unrealized gains and losses and net investment income, not including class specific expenses, are allocated daily to each class of shares based upon the relative proportion of net assets of each class. Differences in per share distributions, by class, are generally due to differences in class specific expenses.
i. Accounting Estimates
The preparation of financial statements in accordance with accounting principles generally accepted in the United States of America requires management to make estimates and assumptions that affect the reported amounts of assets and liabilities at the date of the financial statements and the amounts of income and expenses during the reporting period. Actual results could differ from those estimates.
j. Guarantees and Indemnifications
Under the Trust’s organizational documents, its officers and trustees are indemnified by the Trust against certain liabilities arising out of the performance of their duties to the Trust. Additionally, in the normal course of business, the Trust, on behalf of the Fund, enters into contracts with service providers that contain general indemnification clauses. The Trust’s maximum exposure under these arrangements is unknown as this would involve future claims that may be made against the Trust that have not yet occurred. Currently, the Trust expects the risk of loss to be remote.
FH-29
Franklin Templeton Variable Insurance Products Trust
Notes to Financial Statements (continued)
Franklin High Income Securities Fund
2. SHARES OF BENEFICIAL INTEREST
At December 31, 2013, there were an unlimited number of shares authorized (without par value). Transactions in the Fund’s shares were as follows:
| | | | | | | | | | | | | | | | |
| | | Year Ended December 31, | |
| | | 2013 | | | 2012 | |
| Class 1 Shares: | | Shares | | | Amount | | | Shares | | | Amount | |
Shares sold | | | 296,126 | | | $ | 2,094,060 | | | | 237,071 | | | $ | 1,594,666 | |
Shares issued in reinvestment of distributions | | | 448,910 | | | | 2,998,716 | | | | 461,534 | | | | 2,935,357 | |
Shares redeemed | | | (1,160,278 | ) | | | (8,181,813 | ) | | | (1,118,303 | ) | | | (7,614,059 | ) |
| | | | |
Net increase (decrease) | | | (415,242 | ) | | $ | (3,089,037 | ) | | | (419,698 | ) | | $ | (3,084,036 | ) |
| | | | |
Class 2 Shares: | | | | | | | | | | | | | | | | |
Shares sold | | | 8,384,624 | | | $ | 56,291,181 | | | | 6,520,319 | | | $ | 43,016,960 | |
Shares issued in reinvestment of distributions | | | 3,085,044 | | | | 20,021,935 | | | | 3,021,240 | | | | 18,731,686 | |
Shares redeemed | | | (9,961,173 | ) | | | (67,904,960 | ) | | | (7,450,705 | ) | | | (49,367,263 | ) |
| | | | |
Net increase (decrease) | | | 1,508,495 | | | $ | 8,408,156 | | | | 2,090,854 | | | $ | 12,381,383 | |
| | | | |
Class 4 Shares: | | | | | | | | | | | | | | | | |
Shares sold | | | 232,056 | | | $ | 1,586,635 | | | | 86,672 | | | $ | 581,663 | |
Shares issued on reinvestment of distributions | | | 299,438 | | | | 1,982,283 | | | | 294,584 | | | | 1,858,828 | |
Shares redeemed | | | (515,161 | ) | | | (3,543,663 | ) | | | (582,921 | ) | | | (3,906,406 | ) |
| | | | |
Net increase (decrease) | | | 16,333 | | | $ | 25,255 | | | | (201,665 | ) | | $ | (1,465,915 | ) |
| | | | |
3. TRANSACTIONS WITH AFFILIATES
Franklin Resources, Inc. is the holding company for various subsidiaries that together are referred to as Franklin Templeton Investments. Certain officers and trustees of the Fund are also officers and/or directors of the following subsidiaries:
| | |
| Subsidiary | | Affiliation |
Franklin Advisers, Inc. (Advisers) | | Investment manager |
Franklin Templeton Services, LLC (FT Services) | | Administrative manager |
Franklin Templeton Distributors, Inc. (Distributors) | | Principal underwriter |
Franklin Templeton Investor Services, LLC (Investor Services) | | Transfer agent |
a. Management Fees
The Fund pays an investment management fee to Advisers based on the average daily net assets of the Fund as follows:
| | |
| Annualized Fee Rate | | Net Assets |
| 0.625% | | Up to and including $100 million |
| 0.500% | | Over $100 million, up to and including $250 million |
| 0.450% | | Over $250 million, up to and including $7.5 billion |
| 0.440% | | Over $7.5 billion, up to and including $10 billion |
| 0.430% | | Over $10 billion, up to and including $12.5 billion |
| 0.420% | | Over $12.5 billion, up to and including $15 billion |
| 0.400% | | In excess of $15 billion |
FH-30
Franklin Templeton Variable Insurance Products Trust
Notes to Financial Statements (continued)
Franklin High Income Securities Fund
3. TRANSACTIONS WITH AFFILIATES (continued)
b. Administrative Fees
Under an agreement with Advisers, FT Services provides administrative services to the Fund. The fee is paid by Advisers based on the Fund’s average daily net assets, and is not an additional expense of the Fund.
c. Distribution Fees
The Board has adopted distribution plans for Class 2 and Class 4 shares pursuant to Rule 12b-1 under the 1940 Act. Under the Fund’s compensation distribution plans, the Fund pays Distributors for costs incurred in connection with the servicing, sale and distribution of the Fund’s shares up to 0.35% per year of its average daily net assets of each class. Some distribution fees are not charged on shares held by affiliates. The Board has agreed to limit the current rate to 0.25% per year for Class 2. The plan year, for purposes of monitoring compliance with the maximum annual plan rate, is February 1 through January 31.
d. Transfer Agent Fees
Investor Services, under terms of an agreement, performs shareholder servicing for the Fund and is not paid by the Fund for the services.
4. EXPENSE OFFSET ARRANGEMENT
The Fund has entered into an arrangement with its custodian whereby credits realized as a result of uninvested cash balances are used to reduce a portion of the Fund’s custodian expenses. During the year ended December 31, 2013, the custodian fees were reduced as noted in the Statement of Operations.
5. INCOME TAXES
For tax purposes, capital losses may be carried over to offset future capital gains. Capital loss carryforwards with no expiration, if any, must be fully utilized before those losses with expiration dates.
At December 31, 2013, capital loss carryforwards were as follows:
| | | | |
Capital loss carryforwards expiring in: | | | | |
2014 | | $ | 40,420 | |
2015 | | | 4,493,289 | |
2016 | | | 8,150,741 | |
2017 | | | 10,621,353 | |
| | | | |
| | $ | 23,305,803 | |
| | | | |
During the year ended December 31, 2013, the Fund utilized $5,607,494 of capital loss carryforwards.
On December 31, 2013, the Fund had expired capital loss carryforwards of $713,696, which were reclassified to paid-in capital.
The tax character of distributions paid during the years ended December 31, 2013 and 2012, was as follows:
| | | | | | | | |
| | | 2013 | | | 2012 | |
Distributions paid from ordinary income | | $ | 25,002,934 | | | $ | 23,525,871 | |
| | | | |
FH-31
Franklin Templeton Variable Insurance Products Trust
Notes to Financial Statements (continued)
Franklin High Income Securities Fund
5. INCOME TAXES (continued)
At December 31, 2013, the cost of investments, net unrealized appreciation (depreciation) and undistributed ordinary income for income tax purposes were as follows:
| | | | |
Cost of investments | | $ | 340,717,529 | |
| | | | |
| |
Unrealized appreciation | | $ | 19,235,616 | |
Unrealized depreciation | | | (6,177,975 | ) |
| | | | |
Net unrealized appreciation (depreciation) | | $ | 13,057,641 | |
| | | | |
Distributable earnings – undistributed ordinary income | | $ | 21,479,534 | |
| | | | |
Differences between income and/or capital gains as determined on a book basis and a tax basis are primarily due to differing treatments of bond discounts and premiums.
6. INVESTMENT TRANSACTIONS
Purchases and sales of investments (excluding short term securities) for the year ended December 31, 2013, aggregated $104,578,335 and $104,367,999 respectively.
7. CREDIT RISK AND DEFAULTED SECURITIES
At December 31, 2013, the Fund had 95.56% of its portfolio invested in high yield, senior secured floating rate notes, or other securities rated below investment grade. These securities may be more sensitive to economic conditions causing greater price volatility and are potentially subject to a greater risk of loss due to default than higher rated securities.
The Fund held defaulted securities and/or other securities for which the income has been deemed uncollectible. At December 31, 2013, the aggregate value of these securities represents less than 0.05% of the Fund’s net assets. The Fund discontinues accruing income on securities for which income has been deemed uncollectible and provides an estimate for losses on interest receivable. The securities have been identified on the accompanying Statement of Investments.
8. OTHER DERIVATIVE INFORMATION
At December 31, 2013, the Fund’s investments in derivative contracts are reflected on the Statement of Assets and Liabilities as follows:
| | | | | | | | | | | | |
| | | Asset Derivatives | | | Liability Derivatives | |
Derivative Contracts Not Accounted
for as Hedging Instruments | | Statement of Assets and
Liabilities Location | | Fair Value
Amount | | | Statement of Assets and
Liabilities Location | | Fair Value
Amount | |
Foreign exchange contracts | | Unrealized appreciation on forward exchange contracts | | | $ — | | | Unrealized depreciation on forward exchange contracts | | $ | 2,567 | |
FH-32
Franklin Templeton Variable Insurance Products Trust
Notes to Financial Statements (continued)
Franklin High Income Securities Fund
8. OTHER DERIVATIVE INFORMATION (continued)
For the year ended December 31, 2013, the effect of derivative contracts on the Fund’s Statement of Operations was as follows:
| | | | | | | | | | |
Derivative Contracts Not Accounted
for as Hedging Instruments | | Statement of Operations Locations | | Realized Gain
(Loss) for the
Year | | | Change in
Unrealized
Appreciation
(Depreciation)
for the
Year | |
Foreign exchange contracts | | Net realized gain (loss) from foreign currency transactions / Net change in unrealized appreciation (depreciation) on translation of other assets and liabilities denominated in foreign currencies | | $ | (20,520 | ) | | $ | (1,027 | ) |
9. CREDIT FACILITY
The Fund, together with other U.S. registered and foreign investment funds (collectively, Borrowers), managed by Franklin Templeton Investments, are borrowers in a joint syndicated senior unsecured credit facility totaling $1.5 billion (Global Credit Facility) which, after extension of the original terms, matured on February 14, 2014. This Global Credit Facility provides a source of funds to the Borrowers for temporary and emergency purposes, including the ability to meet future unanticipated or unusually large redemption requests. Effective February 14, 2014, the Borrowers renewed the Global Credit Facility which matures on February 13, 2015.
Under the terms of the Global Credit Facility, the Fund shall, in addition to interest charged on any borrowings made by the Fund and other costs incurred by the Fund, pay its share of fees and expenses incurred in connection with the implementation and maintenance of the Global Credit Facility, based upon its relative share of the aggregate net assets of all of the Borrowers, including an annual commitment fee of 0.07% based upon the unused portion of the Global Credit Facility. These fees are reflected in other expenses on the Statement of Operations. During the year ended December 31, 2013, the Fund did not use the Global Credit Facility.
10. FAIR VALUE MEASUREMENTS
The Fund follows a fair value hierarchy that distinguishes between market data obtained from independent sources (observable inputs) and the Fund’s own market assumptions (unobservable inputs). These inputs are used in determining the value of the Fund’s financial instruments and are summarized in the following fair value hierarchy:
| | • | | Level 1 – quoted prices in active markets for identical financial instruments |
| | • | | Level 2 – other significant observable inputs (including quoted prices for similar financial instruments, interest rates, prepayment speed, credit risk, etc.) |
| | • | | Level 3 – significant unobservable inputs (including the Fund’s own assumptions in determining the fair value of financial instruments) |
The input levels are not necessarily an indication of the risk or liquidity associated with financial instruments at that level.
For movements between the levels within the fair value hierarchy, the Fund has adopted a policy of recognizing the transfers as of the date of the underlying event which caused the movement.
FH-33
Franklin Templeton Variable Insurance Products Trust
Notes to Financial Statements (continued)
Franklin High Income Securities Fund
10. FAIR VALUE MEASUREMENTS (continued)
A summary of inputs used as of December 31, 2013, in valuing the Fund’s assets and liabilities carried at fair value, is as follows:
| | | | | | | | | | | | | | | | |
| | | Level 1 | | | Level 2 | | | Level 3 | | | Total | |
| | | | |
Assets: | | | | | | | | | | | | | | | | |
Investments in Securities: | | | | | | | | | | | | | | | | |
Equity Investments:a | | | | | | | | | | | | | | | | |
Materials | | $ | — | | | $ | 900,000 | | | $ | — | | | $ | 900,000 | |
Transportation | | | — | | | | 682,102 | | | | — | | | | 682,102 | |
All Other Equity Investmentsb | | | 823,592 | | | | — | | | | — | | | | 823,592 | |
Corporate Bonds | | | — | | | | 334,716,428 | | | | 191 | | | | 334,716,619 | |
Senior Floating Rate Interests | | | — | | | | 5,737,505 | | | | — | | | | 5,737,505 | |
Litigation Trust | | | — | | | | — | | | | — | c | | | — | |
Short Term Investments | | | — | | | | 10,915,352 | | | | — | | | | 10,915,352 | |
| | | | |
Total Investments in Securities | | $ | 823,592 | | | $ | 352,951,387 | | | $ | 191 | | | $ | 353,775,170 | |
| | | | |
Liabilities: | | | | | | | | | | | | | | | | |
Forward Exchange Contracts | | | — | | | | 2,567 | | | | — | | | | 2,567 | |
aIncludes common, preferred, and convertible preferred stocks as well as other equity investments.
bFor detailed categories, see the accompanying Statement of Investments.
cIncludes securities determined to have no value at December 31, 2013.
A reconciliation of assets in which Level 3 inputs are used in determining fair value is presented when there are significant Level 3 investments at the end of the year.
11. NEW ACCOUNTING PRONOUNCEMENTS
In June 2013, the Financial Accounting Standards Board issued Accounting Standards Update (ASU) No. 2013-08, Investment Companies (Topic 946): Amendments to the Scope, Measurement, and Disclosure Requirements. The ASU modifies the criteria used in defining an investment company under U.S. Generally Accepted Accounting Principles and also sets forth certain measurement and disclosure requirements. Under the ASU, an entity that is registered under the 1940 Act automatically qualifies as an investment company. The ASU is effective for interim and annual reporting periods beginning after December 15, 2013. Management has reviewed the requirements and believes the adoption of this ASU will not have a material impact on the financial statements.
12. SUBSEQUENT EVENTS
The Fund has evaluated subsequent events through the issuance of the financial statements and determined that no events have occurred that require disclosure other than those already disclosed in the financial statements.
| | | | |
ABBREVIATIONS | | | | |
Counterparty | | Currency | | Selected Portfolio |
| | | | |
DBAB - Deutsche Bank AG | | EUR - Euro | | FRN - Floating Rate Note |
| | | | PIK - Payment-In-Kind |
FH-34
Franklin Templeton Variable Insurance Products Trust
Franklin High Income Securities Fund
Report of Independent Registered Public Accounting Firm
To the Board of Trustees and Shareholders of
Franklin Templeton Variable Insurance Products Trust
In our opinion, the accompanying statement of assets and liabilities, including the statement of investments, and the related statements of operations and of changes in net assets and the financial highlights present fairly, in all material respects, the financial position of Franklin High Income Securities Fund (the “Fund”) at December 31, 2013, the results of its operations for the year then ended, the changes in its net assets for each of the two years in the period then ended and the financial highlights for each of the five years in the period then ended, in conformity with accounting principles generally accepted in the United States of America. These financial statements and financial highlights (hereafter referred to as “financial statements”) are the responsibility of the Fund’s management. Our responsibility is to express an opinion on these financial statements based on our audits. We conducted our audits of these financial statements in accordance with the standards of the Public Company Accounting Oversight Board (United States). Those standards require that we plan and perform the audit to obtain reasonable assurance about whether the financial statements are free of material misstatement. An audit includes examining, on a test basis, evidence supporting the amounts and disclosures in the financial statements, assessing the accounting principles used and significant estimates made by management, and evaluating the overall financial statement presentation. We believe that our audits, which included confirmation of securities at December 31, 2013 by correspondence with the custodian and brokers, provide a reasonable basis for our opinion.
PricewaterhouseCoopers LLP
San Francisco, California
February 14, 2014
FH-35
FRANKLIN INCOME SECURITIES FUND
This annual report for Franklin Income Securities Fund covers the fiscal year ended December 31, 2013.
Performance Summary as of 12/31/13
Average annual total return of Class 4 shares* represents the average annual change in value, assuming reinvestment of dividends and capital gains. Average returns smooth out variations in returns, which can be significant; they are not the same as year-by-year results.
Periods ended 12/31/13
| | | | | | | | | | | | |
| | | 1-Year | | | 5-Year | | | 10-Year | |
Average Annual Total Return | | | +13.85% | | | | +14.84% | | | | +7.24% | |
*For the period beginning 2/29/08, Class 4 performance reflects a 12b-1 fee expense of 0.35% per year, which affects future performance. Class 4 performance prior to 2/29/08 reflects historical Class 1 performance, which does not have a 12b-1 fee expense. Since 2/29/08 (effective date), the average annual total return of Class 4 shares was +6.77%.
Total Return Index Comparison
for a Hypothetical $10,000 Investment (1/1/04–12/31/13)
The graph below shows the change in value of a hypothetical $10,000 investment in the Fund over the indicated period and includes reinvestment of any income or distributions. The Fund’s performance* is compared to the performance of the Standard & Poor’s® 500 Index (S&P 500®) and the Barclays U.S. Aggregate Index. One cannot invest directly in an index, and an index is not representative of the Fund’s portfolio. Please see Important Notes to Performance Information preceding the Fund Summaries.
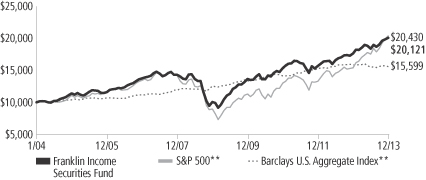
**Source: © 2014 Morningstar. Please see Index Descriptions following the Fund Summaries.
Franklin Income Securities Fund – Class 4
Performance reflects the Fund’s Class 4 operating expenses, but does not include any contract fees, expenses or sales charges. If they had been included, performance would be lower. These charges and deductions, particularly for variable life policies, can have a significant effect on contract values and insurance benefits. See the contract prospectus for a complete description of these expenses, including sales charges.
Performance data represent past performance, which does not guarantee future results. Investment return and principal value will fluctuate, and you may have a gain or loss when you sell your shares.
Current performance may differ from figures shown.
FI-1
Fund Goal and Main Investments: Franklin Income Securities Fund seeks to maximize income while maintaining prospects for capital appreciation. Under normal market conditions, the Fund invests in both equity and debt securities.
Performance Overview
You can find the Fund’s one-year total return in the Performance Summary. For comparison, the Fund’s equity benchmark, the S&P 500, posted a +32.39% total return, and its fixed income benchmark, the Barclays U.S. Aggregate Index, had a -2.02% total return for the same period.1
Economic and Market Overview
The U.S. economy recovered during the year ended December 31, 2013, especially in the second half. Improved business investment, net exports, and state and local government spending mitigated negative effects of federal budget cuts. Third-quarter U.S. gross domestic product growth was the highest since the end of 2011, underpinned by consumer spending and rising inventories. Historically low mortgage rates and positive sentiment aided the housing market, evidenced by solid new and existing home sales, rising home prices, low inventories and multi-year lows in new foreclosures. Manufacturing expanded in 2013, and the unemployment rate declined to 6.7% in December from 7.8% a year earlier.2 Inflation remained below the Federal Reserve Board’s (Fed’s) 2.0% target.
In January, Washington averted automatic federal budget cuts and income tax increases, but automatic budget cuts started in March after Congress could not agree on expenditure reductions. Chairman Bernanke indicated in May that the Fed might reduce monthly asset purchases, assuming ongoing U.S. recovery but stated in September that reductions were postponed pending stronger economic growth. A U.S. budget impasse that shut down non-essential government services in October ended after Congress funded the government until early 2014. In December, Congress passed a two-year budget deal to ease automatic spending cuts in 2014 and avoid future government shutdowns, and the Fed announced it would reduce monthly bond purchases by $10 billion beginning in January 2014. The Fed reaffirmed supporting low
1. Source: © 2014 Morningstar. One cannot invest directly in an index, and an index is not representative of the Fund’s portfolio. Please see Index Descriptions following the Fund Summaries.
2. Source: Bureau of Labor Statistics.
Fund Risks: All investments involve risks, including possible loss of principal. The Fund’s share price and yield will be affected by interest rate movements. Bond prices generally move in the opposite direction of interest rates. Thus, as prices of bonds in the Fund adjust to a rise in interest rates, the Fund’s share price may decline. Changes in the financial strength of a bond issuer or in a bond’s credit rating may affect its value. Investments in lower rated, higher yielding instruments include higher risk of default and loss of principal. These securities carry a greater degree of credit risk relative to investment-grade securities. Stock prices fluctuate, sometimes rapidly and dramatically, due to factors affecting individual companies, particular industries or sectors, or general market conditions. The Fund is actively managed but there is no guarantee that the manager’s investment decisions will produce the desired results. The Fund’s prospectus also includes a description of the main investment risks.
FI-2
interest rates as long as the unemployment rate exceeded 6.5% and inflation expectations remained low.
Rising corporate profits and generally favorable economic data encouraged investors, helping mitigate sell-offs in reaction to Fed statements and Washington’s fiscal negotiations. U.S. stocks generated strong 12-month returns as the S&P 500 and Dow Jones Industrial Average reached all-time highs.3
Although the Fed’s asset purchase program continued to put downward pressure on long-term interest rates, investor concerns about the eventual reduction of asset purchases pushed the 10-year U.S. Treasury note yield to 3.04% at period-end from 1.78% on December 31, 2012. Investors also anticipated higher interest rates and pulled back from the fixed income markets overall. For the year under review, most fixed income markets declined in value.
Investment Strategy
We search for undervalued or out-of-favor securities we believe offer opportunities for income today and growth tomorrow. We generally perform independent analysis of the debt securities being considered for the Fund’s portfolio, rather than relying principally on ratings assigned by rating agencies. In analyzing debt and equity securities, we consider a variety of factors, including: a security’s relative value based on such factors as anticipated cash flow, interest or dividend coverage, asset coverage, and earnings prospects; the experience and strength of a company’s management; a company’s sensitivity to changes in interest rates and business conditions; a company’s debt maturity schedules and borrowing requirements; and a company’s changing financial condition and market recognition of the change.
Manager’s Discussion
During the fiscal year, the Fund meaningfully increased its equity securities weighting. This shift was driven by significant appreciation of underlying positions and reallocation of assets toward equities, given our view of attractive relative value as we sought current income while maintaining prospects for capital appreciation. Our largest equity allocations were in dividend paying common stocks followed by convertible securities.
Fixed income assets declined during the period. The Fund’s fixed income assets remained positioned largely in high yield corporate bonds,
3. Please see Index descriptions following the Fund Summaries.
Portfolio Breakdown
Franklin Income Securities Fund
12/31/13
| | | | |
| | | % of Total
Net Assets | |
| Equity* | | | 60.0% | |
| Utilities | | | 12.7% | |
| Energy | | | 11.5% | |
| Materials | | | 9.6% | |
| Financials | | | 9.1% | |
| Health Care | | | 6.1% | |
| Industrials | | | 3.6% | |
| Information Technology | | | 3.1% | |
| Other | | | 4.3% | |
| Fixed Income | | | 35.7% | |
| Energy | | | 8.2% | |
| Consumer Discretionary | | | 6.6% | |
| Information Technology | | | 5.5% | |
| Materials | | | 3.4% | |
| Telecommunication Services | | | 3.3% | |
| Financials | | | 2.5% | |
| Other | | | 6.2% | |
| Short-Term Investments & Other Net Assets | | | 4.3% | |
*Includes convertible bonds.
FI-3
which performed well relative to other fixed income securities as higher coupons and continued strong credit trends helped mitigate the headwinds associated with rising long-term interest rates.
Most equity and fixed income sectors contributed positive returns during the year. Leading equity sectors included financials, energy, health care and utilities. Among fixed income investments, technology, communications and energy positions notably benefited performance.4
Within our equity investments, financials positions including Wells Fargo and JPMorgan Chase advanced partly because of favorable credit conditions and optimism about loan growth. Health care companies Merck & Co., Roche Holding and Johnson & Johnson benefited from strong cash flow that helped grow dividends and finance share buybacks. Leading individual contributors included Dow Chemical and LyondellBasell Industries in the materials sector. The companies made gains amid improved prospects for economic growth and better margin trends attributed to a favorable feedstock cost outlook driven by low natural gas prices. Notable individual detractors included metals and mining companies Barrick Gold,5 Newmont Mining and GoldCorp, which were hurt by falling commodity prices and a slowing growth outlook for many emerging market economies.
Leading fixed income contributors, including First Data and Freescale Semiconductor in technology and CC Media Holdings6 in communications, benefited from accommodative capital markets that enabled significant refinancing of existing debt maturities. Record high yield bond issuance and favorable credit spreads drove outperformance relative to other fixed income securities. Texas Competitive Electric Holdings (TCEH) was a notable fixed income detractor. TCEH struggled with a highly leveraged balance sheet amid weak power market fundamentals and low natural gas prices and was sold by period-end.
Although the Fund was more heavily weighted toward equities, the rise in long-term interest rates and underperformance of several fixed income sectors allowed us to purchase some corporate bonds. We focused on higher yields and segments with lowered prices and discounts to par value we found attractive.
4. Technology fixed income holdings are in information technology in the SOI. Communications fixed income holdings are part of consumer discretionary and telecommunication services in the SOI.
5. Held in an equity-linked security.
6. CC Media Holdings comprises Clear Channel Communications, Inc. and Clear Channel Worldwide Holdings, Inc. in the SOI.
Top Five Equity Holdings*
Franklin Income Securities Fund
12/31/13
| | | | |
Company
Sector/Industry | | % of Total
Net Assets | |
| Wells Fargo & Co. | | | 2.6% | |
| Financials | | | | |
| Bank of America Corp. | | | 2.2% | |
| Financials | | | | |
| Merck & Co. Inc. | | | 2.1% | |
| Health Care | | | | |
| The Dow Chemical Co. | | | 2.0% | |
| Materials | | | | |
| Royal Dutch Shell PLC, A, ADR (U.K.) | | | 1.9% | |
| Energy | | | | |
Top Five Fixed Income and Senior Floating Rate Interests Holdings*
Franklin Income Securities Fund
12/31/13
| | | | |
Issuer
Sector/Industry | | % of Total
Net Assets | |
| First Data Corp. | | | 2.8% | |
| Information Technology | | | | |
| Clear Channel Communications Inc. | | | 1.6% | |
| Consumer Discretionary | | | | |
| Freescale Semiconductor Inc. | | | 1.6% | |
| Information Technology | | | | |
| JPMorgan Chase & Co. | | | 1.3% | |
| Financials | | | | |
| Sprint Nextel Corp. | | | 1.2% | |
| Telecommunication Services | | | | |
*Does not include convertible bonds.
The dollar value, number of shares or principal amount, and names of all portfolio holdings are listed in the Fund’s Statement of Investments (SOI).
FI-4
Thank you for your participation in Franklin Income Securities Fund. We look forward to serving your future investment needs.
The foregoing information reflects our analysis, opinions and portfolio holdings as of December 31, 2013, the end of the reporting period. The way we implement our main investment strategies and the resulting portfolio holdings may change depending on factors such as market and economic conditions. These opinions may not be relied upon as investment advice or an offer for a particular security. The information is not a complete analysis of every aspect of any market, country, industry, security or the Fund. Statements of fact are from sources considered reliable, but the investment manager makes no representation or warranty as to their completeness or accuracy. Although historical performance is no guarantee of future results, these insights may help you understand our investment management philosophy.
FI-5
Fund Expenses
As an investor in a variable insurance contract (Contract) that indirectly provides for investment in an underlying mutual fund, you can incur transaction and/or ongoing expenses at both the Fund level and the Contract level.
| • | | Transaction expenses can include sales charges (loads) on purchases, redemption fees, surrender fees, transfer fees and premium taxes. |
| • | | Ongoing expenses can include management fees, distribution and service (12b-1) fees, contract fees, annual maintenance fees, mortality and expense risk fees and other fees and expenses. All mutual funds and Contracts have some types of ongoing expenses. |
The expenses shown in the table are meant to highlight ongoing expenses at the Fund level only and do not include ongoing expenses at the Contract level, or transaction expenses at either the Fund or Contract level. While the Fund does not have transaction expenses, if the transaction and ongoing expenses at the Contract level were included, the expenses shown would be higher. You should consult your Contract prospectus or disclosure document for more information.
The table shows Fund-level ongoing expenses and can help you understand these expenses and compare them with those of other mutual funds offered through the Contract. The table assumes a $1,000 investment held for the six months indicated. Please refer to the Fund prospectus for additional information on operating expenses.
Actual Fund Expenses
The first line (Actual) of the table provides actual account values and expenses. The “Ending Account Value” is derived from the Fund’s actual return, which includes the effect of ongoing Fund expenses, but does not include the effect of ongoing Contract expenses.
You can estimate the Fund-level expenses you incurred during the period by following these steps. Of course, your account value and expenses will differ from those in this illustration:
| 1. | Divide your account value by $1,000. |
If an account had an $8,600 value, then $8,600 ÷ $1,000 = 8.6.
| 2. | Multiply the result by the number under the heading “Fund-Level Expenses Incurred During Period.” |
If Fund-Level Expenses Incurred During Period were $7.50, then 8.6 x $7.50 = $64.50.
In this illustration, the estimated expenses incurred this period at the Fund level are $64.50.
Franklin Income Securities Fund – Class 4
FI-6
Hypothetical Example for Comparison with Other Mutual Funds
Information in the second line (Hypothetical) of the table can help you compare ongoing expenses of the Fund with those of other mutual funds offered through the Contract. This information may not be used to estimate the actual ending account balance or expenses you incurred during the period. The hypothetical “Ending Account Value” is based on the Fund’s actual expense ratio and an assumed 5% annual rate of return before expenses, which does not represent the Fund’s actual return. The figure under the heading “Fund-Level Expenses Incurred During Period” shows the hypothetical expenses your account would have incurred under this scenario. You can compare this figure with the 5% hypothetical examples that appear in shareholder reports of other funds offered through a Contract.
| | | | | | | | | | | | |
| Class 4 | | Beginning
Account Value 7/1/13 | | | Ending
Account
Value 12/31/13 | | | Fund-Level
Expenses Incurred
During Period*
7/1/13–12/31/13 | |
Actual | | $ | 1,000 | | | $ | 1,092.90 | | | $ | 4.33 | |
Hypothetical (5% return before expenses) | | $ | 1,000 | | | $ | 1,021.07 | | | $ | 4.18 | |
*Expenses are calculated using the most recent six-month annualized expense ratio for the Fund’s Class 4 shares (0.82%), which does not include any ongoing expenses of the Contract for which the Fund is an investment option, multiplied by the average account value over the period, multiplied by 184/365 to reflect the one-half year period.
FI-7
SUPPLEMENT DATED FEBRUARY 1, 2014
TOTHE PROSPECTUSES DATED MAY 1, 2013
OF
FRANKLIN INCOME SECURITIES FUND
(A series of Franklin Templeton Variable Insurance Products Trust)
The prospectus is amended as follows:
I. The “Fund Summaries – Portfolio Managers” section on page FI-S5 is revised to read as follows:
Investment Manager
Franklin Advisers, Inc. (Advisers)
Portfolio Managers
EDWARD D. PERKS, CFA Executive Vice President of Advisers and portfolio manager of the Fund since 2002.
MATTHEW QUINLAN Portfolio Manager of Advisers and portfolio manager of the Fund since 2012.
ALEX W. PETERS, CFA Vice President of Advisers and portfolio manager of the Fund since 2012.
II. The “Fund Details – Management” section disclosure concerning the portfolio management team beginning on page FI-D9 is revised to read as follows:
Franklin Advisers, Inc. (Advisers), One Franklin Parkway, San Mateo, California 94403-1906, is the Fund’s investment manager.
The Fund is managed by a team of dedicated professionals focused on investments in debt and equity securities. The portfolio managers of the team are as follows:
| | |
EDWARD D. PERKS, CFA Executive Vice President of Advisers | | Mr. Perks has been the lead portfolio manager of the Fund since 2002. He has primary responsibility for the investments of the Fund. He has final authority over all aspects of the Fund’s investment portfolio, including but not limited to, purchases and sales of individual securities, portfolio risk assessment, and the management of daily cash balances in accordance with anticipated investment management requirements. The degree to which he may perform these functions, and the nature of these functions, may change from time to time. He joined Franklin Templeton Investments in 1992. |
F1-8
| | |
MATTHEW QUINLAN Portfolio Manager of Advisers | | Mr. Quinlan has been a portfolio manager of the Fund since 2012, providing research and advice on the purchases and sales of individual securities, and portfolio risk assessment. He joined Franklin Templeton Investments in 2005. |
| |
ALEX W. PETERS, CFA Vice President of Advisers | | Mr. Peters has been a portfolio manager of the Fund since 2012, providing research and advice on the purchases and sales of individual securities, and portfolio risk assessment. He joined Franklin Templeton Investments in 1992. |
CFA® and Chartered Financial Analyst® are trademarks owned by CFA Institute.
Please keep this supplement for future reference.
F1-9
FI-10
SUPPLEMENT DATED NOVEMBER 18, 2013
TOTHE STATEMENT OF ADDITIONAL INFORMATION
DATED MAY 1, 2013
OF
FRANKLIN TEMPLETON VARIABLE INSURANCE PRODUCTS TRUST
The Statement of Additional Information is amended as follows:
I. The section on page five for Franklin Income Securities Fund under the heading “The Funds – Goals, Additional Strategies and Risks” is amended to reflect that the Fund may sell protection using credit default swaps.
II. In the section entitled “Derivative Instruments,” the text under the headings “Swap Agreements,” “Credit Default Swaps.” “Risks of swaps generally,” “Risks of uncleared swaps,” “Risks of cleared swaps” and “Risks of potential regulation of swaps and other derivatives” is replaced with the following:
Swaps. Generally, swap agreements are contracts between the Fund and another party (the swap counterparty) involving the exchange of payments on specified terms over periods ranging from a few days to multiple years. A swap agreement may be negotiated bilaterally and traded OTC between the two parties (for an uncleared swap) or, in some instances, must be transacted through an FCM and cleared through a clearinghouse that serves as a central counterparty (for a cleared swap). In a basic swap transaction, the Fund agrees with the swap counterparty to exchange the returns (or differentials in rates of return) and/or cash flows earned or realized on a particular “notional amount” or value of predetermined underlying reference instruments. The notional amount is the set dollar or other value selected by the parties to use as the basis on which to calculate the obligations that the parties to a swap agreement have agreed to exchange. The parties typically do not actually exchange the notional amount. Instead they agree to exchange the returns that would be earned or realized if the notional amount were invested in given investments or at given interest rates. Examples of returns that may be exchanged in a swap agreement are those of a particular security, a particular fixed or variable interest rate, a particular non-U.S. currency, or a “basket” of securities representing a particular index. Swaps can also be based on credit and other events.
The Fund will generally enter into swap agreements on a net basis, which means that the two payment streams that are to be made by the Fund and its counterparty with respect to a particular swap agreement are netted out, with the Fund receiving or paying, as the case may be, only the net difference in the two payments. The Fund’s obligations (or rights) under a swap agreement that is entered into on a net basis will generally be the net amount to be paid or received under the agreement based on the relative values of the obligations of each party upon termination of the agreement or at set valuation dates. The Fund will accrue its obligations under a swap agreement daily (offset by any amounts the counterparty owes the
Fund). If the swap agreement does not provide for that type of netting, the full amount of the Fund’s obligations will be accrued on a daily basis.
New swaps regulation. The Dodd-Frank Wall Street Reform and Consumer Protection Act of 2010 (the Dodd-Frank Act) and related regulatory developments have imposed comprehensive new regulatory requirements on swaps and swap market participants. The new regulatory framework includes: (1) registration and regulation of swap dealers and major swap participants; (2) requiring central clearing and execution of standardized swaps; (3) imposing margin requirements in swap transactions; (4) regulating and monitoring swap transactions through position limits and large trader reporting requirements; and (5) imposing record keeping and centralized and public reporting requirements, on an anonymous basis, for most swaps. The CFTC is responsible for the regulation of most swaps, and has completed most of its rules implementing the Dodd-Frank Act swap regulations. The SEC has jurisdiction over a small segment of the market referred to as “security-based swaps,” which includes swaps on single securities or credits, or narrow-based indices of securities or credits, but has not yet completed its rulemaking.
Uncleared swaps. In an uncleared swap, the swap counterparty is typically a brokerage firm, bank or other financial institution. The Fund customarily enters into uncleared swaps based on the standard terms and conditions of an International Swaps and Derivatives Association (ISDA) Master Agreement. ISDA is a voluntary industry association of participants in the over-the-counter derivatives markets that has developed standardized contracts used by such participants that have agreed to be bound by such standardized contracts.
In the event that one party to a swap transaction defaults and the transaction is terminated prior to its scheduled termination date, one of the parties may be required to make an early termination payment to the other. An early termination payment may be payable by either the defaulting or non-defaulting party, depending upon which of them is “in-the-money” with respect to the swap at the time of its termination. Early termination payments may be calculated in various ways, but are intended to approximate the amount the “in-the-money” party would have to pay to replace the swap as of the date of its termination.
During the term of an uncleared swap, the Fund is usually required to pledge to the swap counterparty, from time to time, an amount of cash and/or other assets equal to the total net amount (if any) that would be payable by the Fund to the counterparty if the swap were terminated on the date in question, including any early termination payments. Periodically, changes in the amount pledged are made to recognize changes in value of the contract resulting from, among other things, interest on the notional value of the contract, market value changes in the underlying investment, and/or dividends paid by the issuer of the underlying instrument. Likewise, the counterparty may be required to pledge cash or other assets to cover its obligations to the Fund. However, the amount pledged may not always be equal to or more than the amount due to the other party. Therefore, if a counterparty defaults in its obligations
FI-11
to the Fund, the amount pledged by the counterparty and available to the Fund may not be sufficient to cover all the amounts due to the Fund and the Fund may sustain a loss. If the Fund desires to terminate an uncleared swap prior to its expiration date, the Fund generally will have to negotiate with its swap counterparty.
Cleared swaps. Certain standardized swaps are subject to mandatory central clearing. The Dodd-Frank Act and implementing rules will ultimately require the clearing and exchange-trading of many swaps. Mandatory exchange-trading and clearing will occur on a phased-in basis based on the type of market participant and CFTC approval of contracts for central clearing. To date, the CFTC has designated only certain of the most common types of credit default index swaps and interest rate swaps as subject to mandatory clearing, but it is expected that additional categories of swaps will in the future be designated as subject to mandatory clearing. Central clearing is intended to reduce counterparty credit risk and increase liquidity, but central clearing does not eliminate these risks and may involve additional risks not involved with uncleared swaps. For more information, see “Risks of cleared swaps” below.
In a cleared swap, the Fund’s ultimate counterparty is a central clearinghouse rather than a brokerage firm, bank or other financial institution. The Fund initially will enter into cleared swaps through an executing broker. Such transactions will then be submitted for clearing and, if cleared, will be held at regulated FCMs that are members of the clearinghouse that serves as the central counterparty.
When the Fund enters into a cleared swap, it must deliver to the central counterparty (via the FCM) an amount referred to as “initial margin.” Initial margin requirements are determined by the central counterparty, but an FCM may require additional initial margin above the amount required by the central counterparty. During the term of the swap agreement, a “variation margin” amount may also be required to be paid by the Fund or may be received by the Fund in accordance with margin controls set for such accounts, depending upon changes in the price of the underlying reference instrument subject to the swap agreement. At the conclusion of the term of the swap agreement, if the Fund has a loss equal to or greater than the margin amount, the margin amount is paid to the FCM along with any loss in excess of the margin amount. If the Fund has a loss of less than the margin amount, the excess margin is returned to the Fund. If the Fund has a gain, the full margin amount and the amount of the gain is paid to the Fund.
Recently adopted CFTC rules will, when implemented, require the trading and execution of certain cleared swaps on public trading facilities, which will occur for each category of swaps subject to mandatory clearing once one or more trading facilities become accredited and make such category of swaps available to trade. Moving trading to an exchange-type system may increase market transparency and liquidity but may require the Fund to incur increased expenses to access the same types of swaps that it has used in the past. If the Fund desires to terminate a cleared swap prior to its expiration date, the Fund may do so by entering into a
FI-12
FI-13
second offsetting or close out transaction which is usually accomplished by buying or selling, as the case may be, an identical, offsetting swap. This transaction, which is effected through a member of an exchange, cancels the payment obligations under the swap.
Credit default swaps. The “buyer” of protection in a credit default swap agreement is obligated to pay the “seller” a periodic stream of payments over the term of the agreement in return for a payment by the “seller” that is contingent upon the occurrence of a credit event with respect to a specific underlying reference debt obligation (whether as a single debt instrument or as part of an index of debt instruments). The contingent payment by the seller generally is the face amount of the debt obligation, in return for the buyer’s obligation to make periodic cash payments and deliver in physical form the reference debt obligation or a cash payment equal to the then-current market value of that debt obligation at the time of the credit event. If no credit event occurs, the seller would receive a fixed rate of income throughout the term of the contract, while the buyer would lose the amount of its payments and recover nothing. The buyer is also subject to the risk that the seller will not satisfy its contingent payment obligation, if and when due.
Purchasing protection through a credit default swap may be used to attempt to hedge against a decline in the value of debt security or securities due to a credit event. The seller of protection under a credit default swap receives periodic payments from the buyer but is exposed to the risk that the value of the reference debt obligation declines due to a credit event and that it will have to pay the face amount of the reference obligation to the buyer. Selling protection under a credit default swap may also permit the seller to gain exposure that is similar to owning the reference debt obligation directly. As the seller of protection, the Fund would effectively add leverage to its portfolio because, in addition to its total assets, the Fund would be subject to the risk that there would be a credit event and the Fund would have to make a substantial payment in the future.
Generally, a credit event means bankruptcy, failure to timely pay interest or principal, obligation acceleration or default, or repudiation or restructuring of the reference debt obligation. There may be disputes between the buyer and seller of a credit default swap agreement or within the swaps market as a whole as to whether or not a credit event has occurred or what the payout should be which could result in litigation. In some instances where there is a dispute in the credit default swap market, a regional Determinations Committee set up by ISDA may make an official binding determination regarding the existence of credit events with respect to the reference debt obligation of a credit default swap agreement or, in the case of a credit default swap on an index, with respect to a component of the index underlying the credit default swap agreement. In the case of a credit default swap on an index, the existence of a credit event is determined according to the index methodology, which may in turn refer to determinations made by ISDA’s Determinations Committees with respect to particular components of the index.
FI-14
ISDA’s Determination Committees are comprised principally of dealers in the OTC derivatives markets which may have a conflicting interest in the determination regarding the existence of a particular credit event. In addition, in the sovereign debt market, a credit default swap agreement may not provide the protection generally anticipated because the government issuer of the sovereign debt instruments may be able to restructure or renegotiate the debt in such a manner as to avoid triggering a credit event. Moreover, (1) sovereign debt obligations may not incorporate common, commercially acceptable provisions, such as collective action clauses, or (2) the negotiated restructuring of the sovereign debt may be deemed non-mandatory on all holders. As a result, the determination committee might then not be able to determine, or may be able to avoid having to determine, that a credit event under the credit default agreement has occurred.
For these and other reasons, the buyer of protection in a credit default swap agreement is subject to the risk that certain occurrences, such as particular restructuring events affecting the value of the underlying reference debt obligation, or the restructuring of sovereign debt, may not be deemed credit events under the credit default swap agreement. Therefore, if the credit default swap was purchased as a hedge or to take advantage of an anticipated increase in the value of credit protection for the underlying reference obligation, it may not provide any hedging benefit or otherwise increase in value as anticipated. Similarly, the seller of protection in a credit default swap agreement is subject to the risk that certain occurrences may be deemed to be credit events under the credit default swap agreement, even if these occurrences do not adversely impact the value or creditworthiness of the underlying reference debt obligation.
Risks of swaps generally. The use of swap transactions is a highly specialized activity, which involves investment techniques and risks different from those associated with ordinary portfolio securities transactions. Whether the Fund will be successful in using swap agreements to achieve its investment goal depends on the ability of the investment manager correctly to predict which types of investments are likely to produce greater returns. If the investment manager, in using swap agreements, is incorrect in its forecasts of market values, interest rates, inflation, currency exchange rates or other applicable factors, the investment performance of the Fund will be less than its performance would have been if it had not used the swap agreements.
The risk of loss to the Fund for swap transactions that are entered into on a net basis depends on which party is obligated to pay the net amount to the other party. If the counterparty is obligated to pay the net amount to the Fund, the risk of loss to the Fund is loss of the entire amount that the Fund is entitled to receive. If the Fund is obligated to pay the net amount, the Fund’s risk of loss is generally limited to that net amount. If the swap agreement involves the exchange of the entire principal value of a security, the entire principal value of that security is subject to the risk that the other party to the swap will default on its contractual delivery
FI-15
obligations. In addition, the Fund’s risk of loss also includes any margin at risk in the event of default by the counterparty (in an uncleared swap) or the central counterparty or FCM (in a cleared swap), plus any transaction costs.
Because bilateral swap agreements are structured as two-party contracts and may have terms of greater than seven days, these swaps may be considered to be illiquid and, therefore, subject to the Fund’s limitation on investments in illiquid securities. If a swap transaction is particularly large or if the relevant market is illiquid, the Fund may not be able to establish or liquidate a position at an advantageous time or price, which may result in significant losses. Participants in the swap markets are not required to make continuous markets in the swap contracts they trade. Participants could refuse to quote prices for swap contracts or quote prices with an unusually wide spread between the price at which they are prepared to buy and the price at which they are prepared to sell. Some swap agreements entail complex terms and may require a greater degree of subjectivity in their valuation. However, the swap markets have grown substantially in recent years, with a large number of financial institutions acting both as principals and agents, utilizing standardized swap documentation. As a result, the swap markets have become increasingly liquid. In addition, central clearing and the trading of cleared swaps on public facilities are intended to increase liquidity. The Fund’s investment manager, under the supervision of the Board of Trustees, is responsible for determining and monitoring the liquidity of the Funds’ swap transactions.
Rules adopted under the Dodd-Frank Act require centralized reporting of detailed information about many swaps, whether cleared or uncleared. This information is available to regulators and also, to a more limited extent and on an anonymous basis, to the public. Reporting of swap data is intended to result in greater market transparency. This may be beneficial to funds that use swaps in their trading strategies. However, public reporting imposes additional recordkeeping burdens on these funds, and the safeguards established to protect anonymity are not yet tested and may not provide protection of trader identities as intended.
Certain Internal Revenue Service positions may limit the Fund’s ability to use swap agreements in a desired tax strategy. It is possible that developments in the swap markets and/or the laws relating to swap agreements, including potential government regulation, could adversely affect the Fund’s ability to benefit from using swap agreements, or could have adverse tax consequences. For more information about potentially changing regulation, see “Risks of potential regulation of swaps and other derivatives” below.
Risks of uncleared swaps. Uncleared swaps are not traded on exchanges. As a result, swap participants may not be as protected as participants on organized exchanges. Performance of a swap agreement is the responsibility only of the swap counterparty and not of any exchange or clearinghouse. As a result, the Fund is subject to the risk that a counterparty will be unable or will refuse to perform under such agreement, including because of the counterparty’s bankruptcy or insolvency. The Fund risks the loss of the accrued but unpaid amounts under a
FI-16
swap agreement, which could be substantial, in the event of a default, insolvency or bankruptcy by a swap counterparty. In such an event, the Fund will have contractual remedies pursuant to the swap agreements, but bankruptcy and insolvency laws could affect the Fund’s rights as a creditor. If the counterparty’s creditworthiness declines, the value of a swap agreement would likely decline, potentially resulting in losses. The Fund’s investment manager will only approve a swap agreement counterparty for the Fund if the investment manager deems the counterparty to be creditworthy under the Fund’s Counterparty Credit Review Standards, adopted and reviewed annually by the Fund’s board. However, in unusual or extreme market conditions, a counterparty’s creditworthiness and ability to perform may deteriorate rapidly, and the availability of suitable replacement counterparties may become limited.
Risks of cleared swaps. As noted above, under recent financial reforms, certain types of swaps are, and others eventually are expected to be, required to be cleared through a central counterparty, which may affect counterparty risk and other risks faced by the Fund.
Central clearing is designed to reduce counterparty credit risk and increase liquidity compared to bilateral swaps because central clearing interposes the central clearinghouse as the counterparty to each participant’s swap, but it does not eliminate those risks completely. There is also a risk of loss by the Fund of the initial and variation margin deposits in the event of bankruptcy of the FCM with which the Fund has an open position in a swap contract. The assets of the Fund may not be fully protected in the event of the bankruptcy of the FCM or central counterparty because the Fund might be limited to recovering only a pro rata share of all available funds and margin segregated on behalf of an FCM’s customers. If the FCM does not provide accurate reporting, the Fund is also subject to the risk that the FCM could use the Fund’s assets, which are held in an omnibus account with assets belonging to the FCM’s other customers, to satisfy its own financial obligations or the payment obligations of another customer to the central counterparty.
With cleared swaps, the Fund may not be able to obtain as favorable terms as it would be able to negotiate for a bilateral, uncleared swap. In addition, an FCM may unilaterally amend the terms of its agreement with the Fund, which may include the imposition of position limits or additional margin requirements with respect to the Fund’s investment in certain types of swaps. Central counterparties and FCMs generally can require termination of existing cleared swap transactions at any time, and can also require increases in margin above the margin that is required at the initiation of the swap agreement. Additionally, depending on a number of factors, the margin required under the rules of the clearinghouse and FCM may be in excess of the collateral required to be posted by the Fund to support its obligations under a similar uncleared swap. However, regulators are expected to adopt rules imposing certain margin requirements, including minimums, on uncleared swaps in the near future, which could change this comparison.
FI-17
Finally, the Fund is subject to the risk that, after entering into a cleared swap with an executing broker, no FCM or central counterparty is willing or able to clear the transaction. In such an event, the Fund may be required to break the trade and make an early termination payment to the executing broker.
Risks of potential regulation of swaps and other derivatives. The regulation of cleared and uncleared swaps, as well as other derivatives, is a rapidly changing area of law and is subject to modification by government and judicial action. In addition, the SEC, CFTC and the exchanges are authorized to take extraordinary actions in the event of a market emergency, including, for example, the implementation or reduction of speculative position limits, the implementation of higher margin requirements, the establishment of daily price limits and the suspension of trading.
It is not possible to predict fully the effects of current or future regulation. However, it is possible that developments in government regulation of various types of derivative instruments, such as speculative position limits on certain types of derivatives, or limits or restrictions on the counterparties with which the Funds engage in derivative transactions, may limit or prevent a Fund from using or limit a Fund’s use of these instruments effectively as a part of its investment strategy, and could adversely affect a Fund’s ability to achieve its investment goal(s). The investment manager will continue to monitor developments in the area, particularly to the extent regulatory changes affect the Fund’s ability to enter into desired swap agreements. New requirements, even if not directly applicable to the Fund, may increase the cost of a Fund’s investments and cost of doing business, which could adversely affect investors.
Please keep this supplement for future reference.
Franklin Templeton Variable Insurance Products Trust
Financial Highlights
Franklin Income Securities Fund
| | | | | | | | | | | | | | | | | | | | |
| | | Year Ended December 31, | |
| Class 1 | | 2013 | | | 2012 | | | 2011 | | | 2010 | | | 2009 | |
| | | | |
Per share operating performance | | | | | | | | | | | | | | | | | | | | |
(for a share outstanding throughout the year) | | | | | | | | | | | | | | | | | | | | |
Net asset value, beginning of year | | $ | 15.47 | | | $ | 14.68 | | | $ | 15.16 | | | $ | 14.43 | | | $ | 11.53 | |
| | | | |
Income from investment operationsa: | | | | | | | | | | | | | | | | | | | | |
Net investment incomeb | | | 0.81 | | | | 0.91 | | | | 0.96 | | | | 0.89 | | | | 0.91 | |
Net realized and unrealized gains (losses) | | | 1.31 | | | | 0.90 | | | | (0.54 | ) | | | 0.85 | | | | 3.08 | |
| | | | |
Total from investment operations | | | 2.12 | | | | 1.81 | | | | 0.42 | | | | 1.74 | | | | 3.99 | |
| | | | |
Less distributions from net investment income | | | (1.06 | ) | | | (1.02 | ) | | | (0.90 | ) | | | (1.01 | ) | | | (1.09 | ) |
| | | | |
Net asset value, end of year | | $ | 16.53 | | | $ | 15.47 | | | $ | 14.68 | | | $ | 15.16 | | | $ | 14.43 | |
| | | | |
| | | | | |
Total returnc | | | 14.18% | | | | 12.91% | | | | 2.71% | | | | 12.87% | | | | 35.88% | |
Ratios to average net assets | | | | | | | | | | | | | | | | | | | | |
Expenses | | | 0.47% | d | | | 0.47% | | | | 0.47% | d | | | 0.47% | d | | | 0.47% | d |
Net investment income | | | 5.07% | | | | 6.03% | | | | 6.35% | | | | 6.28% | | | | 7.23% | |
| | | | | |
Supplemental data | | | | | | | | | | | | | | | | | | | | |
Net assets, end of year (000’s) | | $ | 695,004 | | | $ | 584,391 | | | $ | 1,300,935 | | | $ | 1,449,028 | | | $ | 910,504 | |
Portfolio turnover rate | | | 21.71% | | | | 26.66% | e | | | 28.65% | | | | 41.65% | | | | 42.30% | |
aThe amount shown for a share outstanding throughout the period may not correlate with the Statement of Operations for the period due to the timing of sales and repurchases of the Fund shares in relation to income earned and/or fluctuating market value of the investments of the Fund.
bBased on average daily shares outstanding.
cTotal return does not include fees, charges or expenses imposed by the variable annuity and life insurance contracts for which the Franklin Templeton Variable Insurance Products Trust serves as an underlying investment vehicle.
dBenefit of expense reduction rounds to less than 0.01%.
eExcludes the value of portfolio securities delivered as a result of a redemption in-kind. See Note 10.
The accompanying notes are an integral part of these financial statements.
FI-18
Franklin Templeton Variable Insurance Products Trust
Financial Highlights (continued)
Franklin Income Securities Fund
| | | | | | | | | | | | | | | | | | | | |
| | | Year Ended December 31, | |
| Class 2 | | 2013 | | | 2012 | | | 2011 | | | 2010 | | | 2009 | |
| | | | |
Per share operating performance | | | | | | | | | | | | | | | | | | | | |
(for a share outstanding throughout the year) | | | | | | | | | | | | | | | | | | | | |
Net asset value, beginning of year | | $ | 15.07 | | | $ | 14.32 | | | $ | 14.82 | | | $ | 14.12 | | | $ | 11.30 | |
| | | | |
Income from investment operationsa: | | | | | | | | | | | | | | | | | | | | |
Net investment incomeb | | | 0.75 | | | | 0.85 | | | | 0.90 | | | | 0.86 | | | | 0.86 | |
Net realized and unrealized gains (losses) | | | 1.27 | | | | 0.88 | | | | (0.53 | ) | | | 0.82 | | | | 3.01 | |
| | | | |
Total from investment operations | | | 2.02 | | | | 1.73 | | | | 0.37 | | | | 1.68 | | | | 3.87 | |
| | | | |
Less distributions from net investment income | | | (1.02 | ) | | | (0.98 | ) | | | (0.87 | ) | | | (0.98 | ) | | | (1.05 | ) |
| | | | |
Net asset value, end of year | | $ | 16.07 | | | $ | 15.07 | | | $ | 14.32 | | | $ | 14.82 | | | $ | 14.12 | |
| | | | |
| | | | | |
Total returnc | | | 13.94% | | | | 12.65% | | | | 2.38% | | | | 12.67% | | | | 35.59% | |
Ratios to average net assets | | | | | | | | | | | | | | | | | | | | |
Expenses | | | 0.72% | d | | | 0.72% | | | | 0.72% | d | | | 0.72% | d | | | 0.72% | d |
Net investment income | | | 4.82% | | | | 5.78% | | | | 6.10% | | | | 6.03% | | | | 6.98% | |
| | | | | |
Supplemental data | | | | | | | | | | | | | | | | | | | | |
Net assets, end of year (000’s) | | $ | 6,188,045 | | | $ | 6,182,997 | | | $ | 5,915,637 | | | $ | 6,309,207 | | | $ | 6,114,898 | |
Portfolio turnover rate | | | 21.71% | | | | 26.66% | e | | | 28.65% | | | | 41.65% | | | | 42.30% | |
aThe amount shown for a share outstanding throughout the period may not correlate with the Statement of Operations for the period due to the timing of sales and repurchases of the Fund shares in relation to income earned and/or fluctuating market value of the investments of the Fund.
bBased on average daily shares outstanding.
cTotal return does not include fees, charges or expenses imposed by the variable annuity and life insurance contracts for which the Franklin Templeton Variable Insurance Products Trust serves as an underlying investment vehicle.
dBenefit of expense reduction rounds to less than 0.01%.
eExcludes the value of portfolio securities delivered as a result of a redemption in-kind. See Note 10.
The accompanying notes are an integral part of these financial statements.
FI-19
Franklin Templeton Variable Insurance Products Trust
Financial Highlights (continued)
Franklin Income Securities Fund
| | | | | | | | | | | | | | | | | | | | |
| | | Year Ended December 31, | |
| Class 4 | | 2013 | | | 2012 | | | 2011 | | | 2010 | | | 2009 | |
| | | | |
Per share operating performance | | | | | | | | | | | | | | | | | | | | |
(for a share outstanding throughout the year) | | | | | | | | | | | | | | | | | | | | |
Net asset value, beginning of year | | $ | 15.32 | | | $ | 14.54 | | | $ | 15.04 | | | $ | 14.33 | | | $ | 11.49 | |
| | | | |
Income from investment operationsa: | | | | | | | | | | | | | | | | | | | | |
Net investment incomeb | | | 0.75 | | | | 0.85 | | | | 0.90 | | | | 0.85 | | | | 0.86 | |
Net realized and unrealized gains (losses) | | | 1.30 | | | | 0.90 | | | | (0.54 | ) | | | 0.84 | | | | 3.06 | |
| | | | |
Total from investment operations | | | 2.05 | | | | 1.75 | | | | 0.36 | | | | 1.69 | | | | 3.92 | |
| | | | |
Less distributions from net investment income | | | (1.01 | ) | | | (0.97 | ) | | | (0.86 | ) | | | (0.98 | ) | | | (1.08 | ) |
| | | | |
Net asset value, end of year | | $ | 16.36 | | | $ | 15.32 | | | $ | 14.54 | | | $ | 15.04 | | | $ | 14.33 | |
| | | | |
| | | | | |
Total returnc | | | 13.85% | | | | 12.56% | | | | 2.29% | | | | 12.54% | | | | 35.37% | |
Ratios to average net assets | | | | | | | | | | | | | | | | | | | | |
Expenses | | | 0.82% | d | | | 0.82% | | | | 0.82% | d | | | 0.82% | d | | | 0.82% | d |
Net investment income | | | 4.72% | | | | 5.68% | | | | 6.00% | | | | 5.93% | | | | 6.88% | |
| | | | | |
Supplemental data | | | | | | | | | | | | | | | | | | | | |
Net assets, end of year (000’s) | | $ | 397,652 | | | $ | 436,405 | | | $ | 431,435 | | | $ | 415,541 | | | $ | 347,733 | |
Portfolio turnover rate | | | 21.71% | | | | 26.66% | e | | | 28.65% | | | | 41.65% | | | | 42.30% | |
aThe amount shown for a share outstanding throughout the period may not correlate with the Statement of Operations for the period due to the timing of sales and repurchases of the Fund shares in relation to income earned and/or fluctuating market value of the investments of the Fund.
bBased on average daily shares outstanding.
cTotal return does not include fees, charges or expenses imposed by the variable annuity and life insurance contracts for which the Franklin Templeton Variable Insurance Products Trust serves as an underlying investment vehicle.
dBenefit of expense reduction rounds to less than 0.01%.
eExcludes the value of portfolio securities delivered as a result of a redemption in-kind. See Note 10.
The accompanying notes are an integral part of these financial statements.
FI-20
Franklin Templeton Variable Insurance Products Trust
Statement of Investments, December 31, 2013
| | | | | | | | | | |
| Franklin Income Securities Fund | | Country | | Shares/
Warrants | | | Value | |
Common Stocks and Other Equity Interests 52.5% | | | | | | | | | | |
Consumer Discretionary 1.0% | | | | | | | | | | |
a,b Dex Media Inc. | | United States | | | 458,876 | | | $ | 3,111,179 | |
Ford Motor Co. | | United States | | | 1,000,000 | | | | 15,430,000 | |
General Motors Co. | | United States | | | 384,539 | | | | 15,716,109 | |
McDonald’s Corp. | | United States | | | 113,300 | | | | 10,993,499 | |
Target Corp. | | United States | | | 394,200 | | | | 24,941,034 | |
| | | | | | | | | | |
| | | | | | | | | 70,191,821 | |
| | | | | | | | | | |
Consumer Staples 1.3% | | | | | | | | | | |
The Coca-Cola Co. | | United States | | | 729,800 | | | | 30,148,038 | |
PepsiCo Inc. | | United States | | | 584,000 | | | | 48,436,960 | |
Safeway Inc. | | United States | | | 445,700 | | | | 14,516,449 | |
| | | | | | | | | | |
| | | | | | | | | 93,101,447 | |
| | | | | | | | | | |
Energy 9.8% | | | | | | | | | | |
BP PLC, ADR | | United Kingdom | | | 2,750,000 | | | | 133,677,500 | |
a Callon Petroleum Co. | | United States | | | 350,000 | | | | 2,285,500 | |
Canadian Oil Sands Ltd. | | Canada | | | 3,212,700 | | | | 60,433,786 | |
Chesapeake Energy Corp. | | United States | | | 581,500 | | | | 15,781,910 | |
Chevron Corp. | | United States | | | 561,000 | | | | 70,074,510 | |
Exxon Mobil Corp. | | United States | | | 884,850 | | | | 89,546,820 | |
a Halcon Resources Corp. | | United States | | | 34,489 | | | | 133,128 | |
Halliburton Co. | | United States | | | 1,151,700 | | | | 58,448,775 | |
Royal Dutch Shell PLC, A, ADR | | United Kingdom | | | 1,951,748 | | | | 139,101,080 | |
Schlumberger Ltd. | | United States | | | 446,600 | | | | 40,243,126 | |
Spectra Energy Corp. | | United States | | | 600,000 | | | | 21,372,000 | |
Total SA, B, ADR | | France | | | 732,900 | | | | 44,904,783 | |
Transocean Ltd. | | United States | | | 400,000 | | | | 19,768,000 | |
The Williams Cos. Inc. | | United States | | | 563,900 | | | | 21,749,623 | |
| | | | | | | | | | |
| | | | | | | | | 717,520,541 | |
| | | | | | | | | | |
Financials 6.0% | | | | | | | | | | |
Banco Santander SA | | Spain | | | 2,255,788 | | | | 20,187,053 | |
Bank of America Corp. | | United States | | | 4,909,800 | | | | 76,445,586 | |
Barclays PLC | | United Kingdom | | | 3,473,166 | | | | 15,637,555 | |
Commonwealth Bank of Australia | | Australia | | | 374,700 | | | | 26,022,229 | |
HSBC Holdings PLC | | United Kingdom | | | 4,341,457 | | | | 47,616,465 | |
JPMorgan Chase & Co. | | United States | | | 1,606,400 | | | | 93,942,272 | |
MetLife Inc. | | United States | | | 258,509 | | | | 13,938,805 | |
Wells Fargo & Co. | | United States | | | 2,863,100 | | | | 129,984,740 | |
Westfield Retail Trust | | Australia | | | 5,543,693 | | | | 14,697,276 | |
| | | | | | | | | | |
| | | | | | | | | 438,471,981 | |
| | | | | | | | | | |
Health Care 6.1% | | | | | | | | | | |
Eli Lilly & Co. | | United States | | | 434,800 | | | | 22,174,800 | |
Johnson & Johnson | | United States | | | 617,800 | | | | 56,584,302 | |
Merck & Co. Inc. | | United States | | | 3,023,200 | | | | 151,311,160 | |
Pfizer Inc. | | United States | | | 3,055,375 | | | | 93,586,136 | |
Roche Holding AG | | Switzerland | | | 257,719 | | | | 71,995,488 | |
Sanofi, ADR | | France | | | 868,292 | | | | 46,566,500 | |
| | | | | | | | | | |
| | | | | | | | | 442,218,386 | |
| | | | | | | | | | |
Industrials 3.4% | | | | | | | | | | |
a CEVA Holdings LLC | | United Kingdom | | | 13,012 | | | | 12,361,647 | |
Deere & Co. | | United States | | | 100,000 | | | | 9,133,000 | |
FI-21
Franklin Templeton Variable Insurance Products Trust
Statement of Investments, December 31, 2013 (continued)
| | | | | | | | | | |
| Franklin Income Securities Fund | | Country | | Shares/
Warrants | | | Value | |
Common Stocks and Other Equity Interests (continued) | | | | | | | | | | |
Industrials (continued) | | | | | | | | | | |
General Electric Co. | | United States | | | 4,341,500 | | | $ | 121,692,245 | |
Lockheed Martin Corp. | | United States | | | 253,200 | | | | 37,640,712 | |
Republic Services Inc. | | United States | | | 527,300 | | | | 17,506,360 | |
Waste Management Inc. | | United States | | | 1,028,200 | | | | 46,135,334 | |
| | | | | | | | | | |
| | | | | | | | | 244,469,298 | |
| | | | | | | | | | |
Information Technology 2.9% | | | | | | | | | | |
Apple Inc. | | United States | | | 50,000 | | | | 28,055,500 | |
Cisco Systems Inc. | | United States | | | 1,534,600 | | | | 34,451,770 | |
Intel Corp. | | United States | | | 3,679,300 | | | | 95,514,628 | |
QUALCOMM Inc. | | United States | | | 200,000 | | | | 14,850,000 | |
Texas Instruments Inc. | | United States | | | 924,800 | | | | 40,607,968 | |
| | | | | | | | | | |
| | | | | | | | | 213,479,866 | |
| | | | | | | | | | |
Materials 8.2% | | | | | | | | | | |
Agrium Inc. | | Canada | | | 650,000 | | | | 59,462,000 | |
AngloGold Ashanti Ltd., ADR | | South Africa | | | 199,655 | | | | 2,339,957 | |
BHP Billiton PLC | | United Kingdom | | | 2,566,292 | | | | 79,359,841 | |
The Dow Chemical Co. | | United States | | | 3,207,200 | | | | 142,399,680 | |
E. I. du Pont de Nemours and Co. | | United States | | | 1,047,500 | | | | 68,056,075 | |
Freeport-McMoRan Copper & Gold Inc., B | | United States | | | 500,000 | | | | 18,870,000 | |
Goldcorp Inc. | | Canada | | | 1,508,600 | | | | 32,691,362 | |
LyondellBasell Industries NV, A | | United States | | | 1,050,000 | | | | 84,294,000 | |
The Mosaic Co. | | United States | | | 200,000 | | | | 9,454,000 | |
Newmont Mining Corp. | | United States | | | 735,317 | | | | 16,934,350 | |
Rio Tinto PLC, ADR | | United Kingdom | | | 1,500,000 | | | | 84,645,000 | |
| | | | | | | | | | |
| | | | | | | | | 598,506,265 | |
| | | | | | | | | | |
Telecommunication Services 1.4% | | | | | | | | | | |
AT&T Inc. | | United States | | | 1,736,600 | | | | 61,058,856 | |
Telstra Corp. Ltd. | | Australia | | | 4,946,331 | | | | 23,180,548 | |
Vodafone Group PLC | | United Kingdom | | | 3,878,012 | | | | 15,224,008 | |
| | | | | | | | | | |
| | | | | | | | | 99,463,412 | |
| | | | | | | | | | |
Utilities 12.4% | | | | | | | | | | |
AGL Resources Inc. | | United States | | | 290,732 | | | | 13,731,272 | |
American Electric Power Co. Inc. | | United States | | | 1,300,000 | | | | 60,762,000 | |
Dominion Resources Inc. | | United States | | | 800,000 | | | | 51,752,000 | |
Duke Energy Corp. | | United States | | | 1,302,500 | | | | 89,885,525 | |
a,b Dynegy Inc. | | United States | | | 3,500,000 | | | | 75,320,000 | |
a,b Dynegy Inc., wts., 10/02/17 | | United States | | | 242,666 | | | | 330,026 | |
Entergy Corp. | | United States | | | 738,100 | | | | 46,699,587 | |
Exelon Corp. | | United States | | | 2,500,000 | | | | 68,475,000 | |
FirstEnergy Corp. | | United States | | | 1,095,900 | | | | 36,142,782 | |
NextEra Energy Inc. | | United States | | | 651,300 | | | | 55,764,306 | |
PG&E Corp. | | United States | | | 1,736,600 | | | | 69,950,248 | |
Pinnacle West Capital Corp. | | United States | | | 260,500 | | | | 13,785,660 | |
PPL Corp. | | United States | | | 1,615,400 | | | | 48,607,386 | |
Public Service Enterprise Group Inc. | | United States | | | 1,823,500 | | | | 58,424,940 | |
Sempra Energy | | United States | | | 868,300 | | | | 77,938,608 | |
The Southern Co. | | United States | | | 1,375,600 | | | | 56,550,916 | |
TECO Energy Inc. | | United States | | | 1,753,700 | | | | 30,233,788 | |
FI-22
Franklin Templeton Variable Insurance Products Trust
Statement of Investments, December 31, 2013 (continued)
| | | | | | | | | | |
| Franklin Income Securities Fund | | Country | | Shares/
Warrants | | | Value | |
Common Stocks and Other Equity Interests (continued) | | | | | | | | | | |
Utilities (continued) | | | | | | | | | | |
Xcel Energy Inc. | | United States | | | 1,710,964 | | | $ | 47,804,334 | |
| | | | | | | | | | |
| | | | | | | | | 902,158,378 | |
| | | | | | | | | | |
Total Common Stocks and Other Equity Interests
(Cost $3,151,809,989) | | | | | | | | | 3,819,581,395 | |
| | | | | | | | | | |
c Equity-Linked Securities 2.6% | | | | | | | | | | |
Energy 1.3% | | | | | | | | | | |
d Barclays Bank PLC into Devon Energy Corp., 6.00%, 144A | | United States | | | 650,000 | | | | 41,004,470 | |
d Barclays Bank PLC into Weatherford International Inc., 7.50%, 144A | | United States | | | 850,000 | | | | 13,623,290 | |
d JPMorgan Chase & Co. into Anadarko Petroleum Corp., 5.00%, 144A | | United States | | | 450,000 | | | | 36,236,385 | |
| | | | | | | | | | |
| | | | | | | | | 90,864,145 | |
| | | | | | | | | | |
Information Technology 0.2% | | | | | | | | | | |
d Wells Fargo & Co. into Broadcom Corp., 7.00%, 144A | | United States | | | 600,000 | | | | 17,032,800 | |
| | | | | | | | | | |
Materials 1.1% | | | | | | | | | | |
d JPMorgan Chase & Co. into Freeport-McMoRan Copper & Gold Inc., 9.00%, 144A | | United States | | | 1,170,000 | | | | 44,601,570 | |
d Morgan Stanley into Barrick Gold Corp., 9.00%, 144A | | Canada | | | 1,980,000 | | | | 37,192,518 | |
| | | | | | | | | | |
| | | | | | | | | 81,794,088 | |
| | | | | | | | | | |
Total Equity-Linked Securities (Cost $206,867,600) | | | | | | | | | 189,691,033 | |
| | | | | | | | | | |
Convertible Preferred Stocks 3.4% | | | | | | | | | | |
Energy 0.4% | | | | | | | | | | |
Halcon Resources Corp., 5.75%, cvt. pfd., A | | United States | | | 10,000 | | | | 7,940,000 | |
d Sanchez Energy Corp., 6.50%, cvt. pfd., B, 144A | | United States | | | 200,000 | | | | 13,080,000 | |
SandRidge Energy Inc., 7.00%, cvt. pfd. | | United States | | | 121,600 | | | | 12,087,040 | |
| | | | | | | | | | |
| | | | | | | | | 33,107,040 | |
| | | | | | | | | | |
Financials 2.4% | | | | | | | | | | |
Bank of America Corp., 7.25%, cvt. pfd., L | | United States | | | 78,200 | | | | 82,970,200 | |
FelCor Lodging Trust Inc., 7.80%, cvt. pfd., A | | United States | | | 347,325 | | | | 8,422,631 | |
a FNMA, 5.38%, cvt. pfd. | | United States | | | 525 | | | | 14,962,500 | |
MetLife Inc., 5.00%, cvt. pfd. | | United States | | | 455,925 | | | | 14,379,875 | |
Wells Fargo & Co., 7.50%, cvt. pfd., A | | United States | | | 53,000 | | | | 58,649,800 | |
| | | | | | | | | | |
| | | | | | | | | 179,385,006 | |
| | | | | | | | | | |
Industrials 0.2% | | | | | | | | | | |
a CEVA Holdings LLC, cvt. pfd., A-1 | | United Kingdom | | | 397 | | | | 516,100 | |
a CEVA Holdings LLC, cvt. pfd., A-2 | | United Kingdom | | | 14,711 | | | | 13,975,355 | |
| | | | | | | | | | |
| | | | | | | | | 14,491,455 | |
| | | | | | | | | | |
Materials 0.1% | | | | | | | | | | |
ArcelorMittal, 6.00%, cvt. pfd. | | Luxembourg | | | 160,000 | | | | 4,162,400 | |
| | | | | | | | | | |
Utilities 0.3% | | | | | | | | | | |
Dominion Resources Inc., 6.00%, cvt. pfd., B | | United States | | | 145,000 | | | | 7,860,450 | |
Dominion Resources Inc., 6.13%, cvt. pfd., A | | United States | | | 145,000 | | | | 7,847,400 | |
NextEra Energy Inc., 5.89%, cvt. pfd. | | United States | | | 83,100 | | | | 4,705,953 | |
| | | | | | | | | | |
| | | | | | | | | 20,413,803 | |
| | | | | | | | | | |
Total Convertible Preferred Stocks (Cost $251,543,613) | | | | | | | | | 251,559,704 | |
| | | | | | | | | | |
FI-23
Franklin Templeton Variable Insurance Products Trust
Statement of Investments, December 31, 2013 (continued)
| | | | | | | | | | |
| Franklin Income Securities Fund | | Country | | Shares/
Warrants | | | Value | |
Preferred Stocks 0.7% | | | | | | | | | | |
Financials 0.7% | | | | | | | | | | |
d Ally Financial Inc., 7.00%, pfd., 144A | | United States | | | 25,989 | | | $ | 24,951,878 | |
Ally Financial Inc., 8.50%, pfd., A | | United States | | | 65,125 | | | | 1,748,606 | |
a FHLMC, 8.375%, pfd., Z | | United States | | | 745,175 | | | | 6,684,220 | |
a FNMA, 6.75%, pfd. | | United States | | | 434,150 | | | | 3,039,050 | |
a FNMA, 7.625%, pfd., R | | United States | | | 694,650 | | | | 5,459,949 | |
a FNMA, 8.25%, pfd. | | United States | | | 739,375 | | | | 6,469,531 | |
| | | | | | | | | | |
Total Preferred Stocks (Cost $74,181,505) | | | | | | | | | 48,353,234 | |
| | | | | | | | | | |
| | | |
| | | | | Principal
Amount* | | | | |
Convertible Bonds 0.8% | | | | | | | | | | |
Consumer Discretionary 0.6% | | | | | | | | | | |
d Volkswagen International Finance, cvt., sub. note, 144A, 5.50%, 11/09/15 | | Germany | | | 25,000,000 | EUR | | | 42,754,492 | |
| | | | | | | | | | |
Materials 0.2% | | | | | | | | | | |
Cemex SAB de CV, cvt., sub. note, | | | | | | | | | | |
3.25%, 3/15/16 | | Mexico | | | 1,700,000 | | | | 2,238,394 | |
3.75%, 3/15/18 | | Mexico | | | 7,920,000 | | | | 10,761,300 | |
| | | | | | | | | | |
| | | | | | | | | 12,999,694 | |
| | | | | | | | | | |
Total Convertible Bonds (Cost $41,000,787) | | | | | | | | | 55,754,186 | |
| | | | | | | | | | |
Corporate Bonds 32.5% | | | | | | | | | | |
Consumer Discretionary 5.7% | | | | | | | | | | |
d Academy Ltd./Finance Corp., senior note, 144A, 9.25%, 8/01/19 | | United States | | | 5,300,000 | | | | 5,883,000 | |
Cablevision Systems Corp., senior note, 7.75%, 4/15/18 | | United States | | | 10,000,000 | | | | 11,200,000 | |
Caesars Entertainment Operating Co. Inc., | | | | | | | | | | |
first lien, 9.00%, 2/15/20 | | United States | | | 15,000,000 | | | | 14,662,500 | |
senior secured note, 11.25%, 6/01/17 | | United States | | | 10,000,000 | | | | 10,200,000 | |
senior secured note, 8.50%, 2/15/20 | | United States | | | 8,900,000 | | | | 8,594,063 | |
senior secured note, first lien, 9.00%, 2/15/20 | | United States | | | 10,000,000 | | | | 9,775,000 | |
CCO Holdings LLC/CCO Holdings Capital Corp., | | | | | | | | | | |
senior bond, 5.75%, 1/15/24 | | United States | | | 15,000,000 | | | | 14,212,500 | |
senior note, 6.50%, 4/30/21 | | United States | | | 15,000,000 | | | | 15,487,500 | |
Chrysler Group LLC/CG Co-Issuer Inc., senior secured note, | | | | | | | | | | |
8.00%, 6/15/19 | | United States | | | 25,000,000 | | | | 27,750,000 | |
8.25%, 6/15/21 | | United States | | | 12,800,000 | | | | 14,624,000 | |
Clear Channel Communications Inc., | | | | | | | | | | |
d,e senior note, 144A, PIK, 14.00%, 2/01/21 | | United States | | | 13,200,000 | | | | 11,945,459 | |
senior secured bond, first lien, 9.00%, 3/01/21 | | United States | | | 24,100,000 | | | | 24,461,500 | |
senior secured note, first lien, 9.00%, 12/15/19 | | United States | | | 18,000,000 | | | | 18,450,000 | |
Clear Channel Worldwide Holdings Inc., senior sub. note, 7.625%, 3/15/20 | | United States | | | 8,750,000 | | | | 9,242,187 | |
ClubCorp Club Operations Inc., senior note, 10.00%, 12/01/18 | | United States | | | 9,684,000 | | | | 10,773,450 | |
CSC Holdings LLC, senior note, 6.75%, 11/15/21 | | United States | | | 15,400,000 | | | | 16,670,500 | |
Cumulus Media Holdings Inc., senior note, 7.75%, 5/01/19 | | United States | | | 10,000,000 | | | | 10,600,000 | |
e Dex Media Inc., senior sub. note, PIK, 14.00%, 1/29/17 | | United States | | | 15,444,588 | | | | 8,044,854 | |
DISH DBS Corp., senior bond, 5.00%, 3/15/23 | | United States | | | 15,000,000 | | | | 14,062,500 | |
The Goodyear Tire & Rubber Co., senior note, | | | | | | | | | | |
8.25%, 8/15/20 | | United States | | | 4,900,000 | | | | 5,500,250 | |
6.50%, 3/01/21 | | United States | | | 12,600,000 | | | | 13,419,000 | |
HD Supply Inc., senior note, 7.50%, 7/15/20 | | United States | | | 10,000,000 | | | | 10,825,000 | |
d Jaguar Land Rover PLC, 144A, 8.125%, 5/15/21 | | United Kingdom | | | 2,118,000 | | | | 2,426,296 | |
FI-24
Franklin Templeton Variable Insurance Products Trust
Statement of Investments, December 31, 2013 (continued)
| | | | | | | | | | |
| Franklin Income Securities Fund | | Country | | Principal
Amount* | | | Value | |
Corporate Bonds (continued) | | | | | | | | | | |
Consumer Discretionary (continued) | | | | | | | | | | |
KB Home, | | | | | | | | | | |
senior bond, 7.50%, 9/15/22 | | United States | | | 6,500,000 | | | $ | 6,873,750 | |
senior note, 7.25%, 6/15/18 | | United States | | | 10,600,000 | | | | 11,739,500 | |
d Landry’s Inc., senior note, 144A, 9.375%, 5/01/20 | | United States | | | 2,500,000 | | | | 2,737,500 | |
d Laureate Education Inc., 144A, 9.25%, 9/01/19 | | United States | | | 5,000,000 | | | | 5,462,500 | |
MGM Resorts International, | | | | | | | | | | |
5.25%, 3/31/20 | | United States | | | 5,000,000 | | | | 4,975,000 | |
senior note, 6.625%, 7/15/15 | | United States | | | 3,200,000 | | | | 3,448,000 | |
senior note, 10.00%, 11/01/16 | | United States | | | 20,000,000 | | | | 24,100,000 | |
senior note, 8.625%, 2/01/19 | | United States | | | 3,700,000 | | | | 4,356,750 | |
senior note, 6.75%, 10/01/20 | | United States | | | 5,500,000 | | | | 5,898,750 | |
Shea Homes LP/Funding Corp., senior secured note, 8.625%, 5/15/19 | | United States | | | 6,700,000 | | | | 7,453,750 | |
d Univision Communications Inc., senior secured note, 144A, | | | | | | | | | | |
6.875%, 5/15/19 | | United States | | | 15,000,000 | | | | 16,106,250 | |
5.125%, 5/15/23 | | United States | | | 10,000,000 | | | | 10,037,500 | |
d UPCB Finance III Ltd., senior secured note, 144A, 6.625%, 7/01/20 | | Netherlands | | | 7,500,000 | | | | 8,006,250 | |
Visant Corp., senior note, 10.00%, 10/01/17 | | United States | | | 20,000,000 | | | | 19,500,000 | |
| | | | | | | | | | |
| | | | | | | | | 419,505,059 | |
| | | | | | | | | | |
Consumer Staples 1.2% | | | | | | | | | | |
Alliance One International Inc., secured note, second lien, 9.875%, 7/15/21 | | United States | | | 10,000,000 | | | | 9,425,000 | |
d Boparan Finance PLC, senior note, 144A, | | | | | | | | | | |
9.75%, 4/30/18 | | United Kingdom | | | 2,000,000 | EUR | | | 3,019,222 | |
9.875%, 4/30/18 | | United Kingdom | | | 7,500,000 | GBP | | | 13,661,175 | |
d Innovation Ventures LLC/Finance Corp., secured note, 144A, 9.50%, 8/15/19 | | United States | | | 5,000,000 | | | | 4,875,000 | |
d JBS USA LLC/Finance Inc., senior note, 144A, | | | | | | | | | | |
8.25%, 2/01/20 | | United States | | | 10,000,000 | | | | 10,900,000 | |
7.25%, 6/01/21 | | United States | | | 4,900,000 | | | | 5,120,500 | |
7.25%, 6/01/21 | | United States | | | 12,500,000 | | | | 13,093,750 | |
SUPERVALU Inc., senior note, 8.00%, 5/01/16 | | United States | | | 15,000,000 | | | | 16,668,750 | |
U.S. Foods Inc., 8.50%, 6/30/19 | | United States | | | 10,000,000 | | | | 10,962,500 | |
| | | | | | | | | | |
| | | | | | | | | 87,725,897 | |
| | | | | | | | | | |
Energy 7.2% | | | | | | | | | | |
Alpha Natural Resources Inc., senior note, 6.25%, 6/01/21 | | United States | | | 2,500,000 | | | | 2,150,000 | |
d Antero Resources Corp., senior note, 144A, 5.375%, 11/01/21 | | United States | | | 2,200,000 | | | | 2,223,375 | |
Antero Resources Finance Corp., senior note, 7.25%, 8/01/19 | | United States | | | 2,534,000 | | | | 2,736,720 | |
Arch Coal Inc., senior note, | | | | | | | | | | |
7.00%, 6/15/19 | | United States | | | 5,500,000 | | | | 4,400,000 | |
7.25%, 6/15/21 | | United States | | | 12,500,000 | | | | 9,625,000 | |
Bill Barrett Corp., senior note, 7.00%, 10/15/22 | | United States | | | 5,000,000 | | | | 5,212,500 | |
Callon Petroleum Co., senior secured note, 13.00%, 9/15/16 | | United States | | | 3,897,250 | | | | 4,043,397 | |
CGG, senior note, 6.50%, 6/01/21 | | France | | | 12,500,000 | | | | 12,875,000 | |
CHC Helicopter SA, senior secured note, first lien, 9.25%, 10/15/20 | | Canada | | | 25,000,000 | | | | 26,968,750 | |
Chesapeake Energy Corp., senior note, | | | | | | | | | | |
7.25%, 12/15/18 | | United States | | | 33,000,000 | | | | 38,280,000 | |
5.75%, 3/15/23 | | United States | | | 21,500,000 | | | | 22,252,500 | |
CONSOL Energy Inc., senior note, 8.25%, 4/01/20 | | United States | | | 1,800,000 | | | | 1,957,500 | |
El Paso Corp., senior note, MTN, 7.75%, 1/15/32 | | United States | | | 22,000,000 | | | | 22,390,522 | |
Energy XXI Gulf Coast Inc., senior note, 9.25%, 12/15/17 | | United States | | | 10,000,000 | | | | 11,175,000 | |
EP Energy LLC/Finance Inc., senior note, 9.375%, 5/01/20 | | United States | | | 10,000,000 | | | | 11,587,500 | |
EXCO Resources Inc., senior note, 7.50%, 9/15/18 | | United States | | | 10,500,000 | | | | 10,027,500 | |
d Expro Finance Luxembourg, senior secured note, 144A, 8.50%, 12/15/16 | | United Kingdom | | | 16,840,000 | | | | 17,639,900 | |
FI-25
Franklin Templeton Variable Insurance Products Trust
Statement of Investments, December 31, 2013 (continued)
| | | | | | | | | | |
| Franklin Income Securities Fund | | Country | | Principal
Amount* | | | Value | |
Corporate Bonds (continued) | | | | | | | | | | |
Energy (continued) | | | | | | | | | | |
d Gibson Energy Inc., senior note, 144A, 6.75%, 7/15/21 | | Canada | | | 7,000,000 | | | $ | 7,437,500 | |
Halcon Resources Corp., senior note, | | | | | | | | | | |
9.75%, 7/15/20 | | United States | | | 10,000,000 | | | | 10,475,000 | |
d 144A, 9.25%, 2/15/22 | | United States | | | 5,800,000 | | | | 5,930,500 | |
d Kinder Morgan Inc., | | | | | | | | | | |
senior secured bond, first lien, 144A, 5.625%, 11/15/23 | | United States | | | 9,800,000 | | | | 9,523,238 | |
senior secured note, 144A, 5.00%, 2/15/21 | | United States | | | 2,400,000 | | | | 2,373,101 | |
Linn Energy LLC/Finance Corp., senior note, 8.625%, 4/15/20 | | United States | | | 20,000,000 | | | | 21,700,000 | |
Magnum Hunter Resources Corp., senior note, 9.75%, 5/15/20 | | United States | | | 5,000,000 | | | | 5,425,000 | |
Midstates Petroleum Co. Inc./LLC, senior note, 10.75%, 10/01/20 | | United States | | | 5,000,000 | | | | 5,462,500 | |
Offshore Group Investment Ltd., senior secured note, first lien, 7.50%, 11/01/19 | | United States | | | 17,900,000 | | | | 19,466,250 | |
Peabody Energy Corp., senior note, 6.25%, 11/15/21 | | United States | | | 15,000,000 | | | | 15,225,000 | |
Penn Virginia Corp., senior note, 8.50%, 5/01/20 | | United States | | | 8,600,000 | | | | 9,288,000 | |
Plains Exploration & Production Co., senior note, 6.50%, 11/15/20 | | United States | | | 10,000,000 | | | | 11,044,680 | |
Quicksilver Resources Inc., senior note, 9.125%, 8/15/19 | | United States | | | 20,000,000 | | | | 20,400,000 | |
d Sabine Pass Liquefaction LLC, secured note, 144A, 5.625%, 2/01/21 | | United States | | | 15,100,000 | | | | 14,835,750 | |
Sabine Pass LNG LP, | | | | | | | | | | |
first lien, 6.50%, 11/01/20 | | United States | | | 10,000,000 | | | | 10,425,000 | |
senior secured note, 7.50%, 11/30/16 | | United States | | | 10,000,000 | | | | 11,350,000 | |
d Samson Investment Co., senior note, 144A, 9.75%, 2/15/20 | | United States | | | 26,300,000 | | | | 28,798,500 | |
d Sanchez Energy Corp., senior note, 144A, 7.75%, 6/15/21 | | United States | | | 9,300,000 | | | | 9,555,750 | |
SandRidge Energy Inc., senior note, | | | | | | | | | | |
8.75%, 1/15/20 | | United States | | | 20,000,000 | | | | 21,650,000 | |
7.50%, 3/15/21 | | United States | | | 15,000,000 | | | | 15,787,500 | |
8.125%, 10/15/22 | | United States | | | 10,000,000 | | | | 10,650,000 | |
7.50%, 2/15/23 | | United States | | | 6,600,000 | | | | 6,732,000 | |
W&T Offshore Inc., senior note, 8.50%, 6/15/19 | | United States | | | 40,500,000 | | | | 43,031,250 | |
| | | | | | | | | | |
| | | | | | | | | 522,111,683 | |
| | | | | | | | | | |
Financials 2.5% | | | | | | | | | | |
Ally Financial Inc., senior note, 6.25%, 12/01/17 | | United States | | | 5,000,000 | | | | 5,593,750 | |
f Bank of America Corp., pfd., sub. bond, M, 8.125% to 5/15/18, FRN thereafter, Perpetual | | United States | | | 5,000,000 | | | | 5,619,765 | |
E*TRADE Financial Corp., senior note, 6.00%, 11/15/17 | | United States | | | 12,500,000 | | | | 13,343,750 | |
International Lease Finance Corp., senior note, 8.75%, 3/15/17 | | United States | | | 15,000,000 | | | | 17,737,500 | |
f JPMorgan Chase & Co., junior sub. note, 1, 7.90% to 4/30/19, FRN thereafter, Perpetual | | United States | | | 85,000,000 | | | | 93,798,860 | |
Morgan Stanley, senior note, 5.50%, 1/26/20 | | United States | | | 15,000,000 | | | | 16,842,495 | |
Nationstar Mortgage LLC/Nationstar Capital Corp., senior note, 9.625%, 5/01/19 | | United States | | | 5,000,000 | | | | 5,650,000 | |
d Nuveen Investments Inc., senior note, 144A, 9.50%, 10/15/20 | | United States | | | 13,600,000 | | | | 13,702,000 | |
f PNC Financial Services Group Inc., junior sub. note, 4.85% to 6/01/23, FRN thereafter, Perpetual | | United States | | | 8,000,000 | | | | 7,184,000 | |
| | | | | | | | | | |
| | | | | | | | | 179,472,120 | |
| | | | | | | | | | |
Health Care 1.8% | | | | | | | | | | |
Grifols Inc., senior note, 8.25%, 2/01/18 | | Spain | | | 4,900,000 | | | | 5,230,750 | |
HCA Inc., | | | | | | | | | | |
senior note, 7.50%, 2/15/22 | | United States | | | 25,000,000 | | | | 27,500,000 | |
senior note, 5.875%, 5/01/23 | | United States | | | 7,500,000 | | | | 7,425,000 | |
senior secured note, 6.50%, 2/15/20 | | United States | | | 16,500,000 | | | | 18,170,625 | |
d,e Jaguar Holding Co. I, senior note, 144A, PIK, 9.375%, 10/15/17 | | United States | | | 10,200,000 | | | | 10,837,500 | |
Tenet Healthcare Corp., senior note, | | | | | | | | | | |
8.00%, 8/01/20 | | United States | | | 14,176,000 | | | | 15,434,120 | |
8.125%, 4/01/22 | | United States | | | 22,500,000 | | | | 24,300,000 | |
g FRN, 9.25%, 2/01/15 | | United States | | | 13,000,000 | | | | 14,040,000 | |
FI-26
Franklin Templeton Variable Insurance Products Trust
Statement of Investments, December 31, 2013 (continued)
| | | | | | | | | | |
| Franklin Income Securities Fund | | Country | | Principal
Amount* | | | Value | |
Corporate Bonds (continued) | | | | | | | | | | |
Health Care (continued) | | | | | | | | | | |
d Valeant Pharmaceuticals International Inc., senior note, 144A, 7.50%, 7/15/21 | | United States | | | 7,700,000 | | | $ | 8,489,250 | |
| | | | | | | | | | |
| | | | | | | | | 131,427,245 | |
| | | | | | | | | | |
Industrials 1.3% | | | | | | | | | | |
d Abengoa Finance SAU, senior note, 144A, 8.875%, 11/01/17 | | Spain | | | 12,900,000 | | | | 13,932,000 | |
d Algeco Scotsman Global Finance PLC, | | | | | | | | | | |
senior note, 144A, 10.75%, 10/15/19 | | United Kingdom | | | 5,000,000 | | | | 5,300,000 | |
senior secured note, first lien, 144A, 8.50%, 10/15/18 | | United Kingdom | | | 9,900,000 | | | | 10,654,875 | |
d Bombardier Inc., senior bond, 144A, 6.125%, 1/15/23 | | Canada | | | 7,500,000 | | | | 7,481,250 | |
d CEVA Group PLC, senior note, first lien, 144A, 4.00%, 5/01/18 | | United Kingdom | | | 32,691,882 | | | | 27,297,721 | |
Hertz Corp., senior note, 6.75%, 4/15/19 | | United States | | | 4,500,000 | | | | 4,871,250 | |
Navistar International Corp., senior note, 8.25%, 11/01/21 | | United States | | | 16,300,000 | | | | 16,952,000 | |
United Rentals North America Inc., senior sub. note, 8.375%, 9/15/20 | | United States | | | 8,800,000 | | | | 9,856,000 | |
| | | | | | | | | | |
| | | | | | | | | 96,345,096 | |
| | | | | | | | | | |
Information Technology 4.8% | | | | | | | | | | |
d BMC Software Finance Inc., senior note, 144A, 8.125%, 7/15/21 | | United States | | | 12,600,000 | | | | 13,041,000 | |
CDW LLC/Finance Corp., | | | | | | | | | | |
senior note, 8.50%, 4/01/19 | | United States | | | 13,725,000 | | | | 15,234,750 | |
senior sub. note, 12.535%, 10/12/17 | | United States | | | 650,000 | | | | 682,500 | |
Ceridian Corp., senior note, 11.25%, 11/15/15 | | United States | | | 4,500,000 | | | | 4,556,250 | |
d,e CommScope Holdings Co. Inc., senior note, 144A, PIK, 7.375%, 6/01/20 | | United States | | | 11,200,000 | | | | 11,704,000 | |
d CommScope Inc., senior note, 144A, 8.25%, 1/15/19 | | United States | | | 1,806,000 | | | | 1,988,858 | |
First Data Corp., | | | | | | | | | | |
senior bond, 12.625%, 1/15/21 | | United States | | | 80,000,000 | | | | 94,300,000 | |
d senior secured bond, 144A, 8.25%, 1/15/21 | | United States | | | 45,000,000 | | | | 48,093,750 | |
d,e senior secured note, 144A, PIK, 8.75%, 1/15/22 | | United States | | | 33,188,000 | | | | 35,594,130 | |
Freescale Semiconductor Inc., senior note, | | | | | | | | | | |
8.05%, 2/01/20 | | United States | | | 30,000,000 | | | | 32,400,000 | |
10.75%, 8/01/20 | | United States | | | 54,846,000 | | | | 62,524,440 | |
Infor U.S. Inc., senior note, 9.375%, 4/01/19 | | United States | | | 4,100,000 | | | | 4,633,000 | |
d Sanmina Corp., senior note, 144A, 7.00%, 5/15/19 | | United States | | | 15,000,000 | | | | 16,031,250 | |
Sterling International Inc., senior note, 11.00%, 10/01/19 | | United States | | | 7,500,000 | | | | 7,837,500 | |
| | | | | | | | | | |
| | | | | | | | | 348,621,428 | |
| | | | | | | | | | |
Materials 3.4% | | | | | | | | | | |
AngloGold Ashanti Holdings PLC, senior note, 8.50%, 7/30/20 | | South Africa | | | 6,000,000 | | | | 6,195,000 | |
d Cemex Finance LLC, senior secured note, 144A, 9.375%, 10/12/22 | | Mexico | | | 7,100,000 | | | | 8,040,750 | |
d Cemex SAB de CV, senior secured note, 144A, | | | | | | | | | | |
9.00%, 1/11/18 | | Mexico | | | 26,000,000 | | | | 28,697,500 | |
9.50%, 6/15/18 | | Mexico | | | 12,000,000 | | | | 13,642,500 | |
Dynacast International LLC/Finance Inc., 9.25%, 7/15/19 | | United States | | | 5,000,000 | | | | 5,537,500 | |
d FMG Resources (August 2006) Pty. Ltd., senior note, 144A, | | | | | | | | | | |
6.875%, 2/01/18 | | Australia | | | 11,900,000 | | | | 12,554,500 | |
8.25%, 11/01/19 | | Australia | | | 15,000,000 | | | | 16,893,750 | |
HudBay Minerals Inc., senior note, 9.50%, 10/01/20 | | Canada | | | 10,000,000 | | | | 10,325,000 | |
d Ineos Finance PLC, senior secured note, 144A, 8.375%, 2/15/19 | | Switzerland | | | 5,100,000 | | | | 5,692,875 | |
d Ineos Group Holdings SA, secured note, second lien, 144A, 7.875%, 2/15/16 | | Switzerland | | | 20,209,708 | EUR | | | 28,059,340 | |
d Inmet Mining Corp., senior note, 144A, 8.75%, 6/01/20 | | Canada | | | 4,000,000 | | | | 4,360,000 | |
d Kerling PLC, senior secured note, 144A, 10.625%, 2/01/17 | | United Kingdom | | | 9,400,000 | EUR | | | 13,773,039 | |
d Orion Engineered Carbons Bondco GmbH, | | | | | | | | | | |
senior secured bond, 144A, 10.00%, 6/15/18 | | Germany | | | 8,910,000 | EUR | | | 13,603,832 | |
senior secured note, first lien, 144A, 9.625%, 6/15/18 | | Germany | | | 11,100,000 | | | | 12,265,500 | |
FI-27
Franklin Templeton Variable Insurance Products Trust
Statement of Investments, December 31, 2013 (continued)
| | | | | | | | | | |
| Franklin Income Securities Fund | | Country | | Principal
Amount* | | | Value | |
Corporate Bonds (continued) | | | | | | | | | | |
Materials (continued) | | | | | | | | | | |
d,e Orion Engineered Carbons Finance & Co. SCA, senior note, 144A, PIK, 9.25%, 8/01/19 | | Germany | | | 4,800,000 | | | $ | 5,040,000 | |
Reynolds Group Issuer Inc./LLC/SA, | | | | | | | | | | |
first lien, 5.75%, 10/15/20 | | United States | | | 14,200,000 | | | | 14,555,000 | |
senior note, 9.00%, 4/15/19 | | United States | | | 5,000,000 | | | | 5,387,500 | |
senior note, 9.875%, 8/15/19 | | United States | | | 16,800,000 | | | | 18,774,000 | |
senior note, 8.25%, 2/15/21 | | United States | | | 5,200,000 | | | | 5,577,000 | |
senior secured note, 6.875%, 2/15/21 | | United States | | | 10,000,000 | | | | 10,825,000 | |
Walter Energy Inc., senior note, 9.875%, 12/15/20 | | United States | | | 7,000,000 | | | | 6,090,000 | |
| | | | | | | | | | |
| | | | | | | | | 245,889,586 | |
| | | | | | | | | | |
Telecommunication Services 3.3% | | | | | | | | | | |
CenturyLink Inc., senior bond, 6.75%, 12/01/23 | | United States | | | 1,700,000 | | | | 1,729,750 | |
Cricket Communications Inc., senior note, 7.75%, 10/15/20 | | United States | | | 20,000,000 | | | | 22,875,000 | |
Frontier Communications Corp., senior note, | | | | | | | | | | |
8.50%, 4/15/20 | | United States | | | 12,900,000 | | | | 14,512,500 | |
9.25%, 7/01/21 | | United States | | | 7,400,000 | | | | 8,565,500 | |
7.125%, 1/15/23 | | United States | | | 8,800,000 | | | | 8,778,000 | |
d MetroPCS Wireless Inc., senior bond, 144A, 6.625%, 4/01/23 | | United States | | | 15,000,000 | | | | 15,543,750 | |
d Sprint Corp., | | | | | | | | | | |
senior bond, 144A, 7.125%, 6/15/24 | | United States | | | 8,200,000 | | | | 8,343,500 | |
senior note, 144A, 7.875%, 9/15/23 | | United States | | | 37,500,000 | | | | 40,406,250 | |
Sprint Nextel Corp., | | | | | | | | | | |
11.50%, 11/15/21 | | United States | | | 30,000,000 | | | | 39,450,000 | |
senior note, 9.125%, 3/01/17 | | United States | | | 13,300,000 | | | | 15,694,000 | |
senior note, 7.00%, 8/15/20 | | United States | | | 5,000,000 | | | | 5,437,500 | |
d senior note, 144A, 9.00%, 11/15/18 | | United States | | | 20,000,000 | | | | 24,150,000 | |
T-Mobile USA Inc., senior note, | | | | | | | | | | |
6.542%, 4/28/20 | | United States | | | 11,200,000 | | | | 11,970,000 | |
6.633%, 4/28/21 | | United States | | | 5,000,000 | | | | 5,293,750 | |
6.731%, 4/28/22 | | United States | | | 5,000,000 | | | | 5,231,250 | |
Verizon Communications Inc., | | | | | | | | | | |
senior bond, 6.55%, 9/15/43 | | United States | | | 7,300,000 | | | | 8,542,591 | |
senior note, 5.15%, 9/15/23 | | United States | | | 6,900,000 | | | | 7,411,014 | |
| | | | | | | | | | |
| | | | | | | | | 243,934,355 | |
| | | | | | | | | | |
Utilities 1.3% | | | | | | | | | | |
d Calpine Corp., senior secured note, 144A, | | | | | | | | | | |
7.875%, 7/31/20 | | United States | | | 4,542,000 | | | | 4,996,200 | |
7.50%, 2/15/21 | | United States | | | 11,970,000 | | | | 13,122,113 | |
7.875%, 1/15/23 | | United States | | | 4,448,000 | | | | 4,881,680 | |
GenOn Energy Inc., senior note, 7.875%, 6/15/17 | | United States | | | 25,000,000 | | | | 27,625,000 | |
d InterGen NV, secured bond, 144A, 7.00%, 6/30/23 | | Netherlands | | | 25,000,000 | | | | 26,000,000 | |
Niska Gas Storage U.S./Canada, senior note, 8.875%, 3/15/18 | | United States | | | 15,000,000 | | | | 15,675,000 | |
| | | | | | | | | | |
| | | | | | | | | 92,299,993 | |
| | | | | | | | | | |
Total Corporate Bonds (Cost $2,162,781,025) | | | | | | | | | 2,367,332,462 | |
| | | | | | | | | | |
g,h Senior Floating Rate Interests 3.2% | | | | | | | | | | |
Consumer Discretionary 0.9% | | | | | | | | | | |
Clear Channel Communications Inc., | | | | | | | | | | |
Term Loan E, 7.669%, 7/31/19 | | United States | | | 13,142,769 | | | | 12,978,485 | |
Tranche B Term Loan, 3.819%, 1/29/16 | | United States | | | 711,676 | | | | 691,305 | |
Tranche D Term Loan, 6.919%, 1/30/19 | | United States | | | 50,864,664 | | | | 48,702,915 | |
FI-28
Franklin Templeton Variable Insurance Products Trust
Statement of Investments, December 31, 2013 (continued)
| | | | | | | | | | |
| Franklin Income Securities Fund | | Country | | Principal
Amount* | | | Value | |
Senior Floating Rate Interests (continued) | | | | | | | | | | |
Consumer Discretionary (continued) | | | | | | | | | | |
Dex Media West LLC, Term Loan B, 8.00%, 12/30/16 | | United States | | | 1,303,270 | | | $ | 1,025,239 | |
SuperMedia Inc., Exit Term Loan, 11.60%, 12/31/16 | | United States | | | 858,471 | | | | 640,992 | |
| | | | | | | | | | |
| | | | | | | | | 64,038,936 | |
| | | | | | | | | | |
Consumer Staples 0.2% | | | | | | | | | | |
U.S. Foods Inc., Term Loan, 4.50%, 3/31/19 | | United States | | | 14,925,000 | | | | 15,060,877 | |
| | | | | | | | | | |
Energy 1.0% | | | | | | | | | | |
Chesapeake Energy Corp., Senior Unsecured Term Loan, 5.75%, 12/02/17 | | United States | | | 20,000,000 | | | | 20,450,000 | |
Drillships Financing Holding Inc., Tranche B-2 Term Loan, 5.50%, 7/15/16 | | Marshall Islands | | | 14,962,500 | | | | 15,214,992 | |
Fieldwood Energy LLC, Second Lien Closing Date Loans, 8.375%, 9/30/20 | | United States | | | 10,000,000 | | | | 10,232,140 | |
Quicksilver Resources Inc., Second Lien Loans, 7.00%, 6/21/19 | | United States | | | 25,000,000 | | | | 24,812,500 | |
| | | | | | | | | | |
| | | | | | | | | 70,709,632 | |
| | | | | | | | | | |
Industrials 0.4% | | | | | | | | | | |
Altegrity Inc., | | | | | | | | | | |
Term Loan B, 4.75%, 2/21/15 | | United States | | | 12,332,706 | | | | 12,113,036 | |
Tranche D Term Loan, 7.75%, 2/21/15 | | United States | | | 12,585,755 | | | | 12,559,539 | |
CEVA Group PLC, Dollar Tranche B L/C, 5.247%, 8/31/16 | | United Kingdom | | | 2,105,263 | | | | 2,060,653 | |
Navistar Inc., Tranche B Term Loan, 5.75%, 8/17/17 | | United States | | | 6,081,022 | | | | 6,185,542 | |
| | | | | | | | | | |
| | | | | | | | | 32,918,770 | |
| | | | | | | | | | |
Information Technology 0.7% | | | | | | | | | | |
First Data Corp., 2018 Term Loan, 4.164%, 3/24/18 | | United States | | | 22,436,455 | | | | 22,491,155 | |
Freescale Semiconductor Inc., Tranche B-4 Term Loan, 5.00%, 2/28/20 | | United States | | | 19,850,000 | | | | 20,096,061 | |
SRA International Inc., Term Loan, 6.50%, 7/20/18 | | United States | | | 8,171,429 | | | | 8,106,735 | |
| | | | | | | | | | |
| | | | | | | | | 50,693,951 | |
| | | | | | | | | | |
Total Senior Floating Rate Interests (Cost $226,981,649) | | | | | | | | | 233,422,166 | |
| | | | | | | | | | |
| | | |
| | | | | Shares | | | | |
Escrow and Litigation Trust 0.0%† | | | | | | | | | | |
a,i Dynegy Holdings Inc., Escrow Account | | United States | | | 149,699,000 | | | | — | |
a Motors Liquidation Co., Escrow Account, pfd., C | | United States | | | 1,400,000 | | | | 14,000 | |
a,i SuperMedia Inc., Litigation Trust | | United States | | | 3,472,135 | | | | — | |
| | | | | | | | | | |
Total Escrow and Litigation Trust (Cost $101,664) | | | | | | | | | 14,000 | |
| | | | | | | | | | |
Total Investments before Short Term Investments (Cost $6,115,267,832) | | | | | | | | | 6,965,708,180 | |
| | | | | | | | | | |
FI-29
Franklin Templeton Variable Insurance Products Trust
Statement of Investments, December 31, 2013 (continued)
| | | | | | | | | | | | |
| Franklin Income Securities Fund | | Country | | | Principal
Amount* | | | Value | |
Short Term Investments (Cost $111,064,830) 1.5% | | | | | | | | | | | | |
Repurchase Agreements 1.5% | | | | | | | | | | | | |
j Joint Repurchase Agreement, 0.008%, 1/02/14 (Maturity Value $111,064,877) | | | United States | | | | 111,064,830 | | | $ | 111,064,830 | |
BNP Paribas Securities Corp. (Maturity Value $8,475,361)
| | | | | | | | | | | | |
Credit Suisse Securities (USA) LLC (Maturity Value $25,426,082) | | | | | | | | | | | | |
Deutsche Bank Securities Inc. (Maturity Value $14,868,255) | | | | | | | | | | | | |
HSBC Securities (USA) Inc. (Maturity Value $35,597,404) | | | | | | | | | | | | |
Merrill Lynch, Pierce, Fenner & Smith Inc. (Maturity Value $16,527,564) | | | | | | | | | | | | |
Morgan Stanley & Co. LLC (Maturity Value $10,170,211) | | | | | | | | | | | | |
Collateralized by U.S. Government Agency Securities, 0.00% - 4.125%, 1/15/14 - 3/07/18;
kU.S. Government Agency Discount Notes, 8/19/14; kU.S. Treasury Bills, 9/18/14; U.S. Treasury Bonds, 8.875% - 9.125%, 5/15/17 - 5/15/18; U.S. Treasury Notes, 0.25% - 4.75%, 1/15/15 - 12/31/18; and U.S. Treasury Notes, Index Linked, 1.375% - 1.625%, 1/15/18 - 7/15/18 (valued at $113,289,908) | | | | | | | | | | | | |
| | | | | | | | | | | | |
Total Investments (Cost $6,226,332,662) 97.2% | | | | | | | | | | | 7,076,773,010 | |
Other Assets, less Liabilities 2.8% | | | | | | | | | | | 203,928,219 | |
| | | | | | | | | | | | |
Net Assets 100.0% | | | | | | | | | | $ | 7,280,701,229 | |
| | | | | | | | | | | | |
See Abbreviations on page FI-43.
*The principal amount is stated in U.S. dollars unless otherwise indicated.
†Rounds to less than 0.1% of net assets.
aNon-income producing.
bAt December 31, 2013, pursuant to the Fund’s policies and the requirements of applicable securities law, the Fund may be restricted from trading these securities for a limited or extended period of time due to ownership limits and/or potential possession of material non-public information.
cSee Note 1(d) regarding equity-linked securities.
dSecurity was purchased pursuant to Rule 144A under the Securities Act of 1933 and may be sold in transactions exempt from registration only to qualified institutional buyers or in a public offering registered under the Securities Act of 1933. These securities have been deemed liquid under guidelines approved by the Trust’s Board of Trustees. At December 31, 2013, the aggregate value of these securities was $1,006,284,082, representing 13.82% of net assets.
eIncome may be received in additional securities and/or cash.
fPerpetual security with no stated maturity date.
gThe coupon rate shown represents the rate at period end.
hSee Note 1(f) regarding senior floating rate interests.
iSecurity has been deemed illiquid because it may not be able to be sold within seven days.
jSee Note 1(c) regarding joint repurchase agreement.
kThe security is traded on a discount basis with no stated coupon rate.
The accompanying notes are an integral part of these financial statements.
FI-30
Franklin Templeton Variable Insurance Products Trust
Financial Statements
Statement of Assets and Liabilities
December 31, 2013
| | | | |
| | | Franklin
Income
Securities Fund | |
Assets: | | | | |
Investments in securities: | | | | |
Cost - Unaffiliated issuers | | $ | 6,115,267,832 | |
Cost - Repurchase agreements | | | 111,064,830 | |
| | | | |
Total cost of investments | | $ | 6,226,332,662 | |
| | | | |
Value - Unaffiliated issuers | | $ | 6,965,708,180 | |
Value - Repurchase agreements | | | 111,064,830 | |
| | | | |
Total value of investments | | | 7,076,773,010 | |
Cash | | | 148,774,364 | |
Receivables: | | | | |
Investment securities sold | | | 130,039 | |
Capital shares sold | | | 3,735,695 | |
Dividends and interest | | | 63,776,442 | |
Unrealized appreciation on unfunded loan commitments (Note 8) | | | 7,350 | |
Other assets | | | 645 | |
| | | | |
Total assets | | | 7,293,197,545 | |
| | | | |
Liabilities: | | | | |
Payables: | | | | |
Capital shares redeemed | | | 6,110,207 | |
Management fees | | | 2,768,977 | |
Distribution fees | | | 2,787,192 | |
Reports to shareholders | | | 661,913 | |
Accrued expenses and other liabilities | | | 168,027 | |
| | | | |
Total liabilities | | | 12,496,316 | |
| | | | |
Net assets, at value | | $ | 7,280,701,229 | |
| | | | |
Net assets consist of: | | | | |
Paid-in capital | | $ | 7,130,152,972 | |
Undistributed net investment income | | | 344,943,832 | |
Net unrealized appreciation (depreciation) | | | 850,561,671 | |
Accumulated net realized gain (loss) | | | (1,044,957,246 | ) |
| | | | |
Net assets, at value | | $ | 7,280,701,229 | |
| | | | |
The accompanying notes are an integral part of these financial statements.
FI-31
Franklin Templeton Variable Insurance Products Trust
Financial Statements (continued)
Statement of Assets and Liabilities (continued)
December 31, 2013
| | | | |
| | | Franklin
Income
Securities Fund | |
Class 1: | | | | |
Net assets, at value | | $ | 695,003,818 | |
| | | | |
Shares outstanding | | | 42,057,305 | |
| | | | |
Net asset value and maximum offering price per share | | $ | 16.53 | |
| | | | |
Class 2: | | | | |
Net assets, at value | | $ | 6,188,045,247 | |
| | | | |
Shares outstanding | | | 385,142,372 | |
| | | | |
Net asset value and maximum offering price per share | | $ | 16.07 | |
| | | | |
Class 4: | | | | |
Net assets, at value | | $ | 397,652,164 | |
| | | | |
Shares outstanding | | | 24,312,395 | |
| | | | |
Net asset value and maximum offering price per share | | $ | 16.36 | |
| | | | |
The accompanying notes are an integral part of these financial statements.
FI-32
Franklin Templeton Variable Insurance Products Trust
Financial Statements (continued)
Statement of Operations
for the year ended December 31, 2013
| | | | |
| | | Franklin
Income
Securities Fund | |
Investment income: | | | | |
Dividends | | $ | 137,259,068 | |
Interest | | | 265,044,238 | |
Income from securities loaned | | | 1,052,277 | |
| | | | |
Total investment income | | | 403,355,583 | |
| | | | |
Expenses: | | | | |
Management fees (Note 3a) | | | 32,994,396 | |
Distribution fees: (Note 3c) | | | | |
Class 2 | | | 15,525,818 | |
Class 4 | | | 1,499,611 | |
Unaffiliated transfer agent fees | | | 1,034 | |
Custodian fees (Note 4) | | | 124,270 | |
Reports to shareholders | | | 638,010 | |
Professional fees | | | 169,453 | |
Trustees’ fees and expenses | | | 37,346 | |
Other | | | 146,190 | |
| | | | |
Total expenses | | | 51,136,128 | |
Expense reductions (Note 4) | | | (549 | ) |
| | | | |
Net expenses | | | 51,135,579 | |
| | | | |
Net investment income | | | 352,220,004 | |
| | | | |
Realized and unrealized gains (losses): | | | | |
Net realized gain (loss) from: | | | | |
Investments | | | 58,743,057 | |
Foreign currency transactions | | | 71,529 | |
| | | | |
Net realized gain (loss) | | | 58,814,586 | |
| | | | |
Net change in unrealized appreciation (depreciation) on: | | | | |
Investments | | | 532,254,537 | |
Translation of other assets and liabilities denominated in foreign currencies | | | 49,945 | |
| | | | |
Net change in unrealized appreciation (depreciation) | | | 532,304,482 | |
| | | | |
Net realized and unrealized gain (loss) | | | 591,119,068 | |
| | | | |
Net increase (decrease) in net assets resulting from operations | | $ | 943,339,072 | |
| | | | |
The accompanying notes are an integral part of these financial statements.
FI-33
Franklin Templeton Variable Insurance Products Trust
Financial Statements (continued)
Statements of Changes in Net Assets
| | | | | | | | |
| | | Franklin Income Securities Fund | |
| | | Year Ended December 31, | |
| | | 2013 | | | 2012 | |
| | | | |
Increase (decrease) in net assets: | | | | | | | | |
Operations: | | | | | | | | |
Net investment income | | $ | 352,220,004 | | | $ | 454,020,826 | |
Net realized gain (loss) from investments and foreign currency transactions | | | 58,814,586 | | | | (46,865,158 | ) |
Net change in unrealized appreciation (depreciation) on investments and translation of other assets and liabilities denominated in foreign currencies | | | 532,304,482 | | | | 534,865,658 | |
| | | | |
Net increase (decrease) in net assets resulting from operations | | | 943,339,072 | | | | 942,021,326 | |
| | | | |
Distributions to shareholders from: | | | | | | | | |
Net investment income: | | | | | | | | |
Class 1 | | | (40,171,484 | ) | | | (90,282,701 | ) |
Class 2 | | | (401,855,498 | ) | | | (392,684,736 | ) |
Class 4 | | | (27,978,841 | ) | | | (28,048,130 | ) |
| | | | |
Total distributions to shareholders | | | (470,005,823 | ) | | | (511,015,567 | ) |
| | | | |
Capital share transactions: (Note 2) | | | | | | | | |
Class 1 | | | 66,533,168 | | | | (793,290,008 | ) |
Class 2 | | | (397,831,491 | ) | | | (63,192,261 | ) |
Class 4 | | | (65,127,276 | ) | | | (18,736,873 | ) |
| | | | |
Total capital share transactions | | | (396,425,599 | ) | | | (875,219,142 | ) |
| | | | |
Net increase (decrease) in net assets | | | 76,907,650 | | | | (444,213,383 | ) |
Net assets: | | | | | | | | |
Beginning of year | | | 7,203,793,579 | | | | 7,648,006,962 | |
| | | | |
End of year | | $ | 7,280,701,229 | | | $ | 7,203,793,579 | |
| | | | |
Undistributed net investment income included in net assets: | | | | | | | | |
End of year | | $ | 344,943,832 | | | $ | 445,550,700 | |
| | | | |
The accompanying notes are an integral part of these financial statements.
FI-34
Franklin Templeton Variable Insurance Products Trust
Notes to Financial Statements
Franklin Income Securities Fund
1. ORGANIZATION AND SIGNIFICANT ACCOUNTING POLICIES
Franklin Templeton Variable Insurance Products Trust (Trust) is registered under the Investment Company Act of 1940, as amended, (1940 Act) as an open-end investment company, consisting of twenty separate funds. The Franklin Income Securities Fund (Fund) is included in this report. The financial statements of the remaining funds in the Trust are presented separately. Shares of the Fund are generally sold only to insurance company separate accounts to fund the benefits of variable life insurance policies or variable annuity contracts. The Fund offers three classes of shares: Class 1, Class 2, and Class 4. Each class of shares differs by its distribution fees, voting rights on matters affecting a single class and its exchange privilege.
The following summarizes the Fund’s significant accounting policies.
a. Financial Instrument Valuation
The Fund’s investments in financial instruments are carried at fair value daily. Fair value is the price that would be received to sell an asset or paid to transfer a liability in an orderly transaction between market participants on the measurement date. The Fund calculates the net asset value (NAV) per share at the close of the New York Stock Exchange (NYSE), generally at 4p.m. Eastern time (NYSE close) on each day the NYSE is open for trading. Under procedures approved by the Trust’s Board of Trustees (the Board), the Fund’s administrator, investment manager and other affiliates have formed the Valuation and Liquidity Oversight Committee (VLOC). The VLOC provides administration and oversight of the Fund’s valuation policies and procedures, which are approved annually by the Board. Among other things, these procedures allow the Fund to utilize independent pricing services, quotations from securities and financial instrument dealers, and other market sources to determine fair value.
Equity securities listed on an exchange or on the NASDAQ National Market System are valued at the last quoted sale price or the official closing price of the day, respectively. Foreign equity securities are valued as of the close of trading on the foreign stock exchange on which the security is primarily traded or as of the NYSE close, whichever is earlier. The value is then converted into its U.S. dollar equivalent at the foreign exchange rate in effect at the NYSE close on the day that the value of the security is determined. Over-the-counter (OTC) securities are valued within the range of the most recent quoted bid and ask prices. Securities that trade in multiple markets or on multiple exchanges are valued according to the broadest and most representative market. Certain equity securities are valued based upon fundamental characteristics or relationships to similar securities.
Debt securities generally trade in the OTC market rather than on a securities exchange. The Fund’s pricing services use multiple valuation techniques to determine fair value. In instances where sufficient market activity exists, the pricing services may utilize a market-based approach through which quotes from market makers are used to determine fair value. In instances where sufficient market activity may not exist or is limited, the pricing services also utilize proprietary valuation models which may consider market characteristics such as benchmark yield curves, credit spreads, estimated default rates, anticipated market interest rate volatility, coupon rates, anticipated timing of principal repayments, underlying collateral, and other unique security features in order to estimate the relevant cash flows, which are then discounted to calculate the fair value. Securities denominated in a foreign currency are converted into their U.S. dollar equivalent at the foreign exchange rate in effect at the NYSE close on the date that the values of the foreign debt securities are determined. Repurchase agreements are valued at cost, which approximates market value.
The Fund has procedures to determine the fair value of financial instruments for which market prices are not reliable or readily available. Under these procedures, the VLOC convenes on a regular basis to review such financial instruments and considers a number of factors, including significant unobservable valuation inputs, when arriving at fair value. The VLOC primarily employs a market-based approach which may use related or comparable assets or liabilities, recent transactions, market multiples, book values, and other relevant information for the investment to determine the fair value of the investment. An income-based valuation approach may also be used in which the anticipated future cash flows of the investment are discounted to calculate fair value. Discounts may also be applied due to the nature or duration of any restrictions on the disposition of the investments. Due to the inherent uncertainty of valuations of such investments, the fair values may differ significantly from the values that would have been used had an active market existed. The VLOC employs various methods for calibrating these valuation approaches including a regular review of key inputs and assumptions, transactional back-testing or disposition analysis, and reviews of any related market activity.
FI-35
Franklin Templeton Variable Insurance Products Trust
Notes to Financial Statements (continued)
Franklin Income Securities Fund
1. ORGANIZATION AND SIGNIFICANT ACCOUNTING POLICIES (continued)
a. Financial Instrument Valuation (continued)
Trading in securities on foreign securities stock exchanges and OTC markets may be completed before the daily NYSE close. In addition, trading in certain foreign markets may not take place on every NYSE business day. Occasionally, events occur between the time at which trading in a foreign security is completed and the close of the NYSE that might call into question the reliability of the value of a portfolio security held by the Fund. As a result, differences may arise between the value of the Fund’s portfolio securities as determined at the foreign market close and the latest indications of value at the close of the NYSE. In order to minimize the potential for these differences, the VLOC monitors price movements following the close of trading in foreign stock markets through a series of country specific market proxies (such as baskets of American Depositary Receipts, futures contracts and exchange traded funds). These price movements are measured against established trigger thresholds for each specific market proxy to assist in determining if an event has occurred that may call into question the reliability of the values of the foreign securities held by the Fund. If such an event occurs, the securities may be valued using fair value procedures, which may include the use of independent pricing services.
Also, when the last day of the reporting period is a non-business day, certain foreign markets may be open on those days that the NYSE is closed, which could result in differences between the value of the Fund’s portfolio securities on the last business day and the last calendar day of the reporting period. Any significant security valuation changes due to an open foreign market are adjusted and reflected by the Fund for financial reporting purposes.
b. Foreign Currency Translation
Portfolio securities and other assets and liabilities denominated in foreign currencies are translated into U.S. dollars based on the exchange rate of such currencies against U.S. dollars on the date of valuation. The Fund may enter into foreign currency exchange contracts to facilitate transactions denominated in a foreign currency. Purchases and sales of securities, income and expense items denominated in foreign currencies are translated into U.S. dollars at the exchange rate in effect on the transaction date. Portfolio securities and assets and liabilities denominated in foreign currencies contain risks that those currencies will decline in value relative to the U.S. dollar. Occasionally, events may impact the availability or reliability of foreign exchange rates used to convert the U.S. dollar equivalent value. If such an event occurs, the foreign exchange rate will be valued at fair value using procedures established and approved by the Board.
The Fund does not separately report the effect of changes in foreign exchange rates from changes in market prices on securities held. Such changes are included in net realized and unrealized gain or loss from investments on the Statement of Operations.
Realized foreign exchange gains or losses arise from sales of foreign currencies, currency gains or losses realized between the trade and settlement dates on securities transactions and the difference between the recorded amounts of dividends, interest, and foreign withholding taxes and the U.S. dollar equivalent of the amounts actually received or paid. Net unrealized foreign exchange gains and losses arise from changes in foreign exchange rates on foreign denominated assets and liabilities other than investments in securities held at the end of the reporting period.
c. Joint Repurchase Agreement
The Fund enters into a joint repurchase agreement whereby its uninvested cash balance is deposited into a joint cash account with other funds managed by the investment manager or an affiliate of the investment manager and is used to invest in one or more repurchase agreements. The value and face amount of the joint repurchase agreement are allocated to the funds based on their pro-rata interest. A repurchase agreement is accounted for as a loan by the Fund to the seller, collateralized by securities which are delivered to the Fund’s custodian. The market value, including accrued interest, of the initial collateralization is required to be at least 102% of the dollar amount invested by the funds, with the value of the underlying securities marked to market daily to maintain coverage of at least 100%. Repurchase agreements are subject to the terms of Master Repurchase
FI-36
Franklin Templeton Variable Insurance Products Trust
Notes to Financial Statements (continued)
Franklin Income Securities Fund
1. ORGANIZATION AND SIGNIFICANT ACCOUNTING POLICIES (continued)
c. Joint Repurchase Agreement (continued)
Agreements (MRAs) with approved counterparties (sellers). The MRAs contain various provisions, including but not limited to events of default and maintenance of collateral for repurchase agreements. In the event of default by either the seller or the Fund, certain MRAs may permit the non-defaulting party to net and close-out all transactions, if any, traded under such agreements. The Fund may sell securities it holds as collateral and apply the proceeds towards the repurchase price and any other amounts owed by the seller to the Fund in the event of default by the seller. This could involve costs or delays in addition to a loss on the securities if their value falls below the repurchase price owed by the seller. The joint repurchase agreement held by the Fund at year end, as indicated in the Statement of Investments, had been entered into on December 31, 2013.
d. Equity-Linked Securities
The Fund invests in equity-linked securities. Equity-linked securities are hybrid financial instruments that generally combine both debt and equity characteristics into a single note form. Income received from equity-linked securities is recorded as realized gains in the Statement of Operations and may be based on the performance of an underlying equity security, an equity index, or an option position. The risks of investing in equity-linked securities include unfavorable price movements in the underlying security and the credit risk of the issuing financial institution. There may be no guarantee of a return of principal with equity-linked securities and the appreciation potential may be limited. Equity-linked securities may be more volatile and less liquid than other investments held by the Fund.
e. Securities Lending
The Fund participates in an agency based securities lending program. The Fund receives cash collateral against the loaned securities in an amount equal to at least 102% of the market value of the loaned securities. Collateral is maintained over the life of the loan in an amount not less than 100% of the market value of loaned securities, as determined at the close of fund business each day; any additional collateral required due to changes in security values is delivered to the Fund on the next business day. The collateral is invested in a non-registered money fund as indicated on the Statement of Investments. The Fund receives income from the investment of cash collateral, in addition to lending fees and rebates paid by the borrower. The Fund bears the market risk with respect to the collateral investment, securities loaned, and the risk that the agent may default on its obligations to the Fund. The securities lending agent has agreed to indemnify the Fund in the event of default by a third party borrower. At December 31, 2013, the Fund had no securities on loan.
f. Senior Floating Rate Interests
The Fund invests in senior secured corporate loans that pay interest at rates which are periodically reset by reference to a base lending rate plus a spread. These base lending rates are generally the prime rate offered by a designated U.S. bank or the London InterBank Offered Rate (LIBOR). Senior secured corporate loans often require prepayment of principal from excess cash flows or at the discretion of the borrower. As a result, actual maturity may be substantially less than the stated maturity.
Senior secured corporate loans in which the Fund invests are generally readily marketable, but may be subject to certain restrictions on resale.
g. Income Taxes
It is the Fund’s policy to qualify as a regulated investment company under the Internal Revenue Code. The Fund intends to distribute to shareholders substantially all of its taxable income and net realized gains to relieve it from federal income and if applicable, excise taxes. As a result, no provision for U.S. federal income taxes is required.
FI-37
Franklin Templeton Variable Insurance Products Trust
Notes to Financial Statements (continued)
Franklin Income Securities Fund
1. ORGANIZATION AND SIGNIFICANT ACCOUNTING POLICIES (continued)
g. Income Taxes
The Fund may be subject to foreign taxation related to income received, capital gains on the sale of securities and certain foreign currency transactions in the foreign jurisdictions in which it invests. Foreign taxes, if any, are recorded based on the tax regulations and rates that exist in the foreign markets in which the Fund invests. When a capital gain tax is determined to apply the Fund records an estimated deferred tax liability in an amount that would be payable if the securities were disposed of on the valuation date.
The Fund recognizes the tax benefits of uncertain tax positions only when the position is “more likely than not” to be sustained upon examination by the tax authorities based on the technical merits of the tax position. As of December 31, 2013, and for all open tax years, the Fund has determined that no liability for unrecognized tax benefits is required in the Fund’s financial statements related to uncertain tax positions taken on a tax return (or expected to be taken on future tax returns). Open tax years are those that remain subject to examination and are based on each tax jurisdiction statute of limitation.
h. Security Transactions, Investment Income, Expenses and Distributions
Security transactions are accounted for on trade date. Realized gains and losses on security transactions are determined on a specific identification basis. Interest income and estimated expenses are accrued daily. Amortization of premium and accretion of discount on debt securities are included in interest income. Facility fees are recognized as income over the expected term of the loan. Dividend income is recorded on the ex-dividend date except that certain dividends from foreign securities are recognized as soon as the Fund is notified of the ex-dividend date. Distributions to shareholders are recorded on the ex-dividend date and are determined according to income tax regulations (tax basis). Distributable earnings determined on a tax basis may differ from earnings recorded in accordance with accounting principles generally accepted in the United States of America. These differences may be permanent or temporary. Permanent differences are reclassified among capital accounts to reflect their tax character. These reclassifications have no impact on net assets or the results of operations. Temporary differences are not reclassified, as they may reverse in subsequent periods.
Common expenses incurred by the Trust are allocated among the funds based on the ratio of net assets of each fund to the combined net assets of the Trust. Fund specific expenses are charged directly to the fund that incurred the expense.
Realized and unrealized gains and losses and net investment income, not including class specific expenses, are allocated daily to each class of shares based upon the relative proportion of net assets of each class. Differences in per share distributions, by class, are generally due to differences in class specific expenses.
i. Accounting Estimates
The preparation of financial statements in accordance with accounting principles generally accepted in the United States of America requires management to make estimates and assumptions that affect the reported amounts of assets and liabilities at the date of the financial statements and the amounts of income and expenses during the reporting period. Actual results could differ from those estimates.
j. Guarantees and Indemnifications
Under the Trust’s organizational documents, its officers and trustees are indemnified by the Trust against certain liabilities arising out of the performance of their duties to the Trust. Additionally, in the normal course of business, the Trust, on behalf of the Fund, enters into contracts with service providers that contain general indemnification clauses. The Trust’s maximum exposure under these arrangements is unknown as this would involve future claims that may be made against the Trust that have not yet occurred. Currently, the Trust expects the risk of loss to be remote.
FI-38
Franklin Templeton Variable Insurance Products Trust
Notes to Financial Statements (continued)
Franklin Income Securities Fund
2. SHARES OF BENEFICIAL INTEREST
At December 31, 2013, there were an unlimited number of shares authorized (without par value). Transactions in the Fund’s shares were as follows:
| | | | | | | | | | | | | | | | |
| | | Year Ended December 31, | |
| | | 2013 | | | 2012 | |
| Class 1 Shares: | | Shares | | | Amount | | | Shares | | | Amount | |
Shares sold | | | 4,144,696 | | | $ | 65,962,113 | | | | 39,214,078 | | | $ | 586,304,676 | |
Shares issued in reinvestment of distributions | | | 2,620,449 | | | | 40,171,484 | | | | 6,331,185 | | | | 90,282,701 | |
Shares redeemed in-kind (Note 10) | | | — | | | | — | | | | (29,984,492 | ) | | | (458,420,903 | ) |
Shares redeemed | | | (2,480,546 | ) | | | (39,600,429 | ) | | | (66,431,278 | ) | | | (1,011,456,482 | ) |
| | | | |
Net increase (decrease) | | | 4,284,599 | | | $ | 66,533,168 | | | | (50,870,507 | ) | | $ | (793,290,008 | ) |
| | | | |
Class 2 Shares: | | | | | | | | | | | | | | | | |
Shares sold | | | 35,402,352 | | | $ | 551,266,014 | | | | 37,383,185 | | | $ | 550,351,184 | |
Shares issued in reinvestment of distributions | | | 26,915,974 | | | | 401,855,498 | | | | 28,230,391 | | | | 392,684,736 | |
Shares redeemed | | | (87,475,715 | ) | | | (1,350,953,003 | ) | | | (68,491,604 | ) | | | (1,006,228,181 | ) |
| | | | |
Net increase (decrease) | | | (25,157,389 | ) | | $ | (397,831,491 | ) | | | (2,878,028 | ) | | $ | (63,192,261 | ) |
| | | | |
Class 4 Shares: | | | | | | | | | | | | | | | | |
Shares sold | | | 3,337,474 | | | $ | 52,791,548 | | | | 2,795,409 | | | $ | 41,861,767 | |
Shares issued on reinvestment of distributions | | | 1,839,503 | | | | 27,978,841 | | | | 1,982,200 | | | | 28,048,130 | |
Shares redeemed | | | (9,346,237 | ) | | | (145,897,665 | ) | | | (5,962,592 | ) | | | (88,646,770 | ) |
| | | | |
Net increase (decrease) | | | (4,169,260 | ) | | $ | (65,127,276 | ) | | | (1,184,983 | ) | | $ | (18,736,873 | ) |
| | | | |
3. TRANSACTIONS WITH AFFILIATES
Franklin Resources, Inc. is the holding company for various subsidiaries that together are referred to as Franklin Templeton Investments. Certain officers and trustees of the Fund are also officers and/or directors of the following subsidiaries:
| | |
| Subsidiary | | Affiliation |
Franklin Advisers, Inc. (Advisers) | | Investment manager |
Templeton Investment Counsel, LLC (TIC) | | Investment manager |
Franklin Templeton Services, LLC (FT Services) | | Administrative manager |
Franklin Templeton Distributors, Inc. (Distributors) | | Principal underwriter |
Franklin Templeton Investor Services, LLC (Investor Services) | | Transfer agent |
a. Management Fees
The Fund pays an investment management fee to Advisers based on the average daily net assets of the Fund as follows:
| | |
| Annualized Fee Rate | | Net Assets |
| 0.625% | | Up to and including $100 million |
| 0.500% | | Over $100 million, up to and including $250 million |
| 0.450% | | Over $250 million, up to and including $7.5 billion |
| 0.440% | | Over $7.5 billion, up to and including $10 billion |
| 0.430% | | Over $10 billion, up to and including $12.5 billion |
| 0.420% | | Over $12.5 billion, up to and including $15 billion |
| 0.400% | | In excess of $15 billion |
FI-39
Franklin Templeton Variable Insurance Products Trust
Notes to Financial Statements (continued)
Franklin Income Securities Fund
3. TRANSACTIONS WITH AFFILIATES (continued)
a. Management Fees (continued)
Under a subadvisory agreement, TIC, an affiliate of Advisers, provides subadvisory services to the Fund. The subadvisory fee is paid by Advisers based on the average daily net assets, and is not an additional expense of the Fund.
b. Administrative Fees
Under an agreement with Advisers, FT Services provides administrative services to the Fund. The fee is paid by Advisers based on the Fund’s average daily net assets, and is not an additional expense of the Fund.
c. Distribution Fees
The Board has adopted distribution plans for Class 2 and Class 4 shares pursuant to Rule 12b-1 under the 1940 Act. Under the Fund’s compensation distribution plans, the Fund pays Distributors for costs incurred in connection with the servicing, sale and distribution of the Fund’s shares up to 0.35% per year of its average daily net assets of each class. Some distribution fees are not charged on shares held by affiliates. The Board has agreed to limit the current rate to 0.25% per year for Class 2. The plan year, for purposes of monitoring compliance with the maximum annual plan rates, is February 1 through January 31.
d. Transfer Agent Fees
Investor Services, under terms of an agreement, performs shareholder servicing for the Fund and is not paid by the Fund for the services.
e. Other Affiliated Transactions
At December 31, 2013, Franklin Templeton Variable Insurance Products Trust – Franklin Templeton VIP Founding Funds Allocation Fund owned 5.42% of the Fund’s outstanding shares.
4. EXPENSE OFFSET ARRANGEMENT
The Fund has entered into an arrangement with its custodian whereby credits realized as a result of uninvested cash balances are used to reduce a portion of the Fund’s custodian expenses. During the year ended December 31, 2013, the custodian fees were reduced as noted in the Statement of Operations.
5. INCOME TAXES
For tax purposes, capital losses may be carried over to offset future capital gains. Capital loss carryforwards with no expiration, if any, must be fully utilized before those losses with expiration dates.
At December 31, 2013, capital loss carryforwards were as follows:
| | | | |
Capital loss carryforwards subject to expiration: | | | | |
2016 | | $ | 310,746,276 | |
2017 | | | 521,405,875 | |
2018 | | | 157,561,044 | |
| |
Capital loss carryforwards not subject to expiration: | | | | |
Long term | | | 54,314,457 | |
| | | | |
Total capital loss carryforwards | | $ | 1,044,027,652 | |
| | | | |
FI-40
Franklin Templeton Variable Insurance Products Trust
Notes to Financial Statements (continued)
Franklin Income Securities Fund
5. INCOME TAXES (continued)
During the year ended December 31, 2013, the Fund utilized $39,440,127 of capital loss carryforwards.
The tax character of distributions paid during the years ended December 31, 2013 and 2012, was as follows:
| | | | | | | | |
| | | 2013 | | | 2012 | |
Distributions paid from ordinary income | | $ | 470,005,823 | | | $ | 511,015,567 | |
| | | | |
At December 31, 2013, the cost of investments, net unrealized appreciation (depreciation), and undistributed ordinary income for income tax purposes were as follows:
| | | | |
Cost of investments | | $ | 6,239,593,241 | |
| | | | |
| |
Unrealized appreciation | | $ | 1,234,163,000 | |
Unrealized depreciation | | | (396,983,231 | ) |
| | | | |
Net unrealized appreciation (depreciation) | | $ | 837,179,769 | |
| | | | |
Distributable earnings - undistributed ordinary income | | $ | 356,211,451 | |
| | | | |
Differences between income and/or capital gains as determined on a book basis and a tax basis are primarily due to differing treatments of defaulted securities, passive foreign investment company shares, payments-in-kind, bond discounts and premiums, corporate actions and wash sales.
6. INVESTMENT TRANSACTIONS
Purchases and sales of investments (excluding short term securities) for the year ended December 31, 2013, aggregated $1,531,457,969 and $2,272,508,246 respectively.
7. CREDIT RISK
At December 31, 2013, the Fund had 34.42% of its portfolio invested in high yield, senior secured floating rate notes, or other securities rated below investment grade. These securities may be more sensitive to economic conditions causing greater price volatility and are potentially subject to a greater risk of loss due to default than higher rated securities.
8. UNFUNDED LOAN COMMITMENTS
The Fund enters into certain credit agreements, all or a portion of which may be unfunded. The Fund is obligated to fund these loan commitments at the borrowers’ discretion. Funded portions of credit agreements are presented on the Statement of Investments.
At December 31, 2013, unfunded commitments were as follows:
| | | | |
| Borrower | | Unfunded
Commitment | |
Community Health Systems Inc. | | $ | 15,000,000 | |
| | | | |
Unfunded loan commitments and funded portions of credit agreements are marked to market daily and any unrealized appreciation or depreciation is included in the Statement of Assets and Liabilities and the Statement of Operations.
FI-41
Franklin Templeton Variable Insurance Products Trust
Notes to Financial Statements (continued)
Franklin Income Securities Fund
9. CREDIT FACILITY
The Fund, together with other U.S. registered and foreign investment funds (collectively, Borrowers), managed by Franklin Templeton Investments, are borrowers in a joint syndicated senior unsecured credit facility totaling $1.5 billion (Global Credit Facility) which, after an extension of the original terms, matured on February 14, 2014. This Global Credit Facility provides a source of funds to the Borrowers for temporary and emergency purposes, including the ability to meet future unanticipated or unusually large redemption requests. Effective February 14, 2014, the Borrowers renewed the Global Credit Facility which matures on February 13, 2015.
Under the terms of the Global Credit Facility, the Fund shall, in addition to interest charged on any borrowings made by the Fund and other costs incurred by the Fund, pay its share of fees and expenses incurred in connection with the implementation and maintenance of the Global Credit Facility, based upon its relative share of the aggregate net assets of all of the Borrowers, including an annual commitment fee of 0.07% based upon the unused portion of the Global Credit Facility. These fees are reflected in other expenses on the Statement of Operations. During the year ended December 31, 2013, the Fund did not use the Global Credit Facility.
10. REDEMPTION IN-KIND
During the year ended December 31, 2012, the Fund realized $38,277,774 of net gains resulting from redemption in-kind in which a shareholder redeemed fund shares for securities held by the Fund rather than for cash. Because such gains are not taxable to the Fund, and are not netted with capital gains that are distributed to remaining shareholders, they have been reclassified from accumulated net realized gains to paid-in capital.
11. FAIR VALUE MEASUREMENTS
The Fund follows a fair value hierarchy that distinguishes between market data obtained from independent sources (observable inputs) and the Fund’s own market assumptions (unobservable inputs). These inputs are used in determining the value of the Fund’s financial instruments and are summarized in the following fair value hierarchy:
| | • | | Level 1 – quoted prices in active markets for identical financial instruments |
| | • | | Level 2 – other significant observable inputs (including quoted prices for similar financial instruments, interest rates, prepayment speed, credit risk, etc.) |
| | • | | Level 3 – significant unobservable inputs (including the Fund’s own assumptions in determining the fair value of financial instruments) |
The input levels are not necessarily an indication of the risk or liquidity associated with financial instruments at that level.
For movements between the levels within the fair value hierarchy, the Fund has adopted a policy of recognizing the transfers as of the date of the underlying event which caused the movement.
FI-42
Franklin Templeton Variable Insurance Products Trust
Notes to Financial Statements (continued)
Franklin Income Securities Fund
11. FAIR VALUE MEASUREMENTS (continued)
A summary of inputs used as of December 31, 2013, in valuing the Fund’s assets carried at fair value, is as follows:
| | | | | | | | | | | | | | | | |
| | | Level 1 | | | Level 2 | | | Level 3 | | | Total | |
| | | | |
Assets: | | | | | | | | | | | | | | | | |
Investments in Securities: | | | | | | | | | | | | | | | | |
Equity Investments:a | | | | | | | | | | | | | | | | |
Energy | | $ | 717,520,541 | | | $ | 33,107,040 | | | $ | — | | | $ | 750,627,581 | |
Financials | | | 567,646,043 | | | | 98,564,178 | | | | — | | | | 666,210,221 | |
Industrials | | | 232,107,651 | | | | 26,853,102 | | | | — | | | | 258,960,753 | |
Materials | | | 598,506,265 | | | | 4,162,400 | | | | — | | | | 602,668,665 | |
All Other Equity Investmentsb | | | 1,841,027,113 | | | | — | | | | — | | | | 1,841,027,113 | |
Equity-Linked Securities | | | — | | | | 189,691,033 | | | | — | | | | 189,691,033 | |
Convertible Bonds | | | — | | | | 55,754,186 | | | | — | | | | 55,754,186 | |
Corporate Bonds | | | — | | | | 2,367,332,462 | | | | — | | | | 2,367,332,462 | |
Senior Floating Rate Interests | | | — | | | | 233,422,166 | | | | — | | | | 233,422,166 | |
Escrow and Litigation Trust | | | — | | | | 14,000 | | | | — | c | | | 14,000 | |
Short Term Investments | | | — | | | | 111,064,830 | | | | — | | | | 111,064,830 | |
| | | | |
Total Investments in Securities | | $ | 3,956,807,613 | | | $ | 3,119,965,397 | | | $ | — | | | $ | 7,076,773,010 | |
| | | | |
Unfunded Loan Commitments | | $ | — | | | $ | 7,350 | | | $ | — | | | $ | 7,350 | |
aIncludes common, preferred, and convertible preferred stocks as well as other equity investments.
bFor detailed categories, see the accompanying Statement of Investments.
cIncludes securities determined to have no value at December 31, 2013.
A reconciliation of assets in which Level 3 inputs are used in determining fair value is presented when there are significant Level 3 investments at the end of the period.
12. NEW ACCOUNTING PRONOUNCEMENTS
In June 2013, the Financial Accounting Standards Board issued Accounting Standards Update (ASU) No. 2013-08, Investment Companies (Topic 946): Amendments to the Scope, Measurement, and Disclosure Requirements. The ASU modifies the criteria used in defining an investment company under U.S. Generally Accepted Accounting Principles and also sets forth certain measurement and disclosure requirements. Under the ASU, an entity that is registered under the 1940 Act automatically qualifies as an investment company. The ASU is effective for interim and annual reporting periods beginning after December 15, 2013. Management has reviewed the requirements and believes the adoption of this ASU will not have a material impact on the financial statements.
13. SUBSEQUENT EVENTS
The Fund has evaluated subsequent events through the issuance of the financial statements and determined that no events have occurred that require disclosure other than those already disclosed in the financial statements.
| | | | |
ABBREVIATIONS | | | | |
| Currency | | Selected Portfolio | | |
| | | | |
| EUR - Euro | | ADR - American Depositary Receipt | | |
| GBP - British Pound | | FHLMC - Federal Home Loan Mortgage Corp. | | |
| | FNMA - Federal National Mortgage Association | | |
| | FRN - Floating Rate Note | | |
| | L/C - Letter of Credit | | |
| | MTN - Medium Term Note | | |
| | PIK - Payment-In-Kind | | |
FI-43
Franklin Templeton Variable Insurance Products Trust
Franklin Income Securities Fund
Report of Independent Registered Public Accounting Firm
To the Board of Trustees and Shareholders of Franklin Templeton Variable Insurance Products Trust
In our opinion, the accompanying statement of assets and liabilities, including the statement of investments, and the related statements of operations and of changes in net assets and the financial highlights present fairly, in all material respects, the financial position of Franklin Income Securities Fund (the “Fund”) at December 31, 2013, the results of its operations for the year then ended, the changes in its net assets for each of the two years in the period then ended and the financial highlights for each of the five years in the period then ended, in conformity with accounting principles generally accepted in the United States of America. These financial statements and financial highlights (hereafter referred to as “financial statements”) are the responsibility of the Fund’s management. Our responsibility is to express an opinion on these financial statements based on our audits. We conducted our audits of these financial statements in accordance with the standards of the Public Company Accounting Oversight Board (United States). Those standards require that we plan and perform the audit to obtain reasonable assurance about whether the financial statements are free of material misstatement. An audit includes examining, on a test basis, evidence supporting the amounts and disclosures in the financial statements, assessing the accounting principles used and significant estimates made by management, and evaluating the overall financial statement presentation. We believe that our audits, which included confirmation of securities at December 31, 2013 by correspondence with the custodian and brokers, provides a reasonable basis for our opinion.
PricewaterhouseCoopers LLP
San Francisco, California
February 14, 2014
FI-44
Franklin Templeton Variable Insurance Products Trust
Tax Information (unaudited)
Franklin Income Securities Fund
Under Section 854(b)(1)(A) of the Internal Revenue Code, the Fund hereby reports 20.92% of the ordinary income dividends as income qualifying for the dividends received deduction for the fiscal year ended December 31, 2013.
FI-45
FRANKLIN RISING DIVIDENDS SECURITIES FUND
This annual report for Franklin Rising Dividends Securities Fund covers the fiscal year ended December 31, 2013.
Performance Summary as of 12/31/13
Average annual total return of Class 4 shares* represents the average annual change in value, assuming reinvestment of dividends and capital gains. Average returns smooth out variations in returns, which can be significant; they are not the same as year-by-year results.
Periods ended 12/31/13
| | | | | | | | | | | | |
| | | 1-Year | | | 5-Year | | | 10-Year | |
Average Annual Total Return | | | +29.57% | | | | +16.75% | | | | +7.64% | |
*For the period beginning 2/29/08, Class 4 performance reflects a 12b-1 fee expense of 0.35% per year, which affects future performance. Class 4 performance prior to 2/29/08 reflects historical Class 1 performance, which does not have a 12b-1 fee expense. Since 2/29/08 (effective date), the average annual total return of Class 4 shares was +9.22%. The Fund has a fee waiver associated with its investments in a Franklin Templeton money fund, contractually guaranteed through at least its current fiscal year end. Fund investment results reflect the fee waiver, to the extent applicable; without this reduction, the results would have been lower.
Total Return Index Comparison
for a Hypothetical $10,000 Investment (1/1/04–12/31/13)
The graph below shows the change in value of a hypothetical $10,000 investment in the Fund over the indicated period and includes reinvestment of any income or distributions. The Fund’s performance* is compared to the performance of the Standard & Poor’s® 500 Index (S&P 500®). One cannot invest directly in an index, and an index is not representative of the Fund’s portfolio. Please see Important Notes to Performance Information preceding the Fund Summaries.
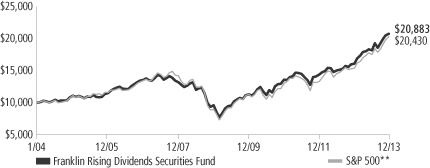
**Source: © 2014 Morningstar. Please see Index Descriptions following the Fund Summaries.
Franklin Rising Dividends Securities Fund – Class 4
Performance reflects the Fund’s Class 4 operating expenses, but does not include any contract fees, expenses or sales charges. If they had been included, performance would be lower. These charges and deductions, particularly for variable life policies, can have a significant effect on contract values and insurance benefits. See the contract prospectus for a complete description of these expenses, including sales charges.
Performance data represent past performance, which does not guarantee future results. Investment return and principal value will fluctuate, and you may have a gain or loss when you sell your shares.
Current performance may differ from figures shown.
FRD-1
Fund Goal and Main Investments: Franklin Rising Dividends Securities Fund seeks long-term capital appreciation, with preservation of capital as an important consideration. Under normal market conditions, the Fund invests at least 80% of its net assets in equity securities of companies that have paid rising dividends.
Performance Overview
You can find the Fund’s one-year total return in the Performance Summary. In comparison, the S&P 500 rose 32.39% for the same period.1 Please note the Fund employs a bottom-up stock selection process, and the managers invest in securities without regard to benchmark comparisons.
Economic and Market Overview
The U.S. economy showed ongoing signs of recovery during the 12-month period ended December 31, 2013, especially in the second half of the year. Business investment, net exports, and state and local government spending picked up in the second quarter, somewhat offsetting the impact of federal budget cuts. During the third quarter, the economy, as measured by gross domestic product, expanded at the strongest pace since the fourth quarter of 2011, underpinned by consumer spending and rising inventories. Historically low mortgage rates and improving sentiment aided the housing market recovery, evidenced by solid new and existing home sales, rising home prices, low inventories and multi-year lows in new foreclosures. Manufacturing expanded for most of the period under review, and the unemployment rate declined to 6.7% in December from 7.8% a year earlier.2 Inflation remained well below the Federal Reserve Board’s (Fed’s) 2.0% target.
The year started on a positive note with Congress passing a budget bill that averted automatic federal budget cuts and income tax increases. However, Washington’s lack of consensus on proposed expenditure reductions resulted in federal spending cuts starting in March. Fed Chairman Ben Bernanke indicated in May that the Fed might reduce monthly asset purchases, assuming ongoing U.S. recovery. In September, however, he announced that any reduction of Fed purchases would be postponed until U.S. economic growth strengthened. A U.S. budget impasse, which led to a temporary shutdown of non-essential government services in October, ended after Congress agreed to fund the government until January 2014 and raise the debt limit
1. Source: © 2014 Morningstar. One cannot invest directly in an index, and an index is not representative of the Fund’s portfolio. Please see Index Descriptions following the Fund Summaries.
2. Source: Bureau of Labor Statistics.
Fund Risks: All investments involve risks, including possible loss of principal. Value securities may not increase in price as anticipated or may decline further in value. While smaller and midsized companies may offer substantial opportunities for capital growth, they also involve heightened risks and should be considered speculative. Historically, smaller and midsized company securities have been more volatile in price than larger company securities, especially over the short term. The Fund is actively managed but there is no guarantee that the manager’s investment decisions will produce the desired results. The Fund’s prospectus also includes a description of the main investment risks.
FRD-2
until February. U.S. equity markets reached new highs after the resolution of the budget impasse and the Fed’s reassurance at its October meeting that it would continue its supportive monetary programs. In December, Congress passed a two-year budget deal that would ease automatic spending cuts in 2014 and lower the risk of another government shutdown. Meanwhile, the Fed announced it would reduce its monthly bond purchases by $10 billion beginning in January 2014. The Fed, however, committed to keeping interest rates low as long as the unemployment rate remained over 6.5% and inflation expectations remained low.
Rising corporate profits and generally favorable economic data bolstered investor confidence, helping markets overcome brief periods of sell-offs in reaction to Fed statements and to Washington’s fiscal negotiations. U.S. stocks generated strong 12-month returns as the S&P 500 and Dow Jones Industrial Average reached all-time highs during the period.3
Investment Strategy
We are a research-driven, fundamental investment adviser, pursuing a disciplined value-oriented strategy. As bottom-up investors concentrating primarily on individual securities, we seek fundamentally sound companies that we believe meet our screening criteria, which include consistent, substantial dividend increases; reinvested earnings; and strong balance sheets. We attempt to acquire such stocks at attractive prices, often when they are out of favor with other investors. In following these criteria, we do not necessarily focus on companies whose securities pay a high dividend but rather on companies that consistently raise their dividends.
Manager’s Discussion
During the 12 months under review, overweighting in the booming health care and industrials sectors and no exposure to the underperforming utilities and telecommunication services sectors benefited performance relative to the benchmark.4 Three holdings that helped Fund performance were West Pharmaceutical Services, Dover and United Technologies. The stock price of West Pharmaceutical Services, a medical devices manufacturer, rose as the company raised its earnings
3. Please see Index Descriptions following the Fund Summaries.
4. The health care sector comprises health care equipment and services; and pharmaceuticals, biotechnology and life sciences in the SOI. The industrials sector comprises aerospace and defense, commercial and professional services, electrical equipment, industrial conglomerates, machinery, trading companies and distributors, and transportation in the SOI.
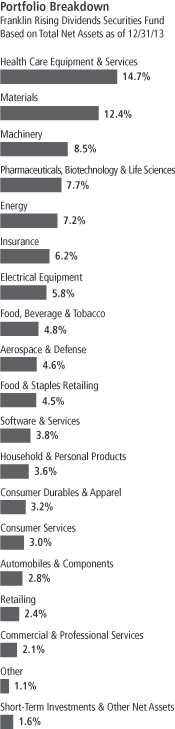
FRD-3
guidance as its business mix continued to shift toward higher value packaging systems products and as sales of its delivery systems products increased. West Pharmaceutical Services has raised its dividend for the past 21 years. Dover, a manufacturer of equipment and industrial products, recovered during the period with increased earnings and profits, particularly in segments related to oil drilling and refining, refrigeration and food equipment, and printing and identification. The company sought to optimize its product offerings with acquisitions that boosted results and a planned spin-off of certain communications technologies businesses. Dover has had 58 consecutive years of dividend increases. Profits rose for United Technologies, an aerospace and building industries products manufacturer, aided by its acquisition of aircraft-component maker Goodrich and sale of its non-core businesses in 2012, stronger revenue from its Pratt & Whitney and UTC Aerospace Systems businesses, and restructuring and cost control measures including staff reduction. The company has raised its dividend for the past 20 years.
The Fund’s stock selection in the financials and consumer discretionary sectors and overweighting in the materials sector hindered relative performance.5 Although most positions held by the Fund aided absolute performance, Brady and Kid Brands detracted from results. Brady, a manufacturer of industrial identification solutions, experienced lower earnings resulting from plans to divest its Asian die cut business. The company also incurred higher expenses from restructuring to focus on its identification solutions and workplace safety businesses. Kid Brands, a designer and producer of infant consumer products, reported lower earnings resulting from sales declines at large customers of its LaJobi and Soft Home businesses, discontinuation of product lines and brands, and closure of its U.K. operations. The company hopes to translate the success of its Sassy division products to its other businesses.
During the period, we initiated six new positions: Bunge, a global agribusiness and food company, which has 13 years of consecutive dividend increases; Target, a mass-market discount retailer with 46 years of consecutive dividend increases; QUALCOMM, a leading developer and innovator of advanced wireless technologies with a long history of dividend increases; Honeywell International, a diversified technology and manufacturing company, which has raised its dividend in eight of the
5. The financials sector comprises diversified financials and insurance in the SOI. The consumer discretionary sector comprises automobiles and components, consumer durables and apparel, consumer services, media and retailing in the SOI.
Top 10 Holdings
Franklin Rising Dividends Securities Fund 12/31/13
| | | | |
Company
Sector/Industry | | % of Total
Net Assets | |
| United Technologies Corp. | | | 4.4% | |
| Aerospace & Defense | | | | |
| Dover Corp. | | | 4.4% | |
| Machinery | | | | |
| Roper Industries Inc. | | | 4.4% | |
| Electrical Equipment | | | | |
| Praxair Inc. | | | 4.3% | |
| Materials | | | | |
| Chevron Corp. | | | 3.9% | |
| Energy | | | | |
| International Business Machines Corp. | | | 3.8% | |
| Software & Services | | | | |
| Johnson & Johnson | | | 3.4% | |
| Pharmaceuticals, Biotechnology & Life Sciences | | | | |
| Pentair Ltd. | | | 3.4% | |
| Machinery | | | | |
| Air Products and Chemicals Inc. | | | 3.4% | |
| Materials | | | | |
| Becton, Dickinson and Co. | | | 3.2% | |
| Health Care Equipment & Services | | | | |
The dollar value, number of shares or principal amount, and names of all portfolio holdings are listed in the Fund’s Statement of Investments (SOI).
FRD-4
past 10 years; United Parcel Service, the world’s largest package delivery company, which also has a long history of dividend increases; and Texas Instruments, a semiconductor manufacturer with 10 years of consecutive dividend increases. We did not add to or completely liquidate any existing positions. However, we did reduce our holdings in West Pharmaceutical Services, United Technologies, Dover, Roper Industries and Family Dollar Stores, among several others.
Our 10 largest positions on December 31, 2013, represented 38.6% of the Fund’s total net assets. It is interesting to note how these 10 companies would respond, in aggregate, to the Fund’s screening criteria based on a simple average of statistical measures. On average, these 10 companies have raised their dividends 32 years in a row and by 250% in the past 10 years. Their most recent year-over-year dividend increases averaged 11.4% with a yield of 1.8% on December 31, 2013, and a dividend payout ratio of 32%, based on estimates of calendar year 2013 operating earnings. The average price/earnings ratio was 18.6 times calendar year 2013 estimates versus 17.4 for that of the unmanaged S&P 500.
Thank you for your participation in Franklin Rising Dividends Securities Fund. We look forward to serving your future investment needs.
The foregoing information reflects our analysis, opinions and portfolio holdings as of December 31, 2013, the end of the reporting period. The way we implement our main investment strategies and the resulting portfolio holdings may change depending on factors such as market and economic conditions. These opinions may not be relied upon as investment advice or an offer for a particular security. The information is not a complete analysis of every aspect of any market, country, industry, security or the Fund. Statements of fact are from sources considered reliable, but the investment manager makes no representation or warranty as to their completeness or accuracy. Although historical performance is no guarantee of future results, these insights may help you understand our investment management philosophy.
FRD-5
Fund Expenses
As an investor in a variable insurance contract (Contract) that indirectly provides for investment in an underlying mutual fund, you can incur transaction and/or ongoing expenses at both the Fund level and the Contract level.
| • | | Transaction expenses can include sales charges (loads) on purchases, redemption fees, surrender fees, transfer fees and premium taxes. |
| • | | Ongoing expenses can include management fees, distribution and service (12b-1) fees, contract fees, annual maintenance fees, mortality and expense risk fees and other fees and expenses. All mutual funds and Contracts have some types of ongoing expenses. |
The expenses shown in the table are meant to highlight ongoing expenses at the Fund level only and do not include ongoing expenses at the Contract level, or transaction expenses at either the Fund or Contract level. While the Fund does not have transaction expenses, if the transaction and ongoing expenses at the Contract level were included, the expenses shown would be higher. You should consult your Contract prospectus or disclosure document for more information.
The table shows Fund-level ongoing expenses and can help you understand these expenses and compare them with those of other mutual funds offered through the Contract. The table assumes a $1,000 investment held for the six months indicated. Please refer to the Fund prospectus for additional information on operating expenses.
Actual Fund Expenses
The first line (Actual) of the table provides actual account values and expenses. The “Ending Account Value” is derived from the Fund’s actual return, which includes the effect of ongoing Fund expenses, but does not include the effect of ongoing Contract expenses.
You can estimate the Fund-level expenses you incurred during the period by following these steps. Of course, your account value and expenses will differ from those in this illustration:
| 1. | Divide your account value by $1,000. |
If an account had an $8,600 value, then $8,600 ÷ $1,000 = 8.6.
| 2. | Multiply the result by the number under the heading “Fund-Level Expenses Incurred During Period.” |
If Fund-Level Expenses Incurred During Period were $7.50, then 8.6 x $7.50 = $64.50.
In this illustration, the estimated expenses incurred this period at the Fund level are $64.50.
Franklin Rising Dividends Securities Fund – Class 4
FRD-6
Hypothetical Example for Comparison with Other Mutual Funds
Information in the second line (Hypothetical) of the table can help you compare ongoing expenses of the Fund with those of other mutual funds offered through the Contract. This information may not be used to estimate the actual ending account balance or expenses you incurred during the period. The hypothetical “Ending Account Value” is based on the Fund’s actual expense ratio and an assumed 5% annual rate of return before expenses, which does not represent the Fund’s actual return. The figure under the heading “Fund-Level Expenses Incurred During Period” shows the hypothetical expenses your account would have incurred under this scenario. You can compare this figure with the 5% hypothetical examples that appear in shareholder reports of other funds offered through a Contract.
| | | | | | | | | | | | |
| Class 4 | | Beginning
Account
Value 7/1/13 | | | Ending
Account
Value 12/31/13 | | | Fund-Level
Expenses Incurred
During Period*
7/1/13–12/31/13 | |
Actual | | $ | 1,000 | | | $ | 1,145.70 | | | $ | 5.19 | |
Hypothetical (5% return
before expenses) | | $ | 1,000 | | | $ | 1,020.37 | | | $ | 4.89 | |
*Expenses are calculated using the most recent six-month annualized expense ratio for the Fund’s Class 4 shares (0.96%), which does not include any ongoing expenses of the Contract for which the Fund is an investment option, multiplied by the average account value over the period, multiplied by 184/365 to reflect the one-half year period.
FRD-7
SUPPLEMENT DATED FEBRUARY 1, 2014
TOTHE PROSPECTUSES
DATED MAY 1, 2013
OF
FRANKLIN RISING DIVIDENDS SECURITIES FUND
(A series of Franklin Templeton Variable Insurance Products Trust)
The prospectus is amended as follows:
I. The “Fund Summaries – Portfolio Managers” section on page FRD-S4 is revised to read as follows:
Portfolio Managers
DONALD G. TAYLOR, CPA Chief Investment Officer of Advisory Services and portfolio manager of the Fund since 1996.
NICHOLAS P.B. GETAZ, CFA Research Analyst of Advisory Services and portfolio manager of the Fund since February 2014.
BRUCE C. BAUGHMAN, CPA Senior Vice President of Advisory Services and portfolio manager of the Fund since inception (1992).
WILLIAM J. LIPPMAN President of Advisory Services and portfolio manager of the Fund since inception (1992).
II. The “Fund Details – Management” section disclosure concerning the portfolio management team beginning on page FRD-D6 is revised to read as follows:
The Fund is managed by a team of dedicated professionals focused on investments that have paid rising dividends. The portfolio managers of the team are as follows:
| | |
DONALD G. TAYLOR, CPA Chief Investment Officer of Advisory Services | | Mr. Taylor has been the lead portfolio manager of the Fund since 1996. He has primary responsibility for the investments of the Fund. He has final authority over all aspects of the Fund’s investment portfolio, including but not limited to, purchases and sales of individual securities, portfolio risk assessment, and the management of daily cash balances in accordance with anticipated investment management requirements. The degree to which he may perform these functions, and the nature of these functions, may change from time to time. He joined Franklin Templeton Investments in 1996. |
| |
NICHOLAS P.B. GETAZ, CFA Research Analyst of Advisory Services | | Mr. Getaz has been portfolio manager of the Fund since February 2014, providing support to the lead portfolio manager(s) as needed. He joined Franklin Templeton Investments in 2011. |
FRD-8
| | |
BRUCE C. BAUGHMAN, CPA Senior Vice President of Advisory Services | | Mr. Baughman has been a portfolio manager of the Fund since its inception, providing support to the lead portfolio manager(s) as needed. He joined Franklin Templeton Investments in 1988. |
| |
WILLIAM J. LIPPMAN President of Advisory Services | | Mr. Lippman has been a portfolio manager of the Fund since its inception, providing support to the lead portfolio manager(s) as needed. He joined Franklin Templeton Investments in 1988. |
Please keep this supplement for future reference.
FRD-9
Franklin Templeton Variable Insurance Products Trust
Financial Highlights
Franklin Rising Dividends Securities Fund
| | | | | | | | | | | | | | | | | | | | |
| | | Year Ended December 31, | |
| Class 1 | | 2013 | | | 2012 | | | 2011 | | | 2010 | | | 2009 | |
| | | | |
Per share operating performance | | | | | | | | | | | | | | | | | | | | |
(for a share outstanding throughout the year) | | | | | | | | | | | | | | | | | | | | |
Net asset value, beginning of year | | $ | 22.03 | | | $ | 20.01 | | | $ | 19.15 | | | $ | 16.13 | | | $ | 13.96 | |
| | | | |
Income from investment operationsa: | | | | | | | | | | | | | | | | | | | | |
Net investment incomeb | | | 0.40 | | | | 0.41 | | | | 0.36 | | | | 0.32 | | | | 0.14 | c |
Net realized and unrealized gains (losses) | | | 6.16 | | | | 2.00 | | | | 0.83 | | | | 3.01 | | | | 2.28 | |
| | | | |
Total from investment operations | | | 6.56 | | | | 2.41 | | | | 1.19 | | | | 3.33 | | | | 2.42 | |
| | | | |
Less distributions from net investment income | | | (0.45 | ) | | | (0.39 | ) | | | (0.33 | ) | | | (0.31 | ) | | | (0.25 | ) |
| | | | |
Net asset value, end of year | | $ | 28.14 | | | $ | 22.03 | | | $ | 20.01 | | | $ | 19.15 | | | $ | 16.13 | |
| | | | |
| | | | | |
Total returnd | | | 30.05% | | | | 12.18% | | | | 6.29% | | | | 20.94% | | | | 17.67% | |
Ratios to average net assets | | | | | | | | | | | | | | | | | | | | |
Expenses | | | 0.61% | | | | 0.63% | | | | 0.63% | | | | 0.64% | | | | 0.65% | e |
Net investment income | | | 1.59% | | | | 1.96% | | | | 1.87% | | | | 1.88% | | | | 0.99% | c |
| | | | | |
Supplemental data | | | | | | | | | | | | | | | | | | | | |
Net assets, end of year (000’s) | | $ | 168,380 | | | $ | 141,455 | | | $ | 140,297 | | | $ | 148,544 | | | $ | 139,816 | |
Portfolio turnover rate | | | 0.07% | | | | 11.19% | | | | 12.76% | | | | 8.97% | | | | 16.99% | |
aThe amount shown for a share outstanding throughout the period may not correlate with the Statement of Operations for the period due to the timing of sales and repurchases of the Fund shares in relation to income earned and/or fluctuating market value of the investments of the Fund.
bBased on average daily shares outstanding.
cNet investment income per share includes approximately $(0.15) per share as a return of capital adjustment to a previously recorded special dividend received by the Fund. Excluding this non-recurring amount, the ratio of net investment income to average net assets would have been 2.07%.
dTotal return does not include fees, charges or expenses imposed by the variable annuity and life insurance contracts for which the Franklin Templeton Variable Insurance Products Trust serves as an underlying investment vehicle.
eBenefit of expense reduction rounds to less than 0.01%.
The accompanying notes are an integral part of these financial statements.
FRD-10
Franklin Templeton Variable Insurance Products Trust
Financial Highlights (continued)
Franklin Rising Dividends Securities Fund
| | | | | | | | | | | | | | | | | | | | |
| | | Year Ended December 31, | |
| Class 2 | | 2013 | | | 2012 | | | 2011 | | | 2010 | | | 2009 | |
| | | | |
Per share operating performance | | | | | | | | | | | | | | | | | | | | |
(for a share outstanding throughout the year) | | | | | | | | | | | | | | | | | | | | |
Net asset value, beginning of year | | $ | 21.64 | | | $ | 19.65 | | | $ | 18.82 | | | $ | 15.86 | | | $ | 13.72 | |
| | | | |
Income from investment operationsa: | | | | | | | | | | | | | | | | | | | | |
Net investment incomeb | | | 0.33 | | | | 0.35 | | | | 0.31 | | | | 0.28 | | | | 0.10 | c |
Net realized and unrealized gains (losses) | | | 6.04 | | | | 1.98 | | | | 0.81 | | | | 2.95 | | | | 2.24 | |
| | | | |
Total from investment operations | | | 6.37 | | | | 2.33 | | | | 1.12 | | | | 3.23 | | | | 2.34 | |
| | | | |
Less distributions from net investment income | | | (0.39 | ) | | | (0.34 | ) | | | (0.29 | ) | | | (0.27 | ) | | | (0.20 | ) |
| | | | |
Net asset value, end of year | | $ | 27.62 | | | $ | 21.64 | | | $ | 19.65 | | | $ | 18.82 | | | $ | 15.86 | |
| | | | |
| | | | | |
Total returnd | | | 29.69% | | | | 11.96% | | | | 6.00% | | | | 20.64% | | | | 17.34% | |
Ratios to average net assets | | | | | | | | | | | | | | | | | | | | |
Expenses | | | 0.86% | | | | 0.88% | | | | 0.88% | | | | 0.89% | | | | 0.90% | e |
Net investment income | | | 1.34% | | | | 1.71% | | | | 1.62% | | | | 1.63% | | | | 0.74% | c |
| | | | | |
Supplemental data | | | | | | | | | | | | | | | | | | | | |
Net assets, end of year (000’s) | | $ | 1,752,012 | | | $ | 1,550,084 | | | $ | 1,523,396 | | | $ | 1,572,732 | | | $ | 1,371,351 | |
Portfolio turnover rate | | | 0.07% | | | | 11.19% | | | | 12.76% | | | | 8.97% | | | | 16.99% | |
aThe amount shown for a share outstanding throughout the period may not correlate with the Statement of Operations for the period due to the timing of sales and repurchases of the Fund shares in relation to income earned and/or fluctuating market value of the investments of the Fund.
bBased on average daily shares outstanding.
cNet investment income per share includes approximately $(0.15) per share as a return of capital adjustment to a previously recorded special dividend received by the Fund. Excluding this non-recurring amount, the ratio of net investment income to average net assets would have been 1.82%.
dTotal return does not include fees, charges or expenses imposed by the variable annuity and life insurance contracts for which the Franklin Templeton Variable Insurance Products Trust serves as an underlying investment vehicle.
eBenefit of expense reduction rounds to less than 0.01%.
The accompanying notes are an integral part of these financial statements.
FRD-11
Franklin Templeton Variable Insurance Products Trust
Financial Highlights (continued)
Franklin Rising Dividends Securities Fund
| | | | | | | | | | | | | | | | | | | | |
| | | Year Ended December 31, | |
| Class 4 | | 2013 | | | 2012 | | | 2011 | | | 2010 | | | 2009 | |
| | | | |
Per share operating performance | | | | | | | | | | | | | | | | | | | | |
(for a share outstanding throughout the year) | | | | | | | | | | | | | | | | | | | | |
Net asset value, beginning of year | | $ | 21.78 | | | $ | 19.83 | | | $ | 19.04 | | | $ | 16.09 | | | $ | 13.92 | |
| | | | |
Income from investment operationsa: | | | | | | | | | | | | | | | | | | | | |
Net investment incomeb | | | 0.32 | | | | 0.35 | | | | 0.31 | | | | 0.32 | | | | 0.13 | c |
Net realized and unrealized gains (losses) | | | 6.07 | | | | 1.96 | | | | 0.80 | | | | 2.94 | | | | 2.24 | |
| | | | |
Total from investment operations | | | 6.39 | | | | 2.31 | | | | 1.11 | | | | 3.26 | | | | 2.37 | |
| | | | |
Less distributions from net investment income | | | (0.41 | ) | | | (0.36 | ) | | | (0.32 | ) | | | (0.31 | ) | | | (0.20 | ) |
| | | | |
Net asset value, end of year | | $ | 27.76 | | | $ | 21.78 | | | $ | 19.83 | | | $ | 19.04 | | | $ | 16.09 | |
| | | | |
| | | | | |
Total returnd | | | 29.57% | | | | 11.78% | | | | 5.89% | | | | 20.62% | | | | 17.22% | |
Ratios to average net assets | | | | | | | | | | | | | | | | | | | | |
Expenses | | | 0.96% | | | | 0.98% | | | | 0.98% | | | | 0.99% | | | | 1.00% | e |
Net investment income | | | 1.24% | | | | 1.61% | | | | 1.52% | | | | 1.53% | | | | 0.64% | c |
| | | | | |
Supplemental data | | | | | | | | | | | | | | | | | | | | |
Net assets, end of year (000’s) | | $ | 12,028 | | | $ | 6,432 | | | $ | 3,020 | | | $ | 1,007 | | | $ | 15 | |
Portfolio turnover rate | | | 0.07% | | | | 11.19% | | | | 12.76% | | | | 8.97% | | | | 16.99% | |
aThe amount shown for a share outstanding throughout the period may not correlate with the Statement of Operations for the period due to the timing of sales and repurchases of the Fund shares in relation to income earned and/or fluctuating market value of the investments of the Fund.
bBased on average daily shares outstanding.
cNet investment income per share includes approximately $(0.15) per share as a return of capital adjustment to a previously recorded special dividend received by the Fund. Excluding this non-recurring amount, the ratio of net investment income to average net assets would have been 1.72%.
dTotal return does not include fees, charges or expenses imposed by the variable annuity and life insurance contracts for which the Franklin Templeton Variable Insurance Products Trust serves as an underlying investment vehicle.
eBenefit of expense reduction rounds to less than 0.01%.
The accompanying notes are an integral part of these financial statements.
FRD-12
Franklin Templeton Variable Insurance Products Trust
Statement of Investments, December 31, 2013
| | | | | | | | |
| Franklin Rising Dividends Securities Fund | | Shares | | | Value | |
Common Stocks 98.4% | | | | | | | | |
Aerospace & Defense 4.6% | | | | | | | | |
General Dynamics Corp. | | | 38,000 | | | $ | 3,630,900 | |
Honeywell International Inc. | | | 2,500 | | | | 228,425 | |
United Technologies Corp. | | | 744,000 | | | | 84,667,200 | |
| | | | | | | | |
| | | | | | | 88,526,525 | |
| | | | | | | | |
Automobiles & Components 2.8% | | | | | | | | |
Johnson Controls Inc. | | | 1,040,500 | | | | 53,377,650 | |
| | | | | | | | |
Commercial & Professional Services 2.1% | | | | | | | | |
ABM Industries Inc. | | | 934,288 | | | | 26,711,294 | |
Cintas Corp. | | | 225,700 | | | | 13,449,463 | |
| | | | | | | | |
| | | | | | | 40,160,757 | |
| | | | | | | | |
Consumer Durables & Apparel 3.2% | | | | | | | | |
a Kid Brands Inc. | | | 265,947 | | | | 271,266 | |
Leggett & Platt Inc. | | | 471,800 | | | | 14,597,492 | |
NIKE Inc., B | | | 554,000 | | | | 43,566,560 | |
Superior Uniform Group Inc. | | | 237,100 | | | | 3,670,308 | |
| | | | | | | | |
| | | | | | | 62,105,626 | |
| | | | | | | | |
Consumer Services 3.0% | | | | | | | | |
Hillenbrand Inc. | | | 1,091,300 | | | | 32,106,046 | |
Matthews International Corp., A | | | 39,000 | | | | 1,661,790 | |
McDonald’s Corp. | | | 254,345 | | | | 24,679,095 | |
| | | | | | | | |
| | | | | | | 58,446,931 | |
| | | | | | | | |
Diversified Financials 0.4% | | | | | | | | |
State Street Corp. | | | 110,500 | | | | 8,109,595 | |
| | | | | | | | |
Electrical Equipment 5.8% | | | | | | | | |
Brady Corp., A | | | 878,579 | | | | 27,174,449 | |
Roper Industries Inc. | | | 606,750 | | | | 84,144,090 | |
| | | | | | | | |
| | | | | | | 111,318,539 | |
| | | | | | | | |
Energy 7.2% | | | | | | | | |
Chevron Corp. | | | 601,000 | | | | 75,070,910 | |
Exxon Mobil Corp. | | | 330,500 | | | | 33,446,600 | |
Occidental Petroleum Corp. | | | 312,190 | | | | 29,689,269 | |
| | | | | | | | |
| | | | | | | 138,206,779 | |
| | | | | | | | |
Food & Staples Retailing 4.5% | | | | | | | | |
Wal-Mart Stores Inc. | | | 728,800 | | | | 57,349,272 | |
Walgreen Co. | | | 531,300 | | | | 30,517,872 | |
| | | | | | | | |
| | | | | | | 87,867,144 | |
| | | | | | | | |
Food, Beverage & Tobacco 4.8% | | | | | | | | |
Archer-Daniels-Midland Co. | | | 713,000 | | | | 30,944,200 | |
Bunge Ltd. | | | 5,000 | | | | 410,550 | |
McCormick & Co. Inc. | | | 441,000 | | | | 30,393,720 | |
PepsiCo Inc. | | | 363,900 | | | | 30,181,866 | |
| | | | | | | | |
| | | | | | | 91,930,336 | |
| | | | | | | | |
Health Care Equipment & Services 14.7% | | | | | | | | |
Abbott Laboratories | | | 681,800 | | | | 26,133,394 | |
Becton, Dickinson and Co. | | | 565,143 | | | | 62,442,650 | |
Hill-Rom Holdings Inc. | | | 117,103 | | | | 4,841,038 | |
FRD-13
Franklin Templeton Variable Insurance Products Trust
Statement of Investments, December 31, 2013 (continued)
| | | | | | | | |
| Franklin Rising Dividends Securities Fund | | Shares | | | Value | |
Common Stocks (continued) | | | | | | | | |
Health Care Equipment & Services (continued) | | | | | | | | |
Medtronic Inc. | | | 730,000 | | | $ | 41,894,700 | |
Stryker Corp. | | | 630,400 | | | | 47,368,256 | |
Teleflex Inc. | | | 484,753 | | | | 45,498,917 | |
West Pharmaceutical Services Inc. | | | 1,132,233 | | | | 55,547,351 | |
| | | | | | | | |
| | | | | | | 283,726,306 | |
| | | | | | | | |
Household & Personal Products 3.6% | | | | | | | | |
Colgate-Palmolive Co. | | | 191,000 | | | | 12,455,110 | |
The Procter & Gamble Co. | | | 707,600 | | | | 57,605,716 | |
| | | | | | | | |
| | | | | | | 70,060,826 | |
| | | | | | | | |
Industrial Conglomerates 0.4% | | | | | | | | |
Carlisle Cos. Inc. | | | 96,261 | | | | 7,643,123 | |
| | | | | | | | |
Insurance 6.2% | | | | | | | | |
Aflac Inc. | | | 276,200 | | | | 18,450,160 | |
Arthur J. Gallagher & Co. | | | 744,000 | | | | 34,915,920 | |
The Chubb Corp. | | | 45,000 | | | | 4,348,350 | |
Erie Indemnity Co., A | | | 526,085 | | | | 38,467,335 | |
Mercury General Corp. | | | 60,200 | | | | 2,992,542 | |
Old Republic International Corp. | | | 830,708 | | | | 14,346,327 | |
RLI Corp. | | | 62,071 | | | | 6,044,474 | |
| | | | | | | | |
| | | | | | | 119,565,108 | |
| | | | | | | | |
Machinery 8.5% | | | | | | | | |
Donaldson Co. Inc. | | | 350,068 | | | | 15,213,955 | |
Dover Corp. | | | 872,000 | | | | 84,182,880 | |
Pentair Ltd. | | | 844,000 | | | | 65,553,480 | |
| | | | | | | | |
| | | | | | | 164,950,315 | |
| | | | | | | | |
Materials 12.4% | | | | | | | | |
Air Products and Chemicals Inc. | | | 580,700 | | | | 64,910,646 | |
Albemarle Corp. | | | 694,700 | | | | 44,037,033 | |
Bemis Co. Inc. | | | 323,300 | | | | 13,242,368 | |
Ecolab Inc. | | | 66,000 | | | | 6,881,820 | |
Nucor Corp. | | | 499,002 | | | | 26,636,727 | |
Praxair Inc. | | | 646,260 | | | | 84,033,188 | |
| | | | | | | | |
| | | | | | | 239,741,782 | |
| | | | | | | | |
Media 0.3% | | | | | | | | |
John Wiley & Sons Inc., A | | | 116,500 | | | | 6,430,800 | |
| | | | | | | | |
Pharmaceuticals, Biotechnology & Life Sciences 7.7% | | | | | | | | |
AbbVie Inc. | | | 505,300 | | | | 26,684,893 | |
Johnson & Johnson | | | 726,100 | | | | 66,503,499 | |
Pfizer Inc. | | | 1,783,100 | | | | 54,616,353 | |
| | | | | | | | |
| | | | | | | 147,804,745 | |
| | | | | | | | |
Retailing 2.4% | | | | | | | | |
Family Dollar Stores Inc. | | | 711,835 | | | | 46,247,920 | |
Ross Stores Inc. | | | 3,000 | | | | 224,790 | |
Target Corp. | | | 3,000 | | | | 189,810 | |
| | | | | | | | |
| | | | | | | 46,662,520 | |
| | | | | | | | |
FRD-14
Franklin Templeton Variable Insurance Products Trust
Statement of Investments, December 31, 2013 (continued)
| | | | | | | | |
| Franklin Rising Dividends Securities Fund | | Shares | | | Value | |
Common Stocks (continued) | | | | | | | | |
Semiconductors & Semiconductor Equipment 0.0%† | | | | | | | | |
Cohu Inc. | | | 50,300 | | | $ | 528,150 | |
Texas Instruments Inc. | | | 4,500 | | | | 197,595 | |
| | | | | | | | |
| | | | | | | 725,745 | |
| | | | | | | | |
Software & Services 3.8% | | | | | | | | |
International Business Machines Corp. | | | 388,000 | | | | 72,777,160 | |
| | | | | | | | |
Technology Hardware & Equipment 0.0%† | | | | | | | | |
QUALCOMM Inc. | | | 3,000 | | | | 222,750 | |
| | | | | | | | |
Trading Companies & Distributors 0.0%† | | | | | | | | |
W.W. Grainger Inc. | | | 1,000 | | | | 255,420 | |
| | | | | | | | |
Transportation 0.0%† | | | | | | | | |
United Parcel Service Inc., B | | | 2,000 | | | | 210,160 | |
| | | | | | | | |
Total Common Stocks (Cost $993,255,991) | | | | | | | 1,900,826,642 | |
| | | | | | | | |
Short Term Investments (Cost $29,912,786) 1.5% | | | | | | | | |
Money Market Funds 1.5% | | | | | | | | |
a,b Institutional Fiduciary Trust Money Market Portfolio | | | 29,912,786 | | | | 29,912,786 | |
| | | | | | | | |
Total Investments (Cost $1,023,168,777) 99.9% | | | | | | | 1,930,739,428 | |
Other Assets, less Liabilities 0.1% | | | | | | | 1,679,692 | |
| | | | | | | | |
Net Assets 100.0% | | | | | | $ | 1,932,419,120 | |
| | | | | | | | |
† Rounds to less than 0.1% of net assets.
a Non-income producing.
b See Note 7 regarding investments in the Institutional Fiduciary Trust Money Market Portfolio.
The accompanying notes are an integral part of these financial statements.
FRD-15
Franklin Templeton Variable Insurance Products Trust
Financial Statements
Statement of Assets and Liabilities
December 31, 2013
| | | | |
| | | Franklin Rising
Dividends
Securities Fund | |
Assets: | | | | |
Investments in securities: | | | | |
Cost - Unaffiliated issuers | | $ | 993,255,991 | |
Cost - Sweep Money Fund (Note 7) | | | 29,912,786 | |
| | | | |
Total cost of investments | | $ | 1,023,168,777 | |
| | | | |
Value - Unaffiliated issuers | | $ | 1,900,826,642 | |
Value - Sweep Money Fund (Note 7) | | | 29,912,786 | |
| | | | |
Total value of investments | | | 1,930,739,428 | |
Receivables: | | | | |
Investment securities sold | | | 2,551,613 | |
Capital shares sold | | | 199,514 | |
Dividends | | | 3,016,773 | |
Other assets | | | 40 | |
| | | | |
Total assets | | | 1,936,507,368 | |
| | | | |
Liabilities: | | | | |
Payables: | | | | |
Capital shares redeemed | | | 2,188,598 | |
Management fees | | | 968,555 | |
Distribution fees | | | 731,600 | |
Accrued expenses and other liabilities | | | 199,495 | |
| | | | |
Total liabilities | | | 4,088,248 | |
| | | | |
Net assets, at value | | $ | 1,932,419,120 | |
| | | | |
Net assets consist of: | | | | |
Paid-in capital | | $ | 965,100,554 | |
Undistributed net investment income | | | 25,044,982 | |
Net unrealized appreciation (depreciation) | | | 907,570,651 | |
Accumulated net realized gain (loss) | | | 34,702,933 | |
| | | | |
Net assets, at value | | $ | 1,932,419,120 | |
| | | | |
Class 1: | | | | |
Net assets, at value | | $ | 168,379,553 | |
| | | | |
Shares outstanding | | | 5,983,438 | |
| | | | |
Net asset value and maximum offering price per share | | $ | 28.14 | |
| | | | |
Class 2: | | | | |
Net assets, at value | | $ | 1,752,011,768 | |
| | | | |
Shares outstanding | | | 63,425,838 | |
| | | | |
Net asset value and maximum offering price per share | | $ | 27.62 | |
| | | | |
Class 4: | | | | |
Net assets, at value | | $ | 12,027,799 | |
| | | | |
Shares outstanding | | | 433,229 | |
| | | | |
Net asset value and maximum offering price per share | | $ | 27.76 | |
| | | | |
The accompanying notes are an integral part of these financial statements.
FRD-16
Franklin Templeton Variable Insurance Products Trust
Financial Statements (continued)
Statement of Operations
for the year ended December 31, 2013
| | | | |
| | | Franklin Rising
Dividends
Securities Fund | |
Investment income: | | | | |
Dividends | | $ | 40,621,408 | |
| | | | |
Expenses: | | | | |
Management fees (Note 3a) | | | 11,067,678 | |
Distribution fees: (Note 3c) | | | | |
Class 2 | | | 4,197,729 | |
Class 4 | | | 34,259 | |
Unaffiliated transfer agent fees | | | 814 | |
Custodian fees (Note 4) | | | 16,234 | |
Reports to shareholders | | | 156,563 | |
Professional fees | | | 61,999 | |
Trustees’ fees and expenses | | | 7,215 | |
Other | | | 27,705 | |
| | | | |
Total expenses | | | 15,570,196 | |
| | | | |
Net investment income | | | 25,051,212 | |
| | | | |
Realized and unrealized gains (losses): | | | | |
Net realized gain (loss) from investments | | | 109,495,187 | |
Net change in unrealized appreciation (depreciation) on investments | | | 341,536,473 | |
| | | | |
Net realized and unrealized gain (loss) | | | 451,031,660 | |
| | | | |
Net increase (decrease) in net assets resulting from operations | | $ | 476,082,872 | |
| | | | |
The accompanying notes are an integral part of these financial statements.
FRD-17
Franklin Templeton Variable Insurance Products Trust
Financial Statements (continued)
Statements of Changes in Net Assets
| | | | | | | | |
| | | Franklin Rising Dividends
Securities Fund | |
| | | Year Ended December 31, | |
| | | 2013 | | | 2012 | |
| | | | |
Increase (decrease) in net assets: | | | | | | | | |
Operations: | | | | | | | | |
Net investment income | | $ | 25,051,212 | | | $ | 29,425,590 | |
Net realized gain (loss) from investments | | | 109,495,187 | | | | 50,961,507 | |
Net change in unrealized appreciation (depreciation) on investments | | | 341,536,473 | | | | 110,558,680 | |
| | | | |
Net increase (decrease) in net assets resulting from operations | | | 476,082,872 | | | | 190,945,777 | |
| | | | |
Distributions to shareholders from: | | | | | | | | |
Net investment income: | | | | | | | | |
Class 1 | | | (2,772,388 | ) | | | (2,577,724 | ) |
Class 2 | | | (26,490,890 | ) | | | (24,994,784 | ) |
Class 4 | | | (163,605 | ) | | | (85,528 | ) |
| | | | |
Total distributions to shareholders | | | (29,426,883 | ) | | | (27,658,036 | ) |
| | | | |
Capital share transactions: (Note 2) | | | | | | | | |
Class 1 | | | (11,198,645 | ) | | | (12,542,862 | ) |
Class 2 | | | (204,341,308 | ) | | | (122,472,505 | ) |
Class 4 | | | 3,331,799 | | | | 2,986,631 | |
| | | | |
Total capital share transactions | | | (212,208,154 | ) | | | (132,028,736 | ) |
| | | | |
Net increase (decrease) in net assets | | | 234,447,835 | | | | 31,259,005 | |
Net assets: | | | | | | | | |
Beginning of year | | | 1,697,971,285 | | | | 1,666,712,280 | |
| | | | |
End of year | | $ | 1,932,419,120 | | | $ | 1,697,971,285 | |
| | | | |
Undistributed net investment income included in net assets: | | | | | | | | |
End of year | | $ | 25,044,982 | | | $ | 29,420,653 | |
| | | | |
The accompanying notes are an integral part of these financial statements.
FRD-18
Franklin Templeton Variable Insurance Products Trust
Notes to Financial Statements
Franklin Rising Dividends Securities Fund
1. ORGANIZATION AND SIGNIFICANT ACCOUNTING POLICIES
Franklin Templeton Variable Insurance Products Trust (Trust) is registered under the Investment Company Act of 1940, as amended, (1940 Act) as an open-end investment company, consisting of twenty separate funds. The Franklin Rising Dividends Securities Fund (Fund) is included in this report. The financial statements of the remaining funds in the Trust are presented separately. Shares of the Fund are generally sold only to insurance company separate accounts to fund the benefits of variable life insurance policies or variable annuity contracts. At December 31, 2013, 45.69% of the Fund’s shares were held through one insurance company. Investment activities of these insurance company separate accounts could have a material impact on the Fund. The Fund offers three classes of shares: Class 1, Class 2, and Class 4. Each class of shares differs by its distribution fees, voting rights on matters affecting a single class and its exchange privilege.
The following summarizes the Fund’s significant accounting policies.
a. Financial Instrument Valuation
The Fund’s investments in financial instruments are carried at fair value daily. Fair value is the price that would be received to sell an asset or paid to transfer a liability in an orderly transaction between market participants on the measurement date. The Fund calculates the net asset value (NAV) per share at the close of the New York Stock Exchange (NYSE), generally at 4p.m. Eastern time (NYSE close) on each day the NYSE is open for trading. Under procedures approved by the Trust’s Board of Trustees (the Board), the Fund’s administrator, investment manager and other affiliates have formed the Valuation and Liquidity Oversight Committee (VLOC). The VLOC provides administration and oversight of the Fund’s valuation policies and procedures, which are approved annually by the Board. Among other things, these procedures allow the Fund to utilize independent pricing services, quotations from securities and financial instrument dealers, and other market sources to determine fair value.
Equity securities listed on an exchange or on the NASDAQ National Market System are valued at the last quoted sale price or the official closing price of the day, respectively. Over-the-counter securities are valued within the range of the most recent quoted bid and ask prices. Securities that trade in multiple markets or on multiple exchanges are valued according to the broadest and most representative market. Certain equity securities are valued based upon fundamental characteristics or relationships to similar securities. Investments in open-end mutual funds are valued at the closing net asset value.
The Fund has procedures to determine the fair value of financial instruments for which market prices are not reliable or readily available. Under these procedures, the VLOC convenes on a regular basis to review such financial instruments and considers a number of factors, including significant unobservable valuation inputs, when arriving at fair value. The VLOC primarily employs a market-based approach which may use related or comparable assets or liabilities, recent transactions, market multiples, book values, and other relevant information for the investment to determine the fair value of the investment. An income-based valuation approach may also be used in which the anticipated future cash flows of the investment are discounted to calculate fair value. Discounts may also be applied due to the nature or duration of any restrictions on the disposition of the investments. Due to the inherent uncertainty of valuations of such investments, the fair values may differ significantly from the values that would have been used had an active market existed. The VLOC employs various methods for calibrating these valuation approaches including a regular review of key inputs and assumptions, transactional back-testing or disposition analysis, and reviews of any related market activity.
b. Income Taxes
It is the Fund’s policy to qualify as a regulated investment company under the Internal Revenue Code. The Fund intends to distribute to shareholders substantially all of its taxable income and net realized gains to relieve it from federal income and if applicable, excise taxes. As a result, no provision for U.S. federal income taxes is required.
The Fund recognizes the tax benefits of uncertain tax positions only when the position is “more likely than not” to be sustained upon examination by the tax authorities based on the technical merits of the tax position. As of December 31, 2013, and for all
FRD-19
Franklin Templeton Variable Insurance Products Trust
Notes to Financial Statements (continued)
Franklin Rising Dividends Securities Fund
1. ORGANIZATION AND SIGNIFICANT ACCOUNTING POLICIES (continued)
b. Income Taxes (continued)
open tax years, the Fund has determined that no liability for unrecognized tax benefits is required in the Fund’s financial statements related to uncertain tax positions taken on a tax return (or expected to be taken on future tax returns). Open tax years are those that remain subject to examination and are based on each tax jurisdiction statute of limitation.
c. Security Transactions, Investment Income, Expenses and Distributions
Security transactions are accounted for on trade date. Realized gains and losses on security transactions are determined on a specific identification basis. Estimated expenses are accrued daily. Dividend income is recorded on the ex-dividend date. Distributions to shareholders are recorded on the ex-dividend date and are determined according to income tax regulations (tax basis). Distributable earnings determined on a tax basis may differ from earnings recorded in accordance with accounting principles generally accepted in the United States of America. These differences may be permanent or temporary. Permanent differences are reclassified among capital accounts to reflect their tax character. These reclassifications have no impact on net assets or the results of operations. Temporary differences are not reclassified, as they may reverse in subsequent periods.
Common expenses incurred by the Trust are allocated among the funds based on the ratio of net assets of each fund to the combined net assets of the Trust. Fund specific expenses are charged directly to the fund that incurred the expense.
Realized and unrealized gains and losses and net investment income, not including class specific expenses, are allocated daily to each class of shares based upon the relative proportion of net assets of each class. Differences in per share distributions, by class, are generally due to differences in class specific expenses.
d. Accounting Estimates
The preparation of financial statements in accordance with accounting principles generally accepted in the United States of America requires management to make estimates and assumptions that affect the reported amounts of assets and liabilities at the date of the financial statements and the amounts of income and expenses during the reporting period. Actual results could differ from those estimates.
e. Guarantees and Indemnifications
Under the Trust’s organizational documents, its officers and trustees are indemnified by the Trust against certain liabilities arising out of the performance of their duties to the Trust. Additionally, in the normal course of business, the Trust, on behalf of the Fund, enters into contracts with service providers that contain general indemnification clauses. The Trust’s maximum exposure under these arrangements is unknown as this would involve future claims that may be made against the Trust that have not yet occurred. Currently, the Trust expects the risk of loss to be remote.
FRD-20
Franklin Templeton Variable Insurance Products Trust
Notes to Financial Statements (continued)
Franklin Rising Dividends Securities Fund
2. SHARES OF BENEFICIAL INTEREST
At December 31, 2013, there were an unlimited number of shares authorized (without par value). Transactions in the Fund’s shares were as follows:
| | | | | | | | | | | | | | | | |
| | | Year Ended December 31, | |
| | | 2013 | | | 2012 | |
| Class 1 Shares: | | Shares | | | Amount | | | Shares | | | Amount | |
Shares sold | | | 425,367 | | | $ | 10,754,937 | | | | 217,372 | | | $ | 4,539,862 | |
Shares issued in reinvestment of distributions | | | 111,610 | | | | 2,772,388 | | | | 125,681 | | | | 2,577,724 | |
Shares redeemed | | | (973,756 | ) | | | (24,725,970 | ) | | | (935,039 | ) | | | (19,660,448 | ) |
| | | | |
Net increase (decrease) | | | (436,779 | ) | | $ | (11,198,645 | ) | | | (591,986 | ) | | $ | (12,542,862 | ) |
| | | | |
Class 2 Shares: | | | | | | | | | | | | | | | | |
Shares sold | | | 6,187,499 | | | $ | 153,726,999 | | | | 5,224,743 | | | $ | 107,681,716 | |
Shares issued in reinvestment of distributions | | | 1,085,247 | | | | 26,490,890 | | | | 1,239,206 | | | | 24,994,784 | |
Shares redeemed | | | (15,483,753 | ) | | | (384,559,197 | ) | | | (12,335,885 | ) | | | (255,149,005 | ) |
| | | | |
Net increase (decrease) | | | (8,211,007 | ) | | $ | (204,341,308 | ) | | | (5,871,936 | ) | | $ | (122,472,505 | ) |
| | | | |
| | |
Class 4 Shares: | | | | | | | | | | | | | | | | |
Shares sold | | | 216,130 | | | $ | 5,332,125 | | | | 179,113 | | | $ | 3,742,720 | |
Shares issued on reinvestment of distributions | | | 6,664 | | | | 163,605 | | | | 4,211 | | | | 85,528 | |
Shares redeemed | | | (84,878 | ) | | | (2,163,931 | ) | | | (40,291 | ) | | | (841,617 | ) |
| | | | |
Net increase (decrease) | | | 137,916 | | | $ | 3,331,799 | | | | 143,033 | | | $ | 2,986,631 | |
| | | | |
3. TRANSACTIONS WITH AFFILIATES
Franklin Resources, Inc. is the holding company for various subsidiaries that together are referred to as Franklin Templeton Investments. Certain officers and trustees of the Fund are also officers and/or directors of the following subsidiaries:
| | |
| Subsidiary | | Affiliation |
Franklin Advisory Services, LLC (Advisory Services) | | Investment manager |
Franklin Templeton Services, LLC (FT Services) | | Administrative manager |
Franklin Templeton Distributors, Inc. (Distributors) | | Principal underwriter |
Franklin Templeton Investor Services, LLC (Investor Services) | | Transfer agent |
a. Management Fees
The Fund pays an investment management fee to Advisory Services based on the average daily net assets of the Fund as follows:
| | |
| Annualized Fee Rate | | Net Assets |
| 0.750% | | Up to and including $500 million |
| 0.625% | | Over $500 million, up to and including $1 billion |
| 0.500% | | In excess of $1 billion |
FRD-21
Franklin Templeton Variable Insurance Products Trust
Notes to Financial Statements (continued)
Franklin Rising Dividends Securities Fund
3. TRANSACTIONS WITH AFFILIATES (continued)
b. Administrative Fees
Under an agreement with Advisory Services, FT Services provides administrative services to the Fund. The fee is paid by Advisory Services based on the Fund’s average daily net assets, and is not an additional expense of the Fund.
c. Distribution Fees
The Board has adopted distribution plans for Class 2 and Class 4 shares pursuant to Rule 12b-1 under the 1940 Act. Under the Fund’s compensation distribution plans, the Fund pays Distributors for costs incurred in connection with the servicing, sale and distribution of the Fund’s shares up to 0.35% per year of its average daily net assets of each class. Some distribution fees are not charged on shares held by affiliates. The Board has agreed to limit the current rate to 0.25% per year for Class 2. The plan year, for purposes of monitoring compliance with the maximum annual plan rates, is February 1 through January 31.
d. Transfer Agent Fees
Investor Services, under terms of an agreement, performs shareholder servicing for the Fund and is not paid by the Fund for the services.
4. EXPENSE OFFSET ARRANGEMENT
The Fund has entered into an arrangement with its custodian whereby credits realized as a result of uninvested cash balances are used to reduce a portion of the Fund’s custodian expenses. During the year ended December 31, 2013, there were no credits earned.
5. INCOME TAXES
For tax purposes, capital losses may be carried over to offset future capital gains. Capital loss carryforwards with no expiration, if any, must be fully utilized before those losses with expiration dates.
During the year ended December 31, 2013, the Fund utilized $73,203,872 of capital loss carryforwards.
The tax character of distributions paid during the years ended December 31, 2013 and 2012, was as follows:
| | | | | | | | |
| | | 2013 | | | 2012 | |
Distributions paid from ordinary income | | $ | 29,426,883 | | | $ | 27,658,036 | |
| | | | |
At December 31, 2013, the cost of investments, net unrealized appreciation (depreciation), undistributed ordinary income and undistributed long term capital gains for income tax purposes were as follows:
| | | | |
Cost of investments | | $ | 1,024,755,445 | |
| | | | |
| |
Unrealized appreciation | | $ | 913,474,786 | |
Unrealized depreciation | | | (7,490,803 | ) |
| | | | |
Net unrealized appreciation (depreciation) | | $ | 905,983,983 | |
| | | | |
Undistributed ordinary income | | $ | 25,044,979 | |
Undistributed long term capital gains | | | 36,289,604 | |
| | | | |
Distributable earnings | | $ | 61,334,583 | |
| | | | |
FRD-22
Franklin Templeton Variable Insurance Products Trust
Notes to Financial Statements (continued)
Franklin Rising Dividends Securities Fund
5. INCOME TAXES (continued)
Differences between income and/or capital gains as determined on a book basis and a tax basis are primarily due to differing treatment of wash sales.
6. INVESTMENT TRANSACTIONS
Purchases and sales of investments (excluding short term securities) for the year ended December 31, 2013, aggregated $1,296,016 and $220,987,287, respectively.
7. INVESTMENTS IN INSTITUTIONAL FIDUCIARY TRUST MONEY MARKET PORTFOLIO
The Fund invests in the Institutional Fiduciary Trust Money Market Portfolio (Sweep Money Fund), an open-end investment company managed by Franklin Advisers, Inc. (an affiliate of the investment manager). Management fees paid by the Fund are reduced on assets invested in the Sweep Money Fund, in an amount not to exceed the management and administrative fees paid by the Sweep Money Fund.
8. CREDIT FACILITY
The Fund, together with other U.S. registered and foreign investment funds (collectively, Borrowers), managed by Franklin Templeton Investments, are borrowers in a joint syndicated senior unsecured credit facility totaling $1.5 billion (Global Credit Facility) which, after an extension of the original terms, matured on February 14, 2014. This Global Credit Facility provides a source of funds to the Borrowers for temporary and emergency purposes, including the ability to meet future unanticipated or unusually large redemption requests. Effective February 14, 2014, the Borrowers renewed the Global Credit Facility which matures on February 13, 2015.
Under the terms of the Global Credit Facility, the Fund shall, in addition to interest charged on any borrowings made by the Fund and other costs incurred by the Fund, pay its share of fees and expenses incurred in connection with the implementation and maintenance of the Global Credit Facility, based upon its relative share of the aggregate net assets of all of the Borrowers, including an annual commitment fee of 0.07% based upon the unused portion of the Global Credit Facility. These fees are reflected in other expenses on the Statement of Operations. During the year ended December 31, 2013, the Fund did not use the Global Credit Facility.
9. FAIR VALUE MEASUREMENTS
The Fund follows a fair value hierarchy that distinguishes between market data obtained from independent sources (observable inputs) and the Fund’s own market assumptions (unobservable inputs). These inputs are used in determining the value of the Fund’s financial instruments and are summarized in the following fair value hierarchy:
| | • | | Level 1 – quoted prices in active markets for identical financial instruments |
| | • | | Level 2 – other significant observable inputs (including quoted prices for similar financial instruments, interest rates, prepayment speed, credit risk, etc.) |
| | • | | Level 3 – significant unobservable inputs (including the Fund’s own assumptions in determining the fair value of financial instruments) |
The input levels are not necessarily an indication of the risk or liquidity associated with financial instruments at that level.
For movements between the levels within the fair value hierarchy, the Fund has adopted a policy of recognizing the transfers as of the date of the underlying event which caused the movement.
FRD-23
Franklin Templeton Variable Insurance Products Trust
Notes to Financial Statements (continued)
Franklin Rising Dividends Securities Fund
9. FAIR VALUE MEASUREMENTS (continued)
At December 31, 2013, all of the Fund’s investments in financial instruments carried at fair value were valued using Level 1 inputs. For detailed categories, see the accompanying Statement of Investments.
10. NEW ACCOUNTING PRONOUNCEMENTS
In June 2013, the Financial Accounting Standards Board issued Accounting Standards Update (ASU) No. 2013-08, Investment Companies (Topic 946): Amendments to the Scope, Measurement, and Disclosure Requirements. The ASU modifies the criteria used in defining an investment company under U.S. Generally Accepted Accounting Principles and also sets forth certain measurement and disclosure requirements. Under the ASU, an entity that is registered under the 1940 Act automatically qualifies as an investment company. The ASU is effective for interim and annual reporting periods beginning after December 15, 2013. Management has reviewed the requirements and believes the adoption of this ASU will not have a material impact on the financial statements.
11. SUBSEQUENT EVENTS
The Fund has evaluated subsequent events through the issuance of the financial statements and determined that no events have occurred that require disclosure other than those already disclosed in the financial statements.
FRD-24
Franklin Templeton Variable Insurance Products Trust
Franklin Rising Dividends Securities Fund
Report of Independent Registered Public Accounting Firm
To the Board of Trustees and Shareholders of
Franklin Templeton Variable Insurance Products Trust
In our opinion, the accompanying statement of assets and liabilities, including the statement of investments, and the related statements of operations and of changes in net assets and the financial highlights present fairly, in all material respects, the financial position of Franklin Rising Dividends Securities Fund (the “Fund”) at December 31, 2013, the results of its operations for the year then ended, the changes in its net assets for each of the two years in the period then ended and the financial highlights for each of the five years in the period then ended, in conformity with accounting principles generally accepted in the United States of America. These financial statements and financial highlights (hereafter referred to as “financial statements”) are the responsibility of the Fund’s management. Our responsibility is to express an opinion on these financial statements based on our audits. We conducted our audits of these financial statements in accordance with the standards of the Public Company Accounting Oversight Board (United States). Those standards require that we plan and perform the audit to obtain reasonable assurance about whether the financial statements are free of material misstatement. An audit includes examining, on a test basis, evidence supporting the amounts and disclosures in the financial statements, assessing the accounting principles used and significant estimates made by management, and evaluating the overall financial statement presentation. We believe that our audits, which included confirmation of securities at December 31, 2013 by correspondence with the custodian, transfer agent and brokers, provides a reasonable basis for our opinion.
PricewaterhouseCoopers LLP
San Francisco, California
February 14, 2014
FRD-25
Franklin Templeton Variable Insurance Products Trust
Tax Information (unaudited)
Franklin Rising Dividends Securities Fund
Under Section 854(b)(1)(A) of the Internal Revenue Code, the Fund hereby reports 100% of the ordinary income dividends as income qualifying for the dividends received deduction for the fiscal year ended December 31, 2013.
FRD-26
FRANKLIN SMALL CAP VALUE SECURITIES FUND
We are pleased to bring you Franklin Small Cap Value Securities Fund’s annual report for the fiscal year ended December 31, 2013.
Performance Summary as of 12/31/13
Average annual total return of Class 4 shares* represents the average annual change in value, assuming reinvestment of dividends and capital gains. Average returns smooth out variations in returns, which can be significant; they are not the same as year-by-year results.
Periods ended 12/31/13
| | | | | | | | | | | | |
| | | 1-Year | | | 5-Year | | | 10-Year | |
Average Annual Total Return | | | +36.12% | | | | +20.67% | | | | +10.28% | |
*For the period beginning 2/29/08, Class 4 performance reflects a 12b-1 fee expense of 0.35% per year, which affects future performance. Class 4 performance prior to 2/29/08 reflects historical Class 1 performance, which does not have a 12b-1 fee expense. Since 2/29/08 (effective date), the average annual total return of Class 4 shares was +10.73%. The Fund has a fee waiver associated with its investments in a Franklin Templeton money fund, contractually guaranteed through at least its current fiscal year end. Fund investment results reflect the fee waiver, to the extent applicable; without this reduction, the results would have been lower.
Total Return Index Comparison for a Hypothetical $10,000 Investment (1/1/04–12/31/13)
The graph below shows the change in value of a hypothetical $10,000 investment in the Fund over the indicated period and includes reinvestment of any income or distributions. The Fund’s performance* is compared to the performance of the Russell 2500™ Value Index. One cannot invest directly in an index, and an index is not representative of the Fund’s portfolio. Please see Important Notes to Performance Information preceding the Fund Summaries.
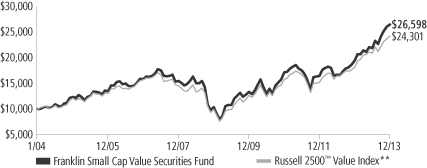
**Source: © 2014 Morningstar. Please see Index Descriptions following the Fund Summaries.
Franklin Small Cap Value Securities Fund – Class 4
Performance reflects the Fund’s Class 4 operating expenses, but does not include any contract fees, expenses or sales charges. If they had been included, performance would be lower. These charges and deductions, particularly for variable life policies, can have a significant effect on contract values and insurance benefits. See the contract prospectus for a complete description of these expenses, including sales charges.
Performance data represent past performance, which does not guarantee future results. Investment return and principal value will fluctuate, and you may have a gain or loss when you sell your shares.
Current performance may differ from figures shown.
FSV-1
Fund Goal and Main Investments: Franklin Small Cap Value Securities Fund seeks long-term total return. Under normal market conditions, the Fund invests at least 80% of its net assets in investments of small capitalization companies. For this Fund, small capitalization companies are those with market capitalizations under $3.5 billion at the time of purchase. The Fund generally invests in equity securities of companies that the manager believes are undervalued and have the potential for capital appreciation.
Performance Overview
You can find the Fund’s one-year total return in the Performance Summary. For comparison, the Fund’s benchmark, the Russell 2500™ Value Index, rose 33.32% for the same period.1 Please note the Fund employs a bottom-up stock selection process, and the managers invest in securities without regard to benchmark comparisons.
Economic and Market Overview
The U.S. economy showed ongoing signs of recovery during the 12-month period ended December 31, 2013, especially in the second half of the year. Business investment, net exports, and state and local government spending picked up in the second quarter, somewhat offsetting the impact of federal budget cuts. During the third quarter, the economy, as measured by gross domestic product, expanded at the strongest pace since the fourth quarter of 2011, underpinned by consumer spending and rising inventories. Historically low mortgage rates and improving sentiment aided the housing market recovery, evidenced by solid new and existing home sales, rising home prices, low inventories and multi-year lows in new foreclosures. Manufacturing expanded for most of the period under review, and the unemployment rate declined to 6.7% in December from 7.8% a year earlier.2 Inflation remained well below the Federal Reserve Board’s (Fed’s) 2.0% target.
The year started on a positive note with Congress passing a budget bill that averted automatic federal budget cuts and income tax increases. However, Washington’s lack of consensus on proposed expenditure reductions resulted in federal spending cuts starting in March. Fed Chairman Ben Bernanke indicated in May that the Fed might reduce monthly asset purchases, assuming ongoing U.S. recovery. In September, however, he announced that any reduction of Fed purchases would be postponed until U.S. economic growth strengthened.
1. Source: © 2014 Morningstar. One cannot invest directly in an index, and an index is not representative of the Fund’s portfolio. Please see Index Descriptions following the Fund Summaries.
2. Source: Bureau of Labor Statistics.
Fund Risks: All investments involve risks, including possible loss of principal. The Fund’s investments in smaller company stocks carry special risks as such stocks have historically exhibited greater price volatility than large-company stocks, particularly over the short term. Additionally, smaller companies often have relatively small revenues, limited product lines and a small market share. In addition, the Fund may invest up to 25% of its total assets in foreign securities, which involve special risks, including currency fluctuations and economic and political uncertainty. The Fund is actively managed but there is no guarantee that the manager’s investment decisions will produce the desired results. The Fund’s prospectus also includes a description of the main investment risks.
FSV-2
A U.S. budget impasse, which led to a temporary shutdown of non-essential government services in October, ended after Congress agreed to fund the government until January 2014 and raise the debt limit until February. U.S. equity markets reached new highs after the resolution of the budget impasse and the Fed’s reassurance at its October meeting that it would continue its supportive monetary programs. In December, Congress passed a two-year budget deal that would ease automatic spending cuts in 2014 and lower the risk of another government shutdown. Meanwhile, the Fed announced it would reduce its monthly bond purchases by $10 billion beginning in January 2014. The Fed, however, committed to keeping interest rates low as long as the unemployment rate remained over 6.5% and inflation expectations remained low.
Rising corporate profits and generally favorable economic data bolstered investor confidence, helping markets overcome brief periods of sell-offs in reaction to Fed statements and to Washington’s fiscal negotiations. U.S. stocks generated strong 12-month returns as the Standard & Poor’s® 500 Index and Dow Jones Industrial Average reached all-time highs during the period.3
Investment Strategy
We generally invest in stocks that we believe are undervalued and have the potential for capital appreciation. We consider a stock price a “value” when it trades at less than the price at which we believe it would trade if the market reflected all factors relating to the company’s worth. Accordingly, we invest in companies that we believe have, for example, stock prices that are low relative to current, or historical or future earnings, book value, cash flow or sales; recent sharp price declines but the potential for good long-term earnings prospects; and valuable intangibles not reflected in the stock price. Companies in which we may invest include those that may be considered out of favor, such as companies attempting to recover from bankruptcy, business setbacks, adverse events or cyclical downturns, or that may be considered potential takeover targets.
Manager’s Discussion
Stock selection in the financials and materials sectors, along with an overweighting and stock selection in the consumer discretionary sector
3. Please see Index Descriptions following the Fund Summaries.
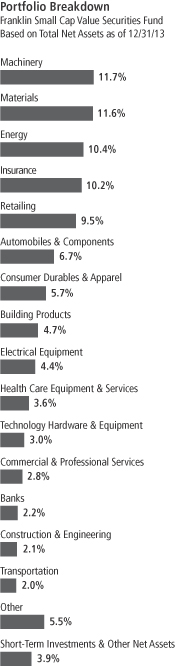
FSV-3
aided performance relative to the benchmark.4 Contributors included insurer Protective Life, furniture retailer La-Z-Boy and recreational vehicle manufacturer Thor Industries. Protective Life rallied based on earnings growth from its annuities business, a potential benefit from acquisitions and higher long-term interest rates. La-Z-Boy experienced earnings growth from increased sales and productivity. Thor Industries benefited from strong demand for towable recreational vehicles and growing sales of motorized vehicles.
Stock selection in the industrials and information technology sectors hindered relative performance.5 Detractors included Multi-Fineline Electronix, a flexible circuit materials maker; Regis, a hair care salon operator; and M.D.C. Holdings, a single family home builder. Multi-Fineline Electronix experienced weaker-than-expected demand and disappointing earnings. Regis posted lower-than-expected earnings as its restructuring had not yet gained traction. M.D.C. Holdings suffered from an uncertain outlook for new housing demand as a result of higher interest rates.
During the period, we initiated new positions in eight holdings, including Regal-Beloit, an electric motor manufacturer; Carpenter Technology, a high performance and specialty metals manufacturer; Genesco, a specialty retailer; Lindsay, a manufacturer of irrigation equipment and road construction products; and Stepan, a global chemical manufacturer, among others. We added to existing positions in Cabot, a specialty chemicals and materials company; Unit Corp., a diversified energy company; and Sensient Technologies, a manufacturer and marketer of colors, flavors and fragrances; among others.
The Fund eliminated positions in Graco, Circor International, West Pharmaceutical Services, A.O. Smith Corp., Teekay and several other positions. We also reduced holdings in several other securities including Protective Life, Benchmark Electronics and GameStop.
There were three all cash takeovers completed during the period: Maidenform Brands was acquired by HanesBrands, Kaydon was acquired by SKF, and NV Energy was acquired by Berkshire Hathaway.
4. The financials sector comprises banks and insurance in the SOI. The consumer discretionary sector comprises automobiles and components, consumer durables and apparel, consumer services and retailing in the SOI.
5. The industrials sector comprises aerospace and defense, building products, commercial and professional services, construction and engineering, electrical equipment, industrial conglomerates, machinery, trading companies and distributors, and transportation in the SOI. The information technology sector comprises semiconductors and semiconductor equipment, and technology hardware and equipment in the SOI.
Top 10 Holdings
Franklin Small Cap Value Securities Fund
12/31/13
| | | | |
Company
Sector/Industry | | % of Total
Net Assets | |
| Thor Industries Inc. | | | 2.4% | |
| Automobiles & Components | | | | |
| Trinity Industries Inc. | | | 2.2% | |
| Machinery | | | | |
| Protective Life Corp. | | | 1.8% | |
| Insurance | | | | |
| The Men’s Wearhouse Inc. | | | 1.8% | |
| Retailing | | | | |
| Reliance Steel & Aluminum Co. | | | 1.8% | |
| Materials | | | | |
| StanCorp Financial Group Inc. | | | 1.8% | |
| Insurance | | | | |
| Cabot Corp. | | | 1.8% | |
| Materials | | | | |
| Bristow Group Inc. | | | 1.8% | |
| Energy | | | | |
| La-Z-Boy Inc. | | | 1.7% | |
| Consumer Durables & Apparel | | | | |
| Group 1 Automotive Inc. | | | 1.7% | |
| Retailing | | | | |
The dollar value, number of shares or principal amount, and names of all portfolio holdings are listed in the Fund’s Statement of Investments (SOI).
FSV-4
Thank you for your participation in Franklin Small Cap Value Securities Fund. We look forward to serving your future investment needs.
The foregoing information reflects our analysis, opinions and portfolio holdings as of December 31, 2013, the end of the reporting period. The way we implement our main investment strategies and the resulting portfolio holdings may change depending on factors such as market and economic conditions. These opinions may not be relied upon as investment advice or an offer for a particular security. The information is not a complete analysis of every aspect of any market, country, industry, security or the Fund. Statements of fact are from sources considered reliable, but the investment manager makes no representation or warranty as to their completeness or accuracy. Although historical performance is no guarantee of future results, these insights may help you understand our investment management philosophy.
FSV-5
Fund Expenses
As an investor in a variable insurance contract (Contract) that indirectly provides for investment in an underlying mutual fund, you can incur transaction and/or ongoing expenses at both the Fund level and the Contract level.
| • | | Transaction expenses can include sales charges (loads) on purchases, redemption fees, surrender fees, transfer fees and premium taxes. |
| • | | Ongoing expenses can include management fees, distribution and service (12b-1) fees, contract fees, annual maintenance fees, mortality and expense risk fees and other fees and expenses. All mutual funds and Contracts have some types of ongoing expenses. |
The expenses shown in the table are meant to highlight ongoing expenses at the Fund level only and do not include ongoing expenses at the Contract level, or transaction expenses at either the Fund or Contract level. While the Fund does not have transaction expenses, if the transaction and ongoing expenses at the Contract level were included, the expenses shown below would be higher. You should consult your Contract prospectus or disclosure document for more information.
The table shows Fund-level ongoing expenses and can help you understand these expenses and compare them with those of other mutual funds offered through the Contract. The table assumes a $1,000 investment held for the six months indicated. Please refer to the Fund prospectus for additional information on operating expenses.
Actual Fund Expenses
The first line (Actual) of the table provides actual account values and expenses. The “Ending Account Value” is derived from the Fund’s actual return, which includes the effect of ongoing Fund expenses, but does not include the effect of ongoing Contract expenses.
You can estimate the Fund-level expenses you incurred during the period by following these steps. Of course, your account value and expenses will differ from those in this illustration:
| 1. | Divide your account value by $1,000. |
If an account had an $8,600 value, then $8,600 ÷ $1,000 = 8.6.
| 2. | Multiply the result by the number under the heading “Fund-Level Expenses Incurred During Period.” |
If Fund-Level Expenses Incurred During Period were $7.50, then 8.6 x $7.50 = $64.50.
In this illustration, the estimated expenses incurred this period at the Fund level are $64.50.
Franklin Small Cap Value Securities Fund – Class 4
FSV-6
Hypothetical Example for Comparison with Other Mutual Funds
Information in the second line (Hypothetical) of the table can help you compare ongoing expenses of the Fund with those of other mutual funds offered through the Contract. This information may not be used to estimate the actual ending account balance or expenses you incurred during the period. The hypothetical “Ending Account Value” is based on the Fund’s actual expense ratio and an assumed 5% annual rate of return before expenses, which does not represent the Fund’s actual return. The figure under the heading “Fund-Level Expenses Incurred During Period” shows the hypothetical expenses your account would have incurred under this scenario. You can compare this figure with the 5% hypothetical examples that appear in shareholder reports of other funds offered through a Contract.
| | | | | | | | | | | | |
| Class 4 | | Beginning
Account
Value 7/1/13 | | | Ending
Account
Value 12/31/13 | | | Fund-Level
Expenses Incurred
During Period*
7/1/13–12/31/13 | |
Actual | | $ | 1,000 | | | $ | 1,213.00 | | | $ | 5.35 | |
Hypothetical (5% return
before expenses) | | $ | 1,000 | | | $ | 1,020.37 | | | $ | 4.89 | |
*Expenses are calculated using the most recent six-month annualized expense ratio for the Fund’s Class 4 shares (0.96%), which does not include any ongoing expenses of the Contract for which the Fund is an investment option, multiplied by the average account value over the period, multiplied by 184/365 to reflect the one-half year period.
FSV-7
Franklin Templeton Variable Insurance Products Trust
Financial Highlights
Franklin Small Cap Value Securities Fund
| | | | | | | | | | | | | | | | | | | | |
| | | Year Ended December 31, | |
| Class 1 | | 2013 | | | 2012 | | | 2011 | | | 2010 | | | 2009 | |
| | | | |
Per share operating performance | | | | | | | | | | | | | | | | | | | | |
(for a share outstanding throughout the year) | | | | | | | | | | | | | | | | | | | | |
Net asset value, beginning of year | | $ | 18.58 | | | $ | 15.82 | | | $ | 16.55 | | | $ | 13.00 | | | $ | 10.73 | |
| | | | |
Income from investment operationsa: | | | | | | | | | | | | | | | | | | | | |
Net investment incomeb | | | 0.19 | | | | 0.29 | c | | | 0.16 | | | | 0.14 | | | | 0.15 | |
Net realized and unrealized gains (losses) | | | 6.45 | | | | 2.64 | | | | (0.74 | ) | | | 3.54 | | | | 2.86 | |
| | | | |
Total from investment operations | | | 6.64 | | | | 2.93 | | | | (0.58 | ) | | | 3.68 | | | | 3.01 | |
| | | | |
Less distributions from: | | | | | | | | | | | | | | | | | | | | |
Net investment income | | | (0.32 | ) | | | (0.17 | ) | | | (0.15 | ) | | | (0.13 | ) | | | (0.22 | ) |
Net realized gains | | | (0.36 | ) | | | — | | | | — | | | | — | | | | (0.52 | ) |
| | | | |
Total distributions | | | (0.68 | ) | | | (0.17 | ) | | | (0.15 | ) | | | (0.13 | ) | | | (0.74 | ) |
| | | | |
Net asset value, end of year | | $ | 24.54 | | | $ | 18.58 | | | $ | 15.82 | | | $ | 16.55 | | | $ | 13.00 | |
| | | | |
| | | | | |
Total returnd | | | 36.50% | | | | 18.75% | | | | (3.53)% | | | | 28.49% | | | | 29.54% | |
Ratios to average net assets | | | | | | | | | | | | | | | | | | | | |
Expenses | | | 0.63% | | | | 0.67% | | | | 0.66% | | | | 0.67% | | | | 0.68% | e |
Net investment income | | | 0.90% | | | | 1.70% | c | | | 1.02% | | | | 0.98% | | | | 1.29% | |
| | | | | |
Supplemental data | | | | | | | | | | | | | | | | | | | | |
Net assets, end of year (000’s) | | $ | 62,408 | | | $ | 40,133 | | | $ | 39,374 | | | $ | 47,300 | | | $ | 42,428 | |
Portfolio turnover rate | | | 10.44% | | | | 5.84% | | | | 14.39% | | | | 15.92% | | | | 6.68% | |
aThe amount shown for a share outstanding throughout the period may not correlate with the Statement of Operations for the period due to the timing of sales and repurchases of the Fund shares in relation to income earned and/or fluctuating market value of the investments of the Fund.
bBased on average daily shares outstanding.
cNet investment income per share includes approximately $0.10 per share received in the form of special dividends. Excluding these amounts, the ratio of net investment income to average net assets would have been 1.10%
dTotal return does not include fees, charges or expenses imposed by the variable annuity and life insurance contracts for which the Franklin Templeton Variable Insurance Products Trust serves as an underlying investment vehicle.
eBenefit of expense reduction rounds to less than 0.01%
The accompanying notes are an integral part of these financial statements.
FSV-8
Franklin Templeton Variable Insurance Products Trust
Financial Highlights (continued)
Franklin Small Cap Value Securities Fund
| | | | | | | | | | | | | | | | | | | | |
| | | Year Ended December 31, | |
| Class 2 | | 2013 | | | 2012 | | | 2011 | | | 2010 | | | 2009 | |
| | | | |
Per share operating performance | | | | | | | | | | | | | | | | | | | | |
(for a share outstanding throughout the year) | | | | | | | | | | | | | | | | | | | | |
Net asset value, beginning of year | | $ | 18.23 | | | $ | 15.53 | | | $ | 16.25 | | | $ | 12.77 | | | $ | 10.55 | |
| | | | |
Income from investment operationsa: | | | | | | | | | | | | | | | | | | | | |
Net investment incomeb | | | 0.14 | | | | 0.24 | c | | | 0.12 | | | | 0.10 | | | | 0.12 | |
Net realized and unrealized gains (losses) | | | 6.34 | | | | 2.59 | | | | (0.73 | ) | | | 3.48 | | | | 2.81 | |
| | | | |
Total from investment operations | | | 6.48 | | | | 2.83 | | | | (0.61 | ) | | | 3.58 | | | | 2.93 | |
| | | | |
Less distributions from: | | | | | | | | | | | | | | | | | | | | |
Net investment income | | | (0.28 | ) | | | (0.13 | ) | | | (0.11 | ) | | | (0.10 | ) | | | (0.19 | ) |
Net realized gains | | | (0.36 | ) | | | — | | | | — | | | | — | | | | (0.52 | ) |
| | | | |
Total distributions | | | (0.64 | ) | | | (0.13 | ) | | | (0.11 | ) | | | (0.10 | ) | | | (0.71 | ) |
| | | | |
Net asset value, end of year | | $ | 24.07 | | | $ | 18.23 | | | $ | 15.53 | | | $ | 16.25 | | | $ | 12.77 | |
| | | | |
| | | | | |
Total returnd | | | 36.24% | | | | 18.39% | | | | (3.76)% | | | | 28.22% | | | | 29.16% | |
Ratios to average net assets | | | | | | | | | | | | | | | | | | | | |
Expenses | | | 0.88% | | | | 0.92% | | | | 0.91% | | | | 0.92% | | | | 0.93% | e |
Net investment income | | | 0.65% | | | | 1.45% | c | | | 0.77% | | | | 0.73% | | | | 1.04% | |
| | | | | |
Supplemental data | | | | | | | | | | | | | | | | | | | | |
Net assets, end of year (000’s) | | $ | 1,606,802 | | | $ | 1,286,573 | | | $ | 1,211,168 | | | $ | 1,362,292 | | | $ | 1,109,855 | |
Portfolio turnover rate | | | 10.44% | | | | 5.84% | | | | 14.39% | | | | 15.92% | | | | 6.68% | |
aThe amount shown for a share outstanding throughout the period may not correlate with the Statement of Operations for the period due to the timing of sales and repurchases of the Fund shares in relation to income earned and/or fluctuating market value of the investments of the Fund.
bBased on average daily shares outstanding.
cNet investment income per share includes approximately $0.10 per share received in the form of special dividends. Excluding these amounts, the ratio of net investment income to average net assets would have been 0.85%
dTotal return does not include fees, charges or expenses imposed by the variable annuity and life insurance contracts for which the Franklin Templeton Variable Insurance Products Trust serves as an underlying investment vehicle.
eBenefit of expense reduction rounds to less than 0.01%
The accompanying notes are an integral part of these financial statements.
FSV-9
Franklin Templeton Variable Insurance Products Trust
Financial Highlights (continued)
Franklin Small Cap Value Securities Fund
| | | | | | | | | | | | | | | | | | | | |
| | | Year Ended December 31, | |
| Class 4 | | 2013 | | | 2012 | | | 2011 | | | 2010 | | | 2009 | |
| | | | |
Per share operating performance | | | | | | | | | | | | | | | | | | | | |
(for a share outstanding throughout the year) | | | | | | | | | | | | | | | | | | | | |
Net asset value, beginning of year | | $ | 18.44 | | | $ | 15.71 | | | $ | 16.44 | | | $ | 12.92 | | | $ | 10.70 | |
| | | | |
Income from investment operationsa: | | | | | | | | | | | | | | | | | | | | |
Net investment incomeb | | | 0.12 | | | | 0.22 | c | | | 0.11 | | | | 0.09 | | | | 0.11 | |
Net realized and unrealized gains (losses) | | | 6.42 | | | | 2.63 | | | | (0.75 | ) | | | 3.53 | | | | 2.84 | |
| | | | |
Total from investment operations | | | 6.54 | | | | 2.85 | | | | (0.64 | ) | | | 3.62 | | | | 2.95 | |
| | | | |
Less distributions from: | | | | | | | | | | | | | | | | | | | | |
Net investment income | | | (0.25 | ) | | | (0.12 | ) | | | (0.09 | ) | | | (0.10 | ) | | | (0.21 | ) |
Net realized gains | | | (0.36 | ) | | | — | | | | — | | | | — | | | | (0.52 | ) |
| | | | |
Total distributions | | | (0.61 | ) | | | (0.12 | ) | | | (0.09 | ) | | | (0.10 | ) | | | (0.73 | ) |
| | | | |
Net asset value, end of year | | $ | 24.37 | | | $ | 18.44 | | | $ | 15.71 | | | $ | 16.44 | | | $ | 12.92 | |
| | | | |
| | | | | |
Total returnd | | | 36.12% | | | | 18.27% | | | | (3.87)% | | | | 28.14% | | | | 29.04% | |
Ratios to average net assets | | | | | | | | | | | | | | | | | | | | |
Expenses | | | 0.98% | | | | 1.02% | | | | 1.01% | | | | 1.02% | | | | 1.03% | e |
Net investment income | | | 0.55% | | | | 1.35% | c | | | 0.67% | | | | 0.63% | | | | 0.94% | |
| | | | | |
Supplemental data | | | | | | | | | | | | | | | | | | | | |
Net assets, end of year (000’s) | | $ | 35,936 | | | $ | 32,424 | | | $ | 34,284 | | | $ | 39,075 | | | $ | 28,599 | |
Portfolio turnover rate | | | 10.44% | | | | 5.84% | | | | 14.39% | | | | 15.92% | | | | 6.68% | |
aThe amount shown for a share outstanding throughout the period may not correlate with the Statement of Operations for the period due to the timing of sales and repurchases of the Fund shares in relation to income earned and/or fluctuating market value of the investments of the Fund.
bBased on average daily shares outstanding.
cNet investment income per share includes approximately $0.10 per share received in the form of special dividends. Excluding these amounts, the ratio of net investment income to average net assets would have been 0.75%
dTotal return does not include fees, charges or expenses imposed by the variable annuity and life insurance contracts for which the Franklin Templeton Variable Insurance Products Trust serves as an underlying investment vehicle.
eBenefit of expense reduction rounds to less than 0.01%
The accompanying notes are an integral part of these financial statements.
FSV-10
Franklin Templeton Variable Insurance Products Trust
Statement of Investments, December 31, 2013
| | | | | | | | |
| Franklin Small Cap Value Securities Fund | | Shares | | | Value | |
Common Stocks 96.1% | | | | | | | | |
Aerospace & Defense 1.6% | | | | | | | | |
AAR Corp. | | | 955,000 | | | $ | 26,749,550 | |
| | | | | | | | |
Automobiles & Components 6.7% | | | | | | | | |
Autoliv Inc. | | | 273,000 | | | | 25,061,400 | |
Drew Industries Inc. | | | 220,000 | | | | 11,264,000 | |
Gentex Corp. | | | 787,300 | | | | 25,973,027 | |
Thor Industries Inc. | | | 745,000 | | | | 41,146,350 | |
a Winnebago Industries Inc. | | | 378,300 | | | | 10,384,335 | |
| | | | | | | | |
| | | | | | | 113,829,112 | |
| | | | | | | | |
Banks 2.2% | | | | | | | | |
Chemical Financial Corp. | | | 360,854 | | | | 11,428,246 | |
OFG Bancorp. | | | 602,000 | | | | 10,438,680 | |
Peoples Bancorp Inc. | | | 158,000 | | | | 3,556,580 | |
TrustCo Bank Corp. NY | | | 1,690,000 | | | | 12,134,200 | |
| | | | | | | | |
| | | | | | | 37,557,706 | |
| | | | | | | | |
Building Products 4.7% | | | | | | | | |
Apogee Enterprises Inc. | | | 610,000 | | | | 21,905,100 | |
a Gibraltar Industries Inc. | | | 842,300 | | | | 15,658,357 | |
Simpson Manufacturing Co. Inc. | | | 433,400 | | | | 15,918,782 | |
Universal Forest Products Inc. | | | 504,700 | | | | 26,315,058 | |
| | | | | | | | |
| | | | | | | 79,797,297 | |
| | | | | | | | |
Commercial & Professional Services 2.8% | | | | | | | | |
Insperity Inc. | | | 263,100 | | | | 9,505,803 | |
McGrath RentCorp | | | 371,018 | | | | 14,766,517 | |
Mine Safety Appliances Co. | | | 328,300 | | | | 16,812,243 | |
Schawk Inc. | | | 464,100 | | | | 6,901,167 | |
| | | | | | | | |
| | | | | | | 47,985,730 | |
| | | | | | | | |
Construction & Engineering 2.1% | | | | | | | | |
EMCOR Group Inc. | | | 272,700 | | | | 11,573,388 | |
Granite Construction Inc. | | | 694,000 | | | | 24,276,120 | |
| | | | | | | | |
| | | | | | | 35,849,508 | |
| | | | | | | | |
Consumer Durables & Apparel 5.7% | | | | | | | | |
Brunswick Corp. | | | 445,000 | | | | 20,496,700 | |
Harman International Industries Inc. | | | 280,000 | | | | 22,918,000 | |
Hooker Furniture Corp. | | | 445,000 | | | | 7,422,600 | |
La-Z-Boy Inc. | | | 930,000 | | | | 28,830,000 | |
a M.D.C. Holdings Inc. | | | 213,800 | | | | 6,892,912 | |
a M/I Homes Inc. | | | 435,900 | | | | 11,093,655 | |
| | | | | | | | |
| | | | | | | 97,653,867 | |
| | | | | | | | |
Consumer Services 1.3% | | | | | | | | |
Hillenbrand Inc. | | | 495,000 | | | | 14,562,900 | |
Regis Corp. | | | 522,400 | | | | 7,580,024 | |
| | | | | | | | |
| | | | | | | 22,142,924 | |
| | | | | | | | |
Electrical Equipment 4.4% | | | | | | | | |
Brady Corp., A | | | 404,900 | | | | 12,523,557 | |
EnerSys | | | 24,100 | | | | 1,689,169 | |
Franklin Electric Co. Inc. | | | 398,464 | | | | 17,787,433 | |
General Cable Corp. | | | 103,500 | | | | 3,043,935 | |
FSV-11
Franklin Templeton Variable Insurance Products Trust
Statement of Investments, December 31, 2013 (continued)
| | | | | | | | |
| Franklin Small Cap Value Securities Fund | | Shares | | | Value | |
Common Stocks (continued) | | | | | | | | |
Electrical Equipment (continued) | | | | | | | | |
Powell Industries Inc. | | | 195,000 | | | $ | 13,063,050 | |
Regal-Beloit Corp. | | | 355,000 | | | | 26,170,600 | |
| | | | | | | | |
| | | | | | | 74,277,744 | |
| | | | | | | | |
Energy 10.4% | | | | | | | | |
a Atwood Oceanics Inc. | | | 363,000 | | | | 19,380,570 | |
Bristow Group Inc. | | | 400,000 | | | | 30,024,000 | |
Energen Corp. | | | 220,000 | | | | 15,565,000 | |
a Helix Energy Solutions Group Inc. | | | 755,000 | | | | 17,500,900 | |
a Oil States International Inc. | | | 224,300 | | | | 22,815,796 | |
a Rowan Cos. PLC | | | 567,500 | | | | 20,066,800 | |
Tidewater Inc. | | | 415,000 | | | | 24,597,050 | |
a Unit Corp. | | | 515,000 | | | | 26,584,300 | |
| | | | | | | | |
| | | | | | | 176,534,416 | |
| | | | | | | | |
Health Care Equipment & Services 3.6% | | | | | | | | |
Hill-Rom Holdings Inc. | | | 405,800 | | | | 16,775,772 | |
STERIS Corp. | | | 490,000 | | | | 23,544,500 | |
Teleflex Inc. | | | 227,900 | | | | 21,390,694 | |
| | | | | | | | |
| | | | | | | 61,710,966 | |
| | | | | | | | |
Industrial Conglomerates 1.6% | | | | | | | | |
Carlisle Cos. Inc. | | | 334,800 | | | | 26,583,120 | |
| | | | | | | | |
Insurance 10.2% | | | | | | | | |
Arthur J. Gallagher & Co. | | | 168,200 | | | | 7,893,626 | |
Aspen Insurance Holdings Ltd. | | | 407,800 | | | | 16,846,218 | |
Assurant Inc. | | | 51,800 | | | | 3,437,966 | |
The Hanover Insurance Group Inc. | | | 345,000 | | | | 20,599,950 | |
HCC Insurance Holdings Inc. | | | 188,200 | | | | 8,683,548 | |
Montpelier Re Holdings Ltd. | | | 585,000 | | | | 17,023,500 | |
Old Republic International Corp. | | | 1,296,900 | | | | 22,397,463 | |
Protective Life Corp. | | | 620,000 | | | | 31,409,200 | |
StanCorp Financial Group Inc. | | | 460,000 | | | | 30,475,000 | |
Validus Holdings Ltd. (Bermuda) | | | 395,000 | | | | 15,914,550 | |
| | | | | | | | |
| | | | | | | 174,681,021 | |
| | | | | | | | |
Machinery 11.7% | | | | | | | | |
Astec Industries Inc. | | | 380,000 | | | | 14,679,400 | |
Briggs & Stratton Corp. | | | 740,000 | | | | 16,102,400 | |
a EnPro Industries Inc. | | | 365,000 | | | | 21,042,250 | |
Kennametal Inc. | | | 370,000 | | | | 19,265,900 | |
Lincoln Electric Holdings Inc. | | | 370,000 | | | | 26,395,800 | |
Lindsay Corp. | | | 56,500 | | | | 4,675,375 | |
Mueller Industries Inc. | | | 325,000 | | | | 20,478,250 | |
Nordson Corp. | | | 34,400 | | | | 2,555,920 | |
Pentair Ltd. | | | 195,000 | | | | 15,145,650 | |
Trinity Industries Inc. | | | 690,000 | | | | 37,618,800 | |
a Wabash National Corp. | | | 1,264,000 | | | | 15,610,400 | |
Watts Water Technologies Inc., A | | | 107,700 | | | | 6,663,399 | |
| | | | | | | | |
| | | | | | | 200,233,544 | |
| | | | | | | | |
Materials 11.6% | | | | | | | | |
A. Schulman Inc. | | | 504,266 | | | | 17,780,419 | |
AMCOL International Corp. | | | 18,200 | | | | 618,436 | |
FSV-12
Franklin Templeton Variable Insurance Products Trust
Statement of Investments, December 31, 2013 (continued)
| | | | | | | | |
| Franklin Small Cap Value Securities Fund | | Shares | | | Value | |
Common Stocks (continued) | | | | | | | | |
Materials (continued) | | | | | | | | |
AptarGroup Inc. | | | 65,000 | | | $ | 4,407,650 | |
Cabot Corp. | | | 590,000 | | | | 30,326,000 | |
Carpenter Technology Corp. | | | 350,000 | | | | 21,770,000 | |
H.B. Fuller Co. | | | 450,000 | | | | 23,418,000 | |
Reliance Steel & Aluminum Co. | | | 405,000 | | | | 30,715,200 | |
RPM International Inc. | | | 620,000 | | | | 25,736,200 | |
Sensient Technologies Corp. | | | 370,000 | | | | 17,952,400 | |
Steel Dynamics Inc. | | | 1,150,000 | | | | 22,471,000 | |
Stepan Co. | | | 44,100 | | | | 2,894,283 | |
| | | | | | | | |
| | | | | | | 198,089,588 | |
| | | | | | | | |
Retailing 9.5% | | | | | | | | |
Brown Shoe Co. Inc. | | | 800,000 | | | | 22,512,000 | |
The Cato Corp., A | | | 438,600 | | | | 13,947,480 | |
GameStop Corp., A | | | 405,100 | | | | 19,955,226 | |
a Genesco Inc. | | | 115,100 | | | | 8,409,206 | |
Group 1 Automotive Inc. | | | 404,200 | | | | 28,706,284 | |
a Jos. A. Bank Clothiers Inc. | | | 180,000 | | | | 9,851,400 | |
The Men’s Wearhouse Inc. | | | 603,700 | | | | 30,836,996 | |
a The Pep Boys - Manny, Moe & Jack | | | 1,173,600 | | | | 14,247,504 | |
Pier 1 Imports Inc. | | | 235,000 | | | | 5,423,800 | |
a West Marine Inc. | | | 610,700 | | | | 8,690,261 | |
| | | | | | | | |
| | | | | | | 162,580,157 | |
| | | | | | | | |
Semiconductors & Semiconductor Equipment 0.5% | | | | | | | | |
Cohu Inc. | | | 736,000 | | | | 7,728,000 | |
| | | | | | | | |
Technology Hardware & Equipment 3.0% | | | | | | | | |
a Benchmark Electronics Inc. | | | 764,100 | | | | 17,635,428 | |
a Ingram Micro Inc., A | | | 507,100 | | | | 11,896,566 | |
a Multi-Fineline Electronix Inc. | | | 274,100 | | | | 3,807,249 | |
a Rofin-Sinar Technologies Inc. | | | 674,900 | | | | 18,235,798 | |
| | | | | | | | |
| | | | | | | 51,575,041 | |
| | | | | | | | |
Trading Companies & Distributors 0.5% | | | | | | | | |
Applied Industrial Technologies Inc. | | | 165,000 | | | | 8,099,850 | |
| | | | | | | | |
Transportation 2.0% | | | | | | | | |
a Genesee & Wyoming Inc. | | | 210,800 | | | | 20,247,340 | |
SkyWest Inc. | | | 990,000 | | | | 14,681,700 | |
| | | | | | | | |
| | | | | | | 34,929,040 | |
| | | | | | | | |
Total Common Stocks (Cost $924,111,750) | | | | | | | 1,638,588,181 | |
| | | | | | | | |
Short Term Investments (Cost $66,928,784) 3.9% | | | | | | | | |
Money Market Funds 3.9% | | | | | | | | |
a,b Institutional Fiduciary Trust Money Market Portfolio | | | 66,928,784 | | | | 66,928,784 | |
| | | | | | | | |
Total Investments (Cost $991,040,534) 100.0% | | | | | | | 1,705,516,965 | |
Other Assets, less Liabilities (0.0)%† | | | | | | | (371,182 | ) |
| | | | | | | | |
Net Assets 100.0% | | | | | | $ | 1,705,145,783 | |
| | | | | | | | |
†Rounds to less than 0.1% of net assets.
aNon-income producing.
bSee Note 7 regarding investments in the Institutional Fiduciary Trust Money Market Portfolio.
The accompanying notes are an integral part of these financial statements.
FSV-13
Franklin Templeton Variable Insurance Products Trust
Financial Statements
Statement of Assets and Liabilities
December 31, 2013
| | | | |
| | | Franklin Small
Cap Value
Securities Fund | |
Assets: | | | | |
Investments in securities: | | | | |
Cost - Unaffiliated issuers | | $ | 924,111,750 | |
Cost - Sweep Money Fund (Note 7) | | | 66,928,784 | |
| | | | |
Total cost of investments | | $ | 991,040,534 | |
| | | | |
Value - Unaffiliated issuers | | $ | 1,638,588,181 | |
Value - Sweep Money Fund (Note 7) | | | 66,928,784 | |
| | | | |
Total value of investments | | | 1,705,516,965 | |
Receivables: | | | | |
Investment securities sold | | | 2,455,877 | |
Capital shares sold | | | 505,609 | |
Dividends | | | 1,461,047 | |
Other assets | | | 33 | |
| | | | |
Total assets | | | 1,709,939,531 | |
| | | | |
Liabilities: | | | | |
Payables: | | | | |
Investment securities purchased | | | 709,803 | |
Capital shares redeemed | | | 2,220,791 | |
Management fees | | | 694,220 | |
Administrative fees | | | 155,879 | |
Distribution fees | | | 680,296 | |
Reports to shareholders | | | 277,642 | |
Accrued expenses and other liabilities | | | 55,117 | |
| | | | |
Total liabilities | | | 4,793,748 | |
| | | | |
Net assets, at value | | $ | 1,705,145,783 | |
| | | | |
Net assets consist of: | | | | |
Paid-in capital | | $ | 861,850,561 | |
Undistributed net investment income | | | 9,437,652 | |
Net unrealized appreciation (depreciation) | | | 714,476,431 | |
Accumulated net realized gain (loss) | | | 119,381,139 | |
| | | | |
Net assets, at value | | $ | 1,705,145,783 | |
| | | | |
The accompanying notes are an integral part of these financial statements.
FSV-14
Franklin Templeton Variable Insurance Products Trust
Financial Statements (continued)
Statement of Assets and Liabilities (continued)
December 31, 2013
| | | | |
| | | Franklin Small
Cap Value
Securities Fund | |
Class 1: | | | | |
Net assets, at value | | $ | 62,407,746 | |
| | | | |
Shares outstanding | | | 2,542,832 | |
| | | | |
Net asset value and maximum offering price per share | | $ | 24.54 | |
| | | | |
Class 2: | | | | |
Net assets, at value | | $ | 1,606,801,860 | |
| | | | |
Shares outstanding | | | 66,766,643 | |
| | | | |
Net asset value and maximum offering price per share | | $ | 24.07 | |
| | | | |
Class 4: | | | | |
Net assets, at value | | $ | 35,936,177 | |
| | | | |
Shares outstanding | | | 1,474,729 | |
| | | | |
Net asset value and maximum offering price per share | | $ | 24.37 | |
| | | | |
The accompanying notes are an integral part of these financial statements.
FSV-15
Franklin Templeton Variable Insurance Products Trust
Financial Statements (continued)
Statement of Operations
for the year ended December 31, 2013
| | | | |
| | | Franklin Small
Cap Value
Securities Fund | |
Investment income: | | | | |
Dividends | | $ | 23,024,269 | |
Income from securities loaned | | | 330,830 | |
| | | | |
Total investment income | | | 23,355,099 | |
| | | | |
Expenses: | | | | |
Management fees (Notes 3a) | | | 7,570,556 | |
Administrative fees (Notes 3b) | | | 1,722,129 | |
Distribution fees: (Notes 3c) | | | | |
Class 2 | | | 3,611,287 | |
Class 4 | | | 119,812 | |
Unaffiliated transfer agent fees | | | 1,524 | |
Custodian fees (Notes 4) | | | 12,973 | |
Reports to shareholders | | | 220,706 | |
Professional fees | | | 58,192 | |
Trustees’ fees and expenses | | | 5,799 | |
Other | | | 22,968 | |
| | | | |
Total expenses | | | 13,345,946 | |
| | | | |
Net investment income | | | 10,009,153 | |
| | | | |
Realized and unrealized gains (losses): | | | | |
Net realized gain (loss) from investments | | | 119,472,862 | |
Net change in unrealized appreciation (depreciation) on investments | | | 344,133,096 | |
| | | | |
Net realized and unrealized gain (loss) | | | 463,605,958 | |
| | | | |
Net increase (decrease) in net assets resulting from operations | | $ | 473,615,111 | |
| | | | |
The accompanying notes are an integral part of these financial statements.
FSV-16
Franklin Templeton Variable Insurance Products Trust
Financial Statements (continued)
Statements of Changes in Net Assets
| | | | | | | | |
| | | Franklin Small Cap Value
Securities Fund | |
| | | Year Ended December 31, | |
| | | 2013 | | | 2012 | |
| | | | |
Increase (decrease) in net assets: | | | | | | | | |
Operations: | | | | | | | | |
Net investment income | | $ | 10,009,153 | | | $ | 19,229,549 | |
Net realized gain (loss) from investments | | | 119,472,862 | | | | 44,247,459 | |
Net change in unrealized appreciation (depreciation) on investments | | | 344,133,096 | | | | 158,357,883 | |
| | | | |
Net increase (decrease) in net assets resulting from operations | | | 473,615,111 | | | | 221,834,891 | |
| | | | |
Distributions to shareholders from: | | | | | | | | |
Net investment income: | | | | | | | | |
Class 1 | | | (615,112 | ) | | | (407,505 | ) |
Class 2 | | | (18,772,536 | ) | | | (9,757,412 | ) |
Class 4 | | | (406,547 | ) | | | (256,129 | ) |
Net realized gains: | | | | | | | | |
Class 1 | | | (681,161 | ) | | | — | |
Class 2 | | | (24,226,581 | ) | | | — | |
Class 4 | | | (585,151 | ) | | | — | |
| | | | |
Total distributions to shareholders | | | (45,287,088 | ) | | | (10,421,046 | ) |
| | | | |
Capital share transactions: (Note 2) | | | | | | | | |
Class 1 | | | 7,328,882 | | | | (5,634,630 | ) |
Class 2 | | | (83,608,654 | ) | | | (124,579,807 | ) |
Class 4 | | | (6,031,999 | ) | | | (6,896,088 | ) |
| | | | |
Total capital share transactions | | | (82,311,771 | ) | | | (137,110,525 | ) |
| | | | |
Net increase (decrease) in net assets | | | 346,016,252 | | | | 74,303,320 | |
Net assets: | | | | | | | | |
Beginning of year | | | 1,359,129,531 | | | | 1,284,826,211 | |
| | | | |
End of year | | $ | 1,705,145,783 | | | $ | 1,359,129,531 | |
| | | | |
Undistributed net investment income included in net assets: | | | | | | | | |
End of year | | $ | 9,437,652 | | | $ | 19,222,694 | |
| | | | |
The accompanying notes are an integral part of these financial statements.
FSV-17
Franklin Templeton Variable Insurance Products Trust
Notes to Financial Statements
Franklin Small Cap Value Securities Fund
1. ORGANIZATION AND SIGNIFICANT ACCOUNTING POLICIES
Franklin Templeton Variable Insurance Products Trust (Trust) is registered under the Investment Company Act of 1940, as amended, (1940 Act) as an open-end investment company, consisting of twenty separate funds. The Franklin Small Cap Value Securities Fund (Fund) is included in this report. The financial statements of the remaining funds in the Trust are presented separately. Shares of the Fund are generally sold only to insurance company separate accounts to fund the benefits of variable life insurance policies or variable annuity contracts. The Fund offers three classes of shares: Class 1, Class 2 and Class 4. Each class of shares differs by its distribution fees, voting rights on matters affecting a single class and its exchange privilege.
The following summarizes the Fund’s significant accounting policies.
a. Financial Instrument Valuation
The Fund’s investments in financial instruments are carried at fair value daily. Fair value is the price that would be received to sell an asset or paid to transfer a liability in an orderly transaction between market participants on the measurement date. The Fund calculates the net asset value (NAV) per share at the close of the New York Stock Exchange (NYSE), generally at 4p.m. Eastern time (NYSE close) on each day the NYSE is open for trading. Under procedures approved by the Trust’s Board of Trustees (the Board), the Fund’s administrator, investment manager and other affiliates have formed the Valuation and Liquidity Oversight Committee (VLOC). The VLOC provides administration and oversight of the Fund’s valuation policies and procedures, which are approved annually by the Board. Among other things, these procedures allow the Fund to utilize independent pricing services, quotations from securities and financial instrument dealers, and other market sources to determine fair value.
Equity securities listed on an exchange or on the NASDAQ National Market System are valued at the last quoted sale price or the official closing price of the day, respectively. Foreign equity securities are valued as of the close of trading on the foreign stock exchange on which the security is primarily traded or as of the NYSE close, whichever is earlier. The value is then converted into its U.S. dollar equivalent at the foreign exchange rate in effect at the NYSE close on the day that the value of the security is determined. Over-the-counter securities are valued within the range of the most recent quoted bid and ask prices. Securities that trade in multiple markets or on multiple exchanges are valued according to the broadest and most representative market. Certain equity securities are valued based upon fundamental characteristics or relationships to similar securities. Investments in open-end mutual funds are valued at the closing net asset value.
The Fund has procedures to determine the fair value of financial instruments for which market prices are not reliable or readily available. Under these procedures, the VLOC convenes on a regular basis to review such financial instruments and considers a number of factors, including significant unobservable valuation inputs, when arriving at fair value. The VLOC primarily employs a market-based approach which may use related or comparable assets or liabilities, recent transactions, market multiples, book values, and other relevant information for the investment to determine the fair value of the investment. An income-based valuation approach may also be used in which the anticipated future cash flows of the investment are discounted to calculate fair value. Discounts may also be applied due to the nature or duration of any restrictions on the disposition of the investments. Due to the inherent uncertainty of valuations of such investments, the fair values may differ significantly from the values that would have been used had an active market existed. The VLOC employs various methods for calibrating these valuation approaches including a regular review of key inputs and assumptions, transactional back-testing or disposition analysis, and reviews of any related market activity.
b. Securities Lending
The Fund participates in an agency based securities lending program. The Fund receives cash collateral against the loaned securities in an amount equal to at least 102% of the market value of the loaned securities. Collateral is maintained over the life of the loan in an amount not less than 100% of the market value of loaned securities, as determined at the close of fund business each day; any additional collateral required due to changes in security values is delivered to the Fund on the next business day.
FSV-18
Franklin Templeton Variable Insurance Products Trust
Notes to Financial Statements (continued)
Franklin Small Cap Value Securities Fund
1. ORGANIZATION AND SIGNIFICANT ACCOUNTING POLICIES (continued)
The collateral is invested in repurchase agreements. The Fund receives income from the investment of cash collateral, in addition to lending fees and rebates paid by the borrower. The Fund bears the market risk with respect to the collateral investment, securities loaned, and the risk that the agent may default on its obligations to the Fund. The securities lending agent has agreed to indemnify the Fund in the event of default by a third party borrower. At December 31, 2013, the Fund had no securities on loan.
c. Income and Deferred Taxes
It is the Fund’s policy to qualify as a regulated investment company under the Internal Revenue Code. The Fund intends to distribute to shareholders substantially all of its taxable income and net realized gains to relieve it from federal income and if applicable, excise taxes. As a result, no provision for U.S. federal income taxes is required.
The Fund may be subject to foreign taxation related to income received, capital gains on the sale of securities and certain foreign currency transactions in the foreign jurisdictions in which it invests. Foreign taxes, if any, are recorded based on the tax regulations and rates that exist in the foreign markets in which the Fund invests. When a capital gain tax is determined to apply the Fund records an estimated deferred tax liability in an amount that would be payable if the securities were disposed of on the valuation date.
The Fund recognizes the tax benefits of uncertain tax positions only when the position is “more likely than not” to be sustained upon examination by the tax authorities based on the technical merits of the tax position. As of December 31, 2013, and for all open tax years, the Fund has determined that no liability for unrecognized tax benefits is required in the Fund’s financial statements related to uncertain tax positions taken on a tax return (or expected to be taken on future tax returns). Open tax years are those that remain subject to examination and are based on each tax jurisdiction statute of limitation.
d. Security Transactions, Investment Income, Expenses and Distributions
Security transactions are accounted for on trade date. Realized gains and losses on security transactions are determined on a specific identification basis. Estimated expenses are accrued daily. Dividend income recorded on the ex-dividend date except that certain dividends from foreign securities are recognized as soon as the Fund is notified of the ex-dividend date. Distributions to shareholders are recorded on the ex-dividend date and are determined according to income tax regulations (tax basis). Distributable earnings determined on a tax basis may differ from earnings recorded in accordance with accounting principles generally accepted in the United States of America. These differences may be permanent or temporary. Permanent differences are reclassified among capital accounts to reflect their tax character. These reclassifications have no impact on net assets or the results of operations. Temporary differences are not reclassified, as they may reverse in subsequent periods.
Common expenses incurred by the Trust are allocated among the funds based on the ratio of net assets of each fund to the combined net assets of the Trust. Fund specific expenses are charged directly to the fund that incurred the expense.
Realized and unrealized gains and losses and net investment income, not including class specific expenses, are allocated daily to each class of shares based upon the relative proportion of net assets of each class. Differences in per share distributions, by class, are generally due to differences in class specific expenses.
e. Accounting Estimates
The preparation of financial statements in accordance with accounting principles generally accepted in the United States of America requires management to make estimates and assumptions that affect the reported amounts of assets and liabilities at the date of the financial statements and the amounts of income and expenses during the reporting period. Actual results could differ from those estimates.
FSV-19
Franklin Templeton Variable Insurance Products Trust
Notes to Financial Statements (continued)
Franklin Small Cap Value Securities Fund
f. Guarantees and Indemnifications
Under the Trust’s organizational documents, its officers and trustees are indemnified by the Trust against certain liabilities arising out of the performance of their duties to the Trust. Additionally, in the normal course of business, the Trust, on behalf of the Fund, enters into contracts with service providers that contain general indemnification clauses. The Trust’s maximum exposure under these arrangements is unknown as this would involve future claims that may be made against the Trust that have not yet occurred. Currently, the Trust expects the risk of loss to be remote.
2. SHARES OF BENEFICIAL INTEREST
At December 31, 2013, there were an unlimited number of shares authorized (without par value). Transactions in the Fund’s shares were as follows:
| | | | | | | | | | | | | | | | |
| | | Year Ended December 31, | |
| | | 2013 | | | 2012 | |
| Class 1 Shares: | | Shares | | | Amount | | | Shares | | | Amount | |
Shares sold | | | 854,519 | | | $ | 17,437,814 | | | | 120,340 | | | $ | 2,031,518 | |
Shares issued in reinvestment of distributions | | | 64,172 | | | | 1,296,273 | | | | 26,308 | | | | 407,505 | |
Shares redeemed | | | (536,406 | ) | | | (11,405,205 | ) | | | (474,365 | ) | | | (8,073,653 | ) |
| | | | |
Net increase (decrease) | | | 382,285 | | | $ | 7,328,882 | | | | (327,717 | ) | | $ | (5,634,630 | ) |
| | | | |
Class 2 Shares: | | | | | | | | | | | | | | | | |
Shares sold | | | 6,730,565 | | | $ | 138,529,743 | | | | 8,509,192 | | | $ | 140,217,286 | |
Shares issued in reinvestment of distributions | | | 2,167,294 | | | | 42,999,117 | | | | 641,091 | | | | 9,757,412 | |
Shares redeemed | | | (12,704,970 | ) | | | (265,137,514 | ) | | | (16,570,761 | ) | | | (274,554,505 | ) |
| | | | |
Net increase (decrease) | | | (3,807,111 | ) | | $ | (83,608,654 | ) | | | (7,420,478 | ) | | $ | (124,579,807 | ) |
| | | | |
Class 4 Shares: | | | | | | | | | | | | | | | | |
Shares sold | | | 205,689 | | | $ | 4,293,023 | | | | 402,254 | | | $ | 6,818,504 | |
Shares issued on reinvestment of distributions | | | 49,338 | | | | 991,698 | | | | 16,621 | | | | 256,129 | |
Shares redeemed | | | (538,222 | ) | | | (11,316,720 | ) | | | (843,050 | ) | | | (13,970,721 | ) |
| | | | |
Net increase (decrease) | | | (283,195 | ) | | $ | (6,031,999 | ) | | | (424,175 | ) | | $ | (6,896,088 | ) |
| | | | |
3. TRANSACTIONS WITH AFFILIATES
Franklin Resources, Inc. is the holding company for various subsidiaries that together are referred to as Franklin Templeton Investments. Certain officers and trustees of the Fund are also officers and/or directors of the following subsidiaries:
| | |
| Subsidiary | | Affiliation |
Franklin Advisory Services, LLC (Advisory Services) | | Investment manager |
Franklin Templeton Services, LLC (FT Services) | | Administrative manager |
Franklin Templeton Distributors, Inc. (Distributors) | | Principal underwriter |
Franklin Templeton Investor Services, LLC (Investor Services) | | Transfer agent |
a. Management Fees
The Fund pays an investment management fee to Advisory Services based on the average daily net assets of the Fund as follows:
| | |
| Annualized Fee Rate | | Net Assets |
| 0.600% | | Up to and including $200 million |
| 0.500% | | Over $200 million, up to and including $1.3 billion |
| 0.400% | | In excess of $1.3 billion |
FSV-20
Franklin Templeton Variable Insurance Products Trust
Notes to Financial Statements (continued)
Franklin Small Cap Value Securities Fund
3. TRANSACTIONS WITH AFFILIATES (continued)
b. Administrative Fees
The Fund pays an administrative fee to FT Services based on the Fund’s average daily net assets as follows:
| | |
| Annualized Fee Rate | | Net Assets |
| 0.150% | | Up to and including $200 million |
| 0.135% | | Over $200 million, up to and including $700 million |
| 0.100% | | Over $700 million, up to and including $1.2 billion |
| 0.075% | | In excess of $1.2 billion |
c. Distribution Fees
The Board has adopted distribution plans for Class 2 and Class 4 shares pursuant to Rule 12b-1 under the 1940 Act. Under the Fund’s compensation distribution plans, the Fund pays Distributors for costs incurred in connection with the servicing, sale and distribution of the Fund’s shares up to 0.35% per year of its average daily net assets of each class. Some distribution fees are not charged on shares held by affiliates. The Board has agreed to limit the current rate to 0.25% per year for Class 2. The plan year, for purposes of monitoring compliance with the maximum annual plan rates, is February 1 through January 31.
d. Transfer Agent Fees
Investor Services, under terms of an agreement, performs shareholder servicing for the Fund and is not paid by the Fund for the services.
4. EXPENSE OFFSET ARRANGEMENT
The Fund has entered into an arrangement with its custodian whereby credits realized as a result of uninvested cash balances are used to reduce a portion of the Fund’s custodian expenses. During the year ended December 31, 2013, there were no credits earned.
5. INCOME TAXES
The tax character of distributions paid during the years ended December 31, 2013 and 2012 was as follows:
| | | | | | | | |
| | | 2013 | | | 2012 | |
Distributions paid from: | | | | | | | | |
Ordinary income | | $ | 19,794,195 | | | $ | 10,421,046 | |
Long term capital gain | | | 25,492,893 | | | | — | |
| | | | |
| | $ | 45,287,088 | | | $ | 10,421,046 | |
| | | | |
FSV-21
Franklin Templeton Variable Insurance Products Trust
Notes to Financial Statements (continued)
Franklin Small Cap Value Securities Fund
5. INCOME TAXES (continued)
At December 31, 2013, the cost of investments, net unrealized appreciation (depreciation), undistributed ordinary income and undistributed long term capital gains for income tax purposes were as follows:
| | | | |
Cost of investments | | $ | 994,087,645 | |
| | | | |
| |
Unrealized appreciation | | $ | 730,962,524 | |
Unrealized depreciation | | | (19,533,204 | ) |
| | | | |
Net unrealized appreciation (depreciation) | | $ | 711,429,320 | |
| | | | |
Undistributed ordinary income | | $ | 18,583,845 | |
Undistributed long term capital gains | �� | | 113,282,058 | |
| | | | |
Distributable earnings | | $ | 131,865,903 | |
| | | | |
Differences between income and/or capital gains as determined on a book basis and a tax basis are primarily due to differing treatment of passive foreign investment company shares.
6. INVESTMENT TRANSACTIONS
Purchases and sales of investments (excluding short term securities) for the year ended December 31, 2013, aggregated $154,031,719 and $290,672,942, respectively.
7. INVESTMENTS IN INSTITUTIONAL FIDUCIARY TRUST MONEY MARKET PORTFOLIO
The Fund invests in the Institutional Fiduciary Trust Money Market Portfolio (Sweep Money Fund), an open-end investment company managed by Franklin Advisers, Inc. (an affiliate of the investment manager). Management fees paid by the Fund are reduced on assets invested in the Sweep Money Fund, in an amount not to exceed the management and administrative fees paid by the Sweep Money Fund.
8. CREDIT FACILITY
The Fund, together with other U.S. registered and foreign investment funds (collectively, Borrowers), managed by Franklin Templeton Investments, are borrowers in a joint syndicated senior unsecured credit facility totaling $1.5 billion (Global Credit Facility) which, after an extension of the original terms, matured on February 14, 2014. This Global Credit Facility provides a source of funds to the Borrowers for temporary and emergency purposes, including the ability to meet future unanticipated or unusually large redemption requests. Effective February 14, 2014, the Borrowers renewed the Global Credit Facility which matures on February 13, 2015.
Under the terms of the Global Credit Facility, the Fund shall, in addition to interest charged on any borrowings made by the Fund and other costs incurred by the Fund, pay its share of fees and expenses incurred in connection with the implementation and maintenance of the Global Credit Facility, based upon its relative share of the aggregate net assets of all of the Borrowers, including an annual commitment fee of 0.07% based upon the unused portion of the Global Credit Facility. These fees are reflected in other expenses on the Statement of Operations. During the year ended December 31, 2013, the Fund did not use the Global Credit Facility.
FSV-22
Franklin Templeton Variable Insurance Products Trust
Notes to Financial Statements (continued)
Franklin Small Cap Value Securities Fund
9. FAIR VALUE MEASUREMENTS
The Fund follows a fair value hierarchy that distinguishes between market data obtained from independent sources (observable inputs) and the Fund’s own market assumptions (unobservable inputs). These inputs are used in determining the value of the Fund’s financial instruments and are summarized in the following fair value hierarchy:
| | • | | Level 1 – quoted prices in active markets for identical financial instruments |
| | • | | Level 2 – other significant observable inputs (including quoted prices for similar financial instruments, interest rates, prepayment speed, credit risk, etc.) |
| | • | | Level 3 – significant unobservable inputs (including the Fund’s own assumptions in determining the fair value of financial instruments) |
The input levels are not necessarily an indication of the risk or liquidity associated with financial instruments at that level.
For movements between the levels within the fair value hierarchy, the Fund has adopted a policy of recognizing the transfers as of the date of the underlying event which caused the movement.
At December 31, 2013, all of the Fund’s investments in financial instruments carried at fair value were valued using Level 1 inputs. For detailed categories, see the accompanying Statement of Investments.
10. NEW ACCOUNTING PRONOUNCEMENTS
In June 2013, the Financial Accounting Standards Board issued Accounting Standards Update (ASU) No. 2013-08, Investment Companies (Topic 946): Amendments to the Scope, Measurement, and Disclosure Requirements. The ASU modifies the criteria used in defining an investment company under U.S. Generally Accepted Accounting Principles and also sets forth certain measurement and disclosure requirements. Under the ASU, an entity that is registered under the 1940 Act automatically qualifies as an investment company. The ASU is effective for interim and annual reporting periods beginning after December 15, 2013. Management has reviewed the requirements and believes the adoption of this ASU will not have a material impact on the financial statements.
11. SUBSEQUENT EVENTS
The Fund has evaluated subsequent events through the issuance of the financial statements and determined that no events have occurred that require disclosure other than those already disclosed in the financial statements.
FSV-23
Franklin Templeton Variable Insurance Products Trust
Franklin Small Cap Value Securities Fund
Report of Independent Registered Public Accounting Firm
To the Board of Trustees and Shareholders of
Franklin Templeton Variable Insurance Products Trust
In our opinion, the accompanying statement of assets and liabilities, including the statement of investments, and the related statements of operations and of changes in net assets and the financial highlights present fairly, in all material respects, the financial position of Franklin Small Cap Value Securities Fund (the “Fund”) at December 31, 2013, the results of its operations for the year then ended, the changes in its net assets for each of the two years in the period then ended and the financial highlights for each of the five years in the period then ended, in conformity with accounting principles generally accepted in the United States of America. These financial statements and financial highlights (hereafter referred to as “financial statements”) are the responsibility of the Fund’s management. Our responsibility is to express an opinion on these financial statements based on our audits. We conducted our audits of these financial statements in accordance with the standards of the Public Company Accounting Oversight Board (United States). Those standards require that we plan and perform the audit to obtain reasonable assurance about whether the financial statements are free of material misstatement. An audit includes examining, on a test basis, evidence supporting the amounts and disclosures in the financial statements, assessing the accounting principles used and significant estimates made by management, and evaluating the overall financial statement presentation. We believe that our audits, which included confirmation of securities at December 31, 2013 by correspondence with the custodian, transfer agent and brokers, provide a reasonable basis for our opinion.
PricewaterhouseCoopers LLP
San Francisco, California
February 14, 2014
FSV-24
Franklin Templeton Variable Insurance Products Trust
Tax Information (unaudited)
Franklin Small Cap Value Securities Fund
Under Section 852(b)(3)(C) of the Internal Revenue Code (Code), the Fund hereby reports the maximum amount allowable but no less than $25,492,893 as a long term capital gain dividend for the fiscal year ended December 31, 2013.
Under Section 854(b)(1)(A) of the Code, the Fund hereby reports 100% of the ordinary income dividends as income qualifying for the dividends received deduction for the fiscal year ended December 31, 2013.
FSV-25
FRANKLIN SMALL-MID CAP GROWTH SECURITIES FUND
We are pleased to bring you Franklin Small-Mid Cap Growth Securities Fund’s annual report for the fiscal year ended December 31, 2013.
Performance Summary as of 12/31/13
Average annual total return of Class 4 shares* represents the average annual change in value, assuming reinvestment of dividends and capital gains. Average returns smooth out variations in returns, which can be significant; they are not the same as year-by-year results.
Periods ended 12/31/13
| | | | | | | | | | | | |
| | | 1-Year | | | 5-Year | | | 10-Year | |
Average Annual Total Return | | | +37.99% | | | | +21.58% | | | | +8.09% | |
*For the period beginning 2/29/08, Class 4 performance reflects a 12b-1 fee expense of 0.35% per year, which affects future performance. Class 4 performance prior to 2/29/08 reflects historical Class 1 performance, which does not have a 12b-1 fee expense. Since 2/29/08 (effective date), the average annual total return of Class 4 shares was +9.89%. The Fund has a fee waiver associated with its investments in a Franklin Templeton money fund, contractually guaranteed through at least its current fiscal year end. Fund investment results reflect the fee waiver, to the extent applicable; without this reduction, the results would have been lower.
Total Return Index Comparison for a Hypothetical $10,000 Investment (1/1/04–12/31/13)
The graph below shows the change in value of a hypothetical $10,000 investment in the Fund over the indicated period and includes reinvestment of any income or distributions. The Fund’s performance* is compared to the performance of the Standard & Poor’s® 500 Index (S&P 500®) and the Russell Midcap® Growth Index. One cannot invest directly in an index, and an index is not representative of the Fund’s portfolio. Please see Important Notes to Performance Information preceding the Fund Summaries.
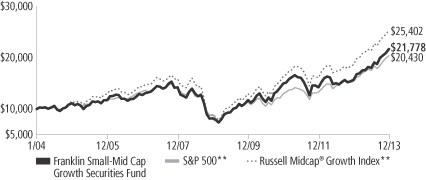
**Source: © 2014 Morningstar. Please see Index Descriptions following the Fund Summaries.
Franklin Small-Mid Cap Growth Securities Fund Class 4
Performance reflects the Fund’s Class 4 operating expenses, but does not include any contract fees, expenses or sales charges. If they had been included, performance would be lower. These charges and deductions, particularly for variable life policies, can have a significant effect on contract values and insurance benefits. See the contract prospectus for a complete description of these expenses, including sales charges.
Performance data represent past performance, which does not guarantee future results. Investment return and principal value will fluctuate, and you may have a gain or loss when you sell your shares.
Current performance may differ from figures shown.
FSC-1
Fund Goal and Main Investments: Franklin Small-Mid Cap Growth Securities Fund seeks long-term capital growth. Under normal market conditions, the Fund invests at least 80% of its net assets in equity securities of small capitalization and mid-capitalization companies. For this Fund, small cap companies are those within the market capitalization range of companies in the Russell 2500TM Index at the time of purchase, and midcap companies are those within the market capitalization range of companies in the Russell Midcap® Index at the time of purchase.1
Performance Overview
You can find the Fund’s one-year total return in the Performance Summary. In comparison, the Fund’s narrow benchmark, the Russell Midcap® Growth Index, generated a +35.74% total return, and its broad benchmark, the S&P 500, produced a +32.39% total return, for the same period.2
Economic and Market Overview
The U.S. economy showed ongoing signs of recovery during the 12-month period ended December 31, 2013, especially in the second half of the year. Business investment, net exports, and state and local government spending picked up in the second quarter, somewhat offsetting the impact of federal budget cuts. During the third quarter, the economy, as measured by gross domestic product, expanded at the strongest pace since the fourth quarter of 2011, underpinned by consumer spending and rising inventories. Historically low mortgage rates and improving sentiment aided the housing market recovery, evidenced by solid new and existing home sales, rising home prices, low inventories and multi-year lows in new foreclosures. Manufacturing expanded for most of the period under review, and the unemployment rate declined to 6.7% in December from 7.8% a year earlier.3 Inflation remained well below the Federal Reserve Board’s (Fed’s) 2.0% target.
The year started on a positive note with Congress passing a budget bill that averted automatic federal budget cuts and income tax increases. However, Washington’s lack of consensus on proposed expenditure reductions resulted in federal spending cuts starting in March. Fed Chairman Ben Bernanke indicated in May that the Fed might reduce monthly asset purchases, assuming ongoing U.S. recovery. In
Fund Risks: All investments involve risks, including possible loss of principal. Investors should be comfortable with fluctuations in the value of their investment, as small and midsized company stocks can be volatile, especially over the short term. Smaller or relatively new or unseasoned companies can be particularly sensitive to changing economic conditions, and their prospects for growth are less certain than those of larger, more established companies. The Fund may focus on particular sectors of the market from time to time, which can carry greater risks of adverse developments in such sectors. The Fund is actively managed but there is no guarantee that the manager’s investment decisions will produce the desired results. The Fund’s prospectus also includes a description of the main investment risks.
1. Please see Index Descriptions following the Fund Summaries.
2. Source: © 2014 Morningstar. One cannot invest directly in an index, and an index is not representative of the Fund’s portfolio. Please see Index Descriptions following the Fund Summaries.
3. Source: Bureau of Labor Statistics.
FSC-2
September, however, he announced that any reduction of Fed purchases would be postponed until U.S. economic growth strengthened. A U.S. budget impasse, which led to a temporary shutdown of non-essential government services in October, ended after Congress agreed to fund the government until January 2014 and raise the debt limit until February. U.S. equity markets reached new highs after the resolution of the budget impasse and the Fed’s reassurance at its October meeting that it would continue its supportive monetary programs. In December, Congress passed a two-year budget deal that would ease automatic spending cuts in 2014 and lower the risk of another government shutdown. Meanwhile, the Fed announced it would reduce its monthly bond purchases by $10 billion beginning in January 2014. The Fed, however, committed to keeping interest rates low as long as the unemployment rate remained over 6.5% and inflation expectations remained low.
Rising corporate profits and generally favorable economic data bolstered investor confidence, helping markets overcome brief periods of sell-offs in reaction to Fed statements and to Washington’s fiscal negotiations. U.S. stocks generated strong 12-month returns as the S&P 500 and Dow Jones Industrial Average reached all-time highs during the period.1
Investment Strategy
We use fundamental, bottom-up research to seek companies meeting our criteria of growth potential, quality and valuation. In seeking sustainable growth characteristics, we look for companies we believe can produce sustainable earnings and cash flow growth, evaluating the long-term market opportunity and competitive structure of an industry to target leaders and emerging leaders. We define quality companies as those with strong and improving competitive positions in attractive markets. We also believe important attributes of quality are experienced and talented management teams as well as financial strength reflected in the capital structure, gross and operating margins, free cash flow generation and returns on capital employed. Our valuation analysis includes a range of potential outcomes based on an assessment of multiple scenarios. In assessing value, we consider whether security prices fully reflect the balance of the sustainable growth opportunities relative to business and financial risks.
Manager’s Discussion
All sectors represented in the Fund’s portfolio delivered positive returns during the 12 months under review as the broad market rallied. Stock
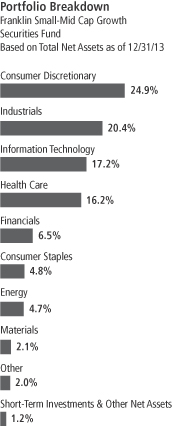
FSC-3
selection, especially in the consumer discretionary, information technology (IT) and financials sectors, was a major contributor to performance relative to the Russell Midcap® Growth Index.
In the consumer discretionary sector, off-benchmark positions in Buffalo Wild Wings, a restaurant owner, operator and franchiser, and Wolverine World Wide, a designer and manufacturer of branded footwear, apparel and accessories, benefited relative results, as did a position in GNC Holdings, a specialty retailer of health and wellness products. Buffalo Wild Wings delivered strong third-quarter earnings, supported by double-digit revenue growth and higher operating margins resulting from lower chicken wing costs and better cost control. The company also raised its earnings guidance for the year 2013. Wolverine raised its full-year 2013 profit outlook as it continued to generate better-than-expected earnings, driven largely by the strength of its international business and solid performance of recent acquisitions, particularly Sperry Top-Sider. GNC’s share price reached an all-time high as the company continued to report solid earnings results. The company also authorized a $500 million share repurchase program toward year-end.
Among the Fund’s IT holdings, major contributors included a position in FleetCor Technologies, a leading provider of payment products to commercial fleets and major oil companies, and an off-benchmark investment in ViaSat, a provider of fixed and mobile satellite network services. FleetCor continued to generate stronger-than-expected earnings, driven by higher domestic and international transactions, larger revenue per transaction and lower operating expenses. Having demonstrated an ability to develop acquired businesses, FleetCor made acquisitions in several countries, including Australia, New Zealand, the U.K. and Brazil. ViaSat generated robust revenues and improved earnings in recent quarters, resulting from strong growth across all its business segments, including government systems.
In the financials sector, key contributors included asset management company Affiliated Managers Group, which reported better-than-expected earnings during the period, driven by solid revenue growth, and increased its earnings guidance for 2013 and 2014. Stock selection in industrials, along with an underweighting and stock selection in materials, also aided relative returns. Key individual contributors included a new, off-benchmark investment in biotechnology company Celldex Therapeutics.
Top 10 Holdings
Franklin Small-Mid Cap Growth Securities Fund
12/31/13
| | | | |
Company Sector/Industry | | % of Total
Net Assets | |
| AMETEK Inc. | | | 1.9% | |
| Industrials | | | | |
| Affiliated Managers Group Inc. | | | 1.7% | |
| Financials | | | | |
| Wolverine World Wide Inc. | | | 1.7% | |
| Consumer Discretionary | | | | |
| Roper Industries Inc. | | | 1.6% | |
| Industrials | | | | |
| Jarden Corp. | | | 1.6% | |
| Consumer Discretionary | | | | |
| Actavis PLC | | | 1.4% | |
| Health Care | | | | |
| Wynn Resorts Ltd. | | | 1.3% | |
| Consumer Discretionary | | | | |
| Alliance Data Systems Corp. | | | 1.3% | |
| Information Technology | | | | |
| Trimble Navigation Ltd. | | | 1.3% | |
| Information Technology | | | | |
| Perrigo Co., PLC | | | 1.2% | |
| Health Care | | | | |
The dollar value, number of shares or principal amount, and names of all portfolio holdings are listed in the Fund’s Statement of Investments.
FSC-4
In contrast, key detractors from the Fund’s relative performance included stock selection in the health care and energy sectors. Notable health care detractors included a position in ARIAD Pharmaceuticals and an off-benchmark investment in U.K.-listed Amarin. ARIAD Pharmaceuticals’ share price fell after the biotechnology firm halted trials on its leukemia drug Iclusig and the U.S. Federal Drug Administration (FDA) suspended sales in response to reports of harmful side effects. Amarin’s share price declined after the FDA denied approval to expand the use of the biopharmaceutical company’s fish-oil drug Vascepa to heart-disease patients. In the energy sector, a position in Cobalt International Energy hurt relative results. The oil exploration and production company could not find commercially viable oil at one of its Gulf of Mexico wells, and toward year-end, its stock price fell amid concerns the company may be unable to profit from its larger-than-expected natural gas discovery in Angola. We closed the Fund’s positions in these three companies during the period.
Although the Fund’s overall IT holdings outperformed the index and contributed to relative performance, some investments lost value. Notable detractors included positions in voice recognition software solutions provider Nuance Communications and computer network optimization products manufacturer F5 Networks, both of which we sold during the period. Nuance’s acquisition costs and higher expenses pressured margins despite revenue growth. Shares of F5 Networks declined in value amid slowing revenue growth based on reduced or delayed orders by its largest customers and loss of market share to software-oriented businesses. Key individual detractors included an off-benchmark holding in Canadian athletic apparel maker Lululemon Athletica, whose share price declined after it announced a management change in June and provided a weak fourth quarter earnings outlook.
Thank you for your participation in Franklin Small-Mid Cap Growth Securities Fund. We look forward to serving your future investment needs.
The foregoing information reflects our analysis, opinions and portfolio holdings as of December 31, 2013, the end of the reporting period. The way we implement our main investment strategies and the resulting portfolio holdings may change depending on factors such as market and economic conditions. These opinions may not be relied upon as investment advice or an offer for a particular security. The information is not a complete analysis of every aspect of any market, country, industry, security or the Fund. Statements of fact are from sources considered reliable, but the investment manager makes no representation or warranty as to their completeness or accuracy. Although historical performance is no guarantee of future results, these insights may help you understand our investment management philosophy.
FSC-5
Fund Expenses
As an investor in a variable insurance contract (Contract) that indirectly provides for investment in an underlying mutual fund, you can incur transaction and/or ongoing expenses at both the Fund level and the Contract level.
| • | | Transaction expenses can include sales charges (loads) on purchases, redemption fees, surrender fees, transfer fees and premium taxes. |
| • | | Ongoing expenses can include management fees, distribution and service (12b-1) fees, contract fees, annual maintenance fees, mortality and expense risk fees and other fees and expenses. All mutual funds and Contracts have some types of ongoing expenses. |
The expenses shown in the table are meant to highlight ongoing expenses at the Fund level only and do not include ongoing expenses at the Contract level, or transaction expenses at either the Fund or Contract level. While the Fund does not have transaction expenses, if the transaction and ongoing expenses at the Contract level were included, the expenses shown below would be higher. You should consult your Contract prospectus or disclosure document for more information.
The table shows Fund-level ongoing expenses and can help you understand these expenses and compare them with those of other mutual funds offered through the Contract. The table assumes a $1,000 investment held for the six months indicated. Please refer to the Fund prospectus for additional information on operating expenses.
Actual Fund Expenses
The first line (Actual) of the table provides actual account values and expenses. The “Ending Account Value” is derived from the Fund’s actual return, which includes the effect of ongoing Fund expenses, but does not include the effect of ongoing Contract expenses.
You can estimate the Fund-level expenses you incurred during the period by following these steps. Of course, your account value and expenses will differ from those in this illustration:
| 1. | Divide your account value by $1,000. |
If an account had an $8,600 value, then $8,600 ÷ $1,000 = 8.6.
| 2. | Multiply the result by the number under the heading “Fund-Level Expenses Incurred During Period.” |
If Fund-Level Expenses Incurred During Period were $7.50, then 8.6 x $7.50 = $64.50.
In this illustration, the estimated expenses incurred this period at the Fund level are $64.50.
Franklin Small-Mid Cap Growth Securities Fund Class 4
FSC-6
Hypothetical Example for Comparison with Other Mutual Funds
Information in the second line (Hypothetical) of the table can help you compare ongoing expenses of the Fund with those of other mutual funds offered through the Contract. This information may not be used to estimate the actual ending account balance or expenses you incurred during the period. The hypothetical “Ending Account Value” is based on the Fund’s actual expense ratio and an assumed 5% annual rate of return before expenses, which does not represent the Fund’s actual return. The figure under the heading “Fund-Level Expenses Incurred During Period” shows the hypothetical expenses your account would have incurred under this scenario. You can compare this figure with the 5% hypothetical examples that appear in shareholder reports of other funds offered through a Contract.
| | | | | | | | | | | | |
| Class 4 | | Beginning
Account Value 7/1/13 | | | Ending
Account Value 12/31/13 | | | Fund-Level Expenses Incurred
During Period* 7/1/13–12/31/13 | |
Actual | | $ | 1,000 | | | $ | 1,203.60 | | | $ | 6.33 | |
Hypothetical (5% return
before expenses) | | $ | 1,000 | | | $ | 1,019.46 | | | $ | 5.80 | |
*Expenses are calculated using the most recent six-month annualized expense ratio for the Fund’s Class 4 shares (1.14%), which does not include any ongoing expenses of the Contract for which the Fund is an investment option, multiplied by the average account value over the period, multiplied by 184/365 to reflect the one-half year period.
FSC-7
Franklin Templeton Variable Insurance Products Trust
Financial Highlights
Franklin Small-Mid Cap Growth Securities Fund
| | | | | | | | | | | | | | | | | | | | |
| | | Year Ended December 31, | |
| Class 1 | | 2013 | | | 2012 | | | 2011 | | | 2010 | | | 2009 | |
| | | | |
Per share operating performance | | | | | | | | | | | | | | | | | | | | |
(for a share outstanding throughout the year) | | | | | | | | | | | | | | | | | | | | |
Net asset value, beginning of year | | $ | 21.87 | | | $ | 21.19 | | | $ | 22.21 | | | $ | 17.36 | | | $ | 12.06 | |
| | | | |
Income from investment operationsa: | | | | | | | | | | | | | | | | | | | | |
Net investment income (loss)b | | | (0.09 | ) | | | (0.01 | )c | | | (0.05 | ) | | | (0.01 | ) | | | (0.10 | )d |
Net realized and unrealized gains (losses) | | | 8.19 | | | | 2.27 | | | | (0.97 | ) | | | 4.86 | | | | 5.40 | |
| | | | |
Total from investment operations | | | 8.10 | | | | 2.26 | | | | (1.02 | ) | | | 4.85 | | | | 5.30 | |
| | | | |
Less distributions from net realized gains | | | (1.59 | ) | | | (1.58 | ) | | | — | | | | — | | | | — | |
| | | | |
Net asset value, end of year | | $ | 28.38 | | | $ | 21.87 | | | $ | 21.19 | | | $ | 22.21 | | | $ | 17.36 | |
| | | | |
| | | | | |
Total returne | | | 38.50% | | | | 11.12% | | | | (4.59)% | | | | 27.94% | | | | 43.95% | |
Ratios to average net assets | | | | | | | | | | | | | | | | | | | | |
Expenses | | | 0.80% | f | | | 0.80% | | | | 0.79% | | | | 0.79% | | | | 0.80% | f |
Net investment income (loss) | | | (0.35)% | | | | (0.03)% | c | | | (0.21)% | | | | (0.07)% | | | | (0.72)% | d |
| | | | | |
Supplemental data | | | | | | | | | | | | | | | | | | | | |
Net assets, end of year (000’s) | | $ | 98,020 | | | $ | 75,977 | | | $ | 76,384 | | | $ | 89,826 | | | $ | 79,670 | |
Portfolio turnover rate | | �� | 42.77% | | | | 41.44% | | | | 45.00% | | | | 46.69% | | | | 63.93% | |
aThe amount shown for a share outstanding throughout the period may not correlate with the Statement of Operations for the period due to the timing of sales and repurchases of the Fund shares in relation to income earned and/or fluctuating market value of the investments of the Fund.
bBased on average daily shares outstanding.
cNet investment income per share includes approximately $0.03 per share received in the form of special dividends. Excluding these amounts, the ratio of net investment income to average net assets would have been (0.16)%.
dNet investment income per share includes approximately $(0.06) per share as a return of capital adjustment to a previously recorded special dividend received by the Fund. Excluding this non-recurring amount, the ratio of net investment income to average net assets would have been (0.22)%.
eTotal return does not include fees, charges or expenses imposed by the variable annuity and life insurance contracts for which the Franklin Templeton Variable Insurance Products Trust serves as an underlying investment vehicle.
fBenefit of expense reduction rounds to less than 0.01%.
The accompanying notes are an integral part of these financial statements.
FSC-8
Franklin Templeton Variable Insurance Products Trust
Financial Highlights (continued)
Franklin Small-Mid Cap Growth Securities Fund
| | | | | | | | | | | | | | | | | | | | |
| | | Year Ended December 31, | |
| Class 2 | | 2013 | | | 2012 | | | 2011 | | | 2010 | | | 2009 | |
| | | | |
Per share operating performance | | | | | | | | | | | | | | | | | | | | |
(for a share outstanding throughout the year) | | | | | | | | | | | | | | | | | | | | |
Net asset value, beginning of year | | $ | 21.04 | | | $ | 20.49 | | | $ | 21.54 | | | $ | 16.87 | | | $ | 11.75 | |
| | | | |
Income from investment operationsa: | | | | | | | | | | | | | | | | | | | | |
Net investment income (loss)b | | | (0.14 | ) | | | (0.06 | )c | | | (0.10 | ) | | | (0.06 | ) | | | (0.13 | )d |
Net realized and unrealized gains (losses) | | | 7.85 | | | | 2.19 | | | | (0.95 | ) | | | 4.73 | | | | 5.25 | |
| | | | |
Total from investment operations | | | 7.71 | | | | 2.13 | | | | (1.05 | ) | | | 4.67 | | | | 5.12 | |
| | | | |
Less distributions from net realized gains | | | (1.59 | ) | | | (1.58 | ) | | | — | | | | — | | | | — | |
| | | | |
Net asset value, end of year | | $ | 27.16 | | | $ | 21.04 | | | $ | 20.49 | | | $ | 21.54 | | | $ | 16.87 | |
| | | | |
| | | | | |
Total returne | | | 38.15% | | | | 10.85% | | | | (4.87)% | | | | 27.68% | | | | 43.57% | |
Ratios to average net assets | | | | | | | | | | | | | | | | | | | | |
Expenses | | | 1.05% | f | | | 1.05% | | | | 1.04% | | | | 1.04% | | | | 1.05% | f |
Net investment income (loss) | | | (0.60)% | | | | (0.28)% | c | | | (0.46)% | | | | (0.32)% | | | | (0.97)% | d |
| | | | | |
Supplemental data | | | | | | | | | | | | | | | | | | | | |
Net assets, end of year (000’s) | | $ | 660,806 | | | $ | 670,193 | | | $ | 717,086 | | | $ | 939,481 | | | $ | 813,480 | |
Portfolio turnover rate | | | 42.77% | | | | 41.44% | | | | 45.00% | | | | 46.69% | | | | 63.93% | |
aThe amount shown for a share outstanding throughout the period may not correlate with the Statement of Operations for the period due to the timing of sales and repurchases of the Fund shares in relation to income earned and/or fluctuating market value of the investments of the Fund.
bBased on average daily shares outstanding.
cNet investment income per share includes approximately $0.03 per share received in the form of special dividends. Excluding these amounts, the ratio of net investment income to average net assets would have been (0.41)%.
dNet investment income per share includes approximately $(0.06) per share as a return of capital adjustment to a previously recorded special dividend received by the Fund. Excluding this non-recurring amount, the ratio of net investment income to average net assets would have been (0.47)%.
eTotal return does not include fees, charges or expenses imposed by the variable annuity and life insurance contracts for which the Franklin Templeton Variable Insurance Products Trust serves as an underlying investment vehicle.
fBenefit of expense reduction rounds to less than 0.01%.
The accompanying notes are an integral part of these financial statements.
FSC-9
Franklin Templeton Variable Insurance Products Trust
Financial Highlights (continued)
Franklin Small-Mid Cap Growth Securities Fund
| | | | | | | | | | | | | | | | | | | | |
| | | Year Ended December 31, | |
| Class 4 | | 2013 | | | 2012 | | | 2011 | | | 2010 | | | 2009 | |
| | | | |
Per share operating performance | | | | | | | | | | | | | | | | | | | | |
(for a share outstanding throughout the year) | | | | | | | | | | | | | | | | | | | | |
Net asset value, beginning of year | | $ | 21.47 | | | $ | 20.90 | | | $ | 21.98 | | | $ | 17.24 | | | $ | 12.02 | |
| | | | |
Income from investment operationsa: | | | | | | | | | | | | | | | | | | | | |
Net investment income (loss)b | | | (0.17 | ) | | | (0.09 | )c | | | (0.12 | ) | | | (0.07 | ) | | | (0.15 | )d |
Net realized and unrealized gains (losses) | | | 8.01 | | | | 2.24 | | | | (0.96 | ) | | | 4.81 | | | | 5.37 | |
| | | | |
Total from investment operations | | | 7.84 | | | | 2.15 | | | | (1.08 | ) | | | 4.74 | | | | 5.22 | |
| | | | |
Less distributions from net realized gains | | | (1.59 | ) | | | (1.58 | ) | | | — | | | | — | | | | — | |
| | | | |
Net asset value, end of year | | $ | 27.72 | | | $ | 21.47 | | | $ | 20.90 | | | $ | 21.98 | | | $ | 17.24 | |
| | | | |
| | | | | |
Total returne | | | 37.99% | | | | 10.79% | | | | (4.91)% | | | | 27.49% | | | | 43.43% | |
Ratios to average net assets | | | | | | | | | | | | | | | | | | | | |
Expenses | | | 1.15% | f | | | 1.15% | | | | 1.14% | | | | 1.14% | | | | 1.15% | f |
Net investment income (loss) | | | (0.70)% | | | | (0.38)% | c | | | (0.56)% | | | | (0.42)% | | | | (1.07)% | d |
| | | | | |
Supplemental data | | | | | | | | | | | | | | | | | | | | |
Net assets, end of year (000’s) | | $ | 19,132 | | | $ | 12,000 | | | $ | 12,664 | | | $ | 15,413 | | | $ | 11,029 | |
Portfolio turnover rate | | | 42.77% | | | | 41.44% | | | | 45.00% | | | | 46.69% | | | | 63.93% | |
aThe amount shown for a share outstanding throughout the period may not correlate with the Statement of Operations for the period due to the timing of sales and repurchases of the Fund shares in relation to income earned and/or fluctuating market value of the investments of the Fund.
bBased on average daily shares outstanding.
cNet investment income per share includes approximately $0.03 per share received in the form of special dividends. Excluding these amounts, the ratio of net investment income to average net assets would have been (0.51)%.
dNet investment income per share includes approximately $(0.06) per share as a return of capital adjustment to a previously recorded special dividend received by the Fund. Excluding this non-recurring amount, the ratio of net investment income to average net assets would have been (0.57)%.
eTotal return does not include fees, charges or expenses imposed by the variable annuity and life insurance contracts for which the Franklin Templeton Variable Insurance Products Trust serves as an underlying investment vehicle.
fBenefit of expense reduction rounds to less than 0.01%.
The accompanying notes are an integral part of these financial statements.
FSC-10
Franklin Templeton Variable Insurance Products Trust
Statement of Investments, December 31, 2013
| | | | | | | | | | |
| Franklin Small-Mid Cap Growth Securities Fund | | Country | | Shares | | | Value | |
Common Stocks 98.8% | | | | | | | | | | |
Consumer Discretionary 24.9% | | | | | | | | | | |
a AMC Networks Inc., A | | United States | | | 68,200 | | | $ | 4,645,102 | |
a Bally Technologies Inc. | | United States | | | 36,100 | | | | 2,832,045 | |
BorgWarner Inc. | | United States | | | 142,800 | | | | 7,983,948 | |
a BRP Inc. | | Canada | | | 224,600 | | | | 6,375,456 | |
a Buffalo Wild Wings Inc. | | United States | | | 36,300 | | | | 5,343,360 | |
a Charter Communications Inc., A | | United States | | | 25,700 | | | | 3,514,732 | |
a Chipotle Mexican Grill Inc. | | United States | | | 14,300 | | | | 7,618,754 | |
Dick’s Sporting Goods Inc. | | United States | | | 161,200 | | | | 9,365,720 | |
a Dollar General Corp. | | United States | | | 151,700 | | | | 9,150,544 | |
GNC Holdings Inc., A | | United States | | | 127,500 | | | | 7,452,375 | |
Harman International Industries Inc. | | United States | | | 67,800 | | | | 5,549,430 | |
a HomeAway Inc. | | United States | | | 150,300 | | | | 6,144,264 | |
a Imax Corp. | | Canada | | | 83,800 | | | | 2,470,424 | |
a Jarden Corp. | | United States | | | 204,900 | | | | 12,570,615 | |
a Liberty Media Corp., A | | United States | | | 30,400 | | | | 4,452,080 | |
a Lululemon Athletica Inc. | | Canada | | | 73,900 | | | | 4,362,317 | |
a Michael Kors Holdings Ltd. | | United States | | | 71,600 | | | | 5,813,204 | |
a Netflix Inc. | | United States | | | 12,000 | | | | 4,418,040 | |
PetSmart Inc. | | United States | | | 72,300 | | | | 5,259,825 | |
Ralph Lauren Corp. | | United States | | | 44,100 | | | | 7,786,737 | |
Ross Stores Inc. | | United States | | | 78,400 | | | | 5,874,512 | |
The Ryland Group Inc. | | United States | | | 80,300 | | | | 3,485,823 | |
a Shutterfly Inc. | | United States | | | 79,100 | | | | 4,028,563 | |
Starwood Hotels & Resorts Worldwide Inc. | | United States | | | 85,900 | | | | 6,824,755 | |
a Starz, A | | United States | | | 98,100 | | | | 2,868,444 | |
a Tenneco Inc. | | United States | | | 129,800 | | | | 7,342,786 | |
Tractor Supply Co. | | United States | | | 101,000 | | | | 7,835,580 | |
a Under Armour Inc., A | | United States | | | 100,288 | | | | 8,755,142 | |
Wolverine World Wide Inc. | | United States | | | 382,200 | | | | 12,979,512 | |
Wynn Resorts Ltd. | | United States | | | 52,900 | | | | 10,273,709 | |
| | | | | | | | | | |
| | | | | | | | | 193,377,798 | |
| | | | | | | | | | |
Consumer Staples 4.8% | | | | | | | | | | |
a Boston Beer Inc., A | | United States | | | 34,200 | | | | 8,269,218 | |
Mead Johnson Nutrition Co., A | | United States | | | 111,000 | | | | 9,297,360 | |
a Monster Beverage Corp. | | United States | | | 89,500 | | | | 6,065,415 | |
a TreeHouse Foods Inc. | | United States | | | 85,900 | | | | 5,920,228 | |
Whole Foods Market Inc. | | United States | | | 139,800 | | | | 8,084,634 | |
| | | | | | | | | | |
| | | | | | | | | 37,636,855 | |
| | | | | | | | | | |
Energy 4.7% | | | | | | | | | | |
Cabot Oil & Gas Corp., A | | United States | | | 141,800 | | | | 5,496,168 | |
a Cameron International Corp. | | United States | | | 93,000 | | | | 5,536,290 | |
a Diamondback Energy Inc. | | United States | | | 105,200 | | | | 5,560,872 | |
a FMC Technologies Inc. | | United States | | | 61,100 | | | | 3,190,031 | |
Oceaneering International Inc. | | United States | | | 44,500 | | | | 3,510,160 | |
a,b Sanchez Energy Corp. | | United States | | | 106,100 | | | | 2,600,511 | |
SM Energy Co. | | United States | | | 33,900 | | | | 2,817,429 | |
a Southwestern Energy Co. | | United States | | | 94,700 | | | | 3,724,551 | |
a Superior Energy Services Inc. | | United States | | | 142,600 | | | | 3,794,586 | |
| | | | | | | | | | |
| | | | | | | | | 36,230,598 | |
| | | | | | | | | | |
Financials 6.5% | | | | | | | | | | |
a Affiliated Managers Group Inc. | | United States | | | 60,600 | | | | 13,142,928 | |
FSC-11
Franklin Templeton Variable Insurance Products Trust
Statement of Investments, December 31, 2013 (continued)
| | | | | | | | | | |
| Franklin Small-Mid Cap Growth Securities Fund | | Country | | Shares | | | Value | |
Common Stocks (continued) | | | | | | | | | | |
Financials (continued) | | | | | | | | | | |
b Digital Realty Trust Inc. | | United States | | | 40,700 | | | $ | 1,999,184 | |
IntercontinentalExchange Group Inc. | | United States | | | 42,108 | | | | 9,470,931 | |
Jones Lang LaSalle Inc. | | United States | | | 35,300 | | | | 3,614,367 | |
Lazard Ltd., A | | United States | | | 168,100 | | | | 7,618,292 | |
a Signature Bank/New York NY | | United States | | | 88,300 | | | | 9,485,186 | |
T. Rowe Price Group Inc. | | United States | | | 67,300 | | | | 5,637,721 | |
| | | | | | | | | | |
| | | | | | | | | 50,968,609 | |
| | | | | | | | | | |
Health Care 16.2% | | | | | | | | | | |
a Actavis PLC | | United States | | | 63,100 | | | | 10,600,800 | |
Agilent Technologies Inc. | | United States | | | 99,100 | | | | 5,667,529 | |
a Alexion Pharmaceuticals Inc. | | United States | | | 42,900 | | | | 5,708,274 | |
a Alnylam Pharmaceuticals Inc. | | United States | | | 55,300 | | | | 3,557,449 | |
a BioMarin Pharmaceutical Inc. | | United States | | | 30,500 | | | | 2,143,235 | |
a CareFusion Corp. | | United States | | | 74,300 | | | | 2,958,626 | |
a Catamaran Corp. | | Canada | | | 116,200 | | | | 5,517,176 | |
a Celldex Therapeutics Inc. | | United States | | | 227,500 | | | | 5,507,775 | |
a Cerner Corp. | | United States | | | 111,400 | | | | 6,209,436 | |
The Cooper Cos. Inc. | | United States | | | 40,700 | | | | 5,040,288 | |
a DaVita HealthCare Partners Inc. | | United States | | | 114,600 | | | | 7,262,202 | |
a Edwards Lifesciences Corp. | | United States | | | 38,100 | | | | 2,505,456 | |
a Envision Healthcare Holdings Inc. | | United States | | | 155,900 | | | | 5,537,568 | |
a HCA Holdings Inc. | | United States | | | 160,200 | | | | 7,643,142 | |
a HeartWare International Inc. | | United States | | | 33,406 | | | | 3,138,828 | |
a HMS Holdings Corp. | | United States | | | 42,900 | | | | 975,117 | |
a Illumina Inc. | | United States | | | 45,700 | | | | 5,055,334 | |
a Laboratory Corp. of America Holdings | | United States | | | 34,200 | | | | 3,124,854 | |
a Medivation Inc. | | United States | | | 55,846 | | | | 3,564,092 | |
a Mettler-Toledo International Inc. | | United States | | | 32,200 | | | | 7,811,398 | |
Perrigo Co., PLC | | United States | | | 62,686 | | | | 9,619,761 | |
a Sagent Pharmaceuticals Inc. | | United States | | | 167,800 | | | | 4,258,764 | |
St. Jude Medical Inc. | | United States | | | 80,900 | | | | 5,011,755 | |
a Vertex Pharmaceuticals Inc. | | United States | | | 51,900 | | | | 3,856,170 | |
Zoetis Inc. | | United States | | | 120,900 | | | | 3,952,221 | |
| | | | | | | | | | |
| | | | | | | | | 126,227,250 | |
| | | | | | | | | | |
Industrials 20.4% | | | | | | | | | | |
a The Advisory Board Co. | | United States | | | 34,300 | | | | 2,183,881 | |
Allegiant Travel Co. | | United States | | | 49,712 | | | | 5,241,633 | |
AMETEK Inc. | | United States | | | 285,100 | | | | 15,016,217 | |
a B/E Aerospace Inc. | | United States | | | 85,800 | | | | 7,467,174 | |
a Colfax Corp. | | United States | | | 101,600 | | | | 6,470,904 | |
Delta Air Lines Inc. | | United States | | | 159,200 | | | | 4,373,224 | |
a DigitalGlobe Inc. | | United States | | | 184,000 | | | | 7,571,600 | |
Flowserve Corp. | | United States | | | 120,300 | | | | 9,483,249 | |
a Genesee & Wyoming Inc. | | United States | | | 61,400 | | | | 5,897,470 | |
a Hertz Global Holdings Inc. | | United States | | | 139,900 | | | | 4,003,938 | |
a Hexcel Corp. | | United States | | | 144,800 | | | | 6,471,112 | |
Hubbell Inc., B | | United States | | | 29,600 | | | | 3,223,440 | |
a IHS Inc., A | | United States | | | 73,800 | | | | 8,833,860 | |
Interface Inc. | | United States | | | 95,800 | | | | 2,103,768 | |
J.B. Hunt Transport Services Inc. | | United States | | | 68,400 | | | | 5,287,320 | |
a Jacobs Engineering Group Inc. | | United States | | | 53,300 | | | | 3,357,367 | |
Kansas City Southern | | United States | | | 47,100 | | | | 5,832,393 | |
FSC-12
Franklin Templeton Variable Insurance Products Trust
Statement of Investments, December 31, 2013 (continued)
| | | | | | | | | | |
| Franklin Small-Mid Cap Growth Securities Fund | | Country | | Shares | | | Value | |
Common Stocks (continued) | | | | | | | | | | |
Industrials (continued) | | | | | | | | | | |
The Manitowoc Co. Inc. | | United States | | | 283,400 | | | $ | 6,608,888 | |
Pall Corp. | | United States | | | 76,900 | | | | 6,563,415 | |
Robert Half International Inc. | | United States | | | 161,400 | | | | 6,777,186 | |
Rockwell Automation Inc. | | United States | | | 34,300 | | | | 4,052,888 | |
Roper Industries Inc. | | United States | | | 91,870 | | | | 12,740,532 | |
a Spirit Airlines Inc. | | United States | | | 95,200 | | | | 4,323,032 | |
a United Rentals Inc. | | United States | | | 102,300 | | | | 7,974,285 | |
a Verisk Analytics Inc., A | | United States | | | 55,500 | | | | 3,647,460 | |
W.W. Grainger Inc. | | United States | | | 13,700 | | | | 3,499,254 | |
| | | | | | | | | | |
| | | | | | | | | 159,005,490 | |
| | | | | | | | | | |
Information Technology 17.2% | | | | | | | | | | |
a Alliance Data Systems Corp. | | United States | | | 38,300 | | | | 10,070,219 | |
a ANSYS Inc. | | United States | | | 99,100 | | | | 8,641,520 | |
Avago Technologies Ltd. | | Singapore | | | 155,000 | | | | 8,197,950 | |
a Bottomline Technologies Inc. | | United States | | | 121,900 | | | | 4,407,904 | |
a Demandware Inc. | | United States | | | 32,300 | | | | 2,071,076 | |
a Electronic Arts Inc. | | United States | | | 107,200 | | | | 2,459,168 | |
a FleetCor Technologies Inc. | | United States | | | 48,800 | | | | 5,717,896 | |
a Global Eagle Entertainment Inc. | | United States | | | 112,200 | | | | 1,668,414 | |
Intersil Corp., A | | United States | | | 315,000 | | | | 3,613,365 | |
a JDS Uniphase Corp. | | United States | | | 343,300 | | | | 4,456,034 | |
a Lam Research Corp. | | United States | | | 108,500 | | | | 5,907,825 | |
a LinkedIn Corp., A | | United States | | | 34,200 | | | | 7,415,586 | |
Maxim Integrated Products Inc. | | United States | | | 130,400 | | | | 3,639,464 | |
National Instruments Corp. | | United States | | | 78,300 | | | | 2,507,166 | |
a NetSuite Inc. | | United States | | | 36,100 | | | | 3,719,022 | |
a Nortel Networks Corp. | | Canada | | | 4 | | | | — | |
a NXP Semiconductors NV | | Netherlands | | | 201,600 | | | | 9,259,488 | |
a Palo Alto Networks Inc. | | United States | | | 41,900 | | | | 2,407,993 | |
a Pandora Media Inc. | | United States | | | 121,500 | | | | 3,231,900 | |
a Red Hat Inc. | | United States | | | 60,800 | | | | 3,407,232 | |
a Semtech Corp. | | United States | | | 102,500 | | | | 2,591,200 | |
a ServiceNow Inc. | | United States | | | 94,200 | | | | 5,276,142 | |
a Silicon Laboratories Inc. | | United States | | | 103,000 | | | | 4,460,930 | |
a Stratasys Ltd. | | United States | | | 20,104 | | | | 2,708,009 | |
a Trimble Navigation Ltd. | | United States | | | 285,300 | | | | 9,899,910 | |
a,b Twitter Inc. | | United States | | | 32,800 | | | | 2,087,720 | |
a ViaSat Inc. | | United States | | | 72,500 | | | | 4,542,125 | |
a Workday Inc. | | United States | | | 21,200 | | | | 1,762,992 | |
Xilinx Inc. | | United States | | | 120,700 | | | | 5,542,544 | |
a Yelp Inc. | | United States | | | 33,400 | | | | 2,302,930 | |
| | | | | | | | | | |
| | | | | | | | | 133,973,724 | |
| | | | | | | | | | |
Materials 2.1% | | | | | | | | | | |
Airgas Inc. | | United States | | | 55,900 | | | | 6,252,415 | |
Cytec Industries Inc. | | United States | | | 57,200 | | | | 5,328,752 | |
H.B. Fuller Co. | | United States | | | 85,713 | | | | 4,460,505 | |
| | | | | | | | | | |
| | | | | | | | | 16,041,672 | |
| | | | | | | | | | |
Telecommunication Services 1.2% | | | | | | | | | | |
a SBA Communications Corp. | | United States | | | 100,200 | | | | 9,001,968 | |
| | | | | | | | | | |
FSC-13
Franklin Templeton Variable Insurance Products Trust
Statement of Investments, December 31, 2013 (continued)
| | | | | | | | | | |
| Franklin Small-Mid Cap Growth Securities Fund | | Country | | Shares | | | Value | |
Common Stocks (continued) | | | | | | | | | | |
Utilities 0.8% | | | | | | | | | | |
a Calpine Corp. | | United States | | | 333,700 | | | $ | 6,510,487 | |
| | | | | | | | | | |
Total Common Stocks (Cost $447,472,979) | | | | | | | | | 768,974,451 | |
| | | | | | | | | | |
Short Term Investments 2.1% | | | | | | | | | | |
Money Market Funds (Cost $9,817,245) 1.3% | | | | | | | | | | |
a,c Institutional Fiduciary Trust Money Market Portfolio | | United States | | | 9,817,245 | | | | 9,817,245 | |
| | | | | | | | | | |
dInvestments from Cash Collateral Received for Loaned Securities
(Cost $6,112,575) 0.8% | | | | | | | | | | |
Money Market Funds 0.8% | | | | | | | | | | |
e BNY Mellon Overnight Government Fund, 0.017% | | United States | | | 6,112,575 | | | | 6,112,575 | |
| | | | | | | | | | |
Total Investments (Cost $463,402,799) 100.9% | | | | | | | | | 784,904,271 | |
Other Assets, less Liabilities (0.9)% | | | | | | | | | (6,945,787 | ) |
| | | | | | | | | | |
Net Assets 100.0% | | | | | | | | $ | 777,958,484 | |
| | | | | | | | | | |
aNon-income producing.
bA portion or all of the security is on loan at December 31, 2013. See Note 1(c).
cSee Note 7 regarding investments in the Institutional Fiduciary Trust Money Market Portfolio.
dSee Note 1(c) regarding securities on loan.
eThe rate shown is the annualized seven-day yield at period end.
The accompanying notes are an integral part of these financial statements.
FSC-14
Franklin Templeton Variable Insurance Products Trust
Financial Statements
Statement of Assets and Liabilities
December 31, 2013
| | | | |
| | | Franklin Small-Mid
Cap Growth
Securities Fund | |
Assets: | | | | |
Investments in securities: | | | | |
Cost - Unaffiliated issuers | | $ | 453,585,554 | |
Cost - Sweep Money Fund (Note 7) | | | 9,817,245 | |
| | | | |
Total cost of investments | | $ | 463,402,799 | |
| | | | |
Value - Unaffiliated issuers | | $ | 775,087,026 | |
Value - Sweep Money Fund (Note 7) | | | 9,817,245 | |
| | | | |
Total value of investments (includes securities loaned in the amount of $6,115,761) | | | 784,904,271 | |
Receivables: | | | | |
Investment securities sold | | | 1,000,636 | |
Capital shares sold | | | 117,783 | |
Dividends and interest | | | 288,194 | |
Other assets | | | 75 | |
| | | | |
Total assets | | | 786,310,959 | |
| | | | |
Liabilities: | | | | |
Payables: | | | | |
Investment securities purchased | | | 103,498 | |
Capital shares redeemed | | | 1,147,510 | |
Management fees | | | 494,488 | |
Distribution fees | | | 280,575 | |
Payable upon return of securities loaned | | | 6,112,575 | |
Accrued expenses and other liabilities | | | 213,829 | |
| | | | |
Total liabilities | | | 8,352,475 | |
| | | | |
Net assets, at value | | $ | 777,958,484 | |
| | | | |
Net assets consist of: | | | | |
Paid-in capital | | $ | 314,807,747 | |
Undistributed net investment income | | | 2,662 | |
Net unrealized appreciation (depreciation) | | | 321,501,472 | |
Accumulated net realized gain (loss) | | | 141,646,603 | |
| | | | |
Net assets, at value | | $ | 777,958,484 | |
| | | | |
Class 1: | | | | |
Net assets, at value | | $ | 98,019,912 | |
| | | | |
Shares outstanding | | | 3,453,316 | |
| | | | |
Net asset value and maximum offering price per share | | $ | 28.38 | |
| | | | |
Class 2: | | | | |
Net assets, at value | | $ | 660,806,191 | |
| | | | |
Shares outstanding | | | 24,330,254 | |
| | | | |
Net asset value and maximum offering price per share | | $ | 27.16 | |
| | | | |
Class 4: | | | | |
Net assets, at value | | $ | 19,132,381 | |
| | | | |
Shares outstanding | | | 690,212 | |
| | | | |
Net asset value and maximum offering price per share | | $ | 27.72 | |
| | | | |
The accompanying notes are an integral part of these financial statements.
FSC-15
Franklin Templeton Variable Insurance Products Trust
Financial Statements (continued)
Statement of Operations
for the year ended December 31, 2013
| | | | |
| | | Franklin Small-Mid
Cap Growth
Securities Fund | |
Investment income: | | | | |
Dividends | | $ | 3,282,357 | |
Income from securities loaned | | | 76,531 | |
| | | | |
Total investment income | | | 3,358,888 | |
| | | | |
Expenses: | | | | |
Management fees (Note 3a) | | | 5,130,037 | |
Administrative fees (Note 3b) | | | 656,155 | |
Distribution fees: (Note 3c) | | | | |
Class 2 | | | 1,639,537 | |
Class 4 | | | 52,187 | |
Unaffiliated transfer agent fees | | | 981 | |
Custodian fees (Note 4) | | | 6,906 | |
Reports to shareholders | | | 175,194 | |
Professional fees | | | 46,946 | |
Trustees’ fees and expenses | | | 3,030 | |
Other | | | 20,848 | |
| | | | |
Total expenses | | | 7,731,821 | |
Expense reductions (Note 4) | | | (14 | ) |
| | | | |
Net expenses | | | 7,731,807 | |
| | | | |
Net investment income (loss) | | | (4,372,919 | ) |
| | | | |
Realized and unrealized gains (losses): | | | | |
Net realized gain (loss) from: | | | | |
Investments | | | 148,347,375 | |
Foreign currency transactions | | | 13,360 | |
| | | | |
Net realized gain (loss) | | | 148,360,735 | |
| | | | |
Net change in unrealized appreciation (depreciation) on investments | | | 103,931,403 | |
| | | | |
Net realized and unrealized gain (loss) | | | 252,292,138 | |
| | | | |
Net increase (decrease) in net assets resulting from operations | | $ | 247,919,219 | |
| | | | |
The accompanying notes are an integral part of these financial statements.
FSC-16
Franklin Templeton Variable Insurance Products Trust
Financial Statements (continued)
Statements of Changes in Net Assets
| | | | | | | | |
| | | Franklin Small-Mid Cap Growth
Securities Fund | |
| | | Year Ended December 31, | |
| | | 2013 | | | 2012 | |
| | | | |
Increase (decrease) in net assets: | | | | | | | | |
Operations: | | | | | | | | |
Net investment income (loss) | | $ | (4,372,919 | ) | | $ | (2,100,633 | ) |
Net realized gain (loss) from investments and foreign currency transactions | | | 148,360,735 | | | | 45,009,702 | |
Net change in unrealized appreciation (depreciation) on investments | | | 103,931,403 | | | | 40,911,343 | |
| | | | |
Net increase (decrease) in net assets resulting from operations | | | 247,919,219 | | | | 83,820,412 | |
| | | | |
Distributions to shareholders from: | | | | | | | | |
Net realized gains: | | | | | | | | |
Class 1 | | | (5,305,025 | ) | | | (5,398,642 | ) |
Class 2 | | | (39,304,696 | ) | | | (51,973,132 | ) |
Class 4 | | | (836,392 | ) | | | (1,174,175 | ) |
| | | | |
Total distributions to shareholders | | | (45,446,113 | ) | | | (58,545,949 | ) |
| | | | |
Capital share transactions: (Note 2) | | | | | | | | |
Class 1 | | | (739,844 | ) | | | (3,317,419 | ) |
Class 2 | | | (185,107,692 | ) | | | (69,375,316 | ) |
Class 4 | | | 3,163,185 | | | | (546,347 | ) |
| | | | |
Total capital share transactions | | | (182,684,351 | ) | | | (73,239,082 | ) |
| | | | |
Net increase (decrease) in net assets | | | 19,788,755 | | | | (47,964,619 | ) |
Net assets: | | | | | | | | |
Beginning of year | | | 758,169,729 | | | | 806,134,348 | |
| | | | |
End of year | | $ | 777,958,484 | | | $ | 758,169,729 | |
| | | | |
Undistributed net investment income included in net assets: | | | | | | | | |
End of year | | $ | 2,662 | | | $ | 825 | |
| | | | |
The accompanying notes are an integral part of these financial statements.
FSC-17
Franklin Templeton Variable Insurance Products Trust
Notes to Financial Statements
Franklin Small-Mid Cap Growth Securities Fund
1. ORGANIZATION AND SIGNIFICANT ACCOUNTING POLICIES
Franklin Templeton Variable Insurance Products Trust (Trust) is registered under the Investment Company Act of 1940, as amended, (1940 Act) as an open-end investment company, consisting of twenty separate funds. The Franklin Small-Mid Cap Growth Securities Fund (Fund) is included in this report. The financial statements of the remaining funds in the Trust are presented separately. Shares of the Fund are generally sold only to insurance company separate accounts to fund the benefits of variable life insurance policies or variable annuity contracts. At December 31, 2013, 45.10% of the Fund’s shares were held through one insurance company. Investment activities of these insurance company separate accounts could have a material impact on the Fund. The Fund offers three classes of shares: Class 1, Class 2, and Class 4. Each class of shares differs by its distribution fees, voting rights on matters affecting a single class and its exchange privilege.
The following summarizes the Fund’s significant accounting policies.
a. Financial Instrument Valuation
The Fund’s investments in financial instruments are carried at fair value daily. Fair value is the price that would be received to sell an asset or paid to transfer a liability in an orderly transaction between market participants on the measurement date. The Fund calculates the net asset value (NAV) per share at the close of the New York Stock Exchange (NYSE), generally at 4p.m. Eastern time (NYSE close) on each day the NYSE is open for trading. Under procedures approved by the Trust’s Board of Trustees (the Board), the Fund’s administrator, investment manager and other affiliates have formed the Valuation and Liquidity Oversight Committee (VLOC). The VLOC provides administration and oversight of the Fund’s valuation policies and procedures, which are approved annually by the Board. Among other things, these procedures allow the Fund to utilize independent pricing services, quotations from securities and financial instrument dealers, and other market sources to determine fair value.
Equity securities listed on an exchange or on the NASDAQ National Market System are valued at the last quoted sale price or the official closing price of the day, respectively. Foreign equity securities are valued as of the close of trading on the foreign stock exchange on which the security is primarily traded or as of the NYSE close, whichever is earlier. The value is then converted into its U.S. dollar equivalent at the foreign exchange rate in effect at the NYSE close on the day that the value of the security is determined. Over-the-counter (OTC) securities are valued within the range of the most recent quoted bid and ask prices. Securities that trade in multiple markets or on multiple exchanges are valued according to the broadest and most representative market. Certain equity securities are valued based upon fundamental characteristics or relationships to similar securities. Investments in open-end mutual funds and non-registered money market funds are valued at the closing net asset value.
The Fund has procedures to determine the fair value of financial instruments for which market prices are not reliable or readily available. Under these procedures, the VLOC convenes on a regular basis to review such financial instruments and considers a number of factors, including significant unobservable valuation inputs, when arriving at fair value. The VLOC primarily employs a market-based approach which may use related or comparable assets or liabilities, recent transactions, market multiples, book values, and other relevant information for the investment to determine the fair value of the investment. An income-based valuation approach may also be used in which the anticipated future cash flows of the investment are discounted to calculate fair value. Discounts may also be applied due to the nature or duration of any restrictions on the disposition of the investments. Due to the inherent uncertainty of valuations of such investments, the fair values may differ significantly from the values that would have been used had an active market existed. The VLOC employs various methods for calibrating these valuation approaches including a regular review of key inputs and assumptions, transactional back-testing or disposition analysis, and reviews of any related market activity.
Trading in securities on foreign securities stock exchanges and OTC markets may be completed before the daily NYSE close. In addition, trading in certain foreign markets may not take place on every NYSE business day. Occasionally, events occur between the time at which trading in a foreign security is completed and the close of the NYSE that might call into question the reliability of the value of a portfolio security held by the Fund. As a result, differences may arise between the value of the Fund’s portfolio securities as determined at the foreign market close and the latest indications of value at the close of the NYSE. In order to minimize the potential for these differences, the VLOC monitors price movements following the close of trading in foreign stock
FSC-18
Franklin Templeton Variable Insurance Products Trust
Notes to Financial Statements (continued)
Franklin Small-Mid Cap Growth Securities Fund
1. ORGANIZATION AND SIGNIFICANT ACCOUNTING POLICIES (continued)
a. Financial Instrument Valuation (continued)
markets through a series of country specific market proxies (such as baskets of American Depositary Receipts, futures contracts and exchange traded funds). These price movements are measured against established trigger thresholds for each specific market proxy to assist in determining if an event has occurred that may call into question the reliability of the values of the foreign securities held by the Fund. If such an event occurs, the securities may be valued using fair value procedures, which may include the use of independent pricing services.
Also, when the last day of the reporting period is a non-business day, certain foreign markets may be open on those days that the NYSE is closed, which could result in differences between the value of the Fund’s portfolio securities on the last business day and the last calendar day of the reporting period. Any significant security valuation changes due to an open foreign market are adjusted and reflected by the Fund for financial reporting purposes.
b. Foreign Currency Translation
Portfolio securities and other assets and liabilities denominated in foreign currencies are translated into U.S. dollars based on the exchange rate of such currencies against U.S. dollars on the date of valuation. The Fund may enter into foreign currency exchange contracts to facilitate transactions denominated in a foreign currency. Purchases and sales of securities, income and expense items denominated in foreign currencies are translated into U.S. dollars at the exchange rate in effect on the transaction date. Portfolio securities and assets and liabilities denominated in foreign currencies contain risks that those currencies will decline in value relative to the U.S. dollar. Occasionally, events may impact the availability or reliability of foreign exchange rates used to convert the U.S. dollar equivalent value. If such an event occurs, the foreign exchange rate will be valued at fair value using procedures established and approved by the Board.
The Fund does not separately report the effect of changes in foreign exchange rates from changes in market prices on securities held. Such changes are included in net realized and unrealized gain or loss from investments on the Statement of Operations.
Realized foreign exchange gains or losses arise from sales of foreign currencies, currency gains or losses realized between the trade and settlement dates on securities transactions and the difference between the recorded amounts of dividends, interest, and foreign withholding taxes and the U.S. dollar equivalent of the amounts actually received or paid. Net unrealized foreign exchange gains and losses arise from changes in foreign exchange rates on foreign denominated assets and liabilities other than investments in securities held at the end of the reporting period.
c. Securities Lending
The Fund participates in an agency based securities lending program. The Fund receives cash collateral against the loaned securities in an amount equal to at least 102% of the market value of the loaned securities. Collateral is maintained over the life of the loan in an amount not less than 100% of the market value of loaned securities, as determined at the close of fund business each day; any additional collateral required due to changes in security values is delivered to the Fund on the next business day. The collateral is invested in a non-registered money fund as indicated on the Statement of Investments. The Fund receives income from the investment of cash collateral, in addition to lending fees and rebates paid by the borrower. The Fund bears the market risk with respect to the collateral investment, securities loaned, and the risk that the agent may default on its obligations to the Fund. The securities lending agent has agreed to indemnify the Fund in the event of default by a third party borrower.
d. Income and Deferred Taxes
It is the Fund’s policy to qualify as a regulated investment company under the Internal Revenue Code. The Fund intends to distribute to shareholders substantially all of its taxable income and net realized gains to relieve it from federal income and if applicable, excise taxes. As a result, no provision for U.S. federal income taxes is required.
FSC-19
Franklin Templeton Variable Insurance Products Trust
Notes to Financial Statements (continued)
Franklin Small-Mid Cap Growth Securities Fund
1. ORGANIZATION AND SIGNIFICANT ACCOUNTING POLICIES (continued)
d. Income and Deferred Taxes (continued)
The Fund may be subject to foreign taxation related to income received, capital gains on the sale of securities and certain foreign currency transactions in the foreign jurisdictions in which it invests. Foreign taxes, if any, are recorded based on the tax regulations and rates that exist in the foreign markets in which the Fund invests. When a capital gain tax is determined to apply the Fund records an estimated deferred tax liability in an amount that would be payable if the securities were disposed of on the valuation date.
The Fund recognizes the tax benefits of uncertain tax positions only when the position is “more likely than not” to be sustained upon examination by the tax authorities based on the technical merits of the tax position. As of December 31, 2013, and for all open tax years, the Fund has determined that no liability for unrecognized tax benefits is required in the Fund’s financial statements related to uncertain tax positions taken on a tax return (or expected to be taken on future tax returns). Open tax years are those that remain subject to examination and are based on each tax jurisdiction statute of limitation.
e. Security Transactions, Investment Income, Expenses and Distributions
Security transactions are accounted for on trade date. Realized gains and losses on security transactions are determined on a specific identification basis. Estimated expenses are accrued daily. Dividend income is recorded on the ex-dividend date except that certain dividends from foreign securities are recognized as soon as the Fund is notified of the ex-dividend date. Distributions to shareholders are recorded on the ex-dividend date and are determined according to income tax regulations (tax basis). Distributable earnings determined on a tax basis may differ from earnings recorded in accordance with accounting principles generally accepted in the United States of America. These differences may be permanent or temporary. Permanent differences are reclassified among capital accounts to reflect their tax character. These reclassifications have no impact on net assets or the results of operations. Temporary differences are not reclassified, as they may reverse in subsequent periods.
Common expenses incurred by the Trust are allocated among the funds based on the ratio of net assets of each fund to the combined net assets of the Trust. Fund specific expenses are charged directly to the fund that incurred the expense.
Realized and unrealized gains and losses and net investment income, not including class specific expenses, are allocated daily to each class of shares based upon the relative proportion of net assets of each class. Differences in per share distributions, by class, are generally due to differences in class specific expenses.
f. Accounting Estimates
The preparation of financial statements in accordance with accounting principles generally accepted in the United States of America requires management to make estimates and assumptions that affect the reported amounts of assets and liabilities at the date of the financial statements and the amounts of income and expenses during the reporting period. Actual results could differ from those estimates.
g. Guarantees and Indemnifications
Under the Trust’s organizational documents, its officers and trustees are indemnified by the Trust against certain liabilities arising out of the performance of their duties to the Trust. Additionally, in the normal course of business, the Trust, on behalf of the Fund, enters into contracts with service providers that contain general indemnification clauses. The Trust’s maximum exposure under these arrangements is unknown as this would involve future claims that may be made against the Trust that have not yet occurred. Currently, the Trust expects the risk of loss to be remote.
FSC-20
Franklin Templeton Variable Insurance Products Trust
Notes to Financial Statements (continued)
Franklin Small-Mid Cap Growth Securities Fund
2. SHARES OF BENEFICIAL INTEREST
At December 31, 2013, there were an unlimited number of shares authorized (without par value). Transactions in the Fund’s shares were as follows:
| | | | | | | | | | | | | | | | |
| | | Year Ended December 31, | |
| | | 2013 | | | 2012 | |
| Class 1 Shares: | | Shares | | | Amount | | | Shares | | | Amount | |
Shares sold | | | 208,707 | | | $ | 5,257,737 | | | | 113,036 | | | $ | 2,509,688 | |
Shares issued in reinvestment of distributions | | | 224,030 | | | | 5,305,025 | | | | 261,943 | | | | 5,398,642 | |
Shares redeemed | | | (452,875 | ) | | | (11,302,606 | ) | | | (505,605 | ) | | | (11,225,749 | ) |
| | | | |
Net increase (decrease) | | | (20,138 | ) | | $ | (739,844 | ) | | | (130,626 | ) | | $ | (3,317,419 | ) |
| | | | |
Class 2 Shares: | | | | | | | | | | | | | | | | |
Shares sold | | | 1,537,143 | | | $ | 36,852,173 | | | | 2,025,093 | | | $ | 43,908,851 | |
Shares issued in reinvestment of distributions | | | 1,732,248 | | | | 39,304,696 | | | | 2,618,294 | | | | 51,973,132 | |
Shares redeemed | | | (10,791,872 | ) | | | (261,264,561 | ) | | | (7,781,173 | ) | | | (165,257,299 | ) |
| | | | |
Net increase (decrease) | | | (7,522,481 | ) | | $ | (185,107,692 | ) | | | (3,137,786 | ) | | $ | (69,375,316 | ) |
| | | | |
Class 4 Shares: | | | | | | | | | | | | | | | | |
Shares sold | | | 272,840 | | | $ | 6,706,822 | | | | 217,367 | | | $ | 4,998,926 | |
Shares issued on reinvestment of distributions | | | 36,098 | | | | 836,392 | | | | 57,955 | | | | 1,174,175 | |
Shares redeemed | | | (177,757 | ) | | | (4,380,029 | ) | | | (322,353 | ) | | | (6,719,448 | ) |
| | | | |
Net increase (decrease) | | | 131,181 | | | $ | 3,163,185 | | | | (47,031 | ) | | $ | (546,347 | ) |
| | | | |
3. TRANSACTIONS WITH AFFILIATES
Franklin Resources, Inc. is the holding company for various subsidiaries that together are referred to as Franklin Templeton Investments. Certain officers and trustees of the Fund are also officers and/or directors of the following subsidiaries:
| | |
| Subsidiary | | Affiliation |
Franklin Advisers, Inc. (Advisers) | | Investment manager |
Franklin Templeton Services, LLC (FT Services) | | Administrative manager |
Franklin Templeton Distributors, Inc. (Distributors) | | Principal underwriter |
Franklin Templeton Investor Services, LLC (Investor Services) | | Transfer agent |
a. Management Fees
The Fund pays an investment management fee to Advisers based on the average daily net assets of the Fund as follows:
| | |
| Annualized Fee Rate | | Net Assets |
| 0.800% | | Up to and including $500 million |
| 0.700% | | Over $500 million, up to and including $1 billion |
| 0.650% | | Over $1 billion, up to and including $1.5 billion |
| 0.600% | | Over $1.5 billion, up to and including $6.5 billion |
| 0.575% | | Over $6.5 billion, up to and including $11.5 billion |
| 0.550% | | Over $11.5 billion, up to and including $16.5 billion |
| 0.540% | | Over $16.5 billion, up to and including $19 billion |
| 0.530% | | Over $19 billion, up to and including $21.5 billion |
| 0.520% | | In excess of $21.5 billion |
FSC-21
Franklin Templeton Variable Insurance Products Trust
Notes to Financial Statements (continued)
Franklin Small-Mid Cap Growth Securities Fund
3. TRANSACTIONS WITH AFFILIATES (continued)
a. Management Fees (continued)
Effective May 1, 2013, the Fund combined its investment management and administration agreements as approved by the Board. The fees paid under the combined agreement do not exceed the aggregate fees that were paid under the separate agreements.
Prior to May 1, 2013, the Fund paid fees to Advisers based on the average daily net assets of the Fund as follows:
| | |
| Annualized Fee Rate | | Net Assets |
| 0.550% | | Up to and including $500 million |
| 0.450% | | Over $500 million, up to and including $1 billion |
| 0.400% | | Over $1 billion, up to and including $1.5 billion |
| 0.350% | | Over $1.5 billion, up to and including $6.5 billion |
| 0.325% | | Over $6.5 billion, up to and including $11.5 billion |
| 0.300% | | Over $11.5 billion, up to and including $16.5 billion |
| 0.290% | | Over $16.5 billion, up to and including $19 billion |
| 0.280% | | Over $19 billion, up to and including $21.5 billion |
| 0.270% | | In excess of $21.5 billion |
b. Administrative Fees
Effective May 1, 2013, under an agreement with Advisers, FT Services provides administrative services to the Fund. The fee is paid by Advisers based on the average daily net assets, and is not an additional expense of the Fund.
Prior to May 1, 2013, the Fund paid administrative fees to FT Services of 0.25% per year of the average daily net assets of the Fund.
c. Distribution Fees
The Board has adopted distribution plans for Class 2 and Class 4 shares pursuant to Rule 12b-1 under the 1940 Act. Under the Fund’s compensation distribution plans, the Fund pays Distributors for costs incurred in connection with the servicing, sale and distribution of the Fund’s shares up to 0.35% per year of its average daily net assets of each class. Some distribution fees are not charged on shares held by affiliates. The Board has agreed to limit the current rate to 0.25% per year for Class 2. The plan year, for purposes of monitoring compliance with the maximum annual plan rates, is February 1 through January 31.
d. Transfer Agent Fees
Investor Services, under terms of an agreement, performs shareholder servicing for the Fund and is not paid by the Fund for the services.
4. EXPENSE OFFSET ARRANGEMENT
The Fund has entered into an arrangement with its custodian whereby credits realized as a result of uninvested cash balances are used to reduce a portion of the Fund’s custodian expenses. During the year ended December 31, 2013, the custodian fees were reduced as noted in the Statement of Operations.
5. INCOME TAXES
The tax character of distributions paid during the years ended December 31, 2013 and 2012, was as follows:
| | | | | | | | |
| | | 2013 | | | 2012 | |
Distributions paid from long term capital gain: | | $ | 45,446,113 | | | $ | 58,545,949 | |
| | | | |
FSC-22
Franklin Templeton Variable Insurance Products Trust
Notes to Financial Statements (continued)
Franklin Small-Mid Cap Growth Securities Fund
5. INCOME TAXES (continued)
At December 31, 2013, the cost of investments, net unrealized appreciation (depreciation), undistributed ordinary income and undistributed long term capital gains for income tax purposes were as follows:
| | | | |
Cost of investments | | $ | 463,856,844 | |
| | | | |
| |
Unrealized appreciation | | $ | 325,491,570 | |
Unrealized depreciation | | $ | (4,444,143 | ) |
| | | | |
Net unrealized appreciation (depreciation) | | $ | 321,047,427 | |
| | | | |
Undistributed ordinary income | | $ | 16,710,176 | |
Undistributed long term capital gains | | | 125,393,135 | |
| | | | |
Distributable earnings | | $ | 142,103,311 | |
| | | | |
Differences between income and/or capital gains as determined on a book basis and a tax basis are primarily due to differing treatments of wash sales.
6. INVESTMENT TRANSACTIONS
Purchases and sales of investments (excluding short term securities) for the year ended December 31, 2013, aggregated $317,073,888 and $548,237,796, respectively.
7. INVESTMENTS IN INSTITUTIONAL FIDUCIARY TRUST MONEY MARKET PORTFOLIO
The Fund invests in the Institutional Fiduciary Trust Money Market Portfolio (Sweep Money Fund), an open-end investment company managed by Advisers. Management fees paid by the Fund are reduced on assets invested in the Sweep Money Fund, in an amount not to exceed the management and administrative fees paid by the Sweep Money Fund.
8. CREDIT FACILITY
The Fund, together with other U.S. registered and foreign investment funds (collectively, Borrowers), managed by Franklin Templeton Investments, are borrowers in a joint syndicated senior unsecured credit facility totaling $1.5 billion (Global Credit Facility) which, after an extension of the original terms, matured on February 14, 2014. This Global Credit Facility provides a source of funds to the Borrowers for temporary and emergency purposes, including the ability to meet future unanticipated or unusually large redemption requests. Effective February 14, 2014, the Borrowers renewed the Global Credit Facility which matures on February 13, 2015.
Under the terms of the Global Credit Facility, the Fund shall, in addition to interest charged on any borrowings made by the Fund and other costs incurred by the Fund, pay its share of fees and expenses incurred in connection with the implementation and maintenance of the Global Credit Facility, based upon its relative share of the aggregate net assets of all of the Borrowers, including an annual commitment fee of 0.07% based upon the unused portion of the Global Credit Facility. These fees are reflected in other expenses on the Statement of Operations. During the year ended December 31, 2013, the Fund did not use the Global Credit Facility.
FSC-23
Franklin Templeton Variable Insurance Products Trust
Notes to Financial Statements (continued)
Franklin Small-Mid Cap Growth Securities Fund
9. FAIR VALUE MEASUREMENTS
The Fund follows a fair value hierarchy that distinguishes between market data obtained from independent sources (observable inputs) and the Fund’s own market assumptions (unobservable inputs). These inputs are used in determining the value of the Fund’s financial instruments and are summarized in the following fair value hierarchy:
| | • | | Level 1 – quoted prices in active markets for identical financial instruments |
| | • | | Level 2 – other significant observable inputs (including quoted prices for similar financial instruments, interest rates, prepayment speed, credit risk, etc.) |
| | • | | Level 3 – significant unobservable inputs (including the Fund’s own assumptions in determining the fair value of financial instruments) |
The input levels are not necessarily an indication of the risk or liquidity associated with financial instruments at that level.
For movements between the levels within the fair value hierarchy, the Fund has adopted a policy of recognizing the transfers as of the date of the underlying event which caused the movement.
A summary of inputs used as of December 31, 2013, in valuing the Fund’s assets carried at fair value, is as follows:
| | | | | | | | | | | | | | | | |
| | | Level 1 | | | Level 2 | | | Level 3 | | | Total | |
| | | | |
Assets: | | | | | | | | | | | | | | | | |
Investments in Securities: | | | | | | | | | | | | | | | | |
Equity Investmentsa | | $ | 768,974,451 | | | $ | — | | | $ | — | | | $ | 768,974,451 | |
Short Term Investments | | | 9,817,245 | | | | 6,112,575 | | | | — | | | | 15,929,820 | |
| | | | |
Total Investments in Securities | | $ | 778,791,696 | | | $ | 6,112,575 | | | $ | — | | | $ | 784,904,271 | |
| | | | |
aFor detailed categories, see the accompanying Statement of Investments.
10. NEW ACCOUNTING PRONOUNCEMENTS
In June 2013, the Financial Accounting Standards Board issued Accounting Standards Update (ASU) No. 2013-08, Investment Companies (Topic 946): Amendments to the Scope, Measurement, and Disclosure Requirements. The ASU modifies the criteria used in defining an investment company under U.S. Generally Accepted Accounting Principles and also sets forth certain measurement and disclosure requirements. Under the ASU, an entity that is registered under the 1940 Act automatically qualifies as an investment company. The ASU is effective for interim and annual reporting periods beginning after December 15, 2013. Management has reviewed the requirements and believes the adoption of this ASU will not have a material impact on the financial statements.
11. SUBSEQUENT EVENTS
The Fund has evaluated subsequent events through the issuance of the financial statements and determined that no events have occurred that require disclosure other than those already disclosed in the financial statements.
FSC-24
Franklin Templeton Variable Insurance Products Trust
Franklin Small-Mid Cap Growth Securities Fund
Report of Independent Registered Public Accounting Firm
To the Board of Trustees and Shareholders of
Franklin Templeton Variable Insurance Products Trust
In our opinion, the accompanying statement of assets and liabilities, including the statement of investments, and the related statements of operations and of changes in net assets and the financial highlights present fairly, in all material respects, the financial position of The Franklin Small-Mid Cap Growth Securities Fund (the “Fund”) at December 31, 2013, the results of its operations for the year then ended, the changes in its net assets for each of the two years in the period then ended and the financial highlights for each of the five years in the period then ended, in conformity with accounting principles generally accepted in the United States of America. These financial statements and financial highlights (hereafter referred to as “financial statements”) are the responsibility of the Fund’s management. Our responsibility is to express an opinion on these financial statements based on our audits. We conducted our audits of these financial statements in accordance with the standards of the Public Company Accounting Oversight Board (United States). Those standards require that we plan and perform the audit to obtain reasonable assurance about whether the financial statements are free of material misstatement. An audit includes examining, on a test basis, evidence supporting the amounts and disclosures in the financial statements, assessing the accounting principles used and significant estimates made by management, and evaluating the overall financial statement presentation. We believe that our audits, which included confirmation of securities at December 31, 2013 by correspondence with the custodian, transfer agent and brokers, provide a reasonable basis for our opinion.
PricewaterhouseCoopers LLP
San Francisco, California
February 14, 2014
FSC-25
Franklin Templeton Variable Insurance Products Trust
Tax Information (unaudited)
Franklin Small-Mid Cap Growth Securities Fund
Under Section 852(b)(3)(C) of the Internal Revenue Code, the Fund hereby reports the maximum amount allowable but no less than $45,446,113 as a long term capital gain dividend for the fiscal year ended December 31, 2013.
FSC-26
FRANKLIN STRATEGIC INCOME SECURITIES FUND
We are pleased to bring you Franklin Strategic Income Securities Fund’s annual report for the fiscal year ended December 31, 2013.
Performance Summary as of 12/31/13
Average annual total return of Class 4 shares* represents the average annual change in value, assuming reinvestment of dividends and capital gains. Average returns smooth out variations in returns, which can be significant; they are not the same as year-by-year results.
Periods ended 12/31/13
| | | | | | | | | | | | |
| | | 1-Year | | | 5-Year | | | 10-Year | |
Average Annual Total Return | | | +3.17% | | | | +10.63% | | | | +6.61% | |
*For the period beginning 2/29/08, Class 4 performance reflects a 12b-1 fee expense of 0.35% per year, which affects future performance. Class 4 performance prior to 2/29/08 reflects historical Class 1 performance, which does not have a 12b-1 fee expense. Since 2/29/08 (effective date), the average annual total return of Class 4 shares was +6.74%. The Fund has a fee waiver associated with its investments in a Franklin Templeton money fund, contractually guaranteed through at least its current fiscal year end. Fund investment results reflect the fee waiver, to the extent applicable; without this reduction, the results would have been lower.
Total Return Index Comparison
for a Hypothetical $10,000 Investment (1/1/04–12/31/13)
The graph below shows the change in value of a hypothetical $10,000 investment in the Fund over the indicated period and includes reinvestment of any income or distributions. The Fund’s performance* is compared to the performance of the Barclays U.S. Aggregate Index and the Lipper Multi-Sector Income Funds Classification Average. One cannot invest directly in an index, and an index is not representative of the Fund’s portfolio. Please see Important Notes to Performance Information preceding the Fund Summaries.
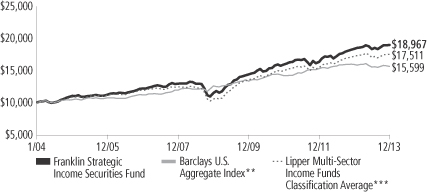
**Source: © 2014 Morningstar. Please see Index Descriptions following the Fund Summaries.
***Source: Lipper Inc. Please see Index Descriptions following the Fund Summaries.
Franklin Strategic Income Securities Fund – Class 4
Performance reflects the Fund’s Class 4 operating expenses, but does not include any contract fees, expenses or sales charges. If they had been included, performance would be lower. These charges and deductions, particularly for variable life policies, can have a significant effect on contract values and insurance benefits. See the contract prospectus for a complete description of these expenses, including sales charges.
Performance data represent past performance, which does not guarantee future results. Investment return and principal value will fluctuate, and you may have a gain or loss when you sell your shares.
Current performance may differ from figures shown.
FSI-1
Fund Goals and Main Investments: Franklin Strategic Income Securities Fund seeks a high level of current income, with capital appreciation over the long term as a secondary goal. Under normal market conditions, the Fund invests primarily to predominantly in U.S. and foreign debt securities, including those in emerging markets.
Performance Overview
You can find the Fund’s one-year total return in the Performance Summary. For comparison, the Fund’s benchmark, the Barclays U.S. Aggregate Index, had a -2.02% total return for the period under review.1 The Fund’s peers, as measured by the Lipper Multi-Sector Income Funds Classification Average, posted a +1.70% return.2
Economic and Market Overview
The U.S. economy showed ongoing signs of recovery during the 12-month period ended December 31, 2013, especially in the second half, driven by consumer spending and rising inventories. In addition, business investment, net exports, and state and local government spending picked up in the second quarter, somewhat offsetting the impact of federal budget cuts. Historically low mortgage rates and improving sentiment aided the housing market recovery, evidenced by solid new and existing home sales, rising home prices, low inventories and multi-year lows in new foreclosures. Manufacturing expanded for most of the period under review, and the unemployment rate declined to 6.7% in December from 7.8% a year earlier.3 Inflation remained well below the Federal Reserve Board’s (Fed’s) 2.0% target.
At the start of 2013, the Fed expanded its asset purchase program to $85 billion per month from $40 billion of mortgage-backed securities. Fed Chairman Ben Bernanke indicated in May that the Fed might reduce monthly asset purchases, triggering a bond market sell-off that raised long-term U.S. Treasury yields to a two-year high. In September and October, long-term yields retreated after the Fed reassured investors it would maintain its current pace of purchases as it awaited more evidence of a sustainable economic expansion. In December, the Fed announced it would reduce its bond purchases $10 billion a month beginning in January 2014 while keeping interest rates low. After the announcement, yields on U.S. Treasuries remained largely stable.
1. Source: © 2014 Morningstar.
2. Source: Lipper Inc.
One cannot invest directly in an index, and an index is not representative of the Fund’s portfolio.
Please see Index Descriptions following the Fund Summaries.
3. Source: Bureau of Labor Statistics.
Fund Risks: All investments involve risks, including possible loss of principal. Bond prices generally move in the opposite direction of interest rates. Thus, as prices of bonds in the Fund adjust to a rise in interest rates, the Fund’s share price may decline. High yields reflect the higher credit risks associated with certain lower rated securities held in the portfolio. Floating rate loans and high yield corporate bonds are rated below investment grade and are subject to greater risk of default, which could result in loss of principal — a risk that may be heightened in a slowing economy. The risks of foreign securities include currency fluctuations and political uncertainty. Investments in developing markets involve heightened risks related to the same factors, in addition to those associated with their relatively small size and lesser liquidity. Investing in derivative securities and the use of foreign currency techniques involve special risks as such may not achieve the anticipated benefits and/or may result in losses to the Fund. Changes in the financial strength of a bond issuer or in a bond’s credit rating may affect its value. The Fund is actively managed but there is no guarantee that the manager’s investment decisions will produce the desired results. The Fund’s prospectus also includes a description of the main investment risks.
FSI-2
Although the Fed’s asset purchase program continued to put downward pressure on long-term interest rates, investor concerns about the eventual reduction of asset purchases pushed the 10-year U.S. Treasury note yield to 3.04% at period-end from 1.78% on December 31, 2012.
Outside of the U.S., economic recovery was mixed during the year under review. The recovery in emerging markets moderated after many economies had previously returned to and exceeded pre-crisis activity levels. Although some developed economies, such as those of Australia and some Scandinavian countries, have enjoyed relatively strong recoveries in the aftermath of the global financial crisis, growth in the eurozone and Japan continued to be slow by the standards of previous recoveries. Improving sentiment, relatively strong fundamentals continued provision of global liquidity supported assets perceived risky and equity markets performed well.
Investment Strategy
We allocate our investments among the various types of debt available based on our assessment of changing economic, global market, industry and issuer conditions. We use a top-down analysis of macroeconomic trends, combined with a bottom-up fundamental analysis of market sectors, industries and issuers, seeking to take advantage of varying sector reactions to economic events. For example, we may evaluate business cycles, yield curves, country risk, and the relative interest rates among currencies, and values between and within markets. In selecting debt securities, we generally conduct our own analysis of the security’s intrinsic value rather than simply relying on the coupon rate or rating. We may also enter into various transactions involving certain currency-, interest rate- or credit-related derivative instruments for hedging purposes, to enhance returns or to obtain exposure to various market sectors.
Manager’s Discussion
Global economic and political headlines affected fixed income markets in 2013. In the U.S., the Fed chairman’s comments regarding the potential tapering of the Fed’s quantitative easing program led to financial market volatility. Consequently, U.S. longer term interest rates rose and the 10-year Treasury note yield climbed. Investors turned their attention toward the U.S. budget and debt ceiling during the second half of the year. Although decisions on these issues were essentially delayed until early 2014, uncertainty contributed to market volatility. The stock market largely shrugged off these concerns amid earnings growth and
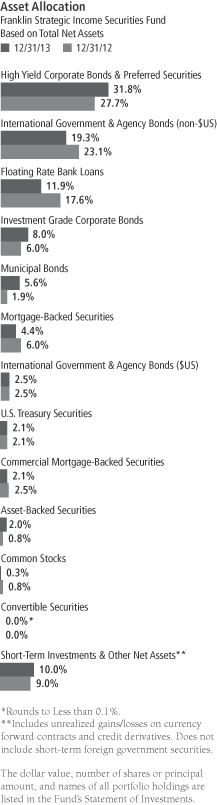
FSI-3
stocks’ lesser rate sensitivity, and U.S. stocks, as measured by the Standard & Poor’s® 500 Index, gained 32.39% during the period.4
The Fund’s overweighted exposure to noninvestment-grade corporate credit sectors positively impacted performance compared to the longer duration and more interest rate-sensitive Barclays U.S. Aggregate Index. Compared to the Lipper peer average, the Fund’s overweighted floating rate loan market allocation bolstered relative Fund returns.
Healthy balance sheet liquidity, issuers’ easy access to public debt markets for capital, rising equity markets and generally increasing corporate earnings supported corporate credit sectors. In this environment, high yield and leveraged corporate loan sector default rates remained below their long-term averages. However, continued shareholder-friendly activity, including dividend increases, share repurchases, and merger and acquisition activity as the global economic recovery sustained its momentum, could lead to higher default rates over time. Overall, spread sector valuations relative to fundamental credit trends still appeared attractive to us, and the Fund maintained significant weightings in the high yield, investment-grade and leveraged loan credit sectors. Given leveraged loans’ outperformance during mid-2013 as U.S. interest rates rose, the Fund reduced its loan exposure and added exposure to high yield corporate bonds.
Concerns regarding a potential slowdown in China’s economic growth and investment demand resulted in mixed performance for non-U.S. bonds held in underlying currencies. The rise in U.S. interest rates strengthened the U.S. dollar, weighing on certain Fund non-dollar holdings. Investor redemptions from certain dedicated emerging market debt funds also pressured hard currency- and local currency-denominated emerging market bonds. In particular, certain Asian currency positions, such as the Indian rupee and Indonesian rupiah, fell in value against the U.S. dollar, as did Latin American positions based in the Brazilian real and Chilean peso. In contrast, weakness in the Japanese yen, which was exacerbated by the country’s major quantitative easing program, positively contributed to Fund performance. (The Fund held a short position in the yen, achieved through currency forward contracts.) Although we found opportunities in select foreign currencies and yield curves, the Fund reduced its foreign non-dollar global bond exposure during the period. For U.S. dollar-denominated emerging market sovereign bonds, the rise in U.S. interest rates weighed on bond prices. However, the Fund maintained a fairly modest sector position.
4. Please see Index descriptions following the Fund summaries.
What is a credit derivative?
A credit derivative is a contract agreement between the Fund and a counterparty that is principally used by the Fund to gain or increase exposure to certain high yield securities or segments of the high yield bond market and/or to hedge against credit risk.
What is a currency forward contract?
A currency forward contract is an agreement between the Fund and a counterparty to buy or sell a foreign currency for a specific exchange rate on a future date.
FSI-4
With the rise in intermediate and longer term interest rates, the more rate-sensitive U.S. fixed income sectors such as Treasuries, agencies and mortgage-backed securities had negative total returns during the period. Considering historically low U.S. interest rates, the Fund held an underweighted exposure to these sectors as we preferred higher income opportunities in the corporate and global bond markets. In the municipal bond market, the U.S. interest rate rise and negative headlines regarding Detroit and Puerto Rico contributed to investor outflows from dedicated municipal bond funds, pressuring bond prices. As valuations cheapened relative to other investment-grade bond sectors, the Fund added to its municipal bond exposure.
Thank you for your participation in Franklin Strategic Income Securities Fund. We look forward to serving your future investment needs.
The foregoing information reflects our analysis, opinions and portfolio holdings as of December 31, 2013, the end of the reporting period. The way we implement our main investment strategies and the resulting portfolio holdings may change depending on factors such as market and economic conditions. These opinions may not be relied upon as investment advice or an offer for a particular security. The information is not a complete analysis of every aspect of any market, country, industry, security or the Fund. Statements of fact are from sources considered reliable, but the investment manager makes no representation or warranty as to their completeness or accuracy. Although historical performance is no guarantee of future results, these insights may help you understand our investment management philosophy.
FSI-5
Fund Expenses
As an investor in a variable insurance contract (Contract) that indirectly provides for investment in an underlying mutual fund, you can incur transaction and/or ongoing expenses at both the Fund level and the Contract level.
| • | | Transaction expenses can include sales charges (loads) on purchases, redemption fees, surrender fees, transfer fees and premium taxes. |
| • | | Ongoing expenses can include management fees, distribution and service (12b-1) fees, contract fees, annual maintenance fees, mortality and expense risk fees and other fees and expenses. All mutual funds and Contracts have some types of ongoing expenses. |
The expenses shown in the table are meant to highlight ongoing expenses at the Fund level only and do not include ongoing expenses at the Contract level, or transaction expenses at either the Fund or Contract level. While the Fund does not have transaction expenses, if the transaction and ongoing expenses at the Contract level were included, the expenses shown below would be higher. You should consult your Contract prospectus or disclosure document for more information.
The table shows Fund-level ongoing expenses and can help you understand these expenses and compare them with those of other mutual funds offered through the Contract. The table assumes a $1,000 investment held for the six months indicated. Please refer to the Fund prospectus for additional information on operating expenses.
Actual Fund Expenses
The first line (Actual) of the table provides actual account values and expenses. The “Ending Account Value” is derived from the Fund’s actual return, which includes the effect of ongoing Fund expenses, but does not include the effect of ongoing Contract expenses.
You can estimate the Fund-level expenses you incurred during the period by following these steps. Of course, your account value and expenses will differ from those in this illustration:
| 1. | Divide your account value by $1,000. |
If an account had an $8,600 value, then $8,600 ÷ $1,000 = 8.6.
| 2. | Multiply the result by the number under the heading “Fund-Level Expenses Incurred During Period.” |
If Fund-Level Expenses Incurred During Period were $7.50, then 8.6 x $7.50 = $64.50.
In this illustration, the estimated expenses incurred this period at the Fund level are $64.50.
Franklin Strategic Income Securities Fund – Class 4
FSI-6
Hypothetical Example for Comparison with Other Mutual Funds
Information in the second line (Hypothetical) of the table can help you compare ongoing expenses of the Fund with those of other mutual funds offered through the Contract. This information may not be used to estimate the actual ending account balance or expenses you incurred during the period. The hypothetical “Ending Account Value” is based on the Fund’s actual expense ratio and an assumed 5% annual rate of return before expenses, which does not represent the Fund’s actual return. The figure under the heading “Fund-Level Expenses Incurred During Period” shows the hypothetical expenses your account would have incurred under this scenario. You can compare this figure with the 5% hypothetical examples that appear in shareholder reports of other funds offered through a Contract.
| | | | | | | | | | | | |
| Class 4 | | Beginning
Account
Value 7/1/13 | | | Ending
Account
Value 12/31/13 | | | Fund-Level
Expenses Incurred
During Period*
7/1/13–12/31/13 | |
Actual | | $ | 1,000 | | | $ | 1,034.70 | | | $ | 4.92 | |
Hypothetical (5% return
before expenses) | | $ | 1,000 | | | $ | 1,020.37 | | | $ | 4.89 | |
*Expenses are calculated using the most recent six-month annualized expense ratio for the Fund’s Class 4 shares (0.96%), which does not include any ongoing expenses of the Contract for which the Fund is an investment option, multiplied by the average account value over the period, multiplied by 184/365 to reflect the one-half year period.
FSI-7
Franklin Templeton Variable Insurance Products Trust
Financial Highlights
Franklin Strategic Income Securities Fund
| | | | | | | | | | | | | | | | | | | | |
| | | Year Ended December 31, | |
| Class 1 | | 2013 | | | 2012 | | | 2011 | | | 2010 | | | 2009 | |
| | | | |
Per share operating performance | | | | | | | | | | | | | | | | | | | | |
(for a share outstanding throughout the year) | | | | | | | | | | | | | | | | | | | | |
Net asset value, beginning of year | | $ | 13.17 | | | $ | 12.55 | | | $ | 12.99 | | | $ | 12.28 | | | $ | 10.58 | |
| | | | |
Income from investment operationsa: | | | | | | | | | | | | | | | | | | | | |
Net investment incomeb | | | 0.59 | | | | 0.65 | | | | 0.69 | | | | 0.72 | | | | 0.70 | |
Net realized and unrealized gains (losses) | | | (0.15 | ) | | | 0.92 | | | | (0.32 | ) | | | 0.61 | | | | 1.95 | |
| | | | |
Total from investment operations | | | 0.44 | | | | 1.57 | | | | 0.37 | | | | 1.33 | | | | 2.65 | |
| | | | |
Less distributions from: | | | | | | | | | | | | | | | | | | | | |
Net investment income and net of foreign currency gains | | | (0.80 | ) | | | (0.93 | ) | | | (0.81 | ) | | | (0.62 | ) | | | (0.95 | ) |
Net realized gains | | | (0.17 | ) | | | (0.02 | ) | | | — | | | | — | | | | — | |
| | | | |
Total distributions | | | (0.97 | ) | | | (0.95 | ) | | | (0.81 | ) | | | (0.62 | ) | | | (0.95 | ) |
| | | | |
Net asset value, end of year | | $ | 12.64 | | | $ | 13.17 | | | $ | 12.55 | | | $ | 12.99 | | | $ | 12.28 | |
| | | | |
| | | | | |
Total returnc | | | 3.52% | | | | 13.12% | | | | 2.78% | | | | 11.21% | | | | 26.11% | |
Ratios to average net assets | | | | | | | | | | | | | | | | | | | | |
Expenses | | | 0.60% | d | | | 0.58% | | | | 0.60% | d | | | 0.59% | d | | | 0.58% | d |
Net investment income | | | 4.58% | | | | 5.04% | | | | 5.36% | | | | 5.71% | | | | 6.13% | |
| | | | | |
Supplemental data | | | | | | | | | | | | | | | | | | | | |
Net assets, end of year (000’s) | | $ | 705,493 | | | $ | 1,019,537 | | | $ | 1,043,690 | | | $ | 1,195,149 | | | $ | 1,173,313 | |
Portfolio turnover rate | | | 48.06% | | | | 49.98% | | | | 55.65% | | | | 56.46% | | | | 56.19% | |
Portfolio turnover rate excluding mortgage dollar rollse | | | 47.01% | | | | 48.75% | | | | 55.65% | | | | 56.46% | | | | 56.19% | |
aThe amount shown for a share outstanding throughout the period may not correlate with the Statement of Operations for the period due to the timing of sales and repurchases of the Fund shares in relation to income earned and/or fluctuating market value of the investments of the Fund.
bBased on average daily shares outstanding.
cTotal return does not include fees, charges or expenses imposed by the variable annuity and life insurance contracts for which the Franklin Templeton Variable Insurance Products Trust serves as an underlying investment vehicle.
dBenefit of expense reduction rounds to less than 0.01%.
eSee Note 1(h) regarding mortgage dollar rolls.
The accompanying notes are an integral part of these financial statements.
FSI-8
Franklin Templeton Variable Insurance Products Trust
Financial Highlights (continued)
Franklin Strategic Income Securities Fund
| | | | | | | | | | | | | | | | | | | | |
| | | Year Ended December 31, | |
| Class 2 | | 2013 | | | 2012 | | | 2011 | | | 2010 | | | 2009 | |
| | | | |
Per share operating performance | | | | | | | | | | | | | | | | | | | | |
(for a share outstanding throughout the year) | | | | | | | | | | | | | | | | | | | | |
Net asset value, beginning of year | | $ | 12.84 | | | $ | 12.27 | | | $ | 12.72 | | | $ | 12.05 | | | $ | 10.41 | |
| | | | |
Income from investment operationsa: | | | | | | | | | | | | | | | | | | | | |
Net investment incomeb | | | 0.54 | | | | 0.60 | | | | 0.64 | | | | 0.68 | | | | 0.66 | |
Net realized and unrealized gains (losses) | | | (0.13 | ) | | | 0.89 | | | | (0.30 | ) | | | 0.59 | | | | 1.91 | |
| | | | |
Total from investment operations | | | 0.41 | | | | 1.49 | | | | 0.34 | | | | 1.27 | | | | 2.57 | |
| | | | |
Less distributions from: | | | | | | | | | | | | | | | | | | | | |
Net investment income and net of foreign currency gains | | | (0.78 | ) | | | (0.90 | ) | | | (0.79 | ) | | | (0.60 | ) | | | (0.93 | ) |
Net realized gains | | | (0.17 | ) | | | (0.02 | ) | | | — | | | | — | | | | — | |
| | | | |
Total distributions | | | (0.95 | ) | | | (0.92 | ) | | | (0.79 | ) | | | (0.60 | ) | | | (0.93 | ) |
| | | | |
Net asset value, end of year | | $ | 12.30 | | | $ | 12.84 | | | $ | 12.27 | | | $ | 12.72 | | | $ | 12.05 | |
| | | | |
| | | | | |
Total returnc | | | 3.32% | | | | 12.75% | | | | 2.57% | | | | 10.91% | | | | 25.75% | |
Ratios to average net assets | | | | | | | | | | | | | | | | | | | | |
Expenses | | | 0.85% | d | | | 0.83% | | | | 0.85% | d | | | 0.84% | d | | | 0.83% | d |
Net investment income | | | 4.33% | | | | 4.79% | | | | 5.11% | | | | 5.46% | | | | 5.88% | |
| | | | | |
Supplemental data | | | | | | | | | | | | | | | | | | | | |
Net assets, end of year (000’s) | | $ | 175,307 | | | $ | 158,451 | | | $ | 123,749 | | | $ | 101,347 | | | $ | 68,240 | |
Portfolio turnover rate | | | 48.06% | | | | 49.98% | | | | 55.65% | | | | 56.46% | | | | 56.19% | |
Portfolio turnover rate excluding mortgage dollar rollse | | | 47.01% | | | | 48.75% | | | | 55.65% | | | | 56.46% | | | | 56.19% | |
aThe amount shown for a share outstanding throughout the period may not correlate with the Statement of Operations for the period due to the timing of sales and repurchases of the Fund shares in relation to income earned and/or fluctuating market value of the investments of the Fund.
bBased on average daily shares outstanding.
cTotal return does not include fees, charges or expenses imposed by the variable annuity and life insurance contracts for which the Franklin Templeton Variable Insurance Products Trust serves as an underlying investment vehicle.
dBenefit of expense reduction rounds to less than 0.01%.
eSee Note 1(h) regarding mortgage dollar rolls.
The accompanying notes are an integral part of these financial statements.
FSI-9
Franklin Templeton Variable Insurance Products Trust
Financial Highlights (continued)
Franklin Strategic Income Securities Fund
| | | | | | | | | | | | | | | | | | | | |
| | | Year Ended December 31, | |
| Class 4 | | 2013 | | | 2012 | | | 2011 | | | 2010 | | | 2009 | |
| | | | |
Per share operating performance | | | | | | | | | | | | | | | | | | | | |
(for a share outstanding throughout the year) | | | | | | | | | | | | | | | | | | | | |
Net asset value, beginning of year | | $ | 13.04 | | | $ | 12.44 | | | $ | 12.88 | | | $ | 12.20 | | | $ | 10.54 | |
| | | | |
Income from investment operationsa: | | | | | | | | | | | | | | | | | | | | |
Net investment incomeb | | | 0.54 | | | | 0.60 | | | | 0.64 | | | | 0.67 | | | | 0.66 | |
Net realized and unrealized gains (losses) | | | (0.14 | ) | | | 0.91 | | | | (0.31 | ) | | | 0.60 | | | | 1.94 | |
| | | | |
Total from investment operations | | | 0.40 | | | | 1.51 | | | | 0.33 | | | | 1.27 | | | | 2.60 | |
| | | | |
Less distributions from: | | | | | | | | | | | | | | | | | | | | |
Net investment income and net of foreign currency gains | | | (0.76 | ) | | | (0.89 | ) | | | (0.77 | ) | | | (0.59 | ) | | | (0.94 | ) |
Net realized gains | | | (0.17 | ) | | | (0.02 | ) | | | — | | | | — | | | | — | |
| | | | |
Total distributions | | | (0.93 | ) | | | (0.91 | ) | | | (0.77 | ) | | | (0.59 | ) | | | (0.94 | ) |
| | | | |
Net asset value, end of year | | $ | 12.51 | | | $ | 13.04 | | | $ | 12.44 | | | $ | 12.88 | | | $ | 12.20 | |
| | | | |
| | | | | |
Total returnc | | | 3.17% | | | | 12.67% | | | | 2.46% | | | | 10.88% | | | | 25.52% | |
Ratios to average net assets | | | | | | | | | | | | | | | | | | | | |
Expenses | | | 0.95% | d | | | 0.93% | | | | 0.95% | d | | | 0.94% | d | | | 0.93% | d |
Net investment income | | | 4.23% | | | | 4.69% | | | | 5.01% | | | | 5.36% | | | | 5.78% | |
| | | | | |
Supplemental data | | | | | | | | | | | | | | | | | | | | |
Net assets, end of year (000’s) | | $ | 134,970 | | | $ | 196,479 | | | $ | 188,786 | | | $ | 188,178 | | | $ | 162,074 | |
Portfolio turnover rate | | | 48.06% | | | | 49.98% | | | | 55.65% | | | | 56.46% | | | | 56.19% | |
Portfolio turnover rate excluding mortgage dollar rollse | | | 47.01% | | | | 48.75% | | | | 55.65% | | | | 56.46% | | | | 56.19% | |
aThe amount shown for a share outstanding throughout the period may not correlate with the Statement of Operations for the period due to the timing of sales and repurchases of the Fund shares in relation to income earned and/or fluctuating market value of the investments of the Fund.
bBased on average daily shares outstanding.
cTotal return does not include fees, charges or expenses imposed by the variable annuity and life insurance contracts for which the Franklin Templeton Variable Insurance Products Trust serves as an underlying investment vehicle.
dBenefit of expense reduction rounds to less than 0.01%.
eSee Note 1(h) regarding mortgage dollar rolls.
The accompanying notes are an integral part of these financial statements.
FSI-10
Franklin Templeton Variable Insurance Products Trust
Statement of Investments, December 31, 2013
| | | | | | | | | | |
| Franklin Strategic Income Securities Fund | | Country | | Shares | | | Value | |
Common Stocks and Other Equity Interests 0.3% | | | | | | | | | | |
Consumer Services 0.2% | | | | | | | | | | |
a,b,c Turtle Bay Resort | | United States | | | 1,901,449 | | | $ | 1,749,333 | |
| | | | | | | | | | |
Energy 0.0%† | | | | | | | | | | |
a Bennu Oil & Gas LLC, A | | United States | | | 1,439 | | | | 92,096 | |
a Bennu Oil & Gas LLC, B | | United States | | | 225 | | | | — | |
| | | | | | | | | | |
| | | | | | | | | 92,096 | |
| | | | | | | | | | |
Materials 0.1% | | | | | | | | | | |
a,c NewPage Holdings Inc. | | United States | | | 10,000 | | | | 900,000 | |
| | | | | | | | | | |
Transportation 0.0%† | | | | | | | | | | |
a CEVA Holdings LLC | | United Kingdom | | | 224 | | | | 213,066 | |
| | | | | | | | | | |
Total Common Stocks and Other Equity Interests
(Cost $4,785,349) | | | | | | | | | 2,954,495 | |
| | | | | | | | | | |
Convertible Preferred Stocks 0.0%† | | | | | | | | | | |
Transportation 0.0%† | | | | | | | | | | |
a CEVA Holdings LLC, cvt. pfd., A-1 | | United Kingdom | | | 6 | | | | 7,800 | |
a CEVA Holdings LLC, cvt. pfd., A-2 | | United Kingdom | | | 486 | | | | 461,234 | |
| | | | | | | | | | |
Total Convertible Preferred Stocks (Cost $731,856) | | | | | | | | | 469,034 | |
| | | | | | | | | | |
Preferred Stocks (Cost $625,000) 0.1% | | | | | | | | | | |
Diversified Financials 0.1% | | | | | | | | | | |
GMAC Capital Trust I, 8.125%, pfd. | | United States | | | 25,000 | | | | 668,500 | |
| | | | | | | | | | |
| | | |
| | | | | Principal
Amount* | | | | |
Corporate Bonds 39.7% | | | | | | | | | | |
Automobiles & Components 0.9% | | | | | | | | | | |
d Avis Budget Finance PLC, senior note, 144A, 6.00%, 3/01/21 | | United States | | | 1,400,000 | EUR | | | 2,056,888 | |
Ford Motor Credit Co. LLC, senior note, | | | | | | | | | | |
5.00%, 5/15/18 | | United States | | | 1,000,000 | | | | 1,114,501 | |
8.125%, 1/15/20 | | United States | | | 1,200,000 | | | | 1,500,871 | |
d General Motors Co., senior bond, 144A, 4.875%, 10/02/23 | | United States | | | 2,400,000 | | | | 2,442,000 | |
The Goodyear Tire & Rubber Co., senior note, 6.50%, 3/01/21 | | United States | | | 2,200,000 | | | | 2,343,000 | |
| | | | | | | | | | |
| | | | | | | | | 9,457,260 | |
| | | | | | | | | | |
Banks 1.6% | | | | | | | | | | |
d Banco do Brasil SA, sub. note, 144A, 5.875%, 1/26/22 | | Brazil | | | 3,500,000 | | | | 3,377,500 | |
CIT Group Inc., senior note, | | | | | | | | | | |
5.375%, 5/15/20 | | United States | | | 1,600,000 | | | | 1,708,000 | |
5.00%, 8/15/22 | | United States | | | 2,500,000 | | | | 2,447,907 | |
HSBC USA Inc., sub. note, 5.00%, 9/27/20 | | United States | | | 2,500,000 | | | | 2,673,350 | |
Regions Bank, sub. note, 7.50%, 5/15/18 | | United States | | | 1,000,000 | | | | 1,185,786 | |
Royal Bank of Scotland Group PLC, sub. note, 6.125%, 12/15/22 | | United Kingdom | | | 1,000,000 | | | | 1,025,625 | |
The Royal Bank of Scotland PLC, sub. note, 6.934%, 4/09/18 | | United Kingdom | | | 2,300,000 | EUR | | | 3,598,652 | |
| | | | | | | | | | |
| | | | | | | | | 16,016,820 | |
| | | | | | | | | | |
Capital Goods 1.2% | | | | | | | | | | |
d Abengoa Finance SAU, senior note, 144A, | | | | | | | | | | |
8.875%, 11/01/17 | | Spain | | | 2,500,000 | | | | 2,700,000 | |
7.75%, 2/01/20 | | Spain | | | 200,000 | | | | 208,250 | |
d KM Germany Holdings GmbH, secured note, 144A, 8.75%, 12/15/20 | | Germany | | | 1,500,000 | EUR | | | 2,314,709 | |
d Loxam SAS, senior sub. note, 144A, 7.375%, 1/24/20 | | France | | | 1,000,000 | EUR | | | 1,473,504 | |
Meritor Inc., senior note, 10.625%, 3/15/18 | | United States | | | 2,500,000 | | | | 2,668,750 | |
FSI-11
Franklin Templeton Variable Insurance Products Trust
Statement of Investments, December 31, 2013 (continued)
| | | | | | | | | | |
| Franklin Strategic Income Securities Fund | | Country | | Principal
Amount* | | | Value | |
Corporate Bonds (continued) | | | | | | | | | | |
Capital Goods (continued) | | | | | | | | | | |
Navistar International Corp., senior note, 8.25%, 11/01/21 | | United States | | | 1,500,000 | | | $ | 1,560,000 | |
Terex Corp., senior note, 6.00%, 5/15/21 | | United States | | | 1,000,000 | | | | 1,038,750 | |
| | | | | | | | | | |
| | | | | | | | | 11,963,963 | |
| | | | | | | | | | |
Commercial & Professional Services 0.2% | | | | | | | | | | |
d Algeco Scotsman Global Finance PLC, senior secured note, first lien, 144A, | | | | | | | | | | |
8.50%, 10/15/18 | | United Kingdom | | | 1,700,000 | | | | 1,829,625 | |
| | | | | | | | | | |
Consumer Durables & Apparel 0.7% | | | | | | | | | | |
KB Home, senior note, 7.00%, 12/15/21 | | United States | | | 1,600,000 | | | | 1,672,000 | |
M/I Homes Inc., senior note, 8.625%, 11/15/18 | | United States | | | 1,800,000 | | | | 1,957,500 | |
Shea Homes LP/Funding Corp., senior secured note, 8.625%, 5/15/19 | | United States | | | 1,000,000 | | | | 1,112,500 | |
Toll Brothers Finance Corp., senior bond, 5.625%, 1/15/24 | | United States | | | 1,000,000 | | | | 1,010,000 | |
Visant Corp., senior note, 10.00%, 10/01/17 | | United States | | | 1,600,000 | | | | 1,560,000 | |
| | | | | | | | | | |
| | | | | | | | | 7,312,000 | |
| | | | | | | | | | |
Consumer Services 1.0% | | | | | | | | | | |
Caesars Entertainment Operating Co. Inc., senior secured note, 11.25%, 6/01/17 | | United States | | | 3,500,000 | | | | 3,570,000 | |
ClubCorp Club Operations Inc., senior note, 10.00%, 12/01/18 | | United States | | | 988,000 | | | | 1,099,150 | |
d,e Fontainebleau Las Vegas, 144A, 11.00%, 6/15/15 | | United States | | | 2,500,000 | | | | 250 | |
MGM Resorts International, senior note, | | | | | | | | | | |
6.625%, 7/15/15 | | United States | | | 3,000,000 | | | | 3,232,500 | |
6.75%, 10/01/20 | | United States | | | 200,000 | | | | 214,500 | |
6.625%, 12/15/21 | | United States | | | 500,000 | | | | 529,375 | |
d Paris Las Vegas Holding LLC, senior secured note, first lien, 144A, 8.00%, 10/01/20 | | United States | | | 500,000 | | | | 522,500 | |
d PNK Finance Corp., senior note, 144A, 6.375%, 8/01/21 | | United States | | | 700,000 | | | | 719,250 | |
| | | | | | | | | | |
| | | | | | | | | 9,887,525 | |
| | | | | | | | | | |
Diversified Financials 4.2% | | | | | | | | | | |
Ally Financial Inc., senior note, 7.50%, 9/15/20 | | United States | | | 3,000,000 | | | | 3,506,250 | |
Bank of America Corp., | | | | | | | | | | |
f pfd., sub. bond, M, 8.125% to 5/15/18, FRN thereafter, Perpetual | | United States | | | 3,000,000 | | | | 3,371,859 | |
senior note, 5.65%, 5/01/18 | | United States | | | 1,500,000 | | | | 1,708,296 | |
Citigroup Inc., | | | | | | | | | | |
senior note, 5.375%, 8/09/20 | | United States | | | 1,500,000 | | | | 1,706,892 | |
sub. bond, 5.50%, 9/13/25 | | United States | | | 1,500,000 | | | | 1,580,471 | |
sub. note, 4.05%, 7/30/22 | | United States | | | 300,000 | | | | 296,752 | |
Deutsche Bank AG, sub. bond, 4.296% to 5/24/23, FRN thereafter, 5/24/28 | | Germany | | | 4,000,000 | | | | 3,625,200 | |
E*TRADE Financial Corp., senior note, 6.375%, 11/15/19 | | United States | | | 1,400,000 | | | | 1,510,250 | |
General Electric Capital Corp.,
senior note, A, 8.50%, 4/06/18 | | United States | | | 29,000,000 | MXN | | | 2,484,447 | |
sub. note, 5.30%, 2/11/21 | | United States | | | 500,000 | | | | 559,460 | |
d General Motors Financial Co. Inc., senior note, 144A, 3.25%, 5/15/18 | | United States | | | 900,000 | | | | 902,250 | |
GMAC Inc., sub. note, 8.00%, 12/31/18 | | United States | | | 900,000 | | | | 1,066,500 | |
The Goldman Sachs Group Inc., senior note, 2.375%, 1/22/18 | | United States | | | 2,500,000 | | | | 2,510,800 | |
JPMorgan Chase & Co., | | | | | | | | | | |
f junior sub. bond, 6.00% to 8/01/23, FRN thereafter, Perpetual | | United States | | | 1,500,000 | | | | 1,441,875 | |
senior note, 4.25%, 10/15/20 | | United States | | | 2,500,000 | | | | 2,650,790 | |
sub. note, 3.375%, 5/01/23 | | United States | | | 1,000,000 | | | | 932,327 | |
d KKR Group Finance Co., senior note, 144A, 6.375%, 9/29/20 | | United States | | | 2,500,000 | | | | 2,808,070 | |
Morgan Stanley, senior note, | | | | | | | | | | |
6.00%, 4/28/15 | | United States | | | 1,000,000 | | | | 1,065,376 | |
5.50%, 7/24/20 | | United States | | | 1,500,000 | | | | 1,678,018 | |
FSI-12
Franklin Templeton Variable Insurance Products Trust
Statement of Investments, December 31, 2013 (continued)
| | | | | | | | | | |
| Franklin Strategic Income Securities Fund | | Country | | Principal
Amount* | | | Value | |
Corporate Bonds (continued) | | | | | | | | | | |
Diversified Financials (continued) | | | | | | | | | | |
d Neuberger Berman Group LLC/Finance Corp., senior note, 144A, | | | | | | | | | | |
5.625%, 3/15/20 | | United States | | | 600,000 | | | $ | 633,000 | |
5.875%, 3/15/22 | | United States | | | 1,400,000 | | | | 1,449,000 | |
d Nuveen Investments Inc., senior note, 144A, | | | | | | | | | | |
9.125%, 10/15/17 | | United States | | | 200,000 | | | | 201,000 | |
9.50%, 10/15/20 | | United States | | | 1,800,000 | | | | 1,813,500 | |
SLM Corp., senior note, | | | | | | | | | | |
8.45%, 6/15/18 | | United States | | | 1,800,000 | | | | 2,103,750 | |
5.50%, 1/15/19 | | United States | | | 1,400,000 | | | | 1,453,708 | |
| | | | | | | | | | |
| | | | | | | | | 43,059,841 | |
| | | | | | | | | | |
Energy 8.7% | | | | | | | | | | |
Access Midstream Partner LP/ACMP Finance Corp., senior note, | | | | | | | | | | |
5.875%, 4/15/21 | | United States | | | 1,500,000 | | | | 1,605,000 | |
6.125%, 7/15/22 | | United States | | | 600,000 | | | | 645,000 | |
d Antero Resources Corp., senior note, 144A, 5.375%, 11/01/21 | | United States | | | 700,000 | | | | 707,438 | |
BreitBurn Energy Partners LP/Finance Corp., senior bond, 7.875%, 4/15/22 | | United States | | | 900,000 | | | | 940,500 | |
CGG, senior note, | | | | | | | | | | |
7.75%, 5/15/17 | | France | | | 500,000 | | | | 516,250 | |
6.50%, 6/01/21 | | France | | | 2,000,000 | | | | 2,060,000 | |
CHC Helicopter SA,
senior note, 9.375%, 6/01/21 | | Canada | | | 400,000 | | | | 412,000 | |
senior secured note, first lien, 9.25%, 10/15/20 | | Canada | | | 2,500,000 | | | | 2,696,875 | |
Chesapeake Energy Corp., senior note, | | | | | | | | | | |
6.625%, 8/15/20 | | United States | | | 2,000,000 | | | | 2,245,000 | |
6.125%, 2/15/21 | | United States | | | 1,500,000 | | | | 1,616,250 | |
5.75%, 3/15/23 | | United States | | | 1,000,000 | | | | 1,035,000 | |
d Clayton Williams Energy Inc., senior note, 144A, 7.75%, 4/01/19 | | United States | | | 1,500,000 | | | | 1,548,750 | |
CONSOL Energy Inc., senior note, | | | | | | | | | | |
8.00%, 4/01/17 | | United States | | | 500,000 | | | | 528,750 | |
8.25%, 4/01/20 | | United States | | | 1,500,000 | | | | 1,631,250 | |
6.375%, 3/01/21 | | United States | | | 200,000 | | | | 207,500 | |
Crosstex Energy LP/Crosstex Energy Finance Corp., senior note, 8.875%, 2/15/18 | | United States | | | 1,500,000 | | | | 1,578,750 | |
El Paso Corp., senior bond, 6.50%, 9/15/20 | | United States | | | 1,500,000 | | | | 1,614,186 | |
Energy Transfer Equity LP, senior note, 7.50%, 10/15/20 | | United States | | | 4,000,000 | | | | 4,510,000 | |
Energy Transfer Partners LP, senior note, 5.20%, 2/01/22 | | United States | | | 1,000,000 | | | | 1,053,097 | |
Energy XXI Gulf Coast Inc., senior note, 9.25%, 12/15/17 | | United States | | | 2,500,000 | | | | 2,793,750 | |
Enterprise Products Operating LLC, junior sub. note, 7.034% to 1/15/18, FRN thereafter, 1/15/68 | | United States | | | 1,500,000 | | | | 1,658,965 | |
d Expro Finance Luxembourg, senior secured note, 144A, 8.50%, 12/15/16 | | United Kingdom | | | 2,500,000 | | | | 2,618,750 | |
d,g Gaz Capital SA (OJSC Gazprom), loan participation, | | | | | | | | | | |
senior bond, 144A, 6.51%, 3/07/22 | | Russia | | | 500,000 | | | | 539,375 | |
senior note, 144A, 5.092%, 11/29/15 | | Russia | | | 3,000,000 | | | | 3,194,325 | |
senior note, 144A, 3.85%, 2/06/20 | | Russia | | | 1,000,000 | | | | 968,505 | |
Halcon Resources Corp., senior note, | | | | | | | | | | |
9.75%, 7/15/20 | | United States | | | 200,000 | | | | 209,500 | |
8.875%, 5/15/21 | | United States | | | 2,000,000 | | | | 2,030,000 | |
d 144A, 9.25%, 2/15/22 | | United States | | | 800,000 | | | | 818,000 | |
d Kinder Morgan Finance Co. LLC, senior secured note, 144A, 6.00%, 1/15/18 | | United States | | | 2,000,000 | | | | 2,200,654 | |
Linn Energy LLC/Finance Corp., senior note, | | | | | | | | | | |
8.625%, 4/15/20 | | United States | | | 2,500,000 | | | | 2,712,500 | |
7.75%, 2/01/21 | | United States | | | 1,500,000 | | | | 1,593,750 | |
d LUKOIL International Finance BV, senior note, 144A, 4.563%, 4/24/23 | | Russia | | | 3,500,000 | | | | 3,297,087 | |
FSI-13
Franklin Templeton Variable Insurance Products Trust
Statement of Investments, December 31, 2013 (continued)
| | | | | | | | | | |
| Franklin Strategic Income Securities Fund | | Country | | Principal
Amount* | | | Value | |
Corporate Bonds (continued) | | | | | | | | | | |
Energy (continued) | | | | | | | | | | |
Martin Midstream Partners LP/Martin Midstream Finance Corp., senior note, | | | | | | | | | | |
8.875%, 4/01/18 | | United States | | | 1,254,000 | | | $ | 1,329,240 | |
7.25%, 2/15/21 | | United States | | | 600,000 | | | | 615,000 | |
Midstates Petroleum Co. Inc./LLC, senior note, 9.25%, 6/01/21 | | United States | | | 1,500,000 | | | | 1,575,000 | |
d Oasis Petroleum Inc., senior note, 144A, 6.875%, 3/15/22 | | United States | | | 1,300,000 | | | | 1,384,500 | |
Offshore Group Investment Ltd., | | | | | | | | | | |
senior bond, first lien, 7.125%, 4/01/23 | | United States | | | 700,000 | | | | 717,500 | |
senior secured note, first lien, 7.50%, 11/01/19 | | United States | | | 2,000,000 | | | | 2,175,000 | |
PBF Holding Co. LLC, first lien, 8.25%, 2/15/20 | | United States | | | 2,400,000 | | | | 2,616,000 | |
Peabody Energy Corp., senior note, | | | | | | | | | | |
6.00%, 11/15/18 | | United States | | | 700,000 | | | | 749,000 | |
6.50%, 9/15/20 | | United States | | | 2,500,000 | | | | 2,643,750 | |
6.25%, 11/15/21 | | United States | | | 1,500,000 | | | | 1,522,500 | |
Penn Virginia Corp., senior note, 8.50%, 5/01/20 | | United States | | | 1,500,000 | | | | 1,620,000 | |
Penn Virginia Resource Partners LP/Finance Corp. II, senior note, | | | | | | | | | | |
8.375%, 6/01/20 | | United States | | | 1,426,000 | | | | 1,579,295 | |
d 144A, 6.50%, 5/15/21 | | United States | | | 400,000 | | | | 416,000 | |
Plains Exploration & Production Co., senior note, | | | | | | | | | | |
6.125%, 6/15/19 | | United States | | | 600,000 | | | | 656,419 | |
6.875%, 2/15/23 | | United States | | | 1,000,000 | | | | 1,120,000 | |
QR Energy LP/QRE Finance, senior note, 9.25%, 8/01/20 | | United States | | | 2,000,000 | | | | 2,080,000 | |
Quicksilver Resources Inc., | | | | | | | | | | |
d,h secured note, second lien, 144A, FRN, 7.00%, 6/21/19 | | United States | | | 1,800,000 | | | | 1,773,000 | |
senior note, 9.125%, 8/15/19 | | United States | | | 500,000 | | | | 510,000 | |
d Sabine Pass Liquefaction LLC, | | | | | | | | | | |
secured note, 144A, 5.625%, 2/01/21 | | United States | | | 3,000,000 | | | | 2,947,500 | |
senior secured note, 144A, 5.625%, 4/15/23 | | United States | | | 900,000 | | | | 846,000 | |
d Samson Investment Co., senior note, 144A, 9.75%, 2/15/20 | | United States | | | 2,500,000 | | | | 2,737,500 | |
d Sanchez Energy Corp., senior note, 144A, 7.75%, 6/15/21 | | United States | | | 1,700,000 | | | | 1,746,750 | |
W&T Offshore Inc., senior note, 8.50%, 6/15/19 | | United States | | | 2,800,000 | | | | 2,975,000 | |
| | | | | | | | | | |
| | | | | | | | | 88,121,711 | |
| | | | | | | | | | |
Food & Staples Retailing 0.6% | | | | | | | | | | |
d Cencosud SA, senior note, 144A, 4.875%, 1/20/23 | | Chile | | | 2,500,000 | | | | 2,336,675 | |
Rite Aid Corp., senior secured note, 8.00%, 8/15/20 | | United States | | | 1,300,000 | | | | 1,469,000 | |
Safeway Inc., senior bond, 3.95%, 8/15/20 | | United States | | | 2,500,000 | | | | 2,499,727 | |
| | | | | | | | | | |
| | | | | | | | | 6,305,402 | |
| | | | | | | | | | |
Food, Beverage & Tobacco 1.2% | | | | | | | | | | |
d Boparan Finance PLC, senior note, 144A, 9.75%, 4/30/18 | | United Kingdom | | | 1,500,000 | EUR | | | 2,264,417 | |
Constellation Brands Inc., senior note, 4.25%, 5/01/23 | | United States | | | 1,000,000 | | | | 935,000 | |
Del Monte Corp., senior note, 7.625%, 2/15/19 | | United States | | | 2,500,000 | | | | 2,603,125 | |
d JBS USA LLC/Finance Inc., senior note, 144A, | | | | | | | | | | |
8.25%, 2/01/20 | | United States | | | 2,400,000 | | | | 2,616,000 | |
7.25%, 6/01/21 | | United States | | | 300,000 | | | | 313,500 | |
Kraft Foods Group Inc., senior bond, 3.50%, 6/06/22 | | United States | | | 2,500,000 | | | | 2,437,270 | |
d Post Holdings Inc., senior note, 144A, 6.75%, 12/01/21 | | United States | | | 400,000 | | | | 415,000 | |
d Sun Merger Sub Inc., senior note, 144A, 5.875%, 8/01/21 | | United States | | | 600,000 | | | | 618,375 | |
| | | | | | | | | | |
| | | | | | | | | 12,202,687 | |
| | | | | | | | | | |
Health Care Equipment & Services 1.5% | | | | | | | | | | |
Alere Inc., senior sub. note, 6.50%, 6/15/20 | | United States | | | 800,000 | | | | 822,000 | |
d Cegedim SA, senior note, 144A, 6.75%, 4/01/20 | | France | | | 1,400,000 | EUR | | | 1,997,914 | |
FSI-14
Franklin Templeton Variable Insurance Products Trust
Statement of Investments, December 31, 2013 (continued)
| | | | | | | | | | |
| Franklin Strategic Income Securities Fund | | Country | | Principal
Amount* | | | Value | |
Corporate Bonds (continued) | | | | | | | | | | |
Health Care Equipment & Services (continued) | | | | | | | | | | |
CHS/Community Health Systems Inc., | | | | | | | | | | |
senior note, 8.00%, 11/15/19 | | United States | | | 1,500,000 | | | $ | 1,635,000 | |
senior secured note, 5.125%, 8/15/18 | | United States | | | 1,100,000 | | | | 1,138,500 | |
DaVita HealthCare Partners Inc., senior note, 5.75%, 8/15/22 | | United States | | | 1,500,000 | | | | 1,526,250 | |
HCA Inc., | | | | | | | | | | |
senior note, 7.50%, 2/15/22 | | United States | | | 2,000,000 | | | | 2,200,000 | |
senior note, 5.875%, 5/01/23 | | United States | | | 1,500,000 | | | | 1,485,000 | |
senior secured note, 5.875%, 3/15/22 | | United States | | | 1,400,000 | | | | 1,449,000 | |
Hologic Inc., senior note, 6.25%, 8/01/20 | | United States | | | 900,000 | | | | 954,000 | |
Tenet Healthcare Corp., senior note, 8.125%, 4/01/22 | | United States | | | 1,700,000 | | | | 1,836,000 | |
| | | | | | | | | | |
| | | | | | | | | 15,043,664 | |
| | | | | | | | | | |
Insurance 0.5% | | | | | | | | | | |
MetLife Inc., junior sub. note, 6.40% to 12/15/36, FRN thereafter, 12/15/66 | | United States | | | 2,500,000 | | | | 2,581,250 | |
d Mitsui Sumitomo Insurance Co. Ltd., junior sub. note, 144A, 7.00% to 3/15/22, FRN | | | | | | | | | | |
thereafter, 3/15/72 | | Japan | | | 2,500,000 | | | | 2,839,275 | |
| | | | | | | | | | |
| | | | | | | | | 5,420,525 | |
| | | | | | | | | | |
Materials 4.6% | | | | | | | | | | |
ArcelorMittal, senior note, | | | | | | | | | | |
6.00%, 3/01/21 | | Luxembourg | | | 3,500,000 | | | | 3,708,967 | |
6.75%, 2/25/22 | | Luxembourg | | | 1,000,000 | | | | 1,090,630 | |
d Ardagh Packaging Finance PLC, senior note, 144A, 9.125%, 10/15/20 | | Luxembourg | | | 900,000 | | | | 987,750 | |
d Ardagh Packaging Finance PLC/Ardagh MP Holdings USA Inc., | | | | | | | | | | |
secured note, 144A, 4.875%, 11/15/22 | | Luxembourg | | | 200,000 | | | | 198,875 | |
senior note, 144A, 7.00%, 11/15/20 | | Luxembourg | | | 600,000 | | | | 606,000 | |
senior secured note, first lien, 144A, 7.375%, 10/15/17 | | Luxembourg | | | 600,000 | | | | 645,750 | |
Ashland Inc., senior note, 4.75%, 8/15/22 | | United States | | | 700,000 | | | | 668,500 | |
d Barminco Finance Pty. Ltd., senior note, 144A, 9.00%, 6/01/18 | | Australia | | | 1,500,000 | | | | 1,389,787 | |
d Cemex SAB de CV, | | | | | | | | | | |
secured note, 144A, 5.875%, 3/25/19 | | Mexico | | | 1,000,000 | | | | 1,005,000 | |
senior secured note, 144A, 9.00%, 1/11/18 | | Mexico | | | 3,000,000 | | | | 3,311,250 | |
Euramax International Inc., senior secured note, 9.50%, 4/01/16 | | United States | | | 800,000 | | | | 806,000 | |
d Faenza GmbH, senior note, 144A, 8.25%, 8/15/21 | | Germany | | | 900,000 | EUR | | | 1,340,855 | |
d FMG Resources (August 2006) Pty. Ltd., senior note, 144A, | | | | | | | | | | |
6.00%, 4/01/17 | | Australia | | | 500,000 | | | | 531,550 | |
6.875%, 2/01/18 | | Australia | | | 2,500,000 | | | | 2,637,500 | |
8.25%, 11/01/19 | | Australia | | | 1,000,000 | | | | 1,126,250 | |
d Glencore Funding LLC, senior note, 144A, 4.125%, 5/30/23 | | United States | | | 1,000,000 | | | | 934,834 | |
d Ineos Finance PLC, senior secured note, 144A, | | | | | | | | | | |
8.375%, 2/15/19 | | Switzerland | | | 200,000 | | | | 223,250 | |
7.50%, 5/01/20 | | Switzerland | | | 300,000 | | | | 328,688 | |
d Ineos Group Holdings SA, secured note, | | | | | | | | | | |
second lien, 144A, 7.875%, 2/15/16 | | Switzerland | | | 1,010,485 | EUR | | | 1,402,967 | |
senior note, 144A, 6.125%, 8/15/18 | | Switzerland | | | 700,000 | | | | 707,875 | |
senior note, 144A, 6.50%, 8/15/18 | | Switzerland | | | 700,000 | EUR | | | 989,497 | |
d Inmet Mining Corp., senior note, 144A, 8.75%, 6/01/20 | | Canada | | | 3,000,000 | | | | 3,270,000 | |
d Kerling PLC, senior secured note, 144A, 10.625%, 2/01/17 | | United Kingdom | | | 1,000,000 | EUR | | | 1,465,217 | |
Novelis Inc., senior note, | | | | | | | | | | |
8.375%, 12/15/17 | | Canada | | | 1,000,000 | | | | 1,069,375 | |
8.75%, 12/15/20 | | Canada | | | 1,600,000 | | | | 1,788,000 | |
d Orion Engineered Carbons Bondco GmbH, senior secured bond, 144A, 10.00%, 6/15/18 | | Germany | | | 2,250,000 | EUR | | | 3,435,311 | |
d,i Orion Engineered Carbons Finance & Co. SCA, senior note, 144A, PIK, 9.25%, 8/01/19 | | Germany | | | 200,000 | | | | 210,000 | |
FSI-15
Franklin Templeton Variable Insurance Products Trust
Statement of Investments, December 31, 2013 (continued)
| | | | | | | | | | | | |
| Franklin Strategic Income Securities Fund | | Country | | | Principal
Amount* | | | Value | |
Corporate Bonds (continued) | | | | | | | | | | | | |
Materials (continued) | | | | | | | | | | | | |
Reynolds Group Issuer Inc./LLC/SA, first lien, 5.75%, 10/15/20 | | | United States | | | | 900,000 | | | $ | 922,500 | |
senior note, 8.50%, 5/15/18 | | | United States | | | | 1,500,000 | | | | 1,590,000 | |
senior note, 8.25%, 2/15/21 | | | United States | | | | 1,000,000 | | | | 1,072,500 | |
senior secured note, 7.125%, 4/15/19 | | | United States | | | | 1,000,000 | | | | 1,070,000 | |
d Sealed Air Corp., senior note, 144A, | | | | | | | | | | | | |
8.125%, 9/15/19 | | | United States | | | | 1,000,000 | | | | 1,127,500 | |
8.375%, 9/15/21 | | | United States | | | | 800,000 | | | | 912,000 | |
d U.S. Coatings Acquisition Inc./Flash Dutch 2 BV, 144A, 5.75%, 2/01/21 | | | United States | | | | 1,000,000 | EUR | | | 1,444,275 | |
d Xstrata Finance Canada Ltd., senior note, 144A, 4.95%, 11/15/21 | | | Canada | | | | 2,500,000 | | | | 2,533,065 | |
| | | | | | | | | | | | |
| | | | | | | | | | | 46,551,518 | |
| | | | | | | | | | | | |
Media 3.2% | | | | | | | | | | | | |
CCO Holdings LLC/CCO Holdings Capital Corp., senior bond, 5.25%, 9/30/22 | | | United States | | | | 1,400,000 | | | | 1,314,250 | |
Clear Channel Communications Inc., senior secured bond, first lien, 9.00%, 3/01/21 | | | United States | | | | 4,500,000 | | | | 4,567,500 | |
Clear Channel Worldwide Holdings Inc.,
senior note, 6.50%, 11/15/22 | | | United States | | | | 1,000,000 | | | | 1,026,250 | |
senior sub. note, 7.625%, 3/15/20 | | | United States | | | | 200,000 | | | | 209,000 | |
senior sub. note, 7.625%, 3/15/20 | | | United States | | | | 1,000,000 | | | | 1,056,250 | |
CSC Holdings Inc., senior deb., 7.625%, 7/15/18 | | | United States | | | | 1,500,000 | | | | 1,723,125 | |
CSC Holdings LLC, senior note, 6.75%, 11/15/21 | | | United States | | | | 3,000,000 | | | | 3,247,500 | |
DISH DBS Corp., senior note, | | | | | | | | | | | | |
7.125%, 2/01/16 | | | United States | | | | 3,500,000 | | | | 3,885,000 | |
6.75%, 6/01/21 | | | United States | | | | 500,000 | | | | 532,500 | |
5.875%, 7/15/22 | | | United States | | | | 500,000 | | | | 502,500 | |
d Gannett Co. Inc., | | | | | | | | | | | | |
senior bond, 144A, 6.375%, 10/15/23 | | | United States | | | | 1,600,000 | | | | 1,660,000 | |
senior note, 144A, 5.125%, 7/15/20 | | | United States | | | | 700,000 | | | | 712,250 | |
i Radio One Inc., senior sub. note, PIK, 12.50%, 5/24/16 | | | United States | | | | 1,200,000 | | | | 1,206,000 | |
Time Warner Inc., 7.625%, 4/15/31 | | | United States | | | | 1,500,000 | | | | 1,898,659 | |
d Unitymedia Hessen GmbH & Co.KG/Unitymedia NRW GmbH, senior secured note, 144A, | | | | | | | | | | | | |
5.625%, 4/15/23 | | | Germany | | | | 800,000 | EUR | | | 1,125,159 | |
d Univision Communications Inc., | | | | | | | | | | | | |
senior secured bond, 144A, 6.75%, 9/15/22 | | | United States | | | | 500,000 | | | | 550,000 | |
senior secured note, 144A, 7.875%, 11/01/20 | | | United States | | | | 2,500,000 | | | | 2,759,375 | |
d UPC Holding BV, senior note, 144A, 6.375%, 9/15/22 | | | Netherlands | | | | 500,000 | EUR | | | 701,935 | |
d UPCB Finance II Ltd., senior secured note, 144A, 6.375%, 7/01/20 | | | Netherlands | | | | 2,000,000 | EUR | | | 2,951,823 | |
d UPCB Finance VI Ltd., senior secured note, 144A, 6.875%, 1/15/22 | | | Netherlands | | | | 500,000 | | | | 532,188 | |
| | | | | | | | | | | | |
| �� | | | | | | | | | | 32,161,264 | |
| | | | | | | | | | | | |
Pharmaceuticals, Biotechnology & Life Sciences 1.4% | | | | | | | | | | | | |
d Capsugel FinanceCo SCA, senior note, 144A, 9.875%, 8/01/19 | | | United States | | | | 2,000,000 | EUR | | | 3,084,559 | |
Gilead Sciences Inc., senior note, | | | | | | | | | | | | |
4.50%, 4/01/21 | | | United States | | | | 500,000 | | | | 532,673 | |
4.40%, 12/01/21 | | | United States | | | | 1,000,000 | | | | 1,068,260 | |
Grifols Inc., senior note, 8.25%, 2/01/18 | | | Spain | | | | 1,500,000 | | | | 1,601,250 | |
d inVentiv Health Inc., senior secured note, 144A, 9.00%, 1/15/18 | | | United States | | | | 600,000 | | | | 630,000 | |
d,i Jaguar Holding Co. I, senior note, 144A, PIK, 9.375%, 10/15/17 | | | United States | | | | 1,900,000 | | | | 2,018,750 | |
d Valeant Pharmaceuticals International Inc., senior note, 144A, 7.50%, 7/15/21 | | | United States | | | | 1,200,000 | | | | 1,323,000 | |
d VPI Escrow Corp., senior note, 144A, 6.375%, 10/15/20 | | | United States | | | | 2,400,000 | | | | 2,541,000 | |
Zoetis Inc., senior bond, 3.25%, 2/01/23 | | | United States | | | | 2,000,000 | | | | 1,871,990 | |
| | | | | | | | | | | | |
| | | | | | | | | | | 14,671,482 | |
| | | | | | | | | | | | |
FSI-16
Franklin Templeton Variable Insurance Products Trust
Statement of Investments, December 31, 2013 (continued)
| | | | | | | | | | |
| Franklin Strategic Income Securities Fund | | Country | | Principal
Amount* | | | Value | |
Corporate Bonds (continued) | | | | | | | | | | |
Retailing 0.6% | | | | | | | | | | |
d Edcon Pty. Ltd., secured note, 144A, 9.50%, 3/01/18 | | South Africa | | | 2,400,000 | EUR | | $ | 3,390,959 | |
d New Look Bondco I PLC, 144A, 8.75%, 5/14/18 | | United Kingdom | | | 1,300,000 | GBP | | | 2,280,033 | |
| | | | | | | | | | |
| | | | | | | | | 5,670,992 | |
| | | | | | | | | | |
Semiconductors & Semiconductor Equipment 0.4% | | | | | | | | | | |
Freescale Semiconductor Inc., | | | | | | | | | | |
d secured note, 144A, 5.00%, 5/15/21 | | United States | | | 500,000 | | | | 487,500 | |
senior note, 8.05%, 2/01/20 | | United States | | | 1,600,000 | | | | 1,728,000 | |
senior note, 10.75%, 8/01/20 | | United States | | | 1,382,000 | | | | 1,575,480 | |
| | | | | | | | | | |
| | | | | | | | | 3,790,980 | |
| | | | | | | | | | |
Software & Services 1.0% | | | | | | | | | | |
d BMC Software Finance Inc., senior note, 144A, 8.125%, 7/15/21 | | United States | | | 1,200,000 | | | | 1,242,000 | |
Equinix Inc., senior bond, 5.375%, 4/01/23 | | United States | | | 2,500,000 | | | | 2,456,250 | |
First Data Corp.,
senior bond, 12.625%, 1/15/21 | | United States | | | 300,000 | | | | 353,625 | |
d senior secured bond, 144A, 8.25%, 1/15/21 | | United States | | | 4,500,000 | | | | 4,809,375 | |
Sterling International Inc., senior note, 11.00%, 10/01/19 | | United States | | | 1,100,000 | | | | 1,149,500 | |
| | | | | | | | | | |
| | | | | | | | | 10,010,750 | |
| | | | | | | | | | |
Technology Hardware & Equipment 0.6% | | | | | | | | | | |
d Alcatel-Lucent USA Inc., senior note, 144A, 6.75%, 11/15/20 | | United States | | | 2,000,000 | | | | 2,085,000 | |
CDW LLC/Finance Corp., senior note, 8.50%, 4/01/19 | | United States | | | 2,000,000 | | | | 2,220,000 | |
d,i CommScope Holdings Co. Inc., senior note, 144A, PIK, 6.625%, 6/01/20 | | United States | | | 200,000 | | | | 209,000 | |
d CommScope Inc., senior note, 144A, 8.25%, 1/15/19 | | United States | | | 1,834,000 | | | | 2,019,692 | |
| | | | | | | | | | |
| | | | | | | | | 6,533,692 | |
| | | | | | | | | | |
Telecommunication Services 4.2% | | | | | | | | | | |
d Altice Financing SA, senior secured note, 144A, 6.50%, 1/15/22 | | Luxembourg | | | 800,000 | EUR | | | 1,111,404 | |
CC Holdings GS V LLC/Crown Castle GS III Corp., senior secured bond, 3.849%, 4/15/23 | | United States | | | 1,000,000 | | | | 936,423 | |
CenturyLink Inc.,
senior bond, 6.75%, 12/01/23 | | United States | | | 200,000 | | | | 203,500 | |
senior note, 6.00%, 4/01/17 | | United States | | | 1,500,000 | | | | 1,661,250 | |
senior note, 6.45%, 6/15/21 | | United States | | | 1,000,000 | | | | 1,045,000 | |
Crown Castle International Corp., senior bond, 5.25%, 1/15/23 | | United States | | | 500,000 | | | | 492,500 | |
d Digicel Group Ltd., senior note, 144A, 8.25%, 9/30/20 | | Bermuda | | | 2,000,000 | | | | 2,081,250 | |
d Digicel Ltd., senior note, 144A, | | | | | | | | | | |
8.25%, 9/01/17 | | Bermuda | | | 300,000 | | | | 313,500 | |
6.00%, 4/15/21 | | Bermuda | | | 800,000 | | | | 775,592 | |
d eAccess Ltd., senior note, 144A, | | | | | | | | | | |
8.25%, 4/01/18 | | Japan | | | 1,400,000 | | | | 1,535,625 | |
8.375%, 4/01/18 | | Japan | | | 600,000 | EUR | | | 918,662 | |
Frontier Communications Corp.,
senior bond, 7.625%, 4/15/24 | | United States | | | 600,000 | | | | 601,500 | |
senior note, 8.50%, 4/15/20 | | United States | | | 2,000,000 | | | | 2,250,000 | |
senior note, 8.75%, 4/15/22 | | United States | | | 1,000,000 | | | | 1,115,000 | |
senior note, 7.875%, 1/15/27 | | United States | | | 400,000 | | | | 386,000 | |
Intelsat Jackson Holdings SA,
senior bond, 6.625%, 12/15/22 | | Luxembourg | | | 1,600,000 | | | | 1,650,000 | |
senior note, 7.25%, 10/15/20 | | Luxembourg | | | 2,000,000 | | | | 2,197,500 | |
senior note, 7.50%, 4/01/21 | | Luxembourg | | | 1,000,000 | | | | 1,107,500 | |
d Millicom International Cellular SA, senior note, 144A, 6.625%, 10/15/21 | | Luxembourg | | | 1,100,000 | | | | 1,145,375 | |
d,i Mobile Challenger Intermediate Group SA, secured note, 144A, PIK, 8.75%, 3/15/19 | | Switzerland | | | 600,000 | EUR | | | 862,438 | |
FSI-17
Franklin Templeton Variable Insurance Products Trust
Statement of Investments, December 31, 2013 (continued)
| | | | | | | | | | |
| Franklin Strategic Income Securities Fund | | Country | | Principal
Amount* | | | Value | |
Corporate Bonds (continued) | | | | | | | | | | |
Telecommunication Services (continued) | | | | | | | | | | |
d Nokia Siemens Networks Finance BV, senior note, 144A, 7.125%, 4/15/20 | | Netherlands | | | 1,000,000 | EUR | | $ | 1,571,509 | |
d Sprint Corp., senior note, 144A, 7.875%, 9/15/23 | | United States | | | 500,000 | | | | 538,750 | |
Sprint Nextel Corp., senior note, | | | | | | | | | | |
8.375%, 8/15/17 | | United States | | | 2,500,000 | | | | 2,906,250 | |
6.00%, 11/15/22 | | United States | | | 500,000 | | | | 490,000 | |
d 144A, 9.00%, 11/15/18 | | United States | | | 1,500,000 | | | | 1,811,250 | |
d 144A, 7.00%, 3/01/20 | | United States | | | 800,000 | | | | 896,000 | |
T-Mobile USA Inc.,
senior bond, 6.50%, 1/15/24 | | United States | | | 300,000 | | | | 304,500 | |
senior note, 6.542%, 4/28/20 | | United States | | | 1,400,000 | | | | 1,496,250 | |
senior note, 6.125%, 1/15/22 | | United States | | | 200,000 | | | | 204,000 | |
Telefonica Emisiones SAU, senior note, | | | | | | | | | | |
5.462%, 2/16/21 | | Spain | | | 800,000 | | | | 852,268 | |
4.57%, 4/27/23 | | Spain | | | 2,000,000 | | | | 1,983,440 | |
Verizon Communications Inc., senior note, 5.15%, 9/15/23 | | United States | | | 3,000,000 | | | | 3,222,180 | |
d Wind Acquisition Finance SA, senior secured note, 144A, 11.75%, 7/15/17 | | Italy | | | 3,000,000 | | | | 3,195,000 | |
d,i Wind Acquisition Holdings Finance SA, senior secured note, 144A, PIK, 12.25%, 7/15/17 | | Italy | | | 765,332 | EUR | | | 1,051,150 | |
| | | | | | | | | | |
| | | | | | | | | 42,912,566 | |
| | | | | | | | | | |
Transportation 0.4% | | | | | | | | | | |
d CEVA Group PLC, senior note, first lien, 144A, 4.00%, 5/01/18 | | United Kingdom | | | 1,700,000 | | | | 1,419,500 | |
HDTFS Inc., 6.25%, 10/15/22 | | United States | | | 1,500,000 | | | | 1,556,250 | |
Hertz Corp., senior note, 6.75%, 4/15/19 | | United States | | | 1,500,000 | | | | 1,623,750 | |
| | | | | | | | | | |
| | | | | | | | | 4,599,500 | |
| | | | | | | | | | |
Utilities 1.0% | | | | | | | | | | |
d Calpine Corp., | | | | | | | | | | |
senior secured bond, first lien, 144A, 5.875%, 1/15/24 | | United States | | | 600,000 | | | | 589,500 | |
senior secured note, 144A, 7.875%, 7/31/20 | | United States | | | 454,000 | | | | 499,400 | |
senior secured note, 144A, 7.50%, 2/15/21 | | United States | | | 1,492,000 | | | | 1,635,605 | |
senior secured, first lien, 144A, 6.00%, 1/15/22 | | United States | | | 100,000 | | | | 103,000 | |
d,f EDF SA, sub. note, 144A, 5.25% to 1/29/23, FRN thereafter, Perpetual | | France | | | 3,000,000 | | | | 2,988,828 | |
d InterGen NV, secured bond, 144A, 7.00%, 6/30/23 | | Netherlands | | | 1,700,000 | | | | 1,768,000 | |
d Texas Competitive Electric Holdings Co. LLC/Texas Competitive Electric Holdings Finance Inc., | | | | | | | | | | |
senior secured note, 144A, 11.50%, 10/01/20 | | United States | | | 3,500,000 | | | | 2,590,000 | |
| | | | | | | | | | |
| | | | | | | | | 10,174,333 | |
| | | | | | | | | | |
Total Corporate Bonds (Cost $380,602,110) | | | | | | | | | 403,698,100 | |
| | | | | | | | | | |
h,jSenior Floating Rate Interests 11.9% | | | | | | | | | | |
Automobiles & Components 0.4% | | | | | | | | | | |
August LuxUK Holding Co., Lux Second Lien, 10.50%, 4/27/19 | | Luxembourg | | | 1,246,997 | | | | 1,281,290 | |
August U.S. Holding Co. Inc., U.S. Second Lien, 10.50%, 4/27/19 | | United States | | | 408,309 | | | | 419,537 | |
FRAM Group Holdings Inc. (Autoparts Holdings), Second Lien Term Loan, 10.50%, 1/29/18 | | United States | | | 2,529,436 | | | | 2,409,287 | |
| | | | | | | | | | |
| | | | | | | | | 4,110,114 | |
| | | | | | | | | | |
Capital Goods 0.8% | | | | | | | | | | |
k Air Distribution Technologies (Tomkins Air Distribution), Second Lien Initial Loan, | | | | | | | | | | |
9.25%, 5/09/20 | | United States | | | 1,119,131 | | | | 1,142,912 | |
l Erickson Air-Crane Inc., Purchase Price Notes, 6.00%, 11/02/20 | | United States | | | 190,406 | | | | 178,471 | |
Quikrete Holdings Inc., First Lien Initial Loan, Inc., 4.00%, 9/26/20 | | United States | | | 1,252,200 | | | | 1,260,412 | |
Sensus USA Inc., Second Lien Term Loan, 8.50%, 5/09/18 | | United States | | | 2,582,186 | | | | 2,575,730 | |
Terex Corp., Term Loan, 3.50%, 4/28/17 | | United States | | | 1,697,356 | | | | 1,714,329 | |
FSI-18
Franklin Templeton Variable Insurance Products Trust
Statement of Investments, December 31, 2013 (continued)
| | | | | | | | | | |
| Franklin Strategic Income Securities Fund | | Country | | Principal
Amount* | | | Value | |
h,jSenior Floating Rate Interests (continued) | | | | | | | | | | |
Capital Goods (continued) | | | | | | | | | | |
TransDigm Inc., Tranche C Term Loan, 3.75%, 2/28/20 | | United States | | | 493,406 | | | $ | 495,359 | |
k Wesco Distribution Inc., Tranche B-1 Loan, 3.75%, 12/12/19 | | United States | | | 1,328,614 | | | | 1,333,596 | |
| | | | | | | | | | |
| | | | | | | | | 8,700,809 | |
| | | | | | | | | | |
Commercial & Professional Services 0.5% | | | | | | | | | | |
k Altegrity Inc., Tranche D Term Loan, 7.75%, 2/21/15 | | United States | | | 2,354,336 | | | | 2,349,432 | |
ARAMARK Corp., | | | | | | | | | | |
Extended Synthetic L/C, 3.519%, 7/26/16 | | United States | | | 143,344 | | | | 143,657 | |
Synthetic L/C-3, 3.519%, 7/26/16 | | United States | | | 91,726 | | | | 92,051 | |
Term Loan B Extended, 3.747%, 7/26/16 | | United States | | | 1,195,362 | | | | 1,197,977 | |
U.S. Term C Loan, 3.747%, 7/26/16 | | United States | | | 113,094 | | | | 113,494 | |
Interactive Data Corp., Term B Loan, 3.75%, 2/11/18 | | United States | | | 1,517,199 | | | | 1,521,467 | |
Pacific Industrial Services US Finco LLC (Spotless), Second Lien Initial Term Loan, 8.75%, 4/02/19 | | United States | | | 39,900 | | | | 40,923 | |
| | | | | | | | | | |
| | | | | | | | | 5,459,001 | |
| | | | | | | | | | |
Consumer Services 0.9% | | | | | | | | | | |
Caesars Entertainment Operating Co. Inc., Term Loan B-4, 9.50%, 10/31/16 | | United States | | | 857,996 | | | | 866,398 | |
Hilton Worldwide Finance LLC, Initial Term Loan, 3.75%, 10/25/20 | | United States | | | 1,184,760 | | | | 1,195,621 | |
k PF Chang's China Bistro Inc., Term Loan B, 5.50%, 6/22/19 | | United States | | | 377,245 | | | | 378,659 | |
c,i Turtle Bay Holdings LLC, Term Loan B, PIK, 3.00%, 3/01/15 | | United States | | | 6,225,893 | | | | 5,882,411 | |
Weight Watchers International Inc., Initial Tranche B-2 Term Loan, 3.75%, 4/02/20 | | United States | | | 1,081,711 | | | | 968,582 | |
| | | | | | | | | | |
| | | | | | | | | 9,291,671 | |
| | | | | | | | | | |
Diversified Financials 0.4% | | | | | | | | | | |
Asurion LLC, Incremental Tranche B-1 Term Loan, 4.50%, 5/24/19 | | United States | | | 2,025,283 | | | | 2,026,915 | |
Guggenheim Partners Investment Management Holdings LLC, Initial Term Loan, 4.25%, 7/22/20 | | United States | | | 246,607 | | | | 249,257 | |
k Trans Union LLC, 2013 Replacement Term Loan, 4.25%, 2/10/19 | | United States | | | 2,361,891 | | | | 2,379,014 | |
| | | | | | | | | | |
| | | | | | | | | 4,655,186 | |
| | | | | | | | | | |
Energy 0.2% | | | | | | | | | | |
e,i,l ATP Oil & Gas Corp., | | | | | | | | | | |
Additional NM Loans (DIP), PIK, 4.50%, 2/28/14 | | United States | | | 1,746 | | | | — | |
New Money (DIP), PIK, 4.50%, 2/28/14 | | United States | | | 12,370 | | | | — | |
Refinancing Loan (DIP), PIK, 4.50%, 2/28/14 | | United States | | | 26,414 | | | | — | |
Bennu Oil & Gas LLC, Second Lien Loans, 10.25%, 11/01/18 | | United States | | | 341,552 | | | | 344,683 | |
Bowie Resource Holdings LLC, 2nd Lien Initial Term Loan, 11.75%, 2/16/21 | | United States | | | 285,714 | | | | 280,000 | |
Pacific Drilling SA, Term Loan, 4.50%, 6/03/18 | | Luxembourg | | | 1,069,341 | | | | 1,082,262 | |
| | | | | | | | | | |
| | | | | | | | | 1,706,945 | |
| | | | | | | �� | | | |
Food & Staples Retailing 0.1% | | | | | | | | | | |
AdvancePierre Foods Inc., Second Lien Term Loan, 9.50%, 10/10/17 | | United States | | | 1,619,009 | | | | 1,570,439 | |
| | | | | | | | | | |
Food, Beverage & Tobacco 0.5% | | | | | | | | | | |
k Del Monte Foods Co., Initial Term Loans, 4.00%, 3/08/18 | | United States | | | 4,825,677 | | | | 4,845,047 | |
| | | | | | | | | | |
Health Care Equipment & Services 1.0% | | | | | | | | | | |
Carestream Health Inc., Second Lien Loan, 9.50%, 12/07/19 | | United States | | | 660,000 | | | | 670,725 | |
Community Health Systems Inc., New Extended Term Loan, 3.737% - 3.747%, 1/25/17 | | United States | | | 5,281,206 | | | | 5,327,417 | |
DaVita HealthCare Partners Inc., | | | | | | | | | | |
Tranche B Term Loan, 4.50%, 10/20/16 | | United States | | | 2,633,171 | | | | 2,655,800 | |
Tranche B-2 Term Loan, 4.00%, 8/24/19 | | United States | | | 1,124,235 | | | | 1,133,369 | |
| | | | | | | | | | |
| | | | | | | | | 9,787,311 | |
| | | | | | | | | | |
FSI-19
Franklin Templeton Variable Insurance Products Trust
Statement of Investments, December 31, 2013 (continued)
| | | | | | | | | | |
| Franklin Strategic Income Securities Fund | | Country | | Principal
Amount* | | | Value | |
h,jSenior Floating Rate Interests (continued) | | | | | | | | | | |
Household & Personal Products 0.4% | | | | | | | | | | |
k FGI Operating Co. LLC (Freedom Group), Term B Loans, 6.50%, 4/19/19 | | United States | | | 2,512,031 | | | $ | 2,540,291 | |
k Otter Products LLC, Loans, 5.25%, 4/29/19 | | United States | | | 1,132,663 | | | | 1,134,787 | |
| | | | | | | | | | |
| | | | | | | | | 3,675,078 | |
| | | | | | | | | | |
Materials 2.7% | | | | | | | | | | |
k American Rock Salt Co. LLC, Initial Loan, 4.75%, 4/25/17 | | United States | | | 2,145,790 | | | | 2,158,665 | |
Arysta Lifescience SPC LLC, | | | | | | | | | | |
Initial Term Loan, 4.50%, 5/29/20 | | United States | | | 2,942,573 | | | | 2,965,255 | |
k Second Lien Initial Term Loan, 8.25%, 11/30/20 | | United States | | | 1,911,853 | | | | 1,947,079 | |
Axalta Coating Systems U.S. Holdings Inc., Initial Term B Loans, 4.75%, 2/01/20 | | United States | | | 2,925,830 | | | | 2,950,617 | |
k Exopack Holdings SA, USD Term Loan, 5.25%, 5/08/19 | | Luxembourg | | | 717,457 | | | | 731,358 | |
FMG America Finance Inc. (Fortescue Metals Group), Loans, 4.25%, 6/30/19 | | United States | | | 904,909 | | | | 918,671 | |
Ineos U.S. Finance LLC, Dollar Term Loan, 4.00%, 5/04/18 | | United States | | | 1,548,391 | | | | 1,555,285 | |
k MacDermid Inc. LLC, First Lien Tranche B Term Loan, 4.00%, 6/07/20 | | United States | | | 2,108,659 | | | | 2,125,792 | |
OCI Beaumont LLC, Term B-2 Loans, 6.25%, 8/20/19 | | United States | | | 531,155 | | | | 538,458 | |
Oxbow Carbon LLC, First Lien Tranche B Term Loan, 4.25%, 7/19/19 | | United States | | | 1,147,546 | | | | 1,156,869 | |
OXEA GmbH, Second Lien Term Loan, 8.25%, 7/15/20 | | Luxembourg | | | 765,404 | | | | 778,799 | |
Reynolds Group Holdings Inc., U.S. Term Loan, 4.00%, 12/01/18 | | United States | | | 2,902,487 | | | | 2,931,512 | |
Road Infrastructure Investment LLC (Ennis Flint), Second Lien Term Loan, 10.25%, 9/30/18 | | United States | | | 5,522,220 | | | | 5,591,248 | |
Tronox Pigments (Netherlands) BV, Term Loan, 4.50%, 3/19/20 | | Netherlands | | | 1,103,588 | | | | 1,119,452 | |
| | | | | | | | | | |
| | | | | | | | | 27,469,060 | |
| | | | | | | | | | |
Media 0.4% | | | | | | | | | | |
k Cumulus Media Holdings Inc., Term Loans, 5.50%, 12/23/20 | | United States | | | 351,900 | | | | 354,979 | |
Entravision Communications Corp., Tranche B Term Loans, 3.50%, 5/31/20 | | United States | | | 1,013,307 | | | | 1,002,858 | |
NEP/NCP Holdco Inc., Second Lien Term Loan, 9.50%, 7/22/20 | | United States | | | 299,222 | | | | 308,198 | |
Radio One Inc., Term Loan, 7.50%, 3/31/16 | | United States | | | 252,127 | | | | 258,982 | |
UPC Financing Partnership, Facility AF, 4.00%, 1/31/21 | | Netherlands | | | 736,600 | | | | 741,511 | |
WMG Acquisition Corp., Tranche B Term Loan, 3.75%, 7/01/20 | | United States | | | 637,523 | | | | 639,317 | |
k Zuffa LLC, Initial Term Loan, 4.50%, 2/25/20 | | United States | | | 383,740 | | | | 387,455 | |
| | | | | | | | | | |
| | | | | | | | | 3,693,300 | |
| | | | | | | | | | |
Pharmaceuticals, Biotechnology & Life Sciences 0.1% | | | | | | | | | | |
Aptalis Pharma Inc. (Axcan), Term B Loans, 6.00%, 10/04/20 | | United States | | | 914,109 | | | | 931,249 | |
Valeant Pharmaceuticals International Inc., Series E Tranche B Term Loan, 4.50%, 8/05/20 | | Canada | | | 277,900 | | | | 280,071 | |
| | | | | | | | | | |
| | | | | | | | | 1,211,320 | |
| | | | | | | | | | |
Retailing 1.6% | | | | | | | | | | |
BJ’s Wholesale Club Inc., | | | | | | | | | | |
2013 (Nov) Replacement Loans, 4.50%, 9/26/19 | | United States | | | 4,281,652 | | | | 4,313,383 | |
Second Lien 2013 (Nov) Replacement Loans, 8.50%, 3/26/20 | | United States | | | 1,198,229 | | | | 1,225,788 | |
Evergreen AcqCo. 1 LP (Savers), Term Loan, 5.00%, 7/09/19 | | United States | | | 2,508,932 | | | | 2,523,421 | |
Harbor Freight Tools USA Inc., Loans, 4.75%, 7/26/19 | | United States | | | 999,631 | | | | 1,013,246 | |
Hudson's Bay Co., Initial Term Loan, 4.75%, 11/04/20 | | Canada | | | 791,072 | | | | 804,641 | |
k The Neiman Marcus Group Ltd. Inc., Term Loan, 5.00%, 10/25/20 | | United States | | | 548,566 | | | | 556,256 | |
Party City Holdings Inc., 2013 Replacement Term Loan, 4.25%, 7/27/19 | | United States | | | 3,215,685 | | | | 3,232,969 | |
Sears Roebuck Acceptance Corp., Term Loan, 5.50%, 6/30/18 | | United States | | | 2,638,659 | | | | 2,657,507 | |
| | | | | | | | | | |
| | | | | | | | | 16,327,211 | |
| | | | | | | | | | |
Software & Services 0.9% | | | | | | | | | | |
BMC Software Finance Inc., Initial U.S. Term Loans, 5.00%, 9/10/20 | | United States | | | 2,903,206 | | | | 2,922,434 | |
k MoneyGram International Inc., Term Loan, 4.25%, 3/28/20 | | United States | | | 4,023,777 | | | | 4,067,760 | |
Vertafore Inc., Second Lien Term Loan, 9.75%, 10/27/17 | | United States | | | 1,720,657 | | | | 1,754,640 | |
| | | | | | | | | | |
| | | | | | | | | 8,744,834 | |
| | | | | | | | | | |
FSI-20
Franklin Templeton Variable Insurance Products Trust
Statement of Investments, December 31, 2013 (continued)
| | | | | | | | | | |
| Franklin Strategic Income Securities Fund | | Country | | Principal
Amount* | | | Value | |
h,jSenior Floating Rate Interests (continued) | | | | | | | | | | |
Technology Hardware & Equipment 0.2% | | | | | | | | | | |
Dell International LLC, Term B Loan, 4.50%, 4/29/20 | | United States | | | 1,757,014 | | | $ | 1,763,603 | |
| | | | | | | | | | |
Telecommunication Services 0.5% | | | | | | | | | | |
k Intelsat Jackson Holdings SA, Tranche B-2 Term Loan, 3.75%, 6/30/19 | | Luxembourg | | | 5,119,849 | | | | 5,171,047 | |
| | | | | | | | | | |
Transportation 0.3% | | | | | | | | | | |
Delta Air Lines Inc., Second New Term Loan B, 3.50%, 4/20/17 | | United States | | | 726,938 | | | | 733,444 | |
Global Tip Finance BV/Finance America LLC, Facility C Commitment, 6.50%, 10/16/20 | | United States | | | 1,390,000 | | | | 1,355,250 | |
YRC Worldwide Inc., U.S. Tranche Term Loan, 10.50%, 3/21/15 | | United States | | | 998,014 | | | | 954,663 | |
| | | | | | | | | | |
| | | | | | | | | 3,043,357 | |
| | | | | | | | | | |
Total Senior Floating Rate Interests (Cost $119,947,177) | | | | | | | | | 121,225,333 | |
| | | | | | | | | | |
| | | |
| | | | | Shares | | | | |
Escrow and Litigation Trust 0.0% | | | | | | | | | | |
a,l Comfort Co. Inc., Escrow Account | | United States | | | 13,427 | | | | — | |
a,c,l NewPage Corp., Litigation Trust | | United States | | | 2,500,000 | | | | — | |
| | | | | | | | | | |
Total Escrow and Litigation Trust (Cost $—) | | | | | | | | | — | |
| | | | | | | | | | |
| | | |
| | | | | Principal
Amount* | | | | |
Foreign Government and Agency Securities 18.7% | | | | | | | | | | |
Government of Canada, | | | | | | | | | | |
2.25%, 8/01/14 | | Canada | | | 701,000 | CAD | | | 664,853 | |
1.00%, 11/01/14 | | Canada | | | 591,000 | CAD | | | 556,496 | |
2.00%, 12/01/14 | | Canada | | | 1,420,000 | CAD | | | 1,349,264 | |
1.00%, 5/01/15 | | Canada | | | 5,080,000 | CAD | | | 4,781,604 | |
Government of Hungary, | | | | | | | | | | |
5.50%, 2/12/16 | | Hungary | | | 1,864,700,000 | HUF | | | 8,946,567 | |
5.50%, 12/22/16 | | Hungary | | | 46,690,000 | HUF | | | 224,817 | |
6.50%, 6/24/19 | | Hungary | | | 206,000,000 | HUF | | | 1,030,574 | |
7.50%, 11/12/20 | | Hungary | | | 313,570,000 | HUF | | | 1,639,098 | |
5.375%, 2/21/23 | | Hungary | | | 1,020,000 | | | | 1,011,381 | |
A, 6.75%, 11/24/17 | | Hungary | | | 4,470,000 | HUF | | | 22,426 | |
A, 5.50%, 12/20/18 | | Hungary | | | 34,100,000 | HUF | | | 163,366 | |
A, 7.00%, 6/24/22 | | Hungary | | | 930,000 | HUF | | | 4,691 | |
A, 6.00%, 11/24/23 | | Hungary | | | 1,270,000 | HUF | | | 6,025 | |
senior note, 6.25%, 1/29/20 | | Hungary | | | 4,597,000 | | | | 4,973,379 | |
senior note, 6.375%, 3/29/21 | | Hungary | | | 1,550,000 | | | | 1,676,906 | |
d Government of Iceland, 144A, 5.875%, 5/11/22 | | Iceland | | | 3,480,000 | | | | 3,575,700 | |
Government of Indonesia, | | | | | | | | | | |
FR26, 11.00%, 10/15/14 | | Indonesia | | | 1,800,000,000 | IDR | | | 152,256 | |
FR34, 12.80%, 6/15/21 | | Indonesia | | | 17,235,000,000 | IDR | | | 1,759,776 | |
Government of Ireland, | | | | | | | | | | |
5.00%, 10/18/20 | | Ireland | | | 3,562,000 | EUR | | | 5,512,585 | |
senior bond, 5.00%, 3/13/25 | | Ireland | | | 2,883,710 | EUR | | | 4,516,365 | |
Government of Malaysia, | | | | | | | | | | |
3.434%, 8/15/14 | | Malaysia | | | 6,410,000 | MYR | | | 1,961,028 | |
3.741%, 2/27/15 | | Malaysia | | | 7,310,000 | MYR | | | 2,246,401 | |
3.835%, 8/12/15 | | Malaysia | | | 4,675,000 | MYR | | | 1,440,930 | |
4.72%, 9/30/15 | | Malaysia | | | 7,768,000 | MYR | | | 2,430,743 | |
3.197%, 10/15/15 | | Malaysia | | | 4,730,000 | MYR | | | 1,442,877 | |
senior bond, 3.814%, 2/15/17 | | Malaysia | | | 2,500,000 | MYR | | | 770,474 | |
senior bond, 4.24%, 2/07/18 | | Malaysia | | | 600,000 | MYR | | | 186,927 | |
FSI-21
Franklin Templeton Variable Insurance Products Trust
Statement of Investments, December 31, 2013 (continued)
| | | | | | | | | | |
| Franklin Strategic Income Securities Fund | | Country | | Principal
Amount* | | | Value | |
Foreign Government and Agency Securities (continued) | | | | | | | | | | |
Government of Mexico, | | | | | | | | | | |
7.00%, 6/19/14 | | Mexico | | | 192,800 | m MXN | | $ | 1,503,643 | |
9.50%, 12/18/14 | | Mexico | | | 679,620 | m MXN | | | 5,504,552 | |
6.00%, 6/18/15 | | Mexico | | | 18,020 | m MXN | | | 142,871 | |
8.00%, 12/17/15 | | Mexico | | | 573,560 | m MXN | | | 4,753,688 | |
6.25%, 6/16/16 | | Mexico | | | 199,310 | m MXN | | | 1,607,547 | |
7.25%, 12/15/16 | | Mexico | | | 360,330 | m MXN | | | 2,980,413 | |
Government of Poland, | | | | | | | | | | |
5.75%, 4/25/14 | | Poland | | | 26,520,000 | PLN | | | 8,875,128 | |
5.50%, 4/25/15 | | Poland | | | 7,018,000 | PLN | | | 2,406,962 | |
6.25%, 10/24/15 | | Poland | | | 9,134,000 | PLN | | | 3,206,337 | |
h FRN, 2.71%, 1/25/17 | | Poland | | | 1,660,000 | PLN | | | 548,070 | |
h FRN, 2.71%, 1/25/21 | | Poland | | | 1,683,000 | PLN | | | 544,503 | |
Strip, 5.00%, 1/25/14 | | Poland | | | 12,830,000 | PLN | | | 4,242,890 | |
Strip, 5.00%, 7/25/14 | | Poland | | | 295,000 | PLN | | | 96,434 | |
Strip, 5.00%, 7/25/15 | | Poland | | | 2,052,000 | PLN | | | 651,387 | |
Strip, 5.00%, 1/25/16 | | Poland | | | 1,066,000 | PLN | | | 332,141 | |
d Government of Serbia, senior note, 144A, | | | | | | | | | | |
4.875%, 2/25/20 | | Serbia | | | 4,410,000 | | | | 4,195,012 | |
7.25%, 9/28/21 | | Serbia | | | 1,820,000 | | | | 1,925,960 | |
Government of Sri Lanka, | | | | | | | | | | |
A, 7.00%, 3/01/14 | | Sri Lanka | | | 7,020,000 | LKR | | | 53,568 | |
A, 11.75%, 3/15/15 | | Sri Lanka | | | 1,160,000 | LKR | | | 9,182 | |
A, 6.50%, 7/15/15 | | Sri Lanka | | | 28,980,000 | LKR | | | 214,771 | |
A, 11.00%, 8/01/15 | | Sri Lanka | | | 116,400,000 | LKR | | | 920,205 | |
A, 6.40%, 8/01/16 | | Sri Lanka | | | 19,500,000 | LKR | | | 139,745 | |
A, 8.00%, 11/15/18 | | Sri Lanka | | | 70,220,000 | LKR | | | 498,898 | |
A, 9.00%, 5/01/21 | | Sri Lanka | | | 73,580,000 | LKR | | | 525,632 | |
B, 11.75%, 4/01/14 | | Sri Lanka | | | 6,990,000 | LKR | | | 53,873 | |
B, 6.60%, 6/01/14 | | Sri Lanka | | | 7,100,000 | LKR | | | 53,939 | |
B, 6.40%, 10/01/16 | | Sri Lanka | | | 16,000,000 | LKR | | | 114,135 | |
B, 8.50%, 7/15/18 | | Sri Lanka | | | 15,280,000 | LKR | | | 110,654 | |
C, 8.50%, 4/01/18 | | Sri Lanka | | | 8,070,000 | LKR | | | 58,898 | |
D, 8.50%, 6/01/18 | | Sri Lanka | | | 54,050,000 | LKR | | | 394,652 | |
Government of Sweden, 6.75%, 5/05/14 | | Sweden | | | 127,770,000 | SEK | | | 20,263,825 | |
Government of the Philippines, senior note, 6.25%, 1/27/14 | | Philippines | | | 129,180,000 | PHP | | | 2,917,878 | |
d Government of Ukraine, | | | | | | | | | | |
144A, 7.75%, 9/23/20 | | Ukraine | | | 3,850,000 | | | | 3,575,688 | |
senior bond, 144A, 7.80%, 11/28/22 | | Ukraine | | | 2,790,000 | | | | 2,531,925 | |
senior note, 144A, 7.95%, 2/23/21 | | Ukraine | | | 2,120,000 | | | | 1,967,625 | |
senior note, 144A, 7.50%, 4/17/23 | | Ukraine | | | 2,945,000 | | | | 2,668,906 | |
n Government of Uruguay, senior bond, Index Linked, 4.375%, 12/15/28 | | Uruguay | | | 147,179,883 | UYU | | | 7,120,517 | |
d Government of Vietnam, 144A, 6.75%, 1/29/20 | | Vietnam | | | 1,045,000 | | | | 1,135,131 | |
Korea Monetary Stabilization Bond,
senior bond, 3.47%, 2/02/14 | | South Korea | | | 2,916,950,000 | KRW | | | 2,764,994 | |
senior bond, 3.59%, 4/02/14 | | South Korea | | | 4,287,030,000 | KRW | | | 4,071,019 | |
senior bond, 2.47%, 4/02/15 | | South Korea | | | 4,622,600,000 | KRW | | | 4,366,399 | |
senior bond, 2.80%, 8/02/15 | | South Korea | | | 1,324,510,000 | KRW | | | 1,255,999 | |
senior note, 3.28%, 6/02/14 | | South Korea | | | 5,082,540,000 | KRW | | | 4,827,384 | |
senior note, 2.57%, 6/09/14 | | South Korea | | | 648,000,000 | KRW | | | 613,715 | |
senior note, 2.82%, 8/02/14 | | South Korea | | | 509,400,000 | KRW | | | 483,057 | |
senior note, 2.78%, 10/02/14 | | South Korea | | | 2,030,900,000 | KRW | | | 1,925,454 | |
senior note, 2.84%, 12/02/14 | | South Korea | | | 841,710,000 | KRW | | | 798,635 | |
FSI-22
Franklin Templeton Variable Insurance Products Trust
Statement of Investments, December 31, 2013 (continued)
| | | | | | | | | | |
| Franklin Strategic Income Securities Fund | | Country | | Principal
Amount* | | | Value | |
Foreign Government and Agency Securities (continued) | | | | | | | | | | |
Korea Monetary Stabilization Bond, (continued) | | | | | | | | | | |
senior note, 2.74%, 2/02/15 | | South Korea | | | 117,220,000 | KRW | | $ | 111,092 | |
senior note, 2.76%, 6/02/15 | | South Korea | | | 5,045,300,000 | KRW | | | 4,781,519 | |
Korea Treasury Bond,
senior bond, 3.50%, 6/10/14 | | South Korea | | | 2,788,920,000 | KRW | | | 2,652,077 | |
senior note, 3.25%, 12/10/14 | | South Korea | | | 1,261,950,000 | KRW | | | 1,201,944 | |
senior note, 3.25%, 6/10/15 | | South Korea | | | 210,800,000 | KRW | | | 201,140 | |
senior note, 2.75%, 12/10/15 | | South Korea | | | 897,900,000 | KRW | | | 850,154 | |
senior note, 3.00%, 12/10/16 | | South Korea | | | 3,000,000,000 | KRW | | | 2,854,903 | |
Nota Do Tesouro Nacional, | | | | | | | | | | |
10.00%, 1/01/17 | | Brazil | | | 1,200 | o BRL | | | 480,748 | |
p Index Linked, 6.00%, 5/15/15 | | Brazil | | | 1,390 | o BRL | | | 1,416,218 | |
p Index Linked, 6.00%, 8/15/16 | | Brazil | | | 1,604 | o BRL | | | 1,619,429 | |
p Index Linked, 6.00%, 8/15/18 | | Brazil | | | 1,525 | o BRL | | | 1,519,562 | |
d Russia Foreign Bond, senior bond, 144A, 7.50%, 3/31/30 | | Russia | | | 1,859,715 | | | | 2,170,334 | |
Uruguay Notas del Tesoro, | | | | | | | | | | |
9.00%, 1/27/14 | | Uruguay | | | 7,570,000 | UYU | | | 350,814 | |
10.50%, 3/21/15 | | Uruguay | | | 1,700,000 | UYU | | | 76,336 | |
10.25%, 8/22/15 | | Uruguay | | | 59,720,000 | UYU | | | 2,641,404 | |
9.50%, 1/27/16 | | Uruguay | | | 9,220,000 | UYU | | | 392,537 | |
n 18, Index Linked, 2.25%, 8/23/17 | | Uruguay | | | 24,212,743 | UYU | | | 1,025,626 | |
Uruguay Treasury Bill, Strip, 5.00%, | | | | | | | | | | |
7/02/15 | | Uruguay | | | 510,000 | UYU | | | 19,384 | |
8/20/15 | | Uruguay | | | 65,364,000 | UYU | | | 2,445,453 | |
| | | | | | | | | | |
Total Foreign Government and Agency Securities
(Cost $185,601,846) | | | | | | | | | 189,812,024 | |
| | | | | | | | | | |
U.S. Government and Agency Securities 2.1% | | | | | | | | | | |
U.S. Treasury Bond, | | | | | | | | | | |
4.50%, 2/15/16 | | United States | | | 3,000,000 | | | | 3,259,686 | |
7.875%, 2/15/21 | | United States | | | 900,000 | | | | 1,223,578 | |
7.125%, 2/15/23 | | United States | | | 1,980,000 | | | | 2,667,199 | |
U.S. Treasury Note, | | | | | | | | | | |
4.625%, 2/15/17 | | United States | | | 600,000 | | | | 669,258 | |
4.75%, 8/15/17 | | United States | | | 2,900,000 | | | | 3,275,979 | |
3.75%, 11/15/18 | | United States | | | 7,000,000 | | | | 7,679,490 | |
n Index Linked, 0.125%, 4/15/16 | | United States | | | 2,433,747 | | | | 2,500,675 | |
| | | | | | | | | | |
Total U.S. Government and Agency Securities
(Cost $20,252,931) | | | | | | | | | 21,275,865 | |
| | | | | | | | | | |
Asset-Backed Securities and Commercial Mortgage-Backed Securities 4.1% | | | | | | | | | | |
Banks 2.4% | | | | | | | | | | |
Banc of America Commercial Mortgage Trust, 2006-4, AJ, 5.695%, 7/10/46 | | United States | | | 1,807,000 | | | | 1,865,912 | |
Bear Stearns Commercial Mortgage Securities Inc., | | | | | | | | | | |
h 2006-PW11, AJ, FRN, 5.452%, 3/11/39 | | United States | | | 500,000 | | | | 520,117 | |
h 2006-PW12, AJ, FRN, 5.932%, 9/11/38 | | United States | | | 1,440,000 | | | | 1,509,714 | |
2006-PW13, AJ, 5.611%, 9/11/41 | | United States | | | 5,100,000 | | | | 5,201,291 | |
Citigroup Commercial Mortgage Trust, | | | | | | | | | | |
2006-C5, AJ, 5.482%, 10/15/49 | | United States | | | 1,700,000 | | | | 1,671,831 | |
h 2007-C6, AM, FRN, 5.885%, 6/10/17 | | United States | | | 4,900,000 | | | | 5,409,740 | |
h Citigroup/Deutsche Bank Commercial Mortgage Trust, 2006-CD3, AJ, FRN, | | | | | | | | | | |
5.688%, 10/15/48 | | United States | | | 2,120,000 | | | | 1,987,065 | |
FSI-23
Franklin Templeton Variable Insurance Products Trust
Statement of Investments, December 31, 2013 (continued)
| | | | | | | | | | |
| Franklin Strategic Income Securities Fund | | Country | | Principal
Amount* | | | Value | |
Asset-Backed Securities and Commercial Mortgage-Backed Securities (continued) | | | | | | | | | | |
Banks (continued) | | | | | | | | | | |
Countrywide Asset-Backed Certificates, 2005-11, AF4, 5.192%, 3/25/34 | | United States | | | 1,275,000 | | | $ | 1,082,564 | |
h Greenwich Capital Commercial Funding Corp., 2006-GG7, AJ, FRN, 5.867%, 7/10/38 | | United States | | | 2,560,000 | | | | 2,635,971 | |
h Morgan Stanley Capital I Trust, 2006-HQ8, AJ, FRN, 5.68%, 3/12/44 | | United States | | | 200,000 | | | | 205,934 | |
Wells Fargo Mortgage Backed Securities Trust, | | | | | | | | | | |
h 2004-W, A9, FRN, 2.762%, 11/25/34 | | United States | | | 1,458,281 | | | | 1,488,237 | |
2007-3, 3A1, 5.50%, 4/25/37 | | United States | | | 614,273 | | | | 635,085 | |
| | | | | | | | | | |
| | | | | | | | | 24,213,461 | |
| | | | | | | | | | |
Diversified Financials 1.7% | | | | | | | | | | |
d,h ARES CLO Funds, 2007-12A, B, 144A, FRN, 1.238%, 11/25/20 | | United States | | | 1,380,000 | | | | 1,328,705 | |
d,h Atrium CDO Corp., 10A, C, 144A, FRN, 2.876%, 7/16/25 | | United States | | | 1,400,000 | | | | 1,357,229 | |
d,h Catamaran CLO Ltd., 2013-1A, C, 144A, FRN, 3.071%, 1/27/25 | | Cayman Islands | | | 1,130,000 | | | | 1,092,917 | |
d,h Cent CDO Ltd., 2007-15A, A2B, 144A, FRN, 0.583%, 3/11/21 | | United States | | | 1,251,000 | | | | 1,194,167 | |
d,h Cent CLO LP, 2013-17A, D, 144A, FRN, 3.236%, 1/30/25 | | Cayman Islands | | | 784,314 | | | | 779,306 | |
d,h CIFC Funding Ltd., 2007-3A, A1J, 144A, FRN, 0.638%, 7/26/21 | | United States | | | 960,000 | | | | 926,482 | |
d,h Columbus Nova CLO Ltd., 2007-2A, A2, 144A, FRN, 1.244%, 10/15/21 | | United States | | | 860,000 | | | | 839,983 | |
d,h CT CDO IV Ltd., 2006-4A, A1, 144A, FRN, 0.477%, 10/20/43 | | United States | | | 1,806,864 | | | | 1,717,406 | |
d G-Force LLC, 2005-RRA, C, 144A, 5.20%, 8/22/36 | | United States | | | 2,000,000 | | | | 1,858,580 | |
d,h ING Investment Management CLO Ltd., | | | | | | | | | | |
2013-1A, B, 144A, FRN, 3.144%, 4/15/24 | | Cayman Islands | | | 270,000 | | | | 265,516 | |
2013-1A, C, 144A, FRN, 3.744%, 4/15/24 | | Cayman Islands | | | 440,000 | | | | 428,596 | |
2013-2A, B, 144A, FRN, 2.918%, 4/25/25 | | United States | | | 1,080,000 | | | | 1,056,851 | |
d,h Newcastle CDO Ltd., 2004-5A, 1, 144A, FRN, 0.588%, 12/24/39 | | United States | | | 1,318,369 | | | | 1,269,221 | |
Residential Asset Securities Corp., 2004-KS1, AI4, 4.213%, 4/25/32 | | United States | | | 56,269 | | | | 56,245 | |
h,q Talisman 6 Finance, Reg S, FRN, 0.404%, 10/22/16 | | Ireland | | | 2,288,970 | EUR | | | 2,963,505 | |
| | | | | | | | | | |
| | | | | | | | | 17,134,709 | |
| | | | | | | | | | |
Total Asset-Backed Securities and Commercial Mortgage-Backed Securities (Cost $38,794,159) | | | | | | | | | 41,348,170 | |
| | | | | | | | | | |
Mortgage-Backed Securities 4.4% | | | | | | | | | | |
hFederalHome Loan Mortgage Corp. (FHLMC) Adjustable Rate 0.0%† | | | | | | | | |
FHLMC, 2.459%, 1/01/33 | | United States | | | 71,498 | | | | 75,197 | |
| | | | | | | | | | |
Federal Home Loan Mortgage Corp. (FHLMC) Fixed Rate 0.7% | | | | | | | | | | |
FHLMC Gold 15 Year, 4.50%, 10/01/18 - 6/01/19 | | United States | | | 507,451 | | | | 538,828 | |
FHLMC Gold 15 Year, 5.00%, 12/01/17 - 9/01/19 | | United States | | | 721,106 | | | | 765,091 | |
FHLMC Gold 15 Year, 5.50%, 7/01/17 - 7/01/19 | | United States | | | 129,330 | | | | 138,531 | |
FHLMC Gold 15 Year, 6.00%, 5/01/17 | | United States | | | 6,516 | | | | 6,895 | |
FHLMC Gold 15 Year, 6.50%, 5/01/16 | | United States | | | 1,046 | | | | 1,085 | |
FHLMC Gold 30 Year, 3.00%, 11/01/42 | | United States | | | 2,712,538 | | | | 2,578,092 | |
FHLMC Gold 30 Year, 3.50%, 4/01/42 | | United States | | | 160,738 | | | | 159,970 | |
FHLMC Gold 30 Year, 5.00%, 4/01/34 - 8/01/35 | | United States | | | 514,824 | | | | 557,789 | |
FHLMC Gold 30 Year, 5.50%, 3/01/33 - 6/01/36 | | United States | | | 1,497,824 | | | | 1,652,146 | |
FHLMC Gold 30 Year, 6.00%, 4/01/33 - 2/01/36 | | United States | | | 427,535 | | | | 477,704 | |
FHLMC Gold 30 Year, 6.50%, 12/01/23 - 6/01/36 | | United States | | | 94,192 | | | | 105,755 | |
FHLMC Gold 30 Year, 7.00%, 9/01/21 - 4/01/30 | | United States | | | 38,566 | | | | 42,594 | |
FHLMC Gold 30 Year, 7.50%, 3/01/30 - 7/01/31 | | United States | | | 1,511 | | | | 1,641 | |
| | | | | | | | | | |
| | | | | | | | | 7,026,121 | |
| | | | | | | | | | |
h Federal National Mortgage Association (FNMA) Adjustable Rate 0.0%† | | | | | | | | |
FNMA, 2.31% - 2.33%, 4/01/20 - 12/01/34 | | United States | | | 253,712 | | | | 268,065 | |
| | | | | | | | | | |
FSI-24
Franklin Templeton Variable Insurance Products Trust
Statement of Investments, December 31, 2013 (continued)
| | | | | | | | | | |
| Franklin Strategic Income Securities Fund | | Country | | Principal
Amount* | | | Value | |
Mortgage-Backed Securities (continued) | | | | | | | | | | |
Federal National Mortgage Association (FNMA) Fixed Rate 3.3% | | | | | | | | | | |
FNMA 15 Year, 2.50%, 7/01/22 - 6/01/27 | | United States | | | 695,017 | | | $ | 693,149 | |
FNMA 15 Year, 3.00%, 10/01/27 - 11/01/27 | | United States | | | 8,447,420 | | | | 8,651,681 | |
FNMA 15 Year, 3.50%, 1/01/26 | | United States | | | 404,610 | | | | 424,136 | |
FNMA 15 Year, 4.50%, 6/01/19 - 3/01/20 | | United States | | | 160,970 | | | | 171,581 | |
FNMA 15 Year, 5.00%, 10/01/17 - 6/01/18 | | United States | | | 141,931 | | | | 151,408 | |
FNMA 15 Year, 5.50%, 9/01/14 - 11/01/18 | | United States | | | 878,488 | | | | 935,060 | |
FNMA 15 Year, 6.00%, 4/01/16 - 7/01/16 | | United States | | | 1,452 | | | | 1,470 | |
FNMA 30 Year, 3.00%, 12/01/42 - 5/01/43 | | United States | | | 4,828,549 | | | | 4,598,101 | |
FNMA 30 Year, 3.50%, 5/01/43 | | United States | | | 3,839,808 | | | | 3,825,519 | |
FNMA 30 Year, 4.00%, 2/01/41 | | United States | | | 8,879,312 | | | | 9,151,391 | |
FNMA 30 Year, 5.00%, 4/01/30 - 9/01/39 | | United States | | | 2,121,002 | | | | 2,329,860 | |
FNMA 30 Year, 5.50%, 8/01/33 - 9/01/35 | | United States | | | 828,045 | | | | 912,436 | |
FNMA 30 Year, 6.00%, 6/01/34 - 5/01/38 | | United States | | | 1,211,089 | | | | 1,356,622 | |
FNMA 30 Year, 6.50%, 6/01/28 - 10/01/37 | | United States | | | 572,173 | | | | 637,279 | |
| | | | | | | | | | |
| | | | | | | | | 33,839,693 | |
| | | | | | | | | | |
Government National Mortgage Association (GNMA) Fixed Rate 0.4% | | | | | | | | | | |
GNMA I SF 30 Year, 5.00%, 11/15/33 - 7/15/34 | | United States | | | 520,056 | | | | 569,044 | |
GNMA I SF 30 Year, 5.50%, 12/15/32 - 6/15/36 | | United States | | | 767,757 | | | | 848,131 | |
GNMA I SF 30 Year, 6.50%, 2/15/32 | | United States | | | 2,234 | | | | 2,497 | |
GNMA I SF 30 Year, 7.00%, 10/15/28 - 6/15/32 | | United States | | | 40,035 | | | | 42,896 | |
GNMA I SF 30 Year, 7.50%, 9/15/30 | | United States | | | 1,689 | | | | 1,949 | |
GNMA II SF 30 Year, 3.50%, 5/20/42 | | United States | | | 1,445,534 | | | | 1,461,052 | |
GNMA II SF 30 Year, 5.00%, 9/20/33 - 11/20/33 | | United States | | | 158,620 | | | | 174,034 | |
GNMA II SF 30 Year, 6.00%, 11/20/34 | | United States | | | 185,274 | | | | 210,056 | |
GNMA II SF 30 Year, 6.50%, 4/20/31 - 2/20/34 | | United States | | | 83,040 | | | | 93,424 | |
GNMA II SF 30 Year, 7.50%, 1/20/28 - 4/20/32 | | United States | | | 20,743 | | | | 24,104 | |
| | | | | | | | | | |
| | | | | | | | | 3,427,187 | |
| | | | | | | | | | |
Total Mortgage-Backed Securities (Cost $44,876,669) | | | | | | | | | 44,636,263 | |
| | | | | | | | | | |
Municipal Bonds 5.6% | | | | | | | | | | |
Arkansas State GO, Four-Lane Highway Construction and Improvement Bonds, 3.25%, 6/15/22 | | United States | | | 1,300,000 | | | | 1,327,651 | |
California State GO, Various Purpose, | | | | | | | | | | |
6.00%, 4/01/38 | | United States | | | 2,500,000 | | | | 2,775,425 | |
6.00%, 11/01/39 | | United States | | | 160,000 | | | | 178,946 | |
5.25%, 11/01/40 | | United States | | | 560,000 | | | | 595,582 | |
Refunding, 5.25%, 3/01/38 | | United States | | | 1,500,000 | | | | 1,549,635 | |
Refunding, 5.00%, 4/01/38 | | United States | | | 3,000,000 | | | | 3,058,320 | |
Refunding, NATL Insured, 4.50%, 12/01/32 | | United States | | | 300,000 | | | | 299,988 | |
Refunding, Series 1, AGMC Insured, 4.75%, 9/01/31 | | United States | | | 290,000 | | | | 299,303 | |
Colorado State ISD, GO, Mitchell and Scurry Counties, Unlimited Tax School Building Bonds, PSF Guarantee, 5.00%, 8/15/43 | | United States | | | 300,000 | | | | 312,066 | |
Evanville Local Public Improvement Bond Bank Revenue, Sewer Works Project, Series A, 5.00%, 7/01/36 | | United States | | | 675,000 | | | | 697,511 | |
Florida Hurricane Catastrophe Fund Finance Corp. Revenue, Series A, 2.995%, 7/01/20 | | United States | | | 4,700,000 | | | | 4,453,109 | |
Hawaii State GO, Series EH, 5.00%, 8/01/30 | | United States | | | 700,000 | | | | 765,716 | |
Illinois State GO, | | | | | | | | | | |
5.877%, 3/01/19 | | United States | | | 3,000,000 | | | | 3,279,060 | |
Build America Bonds, 7.35%, 7/01/35 | | United States | | | 1,000,000 | | | | 1,101,930 | |
FSI-25
Franklin Templeton Variable Insurance Products Trust
Statement of Investments, December 31, 2013 (continued)
| | | | | | | | | | |
| Franklin Strategic Income Securities Fund | | Country | | Principal
Amount* | | | Value | |
Municipal Bonds (continued) | | | | | | | | | | |
Kansas State Development Finance Authority Revenue, Wichita State University Union Corp. Student Housing Project, Refunding, Series F-1, | | | | | | | | | | |
5.25%, 6/01/38 | | United States | | | 820,000 | | | $ | 848,921 | |
5.25%, 6/01/42 | | United States | | | 800,000 | | | | 824,176 | |
5.00%, 6/01/46 | | United States | | | 1,000,000 | | | | 998,360 | |
Marco Island Utility System Revenue, Refunding, 4.625%, | | | | | | | | | | |
10/01/30 | | United States | | | 350,000 | | | | 358,950 | |
10/01/31 | | United States | | | 325,000 | | | | 330,977 | |
k Massachusetts State GO, Series A, 4.50%, 12/01/43 | | United States | | | 2,300,000 | | | | 2,219,270 | |
Metropolitan Boston Transit Parking Corp. Systemwide Parking Revenue, senior lien, 5.00%, 7/01/41 | | United States | | | 500,000 | | | | 511,270 | |
Minnesota State GO, Various Purpose, Refunding, Series F, 4.00%, 10/01/24 | | United States | | | 2,650,000 | | | | 2,851,479 | |
Mississippi State GO, Series B, 5.00%, 12/01/31 | | United States | | | 780,000 | | | | 849,280 | |
Nassau County GO, General Improvement Bonds, Series B, 5.00%, | | | | | | | | | | |
4/01/39 | | United States | | | 1,500,000 | | | | 1,512,045 | |
4/01/43 | | United States | | | 1,600,000 | | | | 1,594,992 | |
New Jersey EDA Revenue, School Facilities Construction, Refunding, Series NN, 5.00%, 3/01/30 | | United States | | | 700,000 | | | | 730,254 | |
New York City HDC Revenue, Series B1, 5.00%, 7/01/33 | | United States | | | 500,000 | | | | 514,070 | |
New York City Municipal Water Finance Authority Water and Sewer System Revenue, Second General Resolution, Fiscal 2014, Refunding, Series BB, 5.00%, 6/15/46 | | United States | | | 2,430,000 | | | | 2,481,322 | |
New York GO, Sub. Series G-1, 5.00%, 4/01/27 | | United States | | | 1,750,000 | | | | 1,899,922 | |
New York State Urban Development Corp. Revenue, State Personal Income Tax, General Purpose, Series C, 5.00%, 3/15/29 | | United States | | | 1,500,000 | | | | 1,625,145 | |
Puerto Rico Electric Power Authority Power Revenue, | | | | | | | | | | |
Series A, 6.75%, 7/01/36 | | United States | | | 3,465,000 | | | | 2,495,112 | |
Series XX, 5.25%, 7/01/40 | | United States | | | 165,000 | | | | 103,146 | |
Puerto Rico Sales Tax FICO Sales Tax Revenue, | | | | | | | | | | |
first subordinate, Series A, 5.75%, 8/01/37 | | United States | | | 1,000,000 | | | | 741,980 | |
first subordinate, Series A, 6.50%, 8/01/44 | | United States | | | 2,500,000 | | | | 1,982,275 | |
Refunding, Series A, NATL RE, FGIC Insured, zero cpn., 8/01/45 | | United States | | | 3,700,000 | | | | 409,923 | |
Refunding, Series B, 6.05%, 8/01/37 | | United States | | | 915,000 | | | | 713,435 | |
Refunding, Series B, 6.05%, 8/01/38 | | United States | | | 1,120,000 | | | | 866,992 | |
Red River Education Financing Corp. Education Revenue, Higher Education, Texas Christian University, 5.00%, 3/15/43 | | United States | | | 625,000 | | | | 636,019 | |
South Carolina State Public Service Authority Revenue, Refunding, Series B, 5.00%, 12/01/38 | | United States | | | 1,000,000 | | | | 1,008,510 | |
University of California Revenues, General, Series AK, 5.00%, 5/15/48 | | United States | | | 4,320,000 | | | | 5,004,979 | |
Washington State GO, Various Purpose, | | | | | | | | | | |
Refunding, Series R-C, 5.00%, 7/01/24 | | United States | | | 900,000 | | | | 1,035,720 | |
Series D, 5.00%, 2/01/23 | | United States | | | 775,000 | | | | 890,235 | |
| | | | | | | | | | |
Total Municipal Bonds (Cost $56,887,739) | | | | | | | | | 56,733,001 | |
| | | | | | | | | | |
Total Investments before Short Term Investments
(Cost $853,104,836) | | | | | | | | | 882,820,785 | |
| | | | | | | | | | |
Short Term Investments 11.7% | | | | | | | | | | |
h,j Senior Floating Rate Interests (Cost $2,011) 0.0%† | | | | | | | | | | |
r Patriot Coal Corp., Reimbursement Obligation, 9.50%, 1/17/14 | | United States | | | 2,044 | | | | 2,044 | |
| | | | | | | | | | |
Foreign Government and Agency Securities 3.1% | | | | | | | | | | |
s Bank of Negara Monetary Notes, 1/09/14 - 11/06/14 | | Malaysia | | | 30,559,000 | MYR | | | 9,226,160 | |
Korea Monetary Stabilization Bond, senior bond, 2.55%, 5/09/14 | | South Korea | | | 1,050,200,000 | KRW | | | 994,623 | |
s Malaysia Treasury Bill, 5/30/14 | | Malaysia | | | 590,000 | MYR | | | 177,801 | |
FSI-26
Franklin Templeton Variable Insurance Products Trust
Statement of Investments, December 31, 2013 (continued)
| | | | | | | | | | |
| Franklin Strategic Income Securities Fund | | Country | | Principal
Amount* | | | Value | |
Foreign Government and Agency Securities (continued) | | | | | | | | | | |
s Mexico Treasury Bills, 1/09/14 - 4/30/14 | | Mexico | | | 4,937,100 | t MXN | | $ | 3,765,406 | |
s Monetary Authority of Singapore Treasury Bill, 2/03/14 | | Singapore | | | 400,000 | SGD | | | 316,950 | |
s Philippine Treasury Bills, 3/05/14 - 11/05/14 | | Philippines | | | 365,300,000 | PHP | | | 8,208,552 | |
s Singapore Treasury Bills, 1/10/14 - 5/30/14 | | Singapore | | | 10,009,000 | SGD | | | 7,926,708 | |
s Uruguay Treasury Bills, 5/16/14 - 8/29/14 | | Uruguay | | | 8,648,000 | UYU | | | 367,770 | |
| | | | | | | | | | |
Total Foreign Government and Agency Securities
(Cost $31,948,897) | | | | | | | | | 30,983,970 | |
| | | | | | | | | | |
Total Investments before Money Market Funds
(Cost $885,055,744) | | | | | | | | | 913,806,799 | |
| | | | | | | | | | |
| | | |
| | | | | Shares | | | | |
Money Market Funds (Cost $87,788,340) 8.6% | | | | | | | | | | |
a,u Institutional Fiduciary Trust Money Market Portfolio | | United States | | | 87,788,340 | | | | 87,788,340 | |
| | | | | | | | | | |
Total Investments (Cost $972,844,084) 98.6% | | | | | | | | | 1,001,595,139 | |
Other Assets, less Liabilities 1.4% | | | | | | | | | 14,174,980 | |
| | | | | | | | | | |
Net Assets 100.0% | | | | | | | | $ | 1,015,770,119 | |
| | | | | | | | | | |
See Abbreviations on page FSI-49.
†Rounds to less than 0.1% of net assets.
*The principal amount is stated in U.S. dollars unless otherwise indicated.
aNon-income producing.
bThe security is owned by FT Holdings Corporation III, a wholly-owned subsidiary of the Fund. See Note 1(g).
cAt December 31, 2013, pursuant to the Fund’s policies and the requirements of applicable securities law, the Fund may be restricted from trading these securities for a limited or extended period of time due to ownership limits and/or potential possession of material non-public information.
dSecurity was purchased pursuant to Rule 144A under the Securities Act of 1933 and may be sold in transactions exempt from registration only to qualified institutional buyers or in a public offering registered under the Securities Act of 1933. These securities have been deemed liquid under guidelines approved by the Trust’s Board of Trustees. At December 31, 2013, the aggregate value of these securities was $203,737,808, representing 20.06% of net assets.
eSee Note 8 regarding defaulted securities.
fPerpetual security with no stated maturity date.
gSee Note 1(f) regarding loan participation notes.
hThe coupon rate shown represents the rate at period end.
iIncome may be received in additional securities and/or cash.
jSee Note 1(i) regarding senior floating rate interests.
kA portion or all of the security purchased on a when-issued or delayed delivery basis. See Note 1(c).
lSecurity has been deemed illiquid because it may not be able to be sold within seven days. At December 31, 2013, the aggregate value of these securities was $178,471, representing 0.02% of net assets.
mPrincipal amount is stated in 100 Mexican Peso Units.
nPrincipal amount of security is adjusted for inflation. See Note 1(k).
oPrincipal amount is stated in 1,000 Brazilian Real Units.
pRedemption price at maturity is adjusted for inflation. See Note 1(k).
qSecurity was purchased pursuant to Regulation S under the Securities Act of 1933, which exempts from registration securities offered and sold outside of the United States. Such a security cannot be sold in the United States without either an effective registration statement filed pursuant to the Securities Act of 1933, or pursuant to an exemption from registration. This security has been deemed liquid under guidelines approved by the Trust’s Board of Trustees. At December 31, 2013, the value of this security was $2,963,505, representing 0.29% of net assets.
rSee Note 9 regarding unfunded loan commitments.
sThe security is traded on a discount basis with no stated coupon rate.
tPrincipal amount is stated in 10 Mexican Peso Units.
uSee Note 7 regarding investments in the Institutional Fiduciary Trust Money Market Portfolio.
FSI-27
Franklin Templeton Variable Insurance Products Trust
Statement of Investments, December 31, 2013 (continued)
| | | | | | |
| Franklin Strategic Income Securities Fund | | | | | | |
At December 31, 2013, the Fund had the following forward exchange contracts outstanding. See Note 1(d).
Forward Exchange Contracts
| | | | | | | | | | | | | | | | | | | | | | | | | | | | |
| Currency | | Counterparya | | | Type | | | Quantity | | | Contract
Amount | | | Settlement
Date | | | Unrealized
Appreciation | | | Unrealized
Depreciation | |
Euro | | | DBAB | | | | Buy | | | | 239,450 | | | $ | 329,244 | | | | 1/03/14 | | | $ | 119 | | | $ | — | |
Euro | | | DBAB | | | | Sell | | | | 239,450 | | | | 317,415 | | | | 1/03/14 | | | | — | | | | (11,948 | ) |
Indian Rupee | | | CITI | | | | Buy | | | | 4,493,000 | | | | 69,490 | | | | 1/06/14 | | | | 3,079 | | | | — | |
Indian Rupee | | | HSBC | | | | Buy | | | | 32,771,000 | | | | 511,284 | | | | 1/06/14 | | | | 18,015 | | | | — | |
Indian Rupee | | | HSBC | | | | Buy | | | | 32,400,000 | | | | 510,358 | | | | 1/07/14 | | | | 12,844 | | | | — | |
Malaysian Ringgit | | | DBAB | | | | Buy | | | | 952,100 | | | | 307,794 | | | | 1/08/14 | | | | — | | | | (17,496 | ) |
Euro | | | DBAB | | | | Buy | | | | 40,550 | | | | 54,341 | | | | 1/09/14 | | | | 1,435 | | | | — | |
Euro | | | DBAB | | | | Sell | | | | 40,550 | | | | 54,098 | | | | 1/09/14 | | | | — | | | | (1,679 | ) |
Chilean Peso | | | DBAB | | | | Buy | | | | 1,449,000,000 | | | | 2,942,729 | | | | 1/10/14 | | | | — | | | | (188,369 | ) |
Chilean Peso | | | DBAB | | | | Sell | | | | 1,449,000,000 | | | | 2,801,895 | | | | 1/10/14 | | | | 47,535 | | | | — | |
Japanese Yen | | | HSBC | | | | Sell | | | | 183,560,000 | | | | 2,105,046 | | | | 1/10/14 | | | | 361,747 | | | | — | |
Euro | | | UBSW | | | | Buy | | | | 5,616,719 | | | | 7,468,443 | | | | 1/13/14 | | | | 257,862 | | | | (557 | ) |
Euro | | | DBAB | | | | Sell | | | | 108,735 | | | | 142,606 | | | | 1/13/14 | | | | — | | | | (6,958 | ) |
Euro | | | UBSW | | | | Sell | | | | 5,631,484 | | | | 7,374,472 | | | | 1/13/14 | | | | — | | | | (371,585 | ) |
Euro | | | DBAB | | | | Buy | | | | 1,865,041 | | | | 2,526,571 | | | | 1/14/14 | | | | 38,775 | | | | — | |
Euro | | | DBAB | | | | Sell | | | | 1,865,041 | | | | 2,470,992 | | | | 1/14/14 | | | | — | | | | (94,353 | ) |
Euro | | | JPHQ | | | | Sell | | | | 1,802,953 | | | | 2,360,516 | | | | 1/14/14 | | | | — | | | | (119,429 | ) |
Indian Rupee | | | DBAB | | | | Buy | | | | 20,841,000 | | | | 333,019 | | | | 1/15/14 | | | | 2,991 | | | | — | |
Euro | | | DBAB | | | | Buy | | | | 221,087 | | | | 303,972 | | | | 1/16/14 | | | | 130 | | | | — | |
Malaysian Ringgit | | | JPHQ | | | | Buy | | | | 175,000 | | | | 57,031 | | | | 1/16/14 | | | | — | | | | (3,693 | ) |
Euro | | | DBAB | | | | Sell | | | | 870,051 | | | | 1,162,992 | | | | 1/16/14 | | | | — | | | | (33,755 | ) |
Japanese Yen | | | UBSW | | | | Sell | | | | 460,675,000 | | | | 5,192,459 | | | | 1/16/14 | | | | 817,221 | | | | — | |
Indian Rupee | | | DBAB | | | | Buy | | | | 16,691,000 | | | | 266,295 | | | | 1/17/14 | | | | 2,699 | | | | — | |
Indian Rupee | | | JPHQ | | | | Buy | | | | 29,466,000 | | | | 466,730 | | | | 1/21/14 | | | | 7,771 | | | | — | |
Euro | | | DBAB | | | | Buy | | | | 400,945 | | | | 540,890 | | | | 1/22/14 | | | | 10,603 | | | | — | |
Indian Rupee | | | DBAB | | | | Buy | | | | 10,360,000 | | | | 165,347 | | | | 1/22/14 | | | | 1,450 | | | | — | |
Indian Rupee | | | JPHQ | | | | Buy | | | | 14,719,000 | | | | 234,955 | | | | 1/22/14 | | | | 2,023 | | | | — | |
Euro | | | DBAB | | | | Sell | | | | 1,700,000 | | | | 2,270,605 | | | | 1/22/14 | | | | — | | | | (67,720 | ) |
Euro | | | JPHQ | | | | Sell | | | | 2,912,410 | | | | 3,880,349 | | | | 1/22/14 | | | | — | | | | (125,627 | ) |
Singapore Dollar | | | JPHQ | | | | Buy | | | | 700,000 | | | | 564,516 | | | | 1/24/14 | | | | — | | | | (9,755 | ) |
Singapore Dollar | | | JPHQ | | | | Sell | | | | 126,000 | | | | 100,000 | | | | 1/24/14 | | | | 143 | | | | — | |
Euro | | | BZWS | | | | Sell | | | | 1,007,118 | | | | 1,332,885 | | | | 1/27/14 | | | | — | | | | (52,387 | ) |
Indian Rupee | | | JPHQ | | | | Buy | | | | 54,590,000 | | | | 868,846 | | | | 1/28/14 | | | | 9,014 | | | | — | |
Euro | | | DBAB | | | | Buy | | | | 4,032,721 | | | | 5,463,531 | | | | 1/30/14 | | | | 83,396 | | | | — | |
Euro | | | DBAB | | | | Sell | | | | 4,032,721 | | | | 5,438,326 | | | | 1/30/14 | | | | — | | | | (108,601 | ) |
Euro | | | DBAB | | | | Sell | | | | 3,014,151 | | | | 4,066,180 | | | | 1/31/14 | | | | — | | | | (79,726 | ) |
Euro | | | DBAB | | | | Buy | | | | 196,964 | | | | 266,287 | | | | 2/06/14 | | | | 4,633 | | | | — | |
Euro | | | DBAB | | | | Sell | | | | 2,316,000 | | | | 3,120,347 | | | | 2/06/14 | | | | — | | | | (65,275 | ) |
Chilean Peso | | | DBAB | | | | Buy | | | | 725,000,000 | | | | 1,468,206 | | | | 2/07/14 | | | | — | | | | (94,506 | ) |
Chilean Peso | | | DBAB | | | | Sell | | | | 585,000,000 | | | | 1,111,139 | | | | 2/07/14 | | | | 2,705 | | | | — | |
Chilean Peso | | | BZWS | | | | Buy | | | | 743,650,000 | | | | 1,407,895 | | | | 2/10/14 | | | | 696 | | | | — | |
Indian Rupee | | | HSBC | | | | Buy | | | | 186,760,000 | | | | 2,943,304 | | | | 2/10/14 | | | | 51,989 | | | | — | |
Chilean Peso | | | BZWS | | | | Sell | | | | 266,000,000 | | | | 499,906 | | | | 2/10/14 | | | | — | | | | (3,940 | ) |
Indian Rupee | | | HSBC | | | | Sell | | | | 62,078,000 | | | | 989,764 | | | | 2/10/14 | | | | — | | | | (5,855 | ) |
Indian Rupee | | | HSBC | | | | Buy | | | | 5,576,000 | | | | 86,663 | | | | 2/12/14 | | | | 2,730 | | | | — | |
Japanese Yen | | | HSBC | | | | Sell | | | | 64,350,000 | | | | 691,846 | | | | 2/12/14 | | | | 80,604 | | | | — | |
Japanese Yen | | | JPHQ | | | | Sell | | | | 64,319,000 | | | | 691,877 | | | | 2/12/14 | | | | 80,929 | | | | — | |
Indian Rupee | | | HSBC | | | | Buy | | | | 14,080,000 | | | | 216,497 | | | | 2/13/14 | | | | 9,181 | | | | — | |
Japanese Yen | | | CITI | | | | Sell | | | | 85,250,000 | | | | 922,544 | | | | 2/13/14 | | | | 112,775 | | | | — | |
FSI-28
Franklin Templeton Variable Insurance Products Trust
Statement of Investments, December 31, 2013 (continued)
| | | | | | |
| Franklin Strategic Income Securities Fund | | | | | | |
Forward Exchange Contracts (continued)
| | | | | | | | | | | | | | | | | | | | | | | | | | | | |
| Currency | | Counterparya | | | Type | | | Quantity | | | Contract
Amount | | | Settlement
Date | | | Unrealized
Appreciation | | | Unrealized
Depreciation | |
Japanese Yen | | | JPHQ | | | | Sell | | | | 42,690,000 | | | $ | 461,279 | | | | 2/13/14 | | | $ | 55,777 | | | $ | — | |
Euro | | | UBSW | | | | Sell | | | | 2,151,000 | | | | 2,885,136 | | | | 2/13/14 | | | | — | | | | (73,541 | ) |
Indian Rupee | | | DBAB | | | | Buy | | | | 14,156,000 | | | | 215,942 | | | | 2/18/14 | | | | 10,721 | | | | — | |
Japanese Yen | | | JPHQ | | | | Sell | | | | 42,710,000 | | | | 461,271 | | | | 2/18/14 | | | | 55,569 | | | | — | |
Japanese Yen | | | CITI | | | | Sell | | | | 42,570,000 | | | | 461,221 | | | | 2/19/14 | | | | 56,847 | | | | — | |
Japanese Yen | | | GSCO | | | | Sell | | | | 42,760,000 | | | | 461,290 | | | | 2/19/14 | | | | 55,112 | | | | — | |
Indian Rupee | | | DBAB | | | | Buy | | | | 12,894,000 | | | | 200,326 | | | | 2/20/14 | | | | 6,045 | | | | — | |
Euro | | | BZWS | | | | Sell | | | | 2,084,000 | | | | 2,781,807 | | | | 2/20/14 | | | | — | | | | (84,723 | ) |
Japanese Yen | | | BZWS | | | | Sell | | | | 21,350,000 | | | | 230,626 | | | | 2/25/14 | | | | 27,816 | | | | — | |
Euro | | | BZWS | | | | Buy | | | | 3,340,073 | | | | 4,595,339 | | | | 2/26/14 | | | | — | | | | (1,076 | ) |
Indian Rupee | | | DBAB | | | | Buy | | | | 10,466,000 | | | | 163,294 | | | | 2/26/14 | | | | 4,011 | | | | — | |
Euro | | | BZWS | | | | Sell | | | | 3,340,073 | | | | 4,452,866 | | | | 2/26/14 | | | | — | | | | (141,397 | ) |
Japanese Yen | | | UBSW | | | | Sell | | | | 34,903,000 | | | | 354,489 | | | | 2/26/14 | | | | 22,933 | | | | — | |
Singapore Dollar | | | DBAB | | | | Buy | | | | 940,000 | | | | 735,064 | | | | 2/27/14 | | | | 9,917 | | | | — | |
Japanese Yen | | | BZWS | | | | Sell | | | | 80,260,000 | | | | 862,890 | | | | 2/27/14 | | | | 100,469 | | | | — | |
Euro | | | BZWS | | | | Sell | | | | 1,025,079 | | | | 1,369,247 | | | | 2/27/14 | | | | — | | | | (40,748 | ) |
Japanese Yen | | | DBAB | | | | Sell | | | | 14,279,000 | | | | 155,996 | | | | 2/27/14 | | | | 20,354 | | | | — | |
Indian Rupee | | | JPHQ | | | | Buy | | | | 23,701,000 | | | | 370,422 | | | | 2/28/14 | | | | 8,297 | | | | — | |
Singapore Dollar | | | DBAB | | | | Buy | | | | 723,000 | | | | 573,989 | | | | 2/28/14 | | | | 4,586 | | | | (5,573 | ) |
Euro | | | UBSW | | | | Sell | | | | 708,181 | | | | 948,438 | | | | 2/28/14 | | | | — | | | | (25,664 | ) |
Euro | | | UBSW | | | | Buy | | | | 1,747,000 | | | | 2,403,872 | | | | 3/03/14 | | | | — | | | | (877 | ) |
Indian Rupee | | | CITI | | | | Buy | | | | 4,537,000 | | | | 70,091 | | | | 3/03/14 | | | | 2,354 | | | | — | |
Euro | | | DBAB | | | | Sell | | | | 1,228,589 | | | | 1,616,516 | | | | 3/03/14 | | | | — | | | | (73,406 | ) |
Japanese Yen | | | JPHQ | | | | Sell | | | | 85,800,000 | | | | 943,521 | | | | 3/03/14 | | | | 128,456 | | | | — | |
Euro | | | UBSW | | | | Sell | | | | 2,581,000 | | | | 3,387,175 | | | | 3/03/14 | | | | — | | | | (162,985 | ) |
Japanese Yen | | | DBAB | | | | Sell | | | | 257,790,000 | | | | 2,801,974 | | | | 3/04/14 | | | | 353,060 | | | | — | |
Japanese Yen | | | HSBC | | | | Sell | | | | 85,800,000 | | | | 942,339 | | | | 3/04/14 | | | | 127,270 | | | | — | |
Japanese Yen | | | UBSW | | | | Sell | | | | 95,700,000 | | | | 1,041,009 | | | | 3/04/14 | | | | 131,893 | | | | — | |
Euro | | | DBAB | | | | Sell | | | | 1,400,000 | | | | 1,828,820 | | | | 3/05/14 | | | | — | | | | (96,874 | ) |
Euro | | | DBAB | | | | Sell | | | | 324,000 | | | | 420,406 | | | | 3/06/14 | | | | — | | | | (25,254 | ) |
Euro | | | DBAB | | | | Sell | | | | 2,741,981 | | | | 3,560,641 | | | | 3/17/14 | | | | — | | | | (210,910 | ) |
Euro | | | DBAB | | | | Sell | | | | 479,200 | | | | 621,863 | | | | 3/18/14 | | | | — | | | | (37,269 | ) |
Singapore Dollar | | | DBAB | | | | Buy | | | | 973,400 | | | | 763,188 | | | | 3/19/14 | | | | 8,271 | | | | — | |
Singapore Dollar | | | HSBC | | | | Buy | | | | 1,113,000 | | | | 892,149 | | | | 3/19/14 | | | | — | | | | (10,052 | ) |
Singapore Dollar | | | JPHQ | | | | Buy | | | | 694,000 | | | | 541,663 | | | | 3/19/14 | | | | 8,360 | | | | — | |
Singapore Dollar | | | HSBC | | | | Sell | | | | 1,113,000 | | | | 883,403 | | | | 3/19/14 | | | | 1,306 | | | | — | |
Euro | | | JPHQ | | | | Sell | | | | 143,700 | | | | 188,283 | | | | 3/19/14 | | | | — | | | | (9,374 | ) |
Euro | | | DBAB | | | | Buy | | | | 1,997,000 | | | | 2,700,244 | | | | 3/20/14 | | | | 46,592 | | | | — | |
Euro | | | DBAB | | | | Sell | | | | 1,997,000 | | | | 2,597,758 | | | | 3/20/14 | | | | — | | | | (149,078 | ) |
Euro | | | JPHQ | | | | Sell | | | | 240,000 | | | | 311,998 | | | | 3/20/14 | | | | — | | | | (18,118 | ) |
Euro | | | JPHQ | | | | Sell | | | | 240,000 | | | | 310,568 | | | | 3/21/14 | | | | — | | | | (19,547 | ) |
Euro | | | JPHQ | | | | Sell | | | | 240,000 | | | | 311,730 | | | | 3/24/14 | | | | — | | | | (18,384 | ) |
Euro | | | JPHQ | | | | Sell | | | | 192,000 | | | | 248,564 | | | | 3/25/14 | | | | — | | | | (15,527 | ) |
Euro | | | DBAB | | | | Sell | | | | 333,108 | | | | 433,807 | | | | 3/26/14 | | | | — | | | | (24,375 | ) |
Euro | | | DBAB | | | | Buy | | | | 4,372,555 | | | | 5,861,847 | | | | 4/03/14 | | | | 152,494 | | | | — | |
Euro | | | DBAB | | | | Sell | | | | 4,372,555 | | | | 5,619,389 | | | | 4/03/14 | | | | — | | | | (394,952 | ) |
Euro | | | BZWS | | | | Sell | | | | 132,570 | | | | 170,624 | | | | 4/07/14 | | | | — | | | | (11,723 | ) |
Euro | | | DBAB | | | | Sell | | | | 800,000 | | | | 1,050,160 | | | | 4/10/14 | | | | — | | | | (50,230 | ) |
Euro | | | DBAB | | | | Sell | | | | 949,814 | | | | 1,243,069 | | | | 4/11/14 | | | | — | | | | (63,390 | ) |
Chilean Peso | | | MSCO | | | | Buy | | | | 116,230,000 | | | | 237,616 | | | | 4/14/14 | | | | — | | | | (18,949 | ) |
Euro | | | HSBC | | | | Sell | | | | 142,717 | | | | 186,807 | | | | 4/16/14 | | | | — | | | | (9,500 | ) |
FSI-29
Franklin Templeton Variable Insurance Products Trust
Statement of Investments, December 31, 2013 (continued)
| | | | | | |
| Franklin Strategic Income Securities Fund | | | | | | |
Forward Exchange Contracts (continued)
| | | | | | | | | | | | | | | | | | | | | | | | | | | | |
| Currency | | Counterparya | | | Type | | | Quantity | | | Contract
Amount | | | Settlement
Date | | | Unrealized
Appreciation | | | Unrealized
Depreciation | |
Chilean Peso | | | MSCO | | | | Buy | | | | 104,150,000 | | | $ | 211,451 | | | | 4/21/14 | | | $ | — | | | $ | (15,650 | ) |
Euro | | | DBAB | | | | Buy | | | | 29,378 | | | | 39,211 | | | | 4/22/14 | | | | 1,199 | | | | — | |
Euro | | | BZWS | | | | Sell | | | | 130,134 | | | | 171,384 | | | | 4/22/14 | | | | — | | | | (7,617 | ) |
Euro | | | DBAB | | | | Sell | | | | 2,272,254 | | | | 2,983,015 | | | | 4/22/14 | | | | — | | | | (142,491 | ) |
Euro | | | JPHQ | | | | Sell | | | | 36,314 | | | | 47,536 | | | | 4/22/14 | | | | — | | | | (2,414 | ) |
Euro | | | BZWS | | | | Sell | | | | 1,659,340 | | | | 2,167,430 | | | | 4/25/14 | | | | — | | | | (115,016 | ) |
Chilean Peso | | | JPHQ | | | | Buy | | | | 234,301,000 | | | | 471,668 | | | | 4/28/14 | | | | — | | | | (31,500 | ) |
British Pound Sterling | | | DBAB | | | | Buy | | | | 223,551 | | | | 344,671 | | | | 4/29/14 | | | | 25,178 | | | | — | |
British Pound Sterling | | | DBAB | | | | Sell | | | | 223,551 | | | | 346,750 | | | | 4/29/14 | | | | — | | | | (23,099 | ) |
Singapore Dollar | | | DBAB | | | | Buy | | | | 6,168,500 | | | | 4,985,654 | | | | 4/30/14 | | | | — | | | | (96,512 | ) |
Euro | | | BZWS | | | | Sell | | | | 91,515 | | | | 119,354 | | | | 4/30/14 | | | | — | | | | (6,527 | ) |
Singapore Dollar | | | DBAB | | | | Sell | | | | 2,560,000 | | | | 1,997,815 | | | | 4/30/14 | | | | — | | | | (31,236 | ) |
Euro | | | DBAB | | | | Sell | | | | 870,275 | | | | 1,155,395 | | | | 4/30/14 | | | | — | | | | (41,689 | ) |
Euro | | | DBAB | | | | Sell | | | | 71,000 | | | | 93,969 | | | | 5/05/14 | | | | — | | | | (3,694 | ) |
Japanese Yen | | | DBAB | | | | Buy | | | | 97,107,500 | | | | 982,869 | | | | 5/07/14 | | | | — | | | | (60,004 | ) |
Japanese Yen | | | DBAB | | | | Sell | | | | 97,107,500 | | | | 1,000,000 | | | | 5/07/14 | | | | 77,135 | | | | — | |
British Pound Sterling | | | DBAB | | | | Buy | | | | 1,217,294 | | | | 1,879,811 | | | | 5/09/14 | | | | 133,943 | | | | — | |
Chilean Peso | | | DBAB | | | | Buy | | | | 574,000,000 | | | | 1,167,972 | | | | 5/09/14 | | | | — | | | | (90,844 | ) |
British Pound Sterling | | | DBAB | | | | Sell | | | | 1,300,000 | | | | 2,010,190 | | | | 5/09/14 | | | | — | | | | (140,384 | ) |
Chilean Peso | | | DBAB | | | | Sell | | | | 260,000,000 | | | | 492,891 | | | | 5/09/14 | | | | 4,993 | | | | — | |
Euro | | | DBAB | | | | Sell | | | | 700,000 | | | | 918,925 | | | | 5/09/14 | | | | — | | | | (43,953 | ) |
Singapore Dollar | | | DBAB | | | | Buy | | | | 3,707,640 | | | | 3,013,410 | | | | 5/12/14 | | | | — | | | | (74,661 | ) |
Euro | | | DBAB | | | | Sell | | | | 212,145 | | | | 280,583 | | | | 5/12/14 | | | | — | | | | (11,232 | ) |
British Pound Sterling | | | DBAB | | | | Buy | | | | 130,318 | | | | 200,911 | | | | 5/15/14 | | | | 14,661 | | | | — | |
British Pound Sterling | | | DBAB | | | | Sell | | | | 130,318 | | | | 198,930 | | | | 5/15/14 | | | | — | | | | (16,642 | ) |
Euro | | | JPHQ | | | | Sell | | | | 201,376 | | | | 260,361 | | | | 5/23/14 | | | | — | | | | (16,645 | ) |
Japanese Yen | | | DBAB | | | | Sell | | | | 50,435,000 | | | | 500,000 | | | | 5/28/14 | | | | 20,619 | | | | — | |
Singapore Dollar | | | JPHQ | | | | Buy | | | | 4,945,200 | | | | 3,933,816 | | | | 6/05/14 | | | | — | | | | (13,936 | ) |
Euro | | | DBAB | | | | Sell | | | | 992 | | | | 1,291 | | | | 6/05/14 | | | | — | | | | (74 | ) |
Japanese Yen | | | BZWS | | | | Sell | | | | 75,370,000 | | | | 774,486 | | | | 6/10/14 | | | | 58,036 | | | | — | |
Japanese Yen | | | HSBC | | | | Sell | | | | 80,270,000 | | | | 829,818 | | | | 6/10/14 | | | | 66,790 | | | | — | |
Japanese Yen | | | JPHQ | | | | Sell | | | | 54,440,000 | | | | 553,272 | | | | 6/10/14 | | | | 35,778 | | | | — | |
Japanese Yen | | | DBAB | | | | Buy | | | | 26,600,000 | | | | 271,734 | | | | 6/11/14 | | | | — | | | | (18,878 | ) |
Japanese Yen | | | DBAB | | | | Sell | | | | 26,600,000 | | | | 276,807 | | | | 6/11/14 | | | | 23,951 | | | | — | |
Japanese Yen | | | JPHQ | | | | Sell | | | | 74,370,000 | | | | 774,497 | | | | 6/11/14 | | | | 67,548 | | | | — | |
Japanese Yen | | | JPHQ | | | | Sell | | | | 31,400,000 | | | | 332,328 | | | | 6/17/14 | | | | 33,832 | | | | — | |
Singapore Dollar | | | HSBC | | | | Buy | | | | 837,000 | | | | 664,813 | | | | 6/20/14 | | | | — | | | | (1,331 | ) |
Euro | | | DBAB | | | | Sell | | | | 320,700 | | | | 420,454 | | | | 6/27/14 | | | | — | | | | (20,710 | ) |
Japanese Yen | | | BZWS | | | | Buy | | | | 396,000,000 | | | | 4,006,516 | | | | 6/30/14 | | | | — | | | | (241,702 | ) |
Japanese Yen | | | BZWS | | | | Sell | | | | 620,288,000 | | | | 6,375,005 | | | | 6/30/14 | | | | 477,862 | | | | — | |
Euro | | | UBSW | | | | Sell | | | | 4,274,000 | | | | 5,581,117 | | | | 6/30/14 | | | | — | | | | (298,342 | ) |
Japanese Yen | | | DBAB | | | | Sell | | | | 97,929,000 | | | | 1,000,000 | | | | 7/01/14 | | | | 68,970 | | | | — | |
British Pound Sterling | | | DBAB | | | | Sell | | | | 297,656 | | | | 444,222 | | | | 7/09/14 | | | | — | | | | (47,929 | ) |
Euro | | | DBAB | | | | Sell | | | | 312,984 | | | | 404,094 | | | | 7/10/14 | | | | — | | | | (26,469 | ) |
Euro | | | DBAB | | | | Sell | | | | 190,862 | | | | 252,893 | | | | 7/25/14 | | | | — | | | | (9,681 | ) |
Euro | | | BZWS | | | | Sell | | | | 1,993,000 | | | | 2,639,529 | | | | 7/28/14 | | | | — | | | | (102,308 | ) |
Euro | | | CITI | | | | Sell | | | | 648,569 | | | | 858,916 | | | | 7/28/14 | | | | — | | | | (33,342 | ) |
British Pound Sterling | | | DBAB | | | | Sell | | | | 169,385 | | | | 257,905 | | | | 7/30/14 | | | | — | | | | (22,101 | ) |
Euro | | | DBAB | | | | Sell | | | | 900,000 | | | | 1,191,825 | | | | 8/01/14 | | | | — | | | | (46,348 | ) |
Euro | | | JPHQ | | | | Sell | | | | 667,276 | | | | 882,608 | | | | 8/06/14 | | | | — | | | | (35,407 | ) |
Euro | | | CITI | | | | Sell | | | | 317,220 | | | | 422,315 | | | | 8/08/14 | | | | — | | | | (14,108 | ) |
FSI-30
Franklin Templeton Variable Insurance Products Trust
Statement of Investments, December 31, 2013 (continued)
| | | | | | |
| Franklin Strategic Income Securities Fund | | | | | | |
Forward Exchange Contracts (continued)
| | | | | | | | | | | | | | | | | | | | | | | | | | | | |
| Currency | | Counterparya | | | Type | | | Quantity | | | Contract
Amount | | | Settlement
Date | | | Unrealized
Appreciation | | | Unrealized
Depreciation | |
Chilean Peso | | | BZWS | | | | Buy | | | | 743,650,000 | | | $ | 1,382,121 | | | | 8/11/14 | | | $ | 56 | | | $ | — | |
Euro | | | CITI | | | | Sell | | | | 92,411 | | | | 123,136 | | | | 8/11/14 | | | | — | | | | (4,001 | ) |
Chilean Peso | | | JPHQ | | | | Buy | | | | 1,141,336,600 | | | | 2,148,196 | | | | 8/20/14 | | | | — | | | | (28,803 | ) |
Japanese Yen | | | HSBC | | | | Sell | | | | 65,957,000 | | | | 679,969 | | | | 8/20/14 | | | | 52,604 | | | | — | |
Japanese Yen | | | JPHQ | | | | Sell | | | | 47,983,000 | | | | 493,588 | | | | 8/20/14 | | | | 37,187 | | | | — | |
Euro | | | JPHQ | | | | Sell | | | | 3,500,000 | | | | 4,678,783 | | | | 8/21/14 | | | | — | | | | (136,583 | ) |
Japanese Yen | | | BZWS | | | | Sell | | | | 15,895,000 | | | | 163,934 | | | | 8/22/14 | | | | 12,742 | | | | — | |
Euro | | | BZWS | | | | Sell | | | | 704,462 | | | | 944,395 | | | | 8/25/14 | | | | — | | | | (24,827 | ) |
Japanese Yen | | | CITI | | | | Sell | | | | 31,757,000 | | | | 326,915 | | | | 8/25/14 | | | | 24,836 | | | | — | |
Japanese Yen | | | HSBC | | | | Sell | | | | 31,524,000 | | | | 323,685 | | | | 8/25/14 | | | | 23,823 | | | | — | |
Japanese Yen | | | BZWS | | | | Sell | | | | 44,152,000 | | | | 449,156 | | | | 8/26/14 | | | | 29,170 | | | | — | |
Euro | | | DBAB | | | | Sell | | | | 527,245 | | | | 704,399 | | | | 8/26/14 | | | | — | | | | (21,004 | ) |
Japanese Yen | | | JPHQ | | | | Sell | | | | 31,689,000 | | | | 322,365 | | | | 8/26/14 | | | | 20,931 | | | | — | |
Singapore Dollar | | | DBAB | | | | Buy | | | | 940,000 | | | | 735,352 | | | | 8/27/14 | | | | 9,909 | | | | — | |
Japanese Yen | | | DBAB | | | | Sell | | | | 27,184,000 | | | | 275,420 | | | | 8/27/14 | | | | 16,836 | | | | — | |
Japanese Yen | | | HSBC | | | | Sell | | | | 50,145,000 | | | | 508,122 | | | | 8/27/14 | | | | 31,124 | | | | — | |
Japanese Yen | | | JPHQ | | | | Sell | | | | 15,991,000 | | | | 162,242 | | | | 8/27/14 | | | | 10,130 | | | | — | |
Euro | | | JPHQ | | | | Sell | | | | 211,135 | | | | 281,762 | | | | 8/27/14 | | | | — | | | | (8,726 | ) |
Euro | | | DBAB | | | | Sell | | | | 1,174,984 | | | | 1,568,731 | | | | 8/28/14 | | | | — | | | | (47,863 | ) |
Japanese Yen | | | JPHQ | | | | Sell | | | | 15,743,000 | | | | 162,024 | | | | 8/29/14 | | | | 12,268 | | | | — | |
Euro | | | BZWS | | | | Sell | | | | 178,354 | | | | 238,281 | | | | 9/19/14 | | | | — | | | | (7,120 | ) |
Euro | | | UBSW | | | | Sell | | | | 2,137,312 | | | | 2,856,732 | | | | 9/22/14 | | | | — | | | | (84,065 | ) |
Euro | | | DBAB | | | | Sell | | | | 275,651 | | | | 374,008 | | | | 9/23/14 | | | | — | | | | (5,269 | ) |
Euro | | | BZWS | | | | Sell | | | | 469,210 | | | | 635,198 | | | | 9/24/14 | | | | — | | | | (10,407 | ) |
Euro | | | DBAB | | | | Sell | | | | 1,550,000 | | | | 2,093,074 | | | | 9/30/14 | | | | — | | | | (39,671 | ) |
Euro | | | JPHQ | | | | Sell | | | | 2,850,000 | | | | 3,886,730 | | | | 10/07/14 | | | | — | | | | (34,860 | ) |
Euro | | | DBAB | | | | Sell | | | | 185,654 | | | | 251,914 | | | | 10/08/14 | | | | — | | | | (3,546 | ) |
Euro | | | BZWS | | | | Sell | | | | 2,749,000 | | | | 3,718,627 | | | | 10/14/14 | | | | — | | | | (64,077 | ) |
Euro | | | DBAB | | | | Sell | | | | 121,043 | | | | 163,672 | | | | 10/15/14 | | | | — | | | | (2,887 | ) |
Euro | | | DBAB | | | | Sell | | | | 587,951 | | | | 795,880 | | | | 10/17/14 | | | | — | | | | (13,166 | ) |
Malaysian Ringgit | | | JPHQ | | | | Buy | | | | 763,000 | | | | 235,851 | | | | 10/20/14 | | | | — | | | | (6,593 | ) |
Chilean Peso | | | CITI | | | | Buy | | | | 377,668,000 | | | | 724,891 | | | | 10/24/14 | | | | — | | | | (28,195 | ) |
Malaysian Ringgit | | | DBAB | | | | Buy | | | | 6,892,000 | | | | 2,140,040 | | | | 10/24/14 | | | | — | | | | (69,780 | ) |
Malaysian Ringgit | | | HSBC | | | | Buy | | | | 6,809,796 | | | | 2,103,087 | | | | 10/24/14 | | | | — | | | | (57,520 | ) |
Japanese Yen | | | JPHQ | | | | Sell | | | | 270,990,000 | | | | 2,763,554 | | | | 10/24/14 | | | | 184,191 | | | | — | |
Euro | | | BZWS | | | | Sell | | | | 217,715 | | | | 299,754 | | | | 10/27/14 | | | | 159 | | | | — | |
Euro | | | GSCO | | | | Sell | | | | 369,000 | | | | 509,146 | | | | 10/29/14 | | | | 1,366 | | | | — | |
Euro | | | DBAB | | | | Sell | | | | 243,767 | | | | 329,122 | | | | 10/30/14 | | | | — | | | | (6,327 | ) |
Euro | | | DBAB | | | | Sell | | | | 744,524 | | | | 1,028,195 | | | | 10/31/14 | | | | 3,649 | | | | — | |
Euro | | | BZWS | | | | Sell | | | | 529,706 | | | | 716,374 | | | | 11/05/14 | | | | — | | | | (12,571 | ) |
Japanese Yen | | | JPHQ | | | | Sell | | | | 360,360,000 | | | | 3,678,695 | | | | 11/05/14 | | | | 248,181 | | | | — | |
Japanese Yen | | | DBAB | | | | Sell | | | | 245,702,500 | | | | 2,500,000 | | | | 11/07/14 | | | | 160,933 | | | | — | |
Euro | | | DBAB | | | | Sell | | | | 740,000 | | | | 997,705 | | | | 11/07/14 | | | | — | | | | (20,640 | ) |
Euro | | | JPHQ | | | | Sell | | | | 473,670 | | | | 631,611 | | | | 11/12/14 | | | | — | | | | (20,237 | ) |
Euro | | | DBAB | | | | Sell | | | | 800,000 | | | | 1,076,736 | | | | 11/14/14 | | | | — | | | | (24,203 | ) |
Japanese Yen | | | MSCO | | | | Sell | | | | 12,500,000 | | | | 125,800 | | | | 11/14/14 | | | | 6,791 | | | | — | |
Euro | | | DBAB | | | | Sell | | | | 227,970 | | | | 306,442 | | | | 11/17/14 | | | | — | | | | (7,288 | ) |
Malaysian Ringgit | | | DBAB | | | | Buy | | | | 623,200 | | | | 191,242 | | | | 11/19/14 | | | | — | | | | (4,374 | ) |
Euro | | | DBAB | | | | Sell | | | | 63,419 | | | | 85,419 | | | | 11/19/14 | | | | — | | | | (1,858 | ) |
Malaysian Ringgit | | | HSBC | | | | Buy | | | | 376,000 | | | | 115,479 | | | | 11/20/14 | | | | — | | | | (2,742 | ) |
Euro | | | JPHQ | | | | Sell | | | | 1,702,433 | | | | 2,304,430 | | | | 11/20/14 | | | | — | | | | (38,462 | ) |
FSI-31
Franklin Templeton Variable Insurance Products Trust
Statement of Investments, December 31, 2013 (continued)
| | | | | | |
| Franklin Strategic Income Securities Fund | | | | | | |
Forward Exchange Contracts (continued)
| | | | | | | | | | | | | | | | | | | | | | | | | | | | |
| Currency | | Counterpartya | | | Type | | | Quantity | | | Contract
Amount | | | Settlement
Date | | | Unrealized
Appreciation | | | Unrealized
Depreciation | |
Euro | | | DBAB | | | | Sell | | | | 1,245,000 | | | $ | 1,688,936 | | | | 12/04/14 | | | $ | — | | | $ | (24,517 | ) |
Euro | | | DBAB | | | | Sell | | | | 3,400,000 | | | | 4,645,114 | | | | 12/09/14 | | | | — | | | | (34,274 | ) |
Euro | | | DBAB | | | | Sell | | | | 800,000 | | | | 1,097,800 | | | | 12/11/14 | | | | — | | | | (3,240 | ) |
Euro | | | DBAB | | | | Sell | | | | 1,200,000 | | | | 1,652,520 | | | | 12/12/14 | | | | 955 | | | | — | |
Japanese Yen | | | JPHQ | | | | Sell | | | | 187,760,000 | | | | 1,833,764 | | | | 12/12/14 | | | | 45,545 | | | | — | |
Euro | | | CITI | | | | Sell | | | | 3,868,000 | | | | 5,309,874 | | | | 12/17/14 | | | | — | | | | (13,761 | ) |
Euro | | | DBAB | | | | Sell | | | | 486,875 | | | | 667,993 | | | | 12/17/14 | | | | — | | | | (2,107 | ) |
Euro | | | DBAB | | | | Sell | | | | 501,617 | | | | 689,772 | | | | 12/18/14 | | | | — | | | | (619 | ) |
| | | | | | | | | | | | | | | | | | | | | | | | |
Unrealized appreciation (depreciation) | | | | | | | | | | | | | | | | 5,467,485 | | | | (6,077,369 | ) |
| | | | | | | | | | | | | | | | | | | | | | | | |
Net unrealized appreciation (depreciation) | | | | | | | | | | | | | | | | | | | $ | (609,884 | ) |
| | | | | | | | | | | | | | | | | | | | | | | | | | | | |
aMay be comprised of multiple contracts using the same currency and settlement date.
At December 31, 2013, the Fund had the following credit default swap contracts outstanding. See Note 1(d).
Credit Default Swap Contracts
| | | | | | | | | | | | | | | | | | | | | | | | | | | | | | | | | | |
| Description | | Counterparty/
Exchange | | | Notional
Amounta | | | Periodic
Payment
Rate | | | Expiration
Date | | | Upfront
Premiums
Paid
(Received) | | | Unrealized
Appreciation | | | Unrealized
Depreciation | | | Market
Value | | | Ratingb |
OTC Swaps | | | | | | | | | | | | | | | | | | | | | | | | | | | | | | | | | | |
Contracts to Sell Protectionc | | | | | | | | | | | | | | | | | | | | | | | | | | | |
Traded Index | | | | | | | | | | | | | | | | | | | | | | | | | | | |
CMBX.NA.AJ.2 | | | FBCO | | | | 6,000,000 | | | | 1.09% | | | | 3/15/49 | | | $ | (832,641 | ) | | $ | 216,038 | | | $ | — | | | $ | (616,603 | ) | | Non Investment
Grade |
MCDX.NA.20 | | | CITI | | | | 13,000,000 | | | | 1.00% | | | | 6/20/18 | | | | (243,671 | ) | | | 31,262 | | | | — | | | | (212,409 | ) | | Non Investment
Grade |
| | | | | | | | | | | | | | | | | | | | | | | | | | | | | | |
Net unrealized appreciation (depreciation) | | | | | | | | | | | $ | 247,300 | | | | | | | | | | | |
| | | | | | | | | | | | | | | | | | | | | | | | | | | | | | | | | | |
aIn U.S. dollars unless otherwise indicated. For contracts to sell protection, the notional amount is equal to the maximum potential amount of the future payments and no recourse provisions have been entered into in association with the contracts.
bBased on Standard and Poor's (S&P) Rating for single name swaps and internal ratings for index swaps. Internal ratings based on mapping into equivalent ratings from external vendors.
cThe fund enters contracts to sell protection to create a long credit position. Performance triggers include failure to pay or bankruptcy of the underlying securities for traded index swaps.
See Note 10 regarding other derivative information.
See Abbreviations on page FSI-49.
The accompanying notes are an integral part of these financial statements.
FSI-32
Franklin Templeton Variable Insurance Products Trust
Financial Statements
Statement of Assets and Liabilities
December 31, 2013
| | | | |
| | | Franklin
Strategic Income
Securities Fund | |
Assets: | | | | |
Investments in securities: | | | | |
Cost - Unaffiliated issuers | | $ | 885,055,744 | |
Cost - Sweep Money Fund (Note 7) | | | 87,788,340 | |
| | | | |
Total cost of investments | | $ | 972,844,084 | |
| | | | |
Value - Unaffiliated issuers | | $ | 913,806,799 | |
Value - Sweep Money Fund (Note 7) | | | 87,788,340 | |
| | | | |
Total value of investments | | | 1,001,595,139 | |
Cash | | | 598,393 | |
Restricted cash (Note 1e) | | | 50,400 | |
Foreign currency, at value (cost and $7,729,923) | | | 7,735,869 | |
Receivables: | | | | |
Investment securities sold | | | 6,347,654 | |
Capital shares sold | | | 281,076 | |
Interest | | | 12,459,008 | |
Due from brokers | | | 3,010,000 | |
Unrealized appreciation on forward exchange contracts | | | 5,467,485 | |
Unrealized appreciation on OTC swap contracts | | | 247,300 | |
Unrealized appreciation on unfunded loan commitments (Note 9) | | | 4,611 | |
Other assets | | | 32 | |
| | | | |
Total assets | | | 1,037,796,967 | |
| | | | |
Liabilities: | | | | |
Payables: | | | | |
Investment securities purchased | | | 12,687,637 | |
Capital shares redeemed | | | 1,229,563 | |
Management fees | | | 490,893 | |
Distribution fees | | | 152,977 | |
Due to brokers | | | 50,400 | |
OTC Swaps (premiums received $1,104,423) | | | 1,076,312 | |
Unrealized depreciation on forward exchange contracts | | | 6,077,369 | |
Deferred tax | | | 11,129 | |
Accrued expenses and other liabilities | | | 250,568 | |
| | | | |
Total liabilities | | | 22,026,848 | |
| | | | |
Net assets, at value | | $ | 1,015,770,119 | |
| | | | |
Net assets consist of: | | | | |
Paid-in capital | | $ | 918,320,098 | |
Undistributed net investment income | | | 50,393,655 | |
Net unrealized appreciation (depreciation) | | | 28,472,814 | |
Accumulated net realized gain (loss) | | | 18,583,552 | |
| | | | |
Net assets, at value | | $ | 1,015,770,119 | |
| | | | |
The accompanying notes are an integral part of these financial statements.
FSI-33
Franklin Templeton Variable Insurance Products Trust
Financial Statements (continued)
Statement of Assets and Liabilities (continued)
December 31, 2013
| | | | |
| | | Franklin
Strategic Income
Securities Fund | |
Class 1: | | | | |
Net assets, at value | | $ | 705,493,101 | |
| | | | |
Shares outstanding | | | 55,803,693 | |
| | | | |
Net asset value and maximum offering price per share | | $ | 12.64 | |
| | | | |
Class 2: | | | | |
Net assets, at value | | $ | 175,306,946 | |
| | | | |
Shares outstanding | | | 14,252,287 | |
| | | | |
Net asset value and maximum offering price per share | | $ | 12.30 | |
| | | | |
Class 4: | | | | |
Net assets, at value | | $ | 134,970,072 | |
| | | | |
Shares outstanding | | | 10,786,004 | |
| | | | |
Net asset value and maximum offering price per share | | $ | 12.51 | |
| | | | |
The accompanying notes are an integral part of these financial statements.
FSI-34
Franklin Templeton Variable Insurance Products Trust
Financial Statements (continued)
Statement of Operations
for the year ended December 31, 2013
| | | | |
| | | Franklin
Strategic Income
Securities Fund | |
Investment income: | | | | |
Dividends | | $ | 61,311 | |
Interest | | | 62,431,314 | |
| | | | |
Total investment income | | | 62,492,625 | |
| | | | |
Expenses: | | | | |
Management fees (Note 3a) | | | 5,775,493 | |
Administrative fees (Note 3b) | | | 889,691 | |
Distribution fees: (Note 3c) | | | | |
Class 2 | | | 425,624 | |
Class 4 | | | 597,536 | |
Unaffiliated transfer agent fees | | | 273 | |
Custodian fees (Note 4) | | | 194,855 | |
Reports to shareholders | | | 189,635 | |
Registration and filing fees | | | 1,357 | |
Professional fees | | | 79,050 | |
Trustees’ fees and expenses | | | 5,245 | |
Other | | | 96,506 | |
| | | | |
Total expenses | | | 8,255,265 | |
Expense reductions (Note 4) | | | (822 | ) |
| | | | |
Net expenses | | | 8,254,443 | |
| | | | |
Net investment income | | | 54,238,182 | |
| | | | |
Realized and unrealized gains (losses): | | | | |
Net realized gain (loss) from: | | | | |
Investments | | | 19,771,356 | |
Foreign currency transactions | | | 1,396,950 | |
Swap contracts | | | 852,627 | |
| | | | |
Net realized gain (loss) | | | 22,020,933 | |
| | | | |
Net change in unrealized appreciation (depreciation) on: | | | | |
Investments | | | (36,683,141 | ) |
Translation of other assets and liabilities denominated in foreign currencies | | | (1,506,950 | ) |
Change in deferred taxes on unrealized appreciation | | | 198,274 | |
| | | | |
Net change in unrealized appreciation (depreciation) | | | (37,991,817 | ) |
| | | | |
Net realized and unrealized gain (loss) | | | (15,970,884 | ) |
| | | | |
Net increase (decrease) in net assets resulting from operations | | $ | 38,267,298 | |
| | | | |
The accompanying notes are an integral part of these financial statements.
FSI-35
Franklin Templeton Variable Insurance Products Trust
Financial Statements (continued)
Statements of Changes in Net Assets
| | | | | | | | |
| | | Franklin Strategic Income
Securities Fund | |
| | | Year Ended December 31, | |
| | | 2013 | | | 2012 | |
| | | | |
Increase (decrease) in net assets: | | | | | | | | |
Operations: | | | | | | | | |
Net investment income | | $ | 54,238,182 | | | $ | 68,402,114 | |
Net realized gain (loss) from investments, foreign currency transactions and swap contracts | | | 22,020,933 | | | | 28,045,425 | |
Net change in unrealized appreciation (depreciation) on investments, translation of other assets and liabilities denominated in foreign currencies and deferred taxes | | | (37,991,817 | ) | | | 71,828,011 | |
| | | | |
Net increase (decrease) in net assets resulting from operations | | | 38,267,298 | | | | 168,275,550 | |
| | | | |
Distributions to shareholders from: | | | | | | | | |
Net investment income and net foreign currency gains: | | | | | | | | |
Class 1 | | | (54,987,119 | ) | | | (72,486,947 | ) |
Class 2 | | | (10,246,664 | ) | | | (9,567,293 | ) |
Class 4 | | | (10,775,092 | ) | | | (13,446,008 | ) |
Net realized gains: | | | | | | | | |
Class 1 | | | (11,433,439 | ) | | | (1,182,191 | ) |
Class 2 | | | (2,203,428 | ) | | | (160,795 | ) |
Class 4 | | | (2,384,488 | ) | | | (230,338 | ) |
| | | | |
Total distributions to shareholders | | | (92,030,230 | ) | | | (97,073,572 | ) |
| | | | |
Capital share transactions: (Note 2) | | | | | | | | |
Class 1 | | | (275,817,937 | ) | | | (78,499,832 | ) |
Class 2 | | | 23,867,593 | | | | 27,715,617 | |
Class 4 | | | (52,983,286 | ) | | | (2,176,836 | ) |
| | | | |
Total capital share transactions | | | (304,933,630 | ) | | | (52,961,051 | ) |
| | | | |
Net increase (decrease) in net assets | | | (358,696,562 | ) | | | 18,240,927 | |
Net assets: | | | | |
Beginning of year | | | 1,374,466,681 | | | | 1,356,225,754 | |
| | | | |
End of year | | $ | 1,015,770,119 | | | $ | 1,374,466,681 | |
| | | | |
Undistributed net investment income included in net assets: | | | | | | | | |
End of year | | $ | 50,393,655 | | | $ | 68,571,868 | |
| | | | |
The accompanying notes are an integral part of these financial statements.
FSI-36
Franklin Templeton Variable Insurance Products Trust
Notes to Financial Statements
Franklin Strategic Income Securities Fund
1. ORGANIZATION AND SIGNIFICANT ACCOUNTING POLICIES
Franklin Templeton Variable Insurance Products Trust (Trust) is registered under the Investment Company Act of 1940, as amended, (1940 Act) as an open-end investment company, consisting of twenty separate funds. The Franklin Strategic Income Securities Fund (Fund) is included in this report. The financial statements of the remaining funds in the Trust are presented separately. Shares of the Fund are generally sold only to insurance company separate accounts to fund the benefits of variable life insurance policies or variable annuity contracts. At December 31, 2013, 83.74% of the Fund’s shares were held through one insurance company. Investment activities of these insurance company separate accounts could have a material impact on the Fund. The Fund offers three classes of shares: Class 1, Class 2, and Class 4. Each class of shares differs by its distribution fees, voting rights on matters affecting a single class and its exchange privilege.
The following summarizes the Fund’s significant accounting policies.
a. Financial Instrument Valuation
The Fund’s investments in financial instruments are carried at fair value daily. Fair value is the price that would be received to sell an asset or paid to transfer a liability in an orderly transaction between market participants on the measurement date. The Fund calculates the net asset value (NAV) per share at the close of the New York Stock Exchange (NYSE), generally at 4p.m. Eastern time (NYSE close) on each day the NYSE is open for trading. Under procedures approved by the Trust’s Board of Trustees (the Board), the Fund’s administrator, investment manager and other affiliates have formed the Valuation and Liquidity Oversight Committee (VLOC). The VLOC provides administration and oversight of the Fund’s valuation policies and procedures, which are approved annually by the Board. Among other things, these procedures allow the Fund to utilize independent pricing services, quotations from securities and financial instrument dealers, and other market sources to determine fair value.
Equity securities listed on an exchange or on the NASDAQ National Market System are valued at the last quoted sale price or the official closing price of the day, respectively. Foreign equity securities are valued as of the close of trading on the foreign stock exchange on which the security is primarily traded or as of the NYSE close, whichever is earlier. The value is then converted into its U.S. dollar equivalent at the foreign exchange rate in effect at the NYSE close on the day that the value of the security is determined. Over-the-counter (OTC) securities are valued within the range of the most recent quoted bid and ask prices. Securities that trade in multiple markets or on multiple exchanges are valued according to the broadest and most representative market. Certain equity securities are valued based upon fundamental characteristics or relationships to similar securities. Investments in open-end mutual funds are valued at the closing net asset value.
Debt securities generally trade in the OTC market rather than on a securities exchange. The Fund’s pricing services use multiple valuation techniques to determine fair value. In instances where sufficient market activity exists, the pricing services may utilize a market-based approach through which quotes from market makers are used to determine fair value. In instances where sufficient market activity may not exist or is limited, the pricing services also utilize proprietary valuation models which may consider market characteristics such as benchmark yield curves, credit spreads, estimated default rates, anticipated market interest rate volatility, coupon rates, anticipated timing of principal repayments, underlying collateral, and other unique security features in order to estimate the relevant cash flows, which are then discounted to calculate the fair value. Securities denominated in a foreign currency are converted into their U.S. dollar equivalent at the foreign exchange rate in effect at the NYSE close on the date that the values of the foreign debt securities are determined.
Certain derivative financial instruments (derivatives) trade in the OTC market. The Fund’s pricing services use various techniques including industry standard option pricing models and proprietary discounted cash flow models to determine the fair value of those instruments. The Fund’s net benefit or obligation under the derivative contract, as measured by the fair value of the contract, is included in net assets.
The Fund has procedures to determine the fair value of financial instruments for which market prices are not reliable or readily available. Under these procedures, the VLOC convenes on a regular basis to review such financial instruments and considers a number of factors, including significant unobservable valuation inputs, when arriving at fair value. The VLOC primarily employs
FSI-37
Franklin Templeton Variable Insurance Products Trust
Notes to Financial Statements (continued)
Franklin Strategic Income Securities Fund
1. ORGANIZATION AND SIGNIFICANT ACCOUNTING POLICIES (continued)
a. Financial Instrument Valuation (continued)
a market-based approach which may use related or comparable assets or liabilities, recent transactions, market multiples, book values, and other relevant information for the investment to determine the fair value of the investment. An income-based valuation approach may also be used in which the anticipated future cash flows of the investment are discounted to calculate fair value. Discounts may also be applied due to the nature or duration of any restrictions on the disposition of the investments. Due to the inherent uncertainty of valuations of such investments, the fair values may differ significantly from the values that would have been used had an active market existed. The VLOC employs various methods for calibrating these valuation approaches including a regular review of key inputs and assumptions, transactional back-testing or disposition analysis, and reviews of any related market activity.
Trading in securities on foreign securities stock exchanges and OTC markets may be completed before the daily NYSE close. In addition, trading in certain foreign markets may not take place on every NYSE business day. Occasionally, events occur between the time at which trading in a foreign security is completed and the close of the NYSE that might call into question the reliability of the value of a portfolio security held by the Fund. As a result, differences may arise between the value of the Fund’s portfolio securities as determined at the foreign market close and the latest indications of value at the close of the NYSE. In order to minimize the potential for these differences, the VLOC monitors price movements following the close of trading in foreign stock markets through a series of country specific market proxies (such as baskets of American Depositary Receipts, futures contracts and exchange traded funds). These price movements are measured against established trigger thresholds for each specific market proxy to assist in determining if an event has occurred that may call into question the reliability of the values of the foreign securities held by the Fund. If such an event occurs, the securities may be valued using fair value procedures, which may include the use of independent pricing services.
Also, when the last day of the reporting period is a non-business day, certain foreign markets may be open on those days that the NYSE is closed, which could result in differences between the value of the Fund’s portfolio securities on the last business day and the last calendar day of the reporting period. Any significant security valuation changes due to an open foreign market are adjusted and reflected by the Fund for financial reporting purposes.
b. Foreign Currency Translation
Portfolio securities and other assets and liabilities denominated in foreign currencies are translated into U.S. dollars based on the exchange rate of such currencies against U.S. dollars on the date of valuation. The Fund may enter into foreign currency exchange contracts to facilitate transactions denominated in a foreign currency. Purchases and sales of securities, income and expense items denominated in foreign currencies are translated into U.S. dollars at the exchange rate in effect on the transaction date. Portfolio securities and assets and liabilities denominated in foreign currencies contain risks that those currencies will decline in value relative to the U.S. dollar. Occasionally, events may impact the availability or reliability of foreign exchange rates used to convert the U.S. dollar equivalent value. If such an event occurs, the foreign exchange rate will be valued at fair value using procedures established and approved by the Board.
The Fund does not separately report the effect of changes in foreign exchange rates from changes in market prices on securities held. Such changes are included in net realized and unrealized gain or loss from investments on the Statement of Operations.
Realized foreign exchange gains or losses arise from sales of foreign currencies, currency gains or losses realized between the trade and settlement dates on securities transactions and the difference between the recorded amounts of dividends, interest, and foreign withholding taxes and the U.S. dollar equivalent of the amounts actually received or paid. Net unrealized foreign exchange gains and losses arise from changes in foreign exchange rates on foreign denominated assets and liabilities other than investments in securities held at the end of the reporting period.
FSI-38
Franklin Templeton Variable Insurance Products Trust
Notes to Financial Statements (continued)
Franklin Strategic Income Securities Fund
1. ORGANIZATION AND SIGNIFICANT ACCOUNTING POLICIES (continued)
c. Securities Purchased on a When-Issued and Delayed Delivery Basis
The Fund purchases securities on a when-issued and delayed delivery basis, with payment and delivery scheduled for a future date. These transactions are subject to market fluctuations and are subject to the risk that the value at delivery may be more or less than the trade date purchase price. Although the Fund will generally purchase these securities with the intention of holding the securities, it may sell the securities before the settlement date. Sufficient assets have been segregated for these securities.
d. Derivative Financial Instruments
The Fund invested in derivatives in order to manage risk or gain exposure to various other investments or markets. Derivatives are financial contracts based on an underlying or notional amount, require no initial investment or an initial net investment that is smaller than would normally be required to have a similar response to changes in market factors, and require or permit net settlement. Derivatives contain various risks including the potential inability of the counterparty to fulfill their obligations under the terms of the contract, the potential for an illiquid secondary market, and/or the potential for market movements which expose the Fund to gains or losses in excess of the amounts shown on the Statement of Assets and Liabilities. Realized gain and loss and unrealized appreciation and depreciation on these contracts for the period are included in the Statement of Operations.
Derivative counterparty credit risk is managed through a formal evaluation of the creditworthiness of all potential counterparties. The Fund attempts to reduce its exposure to counterparty credit risk on OTC derivatives, whenever possible, by entering into International Swaps and Derivatives Association (ISDA) master agreements with certain counterparties. These agreements contain various provisions, including but not limited to collateral requirements, events of default, or early termination. Termination events applicable to the counterparty include certain deteriorations in the credit quality of the counterparty. Termination events applicable to the Fund include failure of the Fund to maintain certain net asset levels and/or limit the decline in net assets over various periods of time. In the event of default or early termination, the ISDA master agreement gives the non-defaulting party the right to net and close-out all transactions traded, whether or not arising under the ISDA agreement, to one net amount payable by one counterparty to the other. However, absent an event of default or early termination, OTC derivative assets and liabilities are presented gross and not offset in the Statement of Assets and Liabilities. Early termination by the counterparty may result in an immediate payment by the Fund of any net liability owed to that counterparty under the ISDA agreement.
Collateral requirements differ by type of derivative. Collateral terms are contract specific for OTC derivatives. For OTC derivatives traded under an ISDA master agreement, posting of collateral is required by either the fund or the applicable counterparty if the total net exposure of all OTC derivatives with the applicable counterparty exceeds the minimum transfer amount, which typically ranges from $100,000 to $250,000, and can vary depending on the counterparty and the type of the agreement. Generally, collateral is determined at the close of fund business each day and any additional collateral required due to changes in derivative values may be delivered by the fund or the counterparty within a few business days. Collateral pledged and/or received by the fund, if any, is held in segregated accounts with the fund’s custodian/counterparty broker and can be in the form of cash and/or securities. Unrestricted cash may be invested according to the Fund’s investment objectives.
The Fund entered into OTC forward exchange contracts primarily to manage and/or gain exposure to certain foreign currencies. A forward exchange contract is an agreement between the Fund and a counterparty to buy or sell a foreign currency at a specific exchange rate on a future date.
The Fund entered into credit default swap contracts primarily to manage exposure to credit risk. A credit default swap is an agreement between the Fund and a counterparty whereby the buyer of the contract receives credit protection and the seller of the contract guarantees the credit worthiness of a referenced debt obligation. These agreements may be privately negotiated in the over-the-counter market (“OTC credit default swaps”) or may be executed in a multilateral trade facility platform, such as a registered exchange (“centrally cleared credit default swaps”). The underlying referenced debt obligation may be a single issuer of corporate or sovereign debt, a credit index, or a tranche of a credit index. In the event of a default of the underlying referenced
FSI-39
Franklin Templeton Variable Insurance Products Trust
Notes to Financial Statements (continued)
Franklin Strategic Income Securities Fund
1. ORGANIZATION AND SIGNIFICANT ACCOUNTING POLICIES (continued)
d. Derivative Financial Instruments (continued)
debt obligation, the buyer is entitled to receive the notional amount of the credit default swap contract from the seller in exchange for the referenced debt obligation, a net settlement amount equal to the notional amount of the credit default swap less the recovery value of the referenced debt obligation, or other agreed upon amount. For centrally cleared credit default swaps, required initial margins are pledged by the Fund, and the daily change in fair value is accounted for as a variation margin payable or receivable on the Statement of Assets and Liabilities. Over the term of the contract, the buyer pays the seller a periodic stream of payments, provided that no event of default has occurred. Such periodic payments are accrued daily as an unrealized appreciation or depreciation until the payments are made, at which time they are realized. Payments received or paid to initiate a credit default swap contract are reflected on the Statement of Assets and Liabilities and represent compensating factors between stated terms of the credit default swap agreement and prevailing market conditions (credit spreads and other relevant factors). These upfront payments are amortized over the term of the contract as a realized gain or loss on the Statement of Operations.
See Note 10 regarding other derivative information.
e. Restricted Cash
At December 31, 2013, the Fund received restricted cash in connection with investments in certain derivative securities. Restricted cash is held in a segregated account with the Fund’s custodian and is reflected in the Statement of Assets and Liabilities.
f. Loan Participation Notes
The Fund invests in loan participation notes (“Participations”). Participations are loans originally issued to a borrower by one or more financial institutions (the “Lender”) and subsequently sold to other investors, such as the Fund. Participations typically result in the Fund having a contractual relationship only with the Lender and not with the borrower. The Fund has the right to receive from the Lender any payments of principal, interest and fees which the Lender received from the borrower. The Fund generally has no rights to either enforce compliance by the borrower with the terms of the loan agreement or to any collateral relating to the original loan. As a result, the Fund assumes the credit risk of both the borrower and the Lender that is selling the Participation. The Participations may also involve interest rate risk and liquidity risk, including the potential default or insolvency of the borrower and/or the Lender.
g. FT Holdings Corporation III (FT Subsidiary)
The Fund invests in certain financial instruments through its investment in the FT Subsidiary. The FT Subsidiary is a Delaware Corporation, is a wholly-owned subsidiary of the Fund, and is able to invest in certain financial instruments consistent with the investment objective of the Fund. At December 31, 2013, the FT Subsidiary’s investment, Turtle Bay Resort, as well as any other assets and liabilities of the FT Subsidiary are reflected in the Fund’s Statement of Investments and Statement of Assets and Liabilities. The financial statements have been consolidated and include the accounts of the Fund and the FT Subsidiary. All intercompany transactions and balances have been eliminated.
h. Mortgage Dollar Rolls
The Fund enters into mortgage dollar rolls, typically on a to-be-announced basis. Mortgage dollar rolls are agreements between the Fund and a financial institution to simultaneously sell and repurchase mortgage-backed securities at a future date. Gains or losses are realized on the initial sale, and the difference between the repurchase price and the sale price is recorded as an unrealized gain or loss to the Fund upon entering into the mortgage dollar roll. In addition, the Fund may invest the cash
FSI-40
Franklin Templeton Variable Insurance Products Trust
Notes to Financial Statements (continued)
Franklin Strategic Income Securities Fund
1. ORGANIZATION AND SIGNIFICANT ACCOUNTING POLICIES (continued)
h. Mortgage Dollar Rolls (continued)
proceeds that are received from the initial sale. During the period between the sale and repurchase, the Fund is not entitled to principal and interest paid on the mortgage backed securities. The risks of mortgage dollar roll transactions include the potential inability of the counterparty to fulfill its obligations.
i. Senior Floating Rate Interests.
The Fund invests in senior secured corporate loans that pay interest at rates which are periodically reset by reference to a base lending rate plus a spread. These base lending rates are generally the prime rate offered by a designated U.S. bank or the London InterBank Offered Rate (LIBOR). Senior secured corporate loans often require prepayment of principal from excess cash flows or at the discretion of the borrower. As a result, actual maturity may be substantially less than the stated maturity.
Senior secured corporate loans in which the Fund invests are generally readily marketable, but may be subject to certain restrictions on resale.
j. Income and Deferred Taxes
It is the Fund’s policy to qualify as a regulated investment company under the Internal Revenue Code. The Fund intends to distribute to shareholders substantially all of its taxable income and net realized gains to relieve it from federal income and if applicable, excise taxes. As a result, no provision for U.S. federal income taxes is required.
The Fund may be subject to foreign taxation related to income received, capital gains on the sale of securities and certain foreign currency transactions in the foreign jurisdictions in which it invests. Foreign taxes, if any, are recorded based on the tax regulations and rates that exist in the foreign markets in which the Fund invests. When a capital gain tax is determined to apply the Fund records an estimated deferred tax liability in an amount that would be payable if the securities were disposed of on the valuation date.
The Fund recognizes the tax benefits of uncertain tax positions only when the position is “more likely than not” to be sustained upon examination by the tax authorities based on the technical merits of the tax position. As of December 31, 2013, and for all open tax years, the Fund has determined that no liability for unrecognized tax benefits is required in the Fund’s financial statements related to uncertain tax positions taken on a tax return (or expected to be taken on future tax returns). Open tax years are those that remain subject to examination and are based on each tax jurisdiction statute of limitation.
k. Security Transactions, Investment Income, Expenses and Distributions
Security transactions are accounted for on trade date. Realized gains and losses on security transactions are determined on a specific identification basis. Interest income and estimated expenses are accrued daily. Amortization of premium and accretion of discount on debt securities are included in interest income. Facility fees are recognized as income over the expected term of the loan. Dividend income is recorded on the ex-dividend date. Distributions to shareholders are recorded on the ex-dividend date and are determined according to income tax regulations (tax basis). Distributable earnings determined on a tax basis may differ from earnings recorded in accordance with accounting principles generally accepted in the United States of America. These differences may be permanent or temporary. Permanent differences are reclassified among capital accounts to reflect their tax character. These reclassifications have no impact on net assets or the results of operations. Temporary differences are not reclassified, as they may reverse in subsequent periods.
Common expenses incurred by the Trust are allocated among the funds based on the ratio of net assets of each fund to the combined net assets of the Trust. Fund specific expenses are charged directly to the fund that incurred the expense.
FSI-41
Franklin Templeton Variable Insurance Products Trust
Notes to Financial Statements (continued)
Franklin Strategic Income Securities Fund
1. ORGANIZATION AND SIGNIFICANT ACCOUNTING POLICIES (continued)
k. Security Transactions, Investment Income, Expenses and Distributions (continued)
Realized and unrealized gains and losses and net investment income, not including class specific expenses, are allocated daily to each class of shares based upon the relative proportion of net assets of each class. Differences in per share distributions, by class, are generally due to differences in class specific expenses.
Inflation-indexed bonds are adjusted for inflation through periodic increases or decreases in the security’s interest accruals, face amount, or principal redemption value, by amounts corresponding to the rate of inflation as measured by an index. Any increase or decrease in the face amount or principal redemption value will be included as interest income on the Statement of Operations.
l. Accounting Estimates
The preparation of financial statements in accordance with accounting principles generally accepted in the United States of America requires management to make estimates and assumptions that affect the reported amounts of assets and liabilities at the date of the financial statements and the amounts of income and expenses during the reporting period. Actual results could differ from those estimates.
m. Guarantees and Indemnifications
Under the Trust’s organizational documents, its officers and trustees are indemnified by the Trust against certain liabilities arising out of the performance of their duties to the Trust. Additionally, in the normal course of business, the Trust, on behalf of the Fund, enters into contracts with service providers that contain general indemnification clauses. The Trust’s maximum exposure under these arrangements is unknown as this would involve future claims that may be made against the Trust that have not yet occurred. Currently, the Trust expects the risk of loss to be remote.
2. SHARES OF BENEFICIAL INTEREST
At December 31, 2013, there were an unlimited number of shares authorized (without par value). Transactions in the Fund’s shares were as follows:
| | | | | | | | | | | | | | | | |
| | | Year Ended December 31, | |
| | | 2013 | | | 2012 | |
| Class 1 Shares: | | Shares | | | Amount | | | Shares | | | Amount | |
Shares sold | | | 782,903 | | | $ | 10,091,023 | | | | 3,209,922 | | | $ | 41,235,226 | |
Shares issued in reinvestment of distributions | | | 5,373,832 | | | | 66,420,558 | | | | 6,063,304 | | | | 73,669,138 | |
Shares redeemed | | | (27,765,536 | ) | | | (352,329,518 | ) | | | (14,997,522 | ) | | | (193,404,196 | ) |
| | | | |
Net increase (decrease) | | | (21,608,801 | ) | | $ | (275,817,937 | ) | | | (5,724,296 | ) | | $ | (78,499,832 | ) |
| | | | |
Class 2 Shares: | | | | | | | | | | | | | | | | |
Shares sold | | | 4,461,765 | | | $ | 56,022,684 | | | | 3,441,994 | | | $ | 43,341,865 | |
Shares issued in reinvestment of distributions | | | 1,034,061 | | | | 12,450,092 | | | | 819,552 | | | | 9,728,087 | |
Shares redeemed | | | (3,579,730 | ) | | | (44,605,183 | ) | | | (2,012,180 | ) | | | (25,354,335 | ) |
| | | | |
Net increase (decrease) | | | 1,916,096 | | | $ | 23,867,593 | | | | 2,249,366 | | | $ | 27,715,617 | |
| | | | |
Class 4 Shares: | | | | | | | | | | | | | | | | |
Shares sold | | | 930,235 | | | $ | 11,782,444 | | | | 1,353,603 | | | $ | 17,206,420 | |
Shares issued on reinvestment of distributions | | | 1,074,251 | | | | 13,159,580 | | | | 1,134,025 | | | | 13,676,347 | |
Shares redeemed | | | (6,283,838 | ) | | | (77,925,310 | ) | | | (2,599,542 | ) | | | (33,059,603 | ) |
| | | | |
Net increase (decrease) | | | (4,279,352 | ) | | $ | (52,983,286 | ) | | | (111,914 | ) | | $ | (2,176,836 | ) |
| | | | |
FSI-42
Franklin Templeton Variable Insurance Products Trust
Notes to Financial Statements (continued)
Franklin Strategic Income Securities Fund
3. TRANSACTIONS WITH AFFILIATES
Franklin Resources, Inc. is the holding company for various subsidiaries that together are referred to as Franklin Templeton Investments. Certain officers and trustees of the Fund are also officers and/or directors of the following subsidiaries:
| | |
| Subsidiary | | Affiliation |
Franklin Advisers, Inc. (Advisers) | | Investment manager |
Franklin Templeton Services, LLC (FT Services) | | Administrative manager |
Franklin Templeton Distributors, Inc. (Distributors) | | Principal underwriter |
Franklin Templeton Investor Services, LLC (Investor Services) | | Transfer agent |
a. Management Fees
The Fund pays an investment management fee to Advisers based on the average daily net assets of the Fund as follows:
| | |
| Annualized Fee Rate | | Net Assets |
| 0.625% | | Up to and including $500 million |
| 0.525% | | Over $500 million, up to and including $1 billion |
| 0.480% | | Over $1 billion, up to and including $1.5 billion |
| 0.435% | | Over $1.5 billion, up to and including $6.5 billion |
| 0.415% | | Over $6.5 billion, up to and including $11.5 billion |
| 0.400% | | Over $11.5 billion, up to and including $16.5 billion |
| 0.390% | | Over $16.5 billion, up to and including $19 billion |
| 0.380% | | Over $19 billion, up to and including $21.5 billion |
| 0.370% | | In excess of $21.5 billion |
Effective May 1, 2013, the Fund combined its investment management and administration agreements as approved by the Board. The fees paid under the combined agreement do not exceed the aggregate fees that were paid under the separate agreements.
Prior to May 1, 2013, the Fund paid fees to Advisers based on the average daily net assets of the Fund as follows:
| | |
| Annualized Fee Rate | | Net Assets |
| 0.425% | | Up to and including $500 million |
| 0.325% | | Over $500 million, up to and including $1 billion |
| 0.280% | | Over $1 billion, up to and including $1.5 billion |
| 0.235% | | Over $1.5 billion, up to and including $6.5 billion |
| 0.215% | | Over $6.5 billion, up to and including $11.5 billion |
| 0.200% | | Over $11.5 billion, up to and including $16.5 billion |
| 0.190% | | Over $16.5 billion, up to and including $19 billion |
| 0.180% | | Over $19 billion, up to and including $21.5 billion |
| 0.170% | | In excess of $21.5 billion |
b. Administrative Fees
Effective May 1, 2013, under an agreement with Advisers, FT Services provides administrative services to the Fund. The fee is paid by Advisers based on the average daily net assets, and is not an additional expense of the Fund.
Prior to May 1, 2013, the Fund paid administrative fees to FT Services of 0.20% per year of the average daily net assets of the Fund.
FSI-43
Franklin Templeton Variable Insurance Products Trust
Notes to Financial Statements (continued)
Franklin Strategic Income Securities Fund
3. TRANSACTIONS WITH AFFILIATES (continued)
c. Distribution Fees
The Board has adopted distribution plans for Class 2 and Class 4 shares pursuant to Rule 12b-1 under the 1940 Act. Under the Fund’s compensation distribution plans, the Fund pays Distributors for costs incurred in connection with the servicing, sale and distribution of the Fund’s shares up to 0.25%, and 0.35% per year of its average daily net assets of Class 2 and Class 4, respectively. Some distribution fees are not charged on shares held by affiliates.
d. Transfer Agent Fees
Investor Services, under terms of an agreement, performs shareholder servicing for the Fund and is not paid by the Fund for the services.
4. EXPENSE OFFSET ARRANGEMENT
The Fund has entered into an arrangement with its custodian whereby credits realized as a result of uninvested cash balances are used to reduce a portion of the Fund’s custodian expenses. During the year ended December 31, 2013, the custodian fees were reduced as noted in the Statement of Operations.
5. INCOME TAXES
The tax character of distributions paid during the years ended December 31, 2013 and 2012, was as follows:
| | | | | | | | |
| | | 2013 | | | 2012 | |
Distributions paid from: | | | | | | | | |
Ordinary income | | $ | 79,686,221 | | | $ | 95,500,248 | |
Long term capital gain | | | 12,344,009 | | | | 1,573,324 | |
| | | | |
| | $ | 92,030,230 | | | $ | 97,073,572 | |
| | | | |
At December 31, 2013, the cost of investments, net unrealized appreciation (depreciation), undistributed ordinary income and undistributed long term capital gains for income tax purposes were as follows:
| | | | |
Cost of investments | | $ | 976,533,231 | |
| | | | |
| |
Unrealized appreciation | | $ | 42,642,179 | |
Unrealized depreciation | | | (17,580,271 | ) |
| | | | |
Net unrealized appreciation (depreciation) | | $ | 25,061,908 | |
| | | | |
Undistributed ordinary income | | $ | 55,929,395 | |
Undistributed long term capital gains | | | 17,502,629 | |
| | | | |
Distributable earnings | | $ | 73,432,024 | |
| | | | |
Differences between income and/or capital gains as determined on a book basis and a tax basis are primarily due to differing treatments of paydown losses, bond discounts and premiums and tax straddles.
6. INVESTMENT TRANSACTIONS
Purchases and sales of investments (excluding short term securities) for the year ended December 31, 2013, aggregated $511,601,048 and $817,698,989, respectively.
FSI-44
Franklin Templeton Variable Insurance Products Trust
Notes to Financial Statements (continued)
Franklin Strategic Income Securities Fund
7. INVESTMENTS IN INSTITUTIONAL FIDUCIARY TRUST MONEY MARKET PORTFOLIO
The Fund invests in the Institutional Fiduciary Trust Money Market Portfolio (Sweep Money Fund), an open-end investment company managed by Advisers. Management fees paid by the Fund are reduced on assets invested in the Sweep Money Fund, in an amount not to exceed the management and administrative fees paid by the Sweep Money Fund.
8. CREDIT RISK AND DEFAULTED SECURITIES
At December 31, 2013, the Fund had 51.61% of its portfolio invested in high yield securities, senior secured floating rate notes, or other securities rated below investment grade. These securities may be more sensitive to economic conditions causing greater price volatility and are potentially subject to a greater risk of loss due to default than higher rated securities.
The Fund held a defaulted security and/or other securities for which the income has been deemed uncollectible. At December 31, 2013, the value of this security represents less than 0.05% of the Fund’s net assets. The Fund discontinues accruing income on securities for which income has been deemed uncollectible and provides an estimate for losses on interest receivable. The security has been identified on the accompanying Statement of Investments.
9. UNFUNDED LOAN COMMITMENTS
The Fund enters into certain credit agreements, all or a portion of which may be unfunded. The Fund is obligated to fund these loan commitments at the borrowers’ discretion. Funded portions of credit agreements are presented on the Statement of Investments.
At December 31, 2013, unfunded commitments were as follows:
| | | | |
| Borrower | | Unfunded
Commitment | |
Patriot Coal Corp., Reimbursement Obligation, 9.50%, 1/17/14 | | $ | 285,464 | |
| | | | |
Unfunded loan commitments and funded portions of credit agreements are marked to market daily and any unrealized appreciation or depreciation is included in the Statement of Assets and Liabilities and the Statement of Operations.
10. OTHER DERIVATIVE INFORMATION
At December 31, 2013 the Fund's investments in derivative contracts are reflected on the Statement of Assets and Liabilities as follows:
| | | | | | | | | | | | |
| | | Asset Derivatives | | | Liability Derivatives | |
Derivative Contracts Not Accounted
for as Hedging Instruments | | Statement of Assets and
Liabilities Location | | Fair Value
Amount | | | Statement of Assets and
Liabilities Location | | Fair Value
Amount | |
Foreign exchange contracts | | Unrealized appreciation on forward exchange contracts | | $ | 5,467,485 | | | Unrealized depreciation on forward exchange contracts | | $ | 6,077,369 | |
Credit contracts | | Unrealized appreciation on OTC swap contracts | | | 247,300 | | | Unrealized depreciation on OTC swap contracts | | | — | |
FSI-45
Franklin Templeton Variable Insurance Products Trust
Notes to Financial Statements (continued)
Franklin Strategic Income Securities Fund
10. OTHER DERIVATIVE INFORMATION (continued)
For the period ended December 31, 2013 the effect of derivative contracts on the Fund’s Statement of Operations was as follows:
| | | | | | | | | | |
Derivative Contracts Not Accounted
for as Hedging Instruments | | Statement of Operations Locations | | Realized Gain
(Loss) for the
Year | | | Change in
Unrealized
Appreciation
(Depreciation)
for the
Year | |
Foreign exchange contracts | | Net realized gain (loss) from foreign currency transactions /
Net change in unrealized appreciation (depreciation) on translation of other assets and liabilities denominated in foreign currencies | | $ | 2,250,891 | | | ($ | 1,478,379 | ) |
Credit contracts | | Net realized gain (loss) from swap contracts /
Net change in unrealized appreciation (depreciation) on investments | | | 852,627 | | | | 240,077 | |
At December 31, 2013 the Fund's OTC derivative assets and liabilities, are as follows:
| | | | | | | | |
| | | Gross and Net Amounts of
Assets and Liabilities Presented
in the Statement of Assets
and Liabilities | |
| | | Assetsa | | | Liabilitiesa | |
Derivatives | | | | | | | | |
Forward exchange contracts | | $ | 5,467,485 | | | $ | 6,077,369 | |
Swap Contracts | | | 247,300 | | | | 1,076,312 | |
| | | | |
Total | | $ | 5,714,785 | | | $ | 7,153,681 | |
| | | | |
| a | Absent an event of default or early termination, OTC derivative assets and liabilities are presented gross and not offset in the Statement of Assets & Liabilities. |
At December 31, 2013 the Fund's OTC derivative assets which may be offset against the Fund's derivative liabilities, and collateral received from the counterparty, is as follows:
| | | | | | | | | | | | | | | | | | | | |
| | | | | | Amounts Not Offset in the Statement of
Assets & Liabilities | | | | |
| | | Gross and Net
Amounts of Assets
Presented in the
Statement of Assets
& Liabilities | | | Financial
Instruments
Available for
Offset | | | Financial
Instruments
Collateral
Received a,b | | | Cash
Collateral
Receivedb | | | Net
Amount
(Not less
than zero) | |
Counterparty | | | | | | | | | | | | | | | | | | | | |
BZWS | | $ | 707,006 | | | $ | (707,006 | ) | | $ | — | | | $ | — | | | $ | — | |
CITI | | | 231,153 | | | | (231,153 | ) | | | — | | | | — | | | | | |
DBAB | | | 1,375,453 | | | | (1,375,453 | ) | | | — | | | | — | | | | — | |
FBCO | | | 216,038 | | | | (216,038 | ) | | | — | | | | — | | | | — | |
GSCO | | | 56,478 | | | | — | | | | — | | | | — | | | | 56,478 | |
HSBC | | | 840,027 | | | | (87,000 | ) | | | (691,773 | ) | | | — | | | | 61,254 | |
JPHQ | | | 1,051,930 | | | | (713,620 | ) | | | (338,310 | ) | | | — | | | | — | |
MSCO | | | 6,791 | | | | (6,791 | ) | | | — | | | | — | | | | — | |
UBSW | | | 1,229,909 | | | | (1,017,616 | ) | | | (120,002 | ) | | | — | | | | 92,291 | |
| | | | |
Total | | $ | 5,714,785 | | | $ | (4,354,677 | ) | | $ | (1,150,085 | ) | | $ | — | | | $ | 210,023 | |
| | | | |
| aAt | December 31, 2013 the Fund received United Kingdom Treasury Bonds and Notes and U.S. Treasury Bonds and Notes as collateral for derivatives. |
FSI-46
Franklin Templeton Variable Insurance Products Trust
Notes to Financial Statements (continued)
Franklin Strategic Income Securities Fund
10. OTHER DERIVATIVE INFORMATION (continued)
| bIn | some instances, the collateral amounts disclosed in the table above were adjusted due to the requirement to limit the collateral amounts to avoid the effect of overcollateralization. Actual collateral received and/or pledged may be more than the amounts disclosed herein. |
At December 31, 2013 the Fund's OTC derivative liabilities which may be offset against the Fund's derivative assets, and collateral pledged to the counterparty, is as follows:
| | | | | | | | | | | | | | | | | | | | |
| | | | | | Amounts Not Offset in the Statement of
Assets & Liabilities | | | | |
| | | Gross and Net
Amounts of Liabilities
Presented in the
Statement of Assets
& Liabilities | | | Financial
Instruments
Available for
Offset | | | Financial
Instruments
Collateral
Pledged | | | Cash
Collateral
Pledgeda | | | Net
Amount
(Not less
than zero) | |
Counterparty | | | | | | | | | | | | | | | | | | | | |
BZWS | | $ | 928,166 | | | $ | (707,006 | ) | | $ | — | | | $ | (221,160 | ) | | $ | — | |
CITI | | | 337,078 | | | | (231,153 | ) | | | — | | | | (105,925 | ) | | | — | |
DBAB | | | 3,202,961 | | | | (1,375,453 | ) | | | — | | | | (1,740,000 | ) | | | 87,508 | |
FBCO | | | 832,641 | | | | (216,038 | ) | | | — | | | | (616,603 | ) | | | — | |
GSCO | | | — | | | | — | | | | — | | | | — | | | | — | |
HSBC | | | 87,000 | | | | (87,000 | ) | | | — | | | | — | | | | — | |
JPHQ | | | 713,620 | | | | (713,620 | ) | | | — | | | | — | | | | — | |
MSCO | | | 34,599 | | | | (6,791 | ) | | | — | | | | — | | | | 27,808 | |
UBSW | | | 1,017,616 | | | | (1,017,616 | ) | | | — | | | | — | | | | — | |
| | | | |
Total | | $ | 7,153,681 | | | $ | (4,354,677 | ) | | $ | — | | | $ | (2,683,688 | ) | | $ | 115,316 | |
| | | | |
| aIn | some instances, the collateral amounts disclosed in the table above were adjusted due to the requirement to limit the collateral amounts to avoid the effect of overcollateralization. Actual collateral received and/or pledged may be more than the amounts disclosed herein. |
For the year ended December 31, 2013 the average month end fair value of derivatives represented 0.94% of average month end net assets. The average month end number of open derivative contracts for the year was 233.
See Note 1(d) regarding derivative financial instruments.
11. CREDIT FACILITY
The Fund, together with other U.S. registered and foreign investment funds (collectively, Borrowers), managed by Franklin Templeton Investments, are borrowers in a joint syndicated senior unsecured credit facility totaling $1.5 billion (Global Credit Facility) which, after an extension of the original terms, matured on February 14, 2014. This Global Credit Facility provides a source of funds to the Borrowers for temporary and emergency purposes, including the ability to meet future unanticipated or unusually large redemption requests. Effective February 14, 2014, the Borrowers renewed the Global Credit Facility which matures on January 16, 2015.
Under the terms of the Global Credit Facility, the Fund shall, in addition to interest charged on any borrowings made by the Fund and other costs incurred by the Fund, pay its share of fees and expenses incurred in connection with the implementation and maintenance of the Global Credit Facility, based upon its relative share of the aggregate net assets of all of the Borrowers, including an annual commitment fee of 0.07% based upon the unused portion of the Global Credit Facility. These fees are reflected in other expenses on the Statement of Operations. During the year ended December 31, 2013, the Fund did not use the Global Credit Facility.
FSI-47
Franklin Templeton Variable Insurance Products Trust
Notes to Financial Statements (continued)
Franklin Strategic Income Securities Fund
12. FAIR VALUE MEASUREMENTS
The Fund follows a fair value hierarchy that distinguishes between market data obtained from independent sources (observable inputs) and the Fund’s own market assumptions (unobservable inputs). These inputs are used in determining the value of the Fund’s financial instruments and are summarized in the following fair value hierarchy:
| | • | | Level 1 – quoted prices in active markets for identical financial instruments |
| | • | | Level 2 – other significant observable inputs (including quoted prices for similar financial instruments, interest rates, prepayment speed, credit risk, etc.) |
| | • | | Level 3 – significant unobservable inputs (including the Fund’s own assumptions in determining the fair value of financial instruments) |
The input levels are not necessarily an indication of the risk or liquidity associated with financial instruments at that level.
For movements between the levels within the fair value hierarchy, the Fund has adopted a policy of recognizing the transfers as of the date of the underlying event which caused the movement.
A summary of inputs used as of December 31, 2013, in valuing the Fund’s assets and liabilities carried at fair value, is as follows:
| | | | | | | | | | | | | | | | |
| | | Level 1 | | | Level 2 | | | Level 3 | | | Total | |
| | | | |
Assets: | | | | | | | | | | | | | | | | |
Investments in Securities: | | | | | | | | | | | | | | | | |
Equity Investments:a | | | | | | | | | | | | | | | | |
Consumer Services | | $ | — | | | $ | 1,749,333 | | | $ | — | | | $ | 1,749,333 | |
Energy | | | — | | | | 92,096 | | | | — | | | | 92,096 | |
Materials | | | — | | | | 900,000 | | | | — | | | | 900,000 | |
Transportation | | | — | | | | 682,100 | | | | — | | | | 682,100 | |
Other Equity Investmentsb | | | 668,500 | | | | — | | | | — | c | | | 668,500 | |
Corporate Bonds | | | — | | | | 403,698,100 | | | | — | | | | 403,698,100 | |
Senior Floating Rate Interests | | | — | | | | 121,046,862 | | | | 178,471 | c | | | 121,225,333 | |
Foreign Government and Agency Securities | | | — | | | | 189,812,024 | | | | — | | | | 189,812,024 | |
U.S. Government and Agency Securities | | | — | | | | 21,275,865 | | | | — | | | | 21,275,865 | |
Asset-Backed Securities and Commercial Mortgage-Backed Securities | | | — | | | | 41,348,170 | | | | — | | | | 41,348,170 | |
Mortgage-Backed Securities | | | — | | | | 44,636,263 | | | | — | | | | 44,636,263 | |
Municipal Bonds | | | — | | | | 56,733,001 | | | | — | | | | 56,733,001 | |
Short Term Investments | | | 87,788,340 | | | | 30,986,014 | | | | — | | | | 118,774,354 | |
| | | | |
Total Investments in Securities | | $ | 88,456,840 | | | $ | 912,959,828 | | | $ | 178,471 | | | $ | 1,001,595,139 | |
| | | | |
Forward Exchange Contracts | | | — | | | | 5,467,485 | | | | — | | | | 5,467,485 | |
Unfunded Loan Commitments | | | — | | | | 4,611 | | | | — | | | | 4,611 | |
Swaps | | | — | | | | 247,300 | | | | — | | | | 247,300 | |
Liabilities: | | | | | | | | | | | | | | | | |
Forward Exchange Contracts | | | — | | | | 6,077,369 | | | | — | | | | 6,077,369 | |
aIncludes common, preferred, and convertible preferred stocks as well as other equity investments.
bFor detailed categories, see the accompanying Statement of Investments.
cIncludes securities determined to have no value at December 31, 2013.
A reconciliation of assets in which Level 3 inputs are used in determining fair value is presented when there are significant Level 3 investments at the end of the period.
FSI-48
Franklin Templeton Variable Insurance Products Trust
Notes to Financial Statements (continued)
Franklin Strategic Income Securities Fund
13. NEW ACCOUNTING PRONOUNCEMENTS
In June 2013, the Financial Accounting Standards Board issued Accounting Standards Update (ASU) No. 2013-08, Investment Companies (Topic 946): Amendments to the Scope, Measurement, and Disclosure Requirements. The ASU modifies the criteria used in defining an investment company under U.S. Generally Accepted Accounting Principles and also sets forth certain measurement and disclosure requirements. Under the ASU, an entity that is registered under the 1940 Act automatically qualifies as an investment company. The ASU is effective for interim and annual reporting periods beginning after December 15, 2013. Management has reveiwed the requirements and believes the adoption of this ASU will not have a material impact on the financial statements.
14. SUBSEQUENT EVENTS
The Fund has evaluated subsequent events through the issuance of the financial statements and determined that no events have occurred that require disclosure other than those already disclosed in the financial statements.
| | | | |
ABBREVIATIONS | | | | |
| Counterparty | | Currency | | Selected Portfolio |
| | | | |
| BZWS - Barclays Bank PLC | | BRL - Brazilian Real | | AGMC - Assured Guaranty Municipal Corp. |
| CITI - Citigroup, Inc. | | CAD - Canadian Dollar | | CDO - Collateralized Debt Obligation |
| DBAB - Deutsche Bank AG | | EUR - Euro | | CLO - Collateralized Loan Obligation |
| FBCO - Credit Suisse Group AG | | GBP - British Pound | | DIP - Debtor-In-Possession |
| GSCO - The Goldman Sachs Group, Inc. | | HUF - Hungarian Forint | | EDA - Economic Development Authority |
| HSBC - HSBC Bank USA, N.A. | | IDR - Indonesian Rupiah | | FGIC - Financial Guaranty Insurance Co. |
| JPHQ - JP Morgan Chase & Co. | | KRW - South Korean Won | | FICO - Financing Corp. |
| MSCO - Morgan Stanley | | LKR - Sri Lankan Rupee | | FRN - Floating Rate Note |
| UBSW - UBS AG | | MXN - Mexican Peso | | GO - General Obligation |
| | MYR - Malaysian Ringgit | | HDC - Housing Development Corp. |
| | PHP - Philippine Peso | | ISD - Independent School District |
| | PLN - Polish Zloty | | L/C - Letter of Credit |
| | SEK - Swedish Krona | | NATL - National Public Financial Guarantee Corp. |
| | SGD - Singapore Dollar | | NATL RE - National Public Financial Guarantee Corp. Reinsured |
| | UYU - Uruguayan Peso | | PIK - Payment-In-Kind |
| | | | PSF - Permanent School Fund |
| | | | SF - Single Family |
FSI-49
Franklin Templeton Variable Insurance Products Trust
Franklin Strategic Income Securities Fund
Report of Independent Registered Public Accounting Firm
To the Board of Trustees and Shareholders of
Franklin Templeton Variable Insurance Products Trust
In our opinion, the accompanying statement of assets and liabilities, including the statement of investments, and the related statements of operations and of changes in net assets and the financial highlights present fairly, in all material respects, the financial position of Franklin Strategic Income Securities Fund (the "Fund") at December 31, 2013, the results of its operations for the year then ended, the changes in its net assets for each of the two years in the period then ended and the financial highlights for each of the five years in the period then ended, in conformity with accounting principles generally accepted in the United States of America. These financial statements and financial highlights (hereafter referred to as "financial statements") are the responsibility of the Fund's management. Our responsibility is to express an opinion on these financial statements based on our audits. We conducted our audits of these financial statements in accordance with the standards of the Public Company Accounting Oversight Board (United States). Those standards require that we plan and perform the audit to obtain reasonable assurance about whether the financial statements are free of material misstatement. An audit includes examining, on a test basis, evidence supporting the amounts and disclosures in the financial statements, assessing the accounting principles used and significant estimates made by management, and evaluating the overall financial statement presentation. We believe that our audits, which included confirmation of securities at December 31, 2013 by correspondence with the custodian and brokers, provide a reasonable basis for our opinion.
PricewaterhouseCoopers LLP
San Francisco, California
February 14, 2014
FSI-50
Franklin Templeton Variable Insurance Products Trust
Tax Information (unaudited)
Franklin Strategic Income Securities Fund
Under Section 852(b)(3)(C) of the Internal Revenue Code, the Fund hereby reports the maximum amount allowable but no less than $12,344,009 as a long term capital gain dividend for the fiscal year ended December 31, 2013.
FSI-51
FRANKLIN TEMPLETON VIP FOUNDING FUNDS ALLOCATION FUND
This annual report for Franklin Templeton VIP Founding Funds Allocation Fund covers the period ended December 31, 2013.
Performance Summary as of 12/31/13
Average annual total return of Class 4 shares* represents the average annual change in value, assuming reinvestment of dividends and capital gains. Average returns smooth out variations in returns, which can be significant; they are not the same as year-by-year results.
Periods ended 12/31/13
| | | | | | | | | | | | |
| | | 1-Year | | | 5-Year | | | Inception
(7/2/07) | |
Average Annual Total Return | | | +23.68% | | | | +14.96% | | | | +2.87% | |
*For the period beginning 2/29/08, Class 4 performance reflects a 12b-1 fee expense of 0.35% per year, which affects future performance. Class 4 performance prior to 2/29/08 reflects historical Class 1 performance, which does not have a 12b-1 fee expense. Since 2/29/08 (effective date), the average annual total return of Class 4 shares was +5.80%. The Fund has an expense reduction contractually guaranteed through at least 4/30/14. Fund investment results reflect the expense reduction, to the extent applicable; without this reduction, the results would have been lower.
Total Return Index Comparison for a Hypothetical $10,000 Investment (7/2/07–12/31/13)
The graph below shows the change in value of a hypothetical $10,000 investment in the Fund over the indicated period and includes reinvestment of any income or distributions. The Fund’s performance* is compared to the performance of the Standard & Poor’s® 500 Index (S&P 500®) and the MSCI World Index. One cannot invest directly in an index, and an index is not representative of the Fund’s portfolio. Please see Important Notes to Performance Information preceding the Fund Summaries.
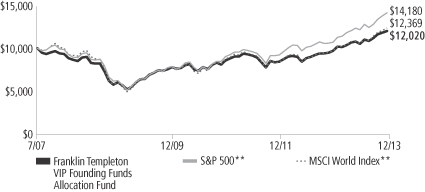
**Source: © 2014 Morningstar. Please see Index Descriptions following the Fund Summaries.
Franklin Templeton VIP Founding Funds Allocation Fund – Class 4
Performance reflects the Fund’s Class 4 operating expenses, but does not include any contract fees, expenses or sales charges. If they had been included, performance would be lower. These charges and deductions, particularly for variable life policies, can have a significant effect on contract values and insurance benefits. See the contract prospectus for a complete description of these expenses, including sales charges.
Performance data represent past performance, which does not guarantee future results. Investment return and principal value will fluctuate, and you may have a gain or loss when you sell your shares.
Current performance may differ from figures shown.
FFA-1
Fund Goals and Main Investments: Franklin Templeton VIP Founding Funds Allocation Fund seeks capital appreciation, with income as a secondary goal. Under normal market conditions, the Fund invests equal portions in Class 1 shares of Franklin Income Securities Fund, Mutual Shares Securities Fund and Templeton Growth Securities Fund.
Performance Overview
You can find the Fund’s one-year total return in the Performance Summary. In comparison, the S&P 500 generated a +32.39% total return and the MSCI World Index produced a +27.36% total return for the same period.1
Economic and Market Overview
The 12 months under review were characterized by reinvigorated policy support and an economic recovery in developed markets. However, differences in global economic trends corresponded with increasingly divergent monetary policies, and growth in emerging market economies tended to slow. The central banks of key developed markets generally reaffirmed their accommodative monetary stances while some emerging market counterparts tightened policy rates as they sought to control inflation and currency depreciation.
In the U.S., economic growth and employment trends generally exceeded expectations, underpinned by consumer and business spending and rising inventories. Historically low mortgage rates and improving sentiment aided the housing market recovery, evidenced by solid new and existing home sales, rising home prices, low inventories and multi-year lows in new foreclosures. The U.S. Federal Reserve Board (Fed) expanded its asset purchase program to $85 billion per month from $40 billion early in the year. After encouraging economic and employment reports, the Fed announced in December it would reduce its monthly bond purchases by $10 billion beginning in January 2014; however, the Fed committed to keeping interest rates low. In October, the federal government temporarily shut down after Congress failed to authorize routine federal funding amid a disagreement over a new health care law. However, Congress subsequently agreed to fund the government through early 2014 and later passed a two-year budget deal that could ease automatic spending cuts and lower the risk of another shutdown.
Fund Risks: All investments involve risks, including possible loss of principal. Because the Fund invests in underlying funds that may engage in a variety of investment strategies involving certain risks, the Fund may be subject to these same risks. Stock prices fluctuate, sometimes rapidly and dramatically, due to factors affecting individual companies, particular industries or sectors, or general market conditions. Bonds are affected by changes in interest rates and the creditworthiness of their issuers. Bond prices generally move in the opposite direction of interest rates. Thus, as prices of bonds adjust to a rise in interest rates, the Fund’s share price may decline. Higher yielding, lower rated corporate bonds entail a greater degree of credit risk compared to investment-grade securities. Foreign investing carries additional risks such as currency and market volatility and political or social instability, risks that are heightened in developing countries. Value securities may not increase in price as anticipated or may decline further in value. The Fund’s prospectus also includes a description of the main investment risks.
1. Source: © 2014 Morningstar. One cannot invest directly in an index, and an index is not representative of the Fund’s portfolio. Please see Index Descriptions following the Fund Summaries.
FFA-2
Outside the U.S., the eurozone emerged from its longest recession on record during the second half of 2013 and Japan’s growth moderated. The European Central Bank reduced its policy rate to a record low and pledged to maintain systemic support following political turmoil in Greece, Spain, Portugal and Italy. Germany’s re-election of Chancellor Angela Merkel was largely perceived as a vote of support for ongoing eurozone reform measures. In Asia, the Bank of Japan set an explicit inflation target and pledged to double bond purchases in an unprecedented wave of policy reform. The U.S. dollar fell versus the euro but rose versus the Japanese yen in 2013.
Growth in many emerging markets moderated based on lower domestic demand, falling exports and weakening commodity prices. Political turmoil in certain emerging markets, the Fed’s potential tapering of its asset purchase program and the Chinese central bank’s effort to tighten liquidity to curb real estate and credit speculation led to a sell-off in emerging market equities and a sharp depreciation in regional currencies against the U.S. dollar. Central banks in Brazil, India and Indonesia raised interest rates in the second half of 2013 as they sought to curb inflation.
The stock market rally in developed markets accelerated during 2013 amid redoubled central bank commitments, continued corporate earnings strength and increasing signs of economic progress. Emerging market stocks rebounded toward period-end, although Latin American stocks trailed their emerging market peers. Oil prices rallied in the third quarter and rose for the year mainly owing to supply concerns related to geopolitical turmoil, but gold posted its largest annual price decline in more than three decades. Increasingly divergent economic and political circumstances during the period resulted in declining market correlations, which many bottom-up investors perceived as more favorable.
Investment Strategy
The Fund normally invests its assets in an equally weighted combination of Class 1 shares of Franklin Income Securities Fund, Mutual Shares Securities Fund and Templeton Growth Securities Fund. These underlying funds, in turn, invest in a variety of U.S. and foreign equity securities and, to a lesser extent, fixed income and money market securities. As market conditions affect the underlying funds, we rebalance the Fund’s allocations seeking to maintain equal weightings of approximately 33 1⁄3% of total net assets in each underlying fund whenever the actual allocations exceed plus or minus 3% of the fixed allocation percentages.
FFA-3
Manager’s Discussion
The Fund’s performance can be attributed largely to its allocation among the underlying funds and their investments in domestic and foreign equities, fixed income securities, and short-term investments and other net assets.
During the year under review, Mutual Shares Securities Fund – Class 1 and Franklin Income Securities Fund – Class 1 underperformed the S&P 500. Templeton Growth Securities Fund – Class 1 outperformed the MSCI World Index.
Thank you for your participation in Franklin Templeton VIP Founding Funds Allocation Fund. We look forward to serving your future investment needs.
The foregoing information reflects our analysis, opinions and portfolio holdings as of December 31, 2013, the end of the reporting period. The way we implement our main investment strategies and the resulting portfolio holdings may change depending on factors such as market and economic conditions. These opinions may not be relied upon as investment advice or an offer for a particular security. The information is not a complete analysis of every aspect of any market, country, industry, security or the Fund. Statements of fact are from sources considered reliable, but the investment manager makes no representation or warranty as to their completeness or accuracy. Although historical performance is no guarantee of future results, these insights may help you understand our investment management philosophy.
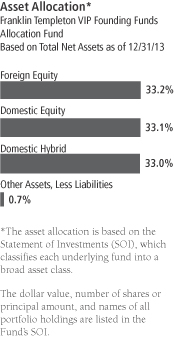
FFA-4
Fund Expenses
As an investor in a variable insurance contract (Contract) that indirectly provides for investment in an underlying mutual fund, you can incur transaction and/or ongoing expenses at both the Fund level and the Contract level.
| • | | Transaction expenses can include sales charges (loads) on purchases, redemption fees, surrender fees, transfer fees and premium taxes. |
| • | | Ongoing expenses can include management fees, distribution and service (12b-1) fees, contract fees, annual maintenance fees, mortality and expense risk fees and other fees and expenses. All mutual funds and Contracts have some types of ongoing expenses. |
The expenses shown in the table are meant to highlight ongoing expenses at the Fund level only and do not include ongoing expenses at the Contract level, or transaction expenses at either the Fund or Contract levels. While the Fund does not have transaction expenses, if the transaction and ongoing expenses at the Contract level were included, the expenses shown below would be higher. You should consult your Contract prospectus or disclosure document for more information.
The table shows Fund-level ongoing expenses and can help you understand these expenses and compare them with those of other mutual funds offered through the Contract. The table assumes a $1,000 investment held for the six months indicated. Please refer to the Fund prospectus for additional information on operating expenses.
Actual Fund Expenses
The first line (Actual) of the table provides actual account values and expenses. The “Ending Account Value” is derived from the Fund’s actual return, which includes the effect of ongoing Fund expenses, but does not include the effect of ongoing Contract expenses.
You can estimate the Fund-level expenses you incurred during the period by following these steps. Of course, your account value and expenses will differ from those in this illustration:
| 1. | Divide your account value by $1,000. |
If an account had an $8,600 value, then $8,600 ÷ $1,000 = 8.6.
| 2. | Multiply the result by the number under the heading “Fund-Level Expenses Incurred During Period.” |
If Fund-Level Expenses Incurred During Period were $7.50, then 8.6 x $7.50 = $64.50.
In this illustration, the estimated expenses incurred this period at the Fund level are $64.50.
Franklin Templeton VIP Founding Funds Allocation Fund – Class 4
FFA-5
Hypothetical Example for Comparison with Other Mutual Funds
Information in the second line (Hypothetical) of the table can help you compare ongoing expenses of the Fund with those of other mutual funds offered through the Contract. This information may not be used to estimate the actual ending account balance or expenses you incurred during the period. The hypothetical “Ending Account Value” is based on the Fund’s actual expense ratio and an assumed 5% annual rate of return before expenses, which does not represent the Fund’s actual return. The figure under the heading “Fund-Level Expenses Incurred During Period” shows the hypothetical expenses your account would have incurred under this scenario. You can compare this figure with the 5% hypothetical examples that appear in shareholder reports of other funds offered through a Contract.
| | | | | | | | | | | | | | | | |
| Class 4 | | Beginning
Account
Value 7/1/13 | | | Ending
Account
Value 12/31/13 | | | Expenses Paid
During Period*
7/1/13–12/31/13 | | | Expenses Paid
During Period** 7/1/13–12/31/13 | |
Actual | | $ | 1,000 | | | $ | 1,140.70 | | | $ | 2.43 | | | $ | 5.99 | |
Hypothetical (5% return before expenses) | | $ | 1,000 | | | $ | 1,022.94 | | | $ | 2.29 | | | $ | 5.65 | |
*Expenses are calculated using the most recent six-month annualized expense ratio excluding expenses of the underlying funds, net of expense waivers, for the Fund’s Class 4 shares (0.45%), which does not include any ongoing expenses of the Contract for which the Fund is an investment option, multiplied by the average account value over the period, multiplied by 184/365 to reflect the one-half year period.
**Expenses are calculated using the most recent six-month annualized expense ratio including expenses of the underlying funds, net of expense waivers, for the Fund’s Class 4 shares (1.11%), which does not include any ongoing expenses of the Contract for which the Fund is an investment option, multiplied by the average account value over the period, multiplied by 184/365 to reflect the one-half year period.
FFA-6
Franklin Templeton Variable Insurance Products Trust
Financial Highlights
Franklin Templeton VIP Founding Funds Allocation Fund
| | | | | | | | | | | | | | | | | | | | |
| | | Year Ended December 31, | |
| Class 1 | | 2013 | | | 2012 | | | 2011 | | | 2010 | | | 2009 | |
| | | | |
Per share operating performance | | | | | | | | | | | | | | | | | | | | |
(for a share outstanding throughout the year) | | | | | | | | | | | | | | | | | | | | |
Net asset value, beginning of year | | $ | 8.55 | | | $ | 7.63 | | | $ | 7.73 | | | $ | 7.15 | | | $ | 5.61 | |
| | | | |
Income from investment operationsa: | | | | | | | | | | | | | | | | | | | | |
Net investment incomeb,c | | | 0.30 | | | | 0.26 | | | | 0.25 | | | | 0.24 | | | | 0.26 | |
Net realized and unrealized gains (losses) | | | 1.42 | | | | 0.90 | | | | (0.35 | ) | | | 0.52 | | | | 1.46 | |
| | | | |
Total from investment operations | | | 1.72 | | | | 1.16 | | | | (0.10 | ) | | | 0.76 | | | | 1.72 | |
| | | | |
Less distributions from: | | | | | | | | | | | | | | | | | | | | |
Net investment income | | | (1.15 | ) | | | (0.24 | ) | | | — | d | | | (0.18 | ) | | | (0.18 | ) |
Net realized gains | | | (1.65 | ) | | | — | | | | — | | | | — | d | | | — | |
| | | | |
Total distributions | | | (2.80 | ) | | | (0.24 | ) | | | — | d | | | (0.18 | ) | | | (0.18 | ) |
| | | | |
Net asset value, end of year | | $ | 7.47 | | | $ | 8.55 | | | $ | 7.63 | | | $ | 7.73 | | | $ | 7.15 | |
| | | | |
| | | | | |
Total returne | | | 24.14% | | | | 15.56% | | | | (1.28)% | | | | 10.64% | | | | 30.47% | |
Ratios to average net assets | | | | | | | | | | | | | | | | | | | | |
Expenses before waiver and payments by affiliatesf | | | 0.11% | | | | 0.11% | | | | 0.11% | | | | 0.11% | | | | 0.12% | |
Expenses net of waiver and payments by affiliatesf | | | 0.10% | | | | 0.10% | | | | 0.10% | | | | 0.10% | | | | 0.10% | |
Net investment incomec | | | 3.67% | | | | 4.06% | | | | 3.44% | | | | 3.04% | | | | 4.16% | |
| | | | | |
Supplemental data | | | | | | | | | | | | | | | | | | | | |
Net assets, end of year (000’s) | | $ | 952 | | | $ | 767 | | | $ | 470 | | | $ | 437 | | | $ | 629 | |
Portfolio turnover rate | | | 3.91% | | | | 28.46% | g | | | 58.42% | | | | 17.81% | | | | 4.23% | |
aThe amount shown for a share outstanding throughout the period may not correlate with the Statement of Operations for the period due to the timing of sales and repurchases of the Fund shares in relation to income earned and/or fluctuating market value of the investments of the Fund.
bBased on average daily shares outstanding.
cRecognition of net investment income by the Fund is affected by the timing of declaration of dividends by the Underlying Funds in which the Fund invests.
dAmount rounds to less than $0.01 per share.
eTotal return does not include fees, charges or expenses imposed by the variable annuity and life insurance contracts for which the Franklin Templeton Variable Insurance Products Trust serves as an underlying investment vehicle.
fDoes not include expenses of the Underlying Funds in which the Fund invests. The weighted average indirect expenses of the Underlying Funds was 0.66% for the year ended December 31, 2013.
gExcludes the value of portfolio securities delivered as a result of a redemption in-kind. See Note 9.
The accompanying notes are an integral part of these financial statements.
FFA-7
Franklin Templeton Variable Insurance Products Trust
Financial Highlights (continued)
Franklin Templeton VIP Founding Funds Allocation Fund
| | | | | | | | | | | | | | | | | | | | |
| | | Year Ended December 31, | |
| Class 2 | | 2013 | | | 2012 | | | 2011 | | | 2010 | | | 2009 | |
| | | | |
Per share operating performance | | | | | | | | | | | | | | | | | | | | |
(for a share outstanding throughout the year) | | | | | | | | | | | | | | | | | | | | |
Net asset value, beginning of year | | $ | 8.51 | | | $ | 7.59 | | | $ | 7.71 | | | $ | 7.14 | | | $ | 5.61 | |
| | | | |
Income from investment operationsa: | | | | | | | | | | | | | | | | | | | | |
Net investment incomeb,c | | | 0.27 | | | | 0.25 | | | | 0.23 | | | | 0.21 | | | | 0.26 | |
Net realized and unrealized gains (losses) | | | 1.42 | | | | 0.89 | | | | (0.35 | ) | | | 0.52 | | | | 1.44 | |
| | | | |
Total from investment operations | | | 1.69 | | | | 1.14 | | | | (0.12 | ) | | | 0.73 | | | | 1.70 | |
| | | | |
Less distributions from: | | | | | | | | | | | | | | | | | | | | |
Net investment income | | | (1.13 | ) | | | (0.22 | ) | | | — | d | | | (0.16 | ) | | | (0.17 | ) |
Net realized gains | | | (1.65 | ) | | | — | | | | — | | | | — | d | | | — | |
| | | | |
Total distributions | | | (2.78 | ) | | | (0.22 | ) | | | — | d | | | (0.16 | ) | | | (0.17 | ) |
| | | | |
Net asset value, end of year | | $ | 7.42 | | | $ | 8.51 | | | $ | 7.59 | | | $ | 7.71 | | | $ | 7.14 | |
| | | | |
| | | | | |
Total returne | | | 23.77% | | | | 15.33% | | | | (1.54)% | | | | 10.25% | | | | 30.25% | |
Ratios to average net assets | | | | | | | | | | | | | | | | | | | | |
Expenses before waiver and payments by affiliatesf | | | 0.36% | | | | 0.36% | | | | 0.36% | | | | 0.36% | | | | 0.37% | |
Expenses net of waiver and payments by affiliatesf | | | 0.35% | | | | 0.35% | | | | 0.35% | | | | 0.35% | | | | 0.35% | |
Net investment incomec | | | 3.42% | | | | 3.81% | | | | 3.19% | | | | 2.79% | | | | 3.91% | |
| | | | | |
Supplemental data | | | | | | | | | | | | | | | | | | | | |
Net assets, end of year (000’s) | | $ | 547,506 | | | $ | 472,686 | | | $ | 448,101 | | | $ | 488,057 | | | $ | 474,176 | |
Portfolio turnover rate | | | 3.91% | | | | 28.46% | g | | | 58.42% | | | | 17.81% | | | | 4.23% | |
aThe amount shown for a share outstanding throughout the period may not correlate with the Statement of Operations for the period due to the timing of sales and repurchases of the Fund shares in relation to income earned and/or fluctuating market value of the investments of the Fund.
bBased on average daily shares outstanding.
cRecognition of net investment income by the Fund is affected by the timing of declaration of dividends by the Underlying Funds in which the Fund invests.
dAmount rounds to less than $0.01 per share.
eTotal return does not include fees, charges or expenses imposed by the variable annuity and life insurance contracts for which the Franklin Templeton Variable Insurance Products Trust serves as an underlying investment vehicle.
fDoes not include expenses of the Underlying Funds in which the Fund invests. The weighted average indirect expenses of the Underlying Funds was 0.66% for the year ended December 31, 2013.
gExcludes the value of portfolio securities delivered as a result of a redemption in-kind. See Note 9.
The accompanying notes are an integral part of these financial statements.
FFA-8
Franklin Templeton Variable Insurance Products Trust
Financial Highlights (continued)
Franklin Templeton VIP Founding Funds Allocation Fund
| | | | | | | | | | | | | | | | | | | | |
| | | Year Ended December 31, | |
| Class 4 | | 2013 | | | 2012 | | | 2011 | | | 2010 | | | 2009 | |
| | | | |
Per share operating performance | | | | | | | | | | | | | | | | | | | | |
(for a share outstanding throughout the year) | | | | | | | | | | | | | | | | | | | | |
Net asset value, beginning of year | | $ | 8.49 | | | $ | 7.58 | | | $ | 7.71 | | | $ | 7.14 | | | $ | 5.62 | |
| | | | |
Income from investment operationsa: | | | | | | | | | | | | | | | | | | | | |
Net investment incomeb,c | | | 0.26 | | | | 0.30 | | | | 0.24 | | | | 0.19 | | | | 0.23 | |
Net realized and unrealized gains (losses) | | | 1.43 | | | | 0.83 | | | | (0.37 | ) | | | 0.54 | | | | 1.46 | |
| | | | |
Total from investment operations | | | 1.69 | | | | 1.13 | | | | (0.13 | ) | | | 0.73 | | | | 1.69 | |
| | | | |
Less distributions from: | | | | | | | | | | | | | | | | | | | | |
Net investment income | | | (0.99 | ) | | | (0.22 | ) | | | — | d | | | (0.16 | ) | | | (0.17 | ) |
Net realized gains | | | (1.65 | ) | | | — | | | | — | | | | — | d | | | — | |
| | | | |
Total distributions | | | (2.64 | ) | | | (0.22 | ) | | | — | d | | | (0.16 | ) | | | (0.17 | ) |
| | | | |
Net asset value, end of year | | $ | 7.54 | | | $ | 8.49 | | | $ | 7.58 | | | $ | 7.71 | | | $ | 7.14 | |
| | | | |
| | | | | |
Total returne | | | 23.68% | | | | 15.17% | | | | (1.67)% | | | | 10.24% | | | | 30.06% | |
Ratios to average net assets | | | | | | | | | | | | | | | | | | | | |
Expenses before waiver and payments by affiliatesf | | | 0.46% | | | | 0.46% | | | | 0.46% | | | | 0.46% | | | | 0.47% | |
Expenses net of waiver and payments by affiliatesf | | | 0.45% | | | | 0.45% | | | | 0.45% | | | | 0.45% | | | | 0.45% | |
Net investment incomec | | | 3.32% | | | | 3.71% | | | | 3.09% | | | | 2.69% | | | | 3.81% | |
| | | | | |
Supplemental data | | | | | | | | | | | | | | | | | | | | |
Net assets, end of year (000’s) | | $ | 676,781 | | | $ | 493,813 | | | $ | 2,860,928 | | | $ | 3,036,272 | | | $ | 1,424,479 | |
Portfolio turnover rate | | | 3.91% | | | | 28.46% | g | | | 58.42% | | | | 17.81% | | | | 4.23% | |
aThe amount shown for a share outstanding throughout the period may not correlate with the Statement of Operations for the period due to the timing of sales and repurchases of the Fund shares in relation to income earned and/or fluctuating market value of the investments of the Fund.
bBased on average daily shares outstanding.
cRecognition of net investment income by the Fund is affected by the timing of declaration of dividends by the Underlying Funds in which the Fund invests.
dAmount rounds to less than $0.01 per share.
eTotal return does not include fees, charges or expenses imposed by the variable annuity and life insurance contracts for which the Franklin Templeton Variable Insurance Products Trust serves as an underlying investment vehicle.
fDoes not include expenses of the Underlying Funds in which the Fund invests. The weighted average indirect expenses of the Underlying Funds was 0.66% for the year ended December 31, 2013.
gExcludes the value of portfolio securities delivered as a result of a redemption in-kind. See Note 9.
The accompanying notes are an integral part of these financial statements.
FFA-9
Franklin Templeton Variable Insurance Products Trust
Statement of Investments, December 31, 2013
| | | | | | | | |
| Franklin Templeton VIP Founding Funds Allocation Fund | | Shares | | | Value | |
Investments in Underlying Fundsa | | | | | | | | |
Domestic Equity 33.1% | | | | | | | | |
Mutual Shares Securities Fund, Class 1 | | | 18,485,942 | | | $ | 405,211,843 | |
| | | | | | | | |
Domestic Hybrid 33.0% | | | | | | | | |
Franklin Income Securities Fund, Class 1 | | | 24,462,601 | | | | 404,122,168 | |
| | | | | | | | |
Foreign Equity 33.2% | | | | | | | | |
Templeton Growth Securities Fund, Class 1 | | | 26,312,175 | | | | 407,049,352 | |
| | | | | | | | |
Total Investments in Underlying Funds (Cost $865,558,414) 99.3% | | | | | | | 1,216,383,363 | |
Other Assets, less Liabilities 0.7% | | | | | | | 8,854,633 | |
| | | | | | | | |
Net Assets 100.0% | | | | | | $ | 1,225,237,996 | |
| | | | | | | | |
aSee Note 7 regarding investments in Underlying Funds.
The accompanying notes are an integral part of these financial statements.
FFA-10
Franklin Templeton Variable Insurance Products Trust
Financial Statements
Statement of Assets and Liabilities
December 31, 2013
| | | | |
| | | Franklin Templeton
VIP Founding Funds
Allocation Fund | |
Assets: | | | | |
Investments in Underlying Funds: (Note 7) | | | | |
Cost | | $ | 865,558,414 | |
| | | | |
Value | | $ | 1,216,383,363 | |
Cash | | | 10,734,628 | |
Receivables: | | | | |
Investment securities sold | | | 101,998 | |
Capital shares sold | | | 499,211 | |
Other assets | | | 24 | |
| | | | |
Total assets | | | 1,227,719,224 | |
| | | | |
Liabilities: | | | | |
Payables: | | | | |
Capital shares redeemed | | | 1,587,895 | |
Administrative fees | | | 101,998 | |
Distribution fees | | | 609,376 | |
Accrued expenses and other liabilities | | | 181,959 | |
| | | | |
Total liabilities | | | 2,481,228 | |
| | | | |
Net assets, at value | | $ | 1,225,237,996 | |
| | | | |
Net assets consist of: | | | | |
Paid-in capital | | $ | 894,399,778 | |
Undistributed net investment income | | | 33,877,400 | |
Net unrealized appreciation (depreciation) | | | 350,824,949 | |
Accumulated net realized gain (loss) | | | (53,864,131 | ) |
| | | | |
Net assets, at value | | $ | 1,225,237,996 | |
| | | | |
Class 1: | | | | |
Net assets, at value | | $ | 951,562 | |
| | | | |
Shares outstanding | | | 127,402 | |
| | | | |
Net asset value and maximum offering price per share | | $ | 7.47 | |
| | | | |
Class 2: | | | | |
Net assets, at value | | $ | 547,505,858 | |
| | | | |
Shares outstanding | | | 73,770,699 | |
| | | | |
Net asset value and maximum offering price per share | | $ | 7.42 | |
| | | | |
Class 4: | | | | |
Net assets, at value | | $ | 676,780,576 | |
| | | | |
Shares outstanding | | | 89,774,728 | |
| | | | |
Net asset value and maximum offering price per share | | $ | 7.54 | |
| | | | |
The accompanying notes are an integral part of these financial statements.
FFA-11
Franklin Templeton Variable Insurance Products Trust
Financial Statements (continued)
Statement of Operations
for the year ended December 31, 2013
| | | | |
| | | Franklin Templeton
VIP Founding Funds
Allocation Fund | |
Investment income: | | | | |
Dividends from Underlying Funds (Note 7) | | $ | 41,026,041 | |
| | | | |
Expenses: | | | | |
Administrative fees (Note 3a) | | | 1,088,163 | |
Distribution fees: (Note 3b) | | | | |
Class 2 | | | 1,272,748 | |
Class 4 | | | 2,022,562 | |
Unaffiliated transfer agent fees | | | 727 | |
Reports to shareholders | | | 24,362 | |
Professional fees | | | 24,651 | |
Trustees’ fees and expenses | | | 4,163 | |
Other | | | 17,005 | |
| | | | |
Total expenses | | | 4,454,381 | |
Expenses waived/paid by affiliates (Note 3d) | | | (70,907 | ) |
| | | | |
Net expenses | | | 4,383,474 | |
| | | | |
Net investment income | | | 36,642,567 | |
| | | | |
Realized and unrealized gains (losses): | | | | |
Net realized gain (loss) from sale of investments in Underlying Funds (Note 7) | | | 3,163,496 | |
Net change in unrealized appreciation (depreciation) on investments in Underlying Funds | | | 190,487,276 | |
| | | | |
Net realized and unrealized gain (loss) | | | 193,650,772 | |
| | | | |
Net increase (decrease) in net assets resulting from operations | | $ | 230,293,339 | |
| | | | |
The accompanying notes are an integral part of these financial statements.
FFA-12
Franklin Templeton Variable Insurance Products Trust
Financial Statements (continued)
Statements of Changes in Net Assets
| | | | | | | | |
| | | Franklin Templeton VIP Founding
Funds Allocation Fund | |
| | | Year Ended December 31, | |
| | | 2013 | | | 2012 | |
| | | | |
Increase (decrease) in net assets: | | | | | | | | |
Operations: | | | | | | | | |
Net investment income | | $ | 36,642,567 | | | $ | 117,257,889 | |
Net realized gain (loss) from Underlying Funds | | | 3,163,496 | | | | 493,521,519 | |
Net change in unrealized appreciation (depreciation) on investments in Underlying Funds | | | 190,487,276 | | | | (130,850,160 | ) |
| | | | |
Net increase (decrease) in net assets resulting from operations | | | 230,293,339 | | | | 479,929,248 | |
| | | | |
Distributions to shareholders from: | | | | | | | | |
Net investment income: | | | | | | | | |
Class 1 | | | (113,893 | ) | | | (14,007 | ) |
Class 2 | | | (60,502,595 | ) | | | (12,894,473 | ) |
Class 4 | | | (59,385,848 | ) | | | (102,116,912 | ) |
Net realized gains: | | | | | | | | |
Class 1 | | | (162,965 | ) | | | — | |
Class 2 | | | (88,234,067 | ) | | | — | |
Class 4 | | | (98,339,718 | ) | | | — | |
| | | | |
Total distributions to shareholders | | | (306,739,086 | ) | | | (115,025,392 | ) |
| | | | |
Capital share transactions: (Note 2) | | | | | | | | |
Class 1 | | | 268,891 | | | | 221,759 | |
Class 2 | | | 115,298,186 | | | | (28,591,508 | ) |
Class 4 | | | 218,850,531 | | | | (2,678,766,884 | ) |
| | | | |
Total capital share transactions | | | 334,417,608 | | | | (2,707,136,633 | ) |
| | | | |
Net increase (decrease) in net assets | | | 257,971,861 | | | | (2,342,232,777 | ) |
Net assets: | | | | | | | | |
Beginning of year | | | 967,266,135 | | | | 3,309,498,912 | |
| | | | |
End of year | | $ | 1,225,237,996 | | | $ | 967,266,135 | |
| | | | |
Undistributed net investment income included in net assets: | | | | | | | | |
End of year | | $ | 33,877,400 | | | $ | 117,237,169 | |
| | | | |
The accompanying notes are an integral part of these financial statements.
FFA-13
Franklin Templeton Variable Insurance Products Trust
Notes to Financial Statements
Franklin Templeton VIP Founding Funds Allocation Fund
1. ORGANIZATION AND SIGNIFICANT ACCOUNTING POLICIES
Franklin Templeton Variable Insurance Products Trust (Trust) is registered under the Investment Company Act of 1940, as amended, (1940 Act) as an open-end investment company, consisting of twenty separate funds. The Franklin Templeton VIP Founding Funds Allocation Fund (Fund) is included in this report. The financial statements of the remaining funds in the Trust are presented separately. The Fund invests primarily in other funds of the Trust (Underlying Funds). Shares of the Fund are generally sold only to insurance company separate accounts to fund the benefits of variable life insurance policies or variable annuity contracts. The Fund offers three classes of shares: Class 1, Class 2, and Class 4. Each class of shares differs by its distribution fees, voting rights on matters affecting a single class and its exchange privilege.
The accounting policies of the Underlying Funds are outlined in their respective shareholder reports. A copy of the Underlying Funds’ shareholder reports is available on the U.S. Securities and Exchange Commission (SEC) website at sec.gov or at the SEC’s Public Reference Room in Washington, D.C. The Underlying Funds’ shareholder reports are not covered by this report.
The following summarizes the Fund’s significant accounting policies.
a. Financial Instrument Valuation
The Fund’s investments in financial instruments are carried at fair value daily. Fair value is the price that would be received to sell an asset or paid to transfer a liability in an orderly transaction between market participants on the measurement date. The Fund calculates the net asset value (NAV) per share at the close of the New York Stock Exchange (NYSE), generally at 4p.m. Eastern time (NYSE close) on each day the NYSE is open for trading. Under procedures approved by the Trust’s Board of Trustees (the Board), the Fund’s administrator and other affiliates have formed the Valuation and Liquidity Oversight Committee (VLOC). The VLOC provides administration and oversight of the Fund’s valuation policies and procedures, which are approved annually by the Board. Investments in the Underlying Funds are valued at their closing net asset value each trading day.
b. Income Taxes
It is the Fund’s policy to qualify as a regulated investment company under the Internal Revenue Code. The Fund intends to distribute to shareholders substantially all of its taxable income and net realized gains to relieve it from federal income and if applicable, excise taxes. As a result, no provision for U.S. federal income taxes is required.
The Fund recognizes the tax benefits of uncertain tax positions only when the position is “more likely than not” to be sustained upon examination by the tax authorities based on the technical merits of the tax position. As of December 31, 2013, and for all open tax years, the Fund has determined that no liability for unrecognized tax benefits is required in the Fund’s financial statements related to uncertain tax positions taken on a tax return (or expected to be taken on future tax returns). Open tax years are those that remain subject to examination and are based on each tax jurisdiction statute of limitation.
c. Security Transactions, Investment Income, Expenses and Distributions
Security transactions are accounted for on trade date. Realized gains and losses on security transactions are determined on a specific identification basis. Estimated expenses are accrued daily. Dividend income and realized gain distributions by Underlying Funds are recorded on the ex-dividend date. Distributions to shareholders are recorded on the ex-dividend date and are determined according to income tax regulations (tax basis). Distributable earnings determined on a tax basis may differ from earnings recorded in accordance with accounting principles generally accepted in the United States of America. These differences may be permanent or temporary. Permanent differences are reclassified among capital accounts to reflect their tax character. These reclassifications have no impact on net assets or the results of operations. Temporary differences are not reclassified, as they may reverse in subsequent periods.
Common expenses incurred by the Trust are allocated among the funds based on the ratio of net assets of each fund to the combined net assets of the Trust. Fund specific expenses are charged directly to the fund that incurred the expense.
FFA-14
Franklin Templeton Variable Insurance Products Trust
Notes to Financial Statements (continued)
Franklin Templeton VIP Founding Funds Allocation Fund
1. ORGANIZATION AND SIGNIFICANT ACCOUNTING POLICIES (continued)
c. Security Transactions, Investment Income, Expenses and Distributions (continued)
The Fund indirectly bears its proportionate share of expenses from the Underlying Funds. Since the Underlying Funds have varied expense levels and the Fund may own different proportions of the Underlying Funds at different times, the amount of expenses incurred indirectly by the Fund will vary.
Realized and unrealized gains and losses and net investment income, not including class specific expenses, are allocated daily to each class of shares based upon the relative proportion of net assets of each class. Differences in per share distributions, by class, are generally due to differences in class specific expenses.
d. Accounting Estimates
The preparation of financial statements in accordance with accounting principles generally accepted in the United States of America requires management to make estimates and assumptions that affect the reported amounts of assets and liabilities at the date of the financial statements and the amounts of income and expenses during the reporting period. Actual results could differ from those estimates.
e. Guarantees and Indemnifications
Under the Trust’s organizational documents, its officers and trustees are indemnified by the Trust against certain liabilities arising out of the performance of their duties to the Trust. Additionally, in the normal course of business, the Trust, on behalf of the Fund, enters into contracts with service providers that contain general indemnification clauses. The Trust’s maximum exposure under these arrangements is unknown as this would involve future claims that may be made against the Trust that have not yet occurred. Currently, the Trust expects the risk of loss to be remote.
2. SHARES OF BENEFICIAL INTEREST
At December 31, 2013, there were an unlimited number of shares authorized (without par value). Transactions in the Fund’s shares were as follows:
| | | | | | | | | | | | | | | | |
| | | Year Ended December 31, | |
| | | 2013 | | | 2012 | |
| Class 1 Shares: | | Shares | | | Amount | | | Shares | | | Amount | |
Shares sold | | | 24,967 | | | $ | 213,393 | | | | 49,376 | | | $ | 392,149 | |
Shares issued in reinvestment of distributions | | | 41,633 | | | | 276,858 | | | | 1,805 | | | | 14,007 | |
Shares redeemed | | | (28,865 | ) | | | (221,360 | ) | | | (23,150 | ) | | | (184,397 | ) |
| | | | |
Net increase (decrease) | | | 37,735 | | | $ | 268,891 | | | | 28,031 | | | $ | 221,759 | |
| | | | |
Class 2 Shares: | | | | | | | | | | | | | | | | |
Shares sold | | | 9,475,437 | | | $ | 72,686,096 | | | | 2,983,614 | | | $ | 23,927,917 | |
Shares issued in reinvestment of distributions | | | 22,467,774 | | | | 148,736,662 | | | | 1,665,953 | | | | 12,894,473 | |
Shares redeemed | | | (13,700,538 | ) | | | (106,124,572 | ) | | | (8,143,086 | ) | | | (65,413,898 | ) |
| | | | |
Net increase (decrease) | | | 18,242,673 | | | $ | 115,298,186 | | | | (3,493,519 | ) | | $ | (28,591,508 | ) |
| | | | |
FFA-15
Franklin Templeton Variable Insurance Products Trust
Notes to Financial Statements (continued)
Franklin Templeton VIP Founding Funds Allocation Fund
2. SHARES OF BENEFICIAL INTEREST (continued)
| | | | | | | | | | | | | | | | |
| | | Year Ended December 31, | |
| | | 2013 | | | 2012 | |
| Class 4 Shares: | | Shares | | | Amount | | | Shares | | | Amount | |
Shares sold | | | 14,101,836 | | | $ | 107,566,000 | | | | 204,285,414 | | | $ | 1,616,018,782 | |
Shares issued on reinvestment of distributions | | | 23,436,191 | | | | 157,725,566 | | | | 13,227,579 | | | | 102,116,912 | |
Shares redeemed in-kind (Note 9) | | | — | | | | — | | | | (291,650,709 | ) | | | (2,437,937,443 | ) |
Shares redeemed | | | (5,915,495 | ) | | | (46,441,035 | ) | | | (245,221,948 | ) | | | (1,958,965,135 | ) |
| | | | |
Net increase (decrease) | | | 31,622,532 | | | $ | 218,850,531 | | | | (319,359,664 | ) | | $ | (2,678,766,884 | ) |
| | | | |
3. TRANSACTIONS WITH AFFILIATES
Franklin Resources, Inc. is the holding company for various subsidiaries that together are referred to as Franklin Templeton Investments. Certain officers and trustees of the Fund are also officers and/or directors of certain of the Underlying Funds and of the following subsidiaries:
| | |
| Subsidiary | | Affiliation |
Franklin Templeton Services, LLC (FT Services) | | Administrative manager |
Franklin Templeton Distributors, Inc. (Distributors) | | Principal underwriter |
Franklin Templeton Investor Services, LLC (Investor Services) | | Transfer agent |
a. Administrative Fees
The Fund pays an administrative fee to FT Services of 0.10% per year of the average daily net assets of the Fund for administrative services including monitoring and rebalancing the percentage of the Fund’s investments in the Underlying Funds.
b. Distribution Fees
The Board has adopted distribution plans for Class 2 and Class 4 shares pursuant to Rule 12b-1 under the 1940 Act. Under the Fund’s compensation distribution plans, the Fund pays Distributors for costs incurred in connection with the servicing, sale and distribution of the Fund’s shares up to 0.35% per year of its average daily net assets of each class. Some distribution fees are not charged on shares held by affiliates. The Board has agreed to limit the current rate to 0.25% per year for Class 2. The plan year, for purposes of monitoring compliance with the maximum annual plan rates, is February 1 through January 31.
c. Transfer Agent Fees
Investor Services, under terms of an agreement, performs shareholder servicing for the Fund and is not paid by the Fund for the services.
d. Waiver and Expense Reimbursements
FT Services contractually agreed in advance to waive or limit its fees and to assume as its own expense certain expenses otherwise payable by the Fund so that the expenses (excluding distribution fees, and acquired fund fees and expenses) for each class of the Fund do not exceed 0.10% based on the average net assets of each class (other than certain non-routine expenses or costs, including those relating to litigation, indemnification, reorganizations, and liquidations) until April 30, 2014.
FFA-16
Franklin Templeton Variable Insurance Products Trust
Notes to Financial Statements (continued)
Franklin Templeton VIP Founding Funds Allocation Fund
4. EXPENSE OFFSET ARRANGEMENT
The Fund has entered into an arrangement with its custodian whereby credits realized as a result of uninvested cash balances are used to reduce a portion of the Fund’s custodian expenses. During the year ended December 31, 2013, there were no credits earned.
5. INCOME TAXES
The tax character of distributions paid during the years ended December 31, 2013 and 2012, was as follows:
| | | | | | | | |
| | | 2013 | | | 2012 | |
Distributions paid from: | | | | | | | | |
Ordinary income | | $ | 120,002,336 | | | $ | 115,025,392 | |
Long term capital gain | | | 186,736,750 | | | | — | |
| | | | |
| | $ | 306,739,086 | | | $ | 115,025,392 | |
| | | | |
At December 31, 2013, the cost of investments, net unrealized appreciation (depreciation), undistributed ordinary income and undistributed long term capital gains for income tax purposes were as follows:
| | | | |
Cost of investments | | $ | 920,504,987 | |
| | | | |
| |
Unrealized appreciation | | $ | 295,878,376 | |
Unrealized depreciation | | | — | |
| | | | |
Net unrealized appreciation (depreciation) | | $ | 295,878,376 | |
| | | | |
Undistributed ordinary income | | $ | 34,795,058 | |
Undistributed long term capital gains | | | 164,775 | |
| | | | |
Distributable earnings | | $ | 34,959,833 | |
| | | | |
Differences between income and/or capital gains as determined on a book basis and a tax basis are primarily due to differing treatment of wash sales.
6. INVESTMENT TRANSACTIONS
Purchases and sales of Underlying Funds (excluding short term securities) for the year ended December 31, 2013, aggregated $106,026,041 and $42,206,902, respectively.
FFA-17
Franklin Templeton Variable Insurance Products Trust
Notes to Financial Statements (continued)
Franklin Templeton VIP Founding Funds Allocation Fund
7. INVESTMENTS IN UNDERLYING FUNDS
The Fund invests primarily in the Underlying Funds which are managed by affiliates of the Fund’s administrative manager, FT Services. The Fund does not invest in the Underlying Funds for the purpose of exercising a controlling influence over the management or policies. Investments in Underlying Funds for the year ended December 31, 2013, were as follows:
| | | | | | | | | | | | | | | | | | | | | | | | | | | | | | | | |
| Underlying Funds | | Number
of Shares
Held at
Beginning
of Year | | | Gross
Additions | | | Gross
Reductions | | | Number
of Shares
Held at
End of
Year | | | Value at
End of
Year | | | Investment
Income | | | Realized
Capital
Gain (Loss) | | | % of
Underlying
Fund Shares
Outstanding
Held at End
of Year | |
Franklin Income Securities Fund, Class 1 | | | 20,629,424 | | | | 4,171,757 | | | | 338,580 | | | | 24,462,601 | | | $ | 404,122,168 | | | $ | 22,456,917 | | | $ | (88,950 | ) | | | 5.42% | |
Mutual Shares Securities Fund, Class 1 | | | 18,291,713 | | | | 982,120 | | | | 787,891 | | | | 18,485,942 | | | | 405,211,843 | | | | 8,239,696 | | | | 1,395,774 | | | | 7.56% | |
Templeton Growth Securities Fund, Class 1 | | | 26,363,969 | | | | 1,524,464 | | | | 1,576,258 | | | | 26,312,175 | | | | 407,049,352 | | | | 10,329,428 | | | | 1,856,672 | | | | 19.07% | |
| | | | | | | | | | | | | | | | | | | |
Total | | | | | | | | | | | | | | | | | | $ | 1,216,383,363 | | | $ | 41,026,041 | | | $ | 3,163,496 | | | | | |
| | | | | | | | | | | | | | | | | | | |
8. CREDIT FACILITY
The Fund, together with other U.S. registered and foreign investment funds (collectively, Borrowers), managed by Franklin Templeton Investments, are borrowers in a joint syndicated senior unsecured credit facility totaling $1.5 billion (Global Credit Facility) which, after an extension of the original terms, matured on February 14, 2014. This Global Credit Facility provides a source of funds to the Borrowers for temporary and emergency purposes, including the ability to meet future unanticipated or unusually large redemption requests. Effective February 14, 2014, the Borrowers renewed the Global Credit Facility which matures on February 13, 2015.
Under the terms of the Global Credit Facility, the Fund shall, in addition to interest charged on any borrowings made by the Fund and other costs incurred by the Fund, pay its share of fees and expenses incurred in connection with the implementation and maintenance of the Global Credit Facility, based upon its relative share of the aggregate net assets of all of the Borrowers, including an annual commitment fee of 0.07% based upon the unused portion of the Global Credit Facility. These fees are reflected in other expenses on the Statement of Operations. During the year ended December 31, 2013, the Fund did not use the Global Credit Facility.
9. REDEMPTION IN-KIND
During the year ended December 31, 2012, the Fund realized $516,992,768 of net gains resulting from a redemption in-kind in which a shareholder redeemed fund shares for cash and securities held by the Underlying Funds.
10. FAIR VALUE MEASUREMENTS
The Fund follows a fair value hierarchy that distinguishes between market data obtained from independent sources (observable inputs) and the Fund’s own market assumptions (unobservable inputs). These inputs are used in determining the value of the Fund’s financial instruments and are summarized in the following fair value hierarchy:
| | • | | Level 1 – quoted prices in active markets for identical financial instruments |
| | • | | Level 2 – other significant observable inputs (including quoted prices for similar financial instruments, interest rates, prepayment speed, credit risk, etc.) |
| | • | | Level 3 – significant unobservable inputs (including the Fund’s own assumptions in determining the fair value of financial instruments) |
FFA-18
Franklin Templeton Variable Insurance Products Trust
Notes to Financial Statements (continued)
Franklin Templeton VIP Founding Funds Allocation Fund
10. FAIR VALUE MEASUREMENTS (continued)
The input levels are not necessarily an indication of the risk or liquidity associated with financial instruments at that level.
For movements between the levels within the fair value hierarchy, the Fund has adopted a policy of recognizing the transfers as of the date of the underlying event which caused the movement.
At December 31, 2013, all of the Fund’s investments in financial instruments carried at fair value were valued using Level 1 inputs. For detailed categories, see the accompanying Statement of Investments.
11. NEW ACCOUNTING PRONOUNCEMENTS
In June 2013, the Financial Accounting Standards Board issued Accounting Standards Update (ASU) No. 2013-08, Investment Companies (Topic 946): Amendments to the Scope, Measurement, and Disclosure Requirements. The ASU modifies the criteria used in defining an investment company under U.S. Generally Accepted Accounting Principles and also sets forth certain measurement and disclosure requirements. Under the ASU, an entity that is registered under the 1940 Act automatically qualifies as an investment company. The ASU is effective for interim and annual reporting periods beginning after December 15, 2013. Management has reviewed the requirements and believes the adoption of this ASU will not have a material impact on its financial statements.
12. SUBSEQUENT EVENTS
The Fund has evaluated subsequent events through the issuance of the financial statements and determined that no events have occurred that require disclosure other than those already disclosed in the financial statements.
FFA-19
Franklin Templeton Variable Insurance Products Trust
Franklin Templeton VIP Founding Funds Allocation Fund
Report of Independent Registered Public Accounting Firm
To the Board of Trustees and Shareholders of Franklin Templeton Variable Insurance Products Trust
In our opinion, the accompanying statement of assets and liabilities, including the statement of investments, and the related statements of operations and of changes in net assets and the financial highlights present fairly, in all material respects, the financial position of Franklin Templeton VIP Founding Funds Allocation Fund (the “Fund”) at December 31, 2013, the results of its operations for the year then ended, the changes in its net assets for each of the two years in the period then ended and the financial highlights for each of the five years in the period then ended, in conformity with accounting principles generally accepted in the United States of America. These financial statements and financial highlights (hereafter referred to as “financial statements”) are the responsibility of the Fund’s management. Our responsibility is to express an opinion on these financial statements based on our audits. We conducted our audits of these financial statements in accordance with the standards of the Public Company Accounting Oversight Board (United States). Those standards require that we plan and perform the audit to obtain reasonable assurance about whether the financial statements are free of material misstatement. An audit includes examining, on a test basis, evidence supporting the amounts and disclosures in the financial statements, assessing the accounting principles used and significant estimates made by management, and evaluating the overall financial statement presentation. We believe that our audits, which included confirmation of securities at December 31, 2013 by correspondence with the custodian, transfer agent and brokers, provide a reasonable basis for our opinion.
PricewaterhouseCoopers LLP
San Francisco, California
February 14, 2014
FFA-20
Franklin Templeton Variable Insurance Products Trust
Tax Information (unaudited)
Franklin Templeton VIP Founding Funds Allocation Fund
Under Section 852(b)(3)(C) of the Internal Revenue Code (Code), the Fund hereby reports the maximum amount allowable but no less than $186,736,750 as a long term capital gain dividend for the fiscal year ended December 31, 2013.
Under Section 854(b)(1)(A) of the Code, the Fund hereby reports 9.91% of the ordinary income dividends as income qualifying for the dividends received deduction for the fiscal year ended December 31, 2013.
At December 31, 2013, the Fund, a qualified fund of funds under Sections 852(g)(2) of the Code, received an allocation of foreign taxes paid from one or more of its underlying funds. The Fund elects to treat foreign taxes paid as allowed under Section 853 of the Code. This election will allow shareholders of record as of the 2014 distribution date, to treat their proportionate share of foreign taxes paid by the underlying funds as having been paid directly by them. The shareholder shall consider these amounts as foreign taxes paid in the tax year in which they receive the Fund distribution.
FFA-21
MUTUAL GLOBAL DISCOVERY SECURITIES FUND
This annual report for Mutual Global Discovery Securities Fund covers the fiscal year ended December 31, 2013.
Performance Summary as of 12/31/13
Average annual total return of Class 4 shares* represents the average annual change in value, assuming reinvestment of dividends and capital gains. Average returns smooth out variations in returns, which can be significant; they are not the same as year-by-year results.
Periods ended 12/31/13
| | | | | | | | | | | | |
| | | 1-Year | | | 5-Year | | | 10-Year | |
Average Annual Total Return | | | +27.52% | | | | +14.05% | | | | +10.15% | |
*For the period beginning 2/29/08, Class 4 performance reflects a 12b-1 fee expense of 0.35% per year, which affects future performance. Class 4 performance prior to 2/29/08 reflects historical Class 1 performance, which does not have a 12b-1 fee expense. Since 2/29/08 (effective date), the average annual total return of Class 4 shares was +6.90%.
Total Return Index Comparison for a Hypothetical $10,000 Investment (1/1/04–12/31/13)
The graph below shows the change in value of a hypothetical $10,000 investment in the Fund over the indicated period and includes reinvestment of any income or distributions. The Fund’s performance* is compared to the performance of the Standard & Poor’s® 500 Index (S&P 500®) and the MSCI World Index. One cannot invest directly in an index, and an index is not representative of the Fund’s portfolio. Please see Important Notes to Performance Information preceding the Fund Summaries.
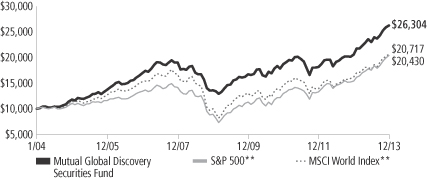
**Source: © 2014 Morningstar. Please see Index Descriptions following the Fund Summaries.
Mutual Global Discovery Securities Fund – Class 4
Performance reflects the Fund’s Class 4 operating expenses, but does not include any contract fees, expenses or sales charges. If they had been included, performance would be lower. These charges and deductions, particularly for variable life policies, can have a significant effect on contract values and insurance benefits. See the contract prospectus for a complete description of these expenses, including sales charges.
Performance data represent past performance, which does not guarantee future results. Investment return and principal value will fluctuate, and you may have a gain or loss when you sell your shares.
Current performance may differ from figures shown.
MGD-1
Fund Goal and Main Investments: Mutual Global Discovery Securities Fund seeks capital appreciation. Under normal market conditions, the Fund invests primarily in U.S. and foreign equity securities that the investment manager believes are undervalued.
Performance Overview
You can find the Fund’s one-year total return in the Performance Summary. For comparison, the Fund’s benchmark, the MSCI World Index, generated a +27.36% total return and the S&P 500 posted a +32.39% total return for the same period.1
Economic and Market Overview
The 12 months under review were characterized by reinvigorated policy support and an economic recovery in developed markets. However, differences in global economic trends corresponded with increasingly divergent monetary policies, and growth in emerging market economies tended to slow. The central banks of key developed markets generally reaffirmed their accommodative monetary stances while some emerging market counterparts tightened policy rates as they sought to control inflation and currency depreciation.
In the U.S., economic growth and employment trends generally exceeded expectations. The U.S. Federal Reserve Board (Fed) expanded its asset purchase program to $85 billion per month from $40 billion early in the year. After encouraging economic and employment reports, the Fed announced in December it would reduce its monthly bond purchases by $10 billion beginning in January 2014; however, the Fed committed to keeping interest rates low. In October, the federal government temporarily shut down after Congress failed to authorize routine federal funding amid a disagreement over a new health care law. However, Congress subsequently agreed to fund the government through early 2014 and later passed a two-year budget deal that could ease automatic spending cuts and lower the risk of another shutdown.
Outside the U.S., the eurozone emerged from its longest recession on record during 2013’s second half and Japan’s growth moderated. The European Central Bank reduced its policy rate to a record low and pledged to maintain systemic support following political turmoil in Greece, Spain, Portugal and Italy. Germany’s re-election of Chancellor
1. Source: © 2014 Morningstar. One cannot invest directly in an index, and an index is not representative of the Fund’s portfolio. Please see Index Descriptions following the Fund Summaries.
Fund Risks: All investments involve risks, including possible loss of principal. Value securities may not increase in price as anticipated, or may decline further in value. The Fund’s investments in foreign securities involve certain risks including currency fluctuations, and economic and political uncertainties. Smaller company stocks have exhibited greater price volatility than larger company stocks, particularly over the short term. The Fund’s investments in companies engaged in mergers, reorganizations or liquidations also involve special risks as pending deals may not be completed on time or on favorable terms. The Fund may invest in lower rated bonds, which entail higher credit risk. The Fund is actively managed but there is no guarantee that the manager’s investment decisions will produce the desired results. The Fund’s prospectus also includes a description of the main investment risks.
MGD-2
Angela Merkel was largely perceived as a vote of support for ongoing eurozone reform measures. In Asia, the Bank of Japan set an explicit inflation target and pledged to double bond purchases in an unprecedented wave of policy reform. The U.S. dollar fell versus the euro but rose versus the Japanese yen in 2013.
Growth in many emerging markets moderated based on lower domestic demand, falling exports and weakening commodity prices. Political turmoil in certain emerging markets, the Fed’s potential tapering of its asset purchase program and the Chinese central bank’s effort to tighten liquidity to curb real estate and credit speculation led to a sell-off in emerging market equities and a sharp depreciation in regional currencies against the U.S. dollar. Central banks in Brazil, India and Indonesia raised interest rates in the second half of 2013 as they sought to curb inflation.
The stock market rally in developed markets accelerated during 2013 amid redoubled central bank commitments, continued corporate earnings strength and increasing signs of economic progress. Emerging market stocks rebounded toward period-end, although Latin American stocks trailed their emerging market peers. Oil prices rallied in the third quarter and rose for the year mainly owing to supply concerns related to geopolitical turmoil, but gold posted its largest annual price decline in more than three decades. Increasingly divergent economic and political circumstances during the period resulted in declining market correlations, which many bottom-up investors perceived as more favorable.
Investment Strategy
At Mutual Series, we are committed to our distinctive value approach to investing. Our major investment strategy is investing in undervalued stocks. When selecting undervalued equities, we are attracted to fundamentally strong companies with healthy balance sheets, high-quality assets, substantial free cash flow and shareholder-oriented management teams and whose stocks are trading at discounts to our assessment of the companies’ intrinsic or business value. We also look for asset-rich companies whose shares may be trading at depressed levels due to concerns over short-term earnings disappointments, litigation, management strategy or other perceived negatives. While the vast majority of our undervalued equity investments are made in publicly traded companies globally, we may invest occasionally in privately held companies as well.
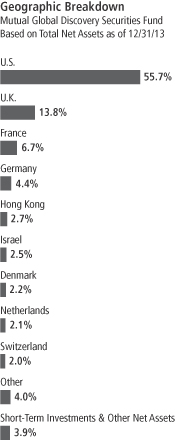
MGD-3
We complement this more traditional investment strategy with two others. One is distressed investing, which is complex and can take many forms. The most common distressed investment the Fund undertakes is the purchase of financially troubled or bankrupt companies’ debt at a substantial discount to face value. After the financially distressed company is reorganized, often in bankruptcy court, the old debt is typically replaced with new securities issued by the financially stronger company.
The other piece of our investment strategy is participating in arbitrage situations, another highly specialized field. When companies announce proposed mergers or takeovers, commonly referred to as “deals,” the target company may trade at a discount to the bid it ultimately accepts. One form of arbitrage involves purchasing the target company’s stock when it is trading below the value we believe it would receive in a deal. In keeping with our commitment to a relatively conservative investment approach, we typically focus our arbitrage efforts on announced deals, and eschew rumored deals or other situations we consider relatively risky.
In addition, it is our practice to hedge the Fund’s currency exposure when we deem it advantageous for our shareholders.
Manager’s Discussion
In an environment of generally rising equity prices, many Fund investments increased in value during the year. Top contributors included U.K.-based mobile telephony operator Vodafone Group, U.S.-based managed health care company Cigna and Germany-based retailer Metro.
Vodafone Group is a global mobile telecommunications company that provides a range of services, including voice and data communications. The company’s stock rallied in the second half of the year, driven largely by the long-anticipated sale of its 45% stake in Verizon Wireless to Verizon Communications at what we considered to be an attractive price. Vodafone said it planned to return two-thirds of the capital from the sale to shareholders and use the balance to invest in growth initiatives in its core markets and to reduce debt. Following the deal, we continued to view Vodafone as a potentially compelling stock, given that the economic environment in Europe has shown signs of stabilizing, the regulatory environment is easing and we believe the company may be close to monetizing its investments in data services.
What is meant by “hedge”?
To hedge a position is to seek to reduce the risk of adverse price movements in an asset. Normally, a hedge is implemented as an offsetting position in a related security, such as a currency forward contract.
What is a currency forward contract?
A currency forward contract, also called a “currency forward,” is an agreement between the Fund and a counterparty to buy or sell a foreign currency at a specific exchange rate on a future date.
MGD-4
Shares of Cigna benefited from improved investor sentiment early in the period following the company’s divestiture of its legacy run-off insurance business. Partially as a result of the divestiture, three major independent credit rating agencies issued positive outlooks for the company’s debt. Additionally, operational performance also improved as Cigna reported strong results in its core businesses. In October, Cigna increased its outlook for fiscal year 2013 consolidated adjusted income from operations. In our assessment, the outlook was among the more favorable in the managed care industry, owing to the company’s low exposure to potentially negative elements of upcoming health care reforms.
Metro, which runs Europe’s largest cash and carry business as well as Germany’s largest department store chain, benefited from ongoing restructuring efforts led by a revamped management team. Management’s plans to create value by exiting non-core markets while improving profitability in Germany supported improved investor sentiment as quarterly operating profits exceeded consensus estimates. A rise in net cash flow from operations and proceeds from the disposal of various business units allowed Metro to significantly reduce its net debt. At period-end, the company was also considering a spin-off of its Russian operations, a move we believed could potentially unlock further value. Additionally, shares were positively affected by rising sentiment that European consumer spending stands to grow.
During the 12 months under review, some of the Fund’s investments lost value and negatively affected performance. Key detractors included Hong Kong-based conglomerate Jardine Matheson Holdings, French power and transportation firm Alstom and U.K.-based metals and mining company Anglo American.
Exposure to emerging markets in Asia negatively affected Jardine Matheson Holdings. A growing belief that the Fed was close to winding down its quantitative easing program, which the central bank confirmed in December, contributed to capital outflows from those markets during the year. Operationally, strong performance at the company’s Hong Kong Land business was offset by weak results for Indonesian automotive producer and distributor Astra International, which struggled amid poor demand for heavy machinery and a weakening Indonesian rupiah. We viewed the recent headwinds as a cyclical issue for emerging markets, and at period-end we remained confident in our investment thesis given Jardine Matheson’s cash generation ability and robust balance sheet.
Top 10 Equity Holdings
Mutual Global Discovery Securities Fund 12/31/13
| | | | |
Company
Sector/Industry,
Country | | % of Total
Net Assets | |
| Vodafone Group PLC | | | 3.3% | |
| Wireless Telecommunication Services, U. K. | | | | |
| Microsoft Corp. | | | 2.4% | |
| Software, U.S. | | | | |
| Merck & Co. Inc. | | | 2.3% | |
| Pharmaceuticals, U.S. | | | | |
| A.P. Moeller-Maersk AS, B | | | 2.2% | |
| Marine, Denmark | | | | |
| ACE Ltd. | | | 2.2% | |
| Insurance, U.S. | | | | |
| Apple Inc. | | | 2.2% | |
| Computers & Peripherals, U.S. | | | | |
| Royal Dutch Shell PLC, A | | | 2.2% | |
| Oil, Gas & Consumable Fuels, U.K. | | | | |
| American International Group Inc. | | | 2.2% | |
| Insurance, U.S. | | | | |
| ING Groep NV, IDR | | | 2.1% | |
| Diversified Financial Services, Netherlands | | | | |
| Metro AG | | | 2.0% | |
| Food & Staples Retailing, Germany | | | | |
The dollar value, number of shares or principal amount, and names of all portfolio holdings are listed in the Fund’s Statement of Investments (SOI).
MGD-5
Alstom is an industrial conglomerate with a focus on power generation, transmission and transportation. Shares declined as the company reduced its organic sales growth estimates during the year and also pushed out its operating margin target by one to two years. Later, investors grew more concerned about the company’s ability to generate sufficient free cash flow to reduce its debt level.
The share price of Anglo American was negatively affected by declining prices for several of the commodities it produces. Uncertainty surrounding possible restructuring actions also weighed on the stock price. In January, the company appointed a new chief executive officer, tasked with a mandate to improve operations and capital discipline. Despite the price decline during the year, at period-end, we maintained a favorable outlook for the stock as the new management team remained focused on improving operational performance and returns with the aim of increasing shareholder value.
During the year, the Fund held currency forwards and futures to somewhat hedge the currency risk of the Fund’s non-U.S. dollar investments. The hedges had a minor negative impact on the Fund’s performance during the period.
Thank you for your participation in Mutual Global Discovery Securities Fund. We look forward to serving your future investment needs.
The foregoing information reflects our analysis, opinions and portfolio holdings as of December 31, 2013, the end of the reporting period. The way we implement our main investment strategies and the resulting portfolio holdings may change depending on factors such as market and economic conditions. These opinions may not be relied upon as investment advice or an offer for a particular security. The information is not a complete analysis of every aspect of any market, country, industry, security or the Fund. Statements of fact are from sources considered reliable, but the investment manager makes no representation or warranty as to their completeness or accuracy. Although historical performance is no guarantee of future results, these insights may help you understand our investment management philosophy.
Top 10 Sectors/Industries
Mutual Global Discovery Securities Fund 12/31/13
| | | | |
| | | % of Total
Net Assets | |
| Commercial Banks | | | 9.5% | |
| Insurance | | | 7.5% | |
| Oil, Gas & Consumable Fuels | | | 7.5% | |
| Diversified Financial Services | | | 5.9% | |
| Pharmaceuticals | | | 5.5% | |
| Food & Staples Retailing | | | 5.5% | |
| Tobacco | | | 4.8% | |
| Software | | | 4.5% | |
| Media | | | 3.7% | |
Wireless Telecommunication Services | | | 3.3% | |
What is a futures contract?
A futures contract, also called a “future,” is an agreement between the Fund and a counterparty made through a U.S. or foreign futures exchange to buy or sell an asset at a specific price on a future date.
MGD-6
Fund Expenses
As an investor in a variable insurance contract (Contract) that indirectly provides for investment in an underlying mutual fund, you can incur transaction and/or ongoing expenses at both the Fund level and the Contract level.
| • | | Transaction expenses can include sales charges (loads) on purchases, redemption fees, surrender fees, transfer fees and premium taxes. |
| • | | Ongoing expenses can include management fees, distribution and service (12b-1) fees, contract fees, annual maintenance fees, mortality and expense risk fees and other fees and expenses. All mutual funds and Contracts have some types of ongoing expenses. |
The expenses shown in the table are meant to highlight ongoing expenses at the Fund level only and do not include ongoing expenses at the Contract level, or transaction expenses at either the Fund or Contract level. While the Fund does not have transaction expenses, if the transaction and ongoing expenses at the Contract level were included, the expenses shown below would be higher. You should consult your Contract prospectus or disclosure document for more information.
The table shows Fund-level ongoing expenses and can help you understand these expenses and compare them with those of other mutual funds offered through the Contract. The table assumes a $1,000 investment held for the six months indicated. Please refer to the Fund prospectus for additional information on operating expenses.
Actual Fund Expenses
The first line (Actual) of the table provides actual account values and expenses. The “Ending Account Value” is derived from the Fund’s actual return, which includes the effect of ongoing Fund expenses, but does not include the effect of ongoing Contract expenses.
You can estimate the Fund-level expenses you incurred during the period by following these steps. Of course, your account value and expenses will differ from those in this illustration:
| 1. | Divide your account value by $1,000. |
If an account had an $8,600 value, then $8,600 ÷ $1,000 = 8.6.
| 2. | Multiply the result by the number under the heading “Fund-Level Expenses Incurred During Period.” |
If Fund-Level Expenses Incurred During Period were $7.50, then 8.6 x $7.50 = $64.50.
In this illustration, the estimated expenses incurred this period at the Fund level are $64.50.
Mutual Global Discovery Securities Fund – Class 4
MGD-7
Hypothetical Example for Comparison with Other Mutual Funds
Information in the second line (Hypothetical) of the table can help you compare ongoing expenses of the Fund with those of other mutual funds offered through the Contract. This information may not be used to estimate the actual ending account balance or expenses you incurred during the period. The hypothetical “Ending Account Value” is based on the Fund’s actual expense ratio and an assumed 5% annual rate of return before expenses, which does not represent the Fund’s actual return. The figure under the heading “Fund-Level Expenses Incurred During Period” shows the hypothetical expenses your account would have incurred under this scenario. You can compare this figure with the 5% hypothetical examples that appear in shareholder reports of other funds offered through a Contract.
| | | | | | | | | | | | |
| Class 4 | | Beginning
Account
Value 7/1/13 | | | Ending
Account
Value 12/31/13 | | | Fund-Level
Expenses Incurred
During Period*
7/1/13–12/31/13 | |
Actual | | $ | 1,000 | | | $ | 1,140.90 | | | $ | 7.12 | |
Hypothetical (5% return
before expenses) | | $ | 1,000 | | | $ | 1,018.55 | | | $ | 6.72 | |
*Expenses are calculated using the most recent six-month annualized expense ratio for the Fund’s Class 4 shares (1.32%), which does not include any ongoing expenses of the Contract for which the Fund is an investment option, multiplied by the average account value over the period, multiplied by 184/365 to reflect the one-half year period.
MGD-8
SUPPLEMENT DATED JANUARY 2, 2014
TOTHE PROSPECTUS
DATED MAY 1, 2013
OF
MUTUAL GLOBAL DISCOVERY SECURITIES FUND
(A series of Franklin Templeton Variable Insurance Products Trust)
The prospectus is amended as follows:
I. The Fund Details “Management” section disclosure concerning the portfolio management team beginning on page MGD-D8 is revised to read as follows:
The Fund is managed by a team of dedicated professionals focused on investments in equity securities they consider to be undervalued. The portfolio managers of the team are as follows:
| | |
PETER A. LANGERMAN Chairman, President and Chief Executive Officer of Franklin Mutual | | Mr. Langerman has been a co-lead portfolio manager since 2009. He joined Franklin Templeton Investments in 1996, serving in various capacities, including President and Chief Executive Officer of Franklin Mutual and member of the management team of the Fund, before leaving in 2002 and serving as director of New Jersey’s Division of Investment, overseeing employee pension funds. Between 1986 and 1996, he was employed at Heine Securities Corporation, the Funds’ former manager. |
| |
PHILIPPE BRUGERE-TRELAT Executive Vice President of Franklin Mutual | | Mr. Brugere-Trelat has been a co-lead portfolio manager of the Fund since 2009. He has been a member of the management team of the Fund since 2004, when he rejoined Franklin Templeton Investments. Between 1984 and 1994, he was employed at Heine Securities Corporation, the Funds’ former manager. |
| |
TIMOTHY RANKIN, CFA Portfolio Manager of Franklin Mutual | | Mr. Rankin has been a portfolio manager of the Fund since 2010 and assumed the duties of co-lead portfolio manager in January 2014. He rejoined Franklin Templeton Investments in June 2010. Prior to rejoining Franklin Templeton Investments, he was managing director of Blue Harbour Group, LLC, a private investment firm focused on small- and mid-cap North American companies. Previously, he worked at Franklin Templeton Investments from 1997 through 2004. |
As co-lead portfolio managers of the Fund, Mr. Langerman, Mr. Brugere-Trelat and Mr. Rankin have equal authority over all aspects of the Fund’s investment portfolio, including but not limited to, purchases and sales of individual securities, portfolio risk assessment, and the management of daily cash balances in accordance with anticipated investment management requirements. The degree to which either may perform these functions, and the nature of these functions, may change from time to time.
CFA® and Chartered Financial Analyst® are trademarks owned by CFA Institute.
Please keep this supplement for future reference.
MGD-9
Franklin Templeton Variable Insurance Products Trust
Financial Highlights
Mutual Global Discovery Securities Fund
| | | | | | | | | | | | | | | | | | | | |
| | | Year Ended December 31, | |
| Class 1 | | 2013 | | | 2012 | | | 2011 | | | 2010 | | | 2009 | |
| | | | |
Per share operating performance | | | | | | | | | | | | | | | | | | | | |
(for a share outstanding throughout the year) | | | | | | | | | | | | | | | | | | | | |
Net asset value, beginning of year | | $ | 20.55 | | | $ | 19.66 | | | $ | 21.16 | | | $ | 19.14 | | | $ | 16.12 | |
| | | | |
Income from investment operationsa: | | | | | | | | | | | | | | | | | | | | |
Net investment incomeb | | | 0.46 | | | | 0.43 | | | | 0.52 | | | | 0.38 | | | | 0.19 | c |
Net realized and unrealized gains (losses) | | | 5.03 | | | | 2.21 | | | | (1.09 | ) | | | 1.94 | | | | 3.57 | |
| | | | |
Total from investment operations | | | 5.49 | | | | 2.64 | | | | (0.57 | ) | | | 2.32 | | | | 3.76 | |
| | | | |
Less distributions from: | | | | | | | | | | | | | | | | | | | | |
Net investment income | | | (0.58 | ) | | | (0.64 | ) | | | (0.50 | ) | | | (0.30 | ) | | | (0.26 | ) |
Net realized gains | | | (2.15 | ) | | | (1.11 | ) | | | (0.43 | ) | | | — | | | | (0.48 | ) |
| | | | |
Total distributions | | | (2.73 | ) | | | (1.75 | ) | | | (0.93 | ) | | | (0.30 | ) | | | (0.74 | ) |
| | | | |
Net asset value, end of year | | $ | 23.31 | | | $ | 20.55 | | | $ | 19.66 | | | $ | 21.16 | | | $ | 19.14 | |
| | | | |
| | | | | |
Total returnd | | | 27.95% | | | | 13.63% | | | | (2.73)% | | | | 12.24% | | | | 23.63% | |
Ratios to average net assets | | | | | | | | | | | | | | | | | | | | |
Expensese | | | 0.97% | f | | | 0.99% | | | | 0.97% | f | | | 1.00% | f | | | 1.06% | f |
Expenses incurred in connection with securities sold short | | | —% | g | | | —% | g | | | —% | g | | | 0.02% | | | | 0.09% | |
Net investment income | | | 2.13% | | | | 2.12% | | | | 2.34% | | | | 1.93% | | | | 1.07% | c |
| | | | | |
Supplemental data | | | | | | | | | | | | | | | | | | | | |
Net assets, end of year (000’s) | | $ | 2,465 | | | $ | 1,136 | | | $ | 974 | | | $ | 84,213 | | | $ | 86,755 | |
Portfolio turnover rate | | | 15.58% | | | | 25.63% | | | | 26.17% | h | | | 49.31% | | | | 43.35% | |
aThe amount shown for a share outstanding throughout the period may not correlate with the Statement of Operations for the period due to the timing of sales and repurchases of the Fund shares in relation to income earned and/or fluctuating market value of the investments of the Fund.
bBased on average daily shares outstanding.
cNet investment income per share includes approximately $(0.03) per share related to an adjustment for uncollectible interest as disclosed on the Statement of Operations. Excluding the effect of this adjustment, the ratio of net investment income to average net assets would have been 1.26%.
dTotal return does not include fees, charges or expenses imposed by the variable annuity and life insurance contracts for which the Franklin Templeton Variable Insurance Products Trust serves as an underlying investment vehicle.
eIncludes dividend or interest expense on securities sold short and security borrowing fees, if any. See below for the ratios of such expenses to average net assets for the periods presented. See Note 1(e).
fBenefit of expense reduction rounds to less than 0.01%.
gRounds to less than 0.01%.
hExcludes the value of portfolio securities delivered as a result of a redemption in-kind.
The accompanying notes are an integral part of these financial statements.
MGD-10
Franklin Templeton Variable Insurance Products Trust
Financial Highlights (continued)
Mutual Global Discovery Securities Fund
| | | | | | | | | | | | | | | | | | | | |
| | | Year Ended December 31, | |
| Class 2 | | 2013 | | | 2012 | | | 2011 | | | 2010 | | | 2009 | |
| | | | |
Per share operating performance | | | | | | | | | | | | | | | | | | | | |
(for a share outstanding throughout the year) | | | | | | | | | | | | | | | | | | | | |
Net asset value, beginning of year | | $ | 20.17 | | | $ | 19.30 | | | $ | 20.80 | | | $ | 18.81 | | | $ | 15.85 | |
| | | | |
Income from investment operationsa: | | | | | | | | | | | | | | | | | | | | |
Net investment incomeb | | | 0.42 | | | | 0.38 | | | | 0.43 | | | | 0.33 | | | | 0.14 | c |
Net realized and unrealized gains (losses) | | | 4.92 | | | | 2.15 | | | | (1.04 | ) | | | 1.91 | | | | 3.50 | |
| | | | |
Total from investment operations | | | 5.34 | | | | 2.53 | | | | (0.61 | ) | | | 2.24 | | | | 3.64 | |
| | | | |
Less distributions from: | | | | | | | | | | | | | | | | | | | | |
Net investment income | | | (0.52 | ) | | | (0.55 | ) | | | (0.46 | ) | | | (0.25 | ) | | | (0.20 | ) |
Net realized gains | | | (2.15 | ) | | | (1.11 | ) | | | (0.43 | ) | | | — | | | | (0.48 | ) |
| | | | |
Total distributions | | | (2.67 | ) | | | (1.66 | ) | | | (0.89 | ) | | | (0.25 | ) | | | (0.68 | ) |
| | | | |
Net asset value, end of year | | $ | 22.84 | | | $ | 20.17 | | | $ | 19.30 | | | $ | 20.80 | | | $ | 18.81 | |
| | | | |
| | | | | |
Total returnd | | | 27.61% | | | | 13.36% | | | | (2.96)% | | | | 11.96% | | | | 23.31% | |
Ratios to average net assets | | | | | | | | | | | | | | | | | | | | |
Expensese | | | 1.22% | f | | | 1.24% | | | | 1.22% | f | | | 1.25% | f | | | 1.31% | f |
Expenses incurred in connection with securities sold short | | | —% | g | | | —% | g | | | —% | g | | | 0.02% | | | | 0.09% | |
Net investment income | | | 1.88% | | | | 1.87% | | | | 2.09% | | | | 1.68% | | | | 0.82% | c |
| | | | | |
Supplemental data | | | | | | | | | | | | | | | | | | | | |
Net assets, end of year (000’s) | | $ | 684,780 | | | $ | 660,465 | | | $ | 712,161 | | | $ | 1,351,223 | | | $ | 1,309,852 | |
Portfolio turnover rate | | | 15.58% | | | | 25.63% | | | | 26.17% | h | | | 49.31% | | | | 43.35% | |
aThe amount shown for a share outstanding throughout the period may not correlate with the Statement of Operations for the period due to the timing of sales and repurchases of the Fund shares in relation to income earned and/or fluctuating market value of the investments of the Fund.
bBased on average daily shares outstanding.
cNet investment income per share includes approximately $(0.03) per share related to an adjustment for uncollectible interest. Excluding the effect of this adjustment, the ratio of net investment income to average net assets would have been 1.01%.
dTotal return does not include fees, charges or expenses imposed by the variable annuity and life insurance contracts for which the Franklin Templeton Variable Insurance Products Trust serves as an underlying investment vehicle.
eIncludes dividend or interest expense on securities sold short and security borrowing fees, if any. See below for the ratios of such expenses to average net assets for the periods presented. See Note 1(e).
fBenefit of expense reduction rounds to less than 0.01%.
gRounds to less than 0.01%.
hExcludes the value of portfolio securities delivered as a result of a redemption in-kind.
The accompanying notes are an integral part of these financial statements.
MGD-11
Franklin Templeton Variable Insurance Products Trust
Financial Highlights (continued)
Mutual Global Discovery Securities Fund
| | | | | | | | | | | | | | | | | | | | |
| | | Year Ended December 31, | |
| Class 4 | | 2013 | | | 2012 | | | 2011 | | | 2010 | | | 2009 | |
| | | | |
Per share operating performance | | | | | | | | | | | | | | | | | | | | |
(for a share outstanding throughout the year) | | | | | | | | | | | | | | | | | | | | |
Net asset value, beginning of year | | $ | 20.38 | | | $ | 19.50 | | | $ | 21.02 | | | $ | 19.02 | | | $ | 16.07 | |
| | | | |
Income from investment operationsa: | | | | | | | | | | | | | | | | | | | | |
Net investment incomeb | | | 0.40 | | | | 0.36 | | | | 0.40 | | | | 0.31 | | | | 0.11 | c |
Net realized and unrealized gains (losses) | | | 4.97 | | | | 2.19 | | | | (1.05 | ) | | | 1.94 | | | | 3.56 | |
| | | | |
Total from investment operations | | | 5.37 | | | | 2.55 | | | | (0.65 | ) | | | 2.25 | | | | 3.67 | |
| | | | |
Less distributions from: | | | | | | | | | | | | | | | | | | | | |
Net investment income | | | (0.50 | ) | | | (0.56 | ) | | | (0.44 | ) | | | (0.25 | ) | | | (0.24 | ) |
Net realized gains | | | (2.15 | ) | | | (1.11 | ) | | | (0.43 | ) | | | — | | | | (0.48 | ) |
| | | | |
Total distributions | | | (2.65 | ) | | | (1.67 | ) | | | (0.87 | ) | | | (0.25 | ) | | | (0.72 | ) |
| | | | |
Net asset value, end of year | | $ | 23.10 | | | $ | 20.38 | | | $ | 19.50 | | | $ | 21.02 | | | $ | 19.02 | |
| | | | |
| | | | | |
Total returnd | | | 27.52% | | | | 13.27% | | | | (3.08)% | | | | 11.87% | | | | 23.19% | |
Ratios to average net assets | | | | | | | | | | | | | | | | | | | | |
Expensese | | | 1.32% | f | | | 1.34% | | | | 1.32% | f | | | 1.35% | f | | | 1.41% | f |
Expenses incurred in connection with securities sold short | | | —% | g | | | —% | g | | | —% | g | | | 0.02% | | | | 0.09% | |
Net investment income | | | 1.78% | | | | 1.77% | | | | 1.99% | | | | 1.58% | | | | 0.72% | c |
| | | | | |
Supplemental data | | | | | | | | | | | | | | | | | | | | |
Net assets, end of year (000’s) | | $ | 70,354 | | | $ | 62,346 | | | $ | 66,695 | | | $ | 70,613 | | | $ | 59,178 | |
Portfolio turnover rate | | | 15.58% | | | | 25.63% | | | | 26.17% | h | | | 49.31% | | | | 43.35% | |
aThe amount shown for a share outstanding throughout the period may not correlate with the Statement of Operations for the period due to the timing of sales and repurchases of the Fund shares in relation to income earned and/or fluctuating market value of the investments of the Fund.
bBased on average daily shares outstanding.
cNet investment income per share includes approximately $(0.03) per share related to an adjustment for uncollectible interest. Excluding the effect of this adjustment, the ratio of net investment income to average net assets would have been 0.91%.
dTotal return does not include fees, charges or expenses imposed by the variable annuity and life insurance contracts for which the Franklin Templeton Variable Insurance Products Trust serves as an underlying investment vehicle.
eIncludes dividend or interest expense on securities sold short and security borrowing fees, if any. See below for the ratios of such expenses to average net assets for the periods presented. See Note 1(e).
fBenefit of expense reduction rounds to less than 0.01%.
gRounds to less than 0.01%.
hExcludes the value of portfolio securities delivered as a result of a redemption in-kind.
The accompanying notes are an integral part of these financial statements.
MGD-12
Franklin Templeton Variable Insurance Products Trust
Statement of Investments, December 31, 2013
| | | | | | | | | | |
| Mutual Global Discovery Securities Fund | | Country | | Shares/
Units | | | Value | |
Common Stocks and Other Equity Interests 90.8% | | | | | | | | | | |
Aerospace & Defense 1.0% | | | | | | | | | | |
Safran SA | | France | | | 107,185 | | | $ | 7,446,839 | |
| | | | | | | | | | |
Auto Components 0.8% | | | | | | | | | | |
Continental AG | | Germany | | | 17,853 | | | | 3,914,354 | |
a,b International Automotive Components Group Brazil LLC | | Brazil | | | 424,073 | | | | 82,618 | |
a,b,c International Automotive Components Group North America, LLC | | United States | | | 4,052,916 | | | | 2,293,221 | |
| | | | | | | | | | |
| | | | | | | | | 6,290,193 | |
| | | | | | | | | | |
Automobiles 0.7% | | | | | | | | | | |
aGeneral Motors Co. | | United States | | | 136,940 | | | | 5,596,738 | |
| | | | | | | | | | |
Beverages 1.2% | | | | | | | | | | |
Coca-Cola Enterprises Inc. | | United Kingdom | | | 96,500 | | | | 4,258,545 | |
Dr. Pepper Snapple Group Inc. | | United States | | | 91,753 | | | | 4,470,206 | |
| | | | | | | | | | |
| | | | | | | | | 8,728,751 | |
| | | | | | | | | | |
Capital Markets 0.6% | | | | | | | | | | |
aChina Cinda Asset Management Co. Ltd., H | | China | | | 341,392 | | | | 212,204 | |
Morgan Stanley | | United States | | | 140,030 | | | | 4,391,341 | |
| | | | | | | | | | |
| | | | | | | | | 4,603,545 | |
| | | | | | | | | | |
Commercial Banks 9.5% | | | | | | | | | | |
a,b,d The Bankshares Inc. | | United States | | | 800,000 | | | | 3,815,192 | |
Barclays PLC | | United Kingdom | | | 990,101 | | | | 4,457,823 | |
BNP Paribas SA | | France | | | 107,180 | | | | 8,351,688 | |
aCapital Bank Financial Corp., A | | United States | | | 78,494 | | | | 1,785,739 | |
a,e Capital Bank Financial Corp., B, 144A, non-voting | | United States | | | 269,922 | | | | 6,140,725 | |
CIT Group Inc. | | United States | | | 108,462 | | | | 5,654,124 | |
HSBC Holdings PLC | | United Kingdom | | | 586,355 | | | | 6,431,056 | |
KB Financial Group Inc. | | South Korea | | | 101,400 | | | | 4,058,017 | |
PNC Financial Services Group Inc. | | United States | | | 112,821 | | | | 8,752,653 | |
Societe Generale | | France | | | 64,534 | | | | 3,747,722 | |
SunTrust Banks Inc. | | United States | | | 139,468 | | | | 5,133,817 | |
Wells Fargo & Co. | | United States | | | 307,140 | | | | 13,944,156 | |
| | | | | | | | | | |
| | | | | | | | | 72,272,712 | |
| | | | | | | | | | |
Communications Equipment 1.1% | | | | | | | | | | |
Cisco Systems Inc. | | United States | | | 359,180 | | | | 8,063,591 | |
| | | | | | | | | | |
Computers & Peripherals 3.0% | | | | | | | | | | |
Apple Inc. | | United States | | | 29,121 | | | | 16,340,084 | |
Hewlett-Packard Co. | | United States | | | 215,217 | | | | 6,021,772 | |
| | | | | | | | | | |
| | | | | | | | | 22,361,856 | |
| | | | | | | | | | |
Construction & Engineering 0.9% | | | | | | | | | | |
Vinci SA | | France | | | 99,255 | | | | 6,514,985 | |
| | | | | | | | | | |
Consumer Finance 0.0%† | | | | | | | | | | |
aComdisco Holding Co. Inc. | | United States | | | 44 | | | | 238 | |
| | | | | | | | | | |
Diversified Financial Services 5.4% | | | | | | | | | | |
Citigroup Inc. | | United States | | | 229,050 | | | | 11,935,796 | |
Deutsche Boerse AG | | Germany | | | 60,838 | | | | 5,037,696 | |
aING Groep NV, IDR | | Netherlands | | | 1,161,320 | | | | 16,133,695 | |
JPMorgan Chase & Co. | | United States | | | 131,280 | | | | 7,677,255 | |
| | | | | | | | | | |
| | | | | | | | | 40,784,442 | |
| | | | | | | | | | |
MGD-13
Franklin Templeton Variable Insurance Products Trust
Statement of Investments, December 31, 2013 (continued)
| | | | | | | | | | |
| Mutual Global Discovery Securities Fund | | Country | | Shares/
Units | | | Value | |
Common Stocks and Other Equity Interests (continued) | | | | | | | | | | |
Diversified Telecommunication Services 0.7% | | | | | | | | | | |
a,f,g Global Crossing Holdings Ltd., Contingent Distribution | | United States | | | 2,236,777 | | | $ | — | |
Vivendi SA | | France | | | 201,673 | | | | 5,313,620 | |
| | | | | | | | | | |
| | | | | | | | | 5,313,620 | |
| | | | | | | | | | |
Electric Utilities 0.8% | | | | | | | | | | |
Exelon Corp. | | United States | | | 215,010 | | | | 5,889,124 | |
| | | | | | | | | | |
Electrical Equipment 0.2% | | | | | | | | | | |
Alstom SA | | France | | | 41,228 | | | | 1,501,374 | |
| | | | | | | | | | |
Energy Equipment & Services 2.5% | | | | | | | | | | |
Baker Hughes Inc. | | United States | | | 147,071 | | | | 8,127,143 | |
Ensco PLC, A | | United States | | | 83,364 | | | | 4,766,754 | |
Transocean Ltd. | | United States | | | 120,473 | | | | 5,953,776 | |
| | | | | | | | | | |
| | | | | | | | | 18,847,673 | |
| | | | | | | | | | |
Food & Staples Retailing 5.5% | | | | | | | | | | |
China Resources Enterprise Ltd. | | China | | | 1,266,000 | | | | 4,204,027 | |
CVS Caremark Corp. | | United States | | | 78,301 | | | | 5,604,003 | |
Empire Co. Ltd., A | | Canada | | | 68,050 | | | | 4,650,067 | |
Metro AG | | Germany | | | 318,004 | | | | 15,396,990 | |
Tesco PLC | | United Kingdom | | | 686,623 | | | | 3,802,342 | |
Walgreen Co. | | United States | | | 135,422 | | | | 7,778,640 | |
| | | | | | | | | | |
| | | | | | | | | 41,436,069 | |
| | | | | | | | | | |
Health Care Equipment & Supplies 2.4% | | | | | | | | | | |
Medtronic Inc. | | United States | | | 257,934 | | | | 14,802,832 | |
Stryker Corp. | | United States | | | 46,588 | | | | 3,500,622 | |
| | | | | | | | | | |
| | | | | | | | | 18,303,454 | |
| | | | | | | | | | |
Health Care Providers & Services 2.4% | | | | | | | | | | |
Cigna Corp. | | United States | | | 152,861 | | | | 13,372,280 | |
WellPoint Inc. | | United States | | | 51,010 | | | | 4,712,814 | |
| | | | | | | | | | |
| | | | | | | | | 18,085,094 | |
| | | | | | | | | | |
Hotels, Restaurants & Leisure 1.5% | | | | | | | | | | |
Accor SA | | France | | | 233,246 | | | | 11,004,464 | |
| | | | | | | | | | |
Independent Power Producers & Energy Traders 1.1% | | | | | | | | | | |
NRG Energy Inc. | | United States | | | 299,277 | | | | 8,595,235 | |
| | | | | | | | | | |
Industrial Conglomerates 2.6% | | | | | | | | | | |
Jardine Matheson Holdings Ltd. | | Hong Kong | | | 141,097 | | | | 7,380,784 | |
Jardine Strategic Holdings Ltd. | | Hong Kong | | | 371,698 | | | | 11,894,336 | |
Siemens AG | | Germany | | | 3,785 | | | | 516,930 | |
| | | | | | | | | | |
| | | | | | | | | 19,792,050 | |
| | | | | | | | | | |
Insurance 7.5% | | | | | | | | | | |
ACE Ltd. | | United States | | | 163,160 | | | | 16,891,955 | |
aAlleghany Corp. | | United States | | | 2,730 | | | | 1,091,891 | |
American International Group Inc. | | United States | | | 319,563 | | | | 16,313,691 | |
E-L Financial Corp. Ltd. | | Canada | | | 5,378 | | | | 3,721,537 | |
a,b Imagine Group Holdings Ltd. | | Bermuda | | | 56,213 | | | | 410,692 | |
MetLife Inc. | | United States | | | 63,096 | | | | 3,402,136 | |
a,b Olympus Re Holdings Ltd. | | United States | | | 2,140 | | | | — | |
PartnerRe Ltd. | | Bermuda | | | 94,940 | | | | 10,009,524 | |
Zurich Insurance Group AG | | Switzerland | | | 17,558 | | | | 5,087,992 | |
| | | | | | | | | | |
| | | | | | | | | 56,929,418 | |
| | | | | | | | | | |
MGD-14
Franklin Templeton Variable Insurance Products Trust
Statement of Investments, December 31, 2013 (continued)
| | | | | | | | | | |
| Mutual Global Discovery Securities Fund | | Country | | Shares/
Units | | | Value | |
Common Stocks and Other Equity Interests (continued) | | | | | | | | | | |
Marine 2.2% | | | | | | | | | | |
A.P. Moeller-Maersk AS, B | | Denmark | | | 1,565 | | | $ | 16,981,387 | |
| | | | | | | | | | |
Media 3.7% | | | | | | | | | | |
CBS Corp., B | | United States | | | 57,392 | | | | 3,658,166 | |
Comcast Corp., Special A | | United States | | | 48,623 | | | | 2,425,315 | |
Daekyo Co. Ltd. | | South Korea | | | 3,075 | | | | 21,263 | |
Reed Elsevier PLC | | United Kingdom | | | 276,908 | | | | 4,121,056 | |
Time Warner Cable Inc. | | United States | | | 48,159 | | | | 6,525,544 | |
aTribune Co., A | | United States | | | 43,818 | | | | 3,391,513 | |
aTribune Co., B | | United States | | | 26,867 | | | | 2,071,446 | |
Twenty-First Century Fox Inc., B | | United States | | | 170,160 | | | | 5,887,536 | |
| | | | | | | | | | |
| | | | | | | | | 28,101,839 | |
| | | | | | | | | | |
Metals & Mining 2.6% | | | | | | | | | | |
Anglo American PLC | | United Kingdom | | | 275,805 | | | | 6,029,654 | |
Freeport-McMoRan Copper & Gold Inc., B | | United States | | | 135,280 | | | | 5,105,467 | |
aThyssenKrupp AG | | Germany | | | 344,296 | | | | 8,377,615 | |
| | | | | | | | | | |
| | | | | | | | | 19,512,736 | |
| | | | | | | | | | |
Multi-Utilities 0.9% | | | | | | | | | | |
GDF Suez | | France | | | 296,982 | | | | 6,983,286 | |
| | | | | | | | | | |
Multiline Retail 0.7% | | | | | | | | | | |
Kohl’s Corp. | | United States | | | 99,870 | | | | 5,667,622 | |
| | | | | | | | | | |
Office Electronics 1.2% | | | | | | | | | | |
Xerox Corp. | | United States | | | 720,967 | | | | 8,774,168 | |
| | | | | | | | | | |
Oil, Gas & Consumable Fuels 7.5% | | | | | | | | | | |
Apache Corp. | | United States | | | 149,500 | | | | 12,848,030 | |
BG Group PLC | | United Kingdom | | | 235,965 | | | | 5,070,756 | |
BP PLC | | United Kingdom | | | 1,028,014 | | | | 8,309,721 | |
CONSOL Energy Inc. | | United States | | | 185,226 | | | | 7,045,997 | |
Marathon Oil Corp. | | United States | | | 178,885 | | | | 6,314,641 | |
Royal Dutch Shell PLC, A | | United Kingdom | | | 458,527 | | | | 16,338,383 | |
aWPX Energy Inc. | | United States | | | 41,146 | | | | 838,555 | |
| | | | | | | | | | |
| | | | | | | | | 56,766,083 | |
| | | | | | | | | | |
Paper & Forest Products 0.2% | | | | | | | | | | |
a,c NewPage Holdings Inc. | | United States | | | 19,416 | | | | 1,747,440 | |
| | | | | | | | | | |
Personal Products 0.8% | | | | | | | | | | |
Avon Products Inc. | | United States | | | 334,038 | | | | 5,752,134 | |
| | | | | | | | | | |
Pharmaceuticals 5.5% | | | | | | | | | | |
Eli Lilly & Co. | | United States | | | 76,608 | | | | 3,907,008 | |
Merck & Co. Inc. | | United States | | | 346,558 | | | | 17,345,228 | |
Novartis AG, ADR | | Switzerland | | | 126,364 | | | | 10,157,138 | |
Teva Pharmaceutical Industries Ltd., ADR | | Israel | | | 257,877 | | | | 10,335,710 | |
| | | | | | | | | | |
| | | | | | | | | 41,745,084 | |
| | | | | | | | | | |
Real Estate Management & Development 0.5% | | | | | | | | | | |
gCanary Wharf Group PLC | | United Kingdom | | | 487,324 | | | | 2,518,473 | |
Great Eagle Holdings Ltd. | | Hong Kong | | | 200,333 | | | | 685,917 | |
Swire Pacific Ltd., B | | Hong Kong | | | 309,263 | | | | 697,944 | |
| | | | | | | | | | |
| | | | | | | | | 3,902,334 | |
| | | | | | | | | | |
MGD-15
Franklin Templeton Variable Insurance Products Trust
Statement of Investments, December 31, 2013 (continued)
| | | | | | | | | | |
| Mutual Global Discovery Securities Fund | | Country | | Shares/
Units | | | Value | |
Common Stocks and Other Equity Interests (continued) | | | | | | | | | | |
Semiconductors & Semiconductor Equipment 0.2% | | | | | | | | | | |
aSK Hynix Semiconductor Inc. | | South Korea | | | 53,632 | | | $ | 1,869,481 | |
| | | | | | | | | | |
Software 4.5% | | | | | | | | | | |
aCheck Point Software Technologies Ltd. | | Israel | | | 130,472 | | | | 8,418,054 | |
Microsoft Corp. | | United States | | | 487,458 | | | | 18,245,553 | |
Symantec Corp. | | United States | | | 312,280 | | | | 7,363,562 | |
| | | | | | | | | | |
| | | | | | | | | 34,027,169 | |
| | | | | | | | | | |
Specialty Retail 0.8% | | | | | | | | | | |
Kingfisher PLC | | United Kingdom | | | 973,910 | | | | 6,202,435 | |
| | | | | | | | | | |
Tobacco 4.8% | | | | | | | | | | |
Altria Group Inc. | | United States | | | 176,234 | | | | 6,765,624 | |
British American Tobacco PLC | | United Kingdom | | | 220,778 | | | | 11,834,028 | |
Lorillard Inc. | | United States | | | 218,909 | | | | 11,094,308 | |
Philip Morris International Inc. | | United States | | | 75,124 | | | | 6,545,554 | |
| | | | | | | | | | |
| | | | | | | | | 36,239,514 | |
| | | | | | | | | | |
Wireless Telecommunication Services 3.3% | | | | | | | | | | |
Vodafone Group PLC | | United Kingdom | | | 6,354,031 | | | | 24,944,178 | |
| | | | | | | | | | |
Total Common Stocks and Other Equity Interests
(Cost $491,250,720) | | | | | | | | | 687,578,355 | |
| | | | | | | | | | |
Preferred Stocks (Cost $5,430,000) 0.5% | | | | | | | | | | |
Diversified Financial Services 0.5% | | | | | | | | | | |
a,b Hightower Holding LLC, pfd., A, Series 2 | | United States | | | 2,172,000 | | | | 4,131,361 | |
| | | | | | | | | | |
| | | |
| | | | | Principal
Amount* | | | | |
Corporate Bonds, Notes and Senior Floating Rate Interests 4.2% | | | | | | | | | | |
eAmerican Airlines Inc., senior secured note, 144A, 7.50%, 3/15/16 | | United States | | | 3,845,000 | | | | 4,008,413 | |
Clear Channel Communications Inc., | | | | | | | | | | |
senior secured note, first lien, 9.00%, 12/15/19 | | United States | | | 5,184,000 | | | | 5,313,600 | |
h,i Tranche B Term Loan, 3.819%, 1/29/16 | | United States | | | 102,224 | | | | 99,297 | |
h,i Tranche C Term Loan, 3.819%, 1/29/16 | | United States | | | 16,816 | | | | 16,138 | |
h,i Tranche D Term Loan, 6.919%, 1/30/19 | | United States | | | 6,889,154 | | | | 6,596,365 | |
h,i Tranche E Term Loan, 7.669%, 7/30/19 | | United States | | | 2,213,881 | | | | 2,186,207 | |
h,i JC Penney Corp. Inc., Term Loan, 6.00%, 5/22/18 | | United States | | | 730,330 | | | | 714,607 | |
eNGPL PipeCo LLC, | | | | | | | | | | |
secured note, 144A, 7.119%, 12/15/17 | | United States | | | 1,086,000 | | | | 988,260 | |
jsenior secured note, 144A, 9.625%, 6/01/19 | | United States | | | 2,369,000 | | | | 2,327,543 | |
h,i Texas Competitive Electric Holdings Co. LLC, Extended Term Loan, 4.668%, 10/10/17 | | United States | | | 5,912,264 | | | | 4,083,896 | |
Texas Competitive Electric Holdings Co. LLC/Texas Competitive Electric Holdings Finance Inc., | | | | | | | | | | |
senior note, A, 10.25%, 11/01/15 | | United States | | | 6,359,000 | | | | 445,130 | |
esenior secured note, 144A, 11.50%, 10/01/20 | | United States | | | 5,895,000 | | | | 4,362,300 | |
eWind Acquisition Finance SA, | | | | | | | | | | |
senior secured note, 144A, 11.75%, 7/15/17 | | Italy | | | 135,000 | | | | 143,775 | |
third lien, 144A, 11.75%, 7/15/17 | | Italy | | | 394,000 | EUR | | | 577,239 | |
| | | | | | | | | | |
Total Corporate Bonds, Notes and Senior Floating Rate Interests
(Cost $33,831,008) | | | | | | | | | 31,862,770 | |
| | | | | | | | | | |
Corporate Notes in Reorganization 0.2% | | | | | | | | | | |
b,k Broadband Ventures III LLC, secured promissory note, 5.00%, 2/01/12 | | United States | | | 595 | | | | — | |
h,k Cengage Learning Acquisitions Inc., FRN, 2.70%, 7/03/14 | | United States | | | 1,512,445 | | | | 1,187,269 | |
| | | | | | | | | | |
Total Corporate Notes in Reorganization (Cost $1,213,245) | | | | | | | | | 1,187,269 | |
| | | | | | | | | | |
MGD-16
Franklin Templeton Variable Insurance Products Trust
Statement of Investments, December 31, 2013 (continued)
| | | | | | | | | | |
| Mutual Global Discovery Securities Fund | | Country | | Shares | | | Value | |
Companies in Liquidation 1.0% | | | | | | | | | | |
aAdelphia Recovery Trust | | United States | | | 5,379,562 | | | $ | 10,759 | |
a,f Adelphia Recovery Trust, Arahova Contingent Value Vehicle, Contingent Distribution | | United States | | | 386,774 | | | | 194 | |
a,f,g Century Communications Corp., Contingent Distribution | | United States | | | 1,074,000 | | | | — | |
a,b FIM Coinvestor Holdings I, LLC | | United States | | | 2,077,368 | | | | — | |
a,l Lehman Brothers Holdings Inc., Bankruptcy Claim | | United States | | | 17,348,669 | | | | 7,806,901 | |
a,f,g NewPage Corp., Litigation Trust, Contingent Distribution | | United States | | | 4,854,000 | | | | — | |
a,f,g Tribune Litigation Trust, Contingent Distribution | | United States | | | 56,883 | | | | — | |
| | | | | | | | | | |
Total Companies in Liquidation (Cost $8,239,386) | | | | | | | | | 7,817,854 | |
| | | | | | | | | | |
Total Investments before Short Term Investments
(Cost $539,964,359) | | | | | | | | | 732,577,609 | |
| | | | | | | | | | |
| | | |
| | | | | Principal
Amount* | | | | |
Short Term Investments 3.3% | | | | | | | | | | |
U.S. Government and Agency Securities 3.2% | | | | | | | | | | |
mU.S. Treasury Bills, | | | | | | | | | | |
1/02/14 | | United States | | | 9,900,000 | | | | 9,900,000 | |
n3/20/14 - 6/26/14 | | United States | | | 14,500,000 | | | | 14,496,810 | |
| | | | | | | | | | |
Total U.S. Government and Agency Securities (Cost $24,395,997) | | | | | | | | | 24,396,810 | |
| | | | | | | | | | |
Total Investments before Money Market Funds
(Cost $564,360,356) | | | | | | | | | 756,974,419 | |
| | | | | | | | | | |
| | | |
| | | | | Shares | | | | |
oInvestments from Cash Collateral Received for Loaned Securities (Cost $391,880) 0.1% | | | | | | | | | | |
Money Market Funds 0.1% | | | | | | | | | | |
p BNY Mellon Overnight Government Fund, 0.017% | | United States | | | 391,880 | | | | 391,880 | |
| | | | | | | | | | |
Total Investments (Cost $564,752,236) 100.0% | | | | | | | | | 757,366,299 | |
Securities Sold Short (0.6)% | | | | | | | | | (4,371,298 | ) |
Other Assets, less Liabilities 0.6% | | | | | | | | | 4,603,857 | |
| | | | | | | | | | |
Net Assets 100.0% | | | | | | | | $ | 757,598,858 | |
| | | | | | | | | | |
qSecurities Sold Short (Proceeds $4,207,572) (0.6)% | | | | | | | | | | |
Common Stocks (0.6)% | | | | | | | | | | |
Diversified Telecommunication Services (0.6)% | | | | | | | | | | |
Verizon Communications Inc. | | United States | | | 88,956 | | | $ | (4,371,298 | ) |
| | | | | | | | | | |
See Abbreviations on page MGD-37.
MGD-17
Franklin Templeton Variable Insurance Products Trust
Statement of Investments, December 31, 2013 (continued)
| | | | | | |
| Mutual Global Discovery Securities Fund | | | | | | |
†Rounds to less than 0.1% of net assets.
*The principal amount is stated in U.S. dollars unless otherwise indicated.
aNon-income producing.
bSee Note 9 regarding restricted securities.
cAt December 31, 2013, pursuant to the Fund’s policies and the requirements of applicable securities law, the Fund may be restricted from trading this security for a limited or extended period of time due to ownership limits and/or potential possession of material non-public information.
dSee Note 11 regarding holdings of 5% voting securities.
eSecurity was purchased pursuant to Rule 144A under the Securities Act of 1933 and may be sold in transactions exempt from registration only to qualified institutional buyers or in a public offering registered under the Securities Act of 1933. These securities have been deemed liquid under guidelines approved by the Trust’s Board of Trustees. At December 31, 2013, the aggregate value of these securities was $18,548,255, representing 2.45% of net assets.
fContingent distributions represent the right to receive additional distributions, if any, during the reorganization of the underlying company. Shares represent total underlying principal of debt securities.
gSecurity has been deemed illiquid because it may not be able to be sold within seven days. At December 31, 2013, the aggregate value of these securities was $2,518,473, representing 0.33% of net assets.
hThe coupon rate shown represents the rate at period end.
iSee Note 1(g) regarding senior floating rate interests.
jA portion or all of the security is on loan at December 31, 2013. See Note 1(f).
kSee Note 7 regarding credit risk and defaulted securities.
lBankruptcy claims represent the right to receive distributions, if any, during the liquidation of the underlying pool of assets. Shares represent amount of allowed unsecured claims.
mThe security is traded on a discount basis with no stated coupon rate.
nSecurity or a portion of the security has been pledged as collateral for securities sold short, open futures and forward contracts. At December 31, 2013, the aggregate value of these securities and/or cash pledged as collateral was $9,694,110, representing 1.28% of net assets.
oSee Note 1(f) regarding securities on loan.
pThe rate shown is the annualized seven-day yield at period end.
qSee Note 1(e) regarding securities sold short.
MGD-18
Franklin Templeton Variable Insurance Products Trust
Statement of Investments, December 31, 2013 (continued)
| | | | | | |
| Mutual Global Discovery Securities Fund | | | | | | |
At December 31, 2013, the Fund had the following futures contracts outstanding. See Note 1(c).
Futures Contracts
| | | | | | | | | | | | | | | | | | | | | | | | |
| Description | | Type | | | Number of
Contracts | | | Notional
Value | | | Expiration
Date | | | Unrealized
Appreciation | | | Unrealized
Depreciation | |
Currency Contracts | | | | | | | | | | | | | | | | | | | | | | | | |
EUR/USD | | | Short | | | | 239 | | | $ | 41,191,650 | | | | 3/17/2014 | | | $ | — | | | $ | (177,302 | ) |
GBP/USD | | | Short | | | | 174 | | | | 18,006,825 | | | | 3/17/2014 | | | | — | | | | (167,744 | ) |
| | | | | | | | | | | | | | | | | | | | |
Net unrealized appreciation (depreciation) | | | | | | | | | | | | | | | | | | | | | | $ | (345,046 | ) |
| | | | | | | | | | | | | | | | | | | | | | | | |
At December 31, 2013, the Fund had the following forward exchange contracts outstanding. See Note 1(c).
Forward Exchange Contracts
| | | | | | | | | | | | | | | | | | | | | | | | | | | | |
| Currency | | Counterpartya | | | Type | | | Quantity | | | Contract
Amount | | | Settlement
Date | | | Unrealized
Appreciation | | | Unrealized
Depreciation | |
Euro | | | HSBC | | | | Buy | | | | 175,279 | | | $ | 240,503 | | | | 1/17/14 | | | $ | 590 | | | $ | — | |
Euro | | | BOFA | | | | Sell | | | | 4,739,416 | | | | 6,220,818 | | | | 1/17/14 | | | | 183 | | | | (298,377 | ) |
Euro | | | BONY | | | | Sell | | | | 90,035 | | | | 123,350 | | | | 1/17/14 | | | | — | | | | (492 | ) |
Euro | | | BZWS | | | | Sell | | | | 3,962,322 | | | | 5,174,238 | | | | 1/17/14 | | | | — | | | | (275,891 | ) |
Euro | | | FBCO | | | | Sell | | | | 1,493,347 | | | | 1,978,900 | | | | 1/17/14 | | | | — | | | | (75,181 | ) |
Euro | | | DBAB | | | | Sell | | | | 2,681,495 | | | | 3,548,648 | | | | 1/17/14 | | | | — | | | | (139,717 | ) |
Euro | | | HSBC | | | | Sell | | | | 1,029,783 | | | | 1,369,599 | | | | 1/17/14 | | | | — | | | | (46,856 | ) |
Euro | | | SCBT | | | | Sell | | | | 1,229,369 | | | | 1,634,481 | | | | 1/17/14 | | | | — | | | | (56,502 | ) |
Euro | | | SSBT | | | | Sell | | | | 80,618 | | | | 110,281 | | | | 1/17/14 | | | | — | | | | (609 | ) |
British Pound | | | BOFA | | | | Sell | | | | 7,475,556 | | | | 11,373,657 | | | | 1/21/14 | | | | — | | | | (1,003,369 | ) |
British Pound | | | FBCO | | | | Sell | | | | 1,110,515 | | | | 1,758,817 | | | | 1/21/14 | | | | — | | | | (79,825 | ) |
British Pound | | | DBAB | | | | Sell | | | | 818,058 | | | | 1,241,894 | | | | 1/21/14 | | | | — | | | | (112,537 | ) |
British Pound | | | HSBC | | | | Sell | | | | 129,815 | | | | 208,254 | | | | 1/21/14 | | | | — | | | | (6,676 | ) |
South Korean Won | | | BOFA | | | | Buy | | | | 145,086,196 | | | | 135,719 | | | | 2/12/14 | | | | 1,316 | | | | — | |
South Korean Won | | | FBCO | | | | Buy | | | | 129,444,725 | | | | 116,348 | | | | 2/12/14 | | | | 5,914 | | | | — | |
South Korean Won | | | HSBC | | | | Buy | | | | 225,428,121 | | | | 209,251 | | | | 2/12/14 | | | | 3,667 | | | | — | |
Swiss Franc | | | FBCO | | | | Buy | | | | 648,838 | | | | 706,814 | | | | 2/12/14 | | | | 20,801 | | | | — | |
Swiss Franc | | | HSBC | | | | Buy | | | | 4,280,392 | | | | 4,647,700 | | | | 2/12/14 | | | | 152,383 | | | | — | |
Swiss Franc | | | SCBT | | | | Buy | | | | 1,832,003 | | | | 1,965,453 | | | | 2/12/14 | | | | 88,977 | | | | — | |
South Korean Won | | | BOFA | | | | Sell | | | | 2,156,238,993 | | | | 2,001,512 | | | | 2/12/14 | | | | 4,666 | | | | (39,733 | ) |
Swiss Franc | | | BOFA | | | | Sell | | | | 6,654,229 | | | | 7,252,566 | | | | 2/12/14 | | | | — | | | | (209,567 | ) |
South Korean Won | | | FBCO | | | | Sell | | | | 1,718,695,111 | | | | 1,542,699 | | | | 2/12/14 | | | | — | | | | (80,619 | ) |
Swiss Franc | | | FBCO | | | | Sell | | | | 107,004 | | | | 114,817 | | | | 2/12/14 | | | | — | | | | (5,178 | ) |
South Korean Won | | | DBAB | | | | Sell | | | | 1,280,493,937 | | | | 1,140,263 | | | | 2/12/14 | | | | — | | | | (69,171 | ) |
South Korean Won | | | HSBC | | | | Sell | | | | 1,601,523,001 | | | | 1,487,974 | | | | 2/12/14 | | | | 697 | | | | (25,371 | ) |
British Pound | | | SCBT | | | | Buy | | | | 4,494,750 | | | | 6,972,346 | | | | 2/19/14 | | | | 467,989 | | | | — | |
British Pound | | | BOFA | | | | Sell | | | | 6,022,171 | | | | 9,366,417 | | | | 2/19/14 | | | | — | | | | (602,317 | ) |
British Pound | | | BZWS | | | | Sell | | | | 2,915,254 | | | | 4,532,054 | | | | 2/19/14 | | | | — | | | | (293,680 | ) |
British Pound | | | FBCO | | | | Sell | | | | 607,752 | | | | 962,386 | | | | 2/19/14 | | | | — | | | | (43,650 | ) |
British Pound | | | HSBC | | | | Sell | | | | 878,039 | | | | 1,391,442 | | | | 2/19/14 | | | | — | | | | (62,011 | ) |
British Pound | | | SCBT | | | | Sell | | | | 1,115,900 | | | | 1,796,164 | | | | 2/19/14 | | | | — | | | | (51,029 | ) |
Euro | | | BOFA | | | | Sell | | | | 989,760 | | | | 1,318,829 | | | | 2/28/14 | | | | — | | | | (42,584 | ) |
Euro | | | BONY | | | | Sell | | | | 1,007,522 | | | | 1,343,642 | | | | 2/28/14 | | | | — | | | | (42,204 | ) |
Euro | | | BZWS | | | | Sell | | | | 4,181,967 | | | | 5,571,949 | | | | 2/28/14 | | | | — | | | | (180,344 | ) |
Euro | | | FBCO | | | | Sell | | | | 1,148,618 | | | | 1,533,358 | | | | 2/28/14 | | | | — | | | | (46,565 | ) |
Euro | | | HSBC | | | | Sell | | | | 5,524,073 | | | | 7,383,063 | | | | 2/28/14 | | | | — | | | | (215,295 | ) |
Euro | | | SCBT | | | | Sell | | | | 1,056,188 | | | | 1,414,914 | | | | 2/28/14 | | | | — | | | | (37,872 | ) |
Euro | | | SSBT | | | | Sell | | | | 410,646 | | | | 549,163 | | | | 2/28/14 | | | | — | | | | (15,680 | ) |
Canadian Dollar | | | HSBC | | | | Buy | | | | 66,274 | | | | 61,784 | | | | 3/18/14 | | | | 495 | | | | — | |
MGD-19
Franklin Templeton Variable Insurance Products Trust
Statement of Investments, December 31, 2013 (continued)
| | | | | | |
| Mutual Global Discovery Securities Fund | | | | | | |
Forward Exchange Contracts (continued)
| | | | | | | | | | | | | | | | | | | | | | | | | | | | |
| Currency | | Counterpartya | | | Type | | | Quantity | | | Contract
Amount | | | Settlement
Date | | | Unrealized
Appreciation | | | Unrealized
Depreciation | |
Canadian Dollar | | | SCBT | | | | Buy | | | | 315,000 | | | $ | 295,159 | | | | 3/18/14 | | | $ | 851 | | | $ | — | |
Canadian Dollar | | | BOFA | | | | Sell | | | | 879,539 | | | | 848,613 | | | | 3/18/14 | | | | 22,095 | | | | — | |
Canadian Dollar | | | HSBC | | | | Sell | | | | 30,328 | | | | 29,316 | | | | 3/18/14 | | | | 816 | | | | — | |
Canadian Dollar | | | SCBT | | | | Sell | | | | 8,166,239 | | | | 7,875,021 | | | | 3/18/14 | | | | 202,553 | | | | (1,483 | ) |
Euro | | | BOFA | | | | Buy | | | | 552,053 | | | | 756,947 | | | | 4/16/14 | | | | 2,565 | | | | (164 | ) |
Euro | | | BONY | | | | Buy | | | | 298,950 | | | | 411,394 | | | | 4/16/14 | | | | — | | | | (189 | ) |
Euro | | | BZWS | | | | Buy | | | | 93,680 | | | | 128,619 | | | | 4/16/14 | | | | 238 | | | | — | |
Euro | | | HSBC | | | | Buy | | | | 571,394 | | | | 783,867 | | | | 4/16/14 | | | | 2,460 | | | | (375 | ) |
Euro | | | SCBT | | | | Buy | | | | 225,950 | | | | 310,628 | | | | 4/16/14 | | | | 299 | | | | (133 | ) |
Euro | | | SSBT | | | | Buy | | | | 187,516 | | | | 258,008 | | | | 4/16/14 | | | | 9 | | | | (89 | ) |
Euro | | | BOFA | | | | Sell | | | | 1,956,565 | | | | 2,659,216 | | | | 4/16/14 | | | | — | | | | (32,036 | ) |
Euro | | | BONY | | | | Sell | | | | 178,239 | | | | 244,020 | | | | 4/16/14 | | | | — | | | | (1,148 | ) |
Euro | | | BZWS | | | | Sell | | | | 2,153,191 | | | | 2,927,705 | | | | 4/16/14 | | | | — | | | | (34,006 | ) |
Euro | | | FBCO | | | | Sell | | | | 614,295 | | | | 839,989 | | | | 4/16/14 | | | | — | | | | (4,973 | ) |
Euro | | | HSBC | | | | Sell | | | | 849,359 | | | | 1,159,440 | | | | 4/16/14 | | | | 26 | | | | (8,878 | ) |
Euro | | | SCBT | | | | Sell | | | | 468,686 | | | | 637,630 | | | | 4/16/14 | | | | — | | | | (7,047 | ) |
Euro | | | SSBT | | | | Sell | | | | 242,983 | | | | 332,590 | | | | 4/16/14 | | | | — | | | | (1,633 | ) |
British Pound | | | BOFA | | | | Sell | | | | 207,154 | | | | 339,577 | | | | 4/22/14 | | | | — | | | | (3,164 | ) |
British Pound | | | BONY | | | | Sell | | | | 2,286,221 | | | | 3,688,543 | | | | 4/22/14 | | | | — | | | | (94,061 | ) |
British Pound | | | FBCO | | | | Sell | | | | 1,953,134 | | | | 3,148,452 | | | | 4/22/14 | | | | — | | | | (83,052 | ) |
British Pound | | | HSBC | | | | Sell | | | | 203,244 | | | | 332,758 | | | | 4/22/14 | | | | — | | | | (3,513 | ) |
British Pound | | | SCBT | | | | Sell | | | | 3,417,985 | | | | 5,509,792 | | | | 4/22/14 | | | | — | | | | (145,342 | ) |
Euro | | | BOFA | | | | Sell | | | | 11,377,449 | | | | 15,317,017 | | | | 5/15/14 | | | | 1,479 | | | | (334,715 | ) |
Euro | | | BONY | | | | Sell | | | | 287,354 | | | | 396,503 | | | | 5/15/14 | | | | 1,234 | | | | — | |
Euro | | | BZWS | | | | Sell | | | | 250,774 | | | | 344,244 | | | | 5/15/14 | | | | 214 | | | | (922 | ) |
Euro | | | HSBC | | | | Sell | | | | 352,244 | | | | 484,821 | | | | 5/15/14 | | | | 1,321 | | | | (1,029 | ) |
Euro | | | SCBT | | | | Sell | | | | 282,352 | | | | 388,685 | | | | 5/15/14 | | | | 801 | | | | (506 | ) |
Euro | | | SSBT | | | | Sell | | | | 81,986 | | | | 112,359 | | | | 5/15/14 | | | | — | | | | (417 | ) |
Euro | | | BONY | | | | Sell | | | | 800,000 | | | | 1,083,393 | | | | 5/19/14 | | | | — | | | | (17,053 | ) |
British Pound | | | BZWS | | | | Sell | | | | 4,350,966 | | | | 6,994,396 | | | | 5/21/14 | | | | — | | | | (202,632 | ) |
British Pound | | | HSBC | | | | Sell | | | | 3,071,759 | | | | 4,939,388 | | | | 5/21/14 | | | | — | | | | (141,675 | ) |
| | | | | | | | | | | | | | | | | | | | | | | | |
Unrealized appreciation (depreciation) | | | | | | | | | | | | 984,639 | | | | (5,279,137 | ) |
| | | | | | | | | | | | | | | | | | | | | | | | |
Net unrealized appreciation (depreciation) | | | | | | | | | | | $ | (4,294,498 | ) |
| | | | | | | | | | | | | | | | | | | | | | | | | | | | |
aMay be comprised of multiple contracts using the same currency and settlement date
See Abbreviations on page MGD-37
The accompanying notes are an integral part of these financial statements.
MGD-20
Franklin Templeton Variable Insurance Products Trust
Financial Statements
Statement of Assets and Liabilities
December 31, 2013
| | | | |
| | | Mutual Global
Discovery
Securities Fund | |
Assets: | | | | |
Investments in securities: | | | | |
Cost - Unaffiliated issuers | | $ | 556,752,236 | |
Cost - Non-controlled affiliated issuers (Note 11) | | | 8,000,000 | |
| | | | |
Total cost of investments | | $ | 564,752,236 | |
| | | | |
Value - Unaffiliated issuers | | $ | 753,551,107 | |
Value - Non-controlled affiliated issuers (Note 11) | | | 3,815,192 | |
| | | | |
Total value of investments (includes securities loaned in the amount of $381,210) | | | 757,366,299 | |
Cash | | | 97,505 | |
Restricted cash (Note 1d) | | | 530,000 | |
Foreign currency, at value (cost $4,287,431) | | | 4,295,247 | |
Receivables: | | | | |
Investment securities sold | | | 109,914 | |
Capital shares sold | | | 102,004 | |
Dividends and interest | | | 2,574,263 | |
Due from brokers | | | 4,519,058 | |
Unrealized appreciation on forward exchange contracts | | | 984,639 | |
Other assets | | | 158,929 | |
| | | | |
Total assets | | | 770,737,858 | |
| | | | |
Liabilities: | | | | |
Payables: | | | | |
Capital shares redeemed | | | 1,422,940 | |
Management fees | | | 506,473 | |
Administrative fees | | | 86,665 | |
Distribution fees | | | 321,836 | |
Variation margin | | | 8,200 | |
Securities sold short, at value (proceeds $4,207,572) | | | 4,371,298 | |
Payable upon return of securities loaned | | | 391,880 | |
Due to brokers | | | 530,000 | |
Unrealized depreciation on forward exchange contracts | | | 5,279,137 | |
Accrued expenses and other liabilities | | | 220,571 | |
| | | | |
Total liabilities | | | 13,139,000 | |
| | | | |
Net assets, at value | | $ | 757,598,858 | |
| | | | |
Net assets consist of: | | | | |
Paid-in capital | | $ | 504,520,871 | |
Undistributed net investment income | | | 15,025,568 | |
Net unrealized appreciation (depreciation) | | | 187,846,828 | |
Accumulated net realized gain (loss) | | | 50,205,591 | |
| | | | |
Net assets, at value | | $ | 757,598,858 | |
| | | | |
The accompanying notes are an integral part of these financial statements.
MGD-21
Franklin Templeton Variable Insurance Products Trust
Financial Statements (continued)
Statement of Assets and Liabilities (continued)
December 31, 2013
| | | | |
| | | Mutual Global
Discovery
Securities Fund | |
Class 1: | | | | |
Net assets, at value | | $ | 2,465,035 | |
| | | | |
Shares outstanding | | | 105,735 | |
| | | | |
Net asset value and maximum offering price per share | | $ | 23.31 | |
| | | | |
Class 2: | | | | |
Net assets, at value | | $ | 684,779,884 | |
| | | | |
Shares outstanding | | | 29,977,635 | |
| | | | |
Net asset value and maximum offering price per share | | $ | 22.84 | |
| | | | |
Class 4: | | | | |
Net assets, at value | | $ | 70,353,939 | |
| | | | |
Shares outstanding | | | 3,045,999 | |
| | | | |
Net asset value and maximum offering price per share | | $ | 23.10 | |
| | | | |
The accompanying notes are an integral part of these financial statements.
MGD-22
Franklin Templeton Variable Insurance Products Trust
Financial Statements (continued)
Statement of Operations
for the year ended December 31, 2013
| | | | |
| | | Mutual Global
Discovery
Securities Fund | |
Investment income: | | | | |
Dividends | | $ | 18,129,322 | |
Interest | | | 5,064,160 | |
Income from securities loaned | | | 80,640 | |
| | | | |
Total investment income | | | 23,274,122 | |
| | | | |
Expenses: | | | | |
Management fees (Note 3a) | | | 5,989,198 | |
Administrative fees (Note 3b) | | | 1,023,488 | |
Distribution fees: (Note 3c) | | | | |
Class 2 | | | 1,700,321 | |
Class 4 | | | 234,176 | |
Unaffiliated transfer agent fees | | | 1,166 | |
Custodian fees (Note 4) | | | 35,240 | |
Reports to shareholders | | | 63,459 | |
Professional fees | | | 162,248 | |
Trustees’ fees and expenses | | | 3,000 | |
Dividends and interest on securities sold short | | | 2,508 | |
Other | | | 16,559 | |
| | | | |
Total expenses | | | 9,231,363 | |
Expense reductions (Note 4) | | | (158 | ) |
| | | | |
Net expenses | | | 9,231,205 | |
| | | | |
Net investment income | | | 14,042,917 | |
| | | | |
Realized and unrealized gains (losses): | | | | |
Net realized gain (loss) from: | | | | |
Investments | | | 56,476,932 | |
Written options | | | 6,664 | |
Foreign currency transactions | | | (2,470,252 | ) |
Futures contracts | | | (2,574,373 | ) |
| | | | |
Net realized gain (loss) | | | 51,438,971 | |
| | | | |
Net change in unrealized appreciation (depreciation) on: | | | | |
Investments | | | 116,496,377 | |
Translation of other assets and liabilities denominated in foreign currencies | | | 344,610 | |
| | | | |
Net change in unrealized appreciation (depreciation) | | | 116,840,987 | |
| | | | |
Net realized and unrealized gain (loss) | | | 168,279,958 | |
| | | | |
Net increase (decrease) in net assets resulting from operations | | $ | 182,322,875 | |
| | | | |
The accompanying notes are an integral part of these financial statements.
MGD-23
Franklin Templeton Variable Insurance Products Trust
Financial Statements (continued)
Statements of Changes in Net Assets
| | | | | | | | |
| | | Mutual Global Discovery
Securities Fund | |
| | | Year Ended December 31, | |
| | | 2013 | | | 2012 | |
| | | | |
Increase (decrease) in net assets: | | | | | | | | |
Operations: | | | | | | | | |
Net investment income | | $ | 14,042,917 | | | $ | 14,067,363 | |
Net realized gain (loss) from investments, written options, foreign currency transactions and futures contracts | | | 51,438,971 | | | | 86,155,202 | |
Net change in unrealized appreciation (depreciation) on investments and translation of other assets and liabilities denominated in foreign currencies | | | 116,840,987 | | | | (5,719,893 | ) |
| | | | |
Net increase (decrease) in net assets resulting from operations | | | 182,322,875 | | | | 94,502,672 | |
| | | | |
Distributions to shareholders from: | | | | | | | | |
Net investment income: | | | | | | | | |
Class 1 | | | (52,604 | ) | | | (32,000 | ) |
Class 2 | | | (14,417,027 | ) | | | (17,455,646 | ) |
Class 4 | | | (1,382,402 | ) | | | (1,713,076 | ) |
Net realized gains: | | | | | | | | |
Class 1 | | | (195,304 | ) | | | (55,531 | ) |
Class 2 | | | (59,917,989 | ) | | | (35,238,248 | ) |
Class 4 | | | (5,990,316 | ) | | | (3,402,551 | ) |
| | | | |
Total distributions to shareholders | | | (81,955,642 | ) | | | (57,897,052 | ) |
| | | | |
Capital share transactions: (Note 2) | | | | | | | | |
Class 1 | | | 1,149,200 | | | | 115,172 | |
Class 2 | | | (67,039,527 | ) | | | (85,201,977 | ) |
Class 4 | | | (825,524 | ) | | | (7,400,610 | ) |
| | | | |
Total capital share transactions | | | (66,715,851 | ) | | | (92,487,415 | ) |
| | | | |
Net increase (decrease) in net assets | | | 33,651,382 | | | | (55,881,795 | ) |
Net assets: | | | | |
Beginning of year | | | 723,947,476 | | | | 779,829,271 | |
| | | | |
End of year | | $ | 757,598,858 | | | $ | 723,947,476 | |
| | | | |
Undistributed net investment income included in net assets: | | | | | | | | |
End of year | | $ | 15,025,568 | | | $ | 15,327,129 | |
| | | | |
The accompanying notes are an integral part of these financial statements.
MGD-24
Franklin Templeton Variable Insurance Products Trust
Notes to Financial Statements
Mutual Global Discovery Securities Fund
1. ORGANIZATION AND SIGNIFICANT ACCOUNTING POLICIES
Franklin Templeton Variable Insurance Products Trust (Trust) is registered under the Investment Company Act of 1940, as amended, (1940 Act) as an open-end investment company, consisting of twenty separate funds. The Mutual Global Discovery Securities (Fund) is included in this report. The financial statements of the remaining funds in the Trust are presented separately. Shares of the Fund are generally sold only to insurance company separate accounts to fund the benefits of variable life insurance policies or variable annuity contracts. At December 31, 2013, 69.47% of the Fund’s shares were held through one insurance company. The Fund offers three classes of shares: Class 1, Class 2, and Class 4. Each class of shares differs by its distribution fees, voting rights on matters affecting a single class and its exchange privilege.
The following summarizes the Fund’s significant accounting policies.
a. Financial Instrument Valuation
The Fund’s investments in financial instruments are carried at fair value daily. Fair value is the price that would be received to sell an asset or paid to transfer a liability in an orderly transaction between market participants on the measurement date. The Fund calculates the net asset value (NAV) per share at the close of the New York Stock Exchange (NYSE), generally at 4p.m. Eastern time (NYSE close) on each day the NYSE is open for trading. Under procedures approved by the Trust’s Board of Trustees (the Board), the Fund’s administrator, investment manager and other affiliates have formed the Valuation and Liquidity Oversight Committee (VLOC). The VLOC provides administration and oversight of the Fund’s valuation policies and procedures, which are approved annually by the Board. Among other things, these procedures allow the Fund to utilize independent pricing services, quotations from securities and financial instrument dealers, and other market sources to determine fair value.
Equity securities and derivative financial instruments (derivatives) listed on an exchange or on the NASDAQ National Market System are valued at the last quoted sale price or the official closing price of the day, respectively. Foreign equity securities are valued as of the close of trading on the foreign stock exchange on which the security is primarily traded or as of the NYSE close, whichever is earlier. The value is then converted into its U.S. dollar equivalent at the foreign exchange rate in effect at the NYSE close on the day that the value of the security is determined. Over-the-counter (OTC) securities are valued within the range of the most recent quoted bid and ask prices. Securities that trade in multiple markets or on multiple exchanges are valued according to the broadest and most representative market. Certain equity securities are valued based upon fundamental characteristics or relationships to similar securities. Investments in non-registered money market funds are valued at the closing net asset value.
Debt securities generally trade in the OTC market rather than on a securities exchange. The Fund’s pricing services use multiple valuation techniques to determine fair value. In instances where sufficient market activity exists, the pricing services may utilize a market-based approach through which quotes from market makers are used to determine fair value. In instances where sufficient market activity may not exist or is limited, the pricing services also utilize proprietary valuation models which may consider market characteristics such as benchmark yield curves, credit spreads, estimated default rates, anticipated market interest rate volatility, coupon rates, anticipated timing of principal repayments, underlying collateral, and other unique security features in order to estimate the relevant cash flows, which are then discounted to calculate the fair value. Securities denominated in a foreign currency are converted into their U.S. dollar equivalent at the foreign exchange rate in effect at the NYSE close on the date that the values of the foreign debt securities are determined.
Certain derivatives trade in the OTC market. The Fund’s pricing services use various techniques including industry standard option pricing models and proprietary discounted cash flow models to determine the fair value of those instruments. The Fund’s net benefit or obligation under the derivative contract, as measured by the fair value of the contract, is included in net assets.
The Fund has procedures to determine the fair value of financial instruments for which market prices are not reliable or readily available. Under these procedures, the VLOC convenes on a regular basis to review such financial instruments and considers a number of factors, including significant unobservable valuation inputs, when arriving at fair value. The VLOC primarily employs
MGD-25
Franklin Templeton Variable Insurance Products Trust
Notes to Financial Statements (continued)
Mutual Global Discovery Securities Fund
1. ORGANIZATION AND SIGNIFICANT ACCOUNTING POLICIES (continued)
a. Financial Instrument Valuation (continued)
a market-based approach which may use related or comparable assets or liabilities, recent transactions, market multiples, book values, and other relevant information for the investment to determine the fair value of the investment. An income-based valuation approach may also be used in which the anticipated future cash flows of the investment are discounted to calculate fair value. Discounts may also be applied due to the nature or duration of any restrictions on the disposition of the investments. Due to the inherent uncertainty of valuations of such investments, the fair values may differ significantly from the values that would have been used had an active market existed. The VLOC employs various methods for calibrating these valuation approaches including a regular review of key inputs and assumptions, transactional back-testing or disposition analysis, and reviews of any related market activity.
Trading in securities on foreign securities stock exchanges and OTC markets may be completed before the daily NYSE close. In addition, trading in certain foreign markets may not take place on every NYSE business day. Occasionally, events occur between the time at which trading in a foreign security is completed and the close of the NYSE that might call into question the reliability of the value of a portfolio security held by the Fund. As a result, differences may arise between the value of the Fund’s portfolio securities as determined at the foreign market close and the latest indications of value at the close of the NYSE. In order to minimize the potential for these differences, the VLOC monitors price movements following the close of trading in foreign stock markets through a series of country specific market proxies (such as baskets of American Depositary Receipts, futures contracts and exchange traded funds). These price movements are measured against established trigger thresholds for each specific market proxy to assist in determining if an event has occurred that may call into question the reliability of the values of the foreign securities held by the Fund. If such an event occurs, the securities may be valued using fair value procedures, which may include the use of independent pricing services.
Also, when the last day of the reporting period is a non-business day, certain foreign markets may be open on those days that the NYSE is closed, which could result in differences between the value of the Fund’s portfolio securities on the last business day and the last calendar day of the reporting period. Any significant security valuation changes due to an open foreign market are adjusted and reflected by the Fund for financial reporting purposes.
b. Foreign Currency Translation
Portfolio securities and other assets and liabilities denominated in foreign currencies are translated into U.S. dollars based on the exchange rate of such currencies against U.S. dollars on the date of valuation. The Fund may enter into foreign currency exchange contracts to facilitate transactions denominated in a foreign currency. Purchases and sales of securities, income and expense items denominated in foreign currencies are translated into U.S. dollars at the exchange rate in effect on the transaction date. Portfolio securities and assets and liabilities denominated in foreign currencies contain risks that those currencies will decline in value relative to the U.S. dollar. Occasionally, events may impact the availability or reliability of foreign exchange rates used to convert the U.S. dollar equivalent value. If such an event occurs, the foreign exchange rate will be valued at fair value using procedures established and approved by the Board.
The Fund does not separately report the effect of changes in foreign exchange rates from changes in market prices on securities held. Such changes are included in net realized and unrealized gain or loss from investments on the Statement of Operations.
Realized foreign exchange gains or losses arise from sales of foreign currencies, currency gains or losses realized between the trade and settlement dates on securities transactions and the difference between the recorded amounts of dividends, interest, and foreign withholding taxes and the U.S. dollar equivalent of the amounts actually received or paid. Net unrealized foreign exchange gains and losses arise from changes in foreign exchange rates on foreign denominated assets and liabilities other than investments in securities held at the end of the reporting period.
MGD-26
Franklin Templeton Variable Insurance Products Trust
Notes to Financial Statements (continued)
Mutual Global Discovery Securities Fund
1. ORGANIZATION AND SIGNIFICANT ACCOUNTING POLICIES (continued)
c. Derivative Financial Instruments
The Fund invested in derivatives in order to manage risk or gain exposure to various other investments or markets. Derivatives are financial contracts based on an underlying or notional amount, require no initial investment or an initial net investment that is smaller than would normally be required to have a similar response to changes in market factors, and require or permit net settlement. Derivatives contain various risks including the potential inability of the counterparty to fulfill their obligations under the terms of the contract, the potential for an illiquid secondary market, and/or the potential for market movements which expose the Fund to gains or losses in excess of the amounts shown on the Statement of Assets and Liabilities. Realized gain and loss and unrealized appreciation and depreciation on these contracts for the period are included in the Statement of Operations.
Derivative counterparty credit risk is managed through a formal evaluation of the creditworthiness of all potential counterparties. The Fund attempts to reduce its exposure to counterparty credit risk on OTC derivatives, whenever possible, by entering into International Swaps and Derivatives Association (ISDA) master agreements with certain counterparties. These agreements contain various provisions, including but not limited to collateral requirements, events of default, or early termination. Termination events applicable to the counterparty include certain deteriorations in the credit quality of the counterparty. Termination events applicable to the Fund include failure of the Fund to maintain certain net asset levels and/or limit the decline in net assets over various periods of time. In the event of default or early termination, the ISDA master agreement gives the non-defaulting party the right to net and close-out all transactions traded, whether or not arising under the ISDA agreement, to one net amount payable by one counterparty to the other. However, absent an event of default or early termination, OTC derivative assets and liabilities are presented gross and not offset in the Statement of Assets and Liabilities. Early termination by the counterparty may result in an immediate payment by the Fund of any net liability owed to that counterparty under the ISDA agreement. At December 31, 2013, the Fund had OTC derivatives in a net liability position of $4,756,054 and the aggregate value of collateral pledged for such contracts was $4,322,203.
Collateral requirements differ by type of derivative. Collateral or initial margin requirements are set by the broker or exchange clearing house for exchange traded and centrally cleared derivatives. Initial margin deposited is held at the exchange and can be in the form of cash and/or securities. For OTC derivatives traded under an ISDA master agreement, posting of collateral is required by either the fund or the applicable counterparty if the total net exposure of all OTC derivatives with the applicable counterparty exceeds the minimum transfer amount, which typically ranges from $100,000 to $250,000, and can vary depending on the counterparty and the type of the agreement. Generally, collateral is determined at the close of fund business each day and any additional collateral required due to changes in derivative values may be delivered by the fund or the counterparty within a few business days. Collateral pledged and/or received by the fund for OTC derivatives, if any, is held in segregated accounts with the fund’s custodian/counterparty broker and can be in the form of cash and/or securities. Unrestricted cash may be invested according to the Fund’s investment objectives.
The Fund entered into exchange traded futures contracts primarily to manage exposure to certain foreign currencies. A futures contract is an agreement between the Fund and a counterparty to buy or sell an asset for a specified price on a future date. Required initial margins are pledged by the Fund, and the daily change in fair value is accounted for as a variation margin payable or receivable on the Statement of Assets and Liabilities.
The Fund entered into OTC forward exchange contracts primarily to manage exposure to certain foreign currencies. A forward exchange contract is an agreement between the Fund and a counterparty to buy or sell a foreign currency at a specific exchange rate on a future date.
The Fund purchased or wrote exchange traded option contracts primarily to manage exposure to equity price risk. An option is a contract entitling the holder to purchase or sell a specific amount of shares or units of an asset or notional amount of a swap (swaption), at a specified price. Options purchased are recorded as an asset while options written are recorded as a liability. Upon exercise of an option, the acquisition cost or sales proceeds of the underlying investment is adjusted by any premium
MGD-27
Franklin Templeton Variable Insurance Products Trust
Notes to Financial Statements (continued)
Mutual Global Discovery Securities Fund
1. ORGANIZATION AND SIGNIFICANT ACCOUNTING POLICIES (continued)
c. Derivative Financial Instruments (continued)
received or paid. Upon expiration of an option, any premium received or paid is recorded as a realized gain or loss. Upon closing an option other than through expiration or exercise, the difference between the premium and the cost to close the position is recorded as a realized gain or loss.
See Notes 6 and 10 regarding investment transactions and other derivative information, respectively.
d. Restricted Cash
At December 31, 2013, the Fund received restricted cash in connection with investments in certain derivative securities. Restricted cash is held in a segregated account with the Fund’s custodian and is reflected in the Statement of Assets and Liabilities.
e. Securities Sold Short
The Fund is engaged in selling securities short, which obligates the Fund to replace a borrowed security with the same security at current market value. The Fund incurs a loss if the price of the security increases between the date of the short sale and the date on which the Fund replaces the borrowed security. The Fund realizes a gain if the price of the security declines between those dates. Gains are limited to the price at which the Fund sold the security short, while losses are potentially unlimited in size.
The Fund is required to establish a margin account with the broker lending the security sold short. While the short sale is outstanding, the broker retains the proceeds of the short sale to the extent necessary to meet margin requirements until the short position is closed out. A deposit must also be maintained with the Fund’s custodian/counterparty broker consisting of cash and/or securities having a value equal to a specified percentage of the value of the securities sold short. The Fund is obligated to pay fees for borrowing the securities sold short and is required to pay the counterparty any dividends or interest due on securities sold short. Such dividends or interest and any security borrowing fees are recorded as an expense to the Fund.
f. Securities Lending
The Fund participates in an agency based securities lending program. The Fund receives cash collateral against the loaned securities in an amount equal to at least 102% of the market value of the loaned securities. Collateral is maintained over the life of the loan in an amount not less than 100% of the market value of loaned securities, as determined at the close of fund business each day; any additional collateral required due to changes in security values is delivered to the Fund on the next business day. The collateral is invested in non-registered money fund as indicated on the Statement of Investments. The Fund receives income from the investment of cash collateral, in addition to lending fees and rebates paid by the borrower. The Fund bears the market risk with respect to the collateral investment, securities loaned, and the risk that the agent may default on its obligations to the Fund. The securities lending agent has agreed to indemnify the Fund in the event of default by a third party borrower.
g. Senior Floating Rate Interests
The Fund invests in senior secured corporate loans that pay interest at rates which are periodically reset by reference to a base lending rate plus a spread. These base lending rates are generally the prime rate offered by a designated U.S. bank or the London InterBank Offered Rate (LIBOR). Senior secured corporate loans often require prepayment of principal from excess cash flows or at the discretion of the borrower. As a result, actual maturity may be substantially less than the stated maturity.
Senior secured corporate loans in which the Fund invests are generally readily marketable, but may be subject to certain restrictions on resale.
MGD-28
Franklin Templeton Variable Insurance Products Trust
Notes to Financial Statements (continued)
Mutual Global Discovery Securities Fund
1. ORGANIZATION AND SIGNIFICANT ACCOUNTING POLICIES (continued)
h. Income and Deferred Taxes
It is the Fund’s policy to qualify as a regulated investment company under the Internal Revenue Code. The Fund intends to distribute to shareholders substantially all of its taxable income and net realized gains to relieve it from federal income and if applicable, excise taxes. As a result, no provision for U.S. federal income taxes is required.
The Fund may be subject to foreign taxation related to income received, capital gains on the sale of securities and certain foreign currency transactions in the foreign jurisdictions in which it invests. Foreign taxes, if any, are recorded based on the tax regulations and rates that exist in the foreign markets in which the Fund invests. When a capital gain tax is determined to apply the Fund records an estimated deferred tax liability in an amount that would be payable if the securities were disposed of on the valuation date.
The Fund recognizes the tax benefits of uncertain tax positions only when the position is “more likely than not” to be sustained upon examination by the tax authorities based on the technical merits of the tax position. As of December 31, 2013, and for all open tax years, the Fund has determined that no liability for unrecognized tax benefits is required in the Fund’s financial statements related to uncertain tax positions taken on a tax return (or expected to be taken on future tax returns). Open tax years are those that remain subject to examination and are based on each tax jurisdiction statute of limitation.
i. Security Transactions, Investment Income, Expenses and Distributions
Security transactions are accounted for on trade date. Realized gains and losses on security transactions are determined on a specific identification basis. Interest income and estimated expenses are accrued daily. Amortization of premium and accretion of discount on debt securities are included in interest income. Dividend income and dividends declared on securities sold short are recorded on the ex-dividend date except that certain dividends from foreign securities are recognized as soon as the Fund is notified of the ex-dividend date. Distributions to shareholders are recorded on the ex-dividend date and are determined according to income tax regulations (tax basis). Distributable earnings determined on a tax basis may differ from earnings recorded in accordance with accounting principles generally accepted in the United States of America. These differences may be permanent or temporary. Permanent differences are reclassified among capital accounts to reflect their tax character. These reclassifications have no impact on net assets or the results of operations. Temporary differences are not reclassified, as they may reverse in subsequent periods.
Common expenses incurred by the Trust are allocated among the funds based on the ratio of net assets of each fund to the combined net assets of the Trust. Fund specific expenses are charged directly to the fund that incurred the expense.
Realized and unrealized gains and losses and net investment income, not including class specific expenses, are allocated daily to each class of shares based upon the relative proportion of net assets of each class. Differences in per share distributions, by class, are generally due to differences in class specific expenses.
j. Accounting Estimates
The preparation of financial statements in accordance with accounting principles generally accepted in the United States of America requires management to make estimates and assumptions that affect the reported amounts of assets and liabilities at the date of the financial statements and the amounts of income and expenses during the reporting period. Actual results could differ from those estimates.
k. Guarantees and Indemnifications
Under the Trust’s organizational documents, its officers and trustees are indemnified by the Trust against certain liabilities arising out of the performance of their duties to the Trust. Additionally, in the normal course of business, the Trust, on behalf of the
MGD-29
Franklin Templeton Variable Insurance Products Trust
Notes to Financial Statements (continued)
Mutual Global Discovery Securities Fund
1. ORGANIZATION AND SIGNIFICANT ACCOUNTING POLICIES (continued)
k. Guarantees and Indemnifications (continued)
Fund, enters into contracts with service providers that contain general indemnification clauses. The Trust’s maximum exposure under these arrangements is unknown as this would involve future claims that may be made against the Trust that have not yet occurred. Currently, the Trust expects the risk of loss to be remote.
2. SHARES OF BENEFICIAL INTEREST
At December 31, 2013, there were an unlimited number of shares authorized (without par value). Transactions in the Fund’s shares were as follows:
| | | | | | | | | | | | | | | | |
| | | Year Ended December 31, | |
| | | 2013 | | | 2012 | |
| Class 1 Shares: | | Shares | | | Amount | | | Shares | | | Amount | |
Shares sold | | | 44,760 | | | $ | 1,035,207 | | | | 11,112 | | | $ | 227,652 | |
Shares issued in reinvestment of distributions | | | 11,601 | | | | 247,908 | | | | 4,331 | | | | 87,532 | |
Shares redeemed | | | (5,936 | ) | | | (133,915 | ) | | | (9,680 | ) | | | (200,012 | ) |
| | | | |
Net increase (decrease) | | | 50,425 | | | $ | 1,149,200 | | | | 5,763 | | | $ | 115,172 | |
| | | | |
Class 2 Shares: | | | | | | | | | | | | | | | | |
Shares sold | | | 4,182,129 | | | $ | 92,856,510 | | | | 1,636,877 | | | $ | 33,107,971 | |
Shares issued in reinvestment of distributions | | | 3,546,518 | | | | 74,335,016 | | | | 2,653,268 | | | | 52,693,893 | |
Shares redeemed | | | (10,488,139 | ) | | | (234,231,053 | ) | | | (8,457,161 | ) | | | (171,003,841 | ) |
| | | | |
Net increase (decrease) | | | (2,759,492 | ) | | $ | (67,039,527 | ) | | | (4,167,016 | ) | | $ | (85,201,977 | ) |
| | | | |
Class 4 Shares: | | | | | | | | | | | | | | | | |
Shares sold | | | 372,331 | | | $ | 8,412,949 | | | | 79,532 | | | $ | 1,636,846 | |
Shares issued on reinvestment of distributions | | | 347,770 | | | | 7,372,718 | | | | 255,016 | | | | 5,115,627 | |
Shares redeemed | | | (733,968 | ) | | | (16,611,191 | ) | | | (694,727 | ) | | | (14,153,083 | ) |
| | | | |
Net increase (decrease) | | | (13,867 | ) | | $ | (825,524 | ) | | | (360,179 | ) | | $ | (7,400,610 | ) |
| | | | |
3. TRANSACTIONS WITH AFFILIATES
Franklin Resources, Inc. is the holding company for various subsidiaries that together are referred to as Franklin Templeton Investments. Certain officers and trustees of the Fund are also officers and/or directors of the following subsidiaries:
| | |
| Subsidiary | | Affiliation |
Franklin Mutual Advisers, LLC (Franklin Mutual) | | Investment manager |
Franklin Templeton Services, LLC (FT Services) | | Administrative manager |
Franklin Templeton Distributors, Inc. (Distributors) | | Principal underwriter |
Franklin Templeton Investor Services, LLC (Investor Services) | | Transfer agent |
a. Management Fees
The Fund pays an investment management fee to Franklin Mutual based on the average daily net assets of the Fund as follows:
| | |
| Annualized Fee Rate | | Net Assets |
| 0.800% | | Up to and including $4 billion |
| 0.770% | | Over $4 billion, up to and including $7 billion |
| 0.750% | | Over $7 billion, up to and including $10 billion |
| 0.730% | | In excess of $10 billion |
MGD-30
Franklin Templeton Variable Insurance Products Trust
Notes to Financial Statements (continued)
Mutual Global Discovery Securities Fund
3. TRANSACTIONS WITH AFFILIATES (continued)
b. Administrative Fees
The Fund pays an administrative fee to FT Services based on the Fund’s average daily net assets as follows:
| | |
| Annualized Fee Rate | | Net Assets |
| 0.150% | | Up to and including $200 million |
| 0.135% | | Over $200 million, up to and including $700 million |
| 0.100% | | Over $700 million, up to and including $1.2 billion |
| 0.075% | | In excess of $1.2 billion |
c. Distribution Fees
The Board has adopted distribution plans for Class 2 and Class 4 shares pursuant to Rule 12b-1 under the 1940 Act. Under the Fund’s compensation distribution plans, the Fund pays Distributors for costs incurred in connection with the servicing, sale and distribution of the Fund’s shares up to 0.35% per year of its average daily net assets of each class. Some distribution fees are not charged on shares held by affiliates. The Board has agreed to limit the current rate to 0.25% per year for Class 2. The plan year, for purposes of monitoring compliance with the maximum annual plan rates, is February 1 through January 31.
d. Transfer Agent Fees
Investor Services, under terms of an agreement, performs shareholder servicing for the Fund and is not paid by the Fund for the services.
4. EXPENSE OFFSET ARRANGEMENT
The Fund has entered into an arrangement with its custodian whereby credits realized as a result of uninvested cash balances are used to reduce a portion of the Fund’s custodian expenses. During the year ended December 31, 2013, the custodian fees were reduced as noted in the Statement of Operations.
5. INCOME TAXES
The tax character of distributions paid during the years ended December 31, 2013 and 2012, was as follows:
| | | | | | | | |
| | | 2013 | | | 2012 | |
Distributions paid from: | | | | | | | | |
Ordinary income | | $ | 18,220,656 | | | $ | 25,422,950 | |
Long term capital gain | | | 63,734,986 | | | | 32,474,102 | |
| | | | |
| | $ | 81,955,642 | | | $ | 57,897,052 | |
| | | | |
MGD-31
Franklin Templeton Variable Insurance Products Trust
Notes to Financial Statements (continued)
Mutual Global Discovery Securities Fund
5. INCOME TAXES (continued)
At December 31, 2013, the cost of investments, net unrealized appreciation (depreciation), undistributed ordinary income and undistributed long term capital gains for income tax purposes were as follows:
| | | | |
Cost of investments | | $ | 566,658,386 | |
| | | | |
| |
Unrealized appreciation | | $ | 220,317,485 | |
Unrealized depreciation | | | (29,609,572 | ) |
| | | | |
Net unrealized appreciation (depreciation) | | $ | 190,707,913 | |
| | | | |
| |
Undistributed ordinary income | | $ | 23,423,360 | |
Undistributed long term capital gains | | | 42,716,047 | |
| | | | |
Distributable earnings | | $ | 66,139,407 | |
| | | | |
Differences between income and/or capital gains as determined on a book basis and a tax basis are primarily due to differing treatments of foreign currency transactions, tax straddles and bond discounts and premiums.
6. INVESTMENT TRANSACTIONS
Purchases and sales of investments (excluding short term securities and securities sold short) for the year ended December 31, 2013, aggregated $111,343,831 and $253,160,301, respectively.
Transactions in options written during the year ended December 31, 2013, were as follows:
| | | | | | | | |
| | | Number of
Contracts | | | Premiums
Received | |
Options outstanding at December 31, 2012 | | | — | | | $ | — | |
Options written | | | 108 | | | | 23,165 | |
Options expired | | | — | | | | — | |
Options exercised | | | (99 | ) | | | (13,860 | ) |
Options closed | | | (9 | ) | | | (9,305 | ) |
| | | | |
Options outstanding at December 31, 2013 | | | — | | | $ | — | |
| | | | |
See Notes 1(c) and 10 regarding derivative financial instruments and other derivative information, respectively.
7. CREDIT RISK AND DEFAULTED SECURITIES
The Fund may purchase the pre-default or defaulted debt of distressed companies. Distressed companies are financially troubled and are about to be or are already involved in financial restructuring or bankruptcy. Risks associated with purchasing these securities include the possibility that the bankruptcy or other restructuring process takes longer than expected, or that distributions in restructuring are less than anticipated, either or both of which may result in unfavorable consequences to the Fund. If it becomes probable that the income on debt securities, including those of distressed companies, will not be collected, the Fund discontinues accruing income and recognizes an adjustment for uncollectible interest.
At December 31, 2013, the aggregate value of distressed company securities for which interest recognition has been discontinued was $1,187,269, representing 0.16% of the Fund’s net assets. For information as to specific securities, see the accompanying Statement of Investments.
MGD-32
Franklin Templeton Variable Insurance Products Trust
Notes to Financial Statements (continued)
Mutual Global Discovery Securities Fund
8. CONCENTRATION OF RISK
Investing in foreign securities may include certain risks and considerations not typically associated with investing in U.S. securities, such as fluctuating currency values and changing local and regional economic, political and social conditions, which may result in greater market volatility. In addition, certain foreign securities may not be as liquid as U.S. securities.
9. RESTRICTED SECURITIES
The Fund invests in securities that are restricted under the Securities Act of 1933 (1933 Act) or which are subject to legal, contractual, or other agreed upon restrictions on resale. Restricted securities are often purchased in private placement transactions, and cannot be sold without prior registration unless the sale is pursuant to an exemption under the 1933 Act. Disposal of these securities may require greater effort and expense, and prompt sale at an acceptable price may be difficult. The Fund may have registration rights for restricted securities. The issuer generally incurs all registration costs.
At December 31, 2013, the Fund held investments in restricted securities, excluding certain securities exempt from registration under the 1933 Act deemed to be liquid, as follows:
| | | | | | | | | | | | | | | | |
Principal
Amount/
Shares | | | Issuer | | Acquisition
Dates | | | Cost | | | Value | |
| | 800,000 | | | The Bankshares Inc. | | | 3/22/07 | | | $ | 8,000,000 | | | $ | 3,815,192 | |
| | 595 | | | Broadband Ventures III LLC, secured promissory note, 5.00%, 2/01/12 | | | 7/01/10 – 11/30/12 | | | | 595 | | | | — | |
| | 2,077,368 | | | FIM Coinvestor Holdings I, LLC | | | 11/20/06 – 6/02/09 | | | | — | | | | — | |
| | 2,172,000 | | | Hightower Holding LLC, pfd., A, Series 2 | | | 6/10/10 – 5/10/12 | | | | 5,430,000 | | | | 4,131,361 | |
| | 56,213 | | | Imagine Group Holdings Ltd. | | | 8/31/04 | | | | 575,705 | | | | 410,692 | |
| | 424,073 | | | International Automotive Components Group Brazil LLC | | | 4/13/06 – 12/26/08 | | | | 281,629 | | | | 82,618 | |
| | 4,052,916 | | | International Automotive Components Group North America, LLC | | | 1/12/06 – 3/18/13 | | | | 3,247,714 | | | | 2,293,221 | |
| | 2,140 | | | Olympus Re Holdings Ltd. | | | 12/19/01 | | | | 200,477 | | | | — | |
| | | | | | | | | | | | |
| | | | Total Restricted Securities (Value is 1.42% of Net Assets) | | | | | | $ | 17,736,120 | | | $ | 10,733,084 | |
| | | | | | | | | | | | |
10. OTHER DERIVATIVE INFORMATION
At December 31, 2013, the Fund’s investments in derivative contracts are reflected on the Statement of Assets and Liabilities as follows:
| | | | | | | | | | | | |
| | | Asset Derivatives | | | | | Liability Derivatives | |
Derivative Contracts Not Accounted for as
Hedging Instruments | | Statement of Assets and
Liabilities Location | | Fair
Value
Amount | | | Statement of Assets and
Liabilities Location | | Fair Value
Amount | |
Foreign exchange contracts | | Unrealized appreciation on forward exchange contracts | | $ | 984,639 | | | Unrealized depreciation on forward exchange contracts / Net assets consist of – net unrealized appreciation (depreciation) | | $ | 5,624,183a | |
aIncludes cumulative appreciation (depreciation) of futures contracts as reported in the Statement of Investments. Only current day’s variation margin is separately reported within the Statement of Assets and Liabilities.
MGD-33
Franklin Templeton Variable Insurance Products Trust
Notes to Financial Statements (continued)
Mutual Global Discovery Securities Fund
10. OTHER DERIVATIVE INFORMATION (continued)
For the year ended December 31, 2013, the effect of derivative contracts on the Fund’s Statement of Operations was as follows:
| | | | | | | | | | |
Derivative Contracts Not Accounted
for as Hedging Instruments | | Statement of
Operations Locations | | Realized Gain
(Loss) for the
Year | | | Change in
Unrealized
Appreciation
(Depreciation)
for the Year | |
Foreign exchange contracts | | Net realized gain (loss) from foreign currency transactions and futures contracts / Net change in unrealized appreciation (depreciation) on translation of other assets and liabilities denominated in foreign currencies | | $ | (4,976,630 | ) | | $ | 386,744 | |
Equity contracts | | Net realized gain (loss) from written options / Net change in unrealized appreciation (depreciation) on investments | | | 6,664 | | | | — | |
For the year ended December 31, 2013, the average month end market value of derivatives represented 0.66% of month end net assets. The average month end number of open derivative contracts for the year was 148.
See Notes 1(c) and 6 regarding derivative financial instruments and investment transactions, respectively.
11. HOLDINGS OF 5% VOTING SECURITIES OF PORTFOLIO COMPANIES
The 1940 Act defines “affiliated companies” to include investments in portfolio companies in which a fund owns 5% or more of the outstanding voting securities. Investments in “affiliated companies” for the Fund for the year ended December 31, 2013, were as shown below.
| | | | | | | | | | | | | | | | | | | | | | | | | | | | |
| Name of Issuer | | Number of Shares
Held at Beginning
of Year | | | Gross
Additions | | | Gross
Reductions | | | Number of Shares
Held at End
of Year | | | Value at
End of
Year | | | Investment
Income | | | Realized Capital
Gain (Loss) | |
Non-Controlled Affiliates | | | | | | | | | | | | | | | | | | | | | | | | | | | | |
The Bankshares Inc. (Value is 0.50% of Net Assets) | | | 800,000 | | | | — | | | | — | | | | 800,000 | | | $ | 3,815,192 | | | $ | — | | | $ | — | |
| | | | | | | | | | | | | | | | | | | | |
12. CREDIT FACILITY
The Fund, together with other U.S. registered and foreign investment funds (collectively, Borrowers), managed by Franklin Templeton Investments, are borrowers in a joint syndicated senior unsecured credit facility totaling $1.5 billion (Global Credit Facility) which, after an extension of the original terms, matured on February 14, 2014. This Global Credit Facility provides a source of funds to the Borrowers for temporary and emergency purposes, including the ability to meet future unanticipated or unusually large redemption requests. Effective February 14, 2014, the Borrowers renewed the Global Credit Facility which matures on February 13, 2015.
Under the terms of the Global Credit Facility, the Fund shall, in addition to interest charged on any borrowings made by the Fund and other costs incurred by the Fund, pay its share of fees and expenses incurred in connection with the implementation and maintenance of the Global Credit Facility, based upon its relative share of the aggregate net assets of all of the Borrowers, including an annual commitment fee of 0.07% based upon the unused portion of the Global Credit Facility. These fees are reflected in other expenses on the Statement of Operations. During the year ended December 31, 2013, the Fund did not use the Global Credit Facility.
MGD-34
Franklin Templeton Variable Insurance Products Trust
Notes to Financial Statements (continued)
Mutual Global Discovery Securities Fund
13. FAIR VALUE MEASUREMENTS
The Fund follows a fair value hierarchy that distinguishes between market data obtained from independent sources (observable inputs) and the Fund’s own market assumptions (unobservable inputs). These inputs are used in determining the value of the Fund’s financial instruments and are summarized in the following fair value hierarchy:
| | • | | Level 1 – quoted prices in active markets for identical financial instruments |
| | • | | Level 2 – other significant observable inputs (including quoted prices for similar financial instruments, interest rates, prepayment speed, credit risk, etc.) |
| | • | | Level 3 – significant unobservable inputs (including the Fund’s own assumptions in determining the fair value of financial instruments) |
The input levels are not necessarily an indication of the risk or liquidity associated with financial instruments at that level.
For movements between the levels within the fair value hierarchy, the Fund has adopted a policy of recognizing the transfers as of the date of the underlying event which caused the movement.
A summary of inputs used as of December 31, 2013, in valuing the Fund’s assets and liabilities carried at fair value, is as follows:
| | | | | | | | | | | | | | | | |
| | | Level 1 | | | Level 2 | | | Level 3 | | | Total | |
| | | | |
Assets: | | | | | | | | | | | | | | | | |
Investments in Securities | | | | | | | | | | | | | | | | |
Equity Investments:a | | | | | | | | | | | | | | | | |
Auto Components | | $ | 3,914,354 | | | $ | — | | | $ | 2,375,839 | | | $ | 6,290,193 | |
Commercial Banks | | | 62,316,795 | | | | 6,140,725 | | | | 3,815,192 | | | | 72,272,712 | |
Diversified Financial Services | | | 40,784,442 | | | | — | | | | 4,131,361 | | | | 44,915,803 | |
Insurance | | | 56,518,726 | | | | — | | | | 410,692 | b | | | 56,929,418 | |
Media | | | 26,030,393 | | | | 2,071,446 | | | | — | | | | 28,101,839 | |
Paper & Forest Products | | | — | | | | 1,747,440 | | | | — | | | | 1,747,440 | |
Real Estate Management & Development | | | 1,383,861 | | | | — | | | | 2,518,473 | | | | 3,902,334 | |
All Other Equity Investmentsc | | | 477,549,977 | | | | — | | | | — | b | | | 477,549,977 | |
Corporate Bonds, Notes and Senior Floating Rate Interests | | | — | | | | 31,862,770 | | | | — | | | | 31,862,770 | |
Corporate Notes in Reorganization | | | — | | | | 1,187,269 | | | | — | b | | | 1,187,269 | |
Companies in Liquidation | | | 10,759 | | | | 7,807,095 | | | | — | b | | | 7,817,854 | |
Short Term Investments | | | 24,396,810 | | | | 391,880 | | | | — | | | | 24,788,690 | |
| | | | |
Total Investments in Securities | | $ | 692,906,117 | | | $ | 51,208,625 | | | $ | 13,251,557 | | | $ | 757,366,299 | |
| | | | |
Forward Exchange Contracts | | | — | | | | 984,639 | | | | — | | | | 984,639 | |
Liabilities: | | | | | | | | | | | | | | | | |
Securities Sold Short | | | 4,371,298 | | | | — | | | | — | | | | 4,371,298 | |
Futures Contracts | | | 345,046 | | | | — | | | | — | | | | 345,046 | |
Forward Exchange Contracts | | | — | | | | 5,279,137 | | | | — | | | | 5,279,137 | |
aIncludes common and preferred stocks as well as other equity investments.
bIncludes securities determined to have no value at December 31, 2013.
cFor detailed categories, see the accompanying Statement of Investments.
MGD-35
Franklin Templeton Variable Insurance Products Trust
Notes to Financial Statements (continued)
Mutual Global Discovery Securities Fund
13. FAIR VALUE MEASUREMENTS (continued)
A reconciliation of assets in which Level 3 inputs are used in determining fair value is presented when there are significant Level 3 investments at the end of the period. At December 31, 2013, the reconciliation of assets is as follows:
| | | | | | | | | | | | | | | | | | | | | | | | | | | | | | | | | | | | | | | | |
| | | Balance at
Beginning
of
Year | | | Purchases | | | Sales | | | Trans
fers
Into
Level 3 | | | Trans
fers
Out of
Level 3a | | | Cost
Basis
Adjust
mentsb | | | Net
Realized
Gain (Loss) | | | Net
Unrealized
Gain (Loss) | | | Balance at
End of
Year | | | Net
Change
in
Unrealized
Appreciation
(Depreciation)
on Assets
Held
at Year
End | |
Assets | | | | | | | | | | | | | | | | | | | | | | | | | | | | | | | | | | | | | | | | |
Investments in Securities: | | | | | | | | | | | | | | | | | | | | | | | | | | | | | | | | | | | | | | | | |
Equity Investments:c | | | | | | | | | | | | | | | | | | | | | | | | | | | | | | | | | | | | | | | | |
Auto Components | | $ | 1,600,592 | | | $ | 368,443 | | | $ | — | | | $ | — | | | $ | — | | | $ | — | | | $ | — | | | $ | 406,804 | | | $ | 2,375,839 | | | $ | 406,804 | |
Commercial Banks | | | 8,957,064 | d | | | — | | | | — | | | | — | | | | (5,954,429 | ) | | | — | | | | — | | | | 812,557 | | | | 3,815,192 | | | | 508,216 | |
Diversified Financial Services | | | 4,239,527 | | | | — | | | | — | | | | — | | | | — | | | | — | | | | — | | | | (108,166 | ) | | | 4,131,361 | | | | (108,166 | ) |
Diversified Telecommunication Services | | | 32,587 | d | | | — | | | | — | | | | — | | | | — | | | | — | | | | 69,570 | | | | (102,157 | ) | | | — | d | | | — | |
Insurance | | | 648,760 | d | | | — | | | | — | | | | — | | | | — | | | | (520 | ) | | | — | | | | (237,548 | ) | | | 410,692 | d | | | (237,548 | ) |
Real Estate Management & Development | | | 3,812,118 | | | | — | | | | — | | | | — | | | | (2,276,952 | ) | | | — | | | | — | | | | 983,307 | | | | 2,518,473 | | | | 670,516 | |
Corporate Notes in Reorganization | | | — | d | | | — | | | | (66 | ) | | | — | | | | — | | | | — | | | | — | | | | 66 | | | | — | d | | | — | |
| | | | |
Total | | $ | 19,290,648 | | | $ | 368,443 | | | $ | (66 | ) | | $ | — | | | $ | (8,231,381 | ) | | $ | (520 | ) | | $ | 69,570 | | | $ | 1,754,863 | | | $ | 13,251,557 | | | $ | 1,239,822 | |
| | | | |
aThe investments were transferred out of Level 3 as a result of the removal of a significant unobservable valuation input and/or the availability of a quoted market price in an active market for identical securities.
bMay include accretion, amortization, partnership adjustments, and/or other cost basis adjustments.
cIncludes common and preferred stocks as well as other equity investments.
dIncludes securities determined to have no value.
Significant unobservable valuation inputs developed by the VLOC for material Level 3 investments and impact to fair value as a result of changes in unobservable valuation inputs as of December 31, 2013, are as follows:
| | | | | | | | | | | | | | |
| Description | | Fair Value
at End of
Period | | | Valuation Technique | | Unobservable Inputs | | Amount/
Range | | | Impact to
Fair Value if
Input
Increasesa |
Assets: | | | | | | | | | | | | | | |
Investments in Securities: | | | | | | | | | | | | | | |
Equity Investments:b | | | | | | | | | | | | | | |
Auto Components | | $ | 2,293,221 | | | Market comparables | | Discount for lack of marketability | | | 15% | | | Decrease |
| | | | | | | | EV / EBITDA multiple | | | 5.1x | | | Increasec |
Commercial Banks | | | 3,815,192 | | | Market comparables | | Discount for lack of marketability | | | 10% | | | Decreasec |
| | | | | | | | Price / tangible book multiple | | | 1.4x | | | Increasec |
Diversified Financial Services | | | 4,131,361 | | | Discounted cash flow model | | Cost of equity | | | 17% | | | Decrease |
| | | | | | | | Long-term revenue growth rate | | | 6.2% - 34.9% | | | Increased |
| | | | | | | | Adjusted EBITDA margin | | | 8% - 22% | | | Increase |
Real Estate Management & Development | | | 2,518,473 | | | Market comparables | | Discount for lack of marketability | | | 8% | | | Decreasec |
All Other Investmentse | | | 493,310 | | | | | | | | | | | |
| | | | | | | | | | | | | | |
Total | | $ | 13,251,557 | | | | | | | | | | | |
| | | | | | | | | | | | | | |
MGD-36
Franklin Templeton Variable Insurance Products Trust
Notes to Financial Statements (continued)
Mutual Global Discovery Securities Fund
13. FAIR VALUE MEASUREMENTS (continued)
a Represents the directional change in the fair value of the Level 3 investments that would result from a significant and reasonable increase in the corresponding input. A significant and reasonable decrease in input would have the opposite effect. Significant impacts, if any, to fair value and/or net assets have been indicated.
b Includes common and convertible preferred stocks.
c Represents a significant impact to fair value but not net assets.
d Represents a significant impact to fair value and net assets.
e Includes fair value of immaterial investments developed using various valuation techniques and unobservable inputs. May also include investments with values derived using prior transaction prices or third party pricing information without adjustment for which such inputs are also unobservable.
14. NEW ACCOUNTING PRONOUNCEMENTS
In June 2013, the Financial Accounting Standards Board issued Accounting Standards Update (ASU) No. 2013-08, Investment Companies (Topic 946): Amendments to the Scope, Measurement, and Disclosure Requirements. The ASU modifies the criteria used in defining an investment company under U.S. Generally Accepted Accounting Principles and also sets forth certain measurement and disclosure requirements. Under the ASU, an entity that is registered under the 1940 Act automatically qualifies as an investment company. The ASU is effective for interim and annual reporting periods beginning after December 15, 2013. Management has reviewed the requirements and believes the adoption of this ASU will not have a material impact on the financial statements.
15. SUBSEQUENT EVENTS
The Fund has evaluated subsequent events through the issuance of the financial statements and determined that no events have occurred that require disclosure other than those already disclosed in the financial statements.
| | | | | | |
ABBREVIATIONS | | | | |
| Counterparty | | Currency | | Selected Notes | | Selected Portfolio |
| | | | | | |
| BOFA - Bank of America N.A. | | EUR - Euro | | EBITDA - Earnings before interest, taxes, depreciation and amortization | | ADR - American Depositary Receipt |
| BZWS - Barclays Bank PLC | | GBP - British Pound | | | FRN - Floating Rate Note |
| BONY - Bank of New York Mellon | | USD - United States Dollar | | EV - Enterprise value | | IDR - International Depositary Receipt |
| DBAB - Deutsche Bank AG | | | | | | |
| FBCO - Credit Suisse Group AG | | | | | | |
| HSBC - HSBC Bank USA, N.A. | | | | | | |
| SCBT - Standard Chartered Bank | | | | | | |
| SSBT - State Street Bank and Trust Co. | | | | | | |
MGD-37
Franklin Templeton Variable Insurance Products Trust
Mutual Global Discovery Securities Fund
Report of Independent Registered Public Accounting Firm
To the Board of Trustees and Shareholders of
Franklin Templeton Variable Insurance Products Trust
In our opinion, the accompanying statement of assets and liabilities, including the statement of investments, and the related statements of operations and of changes in net assets and the financial highlights present fairly, in all material respects, the financial position of The Mutual Global Discovery Securities Fund (the “Fund”) at December 31, 2013, the results of its operations for the year then ended, the changes in its net assets for each of the two years in the period then ended and the financial highlights for each of the five years in the period then ended, in conformity with accounting principles generally accepted in the United States of America. These financial statements and financial highlights (hereafter referred to as “financial statements”) are the responsibility of the Fund’s management. Our responsibility is to express an opinion on these financial statements based on our audits. We conducted our audits of these financial statements in accordance with the standards of the Public Company Accounting Oversight Board (United States). Those standards require that we plan and perform the audit to obtain reasonable assurance about whether the financial statements are free of material misstatement. An audit includes examining, on a test basis, evidence supporting the amounts and disclosures in the financial statements, assessing the accounting principles used and significant estimates made by management, and evaluating the overall financial statement presentation. We believe that our audits, which included confirmation of securities at December 31, 2013 by correspondence with the custodian, transfer agent and brokers, provide a reasonable basis for our opinion.
PricewaterhouseCoopers LLP
San Francisco, California
February 14, 2014
MGD-38
Franklin Templeton Variable Insurance Products Trust
Tax Information (unaudited)
Mutual Global Discovery Securities Fund
Under Section 852(b)(3)(C) of the Internal Revenue Code (Code), the Fund hereby reports the maximum amount allowable but no less than $63,734,986 as a long term capital gain dividend for the fiscal year ended December 31, 2013.
Under Section 854(b)(1)(A) of the Code, the Fund hereby reports 40.46% of the ordinary income dividends as income qualifying for the dividends received deduction for the fiscal year ended December 31, 2013.
MGD-39
MUTUAL SHARES SECURITIES FUND
This annual report for Mutual Shares Securities Fund covers the fiscal year ended December 31, 2013.
Performance Summary as of 12/31/13
Average annual total return of Class 4 shares* represents the average annual change in value, assuming reinvestment of dividends and capital gains. Average returns smooth out variations in returns, which can be significant; they are not the same as year-by-year results.
Periods ended 12/31/13
| | | | | | | | | | | | |
| | | 1-Year | | | 5-Year | | | 10-Year | |
Average Annual Total Return | | | +28.05% | | | | +15.13% | | | | +6.95% | |
*For the period beginning 2/29/08, Class 4 performance reflects a 12b-1 fee expense of 0.35% per year, which affects future performance. Class 4 performance prior to 2/29/08 reflects historical Class 1 performance, which does not have a 12b-1 fee expense. Since 2/29/08 (effective date), the average annual total return of Class 4 shares was +5.58%.
Total Return Index Comparison for a Hypothetical $10,000 Investment (1/1/04–12/31/13)
The graph below shows the change in value of a hypothetical $10,000 investment in the Fund over the indicated period and includes reinvestment of any income and distributions. The Fund’s performance* is compared to the performance of the Standard & Poor’s® 500 Index (S&P 500®). One cannot invest directly in an index, and an index is not representative of the Fund’s portfolio. Please see Important Notes to Performance Information preceding the Fund Summaries.
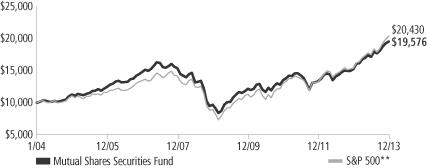
**Source: © 2014 Morningstar. Please see Index Descriptions following the Fund Summaries.
Mutual Shares Securities Fund – Class 4
Performance reflects the Fund’s Class 4 operating expenses, but does not include any contract fees, expenses or sales charges. If they had been included, performance would be lower. These charges and deductions, particularly for variable life policies, can have a significant effect on contract values and insurance benefits. See the contract prospectus for a complete description of these expenses, including sales charges.
Performance data represent past performance, which does not guarantee future results. Investment return and principal value will fluctuate, and you may have a gain or loss when you sell your shares.
Current performance may differ from figures shown.
MS-1
Fund Goals and Main Investments: Mutual Shares Securities Fund seeks capital appreciation, with income as a secondary goal. Under normal market conditions, the Fund invests primarily in U.S. and foreign equity securities that the investment manager believes are undervalued.
Performance Overview
You can find the Fund’s one-year total return in the Performance Summary. In comparison, the Fund’s benchmark, the S&P 500, delivered a +32.39% total return for the period under review.1
Economic and Market Overview
The 12 months under review were characterized by reinvigorated policy support and an economic recovery in developed markets. However, differences in global economic trends corresponded with increasingly divergent monetary policies, and growth in emerging market economies tended to slow. The central banks of key developed markets generally reaffirmed their accommodative monetary stances while some emerging market counterparts tightened policy rates as they sought to control inflation and currency depreciation.
In the U.S., economic growth and employment trends generally exceeded expectations, underpinned by consumer and business spending and rising inventories. Historically low mortgage rates and improving sentiment aided the housing market recovery, evidenced by solid new and existing home sales, rising home prices, low inventories and multi-year lows in new foreclosures. The U.S. Federal Reserve Board (Fed) expanded its asset purchase program to $85 billion per month from $40 billion early in the year. After encouraging economic and employment reports, the Fed announced in December it would reduce its monthly bond purchases by $10 billion beginning in January 2014; however, the Fed committed to keeping interest rates low. In October, the federal government temporarily shut down after Congress failed to authorize routine federal funding amid a disagreement over a new health care law. However, Congress subsequently agreed to fund the government through early 2014 and later passed a two-year budget deal that could ease automatic spending cuts and lower the risk of another shutdown.
Outside the U.S., the eurozone emerged from its longest recession on record during 2013’s second half and Japan’s growth moderated. The European Central Bank reduced its policy rate to a record low and
1. Source: © 2014 Morningstar. One cannot invest directly in an index, and an index is not representative of the Fund’s portfolio. Please see Index Descriptions following the Fund Summaries.
Fund Risks: All investments involve risks, including possible loss of principal. Value securities may not increase in price as anticipated or may decline further in value. The Fund’s investments in foreign securities involve special risks including currency fluctuations, and economic and political uncertainties. The Fund may also invest in companies engaged in mergers, reorganizations or liquidations, which involve special risks as pending deals may not be completed on time or on favorable terms, as well as lower rated bonds, which entail higher credit risk. The Fund is actively managed but there is no guarantee that the manager’s investment decisions will produce the desired results. The Fund’s prospectus also includes a description of the main investment risks.
MS-2
pledged to maintain systemic support following political turmoil in Greece, Spain, Portugal and Italy. Germany’s re-election of Chancellor Angela Merkel was largely perceived as a vote of support for ongoing eurozone reform measures. In Asia, the Bank of Japan set an explicit inflation target and pledged to double bond purchases in an unprecedented wave of policy reform. The U.S. dollar fell versus the euro but rose versus the Japanese yen in 2013.
Growth in many emerging markets moderated based on lower domestic demand, falling exports and weakening commodity prices. Political turmoil in certain emerging markets, the Fed’s potential tapering of its asset purchase program and the Chinese central bank’s effort to tighten liquidity to curb real estate and credit speculation led to a sell-off in emerging market equities and a sharp depreciation in regional currencies against the U.S. dollar. Central banks in Brazil, India and Indonesia raised interest rates in the second half of 2013 as they sought to curb inflation.
The stock market rally in developed markets accelerated during 2013 amid redoubled central bank commitments, continued corporate earnings strength and increasing signs of economic progress. Emerging market stocks rebounded toward period-end, although Latin American stocks trailed their emerging market peers. Oil prices rallied in the third quarter and rose for the year mainly owing to supply concerns related to geopolitical turmoil, but gold posted its largest annual price decline in more than three decades. Increasingly divergent economic and political circumstances during the period resulted in declining market correlations, which many bottom-up investors perceived as more favorable.
Investment Strategy
At Mutual Series, we are committed to our distinctive value approach to investing. Our major investment strategy is investing in undervalued stocks. When selecting undervalued equities, we are attracted to fundamentally strong companies with healthy balance sheets, high-quality assets, substantial free cash flow and shareholder-oriented management teams and whose stocks are trading at discounts to our assessment of the companies’ intrinsic or business value. We also look for asset-rich companies whose shares may be trading at depressed levels due to concerns over short-term earnings disappointments, litigation, management strategy or other perceived negatives. While the vast majority of our undervalued equity investments are made in publicly traded companies globally, we may invest occasionally in privately held companies as well.
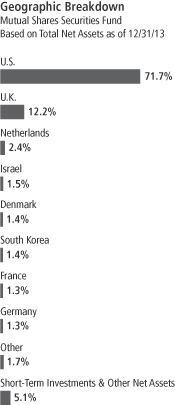
MS-3
We complement this more traditional investment strategy with two others. One is distressed investing, which is complex and can take many forms. The most common distressed investment the Fund undertakes is the purchase of financially troubled or bankrupt companies’ debt at a substantial discount to face value. After the financially distressed company is reorganized, often in bankruptcy court, the old debt is typically replaced with new securities issued by the financially stronger company.
The other piece of our investment strategy is participating in arbitrage situations, another highly specialized field. When companies announce proposed mergers or takeovers, commonly referred to as “deals,” the target company may trade at a discount to the bid it ultimately accepts. One form of arbitrage involves purchasing the target company’s stock when it is trading below the value we believe it would receive in a deal. In keeping with our commitment to a relatively conservative investment approach, we typically focus our arbitrage efforts on announced deals, and eschew rumored deals or other situations we consider relatively risky.
In addition, it is our practice to hedge the Fund’s currency exposure when we deem it advantageous for our shareholders.
Manager’s Discussion
During the year under review, several holdings supported performance. Top contributors included U.K.-based mobile telephony operator Vodafone Group, software firm Microsoft and managed health care company Cigna.
Vodafone Group is a global mobile telecommunications company that provides a range of services, including voice and data communications. The company’s stock rallied in the second half of the year, driven largely by the long-anticipated sale of its 45% stake in Verizon Wireless to Verizon Communications at what we considered to be an attractive price. Vodafone said it planned to return two-thirds of the capital from the sale to shareholders and use the balance to invest in growth initiatives in its core markets and to reduce debt. Following the deal, we continued to view Vodafone as a potentially compelling stock, given that the economic environment in Europe has shown signs of stabilizing, the regulatory environment is easing and we believe the company may be close to monetizing its investments in data services.
Microsoft shares benefited from improved investor sentiment. In the first half of 2013, the company reported earnings that modestly beat
Top 10 Sectors/Industries
Mutual Shares Securities Fund
Based on Equity Securities
12/31/13
| | | | |
| | | % of Total
Net Assets | |
| Oil, Gas & Consumable Fuels | | | 8.9% | |
| Insurance | | | 8.4% | |
| Media | | | 6.8% | |
| Pharmaceuticals | | | 5.4% | |
| Commercial Banks | | | 5.3% | |
| Food & Staples Retailing | | | 5.3% | |
| Tobacco | | | 5.1% | |
| Diversified Financial Services | | | 3.9% | |
| Software | | | 3.8% | |
| Computers & Peripherals | | | 3.2% | |
What is meant by “hedge”?
To hedge a position is to seek to reduce the risk of adverse price movements in an asset. Normally, a hedge is implemented as an offsetting position in a related security, such as a currency forward contract.
What is a currency forward contract?
A currency forward contract, also called a “currency forward,” is an agreement between the Fund and a counterparty to buy or sell a foreign currency at a specific exchange rate on a future date.
MS-4
expectations, generally reassuring the market of its status as a stable business with a reasonable future. The stock also rallied following chief executive officer (CEO) Steve Ballmer’s announcement that he would retire in 2014. At period-end, we remained optimistic about the company’s plans to shift toward a subscription model for its business software such as the Office suite. In our view, if implemented broadly, such a move may have the potential to generate greater revenues and higher profits.
Shares of Cigna also benefited from improved investor sentiment early in the period following the company’s divestiture of its legacy run-off insurance business. Partially as a result of the divestiture, three major independent credit rating agencies issued positive outlooks for the company’s debt. Additionally, operational performance also improved as Cigna reported strong results in its core businesses. In October, Cigna increased its outlook for fiscal year 2013 consolidated adjusted income from operations. In our assessment, the outlook was among the more favorable in the managed care industry, owing to the company’s low exposure to potentially negative elements of upcoming health
care reforms.
During the period under review, some of the Fund’s investments negatively affected performance. These included Brazilian integrated energy firm Petroleo Brasileiro (Petrobras), U.K.-based metals and mining company Anglo American and Netherlands-incorporated heavy equipment manufacturer CNH Industrial.
Although Petrobras possesses several exploration and production assets we believe to be highly attractive, its refining and marketing (downstream) operations hurt results during the year and led the stock to decline. The Brazilian government regulates domestic fuel prices, and its reluctance to increase them continued to result in significant losses in Petrobras’s downstream business. Although the government did allow some modest price increases, recent protests against bus fare hikes, particularly in light of sluggish economic growth and a weakening Brazilian real, contributed to political pressure, limiting the company’s ability to bring domestic prices in line with global prices.
The share price of Anglo American was negatively affected by declining prices for several of the commodities it produces. Uncertainty surrounding possible restructuring actions also weighed on the stock price. In January, the company appointed a new CEO, tasked with a mandate to improve operations and capital discipline. Despite the price
Top 10 Equity Holdings
Mutual Shares Securities Fund 12/31/13
| | | | |
Company
Sector/Industry,
Country | | % of Total
Net Assets | |
| Merck & Co. Inc. | | | 2.8% | |
| Pharmaceuticals, U.S. | | | | |
| Microsoft Corp. | | | 2.6% | |
| Software, U.S. | | | | |
| Vodafone Group PLC | | | 2.4% | |
| Wireless Telecommunication Services, U.K. | | | | |
| Apple Inc. | | | 2.3% | |
| Computers & Peripherals, U.S. | |
| American International Group Inc. | | | 2.1% | |
| Insurance, U.S. | | | | |
| Medtronic Inc. | | | 1.9% | |
| Health Care Equipment & Supplies, U.S | | | | |
| Cigna Corp. | | | 1.9% | |
| Health Care Providers & Services, U.S. | | | | |
| Twenty-First Century Fox Inc. | | | 1.8% | |
| Media, U.S. | | | | |
| CVS Caremark Corp. | | | 1.7% | |
| Food & Staples Retailing, U.S. | |
| PNC Financial Services Group Inc. | | | 1.7% | |
| Commercial Banks, U.S. | | | | |
The dollar value, number of shares or principal amount, and names of all portfolio holdings are listed in the Fund’s Statement of Investments.
MS-5
decline during the year, at period-end, we maintained a favorable outlook for the stock as the new management team remained focused on improving operational performance and returns with the aim of increasing shareholder value.
CNH Industrial was formed from the integration of Fiat Industrial and CNH Global. Late in the year, the manufacturer of heavy machinery reported quarterly earnings that missed consensus estimates. Although operating performance improved in the company’s agricultural segment, declining agricultural commodity prices contributed to an unenthusiastic market outlook for agricultural equipment makers and weighed on the stock price. At period-end, our investment thesis remained intact and we believed CNH Industrial was one of Europe’s more attractively priced capital goods stocks, given upside potential from the restructuring of its European truck business, lower financial expenses and a lower tax rate following the company’s recent reorganization.
During the year, the Fund held currency forwards to somewhat hedge the currency risk of the Fund’s non-U.S. dollar investments. The hedges had a minor negative impact on the Fund’s performance during the period.
Thank you for your participation in Mutual Shares Securities Fund. We look forward to serving your future investment needs.
The foregoing information reflects our analysis, opinions and portfolio holdings as of
December 31, 2013, the end of the reporting period. The way we implement our main investment strategies and the resulting portfolio holdings may change depending on factors such as market and economic conditions. These opinions may not be relied upon as investment advice or an offer for a particular security. The information is not a complete analysis of every aspect of any market, country, industry, security or the Fund. Statements of fact are from sources considered reliable, but the investment manager makes no representation or warranty as to their completeness or accuracy. Although historical performance is no guarantee of future results, these insights may help you understand our investment management philosophy.
MS-6
Fund Expenses
As an investor in a variable insurance contract (Contract) that indirectly provides for investment in an underlying mutual fund, you can incur transaction and/or ongoing expenses at both the Fund level and the Contract level.
| • | | Transaction expenses can include sales charges (loads) on purchases, redemption fees, surrender fees, transfer fees and premium taxes. |
| • | | Ongoing expenses can include management fees, distribution and service (12b-1) fees, contract fees, annual maintenance fees, mortality and expense risk fees and other fees and expenses. All mutual funds and Contracts have some types of ongoing expenses. |
The expenses shown in the table are meant to highlight ongoing expenses at the Fund level only and do not include ongoing expenses at the Contract level, or transaction expenses at either the Fund or Contract level. While the Fund does not have transaction expenses, if the transaction and ongoing expenses at the Contract level were included, the expenses shown below would be higher. You should consult your Contract prospectus or disclosure document for more information.
The table shows Fund-level ongoing expenses and can help you understand these expenses and compare them with those of other mutual funds offered through the Contract. The table assumes a $1,000 investment held for the six months indicated. Please refer to the Fund prospectus for additional information on operating expenses.
Actual Fund Expenses
The first line (Actual) of the table provides actual account values and expenses. The “Ending Account Value” is derived from the Fund’s actual return, which includes the effect of ongoing Fund expenses, but does not include the effect of ongoing Contract expenses.
You can estimate the Fund-level expenses you incurred during the period by following these steps. Of course, your account value and expenses will differ from those in this illustration:
| 1. | Divide your account value by $1,000. |
If an account had an $8,600 value, then $8,600 ÷ $1,000 = 8.6.
| 2. | Multiply the result by the number under the heading “Fund-Level Expenses Incurred During Period.” |
If Fund-Level Expenses Incurred During Period were $7.50, then 8.6 x $7.50 = $64.50.
In this illustration, the estimated expenses incurred this period at the Fund level are $64.50.
Mutual Shares Securities Fund – Class 4
MS-7
Hypothetical Example for Comparison with Other Mutual Funds
Information in the second line (Hypothetical) of the table can help you compare ongoing expenses of the Fund with those of other mutual funds offered through the Contract. This information may not be used to estimate the actual ending account balance or expenses you incurred during the period. The hypothetical “Ending Account Value” is based on the Fund’s actual expense ratio and an assumed 5% annual rate of return before expenses, which does not represent the Fund’s actual return. The figure under the heading “Fund-Level Expenses Incurred During Period” shows the hypothetical expenses your account would have incurred under this scenario. You can compare this figure with the 5% hypothetical examples that appear in shareholder reports of other funds offered through a Contract.
| | | | | | | | | | | | |
| Class 4 | | Beginning
Account
Value 7/1/13 | | | Ending
Account
Value 12/31/13 | | | Fund-Level
Expenses Incurred
During Period*
7/1/13–12/31/13 | |
Actual | | $ | 1,000 | | | $ | 1,138.50 | | | $ | 5.66 | |
Hypothetical (5% return
before expenses) | | $ | 1,000 | | | $ | 1,019.91 | | | $ | 5.35 | |
*Expenses are calculated using the most recent six-month annualized expense ratio for the Fund’s Class 4 shares (1.05%), which does not include any ongoing expenses of the Contract for which the Fund is an investment option, multiplied by the average account value over the period, multiplied by 184/365 to reflect the one-half year period.
MS-8
Franklin Templeton Variable Insurance Products Trust
Financial Highlights
Mutual Shares Securities Fund
| | | | | | | | | | | | | | | | | | | | |
| | | Year Ended December 31, | |
| Class 1 | | 2013 | | | 2012 | | | 2011 | | | 2010 | | | 2009 | |
| | | | |
Per share operating performance | | | | | | | | | | | | | | | | | | | | |
(for a share outstanding throughout the year) | | | | | | | | | | | | | | | | | | | | |
Net asset value, beginning of year | | $ | 17.45 | | | $ | 15.57 | | | $ | 16.14 | | | $ | 14.75 | | | $ | 11.92 | |
| | | | |
Income from investment operationsa: | | | | | | | | | | | | | | | | | | | | |
Net investment incomeb | | | 0.42 | | | | 0.35 | | | | 0.38 | c | | | 0.40 | d | | | 0.23 | e |
Net realized and unrealized gains (losses) | | | 4.52 | | | | 1.92 | | | | (0.53 | ) | | | 1.27 | | | | 2.89 | |
| | | | |
Total from investment operations | | | 4.94 | | | | 2.27 | | | | (0.15 | ) | | | 1.67 | | | | 3.12 | |
| | | | |
Less distributions from net investment income | | | (0.47 | ) | | | (0.39 | ) | | | (0.42 | ) | | | (0.28 | ) | | | (0.29 | ) |
| | | | |
Net asset value, end of year | | $ | 21.92 | | | $ | 17.45 | | | $ | 15.57 | | | $ | 16.14 | | | $ | 14.75 | |
| | | | |
| | | | | |
Total returnf | | | 28.53% | | | | 14.61% | | | | (0.79)% | | | | 11.47% | | | | 26.35% | |
Ratios to average net assets | | | | | | | | | | | | | | | | | | | | |
Expensesg | | | 0.71% | h | | | 0.71% | | | | 0.73% | h | | | 0.74% | h | | | 0.78% | h |
Expenses incurred in connection with securities sold short | | | —% | i | | | —% | i | | | —% | i | | | 0.02% | | | | 0.06% | |
Net investment income | | | 2.08% | | | | 2.06% | | | | 2.28% | c | | | 2.66% | d | | | 1.85% | e |
| | | | | |
Supplemental data | | | | | | | | | | | | | | | | | | | | |
Net assets, end of year (000’s) | | $ | 552,163 | | | $ | 449,343 | | | $ | 1,170,781 | | | $ | 1,301,520 | | | $ | 767,553 | |
Portfolio turnover rate | | | 24.05% | | | | 34.07% | j | | | 41.02% | | | | 32.05% | | | | 49.33% | |
aThe amount shown for a share outstanding throughout the period may not correlate with the Statement of Operations for the period due to the timing of sales and repurchases of the Fund shares in relation to income earned and/or fluctuating market value of the investments of the Fund.
bBased on average daily shares outstanding.
cNet investment income per share includes approximately $0.02 per share related to interest income received that had previously been deemed uncollectible. Excluding this amount, the ratio of net investment income to average net assets would have been 2.14%.
dNet investment income per share includes approximately $0.11 per share received in the form of a special dividend paid in connection with a corporate real estate investment trust (REIT) conversion. Excluding this non-recurring amount, the ratio of the net investment income to average net assets would have been 1.93%.
eNet investment income per share includes approximately $(0.03) per share related to an adjustment for uncollectible interest. Excluding the effect of this adjustment, the ratio of net investment income to average net assets would have been 2.08%.
fTotal return does not include fees, charges or expenses imposed by the variable annuity and life insurance contracts for which the Franklin Templeton Variable Insurance Products Trust serves as an underlying investment vehicle.
gIncludes dividend or interest expense on securities sold short and security borrowing fees, if any. See below for the ratios of such expenses to average net assets for the periods presented. See Note 1(d).
hBenefit of expense reduction rounds to less than 0.01%.
iRounds to less than 0.01%.
jExcludes the value of portfolio securities delivered as a result of redemption in-kind.
The accompanying notes are an integral part of these financial statements.
MS-9
Franklin Templeton Variable Insurance Products Trust
Financial Highlights (continued)
Mutual Shares Securities Fund
| | | | | | | | | | | | | | | | | | | | |
| | | Year Ended December 31, | |
| Class 2 | | 2013 | | | 2012 | | | 2011 | | | 2010 | | | 2009 | |
| | | | |
Per share operating performance | | | | | | | | | | | | | | | | | | | | |
(for a share outstanding throughout the year) | | | | | | | | | | | | | | | | | | | | |
Net asset value, beginning of year | | $ | 17.23 | | | $ | 15.38 | | | $ | 15.95 | | | $ | 14.58 | | | $ | 11.78 | |
| | | | |
Income from investment operationsa: | | | | | | | | | | | | | | | | | | | | |
Net investment incomeb | | | 0.36 | | | | 0.30 | | | | 0.32 | c | | | 0.36 | d | | | 0.20 | e |
Net realized and unrealized gains (losses) | | | 4.46 | | | | 1.90 | | | | (0.51 | ) | | | 1.25 | | | | 2.85 | |
| | | | |
Total from investment operations | | | 4.82 | | | | 2.20 | | | | (0.19 | ) | | | 1.61 | | | | 3.05 | |
| | | | |
Less distributions from net investment income | | | (0.42 | ) | | | (0.35 | ) | | | (0.38 | ) | | | (0.24 | ) | | | (0.25 | ) |
| | | | |
Net asset value, end of year | | $ | 21.63 | | | $ | 17.23 | | | $ | 15.38 | | | $ | 15.95 | | | $ | 14.58 | |
| | | | |
| | | | | |
Total returnf | | | 28.26% | | | | 14.24% | | | | (1.04)% | | | | 11.19% | | | | 26.05% | |
Ratios to average net assets | | | | | | | | | | | | | | | | | | | | |
Expensesg | | | 0.96% | h | | | 0.96% | | | | 0.98% | h | | | 0.99% | h | | | 1.03% | h |
Expenses incurred in connection with securities sold short | | | —% | i | | | —% | i | | | —% | i | | | 0.02% | | | | 0.06% | |
Net investment income | | | 1.83% | | | | 1.81% | | | | 2.03% | c | | | 2.41% | d | | | 1.60% | e |
| | | | | |
Supplemental data | | | | | | | | | | | | | | | | | | | | |
Net assets, end of year (000’s) | | $ | 4,558,547 | | | $ | 4,069,803 | | | $ | 3,913,220 | | | $ | 4,188,821 | | | $ | 3,953,435 | |
Portfolio turnover rate | | | 24.05% | | | | 34.07% | j | | | 41.02% | | | | 32.05% | | | | 49.33% | |
aThe amount shown for a share outstanding throughout the period may not correlate with the Statement of Operations for the period due to the timing of sales and repurchases of the Fund shares in relation to income earned and/or fluctuating market value of the investments of the Fund.
bBased on average daily shares outstanding.
cNet investment income per share includes approximately $0.02 per share related to interest income received that had previously been deemed uncollectible. Excluding this amount, the ratio of net investment income to average net assets would have been 1.89%.
dNet investment income per share includes approximately $0.11 per share received in the form of a special dividend paid in connection with a corporate REIT conversion. Excluding this non-recurring amount, the ratio of the net investment income to average net assets would have been 1.68%.
eNet investment income per share includes approximately $(0.03) per share related to an adjustment for uncollectible interest. Excluding the effect of this adjustment, the ratio of net investment income to average net assets would have been 1.83%.
fTotal return does not include fees, charges or expenses imposed by the variable annuity and life insurance contracts for which the Franklin Templeton Variable Insurance Products Trust serves as an underlying investment vehicle.
gIncludes dividend or interest expense on securities sold short and security borrowing fees, if any. See below for the ratios of such expenses to average net assets for the periods presented. See Note 1(d).
hBenefit of expense reduction rounds to less than 0.01%.
iRounds to less than 0.01%.
jExcludes the value of portfolio securities delivered as a result of redemption in-kind.
The accompanying notes are an integral part of these financial statements.
MS-10
Franklin Templeton Variable Insurance Products Trust
Financial Highlights (continued)
Mutual Shares Securities Fund
| | | | | | | | | | | | | | | | | | | | |
| | | Year Ended December 31, | |
| Class 4 | | 2013 | | | 2012 | | | 2011 | | | 2010 | | | 2009 | |
| | | | |
Per share operating performance | | | | | | | | | | | | | | | | | | | | |
(for a share outstanding throughout the year) | | | | | | | | | | | | | | | | | | | | |
Net asset value, beginning of year | | $ | 17.31 | | | $ | 15.45 | | | $ | 16.03 | | | $ | 14.66 | | | $ | 11.88 | |
| | | | |
Income from investment operationsa: | | | | | | | | | | | | | | | | | | | | |
Net investment incomeb | | | 0.34 | | | | 0.28 | | | | 0.30 | c | | | 0.35 | d | | | 0.19 | e |
Net realized and unrealized gains (losses) | | | 4.49 | | | | 1.91 | | | | (0.51 | ) | | | 1.26 | | | | 2.87 | |
| | | | |
Total from investment operations | | | 4.83 | | | | 2.19 | | | | (0.21 | ) | | | 1.61 | | | | 3.06 | |
| | | | |
Less distributions from net investment income | | | (0.40 | ) | | | (0.33 | ) | | | (0.37 | ) | | | (0.24 | ) | | | (0.28 | ) |
| | | | |
Net asset value, end of year | | $ | 21.74 | | | $ | 17.31 | | | $ | 15.45 | | | $ | 16.03 | | | $ | 14.66 | |
| | | | |
| | | | | |
Total returnf | | | 28.05% | | | | 14.20% | | | | (1.12)% | | | | 11.06% | | | | 25.94% | |
Ratios to average net assets | | | | | | | | | | | | | | | | | | | | |
Expensesg | | | 1.06% | h | | | 1.06% | | | | 1.08% | h | | | 1.09% | h | | | 1.13% | h |
Expenses incurred in connection with securities sold short | | | —% | i | | | —% | i | | | —% | i | | | 0.02% | | | | 0.06% | |
Net investment income | | | 1.73% | | | | 1.71% | | | | 1.93% | c | | | 2.31% | d | | | 1.50% | e |
| | | | | |
Supplemental data | | | | | | | | | | | | | | | | | | | | |
Net assets, end of year (000’s) | | $ | 188,153 | | | $ | 165,015 | | | $ | 162,049 | | | $ | 167,274 | | | $ | 141,446 | |
Portfolio turnover rate | | | 24.05% | | | | 34.07% | j | | | 41.02% | | | | 32.05% | �� | | | 49.33% | |
aThe amount shown for a share outstanding throughout the period may not correlate with the Statement of Operations for the period due to the timing of sales and repurchases of the Fund shares in relation to income earned and/or fluctuating market value of the investments of the Fund.
bBased on average daily shares outstanding.
cNet investment income per share includes approximately $0.02 per share related to interest income received that had previously been deemed uncollectible. Excluding this amount, the ratio of net investment income to average net assets would have been 1.79%.
dNet investment income per share includes approximately $0.11 per share received in the form of a special dividend paid in connection with a corporate REIT conversion. Excluding this non-recurring amount, the ratio of the net investment income to average net assets would have been 1.58%.
eNet investment income per share includes approximately $(0.03) per share related to an adjustment for uncollectible interest. Excluding the effect of this adjustment, the ratio of net investment income to average net assets would have been 1.73%.
fTotal return does not include fees, charges or expenses imposed by the variable annuity and life insurance contracts for which the Franklin Templeton Variable Insurance Products Trust serves as an underlying investment vehicle.
gIncludes dividend or interest expense on securities sold short and security borrowing fees, if any. See below for the ratios of such expenses to average net assets for the periods presented. See Note 1(d).
hBenefit of expense reduction rounds to less than 0.01%.
iRounds to less than 0.01%.
jExcludes the value of portfolio securities delivered as a result of redemption in-kind.
The accompanying notes are an integral part of these financial statements.
MS-11
Franklin Templeton Variable Insurance Products Trust
Statement of Investments, December 31, 2013
| | | | | | | | | | |
| Mutual Shares Securities Fund | | Country | | Shares | | | Value | |
Common Stocks and Other Equity Interests 87.7% | | | | | | | | | | |
Aerospace & Defense 1.2% | | | | | | | | | | |
Huntington Ingalls Industries Inc. | | United States | | | 693,088 | | | $ | 62,384,851 | |
| | | | | | | | | | |
Auto Components 0.2% | | | | | | | | | | |
a,b International Automotive Components Group Brazil LLC | | Brazil | | | 1,730,515 | | | | 337,139 | |
a,b,c International Automotive Components Group North America, LLC | | United States | | | 15,382,424 | | | | 8,703,683 | |
| | | | | | | | | | |
| | | | | | | | | 9,040,822 | |
| | | | | | | | | | |
Automobiles 1.2% | | | | | | | | | | |
aGeneral Motors Co. | | United States | | | 1,508,060 | | | | 61,634,412 | |
| | | | | | | | | | |
Beverages 1.7% | | | | | | | | | | |
Coca-Cola Enterprises Inc. | | United Kingdom | | | 893,011 | | | | 39,408,575 | |
Dr. Pepper Snapple Group Inc. | | United States | | | 629,704 | | | | 30,679,179 | |
Pernod Ricard SA | | France | | | 163,635 | | | | 18,638,869 | |
| | | | | | | | | | |
| | | | | | | | | 88,726,623 | |
| | | | | | | | | | |
Capital Markets 0.6% | | | | | | | | | | |
aChina Cinda Asset Management Co. Ltd., H | | China | | | 2,400,861 | | | | 1,492,343 | |
Morgan Stanley | | United States | | | 955,408 | | | | 29,961,595 | |
| | | | | | | | | | |
| | | | | | | | | 31,453,938 | |
| | | | | | | | | | |
Chemicals 0.0% | | | | | | | | | | |
a,d,e Dow Corning Corp., Contingent Distribution | | United States | | | 100,000 | | | | — | |
| | | | | | | | | | |
Commercial Banks 5.3% | | | | | | | | | | |
a,f Bond Street Holdings LLC, A, 144A | | United States | | | 493,723 | | | | 7,405,845 | |
CIT Group Inc. | | United States | | | 717,853 | | | | 37,421,677 | |
Columbia Banking System Inc. | | United States | | | 163,162 | | | | 4,488,586 | |
a,b First Southern Bancorp Inc. | | United States | | | 140,952 | | | | 679,417 | |
Guaranty Bancorp | | United States | | | 209,583 | | | | 2,944,641 | |
KB Financial Group Inc. | | South Korea | | | 809,531 | | | | 32,397,343 | |
PNC Financial Services Group Inc. | | United States | | | 1,137,209 | | | | 88,224,674 | |
Societe Generale | | France | | | 424,812 | | | | 24,670,365 | |
State Bank Financial Corp. | | United States | | | 352,200 | | | | 6,406,518 | |
SunTrust Banks Inc. | | United States | | | 1,233,522 | | | | 45,405,945 | |
Wells Fargo & Co. | | United States | | | 708,330 | | | | 32,158,182 | |
| | | | | | | | | | |
| | | | | | | | | 282,203,193 | |
| | | | | | | | | | |
Communications Equipment 1.1% | | | | | | | | | | |
Cisco Systems Inc. | | United States | | | 2,714,540 | | | | 60,941,423 | |
| | | | | | | | | | |
Computers & Peripherals 3.2% | | | | | | | | | | |
Apple Inc. | | United States | | | 219,930 | | | | 123,404,923 | |
Hewlett-Packard Co. | | United States | | | 1,720,337 | | | | 48,135,029 | |
| | | | | | | | | | |
| | | | | | | | | 171,539,952 | |
| | | | | | | | | | |
Consumer Finance 0.0%† | | | | | | | | | | |
aComdisco Holding Co. Inc. | | United States | | | 180 | | | | 972 | |
| | | | | | | | | | |
Containers & Packaging 0.7% | | | | | | | | | | |
MeadWestvaco Corp. | | United States | | | 1,092,772 | | | | 40,356,070 | |
| | | | | | | | | | |
Diversified Financial Services 3.9% | | | | | | | | | | |
Citigroup Inc. | | United States | | | 1,120,389 | | | | 58,383,471 | |
Deutsche Boerse AG | | Germany | | | 383,353 | | | | 31,743,581 | |
aING Groep NV, IDR | | Netherlands | | | 3,463,355 | | | | 48,114,830 | |
JPMorgan Chase & Co. | | United States | | | 1,186,260 | | | | 69,372,485 | |
| | | | | | | | | | |
| | | | | | | | | 207,614,367 | |
| | | | | | | | | | |
MS-12
Franklin Templeton Variable Insurance Products Trust
Statement of Investments, December 31, 2013 (continued)
| | | | | | | | | | |
| Mutual Shares Securities Fund | | Country | | Shares | | | Value | |
Common Stocks and Other Equity Interests (continued) | | | | | | | | | | |
Diversified Telecommunication Services 0.0% | | | | | | | | | | |
a,d,e Global Crossing Holdings Ltd., Contingent Distribution | | United States | | | 9,005,048 | | | $ | — | |
| | | | | | | | | | |
Electric Utilities 0.9% | | | | | | | | | | |
Entergy Corp. | | United States | | | 291,000 | | | | 18,411,570 | |
Exelon Corp. | | United States | | | 1,008,329 | | | | 27,618,131 | |
| | | | | | | | | | |
| | | | | | | | | 46,029,701 | |
| | | | | | | | | | |
Electronic Equipment, Instruments & Components 0.5% | | | | | | | | | | |
TE Connectivity Ltd. | | United States | | | 516,772 | | | | 28,479,305 | |
| | | | | | | | | | |
Energy Equipment & Services 2.5% | | | | | | | | | | |
Baker Hughes Inc. | | United States | | | 1,084,998 | | | | 59,956,989 | |
Ensco PLC, A | | United States | | | 364,874 | | | | 20,863,495 | |
Transocean Ltd. | | United States | | | 1,011,287 | | | | 49,977,804 | |
| | | | | | | | | | |
| | | | | | | | | 130,798,288 | |
| | | | | | | | | | |
Food & Staples Retailing 5.3% | | | | | | | | | | |
CVS Caremark Corp. | | United States | | | 1,287,093 | | | | 92,117,246 | |
The Kroger Co. | | United States | | | 1,964,742 | | | | 77,666,251 | |
Tesco PLC | | United Kingdom | | | 9,238,863 | | | | 51,162,455 | |
Walgreen Co. | | United States | | | 1,009,955 | | | | 58,011,815 | |
| | | | | | | | | | |
| | | | | | | | | 278,957,767 | |
| | | | | | | | | | |
Health Care Equipment & Supplies 2.4% | | | | | | | | | | |
Medtronic Inc. | | United States | | | 1,792,402 | | | | 102,865,951 | |
Stryker Corp. | | United States | | | 298,778 | | | | 22,450,179 | |
| | | | | | | | | | |
| | | | | | | | | 125,316,130 | |
| | | | | | | | | | |
Health Care Providers & Services 2.7% | | | | | | | | | | |
Cigna Corp. | | United States | | | 1,137,324 | | | | 99,493,104 | |
UnitedHealth Group Inc. | | United States | | | 57,328 | | | | 4,316,798 | |
WellPoint Inc. | | United States | | | 426,624 | | | | 39,415,791 | |
| | | | | | | | | | |
| | | | | | | | | 143,225,693 | |
| | | | | | | | | | |
Independent Power Producers & Energy Traders 0.8% | | | | | | | | | | |
NRG Energy Inc. | | United States | | | 1,462,424 | | | | 42,000,817 | |
| | | | | | | | | | |
Insurance 8.4% | | | | | | | | | | |
ACE Ltd. | | United States | | | 799,175 | | | | 82,738,588 | |
Aegon NV | | Netherlands | | | 4,289,414 | | | | 40,486,408 | |
aAlleghany Corp. | | United States | | | 124,988 | | | | 49,990,200 | |
American International Group Inc. | | United States | | | 2,211,866 | | | | 112,915,759 | |
MetLife Inc. | | United States | | | 982,953 | | | | 53,000,826 | |
a,b Olympus Re Holdings Ltd. | | United States | | | 16,280 | | | | — | |
White Mountains Insurance Group Ltd. | | United States | | | 114,635 | | | | 69,134,076 | |
Zurich Insurance Group AG | | Switzerland | | | 120,520 | | | | 34,924,522 | |
| | | | | | | | | | |
| | | | | | | | | 443,190,379 | |
| | | | | | | | | | |
Machinery 2.0% | | | | | | | | | | |
Caterpillar Inc. | | United States | | | 362,996 | | | | 32,963,667 | |
aCNH Industrial NV, special voting (EUR Traded) | | Netherlands | | | 1,844,814 | | | | 21,023,531 | |
aCNH Industrial NV (EUR Traded) | | Netherlands | | | 1,378,290 | | | | 15,707,016 | |
aFederal Signal Corp. | | United States | | | 757,221 | | | | 11,093,288 | |
Stanley Black & Decker Inc. | | United States | | | 321,044 | | | | 25,905,040 | |
| | | | | | | | | | |
| | | | | | | | | 106,692,542 | |
| | | | | | | | | | |
MS-13
Franklin Templeton Variable Insurance Products Trust
Statement of Investments, December 31, 2013 (continued)
| | | | | | | | | | |
| Mutual Shares Securities Fund | | Country | | Shares | | | Value | |
Common Stocks and Other Equity Interests (continued) | | | | | | | | | | |
Marine 1.4% | | | | | | | | | | |
A.P. Moeller-Maersk AS, B | | Denmark | | | 6,716 | | | $ | 72,873,479 | |
| | | | | | | | | | |
Media 6.8% | | | | | | | | | | |
British Sky Broadcasting Group PLC | | United Kingdom | | | 369,722 | | | | 5,168,690 | |
CBS Corp., B | | United States | | | 871,847 | | | | 55,571,528 | |
Comcast Corp., Special A | | United States | | | 278,448 | | | | 13,888,986 | |
Reed Elsevier PLC | | United Kingdom | | | 5,432,460 | | | | 80,848,050 | |
Time Warner Cable Inc. | | United States | | | 502,786 | | | | 68,127,503 | |
aTribune Co., A | | United States | | | 303,318 | | | | 23,476,813 | |
aTribune Co., B | | United States | | | 185,976 | | | | 14,338,750 | |
Twenty-First Century Fox Inc., B | | United States | | | 2,816,309 | | | | 97,444,291 | |
| | | | | | | | | | |
| | | | | | | | | 358,864,611 | |
| | | | | | | | | | |
Metals & Mining 2.8% | | | | | | | | | | |
Anglo American PLC | | United Kingdom | | | 1,378,690 | | | | 30,140,948 | |
Freeport-McMoRan Copper & Gold Inc., B | | United States | | | 2,113,606 | | | | 79,767,490 | |
aThyssenKrupp AG | | Germany | | | 1,522,235 | | | | 37,039,926 | |
| | | | | | | | | | |
| | | | | | | | | 146,948,364 | |
| | | | | | | | | | |
Multi-Utilities 0.5% | | | | | | | | | | |
GDF Suez | | France | | | 1,121,503 | | | | 26,371,214 | |
| | | | | | | | | | |
Multiline Retail 0.8% | | | | | | | | | | |
Kohl’s Corp. | | United States | | | 734,130 | | | | 41,661,878 | |
| | | | | | | | | | |
Office Electronics 1.4% | | | | | | | | | | |
Xerox Corp. | | United States | | | 6,323,724 | | | | 76,959,721 | |
| | | | | | | | | | |
Oil, Gas & Consumable Fuels 8.9% | | | | | | | | | | |
Apache Corp. | | United States | | | 946,870 | | | | 81,374,008 | |
BG Group PLC | | United Kingdom | | | 2,026,347 | | | | 43,545,067 | |
BP PLC | | United Kingdom | | | 5,114,242 | | | | 41,339,829 | |
CONSOL Energy Inc. | | United States | | | 1,287,570 | | | | 48,979,163 | |
Marathon Oil Corp. | | United States | | | 2,289,358 | | | | 80,814,338 | |
Murphy Oil Corp. | | United States | | | 543,830 | | | | 35,283,690 | |
Petroleo Brasileiro SA, ADR | | Brazil | | | 1,541,270 | | | | 21,238,701 | |
Royal Dutch Shell PLC, A | | United Kingdom | | | 2,375,753 | | | | 84,653,604 | |
Talisman Energy Inc. (CAD Traded) | | Canada | | | 202,643 | | | | 2,356,203 | |
Talisman Energy Inc. (USD Traded) | | Canada | | | 2,303,599 | | | | 26,836,928 | |
aWPX Energy Inc. | | United States | | | 378,074 | | | | 7,705,148 | |
| | | | | | | | | | |
| | | | | | | | | 474,126,679 | |
| | | | | | | | | | |
Paper & Forest Products 1.7% | | | | | | | | | | |
Domtar Corp. | | United States | | | 194,469 | | | | 18,346,206 | |
International Paper Co. | | United States | | | 1,454,146 | | | | 71,296,778 | |
| | | | | | | | | | |
| | | | | | | | | 89,642,984 | |
| | | | | | | | | | |
Personal Products 0.7% | | | | | | | | | | |
Avon Products Inc. | | United States | | | 2,144,712 | | | | 36,931,941 | |
| | | | | | | | | | |
Pharmaceuticals 5.4% | | | | | | | | | | |
Eli Lilly & Co. | | United States | | | 624,078 | | | | 31,827,978 | |
aHospira Inc. | | United States | | | 587,508 | | | | 24,252,330 | |
Merck & Co. Inc. | | United States | | | 2,960,158 | | | | 148,155,908 | |
Teva Pharmaceutical Industries Ltd., ADR | | Israel | | | 2,042,367 | | | | 81,858,069 | |
| | | | | | | | | | |
| | | | | | | | | 286,094,285 | |
| | | | | | | | | | |
MS-14
Franklin Templeton Variable Insurance Products Trust
Statement of Investments, December 31, 2013 (continued)
| | | | | | | | | | |
| Mutual Shares Securities Fund | | Country | | Shares | | | Value | |
Common Stocks and Other Equity Interests (continued) | |
Real Estate Investment Trusts (REITs) 0.2% | | | | | | | | | | |
Alexander’s Inc. | | United States | | | 40,126 | | | $ | 13,241,580 | |
| | | | | | | | | | |
Real Estate Management & Development 0.5% | | | | | | | | | | |
Brookfield Office Properties Inc. | | United States | | | 667,524 | | | | 12,849,837 | |
eCanary Wharf Group PLC | | United Kingdom | | | 1,535,898 | | | | 7,937,467 | |
aForestar Group Inc. | | United States | | | 261,053 | | | | 5,552,597 | |
| | | | | | | | | | |
| | | | | | | | | 26,339,901 | |
| | | | | | | | | | |
Semiconductors & Semiconductor Equipment 0.7% | | | | | | | | | | |
Samsung Electronics Co. Ltd. | | South Korea | | | 30,351 | | | | 39,443,579 | |
| | | | | | | | | | |
Software 3.8% | | | | | | | | | | |
Microsoft Corp. | | United States | | | 3,643,207 | | | | 136,365,238 | |
Symantec Corp. | | United States | | | 2,715,717 | | | | 64,036,607 | |
| | | | | | | | | | |
| | | | | | | | | 200,401,845 | |
| | | | | | | | | | |
Tobacco 5.1% | | | | | | | | | | |
Altria Group Inc. | | United States | | | 1,312,068 | | | | 50,370,290 | |
British American Tobacco PLC | | United Kingdom | | | 1,614,717 | | | | 86,551,226 | |
Imperial Tobacco Group PLC | | United Kingdom | | | 1,271,537 | | | | 49,216,954 | |
Lorillard Inc. | | United States | | | 1,129,533 | | | | 57,244,732 | |
Philip Morris International Inc. | | United States | | | 315,520 | | | | 27,491,258 | |
| | | | | | | | | | |
| | | | | | | | | 270,874,460 | |
| | | | | | | | | | |
Wireless Telecommunication Services 2.4% | | | | | | | | | | |
Vodafone Group PLC | | United Kingdom | | | 32,091,085 | | | | 125,980,773 | |
| | | | | | | | | | |
Total Common Stocks and Other Equity Interests
(Cost $3,304,424,361) | | | | | | | | | 4,647,344,539 | |
| | | | | | | | | | |
Convertible Preferred Stocks (Cost $241,000) 0.0%† | | | | | | | | | | |
Commercial Banks 0.0%† | | | | | | | | | | |
a,b First Southern Bancorp Inc., cvt. pfd., C | | United States | | | 241 | | | | 449,909 | |
| | | | | | | | | | |
| | | |
| | | | | Principal
Amount* | | | | |
Corporate Bonds, Notes and Senior Floating Rate Interests 6.1% | | | | | | | | | | |
fAmerican Airlines Inc., senior secured note, 144A, 7.50%, 3/15/16 | | United States | | | 30,836,000 | | | | 32,146,530 | |
Avaya Inc., | | | | | | | | | | |
fsenior note, 144A, 10.50%, 3/01/21 | | United States | | | 18,403,000 | | | | 17,850,910 | |
fsenior secured note, 144A, 7.00%, 4/01/19 | | United States | | | 12,923,000 | | | | 12,729,155 | |
g,h Tranche B-3 Term Loan, 4.736%, 10/26/17 | | United States | | | 19,636,899 | | | | 19,203,258 | |
g,h Tranche B-5 Term Loan, 8.00%, 3/31/18 | | United States | | | 4,789,076 | | | | 4,857,919 | |
g,h Caesars Entertainment Operating Co. Inc., Senior Tranche Term Loan, | | | | | | | | | | |
B5, first lien, 4.488%, 1/28/18 | | United States | | | 3,440,000 | | | | 3,247,934 | |
B6, first lien, 5.488%, 1/28/18 | | United States | | | 16,401,000 | | | | 15,692,378 | |
Clear Channel Communications Inc., | | | | | | | | | | |
senior secured note, first lien, 9.00%, 12/15/19 | | United States | | | 26,449,000 | | | | 27,110,225 | |
g,h Tranche B Term Loan, 3.819%, 1/29/16 | | United States | | | 537,126 | | | | 521,751 | |
g,h Tranche C Term Loan, 3.819%, 1/29/16 | | United States | | | 64,409 | | | | 61,813 | |
g,h Tranche D Term Loan, 6.919%, 1/30/19 | | United States | | | 34,746,619 | | | | 33,269,888 | |
g,h Tranche E Term Loan, 7.669%, 7/30/19 | | United States | | | 11,168,253 | | | | 11,028,650 | |
g,h JC Penney Corp. Inc., Term Loan, 6.00%, 5/22/18 | | United States | | | 22,142,411 | | | | 21,665,729 | |
MS-15
Franklin Templeton Variable Insurance Products Trust
Statement of Investments, December 31, 2013 (continued)
| | | | | | | | | | |
| Mutual Shares Securities Fund | | Country | | Principal
Amount* | | | Value | |
Corporate Bonds, Notes and Senior Floating Rate Interests (continued) | |
NGPL PipeCo LLC, | | | | | | | | | | |
fsecured note, 144A, 7.119%, 12/15/17 | | United States | | | 9,756,000 | | | $ | 8,877,960 | |
f,i senior secured note, 144A, 9.625%, 6/01/19 | | United States | | | 14,481,000 | | | | 14,227,583 | |
g,h Term Loan B, 6.75%, 9/15/17 | | United States | | | 860,063 | | | | 804,428 | |
g,h Texas Competitive Electric Holdings Co. LLC, Extended Term Loan, 4.668%, 10/10/17 | | United States | | | 90,618,405 | | | | 62,594,663 | |
Texas Competitive Electric Holdings Co. LLC/Texas Competitive Electric Holdings Finance Inc., | | | | | | | | | | |
senior note, A, 10.25%, 11/01/15 | | United States | | | 44,249,000 | | | | 3,097,430 | |
fsenior secured note, 144A, 11.50%, 10/01/20 | | United States | | | 39,308,000 | | | | 29,087,920 | |
fWind Acquisition Finance SA, | | | | | | | | | | |
senior secured note, 144A, 11.75%, 7/15/17 | | Italy | | | 1,256,000 | | | | 1,337,640 | |
third lien, 144A, 11.75%, 7/15/17 | | Italy | | | 2,930,000 | EUR | | | 4,292,662 | |
| | | | | | | | | | |
Total Corporate Bonds, Notes and Senior Floating Rate Interests
(Cost $340,980,061) | | | | | | | | | 323,706,426 | |
| | | | | | | | | | |
Corporate Bonds and Notes in Reorganization 0.3% | | | | | | | | | | |
b,j Broadband Ventures III LLC, secured promissory note, 5.00%, 2/01/12 | | United States | | | 1,754 | | | | — | |
g,j Cengage Learning Acquisitions Inc., FRN, 2.70%, 7/03/14 | | United States | | | 19,251,289 | | | | 15,112,262 | |
| | | | | | | | | | |
Total Corporate Bonds and Notes in Reorganization
(Cost $15,283,626) | | | | | | | | | 15,112,262 | |
| | | | | | | | | | |
| | | |
| | | | | Shares | | | | |
Companies in Liquidation 1.2% | | | | | | | | | | |
aAdelphia Recovery Trust | | United States | | | 29,283,354 | | | | 58,567 | |
a,d Adelphia Recovery Trust, Arahova Contingent Value Vehicle, Contingent Distribution | | United States | | | 1,955,453 | | | | 978 | |
a,b,c,k CB FIM Coinvestors LLC | | United States | | | 6,400,507 | | | | — | |
a,d,e Century Communications Corp., Contingent Distribution | | United States | | | 5,487,000 | | | | — | |
a,b FIM Coinvestor Holdings I, LLC | | United States | | | 8,006,950 | | | | — | |
a,l Lehman Brothers Holdings Inc., Bankruptcy Claim | | United States | | | 144,058,799 | | | | 64,826,459 | |
a,d,e Tribune Litigation Trust, Contingent Distribution | | United States | | | 393,761 | | | | — | |
a,d,e Tropicana Litigation Trust, Contingent Distribution | | United States | | | 18,305,000 | | | | — | |
| | | |
| | | | | Principal
Amount* | | | | |
e,j Peregrine Investments Holdings Ltd., 1/15/98 | | Hong Kong | | | 5,000,000 | JPY | | | — | |
e,j PIV Investment Finance (Cayman) Ltd., 12/01/00 | | Hong Kong | | | 12,200,000 | | | | — | |
| | | | | | | | | | |
Total Companies in Liquidation (Cost $66,366,158) | | | | | | | | | 64,886,004 | |
| | | | | | | | | | |
Total Investments before Short Term Investments
(Cost $3,727,295,206) | | | | | | | | | 5,051,499,140 | |
| | | | | | | | | | |
Short Term Investments 5.0% | | | | | | | | | | |
U.S. Government and Agency Securities (Cost $262,676,970) 4.9% | | | | | | | | | | |
m,n U.S. Treasury Bills, 1/02/14 - 6/26/14 | | United States | | | 262,700,000 | | | | 262,686,594 | |
| | | | | | | | | | |
Total Investments before Money Market Funds
(Cost $3,989,972,176) | | | | | | | | | 5,314,185,734 | |
| | | | | | | | | | |
MS-16
Franklin Templeton Variable Insurance Products Trust
Statement of Investments, December 31, 2013 (continued)
| | | | | | | | | | |
| Mutual Shares Securities Fund | | Country | | Shares | | | Value | |
Short Term Investments (continued) | | | | | | | | | | |
o Investments from Cash Collateral Received for Loaned Securities (Cost $2,731,040) 0.1% | | | | | | | | | | |
Money Market Funds 0.1% | | | | | | | | | | |
pBNY Mellon Overnight Government Fund, 0.017% | | United States | | | 2,731,040 | | | $ | 2,731,040 | |
| | | | | | | | | | |
Total Investments (Cost $3,992,703,216) 100.3% | | | | | | | | | 5,316,916,774 | |
Securities Sold Short (0.4)% | | | | | | | | | (22,077,374 | ) |
Other Assets, less Liabilities 0.1% | | | | | | | | | 4,023,282 | |
| | | | | | | | | | |
Net Assets 100.0% | | | | | | | | $ | 5,298,862,682 | |
| | | | | | | | | | |
qSecurities Sold Short (Proceeds $21,250,473) (0.4)% | | | | | | | | | | |
Common Stocks (0.4)% | | | | | | | | | | |
Diversified Telecommunication Services (0.4)% | | | | | | | | | | |
Verizon Communications Inc. | | United States | | | 449,275 | | | $ | (22,077,374 | ) |
| | | | | | | | | | |
†Rounds to less than 0.1% of net assets.
*The principal amount is stated in U.S. dollars unless otherwise indicated.
aNon-income producing.
bSee Note 8 regarding restricted securities.
cAt December 31, 2013, pursuant to the Fund’s policies and the requirements of applicable securities law, the Fund may be restricted from trading these securities for a limited or extended period of time due to ownership limits and/or potential possession of material non-public information.
dContingent distributions represent the right to receive additional distributions, if any, during the reorganization of the underlying company. Shares represent total underlying principal of debt securities.
eSecurity has been deemed illiquid because it may not be able to be sold within seven days. At December 31, 2013, the aggregate value of these securities was $7,937,467, representing 0.15% of net assets.
fSecurity was purchased pursuant to Rule 144A under the Securities Act of 1933 and may be sold in transactions exempt from registration only to qualified institutional buyers or in a public offering registered under the Securities Act of 1933. These securities have been deemed liquid under guidelines approved by the Trust’s Board of Trustees. At December 31, 2013, the aggregate value of these securities was $127,956,205, representing 2.41% of net assets.
gThe coupon rate shown represents the rate at period end.
hSee Note 1(f) regarding senior floating rate interests.
iA portion or all of the security is on loan at December 31, 2013. See Note 1(e).
jSee Note 7 regarding credit risk and defaulted securities.
kSee Note 10 regarding holdings of 5% voting securities.
lBankruptcy claims represent the right to receive distributions, if any, during the liquidation of the underlying pool of assets. Shares represent amount of allowed unsecured.
mThe security is traded on a discount basis with no stated coupon rate.
nSecurity or a portion of the security has been pledged as collateral for securities sold short, open futures, forward contracts. At December 31, 2013, the aggregate value of these securities and/or cash pledged as collateral was $49,032,229, representing 0.93% of net assets.
oSee Note 1(e) regarding securities on loan.
pThe rate shown is the annualized seven-day yield at period end.
qSee Note 1(e) regarding securities sold short.
MS-17
Franklin Templeton Variable Insurance Products Trust
Statement of Investments, December 31, 2013 (continued)
| | | | | | |
| Mutual Shares Securities Fund | | | | | | |
At December 31, 2013, the Fund had the following futures contracts outstanding. See Note 1(c).
Futures Contracts
| | | | | | | | | | | | | | | | | | | | | | | | |
| Description | | Type | | | Number of
Contracts | | | Notional
Value | | | Expiration
Date | | | Unrealized
Appreciation | | | Unrealized
Depreciation | |
Currency Contracts | | | | | | | | | | | | | | | | | | | | | | | | |
EUR/USD | | | Short | | | | 474 | | | $ | 81,693,900 | | | | 3/17/14 | | | $ | — | | | $ | (351,334 | ) |
GBP/USD | | | Short | | | | 957 | | | | 99,037,538 | | | | 3/17/14 | | | | — | | | | (921,355 | ) |
| | | | | | | | | | | | | | | | | | | | |
Net unrealized appreciation (depreciation) | | | | | | | | | | | | | | | | | | | | | | $ | (1,272,689 | ) |
| | | | | | | | | | | | | | | | | | | | | | | | |
At December 31, 2013, the Fund had the following forward exchange contracts outstanding. See Note 1(c).
Forward Exchange Contracts
| | | | | | | | | | | | | | | | | | | | | | | | | | | | |
| Currency | | Counterpartya | | | Type | | | Quantity | | | Contract
Amount | | | Settlement
Date | | | Unrealized
Appreciation | | | Unrealized
Depreciation | |
Euro | | | BBU | | | | Sell | | | | 18,143,601 | | | $ | 23,693,003 | | | | 1/17/14 | | | $ | — | | | $ | (1,263,313 | ) |
Euro | | | BOFA | | | | Sell | | | | 21,128,952 | | | | 27,728,755 | | | | 1/17/14 | | | | 397 | | | | (1,334,274 | ) |
Euro | | | BONY | | | | Sell | | | | 337,248 | | | | 462,037 | | | | 1/17/14 | | | | — | | | | (1,844 | ) |
Euro | | | DBAB | | | | Sell | | | | 1,271,513 | | | | 1,678,547 | | | | 1/17/14 | | | | — | | | | (70,405 | ) |
Euro | | | FBCO | | | | Sell | | | | 2,536,652 | | | | 3,385,762 | | | | 1/17/14 | | | | — | | | | (103,375 | ) |
Euro | | | HSBC | | | | Buy | | | | 125,000 | | | | 170,015 | | | | 1/17/14 | �� | | | 1,921 | | | | — | |
Euro | | | HSBC | | | | Sell | | | | 1,316,930 | | | | 1,800,794 | | | | 1/17/14 | | | | — | | | | (10,629 | ) |
Euro | | | SSBT | | | | Sell | | | | 393,401 | | | | 538,149 | | | | 1/17/14 | | | | — | | | | (2,970 | ) |
British Pound | | | BBU | | | | Sell | | | | 1,492,298 | | | | 2,412,792 | | | | 1/21/14 | | | | — | | | | (57,956 | ) |
British Pound | | | BOFA | | | | Sell | | | | 35,360,751 | | | | 53,962,198 | | | | 1/21/14 | | | | — | | | | (4,583,410 | ) |
British Pound | | | DBAB | | | | Sell | | | | 8,725,951 | | | | 13,246,866 | | | | 1/21/14 | | | | — | | | | (1,200,398 | ) |
British Pound | | | FBCO | | | | Sell | | | | 6,955,419 | | | | 11,152,900 | | | | 1/21/14 | | | | — | | | | (362,953 | ) |
British Pound | | | HSBC | | | | Sell | | | | 2,362,082 | | | | 3,786,290 | | | | 1/21/14 | | | | — | | | | (124,529 | ) |
British Pound | | | SSBT | | | | Sell | | | | 916,576 | | | | 1,466,050 | | | | 1/21/14 | | | | — | | | | (51,494 | ) |
South Korean Won | | | BOFA | | | | Buy | | | | 1,621,025,976 | | | | 1,517,930 | | | | 2/12/14 | | | | 13,139 | | | | — | |
South Korean Won | | | BOFA | | | | Sell | | | | 14,695,766,498 | | | | 13,080,039 | | | | 2/12/14 | | | | — | | | | (800,194 | ) |
South Korean Won | | | DBAB | | | | Sell | | | | 22,096,007,739 | | | | 19,670,823 | | | | 2/12/14 | | | | — | | | | (1,198,979 | ) |
South Korean Won | | | FBCO | | | | Buy | | | | 303,854,000 | | | | 280,412 | | | | 2/12/14 | | | | 6,580 | | | | — | |
South Korean Won | | | FBCO | | | | Sell | | | | 30,427,525,553 | | | | 27,275,589 | | | | 2/12/14 | | | | — | | | | (1,463,378 | ) |
South Korean Won | | | HSBC | | | | Buy | | | | 4,930,420,831 | | | | 4,603,234 | | | | 2/12/14 | | | | 55,480 | | | | (1,903 | ) |
South Korean Won | | | HSBC | | | | Sell | | | | 14,248,226,851 | | | | 12,851,791 | | | | 2/12/14 | | | | — | | | | (605,739 | ) |
British Pound | | | BBU | | | | Buy | | | | 1,250,202 | | | | 2,024,341 | | | | 2/19/14 | | | | 45,167 | | | | — | |
British Pound | | | BBU | | | | Sell | | | | 20,499,252 | | | | 31,953,162 | | | | 2/19/14 | | | | — | | | | (1,980,051 | ) |
British Pound | | | BOFA | | | | Buy | | | | 1,717,529 | | | | 2,772,486 | | | | 2/19/14 | | | | 70,607 | | | | — | |
British Pound | | | BOFA | | | | Sell | | | | 39,469,601 | | | | 61,388,670 | | | | 2/19/14 | | | | — | | | | (3,946,904 | ) |
British Pound | | | FBCO | | | | Sell | | | | 1,940,964 | | | | 3,051,458 | | | | 2/19/14 | | | | — | | | | (161,496 | ) |
British Pound | | | HSBC | | | | Sell | | | | 3,000,726 | | | | 4,682,406 | | | | 2/19/14 | | | | — | | | | (284,813 | ) |
British Pound | | | SSBT | | | | Sell | | | | 1,253,062 | | | | 1,984,924 | | | | 2/19/14 | | | | — | | | | (89,319 | ) |
Euro | | | BBU | | | | Sell | | | | 11,718,955 | | | | 15,614,043 | | | | 2/28/14 | | | | — | | | | (505,371 | ) |
Euro | | | BOFA | | | | Sell | | | | 3,726,675 | | | | 4,981,771 | | | | 2/28/14 | | | | — | | | | (144,268 | ) |
Euro | | | BONY | | | | Sell | | | | 191,928 | | | | 252,417 | | | | 2/28/14 | | | | — | | | | (11,580 | ) |
Euro | | | FBCO | | | | Sell | | | | 4,593,952 | | | | 6,142,493 | | | | 2/28/14 | | | | — | | | | (176,484 | ) |
Euro | | | HSBC | | | | Sell | | | | 15,105,018 | | | | 20,188,796 | | | | 2/28/14 | | | | — | | | | (588,146 | ) |
Euro | | | SSBT | | | | Sell | | | | 2,148,825 | | | | 2,892,862 | | | | 2/28/14 | | | | — | | | | (62,845 | ) |
Euro | | | SSBT | | | | Sell | | | | 487,709 | | | | 654,098 | | | | 2/28/14 | | | | — | | | | (16,746 | ) |
Euro | | | BBU | | | | Buy | | | | 1,244,224 | | | | 1,710,034 | | | | 4/16/14 | | | | 1,394 | | | | — | |
Euro | | | BBU | | | | Sell | | | | 1,638,747 | | | | 2,228,213 | | | | 4/16/14 | | | | — | | | | (25,881 | ) |
Euro | | | BOFA | | | | Buy | | | | 1,217,972 | | | | 1,674,679 | | | | 4/16/14 | | | | 1,283 | | | | (644 | ) |
Euro | | | BOFA | | | | Sell | | | | 1,489,099 | | | | 2,023,872 | | | | 4/16/14 | | | | — | | | | (24,382 | ) |
MS-18
Franklin Templeton Variable Insurance Products Trust
Statement of Investments, December 31, 2013 (continued)
| | | | | | |
| Mutual Shares Securities Fund | | | | | | |
Forward Exchange Contracts (continued)
| | | | | | | | | | | | | | | | | | | | | | | | | | | | |
| Currency | | Counterpartya | | | Type | | | Quantity | | | Contract
Amount | | | Settlement
Date | | | Unrealized
Appreciation | | | Unrealized
Depreciation | |
Euro | | | BONY | | | | Buy | | | | 603,108 | | | $ | 829,943 | | | | 4/16/14 | | | $ | — | | | $ | (369 | ) |
Euro | | | BONY | | | | Sell | | | | 328,468 | | | | 449,653 | | | | 4/16/14 | | | | — | | | | (2,155 | ) |
Euro | | | FBCO | | | | Sell | | | | 1,222,232 | | | | 1,669,091 | | | | 4/16/14 | | | | — | | | | (12,087 | ) |
Euro | | | HSBC | | | | Buy | | | | 1,466,688 | | | | 2,013,675 | | | | 4/16/14 | | | | 4,757 | | | | (1,005 | ) |
Euro | | | HSBC | | | | Sell | | | | 1,724,164 | | | | 2,349,884 | | | | 4/16/14 | | | | 42 | | | | (21,743 | ) |
Euro | | | SSBT | | | | Buy | | | | 839,677 | | | | 1,154,514 | | | | 4/16/14 | | | | 981 | | | | (521 | ) |
Euro | | | SSBT | | | | Sell | | | | 1,146,553 | | | | 1,558,606 | | | | 4/16/14 | | | | — | | | | (18,476 | ) |
Euro | | | SSBT | | | | Buy | | | | 535,554 | | | | 736,814 | | | | 4/16/14 | | | | 34 | | | | (194 | ) |
Euro | | | SSBT | | | | Sell | | | | 419,318 | | | | 573,874 | | | | 4/16/14 | | | | — | | | | (2,898 | ) |
British Pound | | | BBU | | | | Sell | | | | 110,040 | | | | 180,168 | | | | 4/22/14 | | | | — | | | | (1,895 | ) |
British Pound | | | BOFA | | | | Sell | | | | 14,514,118 | | | | 23,497,154 | | | | 4/22/14 | | | | — | | | | (516,783 | ) |
British Pound | | | BONY | | | | Sell | | | | 587,838 | | | | 961,365 | | | | 4/22/14 | | | | — | | | | (11,226 | ) |
British Pound | | | FBCO | | | | Sell | | | | 12,770,332 | | | | 20,585,775 | | | | 4/22/14 | | | | — | | | | (543,029 | ) |
British Pound | | | HSBC | | | | Sell | | | | 501,468 | | | | 803,763 | | | | 4/22/14 | | | | — | | | | (25,927 | ) |
British Pound | | | SSBT | | | | Sell | | | | 22,348,080 | | | | 36,025,105 | | | | 4/22/14 | | | | — | | | | (950,300 | ) |
Euro | | | BBU | | | | Sell | | | | 848,341 | | | | 1,164,060 | | | | 5/15/14 | | | | 576 | | | | (3,452 | ) |
Euro | | | BOFA | | | | Sell | | | | 42,831,369 | | | | 57,632,325 | | | | 5/15/14 | | | | 3,752 | | | | (1,288,124 | ) |
Euro | | | BONY | | | | Sell | | | | 750,107 | | | | 1,035,028 | | | | 5/15/14 | | | | 3,219 | | | | — | |
Euro | | | HSBC | | | | Sell | | | | 1,041,714 | | | | 1,432,862 | | | | 5/15/14 | | | | 3,329 | | | | (3,397 | ) |
Euro | | | SSBT | | | | Sell | | | | 831,009 | | | | 1,143,241 | | | | 5/15/14 | | | | 2,040 | | | | (1,894 | ) |
Euro | | | SSBT | | | | Sell | | | | 307,101 | | | | 420,870 | | | | 5/15/14 | | | | — | | | | (1,563 | ) |
Euro | | | BOFA | | | | Sell | | | | 448,800 | | | | 606,995 | | | | 5/19/14 | | | | — | | | | (10,355 | ) |
British Pound | | | BBU | | | | Buy | | | | 1,607,143 | | | | 2,626,715 | | | | 5/21/14 | | | | 31,696 | | | | — | |
British Pound | | | BBU | | | | Sell | | | | 33,376,309 | | | | 53,654,086 | | | | 5/21/14 | | | | — | | | | (1,554,393 | ) |
British Pound | | | BOFA | | | | Buy | | | | 5,541,429 | | | | 9,062,052 | | | | 5/21/14 | | | | 104,146 | | | | — | |
British Pound | | | HSBC | | | | Buy | | | | 1,521,428 | | | | 2,486,264 | | | | 5/21/14 | | | | 30,363 | | | | — | |
British Pound | | | HSBC | | | | Sell | | | | 23,563,492 | | | | 37,890,095 | | | | 5/21/14 | | | | — | | | | (1,086,789 | ) |
| | | | | | | | | | | | |
Unrealized appreciation (depreciation) | | | | | | | | | | | | | | | | 380,903 | | | | (27,315,248 | ) |
| | | | | | | | | | | | |
Net unrealized appreciation (depreciation) | | | | | | | | | | | | | | | | | | | $ | (26,934,345 | ) |
| | | | | | | | | | | | | | | | | | | | | | | | | | | | |
aMay be comprised of multiple contracts using the same currency and settlement date.
See Abbreviations on page MS-35.
The accompanying notes are an integral part of these financial statements.
MS-19
Franklin Templeton Variable Insurance Products Trust
Financial Statements
Statement of Assets and Liabilities
December 31, 2013
| | | | |
| | | Mutual Shares
Securities Fund | |
Assets: | | | | |
Investments in securities: | | | | |
Cost - Unaffiliated issuers | | $ | 3,992,703,216 | |
| | | | |
Value - Unaffiliated issuers (includes securities loaned in the amount of $2,656,680) | | $ | 5,316,916,774 | |
Cash | | | 431,150 | |
Foreign currency, at value (cost $1,671,843) | | | 1,675,912 | |
Receivables: | | | | |
Investment securities sold | | | 1,906,478 | |
Capital shares sold | | | 372,962 | |
Dividends and interest | | | 17,205,554 | |
Due from brokers | | | 22,581,748 | |
Unrealized appreciation on forward exchange contracts | | | 380,903 | |
Other assets | | | 1,408 | |
| | | | |
Total assets | | | 5,361,472,889 | |
| | | | |
Liabilities: | | | | |
Payables: | | | | |
Investment securities purchased | | | 38,191 | |
Capital shares redeemed | | | 4,346,573 | |
Management fees | | | 2,656,564 | |
Administrative fees | | | 381,621 | |
Distribution fees | | | 1,989,205 | |
Variation margin | | | 192,188 | |
Securities sold short, at value (proceeds $21,250,473) | | | 22,077,374 | |
Payable upon return of securities loaned | | | 2,731,040 | |
Unrealized depreciation on forward exchange contracts | | | 27,315,248 | |
Accrued expenses and other liabilities | | | 882,203 | |
| | | | |
Total liabilities | | | 62,610,207 | |
| | | | |
Net assets, at value | | $ | 5,298,862,682 | |
| | | | |
Net assets consist of: | | | | |
Paid-in capital | | $ | 3,889,248,227 | |
Undistributed net investment income | | | 91,100,656 | |
Net unrealized appreciation (depreciation) | | | 1,295,275,148 | |
Accumulated net realized gain (loss) | | | 23,238,651 | |
| | | | |
Net assets, at value | | $ | 5,298,862,682 | |
| | | | |
The accompanying notes are an integral part of these financial statements.
MS-20
Franklin Templeton Variable Insurance Products Trust
Financial Statements (continued)
Statement of Assets and Liabilities (continued)
December 31, 2013
| | | | |
| | | Mutual Shares
Securities Fund | |
Class 1: | | | | |
Net assets, at value | | $ | 552,162,822 | |
| | | | |
Shares outstanding | | | 25,189,923 | |
| | | | |
Net asset value and maximum offering price per share | | $ | 21.92 | |
| | | | |
Class 2: | | | | |
Net assets, at value | | $ | 4,558,547,063 | |
| | | | |
Shares outstanding | | | 210,731,195 | |
| | | | |
Net asset value and maximum offering price per share | | $ | 21.63 | |
| | | | |
Class 4: | | | | |
Net assets, at value | | $ | 188,152,797 | |
| | | | |
Shares outstanding | | | 8,656,494 | |
| | | | |
Net asset value and maximum offering price per share | | $ | 21.74 | |
| | | | |
The accompanying notes are an integral part of these financial statements.
MS-21
Franklin Templeton Variable Insurance Products Trust
Financial Statements (continued)
Statement of Operations
for the year ended December 31, 2013
| | | | |
| | | Mutual Shares
Securities Fund | |
Investment income: | | | | |
Dividends | | $ | 102,474,476 | |
Interest | | | 38,650,858 | |
Income from securities loaned | | | 168,526 | |
| | | | |
Total investment income | | | 141,293,860 | |
| | | | |
Expenses: | | | | |
Management fees (Note 3a) | | | 30,354,246 | |
Administrative fees (Note 3b) | | | 4,372,679 | |
Distribution fees: (Note 3c) | | | | |
Class 2 | | | 10,959,930 | |
Class 4 | | | 628,902 | |
Unaffiliated transfer agent fees | | | 745 | |
Custodian fees (Note 4) | | | 130,845 | |
Reports to shareholders | | | 598,484 | |
Professional fees | | | 213,648 | |
Trustees’ fees and expenses | | | 19,812 | |
Dividends and interest on securities sold short | | | 12,668 | |
Other | | | 69,372 | |
| | | | |
Total expenses | | | 47,361,331 | |
Expense reductions (Note 4) | | | (804 | ) |
| | | | |
Net expenses | | | 47,360,527 | |
| | | | |
Net investment income | | | 93,933,333 | |
| | | | |
Realized and unrealized gains (losses): | | | | |
Net realized gain (loss) from: | | | | |
Investments | | | 384,579,749 | |
Written options | | | 42,621 | |
Foreign currency transactions | | | (8,920,652 | ) |
Futures contracts | | | (6,687,621 | ) |
Securities sold short | | | (4,261 | ) |
| | | | |
Net realized gain (loss) | | | 369,009,836 | |
| | | | |
Net change in unrealized appreciation (depreciation) on: | | | | |
Investments | | | 799,141,213 | |
Translation of other assets and liabilities denominated in foreign currencies | | | (12,316,056 | ) |
| | | | |
Net change in unrealized appreciation (depreciation) | | | 786,825,157 | |
| | | | |
Net realized and unrealized gain (loss) | | | 1,155,834,993 | |
| | | | |
Net increase (decrease) in net assets resulting from operations | | $ | 1,249,768,326 | |
| | | | |
The accompanying notes are an integral part of these financial statements.
MS-22
Franklin Templeton Variable Insurance Products Trust
Financial Statements (continued)
Statements of Changes in Net Assets
| | | | | | | | |
| | | Mutual Shares Securities Fund | |
| | | Year Ended December 31, | |
| | | 2013 | | | 2012 | |
| | | | |
Increase (decrease) in net assets: | | | | | | | | |
Operations: | | | | | | | | |
Net investment income | | $ | 93,933,333 | | | $ | 99,008,766 | |
Net realized gain (loss) from investments, written options, foreign currency transactions, futures contracts and securities sold short | | | 369,009,836 | | | | 398,833,480 | |
Net change in unrealized appreciation (depreciation) on investments and translation of other assets and liabilities denominated in foreign currencies | | | 786,825,157 | | | | 239,569,243 | |
| | | | |
Net increase (decrease) in net assets resulting from operations | | | 1,249,768,326 | | | | 737,411,489 | |
| | | | |
Distributions to shareholders from: | | | | | | | | |
Net investment income: | | | | | | | | |
Class 1 | | | (11,380,461 | ) | | | (33,342,789 | ) |
Class 2 | | | (90,294,700 | ) | | | (82,893,175 | ) |
Class 4 | | | (3,535,676 | ) | | | (3,198,551 | ) |
| | | | |
Total distributions to shareholders | | | (105,210,837 | ) | | | (119,434,515 | ) |
| | | | |
Capital share transactions: (Note 2) | | | | | | | | |
Class 1 | | | (9,960,888 | ) | | | (865,246,582 | ) |
Class 2 | | | (502,396,967 | ) | | | (298,991,452 | ) |
Class 4 | | | (17,497,568 | ) | | | (15,628,562 | ) |
| | | | |
Total capital share transactions | | | (529,855,423 | ) | | | (1,179,866,596 | ) |
| | | | |
Net increase (decrease) in net assets | | | 614,702,066 | | | | (561,889,622 | ) |
Net assets: | | | | | | | | |
Beginning of year | | | 4,684,160,616 | | | | 5,246,050,238 | |
| | | | |
End of year | | $ | 5,298,862,682 | | | $ | 4,684,160,616 | |
| | | | |
Undistributed net investment income included in net assets: | | | | | | | | |
End of year | | $ | 91,100,656 | | | $ | 101,815,540 | |
| | | | |
The accompanying notes are an integral part of these financial statements.
MS-23
Franklin Templeton Variable Insurance Products Trust
Notes to Financial Statements
Mutual Shares Securities Fund
1. ORGANIZATION AND SIGNIFICANT ACCOUNTING POLICIES
Franklin Templeton Variable Insurance Products Trust (Trust) is registered under the Investment Company Act of 1940, as amended, (1940 Act) as an open-end investment company, consisting of twenty separate funds. The The Mutual Shares Securities (Fund) is included in this report. The financial statements of the remaining funds in the Trust are presented separately. Shares of the Fund are generally sold only to insurance company separate accounts to fund the benefits of variable life insurance policies or variable annuity contracts. The Fund offers three classes of shares: Class 1, Class 2, and Class 4. Each class of shares differs by its distribution fees, voting rights on matters affecting a single class and its exchange privilege.
The following summarizes the Fund’s significant accounting policies.
a. Financial Instrument Valuation
The Fund’s investments in financial instruments are carried at fair value daily. Fair value is the price that would be received to sell an asset or paid to transfer a liability in an orderly transaction between market participants on the measurement date. The Fund calculates the net asset value (NAV) per share at the close of the New York Stock Exchange (NYSE), generally at 4p.m. Eastern time (NYSE close) on each day the NYSE is open for trading. Under procedures approved by the Trust’s Board of Trustees (the Board), the Fund’s administrator, investment manager and other affiliates have formed the Valuation and Liquidity Oversight Committee (VLOC). The VLOC provides administration and oversight of the Fund’s valuation policies and procedures, which are approved annually by the Board. Among other things, these procedures allow the Fund to utilize independent pricing services, quotations from securities and financial instrument dealers, and other market sources to determine fair value.
Equity securities and derivative financial instruments (derivatives) listed on an exchange or on the NASDAQ National Market System are valued at the last quoted sale price or the official closing price of the day, respectively. Foreign equity securities are valued as of the close of trading on the foreign stock exchange on which the security is primarily traded or as of the NYSE close, whichever is earlier. The value is then converted into its U.S. dollar equivalent at the foreign exchange rate in effect at the NYSE close on the day that the value of the security is determined. Over-the-counter (OTC) securities are valued within the range of the most recent quoted bid and ask prices. Securities that trade in multiple markets or on multiple exchanges are valued according to the broadest and most representative market. Certain equity securities are valued based upon fundamental characteristics or relationships to similar securities. Investments in non-registered money market funds are valued at the closing net asset value.
Debt securities generally trade in the OTC market rather than on a securities exchange. The Fund’s pricing services use multiple valuation techniques to determine fair value. In instances where sufficient market activity exists, the pricing services may utilize a market-based approach through which quotes from market makers are used to determine fair value. In instances where sufficient market activity may not exist or is limited, the pricing services also utilize proprietary valuation models which may consider market characteristics such as benchmark yield curves, credit spreads, estimated default rates, anticipated market interest rate volatility, coupon rates, anticipated timing of principal repayments, underlying collateral, and other unique security features in order to estimate the relevant cash flows, which are then discounted to calculate the fair value. Securities denominated in a foreign currency are converted into their U.S. dollar equivalent at the foreign exchange rate in effect at the NYSE close on the date that the values of the foreign debt securities are determined.
Certain derivatives trade in the OTC market. The Fund’s pricing services use various techniques including industry standard option pricing models and proprietary discounted cash flow models to determine the fair value of those instruments. The Fund’s net benefit or obligation under the derivative contract, as measured by the fair value of the contract, is included in net assets.
The Fund has procedures to determine the fair value of financial instruments for which market prices are not reliable or readily available. Under these procedures, the VLOC convenes on a regular basis to review such financial instruments and considers a number of factors, including significant unobservable valuation inputs, when arriving at fair value. The VLOC primarily employs a market-based approach which may use related or comparable assets or liabilities, recent transactions, market multiples, book values, and other relevant information for the investment to determine the fair value of the investment. An income-based
MS-24
Franklin Templeton Variable Insurance Products Trust
Notes to Financial Statements (continued)
Mutual Shares Securities Fund
1. ORGANIZATION AND SIGNIFICANT ACCOUNTING POLICIES (continued)
a. Financial Instrument Valuation (continued)
valuation approach may also be used in which the anticipated future cash flows of the investment are discounted to calculate fair value. Discounts may also be applied due to the nature or duration of any restrictions on the disposition of the investments. Due to the inherent uncertainty of valuations of such investments, the fair values may differ significantly from the values that would have been used had an active market existed. The VLOC employs various methods for calibrating these valuation approaches including a regular review of key inputs and assumptions, transactional back-testing or disposition analysis, and reviews of any related market activity.
Trading in securities on foreign securities stock exchanges and OTC markets may be completed before the daily NYSE close. In addition, trading in certain foreign markets may not take place on every NYSE business day. Occasionally, events occur between the time at which trading in a foreign security is completed and the close of the NYSE that might call into question the reliability of the value of a portfolio security held by the Fund. As a result, differences may arise between the value of the Fund’s portfolio securities as determined at the foreign market close and the latest indications of value at the close of the NYSE. In order to minimize the potential for these differences, the VLOC monitors price movements following the close of trading in foreign stock markets through a series of country specific market proxies (such as baskets of American Depositary Receipts, futures contracts and exchange traded funds). These price movements are measured against established trigger thresholds for each specific market proxy to assist in determining if an event has occurred that may call into question the reliability of the values of the foreign securities held by the Fund. If such an event occurs, the securities may be valued using fair value procedures, which may include the use of independent pricing services.
Also, when the last day of the reporting period is a non-business day, certain foreign markets may be open on those days that the NYSE is closed, which could result in differences between the value of the Fund’s portfolio securities on the last business day and the last calendar day of the reporting period. Any significant security valuation changes due to an open foreign market are adjusted and reflected by the Fund for financial reporting purposes.
b. Foreign Currency Translation
Portfolio securities and other assets and liabilities denominated in foreign currencies are translated into U.S. dollars based on the exchange rate of such currencies against U.S. dollars on the date of valuation. The Fund may enter into foreign currency exchange contracts to facilitate transactions denominated in a foreign currency. Purchases and sales of securities, income and expense items denominated in foreign currencies are translated into U.S. dollars at the exchange rate in effect on the transaction date. Portfolio securities and assets and liabilities denominated in foreign currencies contain risks that those currencies will decline in value relative to the U.S. dollar. Occasionally, events may impact the availability or reliability of foreign exchange rates used to convert the U.S. dollar equivalent value. If such an event occurs, the foreign exchange rate will be valued at fair value using procedures established and approved by the Board.
The Fund does not separately report the effect of changes in foreign exchange rates from changes in market prices on securities held. Such changes are included in net realized and unrealized gain or loss from investments on the Statement of Operations.
Realized foreign exchange gains or losses arise from sales of foreign currencies, currency gains or losses realized between the trade and settlement dates on securities transactions and the difference between the recorded amounts of dividends, interest, and foreign withholding taxes and the U.S. dollar equivalent of the amounts actually received or paid. Net unrealized foreign exchange gains and losses arise from changes in foreign exchange rates on foreign denominated assets and liabilities other than investments in securities held at the end of the reporting period.
MS-25
Franklin Templeton Variable Insurance Products Trust
Notes to Financial Statements (continued)
Mutual Shares Securities Fund
1. ORGANIZATION AND SIGNIFICANT ACCOUNTING POLICIES (continued)
c. Derivative Financial Instruments
The Fund invested in derivatives in order to manage risk or gain exposure to various other investments or markets. Derivatives are financial contracts based on an underlying or notional amount, require no initial investment or an initial net investment that is smaller than would normally be required to have a similar response to changes in market factors, and require or permit net settlement. Derivatives contain various risks including the potential inability of the counterparty to fulfill their obligations under the terms of the contract, the potential for an illiquid secondary market, and/or the potential for market movements which expose the Fund to gains or losses in excess of the amounts shown on the Statement of Assets and Liabilities. Realized gain and loss and unrealized appreciation and depreciation on these contracts for the period are included in the Statement of Operations.
Derivative counterparty credit risk is managed through a formal evaluation of the creditworthiness of all potential counterparties. The Fund attempts to reduce its exposure to counterparty credit risk on OTC derivatives, whenever possible, by entering into International Swaps and Derivatives Association (ISDA) master agreements with certain counterparties. These agreements contain various provisions, including but not limited to collateral requirements, events of default, or early termination. Termination events applicable to the counterparty include certain deteriorations in the credit quality of the counterparty. Termination events applicable to the Fund include failure of the Fund to maintain certain net asset levels and/or limit the decline in net assets over various periods of time. In the event of default or early termination, the ISDA master agreement gives the non-defaulting party the right to net and close-out all transactions traded, whether or not arising under the ISDA agreement, to one net amount payable by one counterparty to the other. However, absent an event of default or early termination, OTC derivative assets and liabilities are presented gross and not offset in the Statement of Assets and Liabilities. Early termination by the counterparty may result in an immediate payment by the Fund of any net liability owed to that counterparty under the ISDA agreement. However, absent an event of default or early termination, OTC derivative assets and liabilities are presented gross and not offset in the Statement of Assets and Liabilities. Early termination by the counterparty may result in an immediate payment by the Fund of any net liability owed to that counterparty under the ISDA agreement. At December 31, 2013, the Fund had OTC derivatives in a net liability position of $26,934,345 and the aggregate value of collateral pledged for such contracts was $23,885,805.
Collateral requirements differ by type of derivative. Collateral or initial margin requirements are set by the broker or exchange clearing house for exchange traded and centrally cleared derivatives. Initial margin deposited is held at the exchange and can be in the form of cash and/or securities. For OTC derivatives traded under an ISDA master agreement, posting of collateral is required by either the fund or the applicable counterparty if the total net exposure of all OTC derivatives with the applicable counterparty exceeds the minimum transfer amount, which typically ranges from $100,000 to $250,000, and can vary depending on the counterparty and the type of the agreement. Generally, collateral is determined at the close of fund business each day and any additional collateral required due to changes in derivative values may be delivered by the fund or the counterparty within a few business days. Collateral pledged and/or received by the fund, if any, is held in segregated accounts with the fund’s custodian/counterparty broker and can be in the form of cash and/or securities. Unrestricted cash may be invested according to the Fund’s investment objectives.
The Fund entered into exchange traded futures contracts primarily to manage exposure to certain foreign currencies. A futures contract is an agreement between the Fund and a counterparty to buy or sell an asset for a specified price on a future date. Required initial margins are pledged by the Fund, and the daily change in fair value is accounted for as a variation margin payable or receivable on the Statement of Assets and Liabilities.
The Fund entered into OTC exchange traded forward exchange contracts primarily to manage exposure to certain foreign currencies. A forward exchange contract is an agreement between the Fund and a counterparty to buy or sell a foreign currency at a specific exchange rate on a future date.
The Fund purchased or wrote exchange traded option contracts primarily to manage exposure to equity price risk. An option is a contract entitling the holder to purchase or sell a specific amount of shares or units of an asset or notional amount of a swap (swaption), at a specified price. Options purchased are recorded as an asset while options written are recorded as a liability.
MS-26
Franklin Templeton Variable Insurance Products Trust
Notes to Financial Statements (continued)
Mutual Shares Securities Fund
1. ORGANIZATION AND SIGNIFICANT ACCOUNTING POLICIES (continued)
c. Derivative Financial Instruments (continued)
Upon exercise of an option, the acquisition cost or sales proceeds of the underlying investment is adjusted by any premium received or paid. Upon expiration of an option, any premium received or paid is recorded as a realized gain or loss. Upon closing an option other than through expiration or exercise, the difference between the premium and the cost to close the position is recorded as a realized gain or loss.
See Notes 6 and 9 regarding investment transactions and other derivative information, respectively.
d. Securities Sold Short
The Fund is engaged in selling securities short, which obligates the Fund to replace a borrowed security with the same security at current market value. The Fund incurs a loss if the price of the security increases between the date of the short sale and the date on which the Fund replaces the borrowed security. The Fund realizes a gain if the price of the security declines between those dates. Gains are limited to the price at which the Fund sold the security short, while losses are potentially unlimited in size.
The Fund is required to establish a margin account with the broker lending the security sold short. While the short sale is outstanding, the broker retains the proceeds of the short sale to the extent necessary to meet margin requirements until the short position is closed out. A deposit must also be maintained with the Fund’s custodian/counterparty broker consisting of cash and/or securities having a value equal to a specified percentage of the value of the securities sold short. The Fund is obligated to pay fees for borrowing the securities sold short and is required to pay the counterparty any dividends or interest due on securities sold short. Such dividends or interest and any security borrowing fees are recorded as an expense to the Fund.
e. Securities Lending
The Fund participates in an agency based securities lending program. The Fund receives cash collateral against the loaned securities in an amount equal to at least 102% of the market value of the loaned securities. Collateral is maintained over the life of the loan in an amount not less than 100% of the market value of loaned securities, as determined at the close of fund business each day; any additional collateral required due to changes in security values is delivered to the Fund on the next business day. The collateral is invested in a non-registered money fund. The Fund receives income from the investment of cash collateral, in addition to lending fees and rebates paid by the borrower. The Fund bears the market risk with respect to the collateral investment, securities loaned, and the risk that the agent may default on its obligations to the Fund. The securities lending agent has agreed to indemnify the Fund in the event of default by a third party borrower.
f. Senior Floating Rate Interests
The Fund invests in senior secured corporate loans that pay interest at rates which are periodically reset by reference to a base lending rate plus a spread. These base lending rates are generally the prime rate offered by a designated U.S. bank or the London InterBank Offered Rate (LIBOR). Senior secured corporate loans often require prepayment of principal from excess cash flows or at the discretion of the borrower. As a result, actual maturity may be substantially less than the stated maturity.
Senior secured corporate loans in which the Fund invests are generally readily marketable, but may be subject to certain restrictions on resale.
g. Income and Deferred Taxes
It is the Fund’s policy to qualify as a regulated investment company under the Internal Revenue Code. The Fund intends to distribute to shareholders substantially all of its taxable income and net realized gains to relieve it from federal income and if applicable, excise taxes. As a result, no provision for U.S. federal income taxes is required.
MS-27
Franklin Templeton Variable Insurance Products Trust
Notes to Financial Statements (continued)
Mutual Shares Securities Fund
1. ORGANIZATION AND SIGNIFICANT ACCOUNTING POLICIES (continued)
g. Income and Deferred Taxes (continued)
The Fund may be subject to foreign taxation related to income received, capital gains on the sale of securities and certain foreign currency transactions in the foreign jurisdictions in which it invests. Foreign taxes, if any, are recorded based on the tax regulations and rates that exist in the foreign markets in which the Fund invests. When a capital gain tax is determined to apply the Fund records an estimated deferred tax liability in an amount that would be payable if the securities were disposed of on the valuation date.
The Fund recognizes the tax benefits of uncertain tax positions only when the position is “more likely than not” to be sustained upon examination by the tax authorities based on the technical merits of the tax position. As of December 31, 2013, and for all open tax years, the Fund has determined that no liability for unrecognized tax benefits is required in the Fund’s financial statements related to uncertain tax positions taken on a tax return (or expected to be taken on future tax returns). Open tax years are those that remain subject to examination and are based on each tax jurisdiction statute of limitation.
h. Security Transactions, Investment Income, Expenses and Distributions
Security transactions are accounted for on trade date. Realized gains and losses on security transactions are determined on a specific identification basis. Interest income and estimated expenses are accrued daily. Amortization of premium and accretion of discount on debt securities are included in interest income. Dividend income and dividends declared on securities sold short are recorded on the ex-dividend date except that certain dividends from foreign securities are recognized as soon as the Fund is notified of the ex-dividend date. Distributions to shareholders are recorded on the ex-dividend date and are determined according to income tax regulations (tax basis). Distributable earnings determined on a tax basis may differ from earnings recorded in accordance with accounting principles generally accepted in the United States of America. These differences may be permanent or temporary. Permanent differences are reclassified among capital accounts to reflect their tax character. These reclassifications have no impact on net assets or the results of operations. Temporary differences are not reclassified, as they may reverse in subsequent periods.
Common expenses incurred by the Trust are allocated among the funds based on the ratio of net assets of each fund to the combined net assets of the Trust. Fund specific expenses are charged directly to the fund that incurred the expense.
Realized and unrealized gains and losses and net investment income, not including class specific expenses, are allocated daily to each class of shares based upon the relative proportion of net assets of each class. Differences in per share distributions, by class, are generally due to differences in class specific expenses.
i. Accounting Estimates
The preparation of financial statements in accordance with accounting principles generally accepted in the United States of America requires management to make estimates and assumptions that affect the reported amounts of assets and liabilities at the date of the financial statements and the amounts of income and expenses during the reporting period. Actual results could differ from those estimates.
j. Guarantees and Indemnifications
Under the Trust’s organizational documents, its officers and trustees are indemnified by the Trust against certain liabilities arising out of the performance of their duties to the Trust. Additionally, in the normal course of business, the Trust, on behalf of the Fund, enters into contracts with service providers that contain general indemnification clauses. The Trust’s maximum exposure under these arrangements is unknown as this would involve future claims that may be made against the Trust that have not yet occurred. Currently, the Trust expects the risk of loss to be remote.
MS-28
Franklin Templeton Variable Insurance Products Trust
Notes to Financial Statements (continued)
Mutual Shares Securities Fund
2. SHARES OF BENEFICIAL INTEREST
At December 31, 2013, there were an unlimited number of shares authorized (without par value). Transactions in the Fund’s shares were as follows:
| | | | | | | | | | | | | | | | |
| | | Year Ended December 31, | |
| | | 2013 | | | 2012 | |
| Class 1 Shares: | | Shares | | | Amount | | | Shares | | | Amount | |
Shares sold | | | 1,271,063 | | | $ | 25,943,160 | | | | 30,409,042 | | | $ | 503,225,918 | |
Shares issued in reinvestment of distributions | | | 565,348 | | | | 11,380,461 | | | | 1,941,921 | | | | 33,342,789 | |
Shares redeemed in-kind (Note 12) | | | — | | | | — | | | | (52,704,789 | ) | | | (918,607,583 | ) |
Shares redeemed | | | (2,402,608 | ) | | | (47,284,509 | ) | | | (29,093,625 | ) | | | (483,207,706 | ) |
| | | | |
Net increase (decrease) | | | (566,197 | ) | | $ | (9,960,888 | ) | | | (49,447,451 | ) | | $ | (865,246,582 | ) |
| | | | |
Class 2 Shares: | | | | | | | | | | | | | | | | |
Shares sold | | | 9,115,759 | | | $ | 176,951,746 | | | | 18,569,762 | | | $ | 304,904,655 | |
Shares issued in reinvestment of distributions | | | 4,541,987 | | | | 90,294,700 | | | | 4,887,569 | | | | 82,893,175 | |
Shares redeemed | | | (39,198,203 | ) | | | (769,643,413 | ) | | | (41,692,641 | ) | | | (686,789,282 | ) |
| | | | |
Net increase (decrease) | | | (25,540,457 | ) | | $ | (502,396,967 | ) | | | (18,235,310 | ) | | $ | (298,991,452 | ) |
| | | | |
Class 4 Shares: | | | | | | | | | | | | | | | | |
Shares sold | | | 622,201 | | | $ | 12,228,440 | | | | 310,070 | | | $ | 5,137,019 | |
Shares issued on reinvestment of distributions | | | 176,961 | | | | 3,535,676 | | | | 187,598 | | | | 3,198,551 | |
Shares redeemed | | | (1,677,249 | ) | | | (33,261,684 | ) | | | (1,453,214 | ) | | | (23,964,132 | ) |
| | | | |
Net increase (decrease) | | | (878,087 | ) | | $ | (17,497,568 | ) | | | (955,546 | ) | | $ | (15,628,562 | ) |
| | | | |
3. TRANSACTIONS WITH AFFILIATES
Franklin Resources, Inc. is the holding company for various subsidiaries that together are referred to as Franklin Templeton Investments. Certain officers and trustees of the Fund are also officers and/or directors of the following subsidiaries:
| | |
| Subsidiary | | Affiliation |
Franklin Mutual Advisers, LLC (Franklin Mutual) | | Investment manager |
Franklin Templeton Services, LLC (FT Services) | | Administrative manager |
Franklin Templeton Distributors, Inc. (Distributors) | | Principal underwriter |
Franklin Templeton Investor Services, LLC (Investor Services) | | Transfer agent |
a. Management Fees
The Fund pays an investment management fee to Franklin Mutual based on the average daily net assets of the Fund as follows:
| | |
| Annualized Fee Rate | | Net Assets |
| 0.600% | | Up to and including $5 billion |
| 0.570% | | Over $5 billion, up to and including $10 billion |
| 0.550% | | Over $10 billion, up to and including $15 billion |
| 0.530% | | Over $15 billion, up to and including $20 billion |
| 0.510% | | In excess of $20 billion |
MS-29
Franklin Templeton Variable Insurance Products Trust
Notes to Financial Statements (continued)
Mutual Shares Securities Fund
3. TRANSACTIONS WITH AFFILIATES (continued)
b. Administrative Fees
The Funds pays an administrative fee to FT Services based on the Fund’s average daily net assets as follows:
| | |
| Annualized Fee Rate | | Net Assets |
| 0.150% | | Up to and including $200 million |
| 0.135% | | Over $200 million, up to and including $700 million |
| 0.100% | | Over $700 million, up to and including $1.2 billion |
| 0.075% | | In excess of $1.2 billion |
c. Distribution Fees
The Board has adopted distribution plans for Class 2 and Class 4 shares pursuant to Rule 12b-1 under the 1940 Act. Under the Fund’s compensation distribution plans, the Fund pays Distributors for costs incurred in connection with the servicing, sale and distribution of the Fund’s shares up to 0.35% per year of its average daily net assets of each class. Some distribution fees are not charged on shares held by affiliates. The Board has agreed to limit the current rate to 0.25% per year for Class 2. The plan year, for purposes of monitoring compliance with the maximum annual plan rates, is February 1 through January 31.
d. Transfer Agent Fees
Investor Services, under terms of an agreement, performs shareholder servicing for the Fund and is not paid by the Fund for the services.
e. Other Affiliated Transactions
At December 31, 2013, Franklin Templeton Variable Insurance Products Trust – Franklin Templeton VIP Founding Funds Allocation Fund owned 7.56% of the Fund’s outstanding shares.
4. EXPENSE OFFSET ARRANGEMENT
The Fund has entered into an arrangement with its custodian whereby credits realized as a result of uninvested cash balances are used to reduce a portion of the Fund’s custodian expenses. During the year ended December 31, 2013, the custodian fees were reduced as noted in the Statement of Operations.
5. INCOME TAXES
For tax purposes, capital losses may be carried over to offset future capital gains. Capital loss carryforwards with no expiration, if any, must be fully utilized before those losses with expiration dates.
During the year ended December 31, 2013, the Fund utilized $325,941,709 of capital loss carryforwards.
The tax character of distributions paid during the years ended December 31, 2013 and 2012, was as follows:
| | | | | | | | |
| | | 2013 | | | 2012 | |
Distributions paid from ordinary income | | $ | 105,210,837 | | | $ | 119,434,515 | |
| | | | |
MS-30
Franklin Templeton Variable Insurance Products Trust
Notes to Financial Statements (continued)
Mutual Shares Securities Fund
5. INCOME TAXES (continued)
At December 31, 2013, the cost of investments, net unrealized appreciation (depreciation), undistributed ordinary income and undistributed long term capital gains for income tax purposes were as follows:
| | | | |
Cost of investments | | $ | 4,038,395,386 | |
| | | | |
| |
Unrealized appreciation | | $ | 1,457,975,609 | |
Unrealized depreciation | | | (179,454,221 | ) |
| | | | |
Net unrealized appreciation (depreciation) | | $ | 1,278,521,388 | |
| | | | |
Undistributed ordinary income | | $ | 105,335,240 | |
Undistributed long term capital gains | | | 26,534,084 | |
| | | | |
Distributable earnings | | $ | 131,869,324 | |
| | | | |
Differences between income and/or capital gains as determined on a book basis and a tax basis are primarily due to differing treatments of foreign currency transactions, bond discounts and premiums and wash sales.
6. INVESTMENT TRANSACTIONS
Purchases and sales of investments (excluding short term securities and securities sold short) for the year ended December 31, 2013, aggregated $1,106,361,292 and $1,489,085,114, respectively.
Transactions in options written during the year ended December 31, 2013, were as follows:
| | | | | | | | |
| | | Options | |
| | | Number of
Contracts | | | Premiums
Received | |
Options outstanding at December 31, 2012 | | | — | | | $ | — | |
Options written | | | 391 | | | | 106,103 | |
Options expired | | | — | | | | — | |
Options exercised | | | (334 | ) | | | (46,760 | ) |
Options closed | | | (57 | ) | | | (59,343 | ) |
| | | | | | | | |
Options outstanding at December 31, 2013 | | | — | | | $ | — | |
| | | | | | | | |
See Notes 1(c) and 9 regarding derivative financial instruments and other derivative information, respectively.
7. CREDIT RISK AND DEFAULTED SECURITIES
The Fund may purchase the pre-default or defaulted debt of distressed companies. Distressed companies are financially troubled and are about to be or are already involved in financial restructuring or bankruptcy. Risks associated with purchasing these securities include the possibility that the bankruptcy or other restructuring process takes longer than expected, or that distributions in restructuring are less than anticipated, either or both of which may result in unfavorable consequences to the Fund. If it becomes probable that the income on debt securities, including those of distressed companies, will not be collected, the Fund discontinues accruing income and recognizes an adjustment for uncollectible interest.
At December 31, 2013, the aggregate value of distressed company securities for which interest recognition has been discontinued was $15,112,262, representing 0.29% of the Fund’s net assets. For information as to specific securities, see the accompanying Statement of Investments.
MS-31
Franklin Templeton Variable Insurance Products Trust
Notes to Financial Statements (continued)
Mutual Shares Securities Fund
8. RESTRICTED SECURITIES
The Fund invests in securities that are restricted under the Securities Act of 1933 (1933 Act) or which are subject to legal, contractual, or other agreed upon restrictions on resale. Restricted securities are often purchased in private placement transactions, and cannot be sold without prior registration unless the sale is pursuant to an exemption under the 1933 Act. Disposal of these securities may require greater effort and expense, and prompt sale at an acceptable price may be difficult. The Fund may have registration rights for restricted securities. The issuer generally incurs all registration costs.
At December 31, 2013, the Fund held investments in restricted securities, excluding certain securities exempt from registration under the 1933 Act deemed to be liquid, as follows:
| | | | | | | | | | | | | | |
Principal
Amount/
Shares | | | Issuer | | Acquisition
Dates | | Cost | | | Value | |
| | 1,754 | | | Broadband Ventures III LLC, secured promissory note, 5.00%, 2/01/12 | | 7/01/10 | | $ | 1,754 | | | $ | — | |
| | 6,400,507 | | | CB FIM Coinvestors LLC | | 1/15/09 - 6/02/09 | | | — | | | | — | |
| | 8,006,950 | | | FIM Coinvestor Holdings I, LLC | | 11/20/06 - 6/02/09 | | | — | | | | — | |
| | 140,952 | | | First Southern Bancorp Inc. | | 1/27/10 - 7/07/10 | | | 2,974,087 | | | | 679,417 | |
| | 241 | | | First Southern Bancorp Inc., cvt. pfd., C | | 1/27/10 - 7/07/10 | | | 241,000 | | | | 449,909 | |
| | 1,730,515 | | | International Automotive Components Group Brazil LLC | | 4/13/06 - 12/26/08 | | | 1,149,241 | | | | 337,139 | |
| | 15,382,424 | | | International Automotive Components Group North America, LLC | | 1/12/06 - 3/18/13 | | | 12,591,586 | | | | 8,703,683 | |
| | 16,280 | | | Olympus Re Holdings Ltd. | | 12/19/01 | | | 1,525,128 | | | | — | |
| | | | | | | | | | |
| | | | Total Restricted Securities (Value is 0.19% of Net Assets) | | $ | 18,482,796 | | | $ | 10,170,148 | |
| | | | | | | | | | |
9. OTHER DERIVATIVE INFORMATION
At December 31, 2013, the Fund’s investments in derivative contracts are reflected on the Statement of Assets and Liabilities as follows:
| | | | | | | | | | | | |
| | | Asset Derivatives | | | Liability Derivatives | |
Derivative Contracts Not Accounted
for as Hedging Instruments | | Statement of Assets and
Liabilities Location | | Fair Value
Amount | | | Statement of Assets and
Liabilities Location | | Fair Value
Amount | |
Foreign exchange contracts | | Unrealized appreciation on forward exchange contracts | | $ | 380,903 | | | Unrealized depreciation on forward exchange contracts/Net assets consist of – net unrealized appreciation (depreciation) | | $ | 28,587,937a | |
aIncludes cumulative appreciation (depreciation) of futures contracts as reported in the Statement of Investments. Only current day’s variation margin is separately reported within the Statement of Assets and Liabilities.
MS-32
Franklin Templeton Variable Insurance Products Trust
Notes to Financial Statements (continued)
Mutual Shares Securities Fund
9. OTHER DERIVATIVE INFORMATION (continued)
For the year ended December 31, 2013, the effect of derivative contracts on the Fund’s Statement of Operations was as follows:
| | | | | | | | | | |
Derivative Contracts Not
Accounted for as
Hedging Instruments | | Statement of Operations Locations | | Realized Gain
(Loss) for the
Year | | | Change in
Unrealized
Appreciation
(Depreciation)
for the Year | |
Foreign exchange contracts | | Net realized gain (loss) from foreign currency transactions and futures contracts / Net change in unrealized appreciation (depreciation) on translation of other assets and liabilities denominated in foreign currencies | | $ | (16,040,875 | ) | | $ | (12,375,422 | ) |
Equity contracts | | Net realized gain (loss) from written options / Net change in unrealized appreciation (depreciation) on investments | | | 42,621 | | | | — | |
For the year ended December 31, 2013 the average month end fair value of derivatives represented 0.34% of average month end net assets. The average month end number of open derivative contracts for the year was 126.
See Notes 1(c) and 6 regarding derivative financial instruments and investment transactions, respectively.
10. HOLDINGS OF 5% VOTING SECURITIES OF PORTFOLIO COMPANIES
The 1940 Act defines “affiliated companies” to include investments in portfolio companies in which a fund owns 5% or more of the outstanding voting securities. Investments in “affiliated companies” for the Fund for the year ended December 31, 2013, were as shown below.
| | | | | | | | | | | | | | | | | | | | | | | | | | | | |
| Name of Issuer | | Number of
Shares
Held at Beginning
of Year | | | Gross
Additions | | | Gross
Reductions | | | Number of
Shares
Held at End
of Year | | | Value at
End of
Year | | | Investment
Income | | | Realized Capital
Gain (Loss) | |
Non-Controlled Affiliates | | | | | | | | | | | | | | | | | | | | | | | | | | | | |
CB FIM Coinvestors LLC (Value is 0.00% of Net Assets) | | | 6,400,507 | | | | — | | | | — | | | | 6,400,507 | | | $ | — | | | $ | — | | | $ | — | |
| | | | | | | | | | | | | | | | |
11. CREDIT FACILITY
The Fund, together with other U.S. registered and foreign investment funds (collectively, Borrowers), managed by Franklin Templeton Investments, are borrowers in a joint syndicated senior unsecured credit facility totaling $1.5 billion (Global Credit Facility) which, after an extension of the original terms, matured on February 14, 2014. This Global Credit Facility provides a source of funds to the Borrowers for temporary and emergency purposes, including the ability to meet future unanticipated or unusually large redemption requests. Effective February 14, 2014, the Borrowers renewed the Global Credit Facility which matures on February 13, 2015.
Under the terms of the Global Credit Facility, the Fund shall, in addition to interest charged on any borrowings made by the Fund and other costs incurred by the Fund, pay its share of fees and expenses incurred in connection with the implementation and maintenance of the Global Credit Facility, based upon its relative share of the aggregate net assets of all of the Borrowers, including an annual commitment fee of 0.07% based upon the unused portion of the Global Credit Facility. These fees are reflected in other expenses on the Statement of Operations. During the year ended December 31, 2013, the Fund did not use the Global Credit Facility.
MS-33
Franklin Templeton Variable Insurance Products Trust
Notes to Financial Statements (continued)
Mutual Shares Securities Fund
12. REDEMPTION IN-KIND
During the year ended December 31, 2012, the Fund realized $139,199,450 of net gains resulting from a redemption in-kind in which a shareholder redeemed fund shares for securities held by the Fund rather than for cash. Because such gains are not taxable to the Fund, and are not netted with capital gains that are distributed to remaining shareholders, they have been reclassified from accumulated net realized gains to paid-in capital.
13. FAIR VALUE MEASUREMENTS
The Fund follows a fair value hierarchy that distinguishes between market data obtained from independent sources (observable inputs) and the Fund’s own market assumptions (unobservable inputs). These inputs are used in determining the value of the Fund’s financial instruments and are summarized in the following fair value hierarchy:
| | • | | Level 1 – quoted prices in active markets for identical financial instruments |
| | • | | Level 2 – other significant observable inputs (including quoted prices for similar financial instruments, interest rates, prepayment speed, credit risk, etc.) |
| | • | | Level 3 – significant unobservable inputs (including the Fund’s own assumptions in determining the fair value of financial instruments) |
The input levels are not necessarily an indication of the risk or liquidity associated with financial instruments at that level.
For movements between the levels within the fair value hierarchy, the Fund has adopted a policy of recognizing the transfers as of the date of the underlying event which caused the movement.
A summary of inputs used as of December 31, 2013, in valuing the Fund’s assets and liabilities carried at fair value, is as follows:
| | | | | | | | | | | | | | | | |
| | | Level 1 | | | Level 2 | | | Level 3 | | | Total | |
| | | | |
Assets: | | | | | | | | | | | | | | | | |
Investments in Securities | | | | | | | | | | | | | | | | |
Equity Investments:a | | | | | | | | | | | | | | | | |
Auto Components | | $ | — | | | $ | — | | | $ | 9,040,822 | | | $ | 9,040,822 | |
Commercial Banks | | | 274,117,931 | | | | — | | | | 8,535,171 | | | | 282,653,102 | |
Machinery | | | 85,669,011 | | | | 21,023,531 | | | | — | | | | 106,692,542 | |
Media | | | 344,525,861 | | | | 14,338,750 | | | | — | | | | 358,864,611 | |
Real Estate Management & Development | | | 18,402,434 | | | | — | | | | 7,937,467 | | | | 26,339,901 | |
All Other Equity Investmentsb | | | 3,864,203,470 | | | | — | | | | — | c | | | 3,864,203,470 | |
Corporate Bonds, Notes and Senior Floating Rate Interests | | | — | | | | 323,706,426 | | | | — | | | | 323,706,426 | |
Corporate Notes in Reorganization | | | — | | | | 15,112,262 | | | | — | c | | | 15,112,262 | |
Companies in Liquidation | | | 58,567 | | | | 64,827,437 | | | | — | c | | | 64,886,004 | |
Short Term Investments | | | 262,686,594 | | | | 2,731,040 | | | | — | | | | 265,417,634 | |
| | | | |
Total Investments in Securities | | $ | 4,849,663,868 | | | $ | 441,739,446 | | | $ | 25,513,460 | | | $ | 5,316,916,774 | |
| | | | |
Forward Exchange Contracts | | $ | — | | | $ | 380,903 | | | $ | — | | | $ | 380,903 | |
Liabilities: | | | | | | | | | | | | | | | | |
Security Sold Short | | | 22,077,374 | | | | — | | | | — | | | | 22,077,374 | |
Futures Contracts | | | 1,272,689 | | | | — | | | | — | | | | 1,272,689 | |
Forward Exchange Contracts | | | — | | | | 27,315,248 | | | | — | | | | 27,315,248 | |
aIncludes common and convertible preferred stocks as well as other equity investments.
bFor detailed categories, see the accompanying Statement of Investments.
cIncludes securities determined to have no value at December 31, 2013.
A reconciliation of assets in which Level 3 inputs are used in determining fair value is presented when there are significant Level 3 investments at the end of the year.
MS-34
Franklin Templeton Variable Insurance Products Trust
Notes to Financial Statements (continued)
Mutual Shares Securities Fund
14. NEW ACCOUNTING PRONOUNCEMENTS
In June 2013, the Financial Accounting Standards Board issued Accounting Standards Update (ASU) No. 2013-08, Investment Companies (Topic 946): Amendments to the Scope, Measurement, and Disclosure Requirements. The ASU modifies the criteria used in defining an investment company under U.S. Generally Accepted Accounting Principles and also sets forth certain measurement and disclosure requirements. Under the ASU, an entity that is registered under the 1940 Act automatically qualifies as an investment company. The ASU is effective for interim and annual reporting periods beginning after December 15, 2013. Management has reviewed the requirements and believes the adoption of this ASU will not have a material impact on the financial statements.
15. SUBSEQUENT EVENTS
The Fund has evaluated subsequent events through the issuance of the financial statements and determined that no events have occurred that require disclosure other than those already disclosed in the financial statements.
| | | | |
ABBREVIATIONS | | | | |
| Counterparty | | Currency | | Selected Portfolio |
| | | | |
| BBU - Barclays Bank PLC | | CAD - Canadian Dollar | | ADR - American Depositary Receipts |
| BOFA - Bank of America Corp | | EUR - Euro | | FRN - Floating Rate Note |
| BONY - Bank of New York Mellon | | GBP - British Pound | | IDR - International Depositary Receipts |
| DBAB - Deutsche Bank AG | | JPY - Japanese Yen | | |
| FBCO - Credit Suisse Group AG | | USD - United States Dollar | | |
| HSBC - HSBC Bank USA, N.A. | | | | |
| SSBT - State Street Bank and Trust Co. | | | | |
MS-35
Franklin Templeton Variable Insurance Products Trust
Mutual Shares Securities Fund
Report of Independent Registered Public Accounting Firm
To the Board of Trustees and Shareholders of Franklin Templeton Variable Insurance Products Trust
In our opinion, the accompanying statement of assets and liabilities, including the statement of investments, and the related statements of operations and of changes in net assets and the financial highlights present fairly, in all material respects, the financial position of The Mutual Shares Securities Fund (the “Fund”) at December 31, 2013, the results of its operations for the year then ended, the changes in its net assets for each of the two years in the period then ended and the financial highlights for each of the five years in the period then ended, in conformity with accounting principles generally accepted in the United States of America. These financial statements and financial highlights (hereafter referred to as “financial statements”) are the responsibility of the Fund’s management. Our responsibility is to express an opinion on these financial statements based on our audits. We conducted our audits of these financial statements in accordance with the standards of the Public Company Accounting Oversight Board (United States). Those standards require that we plan and perform the audit to obtain reasonable assurance about whether the financial statements are free of material misstatement. An audit includes examining, on a test basis, evidence supporting the amounts and disclosures in the financial statements, assessing the accounting principles used and significant estimates made by management, and evaluating the overall financial statement presentation. We believe that our audits, which included confirmation of securities at December 31, 2013 by correspondence with the custodian and brokers, provides a reasonable basis for our opinion.
PricewaterhouseCoopers LLP
San Francisco, California
February 14, 2014
MS-36
Franklin Templeton Variable Insurance Products Trust
Tax Information (unaudited)
Mutual Shares Securities Fund
Under Section 854(b)(1)(A) of the Code, the Fund hereby reports 61.78% of the ordinary income dividends as income qualifying for the dividends received deduction for the fiscal year ended December 31, 2013.
MS-37
TEMPLETON DEVELOPING MARKETS SECURITIES FUND
This annual report for Templeton Developing Markets Securities Fund covers the fiscal year ended December 31, 2013.
Performance Summary as of 12/31/13
Average annual total return of Class 4 shares* represents the average annual change in value, assuming reinvestment of dividends and capital gains. Average returns smooth out variations in returns, which can be significant; they are not the same as year-by-year results.
Periods ended 12/31/13
| | | | | | | | | | | | |
| | | 1-Year | | | 5-Year | | | 10-Year | |
Average Annual Total Return | | | -1.07% | | | | +13.76% | | | | +9.06% | |
*For the period beginning 2/29/08, Class 4 performance reflects a 12b-1 fee expense of 0.35% per year, which affects future performance. Class 4 performance prior to 2/29/08 reflects historical Class 1 performance, which does not have a 12b-1 fee expense. Since 2/29/08 (effective date), the average annual total return of Class 4 shares was -0.38%. The Fund has a fee waiver associated with its investments in a Franklin Templeton money fund, contractually guaranteed through at least its current fiscal year end. Fund investment results reflect the fee waiver, to the extent applicable; without this reduction, the results would have been lower.
Total Return Index Comparison
for a Hypothetical $10,000 Investment (1/1/04–12/31/13)
The graph below shows the change in value of a hypothetical $10,000 investment in the Fund over the indicated period and includes reinvestment of any income or distributions. The Fund’s performance* is compared to the performance of the MSCI Emerging Markets (EM) Index and the Standard & Poor’s®/International Finance Corporation Investable (S&P®/IFCI) Composite Index. One cannot invest directly in an index, and an index is not representative of the Fund’s portfolio. Please see Important Notes to Performance Information preceding the Fund Summaries.
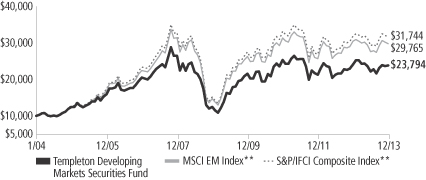
**Source: © 2014 Morningstar. Please see Index Descriptions following the Fund Summaries.
Templeton Developing Markets Securities Fund Class 4
Performance reflects the Fund’s Class 4 operating expenses, but does not include any contract fees, expenses or sales charges. If they had been included, performance would be lower. These charges and deductions, particularly for variable life policies, can have a significant effect on contract values and insurance benefits. See the contract prospectus for a complete description of these expenses, including sales charges.
Performance data represent past performance, which does not guarantee future results. Investment return and principal value will fluctuate, and you may have a gain or loss when you sell your shares.
Current performance may differ from figures shown.
TD-1
Fund Goal and Main Investments: Templeton Developing Markets Securities Fund seeks long-term capital appreciation. Under normal market conditions, the Fund invests at least 80% of its net assets in emerging market investments.
Performance Overview
You can find the Fund’s one-year total return in the Performance Summary. In comparison, the MSCI EM Index had a -2.27% total return, and the S&P/IFCI Composite Index had a -0.57% total return for the same period.1 Please note index performance numbers are for reference and we do not attempt to track an index but rather undertake investments on the basis of fundamental research.
Economic and Market Overview
The 12 months under review were characterized by reinvigorated policy support, an economic recovery in developed markets and a slowdown in emerging markets. Although several emerging market countries faced headwinds such as soft domestic demand, weak exports, market volatility and social unrest, emerging market economies overall continued to grow faster than developed market economies. Following a relatively subdued first half, China’s growth rate stabilized in the second half. Economic growth rates moderated in Russia, India and Indonesia but improved in Brazil, South Korea and Turkey. However, emerging market stock performance during the period appeared to be driven less by economic growth and corporate fundamentals and more by the fiscal and monetary policies in developed market countries.
After a weak start to 2013 as many investors locked in 2012 gains, emerging market stocks experienced a sharp sell-off in May and June amid concerns about a spike in China’s interbank rates and the U.S. Federal Reserve Board’s (Fed’s) potential tapering of its asset purchase program. When these fears were not realized, investor confidence rose in late June, leading to a partial rebound in emerging market stock prices. Financial markets grew volatile again in late August but recovered as tension surrounding Syria was defused and as the Fed announced it would delay tapering its asset purchase program. A U.S. budget impasse in late September and its resolution in October also moved the markets. The Chinese government’s announcement of social, economic and financial reforms boosted Chinese stocks in November.
1. Source: © 2014 Morningstar. One cannot invest directly in an index, and an index is not representative of the Fund’s portfolio. Please see Index Descriptions following the Fund Summaries.
Fund Risks: All investments involve risks, including possible loss of principal. Special risks are associated with foreign investing, including currency fluctuations, economic instability and political developments. Investments in developing markets, of which frontier markets are a subset, involve heightened risks related to the same factors, in addition to those associated with these markets’ smaller size, lesser liquidity and lack of established legal, political, business and social frameworks to support securities markets. Because these frameworks are typically even less developed in frontier markets, as well as various factors including the increased potential for extreme price volatility, illiquidity, trade barriers and exchange controls, the risks associated with developing markets are magnified in frontier markets. The Fund is designed for the aggressive portion of a well-diversified portfolio. The Fund is actively managed but there is no guarantee that the manager’s investment decisions will produce the desired results. The Fund’s prospectus also includes a description of the main investment risks.
TD-2
Emerging market stocks overall remained resilient despite the Fed’s December announcement that it would reduce its monthly bond purchases beginning in January 2014.
For the 12 months ended December 31, 2013, emerging market stocks, as measured by the MSCI EM Index, had a -2.27% total return in U.S. dollar terms, as weaker emerging market currencies hindered returns.1 Asia and Eastern Europe produced modest gains, while Latin America declined. In Asia, Taiwan, Malaysia, South Korea and China delivered gains, while Indonesia, Thailand, India and the Philippines posted losses. In Eastern Europe, Poland and Russia generated gains, while the Czech Republic and Hungary posted losses. Latin American markets such as Peru, Chile, Colombia and Brazil were among the worst performers, partly because of generally weak commodity prices and local currencies. In the largely frontier markets of the Middle East and Africa, the United Arab Emirates (UAE), Ghana and Kenya outperformed many of their global peers, while Lebanon, Tunisia and South Africa underperformed.
At year-end, global liquidity conditions continued to be accommodative. The Fed committed to keeping interest rates low as long as the U.S. unemployment rate remained over 6.5% and inflation expectations remained low. Furthermore, there were no signs at period-end indicating the Bank of Japan or the European Central Bank would tighten policy. We believe emerging and frontier market countries with strong economic fundamentals could continue to benefit from the high liquidity provided by major central banks, as investors seek higher yielding assets in a low interest rate environment. We viewed greater cooperation among major emerging and developed market countries as potentially beneficial for economic growth and financial markets. For example, in August, Brazil, Russia, India, China and South Africa (BRICS) decided on a capital structure for a proposed development bank aimed at supporting emerging market countries’ financing needs for infrastructure projects. In September, the BRICS countries committed $100 billion for a joint currency reserve to protect their economies from global financial market volatility and currency shocks. Toward year-end, China and the European Union agreed to negotiate a bilateral investment treaty in an effort to increase bilateral trade and improve access to each other’s markets.
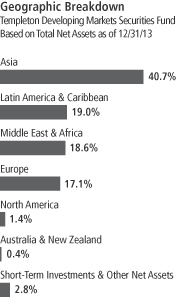
TD-3
Investment Strategy
We employ a fundamental research, value-oriented, long-term investment approach. We focus on the market price of a company’s securities relative to our evaluation of its long-term earnings, asset value and cash flow potential. We also consider a company’s profit and loss outlook, balance sheet strength, cash flow trends and asset value in relation to the current price. Our analysis considers the company’s corporate governance behavior as well as its position in its sector, the economic framework and political environment. We invest in securities without regard to benchmark comparisons.
Manager’s Discussion
During the 12 months under review, key contributors to the Fund’s absolute performance included Emaar Properties, a major property developer and manager with operations throughout the Middle East, notably in Dubai, UAE; Tata Consultancy Services, one of India’s largest information technology (IT) consulting and services firms; and Melco Crown Entertainment, one of Macau’s leading casino operators.
We believe that Emaar Properties provides an attractive exposure to Dubai’s recovering real estate market. With a substantial income stream from its shopping mall and hotel properties, Emaar has a greater measure of financial security than some of its peers, in our assessment. Solid growth in all sectors of Dubai’s real estate market and the Emirate’s winning bid to host the 2020 World Expo benefited the shares of real estate companies in the region, notably Emaar. Furthermore, in our analysis, Dubai’s rising tourism could continue to support Emaar’s hotel and retail operations.
Tata Consultancy Services reported strong corporate results in 2013 amid the IT outsourcing industry’s continued growth. Moreover, the company benefited from the rupee’s significant weakness against major currencies such as the U.S. dollar and euro, as its revenues are primarily based in foreign currencies, while most costs are in rupees. In our view, Tata Consultancy is a well-managed, attractively valued service provider that is well positioned to potentially benefit from the IT outsourcing industry’s continued growth.
Melco Crown Entertainment’s solid earnings results and favorable growth outlook helped boost the casino resort operator’s share price. Macau casinos continued to report strong visitor numbers and
TD-4
gambling revenue growth, which supported the share prices of Macau-focused casino operators as investors anticipated higher earnings. We believe that Chinese consumers’ rising disposable income could potentially benefit leisure businesses such as Melco Crown. Additionally, recent improvements to the transportation links between China’s population centers and Macau could potentially lead to strong revenue growth.
In contrast, key detractors from the Fund’s absolute performance included Souza Cruz, a major Brazilian cigarette company; Brazil-based Ambev, one of the world’s largest beer and soft drink producers; and Antofagasta, a Chilean copper mining group.
Brazil’s weak consumer demand, currency depreciation and higher taxes resulted in a challenging operating environment for Souza Cruz and Ambev in 2013, leading to share price declines. In our longer term view, however, we considered these companies to be attractive investments based on our belief that they have strong operations, low debt levels, dominant market shares and popular brands. Moreover, Brazil’s hosting of the 2014 FIFA World Cup and 2016 Summer Olympics could potentially support consumer demand.
Concerns about copper prices and weak demand pressured the stocks of many copper mining companies, including Antofagasta. We divested the Fund’s holdings in the company to raise funds for investment opportunities that we considered to be more attractive within our investment universe.
It is important to recognize the effect of currency movements on the Fund’s performance. In general, if the value of the U.S. dollar goes up compared with a foreign currency, an investment traded in that foreign currency will go down in value because it will be worth fewer U.S. dollars. This can have a negative effect on Fund performance. Conversely, when the U.S. dollar weakens in relation to a foreign currency, an investment traded in that foreign currency will increase in value, which can contribute to Fund performance. For the 12 months ended December 31, 2013, the U.S. dollar rose in value relative to most currencies. As a result, the Fund’s performance was negatively affected by the portfolio’s investment predominantly in securities with non-U.S. currency exposure.
In the past 12 months, our continued search for investments we considered to be attractively valued led us to increase the Fund’s exposure to Hong Kong, South Korea and Macau and to initiate a position in the
Top 10 Holdings
Templeton Developing Markets Securities Fund
12/31/13
| | | | |
Company
Sector/Industry,
Country | | % of Total
Net Assets | |
| Ambev SA | | | 10.6% | |
| Beverages, Brazil | | | | |
| Souza Cruz SA | | | 4.5% | |
| Tobacco, Brazil | | | | |
| Remgro Ltd. | | | 4.4% | |
Diversified Financial Services,
South Africa | |
| Emaar Properties PJSC | | | 4.3% | |
| Real Estate Management & Development, UAE | | | | |
| Melco Crown Entertainment Ltd., ADR | | | 3.7% | |
Hotels, Restaurants & Leisure,
China | |
| Tata Consultancy Services Ltd. | | | 3.7% | |
| IT Services, India | | | | |
| SJM Holdings Ltd. | | | 3.5% | |
Hotels, Restaurants & Leisure,
Hong Kong | |
| Sands China Ltd. | | | 3.3% | |
Hotels, Restaurants & Leisure,
Macau | |
| Compagnie Financiere Richemont SA | | | 3.0% | |
| Textiles, Apparel & Luxury Goods, Switzerland | | | | |
| Samsung Electronics Co. Ltd. | | | 2.9% | |
| Semiconductors & Semiconductor Equipment, South Korea | | | | |
The dollar value, number of shares or principal amount, and names of all portfolio holdings are listed in the Fund’s Statement of Investments.
TD-5
Philippines. We also made some purchases in the U.K., Switzerland and Belgium as we identified companies listed in these developed countries that have significant emerging market operations, giving them the potential to benefit from emerging market countries’ stronger personal income and consumer demand growth. Moreover, we added to the Fund’s investments in Saudi Arabia, Qatar, the UAE and Nigeria as we identified companies in these frontier market countries that we believe have solid growth potential. We made some of the largest additions in hotels, restaurants and leisure; beverages; tobacco; real estate management and development; and textiles, apparel and luxury goods companies. Key purchases included new positions in Unilever, a U.K.-listed global consumer products company with more than 50% of its sales in emerging and frontier markets; Sands China and Melco Crown Entertainment, two of Macau’s leading casino operators; and Belgium-listed Anheuser-Busch InBev, the world’s largest brewer.
Conversely, we reduced the Fund’s investments in Russia, Indonesia, India and China via China H shares as certain stocks reached their target prices and as we focused on stocks we considered to be more attractively valued within our investment universe.2 We reduced the Fund’s holdings largely in oil, gas and consumable fuels; commercial banking; and automobile companies. Key sales included the Fund’s positions in Indonesian car and motorcycle manufacturer Astra International, Chinese oil and gas company PetroChina and Thai commercial bank Kasikornbank.
Thank you for your participation in Templeton Developing Markets Securities Fund. We look forward to serving your future investment needs.
2. “China H” denotes shares of China-incorporated, Hong Kong Stock Exchange-listed companies with most businesses in China.
The foregoing information reflects our analysis, opinions and portfolio holdings as of December 31, 2013, the end of the reporting period. The way we implement our main investment strategies and the resulting portfolio holdings may change depending on factors such as market and economic conditions. These opinions may not be relied upon as investment advice or an offer for a particular security. The information is not a complete analysis of every aspect of any market, country, industry, security or the Fund. Statements of fact are from sources considered reliable, but the investment manager makes no representation or warranty as to their completeness or accuracy. Although historical performance is no guarantee of future results, these insights may help you understand our investment management philosophy.
Top 10 Countries
Templeton Developing Markets Securities Fund
12/31/13
| | | | |
| | | % of Total
Net Assets | |
| Brazil | | | 16.6% | |
| Hong Kong | | | 11.4% | |
| China | | | 11.2% | |
| U.K. | | | 5.6% | |
| India | | | 5.1% | |
| South Africa | | | 5.0% | |
| Russia | | | 4.9% | |
| UAE | | | 4.3% | |
| South Korea | | | 4.3% | |
| Macau | | | 3.3% | |
TD-6
Fund Expenses
As an investor in a variable insurance contract (Contract) that indirectly provides for investment in an underlying mutual fund, you can incur transaction and/or ongoing expenses at both the Fund level and the Contract level.
| • | | Transaction expenses can include sales charges (loads) on purchases, redemption fees, surrender fees, transfer fees and premium taxes. |
| • | | Ongoing expenses can include management fees, distribution and service (12b-1) fees, contract fees, annual maintenance fees, mortality and expense risk fees and other fees and expenses. All mutual funds and Contracts have some types of ongoing expenses. |
The expenses shown in the table are meant to highlight ongoing expenses at the Fund level only and do not include ongoing expenses at the Contract level, or transaction expenses at either the Fund or Contract level. While the Fund does not have transaction expenses, if the transaction and ongoing expenses at the Contract level were included, the expenses shown below would be higher. You should consult your Contract prospectus or disclosure document for more information.
The table shows Fund-level ongoing expenses and can help you understand these expenses and compare them with those of other mutual funds offered through the Contract. The table assumes a $1,000 investment held for the six months indicated. Please refer to the Fund prospectus for additional information on operating expenses.
Actual Fund Expenses
The first line (Actual) of the table provides actual account values and expenses. The “Ending Account Value” is derived from the Fund’s actual return, which includes the effect of ongoing Fund expenses, but does not include the effect of ongoing Contract expenses.
You can estimate the Fund-level expenses you incurred during the period by following these steps. Of course, your account value and expenses will differ from those in this illustration:
| 1. | Divide your account value by $1,000. |
If an account had an $8,600 value, then $8,600 ÷ $1,000 = 8.6.
| 2. | Multiply the result by the number under the heading “Fund-Level Expenses Incurred During Period.” |
If Fund-Level Expenses Incurred During Period were $7.50, then 8.6 x $7.50 = $64.50.
In this illustration, the estimated expenses incurred this period at the Fund level are $64.50.
Templeton Developing Markets Securities Fund Class 4
TD-7
Hypothetical Example for Comparison with Other Mutual Funds
Information in the second line (Hypothetical) of the table can help you compare ongoing expenses of the Fund with those of other mutual funds offered through the Contract. This information may not be used to estimate the actual ending account balance or expenses you incurred during the period. The hypothetical “Ending Account Value” is based on the Fund’s actual expense ratio and an assumed 5% annual rate of return before expenses, which does not represent the Fund’s actual return. The figure under the heading “Fund-Level Expenses Incurred During Period” shows the hypothetical expenses your account would have incurred under this scenario. You can compare this figure with the 5% hypothetical examples that appear in shareholder reports of other funds offered through a Contract.
| | | | | | | | | | | | |
| Class 4 | | Beginning
Account Value 7/1/13 | | | Ending
Account Value 12/31/13 | | | Fund-Level Expenses Incurred
During Period* 7/1/13–12/31/13 | |
Actual | | $ | 1,000 | | | $ | 1,072.60 | | | $ | 8.83 | |
Hypothetical (5% return before expenses) | | $ | 1,000 | | | $ | 1,016.69 | | | $ | 8.59 | |
*Expenses are calculated using the most recent six-month annualized expense ratio for the Fund’s Class 4 shares (1.69%), which does not include any ongoing expenses of the Contract for which the Fund is an investment option, multiplied by the average account value over the period, multiplied by 184/365 to reflect the one-half year period.
TD-8
Franklin Templeton Variable Insurance Products Trust
Financial Highlights
Templeton Developing Markets Securities Fund
| | | | | | | | | | | | | | | | | | | | |
| | | Year Ended December 31, | |
| Class 1 | | 2013 | | | 2012 | | | 2011 | | | 2010 | | | 2009 | |
| | | | |
Per share operating performance | | | | | | | | | | | | | | | | | | | | |
(for a share outstanding throughout the year) | | | | | | | | | | | | | | | | | | | | |
Net asset value, beginning of year | | $ | 10.58 | | | $ | 9.50 | | | $ | 11.40 | | | $ | 9.86 | | | $ | 6.11 | |
| | | | |
Income from investment operationsa: | | | | | | | | | | | | | | | | | | | | |
Net investment incomeb | | | 0.13 | | | | 0.19 | | | | 0.17 | | | | 0.09 | | | | 0.12 | |
Net realized and unrealized gains (losses) | | | (0.22 | ) | | | 1.06 | | | | (1.94 | ) | | | 1.63 | | | | 4.02 | |
| | | | |
Total from investment operations | | | (0.09 | ) | | | 1.25 | | | | (1.77 | ) | | | 1.72 | | | | 4.14 | |
| | | | |
Less distributions from: | | | | | | | | | | | | | | | | | | | | |
Net investment income | | | (0.23 | ) | | | (0.17 | ) | | | (0.13 | ) | | | (0.18 | ) | | | (0.36 | ) |
Net realized gains | | | — | | | | — | | | | — | | | | — | | | | (0.03 | ) |
| | | | |
Total distributions | | | (0.23 | ) | | | (0.17 | ) | | | (0.13 | ) | | | (0.18 | ) | | | (0.39 | ) |
| | | | |
Redemption feesc | | | — | | | | — | | | | — | | | | — | | | | — | |
| | | | |
Net asset value, end of year | | $ | 10.26 | | | $ | 10.58 | | | $ | 9.50 | | | $ | 11.40 | | | $ | 9.86 | |
| | | | |
| | | | | |
Total returnd | | | (0.73)% | | | | 13.40% | | | | (15.67)% | | | | 17.83% | | | | 73.32% | |
Ratios to average net assets | | | | | | | | | | | | | | | | | | | | |
Expenses | | | 1.35% | | | | 1.35% | | | | 1.40% | | | | 1.49% | e | | | 1.45% | e |
Net investment income | | | 1.25% | | | | 1.93% | | | | 1.57% | | | | 0.87% | | | | 1.64% | |
| | | | | |
Supplemental data | | | | | | | | | | | | | | | | | | | | |
Net assets, end of year (000’s) | | $ | 145,707 | | | $ | 203,568 | | | $ | 232,544 | | | $ | 347,242 | | | $ | 325,927 | |
Portfolio turnover rate | | | 44.59% | | | | 24.45% | | | | 14.90% | | | | 24.41% | | | | 56.58% | f |
aThe amount shown for a share outstanding throughout the period may not correlate with the Statement of Operations for the period due to the timing of sales and repurchases of the Fund shares in relation to income earned and/or fluctuating market value of the investments of the Fund.
bBased on average daily shares outstanding.
cAmount rounds to less than $0.01 per share.
dTotal return does not include fees, charges or expenses imposed by the variable annuity and life insurance contracts for which the Franklin Templeton Variable Insurance Products Trust serves as an underlying investment vehicle.
eBenefit of expense reduction rounds to less than 0.01%.
fExcludes the value of portfolio securities delivered as a result of a redemption in-kind.
The accompanying notes are an integral part of these financial statements.
TD-9
Franklin Templeton Variable Insurance Products Trust
Financial Highlights (continued)
Templeton Developing Markets Securities Fund
| | | | | | | | | | | | | | | | | | | | |
| | | Year Ended December 31, | |
| Class 2 | | 2013 | | | 2012 | | | 2011 | | | 2010 | | | 2009 | |
| | | | |
Per share operating performance | | | | | | | | | | | | | | | | | | | | |
(for a share outstanding throughout the year) | | | | | | | | | | | | | | | | | | | | |
Net asset value, beginning of year | | $ | 10.50 | | | $ | 9.42 | | | $ | 11.30 | | | $ | 9.78 | | | $ | 6.04 | |
| | | | |
Income from investment operationsa: | | | | | | | | | | | | | | | | | | | | |
Net investment incomeb | | | 0.10 | | | | 0.17 | | | | 0.14 | | | | 0.06 | | | | 0.11 | |
Net realized and unrealized gains (losses) | | | (0.21 | ) | | | 1.05 | | | | (1.92 | ) | | | 1.62 | | | | 3.98 | |
| | | | |
Total from investment operations | | | (0.11 | ) | | | 1.22 | | | | (1.78 | ) | | | 1.68 | | | | 4.09 | |
| | | | |
Less distributions from: | | | | | | | | | | | | | | | | | | | | |
Net investment income | | | (0.20 | ) | | | (0.14 | ) | | | (0.10 | ) | | | (0.16 | ) | | | (0.32 | ) |
Net realized gains | | | — | | | | — | | | | — | | | | — | | | | (0.03 | ) |
| | | | |
Total distributions | | | (0.20 | ) | | | (0.14 | ) | | | (0.10 | ) | | | (0.16 | ) | | | (0.35 | ) |
| | | | |
Redemption feesc | | | — | | | | — | | | | — | | | | — | | | | — | |
| | | | |
Net asset value, end of year | | $ | 10.19 | | | $ | 10.50 | | | $ | 9.42 | | | $ | 11.30 | | | $ | 9.78 | |
| | | | |
| | | | | |
Total returnd | | | (0.92)% | | | | 13.16% | | | | (15.86)% | | | | 17.58% | | | | 72.59% | |
Ratios to average net assets | | | | | | | | | | | | | | | | | | | | |
Expenses | | | 1.60% | | | | 1.60% | | | | 1.65% | | | | 1.74% | e | | | 1.70% | e |
Net investment income | | | 1.00% | | | | 1.68% | | | | 1.32% | | | | 0.62% | | | | 1.39% | |
| | | | | |
Supplemental data | | | | | | | | | | | | | | | | | | | | |
Net assets, end of year (000’s) | | $ | 274,683 | | | $ | 291,638 | | | $ | 295,223 | | | $ | 392,546 | | | $ | 435,947 | |
Portfolio turnover rate | | | 44.59% | | | | 24.45% | | | | 14.90% | | | | 24.41% | | | | 56.58% | f |
aThe amount shown for a share outstanding throughout the period may not correlate with the Statement of Operations for the period due to the timing of sales and repurchases of the Fund shares in relation to income earned and/or fluctuating market value of the investments of the Fund.
bBased on average daily shares outstanding.
cAmount rounds to less than $0.01 per share.
dTotal return does not include fees, charges or expenses imposed by the variable annuity and life insurance contracts for which the Franklin Templeton Variable Insurance Products Trust serves as an underlying investment vehicle.
eBenefit of expense reduction rounds to less than 0.01%.
fExcludes the value of portfolio securities delivered as a result of a redemption in-kind.
The accompanying notes are an integral part of these financial statements.
TD-10
Franklin Templeton Variable Insurance Products Trust
Financial Highlights (continued)
Templeton Developing Markets Securities Fund
| | | | | | | | | | | | | | | | | | | | |
| | | Year Ended December 31, | |
| Class 3 | | 2013 | | | 2012 | | | 2011 | | | 2010 | | | 2009 | |
| | | | |
Per share operating performance | | | | | | | | | | | | | | | | | | | | |
(for a share outstanding throughout the year) | | | | | | | | | | | | | | | | | | | | |
Net asset value, beginning of year | | $ | 10.43 | | | $ | 9.36 | | | $ | 11.23 | | | $ | 9.73 | | | $ | 6.02 | |
| | | | |
Income from investment operationsa: | | | | | | | | | | | | | | | | | | | | |
Net investment incomeb | | | 0.11 | | | | 0.17 | | | | 0.14 | | | | 0.06 | | | | 0.10 | |
Net realized and unrealized gains (losses) | | | (0.22 | ) | | | 1.04 | | | | (1.91 | ) | | | 1.60 | | | | 3.97 | |
| | | | |
Total from investment operations | | | (0.11 | ) | | | 1.21 | | | | (1.77 | ) | | | 1.66 | | | | 4.07 | |
| | | | |
Less distributions from: | | | | | | | | | | | | | | | | | | | | |
Net investment income | | | (0.20 | ) | | | (0.14 | ) | | | (0.10 | ) | | | (0.16 | ) | | | (0.33 | ) |
Net realized gains | | | — | | | | — | | | | — | | | | — | | | | (0.03 | ) |
| | | | |
Total distributions | | | (0.20 | ) | | | (0.14 | ) | | | (0.10 | ) | | | (0.16 | ) | | | (0.36 | ) |
| | | | |
Redemption feesc | | | — | | | | — | | | | — | | | | — | | | | — | |
| | | | |
Net asset value, end of year | | $ | 10.12 | | | $ | 10.43 | | | $ | 9.36 | | | $ | 11.23 | | | $ | 9.73 | |
| | | | |
| | | | | |
Total returnd | | | (0.97)% | | | | 13.16% | | | | (15.86)% | | | | 17.51% | | | | 72.63% | |
Ratios to average net assets | | | | | | | | | | | | | | | | | | | | |
Expenses | | | 1.60% | | | | 1.60% | | | | 1.65% | | | | 1.74% | e | | | 1.70% | e |
Net investment income | | | 1.00% | | | | 1.68% | | | | 1.32% | | | | 0.62% | | | | 1.39% | |
| | | | | |
Supplemental data | | | | | | | | | | | | | | | | | | | | |
Net assets, end of year (000’s) | | $ | 34,651 | | | $ | 48,277 | | | $ | 44,702 | | | $ | 66,484 | | | $ | 66,718 | |
Portfolio turnover rate | | | 44.59% | | | | 24.45% | | | | 14.90% | | | | 24.41% | | | | 56.58% | f |
aThe amount shown for a share outstanding throughout the period may not correlate with the Statement of Operations for the period due to the timing of sales and repurchases of the Fund shares in relation to income earned and/or fluctuating market value of the investments of the Fund.
bBased on average daily shares outstanding.
cAmount rounds to less than $0.01 per share.
dTotal return does not include fees, charges or expenses imposed by the variable annuity and life insurance contracts for which the Franklin Templeton Variable Insurance Products Trust serves as an underlying investment vehicle.
eBenefit of expense reduction rounds to less than 0.01%.
fExcludes the value of portfolio securities delivered as a result of a redemption in-kind.
The accompanying notes are an integral part of these financial statements.
TD-11
Franklin Templeton Variable Insurance Products Trust
Financial Highlights (continued)
Templeton Developing Markets Securities Fund
| | | | | | | | | | | | | | | | | | | | |
| | | Year Ended December 31, | |
| Class 4 | | 2013 | | | 2012 | | | 2011 | | | 2010 | | | 2009 | |
| | | | |
Per share operating performance | | | | | | | | | | | | | | | | | | | | |
(for a share outstanding throughout the year) | | | | | | | | | | | | | | | | | | | | |
Net asset value, beginning of year | | $ | 10.50 | | | $ | 9.42 | | | $ | 11.30 | | | $ | 9.80 | | | $ | 6.09 | |
| | | | |
Income from investment operationsa: | | | | | | | | | | | | | | | | | | | | |
Net investment incomeb | | | 0.10 | | | | 0.16 | | | | 0.13 | | | | 0.05 | | | | 0.09 | |
Net realized and unrealized gains (losses) | | | (0.21 | ) | | | 1.04 | | | | (1.91 | ) | | | 1.61 | | | | 4.00 | |
| | | | |
Total from investment operations | | | (0.11 | ) | | | 1.20 | | | | (1.78 | ) | | | 1.66 | | | | 4.09 | |
| | | | |
Less distributions from: | | | | | | | | | | | | | | | | | | | | |
Net investment income | | | (0.19 | ) | | | (0.12 | ) | | | (0.10 | ) | | | (0.16 | ) | | | (0.35 | ) |
Net realized gains | | | — | | | | — | | | | — | | | | — | | | | (0.03 | ) |
| | | | |
Total distributions | | | (0.19 | ) | | | (0.12 | ) | | | (0.10 | ) | | | (0.16 | ) | | | (0.38 | ) |
| | | | |
Redemption feesc | | | — | | | | — | | | | — | | | | — | | | | — | |
| | | | |
Net asset value, end of year | | $ | 10.20 | | | $ | 10.50 | | | $ | 9.42 | | | $ | 11.30 | | | $ | 9.80 | |
| | | | |
| | | | | |
Total returnd | | | (1.07)% | | | | 13.06% | | | | (15.88)% | | | | 17.41% | | | | 72.45% | |
Ratios to average net assets | | | | | | | | | | | | | | | | | | | | |
Expenses | | | 1.70% | | | | 1.70% | | | | 1.75% | | | | 1.84% | e | | | 1.80% | e |
Net investment income | | | 0.90% | | | | 1.58% | | | | 1.22% | | | | 0.52% | | | | 1.29% | |
| | | | | |
Supplemental data | | | | | | | | | | | | | | | | | | | | |
Net assets, end of year (000’s) | | $ | 15,225 | | | $ | 23,341 | | | $ | 24,380 | | | $ | 37,198 | | | $ | 26,362 | |
Portfolio turnover rate | | | 44.59% | | | | 24.45% | | | | 14.90% | | | | 24.41% | | | | 56.58% | f |
aThe amount shown for a share outstanding throughout the period may not correlate with the Statement of Operations for the period due to the timing of sales and repurchases of the Fund shares in relation to income earned and/or fluctuating market value of the investments of the Fund.
bBased on average daily shares outstanding.
cAmount rounds to less than $0.01 per share.
dTotal return does not include fees, charges or expenses imposed by the variable annuity and life insurance contracts for which the Franklin Templeton Variable Insurance Products Trust serves as an underlying investment vehicle.
eBenefit of expense reduction rounds to less than 0.01%.
fExcludes the value of portfolio securities delivered as a result of a redemption in-kind.
The accompanying notes are an integral part of these financial statements.
TD-12
Franklin Templeton Variable Insurance Products Trust
Statement of Investments, December 31, 2013
| | | | | | | | | | |
| Templeton Developing Markets Securities Fund | | Industry | | Shares | | | Value | |
Closed End Funds 0.4% | | | | | | | | | | |
Romania 0.4% | | | | | | | | | | |
SIF Moldova | | Diversified Financial Services | | | 1,326,345 | | | $ | 599,363 | |
SIF Oltenia | | Diversified Financial Services | | | 1,975,791 | | | | 1,205,032 | |
| | | | | | | | | | |
Total Closed End Funds (Cost $1,309,811) | | | | | | | | | 1,804,395 | |
| | | | | | | | | | |
Common Stocks 91.0% | | | | | | | | | | |
Argentina 0.1% | | | | | | | | | | |
a,b Grupo Clarin SA, B, GDR, Reg S | | Media | | | 47,911 | | | | 275,488 | |
| | | | | | | | | | |
Australia 0.4% | | | | | | | | | | |
BHP Billiton Ltd. | | Metals & Mining | | | 56,757 | | | | 1,924,731 | |
| | | | | | | | | | |
Belgium 2.2% | | | | | | | | | | |
Anheuser-Busch InBev NV | | Beverages | | | 95,309 | | | | 10,128,595 | |
| | | | | | | | | | |
Brazil 16.6% | | | | | | | | | | |
Ambev SA | | Beverages | | | 6,811,750 | | | | 49,946,874 | |
M Dias Branco SA | | Food Products | | | 173,700 | | | | 7,353,626 | |
Souza Cruz SA | | Tobacco | | | 2,053,928 | | | | 20,964,482 | |
| | | | | | | | | | |
| | | | | | | | | 78,264,982 | |
| | | | | | | | | | |
China 11.2% | | | | | | | | | | |
AAC Technologies Holdings Inc. | | Communications Equipment | | | 889,600 | | | | 4,319,310 | |
aAngang Steel Co. Ltd., H | | Metals & Mining | | | 5,129,000 | | | | 3,809,867 | |
China Overseas Land & Investment Ltd. | | Real Estate Management & Development | | | 2,002,900 | | | | 5,630,803 | |
aChina Shipping Development Co. Ltd., H | | Marine | | | 6,062,800 | | | | 4,691,148 | |
CNOOC Ltd. | | Oil, Gas & Consumable Fuels | | | 1,191,400 | | | | 2,215,529 | |
Great Wall Motor Co. Ltd., H | | Automobiles | | | 867,077 | | | | 4,774,635 | |
Lenovo Group Ltd. | | Computers & Peripherals | | | 3,904,700 | | | | 4,748,473 | |
aMelco Crown Entertainment Ltd., ADR | | Hotels, Restaurants & Leisure | | | 448,443 | | | | 17,587,934 | |
aNetEase Inc., ADR | | Internet Software & Services | | | 63,300 | | | | 4,975,380 | |
| | | | | | | | | | |
| | | | | | | | | 52,753,079 | |
| | | | | | | | | | |
Colombia 0.4% | | | | | | | | | | |
Ecopetrol SA, ADR | | Oil, Gas & Consumable Fuels | | | 46,835 | | | | 1,800,806 | |
| | | | | | | | | | |
Egypt 0.0%† | | | | | | | | | | |
Egyptian International Pharmaceutical Industries Co. | | Pharmaceuticals | | | 23,609 | | | | 147,290 | |
| | | | | | | | | | |
Georgia 0.1% | | | | | | | | | | |
Bank of Georgia Holdings PLC | | Commercial Banks | | | 11,994 | | | | 475,171 | |
| | | | | | | | | | |
Hong Kong 11.4% | | | | | | | | | | |
Dairy Farm International Holdings Ltd. | | Food & Staples Retailing | | | 966,133 | | | | 9,178,264 | |
aEsprit Holdings Ltd. | | Specialty Retail | | | 572,600 | | | | 1,107,636 | |
Giordano International Ltd. | | Specialty Retail | | | 4,631,000 | | | | 4,138,687 | |
I.T Ltd. | | Specialty Retail | | | 1,321,100 | | | | 340,738 | |
Luk Fook Holdings (International) Ltd. | | Specialty Retail | | | 2,224,513 | | | | 8,462,751 | |
cLuk Fook Holdings (International) Ltd., 144A | | Specialty Retail | | | 130,000 | | | | 494,561 | |
MGM China Holdings Ltd. | | Hotels, Restaurants & Leisure | | | 2,826,100 | | | | 12,081,634 | |
SJM Holdings Ltd. | | Hotels, Restaurants & Leisure | | | 4,909,930 | | | | 16,399,464 | |
aSummit Ascent Holdings Ltd. | | Trading Companies & Distributors | | | 927,000 | | | | 1,482,368 | |
| | | | | | | | | | |
| | | | | | | | | 53,686,103 | |
| | | | | | | | | | |
India 5.1% | | | | | | | | | | |
Tata Consultancy Services Ltd. | | IT Services | | | 495,500 | | | | 17,394,982 | |
Tata Motors Ltd. | | Automobiles | | | 1,063,000 | | | | 6,470,136 | |
| | | | | | | | | | |
| | | | | | | | | 23,865,118 | |
| | | | | | | | | | |
TD-13
Franklin Templeton Variable Insurance Products Trust
Statement of Investments, December 31, 2013 (continued)
| | | | | | | | | | |
| Templeton Developing Markets Securities Fund | | Industry | | Shares | | | Value | |
Common Stocks (continued) | | | | | | | | | | |
Indonesia 0.4% | | | | | | | | | | |
Bank Rakyat Indonesia Persero Tbk PT | | Commercial Banks | �� | | 3,203,600 | | | $ | 1,908,472 | |
| | | | | | | | | | |
Kenya 1.5% | | | | | | | | | | |
East African Breweries Ltd. | | Beverages | | | 210,500 | | | | 707,358 | |
Equity Bank Ltd. | | Commercial Banks | | | 8,986,101 | | | | 3,201,884 | |
Kenya Commercial Bank Ltd. | | Commercial Banks | | | 5,335,900 | | | | 2,936,909 | |
| | | | | | | | | | |
| | | | | | | | | 6,846,151 | |
| | | | | | | | | | |
Macau 3.3% | | | | | | | | | | |
Sands China Ltd. | | Hotels, Restaurants & Leisure | | | 1,905,000 | | | | 15,624,520 | |
| | | | | | | | | | |
Mexico 0.3% | | | | | | | | | | |
Kimberly Clark de Mexico SAB de CV, A | | Household Products | | | 489,532 | | | | 1,395,388 | |
| | | | | | | | | | |
Nigeria 1.7% | | | | | | | | | | |
Ecobank Transnational Inc. | | Commercial Banks | | | 2,631,065 | | | | 265,985 | |
FBN Holdings PLC | | Commercial Banks | | | 36,527,236 | | | | 3,722,375 | |
Nigerian Breweries PLC | | Beverages | | | 3,770,084 | | | | 3,957,469 | |
| | | | | | | | | | |
| | | | | | | | | 7,945,829 | |
| | | | | | | | | | |
Philippines 1.1% | | | | | | | | | | |
Ayala Corp. | | Diversified Financial Services | | | 429,820 | | | | 5,014,567 | |
| | | | | | | | | | |
Qatar 2.5% | | | | | | | | | | |
Industries Qatar QSC | | Industrial Conglomerates | | | 255,782 | | | | 11,863,677 | |
| | | | | | | | | | |
Romania 0.2% | | | | | | | | | | |
Nuclearelectrica SA | | Independent Power Producers & Energy Traders | | | 43,925 | | | | 151,098 | |
a,c Societatea Nationala de Gaze Naturale ROMGAZ SA, 144A | | Oil, Gas & Consumable Fuels | | | 85,800 | | | | 901,783 | |
| | | | | | | | | | |
| | | | | | | | | 1,052,881 | |
| | | | | | | | | | |
Russia 3.5% | | | | | | | | | | |
cAlrosa AO, 144A | | Metals & Mining | | | 3,445,400 | | | | 3,740,600 | |
d LUKOIL Holdings, ADR | | Oil, Gas & Consumable Fuels | | | 29,958 | | | | 1,870,877 | |
d LUKOIL Holdings, ADR (London Stock Exchange) | | Oil, Gas & Consumable Fuels | | | 174,418 | | | | 10,892,404 | |
| | | | | | | | | | |
| | | | | | | | | 16,503,881 | |
| | | | | | | | | | |
Singapore 1.0% | | | | | | | | | | |
K-REIT Asia | | Real Estate Investment Trusts (REITs) | | | 5,248,511 | | | | 4,929,058 | |
| | | | | | | | | | |
South Africa 5.0% | | | | | | | | | | |
MTN Group Ltd. | | Wireless Telecommunication Services | | | 134,100 | | | | 2,774,297 | |
Remgro Ltd. | | Diversified Financial Services | | | 1,041,324 | | | | 20,629,929 | |
| | | | | | | | | | |
| | | | | | | | | 23,404,226 | |
| | | | | | | | | | |
South Korea 4.3% | | | | | | | | | | |
Grand Korea Leisure Co. Ltd. | | Hotels, Restaurants & Leisure | | | 170,220 | | | | 6,513,901 | |
Samsung Electronics Co. Ltd. | | Semiconductors & Semiconductor Equipment | | | 10,508 | | | | 13,655,996 | |
| | | | | | | | | | |
| | | | | | | | | 20,169,897 | |
| | | | | | | | | | |
Sweden 0.6% | | | | | | | | | | |
Oriflame Cosmetics SA, SDR | | Personal Products | | | 87,856 | | | | 2,697,336 | |
| | | | | | | | | | |
Switzerland 3.0% | | | | | | | | | | |
Compagnie Financiere Richemont SA | | Textiles, Apparel & Luxury Goods | | | 143,641 | | | | 14,298,886 | |
| | | | | | | | | | |
Taiwan 1.0% | | | | | | | | | | |
Taiwan Semiconductor Manufacturing Co. Ltd. | | Semiconductors & Semiconductor Equipment | | | 1,325,500 | | | | 4,687,671 | |
| | | | | | | | | | |
TD-14
Franklin Templeton Variable Insurance Products Trust
Statement of Investments, December 31, 2013 (continued)
| | | | | | | | | | |
| Templeton Developing Markets Securities Fund | | Industry | | Shares | | | Value | |
Common Stocks (continued) | | | | | | | | | | |
Thailand 1.7% | | | | | | | | | | |
Shin Corp. PCL, fgn. | | Wireless Telecommunication Services | | | 1,306,200 | | | $ | 2,774,478 | |
Thai Beverage PCL | | Beverages | | | 12,053,200 | | | | 5,158,288 | |
| | | | | | | | | | |
| | | | | | | | | 7,932,766 | |
| | | | | | | | | | |
Turkey 0.1% | | | | | | | | | | |
Yazicilar Holding AS | | Industrial Conglomerates | | | 43,862 | | | | 382,856 | |
| | | | | | | | | | |
Turkmenistan 0.1% | | | | | | | | | | |
Dragon Oil PLC | | Oil, Gas & Consumable Fuels | | | 65,784 | | | | 619,005 | |
| | | | | | | | | | |
United Arab Emirates 4.3% | | | | | | | | | | |
Emaar Properties PJSC | | Real Estate Management &
Development | | | 9,763,577 | | | | 20,308,665 | |
| | | | | | | | | | |
United Kingdom 5.6% | | | | | | | | | | |
British American Tobacco PLC | | Tobacco | | | 249,100 | | | | 13,352,129 | |
Unilever PLC | | Food Products | | | 316,084 | | | | 12,993,492 | |
| | | | | | | | | | |
| | | | | | | | | 26,345,621 | |
| | | | | | | | | | |
United States 1.4% | | | | | | | | | | |
Avon Products Inc. | | Personal Products | | | 391,680 | | | | 6,744,730 | |
| | | | | | | | | | |
Vietnam 0.2% | | | | | | | | | | |
DHG Pharmaceutical JSC | | Pharmaceuticals | | | 95,800 | | | | 517,715 | |
Dong Phu Rubber JSC | | Chemicals | | | 104,160 | | | | 231,576 | |
| | | | | | | | | | |
| | | | | | | | | 749,291 | |
| | | | | | | | | | |
Zimbabwe 0.7% | | | | | | | | | | |
Delta Corp. Ltd. | | Beverages | | | 2,209,976 | | | | 3,096,176 | |
| | | | | | | | | | |
Total Common Stocks (Cost $299,958,882) | | | | | | | | | 427,842,913 | |
| | | | | | | | | | |
eParticipatory Notes 2.8% | | | | | | | | | | |
Saudi Arabia 2.8% | | | | | | | | | | |
c Deutsche Bank AG/London, Saudi Dairy & Foodstuff Co., 144A, 5/13/14 | | Food Products | | | 55,781 | | | | 1,282,809 | |
cHSBC Bank PLC, | | | | | | | | | | |
Al Mouwasat Medical Services, 144A, 4/13/15 | | Health Care Providers & Services | | | 19,800 | | | | 485,702 | |
Etihad Etisalat Co., 144A, 12/05/14 | | Wireless Telecommunication Services | | | 515,329 | | | | 11,748,091 | |
| | | | | | | | | | |
Total Participatory Notes (Cost $10,815,443) | | | | | | | | | 13,516,602 | |
| | | | | | | | | | |
Preferred Stocks 3.0% | | | | | | | | | | |
Chile 1.6% | | | | | | | | | | |
Embotelladora Andina SA, pfd., A | | Beverages | | | 2,068,717 | | | | 7,283,521 | |
| | | | | | | | | | |
Russia 1.4% | | | | | | | | | | |
Sberbank of Russia, pfd. | | Commercial Banks | | | 2,752,211 | | | | 6,719,064 | |
| | | | | | | | | | |
Total Preferred Stocks (Cost $11,239,911) | | | | | | | | | 14,002,585 | |
| | | | | | | | | | |
Total Investments before Short Term Investments (Cost $323,324,047) | | | | | | | | | 457,166,495 | |
| | | | | | | | | | |
TD-15
Franklin Templeton Variable Insurance Products Trust
Statement of Investments, December 31, 2013 (continued)
| | | | | | | | | | |
| Templeton Developing Markets Securities Fund | | | | Shares | | | Value | |
Short Term Investments (Cost $12,277,809) 2.6% | | | | | | | | | | |
Money Market Funds 2.6% | | | | | | | | | | |
United States 2.6% | | | | | | | | | | |
a,f Institutional Fiduciary Trust Money Market Portfolio | | | | | 12,277,809 | | | $ | 12,277,809 | |
| | | | | | | | | | |
Total Investments (Cost $335,601,856) 99.8% | | | | | | | | | 469,444,304 | |
Other Assets, less Liabilities 0.2% | | | | | | | | | 821,406 | |
| | | | | | | | | | |
Net Assets 100.0% | | | | | | | | $ | 470,265,710 | |
| | | | | | | | | | |
See Abbreviations on page TD-28.
†Rounds to less than 0.1% of net assets.
aNon-income producing.
bSecurity was purchased pursuant to Regulation S under the Securities Act of 1933, which exempts from registration securities offered and sold outside of the United States. Such a security cannot be sold in the United States without either an effective registration statement filed pursuant to the Securities Act of 1933, or pursuant to an exemption from registration. This security has been deemed liquid under guidelines approved by the Trust’s Board of Trustees.
cSecurity was purchased pursuant to Rule 144A under the Securities Act of 1933 and may be sold in transactions exempt from registration only to qualified institutional buyers or in a public offering registered under the Securities Act of 1933. These securities have been deemed liquid under guidelines approved by the Trust’s Board of Trustees. At December 31, 2013, the aggregate value of these securities was $18,653,546, representing 3.97% of net assets.
dAt December 31, 2013, pursuant to the Fund’s policies and the requirements of applicable securities law, the Fund may be restricted from trading these securities for a limited or extended period of time due to ownership limits and/or potential possession of material non-public information.
eSee Note 1(c) regarding Participatory Notes.
fSee Note 7 regarding investments in the Institutional Fiduciary Trust Money Market Portfolio.
The accompanying notes are an integral part of these financial statements.
TD-16
Franklin Templeton Variable Insurance Products Trust
Financial Statements
Statement of Assets and Liabilities
December 31, 2013
| | | | |
| | | Templeton
Developing Markets
Securities Fund | |
Assets: | | | | |
Investments in securities: | | | | |
Cost - Unaffiliated issuers | | $ | 323,324,047 | |
Cost - Sweep Money Fund (Note 7) | | | 12,277,809 | |
| | | | |
Total cost of investments | | $ | 335,601,856 | |
| | | | |
Value - Unaffiliated issuers | | $ | 457,166,495 | |
Value - Sweep Money Fund (Note 7) | | | 12,277,809 | |
| | | | |
Total value of investments | | | 469,444,304 | |
Cash | | | 852 | |
Foreign currency, at value (cost $47,388) | | | 47,388 | |
Receivables: | | | | |
Investment securities sold | | | 2,415,950 | |
Capital shares sold | | | 142,999 | |
Dividends | | | 210,342 | |
Foreign tax | | | 25,179 | |
Other assets | | | 12 | |
| | | | |
Total assets | | | 472,287,026 | |
| | | | |
Liabilities: | | | | |
Payables: | | | | |
Investment securities purchased | | | 458,487 | |
Capital shares redeemed | | | 516,507 | |
Management fees | | | 433,361 | |
Administrative fees | | | 55,772 | |
Distribution fees | | | 137,500 | |
Custodian fees | | | 149,186 | |
Reports to shareholders | | | 214,744 | |
Accrued expenses and other liabilities | | | 55,759 | |
| | | | |
Total liabilities | | | 2,021,316 | |
| | | | |
Net assets, at value | | $ | 470,265,710 | |
| | | | |
Net assets consist of: | | | | |
Paid-in capital | | $ | 363,881,784 | |
Distributions in excess of net investment income | | | (481,395 | ) |
Net unrealized appreciation (depreciation) | | | 133,819,737 | |
Accumulated net realized gain (loss) | | | (26,954,416 | ) |
| | | | |
Net assets, at value | | $ | 470,265,710 | |
| | | | |
The accompanying notes are an integral part of these financial statements.
TD-17
Franklin Templeton Variable Insurance Products Trust
Financial Statements (continued)
Statement of Assets and Liabilities (continued)
December 31, 2013
| | | | |
| | | Templeton
Developing Markets
Securities Fund | |
Class 1: | | | | |
Net assets, at value | | $ | 145,707,342 | |
| | | | |
Shares outstanding | | | 14,195,852 | |
| | | | |
Net asset value and maximum offering price per share | | $ | 10.26 | |
| | | | |
Class 2: | | | | |
Net assets, at value | | $ | 274,682,503 | |
| | | | |
Shares outstanding | | | 26,966,823 | |
| | | | |
Net asset value and maximum offering price per share | | $ | 10.19 | |
| | | | |
Class 3: | | | | |
Net assets, at value | | $ | 34,650,803 | |
| | | | |
Shares outstanding | | | 3,422,536 | |
| | | | |
Net asset value and maximum offering price per sharea | | $ | 10.12 | |
| | | | |
Class 4: | | | | |
Net assets, at value | | $ | 15,225,062 | |
| | | | |
Shares outstanding | | | 1,493,241 | |
| | | | |
Net asset value and maximum offering price per share | | $ | 10.20 | |
| | | | |
aRedemption price is equal to net asset value less redemption fees retained by the Fund.
The accompanying notes are an integral part of these financial statements.
TD-18
Franklin Templeton Variable Insurance Products Trust
Financial Statements (continued)
Statement of Operations
for the year ended December 31, 2013
| | | | |
| | | Templeton
Developing Markets
Securities Fund | |
Investment income: | | | | |
Dividends (net of foreign taxes of $1,022,583) | | $ | 13,364,543 | |
Income from securities loaned | | | 14,539 | |
| | | | |
Total investment income | | | 13,379,082 | |
| | | | |
Expenses: | | | | |
Management fees (Note 3a) | | | 5,647,955 | |
Administrative fees (Note 3b) | | | 724,451 | |
Distribution fees: (Note 3c) | | | | |
Class 2 | | | 703,863 | |
Class 3 | | | 102,353 | |
Class 4 | | | 67,695 | |
Unaffiliated transfer agent fees | | | 911 | |
Custodian fees (Note 4) | | | 349,498 | |
Reports to shareholders | | | 142,286 | |
Professional fees | | | 58,627 | |
Trustees’ fees and expenses | | | 2,160 | |
Other | | | 23,136 | |
| | | | |
Total expenses | | | 7,822,935 | |
| | | | |
Net investment income | | | 5,556,147 | |
| | | | |
Realized and unrealized gains (losses): | | | | |
Net realized gain (loss) from: | | | | |
Investments | | | 68,533,153 | |
Foreign currency transactions | | | (570,528 | ) |
| | | | |
Net realized gain (loss) | | | 67,962,625 | |
| | | | |
Net change in unrealized appreciation (depreciation) on: | | | | |
Investments | | | (79,209,837 | ) |
Translation of other assets and liabilities denominated in foreign currencies | | | (468 | ) |
Change in deferred taxes on unrealized appreciation | | | 21,147 | |
| | | | |
Net change in unrealized appreciation (depreciation) | | | (79,189,158 | ) |
| | | | |
Net realized and unrealized gain (loss) | | | (11,226,533 | ) |
| | | | |
Net increase (decrease) in net assets resulting from operations | | $ | (5,670,386 | ) |
| | | | |
The accompanying notes are an integral part of these financial statements.
TD-19
Franklin Templeton Variable Insurance Products Trust
Financial Statements (continued)
Statements of Changes in Net Assets
| | | | | | | | |
| | | Templeton Developing Markets
Securities Fund | |
| | | Year Ended December 31, | |
| | | 2013 | | | 2012 | |
| | | | |
Increase (decrease) in net assets: | | | | | | | | |
Operations: | | | | | | | | |
Net investment income | | $ | 5,556,147 | | | $ | 10,321,744 | |
Net realized gain (loss) from investments and foreign currency transactions | | | 67,962,625 | | | | 37,187,656 | |
Net change in unrealized appreciation (depreciation) on investments, translation of other assets and liabilities denominated in foreign currencies and deferred taxes | | | (79,189,158 | ) | | | 25,533,270 | |
| | | | |
Net increase (decrease) in net assets resulting from operations | | | (5,670,386 | ) | | | 73,042,670 | |
| | | | |
Distributions to shareholders from: | | | | | | | | |
Net investment income: | | | | | | | | |
Class 1 | | | (3,816,779 | ) | | | (3,523,272 | ) |
Class 2 | | | (5,449,449 | ) | | | (4,111,805 | ) |
Class 3 | | | (777,644 | ) | | | (716,639 | ) |
Class 4 | | | (373,848 | ) | | | (295,623 | ) |
| | | | |
Total distributions to shareholders | | | (10,417,720 | ) | | | (8,647,339 | ) |
| | | | |
Capital share transactions: (Note 2) | | | | | | | | |
Class 1 | | | (52,075,044 | ) | | | (52,933,691 | ) |
Class 2 | | | (8,867,643 | ) | | | (36,646,633 | ) |
Class 3 | | | (12,240,084 | ) | | | (1,195,085 | ) |
Class 4 | | | (7,287,727 | ) | | | (3,647,744 | ) |
| | | | |
Total capital share transactions | | | (80,470,498 | ) | | | (94,423,153 | ) |
| | | | |
Redemption fees | | | 1,204 | | | | 1,457 | |
| | | | |
Net increase (decrease) in net assets | | | (96,557,400 | ) | | | (30,026,365 | ) |
| | | | |
Net assets: | | | | | | | | |
Beginning of year | | | 566,823,110 | | | | 596,849,475 | |
| | | | |
End of year | | $ | 470,265,710 | | | $ | 566,823,110 | |
| | | | |
Undistributed net investment income (distributions in excess of net investment income)
included in net assets: | | | | | | | | |
End of year | | $ | (481,395 | ) | | $ | 3,581,480 | |
| | | | |
The accompanying notes are an integral part of these financial statements.
TD-20
Franklin Templeton Variable Insurance Products Trust
Notes to Financial Statements
Templeton Developing Markets Securities Fund
1. ORGANIZATION AND SIGNIFICANT ACCOUNTING POLICIES
Franklin Templeton Variable Insurance Products Trust (Trust) is registered under the Investment Company Act of 1940, as amended, (1940 Act) as an open-end investment company, consisting of twenty separate funds. The Templeton Developing Markets Securities Fund (Fund) is included in this report. The financial statements of the remaining funds in the Trust are presented separately. Shares of the Fund are generally sold only to insurance company separate accounts to fund the benefits of variable life insurance policies or variable annuity contracts. The Fund offers four classes of shares: Class 1, Class 2, Class 3, and Class 4. Each class of shares differs by its distribution fees, voting rights on matters affecting a single class and its exchange privilege.
The following summarizes the Fund’s significant accounting policies.
a. Financial Instrument Valuation
The Fund’s investments in financial instruments are carried at fair value daily. Fair value is the price that would be received to sell an asset or paid to transfer a liability in an orderly transaction between market participants on the measurement date. The Fund calculates the net asset value (NAV) per share at the close of the New York Stock Exchange (NYSE), generally at 4p.m. Eastern time (NYSE close) on each day the NYSE is open for trading. Under procedures approved by the Trust’s Board of Trustees (the Board), the Fund’s administrator, investment manager and other affiliates have formed the Valuation and Liquidity Oversight Committee (VLOC). The VLOC provides administration and oversight of the Fund’s valuation policies and procedures, which are approved annually by the Board. Among other things, these procedures allow the Fund to utilize independent pricing services, quotations from securities and financial instrument dealers, and other market sources to determine fair value.
Equity securities and exchange traded funds listed on an exchange or on the NASDAQ National Market System are valued at the last quoted sale price or the official closing price of the day, respectively. Foreign equity securities are valued as of the close of trading on the foreign stock exchange on which the security is primarily traded or as of the NYSE close, whichever is earlier. The value is then converted into its U.S. dollar equivalent at the foreign exchange rate in effect at the NYSE close on the day that the value of the security is determined. Over-the-counter (OTC) securities are valued within the range of the most recent quoted bid and ask prices. Securities that trade in multiple markets or on multiple exchanges are valued according to the broadest and most representative market. Certain equity securities are valued based upon fundamental characteristics or relationships to similar securities. Investments in open-end mutual funds are valued at the closing net asset value.
The Fund has procedures to determine the fair value of financial instruments for which market prices are not reliable or readily available. Under these procedures, the VLOC convenes on a regular basis to review such financial instruments and considers a number of factors, including significant unobservable valuation inputs, when arriving at fair value. The VLOC primarily employs a market-based approach which may use related or comparable assets or liabilities, recent transactions, market multiples, book values, and other relevant information for the investment to determine the fair value of the investment. An income-based valuation approach may also be used in which the anticipated future cash flows of the investment are discounted to calculate fair value. Discounts may also be applied due to the nature or duration of any restrictions on the disposition of the investments. Due to the inherent uncertainty of valuations of such investments, the fair values may differ significantly from the values that would have been used had an active market existed. The VLOC employs various methods for calibrating these valuation approaches including a regular review of key inputs and assumptions, transactional back-testing or disposition analysis, and reviews of any related market activity.
Trading in securities on foreign securities stock exchanges and OTC markets may be completed before the daily NYSE close. In addition, trading in certain foreign markets may not take place on every NYSE business day. Occasionally, events occur between the time at which trading in a foreign security is completed and the close of the NYSE that might call into question the reliability of the value of a portfolio security held by the Fund. As a result, differences may arise between the value of the Fund’s portfolio securities as determined at the foreign market close and the latest indications of value at the close of the NYSE. In order to minimize the potential for these differences, the VLOC monitors price movements following the close of trading in foreign stock
TD-21
Franklin Templeton Variable Insurance Products Trust
Notes to Financial Statements (continued)
Templeton Developing Markets Securities Fund
1. ORGANIZATION AND SIGNIFICANT ACCOUNTING POLICIES (continued)
a. Financial Instrument Valuation (continued)
markets through a series of country specific market proxies (such as baskets of American Depositary Receipts, futures contracts and exchange traded funds). These price movements are measured against established trigger thresholds for each specific market proxy to assist in determining if an event has occurred that may call into question the reliability of the values of the foreign securities held by the Fund. If such an event occurs, the securities may be valued using fair value procedures, which may include the use of independent pricing services.
Also, when the last day of the reporting period is a non-business day, certain foreign markets may be open on those days that the NYSE is closed, which could result in differences between the value of the Fund’s portfolio securities on the last business day and the last calendar day of the reporting period. Any significant security valuation changes due to an open foreign market are adjusted and reflected by the Fund for financial reporting purposes.
b. Foreign Currency Translation
Portfolio securities and other assets and liabilities denominated in foreign currencies are translated into U.S. dollars based on the exchange rate of such currencies against U.S. dollars on the date of valuation. The Fund may enter into foreign currency exchange contracts to facilitate transactions denominated in a foreign currency. Purchases and sales of securities, income and expense items denominated in foreign currencies are translated into U.S. dollars at the exchange rate in effect on the transaction date. Portfolio securities and assets and liabilities denominated in foreign currencies contain risks that those currencies will decline in value relative to the U.S. dollar. Occasionally, events may impact the availability or reliability of foreign exchange rates used to convert the U.S. dollar equivalent value. If such an event occurs, the foreign exchange rate will be valued at fair value using procedures established and approved by the Board.
The Fund does not separately report the effect of changes in foreign exchange rates from changes in market prices on securities held. Such changes are included in net realized and unrealized gain or loss from investments on the Statement of Operations.
Realized foreign exchange gains or losses arise from sales of foreign currencies, currency gains or losses realized between the trade and settlement dates on securities transactions and the difference between the recorded amounts of dividends, interest, and foreign withholding taxes and the U.S. dollar equivalent of the amounts actually received or paid. Net unrealized foreign exchange gains and losses arise from changes in foreign exchange rates on foreign denominated assets and liabilities other than investments in securities held at the end of the reporting period.
c. Participatory Notes
The Fund invests in Participatory Notes (P-Notes). P-notes are promissory notes that are designed to offer a return linked to the performance of a particular underlying equity security or market. P-Notes are issued by banks or broker-dealers and allow the fund to gain exposure to common stocks in markets where direct investment is not allowed. Income received from P-Notes is recorded as dividend income in the Statement of Operations. P-Notes may contain various risks including the potential inability of the counterparty to fulfill their obligations under the terms of the contract. These securities may be more volatile and less liquid than other investments held by the Fund.
d. Securities Lending
The Fund participates in an agency based securities lending program. The Fund receives cash collateral against the loaned securities in an amount equal to at least 102% of the market value of the loaned securities. Collateral is maintained over the life of the loan in an amount not less than 100% of the market value of loaned securities, as determined at the close of fund business each day; any additional collateral required due to changes in security values is delivered to the Fund on the next business
TD-22
Franklin Templeton Variable Insurance Products Trust
Notes to Financial Statements (continued)
Templeton Developing Markets Securities Fund
1. ORGANIZATION AND SIGNIFICANT ACCOUNTING POLICIES (continued)
d. Securities Lending (continued)
day. The collateral is invested in a non-registered money fund. The Fund receives income from the investment of cash collateral, in addition to lending fees and rebates paid by the borrower. The Fund bears the market risk with respect to the collateral investment, securities loaned, and the risk that the agent may default on its obligations to the Fund. The securities lending agent has agreed to indemnify the Fund in the event of default by a third party borrower. At December 31, 2013, the Fund had no securities on loan.
e. Income and Deferred Taxes
It is the Fund’s policy to qualify as a regulated investment company under the Internal Revenue Code. The Fund intends to distribute to shareholders substantially all of its taxable income and net realized gains to relieve it from federal income and if applicable, excise taxes. As a result, no provision for U.S. federal income taxes is required.
The Fund may be subject to foreign taxation related to income received, capital gains on the sale of securities and certain foreign currency transactions in the foreign jurisdictions in which it invests. Foreign taxes, if any, are recorded based on the tax regulations and rates that exist in the foreign markets in which the Fund invests. When a capital gain tax is determined to apply the Fund records an estimated deferred tax liability in an amount that would be payable if the securities were disposed of on the valuation date.
The Fund recognizes the tax benefits of uncertain tax positions only when the position is “more likely than not” to be sustained upon examination by the tax authorities based on the technical merits of the tax position. As of December 31, 2013, and for all open tax years, the Fund has determined that no liability for unrecognized tax benefits is required in the Fund’s financial statements related to uncertain tax positions taken on a tax return (or expected to be taken on future tax returns). Open tax years are those that remain subject to examination and are based on each tax jurisdiction statute of limitation.
f. Security Transactions, Investment Income, Expenses and Distributions
Security transactions are accounted for on trade date. Realized gains and losses on security transactions are determined on a specific identification basis. Estimated expenses are accrued daily. Dividend income is recorded on the ex-dividend date except that certain dividends from foreign securities are recognized as soon as the Fund is notified of the ex-dividend date. Distributions to shareholders are recorded on the ex-dividend date and are determined according to income tax regulations (tax basis). Distributable earnings determined on a tax basis may differ from earnings recorded in accordance with accounting principles generally accepted in the United States of America. These differences may be permanent or temporary. Permanent differences are reclassified among capital accounts to reflect their tax character. These reclassifications have no impact on net assets or the results of operations. Temporary differences are not reclassified, as they may reverse in subsequent periods.
Common expenses incurred by the Trust are allocated among the funds based on the ratio of net assets of each fund to the combined net assets of the Trust. Fund specific expenses are charged directly to the fund that incurred the expense.
Realized and unrealized gains and losses and net investment income, not including class specific expenses, are allocated daily to each class of shares based upon the relative proportion of net assets of each class. Differences in per share distributions, by class, are generally due to differences in class specific expenses.
g. Accounting Estimates
The preparation of financial statements in accordance with accounting principles generally accepted in the United States of America requires management to make estimates and assumptions that affect the reported amounts of assets and liabilities at the date of the financial statements and the amounts of income and expenses during the reporting period. Actual results could differ from those estimates.
TD-23
Franklin Templeton Variable Insurance Products Trust
Notes to Financial Statements (continued)
Templeton Developing Markets Securities Fund
1. ORGANIZATION AND SIGNIFICANT ACCOUNTING POLICIES (continued)
h. Redemption Fees
Redemptions and exchanges of interests in an insurance company subaccount that invests in Class 3 shares of the Fund will be subject to a 1.0% short term trading fee if the interest in the subaccount has been held for less than 60 days. Such fees are retained by the Fund and accounted for as an addition to paid-in capital, allocated to each class of shares based upon the relative proportion of net assets of each class.
i. Guarantees and Indemnifications
Under the Trust’s organizational documents, its officers and trustees are indemnified by the Trust against certain liabilities arising out of the performance of their duties to the Trust. Additionally, in the normal course of business, the Trust, on behalf of the Fund, enters into contracts with service providers that contain general indemnification clauses. The Trust’s maximum exposure under these arrangements is unknown as this would involve future claims that may be made against the Trust that have not yet occurred. Currently, the Trust expects the risk of loss to be remote.
2. SHARES OF BENEFICIAL INTEREST
At December 31, 2013, there were an unlimited number of shares authorized (without par value). Transactions in the Fund’s shares were as follows:
| | | | | | | | | | | | | | | | |
| | | Year Ended December 31, | |
| | | 2013 | | | 2012 | |
| Class 1 Shares: | | Shares | | | Amount | | | Shares | | | Amount | |
Shares sold | | | 1,118,729 | | | $ | 11,636,774 | | | | 1,107,285 | | | $ | 11,165,172 | |
Shares issued in reinvestment of distributions | | | 392,673 | | | | 3,816,779 | | | | 385,901 | | | | 3,523,272 | |
Shares redeemed | | | (6,552,381 | ) | | | (67,528,597 | ) | | | (6,733,412 | ) | | | (67,622,135 | ) |
| | | | |
Net increase (decrease) | | | (5,040,979 | ) | | $ | (52,075,044 | ) | | | (5,240,226 | ) | | $ | (52,933,691 | ) |
| | | | |
Class 2 Shares: | | | | | | | | | | | | | | | | |
Shares sold | | | 5,110,513 | | | $ | 51,867,557 | | | | 3,879,555 | | | $ | 38,012,902 | |
Shares issued in reinvestment of distributions | | | 564,125 | | | | 5,449,449 | | | | 453,341 | | | | 4,111,805 | |
Shares redeemed | | | (6,483,017 | ) | | | (66,184,649 | ) | | | (7,891,630 | ) | | | (78,771,340 | ) |
| | | | |
Net increase (decrease) | | | (808,379 | ) | | $ | (8,867,643 | ) | | | (3,558,734 | ) | | $ | (36,646,633 | ) |
| | | | |
Class 3 Shares: | | | | | | | | | | | | | | | | |
Shares sold | | | 410,783 | | | $ | 4,328,836 | | | | 998,194 | | | $ | 10,036,984 | |
Shares issued in reinvestment of distributions | | | 81,005 | | | | 777,644 | | | | 79,538 | | | | 716,639 | |
Shares redeemed | | | (1,696,602 | ) | | | (17,346,564 | ) | | | (1,224,195 | ) | | | (11,948,708 | ) |
| | | | |
Net increase (decrease) | | | (1,204,814 | ) | | $ | (12,240,084 | ) | | | (146,463 | ) | | $ | (1,195,085 | ) |
| | | | |
Class 4 Shares: | | | | | | | | | | | | | | | | |
Shares sold | | | 206,201 | | | $ | 2,099,934 | | | | 257,374 | | | $ | 2,544,613 | |
Shares issued on reinvestment of distributions | | | 38,661 | | | | 373,848 | | | | 32,558 | | | | 295,623 | |
Shares redeemed | | | (973,500 | ) | | | (9,761,509 | ) | | | (656,835 | ) | | | (6,487,980 | ) |
| | | | |
Net increase (decrease) | | | (728,638 | ) | | $ | (7,287,727 | ) | | | (366,903 | ) | | $ | (3,647,744 | ) |
| | | | |
TD-24
Franklin Templeton Variable Insurance Products Trust
Notes to Financial Statements (continued)
Templeton Developing Markets Securities Fund
3. TRANSACTIONS WITH AFFILIATES
Franklin Resources, Inc. is the holding company for various subsidiaries that together are referred to as Franklin Templeton Investments. Certain officers and trustees of the Fund are also officers and/or directors of the following subsidiaries:
| | |
| Subsidiary | | Affiliation |
Templeton Asset Management Ltd. (TAML) | | Investment manager |
Franklin Templeton Services, LLC (FT Services) | | Administrative manager |
Franklin Templeton Distributors, Inc. (Distributors) | | Principal underwriter |
Franklin Templeton Investor Services, LLC (Investor Services) | | Transfer agent |
a. Management Fees
The Fund pays an investment management fee to TAML based on the average daily net assets of the Fund as follows:
| | |
| Annualized Fee Rate | | Net Assets |
| 1.100% | | Up to and including $1 billion |
| 1.050% | | Over $1 billion, up to and including $5 billion |
| 1.000% | | Over $5 billion, up to and including $10 billion |
| 0.950% | | Over $10 billion, up to and including $15 billion |
| 0.900% | | Over $15 billion, up to and including $20 billion |
| 0.850% | | In excess of $20 billion |
b. Administrative Fees
The Fund pays an administrative fee to FT Services based on the Fund’s average daily net assets as follows:
| | |
| Annualized Fee Rate | | Net Assets |
| 0.150% | | Up to and including $200 million |
| 0.135% | | Over $200 million, up to and including $700 million |
| 0.100% | | Over $700 million, up to and including $1.2 billion |
| 0.075% | | In excess of $1.2 billion |
c. Distribution Fees
The Board has adopted distribution plans for Class 2, Class 3, and Class 4 shares pursuant to Rule 12b-1 under the 1940 Act. Under the Fund’s compensation distribution plans, the Fund pays Distributors for costs incurred in connection with the servicing, sale and distribution of the Fund’s shares up to 0.25%, 0.35%, and 0.35% per year of its average daily net assets of Class 2, Class 3, and Class 4, respectively. Some distribution fees are not charged on shares held by affiliates. The Board has agreed to limit the current rate to 0.25% per year for Class 3. The plan year, for purposes of monitoring compliance with the maximum annual plan rates, is February 1 through January 31.
d. Transfer Agent Fees
Investor Services, under terms of an agreement, performs shareholder servicing for the Fund and is not paid by the Fund for the services.
4. EXPENSE OFFSET ARRANGEMENT
The Fund has entered into an arrangement with its custodian whereby credits realized as a result of uninvested cash balances are used to reduce a portion of the Fund’s custodian expenses. During the year ended December 31, 2013, there were no credits earned.
TD-25
Franklin Templeton Variable Insurance Products Trust
Notes to Financial Statements (continued)
Templeton Developing Markets Securities Fund
5. INCOME TAXES
For tax purposes, capital losses may be carried over to offset future capital gains. Capital loss carryforwards with no expiration, if any, must be fully utilized before those losses with expiration dates.
At December 31, 2013, the Fund had capital loss carryforwards of $21,512,788 expiring in 2017.
During the year ended December 31, 2013, the Fund utilized $66,613,489 of capital loss carryforwards.
The tax character of distributions paid during the years ended December 31, 2013 and 2012, was as follows:
| | | | | | | | |
| | | 2013 | | | 2012 | |
Distributions paid from ordinary income | | $ | 10,417,720 | | | $ | 8,647,339 | |
| | | | |
At December 31, 2013, the cost of investments, net unrealized appreciation (depreciation) and undistributed ordinary income for income tax purposes were as follows:
| | | | |
Cost of investments | | $ | 348,373,004 | |
| | | | |
| |
Unrealized appreciation | | $ | 129,012,176 | |
Unrealized depreciation | | | (7,940,876 | ) |
| | | | |
Net unrealized appreciation (depreciation) | | $ | 121,071,300 | |
| | | | |
Undistributed ordinary income | | $ | 6,847,606 | |
| | | | |
Differences between income and/or capital gains as determined on a book basis and a tax basis are primarily due to differing treatments of foreign currency transactions, passive foreign investment company shares, corporate actions and wash sales.
6. INVESTMENT TRANSACTIONS
Purchases and sales of investments (excluding short term securities) for the year ended December 31, 2013, aggregated $224,131,604 and $314,267,484, respectively.
7. INVESTMENTS IN INSTITUTIONAL FIDUCIARY TRUST MONEY MARKET PORTFOLIO
The Fund invests in the Institutional Fiduciary Trust Money Market Portfolio (Sweep Money Fund), an open-end investment company managed by Franklin Advisers, Inc. (an affiliate of the investment manager). Management fees paid by the Fund are reduced on assets invested in the Sweep Money Fund, in an amount not to exceed the management and administrative fees paid by the Sweep Money Fund.
8. CONCENTRATION OF RISK
Investing in foreign securities may include certain risks and considerations not typically associated with investing in U.S. securities, such as fluctuating currency values and changing local and regional economic, political and social conditions, which may result in greater market volatility. In addition, certain foreign securities may not be as liquid as U.S. securities.
9. CREDIT FACILITY
The Fund, together with other U.S. registered and foreign investment funds (collectively, Borrowers), managed by Franklin Templeton Investments, are borrowers in a joint syndicated senior unsecured credit facility totaling $1.5 billion (Global Credit
TD-26
Franklin Templeton Variable Insurance Products Trust
Notes to Financial Statements (continued)
Templeton Developing Markets Securities Fund
9. CREDIT FACILITY (continued)
Facility) which, after an extension of the original terms, matured on February 14, 2014. This Global Credit Facility provides a source of funds to the Borrowers for temporary and emergency purposes, including the ability to meet future unanticipated or unusually large redemption requests. Effective February 14, 2014, the Borrowers renewed the Global Credit Facility which matures on February 13, 2015.
Under the terms of the Global Credit Facility, the Fund shall, in addition to interest charged on any borrowings made by the Fund and other costs incurred by the Fund, pay its share of fees and expenses incurred in connection with the implementation and maintenance of the Global Credit Facility, based upon its relative share of the aggregate net assets of all of the Borrowers, including an annual commitment fee of 0.07% based upon the unused portion of the Global Credit Facility. These fees are reflected in other expenses on the Statement of Operations. During the year ended December 31, 2013, the Fund did not use the Global Credit Facility.
10. FAIR VALUE MEASUREMENTS
The Fund follows a fair value hierarchy that distinguishes between market data obtained from independent sources (observable inputs) and the Fund’s own market assumptions (unobservable inputs). These inputs are used in determining the value of the Fund’s financial instruments and are summarized in the following fair value hierarchy:
| | • | | Level 1 – quoted prices in active markets for identical financial instruments |
| | • | | Level 2 – other significant observable inputs (including quoted prices for similar financial instruments, interest rates, prepayment speed, credit risk, etc.) |
| | • | | Level 3 – significant unobservable inputs (including the Fund’s own assumptions in determining the fair value of financial instruments) |
The input levels are not necessarily an indication of the risk or liquidity associated with financial instruments at that level.
For movements between the levels within the fair value hierarchy, the Fund has adopted a policy of recognizing the transfers as of the date of the underlying event which caused the movement.
A summary of inputs used as of December 31, 2013, in valuing the Fund’s assets carried at fair value, is as follows:
| | | | | | | | | | | | | | | | |
| | | Level 1 | | | Level 2 | | | Level 3 | | | Total | |
| | | | |
Assets: | | | | | | | | | | | | | | | | |
Investments in Securities: | | | | | | | | | | | | | | | | |
Closed End Funds | | $ | 1,804,395 | | | $ | — | | | $ | — | | | $ | 1,804,395 | |
Equity Investments:a | | | | | | | | | | | | | | | | |
Russia | | | 21,352,068 | | | | 1,870,877 | | | | — | | | | 23,222,945 | |
All Other Equity Investmentsb | | | 418,622,553 | | | | — | | | | — | | | | 418,622,553 | |
Participatory Notes | | | — | | | | 13,516,602 | | | | — | | | | 13,516,602 | |
Short Term Investments | | | 12,277,809 | | | | — | | | | — | | | | 12,277,809 | |
| | | | |
Total Investments in Securities | | $ | 454,056,825 | | | $ | 15,387,479 | | | $ | — | | | $ | 469,444,304 | |
| | | | |
aIncludes common and preferred stocks.
bFor detailed categories, see the accompanying Statement of Investments.
11. NEW ACCOUNTING PRONOUNCEMENTS
In June 2013, the Financial Accounting Standards Board issued Accounting Standards Update (ASU) No. 2013-08, Investment Companies (Topic 946): Amendments to the Scope, Measurement, and Disclosure Requirements. The ASU modifies the criteria
TD-27
Franklin Templeton Variable Insurance Products Trust
Notes to Financial Statements (continued)
Templeton Developing Markets Securities Fund
11. NEW ACCOUNTING PRONOUNCEMENTS (continued)
used in defining an investment company under U.S. Generally Accepted Accounting Principles and also sets forth certain measurement and disclosure requirements. Under the ASU, an entity that is registered under the 1940 Act automatically qualifies as an investment company. The ASU is effective for interim and annual reporting periods beginning after December 15, 2013. Management has reviewed the requirements and believes the adoption of this ASU will not have a material impact on the financial statements.
12. SUBSEQUENT EVENTS
The Fund has evaluated subsequent events through the issuance of the financial statements and determined that no events have occurred that require disclosure other than those already disclosed in the financial statements.
|
ABBREVIATIONS |
| Selected Portfolio |
|
| ADR - American Depositary Receipt |
| GDR - Global Depositary Receipt |
| SDR - Swedish Depositary Receipt |
TD-28
Franklin Templeton Variable Insurance Products Trust
Templeton Developing Markets Securities Fund
Report of Independent Registered Public Accounting Firm
To the Board of Trustees and Shareholders
of Franklin Templeton Variable Insurance Products Trust
In our opinion, the accompanying statement of assets and liabilities, including the statement of investments, and the related statements of operations and of changes in net assets and the financial highlights present fairly, in all material respects, the financial position of Templeton Developing Markets Securities Fund (the “Fund”) at December 31, 2013, the results of its operations for the year then ended, the changes in its net assets for each of the two years in the period then ended and the financial highlights for each of the five years in the period then ended, in conformity with accounting principles generally accepted in the United States of America. These financial statements and financial highlights (hereafter referred to as “financial statements”) are the responsibility of the Fund’s management. Our responsibility is to express an opinion on these financial statements based on our audits. We conducted our audits of these financial statements in accordance with the standards of the Public Company Accounting Oversight Board (United States). Those standards require that we plan and perform the audit to obtain reasonable assurance about whether the financial statements are free of material misstatement. An audit includes examining, on a test basis, evidence supporting the amounts and disclosures in the financial statements, assessing the accounting principles used and significant estimates made by management, and evaluating the overall financial statement presentation. We believe that our audits, which included confirmation of securities at December 31, 2013 by correspondence with the custodian, transfer agent and brokers, provide a reasonable basis for our opinion.
PricewaterhouseCoopers LLP
San Francisco, California
February 14, 2014
TD-29
Franklin Templeton Variable Insurance Products Trust
Tax Information (unaudited)
Templeton Developing Markets Securities Fund
At December 31, 2013, more than 50% of the Fund’s total assets were invested in securities of foreign issuers. In most instances, foreign taxes were withheld from income paid to the Fund on these investments. The Fund elects to treat foreign taxes paid as allowed under Section 853 of the Internal Revenue Code (Code). This election will allow shareholders of record as of the 2014 distribution date, to treat their proportionate share of foreign taxes paid by the Fund as having been paid directly by them. The shareholder shall consider these amounts as foreign taxes paid in the tax year in which they receive the Fund distribution.
TD-30
TEMPLETON FOREIGN SECURITIES FUND
This annual report for Templeton Foreign Securities Fund covers the fiscal year ended December 31, 2013.
Performance Summary as of 12/31/13
Average annual total return of Class 4 shares* represents the average annual change in value, assuming reinvestment of dividends and capital gains. Average returns smooth out variations in returns, which can be significant; they are not the same as year-by-year results.
Periods ended 12/31/13
| | | | | | | | | | | | |
| | | 1-Year | | | 5-Year | | | 10-Year | |
Average Annual Total Return | | | +22.86% | | | | +13.95% | | | | +7.79% | |
*For the period beginning 2/29/08, Class 4 performance reflects a 12b-1 fee expense of 0.35% per year, which affects future performance. Class 4 performance prior to 2/29/08 reflects historical Class 1 performance, which does not have a 12b-1 fee expense. Since 2/29/08 (effective date), the average annual total return of Class 4 shares was +3.84%. The Fund has a fee waiver associated with its investments in a Franklin Templeton money fund, contractually guaranteed through at least its current fiscal year end. Fund investment results reflect the fee waiver, to the extent applicable; without this reduction, the results would have been lower.
Total Return Index Comparison
for a Hypothetical $10,000 Investment (1/1/04–12/31/13)
The graph below shows the change in value of a hypothetical $10,000 investment in the Fund over the indicated period and includes reinvestment of any income or distributions. The Fund’s performance* is compared to the performance of the MSCI Europe, Australasia, Far East (EAFE) Index. One cannot invest directly in an index, and an index is not representative of the Fund’s portfolio. Please see Important Notes to Performance Information preceding the Fund Summaries.
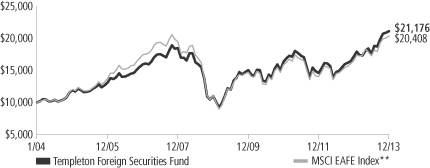
**Source: © 2014 Morningstar. Please see Index Descriptions following the Fund Summaries.
Templeton Foreign Securities Fund – Class 4
Performance reflects the Fund’s Class 4 operating expenses, but does not include any contract fees, expenses or sales charges. If they had been included, performance would be lower. These charges and deductions, particularly for variable life policies, can have a significant effect on contract values and insurance benefits. See the contract prospectus for a complete description of these expenses, including sales charges.
Performance data represent past performance, which does not guarantee future results. Investment return and principal value will fluctuate, and you may have a gain or loss when you sell your shares.
Current performance may differ from figures shown.
TF-1
Fund Goal and Main Investments: Templeton Foreign Securities Fund seeks long-term capital growth. Under normal market conditions, the Fund invests at least 80% of its net assets in investments of issuers located outside the U.S., including those in emerging markets.
Performance Overview
You can find the Fund’s one-year total return in the Performance Summary. In comparison, the Fund’s benchmark, the MSCI EAFE Index, produced a +23.29% total return for the same period.1 Please note, index performance information is provided for reference and we do not attempt to track the index but rather undertake investments on the basis of fundamental research.
Economic and Market Overview
The 12 months under review were characterized by reinvigorated policy support and an economic recovery in developed markets. However, differences in global economic trends corresponded with increasingly divergent monetary policies, and growth in emerging market economies tended to slow. The central banks of key developed markets generally reaffirmed their accommodative monetary stances while some emerging market counterparts tightened policy rates as they sought to control inflation and currency depreciation.
In the U.S., economic growth and employment trends generally exceeded expectations. The U.S. Federal Reserve Board (Fed) expanded its asset purchase program to $85 billion per month from $40 billion early in the year. After encouraging economic and employment reports, the Fed announced in December it would reduce its monthly bond purchases by $10 billion beginning in January 2014; however, the Fed committed to keeping interest rates low. In October, the federal government temporarily shut down after Congress failed to authorize routine federal funding amid a disagreement over a new health care law. However, Congress subsequently agreed to fund the government through early 2014 and later passed a two-year budget deal that could ease automatic spending cuts and lower the risk of another shutdown.
Outside the U.S., the eurozone emerged from its longest recession on record during 2013’s second half and Japan’s growth moderated. The European Central Bank reduced its policy rate to a record low and pledged to maintain systemic support following political turmoil in
1. Source: © 2014 Morningstar. One cannot invest directly in an index, and an index is not representative of the Fund’s portfolio. Please see Index Descriptions following the Fund Summaries.
Fund Risks: All investments involve risks, including possible loss of principal. Special risks are associated with foreign investing, including currency fluctuations, economic instability and political developments; investments in emerging markets involve heightened risks related to the same factors. To the extent the Fund focuses on particular countries, regions, industries, sectors or types of investment from time to time, it may be subject to greater risks of adverse developments in such areas of focus than a fund that invests in a wider variety of countries, regions, industries, sectors or investments. Current political uncertainty surrounding the European Union (EU) and its membership may increase market volatility. The financial instability of some countries in the EU, including Greece, Italy and Spain, together with the risk of that impacting other more stable countries, may increase the economic risk of investing in companies in Europe. The Fund is actively managed but there is no guarantee that the manager’s investment decisions will produce the desired results. The Fund’s prospectus also includes a description of the main investment risks.
TF-2
Greece, Spain, Portugal and Italy. Germany’s re-election of Chancellor Angela Merkel was largely perceived as a vote of support for ongoing eurozone reform measures. In Asia, the Bank of Japan set an explicit inflation target and pledged to double bond purchases in an unprecedented wave of policy reform. The U.S. dollar fell versus the euro but rose versus the Japanese yen in 2013.
Growth in many emerging markets moderated based on lower domestic demand, falling exports and weakening commodity prices. Political turmoil in certain emerging markets, the Fed’s potential tapering of its asset purchase program and the Chinese central bank’s effort to tighten liquidity to curb real estate and credit speculation led to a sell-off in emerging market equities and a sharp depreciation in regional currencies against the U.S. dollar. Central banks in Brazil, India and Indonesia raised interest rates in the second half of 2013 as they sought to curb inflation.
The stock market rally in developed markets accelerated during 2013 amid redoubled central bank commitments, continued corporate earnings strength and increasing signs of economic progress. Emerging market stocks rebounded toward period-end, although Latin American stocks trailed their emerging market peers. Oil prices rallied in the third quarter and rose for the year mainly owing to supply concerns related to geopolitical turmoil, but gold posted its largest annual price decline in more than three decades. Increasingly divergent economic and political circumstances during the period resulted in declining market correlations, which many bottom-up investors perceived as more favorable.
Investment Strategy
Our investment philosophy is bottom up, value oriented and long term. In choosing investments, we generally focus on the market price of a company’s securities relative to our evaluation of the company’s potential long-term earnings, asset value and cash flow. Among factors we consider are a company’s historical value measures, including price/earnings ratio, profit margins and liquidation value. We do in-depth research to construct a bargain list from which we buy.
Manager’s Discussion
During the 12 months under review, all sectors in the MSCI EAFE Index delivered positive returns as the broad market rallied. Our stock selection in the financials sector, especially in insurance, diversified financial services and commercial banks, was a major contributor to
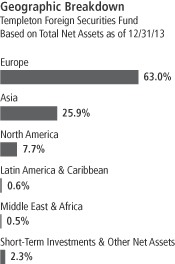
TF-3
Fund performance relative to its benchmark index.2 Among the top sector contributors were insurance providers AXA (France) and Aegon (Netherlands), diversified financial services providers ING Groep (Netherlands) and ING U.S.,3 a new holding, and commercial banks Lloyds Banking Group (U.K.), BNP Paribas (France) and UniCredit (Italy). AXA’s shares advanced through the year as the insurer reported moderate revenue growth across all its business segments and continued to focus on higher margin products. The insurer also continued to expand its presence in emerging markets by acquiring domestic insurers in China and Colombia. Our underweighting in the underperforming materials sector, especially in metals and mining, contributed to relative results.4 Stock selection in the health care sector also aided relative performance, with pharmaceutical company Roche Holding (Switzerland) as a notable contributor.5 The company reported encouraging earnings results through the year, driven by demand for its cancer drugs, especially Avastin. The drug maker also progressed on its product pipeline and launched cancer drugs Perjeta in the U.S. and Kadcyla in the European Union. Underweightings in utilities, a sector we eliminated by period-end, and in consumer staples also aided returns.6 Other individual contributors included telecommunication services provider Vodafone Group (U.K.), specialty retailer Kingfisher (U.K.) and Japanese automobile manufacturer Mazda Motor.7 Vodafone’s stock price advanced as the company entered into an agreement to sell a joint venture interest to its partner Verizon Communications and planned to return a large portion of the sale to Vodafone’s shareholders.
In contrast, our overweighting and stock selection in the energy sector detracted from Fund performance.8 Our positions in energy equipment and services companies Aker Solutions (Norway) and Trican Well Service3 (Canada) as well as Norwegian oil and natural gas producer Statoil suffered from oil price fluctuations stemming from Middle East political tensions. Our stock selection in telecommunication services companies such as wireless telecommunication provider China Mobile3 and diversified telecommunication provider China Telecom3 weighed
2. The financials sector comprises capital markets, commercial banks, diversified financial services, insurance, and real estate management and development in the SOI.
3. Not part of the index.
4. The materials sector comprises chemicals, construction materials, containers and packaging, and metals and mining in the SOI.
5. The health care sector comprises health care equipment and supplies, health care providers and services, life sciences tools and services, and pharmaceuticals in the SOI.
6. The consumer staples sector comprises food and staples retailing in the SOI.
7. Sold by period-end.
8. The energy sector comprises energy equipment and services; and oil, gas and consumable fuels in the SOI.
Top 10 Holdings
Templeton Foreign Securities Fund
12/31/13
| | | | |
Company
Sector/Industry,
Country | | % of Total
Net Assets | |
| BNP Paribas SA | | | 3.2% | |
| Commercial Banks, France | | | | |
| ING Groep NV, IDR | | | 3.0% | |
| Diversified Financial Services, Netherlands | | | | |
| GlaxoSmithKline PLC | | | 2.7% | |
| Pharmaceuticals, U.K. | | | | |
| Sanofi | | | 2.6% | |
| Pharmaceuticals, France | | | | |
| Aviva PLC | | | 2.5% | |
| Insurance, U.K. | | | | |
| Tesco PLC | | | 2.4% | |
| Food & Staples Retailing, U.K. | |
| Credit Suisse Group AG | | | 2.4% | |
| Capital Markets, Switzerland | | | | |
| Samsung Electronics Co. Ltd. | | | 2.2% | |
| Semiconductors & Semiconductor Equipment, South Korea | | | | |
| Total SA, B | | | 2.2% | |
| Oil, Gas & Consumable Fuels, France | | | | |
| AXA SA | | | 2.1% | |
| Insurance, France | | | | |
The dollar value, number of shares or principal amount, and names of all portfolio holdings are listed in the Fund’s Statement of Investments (SOI).
TF-4
on results.9 China Mobile’s stock price fell after the company reported lower-than-expected second- and third-quarter earnings because of rising network costs. Stock selection in the information technology sector detracted from relative performance, with an off-benchmark position in South Korean electronic products manufacturer Samsung Electronics as a major detractor.10 In other sectors, the Fund’s off-benchmark positions in POSCO (South Korea) and Potash Corp. of Saskatchewan7 (Canada) as well as holdings in food and staples retailer Tesco (U.K.) and Brazilian metals and mining company Vale hindered relative performance.
From a geographic perspective, our stock selection in Europe benefited the Fund’s relative performance, as a number of our investments in the U.K., Switzerland, the Netherlands, France and Italy performed well. A lack of exposure to Australia, an off-benchmark allocation to the U.S. and stock selection in Hong Kong also contributed to relative returns. However, elsewhere in Asia, off-benchmark allocations to South Korea and China detracted from relative performance. Our exposure to off-benchmark nation Canada and a few European countries, led by Norway, also hurt performance.
Thank you for your participation in Templeton Foreign Securities Fund. We look forward to serving your future investment needs.
9. The telecommunication services sector comprises diversified telecommunication services and wireless telecommunication services in the SOI.
10. The information technology sector comprises communications equipment; computers and peripherals; electronic equipment, instruments and components; semiconductors and semiconductor equipment; and software in the SOI.
The foregoing information reflects our analysis, opinions and portfolio holdings as of December 31, 2013, the end of the reporting period. The way we implement our main investment strategies and the resulting portfolio holdings may change depending on factors such as market and economic conditions. These opinions may not be relied upon as investment advice or an offer for a particular security. The information is not a complete analysis of every aspect of any market, country, industry, security or the Fund. Statements of fact are from sources considered reliable, but the investment manager makes no representation or warranty as to their completeness or accuracy. Although historical performance is no guarantee of future results, these insights may help you understand our investment management philosophy.
TF-5
Fund Expenses
As an investor in a variable insurance contract (Contract) that indirectly provides for investment in an underlying mutual fund, you can incur transaction and/or ongoing expenses at both the Fund level and the Contract level.
| • | | Transaction expenses can include sales charges (loads) on purchases, redemption fees, surrender fees, transfer fees and premium taxes. |
| • | | Ongoing expenses can include management fees, distribution and service (12b-1) fees, contract fees, annual maintenance fees, mortality and expense risk fees and other fees and expenses. All mutual funds and Contracts have some types of ongoing expenses. |
The expenses shown in the table are meant to highlight ongoing expenses at the Fund level only and do not include ongoing expenses at the Contract level, or transaction expenses at either the Fund or Contract level. While the Fund does not have transaction expenses, if the transaction and ongoing expenses at the Contract level were included, the expenses shown below would be higher. You should consult your Contract prospectus or disclosure document for more information.
The table shows Fund-level ongoing expenses and can help you understand these expenses and compare them with those of other mutual funds offered through the Contract. The table assumes a $1,000 investment held for the six months indicated. Please refer to the Fund prospectus for additional information on operating expenses.
Actual Fund Expenses
The first line (Actual) of the table provides actual account values and expenses. The “Ending Account Value” is derived from the Fund’s actual return, which includes the effect of ongoing Fund expenses, but does not include the effect of ongoing Contract expenses.
You can estimate the Fund-level expenses you incurred during the period by following these steps. Of course, your account value and expenses will differ from those in this illustration:
| 1. | Divide your account value by $1,000. |
If an account had an $8,600 value, then $8,600 ÷ $1,000 = 8.6.
| 2. | Multiply the result by the number under the heading “Fund-Level Expenses Incurred During Period.” |
If Fund-Level Expenses Incurred During Period were $7.50, then 8.6 x $7.50 = $64.50.
In this illustration, the estimated expenses incurred this period at the Fund level are $64.50.
Templeton Foreign Securities Fund – Class 4
TF-6
Hypothetical Example for Comparison with Other Mutual Funds
Information in the second line (Hypothetical) of the table can help you compare ongoing expenses of the Fund with those of other mutual funds offered through the Contract. This information may not be used to estimate the actual ending account balance or expenses you incurred during the period. The hypothetical “Ending Account Value” is based on the Fund’s actual expense ratio and an assumed 5% annual rate of return before expenses, which does not represent the Fund’s actual return. The figure under the heading “Fund-Level Expenses Incurred During Period” shows the hypothetical expenses your account would have incurred under this scenario. You can compare this figure with the 5% hypothetical examples that appear in shareholder reports of other funds offered through a Contract.
| | | | | | | | | | | | |
| Class 4 | | Beginning
Account
Value 7/1/13 | | | Ending
Account
Value 12/31/13 | | | Fund-Level
Expenses Incurred
During Period*
7/1/13–12/31/13 | |
Actual | | $ | 1,000 | | | $ | 1,201.20 | | | $ | 6.21 | |
Hypothetical (5% return
before expenses) | | $ | 1,000 | | | $ | 1,019.56 | | | $ | 5.70 | |
*Expenses are calculated using the most recent six-month annualized expense ratio for the Fund’s Class 4 shares (1.12%), which does not include any ongoing expenses of the Contract for which the Fund is an investment option, multiplied by the average account value over the period, multiplied by 184/365 to reflect the one-half year period.
TF-7
Franklin Templeton Variable Insurance Products Trust
Financial Highlights
Templeton Foreign Securities Fund
| | | | | | | | | | | | | | | | | | | | |
| | | Year Ended December 31, | |
| Class 1 | | 2013 | | | 2012 | | | 2011 | | | 2010 | | | 2009 | |
| | | | |
Per share operating performance | | | | | | | | | | | | | | | | | | | | |
(for a share outstanding throughout the year) | | | | | | | | | | | | | | | | | | | | |
Net asset value, beginning of year | | $ | 14.63 | | | $ | 12.78 | | | $ | 14.54 | | | $ | 13.68 | | | $ | 10.95 | |
| | | | |
Income from investment operationsa: | | | | | | | | | | | | | | | | | | | | |
Net investment incomeb | | | 0.34 | | | | 0.38 | | | | 0.42 | | | | 0.28 | | | | 0.25 | |
Net realized and unrealized gains (losses) | | | 3.00 | | | | 1.91 | | | | (1.90 | ) | | | 0.86 | | | | 3.39 | |
| | | | |
Total from investment operations | | | 3.34 | | | | 2.29 | | | | (1.48 | ) | | | 1.14 | | | | 3.64 | |
| | | | |
Less distributions from: | | | | | | | | | | | | | | | | | | | | |
Net investment income | | | (0.41 | ) | | | (0.44 | ) | | | (0.28 | ) | | | (0.28 | ) | | | (0.43 | ) |
Net realized gains | | | — | | | | — | | | | — | | | | — | | | | (0.48 | ) |
| | | | |
Total distributions | | | (0.41 | ) | | | (0.44 | ) | | | (0.28 | ) | | | (0.28 | ) | | | (0.91 | ) |
| | | | |
Redemption feesc | | | — | | | | — | | | | — | | | | — | | | | — | |
| | | | |
Net asset value, end of year | | $ | 17.56 | | | $ | 14.63 | | | $ | 12.78 | | | $ | 14.54 | | | $ | 13.68 | |
| | | | |
| | | | | |
Total returnd | | | 23.27% | | | | 18.60% | | | | (10.44)% | | | | 8.67% | | | | 37.34% | |
Ratios to average net assets | | | | | | | | | | | | | | | | | | | | |
Expenses | | | 0.78% | | | | 0.79% | | | | 0.79% | e | | | 0.78% | e | | | 0.78% | e |
Net investment income | | | 2.16% | | | | 2.84% | | | | 2.92% | | | | 2.10% | | | | 2.28% | |
| | | | | |
Supplemental data | | | | | | | | | | | | | | | | | | | | |
Net assets, end of year (000’s) | | $ | 298,468 | | | $ | 265,924 | | | $ | 254,292 | | | $ | 321,282 | | | $ | 318,173 | |
Portfolio turnover rate | | | 23.61% | | | | 12.53% | | | | 21.09% | | | | 19.16% | | | | 22.50% | |
aThe amount shown for a share outstanding throughout the period may not correlate with the Statement of Operations for the period due to the timing of sales and repurchases of the Fund shares in relation to income earned and/or fluctuating market value of the investments of the Fund.
bBased on average daily shares outstanding.
cAmount rounds to less than $0.01 per share.
dTotal return does not include fees, charges or expenses imposed by the variable annuity and life insurance contracts for which the Franklin Templeton Variable Insurance Products Trust serves as an underlying investment vehicle.
eBenefit of expense reduction rounds to less than 0.01%.
The accompanying notes are an integral part of these financial statements.
TF-8
Franklin Templeton Variable Insurance Products Trust
Financial Highlights (continued)
Templeton Foreign Securities Fund
| | | | | | | | | | | | | | | | | | | | |
| | | Year Ended December 31, | |
| Class 2 | | 2013 | | | 2012 | | | 2011 | | | 2010 | | | 2009 | |
| | | | |
Per share operating performance | | | | | | | | | | | | | | | | | | | | |
(for a share outstanding throughout the year) | | | | | | | | | | | | | | | | | | | | |
Net asset value, beginning of year | | $ | 14.37 | | | $ | 12.56 | | | $ | 14.29 | | | $ | 13.45 | | | $ | 10.76 | |
| | | | |
Income from investment operationsa: | | | | | | | | | | | | | | | | | | | | |
Net investment incomeb | | | 0.30 | | | | 0.34 | | | | 0.37 | | | | 0.25 | | | | 0.22 | |
Net realized and unrealized gains (losses) | | | 2.94 | | | | 1.87 | | | | (1.86 | ) | | | 0.84 | | | | 3.34 | |
| | | | |
Total from investment operations | | | 3.24 | | | | 2.21 | | | | (1.49 | ) | | | 1.09 | | | | 3.56 | |
| | | | |
Less distributions from: | | | | | | | | | | | | | | | | | | | | |
Net investment income | | | (0.37 | ) | | | (0.40 | ) | | | (0.24 | ) | | | (0.25 | ) | | | (0.39 | ) |
Net realized gains | | | — | | | | — | | | | — | | | | — | | | | (0.48 | ) |
| | | | |
Total distributions | | | (0.37 | ) | | | (0.40 | ) | | | (0.24 | ) | | | (0.25 | ) | | | (0.87 | ) |
| | | | |
Redemption feesc | | | — | | | | — | | | | — | | | | — | | | | — | |
| | | | |
Net asset value, end of year | | $ | 17.24 | | | $ | 14.37 | | | $ | 12.56 | | | $ | 14.29 | | | $ | 13.45 | |
| | | | |
| | | | | |
Total returnd | | | 22.97% | | | | 18.23% | | | | (10.63)% | | | | 8.41% | | | | 37.04% | |
Ratios to average net assets | | | | | | | | | | | | | | | | | | | | |
Expenses | | | 1.03% | | | | 1.04% | | | | 1.04% | e | | | 1.03% | e | | | 1.03% | e |
Net investment income | | | 1.91% | | | | 2.59% | | | | 2.67% | | | | 1.85% | | | | 2.03% | |
| | | | | |
Supplemental data | | | | | | | | | | | | | | | | | | | | |
Net assets, end of year (000’s) | | $ | 1,873,586 | | | $ | 1,744,231 | | | $ | 1,679,412 | | | $ | 2,090,757 | | | $ | 2,010,268 | |
Portfolio turnover rate | | | 23.61% | | | | 12.53% | | | | 21.09% | | | | 19.16% | | | | 22.50% | |
aThe amount shown for a share outstanding throughout the period may not correlate with the Statement of Operations for the period due to the timing of sales and repurchases of the Fund shares in relation to income earned and/or fluctuating market value of the investments of the Fund.
bBased on average daily shares outstanding.
cAmount rounds to less than $0.01 per share.
dTotal return does not include fees, charges or expenses imposed by the variable annuity and life insurance contracts for which the Franklin Templeton Variable Insurance Products Trust serves as an underlying investment vehicle.
eBenefit of expense reduction rounds to less than 0.01%.
The accompanying notes are an integral part of these financial statements.
TF-9
Franklin Templeton Variable Insurance Products Trust
Financial Highlights (continued)
Templeton Foreign Securities Fund
| | | | | | | | | | | | | | | | | | | | |
| | | Year Ended December 31, | |
| Class 3 | | 2013 | | | 2012 | | | 2011 | | | 2010 | | | 2009 | |
| | | | |
Per share operating performance | | | | | | | | | | | | | | | | | | | | |
(for a share outstanding throughout the year) | | | | | | | | | | | | | | | | | | | | |
Net asset value, beginning of year | | $ | 14.32 | | | $ | 12.51 | | | $ | 14.24 | | | $ | 13.37 | | | $ | 10.70 | |
| | | | |
Income from investment operationsa: | | | | | | | | | | | | | | | | | | | | |
Net investment incomeb | | | 0.30 | | | | 0.34 | | | | 0.37 | | | | 0.25 | | | | 0.25 | |
Net realized and unrealized gains (losses) | | | 2.93 | | | | 1.87 | | | | (1.86 | ) | | | 0.84 | | | | 3.30 | |
| | | | |
Total from investment operations | | | 3.23 | | | | 2.21 | | | | (1.49 | ) | | | 1.09 | | | | 3.55 | |
| | | | |
Less distributions from: | | | | | | | | | | | | | | | | | | | | |
Net investment income | | | (0.37 | ) | | | (0.40 | ) | | | (0.24 | ) | | | (0.22 | ) | | | (0.40 | ) |
Net realized gains | | | — | | | | — | | | | — | | | | — | | | | (0.48 | ) |
| | | | |
Total distributions | | | (0.37 | ) | | | (0.40 | ) | | | (0.24 | ) | | | (0.22 | ) | | | (0.88 | ) |
| | | | |
Redemption feesc | | | — | | | | — | | | | — | | | | — | | | | — | |
| | | | |
Net asset value, end of year | | $ | 17.18 | | | $ | 14.32 | | | $ | 12.51 | | | $ | 14.24 | | | $ | 13.37 | |
| | | | |
| | | | | |
Total returnd | | | 22.98% | | | | 18.30% | | | | (10.68)% | | | | 8.41% | | | | 37.20% | |
Ratios to average net assets | | | | | | | | | | | | | | | | | | | | |
Expenses | | | 1.03% | | | | 1.04% | | | | 1.04% | e | | | 1.03% | e | | | 1.03% | e |
Net investment income | | | 1.91% | | | | 2.59% | | | | 2.67% | | | | 1.85% | | | | 2.03% | |
| | | | | |
Supplemental data | | | | | | | | | | | | | | | | | | | | |
Net assets, end of year (000’s) | | $ | 95,405 | | | $ | 91,642 | | | $ | 88,380 | | | $ | 108,766 | | | $ | 115,364 | |
Portfolio turnover rate | | | 23.61% | | | | 12.53% | | | | 21.09% | | | | 19.16% | | | | 22.50% | |
aThe amount shown for a share outstanding throughout the period may not correlate with the Statement of Operations for the period due to the timing of sales and repurchases of the Fund shares in relation to income earned and/or fluctuating market value of the investments of the Fund.
bBased on average daily shares outstanding.
cAmount rounds to less than $0.01 per share.
dTotal return does not include fees, charges or expenses imposed by the variable annuity and life insurance contracts for which the Franklin Templeton Variable Insurance Products Trust serves as an underlying investment vehicle.
eBenefit of expense reduction rounds to less than 0.01%.
The accompanying notes are an integral part of these financial statements.
TF-10
Franklin Templeton Variable Insurance Products Trust
Financial Highlights (continued)
Templeton Foreign Securities Fund
| | | | | | | | | | | | | | | | | | | | |
| | | Year Ended December 31, | |
| Class 4 | | 2013 | | | 2012 | | | 2011 | | | 2010 | | | 2009 | |
| | | | |
Per share operating performance | | | | | | | | | | | | | | | | | | | | |
(for a share outstanding throughout the year) | | | | | | | | | | | | | | | | | | | | |
Net asset value, beginning of year | | $ | 14.48 | | | $ | 12.66 | | | $ | 14.43 | | | $ | 13.59 | | | $ | 10.91 | |
| | | | |
Income from investment operationsa: | | | | | | | | | | | | | | | | | | | | |
Net investment incomeb | | | 0.28 | | | | 0.33 | | | | 0.36 | | | | 0.17 | | | | 0.21 | |
Net realized and unrealized gains (losses) | | | 2.97 | | | | 1.89 | | | | (1.88 | ) | | | 0.92 | | | | 3.37 | |
| | | | |
Total from investment operations | | | 3.25 | | | | 2.22 | | | | (1.52 | ) | | | 1.09 | | | | 3.58 | |
| | | | |
Less distributions from: | | | | | | | | | | | | | | | | | | | | |
Net investment income | | | (0.36 | ) | | | (0.40 | ) | | | (0.25 | ) | | | (0.25 | ) | | | (0.42 | ) |
Net realized gains | | | — | | | | — | | | | — | | | | — | | | | (0.48 | ) |
| | | | |
Total distributions | | | (0.36 | ) | | | (0.40 | ) | | | (0.25 | ) | | | (0.25 | ) | | | (0.90 | ) |
| | | | |
Redemption feesc | | | — | | | | — | | | | — | | | | — | | | | — | |
| | | | |
Net asset value, end of year | | $ | 17.37 | | | $ | 14.48 | | | $ | 12.66 | | | $ | 14.43 | | | $ | 13.59 | |
| | | | |
| | | | | |
Total returnd | | | 22.86% | | | | 18.14% | | | | (10.74)% | | | | 8.38% | | | | 36.84% | |
Ratios to average net assets | | | | | | | | | | | | | | | | | | | | |
Expenses | | | 1.13% | | | | 1.14% | | | | 1.14% | e | | | 1.13% | e | | | 1.13% | e |
Net investment income | | | 1.81% | | | | 2.49% | | | | 2.57% | | | | 1.75% | | | | 1.93% | |
| | | | | |
Supplemental data | | | | | | | | | | | | | | | | | | | | |
Net assets, end of year (000’s) | | $ | 513,098 | | | $ | 416,277 | | | $ | 353,346 | | | $ | 305,505 | | | $ | 48,501 | |
Portfolio turnover rate | | | 23.61% | | | | 12.53% | | | | 21.09% | | | | 19.16% | | | | 22.50% | |
aThe amount shown for a share outstanding throughout the period may not correlate with the Statement of Operations for the period due to the timing of sales and repurchases of the Fund shares in relation to income earned and/or fluctuating market value of the investments of the Fund.
bBased on average daily shares outstanding.
cAmount rounds to less than $0.01 per share.
dTotal return does not include fees, charges or expenses imposed by the variable annuity and life insurance contracts for which the Franklin Templeton Variable Insurance Products Trust serves as an underlying investment vehicle.
eBenefit of expense reduction rounds to less than 0.01%.
The accompanying notes are an integral part of these financial statements.
TF-11
Franklin Templeton Variable Insurance Products Trust
Statement of Investments, December 31, 2013
| | | | | | | | | | |
| Templeton Foreign Securities Fund | | Country | | Shares | | | Value | |
Common Stocks 97.1% | | | | | | | | | | |
Aerospace & Defense 1.1% | | | | | | | | | | |
BAE Systems PLC | | United Kingdom | | | 4,201,030 | | | $ | 30,243,321 | |
| | | | | | | | | | |
Airlines 0.8% | | | | | | | | | | |
a Deutsche Lufthansa AG | | Germany | | | 1,080,990 | | | | 22,928,024 | |
| | | | | | | | | | |
Auto Components 1.8% | | | | | | | | | | |
Cie Generale des Etablissements Michelin, B | | France | | | 222,570 | | | | 23,649,703 | |
Hyundai Mobis | | South Korea | | | 100,634 | | | | 27,977,057 | |
| | | | | | | | | | |
| | | | | | | | | 51,626,760 | |
| | | | | | | | | | |
Automobiles 1.7% | | | | | | | | | | |
Nissan Motor Co. Ltd. | | Japan | | | 1,341,500 | | | | 11,261,975 | |
Toyota Motor Corp., ADR | | Japan | | | 291,181 | | | | 35,500,788 | |
| | | | | | | | | | |
| | | | | | | | | 46,762,763 | |
| | | | | | | | | | |
Building Products 0.6% | | | | | | | | | | |
Compagnie de Saint-Gobain | | France | | | 296,890 | | | | 16,324,678 | |
| | | | | | | | | | |
Capital Markets 2.8% | | | | | | | | | | |
Credit Suisse Group AG | | Switzerland | | | 2,190,208 | | | | 66,954,736 | |
GAM Holding Ltd. | | Switzerland | | | 505,110 | | | | 9,824,179 | |
| | | | | | | | | | |
| | | | | | | | | 76,778,915 | |
| | | | | | | | | | |
Chemicals 1.6% | | | | | | | | | | |
Akzo Nobel NV | | Netherlands | | | 594,220 | | | | 46,049,475 | |
| | | | | | | | | | |
Commercial Banks 14.2% | | | | | | | | | | |
BNP Paribas SA | | France | | | 1,124,120 | | | | 87,593,758 | |
a Commerzbank AG | | Germany | | | 793,900 | | | | 12,787,430 | |
DBS Group Holdings Ltd. | | Singapore | | | 2,174,520 | | | | 29,469,244 | |
Hana Financial Group Inc. | | South Korea | | | 1,255,380 | | | | 52,202,214 | |
HSBC Holdings PLC | | United Kingdom | | | 4,015,600 | | | | 43,577,184 | |
KB Financial Group Inc., ADR | | South Korea | | | 1,189,645 | | | | 48,192,519 | |
a Lloyds Banking Group PLC | | United Kingdom | | | 19,072,470 | | | | 24,875,644 | |
Societe Generale | | France | | | 480,870 | | | | 27,925,855 | |
UniCredit SpA | | Italy | | | 6,991,743 | | | | 51,740,224 | |
United Overseas Bank Ltd. | | Singapore | | | 985,000 | | | | 16,580,599 | |
| | | | | | | | | | |
| | | | | | | | | 394,944,671 | |
| | | | | | | | | | |
Communications Equipment 0.4% | | | | | | | | | | |
Ericsson, B, ADR | | Sweden | | | 997,972 | | | | 12,215,177 | |
| | | | | | | | | | |
Computers & Peripherals 0.5% | | | | | | | | | | |
Compal Electronics Inc. | | Taiwan | | | 16,699,431 | | | | 12,791,244 | |
| | | | | | | | | | |
Construction & Engineering 0.7% | | | | | | | | | | |
Carillion PLC | | United Kingdom | | | 3,750,730 | | | | 20,520,595 | |
| | | | | | | | | | |
Construction Materials 0.6% | | | | | | | | | | |
CRH PLC | | Ireland | | | 659,820 | | | | 16,608,757 | |
| | | | | | | | | | |
Containers & Packaging 0.9% | | | | | | | | | | |
Rexam PLC | | United Kingdom | | | 2,719,161 | | | | 23,875,348 | |
| | | | | | | | | | |
Diversified Financial Services 4.4% | | | | | | | | | | |
a ING Groep NV, IDR | | Netherlands | | | 6,093,334 | | | | 84,651,943 | |
ING U.S. Inc. | | United States | | | 1,076,240 | | | | 37,829,836 | |
| | | | | | | | | | |
| | | | | | | | | 122,481,779 | |
| | | | | | | | | | |
TF-12
Franklin Templeton Variable Insurance Products Trust
Statement of Investments, December 31, 2013 (continued)
| | | | | | | | | | |
| Templeton Foreign Securities Fund | | Country | | Shares | | | Value | |
Common Stocks (continued) | | | | | | | | | | |
Diversified Telecommunication Services 5.6% | | | | | | | | | | |
China Telecom Corp. Ltd., H | | China | | | 47,482,357 | | | $ | 24,003,410 | |
Orange SA | | France | | | 1,396,683 | | | | 17,290,236 | |
Singapore Telecommunications Ltd. | | Singapore | | | 9,394,000 | | | | 27,248,407 | |
b Telefonica SA, ADR | | Spain | | | 2,270,951 | | | | 37,107,339 | |
Telenor ASA | | Norway | | | 1,103,354 | | | | 26,305,418 | |
Vivendi SA | | France | | | 928,427 | | | | 24,461,917 | |
| | | | | | | | | | |
| | | | | | | | | 156,416,727 | |
| | | | | | | | | | |
Electrical Equipment 0.9% | | | | | | | | | | |
Alstom SA | | France | | | 438,720 | | | | 15,976,586 | |
Shanghai Electric Group Co. Ltd., H | | China | | | 23,792,000 | | | | 8,590,997 | |
| | | | | | | | | | |
| | | | | | | | | 24,567,583 | |
| | | | | | | | | | |
Electronic Equipment, Instruments & Components 1.8% | | | | | | | | | | |
a Flextronics International Ltd. | | Singapore | | | 2,385,970 | | | | 18,538,987 | |
Kingboard Chemical Holdings Ltd. | | Hong Kong | | | 11,646,000 | | | | 30,337,707 | |
| | | | | | | | | | |
| | | | | | | | | 48,876,694 | |
| | | | | | | | | | |
Energy Equipment & Services 3.7% | | | | | | | | | | |
Aker Solutions ASA | | Norway | | | 1,617,940 | | | | 28,917,033 | |
Ensign Energy Services Inc. | | Canada | | | 1,965,300 | | | | 30,955,580 | |
Fugro NV, IDR | | Netherlands | | | 253,200 | | | | 15,085,600 | |
Trican Well Service Ltd. | | Canada | | | 2,373,000 | | | | 28,999,237 | |
| | | | | | | | | | |
| | | | | | | | | 103,957,450 | |
| | | | | | | | | | |
Food & Staples Retailing 3.2% | | | | | | | | | | |
Metro AG | | Germany | | | 437,967 | | | | 21,205,310 | |
Tesco PLC | | United Kingdom | | | 12,226,930 | | | | 67,709,603 | |
| | | | | | | | | | |
| | | | | | | | | 88,914,913 | |
| | | | | | | | | | |
Health Care Equipment & Supplies 1.1% | | | | | | | | | | |
Getinge AB, B | | Sweden | | | 417,870 | | | | 14,290,929 | |
Nobel Biocare Holding AG | | Switzerland | | | 974,135 | | | | 15,179,055 | |
| | | | | | | | | | |
| | | | | | | | | 29,469,984 | |
| | | | | | | | | | |
Health Care Providers & Services 0.5% | | | | | | | | | | |
Shanghai Pharmaceuticals Holding Co. Ltd., H | | China | | | 5,268,500 | | | | 12,881,900 | |
| | | | | | | | | | |
Industrial Conglomerates 2.6% | | | | | | | | | | |
Hutchison Whampoa Ltd. | | Hong Kong | | | 2,500,239 | | | | 34,016,418 | |
Siemens AG | | Germany | | | 285,414 | | | | 38,979,957 | |
| | | | | | | | | | |
| | | | | | | | | 72,996,375 | |
| | | | | | | | | | |
Insurance 10.1% | | | | | | | | | | |
ACE Ltd. | | United States | | | 307,649 | | | | 31,850,901 | |
Aegon NV | | Netherlands | | | 5,507,530 | | | | 51,983,816 | |
AIA Group Ltd. | | Hong Kong | | | 7,789,600 | | | | 39,076,833 | |
Aviva PLC | | United Kingdom | | | 9,258,670 | | | | 68,937,783 | |
AXA SA | | France | | | 2,056,508 | | | | 57,168,564 | |
Muenchener Rueckversicherungs-Gesellschaft AG | | Germany | | | 68,060 | | | | 14,992,686 | |
Swiss Re AG | | Switzerland | | | 174,680 | | | | 16,066,918 | |
| | | | | | | | | | |
| | | | | | | | | 280,077,501 | |
| | | | | | | | | | |
TF-13
Franklin Templeton Variable Insurance Products Trust
Statement of Investments, December 31, 2013 (continued)
| | | | | | | | | | |
| Templeton Foreign Securities Fund | | Country | | Shares | | | Value | |
Common Stocks (continued) | | | | | | | | | | |
Leisure Equipment & Products 1.0% | | | | | | | | | | |
Namco Bandai Holdings Inc. | | Japan | | | 977,800 | | | $ | 21,673,174 | |
Nikon Corp. | | Japan | | | 386,100 | | | | 7,366,333 | |
| | | | | | | | | | |
| | | | | | | | | 29,039,507 | |
| | | | | | | | | | |
Life Sciences Tools & Services 0.6% | | | | | | | | | | |
Lonza Group AG | | Switzerland | | | 175,440 | | | | 16,638,332 | |
| | | | | | | | | | |
Metals & Mining 2.6% | | | | | | | | | | |
HudBay Minerals Inc. | | Canada | | | 2,891,000 | | | | 23,788,862 | |
Mining and Metallurgical Co. Norilsk Nickel OJSC, ADR | | Russia | | | 317,022 | | | | 5,264,151 | |
POSCO | | South Korea | | | 136,907 | | | | 42,340,700 | |
| | | | | | | | | | |
| | | | | | | | | 71,393,713 | |
| | | | | | | | | | |
Multiline Retail 1.0% | | | | | | | | | | |
Marks & Spencer Group PLC | | United Kingdom | | | 4,066,900 | | | | 29,146,395 | |
| | | | | | | | | | |
Oil, Gas & Consumable Fuels 11.4% | | | | | | | | | | |
BP PLC | | United Kingdom | | | 5,946,135 | | | | 48,064,250 | |
China Shenhua Energy Co. Ltd., H | | China | | | 8,462,000 | | | | 26,626,706 | |
Eni SpA | | Italy | | | 1,159,640 | | | | 27,898,032 | |
LUKOIL Holdings, ADR | | Russia | | | 109,772 | | | | 6,855,261 | |
Royal Dutch Shell PLC, A | | United Kingdom | | | 16,803 | | | | 601,696 | |
Royal Dutch Shell PLC, B | | United Kingdom | | | 1,094,263 | | | | 41,308,844 | |
Statoil ASA | | Norway | | | 1,816,110 | | | | 44,017,109 | |
Suncor Energy Inc. | | Canada | | | 901,700 | | | | 31,614,469 | |
Talisman Energy Inc. | | Canada | | | 2,554,600 | | | | 29,703,253 | |
Total SA, B | | France | | | 979,926 | | | | 60,021,459 | |
| | | | | | | | | | |
| | | | | | | | | 316,711,079 | |
| | | | | | | | | | |
Pharmaceuticals 8.4% | | | | | | | | | | |
GlaxoSmithKline PLC | | United Kingdom | | | 2,772,585 | | | | 73,997,433 | |
Novartis AG | | Switzerland | | | 328,730 | | | | 26,237,964 | |
Roche Holding AG | | Switzerland | | | 179,480 | | | | 50,138,912 | |
Sanofi | | France | | | 670,755 | | | | 71,152,721 | |
Teva Pharmaceutical Industries Ltd., ADR | | Israel | | | 333,815 | | | | 13,379,305 | |
| | | | | | | | | | |
| | | | | | | | | 234,906,335 | |
| | | | | | | | | | |
Real Estate Management & Development 0.0%† | | | | | | | | | | |
Cheung Kong (Holdings) Ltd. | | Hong Kong | | | 922 | | | | 14,565 | |
| | | | | | | | | | |
Semiconductors & Semiconductor Equipment 3.1% | | | | | | | | | | |
Infineon Technologies AG | | Germany | | | 1,103,225 | | | | 11,775,691 | |
Samsung Electronics Co. Ltd. | | South Korea | | | 46,744 | | | | 60,747,607 | |
Taiwan Semiconductor Manufacturing Co. Ltd. | | Taiwan | | | 4,151,526 | | | | 14,681,997 | |
| | | | | | | | | | |
| | | | | | | | | 87,205,295 | |
| | | | | | | | | | |
Software 1.7% | | | | | | | | | | |
Capcom Co. Ltd. | | Japan | | | 1,211,400 | | | | 21,708,564 | |
Trend Micro Inc. | | Japan | | | 713,300 | | | | 24,928,243 | |
| | | | | | | | | | |
| | | | | | | | | 46,636,807 | |
| | | | | | | | | | |
Specialty Retail 1.2% | | | | | | | | | | |
Kingfisher PLC | | United Kingdom | | | 5,160,616 | | | | 32,865,855 | |
| | | | | | | | | | |
Trading Companies & Distributors 1.7% | | | | | | | | | | |
ITOCHU Corp. | | Japan | | | 3,753,600 | | | | 46,305,094 | |
| | | | | | | | | | |
TF-14
Franklin Templeton Variable Insurance Products Trust
Statement of Investments, December 31, 2013 (continued)
| | | | | | | | | | |
| Templeton Foreign Securities Fund | | Country | | Shares | | | Value | |
Common Stocks (continued) | | | | | | | | | | |
Wireless Telecommunication Services 2.8% | | | | | | | | | | |
China Mobile Ltd. | | China | | | 2,340,000 | | | $ | 24,216,730 | |
Vodafone Group PLC, ADR | | United Kingdom | | | 1,340,319 | | | | 52,687,940 | |
| | | | | | | | | | |
| | | | | | | | | 76,904,670 | |
| | | | | | | | | | |
Total Common Stocks (Cost $2,052,849,016) | | | | | | | | | 2,700,078,281 | |
| | | | | | | | | | |
Preferred Stocks 0.6% | | | | | | | | | | |
Metals & Mining 0.3% | | | | | | | | | | |
Vale SA, ADR, pfd., A | | Brazil | | | 664,832 | | | | 9,314,297 | |
| | | | | | | | | | |
Oil, Gas & Consumable Fuels 0.3% | | | | | | | | | | |
Petroleo Brasileiro SA, ADR, pfd. | | Brazil | | | 517,880 | | | | 7,607,657 | |
| | | | | | | | | | |
Total Preferred Stocks (Cost $12,298,385) | | | | | | | | | 16,921,954 | |
| | | | | | | | | | |
Total Investments before Short Term Investments
(Cost $2,065,147,401) | | | | | | | | | 2,717,000,235 | |
| | | | | | | | | | |
Short Term Investments 2.7% | | | | | | | | | | |
Money Market Funds (Cost $69,592,541) 2.5% | | | | | | | | | | |
a,c Institutional Fiduciary Trust Money Market Portfolio | | United States | | | 69,592,541 | | | | 69,592,541 | |
| | | | | | | | | | |
dInvestments from Cash Collateral Received for Loaned Securities
(Cost $6,432,000) 0.2% | | | | | | | | | | |
Money Market Funds 0.2% | | | | | | | | | | |
e BNY Mellon Overnight Government Fund, 0.017% | | United States | | | 6,432,000 | | | | 6,432,000 | |
| | | | | | | | | | |
Total Investments (Cost $2,141,171,942) 100.4% | | | | | | | | | 2,793,024,776 | |
Other Assets, less Liabilities (0.4)% | | | | | | | | | (12,466,730 | ) |
| | | | | | | | | | |
Net Assets 100.0% | | | | | | | | $ | 2,780,558,046 | |
| | | | | | | | | | |
See Abbreviations on page TF-27.
†Rounds to less than 0.1% of net assets.
aNon-income producing.
bA portion or all of the security is on loan at December 31, 2013. See Note 1(c).
cSee Note 7 regarding investments in the Institutional Fiduciary Trust Money Market Portfolio.
dSee Note 1(c) regarding securities on loan.
eThe rate shown is the annualized seven-day yield at period end.
The accompanying notes are an integral part of these financial statements.
TF-15
Franklin Templeton Variable Insurance Products Trust
Financial Statements
Statement of Assets and Liabilities
December 31, 2013
| | | | |
| | | Templeton
Foreign
Securities Fund | |
Assets: | | | | |
Investments in securities: | | | | |
Cost - Unaffiliated issuers | | $ | 2,071,579,401 | |
Cost - Sweep Money Fund (Note 7) | | | 69,592,541 | |
| | | | |
Total cost of investments | | $ | 2,141,171,942 | |
| | | | |
Value - Unaffiliated issuers | | $ | 2,723,432,235 | |
Value - Sweep Money Fund (Note 7) | | | 69,592,541 | |
| | | | |
Total value of investments (includes securities loaned in the amount $6,274,560) | | | 2,793,024,776 | |
Receivables: | | | | |
Investment securities sold | | | 515,083 | |
Capital shares sold | | | 982,086 | |
Dividends | | | 4,477,585 | |
Other assets | | | 60 | |
| | | | |
Total assets | | | 2,798,999,590 | |
| | | | |
Liabilities: | | | | |
Payables: | | | | |
Investment securities purchased | | | 495,501 | |
Capital shares redeemed | | | 7,960,888 | |
Management fees | | | 1,477,136 | |
Administrative fees | | | 222,190 | |
Distribution fees | | | 1,104,444 | |
Payable upon return of securities loaned | | | 6,432,000 | |
Accrued expenses and other liabilities | | | 749,385 | |
| | | | |
Total liabilities | | | 18,441,544 | |
| | | | |
Net assets, at value | | $ | 2,780,558,046 | |
| | | | |
Net assets consist of: | | | | |
Paid-in capital | | $ | 2,147,551,858 | |
Undistributed net investment income | | | 49,005,172 | |
Net unrealized appreciation (depreciation) | | | 651,936,806 | |
Accumulated net realized gain (loss) | | | (67,935,790 | ) |
| | | | |
Net assets, at value | | $ | 2,780,558,046 | |
| | | | |
The accompanying notes are an integral part of these financial statements.
TF-16
Franklin Templeton Variable Insurance Products Trust
Financial Statements (continued)
Statement of Assets and Liabilities (continued)
December 31, 2013
| | | | |
| | | Templeton
Foreign
Securities Fund | |
Class 1: | | | | |
Net assets, at value | | $ | 298,468,465 | |
| | | | |
Shares outstanding | | | 16,995,615 | |
| | | | |
Net asset value and maximum offering price per share | | $ | 17.56 | |
| | | | |
Class 2: | | | | |
Net assets, at value | | $ | 1,873,586,040 | |
| | | | |
Shares outstanding | | | 108,656,664 | |
| | | | |
Net asset value and maximum offering price per share | | $ | 17.24 | |
| | | | |
Class 3: | | | | |
Net assets, at value | | $ | 95,405,319 | |
| | | | |
Shares outstanding | | | 5,553,970 | |
| | | | |
Net asset value and maximum offering price per sharea | | $ | 17.18 | |
| | | | |
Class 4: | | | | |
Net assets, at value | | $ | 513,098,222 | |
| | | | |
Shares outstanding | | | 29,544,388 | |
| | | | |
Net asset value and maximum offering price per share | | $ | 17.37 | |
| | | | |
aRedemption price is equal to net asset value less redemption fees retained by the Fund.
The accompanying notes are an integral part of these financial statements.
TF-17
Franklin Templeton Variable Insurance Products Trust
Financial Statements (continued)
Statement of Operations
for the year ended December 31, 2013
| | | | |
| | | Templeton
Foreign
Securities Fund | |
Investment income: | | | | |
Dividends (net of foreign taxes of $6,946,517) | | $ | 75,267,252 | |
Income from securities loaned | | | 1,510,201 | |
| | | | |
Total investment income | | | 76,777,453 | |
| | | | |
Expenses: | | | | |
Management fees (Note 3a) | | | 16,712,881 | |
Administrative fees (Note 3b) | | | 2,535,512 | |
Distribution fees: (Note 3c) | | | | |
Class 2 | | | 4,453,331 | |
Class 3 | | | 230,038 | |
Class 4 | | | 1,623,277 | |
Unaffiliated transfer agent fees | | | 1,774 | |
Custodian fees (Note 4) | | | 377,540 | |
Reports to shareholders | | | 436,387 | |
Registration and filing fees | | | 1,094 | |
Professional fees | | | 138,372 | |
Trustees’ fees and expenses | | | 10,256 | |
Other | | | 56,693 | |
| | | | |
Total expenses | | | 26,577,155 | |
| | | | |
Net investment income | | | 50,200,298 | |
| | | | |
Realized and unrealized gains (losses): | | | | |
Net realized gain (loss) from: | | | | |
Investments | | | 40,989,015 | |
Foreign currency transactions | | | (465,033 | ) |
| | | | |
Net realized gain (loss) | | | 40,523,982 | |
| | | | |
Net change in unrealized appreciation (depreciation) on: | | | | |
Investments | | | 454,907,975 | |
Translation of other assets and liabilities denominated in foreign currencies | | | 77,388 | |
| | | | |
Net change in unrealized appreciation (depreciation) | | | 454,985,363 | |
| | | | |
Net realized and unrealized gain (loss) | | | 495,509,345 | |
| | | | |
Net increase (decrease) in net assets resulting from operations | | $ | 545,709,643 | |
| | | | |
The accompanying notes are an integral part of these financial statements.
TF-18
Franklin Templeton Variable Insurance Products Trust
Financial Statements (continued)
Statements of Changes in Net Assets
| | | | | | | | |
| | | Templeton Foreign
Securities Fund | |
| | | Year Ended December 31, | |
| | | 2013 | | | 2012 | |
| | | | |
Increase (decrease) in net assets: | | | | | | | | |
Operations: | | | | | | | | |
Net investment income | | $ | 50,200,298 | | | $ | 63,456,029 | |
Net realized gain (loss) from investments and foreign currency transactions | | | 40,523,982 | | | | 19,998,467 | |
Net change in unrealized appreciation (depreciation) on investments and translation of other assets and liabilities denominated in foreign currencies | | | 454,985,363 | | | | 333,368,769 | |
| | | | |
Net increase (decrease) in net assets resulting from operations | | | 545,709,643 | | | | 416,823,265 | |
| | | | |
Distributions to shareholders from: | | | | | | | | |
Net investment income: | | | | | | | | |
Class 1 | | | (7,042,374 | ) | | | (8,240,958 | ) |
Class 2 | | | (42,339,120 | ) | | | (51,055,731 | ) |
Class 3 | | | (2,189,476 | ) | | | (2,656,996 | ) |
Class 4 | | | (10,745,373 | ) | | | (11,448,483 | ) |
| | | | |
Total distributions to shareholders | | | (62,316,343 | ) | | | (73,402,168 | ) |
| | | | |
Capital share transactions: (Note 2) | | | | | | | | |
Class 1 | | | (18,682,478 | ) | | | (24,104,168 | ) |
Class 2 | | | (199,579,456 | ) | | | (174,931,568 | ) |
Class 3 | | | (13,135,502 | ) | | | (9,153,115 | ) |
Class 4 | | | 10,467,967 | | | | 7,407,804 | |
| | | | |
Total capital share transactions | | | (220,929,469 | ) | | | (200,781,047 | ) |
| | | | |
Redemption fees | | | 19,703 | | | | 4,388 | |
| | | | |
Net increase (decrease) in net assets | | | 262,483,534 | | | | 142,644,438 | |
Net assets: | | | | | | | | |
Beginning of year | | | 2,518,074,512 | | | | 2,375,430,074 | |
| | | | |
End of year | | $ | 2,780,558,046 | | | $ | 2,518,074,512 | |
| | | | |
Undistributed net investment income included in net assets: | | | | | | | | |
End of year | | $ | 49,005,172 | | | $ | 61,586,250 | |
| | | | |
The accompanying notes are an integral part of these financial statements.
TF-19
Franklin Templeton Variable Insurance Products Trust
Notes to Financial Statements
Templeton Foreign Securities Fund
1. ORGANIZATION AND SIGNIFICANT ACCOUNTING POLICIES
Franklin Templeton Variable Insurance Products Trust (Trust) is registered under the Investment Company Act of 1940, as amended, (1940 Act) as an open-end investment company, consisting of twenty separate funds. The Templeton Foreign Securities Fund (Fund) is included in this report. The financial statements of the remaining funds in the Trust are presented separately. Shares of the Fund are generally sold only to insurance company separate accounts to fund the benefits of variable life insurance policies or variable annuity contracts. The Fund offers four classes of shares: Class 1, Class 2, Class 3, and Class 4. Each class of shares differs by its distribution fees, voting rights on matters affecting a single class and its exchange privilege.
The following summarizes the Fund’s significant accounting policies.
a. Financial Instrument Valuation
The Fund’s investments in financial instruments are carried at fair value daily. Fair value is the price that would be received to sell an asset or paid to transfer a liability in an orderly transaction between market participants on the measurement date. The Fund calculates the net asset value (NAV) per share at the close of the New York Stock Exchange (NYSE), generally at 4p.m. Eastern time (NYSE close) on each day the NYSE is open for trading. Under procedures approved by the Trust’s Board of Trustees (the Board), the Fund’s administrator, investment manager and other affiliates have formed the Valuation and Liquidity Oversight Committee (VLOC). The VLOC provides administration and oversight of the Fund’s valuation policies and procedures, which are approved annually by the Board. Among other things, these procedures allow the Fund to utilize independent pricing services, quotations from securities and financial instrument dealers, and other market sources to determine fair value.
Equity securities listed on an exchange or on the NASDAQ National Market System are valued at the last quoted sale price or the official closing price of the day, respectively. Foreign equity securities are valued as of the close of trading on the foreign stock exchange on which the security is primarily traded or as of the NYSE close, whichever is earlier. The value is then converted into its U.S. dollar equivalent at the foreign exchange rate in effect at the NYSE close on the day that the value of the security is determined. Over-the-counter (OTC) securities are valued within the range of the most recent quoted bid and ask prices. Securities that trade in multiple markets or on multiple exchanges are valued according to the broadest and most representative market. Certain equity securities are valued based upon fundamental characteristics or relationships to similar securities. Investments in open-end mutual funds and non-registered money market funds are valued at the closing net asset value.
The Fund has procedures to determine the fair value of financial instruments for which market prices are not reliable or readily available. Under these procedures, the VLOC convenes on a regular basis to review such financial instruments and considers a number of factors, including significant unobservable valuation inputs, when arriving at fair value. The VLOC primarily employs a market-based approach which may use related or comparable assets or liabilities, recent transactions, market multiples, book values, and other relevant information for the investment to determine the fair value of the investment. An income-based valuation approach may also be used in which the anticipated future cash flows of the investment are discounted to calculate fair value. Discounts may also be applied due to the nature or duration of any restrictions on the disposition of the investments. Due to the inherent uncertainty of valuations of such investments, the fair values may differ significantly from the values that would have been used had an active market existed. The VLOC employs various methods for calibrating these valuation approaches including a regular review of key inputs and assumptions, transactional back-testing or disposition analysis, and reviews of any related market activity.
Trading in securities on foreign securities stock exchanges and OTC markets may be completed before the daily NYSE close. In addition, trading in certain foreign markets may not take place on every NYSE business day. Occasionally, events occur between the time at which trading in a foreign security is completed and the close of the NYSE that might call into question the reliability of the value of a portfolio security held by the Fund. As a result, differences may arise between the value of the Fund’s portfolio securities as determined at the foreign market close and the latest indications of value at the close of the NYSE. In order to minimize the potential for these differences, the VLOC monitors price movements following the close of trading in foreign stock markets through a series of country specific market proxies (such as baskets of American Depositary Receipts, futures contracts
TF-20
Franklin Templeton Variable Insurance Products Trust
Notes to Financial Statements (continued)
Templeton Foreign Securities Fund
1. ORGANIZATION AND SIGNIFICANT ACCOUNTING POLICIES (continued)
a. Financial Instrument Valuation (continued)
and exchange traded funds). These price movements are measured against established trigger thresholds for each specific market proxy to assist in determining if an event has occurred that may call into question the reliability of the values of the foreign securities held by the Fund. If such an event occurs, the securities may be valued using fair value procedures, which may include the use of independent pricing services.
Also, when the last day of the reporting period is a non-business day, certain foreign markets may be open on those days that the NYSE is closed, which could result in differences between the value of the Fund’s portfolio securities on the last business day and the last calendar day of the reporting period. Any significant security valuation changes due to an open foreign market are adjusted and reflected by the Fund for financial reporting purposes.
b. Foreign Currency Translation
Portfolio securities and other assets and liabilities denominated in foreign currencies are translated into U.S. dollars based on the exchange rate of such currencies against U.S. dollars on the date of valuation. The Fund may enter into foreign currency exchange contracts to facilitate transactions denominated in a foreign currency. Purchases and sales of securities, income and expense items denominated in foreign currencies are translated into U.S. dollars at the exchange rate in effect on the transaction date. Portfolio securities and assets and liabilities denominated in foreign currencies contain risks that those currencies will decline in value relative to the U.S. dollar. Occasionally, events may impact the availability or reliability of foreign exchange rates used to convert the U.S. dollar equivalent value. If such an event occurs, the foreign exchange rate will be valued at fair value using procedures established and approved by the Board.
The Fund does not separately report the effect of changes in foreign exchange rates from changes in market prices on securities held. Such changes are included in net realized and unrealized gain or loss from investments on the Statement of Operations.
Realized foreign exchange gains or losses arise from sales of foreign currencies, currency gains or losses realized between the trade and settlement dates on securities transactions and the difference between the recorded amounts of dividends, interest, and foreign withholding taxes and the U.S. dollar equivalent of the amounts actually received or paid. Net unrealized foreign exchange gains and losses arise from changes in foreign exchange rates on foreign denominated assets and liabilities other than investments in securities held at the end of the reporting period.
c. Securities Lending
The Fund participates in an agency based securities lending program. The Fund receives cash collateral against the loaned securities in an amount equal to at least 102% of the market value of the loaned securities. Collateral is maintained over the life of the loan in an amount not less than 100% of the market value of loaned securities, as determined at the close of fund business each day; any additional collateral required due to changes in security values is delivered to the Fund on the next business day. The collateral is invested in a non-registered money fund. The Fund receives income from the investment of cash collateral, in addition to lending fees and rebates paid by the borrower. The Fund bears the market risk with respect to the collateral investment, securities loaned, and the risk that the agent may default on its obligations to the Fund. The securities lending agent has agreed to indemnify the Fund in the event of default by a third party borrower.
d. Income and Deferred Taxes
It is the Fund’s policy to qualify as a regulated investment company under the Internal Revenue Code. The Fund intends to distribute to shareholders substantially all of its taxable income and net realized gains to relieve it from federal income and if applicable, excise taxes. As a result, no provision for U.S. federal income taxes is required.
TF-21
Franklin Templeton Variable Insurance Products Trust
Notes to Financial Statements (continued)
Templeton Foreign Securities Fund
1. ORGANIZATION AND SIGNIFICANT ACCOUNTING POLICIES (continued)
d. Income and Deferred Taxes (continued)
The Fund may be subject to foreign taxation related to income received, capital gains on the sale of securities and certain foreign currency transactions in the foreign jurisdictions in which it invests. Foreign taxes, if any, are recorded based on the tax regulations and rates that exist in the foreign markets in which the Fund invests. When a capital gain tax is determined to apply the Fund records an estimated deferred tax liability in an amount that would be payable if the securities were disposed of on the valuation date.
The Fund recognizes the tax benefits of uncertain tax positions only when the position is “more likely than not” to be sustained upon examination by the tax authorities based on the technical merits of the tax position. As of December 31, 2013, and for all open tax years, the Fund has determined that no liability for unrecognized tax benefits is required in the Fund’s financial statements related to uncertain tax positions taken on a tax return (or expected to be taken on future tax returns). Open tax years are those that remain subject to examination and are based on each tax jurisdiction statute of limitation.
e. Security Transactions, Investment Income, Expenses and Distributions
Security transactions are accounted for on trade date. Realized gains and losses on security transactions are determined on a specific identification basis. Estimated expenses are accrued daily. Dividend income is recorded on the ex-dividend date except that certain dividends from foreign securities are recognized as soon as the Fund is notified of the ex-dividend date. Distributions to shareholders are recorded on the ex-dividend date and are determined according to income tax regulations (tax basis). Distributable earnings determined on a tax basis may differ from earnings recorded in accordance with accounting principles generally accepted in the United States of America. These differences may be permanent or temporary. Permanent differences are reclassified among capital accounts to reflect their tax character. These reclassifications have no impact on net assets or the results of operations. Temporary differences are not reclassified, as they may reverse in subsequent periods.
Common expenses incurred by the Trust are allocated among the funds based on the ratio of net assets of each fund to the combined net assets of the Trust. Fund specific expenses are charged directly to the fund that incurred the expense.
Realized and unrealized gains and losses and net investment income, not including class specific expenses, are allocated daily to each class of shares based upon the relative proportion of net assets of each class. Differences in per share distributions, by class, are generally due to differences in class specific expenses.
f. Accounting Estimates
The preparation of financial statements in accordance with accounting principles generally accepted in the United States of America requires management to make estimates and assumptions that affect the reported amounts of assets and liabilities at the date of the financial statements and the amounts of income and expenses during the reporting period. Actual results could differ from those estimates.
g. Redemption Fees
Redemptions and exchanges of interests in an insurance company subaccount that invests in Class 3 shares of the Fund will be subject to a 1.0% short term trading fee if the interest in the subaccount has been held for less than 60 days. Such fees are retained by the Fund and accounted for as an addition to paid-in capital, allocated to each class of shares based upon the relative proportion of net assets of each class.
TF-22
Franklin Templeton Variable Insurance Products Trust
Notes to Financial Statements (continued)
Templeton Foreign Securities Fund
1. ORGANIZATION AND SIGNIFICANT ACCOUNTING POLICIES (continued)
h. Guarantees and Indemnifications
Under the Trust’s organizational documents, its officers and trustees are indemnified by the Trust against certain liabilities arising out of the performance of their duties to the Trust. Additionally, in the normal course of business, the Trust, on behalf of the Fund, enters into contracts with service providers that contain general indemnification clauses. The Trust’s maximum exposure under these arrangements is unknown as this would involve future claims that may be made against the Trust that have not yet occurred. Currently, the Trust expects the risk of loss to be remote.
2. SHARES OF BENEFICIAL INTEREST
At December 31, 2013, there were an unlimited number of shares authorized (without par value). Transactions in the Fund’s shares were as follows:
| | | | | | | | | | | | | | | | |
| | | Year Ended December 31, | |
| | | 2013 | | | 2012 | |
| Class 1 Shares: | | Shares | | | Amount | | | Shares | | | Amount | |
Shares sold | | | 496,052 | | | $ | 7,884,222 | | | | 437,702 | | | $ | 5,851,468 | |
Shares issued in reinvestment of distributions | | | 468,554 | | | | 7,042,374 | | | | 676,598 | | | | 8,240,958 | |
Shares redeemed | | | (2,142,399 | ) | | | (33,609,074 | ) | | | (2,835,243 | ) | | | (38,196,594 | ) |
| | | | |
Net increase (decrease) | | | (1,177,793 | ) | | $ | (18,682,478 | ) | | | (1,720,943 | ) | | $ | (24,104,168 | ) |
| | | | |
Class 2 Shares: | | | | | | | | | | | | | | | | |
Shares sold | | | 9,932,214 | | | $ | 152,564,880 | | | | 12,784,843 | | | $ | 164,850,484 | |
Shares issued in reinvestment of distributions | | | 2,864,622 | | | | 42,339,120 | | | | 4,261,747 | | | | 51,055,731 | |
Shares redeemed | | | (25,480,434 | ) | | | (394,483,456 | ) | | | (29,457,075 | ) | | | (390,837,783 | ) |
| | | | |
Net increase (decrease) | | | (12,683,598 | ) | | $ | (199,579,456 | ) | | | (12,410,485 | ) | | $ | (174,931,568 | ) |
| | | | |
Class 3 Shares: | | | | | | | | | | | | | | | | |
Shares sold | | | 558,566 | | | $ | 8,455,794 | | | | 414,387 | | | $ | 5,363,853 | |
Shares issued in reinvestment of distributions | | | 148,742 | | | | 2,189,476 | | | | 222,529 | | | | 2,656,996 | |
Shares redeemed | | | (1,552,340 | ) | | | (23,780,772 | ) | | | (1,302,161 | ) | | | (17,173,964 | ) |
| | | | |
Net increase (decrease) | | | (845,032 | ) | | $ | (13,135,502 | ) | | | (665,245 | ) | | $ | (9,153,115 | ) |
| | | | |
Class 4 Shares: | | | | | | | | | | | | | | | | |
Shares sold | | | 5,690,758 | | | $ | 88,119,947 | | | | 6,234,278 | | | $ | 81,740,548 | |
Shares issued on reinvestment of distributions | | | 721,650 | | | | 10,745,373 | | | | 947,722 | | | | 11,448,483 | |
Shares redeemed | | | (5,613,738 | ) | | | (88,397,353 | ) | | | (6,356,073 | ) | | | (85,781,227 | ) |
| | | | |
Net increase (decrease) | | | 798,670 | | | $ | 10,467,967 | | | | 825,927 | | | $ | 7,407,804 | |
| | | | |
3. TRANSACTIONS WITH AFFILIATES
Franklin Resources, Inc. is the holding company for various subsidiaries that together are referred to as Franklin Templeton Investments. Certain officers and trustees of the Fund are also officers and/or directors of the following subsidiaries:
| | |
| Subsidiary | | Affiliation |
Templeton Investment Counsel, LLC (TIC) | | Investment manager |
Franklin Templeton Services, LLC (FT Services) | | Administrative manager |
Franklin Templeton Distributors, Inc. (Distributors) | | Principal underwriter |
Franklin Templeton Investor Services, LLC (Investor Services) | | Transfer agent |
TF-23
Franklin Templeton Variable Insurance Products Trust
Notes to Financial Statements (continued)
Templeton Foreign Securities Fund
3. TRANSACTIONS WITH AFFILIATES (continued)
a. Management Fees
The Fund pays an investment management fee to TIC based on the average daily net assets of the Fund as follows:
| | |
| Annualized Fee Rate | | Net Assets |
| 0.750% | | Up to and including $200 million |
| 0.675% | | Over $200 million, up to and including $1.3 billion |
| 0.600% | | Over $1.3 billion, up to and including $10 billion |
| 0.580% | | Over $10 billion, up to and including $15 billion |
| 0.560% | | Over $15 billion, up to and including $20 billion |
| 0.540% | | In excess of $20 billion |
b. Administrative Fees
The Fund pays an administrative fee to FT Services based on the average daily net assets of the Fund as follows:
| | |
| Annualized Fee Rate | | Net Assets |
| 0.150% | | Up to and including $200 million |
| 0.135% | | Over $200 million, up to and including $700 million |
| 0.100% | | Over $700 million, up to and including $1.2 billion |
| 0.075% | | In excess of $1.2 billion |
c. Distribution Fees
The Board has adopted distribution plans for Class 2, Class 3, and Class 4 shares pursuant to Rule 12b-1 under the 1940 Act. Under the Fund’s compensation distribution plans, the Fund pays Distributors for costs incurred in connection with the servicing, sale and distribution of the Fund’s shares up to 0.25%, 0.35%, and 0.35% per year of its average daily net assets of Class 2, Class 3, and Class 4, respectively. Some distribution fees are not charged on shares held by affiliates. The Board has agreed to limit the current rate to 0.25% per year for Class 3. The plan year, for purposes of monitoring compliance with the maximum annual plan rates, is February 1 through January 31.
d. Transfer Agent Fees
Investor Services, under terms of an agreement, performs shareholder servicing for the Fund and is not paid by the Fund for the services.
4. EXPENSE OFFSET ARRANGEMENT
The Fund has entered into an arrangement with its custodian whereby credits realized as a result of uninvested cash balances are used to reduce a portion of the Fund’s custodian expenses. During the year ended December 31, 2013, there were no credits earned.
5. INCOME TAXES
For tax purposes, capital losses may be carried over to offset future capital gains. Capital loss carryforwards with no expiration, if any, must be fully utilized before those losses with expiration dates.
TF-24
Franklin Templeton Variable Insurance Products Trust
Notes to Financial Statements (continued)
Templeton Foreign Securities Fund
5. INCOME TAXES (continued)
At December 31, 2013, the Fund had capital loss carryforwards of $59,815,020 expiring in 2017. During the year ended December 31, 2013, the Fund utilized $40,989,015 of capital loss carryforwards.
The tax character of distributions paid during the years ended December 31, 2013 and 2012, was as follows:
| | | | | | | | |
| | | 2013 | | | 2012 | |
Distributions paid from ordinary income | | $ | 62,316,343 | | | $ | 73,402,168 | |
| | | | |
At December 31, 2013, the cost of investments, net unrealized appreciation (depreciation), and undistributed ordinary income for income tax purposes were as follows:
| | | | |
Cost of investments | | $ | 2,149,983,787 | |
| | | | |
| |
Unrealized appreciation | | $ | 707,876,713 | |
Unrealized depreciation | | | (64,835,724 | ) |
| | | | |
Net unrealized appreciation (depreciation) | | $ | 643,040,989 | |
| | | | |
Distributable earnings – undistributed ordinary income | | $ | 49,729,731 | |
| | | | |
Differences between income and/or capital gains as determined on a book basis and a tax basis are primarily due to differing treatments of foreign currency transactions and wash sales.
6. INVESTMENT TRANSACTIONS
Purchases and sales of investments (excluding short term securities) for the year ended December 31, 2013, aggregated $592,406,211 and $841,981,365, respectively.
7. INVESTMENTS IN INSTITUTIONAL FIDUCIARY TRUST MONEY MARKET PORTFOLIO
The Fund invests in the Institutional Fiduciary Trust Money Market Portfolio (Sweep Money Fund), an open-end investment company managed by Franklin Advisers, Inc. (an affiliate of the investment manager). Management fees paid by the Fund are reduced on assets invested in the Sweep Money Fund, in an amount not to exceed the management and administrative fees paid by the Sweep Money Fund.
8. CONCENTRATION OF RISK
Investing in foreign securities may include certain risks and considerations not typically associated with investing in U.S. securities, such as fluctuating currency values and changing local and regional economic, political and social conditions, which may result in greater market volatility. In addition, certain foreign securities may not be as liquid as U.S. securities.
9. CREDIT FACILITY
The Fund, together with other U.S. registered and foreign investment funds (collectively, Borrowers), managed by Franklin Templeton Investments, are borrowers in a joint syndicated senior unsecured credit facility totaling $1.5 billion (Global Credit Facility) which, after an extension of the original terms, matured on February 14, 2014. This Global Credit Facility provides a source of funds to the Borrowers for temporary and emergency purposes, including the ability to meet future unanticipated or unusually large redemption requests. Effective February 14, 2014, the Borrowers renewed the Global Credit Facility which matures on February 13, 2015.
TF-25
Franklin Templeton Variable Insurance Products Trust
Notes to Financial Statements (continued)
Templeton Foreign Securities Fund
9. CREDIT FACILITY (continued)
Under the terms of the Global Credit Facility, the Fund shall, in addition to interest charged on any borrowings made by the Fund and other costs incurred by the Fund, pay its share of fees and expenses incurred in connection with the implementation and maintenance of the Global Credit Facility, based upon its relative share of the aggregate net assets of all of the Borrowers, including an annual commitment fee of 0.07% based upon the unused portion of the Global Credit Facility. These fees are reflected in other expenses on the Statement of Operations. During the year ended December 31, 2013, the Fund did not use the Global Credit Facility.
10. FAIR VALUE MEASUREMENTS
The Fund follows a fair value hierarchy that distinguishes between market data obtained from independent sources (observable inputs) and the Fund’s own market assumptions (unobservable inputs). These inputs are used in determining the value of the Fund’s financial instruments and are summarized in the following fair value hierarchy:
| | • | | Level 1 – quoted prices in active markets for identical financial instruments |
| | • | | Level 2 – other significant observable inputs (including quoted prices for similar financial instruments, interest rates, prepayment speed, credit risk, etc.) |
| | • | | Level 3 – significant unobservable inputs (including the Fund’s own assumptions in determining the fair value of financial instruments) |
The input levels are not necessarily an indication of the risk or liquidity associated with financial instruments at that level.
For movements between the levels within the fair value hierarchy, the Fund has adopted a policy of recognizing the transfers as of the date of the underlying event which caused the movement.
A summary of inputs used as of December 31, 2013, in valuing the Fund’s assets carried at fair value, is as follows:
| | | | | | | | | | | | | | | | |
| | | Level 1 | | | Level 2 | | | Level 3 | | | Total | |
| | | | |
Assets: | | | | | | | | | | | | | | | | |
Investments in Securities: | | | | | | | | | | | | | | | | |
Equity Investmentsa,b | | $ | 2,717,000,235 | | | $ | — | | | $ | — | | | $ | 2,717,000,235 | |
Short Term Investments | | | 69,592,541 | | | | 6,432,000 | | | | — | | | | 76,024,541 | |
| | | | |
Total Investments in Securities | | $ | 2,786,592,776 | | | $ | 6,432,000 | | | $ | — | | | $ | 2,793,024,776 | |
| | | | |
aIncludes common and preferred stocks.
bFor detailed categories, see the accompanying Statement of Investments.
11. NEW ACCOUNTING PRONOUNCEMENTS
In June 2013, the Financial Accounting Standards Board issued Accounting Standards Update (ASU) No. 2013-08, Investment Companies (Topic 946): Amendments to the Scope, Measurement, and Disclosure Requirements. The ASU modifies the criteria used in defining an investment company under U.S. Generally Accepted Accounting Principles and also sets forth certain measurement and disclosure requirements. Under the ASU, an entity that is registered under the 1940 Act automatically qualifies as an investment company. The ASU is effective for interim and annual reporting periods beginning after December 15, 2013. Management has reviewed the requirements and believes the adoption of this ASU will not have a material impact on the financial statements.
TF-26
Franklin Templeton Variable Insurance Products Trust
Notes to Financial Statements (continued)
Templeton Foreign Securities Fund
12. SUBSEQUENT EVENTS
The Fund has evaluated subsequent events through the issuance of the financial statements and determined that no events have occurred that require disclosure other than those already disclosed in the financial statements.
| | | | |
ABBREVIATIONS | | | | |
| Selected Portfolio | | | | |
| | | | |
| ADR - American Depositary Receipt | | | | |
| IDR - International Depositary Receipt | | | | |
TF-27
Franklin Templeton Variable Insurance Products Trust
Templeton Foreign Securities Fund
Report of Independent Registered Public Accounting Firm
To the Board of Trustees and Shareholders of
Franklin Templeton Variable Insurance Products Trust
In our opinion, the accompanying statement of assets and liabilities, including the statement of investments, and the related statements of operations and of changes in net assets and the financial highlights present fairly, in all material respects, the financial position of Templeton Foreign Securities Fund (the “Fund”) at December 31, 2013, the results of its operations for the year then ended, the changes in its net assets for each of the two years in the period then ended and the financial highlights for each of the five years in the period then ended, in conformity with accounting principles generally accepted in the United States of America. These financial statements and financial highlights (hereafter referred to as “financial statements”) are the responsibility of the Fund’s management. Our responsibility is to express an opinion on these financial statements based on our audits. We conducted our audits of these financial statements in accordance with the standards of the Public Company Accounting Oversight Board (United States). Those standards require that we plan and perform the audit to obtain reasonable assurance about whether the financial statements are free of material misstatement. An audit includes examining, on a test basis, evidence supporting the amounts and disclosures in the financial statements, assessing the accounting principles used and significant estimates made by management, and evaluating the overall financial statement presentation. We believe that our audits, which included confirmation of securities at December 31, 2013 by correspondence with the custodian, transfer agent and brokers, provide a reasonable basis for our opinion.
PricewaterhouseCoopers LLP
San Francisco, California
February 14, 2014
TF-28
Franklin Templeton Variable Insurance Products Trust
Tax Information (unaudited)
Templeton Foreign Securities Fund
At December 31, 2013, more than 50% of the Fund’s total assets were invested in securities of foreign issuers. In most instances, foreign taxes were withheld from income paid to the Fund on these investments. The Fund elects to treat foreign taxes paid as allowed under Section 853 of the Internal Revenue Code (Code). This election will allow shareholders of record as of the 2014 distribution date, to treat their proportionate share of foreign taxes paid by the Fund as having been paid directly by them. The shareholder shall consider these amounts as foreign taxes paid in the tax year in which they receive the Fund distribution.
TF-29
TEMPLETON GLOBAL BOND SECURITIES FUND
We are pleased to bring you Templeton Global Bond Securities Fund’s annual report for the fiscal year ended December 31, 2013.
Performance Summary as of 12/31/13
Average annual total return of Class 4 shares* represents the average annual change in value, assuming reinvestment of dividends and capital gains. Average returns smooth out variations in returns, which can be significant; they are not the same as year-by-year results.
Periods ended 12/31/13
| | | | | | | | | | | | |
| | | 1-Year | | | 5-Year | | | 10-Year | |
Average Annual Total Return | | | +1.54% | | | | +9.40% | | | | +8.87% | |
*For the period beginning 2/29/08, Class 4 performance reflects a 12b-1 fee expense of 0.35% per year, which affects future performance. Class 4 performance prior to 2/29/08 reflects historical Class 1 performance, which does not have a 12b-1 fee expense. Since 2/29/08 (effective date), the average annual total return of Class 4 shares was +8.04%.
Total Return Index Comparison for a Hypothetical $10,000 Investment (1/1/04–12/31/13)
The graph below shows the change in value of a hypothetical $10,000 investment in the Fund over the indicated period and includes reinvestment of any income or distributions. The Fund’s performance* is compared to the performance of the J.P. Morgan (JPM) Global Government Bond Index (GGBI), the Citigroup World Government Bond Index (WGBI) and the Consumer Price Index (CPI). One cannot invest directly in an index, and an index is not representative of the Fund’s portfolio. Please see Important Notes to Performance Information preceding the Fund Summaries.
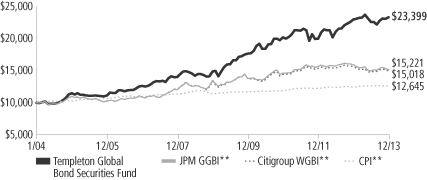
**Source: © 2014 Morningstar. Please see Index Descriptions following the Fund Summaries.
Templeton Global Bond Securities Fund – Class 4
Performance reflects the Fund’s Class 4 operating expenses, but does not include any contract fees, expenses or sales charges. If they had been included, performance would be lower. These charges and deductions, particularly for variable life policies, can have a significant effect on contract values and insurance benefits. See the contract prospectus for a complete description of these expenses, including sales charges.
Performance data represent past performance, which does not guarantee future results. Investment return and principal value will fluctuate, and you may have a gain or loss when you sell your shares.
Current performance may differ from figures shown.
TGB-1
Fund Goal and Main Investments: Templeton Global Bond Securities Fund seeks high current income, consistent with preservation of capital, with capital appreciation as a secondary consideration. Under normal market conditions, the Fund invests at least 80% of its net assets in bonds, which include debt securities of any maturity, such as bonds, notes, bills and debentures.
Performance Overview
You can find the Fund’s one-year total return in the Performance Summary. For comparison, the Fund’s benchmarks, the JPM GGBI and the Citigroup WGBI, had -4.50% and -4.00% total returns for the same period.1
Economic and Market Overview
The global economic recovery was mixed during the year under review. The recovery in emerging markets moderated after many economies had previously returned to and exceeded pre-crisis activity levels. Although some developed economies, such as those of Australia and some Scandinavian countries, have enjoyed relatively strong recoveries in the aftermath of the global financial crisis, growth in the eurozone and Japan continued to be slow by the standards of previous recoveries. Improving sentiment, relatively strong fundamentals and continued provision of global liquidity supported assets perceived as risky and equity markets performed well.
Fears of possible reductions in stimulative government policies contributed to periods of risk aversion, when credit spreads widened and assets perceived as risky sold off, alternating with periods of heightened risk appetite, when spreads narrowed and investors again favored risk assets. Against this backdrop, extensive liquidity creation continued, in particular from the Bank of Japan’s commitment to raise its inflation target, as well as from the European Central Bank’s interest rate cuts.
During the period, the U.S. Federal Reserve Board (Fed) announced it might reduce the size of its quantitative easing program at subsequent meetings. The announcement led risk assets, particularly those in emerging markets, to sell off as market participants’ expectations of global liquidity conditions began to change. The Fed later confirmed it would begin tapering its asset purchases from $85 billion per month to $75 billion per month beginning in January 2014.
1. Source: © 2014 Morningstar. One cannot invest directly in an index, and an index is not representative of the Fund’s portfolio. Please see Index Descriptions following the Fund Summaries.
Fund Risks: All investments involve risks, including possible loss of principal. Currency rates may fluctuate significantly over short periods of time, and can reduce returns. Derivatives, including currency management strategies, involve costs and can create economic leverage in the portfolio that may result in significant volatility and cause the Fund to participate in losses (as well as enable gains) on an amount that exceeds the Fund’s initial investment. The Fund may not achieve the anticipated benefits and may realize losses when a counterparty fails to perform as promised. Foreign securities involve special risks, including currency fluctuations and economic and political uncertainties. Investments in emerging markets involve heightened risks related to the same factors, in addition to those associated with these markets’ smaller size and lesser liquidity. Investments in lower rated bonds include higher risk of default and loss of principal. Changes in interest rates will affect the value of the Fund’s portfolio and its share price and yield. Bond prices generally move in the opposite direction of interest rates. As prices of bonds in the Fund adjust to a rise in interest rates, the Fund’s share price may decline. The Fund is also nondiversified, which involves the risk of greater price fluctuation than a more diversified portfolio. Changes in the financial strength of a bond issuer or in a bond’s credit rating may affect its value. The Fund is actively managed but there is no guarantee that the manager’s investment decisions will produce the desired results. The Fund’s prospectus also includes a description of the main investment risks.
TGB-2
Global financial market volatility increased toward the end of the period as the U.S. federal government partially shut down and the U.S. Treasury approached its debt ceiling. As the government shutdown ended and the debt ceiling was raised, market volatility quickly subsided.
Investment Strategy
We invest selectively in bonds around the world based upon our assessment of changing market, political and economic conditions. While seeking opportunities, we monitor various factors including changes in interest rates, currency exchange rates and credit risks. We seek to manage the Fund’s exposure to various currencies and may utilize currency forward contracts.
Manager’s Discussion
The Fund’s total return was influenced by various factors, including interest rate developments, currency movements and exposure to sovereign debt markets. During the year under review, each of these sources of return benefited absolute and relative performance.
Interest Rate Strategy
As part of the Fund’s interest rate strategy we use interest rate swaps to manage duration. We maintained a defensive posture with respect to interest rate risk in developed and emerging markets. At period-end, the Fund had a shorter duration position than the JPM GGBI given our assessment that there was limited scope for further global interest rate reductions from historically low levels and improving economic conditions. However, we maintained some duration exposure in countries where we believed long-term bond yields could benefit from declining risk premiums, and select duration exposures in Europe and Latin America contributed to performance relative to the JPM GGBI.
Currency Strategy
As part of the Fund’s investment strategy, we used currency forward contracts seeking to hedge or gain exposure to various currencies. Overall, our diversified currency exposure contributed to absolute performance and performance relative to the JPM GGBI. As the Japanese yen depreciated against the U.S. dollar during the year, the Fund’s net negative position in the currency, achieved via the use of currency forward contracts, contributed meaningfully in terms of absolute and relative performance. Our net negative position in the yen reflected our pessimistic view on the relative prospects for the Japanese economy and
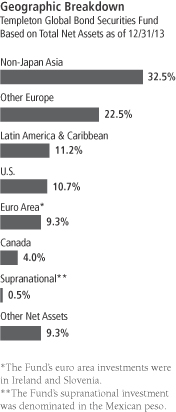
What is duration?
Duration is a measure of a bond’s price sensitivity to interest rate changes. In general, a portfolio of securities with a lower duration can be expected to be less sensitive to interest rate changes than a portfolio with a higher duration.
What is an interest rate swap?
An interest rate swap is an agreement between two parties to exchange interest rate obligations, generally one based on an interest rate fixed to maturity while the other is based on an interest rate that changes in accordance with changes in a designated benchmark (for example, LIBOR, prime, commercial paper or other benchmarks).
What is a currency forward contract?
A currency forward contract is an agreement between the Fund and a counterparty to buy or sell a foreign currency at a specific exchange rate on a future date.
TGB-3
was meant as an implicit hedge against potentially rising yields in the U.S., given the yen’s historically strong correlation to long-term U.S. Treasury yields. However, as the euro appreciated against the U.S. dollar during the year, our net negative position in the monetary union’s currency detracted from performance.
Global Sovereign Debt Strategy
The Fund purchased investment-grade and subinvestment-grade hard currency-denominated sovereign debt that has historically typically compensated for greater credit risk by offering higher yields relative to U.S. Treasury and European benchmark bonds. Overall, the Fund’s sovereign credit exposures contributed to performance. These exposures were concentrated in non-eurozone Europe.
Thank you for your participation in Templeton Global Bond Securities Fund. We look forward to serving your future investment needs.
The foregoing information reflects our analysis, opinions and portfolio holdings as of December 31, 2013, the end of the reporting period. The way we implement our main investment strategies and the resulting portfolio holdings may change depending on factors such as market and economic conditions. These opinions may not be relied upon as investment advice or an offer for a particular security. The information is not a complete analysis of every aspect of any market, country, industry, security or the Fund. Statements of fact are from sources considered reliable, but the investment manager makes no representation or warranty as to their completeness or accuracy. Although historical performance is no guarantee of future results, these insights may help you understand our investment management philosophy.
Currency Breakdown
Templeton Global Bond Securities Fund
12/31/13
| | | | |
| | | % of Total
Net Assets | |
| |
Americas | | | 82.1% | |
| U.S. Dollar | | | 58.2% | |
| Mexican Peso | | | 11.7% | |
| Brazilian Real | | | 4.4% | |
| Canadian Dollar | | | 4.0% | |
| Chilean Peso | | | 3.7% | |
| Peruvian Nuevo Sol | | | 0.1% | |
| |
Asia Pacific | | | 24.6% | |
| South Korean Won | | | 16.4% | |
| Malaysian Ringgit | | | 12.7% | |
| Singapore Dollar | | | 8.5% | |
| Indonesian Rupiah | | | 2.4% | |
| Indian Rupee | | | 2.3% | |
| Philippine Peso | | | 1.4% | |
| Sri Lankan Rupee | | | 1.2% | |
| Japanese Yen* | | | -20.3% | |
| |
Europe* | | | -6.7% | |
| Polish Zloty | | | 10.6% | |
| Swedish Krona | | | 8.1% | |
| Hungarian Forint | | | 2.3% | |
| Euro* | | | -27.7% | |
*A negative figure reflects net “short” exposure, designed to benefit if the value of the associated currency decreases. Conversely, the Fund’s value would potentially decline if the value of the associated currency increases.
The dollar value, number of shares or principal amount, and names of all portfolio holdings are listed in the Fund’s Statement of Investments.
TGB-4
Fund Expenses
As an investor in a variable insurance contract (Contract) that indirectly provides for investment in an underlying mutual fund, you can incur transaction and/or ongoing expenses at both the Fund level and the Contract level.
| • | | Transaction expenses can include sales charges (loads) on purchases, redemption fees, surrender fees, transfer fees and premium taxes. |
| • | | Ongoing expenses can include management fees, distribution and service (12b-1) fees, contract fees, annual maintenance fees, mortality and expense risk fees and other fees and expenses. All mutual funds and Contracts have some types of ongoing expenses. |
The expenses shown in the table are meant to highlight ongoing expenses at the Fund level only and do not include ongoing expenses at the Contract level, or transaction expenses at either the Fund or Contract level. While the Fund does not have transaction expenses, if the transaction and ongoing expenses at the Contract level were included, the expenses shown below would be higher. You should consult your Contract prospectus or disclosure document for more information.
The table shows Fund-level ongoing expenses and can help you understand these expenses and compare them with those of other mutual funds offered through the Contract. The table assumes a $1,000 investment held for the six months indicated. Please refer to the Fund prospectus for additional information on operating expenses.
Actual Fund Expenses
The first line (Actual) of the table provides actual account values and expenses. The “Ending Account Value” is derived from the Fund’s actual return, which includes the effect of ongoing Fund expenses, but does not include the effect of ongoing Contract expenses.
You can estimate the Fund-level expenses you incurred during the period by following these steps. Of course, your account value and expenses will differ from those in this illustration:
| 1. | Divide your account value by $1,000. |
If an account had an $8,600 value, then $8,600 ÷ $1,000 = 8.6.
| 2. | Multiply the result by the number under the heading “Fund-Level Expenses Incurred During Period.” |
If Fund-Level Expenses Incurred During Period were $7.50, then 8.6 x $7.50 = $64.50.
In this illustration, the estimated expenses incurred this period at the Fund level are $64.50.
Templeton Global Bond Securities Fund – Class 4
TGB-5
Hypothetical Example for Comparison with Other Mutual Funds
Information in the second line (Hypothetical) of the table can help you compare ongoing expenses of the Fund with those of other mutual funds offered through the Contract. This information may not be used to estimate the actual ending account balance or expenses you incurred during the period. The hypothetical “Ending Account Value” is based on the Fund’s actual expense ratio for each class and an assumed 5% annual rate of return before expenses, which does not represent the Fund’s actual return. The figure under the heading “Fund-Level Expenses Incurred During Period” shows the hypothetical expenses your account would have incurred under this scenario. You can compare this figure with the 5% hypothetical examples that appear in shareholder reports of other funds offered through a Contract.
| | | | | | | | | | | | |
| Class 4 | | Beginning
Account Value 7/1/13 | | | Ending
Account Value 12/31/13 | | | Fund-Level Expenses Incurred During Period* 7/1/13–12/31/13 | |
Actual | | $ | 1,000 | | | $ | 1,033.20 | | | $ | 4.30 | |
Hypothetical (5% return
before expenses) | | $ | 1,000 | | | $ | 1,020.97 | | | $ | 4.28 | |
*Expenses are calculated using the most recent six-month annualized expense ratio for the Fund’s Class 4 shares (0.84%), which does not include any ongoing expenses of the Contract for which the Fund is an investment option, multiplied by the average account value over the period, multiplied by 184/365 to reflect the one-half year period.
TGB-6
Franklin Templeton Variable Insurance Products Trust
Financial Highlights
Templeton Global Bond Securities Fund
| | | | | | | | | | | | | | | | | | | | |
| | | Year Ended December 31, | |
| Class 1 | | 2013 | | | 2012 | | | 2011 | | | 2010 | | | 2009 | |
| | | | |
Per share operating performance | | | | | | | | | | | | | | | | | | | | |
(for a share outstanding throughout the year) | | | | | | | | | | | | | | | | | | | | |
Net asset value, beginning of year | | $ | 20.01 | | | $ | 18.61 | | | $ | 19.94 | | | $ | 17.72 | | | $ | 17.42 | |
| | | | |
Income from investment operationsa: | | | | | | | | | | | | | | | | | | | | |
Net investment incomeb | | | 0.64 | | | | 0.72 | | | | 0.87 | | | | 1.00 | | | | 0.99 | |
Net realized and unrealized gains (losses) | | | (0.30 | ) | | | 1.99 | | | | (0.92 | ) | | | 1.58 | | | | 2.01 | |
| | | | |
Total from investment operations | | | 0.34 | | | | 2.71 | | | | (0.05 | ) | | | 2.58 | | | | 3.00 | |
| | | | |
Less distributions from: | | | | | | | | | | | | | | | | | | | | |
Net investment income and net foreign currency gains | | | (0.96 | ) | | | (1.28 | ) | | | (1.15 | ) | | | (0.31 | ) | | | (2.70 | ) |
Net realized gains | | | (0.24 | ) | | | (0.03 | ) | | | (0.13 | ) | | | (0.05 | ) | | | — | |
| | | | |
Total distributions | | | (1.20 | ) | | | (1.31 | ) | | | (1.28 | ) | | | (0.36 | ) | | | (2.70 | ) |
| | | | |
Redemption feesc | | | — | | | | — | | | | — | | | | — | | | | — | |
| | | | |
Net asset value, end of year | | $ | 19.15 | | | $ | 20.01 | | | $ | 18.61 | | | $ | 19.94 | | | $ | 17.72 | |
| | | | |
| | | | | |
Total returnd | | | 1.89% | | | | 15.31% | | | | (0.61)% | | | | 14.71% | | | | 18.98% | |
Ratios to average net assets | | | | | | | | | | | | | | | | | | | | |
Expensese | | | 0.51% | | | | 0.55% | | | | 0.56% | | | | 0.55% | | | | 0.54% | |
Net investment income | | | 3.26% | | | | 3.71% | | | | 4.40% | | | | 5.27% | | | | 5.73% | |
| | | | | |
Supplemental data | | | | | | | | | | | | | | | | | | | | |
Net assets, end of year (000’s) | | $ | 280,963 | | | $ | 307,142 | | | $ | 269,819 | | | $ | 272,232 | | | $ | 195,662 | |
Portfolio turnover rate | | | 34.39% | | | | 43.26% | | | | 34.18% | | | | 8.77% | | | | 20.84% | |
aThe amount shown for a share outstanding throughout the period may not correlate with the Statement of Operations for the period due to the timing of sales and repurchases of the Fund shares in relation to income earned and/or fluctuating market value of the investments of the Fund.
bBased on average daily shares outstanding.
cAmount rounds to less than $0.01 per share.
dTotal return does not include fees, charges or expenses imposed by the variable annuity and life insurance contracts for which the Franklin Templeton Variable Insurance Products Trust serves as an underlying investment vehicle.
eBenefit of expense reduction rounds to less than 0.01%.
The accompanying notes are an integral part of these financial statements.
TGB-7
Franklin Templeton Variable Insurance Products Trust
Financial Highlights (continued)
Templeton Global Bond Securities Fund
| | | | | | | | | | | | | | | | | | | | |
| | | Year Ended December 31, | |
| Class 2 | | 2013 | | | 2012 | | | 2011 | | | 2010 | | | 2009 | |
| | | | |
Per share operating performance | | | | | | | | | | | | | | | | | | | | |
(for a share outstanding throughout the year) | | | | | | | | | | | | | | | | | | | | |
Net asset value, beginning of year | | $ | 19.47 | | | $ | 18.15 | | | $ | 19.49 | | | $ | 17.34 | | | $ | 17.10 | |
| | | | |
Income from investment operationsa: | | | | | | | | | | | | | | | | | | | | |
Net investment incomeb | | | 0.57 | | | | 0.65 | | | | 0.79 | | | | 0.93 | | | | 0.93 | |
Net realized and unrealized gains (losses) | | | (0.27 | ) | | | 1.94 | | | | (0.89 | ) | | | 1.54 | | | | 1.98 | |
| | | | |
Total from investment operations | | | 0.30 | | | | 2.59 | | | | (0.10 | ) | | | 2.47 | | | | 2.91 | |
| | | | |
Less distributions from: | | | | | | | | | | | | | | | | | | | | |
Net investment income and net foreign currency gains | | | (0.93 | ) | | | (1.24 | ) | | | (1.11 | ) | | | (0.27 | ) | | | (2.67 | ) |
Net realized gains | | | (0.24 | ) | | | (0.03 | ) | | | (0.13 | ) | | | (0.05 | ) | | | — | |
| | | | |
Total distributions | | | (1.17 | ) | | | (1.27 | ) | | | (1.24 | ) | | | (0.32 | ) | | | (2.67 | ) |
| | | | |
Redemption feesc | | | — | | | | — | | | | — | | | | — | | | | — | |
| | | | |
Net asset value, end of year | | $ | 18.60 | | | $ | 19.47 | | | $ | 18.15 | | | $ | 19.49 | | | $ | 17.34 | |
| | | | |
| | | | | |
Total returnd | | | 1.63% | | | | 15.07% | | | | (0.87)% | | | | 14.45% | | | | 18.68% | |
Ratios to average net assets | | | | | | | | | | | | | | | | | | | | |
Expensese | | | 0.76% | | | | 0.80% | | | | 0.81% | | | | 0.80% | | | | 0.79% | |
Net investment income | | | 3.01% | | | | 3.46% | | | | 4.15% | | | | 5.02% | | | | 5.48% | |
| | | | | |
Supplemental data | | | | | | | | | | | | | | | | | | | | |
Net assets, end of year (000’s) | | $ | 2,826,039 | | | $ | 2,418,229 | | | $ | 1,812,814 | | | $ | 1,490,794 | | | $ | 1,262,783 | |
Portfolio turnover rate | | | 34.39% | | | | 43.26% | | | | 34.18% | | | | 8.77% | | | | 20.84% | |
aThe amount shown for a share outstanding throughout the period may not correlate with the Statement of Operations for the period due to the timing of sales and repurchases of the Fund shares in relation to income earned and/or fluctuating market value of the investments of the Fund.
bBased on average daily shares outstanding.
cAmount rounds to less than $0.01 per share.
dTotal return does not include fees, charges or expenses imposed by the variable annuity and life insurance contracts for which the Franklin Templeton Variable Insurance Products Trust serves as an underlying investment vehicle.
eBenefit of expense reduction rounds to less than 0.01%.
The accompanying notes are an integral part of these financial statements.
TGB-8
Franklin Templeton Variable Insurance Products Trust
Financial Highlights (continued)
Templeton Global Bond Securities Fund
| | | | | | | | | | | | | | | | | | | | |
| | | Year Ended December 31, | |
| Class 3 | | 2013 | | | 2012 | | | 2011 | | | 2010 | | | 2009 | |
| | | | |
Per share operating performance | | | | | | | | | | | | | | | | | | | | |
(for a share outstanding throughout the year) | | | | | | | | | | | | | | | | | | | | |
Net asset value, beginning of year | | $ | 19.48 | | | $ | 18.15 | | | $ | 19.48 | | | $ | 17.33 | | | $ | 17.08 | |
| | | | |
Income from investment operationsa: | | | | | | | | | | | | | | | | | | | | |
Net investment incomeb | | | 0.57 | | | | 0.65 | | | | 0.80 | | | | 0.93 | | | | 0.93 | |
Net realized and unrealized gains (losses) | | | (0.27 | ) | | | 1.94 | | | | (0.90 | ) | | | 1.54 | | | | 1.98 | |
| | | | |
Total from investment operations | | | 0.30 | | | | 2.59 | | | | (0.10 | ) | | | 2.47 | | | | 2.91 | |
| | | | |
Less distributions from: | | | | | | | | | | | | | | | | | | | | |
Net investment income and net foreign currency gains | | | (0.92 | ) | | | (1.23 | ) | | | (1.10 | ) | | | (0.27 | ) | | | (2.66 | ) |
Net realized gains | | | (0.24 | ) | | | (0.03 | ) | | | (0.13 | ) | | | (0.05 | ) | | | — | |
| | | | |
Total distributions | | | (1.16 | ) | | | (1.26 | ) | | | (1.23 | ) | | | (0.32 | ) | | | (2.66 | ) |
| | | | |
Redemption feesc | | | — | | | | — | | | | — | | | | — | | | | — | |
| | | | |
Net asset value, end of year | | $ | 18.62 | | | $ | 19.48 | | | $ | 18.15 | | | $ | 19.48 | | | $ | 17.33 | |
| | | | |
| | | | | |
Total returnd | | | 1.64% | | | | 15.06% | | | | (0.83)% | | | | 14.38% | | | | 18.69% | |
Ratios to average net assets | | | | | | | | | | | | | | | | | | | | |
Expensese | | | 0.76% | | | | 0.80% | | | | 0.81% | | | | 0.80% | | | | 0.79% | |
Net investment income | | | 3.01% | | | | 3.46% | | | | 4.15% | | | | 5.02% | | | | 5.48% | |
| | | | | |
Supplemental data | | | | | | | | | | | | | | | | | | | | |
Net assets, end of year (000’s) | | $ | 194,122 | | | $ | 198,077 | | | $ | 185,811 | | | $ | 183,380 | | | $ | 143,264 | |
Portfolio turnover rate | | | 34.39% | | | | 43.26% | | | | 34.18% | | | | 8.77% | | | | 20.84% | |
aThe amount shown for a share outstanding throughout the period may not correlate with the Statement of Operations for the period due to the timing of sales and repurchases of the Fund shares in relation to income earned and/or fluctuating market value of the investments of the Fund.
bBased on average daily shares outstanding.
cAmount rounds to less than $0.01 per share.
dTotal return does not include fees, charges or expenses imposed by the variable annuity and life insurance contracts for which the Franklin Templeton Variable Insurance Products Trust serves as an underlying investment vehicle.
eBenefit of expense reduction rounds to less than 0.01%.
The accompanying notes are an integral part of these financial statements.
TGB-9
Franklin Templeton Variable Insurance Products Trust
Financial Highlights (continued)
Templeton Global Bond Securities Fund
| | | | | | | | | | | | | | | | | | | | |
| | | Year Ended December 31, | |
| Class 4 | | 2013 | | | 2012 | | | 2011 | | | 2010 | | | 2009 | |
| | | | |
Per share operating performance | | | | | | | | | | | | | | | | | | | | |
(for a share outstanding throughout the year) | | | | | | | | | | | | | | | | | | | | |
Net asset value, beginning of year | | $ | 19.82 | | | $ | 18.44 | | | $ | 19.78 | | | $ | 17.61 | | | $ | 17.37 | |
| | | | |
Income from investment operationsa: | | | | | | | | | | | | | | | | | | | | |
Net investment incomeb | | | 0.56 | | | | 0.64 | | | | 0.79 | | | | 0.93 | | | | 0.93 | |
Net realized and unrealized gains (losses) | | | (0.28 | ) | | | 1.98 | | | | (0.91 | ) | | | 1.56 | | | | 2.00 | |
| | | | |
Total from investment operations | | | 0.28 | | | | 2.62 | | | | (0.12 | ) | | | 2.49 | | | | 2.93 | |
| | | | |
Less distributions from: | | | | | | | | | | | | | | | | | | | | |
Net investment income and net foreign currency gains | | | (0.89 | ) | | | (1.21 | ) | | | (1.09 | ) | | | (0.27 | ) | | | (2.69 | ) |
Net realized gains | | | (0.24 | ) | | | (0.03 | ) | | | (0.13 | ) | | | (0.05 | ) | | | — | |
| | | | |
Total distributions | | | (1.13 | ) | | | (1.24 | ) | | | (1.22 | ) | | | (0.32 | ) | | | (2.69 | ) |
| | | | |
Redemption feesc | | | — | | | | — | | | | — | | | | — | | | | — | |
| | | | |
Net asset value, end of year | | $ | 18.97 | | | $ | 19.82 | | | $ | 18.44 | | | $ | 19.78 | | | $ | 17.61 | |
| | | | |
| | | | | |
Total returnd | | | 1.54% | | | | 14.97% | | | | (0.96)% | | | | 14.28% | | | | 18.58% | |
Ratios to average net assets | | | | | | | | | | | | | | | | | | | | |
Expensese | | | 0.86% | | | | 0.90% | | | | 0.91% | | | | 0.90% | | | | 0.89% | |
Net investment income | | | 2.91% | | | | 3.36% | | | | 4.05% | | | | 4.92% | | | | 5.38% | |
| | | | | |
Supplemental data | | | | | | | | | | | | | | | | | | | | |
Net assets, end of year (000’s) | | $ | 118,145 | | | $ | 163,241 | | | $ | 151,695 | | | $ | 150,891 | | | $ | 108,910 | |
Portfolio turnover rate | | | 34.39% | | | | 43.26% | | | | 34.18% | | | | 8.77% | | | | 20.84% | |
aThe amount shown for a share outstanding throughout the period may not correlate with the Statement of Operations for the period due to the timing of sales and repurchases of the Fund shares in relation to income earned and/or fluctuating market value of the investments of the Fund.
bBased on average daily shares outstanding.
cAmount rounds to less than $0.01 per share.
dTotal return does not include fees, charges or expenses imposed by the variable annuity and life insurance contracts for which the Franklin Templeton Variable Insurance Products Trust serves as an underlying investment vehicle.
eBenefit of expense reduction rounds to less than 0.01%.
The accompanying notes are an integral part of these financial statements.
TGB-10
Franklin Templeton Variable Insurance Products Trust
Statement of Investments, December 31, 2013
| | | | | | | | |
| Templeton Global Bond Securities Fund | | Principal
Amount* | | | Value | |
Foreign Government and Agency Securities 65.7% | | | | | | | | |
Brazil 4.1% | | | | | | | | |
Letra Tesouro Nacional, Strip, | | | | | | | | |
1/01/15 | | | 3,971 | a BRL | | $ | 1,517,952 | |
1/01/16 | | | 26,160 | a BRL | | | 8,866,995 | |
1/01/17 | | | 46,660 | a BRL | | | 13,913,524 | |
Nota Do Tesouro Nacional, | | | | | | | | |
10.00%, 1/01/14 | | | 7,100 | a BRL | | | 3,005,713 | |
10.00%, 1/01/17 | | | 22,490 | a BRL | | | 9,010,015 | |
10.00%, 1/01/21 | | | 9,240 | a BRL | | | 3,398,793 | |
10.00%, 1/01/23 | | | 26,700 | a BRL | | | 9,526,924 | |
b Index Linked, 6.00%, 5/15/15 | | | 30,226 | a BRL | | | 30,796,127 | |
b Index Linked, 6.00%, 8/15/16 | | | 14,388 | a BRL | | | 14,526,395 | |
b Index Linked, 6.00%, 5/15/17 | | | 202 | a BRL | | | 202,885 | |
b Index Linked, 6.00%, 8/15/18 | | | 12,725 | a BRL | | | 12,679,621 | |
b Index Linked, 6.00%, 8/15/22 | | | 14,400 | a BRL | | | 14,056,509 | |
b Index Linked, 6.00%, 5/15/45 | | | 10,825 | a BRL | | | 10,079,341 | |
senior note, 10.00%, 1/01/19 | | | 21,390 | a BRL | | | 8,192,766 | |
| | | | | | | | |
| | | | | | | 139,773,560 | |
| | | | | | | | |
Canada 2.7% | | | | | | | | |
Government of Canada, | | | | | | | | |
2.25%, 8/01/14 | | | 10,628,000 | CAD | | | 10,079,965 | |
1.00%, 11/01/14 | | | 20,887,000 | CAD | | | 19,667,584 | |
2.00%, 12/01/14 | | | 17,861,000 | CAD | | | 16,971,271 | |
1.00%, 2/01/15 | | | 48,972,000 | CAD | | | 46,108,326 | |
| | | | | | | | |
| | | | | | | 92,827,146 | |
| | | | | | | | |
Hungary 4.2% | | | | | | | | |
Government of Hungary, | | | | | | | | |
5.50%, 2/12/14 | | | 653,440,000 | HUF | | | 3,030,175 | |
7.75%, 8/24/15 | | | 672,690,000 | HUF | | | 3,331,052 | |
5.50%, 2/12/16 | | | 436,800,000 | HUF | | | 2,095,705 | |
5.50%, 12/22/16 | | | 236,640,000 | HUF | | | 1,139,444 | |
4.125%, 2/19/18 | | | 14,310,000 | | | | 14,462,044 | |
6.50%, 6/24/19 | | | 389,700,000 | HUF | | | 1,949,586 | |
7.50%, 11/12/20 | | | 317,540,000 | HUF | | | 1,659,850 | |
5.375%, 2/21/23 | | | 26,430,000 | | | | 26,206,666 | |
A, 8.00%, 2/12/15 | | | 280,000,000 | HUF | | | 1,364,846 | |
A, 6.75%, 11/24/17 | | | 2,049,040,000 | HUF | | | 10,280,148 | |
A, 5.50%, 12/20/18 | | | 446,060,000 | HUF | | | 2,136,985 | |
A, 7.00%, 6/24/22 | | | 512,570,000 | HUF | | | 2,585,322 | |
A, 6.00%, 11/24/23 | | | 173,290,000 | HUF | | | 822,136 | |
B, 6.75%, 2/24/17 | | | 394,700,000 | HUF | | | 1,961,662 | |
D, 6.75%, 8/22/14 | | | 1,856,440,000 | HUF | | | 8,782,954 | |
senior note, 6.25%, 1/29/20 | | | 6,420,000 | | | | 6,945,638 | |
senior note, 6.375%, 3/29/21 | | | 14,820,000 | | | | 16,033,387 | |
c senior note, Reg S, 3.50%, 7/18/16 | | | 1,055,000 | EUR | | | 1,500,165 | |
c senior note, Reg S, 4.375%, 7/04/17 | | | 7,480,000 | EUR | | | 10,771,024 | |
c senior note, Reg S, 5.75%, 6/11/18 | | | 14,475,000 | EUR | | | 21,677,406 | |
c senior note, Reg S, 3.875%, 2/24/20 | | | 3,120,000 | EUR | | | 4,302,289 | |
| | | | | | | | |
| | | | | | | 143,038,484 | |
| | | | | | | | |
Iceland 0.2% | | | | | | | | |
dGovernment of Iceland, 144A, 5.875%, 5/11/22 | | | 7,660,000 | | | | 7,870,650 | |
| | | | | | | | |
TGB-11
Franklin Templeton Variable Insurance Products Trust
Statement of Investments, December 31, 2013 (continued)
| | | | | | | | |
| Templeton Global Bond Securities Fund | | Principal
Amount* | | | Value | |
Foreign Government and Agency Securities (continued) | | | | | | | | |
Indonesia 2.4% | | | | | | | | |
Government of Indonesia, | | | | | | | | |
FR31, 11.00%, 11/15/20 | | | 170,808,000,000 | IDR | | $ | 15,972,581 | |
FR34, 12.80%, 6/15/21 | | | 208,649,000,000 | IDR | | | 21,304,064 | |
FR35, 12.90%, 6/15/22 | | | 67,421,000,000 | IDR | | | 6,974,170 | |
FR36, 11.50%, 9/15/19 | | | 31,754,000,000 | IDR | | | 2,994,348 | |
FR39, 11.75%, 8/15/23 | | | 5,491,000,000 | IDR | | | 541,430 | |
FR40, 11.00%, 9/15/25 | | | 46,856,000,000 | IDR | | | 4,464,505 | |
FR43, 10.25%, 7/15/22 | | | 69,179,000,000 | IDR | | | 6,264,366 | |
FR44, 10.00%, 9/15/24 | | | 4,454,000,000 | IDR | | | 397,343 | |
FR46, 9.50%, 7/15/23 | | | 226,780,000,000 | IDR | | | 19,656,723 | |
FR48, 9.00%, 9/15/18 | | | 16,920,000,000 | IDR | | | 1,442,232 | |
senior bond, FR53, 8.25%, 7/15/21 | | | 11,270,000,000 | IDR | | | 919,895 | |
Indonesia Retail Bond, senior note, 8.50%, 10/15/16 | | | 3,358,000,000 | IDR | | | 276,243 | |
| | | | | | | | |
| | | | | | | 81,207,900 | |
| | | | | | | | |
Ireland 8.9% | | | | | | | | |
Government of Ireland, | | | | | | | | |
5.50%, 10/18/17 | | | 27,708,700 | EUR | | | 43,369,903 | |
5.90%, 10/18/19 | | | 20,597,000 | EUR | | | 33,280,628 | |
4.50%, 4/18/20 | | | 19,512,000 | EUR | | | 29,375,017 | |
5.00%, 10/18/20 | | | 58,588,000 | EUR | | | 90,671,337 | |
senior bond, 4.50%, 10/18/18 | | | 8,090,000 | EUR | | | 12,354,689 | |
senior bond, 4.40%, 6/18/19 | | | 20,943,000 | EUR | | | 31,673,977 | |
senior bond, 5.40%, 3/13/25 | | | 40,422,910 | EUR | | | 63,308,941 | |
| | | | | | | | |
| | | | | | | 304,034,492 | |
| | | | | | | | |
Lithuania 1.2% | | | | | | | | |
dGovernment of Lithuania, 144A, | | | | | | | | |
6.75%, 1/15/15 | | | 19,480,000 | | | | 20,600,587 | |
7.375%, 2/11/20 | | | 12,690,000 | | | | 15,267,656 | |
6.125%, 3/09/21 | | | 3,240,000 | | | | 3,676,315 | |
| | | | | | | | |
| | | | | | | 39,544,558 | |
| | | | | | | | |
Malaysia 3.8% | | | | | | | | |
Government of Malaysia, | | | | | | | | |
3.434%, 8/15/14 | | | 59,260,000 | MYR | | | 18,129,565 | |
3.741%, 2/27/15 | | | 61,480,000 | MYR | | | 18,893,122 | |
3.835%, 8/12/15 | | | 36,620,000 | MYR | | | 11,287,025 | |
4.72%, 9/30/15 | | | 230,000 | MYR | | | 71,971 | |
3.197%, 10/15/15 | | | 14,220,000 | MYR | | | 4,337,783 | |
senior bond, 5.094%, 4/30/14 | | | 187,985,000 | MYR | | | 57,734,359 | |
senior bond, 3.814%, 2/15/17 | | | 18,885,000 | MYR | | | 5,820,163 | |
senior bond, 4.24%, 2/07/18 | | | 44,360,000 | MYR | | | 13,820,132 | |
| | | | | | | | |
| | | | | | | 130,094,120 | |
| | | | | | | | |
Mexico 3.7% | | | | | | | | |
Government of Mexico, | | | | | | | | |
7.00%, 6/19/14 | | | 286,280e | MXN | | | 2,232,692 | |
9.50%, 12/18/14 | | | 1,774,400e | MXN | | | 14,371,673 | |
6.00%, 6/18/15 | | | 732,200e | MXN | | | 5,805,212 | |
8.00%, 12/17/15 | | | 4,996,150e | MXN | | | 41,408,288 | |
6.25%, 6/16/16 | | | 733,810e | MXN | | | 5,918,589 | |
7.25%, 12/15/16 | | | 250,000e | MXN | | | 2,067,835 | |
TGB-12
Franklin Templeton Variable Insurance Products Trust
Statement of Investments, December 31, 2013 (continued)
| | | | | | | | |
| Templeton Global Bond Securities Fund | | Principal
Amount* | | | Value | |
Foreign Government and Agency Securities (continued) | | | | | | | | |
Mexico (continued) | | | | | | | | |
7.75%, 12/14/17 | | | 4,473,000 | e MXN | | $ | 37,709,388 | |
fMexican Udibonos, Index Linked, | | | | | | | | |
4.50%, 12/18/14 | | | 222,190 | g MXN | | | 1,783,563 | |
5.00%, 6/16/16 | | | 569,208 | g MXN | | | 4,827,172 | |
3.50%, 12/14/17 | | | 570,675 | g MXN | | | 4,734,753 | |
4.00%, 6/13/19 | | | 391,698 | g MXN | | | 3,328,978 | |
2.50%, 12/10/20 | | | 308,481 | g MXN | | | 2,405,497 | |
| | | | | | | | |
| | | | | | | 126,593,640 | |
| | | | | | | | |
Peru 0.1% | | | | | | | | |
Government of Peru, senior bond, 7.84%, 8/12/20 | | | 11,090,000 | PEN | | | 4,535,287 | |
| | | | | | | | |
Philippines 0.2% | | | | | | | | |
Government of the Philippines, | | | | | | | | |
senior bond, 7.00%, 1/27/16 | | | 53,190,000 | PHP | | | 1,292,639 | |
senior bond, 9.125%, 9/04/16 | | | 31,840,000 | PHP | | | 821,907 | |
senior note, 6.25%, 1/27/14 | | | 35,720,000 | PHP | | | 806,832 | |
senior note, 1.625%, 4/25/16 | | | 236,480,000 | PHP | | | 5,278,929 | |
| | | | | | | | |
| | | | | | | 8,200,307 | |
| | | | | | | | |
Poland 9.1% | | | | | | | | |
Government of Poland, | | | | | | | | |
5.75%, 4/25/14 | | | 336,990,000 | PLN | | | 112,776,374 | |
5.50%, 4/25/15 | | | 31,408,000 | PLN | | | 10,771,993 | |
6.25%, 10/24/15 | | | 75,580,000 | PLN | | | 26,531,088 | |
5.00%, 4/25/16 | | | 45,810,000 | PLN | | | 15,820,591 | |
5.75%, 9/23/22 | | | 48,750,000 | PLN | | | 17,824,390 | |
hFRN, 2.71%, 1/25/17 | | | 59,279,000 | PLN | | | 19,571,709 | |
hFRN, 2.71%, 1/25/21 | | | 60,135,000 | PLN | | | 19,455,558 | |
Strip, 1/25/14 | | | 49,315,000 | PLN | | | 16,308,506 | |
Strip, 7/25/14 | | | 35,420,000 | PLN | | | 11,578,650 | |
Strip, 7/25/15 | | | 23,822,000 | PLN | | | 7,562,053 | |
Strip, 1/25/16 | | | 169,757,000 | PLN | | | 52,892,364 | |
| | | | | | | | |
| | | | | | | 311,093,276 | |
| | | | | | | | |
Russia 1.7% | | | | | | | | |
dRussia Foreign Bond, senior bond, 144A, 7.50%, 3/31/30 | | | 50,648,455 | | | | 59,108,013 | |
| | | | | | | | |
Serbia 0.7% | | | | | | | | |
dGovernment of Serbia, senior note, 144A, | | | | | | | | |
5.25%, 11/21/17 | | | 4,590,000 | | | | 4,627,294 | |
4.875%, 2/25/20 | | | 8,800,000 | | | | 8,371,000 | |
7.25%, 9/28/21 | | | 9,670,000 | | | | 10,232,987 | |
| | | | | | | | |
| | | | | | | 23,231,281 | |
| | | | | | | | |
Singapore 0.8% | | | | | | | | |
Government of Singapore, senior note, | | | | | | | | |
3.625%, 7/01/14 | | | 21,650,000 | SGD | | | 17,442,766 | |
1.125%, 4/01/16 | | | 11,000,000 | SGD | | | 8,876,166 | |
| | | | | | | | |
| | | | | | | 26,318,932 | |
| | | | | | | | |
Slovenia 0.4% | | | | | | | | |
dGovernment of Slovenia, senior note, 144A, | | | | | | | | |
5.50%, 10/26/22 | | | 8,140,000 | | | | 8,166,455 | |
TGB-13
Franklin Templeton Variable Insurance Products Trust
Statement of Investments, December 31, 2013 (continued)
| | | | | | | | |
| Templeton Global Bond Securities Fund | | Principal
Amount* | | | Value | |
Foreign Government and Agency Securities (continued) | | | | | | | | |
Slovenia (continued) | | | | | | | | |
5.85%, 5/10/23 | | | 5,030,000 | | | $ | 5,143,276 | |
| | | | | | | | |
| | | | | | | 13,309,731 | |
| | | | | | | | |
South Korea 14.0% | | | | | | | | |
The Export-Import Bank of Korea, senior note, | | | | | | | | |
4.625%, 2/20/17 | | | 230,000 | EUR | | | 346,546 | |
d144A, 1.45%, 5/19/14 | | | 40,580,000 | SEK | | | 6,318,181 | |
Korea Monetary Stabilization Bond, | | | | | | | | |
senior bond, 3.47%, 2/02/14 | | | 20,416,550,000 | KRW | | | 19,352,968 | |
senior bond, 3.59%, 4/02/14 | | | 20,432,530,000 | KRW | | | 19,402,992 | |
senior bond, 2.47%, 4/02/15 | | | 22,461,930,000 | KRW | | | 21,217,011 | |
senior bond, 2.80%, 8/02/15 | | | 68,737,030,000 | KRW | | | 65,181,566 | |
senior bond, 2.81%, 10/02/15 | | | 2,932,000,000 | KRW | | | 2,780,860 | |
senior note, 3.28%, 6/02/14 | | | 24,224,170,000 | KRW | | | 23,008,056 | |
senior note, 2.57%, 6/09/14 | | | 14,607,000,000 | KRW | | | 13,834,163 | |
senior note, 2.82%, 8/02/14 | | | 31,785,420,000 | KRW | | | 30,141,691 | |
senior note, 2.78%, 10/02/14 | | | 13,357,000,000 | KRW | | | 12,663,495 | |
senior note, 2.84%, 12/02/14 | | | 22,065,270,000 | KRW | | | 20,936,073 | |
senior note, 2.74%, 2/02/15 | | | 47,745,950,000 | KRW | | | 45,249,715 | |
senior note, 2.76%, 6/02/15 | | | 51,516,200,000 | KRW | | | 48,822,799 | |
senior note, 2.90%, 12/02/15 | | | 54,164,800,000 | KRW | | | 51,439,336 | |
Korea Treasury Bond, | | | | | | | | |
senior bond, 4.00%, 3/10/16 | | | 1,283,100,000 | KRW | | | 1,245,888 | |
senior bond, 5.00%, 9/10/16 | | | 2,806,000,000 | KRW | | | 2,802,925 | |
senior note, 3.25%, 12/10/14 | | | 13,830,700,000 | KRW | | | 13,173,046 | |
senior note, 4.50%, 3/10/15 | | | 641,500,000 | KRW | | | 620,482 | |
senior note, 3.25%, 6/10/15 | | | 4,668,800,000 | KRW | | | 4,454,846 | |
senior note, 4.00%, 9/10/15 | | | 3,390,100,000 | KRW | | | 3,275,674 | |
senior note, 2.75%, 12/10/15 | | | 32,942,000,000 | KRW | | | 31,190,316 | |
senior note, 3.00%, 12/10/16 | | | 26,530,400,000 | KRW | | | 25,247,236 | |
Korea Treasury Note, senior note, 2.75%, 6/10/16 | | | 18,308,100,000 | KRW | | | 17,318,320 | |
| | | | | | | | |
| | | | | | | 480,024,185 | |
| | | | | | | | |
Sri Lanka 1.2% | | | | | | | | |
Government of Sri Lanka, | | | | | | | | |
A, 7.00%, 3/01/14 | | | 43,380,000 | LKR | | | 331,025 | |
A, 11.25%, 7/15/14 | | | 773,000,000 | LKR | | | 6,001,358 | |
A, 11.75%, 3/15/15 | | | 8,520,000 | LKR | | | 67,440 | |
A, 6.50%, 7/15/15 | | | 239,920,000 | LKR | | | 1,778,049 | |
A, 11.00%, 8/01/15 | | | 1,349,700,000 | LKR | | | 10,670,111 | |
A, 6.40%, 8/01/16 | | | 109,200,000 | LKR | | | 782,571 | |
A, 5.80%, 1/15/17 | | | 112,300,000 | LKR | | | 781,236 | |
A, 8.00%, 11/15/18 | | | 512,300,000 | LKR | | | 3,639,778 | |
A, 9.00%, 5/01/21 | | | 861,720,000 | LKR | | | 6,155,846 | |
B, 11.75%, 4/01/14 | | | 68,370,000 | LKR | | | 526,938 | |
B, 6.60%, 6/01/14 | | | 65,500,000 | LKR | | | 497,602 | |
B, 6.40%, 10/01/16 | | | 119,100,000 | LKR | | | 849,589 | |
B, 8.50%, 7/15/18 | | | 146,350,000 | LKR | | | 1,059,835 | |
C, 8.50%, 4/01/18 | | | 241,930,000 | LKR | | | 1,765,710 | |
D, 8.50%, 6/01/18 | | | 633,000,000 | LKR | | | 4,621,916 | |
| | | | | | | | |
| | | | | | | 39,529,004 | |
| | | | | | | | |
TGB-14
Franklin Templeton Variable Insurance Products Trust
Statement of Investments, December 31, 2013 (continued)
| | | | | | | | |
| Templeton Global Bond Securities Fund | | Principal
Amount* | | | Value | |
Foreign Government and Agency Securities (continued) | | | | | | | | |
iSupranational 0.5% | | | | | | | | |
Inter-American Development Bank, senior note, 7.50%, 12/05/24 | | | 200,000,000 | MXN | | $ | 16,379,549 | |
| | | | | | | | |
Sweden 2.4% | | | | | | | | |
Government of Sweden, 6.75%, 5/05/14 | | | 391,220,000 | SEK | | | 62,045,971 | |
Kommuninvest I Sverige AB, 2.25%, 5/05/14 | | | 123,520,000 | SEK | | | 19,294,378 | |
| | | | | | | | |
| | | | | | | 81,340,349 | |
| | | | | | | | |
Ukraine 3.0% | | | | | | | | |
dFinancing of Infrastructure Projects State Enterprise, 144A, | | | | | | | | |
8.375%, 11/03/17 | | | 1,100,000 | | | | 1,017,357 | |
7.40%, 4/20/18 | | | 840,000 | | | | 754,202 | |
dGovernment of Ukraine, | | | | | | | | |
144A, 9.25%, 7/24/17 | | | 25,550,000 | | | | 25,454,188 | |
144A, 7.75%, 9/23/20 | | | 17,227,000 | | | | 15,999,576 | |
senior bond, 144A, 6.58%, 11/21/16 | | | 12,541,000 | | | | 11,796,692 | |
senior bond, 144A, 7.80%, 11/28/22 | | | 10,110,000 | | | | 9,174,825 | |
senior note, 144A, 4.95%, 10/13/15 | | | 290,000 | EUR | | | 381,826 | |
senior note, 144A, 6.25%, 6/17/16 | | | 8,760,000 | | | | 8,250,825 | |
senior note, 144A, 7.95%, 2/23/21 | | | 24,098,000 | | | | 22,365,956 | |
senior note, 144A, 7.50%, 4/17/23 | | | 8,160,000 | | | | 7,395,000 | |
| | | | | | | | |
| | | | | | | 102,590,447 | |
| | | | | | | | |
Vietnam 0.4% | | | | | | | | |
dGovernment of Vietnam, 144A, 6.75%, 1/29/20 | | | 13,110,000 | | | | 14,240,738 | |
| | | | | | | | |
Total Foreign Government and Agency Securities (Cost $2,141,644,799) | | | | | | | 2,244,885,649 | |
| | | | | | | | |
Municipal Bonds (Cost $1,293,641) 0.0%† | | | | | | | | |
United States 0.0%† | | | | | | | | |
Bexar County Revenue, Venue Project, Refunding, Series A, BHAC Insured, 5.25%, 8/15/47 | | | 1,450,000 | | | | 1,510,654 | |
| | | | | | | | |
Total Investments before Short Term Investments (Cost $2,142,938,440) | | | | | | | 2,246,396,303 | |
| | | | | | | | |
Short Term Investments 25.0% | | | | | | | | |
Foreign Government and Agency Securities 14.4% | | | | | | | | |
Brazil 0.2% | | | | | | | | |
Letra Tesouro Nacional, Strip, 4/01/14 | | | 18,450 | a BRL | | | 7,628,846 | |
| | | | | | | | |
Canada 1.3% | | | | | | | | |
Government of Canada, | | | | | | | | |
1.00%, 2/01/14 | | | 33,882,000 | CAD | | | 31,899,130 | |
2.00%, 3/01/14 | | | 7,354,000 | CAD | | | 6,935,463 | |
0.75%, 5/01/14 | | | 6,298,000 | CAD | | | 5,926,569 | |
| | | | | | | | |
| | | | | | | 44,761,162 | |
| | | | | | | | |
Hungary 0.1% | | | | | | | | |
jHungary Treasury Bills, 1/08/14 - 6/25/14 | | | 356,460,000 | HUF | | | 1,637,274 | |
| | | | | | | | |
Malaysia 4.4% | | | | | | | | |
jBank of Negara Monetary Notes, 1/09/14 - 11/18/14 | | | 496,745,000 | MYR | | | 149,780,015 | |
jMalaysia Treasury Bill, 5/30/14 | | | 1,140,000 | MYR | | | 343,547 | |
| | | | | | | | |
| | | | | | | 150,123,562 | |
| | | | | | | | |
TGB-15
Franklin Templeton Variable Insurance Products Trust
Statement of Investments, December 31, 2013 (continued)
| | | | | | | | |
| Templeton Global Bond Securities Fund | | Principal
Amount* | | | Value | |
Short Term Investments (continued) | | | | | | | | |
Foreign Government and Agency Securities (continued) | | | | | | | | |
Mexico 3.0% | | | | | | | | |
jMexico Treasury Bills, | | | | | | | | |
1/09/14 - 4/30/14 | | | 31,812,220 | k MXN | | $ | 24,223,335 | |
10/16/14 | | | 46,859,000 | k MXN | | | 34,960,785 | |
12/11/14 | | | 59,641,100 | k MXN | | | 44,250,070 | |
| | | | | | | | |
| | | | | | | 103,434,190 | |
| | | | | | | | |
Philippines 0.9% | | | | | | | | |
jPhilippine Treasury Bills, 1/08/14 - 10/08/14 | | | 1,289,295,000 | PHP | | | 28,952,151 | |
| | | | | | | | |
Singapore 3.8% | | | | | | | | |
Government of Singapore, senior bond, 0.25%, 2/01/14 | | | 21,600,000 | SGD | | | 17,116,947 | |
jMonetary Authority of Singapore Treasury Bills, 1/03/14 - 2/14/14 | | | 46,732,000 | SGD | | | 37,030,791 | |
jSingapore Treasury Bills, 1/10/14 - 5/30/14 | | | 96,960,000 | SGD | | | 76,800,680 | |
| | | | | | | | |
| | | | | | | 130,948,418 | |
| | | | | | | | |
South Korea 0.7% | | | | | | | | |
Korea Monetary Stabilization Bond, senior bond, | | | | | | | | |
2.55%, 5/09/14 | | | 10,064,000,000 | KRW | | | 9,531,413 | |
2.72%, 9/09/14 | | | 14,437,000,000 | KRW | | | 13,682,266 | |
| | | | | | | | |
| | | | | | | 23,213,679 | |
| | | | | | | | |
Total Foreign Government and Agency Securities (Cost $503,106,917) | | | | | | | 490,699,282 | |
| | | | | | | | |
Total Investments before Repurchase Agreements (Cost $2,646,045,357) | | | | | | | 2,737,095,585 | |
| | | | | | | | |
Repurchase Agreements (Cost $362,770,388) 10.6% | | | | | | | | |
United States 10.6% | | | | | | | | |
lJoint Repurchase Agreement, 0.008%, 1/02/14 (Maturity Value $362,770,540) | | | 362,770,388 | | | | 362,770,388 | |
BNP Paribas Securities Corp. (Maturity Value $27,683,020) Credit Suisse Securities (USA) LLC (Maturity Value $83,049,060) Deutsche Bank Securities Inc. (Maturity Value $48,564,092) HSBC Securities (USA) Inc. (Maturity Value $116,271,586) Merrill Lynch, Pierce, Fenner & Smith Inc. (Maturity Value $53,983,884) Morgan Stanley & Co. LLC (Maturity Value $33,218,898) | | | | | | | | |
Collateralized by U.S. Government Agency Securities, 0.00% - 4.125%, 1/15/14 - 3/07/18; jU.S. Government Agency Discount Notes, 8/19/14; jU.S. Treasury Bills, 9/18/14; U.S. Treasury Bonds, 8.875% - 9.125%, 5/15/17 - 5/15/18; U.S. Treasury Notes, 0.25% - 4.75%, 1/15/15 - 12/31/18; and U.S. Treasury Notes, Index Linked, 1.375% - 1.625%, 1/15/18 - 7/15/18 (valued at $370,038,148) | | | | | | | | |
| | | | | | | | |
Total Investments (Cost $3,008,815,745) 90.7% | | | | | | | 3,099,865,973 | |
Other Assets, less Liabilities 9.3% | | | | | | | 319,403,073 | |
| | | | | | | | |
Net Assets 100.0% | | | | | | $ | 3,419,269,046 | |
| | | | | | | | |
See Abbreviations on page TGB-41.
TGB-16
Franklin Templeton Variable Insurance Products Trust
Statement of Investments, December 31, 2013 (continued)
| | | | |
| Templeton Global Bond Securities Fund | | | | |
†Rounds to less than 0.1% of net assets.
*The principal amount is stated in U.S. dollars unless otherwise indicated.
aPrincipal amount is stated in 1,000 Brazilian Real Units.
bRedemption price at maturity is adjusted for inflation. See Note 1(g).
cSecurity was purchased pursuant to Regulation S under the Securities Act of 1933, which exempts from registration securities offered and sold outside of the United States. Such a security cannot be sold in the United States without either an effective registration statement filed pursuant to the Securities Act of 1933, or pursuant to an exemption from registration. These securities have been deemed liquid under guidelines approved by the Trust’s Board of Trustees. At December 31, 2013, the aggregate value of these securities was $38,250,884, representing 1.12% of net assets.
dSecurity was purchased pursuant to Rule 144A under the Securities Act of 1933 and may be sold in transactions exempt from registration only to qualified institutional buyers or in a public offering registered under the Securities Act of 1933. These securities have been deemed liquid under guidelines approved by the Trust’s Board of Trustees. At December 31, 2013, the aggregate value of these securities was $266,213,599, representing 7.79% of net assets.
ePrincipal amount is stated in 100 Mexican Peso Units.
fPrincipal amount of security is adjusted for inflation. See Note 1(g).
gPrincipal amount is stated in Unidad de Inversion Units.
hThe coupon rate shown represents the rate at period end.
iA supranational organization is an entity formed by two or more central governments through international treaties.
jThe security is traded on a discount basis with no stated coupon rate.
kPrincipal amount is stated in 10 Mexican Peso Units.
lSee Note 1(c) regarding joint repurchase agreement.
TGB-17
Franklin Templeton Variable Insurance Products Trust
Statement of Investments, December 31, 2013 (continued)
| | | | |
| Templeton Global Bond Securities Fund | | | | |
At December 31, 2013, the Fund had the following forward exchange contracts outstanding. See Note 1(d).
Forward Exchange Contracts
| | | | | | | | | | | | | | | | | | | | | | | | | | | | |
| Currency | | Counterpartya | | | Type | | | Quantity | | | Contract
Amount* | | | Settlement
Date | | | Unrealized
Appreciation | | | Unrealized
Depreciation | |
Indian Rupee | | | CITI | | | | Buy | | | | 34,491,000 | | | | 533,446 | | | | 1/06/14 | | | $ | 23,633 | | | $ | — | |
Indian Rupee | | | HSBC | | | | Buy | | | | 251,448,000 | | | | 3,923,021 | | | | 1/06/14 | | | | 138,225 | | | | — | |
Indian Rupee | | | CITI | | | | Sell | | | | 34,491,000 | | | | 555,769 | | | | 1/06/14 | | | | — | | | | (1,311 | ) |
Indian Rupee | | | HSBC | | | | Sell | | | | 251,448,000 | | | | 4,045,825 | | | | 1/06/14 | | | | — | | | | (15,422 | ) |
Indian Rupee | | | DBAB | | | | Buy | | | | 217,594,000 | | | | 3,426,958 | | | | 1/07/14 | | | | 86,798 | | | | — | |
Japanese Yen | | | DBAB | | | | Sell | | | | 770,370,000 | | | | 8,897,885 | | | | 1/07/14 | | | | 1,581,670 | | | | — | |
Indian Rupee | | | DBAB | | | | Sell | | | | 217,594,000 | | | | 3,498,296 | | | | 1/07/14 | | | | — | | | | (15,460 | ) |
Euro | | | DBAB | | | | Sell | | | | 2,285,618 | | | | 3,003,759 | | | | 1/07/14 | | | | — | | | | (140,098 | ) |
Indian Rupee | | | DBAB | | | | Buy | | | | 40,529,000 | | | | 644,084 | | | | 1/08/14 | | | | 10,257 | | | | — | |
Malaysian Ringgit | | | DBAB | | | | Buy | | | | 8,862,500 | | | | 2,865,063 | | | | 1/08/14 | | | | — | | | | (162,856 | ) |
Swedish Krona | | | DBAB | | | | Buy | | | | 136,332,733 | | | | 15,821,369 | EUR | | | 1/09/14 | | | | — | | | | (572,377 | ) |
Mexican Peso | | | CITI | | | | Buy | | | | 109,357,558 | | | | 8,363,867 | | | | 1/10/14 | | | | 24,207 | | | | — | |
Japanese Yen | | | CITI | | | | Sell | | | | 138,680,000 | | | | 1,589,474 | | | | 1/10/14 | | | | 272,408 | | | | — | |
Euro | | | CITI | | | | Sell | | | | 5,040,000 | | | | 6,611,220 | | | | 1/10/14 | | | | — | | | | (321,266 | ) |
Chilean Peso | | | MSCO | | | | Buy | | | | 2,254,600,000 | | | | 4,581,124 | | | | 1/13/14 | | | | — | | | | (296,950 | ) |
Euro | | | UBSW | | | | Sell | | | | 15,572,000 | | | | 20,393,838 | | | | 1/13/14 | | | | — | | | | (1,025,311 | ) |
Euro | | | DBAB | | | | Sell | | | | 9,460,000 | | | | 12,533,554 | | | | 1/14/14 | | | | — | | | | (478,587 | ) |
Euro | | | JPHQ | | | | Sell | | | | 937,000 | | | | 1,226,767 | | | | 1/14/14 | | | | — | | | | (62,067 | ) |
Japanese Yen | | | UBSW | | | | Sell | | | | 415,980,000 | | | | 4,756,980 | | | | 1/14/14 | | | | 806,271 | | | | — | |
Indian Rupee | | | DBAB | | | | Buy | | | | 239,338,000 | | | | 3,824,390 | | | | 1/15/14 | | | | 34,344 | | | | — | |
Japanese Yen | | | HSBC | | | | Sell | | | | 536,380,000 | | | | 6,109,112 | | | | 1/15/14 | | | | 1,014,895 | | | | — | |
Malaysian Ringgit | | | JPHQ | | | | Buy | | | | 1,856,000 | | | | 604,856 | | | | 1/16/14 | | | | — | | | | (39,167 | ) |
Japanese Yen | | | DBAB | | | | Sell | | | | 139,110,000 | | | | 1,567,896 | | | | 1/16/14 | | | | 246,706 | | | | — | |
Japanese Yen | | | UBSW | | | | Sell | | | | 707,660,000 | | | | 7,973,544 | | | | 1/16/14 | | | | 1,252,578 | | | | — | |
Indian Rupee | | | DBAB | | | | Buy | | | | 383,041,000 | | | | 6,111,193 | | | | 1/17/14 | | | | 61,943 | | | | — | |
Japanese Yen | | | DBAB | | | | Sell | | | | 719,030,000 | | | | 8,111,032 | | | | 1/17/14 | | | | 1,282,045 | | | | — | |
Euro | | | DBAB | | | | Sell | | | | 4,856,000 | | | | 6,497,328 | | | | 1/17/14 | | | | — | | | | (182,044 | ) |
Japanese Yen | | | JPHQ | | | | Sell | | | | 1,305,790,000 | | | | 14,747,457 | | | | 1/17/14 | | | | 2,345,718 | | | | — | |
Indian Rupee | | | JPHQ | | | | Buy | | | | 226,092,000 | | | | 3,581,207 | | | | 1/21/14 | | | | 59,624 | | | | — | |
Euro | | | BZWS | | | | Sell | | | | 2,638,000 | | | | 3,467,255 | | | | 1/21/14 | | | | — | | | | (161,276 | ) |
Chilean Peso | | | DBAB | | | | Buy | | | | 2,227,910,000 | | | | 4,528,272 | | | | 1/22/14 | | | | — | | | | (299,335 | ) |
Indian Rupee | | | DBAB | | | | Buy | | | | 79,271,000 | | | | 1,265,178 | | | | 1/22/14 | | | | 11,095 | | | | — | |
Indian Rupee | | | JPHQ | | | | Buy | | | | 152,363,000 | | | | 2,432,127 | | | | 1/22/14 | | | | 20,936 | | | | — | |
Euro | | | JPHQ | | | | Sell | | | | 300,000 | | | | 403,658 | | | | 1/22/14 | | | | — | | | | (8,988 | ) |
Chilean Peso | | | DBAB | | | | Buy | | | | 3,160,140,000 | | | | 6,428,929 | | | | 1/24/14 | | | | — | | | | (431,889 | ) |
Singapore Dollar | | | JPHQ | | | | Buy | | | | 5,740,000 | | | | 4,629,032 | | | | 1/24/14 | | | | — | | | | (79,990 | ) |
Japanese Yen | | | UBSW | | | | Sell | | | | 944,420,000 | | | | 10,705,282 | | | | 1/27/14 | | | | 1,735,197 | | | | — | |
Chilean Peso | | | DBAB | | | | Buy | | | | 1,967,720,000 | | | | 4,001,871 | | | | 1/28/14 | | | | — | | | | (269,473 | ) |
Euro | | | CITI | | | | Sell | | | | 4,998,400 | | | | 6,690,208 | | | | 1/28/14 | | | | — | | | | (184,997 | ) |
Japanese Yen | | | DBAB | | | | Sell | | | | 897,860,782 | | | | 10,026,363 | | | | 1/28/14 | | | | 1,498,453 | | | | — | |
Japanese Yen | | | HSBC | | | | Sell | | | | 1,162,462,488 | | | | 12,988,408 | | | | 1/28/14 | | | | 1,947,302 | | | | — | |
Chilean Peso | | | DBAB | | | | Buy | | | | 635,690,000 | | | | 1,295,608 | | | | 1/29/14 | | | | — | | | | (89,966 | ) |
Indian Rupee | | | HSBC | | | | Buy | | | | 531,272,000 | | | | 8,425,533 | | | | 1/29/14 | | | | 116,138 | | | | — | |
Chilean Peso | | | JPHQ | | | | Buy | | | | 675,370,000 | | | | 1,372,703 | | | | 1/30/14 | | | | — | | | | (91,956 | ) |
Malaysian Ringgit | | | JPHQ | | | | Buy | | | | 11,703,000 | | | | 3,767,869 | | | | 1/30/14 | | | | — | | | | (203,250 | ) |
Chilean Peso | | | DBAB | | | | Buy | | | | 1,271,380,000 | | | | 2,582,793 | | | | 1/31/14 | | | | — | | | | (172,050 | ) |
Euro | | | DBAB | | | | Sell | | | | 65,773,000 | | | | 88,728,713 | | | | 1/31/14 | | | | — | | | | (1,740,768 | ) |
Chilean Peso | | | DBAB | | | | Buy | | | | 1,186,400,000 | | | | 2,402,106 | | | | 2/03/14 | | | | — | | | | (153,212 | ) |
Euro | | | UBSW | | | | Sell | | | | 5,540,000 | | | | 7,513,071 | | | | 2/03/14 | | | | — | | | | (107,102 | ) |
TGB-18
Franklin Templeton Variable Insurance Products Trust
Statement of Investments, December 31, 2013 (continued)
| | | | |
| Templeton Global Bond Securities Fund | | | | |
Forward Exchange Contracts (continued)
| | | | | | | | | | | | | | | | | | | | | | | | | | | | |
| Currency | | Counterpartya | | | Type | | | Quantity | | | Contract
Amount* | | | Settlement
Date | | | Unrealized
Appreciation | | | Unrealized
Depreciation | |
Malaysian Ringgit | | | JPHQ | | | | Buy | | | | 9,715,000 | | | | 3,085,596 | | | | 2/04/14 | | | $ | — | | | $ | (127,164 | ) |
Indian Rupee | | | JPHQ | | | | Buy | | | | 21,500,000 | | | | 339,360 | | | | 2/06/14 | | | | 5,746 | | | | — | |
Malaysian Ringgit | | | HSBC | | | | Buy | | | | 19,888,085 | | | | 6,268,900 | | | | 2/06/14 | | | | — | | | | (213,078 | ) |
Singapore Dollar | | | DBAB | | | | Buy | | | | 6,207,000 | | | | 4,875,348 | | | | 2/07/14 | | | | 43,827 | | | | — | |
Singapore Dollar | | | HSBC | | | | Buy | | | | 6,206,000 | | | | 5,016,571 | | | | 2/07/14 | | | | — | | | | (98,189 | ) |
Indian Rupee | | | DBAB | | | | Buy | | | | 39,609,000 | | | | 624,182 | | | | 2/10/14 | | | | 11,075 | | | | — | |
South Korean Won | | | HSBC | | | | Buy | | | | 21,363,430,000 | | | | 18,962,746 | | | | 2/10/14 | | | | 1,217,420 | | | | — | |
Japanese Yen | | | CITI | | | | Sell | | | | 366,860,000 | | | | 3,724,013 | | | | 2/10/14 | | | | 239,348 | | | | — | |
Euro | | | CITI | | | | Sell | | | | 6,572,000 | | | | 8,899,605 | | | | 2/10/14 | | | | — | | | | (140,097 | ) |
Euro | | | HSBC | | | | Sell | | | | 1,800,000 | | | | 2,434,230 | | | | 2/10/14 | | | | — | | | | (41,647 | ) |
Euro | | | UBSW | | | | Sell | | | | 4,929,000 | | | | 6,673,472 | | | | 2/10/14 | | | | — | | | | (106,305 | ) |
Chilean Peso | | | BZWS | | | | Buy | | | | 1,142,900,000 | | | | 2,317,315 | | | | 2/11/14 | | | | — | | | | (152,712 | ) |
Polish Zloty | | | BZWS | | | | Buy | | | | 17,528,000 | | | | 4,066,538 | EUR | | | 2/11/14 | | | | 195,525 | | | | — | |
Polish Zloty | | | DBAB | | | | Buy | | | | 17,528,000 | | | | 4,075,237 | EUR | | | 2/11/14 | | | | 183,560 | | | | — | |
Euro | | | BZWS | | | | Sell | | | | 1,412,000 | | | | 1,907,753 | | | | 2/11/14 | | | | — | | | | (34,436 | ) |
Euro | | | DBAB | | | | Sell | | | | 1,738,000 | | | | 2,332,274 | | | | 2/11/14 | | | | — | | | | (58,324 | ) |
Chilean Peso | | | DBAB | | | | Buy | | | | 1,145,000,000 | | | | 2,318,283 | | | | 2/12/14 | | | | — | | | | (149,931 | ) |
Indian Rupee | | | HSBC | | | | Buy | | | | 42,784,000 | | | | 664,952 | | | | 2/12/14 | | | | 20,944 | | | | — | |
Singapore Dollar | | | BZWS | | | | Buy | | | | 1,717,028 | | | | 1,353,269 | | | | 2/12/14 | | | | 7,516 | | | | — | |
Japanese Yen | | | GSCO | | | | Sell | | | | 394,373,000 | | | | 4,248,793 | | | | 2/12/14 | | | | 502,757 | | | | — | |
Japanese Yen | | | HSBC | | | | Sell | | | | 1,035,240,000 | | | | 11,130,177 | | | | 2/12/14 | | | | 1,296,727 | | | | — | |
Japanese Yen | | | JPHQ | | | | Sell | | | | 1,034,700,000 | | | | 11,130,223 | | | | 2/12/14 | | | | 1,301,902 | | | | — | |
Indian Rupee | | | HSBC | | | | Buy | | | | 108,000,000 | | | | 1,660,632 | | | | 2/13/14 | | | | 70,424 | | | | — | |
Japanese Yen | | | CITI | | | | Sell | | | | 1,371,360,000 | | | | 14,840,354 | | | | 2/13/14 | | | | 1,814,134 | | | | — | |
Japanese Yen | | | JPHQ | | | | Sell | | | | 686,710,000 | | | | 7,420,122 | | | | 2/13/14 | | | | 897,228 | | | | — | |
Euro | | | UBSW | | | | Sell | | | | 657,000 | | | | 881,234 | | | | 2/13/14 | | | | — | | | | (22,462 | ) |
Chilean Peso | | | DBAB | | | | Buy | | | | 964,250,000 | | | | 1,956,001 | | | | 2/14/14 | | | | — | | | | (130,332 | ) |
Chilean Peso | | | MSCO | | | | Buy | | | | 2,590,220,000 | | | | 5,239,648 | | | | 2/14/14 | | | | — | | | | (335,438 | ) |
Malaysian Ringgit | | | DBAB | | | | Buy | | | | 97,443,480 | | | | 30,906,965 | | | | 2/14/14 | | | | — | | | | (1,246,514 | ) |
Polish Zloty | | | DBAB | | | | Buy | | | | 17,528,000 | | | | 4,068,048 | EUR | | | 2/14/14 | | | | 192,440 | | | | — | |
Chilean Peso | | | DBAB | | | | Buy | | | | 2,188,820,000 | | | | 4,439,527 | | | | 2/18/14 | | | | — | | | | (297,062 | ) |
Indian Rupee | | | DBAB | | | | Buy | | | | 108,614,000 | | | | 1,656,850 | | | | 2/18/14 | | | | 82,258 | | | | — | |
Indian Rupee | | | JPHQ | | | | Buy | | | | 127,745,000 | | | | 1,949,576 | | | | 2/18/14 | | | | 95,855 | | | | — | |
Singapore Dollar | | | HSBC | | | | Buy | | | | 3,667,000 | | | | 2,901,108 | | | | 2/18/14 | | | | 5,090 | | | | — | |
Japanese Yen | | | GSCO | | | | Sell | | | | 123,057,280 | | | | 1,322,059 | | | | 2/18/14 | | | | 153,140 | | | | — | |
Japanese Yen | | | JPHQ | | | | Sell | | | | 831,970,000 | | | | 8,977,211 | | | | 2/18/14 | | | | 1,074,340 | | | | — | |
Malaysian Ringgit | | | HSBC | | | | Buy | | | | 4,899,000 | | | | 1,551,593 | | | | 2/19/14 | | | | — | | | | (60,738 | ) |
Japanese Yen | | | CITI | | | | Sell | | | | 684,870,000 | | | | 7,420,164 | | | | 2/19/14 | | | | 914,563 | | | | — | |
Japanese Yen | | | GSCO | | | | Sell | | | | 687,820,000 | | | | 7,420,129 | | | | 2/19/14 | | | | 886,506 | | | | — | |
Euro | | | JPHQ | | | | Sell | | | | 3,942,000 | | | | 5,268,404 | | | | 2/19/14 | | | | — | | | | (153,790 | ) |
Chilean Peso | | | CITI | | | | Buy | | | | 2,285,090,000 | | | | 4,646,381 | | | | 2/20/14 | | | | — | | | | (322,633 | ) |
Indian Rupee | | | DBAB | | | | Buy | | | | 98,937,000 | | | | 1,537,124 | | | | 2/20/14 | | | | 46,387 | | | | — | |
Euro | | | BZWS | | | | Sell | | | | 6,280,000 | | | | 8,382,795 | | | | 2/20/14 | | | | — | | | | (255,307 | ) |
Chilean Peso | | | JPHQ | | | | Buy | | | | 1,055,800,000 | | | | 2,145,935 | | | | 2/21/14 | | | | — | | | | (148,407 | ) |
Euro | | | GSCO | | | | Sell | | | | 2,038,000 | | | | 2,728,067 | | | | 2/21/14 | | | | — | | | | (75,191 | ) |
Chilean Peso | | | JPHQ | | | | Buy | | | | 1,792,000,000 | | | | 3,635,257 | | | | 2/24/14 | | | | — | | | | (245,945 | ) |
Chilean Peso | | | MSCO | | | | Buy | | | | 1,273,240,000 | | | | 2,575,584 | | | | 2/24/14 | | | | — | | | | (167,432 | ) |
Japanese Yen | | | HSBC | | | | Sell | | | | 385,460,000 | | | | 4,124,773 | | | | 2/24/14 | | | | 463,189 | | | | — | |
Chilean Peso | | | DBAB | | | | Buy | | | | 1,455,470,000 | | | | 2,942,721 | | | | 2/25/14 | | | | — | | | | (190,198 | ) |
Japanese Yen | | | BZWS | | | | Sell | | | | 343,460,000 | | | | 3,710,113 | | | | 2/25/14 | | | | 447,483 | | | | — | |
Japanese Yen | | | JPHQ | | | | Sell | | | | 385,700,000 | | | | 4,160,621 | | | | 2/25/14 | | | | 496,741 | | | | — | |
TGB-19
Franklin Templeton Variable Insurance Products Trust
Statement of Investments, December 31, 2013 (continued)
| | | | |
| Templeton Global Bond Securities Fund | | | | |
Forward Exchange Contracts (continued)
| | | | | | | | | | | | | | | | | | | | | | | | | | | | |
| Currency | | Counterpartya | | | Type | | | Quantity | | | Contract
Amount* | | | Settlement
Date | | | Unrealized
Appreciation | | | Unrealized
Depreciation | |
Chilean Peso | | | DBAB | | | | Buy | | | | 1,435,490,000 | | | | 2,899,980 | | | | 2/26/14 | | | $ | — | | | $ | (185,529 | ) |
Chilean Peso | | | MSCO | | | | Buy | | | | 1,559,200,000 | | | | 3,152,128 | | | | 2/26/14 | | | | — | | | | (203,746 | ) |
Indian Rupee | | | DBAB | | | | Buy | | | | 130,201,000 | | | | 2,031,439 | | | | 2/26/14 | | | | 49,896 | | | | — | |
Euro | | | BZWS | | | | Sell | | | | 9,771,593 | | | | 13,027,122 | | | | 2/26/14 | | | | — | | | | (413,684 | ) |
Japanese Yen | | | UBSW | | | | Sell | | | | 937,086,000 | | | | 9,517,428 | | | | 2/26/14 | | | | 615,724 | | | | — | |
Euro | | | UBSW | | | | Sell | | | | 13,581,483 | | | | 18,149,614 | | | | 2/26/14 | | | | — | | | | (531,687 | ) |
Chilean Peso | | | DBAB | | | | Buy | | | | 2,094,920,000 | | | | 4,235,584 | | | | 2/27/14 | | | | — | | | | (274,597 | ) |
Indian Rupee | | | DBAB | | | | Buy | | | | 700,705,481 | | | | 10,929,226 | | | | 2/27/14 | | | | 269,638 | | | | — | |
Indian Rupee | | | HSBC | | | | Buy | | | | 148,257,000 | | | | 2,311,207 | | | | 2/27/14 | | | | 58,276 | | | | — | |
Malaysian Ringgit | | | HSBC | | | | Buy | | | | 2,087,700 | | | | 622,265 | | | | 2/27/14 | | | | 12,833 | | | | — | |
Singapore Dollar | | | DBAB | | | | Buy | | | | 7,749,500 | | | | 6,059,978 | | | | 2/27/14 | | | | 81,757 | | | | — | |
Japanese Yen | | | BZWS | | | | Sell | | | | 1,576,550,000 | | | | 16,929,882 | | | | 2/27/14 | | | | 1,953,617 | | | | — | |
Euro | | | BZWS | | | | Sell | | | | 3,902,180 | | | | 5,212,328 | | | | 2/27/14 | | | | — | | | | (155,115 | ) |
Japanese Yen | | | DBAB | | | | Sell | | | | 229,660,000 | | | | 2,508,999 | | | | 2/27/14 | | | | 327,369 | | | | — | |
Euro | | | DBAB | | | | Sell | | | | 1,530,900 | | | | 2,024,646 | | | | 2/27/14 | | | | — | | | | (81,105 | ) |
Chilean Peso | | | DBAB | | | | Buy | | | | 790,050,000 | | | | 1,595,158 | | | | 2/28/14 | | | | — | | | | (101,522 | ) |
Chilean Peso | | | JPHQ | | | | Buy | | | | 593,800,000 | | | | 1,200,445 | | | | 2/28/14 | | | | — | | | | (77,831 | ) |
Indian Rupee | �� | | DBAB | | | | Buy | | | | 211,714,000 | | | | 3,313,364 | | | | 2/28/14 | | | | 69,613 | | | | — | |
Indian Rupee | | | JPHQ | | | | Buy | | | | 181,822,000 | | | | 2,841,685 | | | | 2/28/14 | | | | 63,647 | | | | — | |
Singapore Dollar | | | BZWS | | | | Buy | | | | 21,427,761 | | | | 16,716,930 | | | | 2/28/14 | | | | 265,293 | | | | — | |
Singapore Dollar | | | DBAB | | | | Buy | | | | 5,960,000 | | | | 4,731,641 | | | | 2/28/14 | | | | 37,801 | | | | (45,941 | ) |
Euro | | | UBSW | | | | Sell | | | | 2,694,506 | | | | 3,608,644 | | | | 2/28/14 | | | | — | | | | (97,647 | ) |
Chilean Peso | | | DBAB | | | | Buy | | | | 1,253,970,000 | | | | 2,533,529 | | | | 3/03/14 | | | | — | | | | (163,605 | ) |
Indian Rupee | | | CITI | | | | Buy | | | | 34,827,000 | | | | 538,035 | | | | 3/03/14 | | | | 18,073 | | | | — | |
Indian Rupee | | | HSBC | | | | Buy | | | | 240,033,500 | | | | 3,705,936 | | | | 3/03/14 | | | | 126,852 | | | | — | |
Euro | | | DBAB | | | | Sell | | | | 2,579,651 | | | | 3,394,176 | | | | 3/03/14 | | | | — | | | | (154,129 | ) |
Japanese Yen | | | JPHQ | | | | Sell | | | | 401,100,000 | | | | 4,410,794 | | | | 3/03/14 | | | | 600,508 | | | | — | |
Japanese Yen | | | HSBC | | | | Sell | | | | 400,800,000 | | | | 4,401,977 | | | | 3/04/14 | | | | 594,519 | | | | — | |
Japanese Yen | | | UBSW | | | | Sell | | | | 447,200,000 | | | | 4,864,571 | | | | 3/04/14 | | | | 616,329 | | | | — | |
Chilean Peso | | | BZWS | | | | Buy | | | | 3,010,700,000 | | | | 6,079,152 | | | | 3/05/14 | | | | — | | | | (390,393 | ) |
Chilean Peso | | | DBAB | | | | Buy | | | | 1,253,970,000 | | | | 2,526,637 | | | | 3/05/14 | | | | — | | | | (157,243 | ) |
Euro | | | DBAB | | | | Sell | | | | 1,536,000 | | | | 2,000,640 | | | | 3/05/14 | | | | — | | | | (112,122 | ) |
Chilean Peso | | | DBAB | | | | Buy | | | | 1,328,230,000 | | | | 2,673,840 | | | | 3/06/14 | | | | — | | | | (164,412 | ) |
Chilean Peso | | | DBAB | | | | Buy | | | | 1,320,220,000 | | | | 2,665,765 | | | | 3/07/14 | | | | — | | | | (171,748 | ) |
Japanese Yen | | | BZWS | | | | Sell | | | | 1,712,605,900 | | | | 17,274,115 | | | | 3/07/14 | | | | 1,004,686 | | | | — | |
Euro | | | BZWS | | | | Sell | | | | 3,441,044 | | | | 4,502,400 | | | | 3/07/14 | | | | — | | | | (230,735 | ) |
Chilean Peso | | | MSCO | | | | Buy | | | | 662,100,000 | | | | 1,337,576 | | | | 3/10/14 | | | | — | | | | (87,228 | ) |
Mexican Peso | | | HSBC | | | | Buy | | | | 135,500,950 | | | | 10,314,452 | | | | 3/10/14 | | | | 30,526 | | | | — | |
Euro | | | BZWS | | | | Sell | | | | 3,785,232 | | | | 4,931,173 | | | | 3/10/14 | | | | — | | | | (275,379 | ) |
Euro | | | CITI | | | | Sell | | | | 31,404,613 | | | | 41,028,557 | | | | 3/10/14 | | | | — | | | | (2,168,203 | ) |
Euro | | | GSCO | | | | Sell | | | | 21,480,000 | | | | 28,010,350 | | | | 3/10/14 | | | | — | | | | (1,535,195 | ) |
Euro | | | HSBC | | | | Sell | | | | 1,844,000 | | | | 2,406,420 | | | | 3/10/14 | | | | — | | | | (129,985 | ) |
Euro | | | MSCO | | | | Sell | | | | 5,225,000 | | | | 6,827,769 | | | | 3/10/14 | | | | — | | | | (359,171 | ) |
Singapore Dollar | | | CITI | | | | Buy | | | | 21,075,381 | | | | 16,932,505 | | | | 3/11/14 | | | | — | | | | (229,476 | ) |
Chilean Peso | | | DBAB | | | | Buy | | | | 1,284,460,000 | | | | 2,596,967 | | | | 3/13/14 | | | | — | | | | (172,131 | ) |
Euro | | | JPHQ | | | | Sell | | | | 541,000 | | | | 713,081 | | | | 3/13/14 | | | | — | | | | (31,058 | ) |
Mexican Peso | | | CITI | | | | Buy | | | | 25,894,900 | | | | 1,967,204 | | | | 3/14/14 | | | | 9,139 | | | | — | |
Singapore Dollar | | | HSBC | | | | Buy | | | | 10,521,600 | | | | 8,436,177 | | | | 3/14/14 | | | | — | | | | (97,405 | ) |
Euro | | | BZWS | | | | Sell | | | | 1,161,439 | | | | 1,511,346 | | | | 3/17/14 | | | | — | | | | (86,195 | ) |
Japanese Yen | | | CITI | | | | Sell | | | | 286,112,008 | | | | 2,988,583 | | | | 3/17/14 | | | | 270,417 | | | | — | |
Chilean Peso | | | DBAB | | | | Buy | | | | 2,600,220,000 | | | | 5,271,072 | | | | 3/18/14 | | | | — | | | | (365,051 | ) |
TGB-20
Franklin Templeton Variable Insurance Products Trust
Statement of Investments, December 31, 2013 (continued)
| | | | |
| Templeton Global Bond Securities Fund | | | | |
Forward Exchange Contracts (continued)
| | | | | | | | | | | | | | | | | | | | | | | | | | | | |
| Currency | | Counterpartya | | | Type | | | Quantity | | | Contract
Amount* | | | Settlement
Date | | | Unrealized
Appreciation | | | Unrealized
Depreciation | |
Indian Rupee | | | JPHQ | | | | Buy | | | | 230,330,000 | | | | 3,633,401 | | | | 3/18/14 | | | $ | 30,696 | | | $ | — | |
Euro | | | CITI | | | | Sell | | | | 861,168 | | | | 1,117,955 | | | | 3/18/14 | | | | — | | | | (66,566 | ) |
Hungarian Forint | | | DBAB | | | | Buy | | | | 2,348,675,000 | | | | 7,437,753 | EUR | | | 3/19/14 | | | | 584,620 | | | | — | |
Hungarian Forint | | | JPHQ | | | | Buy | | | | 703,907,450 | | | | 2,231,326 | EUR | | | 3/19/14 | | | | 172,185 | | | | — | |
Singapore Dollar | | | DBAB | | | | Buy | | | | 7,978,100 | | | | 6,255,175 | | | | 3/19/14 | | | | 67,789 | | | | — | |
Singapore Dollar | | | HSBC | | | | Buy | | | | 9,120,000 | | | | 7,310,328 | | | | 3/19/14 | | | | — | | | | (82,364 | ) |
Singapore Dollar | | | JPHQ | | | | Buy | | | | 5,686,000 | | | | 4,437,888 | | | | 3/19/14 | | | | 68,494 | | | | — | |
Japanese Yen | | | CITI | | | | Sell | | | | 1,866,452,000 | | | | 19,634,407 | | | | 3/19/14 | | | | 1,902,246 | | | | — | |
Japanese Yen | | | MSCO | | | | Sell | | | | 575,230,000 | | | | 6,012,962 | | | | 3/19/14 | | | | 548,010 | | | | — | |
Hungarian Forint | | | JPHQ | | | | Buy | | | | 1,177,657,000 | | | | 3,718,878 | EUR | | | 3/20/14 | | | | 307,298 | | | | — | |
Chilean Peso | | | JPHQ | | | | Buy | | | | 1,065,000,000 | | | | 2,153,691 | | | | 3/21/14 | | | | — | | | | (144,951 | ) |
Hungarian Forint | | | JPHQ | | | | Buy | | | | 1,171,335,000 | | | | 3,718,878 | EUR | | | 3/21/14 | | | | 277,893 | | | | — | |
Euro | | | BZWS | | | | Sell | | | | 744,197 | | | | 966,414 | | | | 3/21/14 | | | | — | | | | (57,214 | ) |
Mexican Peso | | | CITI | | | | Buy | | | | 75,637,200 | | | | 5,547,527 | | | | 3/24/14 | | | | 220,620 | | | | — | |
Japanese Yen | | | BZWS | | | | Sell | | | | 740,940,000 | | | | 7,832,595 | | | | 3/24/14 | | | | 793,119 | | | | — | |
Japanese Yen | | | DBAB | | | | Sell | | | | 725,287,000 | | | | 7,682,067 | | | | 3/24/14 | | | | 791,306 | | | | — | |
Japanese Yen | | | BZWS | | | | Sell | | | | 242,774,840 | | | | 2,559,566 | | | | 3/25/14 | | | | 253,013 | | | | — | |
Indian Rupee | | | DBAB | | | | Buy | | | | 130,201,000 | | | | 2,046,864 | | | | 3/26/14 | | | | 20,256 | | | | — | |
Malaysian Ringgit | | | DBAB | | | | Buy | | | | 8,012,500 | | | | 2,524,576 | | | | 3/26/14 | | | | — | | | | (90,645 | ) |
Malaysian Ringgit | | | HSBC | | | | Buy | | | | 7,634,000 | | | | 2,404,107 | | | | 3/26/14 | | | | — | | | | (85,152 | ) |
Euro | | | CITI | | | | Sell | | | | 1,532,964 | | | | 1,993,926 | | | | 3/26/14 | | | | — | | | | (114,627 | ) |
Euro | | | DBAB | | | | Sell | | | | 2,736,000 | | | | 3,554,748 | | | | 3/26/14 | | | | — | | | | (208,551 | ) |
Euro | | | BZWS | | | | Sell | | | | 6,085,000 | | | | 8,216,880 | | | | 3/27/14 | | | | — | | | | (152,879 | ) |
Indian Rupee | | | DBAB | | | | Buy | | | | 24,950,000 | | | | 393,968 | | | | 3/28/14 | | | | 1,951 | | | | — | |
Indian Rupee | | | JPHQ | | | | Buy | | | | 79,054,000 | | | | 1,244,357 | | | | 3/28/14 | | �� | | 10,110 | | | | — | |
Chilean Peso | | | DBAB | | | | Buy | | | | 1,330,940,000 | | | | 2,695,302 | | | | 4/04/14 | | | | — | | | | (188,789 | ) |
Euro | | | DBAB | | | | Sell | | | | 6,200,000 | | | | 7,980,330 | | | | 4/04/14 | | | | — | | | | (547,627 | ) |
Indian Rupee | | | CITI | | | | Buy | | | | 34,491,000 | | | | 545,226 | | | | 4/07/14 | | | | 847 | | | | — | |
Indian Rupee | | | DBAB | | | | Buy | | | | 217,594,000 | | | | 3,435,333 | | | | 4/07/14 | | | | 9,690 | | | | — | |
Indian Rupee | | | HSBC | | | | Buy | | | | 251,448,000 | | | | 3,969,814 | | | | 4/07/14 | | | | 11,198 | | | | — | |
Euro | | | HSBC | | | | Sell | | | | 8,692,000 | | | | 11,359,314 | | | | 4/10/14 | | | | — | | | | (596,425 | ) |
Euro | | | DBAB | | | | Sell | | | | 7,243,000 | | | | 9,479,276 | | | | 4/11/14 | | | | — | | | | (483,394 | ) |
Euro | | | UBSW | | | | Sell | | | | 4,346,000 | | | | 5,690,001 | | | | 4/11/14 | | | | — | | | | (287,877 | ) |
Chilean Peso | | | MSCO | | | | Buy | | | | 2,645,530,000 | | | | 5,408,423 | | | | 4/14/14 | | | | — | | | | (431,293 | ) |
Euro | | | JPHQ | | | | Sell | | | | 3,907,000 | | | | 5,120,878 | | | | 4/14/14 | | | | — | | | | (253,181 | ) |
Malaysian Ringgit | | | DBAB | | | | Buy | | | | 16,369,588 | | | | 5,106,241 | | | | 4/16/14 | | | | — | | | | (139,221 | ) |
Euro | | | HSBC | | | | Sell | | | | 6,919,000 | | | | 9,056,487 | | | | 4/16/14 | | | | — | | | | (460,587 | ) |
Chilean Peso | | | MSCO | | | | Buy | | | | 2,370,410,000 | | | | 4,812,527 | | | | 4/21/14 | | | | — | | | | (356,185 | ) |
Malaysian Ringgit | | | JPHQ | | | | Buy | | | | 15,728,213 | | | | 5,098,286 | | | | 4/21/14 | | | | — | | | | (327,125 | ) |
Japanese Yen | | | BZWS | | | | Sell | | | | 700,840,000 | | | | 7,204,618 | | | | 4/21/14 | | | | 544,890 | | | | — | |
Japanese Yen | | | JPHQ | | | | Sell | | | | 421,090,000 | | | | 4,322,751 | | | | 4/21/14 | | | | 321,346 | | | | — | |
Japanese Yen | | | CITI | | | | Sell | | | | 261,800,000 | | | | 2,675,387 | | | | 4/22/14 | | | | 187,617 | | | | — | |
Japanese Yen | | | JPHQ | | | | Sell | | | | 496,560,000 | | | | 5,072,581 | | | | 4/22/14 | | | | 353,990 | | | | — | |
Euro | | | DBAB | | | | Sell | | | | 4,545,000 | | | | 5,957,132 | | | | 4/23/14 | | | | — | | | | (294,566 | ) |
Euro | | | BZWS | | | | Sell | | | | 4,954,399 | | | | 6,471,436 | | | | 4/25/14 | | | | — | | | | (343,412 | ) |
Chilean Peso | | | JPHQ | | | | Buy | | | | 1,501,938,000 | | | | 3,023,529 | | | | 4/28/14 | | | | — | | | | (201,925 | ) |
Swedish Krona | | | BZWS | | | | Buy | | | | 122,773,200 | | | | 14,205,258 | EUR | | | 4/30/14 | | | | — | | | | (493,221 | ) |
Euro | | | BZWS | | | | Sell | | | | 6,575,679 | | | | 8,576,001 | | | | 4/30/14 | | | | — | | | | (469,000 | ) |
Euro | | | DBAB | | | | Sell | | | | 11,263,000 | | | | 14,952,984 | | | | 4/30/14 | | | | — | | | | (539,536 | ) |
Euro | | | BZWS | | | | Sell | | | | 7,026,829 | | | | 9,313,640 | | | | 5/05/14 | | | | — | | | | (351,990 | ) |
Euro | | | BZWS | | | | Sell | | | | 1,259,000 | | | | 1,652,249 | | | | 5/07/14 | | | | — | | | | (79,551 | ) |
TGB-21
Franklin Templeton Variable Insurance Products Trust
Statement of Investments, December 31, 2013 (continued)
| | | | |
| Templeton Global Bond Securities Fund | | | | |
Forward Exchange Contracts (continued)
| | | | | | | | | | | | | | | | | | | | | | | | | | | | |
| Currency | | Counterpartya | | | Type | | | Quantity | | | Contract
Amount* | | | Settlement
Date | | | Unrealized
Appreciation | | | Unrealized
Depreciation | |
Euro | | | GSCO | | | | Sell | | | | 2,990,000 | | | | 3,933,644 | | | | 5/07/14 | | | $ | — | | | $ | (179,208 | ) |
Euro | | | GSCO | | | | Sell | | | | 2,045,000 | | | | 2,678,152 | | | | 5/08/14 | | | | — | | | | (134,822 | ) |
Chilean Peso | | | MSCO | | | | Buy | | | | 1,150,200,000 | | | | 2,333,063 | | | | 5/12/14 | | | | — | | | | (175,339 | ) |
Japanese Yen | | | CITI | | | | Sell | | | | 366,861,000 | | | | 3,718,550 | | | | 5/12/14 | | | | 231,951 | | | | — | |
Euro | | | GSCO | | | | Sell | | | | 1,259,000 | | | | 1,663,328 | | | | 5/12/14 | | | | — | | | | (68,483 | ) |
Euro | | | UBSW | | | | Sell | | | | 629,000 | | | | 830,516 | | | | 5/12/14 | | | | — | | | | (34,702 | ) |
Euro | | | CITI | | | | Sell | | | | 5,658,426 | | | | 7,468,274 | | | | 5/13/14 | | | | — | | | | (315,155 | ) |
Japanese Yen | | | GSCO | | | | Sell | | | | 490,555,000 | | | | 4,954,250 | | | | 5/13/14 | | | | 292,047 | | | | — | |
Euro | | | GSCO | | | | Sell | | | | 4,115,000 | | | | 5,502,990 | | | | 5/13/14 | | | | — | | | | (157,385 | ) |
Japanese Yen | | | UBSW | | | | Sell | | | | 366,681,000 | | | | 3,702,540 | | | | 5/13/14 | | | | 217,627 | | | | — | |
Japanese Yen | | | CITI | | | | Sell | | | | 366,680,000 | | | | 3,644,713 | | | | 5/14/14 | | | | 159,786 | | | | — | |
Euro | | | BZWS | | | | Sell | | | | 8,551,980 | | | | 11,291,103 | | | | 5/16/14 | | | | — | | | | (472,589 | ) |
Singapore Dollar | | | DBAB | | | | Buy | | | | 3,667,000 | | | | 2,891,728 | | | | 5/19/14 | | | | 14,856 | | | | — | |
Euro | | | GSCO | | | | Sell | | | | 4,454,000 | | | | 5,771,271 | | | | 5/20/14 | | | | — | | | | (355,470 | ) |
Euro | | | BZWS | | | | Sell | | | | 11,375,532 | | | | 14,643,154 | | | | 5/21/14 | | | | — | | | | (1,004,583 | ) |
Chilean Peso | | | MSCO | | | | Buy | | | | 420,740,000 | | | | 836,794 | | | | 5/22/14 | | | | — | | | | (48,310 | ) |
Malaysian Ringgit | | | HSBC | | | | Buy | | | | 298,500 | | | | 96,950 | | | | 5/22/14 | | | | — | | | | (6,547 | ) |
Euro | | | JPHQ | | | | Sell | | | | 4,730,771 | | | | 6,116,461 | | | | 5/23/14 | | | | — | | | | (391,019 | ) |
Malaysian Ringgit | | | HSBC | | | | Buy | | | | 1,229,300 | | | | 397,484 | | | | 5/28/14 | | | | — | | | | (25,295 | ) |
Euro | | | BZWS | | | | Sell | | | | 2,836,669 | | | | 3,664,976 | | | | 5/30/14 | | | | — | | | | (237,080 | ) |
Euro | | | GSCO | | | | Sell | | | | 463,000 | | | | 596,969 | | | | 5/30/14 | | | | — | | | | (39,923 | ) |
Euro | | | BZWS | | | | Sell | | | | 7,895,591 | | | | 10,294,504 | | | | 6/05/14 | | | | — | | | | (566,574 | ) |
Mexican Peso | | | CITI | | | | Buy | | | | 78,317,430 | | | | 5,917,359 | | | | 6/09/14 | | | | 19,203 | | | | — | |
Japanese Yen | | | CITI | | | | Sell | | | | 1,370,500,000 | | | | 13,819,704 | | | | 6/09/14 | | | | 792,137 | | | | — | |
Euro | | | GSCO | | | | Sell | | | | 2,033,100 | | | | 2,667,793 | | | | 6/09/14 | | | | — | | | | (128,929 | ) |
Japanese Yen | | | HSBC | | | | Sell | | | | 2,052,400,000 | | | | 20,729,219 | | | | 6/09/14 | | | | 1,219,714 | | | | — | |
Japanese Yen | | | JPHQ | | | | Sell | | | | 1,375,900,000 | | | | 13,819,113 | | | | 6/09/14 | | | | 740,216 | | | | — | |
Mexican Peso | | | CITI | | | | Buy | | | | 78,230,000 | | | | 5,901,657 | | | | 6/10/14 | | | | 27,814 | | | | — | |
Swedish Krona | | | DBAB | | | | Buy | | | | 41,300,000 | | | | 4,737,325 | EUR | | | 6/10/14 | | | | — | | | | (113,951 | ) |
Japanese Yen | | | BZWS | | | | Sell | | | | 1,689,110,000 | | | | 17,356,925 | | | | 6/10/14 | | | | 1,300,636 | | | | — | |
Japanese Yen | | | HSBC | | | | Sell | | | | 1,798,900,000 | | | | 18,596,742 | | | | 6/10/14 | | | | 1,496,814 | | | | — | |
Japanese Yen | | | JPHQ | | | | Sell | | | | 1,219,900,000 | | | | 12,397,806 | | | | 6/10/14 | | | | 801,719 | | | | — | |
Polish Zloty | | | CITI | | | | Buy | | | | 5,990,000 | | | | 1,365,927 | EUR | | | 6/11/14 | | | | 84,980 | | | | — | |
Swedish Krona | | | MSCO | | | | Buy | | | | 13,064,000 | | | | 1,488,181 | EUR | | | 6/11/14 | | | | — | | | | (21,875 | ) |
Japanese Yen | | | DBAB | | | | Sell | | | | 595,700,000 | | | | 6,199,009 | | | | 6/11/14 | | | | 536,384 | | | | — | |
Euro | | | GSCO | | | | Sell | | | | 8,105,300 | | | | 10,738,712 | | | | 6/11/14 | | | | — | | | | (410,925 | ) |
Japanese Yen | | | JPHQ | | | | Sell | | | | 1,666,680,000 | | | | 17,356,983 | | | | 6/11/14 | | | | 1,513,799 | | | | — | |
Mexican Peso | | | CITI | | | | Buy | | | | 159,085,880 | | | | 12,019,635 | | | | 6/12/14 | | | | 36,453 | | | | — | |
Polish Zloty | | | DBAB | | | | Buy | | | | 30,704,000 | | | | 7,052,392 | EUR | | | 6/12/14 | | | | 365,071 | | | | — | |
Swedish Krona | | | MSCO | | | | Buy | | | | 42,305,800 | | | | 4,810,926 | EUR | | | 6/12/14 | | | | — | | | | (59,504 | ) |
Mexican Peso | | | CITI | | | | Buy | | | | 99,058,800 | | | | 7,396,698 | | | | 6/13/14 | | | | 109,740 | | | | — | |
Swedish Krona | | | BZWS | | | | Buy | | | | 24,372,000 | | | | 2,756,016 | EUR | | | 6/13/14 | | | | — | | | | (13,004 | ) |
Swedish Krona | | | MSCO | | | | Buy | | | | 28,654,000 | | | | 3,185,687 | EUR | | | 6/13/14 | | | | 65,080 | | | | (5,339 | ) |
Euro | | | DBAB | | | | Sell | | | | 8,383,000 | | | | 11,130,528 | | | | 6/13/14 | | | | — | | | | (401,143 | ) |
Swedish Krona | | | MSCO | | | | Buy | | | | 21,328,100 | | | | 2,430,774 | EUR | | | 6/16/14 | | | | — | | | | (37,648 | ) |
Japanese Yen | | | CITI | | | | Sell | | | | 310,702,000 | | | | 3,270,547 | | | | 6/16/14 | | | | 316,964 | | | | — | |
Japanese Yen | | | JPHQ | | | | Sell | | | | 702,800,000 | | | | 7,438,218 | | | | 6/17/14 | | | | 757,241 | | | | — | |
Malaysian Ringgit | | | HSBC | | | | Buy | | | | 36,880,000 | | | | 11,242,874 | | | | 6/20/14 | | | | — | | | | (90,267 | ) |
Mexican Peso | | | CITI | | | | Buy | | | | 61,535,000 | | | | 4,622,938 | | | | 6/20/14 | | | | 37,490 | | | | — | |
Singapore Dollar | | | HSBC | | | | Buy | | | | 6,864,000 | | | | 5,451,946 | | | | 6/20/14 | | | | — | | | | (10,917 | ) |
Euro | | | BZWS | | | | Sell | | | | 1,124,367 | | | | 1,509,688 | | | | 6/20/14 | | | | — | | | | (37,008 | ) |
TGB-22
Franklin Templeton Variable Insurance Products Trust
Statement of Investments, December 31, 2013 (continued)
| | | | |
| Templeton Global Bond Securities Fund | | | | |
Forward Exchange Contracts (continued)
| | | | | | | | | | | | | | | | | | | | | | | | | | | | |
| Currency | | Counterpartya | | | Type | | | Quantity | | | Contract
Amount* | | | Settlement
Date | | | Unrealized
Appreciation | | | Unrealized
Depreciation | |
Japanese Yen | | | DBAB | | | | Sell | | | | 1,455,820,000 | | | | 14,169,116 | | | | 6/20/14 | | | $ | 329,474 | | | $ | — | |
Singapore Dollar | | | DBAB | | | | Buy | | | | 8,589,700 | | | | 6,844,928 | | | | 6/23/14 | | | | — | | | | (35,905 | ) |
Philippine Peso | | | JPHQ | | | | Buy | | | | 392,700,000 | | | | 8,866,561 | | | | 6/25/14 | | | | — | | | | (8,445 | ) |
South Korean Won | | | DBAB | | | | Buy | | | | 21,440,000,000 | | | | 18,351,451 | | | | 6/27/14 | | | | 1,761,549 | | | | — | |
Swedish Krona | | | UBSW | | | | Buy | | | | 302,991,000 | | | | 34,200,332 | EUR | | | 6/30/14 | | | | — | | | | (90,475 | ) |
Mexican Peso | | | CITI | | | | Buy | | | | 105,786,172 | | | | 7,970,207 | | | | 7/10/14 | | | | 29,333 | | | | — | |
Malaysian Ringgit | | | DBAB | | | | Buy | | | | 18,006,622 | | | | 5,550,404 | | | | 7/14/14 | | | | — | | | | (111,679 | ) |
Malaysian Ringgit | | | DBAB | | | | Buy | | | | 13,610,000 | | | | 4,232,360 | | | | 7/15/14 | | | | — | | | | (121,792 | ) |
Euro | | | BZWS | | | | Sell | | | | 2,243,000 | | | | 2,932,498 | | | | 7/16/14 | | | | — | | | | (153,176 | ) |
Euro | | | MSCO | | | | Sell | | | | 9,679,000 | | | | 12,627,320 | | | | 7/16/14 | | | | — | | | | (687,991 | ) |
Euro | | | UBSW | | | | Sell | | | | 17,930,000 | | | | 23,415,056 | | | | 7/16/14 | | | | — | | | | (1,251,081 | ) |
Malaysian Ringgit | | | DBAB | | | | Buy | | | | 2,637,000 | | | | 815,651 | | | | 7/18/14 | | | | — | | | | (19,326 | ) |
Malaysian Ringgit | | | DBAB | | | | Buy | | | | 11,455,000 | | | | 2,704,841 | EUR | | | 7/18/14 | | | | — | | | | (261,846 | ) |
Euro | | | BZWS | | | | Sell | | | | 3,518,000 | | | | 4,627,050 | | | | 7/18/14 | | | | — | | | | (212,656 | ) |
Malaysian Ringgit | | | DBAB | | | | Buy | | | | 4,160,000 | | | | 1,280,867 | | | | 7/22/14 | | | | — | | | | (24,868 | ) |
Malaysian Ringgit | | | DBAB | | | | Buy | | | | 12,933,000 | | | | 3,029,870 | EUR | | | 7/22/14 | | | | — | | | | (263,462 | ) |
Euro | | | DBAB | | | | Sell | | | | 1,935,000 | | | | 2,538,372 | | | | 7/22/14 | | | | — | | | | (123,631 | ) |
Euro | | | MSCO | | | | Sell | | | | 12,182,000 | | | | 15,957,689 | | | | 7/22/14 | | | | — | | | | (801,236 | ) |
Euro | | | DBAB | | | | Sell | | | | 1,759,000 | | | | 2,311,361 | | | | 7/23/14 | | | | — | | | | (108,523 | ) |
Japanese Yen | | | CITI | | | | Sell | | | | 913,412,000 | | | | 9,181,286 | | | | 7/24/14 | | | | 495,395 | | | | — | |
Japanese Yen | | | JPHQ | | | | Sell | | | | 1,407,000,000 | | | | 14,122,252 | | | | 7/24/14 | | | | 742,695 | | | | — | |
Malaysian Ringgit | | | DBAB | | | | Buy | | | | 5,058,000 | | | | 1,570,466 | | | | 7/25/14 | | | | — | | | | (43,564 | ) |
Malaysian Ringgit | | | DBAB | | | | Buy | | | | 16,628,000 | | | | 3,903,470 | EUR | | | 7/25/14 | | | | — | | | | (350,453 | ) |
Euro | | | DBAB | | | | Sell | | | | 4,715,000 | | | | 6,236,219 | | | | 7/25/14 | | | | — | | | | (250,314 | ) |
Euro | | | GSCO | | | | Sell | | | | 4,711,000 | | | | 6,236,704 | | | | 7/25/14 | | | | — | | | | (244,326 | ) |
Japanese Yen | | | JPHQ | | | | Sell | | | | 490,100,000 | | | | 4,944,262 | | | | 7/25/14 | | | | 283,720 | | | | — | |
Euro | | | CITI | | | | Sell | | | | 1,935,410 | | | | 2,563,112 | | | | 7/28/14 | | | | — | | | | (99,496 | ) |
Japanese Yen | | | BZWS | | | | Sell | | | | 1,079,470,000 | | | | 10,875,395 | | | | 7/29/14 | | | | 609,923 | | | | — | |
Malaysian Ringgit | | | JPHQ | | | | Buy | | | | 5,318,000 | | | | 1,632,139 | | | | 7/30/14 | | | | — | | | | (27,139 | ) |
Malaysian Ringgit | | | JPHQ | | | | Buy | | | | 16,628,000 | | | | 3,857,826 | EUR | | | 7/30/14 | | | | — | | | | (288,949 | ) |
Chilean Peso | | | MSCO | | | | Buy | | | | 1,963,430,000 | | | | 3,690,311 | | | | 7/31/14 | | | | — | | | | (36,916 | ) |
Malaysian Ringgit | | | HSBC | | | | Buy | | | | 3,005,000 | | | | 916,354 | | | | 7/31/14 | | | | — | | | | (9,473 | ) |
Euro | | | JPHQ | | | | Sell | | | | 11,263,000 | | | | 14,973,201 | | | | 7/31/14 | | | | — | | | | (521,804 | ) |
Euro | | | GSCO | | | | Sell | | | | 11,263,000 | | | | 14,951,745 | | | | 8/01/14 | | | | — | | | | (543,300 | ) |
Euro | | | BZWS | | | | Sell | | | | 282,898 | | | | 375,646 | | | | 8/04/14 | | | | — | | | | (13,553 | ) |
Euro | | | HSBC | | | | Sell | | | | 11,263,000 | | | | 14,928,318 | | | | 8/04/14 | | | | — | | | | (566,847 | ) |
Euro | | | BZWS | | | | Sell | | | | 7,003,000 | | | | 9,287,659 | | | | 8/05/14 | | | | — | | | | (346,801 | ) |
Malaysian Ringgit | | | JPHQ | | | | Buy | | | | 1,100,000 | | | | 331,655 | | | | 8/06/14 | | | | 218 | | | | — | |
Euro | | | JPHQ | | | | Sell | | | | 5,724,900 | | | | 7,572,342 | | | | 8/06/14 | | | | — | | | | (303,777 | ) |
Euro | | | CITI | | | | Sell | | | | 1,210,637 | | | | 1,611,721 | | | | 8/08/14 | | | | — | | | | (53,840 | ) |
Euro | | | CITI | | | | Sell | | | | 351,512 | | | | 468,384 | | | | 8/11/14 | | | | — | | | | (15,220 | ) |
Euro | | | DBAB | | | | Sell | | | | 4,845,000 | | | | 6,460,081 | | | | 8/11/14 | | | | — | | | | (205,588 | ) |
Euro | | | JPHQ | | | | Sell | | | | 6,343,900 | | | | 8,447,664 | | | | 8/11/14 | | | | — | | | | (280,166 | ) |
Malaysian Ringgit | | | HSBC | | | | Buy | | | | 6,100,000 | | | | 1,853,146 | | | | 8/12/14 | | | | — | | | | (13,296 | ) |
Singapore Dollar | | | DBAB | | | | Buy | | | | 12,363,000 | | | | 9,768,489 | | | | 8/12/14 | | | | 32,888 | | | | — | |
South Korean Won | | | HSBC | | | | Buy | | | | 11,980,000,000 | | | | 1,018,568,902 | JPY | | | 8/12/14 | | | | 1,532,531 | | | | — | |
Euro | | | GSCO | | | | Sell | | | | 30,376,000 | | | | 40,668,604 | | | | 8/12/14 | | | | — | | | | (1,122,292 | ) |
Euro | | | MSCO | | | | Sell | | | | 1,962,500 | | | | 2,604,218 | | | | 8/15/14 | | | | — | | | | (95,784 | ) |
Singapore Dollar | | | BZWS | | | | Buy | | | | 4,886,000 | | | | 3,847,244 | | | | 8/18/14 | | | | 26,435 | | | | — | |
Polish Zloty | | | DBAB | | | | Buy | | | | 59,155,000 | | | | 13,693,287 | EUR | | | 8/19/14 | | | | 474,018 | | | | — | |
Singapore Dollar | | | DBAB | | | | Buy | | | | 3,667,000 | | | | 2,892,412 | | | | 8/19/14 | | | | 14,837 | | | | — | |
TGB-23
Franklin Templeton Variable Insurance Products Trust
Statement of Investments, December 31, 2013 (continued)
| | | | |
| Templeton Global Bond Securities Fund | | | | |
Forward Exchange Contracts (continued)
| | | | | | | | | | | | | | | | | | | | | | | | | | | | |
| Currency | | Counterpartya | | | Type | | | Quantity | | | Contract
Amount* | | | Settlement
Date | | | Unrealized
Appreciation | | | Unrealized
Depreciation | |
Singapore Dollar | | | HSBC | | | | Buy | | | | 3,667,000 | | | | 2,892,868 | | | | 8/19/14 | | | $ | 14,380 | | | $ | — | |
Euro | | | BZWS | | | | Sell | | | | 7,066,000 | | | | 9,363,510 | | | | 8/19/14 | | | | — | | | | (357,974 | ) |
Japanese Yen | | | DBAB | | | | Sell | | | | 838,612,000 | | | | 8,543,578 | | | | 8/19/14 | | | | 567,004 | | | | — | |
Chilean Peso | | | MSCO | | | | Buy | | | | 981,300,000 | | | | 1,843,960 | | | | 8/20/14 | | | | — | | | | (21,745 | ) |
Euro | | | DBAB | | | | Sell | | | | 3,964,000 | | | | 5,294,081 | | | | 8/20/14 | | | | — | | | | (159,650 | ) |
Japanese Yen | | | HSBC | | | | Sell | | | | 1,621,372,000 | | | | 16,715,175 | | | | 8/20/14 | | | | 1,293,124 | | | | — | |
Japanese Yen | | | JPHQ | | | | Sell | | | | 1,135,828,000 | | | | 11,683,964 | | | | 8/20/14 | | | | 880,276 | | | | — | |
Euro | | | JPHQ | | | | Sell | | | | 7,851,000 | | | | 10,489,250 | | | | 8/20/14 | | | | — | | | | (312,274 | ) |
Japanese Yen | | | BZWS | | | | Sell | | | | 376,247,000 | | | | 3,880,435 | | | | 8/22/14 | | | | 301,607 | | | | — | |
Euro | | | BZWS | | | | Sell | | | | 2,680,925 | | | | 3,594,021 | | | | 8/25/14 | | | | — | | | | (94,483 | ) |
Japanese Yen | | | CITI | | | | Sell | | | | 751,731,000 | | | | 7,738,515 | | | | 8/25/14 | | | | 587,913 | | | | — | |
Japanese Yen | | | DBAB | | | | Sell | | | | 371,821,000 | | | | 3,825,870 | | | | 8/25/14 | | | | 289,041 | | | | — | |
Japanese Yen | | | HSBC | | | | Sell | | | | 746,218,000 | | | | 7,662,084 | | | | 8/25/14 | | | | 563,922 | | | | — | |
Malaysian Ringgit | | | HSBC | | | | Buy | | | | 1,223,000 | | | | 363,124 | | | | 8/26/14 | | | | 5,500 | | | | — | |
Swedish Krona | | | UBSW | | | | Buy | | | | 30,000,000 | | | | 3,417,246 | EUR | | | 8/26/14 | | | | — | | | | (56,907 | ) |
Japanese Yen | | | BZWS | | | | Sell | | | | 1,085,075,000 | | | | 11,038,403 | | | | 8/26/14 | | | | 716,873 | | | | — | |
Japanese Yen | | | JPHQ | | | | Sell | | | | 750,133,000 | | | | 7,630,942 | | | | 8/26/14 | | | | 495,471 | | | | — | |
Malaysian Ringgit | | | JPHQ | | | | Buy | | | | 8,340,000 | | | | 2,483,399 | | | | 8/27/14 | | | | 30,235 | | | | — | |
Singapore Dollar | | | DBAB | | | | Buy | | | | 7,749,500 | | | | 6,062,348 | | | | 8/27/14 | | | | 81,693 | | | | — | |
Euro | | | CITI | | | | Sell | | | | 6,136,805 | | | | 8,203,374 | | | | 8/27/14 | | | | — | | | | (239,887 | ) |
Japanese Yen | | | DBAB | | | | Sell | | | | 685,950,000 | | | | 6,949,848 | | | | 8/27/14 | | | | 424,842 | | | | — | |
Japanese Yen | | | HSBC | | | | Sell | | | | 1,247,125,000 | | | | 12,637,176 | | | | 8/27/14 | | | | 774,069 | | | | — | |
Euro | | | HSBC | | | | Sell | | | | 18,537,726 | | | | 24,780,677 | | | | 8/27/14 | | | | — | | | | (724,268 | ) |
Japanese Yen | | | JPHQ | | | | Sell | | | | 751,903,000 | | | | 7,628,692 | | | | 8/27/14 | | | | 476,317 | | | | — | |
Euro | | | JPHQ | | | | Sell | | | | 14,996,625 | | | | 20,054,025 | | | | 8/27/14 | | | | — | | | | (578,930 | ) |
Euro | | | DBAB | | | | Sell | | | | 1,058,312 | | | | 1,413,270 | | | | 8/29/14 | | | | — | | | | (42,806 | ) |
Japanese Yen | | | JPHQ | | | | Sell | | | | 372,662,000 | | | | 3,835,372 | | | | 8/29/14 | | | | 290,408 | | | | — | |
Euro | | | DBAB | | | | Sell | | | | 1,732,000 | | | | 2,293,688 | | | | 9/03/14 | | | | — | | | | (89,310 | ) |
Euro | | | DBAB | | | | Sell | | | | 8,105,300 | | | | 10,696,483 | | | | 9/05/14 | | | | — | | | | (455,371 | ) |
Japanese Yen | | | BZWS | | | | Sell | | | | 285,057,504 | | | | 2,895,749 | | | | 9/18/14 | | | | 183,609 | | | | — | |
Euro | | | BZWS | | | | Sell | | | | 678,250 | | | | 906,142 | | | | 9/19/14 | | | | — | | | | (27,077 | ) |
Hungarian Forint | | | JPHQ | | | | Buy | | | | 1,156,013,000 | | | | 3,813,337 | EUR | | | 9/23/14 | | | | 27,163 | | | | — | |
Euro | | | DBAB | | | | Sell | | | | 8,070,000 | | | | 10,949,537 | | | | 9/23/14 | | | | — | | | | (154,264 | ) |
Euro | | | BZWS | | | | Sell | | | | 1,647,381 | | | | 2,230,159 | | | | 9/24/14 | | | | — | | | | (36,538 | ) |
Hungarian Forint | | | JPHQ | | | | Buy | | | | 925,405,000 | | | | 3,021,829 | EUR | | | 9/25/14 | | | | 63,697 | | | | — | |
Malaysian Ringgit | | | DBAB | | | | Buy | | | | 11,080,500 | | | | 3,390,087 | | | | 9/26/14 | | | | — | | | | (55,338 | ) |
Malaysian Ringgit | | | HSBC | | | | Buy | | | | 11,490,000 | | | | 3,513,224 | | | | 9/26/14 | | | | — | | | | (55,234 | ) |
South Korean Won | | | HSBC | | | | Buy | | | | 9,530,000,000 | | | | 8,719,122 | | | | 9/26/14 | | | | 192,355 | | | | — | |
Euro | | | DBAB | | | | Sell | | | | 3,753,000 | | | | 5,064,392 | | | | 9/26/14 | | | | — | | | | (99,535 | ) |
Euro | | | BZWS | | | | Sell | | | | 6,085,000 | | | | 8,220,531 | | | | 9/29/14 | | | | — | | | | (152,182 | ) |
Japanese Yen | | | JPHQ | | | | Sell | | | | 285,510,329 | | | | 2,905,810 | | | | 9/29/14 | | | | 189,062 | | | | — | |
Chilean Peso | | | DBAB | | | | Buy | | | | 1,252,750,000 | | | | 2,393,028 | | | | 9/30/14 | | | | — | | | | (76,402 | ) |
Euro | | | DBAB | | | | Sell | | | | 14,880,000 | | | | 20,093,506 | | | | 9/30/14 | | | | — | | | | (380,838 | ) |
Euro | | | GSCO | | | | Sell | | | | 4,020,000 | | | | 5,424,226 | | | | 9/30/14 | | | | — | | | | (107,149 | ) |
Euro | | | HSBC | | | | Sell | | | | 5,430,000 | | | | 7,340,763 | | | | 9/30/14 | | | | — | | | | (130,722 | ) |
Japanese Yen | | | JPHQ | | | | Sell | | | | 172,207,000 | | | | 1,746,477 | | | | 9/30/14 | | | | 107,837 | | | | — | |
Swedish Krona | | | DBAB | | | | Buy | | | | 445,104,500 | | | | 69,296,379 | | | | 10/03/14 | | | | — | | | | (431,145 | ) |
Mexican Peso | | | HSBC | | | | Buy | | | | 377,048,070 | | | | 27,679,754 | | | | 10/07/14 | | | | 638,852 | | | | — | |
Euro | | | JPHQ | | | | Sell | | | | 6,370,000 | | | | 8,687,183 | | | | 10/07/14 | | | | — | | | | (77,915 | ) |
Euro | | | DBAB | | | | Sell | | | | 12,680,000 | | | | 17,224,258 | | | | 10/09/14 | | | | — | | | | (223,497 | ) |
Mexican Peso | | | DBAB | | | | Buy | | | | 259,112,000 | | | | 19,136,780 | | | | 10/14/14 | | | | 312,605 | | | | — | |
Chilean Peso | | | CITI | | | | Buy | | | | 921,291,798 | | | | 1,770,693 | | | | 10/20/14 | | | | — | | | | (70,470 | ) |
TGB-24
Franklin Templeton Variable Insurance Products Trust
Statement of Investments, December 31, 2013 (continued)
| | | | |
| Templeton Global Bond Securities Fund | | | | |
Forward Exchange Contracts (continued)
| | | | | | | | | | | | | | | | | | | | | | | | | | | | |
| Currency | | Counterpartya | | | Type | | | Quantity | | | Contract
Amount* | | | Settlement
Date | | | Unrealized
Appreciation | | | Unrealized
Depreciation | |
Malaysian Ringgit | | | JPHQ | | | | Buy | | | | 8,104,000 | | | | 2,505,023 | | | | 10/20/14 | | | $ | — | | | $ | (70,029 | ) |
Euro | | | HSBC | | | | Sell | | | | 12,569,000 | | | | 17,069,079 | | | | 10/20/14 | | | | — | | | | (226,585 | ) |
Japanese Yen | | | JPHQ | | | | Sell | | | | 1,233,160,000 | | | | 12,562,755 | | | | 10/20/14 | | | | 825,740 | | | | — | |
Malaysian Ringgit | | | HSBC | | | | Buy | | | | 14,613,000 | | | | 4,556,311 | | | | 10/22/14 | | | | — | | | | (166,169 | ) |
Japanese Yen | | | BZWS | | | | Sell | | | | 735,200,000 | | | | 7,538,966 | | | | 10/22/14 | | | | 541,283 | | | | — | |
Chilean Peso | | | CITI | | | | Buy | | | | 2,420,966,000 | | | | 4,646,768 | | | | 10/24/14 | | | | — | | | | (180,741 | ) |
Malaysian Ringgit | | | DBAB | | | | Buy | | | | 10,811,000 | | | | 3,356,932 | | | | 10/24/14 | | | | — | | | | (109,459 | ) |
Malaysian Ringgit | | | HSBC | | | | Buy | | | | 7,209,825 | | | | 2,226,629 | | | | 10/24/14 | | | | — | | | | (60,899 | ) |
Chilean Peso | | | BZWS | | | | Buy | | | | 199,342,000 | | | | 381,370 | | | | 10/27/14 | | | | — | | | | (13,750 | ) |
Euro | | | BZWS | | | | Sell | | | | 649,907 | | | | 894,805 | | | | 10/27/14 | | | | 474 | | | | — | |
Chilean Peso | | | DBAB | | | | Buy | | | | 398,486,000 | | | | 758,732 | | | | 10/29/14 | | | | — | | | | (24,006 | ) |
Malaysian Ringgit | | | JPHQ | | | | Buy | | | | 7,468,000 | | | | 2,335,210 | | | | 10/31/14 | | | | — | | | | (93,001 | ) |
Euro | | | DBAB | | | | Sell | | | | 3,319,244 | | | | 4,583,909 | | | | 10/31/14 | | | | 16,269 | | | | — | |
Euro | | | DBAB | | | | Sell | | | | 224,556 | | | | 309,000 | | | | 11/03/14 | | | | — | | | | (16 | ) |
Euro | | | BZWS | | | | Sell | | | | 1,581,109 | | | | 2,138,292 | | | | 11/05/14 | | | | — | | | | (37,523 | ) |
Japanese Yen | | | CITI | | | | Sell | | | | 341,992,119 | | | | 3,478,711 | | | | 11/10/14 | | | | 222,856 | | | | — | |
Japanese Yen | | | HSBC | | | | Sell | | | | 413,563,000 | | | | 4,194,351 | | | | 11/12/14 | | | | 257,026 | | | | — | |
Euro | | | JPHQ | | | | Sell | | | | 8,969,211 | | | | 11,959,905 | | | | 11/12/14 | | | | — | | | | (383,206 | ) |
Japanese Yen | | | JPHQ | | | | Sell | | | | 335,950,000 | | | | 3,397,209 | | | | 11/13/14 | | | | 198,760 | | | | — | |
Japanese Yen | | | MSCO | | | | Sell | | | | 300,000,000 | | | | 3,019,202 | | | | 11/14/14 | | | | 162,984 | | | | — | |
Japanese Yen | | | CITI | | | | Sell | | | | 429,663,000 | | | | 4,339,154 | | | | 11/17/14 | | | | 248,301 | | | | — | |
Euro | | | DBAB | | | | Sell | | | | 10,778,730 | | | | 14,488,984 | | | | 11/17/14 | | | | — | | | | (344,573 | ) |
Euro | | | MSCO | | | | Sell | | | | 1,962,500 | | | | 2,641,103 | | | | 11/17/14 | | | | — | | | | (59,666 | ) |
Japanese Yen | | | SCNY | | | | Sell | | | | 340,600,700 | | | | 3,436,315 | | | | 11/17/14 | | | | 193,431 | | | | — | |
Malaysian Ringgit | | | DBAB | | | | Buy | | | | 7,197,960 | | | | 2,208,844 | | | | 11/19/14 | | | | — | | | | (50,517 | ) |
Japanese Yen | | | CITI | | | | Sell | | | | 986,239,000 | | | | 9,872,460 | | | | 11/19/14 | | | | 482,177 | | | | — | |
Japanese Yen | | | DBAB | | | | Sell | | | | 796,770,000 | | | | 7,970,888 | | | | 11/19/14 | | | | 384,598 | | | | — | |
Euro | | | DBAB | | | | Sell | | | | 3,953,398 | | | | 5,324,831 | | | | 11/19/14 | | | | — | | | | (115,824 | ) |
Malaysian Ringgit | | | HSBC | | | | Buy | | | | 4,326,000 | | | | 1,328,624 | | | | 11/20/14 | | | | — | | | | (31,550 | ) |
Japanese Yen | | | CITI | | | | Sell | | | | 1,107,834,000 | | | | 11,116,135 | | | | 11/20/14 | | | | 567,981 | | | | — | |
Euro | | | DBAB | | | | Sell | | | | 3,887,000 | | | | 5,260,471 | | | | 11/20/14 | | | | — | | | | (88,825 | ) |
Japanese Yen | | | HSBC | | | | Sell | | | | 207,909,000 | | | | 2,085,116 | | | | 11/20/14 | | | | 105,527 | | | | — | |
Japanese Yen | | | JPHQ | | | | Sell | | | | 715,709,000 | | | | 7,176,440 | | | | 11/20/14 | | | | 361,873 | | | | — | |
Euro | | | JPHQ | | | | Sell | | | | 15,309,581 | | | | 20,722,858 | | | | 11/20/14 | | | | — | | | | (346,216 | ) |
Euro | | | DBAB | | | | Sell | | | | 837,570 | | | | 1,134,907 | | | | 11/28/14 | | | | — | | | | (17,789 | ) |
Euro | | | DBAB | | | | Sell | | | | 5,440,000 | | | | 7,369,350 | | | | 12/04/14 | | | | — | | | | (117,543 | ) |
Euro | | | HSBC | | | | Sell | | | | 2,155,292 | | | | 2,941,973 | | | | 12/09/14 | | | | — | | | | (24,334 | ) |
Euro | | | SCNY | | | | Sell | | | | 2,400,751 | | | | 3,279,738 | | | | 12/09/14 | | | | — | | | | (24,393 | ) |
Euro | | | JPHQ | | | | Sell | | | | 5,095,000 | | | | 7,027,712 | | | | 12/15/14 | | | | 15,369 | | | | — | |
Mexican Peso | | | CITI | | | | Buy | | | | 95,083,400 | | | | 7,164,750 | | | | 12/16/14 | | | | — | | | | (65,397 | ) |
Malaysian Ringgit | | | JPHQ | | | | Buy | | | | 13,361,013 | | | | 4,058,384 | | | | 12/17/14 | | | | — | | | | (59,696 | ) |
Mexican Peso | | | CITI | | | | Buy | | | | 45,585,080 | | | | 3,424,103 | | | | 12/18/14 | | | | — | | | | (21,087 | ) |
Malaysian Ringgit | | | JPHQ | | | | Buy | | | | 14,772,000 | | | | 4,472,704 | | | | 12/19/14 | | | | — | | | | (52,338 | ) |
Japanese Yen | | | DBAB | | | | Sell | | | | 1,453,310,000 | | | | 14,169,165 | | | | 12/22/14 | | | | 326,205 | | | | — | |
Japanese Yen | | | HSBC | | | | Sell | | | | 1,455,540,000 | | | | 14,169,149 | | | | 12/22/14 | | | | 304,948 | | | | — | |
Japanese Yen | | | BZWS | | | | Sell | | | | 696,650,000 | | | | 6,718,260 | | | | 12/26/14 | | | | 82,259 | | | | — | |
Japanese Yen | | | CITI | | | | Sell | | | | 1,086,780,000 | | | | 10,480,503 | | | | 12/26/14 | | | | 128,284 | | | | — | |
| | | | | | | | | | | | | | | | | | | | | | | | |
Unrealized appreciation (depreciation) | | | | | | | | | | | | 74,197,203 | | | | (52,426,649 | ) |
| | | | | | | | | | | | | | | | | | | | | | | | |
Net unrealized appreciation (depreciation) | | | | | | | | | | | $ | 21,770,554 | | | | | |
| | | | | | | | | | | | | | | | | | | | | | | | | | | | |
aMay be comprised of multiple contracts using the same currency and settlement date.
*In U.S. dollars unless otherwise indicated.
TGB-25
Franklin Templeton Variable Insurance Products Trust
Statement of Investments, December 31, 2013 (continued)
| | | | |
| Templeton Global Bond Securities Fund | | | | |
At December 31, 2013, the Fund had the following interest rate swap contracts outstanding. See Note 1(d).
| | | | | | | | | | | | | | | | | | | | |
| Description | | Counterparty/
Exchange | | | Expiration
Date | | | Notional
Amount | | | Unrealized
Appreciation | | | Unrealized
Depreciation | |
Centrally Cleared Swaps | | | | | | | | | | | | | | | | | | | | |
Receive Floating rate 3-month USD BBA LIBOR Pay Fixed rate 2.775% | | | DBAB | | | | 10/4/23 | | | $ | 13,090,000 | | | $ | 227,372 | | | $ | — | |
Receive Floating rate 3-month USD BBA LIBOR Pay Fixed rate 2.795% | | | DBAB | | | | 10/4/23 | | | | 13,090,000 | | | | 203,607 | | | | — | |
Receive Floating rate 3-month USD BBA LIBOR Pay Fixed rate 2.765% | | | HSBC | | | | 10/7/23 | | | | 13,090,000 | | | | 245,363 | | | | — | |
Receive Floating rate 3-month USD BBA LIBOR Pay Fixed rate 3.668% | | | DBAB | | | | 10/4/43 | | | | 6,370,000 | | | | 241,141 | | | | — | |
Receive Floating rate 3-month USD BBA LIBOR Pay Fixed rate 3.687% | | | DBAB | | | | 10/4/43 | | | | 6,370,000 | | | | 218,732 | | | | — | |
Receive Floating rate 3-month USD BBA LIBOR Pay Fixed rate 3.675% | | | HSBC | | | | 10/7/43 | | | | 6,370,000 | | | | 234,539 | | | | — | |
| | | | | | | | | | | | | | | | |
Centrally Cleared Swaps unrealized appreciation (depreciation) | | | | 1,370,754 | | | | — | |
| | | | | | | | | | | | | | | | |
OTC Swaps | | | | | | | | | | | | | | | | | | | | |
Receive Floating rate 3-month USD BBA LIBOR Pay Fixed rate 3.558% | | | JPHQ | | | | 3/4/21 | | | $ | 3,240,000 | | | $ | — | | | $ | (266,148 | ) |
Receive Floating rate 3-month USD BBA LIBOR Pay Fixed rate 3.523% | | | DBAB | | | | 3/28/21 | | | | 14,630,000 | | | | — | | | | (1,124,007 | ) |
Receive Floating rate 3-month USD BBA LIBOR Pay Fixed rate 4.347% | | | CITI | | | | 2/25/41 | | | | 7,460,000 | | | | — | | | | (713,354 | ) |
Receive Floating rate 3-month USD BBA LIBOR Pay Fixed rate 4.349% | | | JPHQ | | | | 2/25/41 | | | | 7,460,000 | | | | — | | | | (716,953 | ) |
Receive Floating rate 3-month USD BBA LIBOR Pay Fixed rate 4.320% | | | JPHQ | | | | 2/28/41 | | | | 5,600,000 | | | | — | | | | (516,449 | ) |
Receive Floating rate 3-month USD BBA LIBOR Pay Fixed rate 4.299% | | | JPHQ | | | | 3/1/41 | | | | 1,870,000 | | | | — | | | | (161,314 | ) |
| | | | | | | | | | | | | | | | |
OTC Swaps unrealized appreciation (depreciation) | | | | | | | | | | | | | | | — | | | | (3,498,225 | ) |
| | | | | | | | | | | | | | | | |
Total Interest Rate Swaps unrealized appreciation (depreciation) | | | | 1,370,754 | | | | (3,498,225 | ) |
| | | | | | | | | | | | | | | | |
Net unrealized appreciation (depreciation) | | | $ | (2,127,471 | ) |
| | | | | | | | | | | | | | | | | | | | |
The accompanying notes are an integral part of these financial statements.
TGB-26
Franklin Templeton Variable Insurance Products Trust
Financial Statements
Statement of Assets and Liabilities
December 31, 2013
| | | | |
| | | Templeton
Global Bond
Securities Fund | |
Assets: | | | | |
Investments in securities: | | | | |
Cost - Unaffiliated issuers | | $ | 2,646,045,357 | |
Cost - Repurchase agreements | | | 362,770,388 | |
| | | | |
Total cost of investments | | $ | 3,008,815,745 | |
| | | | |
Value - Unaffiliated issuers | | $ | 2,737,095,585 | |
Value - Repurchase agreements | | | 362,770,388 | |
| | | | |
Total value of investments | | | 3,099,865,973 | |
Cash | | | 200,014,736 | |
Restricted Cash (Note 1e) | | | 1,130,000 | |
Foreign currency, at value (cost $55,664,573) | | | 55,784,724 | |
Receivables: | | | | |
Capital shares sold | | | 2,159,575 | |
Interest | | | 35,402,500 | |
Due from brokers | | | 15,102,968 | |
Variation margin | | | 235,528 | |
Unrealized appreciation on forward exchange contracts | | | 74,197,203 | |
Other assets | | | 72 | |
| | | | |
Total assets | | | 3,483,893,279 | |
| | | | |
Liabilities: | | | | |
Payables: | | | | |
Capital shares redeemed | | | 2,184,639 | |
Management fees | | | 1,316,004 | |
Distribution fees | | | 1,314,835 | |
Due to brokers | | | 1,130,000 | |
Unrealized depreciation on forward exchange contracts | | | 52,426,649 | |
Unrealized depreciation on OTC swap contracts | | | 3,498,225 | |
Deferred tax | | | 1,660,320 | |
Accrued expenses and other liabilities | | | 1,093,561 | |
| | | | |
Total liabilities | | | 64,624,233 | |
| | | | |
Net assets, at value | | $ | 3,419,269,046 | |
| | | | |
Net assets consist of: | | | | |
Paid-in capital | | $ | 3,209,576,714 | |
Undistributed net investment income | | | 104,975,944 | |
Net unrealized appreciation (depreciation) | | | 109,051,786 | |
Accumulated net realized gain (loss) | | | (4,335,398 | ) |
| | | | |
Net assets, at value | | $ | 3,419,269,046 | |
| | | | |
The accompanying notes are an integral part of these financial statements.
TGB-27
Franklin Templeton Variable Insurance Products Trust
Financial Statements (continued)
Statement of Assets and Liabilities (continued)
December 31, 2013
| | | | |
| | | Templeton
Global Bond
Securities Fund | |
Class 1: | | | | |
Net assets, at value | | $ | 280,962,552 | |
| | | | |
Shares outstanding | | | 14,668,077 | |
| | | | |
Net asset value and maximum offering price per share | | $ | 19.15 | |
| | | | |
Class 2: | | | | |
Net assets, at value | | $ | 2,826,039,424 | |
| | | | |
Shares outstanding | | | 151,940,953 | |
| | | | |
Net asset value and maximum offering price per share | | $ | 18.60 | |
| | | | |
Class 3: | | | | |
Net assets, at value | | $ | 194,121,714 | |
| | | | |
Shares outstanding | | | 10,427,807 | |
| | | | |
Net asset value and maximum offering price per sharea | | $ | 18.62 | |
| | | | |
Class 4: | | | | |
Net assets, at value | | $ | 118,145,356 | |
| | | | |
Shares outstanding | | | 6,229,133 | |
| | | | |
Net asset value and maximum offering price per share | | $ | 18.97 | |
| | | | |
aRedemption price is equal to net asset value less redemption fees retained by the Fund.
The accompanying notes are an integral part of these financial statements.
TGB-28
Franklin Templeton Variable Insurance Products Trust
Financial Statements (continued)
Statement of Operations
for the year ended December 31, 2013
| | | | |
| | | Templeton
Global Bond
Securities Fund | |
Investment income: | | | | |
Interest (net of foreign taxes of $3,046,677) | | $ | 125,459,123 | |
| | | | |
Expenses: | | | | |
Management fees (Note 3a) | | | 15,206,841 | |
Distribution fees: (Note 3c) | | | | |
Class 2 | | | 6,709,408 | |
Class 3 | | | 494,110 | |
Class 4 | | | 512,425 | |
Unaffiliated transfer agent fees | | | 1,833 | |
Custodian fees (Note 4) | | | 1,262,335 | |
Reports to shareholders | | | 460,112 | |
Professional fees | | | 104,376 | |
Trustees’ fees and expenses | | | 13,018 | |
Other | | | 49,965 | |
| | | | |
Total expenses | | | 24,814,423 | |
Expense reductions (Note 4) | | | (3,497 | ) |
| | | | |
Net expenses | | | 24,810,926 | |
| | | | |
Net investment income | | | 100,648,197 | |
| | | | |
Realized and unrealized gains (losses): | | | | |
Net realized gain (loss) from: | | | | |
Investments | | | (4,233,228 | ) |
Foreign currency transactions | | | 52,343,687 | |
Swap contracts | | | (996,665 | ) |
| | | | |
Net realized gain (loss) | | | 47,113,794 | |
| | | | |
Net change in unrealized appreciation (depreciation) on: | | | | |
Investments | | | (91,405,625 | ) |
Translation of other assets and liabilities denominated in foreign currencies | | | (10,160,429 | ) |
Change in deferred taxes on unrealized appreciation | | | 3,057,943 | |
| | | | |
Net change in unrealized appreciation (depreciation) | | | (98,508,111 | ) |
| | | | |
Net realized and unrealized gain (loss) | | | (51,394,317 | ) |
| | | | |
Net increase (decrease) in net assets resulting from operations | | $ | 49,253,880 | |
| | | | |
The accompanying notes are an integral part of these financial statements.
TGB-29
Franklin Templeton Variable Insurance Products Trust
Financial Statements (continued)
Statements of Changes in Net Assets
| | | | | | | | |
| | | Templeton Global Bond
Securities Fund | |
| | | Year Ended December 31, | |
| | | 2013 | | | 2012 | |
| | | | |
Increase (decrease) in net assets: | | | | | | | | |
Operations: | | | | | | | | |
Net investment income | | $ | 100,648,197 | | | $ | 95,705,827 | |
Net realized gain (loss) from investments, foreign currency transactions and swap contracts | | | 47,113,794 | | | | 113,860,368 | |
Net change in unrealized appreciation (depreciation) on investments, translation of other assets and liabilities denominated in foreign currencies and deferred taxes | | | (98,508,111 | ) | | | 173,490,240 | |
| | | | |
Net increase (decrease) in net assets resulting from operations | | | 49,253,880 | | | | 383,056,435 | |
| | | | |
Distributions to shareholders from: | | | | | | | | |
Net investment income and net foreign currency gains: | | | | | | | | |
Class 1 | | | (14,463,879 | ) | | | (18,014,760 | ) |
Class 2 | | | (128,696,606 | ) | | | (133,749,946 | ) |
Class 3 | | | (9,351,774 | ) | | | (12,114,860 | ) |
Class 4 | | | (7,129,387 | ) | | | (9,763,141 | ) |
Net realized gains: | | | | | | | | |
Class 1 | | | (3,587,066 | ) | | | (438,387 | ) |
Class 2 | | | (33,227,731 | ) | | | (3,357,784 | ) |
Class 3 | | | (2,438,218 | ) | | | (306,543 | ) |
Class 4 | | | (1,906,223 | ) | | | (251,144 | ) |
| | | | |
Total distributions to shareholders | | | (200,800,884 | ) | | | (177,996,565 | ) |
| | | | |
Capital share transactions: (Note 2) | | | | | | | | |
Class 1 | | | (13,273,114 | ) | | | 15,415,298 | |
Class 2 | | | 529,969,403 | | | | 448,524,053 | |
Class 3 | | | 4,794,164 | | | | (2,060,465 | ) |
Class 4 | | | (37,369,362 | ) | | | (394,730 | ) |
| | | | |
Total capital share transactions | | | 484,121,091 | | | | 461,484,156 | |
| | | | |
Redemption fees | | | 7,288 | | | | 6,086 | |
| | | | |
Net increase (decrease) in net assets | | | 332,581,375 | | | | 666,550,112 | |
Net assets: | | | | | | | | |
Beginning of year | | | 3,086,687,671 | | | | 2,420,137,559 | |
| | | | |
End of year | | $ | 3,419,269,046 | | | $ | 3,086,687,671 | |
| | | | |
Undistributed net investment income included in net assets: | | | | | | | | |
End of year | | $ | 104,975,944 | | | $ | 114,278,705 | |
| | | | |
The accompanying notes are an integral part of these financial statements.
TGB-30
Franklin Templeton Variable Insurance Products Trust
Notes to Financial Statements
Templeton Global Bond Securities Fund
1. ORGANIZATION AND SIGNIFICANT ACCOUNTING POLICIES
Franklin Templeton Variable Insurance Products Trust (Trust) is registered under the Investment Company Act of 1940, as amended, (1940 Act) as an open-end investment company, consisting of twenty separate funds. The Templeton Global Bond Securities Fund (Fund) is included in this report. The financial statements of the remaining funds in the Trust are presented separately. Shares of the Fund are generally sold only to insurance company separate accounts to fund the benefits of variable life insurance policies or variable annuity contracts. The Fund offers four classes of shares: Class 1, Class 2, Class 3, and Class 4. Each class of shares differs by its distribution fees, voting rights on matters affecting a single class and its exchange privilege.
The following summarizes the Fund’s significant accounting policies.
a. Financial Instrument Valuation
The Fund’s investments in financial instruments are carried at fair value daily. Fair value is the price that would be received to sell an asset or paid to transfer a liability in an orderly transaction between market participants on the measurement date. The Fund calculates the net asset value (NAV) per share at the close of the New York Stock Exchange (NYSE), generally at 4p.m. Eastern time (NYSE close) on each day the NYSE is open for trading. Under procedures approved by the Trust’s Board of Trustees (the Board), the Fund’s administrator, investment manager and other affiliates have formed the Valuation and Liquidity Oversight Committee (VLOC). The VLOC provides administration and oversight of the Fund’s valuation policies and procedures, which are approved annually by the Board. Among other things, these procedures allow the Fund to utilize independent pricing services, quotations from securities and financial instrument dealers, and other market sources to determine fair value.
Debt securities generally trade in the Over-the-counter (OTC) market rather than on a securities exchange. The Fund’s pricing services use multiple valuation techniques to determine fair value. In instances where sufficient market activity exists, the pricing services may utilize a market-based approach through which quotes from market makers are used to determine fair value. In instances where sufficient market activity may not exist or is limited, the pricing services also utilize proprietary valuation models which may consider market characteristics such as benchmark yield curves, credit spreads, estimated default rates, anticipated market interest rate volatility, coupon rates, anticipated timing of principal repayments, underlying collateral, and other unique security features in order to estimate the relevant cash flows, which are then discounted to calculate the fair value. Securities denominated in a foreign currency are converted into their U.S. dollar equivalent at the foreign exchange rate in effect at the NYSE close on the date that the values of the foreign debt securities are determined. Repurchase agreements are valued at cost, which approximates market value.
Derivative financial instruments (derivatives) listed on an exchange are valued at the official closing price of the day. Certain derivatives trade in the OTC market. The Fund’s pricing services use various techniques including industry standard option pricing models and proprietary discounted cash flow models to determine the fair value of those instruments. The Fund’s net benefit or obligation under the derivative contract, as measured by the fair value of the contract, is included in net assets.
The Fund has procedures to determine the fair value of financial instruments for which market prices are not reliable or readily available. Under these procedures, the VLOC convenes on a regular basis to review such financial instruments and considers a number of factors, including significant unobservable valuation inputs, when arriving at fair value. The VLOC primarily employs a market-based approach which may use related or comparable assets or liabilities, recent transactions, market multiples, book values, and other relevant information for the investment to determine the fair value of the investment. An income-based valuation approach may also be used in which the anticipated future cash flows of the investment are discounted to calculate fair value. Discounts may also be applied due to the nature or duration of any restrictions on the disposition of the investments. Due to the inherent uncertainty of valuations of such investments, the fair values may differ significantly from the values that would have been used had an active market existed. The VLOC employs various methods for calibrating these valuation approaches including a regular review of key inputs and assumptions, transactional back-testing or disposition analysis, and reviews of any related market activity.
TGB-31
Franklin Templeton Variable Insurance Products Trust
Notes to Financial Statements (continued)
Templeton Global Bond Securities Fund
1. ORGANIZATION AND SIGNIFICANT ACCOUNTING POLICIES (continued)
b. Foreign Currency Translation
Portfolio securities and other assets and liabilities denominated in foreign currencies are translated into U.S. dollars based on the exchange rate of such currencies against U.S. dollars on the date of valuation. The Fund may enter into foreign currency exchange contracts to facilitate transactions denominated in a foreign currency. Purchases and sales of securities, income and expense items denominated in foreign currencies are translated into U.S. dollars at the exchange rate in effect on the transaction date. Portfolio securities and assets and liabilities denominated in foreign currencies contain risks that those currencies will decline in value relative to the U.S. dollar. Occasionally, events may impact the availability or reliability of foreign exchange rates used to convert the U.S. dollar equivalent value. If such an event occurs, the foreign exchange rate will be valued at fair value using procedures established and approved by the Board.
The Fund does not separately report the effect of changes in foreign exchange rates from changes in market prices on securities held. Such changes are included in net realized and unrealized gain or loss from investments on the Statement of Operations.
Realized foreign exchange gains or losses arise from sales of foreign currencies, currency gains or losses realized between the trade and settlement dates on securities transactions and the difference between the recorded amounts of dividends, interest, and foreign withholding taxes and the U.S. dollar equivalent of the amounts actually received or paid. Net unrealized foreign exchange gains and losses arise from changes in foreign exchange rates on foreign denominated assets and liabilities other than investments in securities held at the end of the reporting period.
c. Joint Repurchase Agreement
The Fund enters into a joint repurchase agreement whereby its uninvested cash balance is deposited into a joint cash account with other funds managed by the investment manager or an affiliate of the investment manager and is used to invest in one or more repurchase agreements. The value and face amount of the joint repurchase agreement are allocated to the funds based on their pro-rata interest. A repurchase agreement is accounted for as a loan by the Fund to the seller, collateralized by securities which are delivered to the Fund’s custodian. The market value, including accrued interest, of the initial collateralization is required to be at least 102% of the dollar amount invested by the funds, with the value of the underlying securities marked to market daily to maintain coverage of at least 100%. Repurchase agreements are subject to the terms of Master Repurchase Agreements (MRAs) with approved counterparties (sellers). The MRAs contain various provisions, including but not limited to events of default and maintenance of collateral for repurchase agreements. In the event of default by either the seller or the Fund, certain MRAs may permit the non-defaulting party to net and close-out all transactions, if any, traded under such agreements. The Fund may sell securities it holds as collateral and apply the proceeds towards the repurchase price and any other amounts owed by the seller to the Fund in the event of default by the seller. This could involve costs or delays in addition to a loss on the securities if their value falls below the repurchase price owed by the seller. The joint repurchase agreement held by the Fund at year end, as indicated in the Statement of Investments, had been entered into on December 31, 2013.
d. Derivative Financial Instruments
The Fund invested in derivatives in order to manage risk or gain exposure to various other investments or markets. Derivatives are financial contracts based on an underlying or notional amount, require no initial investment or an initial net investment that is smaller than would normally be required to have a similar response to changes in market factors, and require or permit net settlement. Derivatives contain various risks including the potential inability of the counterparty to fulfill their obligations under the terms of the contract, the potential for an illiquid secondary market, and/or the potential for market movements which expose the Fund to gains or losses in excess of the amounts shown on the Statement of Assets and Liabilities. Realized gain and loss and unrealized appreciation and depreciation on these contracts for the period are included in the Statement of Operations.
TGB-32
Franklin Templeton Variable Insurance Products Trust
Notes to Financial Statements (continued)
Templeton Global Bond Securities Fund
1. ORGANIZATION AND SIGNIFICANT ACCOUNTING POLICIES (continued)
d. Derivative Financial Instruments (continued)
Derivative counterparty credit risk is managed through a formal evaluation of the creditworthiness of all potential counterparties. The Fund attempts to reduce its exposure to counterparty credit risk on OTC derivatives, whenever possible, by entering into International Swaps and Derivatives Association (ISDA) master agreements with certain counterparties. These agreements contain various provisions, including but not limited to collateral requirements, events of default, or early termination. Termination events applicable to the counterparty include certain deteriorations in the credit quality of the counterparty. Termination events applicable to the Fund include failure of the Fund to maintain certain net asset levels and/or limit the decline in net assets over various periods of time. In the event of default or early termination, the ISDA master agreement gives the non-defaulting party the right to net and close-out all transactions traded, whether or not arising under the ISDA agreement, to one net amount payable by one counterparty to the other. However, absent an event of default or early termination, OTC derivative assets and liabilities are presented gross and not offset in the Statement of Assets and Liabilities. Early termination by the counterparty may result in an immediate payment by the Fund of any net liability owed to that counterparty under the ISDA agreement.
Collateral requirements differ by type of derivative. Collateral or initial margin requirements are set by the broker or exchange clearing house for exchange traded and centrally cleared derivatives. Initial margin deposited is held at the exchange and can be in the form of cash and/or securities. For OTC derivatives traded under an ISDA master agreement, posting of collateral is required by either the fund or the applicable counterparty if the total net exposure of all OTC derivatives with the applicable counterparty exceeds the minimum transfer amount, which typically ranges from $100,000 to $250,000, and can vary depending on the counterparty and the type of the agreement. Generally, collateral is determined at the close of fund business each day and any additional collateral required due to changes in derivative values may be delivered by the fund or the counterparty within a few business days. Collateral pledged and/or received by the fund for OTC derivatives, if any, is held in segregated accounts with the fund’s custodian/counterparty broker and can be in the form of cash and/or securities. Unrestricted cash may be invested according to the Fund’s investment objectives.
The Fund entered into OTC forward exchange contracts primarily to manage and/or gain exposure to certain foreign currencies. A forward exchange contract is an agreement between the Fund and a counterparty to buy or sell a foreign currency at a specific exchange rate on a future date.
The Fund entered into interest rate swap contracts primarily to manage interest rate risk. An interest rate swap is an agreement between the Fund and a counterparty to exchange cash flows based on the difference between two interest rates, applied to a notional amount. These agreements may be privately negotiated in the over-the-counter market (“OTC interest rate swaps”) or may be executed on a registered exchange (“centrally cleared interest rate swaps”). For centrally cleared interest rate swaps, required initial margins are pledged by the Fund, and the daily change in fair value is accounted for as a variation margin payable or receivable on the Statement of Assets and Liabilities. Over the term of the contract, contractually required payments to be paid and to be received are accrued daily and recorded as unrealized depreciation and appreciation until the payments are made, at which time they are realized.
See Note 9 regarding other derivative information.
e. Restricted Cash
At December 31, 2013, the Fund received restricted cash in connection with investments in certain derivative securities. Restricted cash is held in a segregated account with the Fund’s counterparty broker and is reflected in the Statement of Assets and Liabilities.
TGB-33
Franklin Templeton Variable Insurance Products Trust
Notes to Financial Statements (continued)
Templeton Global Bond Securities Fund
1. ORGANIZATION AND SIGNIFICANT ACCOUNTING POLICIES (continued)
f. Income and Deferred Taxes
It is the Fund’s policy to qualify as a regulated investment company under the Internal Revenue Code. The Fund intends to distribute to shareholders substantially all of its taxable income and net realized gains to relieve it from federal income and if applicable, excise taxes. As a result, no provision for U.S. federal income taxes is required.
The Fund may be subject to foreign taxation related to income received, capital gains on the sale of securities and certain foreign currency transactions in the foreign jurisdictions in which it invests. Foreign taxes, if any, are recorded based on the tax regulations and rates that exist in the foreign markets in which the Fund invests. When a capital gain tax is determined to apply the Fund records an estimated deferred tax liability in an amount that would be payable if the securities were disposed of on the valuation date.
The Fund recognizes the tax benefits of uncertain tax positions only when the position is “more likely than not” to be sustained upon examination by the tax authorities based on the technical merits of the tax position. As of December 31, 2013, and for all open tax years, the Fund has determined that no liability for unrecognized tax benefits is required in the Fund’s financial statements related to uncertain tax positions taken on a tax return (or expected to be taken on future tax returns). Open tax years are those that remain subject to examination and are based on each tax jurisdiction statute of limitation.
g. Security Transactions, Investment Income, Expenses and Distributions
Security transactions are accounted for on trade date. Realized gains and losses on security transactions are determined on a specific identification basis. Interest income and estimated expenses are accrued daily. Amortization of premium and accretion of discount on debt securities are included in interest income. Distributions to shareholders are recorded on the ex-dividend date and are determined according to income tax regulations (tax basis). Distributable earnings determined on a tax basis may differ from earnings recorded in accordance with accounting principles generally accepted in the United States of America. These differences may be permanent or temporary. Permanent differences are reclassified among capital accounts to reflect their tax character. These reclassifications have no impact on net assets or the results of operations. Temporary differences are not reclassified, as they may reverse in subsequent periods.
Common expenses incurred by the Trust are allocated among the funds based on the ratio of net assets of each fund to the combined net assets of the Trust. Fund specific expenses are charged directly to the fund that incurred the expense.
Realized and unrealized gains and losses and net investment income, not including class specific expenses, are allocated daily to each class of shares based upon the relative proportion of net assets of each class. Differences in per share distributions, by class, are generally due to differences in class specific expenses.
Inflation-indexed bonds are adjusted for inflation through periodic increases or decreases in the security’s interest accruals, face amount, or principal redemption value, by amounts corresponding to the rate of inflation as measured by an index. Any increase or decrease in the face amount or principal redemption value will be included as interest income on the Statement of Operations.
h. Accounting Estimates
The preparation of financial statements in accordance with accounting principles generally accepted in the United States of America requires management to make estimates and assumptions that affect the reported amounts of assets and liabilities at the date of the financial statements and the amounts of income and expenses during the reporting period. Actual results could differ from those estimates.
TGB-34
Franklin Templeton Variable Insurance Products Trust
Notes to Financial Statements (continued)
Templeton Global Bond Securities Fund
1. ORGANIZATION AND SIGNIFICANT ACCOUNTING POLICIES (continued)
i. Redemption Fees
Redemptions and exchanges of interests in an insurance company subaccount that invests in Class 3 shares of the Fund will be subject to a 1.0% short term trading fee if the interest in the subaccount has been held for less than 60 days. Such fees are retained by the Fund and accounted for as an addition to paid-in capital, allocated to each class of shares based upon the relative proportion of net assets of each class.
j. Guarantees and Indemnifications
Under the Trust’s organizational documents, its officers and trustees are indemnified by the Trust against certain liabilities arising out of the performance of their duties to the Trust. Additionally, in the normal course of business, the Trust, on behalf of the Fund, enters into contracts with service providers that contain general indemnification clauses. The Trust’s maximum exposure under these arrangements is unknown as this would involve future claims that may be made against the Trust that have not yet occurred. Currently, the Trust expects the risk of loss to be remote.
2. SHARES OF BENEFICIAL INTEREST
At December 31, 2013, there were an unlimited number of shares authorized (without par value). Transactions in the Fund’s shares were as follows:
| | | | | | | | | | | | | | | | |
| | | Year Ended December 31, | |
| | | 2013 | | | 2012 | |
| Class 1 Shares: | | Shares | | | Amount | | | Shares | | | Amount | |
Shares sold | | | 1,918,229 | | | $ | 37,822,305 | | | | 2,650,014 | | | $ | 51,366,352 | |
Shares issued in reinvestment of distributions | | | 962,717 | | | | 18,050,945 | | | | 1,028,604 | | | | 18,453,147 | |
Shares redeemed | | | (3,563,965 | ) | | | (69,146,364 | ) | | | (2,823,320 | ) | | | (54,404,201 | ) |
| | | | |
Net increase (decrease) | | | (683,019 | ) | | $ | (13,273,114 | ) | | | 855,298 | | | $ | 15,415,298 | |
| | | | |
Class 2 Shares: | | | | | | | | | | | | | | | | |
Shares sold | | | 34,876,621 | | | $ | 667,964,958 | | | | 28,727,828 | | | $ | 540,675,595 | |
Shares issued in reinvestment of distributions | | | 8,877,431 | | | | 161,924,337 | | | | 7,843,692 | | | | 137,107,730 | |
Shares redeemed | | | (16,008,448 | ) | | | (299,919,892 | ) | | | (12,232,820 | ) | | | (229,259,272 | ) |
| | | | |
Net increase (decrease) | | | 27,745,604 | | | $ | 529,969,403 | | | | 24,338,700 | | | $ | 448,524,053 | |
| | | | |
Class 3 Shares: | | | | | | | | | | | | | | | | |
Shares sold | | | 1,022,231 | | | $ | 19,570,327 | | | | 835,292 | | | $ | 15,856,382 | |
Shares issued in reinvestment of distributions | | | 646,027 | | | | 11,789,991 | | | | 710,200 | | | | 12,421,403 | |
Shares redeemed | | | (1,409,425 | ) | | | (26,566,154 | ) | | | (1,613,494 | ) | | | (30,338,250 | ) |
| | | | |
Net increase (decrease) | | | 258,833 | | | $ | 4,794,164 | | | | (68,002 | ) | | $ | (2,060,465 | ) |
| | | | |
Class 4 Shares: | | | | | | | | | | | | | | | | |
Shares sold | | | 892,452 | | | $ | 17,199,730 | | | | 871,336 | | | $ | 16,701,133 | |
Shares issued on reinvestment of distributions | | | 485,524 | | | | 9,035,611 | | | | 562,284 | | | | 10,014,286 | |
Shares redeemed | | | (3,385,215 | ) | | | (63,604,703 | ) | | | (1,421,448 | ) | | | (27,110,149 | ) |
| | | | |
Net increase (decrease) | | | (2,007,239 | ) | | $ | (37,369,362 | ) | | | 12,172 | | | $ | (394,730 | ) |
| | | | |
TGB-35
Franklin Templeton Variable Insurance Products Trust
Notes to Financial Statements (continued)
Templeton Global Bond Securities Fund
3. TRANSACTIONS WITH AFFILIATES
Franklin Resources, Inc. is the holding company for various subsidiaries that together are referred to as Franklin Templeton Investments. Certain officers and trustees of the Fund are also officers and/or directors of the following subsidiaries:
| | |
| Subsidiary | | Affiliation |
Franklin Advisers, Inc. (Advisers) | | Investment manager |
Franklin Templeton Services, LLC (FT Services) | | Administrative manager |
Franklin Templeton Distributors, Inc. (Distributors) | | Principal underwriter |
Franklin Templeton Investor Services, LLC (Investor Services) | | Transfer agent |
a. Management Fees
The Fund pays an investment management fee to Advisers based on the average daily net assets of the Fund as follows:
| | |
| Annualized Fee Rate | | Net Assets |
| 0.625% | | Up to and including $100 million |
| 0.500% | | Over $100 million, up to and including $250 million |
| 0.450% | | Over $250 million, up to and including $7.5 billion |
| 0.440% | | Over $7.5 billion, up to and including $10 billion |
| 0.430% | | Over $10 billion, up to and including $12.5 billion |
| 0.420% | | Over $12.5 billion, up to and including $15 billion |
| 0.400% | | In excess of $15 billion |
b. Administrative Fees
Under an agreement with Advisers, FT Services provides administrative services to the Fund. The fee is paid by Advisers based on the Fund’s average daily net assets, and is not an additional expense of the Fund.
c. Distribution Fees
The Board has adopted distribution plans for Class 2, Class 3, and Class 4 shares pursuant to Rule 12b-1 under the 1940 Act. Under the Fund’s compensation distribution plans, the Fund pays Distributors for costs incurred in connection with the servicing, sale and distribution of the Fund’s shares up to 0.25%, 0.35%, and 0.35% per year of its average daily net assets of Class 2, Class 3, and Class 4, respectively. Some distribution fees are not charged on shares held by affiliates. The Board has agreed to limit the current rate to 0.25% per year for Class 3. The plan year, for purposes of monitoring compliance with the maximum annual plan rates, is February 1 through January 31.
d. Transfer Agent Fees
Investor Services, under terms of an agreement, performs shareholder servicing for the Fund and is not paid by the Fund for the services.
4. EXPENSE OFFSET ARRANGEMENT
The Fund has entered into an arrangement with its custodian whereby credits realized as a result of uninvested cash balances are used to reduce a portion of the Fund’s custodian expenses. During the year ended December 31, 2013, the custodian fees were reduced as noted in the Statement of Operations.
TGB-36
Franklin Templeton Variable Insurance Products Trust
Notes to Financial Statements (continued)
Templeton Global Bond Securities Fund
5. INCOME TAXES
For tax purposes, capital losses may be carried over to offset future capital gains. At December 31, 2013, the Fund had long-term capital loss carryforwards of $4,268,308.
The tax character of distributions paid during the years ended December 31, 2013 and 2012, was as follows:
| | | | | | | | |
| | | 2013 | | | 2012 | |
Distributions paid from: | | | | | | | | |
Ordinary income | | $ | 159,641,646 | | | $ | 173,642,707 | |
Long term capital gain | | | 41,159,238 | | | | 4,353,858 | |
| | | | |
| | $ | 200,800,884 | | | $ | 177,996,565 | |
| | | | |
At December 31, 2013, the cost of investments, net unrealized appreciation (depreciation) and undistributed ordinary income for income tax purposes were as follows:
| | | | |
Cost of investments | | $ | 3,028,483,990 | |
| | | | |
| |
Unrealized appreciation | | $ | 143,431,341 | |
Unrealized depreciation | | | (72,049,358 | ) |
| | | | |
Net unrealized appreciation (depreciation) | | $ | 71,381,983 | |
| | | | |
Distributable earnings - undistributed ordinary income | | $ | 177,849,072 | |
| | | | |
Differences between income and/or capital gains as determined on a book basis and a tax basis are primarily due to differing treatments of foreign currency transactions, bond discounts and premiums, tax straddles.
6. INVESTMENT TRANSACTIONS
Purchases and sales of investments (excluding short term securities) for the year ended December 31, 2013, aggregated $1,063,004,404 and $826,160,004, respectively.
7. CREDIT RISK
At December 31, 2013, the Fund had 10.46% of its portfolio invested in high yield or other securities rated below investment grade. These securities may be more sensitive to economic conditions causing greater price volatility and are potentially subject to a greater risk of loss due to default than higher rated securities.
8. CONCENTRATION OF RISK
Investing in foreign securities may include certain risks and considerations not typically associated with investing in U.S. securities, such as fluctuating currency values and changing local and regional economic, political and social conditions, which may result in greater market volatility. In addition, certain foreign securities may not be as liquid as U.S. securities.
TGB-37
Franklin Templeton Variable Insurance Products Trust
Notes to Financial Statements (continued)
Templeton Global Bond Securities Fund
9. OTHER DERIVATIVE INFORMATION
At December 31, 2013, the Fund’s investments in derivative contracts are reflected on the Statement of Assets and Liabilities as follows:
| | | | | | | | | | | | |
| | | Asset Derivatives | | | Liability Derivatives | |
Derivative Contracts Not Accounted
for as Hedging Instruments | | Statement of Assets and
Liabilities Location | | Fair
Value
Amount | | | Statement of Assets and
Liabilities Location | | Fair
Value
Amount | |
Interest rate contracts | | Variation margin / Net assets consist of – net unrealized appreciationa | | $ | 1,370,754 | | | Unrealized depreciation on swap contracts / Net assets consist of – net unrealized depreciation | | $ | 3,498,225 | |
Foreign exchange contracts | | Unrealized appreciation on forward exchange contracts / Net assets consist of – net unrealized appreciation | | | 74,197,203 | | | Unrealized depreciation on forward exchange contracts / Net assets consist of – net unrealized depreciation | | | 52,426,649 | |
aIncludes cumulative appreciation (depreciation) of centrally cleared swaps as reported in the Statement of Investments. Only current day’s variation margin is separately reported within the Statement of Assets and Liabilities.
For the year ended December 31, 2013, the effect of derivative contracts on the Fund’s Statement of Operations was as follows:
| | | | | | | | | | |
Derivative Contracts Not Accounted
for as Hedging Instruments | | Statement of Operations Locations | | Realized Gain
(Loss) for the
Year | | | Change in
Unrealized
Appreciation
(Depreciation)
for the
Year | |
Interest rate contracts | | Net realized gain (loss) from swap contracts / Net change in unrealized appreciation (depreciation) on investments | | $ | (996,665 | ) | | $ | 8,336,928 | |
Foreign exchange contracts | | Net realized gain (loss) from foreign currency transactions / Net change in unrealized appreciation (depreciation) on translation of other assets and liabilities denominated in foreign currencies | | | 55,154,098 | | | | (9,671,096 | ) |
At December 31, 2013, the Fund’s OTC derivative assets and liabilities, are as follows:
| | | | | | | | |
| | | Gross and Net Amounts of
Assets and Liabilities Presented
in the Statement of Assets
and Liabilities | |
| | | Assetsa | | | Liabilitiesa | |
Derivatives | | | | | | | | |
Forward Exchange Contracts | | $ | 74,197,203 | | | $ | 52,426,649 | |
Swap Contracts | | | — | | | | 3,498,225 | |
| | | | |
Total | | $ | 74,197,203 | | | $ | 55,924,874 | |
| | | | |
| a | Absent an event of default or early termination, OTC derivative assets and liabilities are presented gross and not offset in the Statement of Assets and Liabilities. |
TGB-38
Franklin Templeton Variable Insurance Products Trust
Notes to Financial Statements (continued)
Templeton Global Bond Securities Fund
9. OTHER DERIVATIVE INFORMATION (continued)
At December 31, 2013, the Fund’s OTC derivative assets which may be offset against the Fund’s OTC derivative liabilities and collateral received from the counterparty, is as follows:
| | | | | | | | | | | | | | | | | | | | |
| | | | | | Amounts Not Offset in the Statement of
Assets and Liabilities | | | | |
| | | Gross and Net
Amounts of Assets
Presented in the
Statement of Assets
and Liabilities | | | Financial
Instruments
Available for
Offset | | | Financial
Instruments
Collateral
Receiveda | | | Cash
Collateral
Received | | | Net
Amount
(Not less
than zero) | |
Counterparty | | | | | | | | | | | | | | | | | | | | |
BZWS | | $ | 9,228,241 | | | $ | (7,879,050 | ) | | $ | — | | | $ | (1,130,000 | ) | | $ | 219,191 | |
CITI | | | 10,476,010 | | | | (5,323,823 | ) | | | (4,651,652 | ) | | | — | | | | 500,535 | |
DBAB | | | 13,615,878 | | | | (13,615,878 | ) | | | — | | | | — | | | | — | |
GSCO | | | 1,834,450 | | | | (1,834,450 | ) | | | — | | | | — | | | | — | |
HSBC | | | 15,523,320 | | | | (4,023,395 | ) | | | (10,901,026 | ) | | | — | | | | 598,899 | |
JPHQ | | | 17,306,073 | | | | (7,652,563 | ) | | | (9,142,201 | ) | | | — | | | | 511,309 | |
MSCO | | | 776,074 | | | | (776,074 | ) | | | — | | | | — | | | | — | |
SCNY | | | 193,431 | | | | (24,393 | ) | | | — | | | | — | | | | 169,038 | |
UBSW | | | 5,243,726 | | | | (3,611,556 | ) | | | (989,024 | ) | | | — | | | | 643,146 | |
| | | | |
Total | | $ | 74,197,203 | | | $ | (44,741,182 | ) | | $ | (25,683,903 | ) | | $ | (1,130,000 | ) | | $ | 2,642,118 | |
| | | | |
| a | At December 31, 2013, the Fund received United Kingdom Treasury Bonds and United States Treasury Notes as collateral for derivatives. |
At December 31, 2013, the Fund’s OTC derivative liabilities which may be offset against the Fund’s OTC derivative assets and collateral pledged to the counterparty, is as follows:
| | | | | | | | | | | | | | | | | | | | |
| | | | | | Amounts Not Offset in the Statement of
Assets and Liabilities | | | | |
| | | Gross and Net
Amounts of Liabilities
Presented in the
Statement of Assets
and Liabilities | | | Financial
Instruments
Available for
Offset | | | Financial
Instruments
Collateral
Pledged | | | Cash
Collateral
Pledgeda | | | Net
Amount
(Not less
than zero) | |
Counterparty | | | | | | | | | | | | | | | | | | | | |
BZWS | | $ | 7,879,050 | | | $ | (7,879,050 | ) | | $ | — | | | $ | — | | | $ | — | |
CITI | | | 5,323,823 | | | | (5,323,823 | ) | | | — | | | | — | | | | — | |
DBAB | | | 18,018,700 | | | | (13,615,878 | ) | | | — | | | | (4,402,822 | ) | | | — | |
GSCO | | | 5,102,598 | | | | (1,834,450 | ) | | | — | | | | (3,080,000 | ) | | | 188,148 | |
HSBC | | | 4,023,395 | | | | (4,023,395 | ) | | | — | | | | — | | | | — | |
JPHQ | | | 7,652,563 | | | | (7,652,563 | ) | | | — | | | | — | | | | — | |
MSCO | | | 4,288,796 | | | | (776,074 | ) | | | — | | | | (3,512,722 | ) | | | — | |
SCNY | | | 24,393 | | | | (24,393 | ) | | | — | | | | — | | | | — | |
UBSW | | | 3,611,556 | | | | (3,611,556 | ) | | | — | | | | — | | | | — | |
| | | | |
Total | | $ | 55,924,874 | | | $ | (44,741,182 | ) | | $ | — | | | $ | (10,995,544 | ) | | $ | 188,148 | |
| | | | |
| a | In some instances, the collateral amounts disclosed in the table above were adjusted due to the requirement to limit the collateral amounts to avoid the effect of overcollateralization. Actual collateral received and/or pledged may be more than the amounts disclosed herein. |
TGB-39
Franklin Templeton Variable Insurance Products Trust
Notes to Financial Statements (continued)
Templeton Global Bond Securities Fund
9. OTHER DERIVATIVE INFORMATION (continued)
For the year ended December 31, 2013, the average month end fair value of derivatives represented 3.58% of average month end net assets. The average month end number of open derivative contracts for the year was 454.
See Note 1(d) regarding derivative financial instruments.
10. CREDIT FACILITY
The Fund, together with other U.S. registered and foreign investment funds (collectively, Borrowers), managed by Franklin Templeton Investments, are borrowers in a joint syndicated senior unsecured credit facility totaling $1.5 billion (Global Credit Facility) which, after an extension of the original terms, matured on February 14, 2014. This Global Credit Facility provides a source of funds to the Borrowers for temporary and emergency purposes, including the ability to meet future unanticipated or unusually large redemption requests. Effective February 14, 2014, the Borrowers renewed the Global Credit Facility which matures on February 13, 2015.
Under the terms of the Global Credit Facility, the Fund shall, in addition to interest charged on any borrowings made by the Fund and other costs incurred by the Fund, pay its share of fees and expenses incurred in connection with the implementation and maintenance of the Global Credit Facility, based upon its relative share of the aggregate net assets of all of the Borrowers, including an annual commitment fee of 0.07% based upon the unused portion of the Global Credit Facility. These fees are reflected in other expenses on the Statement of Operations. During the year ended December 31, 2013, the Fund did not use the Global Credit Facility.
11. FAIR VALUE MEASUREMENTS
The Fund follows a fair value hierarchy that distinguishes between market data obtained from independent sources (observable inputs) and the Fund’s own market assumptions (unobservable inputs). These inputs are used in determining the value of the Fund’s financial instruments and are summarized in the following fair value hierarchy:
| | • | | Level 1 – quoted prices in active markets for identical financial instruments |
| | • | | Level 2 – other significant observable inputs (including quoted prices for similar financial instruments, interest rates, prepayment speed, credit risk, etc.) |
| | • | | Level 3 – significant unobservable inputs (including the Fund’s own assumptions in determining the fair value of financial instruments) |
The input levels are not necessarily an indication of the risk or liquidity associated with financial instruments at that level.
For movements between the levels within the fair value hierarchy, the Fund has adopted a policy of recognizing the transfers as of the date of the underlying event which caused the movement.
TGB-40
Franklin Templeton Variable Insurance Products Trust
Notes to Financial Statements (continued)
Templeton Global Bond Securities Fund
11. FAIR VALUE MEASUREMENTS (continued)
A summary of inputs used as of December 31, 2013, in valuing the Fund’s assets and liabilities carried at fair value, is as follows:
| | | | | | | | | | | | | | | | |
| | | Level 1 | | | Level 2 | | | Level 3 | | | Total | |
| | | | |
Assets: | | | | | | | | | | | | | | | | |
Investments in Securities: | | | | | | | | | | | | | | | | |
Foreign Government and Agency Securities | | $ | — | | | $ | 2,244,885,649 | | | $ | — | | | $ | 2,244,885,649 | |
Municipal Bonds | | | — | | | | 1,510,654 | | | | — | | | | 1,510,654 | |
Short Term Investments | | | — | | | | 853,469,670 | | | | — | | | | 853,469,670 | |
| | | | |
Total Investments in Securities | | $ | — | | | $ | 3,099,865,973 | | | $ | — | | | $ | 3,099,865,973 | |
| | | | |
Forward Exchange Contracts | | | — | | | | 74,197,203 | | | | — | | | | 74,197,203 | |
Swaps | | | — | | | | 1,370,754 | | | | — | | | | 1,370,754 | |
Liabilities: | | | | | | | | | | | | | | | | |
Forward Exchange Contracts | | | — | | | | 52,426,649 | | | | — | | | | 52,426,649 | |
Swaps | | | — | | | | 3,498,225 | | | | — | | | | 3,498,225 | |
12. NEW ACCOUNTING PRONOUNCEMENTS
In June 2013, the Financial Accounting Standards Board issued Accounting Standards Update (ASU) No. 2013-08, Investment Companies (Topic 946): Amendments to the Scope, Measurement, and Disclosure Requirements. The ASU modifies the criteria used in defining an investment company under U.S. Generally Accepted Accounting Principles and also sets forth certain measurement and disclosure requirements. Under the ASU, an entity that is registered under the 1940 Act automatically qualifies as an investment company. The ASU is effective for interim and annual reporting periods beginning after December 15, 2013. Management has reviewed the requirements and believe the adoption of this ASU will not have a material impact on the financial statements.
13. SUBSEQUENT EVENTS
The Fund has evaluated subsequent events through the issuance of the financial statements and determined that no events have occurred that require disclosure other than those already disclosed in the financial statements.
| | | | |
ABBREVIATIONS | | | | |
| Counterparty | | Currency | | Selected Portfolio |
| | | | |
| BZWS - Barclays Bank PLC | | BRL - Brazilian Real | | BHAC - Berkshire Hathaway Assurance Corp. |
| CITI - Citigroup, Inc. | | CAD - Canadian Dollar | | FRN - Floating Rate Note |
| DBAB - Deutsche Bank AG | | EUR - Euro | | |
| GSCO - Goldman Sachs Bank | | HUF - Hungarian Forint | | |
| HSBC - HSBC Bank USA, N.A. | | IDR - Indonesian Rupiah | | |
| JPHQ - JPMorgan Chase & Co. | | KRW - South Korean Won | | |
| MSCO - Morgan Stanley | | LKR - Sri Lankan Rupee | | |
| SCNY - Standard Chartered Bank | | MXN - Mexican Peso | | |
| UBSW - UBS AG | | MYR - Malaysian Ringgit | | |
| | PEN - Peruvian Nuevo Sol | | |
| | PHP - Philippine Peso | | |
| | PLN - Polish Zloty | | |
| | SEK - Swedish Krona | | |
| | SGD - Singapore Dollar | | |
TGB-41
Franklin Templeton Variable Insurance Products Trust
Templeton Global Bond Securities Fund
Report of Independent Registered Public Accounting Firm
To the Board of Trustees and Shareholders of
Franklin Templeton Variable Insurance Products Trust
In our opinion, the accompanying statement of assets and liabilities, including the statement of investments, and the related statements of operations and of changes in net assets and the financial highlights present fairly, in all material respects, the financial position of The Templeton Global Bond Securities Fund (the “Fund”) at December 31, 2013, the results of its operations for the year then ended, the changes in its net assets for each of the two years in the period then ended and the financial highlights for each of the five years in the period then ended, in conformity with accounting principles generally accepted in the United States of America. These financial statements and financial highlights (hereafter referred to as “financial statements”) are the responsibility of the Fund’s management. Our responsibility is to express an opinion on these financial statements based on our audits. We conducted our audits of these financial statements in accordance with the standards of the Public Company Accounting Oversight Board (United States). Those standards require that we plan and perform the audit to obtain reasonable assurance about whether the financial statements are free of material misstatement. An audit includes examining, on a test basis, evidence supporting the amounts and disclosures in the financial statements, assessing the accounting principles used and significant estimates made by management, and evaluating the overall financial statement presentation. We believe that our audits, which included confirmation of securities at December 31, 2013 by correspondence with the custodian, transfer agent and brokers, provide a reasonable basis for our opinion.
PricewaterhouseCoopers LLP
San Francisco, California
February 14, 2014
TGB-42
Franklin Templeton Variable Insurance Products Trust
Tax Information (unaudited)
Templeton Global Bond Securities Fund
Under Section 852(b)(3)(C) of the Internal Revenue Code (Code), the Fund hereby reports the maximum amount allowable but no less than $41,159,238 as a long term capital gain dividend for the fiscal year ended December 31, 2013.
At December 31, 2013, more than 50% of the Fund’s total assets were invested in securities of foreign issuers. In most instances, foreign taxes were withheld from income paid to the Fund on these investments. The Fund elects to treat foreign taxes paid as allowed under Section 853 of the Code. This election will allow shareholders of record as of the 2014 distribution date, to treat their proportionate share of foreign taxes paid by the Fund as having been paid directly by them. The shareholder shall consider these amounts as foreign taxes paid in the tax year in which they receive the Fund distribution.
TGB-43
TEMPLETON GROWTH SECURITIES FUND
We are pleased to bring you Templeton Growth Securities Fund’s annual report for the fiscal year ended December 31, 2013.
Performance Summary as of 12/31/13
Average annual total return of Class 4 shares* represents the average annual change in value, assuming reinvestment of dividends and capital gains. Average returns smooth out variations in returns, which can be significant; they are not the same as year-by-year results.
Periods ended 12/31/13
| | | | | | | | | | | | |
| | | 1-Year | | | 5-Year | | | 10-Year | |
Average Annual Total Return | | | +30.64% | | | | +15.59% | | | | +6.57% | |
*For the period beginning 2/29/08, Class 4 performance reflects a 12b-1 fee expense of 0.35% per year, which affects future performance. Class 4 performance prior to 2/29/08 reflects historical Class 1 performance, which does not have a 12b-1fee expense. Since 2/29/08 (effective date), the average annual total return of Class 4 shares was +4.94%.
Total Return Index Comparison
for a Hypothetical $10,000 Investment (1/1/04–12/31/13)
The graph below shows the change in value of a hypothetical $10,000 investment in the Fund over the indicated period and includes reinvestment of any income or distributions. The Fund’s performance* is compared to the performance of the MSCI World Index and the MSCI All Country World Index (ACWI). One cannot invest directly in an index, and an index is not representative of the Fund’s portfolio. Please see Important Notes to Performance Information preceding the Fund Summaries.
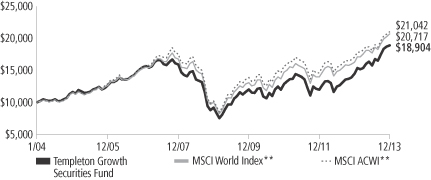
**Source: © 2014 Morningstar. Please see Index Descriptions following the Fund Summaries.
Templeton Growth Securities Fund – Class 4
Performance reflects the Fund’s Class 4 operating expenses, but does not include any contract fees, expenses or sales charges. If they had been included, performance would be lower. These charges and deductions, particularly for variable life policies, can have a significant effect on contract values and insurance benefits. See the contract prospectus for a complete description of these expenses, including sales charges.
Performance data represent past performance, which does not guarantee future results. Investment return and principal value will fluctuate, and you may have a gain or loss when you sell your shares.
Current performance may differ from figures shown.
TG-1
Fund Goal and Main Investments: Templeton Growth Securities Fund seeks long-term capital growth. Under normal market conditions, the Fund invests predominantly in equity securities of companies located anywhere in the world, including those in the U.S. and in emerging markets.
Performance Overview
You can find the Fund’s one-year total return in the Performance Summary. For comparison, the Fund’s benchmarks, the MSCI ACWI and the MSCI World Index, had total returns of +23.44% and +27.36% for the period under review.1
Economic and Market Overview
The 12 months under review were characterized by reinvigorated policy support and an economic recovery in developed markets. However, differences in global economic trends corresponded with increasingly divergent monetary policies, and growth in emerging market economies tended to slow. The central banks of key developed markets generally reaffirmed their accommodative monetary stances while some emerging market counterparts tightened policy rates as they sought to control inflation and currency depreciation.
In the U.S., economic growth and employment trends generally exceeded expectations. The U.S. Federal Reserve Board (Fed) expanded its asset purchase program to $85 billion per month from $40 billion early in the year. After encouraging economic and employment reports, the Fed announced in December it would reduce its monthly bond purchases by $10 billion beginning in January 2014; however, the Fed committed to keeping interest rates low. In October, the federal government temporarily shut down after Congress failed to authorize routine federal funding amid a disagreement over a new health care law. However, Congress subsequently agreed to fund the government through early 2014 and later passed a two-year budget deal that could ease automatic spending cuts and lower the risk of another shutdown.
Outside the U.S., the eurozone emerged from its longest recession on record during 2013’s second half and Japan’s growth moderated. The European Central Bank reduced its policy rate to a record low and pledged to maintain systemic support following political turmoil in Greece, Spain, Portugal and Italy. Germany’s re-election of Chancellor
1. Source: © 2014 Morningstar. One cannot invest directly in an index, and an index is not representative of the Fund’s portfolio. Please see Index Descriptions following the Fund Summaries.
Fund Risks: All investments involve risks, including possible loss of principal. Special risks are associated with foreign investing, including currency fluctuations, economic instability and political developments; investments in emerging markets involve heightened risks related to the same factors. To the extent that the Fund focuses on particular countries, regions, industries, sectors or types of investment from time to time, it may be subject to greater risks of adverse developments in such areas of focus than a fund that invests in a wider variety of countries, regions, industries, sectors or investments. Current political uncertainty surrounding the European Union (EU) and its membership may increase market volatility. The financial instability of some countries in the EU, including Greece, Italy and Spain, together with the risk of that impacting other more stable countries, may increase the economic risk of investing in companies in Europe. The Fund is actively managed but there is no guarantee that the manager’s investment decisions will produce the desired results. The Fund’s prospectus also includes a description of the main investment risks.
TG-2
Angela Merkel was largely perceived as a vote of support for ongoing eurozone reform measures. In Asia, the Bank of Japan set an explicit inflation target and pledged to double bond purchases in an unprecedented wave of policy reform. The U.S. dollar fell versus the euro but rose versus the Japanese yen in 2013.
Growth in many emerging markets moderated based on lower domestic demand, falling exports and weakening commodity prices. Political turmoil in certain emerging markets, the Fed’s potential tapering of its asset purchase program and the Chinese central bank’s effort to tighten liquidity to curb real estate and credit speculation led to a sell-off in emerging market equities and a sharp depreciation in regional currencies against the U.S. dollar. Central banks in Brazil, India and Indonesia raised interest rates in the second half of 2013 as they sought to curb inflation.
The stock market rally in developed markets accelerated during 2013 amid redoubled central bank commitments, continued corporate earnings strength and increasing signs of economic progress. Emerging market stocks rebounded toward period-end, although Latin American stocks trailed their emerging market peers. Oil prices rallied in the third quarter and rose for the year mainly owing to supply concerns related to geopolitical turmoil, but gold posted its largest annual price decline in more than three decades. Increasingly divergent economic and political circumstances during the period resulted in declining market correlations, which many bottom-up investors perceived as more favorable.
Investment Strategy
Our investment philosophy is bottom up, value oriented and long term. In choosing investments, we will focus on the market price of a company’s securities relative to our evaluation of the company’s potential long-term earnings, asset value and cash flow. Among factors we may consider are a company’s historical value measures, including price/earnings ratio, profit margins and liquidation value. We do in-depth research to construct a bargain list from which we buy.
Manager’s Discussion
The year 2013 brought progress to financial markets and the global economy as stabilization for key financial institutions and declining equity correlations allowed investors to refocus on fundamentals, benefiting bottom-up stock pickers like us.
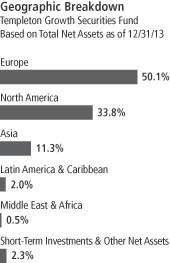
TG-3
All of the Fund’s major stock sectors and most regional positions delivered double-digit returns. The Fund performed better than its benchmarks during the review period. Encouragingly for us as bottom-up investors, stock selection helped drive performance relative to the MSCI ACWI as market conditions seemed to us to permit value recognition at the stock level following a prolonged period of high stock correlations. Also encouraging to us was the fact that many of the Fund’s highest conviction, long-term holdings aided results.
Financials was a top sector contributor, particularly in Europe, where in recent years we acquired positions in out-of-favor banks and insurers amid extreme investor pessimism.2 For example, French insurer AXA was a leading contributor as its share price reached a post-financial crisis high. In our view, AXA management’s focus on margin expansion helped drive cash flow improvements and kept the company on track to meet operating targets. AXA managed its balance sheet and peripheral debt exposure well during the financial crisis and recently benefited from robust earnings momentum created during that uncertain economic environment. Although our European financials stocks rallied from historically low valuations, they continued to trade at significant discounts to their global peers and the broader European market. To us, European financials offered further upside potential as restructuring continued amid an improving economic outlook. Our financials positions also included well-capitalized U.S. and Asian banks with what we viewed as competitive advantages across domestic and international markets.
Economically sensitive industrials holdings also benefited from strategic initiatives and a stabilizing global economy.3 European airlines were leading sector contributors, including International Consolidated Airlines Group (IAG). The U.K.-based airline conglomerate’s share price reached a six-year high and earnings rose as the parent company of British Airways cut costs, rationalized capacity and benefited from recovering air passenger traffic. We believe IAG made significant strides in improving labor relations at its Iberia unit, in completing the acquisition of profitable, low-cost airline Vueling, and in meeting its medium-term operating targets. Although we remained optimistic given the stock’s discount to our projection of IAG’s long-term business value, we
2. The financials sector comprises capital markets, commercial banks, consumer finance, diversified financial services and insurance in the SOI.
3. The industrials sector comprises aerospace and defense, air freight and logistics, airlines, commercial services and supplies, construction and engineering, electrical equipment, industrial conglomerates, machinery, professional services, and trading companies and distributors in the SOI.
TG-4
reduced exposure to realize significant gains after the stock price doubled in value in 2013. Dutch staffing firm Randstad Holding, another top industrials sector holding, rallied after strong operating results attested to many investors the company’s ability to preserve profitability despite continued labor market tightness.
Health care was a long-standing overweighting that bolstered relative performance, led by Swiss biotechnology specialist Roche Holding.4 Roche’s share price rose to a record level after the company reported higher oncology sales, and we think investors appeared to recognize the depth we see in Roche’s product pipeline. In our opinion, shares remained undervalued given Roche’s stable outlook, rising margins and strong free cash-flow generation. The company returned much of the cash flow to shareholders as dividends. We continued to find a number of biotechnology stocks like Roche with what we viewed as undervalued growth prospects to complement our more mature pharmaceuticals holdings. In our view, major pharmaceuticals firms still offered opportunities, but have become more fully valued in recent quarters; consistent with our investment thesis in the sector, cost cutting, productivity improvements and strategic mergers and acquisitions have helped big pharmaceutical firms survive the much-feared patent cliffs.
Below-benchmark allocations and stock selection in the materials and consumer staples sectors also contributed to relative performance.5 Our caution in the sectors was rewarded as what we viewed as expensive materials stocks with dubious fundamentals and consumer staples stocks facing margin pressures trailed broader market gains. We found what we believe to be more attractive opportunities in the consumer discretionary sector as concerns tempered consumer spending expectations.6 In our view, this uncertainty allowed us to buy valuable brands at discounted prices. Japanese automaker Mazda Motor was a leading sector performer as its share price rose to its highest level since 2009 after yen weakness boosted sales, helping the firm earn its first annual profit in five years. Elsewhere in the sector, we continued to incrementally reduce exposure as what we viewed as lofty valuations allowed us to realize gains on certain contrarian investments made during periods of extreme economic pessimism.
4. The health care sector comprises biotechnology, life sciences tools and services, and pharmaceuticals in the SOI.
5. The materials sector comprises chemicals, construction materials, and metals and mining in the SOI. The consumer staples sector comprises food and staples retailing in the SOI.
6. The consumer discretionary sector comprises auto components, automobiles, media, multiline retail and specialty retail in the SOI.
TG-5
The Fund’s information technology (IT) and telecommunication services holdings supported relative performance.7 In the IT sector, U.S. PC manufacturer Hewlett-Packard’s shares rallied as restructuring initiatives began to positively impact operating results. In contrast, South Korean semiconductor and consumer electronics manufacturer Samsung Electronics was a major detractor, declining amid currency depreciation and concerns about the sustainability of handset margins. We continued to hold Samsung despite weak stock performance during the period. Based on our analysis, the company had a reasonable valuation, self-funding cash position and market leadership across highly profitable business lines. In telecommunication services, U.K. mobile telephone operator Vodafone Group’s share price surged after the company divested its stake in U.S. wireless firm Verizon Wireless for $130 billion. However, Turkish mobile telephone operator Turkcell Iletisim Hizmetleri notably detracted from performance as a shareholder dispute and regional political turmoil weighed on the stock. Tuckcell’s valuation remained very attractive to us and we identified potential value catalysts, including a more rational Turkish pricing environment and the potential for Turkcell to deploy cash to increase dividends once the shareholder dispute is resolved.
Although stock selection for energy stocks drove sector performance, Brazilian oil multinational Petroleo Brasileiro’s (Petrobras) share price retreated after the Brazilian government failed to specify details for phasing out a domestic fuel subsidy that has weighed on earnings and increased debt at the state-controlled company.8 We continued to view the price subsidy as a temporary headwind and believed that Petrobras neared an inflection point at which the value of its significant exploration and production assets might finally be unlocked. More broadly, our analysis indicated depressed energy sector valuations might understate the long-term cash-flow and shareholder return potential of oil companies with falling capital expenditures and improving production prospects. In addition to finding certain major oil companies, we found what we believed were attractively valued opportunities among oil services firms that could benefit from increased shale gas activity and an improving supply-and-demand balance in major pressure-pumping markets.
7. The IT sector comprises communications equipment; computers and peripherals; electronic equipment, instruments and components; semiconductors and semiconductor equipment; and software in the SOI. The telecommunication services sector comprises diversified telecommunication services and wireless telecommunication services in the SOI.
8. The energy sector comprises energy equipment and services; and oil, gas and consumable fuels in the SOI.
Top 10 Holdings
Templeton Growth Securities Fund
12/31/13
| | | | |
Company
Sector/Industry,
Country | | % of Total
Net Assets | |
| Microsoft Corp. | | | 1.9% | |
| Software, U.S. | | | | |
| Samsung Electronics Co. Ltd. | | | 1.9% | |
| Semiconductors & Semiconductor Equipment, South Korea | | | | |
| Citigroup Inc. | | | 1.9% | |
| Diversified Financial Services, U.S. | | | | |
| BNP Paribas SA | | | 1.8% | |
| Commercial Banks, France | | | | |
| Total SA, B | | | 1.8% | |
Oil, Gas & Consumable Fuels,
France | |
| Sanofi | | | 1.7% | |
| Pharmaceuticals, France | | | | |
| Baker Hughes Inc. | | | 1.7% | |
| Energy Equipment & Services, U.S. | | | | |
| Roche Holding AG | | | 1.7% | |
| Pharmaceuticals, Switzerland | | | | |
| Deutsche Lufthansa AG | | | 1.6% | |
| Airlines, Germany | | | | |
| Pfizer Inc. | | | 1.6% | |
| Pharmaceuticals, U.S. | | | | |
The dollar value, number of shares or principal amount, and names of all portfolio holdings are listed in the Fund’s Statement of Investments (SOI).
TG-6
From a regional standpoint, stock selection in Europe helped drive performance. We identified many of our European investments during periods of deep pessimism, and we believe our valuation discipline during the European debt crisis served the Fund well. Fundamental improvements we previously anticipated came to fruition during the review period. With valuations still selectively attractive to us, we believe further upside potential exists. From our perspective, policymakers remained committed to growth and stability, fiscal tightening lessened and the ECB’s balance sheet returned to near pre-crisis levels, attesting to the continued normalization of financial conditions. Rising domestic demand, improving competitiveness and a current account surplus in peripheral countries helped the eurozone exit its worst recession on record. Even after these notable improvements, eurozone companies overall traded at a material discount relative to their historical valuation average and U.S. peers. Profit margins also remained significantly below those of many U.S. companies, although operating leverage in Europe is considerably greater, further enhancing the potential positive impact of revenue recovery on European corporate profitability. Although the Fund’s U.S. holdings contributed to performance, the Fund’s underweighting in the U.S. weighed on relative results.
Although considerable risks remained, European companies with globally diversified revenues remained attractive to us as earnings recover over the long term. We had less geographical conviction outside of Europe as regions progressed with reform and recovery at different levels. In our view, this healthy divergence of global economic and financial conditions, combined with a more even overall valuation environment, could continue to favor discerning investors capable of uncovering individual values at the bottom-up level.
Thank you for your participation in Templeton Growth Securities Fund. We look forward to serving your future investment needs.
The foregoing information reflects our analysis, opinions and portfolio holdings as of December 31, 2013, the end of the reporting period. The way we implement our main investment strategies and the resulting portfolio holdings may change depending on factors such as market and economic conditions. These opinions may not be relied upon as investment advice or an offer for a particular security. The information is not a complete analysis of every aspect of any market, country, industry, security or the Fund. Statements of fact are from sources considered reliable, but the investment manager makes no representation or warranty as to their completeness or accuracy. Although historical performance is no guarantee of future results, these insights may help you understand our investment management philosophy.
TG-7
Fund Expenses
As an investor in a variable insurance contract (Contract) that indirectly provides for investment in an underlying mutual fund, you can incur transaction and/or ongoing expenses at both the Fund level and the Contract level.
| • | | Transaction expenses can include sales charges (loads) on purchases, redemption fees, surrender fees, transfer fees and premium taxes. |
| • | | Ongoing expenses can include management fees, distribution and service (12b-1) fees, contract fees, annual maintenance fees, mortality and expense risk fees and other fees and expenses. All mutual funds and Contracts have some types of ongoing expenses. |
The expenses shown in the table are meant to highlight ongoing expenses at the Fund level only and do not include ongoing expenses at the Contract level, or transaction expenses at either the Fund or Contract level. While the Fund does not have transaction expenses, if the transaction and ongoing expenses at the Contract level were included, the expenses shown below would be higher. You should consult your Contract prospectus or disclosure document for more information.
The table shows Fund-level ongoing expenses and can help you understand these expenses and compare them with those of other mutual funds offered through the Contract. The table assumes a $1,000 investment held for the six months indicated. Please refer to the Fund prospectus for additional information on operating expenses.
Actual Fund Expenses
The first line (Actual) of the table provides actual account values and expenses. The “Ending Account Value” is derived from the Fund’s actual return, which includes the effect of ongoing Fund expenses, but does not include the effect of ongoing Contract expenses.
You can estimate the Fund-level expenses you incurred during the period by following these steps. Of course, your account value and expenses will differ from those in this illustration:
| 1. | Divide your account value by $1,000. |
If an account had an $8,600 value, then $8,600 ÷ $1,000 = 8.6.
| 2. | Multiply the result by the number under the heading “Fund-Level Expenses Incurred During Period.” |
If Fund-Level Expenses Incurred During Period were $7.50, then 8.6 x $7.50 = $64.50.
In this illustration, the estimated expenses incurred this period at the Fund level are $64.50.
Templeton Growth Securities Fund – Class 4
TG-8
Hypothetical Example for Comparison with Other Mutual Funds
Information in the second line (Hypothetical) of the table can help you compare ongoing expenses of the Fund with those of other mutual funds offered through the Contract. This information may not be used to estimate the actual ending account balance or expenses you incurred during the period. The hypothetical “Ending Account Value” is based on the Fund’s actual expense ratio and an assumed 5% annual rate of return before expenses, which does not represent the Fund’s actual return. The figure under the heading “Fund-Level Expenses Incurred During Period” shows the hypothetical expenses your account would have incurred under this scenario. You can compare this figure with the 5% hypothetical examples that appear in shareholder reports of other funds offered through a Contract.
| | | | | | | | | | | | |
| Class 4 | | Beginning
Account
Value 7/1/13 | | | Ending
Account
Value 12/31/13 | | | Fund-Level
Expenses Incurred
During Period*
7/1/13–12/31/13 | |
Actual | | $ | 1,000 | | | $ | 1,199.20 | | | $ | 6.26 | |
Hypothetical (5% return
before expenses) | | $ | 1,000 | | | $ | 1,019.51 | | | $ | 5.75 | |
*Expenses are calculated using the most recent six-month annualized expense ratio for the Fund’s Class 4 shares (1.13%), which does not include any ongoing expenses of the Contract for which the Fund is an investment option, multiplied by the average account value over the period, multiplied by 184/365 to reflect the one-half year period.
TG-9
Franklin Templeton Variable Insurance Products Trust
Financial Highlights
Templeton Growth Securities Fund
| | | | | | | | | | | | | | | | | | | | |
| | | Year Ended December 31, | |
| Class 1 | | 2013 | | | 2012 | | | 2011 | | | 2010 | | | 2009 | |
| | | | |
Per share operating performance | | | | | | | | | | | | | | | | | | | | |
(for a share outstanding throughout the year) | | | | | | | | | | | | | | | | | | | | |
Net asset value, beginning of year | | $ | 12.16 | | | $ | 10.27 | | | $ | 11.19 | | | $ | 10.56 | | | $ | 8.34 | |
| | | | |
Income from investment operationsa: | | | | | | | | | | | | | | | | | | | | |
Net investment incomeb | | | 0.22 | | | | 0.27 | | | | 0.25 | | | | 0.17 | | | | 0.17 | |
Net realized and unrealized gains (losses) | | | 3.49 | | | | 1.88 | | | | (0.99 | ) | | | 0.62 | | | | 2.36 | |
| | | | |
Total from investment operations | | | 3.71 | | | | 2.15 | | | | (0.74 | ) | | | 0.79 | | | | 2.53 | |
| | | | |
Less distributions from net investment income | | | (0.40 | ) | | | (0.26 | ) | | | (0.18 | ) | | | (0.16 | ) | | | (0.31 | ) |
| | | | |
Net asset value, end of year | | $ | 15.47 | | | $ | 12.16 | | | $ | 10.27 | | | $ | 11.19 | | | $ | 10.56 | |
| | | | |
| | | | | |
Total returnc | | | 31.05% | | | | 21.40% | | | | (6.80)% | | | | 7.74% | | | | 31.33% | |
Ratios to average net assets | | | | | | | | | | | | | | | | | | | | |
Expensesd | | | 0.78% | | | | 0.78% | | | | 0.78% | | | | 0.77% | | | | 0.79% | |
Net investment income | | | 1.62% | | | | 2.31% | | | | 2.22% | | | | 1.71% | | | | 2.00% | |
| | | | | |
Supplemental data | | | | | | | | | | | | | | | | | | | | |
Net assets, end of year (000’s) | | $ | 588,409 | | | $ | 476,954 | | | $ | 1,200,682 | | | $ | 1,348,622 | | | $ | 824,575 | |
Portfolio turnover rate | | | 11.60% | | | | 18.73% | e | | | 42.13% | e | | | 9.61% | | | | 14.95% | |
aThe amount shown for a share outstanding throughout the period may not correlate with the Statement of Operations for the period due to the timing of sales and repurchases of the Fund shares in relation to income earned and/or fluctuating market value of the investments of the Fund.
bBased on average daily shares outstanding.
cTotal return does not include fees, charges or expenses imposed by the variable annuity and life insurance contracts for which the Franklin Templeton Variable Insurance Products Trust serves as an underlying investment vehicle.
dBenefit of expense reduction rounds to less than 0.01%.
eExcludes the value of portfolio securities delivered as a result of a redemption in-kind.
The accompanying notes are an integral part of these financial statements.
TG-10
Franklin Templeton Variable Insurance Products Trust
Financial Highlights (continued)
Templeton Growth Securities Fund
| | | | | | | | | | | | | | | | | | | | |
| | | Year Ended December 31, | |
| Class 2 | | 2013 | | | 2012 | | | 2011 | | | 2010 | | | 2009 | |
| | | | |
Per share operating performance | | | | | | | | | | | | | | | | | | | | |
(for a share outstanding throughout the year) | | | | | | | | | | | | | | | | | | | | |
Net asset value, beginning of year | | $ | 11.97 | | | $ | 10.11 | | | $ | 11.01 | | | $ | 10.40 | | | $ | 8.20 | |
| | | | |
Income from investment operationsa: | | | | | | | | | | | | | | | | | | | | |
Net investment incomeb | | | 0.19 | | | | 0.21 | | | | 0.21 | | | | 0.15 | | | | 0.16 | |
Net realized and unrealized gains (losses) | | | 3.44 | | | | 1.88 | | | | (0.96 | ) | | | 0.60 | | | | 2.32 | |
| | | | |
Total from investment operations | | | 3.63 | | | | 2.09 | | | | (0.75 | ) | | | 0.75 | | | | 2.48 | |
| | | | |
Less distributions from net investment income | | | (0.37 | ) | | | (0.23 | ) | | | (0.15 | ) | | | (0.14 | ) | | | (0.28 | ) |
| | | | |
Net asset value, end of year | | $ | 15.23 | | | $ | 11.97 | | | $ | 10.11 | | | $ | 11.01 | | | $ | 10.40 | |
| | | | |
| | | | | |
Total returnc | | | 30.82% | | | | 21.07% | | | | (6.97)% | | | | 7.39% | | | | 31.10% | |
Ratios to average net assets | | | | | | | | | | | | | | | | | | | | |
Expensesd | | | 1.03% | | | | 1.03% | | | | 1.03% | | | | 1.02% | | | | 1.04% | |
Net investment income | | | 1.37% | | | | 2.06% | | | | 1.97% | | | | 1.46% | | | | 1.75% | |
| | | | | |
Supplemental data | | | | | | | | | | | | | | | | | | | | |
Net assets, end of year (000’s) | | $ | 1,450,304 | | | $ | 1,352,554 | | | $ | 1,254,193 | | | $ | 1,626,885 | | | $ | 1,718,894 | |
Portfolio turnover rate | | | 11.60% | | | | 18.73% | e | | | 42.13% | e | | | 9.61% | | | | 14.95% | |
aThe amount shown for a share outstanding throughout the period may not correlate with the Statement of Operations for the period due to the timing of sales and repurchases of the Fund shares in relation to income earned and/or fluctuating market value of the investments of the Fund.
bBased on average daily shares outstanding.
cTotal return does not include fees, charges or expenses imposed by the variable annuity and life insurance contracts for which the Franklin Templeton Variable Insurance Products Trust serves as an underlying investment vehicle.
dBenefit of expense reduction rounds to less than 0.01%.
eExcludes the value of portfolio securities delivered as a result of redemption in-kind.
The accompanying notes are an integral part of these financial statements.
TG-11
Franklin Templeton Variable Insurance Products Trust
Financial Highlights (continued)
Templeton Growth Securities Fund
| | | | | | | | | | | | | | | | | | | | |
| | | Year Ended December 31, | |
| Class 4 | | 2013 | | | 2012 | | | 2011 | | | 2010 | | | 2009 | |
| | | | |
Per share operating performance | | | | | | | | | | | | | | | | | | | | |
(for a share outstanding throughout the year) | | | | | | | | | | | | | | | | | | | | |
Net asset value, beginning of year | | $ | 12.07 | | | $ | 10.19 | | | $ | 11.11 | | | $ | 10.50 | | | $ | 8.31 | |
| | | | |
Income from investment operationsa: | | | | | | | | | | | | | | | | | | | | |
Net investment incomeb | | | 0.17 | | | | 0.20 | | | | 0.20 | | | | 0.14 | | | | 0.14 | |
Net realized and unrealized gains (losses) | | | 3.47 | | | | 1.90 | | | | (0.98 | ) | | | 0.61 | | | | 2.36 | |
| | | | |
Total from investment operations | | | 3.64 | | | | 2.10 | | | | (0.78 | ) | | | 0.75 | | | | 2.50 | |
| | | | |
Less distributions from net investment income | | | (0.36 | ) | | | (0.22 | ) | | | (0.14 | ) | | | (0.14 | ) | | | (0.31 | ) |
| | | | |
Net asset value, end of year | | $ | 15.35 | | | $ | 12.07 | | | $ | 10.19 | | | $ | 11.11 | | | $ | 10.50 | |
| | | | |
| | | | | |
Total returnc | | | 30.64% | | | | 21.02% | | | | (7.14)% | | | | 7.31% | | | | 30.98% | |
Ratios to average net assets | | | | | | | | | | | | | | | | | | | | |
Expensesd | | | 1.13% | | | | 1.13% | | | | 1.13% | | | | 1.12% | | | | 1.14% | |
Net investment income | | | 1.27% | | | | 1.96% | | | | 1.87% | | | | 1.36% | | | | 1.65% | |
| | | | | |
Supplemental data | | | | | | | | | | | | | | | | | | | | |
Net assets, end of year (000’s) | | $ | 72,683 | | | $ | 67,158 | | | $ | 56,170 | | | $ | 60,569 | | | $ | 56,218 | |
Portfolio turnover rate | | | 11.60% | | | | 18.73% | e | | | 42.13% | e | | | 9.61% | | | | 14.95% | |
aThe amount shown for a share outstanding throughout the period may not correlate with the Statement of Operations for the period due to the timing of sales and repurchases of the Fund shares in relation to income earned and/or fluctuating market value of the investments of the Fund.
bBased on average daily shares outstanding.
cTotal return does not include fees, charges or expenses imposed by the variable annuity and life insurance contracts for which the Franklin Templeton Variable Insurance Products Trust serves as an underlying investment vehicle.
dBenefit of expense reduction rounds to less than 0.01%.
eExcludes the value of portfolio securities delivered as a result of a redemption in-kind.
The accompanying notes are an integral part of these financial statements.
TG-12
Franklin Templeton Variable Insurance Products Trust
Statement of Investments, December 31, 2013
| | | | | | | | | | |
| Templeton Growth Securities Fund | | Country | | Shares | | | Value | |
Common Stocks 95.7% | | | | | | | | | | |
Aerospace & Defense 0.6% | | | | | | | | | | |
BAE Systems PLC | | United Kingdom | | | 1,730,147 | | | $ | 12,455,372 | |
| | | | | | | | | | |
Air Freight & Logistics 2.2% | | | | | | | | | | |
FedEx Corp. | | United States | | | 100,270 | | | | 14,415,818 | |
TNT Express NV | | Netherlands | | | 646,272 | | | | 5,998,615 | |
aTNT Express NV, 144A | | Netherlands | | | 441,000 | | | | 4,093,306 | |
United Parcel Service Inc., B | | United States | | | 213,890 | | | | 22,475,561 | |
| | | | | | | | | | |
| | | | | | | | | 46,983,300 | |
| | | | | | | | | | |
Airlines 3.0% | | | | | | | | | | |
bDeutsche Lufthansa AG | | Germany | | | 1,609,064 | | | | 34,128,584 | |
bInternational Consolidated Airlines Group SA | | United Kingdom | | | 4,391,327 | | | | 29,180,924 | |
| | | | | | | | | | |
| | | | | | | | | 63,309,508 | |
| | | | | | | | | | |
Auto Components 1.2% | | | | | | | | | | |
Cie Generale des Etablissements Michelin, B | | France | | | 237,229 | | | | 25,207,329 | |
| | | | | | | | | | |
Automobiles 2.4% | | | | | | | | | | |
bMazda Motor Corp. | | Japan | | | 2,351,180 | | | | 12,146,647 | |
Nissan Motor Co. Ltd. | | Japan | | | 2,342,720 | | | | 19,667,279 | |
Toyota Motor Corp. | | Japan | | | 312,490 | | | | 19,052,097 | |
| | | | | | | | | | |
| | | | | | | | | 50,866,023 | |
| | | | | | | | | | |
Biotechnology 1.5% | | | | | | | | | | |
Amgen Inc. | | United States | | | 272,230 | | | | 31,077,777 | |
| | | | | | | | | | |
Capital Markets 2.9% | | | | | | | | | | |
Credit Suisse Group AG | | Switzerland | | | 1,026,980 | | | | 31,394,815 | |
Morgan Stanley | | United States | | | 985,150 | | | | 30,894,304 | |
| | | | | | | | | | |
| | | | | | | | | 62,289,119 | |
| | | | | | | | | | |
Chemicals 1.5% | | | | | | | | | | |
Akzo Nobel NV | | Netherlands | | | 397,282 | | | | 30,787,633 | |
| | | | | | | | | | |
Commercial Banks 10.1% | | | | | | | | | | |
BNP Paribas SA | | France | | | 501,247 | | | | 39,058,204 | |
bCommerzbank AG | | Germany | | | 875,260 | | | | 14,097,904 | |
bCredit Agricole SA | | France | | | 2,131,406 | | | | 27,279,923 | |
DBS Group Holdings Ltd. | | Singapore | | | 932,690 | | | | 12,639,879 | |
HSBC Holdings PLC | | United Kingdom | | | 1,913,864 | | | | 20,769,201 | |
ICICI Bank Ltd., ADR | | India | | | 261,909 | | | | 9,735,158 | |
Intesa Sanpaolo SpA | | Italy | | | 7,041,594 | | | | 17,376,167 | |
KB Financial Group Inc. | | South Korea | | | 657,984 | | | | 26,332,448 | |
SunTrust Banks Inc. | | United States | | | 478,520 | | | | 17,614,321 | |
UniCredit SpA | | Italy | | | 3,979,321 | | | | 29,447,730 | |
| | | | | | | | | | |
| | | | | | | | | 214,350,935 | |
| | | | | | | | | | |
Commercial Services & Supplies 0.2% | | | | | | | | | | |
Serco Group PLC | | United Kingdom | | | 587,700 | | | | 4,871,701 | |
| | | | | | | | | | |
Communications Equipment 3.5% | | | | | | | | | | |
bBrocade Communications Systems Inc. | | United States | | | 2,133,070 | | | | 18,920,331 | |
Cisco Systems Inc. | | United States | | | 1,266,680 | | | | 28,436,966 | |
Ericsson, B | | Sweden | | | 2,161,202 | | | | 26,373,125 | |
| | | | | | | | | | |
| | | | | | | | | 73,730,422 | |
| | | | | | | | | | |
Computers & Peripherals 1.4% | | | | | | | | | | |
Hewlett-Packard Co. | | United States | | | 1,036,700 | | | | 29,006,866 | |
| | | | | | | | | | |
TG-13
Franklin Templeton Variable Insurance Products Trust
Statement of Investments, December 31, 2013 (continued)
| | | | | | | | | | |
| Templeton Growth Securities Fund | | Country | | Shares | | | Value | |
Common Stocks (continued) | | | | | | | | | | |
Construction & Engineering 0.6% | | | | | | | | | | |
Carillion PLC | | United Kingdom | | | 506,846 | | | $ | 2,773,002 | |
FLSmidth & Co. AS | | Denmark | | | 196,370 | | | | 10,720,768 | |
| | | | | | | | | | |
| | | | | | | | | 13,493,770 | |
| | | | | | | | | | |
Construction Materials 1.5% | | | | | | | | | | |
CRH PLC | | Ireland | | | 1,277,393 | | | | 32,154,088 | |
| | | | | | | | | | |
Diversified Financial Services 4.4% | | | | | | | | | | |
Citigroup Inc. | | United States | | | 770,990 | | | | 40,176,289 | |
b ING Groep NV, IDR | | Netherlands | | | 1,899,376 | | | | 26,387,174 | |
JPMorgan Chase & Co. | | United States | | | 440,760 | | | | 25,775,645 | |
| | | | | | | | | | |
| | | | | | | | | 92,339,108 | |
| | | | | | | | | | |
Diversified Telecommunication Services 3.4% | | | | | | | | | | |
China Telecom Corp. Ltd., ADR | | China | | | 179,195 | | | | 9,061,891 | |
Singapore Telecommunications Ltd. | | Singapore | | | 7,063,710 | | | | 20,489,126 | |
Telefonica SA | | Spain | | | 1,371,960 | | | | 22,334,194 | |
Vivendi SA | | France | | | 739,654 | | | | 19,488,182 | |
| | | | | | | | | | |
| | | | | | | | | 71,373,393 | |
| | | | | | | | | | |
Electrical Equipment 1.3% | | | | | | | | | | |
Alstom SA | | France | | | 600,827 | | | | 21,879,933 | |
Dongfang Electric Corp. Ltd., H | | China | | | 2,016,600 | | | | 3,536,822 | |
bOsram Licht AG | | Germany | | | 20,171 | | | | 1,137,554 | |
| | | | | | | | | | |
| | | | | | | | | 26,554,309 | |
| | | | | | | | | | |
Electronic Equipment, Instruments & Components 0.5% | | | | | | | | | | |
bFlextronics International Ltd. | | Singapore | | | 1,241,008 | | | | 9,642,632 | |
| | | | | | | | | | |
Energy Equipment & Services 4.5% | | | | | | | | | | |
Baker Hughes Inc. | | United States | | | 657,950 | | | | 36,358,317 | |
Fugro NV, IDR | | Netherlands | | | 286,233 | | | | 17,053,699 | |
Halliburton Co. | | United States | | | 461,224 | | | | 23,407,118 | |
Noble Corp. PLC | | United States | | | 470,410 | | | | 17,626,263 | |
| | | | | | | | | | |
| | | | | | | | | 94,445,397 | |
| | | | | | | | | | |
Food & Staples Retailing 2.5% | | | | | | | | | | |
CVS Caremark Corp. | | United States | | | 330,420 | | | | 23,648,159 | |
Metro AG | | Germany | | | 156,280 | | | | 7,566,702 | |
Tesco PLC | | United Kingdom | | | 4,054,493 | | | | 22,452,743 | |
| | | | | | | | | | |
| | | | | | | | | 53,667,604 | |
| | | | | | | | | | |
Health Care Equipment & Supplies 2.1% | | | | | | | | | | |
Getinge AB, B | | Sweden | | | 438,720 | | | | 15,003,987 | |
Medtronic Inc. | | United States | | | 497,540 | | | | 28,553,821 | |
| | | | | | | | | | |
| | | | | | | | | 43,557,808 | |
| | | | | | | | | | |
Industrial Conglomerates 2.1% | | | | | | | | | | |
Koninklijke Philips NV | | Netherlands | | | 459,718 | | | | 16,848,755 | |
Siemens AG | | Germany | | | 201,712 | | | | 27,548,491 | |
| | | | | | | | | | |
| | | | | | | | | 44,397,246 | |
| | | | | | | | | | |
Insurance 5.4% | | | | | | | | | | |
American International Group Inc. | | United States | | | 221,040 | | | | 11,284,092 | |
Aviva PLC | | United Kingdom | | | 3,976,260 | | | | 29,606,255 | |
AXA SA | | France | | | 1,091,068 | | | | 30,330,440 | |
TG-14
Franklin Templeton Variable Insurance Products Trust
Statement of Investments, December 31, 2013 (continued)
| | | | | | | | | | |
| Templeton Growth Securities Fund | | Country | | Shares | | | Value | |
Common Stocks (continued) | | | | | | | | | | |
Insurance (continued) | | | | | | | | | | |
Muenchener Rueckversicherungs-Gesellschaft AG | | Germany | | | 78,511 | | | $ | 17,294,899 | |
Swiss Re AG | | Switzerland | | | 270,006 | | | | 24,834,922 | |
| | | | | | | | | | |
| | | | | | | | | 113,350,608 | |
| | | | | | | | | | |
Life Sciences Tools & Services 0.5% | | | | | | | | | | |
Lonza Group AG | | Switzerland | | | 120,746 | | | | 11,451,277 | |
| | | | | | | | | | |
Machinery 1.3% | | | | | | | | | | |
bNavistar International Corp. | | United States | | | 725,430 | | | | 27,704,172 | |
| | | | | | | | | | |
Media 4.3% | | | | | | | | | | |
Comcast Corp., Special A | | United States | | | 457,122 | | | | 22,801,245 | |
bNews Corp., A | | United States | | | 319,435 | | | | 5,756,219 | |
Time Warner Cable Inc. | | United States | | | 130,120 | | | | 17,631,260 | |
Twenty-First Century Fox Inc., A | | United States | | | 610,902 | | | | 21,491,532 | |
The Walt Disney Co. | | United States | | | 296,070 | | | | 22,619,748 | |
| | | | | | | | | | |
| | | | | | | | | 90,300,004 | |
| | | | | | | | | | |
Metals & Mining 1.3% | | | | | | | | | | |
Mining and Metallurgical Co. Norilsk Nickel OJSC, ADR | | Russia | | | 326,600 | | | | 5,423,193 | |
POSCO | | South Korea | | | 63,730 | | | | 19,709,531 | |
POSCO, ADR | | South Korea | | | 27,740 | | | | 2,163,720 | |
| | | | | | | | | | |
| | | | | | | | | 27,296,444 | |
| | | | | | | | | | |
Multiline Retail 0.6% | | | | | | | | | | |
Target Corp. | | United States | | | 191,680 | | | | 12,127,594 | |
| | | | | | | | | | |
Oil, Gas & Consumable Fuels 8.6% | | | | | | | | | | |
BP PLC | | United Kingdom | | | 2,807,128 | | | | 22,690,790 | |
Chevron Corp. | | United States | | | 137,470 | | | | 17,171,378 | |
China Shenhua Energy Co. Ltd., H | | China | | | 3,388,200 | | | | 10,661,381 | |
Eni SpA | | Italy | | | 776,759 | | | | 18,686,875 | |
Galp Energia SGPS SA, B | | Portugal | | | 1,575,520 | | | | 25,821,326 | |
LUKOIL Holdings, ADR | | Russia | | | 83,570 | | | | 5,218,946 | |
Royal Dutch Shell PLC, B | | United Kingdom | | | 299,573 | | | | 11,308,995 | |
Talisman Energy Inc. | | Canada | | | 2,690,800 | | | | 31,286,899 | |
Total SA, B | | France | | | 618,659 | | | | 37,893,489 | |
| | | | | | | | | | |
| | | | | | | | | 180,740,079 | |
| | | | | | | | | | |
Pharmaceuticals 10.2% | | | | | | | | | | |
b Forest Laboratories Inc. | | United States | | | 276,650 | | | | 16,607,299 | |
GlaxoSmithKline PLC | | United Kingdom | | | 1,260,103 | | | | 33,630,849 | |
Merck & Co. Inc. | | United States | | | 558,641 | | | | 27,959,982 | |
Merck KGaA | | Germany | | | 114,777 | | | | 20,563,317 | |
Pfizer Inc. | | United States | | | 1,111,443 | | | | 34,043,499 | |
Roche Holding AG | | Switzerland | | | 128,303 | | | | 35,842,282 | |
Sanofi | | France | | | 346,687 | | | | 36,776,056 | |
Teva Pharmaceutical Industries Ltd., ADR | | Israel | | | 268,460 | | | | 10,759,877 | |
| | | | | | | | | | |
| | | | | | | | | 216,183,161 | |
| | | | | | | | | | |
Professional Services 0.6% | | | | | | | | | | |
Hays PLC | | United Kingdom | | | 2,280 | | | | 4,889 | |
Randstad Holding NV | | Netherlands | | | 188,460 | | | | 12,222,540 | |
| | | | | | | | | | |
| | | | | | | | | 12,227,429 | |
| | | | | | | | | | |
TG-15
Franklin Templeton Variable Insurance Products Trust
Statement of Investments, December 31, 2013 (continued)
| | | | | | | | | | |
| Templeton Growth Securities Fund | | Country | | Shares | | | Value | |
Common Stocks (continued) | | | | | | | | | | |
Semiconductors & Semiconductor Equipment 1.9% | | | | | | | | | | |
Samsung Electronics Co. Ltd. | | South Korea | | | 31,260 | | | $ | 40,624,897 | |
| | | | | | | | | | |
Software 3.1% | | | | | | | | | | |
Microsoft Corp. | | United States | | | 1,099,279 | | | | 41,146,013 | |
Nintendo Co. Ltd. | | Japan | | | 99,240 | | | | 13,203,727 | |
Oracle Corp. | | United States | | | 122,950 | | | | 4,704,067 | |
SAP AG | | Germany | | | 80,912 | | | | 6,934,757 | |
| | | | | | | | | | |
| | | | | | | | | 65,988,564 | |
| | | | | | | | | | |
Specialty Retail 1.2% | | | | | | | | | | |
Kingfisher PLC | | United Kingdom | | | 4,083,541 | | | | 26,006,404 | |
| | | | | | | | | | |
Trading Companies & Distributors 0.5% | | | | | | | | | | |
ITOCHU Corp. | | Japan | | | 770,990 | | | | 9,511,073 | |
Noble Group Ltd. | | Hong Kong | | | 1,602,200 | | | | 1,358,658 | |
| | | | | | | | | | |
| | | | | | | | | 10,869,731 | |
| | | | | | | | | | |
Wireless Telecommunication Services 2.8% | | | | | | | | | | |
b Sprint Corp. | | United States | | | 1,017,459 | | | | 10,937,684 | |
b Turkcell Iletisim Hizmetleri AS, ADR | | Turkey | | | 1,477,723 | | | | 19,727,602 | |
Vodafone Group PLC | | United Kingdom | | | 7,430,079 | | | | 29,168,447 | |
| | | | | | | | | | |
| | | | | | | | | 59,833,733 | |
| | | | | | | | | | |
Total Common Stocks (Cost $1,466,967,898) | | | | | | | | | 2,021,265,437 | |
| | | | | | | | | | |
Preferred Stocks 1.3% | | | | | | | | | | |
Metals & Mining 0.2% | | | | | | | | | | |
Vale SA, ADR, pfd., A | | Brazil | | | 372,875 | | | | 5,223,979 | |
| | | | | | | | | | |
Oil, Gas & Consumable Fuels 1.1% | | | | | | | | | | |
Petroleo Brasileiro SA, ADR, pfd. | | Brazil | | | 1,528,452 | | | | 22,452,960 | |
| | | | | | | | | | |
Total Preferred Stocks (Cost $34,879,238) | | | | | | | | | 27,676,939 | |
| | | | | | | | | | |
Non-Registered Mutual Funds (Cost $11,942,900) 0.7% | | | | | | | | | | |
Diversified Financial Services 0.7% | | | | | | | | | | |
b,c,d,e Templeton China Opportunities Fund Ltd., Reg D | | Cayman Islands | | | 1,195,196 | | | | 14,031,606 | |
| | | | | | | | | | |
Total Investments before Short Term Investments
(Cost $1,513,790,036) | | | | | | | | | 2,062,973,982 | |
| | | | | | | | | | |
| | | |
| | | | | Principal
Amount* | | | | |
Short Term Investments (Cost $49,000,000) 2.3% | | | | | | | | | | |
Time Deposits 2.3% | | | | | | | | | | |
Royal Bank of Canada, 0.01%, 1/02/14 | | Canada | | | 49,000,000 | | | | 49,000,000 | |
| | | | | | | | | | |
Total Investments (Cost $1,562,790,036) 100.0% | | | | | | | | | 2,111,973,982 | |
Other Assets, less Liabilities (0.0)%† | | | | | | | | | (578,324 | ) |
| | | | | | | | | | |
Net Assets 100.0% | | | | | | | | $ | 2,111,395,658 | |
| | | | | | | | | | |
TG-16
Franklin Templeton Variable Insurance Products Trust
Statement of Investments, December 31, 2013 (continued)
| | | | | | |
| Templeton Growth Securities Fund | | | | | | |
See Abbreviations on page TG-30.
*The principal amount is stated in U.S. dollars unless otherwise indicated.
†Rounds to less than 0.1% of net assets.
aSecurity was purchased pursuant to Rule 144A under the Securities Act of 1933 and may be sold in transactions exempt from registration only to qualified institutional buyers or in a public offering registered under the Securities Act of 1933. This security has been deemed liquid under guidelines approved by the Trust’s Board of Trustees. At December 31, 2013, the value of this security was $4,093,306, representing 0.19% of net assets.
bNon-income producing.
cSee Note 1(d) regarding investment in Templeton China Opportunities Fund, Ltd.
dSee Note 8 regarding restricted securities.
eSee Note 9 regarding holdings of 5% voting securities.
The accompanying notes are an integral part of these financial statements.
TG-17
Franklin Templeton Variable Insurance Products Trust
Financial Statements
Statement of Assets and Liabilities
December 31, 2013
| | | | |
| | | Templeton
Growth
Securities Fund | |
Assets: | | | | |
Investments in securities: | | | | |
Cost - Unaffiliated issuers | | $ | 1,550,847,136 | |
Cost - Non-controlled affiliated issuers (Note 9) | | | 11,942,900 | |
| | | | |
Total cost of investments | | $ | 1,562,790,036 | |
| | | | |
Value - Unaffiliated issuers | | $ | 2,097,942,376 | |
Value - Non-controlled affiliated issuers (Note 9) | | | 14,031,606 | |
| | | | |
Total value of investments | | | 2,111,973,982 | |
Cash | | | 472,849 | |
Receivables: | | | | |
Investment securities sold | | | 68,378 | |
Capital shares sold | | | 392,962 | |
Dividends and interest | | | 2,864,435 | |
Other assets | | | 18,352 | |
| | | | |
Total assets | | | 2,115,790,958 | |
| | | | |
Liabilities: | | | | |
Payables: | | | | |
Investment securities purchased | | | 143,009 | |
Capital shares redeemed | | | 1,837,474 | |
Management fees | | | 1,325,266 | |
Distribution fees | | | 641,845 | |
Reports to shareholders | | | 284,132 | |
Accrued expenses and other liabilities | | | 163,574 | |
| | | | |
Total liabilities | | | 4,395,300 | |
| | | | |
Net assets, at value | | $ | 2,111,395,658 | |
| | | | |
Net assets consist of: | | | | |
Paid-in capital | | $ | 1,729,691,692 | |
Undistributed net investment income | | | 26,566,772 | |
Net unrealized appreciation (depreciation) | | | 549,231,460 | |
Accumulated net realized gain (loss) | | | (194,094,266 | ) |
| | | | |
Net assets, at value | | $ | 2,111,395,658 | |
| | | | |
The accompanying notes are an integral part of these financial statements.
TG-18
Franklin Templeton Variable Insurance Products Trust
Financial Statements (continued)
Statement of Assets and Liabilities (continued)
December 31, 2013
| | | | |
| | | Templeton
Growth
Securities Fund | |
Class 1: | | | | |
Net assets, at value | | $ | 588,408,710 | |
| | | | |
Shares outstanding | | | 38,027,031 | |
| | | | |
Net asset value and maximum offering price per share | | $ | 15.47 | |
| | | | |
Class 2: | | | | |
Net assets, at value | | $ | 1,450,304,170 | |
| | | | |
Shares outstanding | | | 95,237,568 | |
| | | | |
Net asset value and maximum offering price per share | | $ | 15.23 | |
| | | | |
Class 4: | | | | |
Net assets, at value | | $ | 72,682,778 | |
| | | | |
Shares outstanding | | | 4,734,503 | |
| | | | |
Net asset value and maximum offering price per share | | $ | 15.35 | |
| | | | |
The accompanying notes are an integral part of these financial statements.
TG-19
Franklin Templeton Variable Insurance Products Trust
Financial Statements (continued)
Statement of Operations
for the year ended December 31, 2013
| | | | |
| | | Templeton
Growth
Securities Fund | |
Investment income: | | | | |
Dividends (net of foreign taxes $3,216,346) | | $ | 47,694,922 | |
Interest | | | 26,037 | |
Income from securities loaned | | | 741,078 | |
| | | | |
Total investment income | | | 48,462,037 | |
| | | | |
Expenses: | | | | |
Management fees (Note 3a) | | | 15,215,428 | |
Distribution fees: (Note 3c) | | | | |
Class 2 | | | 3,533,134 | |
Class 4 | | | 250,125 | |
Unaffiliated transfer agent fees | | | 526 | |
Custodian fees (Note 4) | | | 191,874 | |
Reports to shareholders | | | 257,607 | |
Registration and filing fees | | | 2,000 | |
Professional fees | | | 102,517 | |
Trustees’ fees and expenses | | | 7,864 | |
Other | | | 50,001 | |
| | | | |
Total expenses | | | 19,611,076 | |
Expense reductions (Note 4) | | | (32 | ) |
| | | | |
Net expenses | | | 19,611,044 | |
| | | | |
Net investment income | | | 28,850,993 | |
| | | | |
Realized and unrealized gains (losses): | | | | |
Net realized gain (loss) from: | | | | |
Investments | | | 99,244,604 | |
Foreign currency transactions | | | (519,265 | ) |
| | | | |
Net realized gain (loss) | | | 98,725,339 | |
| | | | |
Net change in unrealized appreciation (depreciation) on: | | | | |
Investments | | | 412,364,156 | |
Translation of other assets and liabilities denominated in foreign currencies | | | 11,414 | |
| | | | |
Net change in unrealized appreciation (depreciation) | | | 412,375,570 | |
| | | | |
Net realized and unrealized gain (loss) | | | 511,100,909 | |
| | | | |
Net increase (decrease) in net assets resulting from operations | | $ | 539,951,902 | |
| | | | |
The accompanying notes are an integral part of these financial statements.
TG-20
Franklin Templeton Variable Insurance Products Trust
Financial Statements (continued)
Statements of Changes in Net Assets
| | | | | | | | |
| | | Templeton Growth
Securities Fund | |
| | | Year Ended December 31, | |
| | | 2013 | | | 2012 | |
| | | | |
Increase (decrease) in net assets: | | | | | | | | |
Operations: | | | | | | | | |
Net investment income | | $ | 28,850,993 | | | $ | 54,813,475 | |
Net realized gain (loss) from investments and foreign currency transactions | | | 98,725,339 | | | | 52,034,520 | |
Net change in unrealized appreciation (depreciation) on investments and translation of other assets and liabilities denominated in foreign currencies | | | 412,375,570 | | | | 384,863,694 | |
| | | | |
Net increase (decrease) in net assets resulting from operations | | | 539,951,902 | | | | 491,711,689 | |
| | | | |
Distributions to shareholders from: | | | | | | | | |
Net investment income: | | | | | | | | |
Class 1 | | | (15,214,157 | ) | | | (30,925,492 | ) |
Class 2 | | | (38,639,867 | ) | | | (26,587,764 | ) |
Class 4 | | | (1,946,523 | ) | | | (1,228,892 | ) |
| | | | |
Total distributions to shareholders | | | (55,800,547 | ) | | | (58,742,148 | ) |
| | | | |
Capital share transactions: (Note 2) | | | | | | | | |
Class 1 | | | (17,266,459 | ) | | | (922,021,789 | ) |
Class 2 | | | (240,507,877 | ) | | | (125,611,247 | ) |
Class 4 | | | (11,647,677 | ) | | | 284,692 | |
| | | | |
Total capital share transactions | | | (269,422,013 | ) | | | (1,047,348,344 | ) |
| | | | |
Net increase (decrease) in net assets | | | 214,729,342 | | | | (614,378,803 | ) |
Net assets: | | | | | | | | |
Beginning of year | | | 1,896,666,316 | | | | 2,511,045,119 | |
| | | | |
End of year | | $ | 2,111,395,658 | | | $ | 1,896,666,316 | |
| | | | |
Undistributed net investment income included in net assets: | | | | | | | | |
End of year | | $ | 26,566,772 | | | $ | 54,035,591 | |
| | | | |
The accompanying notes are an integral part of these financial statements.
TG-21
Franklin Templeton Variable Insurance Products Trust
Notes to Financial Statements
Templeton Growth Securities Fund
1. ORGANIZATION AND SIGNIFICANT ACCOUNTING POLICIES
Franklin Templeton Variable Insurance Products Trust (Trust) is registered under the Investment Company Act of 1940, as amended, (1940 Act) as an open-end investment company, consisting of twenty separate funds. The Templeton Growth Securities Fund (Fund) is included in this report. The financial statements of the remaining funds in the Trust are presented separately. Shares of the Fund are generally sold only to insurance company separate accounts to fund the benefits of variable life insurance policies or variable annuity contracts. The Fund offers three classes of shares: Class 1, Class 2, and Class 4. Each class of shares differs by its distribution fees, voting rights on matters affecting a single class and its exchange privilege.
The following summarizes the Fund’s significant accounting policies.
a. Financial Instrument Valuation
The Fund’s investments in financial instruments are carried at fair value daily. Fair value is the price that would be received to sell an asset or paid to transfer a liability in an orderly transaction between market participants on the measurement date. The Fund calculates the net asset value (NAV) per share at the close of the New York Stock Exchange (NYSE), generally at 4 p.m. Eastern time (NYSE close) on each day the NYSE is open for trading. Under procedures approved by the Trust’s Board of Trustees (the Board), the Fund’s administrator, investment manager and other affiliates have formed the Valuation and Liquidity Oversight Committee (VLOC). The VLOC provides administration and oversight of the Fund’s valuation policies and procedures, which are approved annually by the Board. Among other things, these procedures allow the Fund to utilize independent pricing services, quotations from securities and financial instrument dealers, and other market sources to determine fair value.
Equity securities listed on an exchange or on the NASDAQ National Market System are valued at the last quoted sale price or the official closing price of the day, respectively. Foreign equity securities are valued as of the close of trading on the foreign stock exchange on which the security is primarily traded or as of the NYSE close, whichever is earlier. The value is then converted into its U.S. dollar equivalent at the foreign exchange rate in effect at the NYSE close on the day that the value of the security is determined. Over-the-counter (OTC) securities are valued within the range of the most recent quoted bid and ask prices. Securities that trade in multiple markets or on multiple exchanges are valued according to the broadest and most representative market. Certain equity securities are valued based upon fundamental characteristics or relationships to similar securities. Time deposits are valued at cost, which approximates market value.
The Fund has procedures to determine the fair value of financial instruments for which market prices are not reliable or readily available. Under these procedures, the VLOC convenes on a regular basis to review such financial instruments and considers a number of factors, including significant unobservable valuation inputs, when arriving at fair value. The VLOC primarily employs a market-based approach which may use related or comparable assets or liabilities, recent transactions, market multiples, book values, and other relevant information for the investment to determine the fair value of the investment. An income-based valuation approach may also be used in which the anticipated future cash flows of the investment are discounted to calculate fair value. Discounts may also be applied due to the nature or duration of any restrictions on the disposition of the investments. Due to the inherent uncertainty of valuations of such investments, the fair values may differ significantly from the values that would have been used had an active market existed. The VLOC employs various methods for calibrating these valuation approaches including a regular review of key inputs and assumptions, transactional back-testing or disposition analysis, and reviews of any related market activity.
Trading in securities on foreign securities stock exchanges and OTC markets may be completed before the daily NYSE close. In addition, trading in certain foreign markets may not take place on every NYSE business day. Occasionally, events occur between the time at which trading in a foreign security is completed and the close of the NYSE that might call into question the reliability of the value of a portfolio security held by the Fund. As a result, differences may arise between the value of the Fund’s portfolio securities as determined at the foreign market close and the latest indications of value at the close of the NYSE. In order to minimize the potential for these differences, the VLOC monitors price movements following the close of trading in foreign stock markets through a series of country specific market proxies (such as baskets of American Depositary Receipts, futures contracts
TG-22
Franklin Templeton Variable Insurance Products Trust
Notes to Financial Statements (continued)
Templeton Growth Securities Fund
1. ORGANIZATION AND SIGNIFICANT ACCOUNTING POLICIES (continued)
a. Financial Instrument Valuation (continued)
and exchange traded funds). These price movements are measured against established trigger thresholds for each specific market proxy to assist in determining if an event has occurred that may call into question the reliability of the values of the foreign securities held by the Fund. If such an event occurs, the securities may be valued using fair value procedures, which may include the use of independent pricing services.
Also, when the last day of the reporting period is a non-business day, certain foreign markets may be open on those days that the NYSE is closed, which could result in differences between the value of the Fund’s portfolio securities on the last business day and the last calendar day of the reporting period. Any significant security valuation changes due to an open foreign market are adjusted and reflected by the Fund for financial reporting purposes.
b. Foreign Currency Translation
Portfolio securities and other assets and liabilities denominated in foreign currencies are translated into U.S. dollars based on the exchange rate of such currencies against U.S. dollars on the date of valuation. The Fund may enter into foreign currency exchange contracts to facilitate transactions denominated in a foreign currency. Purchases and sales of securities, income and expense items denominated in foreign currencies are translated into U.S. dollars at the exchange rate in effect on the transaction date. Portfolio securities and assets and liabilities denominated in foreign currencies contain risks that those currencies will decline in value relative to the U.S. dollar. Occasionally, events may impact the availability or reliability of foreign exchange rates used to convert the U.S. dollar equivalent value. If such an event occurs, the foreign exchange rate will be valued at fair value using procedures established and approved by the Board.
The Fund does not separately report the effect of changes in foreign exchange rates from changes in market prices on securities held. Such changes are included in net realized and unrealized gain or loss from investments on the Statement of Operations.
Realized foreign exchange gains or losses arise from sales of foreign currencies, currency gains or losses realized between the trade and settlement dates on securities transactions and the difference between the recorded amounts of dividends, interest, and foreign withholding taxes and the U.S. dollar equivalent of the amounts actually received or paid. Net unrealized foreign exchange gains and losses arise from changes in foreign exchange rates on foreign denominated assets and liabilities other than investments in securities held at the end of the reporting period.
c. Securities Lending
The Fund participates in an agency based securities lending program. The Fund receives cash collateral against the loaned securities in an amount equal to at least 102% of the market value of the loaned securities. Collateral is maintained over the life of the loan in an amount not less than 100% of the market value of loaned securities, as determined at the close of fund business each day; any additional collateral required due to changes in security values is delivered to the Fund on the next business day. The collateral is invested in a non-registered money fund. The Fund receives income from the investment of cash collateral, in addition to lending fees and rebates paid by the borrower. The Fund bears the market risk with respect to the collateral investment, securities loaned, and the risk that the agent may default on its obligations to the Fund. The securities lending agent has agreed to indemnify the Fund in the event of default by a third party borrower. At December 31, 2013, the Fund had no securities on loan.
d. Investment in Templeton China Opportunities Fund, Ltd.
The Fund invests in Templeton China Opportunities Fund, Ltd. (China Fund), a private offering of unregistered shares in a Cayman Islands Exempt Company. The China Fund investment objective is to seek capital growth primarily through
TG-23
Franklin Templeton Variable Insurance Products Trust
Notes to Financial Statements (continued)
Templeton Growth Securities Fund
1. ORGANIZATION AND SIGNIFICANT ACCOUNTING POLICIES (continued)
d. Investment in Templeton China Opportunities Fund, Ltd. (continued)
investments in A-shares of Chinese companies listed on the Shanghai and Shenzhen stock exchanges. Chinese A-shares are traded in Chinese Renminbi and are only available as an investment to domestic (Chinese) investors and holders of a Qualified Foreign Institutional Investors license. The China Fund is managed by Templeton Investment Counsel, LLC (an affiliate of the investment manager). No additional management or administrative fees are incurred on assets invested in the China Fund.
The China Fund may be subject to certain restrictions and administrative processes relating to its ability to repatriate cash balances, investment proceeds and earnings associated with its investment, as such activities are subject to approval by agencies of the Chinese government and thus the Fund may incur delays in redeeming its investment in the China Fund. The Fund’s investment in the China Fund is valued based upon the fair value of the China Fund’s portfolio securities and other assets and liabilities.
e. Income and Deferred Taxes
It is the Fund’s policy to qualify as a regulated investment company under the Internal Revenue Code. The Fund intends to distribute to shareholders substantially all of its taxable income and net realized gains to relieve it from federal income and if applicable excise taxes. As a result, no provision for U.S. federal income taxes is required.
The Fund may be subject to foreign taxation related to income received, capital gains on the sale of securities and certain foreign currency transactions in the foreign jurisdictions in which it invests. Foreign taxes, if any, are recorded based on the tax regulations and rates that exist in the foreign markets in which the Fund invests. When a capital gain tax is determined to apply the Fund records an estimated deferred tax liability in an amount that would be payable if the securities were disposed of on the valuation date.
The Fund recognizes the tax benefits of uncertain tax positions only when the position is “more likely than not” to be sustained upon examination by the tax authorities based on the technical merits of the tax position. As of December 31, 2013, and for all open tax years, the Fund has determined that no liability for unrecognized tax benefits is required in the Fund’s financial statements related to uncertain tax positions taken on a tax return (or expected to be taken on future tax returns). Open tax years are those that remain subject to examination and are based on each tax jurisdiction statute of limitation.
f. Security Transactions, Investment Income, Expenses and Distributions
Security transactions are accounted for on trade date. Realized gains and losses on security transactions are determined on a specific identification basis. Interest income and estimated expenses are accrued daily. Dividend income is recorded on the ex-dividend date except that certain dividends from foreign securities are recognized as soon as the Fund is notified of the ex-dividend date. Distributions to shareholders are recorded on the ex-dividend date and are determined according to income tax regulations (tax basis). Distributable earnings determined on a tax basis may differ from earnings recorded in accordance with accounting principles generally accepted in the United States of America. These differences may be permanent or temporary. Permanent differences are reclassified among capital accounts to reflect their tax character. These reclassifications have no impact on net assets or the results of operations. Temporary differences are not reclassified, as they may reverse in subsequent periods.
Common expenses incurred by the Trust are allocated among the funds based on the ratio of net assets of each fund to the combined net assets of the Trust. Fund specific expenses are charged directly to the fund that incurred the expense.
Realized and unrealized gains and losses and net investment income, not including class specific expenses, are allocated daily to each class of shares based upon the relative proportion of net assets of each class. Differences in per share distributions, by class, are generally due to differences in class specific expenses.
TG-24
Franklin Templeton Variable Insurance Products Trust
Notes to Financial Statements (continued)
Templeton Growth Securities Fund
1. ORGANIZATION AND SIGNIFICANT ACCOUNTING POLICIES (continued)
g. Accounting Estimates
The preparation of financial statements in accordance with accounting principles generally accepted in the United States of America requires management to make estimates and assumptions that affect the reported amounts of assets and liabilities at the date of the financial statements and the amounts of income and expenses during the reporting period. Actual results could differ from those estimates.
h. Guarantees and Indemnifications
Under the Trust’s organizational documents, its officers and trustees are indemnified by the Trust against certain liabilities arising out of the performance of their duties to the Trust. Additionally, in the normal course of business, the Trust, on behalf of the Fund, enters into contracts with service providers that contain general indemnification clauses. The Trust’s maximum exposure under these arrangements is unknown as this would involve future claims that may be made against the Trust that have not yet occurred. Currently, the Trust expects the risk of loss to be remote.
2. SHARES OF BENEFICIAL INTEREST
At December 31, 2013, there were an unlimited number of shares authorized (without par value). Transactions in the Fund’s shares were as follows:
| | | | | | | | | | | | | | | | |
| | | Year Ended December 31, | |
| | | 2013 | | | 2012 | |
| Class 1 Shares: | | Shares | | | Amount | | | Shares | | | Amount | |
Shares sold | | | 896,927 | | | $ | 12,053,666 | | | | 39,146,115 | | | $ | 423,930,779 | |
Shares issued in reinvestment of distributions | | | 1,149,106 | | | | 15,214,157 | | | | 3,052,862 | | | | 30,925,492 | |
Shares redeemed in-kind (Note 11) | | | — | | | | — | | | | (90,515,836 | ) | | | (1,060,908,757 | ) |
Shares redeemed | | | (3,250,296 | ) | | | (44,534,282 | ) | | | (29,409,088 | ) | | | (315,969,303 | ) |
| | | | |
Net increase (decrease) | | | (1,204,263 | ) | | $ | (17,266,459 | ) | | | (77,725,947 | ) | | $ | (922,021,789 | ) |
| | | | |
Class 2 Shares: | | | | | | | | | | | | | | | | |
Shares sold | | | 7,540,783 | | | $ | 101,234,976 | | | | 9,278,139 | | | $ | 99,327,364 | |
Shares issued in reinvestment of distributions | | | 2,963,180 | | | | 38,639,867 | | | | 2,661,438 | | | | 26,587,764 | |
Shares redeemed | | | (28,236,625 | ) | | | (380,382,720 | ) | | | (23,060,322 | ) | | | (251,526,375 | ) |
| | | | |
Net increase (decrease) | | | (17,732,662 | ) | | $ | (240,507,877 | ) | | | (11,120,745 | ) | | $ | (125,611,247 | ) |
| | | | |
Class 4 Shares: | | | | | | | | | | | | | | | | |
Shares sold | | | 683,745 | | | $ | 9,107,528 | | | | 712,668 | | | $ | 7,687,691 | |
Shares issued on reinvestment of distributions | | | 147,912 | | | | 1,946,523 | | | | 121,914 | | | | 1,228,892 | |
Shares redeemed | | | (1,660,931 | ) | | | (22,701,728 | ) | | | (782,111 | ) | | | (8,631,891 | ) |
| | | | |
Net increase (decrease) | | | (829,274 | ) | | $ | (11,647,677 | ) | | | 52,471 | | | $ | 284,692 | |
| | | | |
TG-25
Franklin Templeton Variable Insurance Products Trust
Notes to Financial Statements (continued)
Templeton Growth Securities Fund
3. TRANSACTIONS WITH AFFILIATES
Franklin Resources, Inc. is the holding company for various subsidiaries that together are referred to as Franklin Templeton Investments. Certain officers and trustees of the Fund are also officers and/or directors of the following subsidiaries:
| | |
| Subsidiary | | Affiliation |
Templeton Global Advisors Limited (TGAL) | | Investment manager |
Franklin Templeton Services, LLC (FT Services) | | Administrative manager |
Franklin Templeton Distributors, Inc. (Distributors) | | Principal underwriter |
Franklin Templeton Investor Services, LLC (Investor Services) | | Transfer agent |
a. Management Fees
The Fund pays an investment management fee to TGAL based on the average daily net assets of the Fund as follows:
| | |
| Annualized Fee Rate | | Net Assets |
| 1.000% | | Up to and including $100 million |
| 0.900% | | over $100 million, up to and including $250 million |
| 0.800% | | over $250 million, up to and including $500 million |
| 0.750% | | over $500 million, up to and including $1 billion |
| 0.700% | | over $1 billion, up to and including $5 billion |
| 0.675% | | over $5 billion, up to and including $10 billion |
| 0.655% | | over $10 billion, up to and including $15 billion |
| 0.635% | | over $15 billion, up to and including $20 billion |
| 0.615% | | In excess of $20 billion |
b. Administrative Fees
Under an agreement with TGAL, FT Services provides administrative services to the Fund. The fee is paid by TGAL based on the Fund’s average daily net assets, and is not an additional expense of the Fund.
c. Distribution Fees
The Board has adopted distribution plans for Class 2 and Class 4 shares pursuant to Rule 12b-1 under the 1940 Act. Under the Fund’s compensation distribution plans, the Fund pays Distributors for costs incurred in connection with the servicing, sale and distribution of the Fund’s shares up to 0.35% per year of its average daily net assets each class. Some distribution fees are not charged on shares held by affiliates. The Board has agreed to limit the current rate to 0.25% per year for Class 2. The plan year, for purposes of monitoring compliance with the maximum annual plan rates, is February 1 through January 31.
d. Transfer Agent Fees
Investor Services, under terms of an agreement, performs shareholder servicing for the Fund and is not paid by the Fund for the services.
e. Other Affiliated Transactions
At December 31, 2013, Franklin Templeton Variable Insurance Products Trust – Franklin Templeton VIP Founding owned 19.07% of the Fund’s outstanding shares. Investment activities of this investment company could have a material impact on the Fund.
TG-26
Franklin Templeton Variable Insurance Products Trust
Notes to Financial Statements (continued)
Templeton Growth Securities Fund
4. EXPENSE OFFSET ARRANGEMENT
The Fund has entered into an arrangement with its custodian whereby credits realized as a result of uninvested cash balances are used to reduce a portion of the Fund’s custodian expenses. During the year ended December 31, 2013, the custodian fees were reduced as noted in the Statement of Operations.
5. INCOME TAXES
For tax purposes, capital losses may be carried over to offset future capital gains. Capital loss carryforwards with no expiration, if any, must be fully utilized before those losses with expiration dates.
At December 31, 2013, capital loss carryforwards were as follows:
| | | | |
Capital loss carryforwards expiring in: | | | | |
2017 | | $ | 117,602,940 | |
2018 | | | 55,299,629 | |
| | | | |
| | $ | 172,902,569 | |
| | | | |
During the year ended December 31, 2013, the Fund utilized $97,674,285 of capital loss carryforwards.
The tax character of distributions paid during the years ended December 31, 2013 and 2012, was as follows:
| | | | | | | | |
| | | 2013 | | | 2012 | |
Distributions paid from ordinary income | | $ | 55,800,547 | | | $ | 58,742,148 | |
| | | | |
At December 31, 2013, the cost of investments, net unrealized appreciation (depreciation), undistributed ordinary income for income tax purposes were as follows:
| | | | |
Cost of investments | | $ | 1,586,070,444 | |
| | | | |
| |
Unrealized appreciation | | $ | 589,015,063 | |
Unrealized depreciation | | | (63,111,525 | ) |
| | | | |
Net unrealized appreciation (depreciation) | | $ | 525,903,538 | |
| | | | |
Distributable earnings – undistributed ordinary income | | $ | 28,655,514 | |
| | | | |
Differences between income and/or capital gains as determined on a book basis and a tax basis are primarily due to differing treatments of foreign currency transactions, passive foreign investment company shares and wash sales.
6. INVESTMENT TRANSACTIONS
Purchases and sales of investments (excluding short term securities) for the year ended December 31, 2013, aggregated $228,082,993 and $551,098,938, respectively.
7. CONCENTRATION OF RISK
Investing in foreign securities may include certain risks and considerations not typically associated with investing in U.S. securities, such as fluctuating currency values and changing local and regional economic, political and social conditions, which may result in greater market volatility. In addition, certain foreign securities may not be as liquid as U.S. securities.
TG-27
Franklin Templeton Variable Insurance Products Trust
Notes to Financial Statements (continued)
Templeton Growth Securities Fund
8. RESTRICTED SECURITIES
The Fund invests in securities that are restricted under the Securities Act of 1933 (1933 Act) or which are subject to legal, contractual, or other agreed upon restrictions on resale. Restricted securities are often purchased in private placement transactions, and cannot be sold without prior registration unless the sale is pursuant to an exemption under the 1933 Act. Disposal of these securities may require greater effort and expense, and prompt sale at an acceptable price may be difficult. The Fund may have registration rights for restricted securities. The issuer generally incurs all registration costs.
At December 31, 2013, the Fund held investments in restricted securities, excluding certain securities exempt from registration under the 1933 Act deemed to be liquid, as follows:
| | | | | | | | | | | | | | | | |
| Shares | | | Issuer | | Acquisition
Dates | | | Cost | | | Value | |
| | 1,195,196 | | | Templeton China Opportunities Fund Ltd., Reg D (Value is 0.66% of Net Assets) | | | 3/17/10-10/9/13 | | | $ | 11,942,900 | | | $ | 14,031,606 | |
| | | | | | | | | | | | | | | | |
9. HOLDINGS OF 5% VOTING SECURITIES OF PORTFOLIO COMPANIES
The 1940 Act defines “affiliated companies” to include investments in portfolio companies in which a fund owns 5% or more of the outstanding voting securities. Investments in “affiliated companies” for the Fund for the year ended December 31, 2013, were as shown below.
| | | | | | | | | | | | | | | | | | | | | | | | | | | | |
| Name of Issuer | | Number of
Shares
Held at
Beginning
of Year | | | Gross
Additions | | | Gross
Reductions | | | Number of
Shares
Held at
End of Year | | | Value at
End of Year | | | Investment
Income | | | Realized
Capital
Gain (Loss) | |
Non-Controlled Affiliates | | | | | | | | | | | | | | | | | | | | | | | | | | | | |
Templeton China Opportunities Fund Ltd., Reg D | | | 1,194,518 | | | | 678 | | | | — | | | | 1,195,196 | | | $ | 14,031,606 | | | $ | — | | | $ | — | |
| | | | | | | | | | | | | | | | | | | | |
Total Affiliated Securities (Value is 0.66% of Net Assets) | | | | | | | | | | | | | | | | | | | | | | | | | | | | |
10. CREDIT FACILITY
The Fund, together with other U.S. registered and foreign investment funds (collectively, Borrowers), managed by Franklin Templeton Investments, are borrowers in a joint syndicated senior unsecured credit facility totaling $1.5 billion (Global Credit Facility) which, after an extension of the original terms, matured on February 14, 2014. This Global Credit Facility provides a source of funds to the Borrowers for temporary and emergency purposes, including the ability to meet future unanticipated or unusually large redemption requests. Effective February 14, 2014, the Borrowers renewed the Global Credit Facility which matures on February 13, 2015.
Under the terms of the Global Credit Facility, the Fund shall, in addition to interest charged on any borrowings made by the Fund and other costs incurred by the Fund, pay its share of fees and expenses incurred in connection with the implementation and maintenance of the Global Credit Facility, based upon its relative share of the aggregate net assets of all of the Borrowers, including an annual commitment fee of 0.07% based upon the unused portion of the Global Credit Facility. These fees are reflected in other expenses on the Statement of Operations.
11. REDEMPTION IN-KIND
During the year ended December 31, 2012, the Fund realized $18,346,694 of net gains resulting from a redemption in-kind in which a shareholder redeemed fund shares for securities held by the Fund rather than for cash. Because such gains are not taxable to the Fund, and are not distributed to remaining shareholders, they have been reclassified from accumulated net realized gains to paid-in capital.
TG-28
Franklin Templeton Variable Insurance Products Trust
Notes to Financial Statements (continued)
Templeton Growth Securities Fund
12. FAIR VALUE MEASUREMENTS
The Fund follows a fair value hierarchy that distinguishes between market data obtained from independent sources (observable inputs) and the Fund’s own market assumptions (unobservable inputs). These inputs are used in determining the value of the Fund’s financial instruments and are summarized in the following fair value hierarchy:
| | • | | Level 1 – quoted prices in active markets for identical financial instruments |
| | • | | Level 2 – other significant observable inputs (including quoted prices for similar financial instruments, interest rates, prepayment speed, credit risk, etc.) |
| | • | | Level 3 – significant unobservable inputs (including the Fund’s own assumptions in determining the fair value of financial instruments) |
The input levels are not necessarily an indication of the risk or liquidity associated with financial instruments at that level.
For movements between the levels within the fair value hierarchy, the Fund has adopted a policy of recognizing the transfers as of the date of the underlying event which caused the movement.
A summary of inputs used as of December 31, 2013, in valuing the Fund’s assets carried at fair value, is as follows:
| | | | | | | | | | | | | | | | |
| | | Level 1 | | | Level 2 | | | Level 3 | | | Total | |
| | | | |
Assets: | | | | | | | | | | | | | | | | |
Investments in Securities: | | | | | | | | | | | | | | | | |
Equity Investments:a | | | | | | | | | | | | | | | | |
Diversified Financial Services | | $ | 92,339,108 | | | $ | — | | | $ | 14,031,606 | | | $ | 106,370,714 | |
All Other Equity Investmentsb | | | 1,956,603,268 | | | | — | | | | — | | | | 1,956,603,268 | |
Short term investments | | | — | | | | 49,000,000 | | | | — | | | | 49,000,000 | |
| | | | |
Total Investments in Securities | | $ | 2,048,942,376 | | | $ | 49,000,000 | | | $ | 14,031,606 | | | $ | 2,111,973,982 | |
| | | | |
aIncludes common stocks as well as other equity investments.
bFor detailed categories, see the accompanying Statement of Investments.
A reconciliation of assets in which Level 3 inputs are used in determining fair value is presented when there are significant Level 3 investments at the end of the period.
13. NEW ACCOUNTING PRONOUNCEMENTS
In June 2013, the Financial Accounting Standards Board issued Accounting Standards Update (ASU) No. 2013-08, Investment Companies (Topic 946): Amendments to the Scope, Measurement, and Disclosure Requirements. The ASU modifies the criteria used in defining an investment company under U.S. Generally Accepted Accounting Principles and also sets forth certain measurement and disclosure requirements. Under the ASU, an entity that is registered under the 1940 Act automatically qualifies as an investment company. The ASU is effective for interim and annual reporting periods beginning after December 15, 2013. Management has reviewed the requirements and believes the adoption of this ASU will not have a material impact on the financial statements.
TG-29
Franklin Templeton Variable Insurance Products Trust
Notes to Financial Statements (continued)
Templeton Growth Securities Fund
14. SUBSEQUENT EVENTS
The Fund has evaluated subsequent events through the issuance of the financial statements and determined that no events have occurred that require disclosure other than those already disclosed in the financial statements.
| | | | |
ABBREVIATIONS | | | | |
| Selected Portfolio | | | | |
| | | | |
| ADR - American Depositary Receipt | | | | |
| IDR - International Depositary Receipt | | | | |
TG-30
Franklin Templeton Variable Insurance Products Trust
Templeton Growth Securities Fund
Report of Independent Registered Public Accounting Firm
To the Board of Trustees and Shareholders of
Franklin Templeton Variable Insurance Products Trust
In our opinion, the accompanying statement of assets and liabilities, including the statement of investments, and the related statements of operations and of changes in net assets and the financial highlights present fairly, in all material respects, the financial position of Templeton Growth Securities Fund (the “Fund”) at December 31, 2013, the results of its operations for the year then ended, the changes in its net assets for each of the two years in the period then ended and the financial highlights for each of the five years in the period then ended, in conformity with accounting principles generally accepted in the United States of America. These financial statements and financial highlights (hereafter referred to as “financial statements”) are the responsibility of the Fund’s management. Our responsibility is to express an opinion on these financial statements based on our audits. We conducted our audits of these financial statements in accordance with the standards of the Public Company Accounting Oversight Board (United States). Those standards require that we plan and perform the audit to obtain reasonable assurance about whether the financial statements are free of material misstatement. An audit includes examining, on a test basis, evidence supporting the amounts and disclosures in the financial statements, assessing the accounting principles used and significant estimates made by management, and evaluating the overall financial statement presentation. We believe that our audits, which included confirmation of securities at December 31, 2013 by correspondence with the custodian, transfer agent and brokers, provide a reasonable basis for our opinion.
PricewaterhouseCoopers LLP
San Francisco, California
February 14, 2014
TG-31
Franklin Templeton Variable Insurance Products Trust
Tax Information (unaudited)
Templeton Growth Securities Fund
Under Section 854(b)(1)(A) of the Internal Revenue Code (Code), the Fund hereby reports 20.31% of the ordinary income dividends as income qualifying for the dividends received deduction for the fiscal year ended December 31, 2013.
At December 31, 2013, more than 50% of the Fund’s total assets were invested in securities of foreign issuers. In most instances, foreign taxes were withheld from income paid to the Fund on these investments. The Fund elects to treat foreign taxes paid as allowed under Section 853 of the Code. This election will allow shareholders of record as of the 2014 distribution date, to treat their proportionate share of foreign taxes paid by the Fund as having been paid directly by them. The shareholder shall consider these amounts as foreign taxes paid in the tax year in which they receive the Fund distribution.
TG-32
INDEX DESCRIPTIONS
The indexes are unmanaged and include reinvested distributions.
For indexes sourced by Morningstar: © 2014 Morningstar. All Rights Reserved. The information contained herein: (1) is proprietary to Morningstar and/or its content providers; (2) may not be copied or distributed; and (3) is not warranted to be accurate, complete or timely. Neither Morningstar nor its content providers are responsible for any damages or losses arising from any use of this information.
Russell® is a trademark and RussellTM is a servicemark of the Frank Russell Company.
Barclays U.S. Aggregate Index is a market capitalization-weighted index representing the U.S. investment-grade, fixed-rate, taxable bond market with index components for government and corporate, mortgage pass-through and asset-backed securities. All issues included are SEC registered, taxable, dollar denominated and nonconvertible, must have at least one year to final maturity and must be rated investment grade (Baa3/BBB-/BBB- or higher) using the middle rating of Moody’s, Standard & Poor’s and Fitch, respectively.
Barclays U.S. Government Index: Intermediate Component is the intermediate component of the Barclays U.S. Government Index, which includes public obligations of the U.S. Treasury with at least one year to final maturity and publicly issued debt of U.S. government agencies, quasi-federal corporations, and corporate or foreign debt guaranteed by the U.S. government.
Citigroup World Government Bond Index is a market capitalization-weighted index consisting of investment-grade world government bond markets.
Consumer Price Index (CPI), calculated by the Bureau of Labor Statistics, is a commonly used measure of the inflation rate.
Credit Suisse (CS) High Yield Index is designed to mirror the investable universe of the U.S. dollar-denominated high yield debt market.
Dow Jones Industrial Average is a price-weighted average of blue-chip stocks that are generally the leaders in their industry.
Dow Jones-UBS Commodity Index is a broadly diversified index designed to allow investors to track commodity futures through a single, simple measure. The index reflects the return on fully collateralized positions in the underlying futures contracts on physical commodities, which are reweighted and rebalanced annually on a price-percentage basis. The Dow Jones-UBS Commodity IndicesSM are a joint product of DJI Opco, LLC, a subsidiary of S&P Dow Jones Indices LLC, and UBS Securities LLC (“UBS”) and have been licensed for use to S&P Opco, LLC and Franklin Templeton Companies, LLC. S&P® is a registered trademark of Standard & Poor’s Financial Services LLC, Dow Jones® and DJ are registered trademarks of Dow Jones Trademark Holdings LLC, and “UBS” is a registered trademark of UBS AG. All content of the Dow Jones-UBS Commodity IndicesSM © S&P Dow Jones Indices LLC and UBS and their respective affiliates 2014. Reproduction of Dow Jones-UBS Commodity IndicesSM in any form is prohibited except with the prior written permission of S&P. S&P does not guarantee the accuracy, adequacy, completeness or availability of any information and is not responsible for any errors or omissions, regardless of the cause or for the results obtained from the use of such information. S&P DISCLAIMS ANY AND ALL EXPRESS OR IMPLIED WARRANTIES, INCLUDING, BUT NOT LIMITED TO, ANY WARRANTIES OF MERCHANTABILITY OR FITNESS FOR A PARTICULAR PURPOSE OR USE. In no event shall S&P be liable for any direct, indirect, special or consequential damages, costs, expenses, legal fees, or losses (including lost income or lost profit and opportunity costs) in connection with subscriber’s or others’ use of Dow Jones-UBS Commodity IndicesSM.
FTSE EPRA/NAREIT Developed Index is a free float-adjusted index designed to measure the performance of publicly traded real estate securities in the North American, European and Asian real estate markets. FTSE® is a trademark of London Stock Exchange Plc and The Financial Times Limited and is used by FTSE under license.
J.P. Morgan (JPM) Global Government Bond Index (GGBI) tracks total returns for liquid, fixed-rate, domestic government bonds with maturities greater than one year issued by developed countries globally.
Lipper Multi-Sector Income Funds Classification Average is calculated by averaging the total returns of all funds within the Lipper Multi-Sector Income Funds classification in the Lipper Open-End underlying funds universe. Lipper Multi-Sector Income Funds are defined as funds that seek current income by allocating assets among different fixed income securities sectors (not primarily in one sector except for defensive purposes), including U.S. and foreign governments, with a significant portion rated below investment grade. For the 12-month period ended 12/31/13, there were 226 funds in this category. Lipper calculations do not include contract fees, expenses or sales charges, and may have been different if such charges had been considered.
Lipper VIP Equity Income Funds Classification Average is an equally weighted average calculation of performance figures for all funds within the Lipper Equity Income Funds classification in the Lipper VIP underlying funds universe. Lipper Equity
I-1
Income Funds seek relatively high current income and growth of income through investing 60% or more of their portfolios in equities. For the 12-month period ended 12/31/13, there were 66 funds in this category. Lipper calculations do not include contract fees, expenses or sales charges, and may have been different if such charges had been considered.
Lipper VIP General U.S. Government Funds Classification Average is an equally weighted average calculation of performance figures for all funds within the Lipper General U.S. Government Funds classification in the Lipper VIP underlying funds universe. Lipper General U.S. Government Funds invest primarily in U.S. government and agency issues. For the 12-month period ended 12/31/13, there were 50 funds in this category. Lipper calculations do not include contract fees, expenses or sales charges, and may have been different if such charges had been considered.
Lipper VIP High Yield Funds Classification Average is an equally weighted average calculation of performance figures for all funds within the Lipper High Yield Funds Classification in the Lipper VIP underlying funds universe. Lipper High Yield Funds aim at high (relative) current yield from fixed income securities, have no quality or maturity restrictions, and tend to invest in lower grade debt issues. For the 12-month period ended 12/31/13, there were 110 funds in this category. Lipper calculations do not include contract fees, expenses or sales charges, and may have been different if such charges had been considered.
MSCI All Country World Index (ACWI) is a free float-adjusted, market capitalization-weighted index designed to measure equity market performance in global developed and emerging markets.
MSCI Emerging Markets (EM) Index is a free float-adjusted, market capitalization-weighted index designed to measure equity market performance in global emerging markets.
MSCI Europe, Australasia, Far East (EAFE) Index is a free float-adjusted, market capitalization-weighted index designed to measure equity market performance in global developed markets excluding the U.S. and Canada.
MSCI Europe, Australasia, Far East (EAFE) Index Net Return (Local Currency) is a free float-adjusted, market capitalization-weighted index designed to measure equity market performance of global developed markets excluding the U.S. and Canada. The index is calculated in local currency and includes reinvested daily net dividends.
MSCI World Index is a free float-adjusted, market capitalization-weighted index designed to measure equity market performance in global developed markets.
Russell 1000® Growth Index is market capitalization weighted and measures performance of those Russell 1000® Index companies with higher price-to-book ratios and higher forecasted growth values.
Russell 1000® Index is market capitalization weighted and measures performance of the largest companies in the Russell 3000® Index, which represents the majority of the U.S. market’s total capitalization.
Russell 1000® Value Index is market capitalization weighted and measures performance of those Russell 1000® Index companies with lower price-to-book ratios and lower forecasted growth values.
Russell 2500™ Index is market capitalization weighted and measures performance of the smallest companies in the Russell 3000® Index, which represent a modest amount of the Russell 3000® Index’s total market capitalization.
Russell 2500™ Value Index is market capitalization weighted and measures performance of those Russell 2500™ Index companies with lower price-to-book ratios and lower forecasted growth values.
Russell 3000® Growth Index is market capitalization weighted and measures performance of those Russell 3000® Index companies with higher price-to-book ratios and higher forecasted growth values.
Russell 3000® Index is market capitalization weighted and measures performance of the largest U.S. companies based on total market capitalization and represents the majority of the investable U.S. equity market.
Russell Midcap® Growth Index is market capitalization weighted and measures performance of those Russell Midcap® Index companies with higher price-to-book ratios and higher forecasted growth values.
Russell Midcap® Index is market capitalization weighted and measures performance of the smallest companies in the Russell 1000® Index, which represent a modest amount of the Russell 1000® Index’s total market capitalization.
I-2
Standard & Poor’s 500 Index (S&P 500) is a market capitalization-weighted index of 500 stocks designed to measure total U.S. equity market performance. STANDARD & POOR’S®, S&P® and S&P 500® are registered trademarks of Standard & Poor’s Financial Services LLC.
Standard & Poor’s/International Finance Corporation Investable (S&P/IFCI) Composite Index is a free float-adjusted, market capitalization-weighted index designed to measure equity performance in global emerging markets.
I-3
Board Members and Officers
The name, year of birth and address of the officers and board members, as well as their affiliations, positions held with the Trust, principal occupation during at least the past five years and number of portfolios overseen in the Franklin Templeton Investments fund complex are shown below. Generally, each board member serves until that person’s successor is elected and qualified.
Independent Board Members
| | | | | | | | |
| Name, Year of Birth and Address | | Position | | Length of
Time Served | | Number of
Portfolios in Fund
Complex Overseen
by Board Member* | | Other Directorships Held
During at Least the Past 5 Years |
Harris J. Ashton (1932) One Franklin Parkway San Mateo, CA 94403-1906 | | Trustee | | Since 1988 | | 141 | | Bar-S Foods (meat packing company) (1981-2010). |
|
Principal Occupation During at Least the Past 5 Years: Director of various companies; and formerly, Director, RBC Holdings, Inc. (bank holding company) (until 2002); and President, Chief Executive Officer and Chairman of the Board, General Host Corporation (nursery and craft centers) (until 1998). |
Sam Ginn (1937) One Franklin Parkway San Mateo, CA 94403-1906 | | Trustee | | Since 2007 | | 114 | | ICO Global Communications (Holdings) Limited (satellite company) (2006-2010), Chevron Corporation (global energy company) (1989-2009), Hewlett-Packard Company (technology company) (1996-2002), Safeway, Inc. (grocery retailer) (1991-1998) and TransAmerica Corporation (insurance company) (1989-1999). |
|
Principal Occupation During at Least the Past 5 Years: Private investor; Chairman, First Responder Network Authority (FirstNet) (interoperable wireless broadband network) (2012); and formerly, Chairman of the Board, Vodafone AirTouch, PLC (wireless company) (1999-2000); Chairman of the Board and Chief Executive Officer, AirTouch Communications (cellular communications) (1993-1998) and Pacific Telesis Group (telephone holding company) (1988-1994). |
Edith E. Holiday (1952) One Franklin Parkway San Mateo, CA 94403-1906 | | Trustee | | Since 2005 | | 141 | | Hess Corporation (exploration and refining of oil and gas), H.J. Heinz Company (processed foods and allied products)(1994-2013), RTI International Metals, Inc. (manufacture and distribution of titanium), Canadian National Railway (railroad) and White Mountains Insurance Group, Ltd. (holding company). |
|
Principal Occupation During at Least the Past 5 Years: Director or Trustee of various companies and trusts; and formerly, Assistant to the President of the United States and Secretary of the Cabinet (1990-1993); General Counsel to the United States Treasury Department (1989-1990); and Counselor to the Secretary and Assistant Secretary for Public Affairs and Public Liaison – United States Treasury Department (1988-1989). |
J. Michael Luttig (1954) One Franklin Parkway San Mateo, CA 94403-1906 | | Trustee | | Since 2009 | | 141 | | Boeing Capital Corporation (aircraft financing) (2006-2013). |
|
Principal Occupation During at Least the Past 5 Years: Executive Vice President, General Counsel and member of Executive Council, The Boeing Company (aerospace company); and formerly, Federal Appeals Court Judge, U.S. Court of Appeals for the Fourth Circuit (1991-2006). |
Frank A. Olson (1932) One Franklin Parkway San Mateo, CA 94403-1906 | | Trustee | | Since 2005 | | 141 | | Hess Corporation (exploration and refining of oil and gas) (1998-2013). |
|
Principal Occupation During at Least the Past 5 Years: Chairman Emeritus, The Hertz Corporation (car rental) (since 2000) (Chairman of the Board (1980-2000) and Chief Executive Officer (1977-1999)); and formerly, Chairman of the Board, President and Chief Executive Officer, UAL Corporation (airlines) (until 1987). |
BOD-1
| | | | | | | | |
| Name, Year of Birth and Address | | Position | | Length of
Time Served | | Number of
Portfolios in Fund
Complex Overseen
by Board Member* | | Other Directorships Held
During at Least the Past 5 Years |
Larry D. Thompson (1945) One Franklin Parkway San Mateo, CA 94403-1906 | | Trustee | | Since 2007 | | 141 | | Cbeyond, Inc. (business communications provider) (2010-2012), The Southern Company (energy company) (2010-2012) and The Washington Post Company (education and media organization). |
|
Principal Occupation During at Least the Past 5 Years: Executive Vice President – Government Affairs, General Counsel and Corporate Secretary, PepsiCo, Inc. (consumer products) (July 2012); and formerly, John A. Sibley Professor of Corporate and Business Law, University of Georgia School of Law (2011-2012); Senior Vice President – Government Affairs, General Counsel and Secretary, PepsiCo, Inc. (2004-2011); Senior Fellow of The Brookings Institution (2003-2004); Visiting Professor, University of Georgia School of Law (2004); and Deputy Attorney General, U.S. Department of Justice (2001-2003). |
John B. Wilson (1959) One Franklin Parkway San Mateo, CA 94403-1906 | | Lead Independent Trustee | | Trustee since 2007 and Lead Independent Trustee since 2008 | | 114 | | None |
|
Principal Occupation During at Least the Past 5 Years: President, Staples Europe (office supplies) (2012); President and Founder, Hyannis Port Capital, Inc. (real estate and private equity investing); serves on private and non-profit boards; and formerly, Chief Operating Officer and Executive Vice President, Gap, Inc. (retail) (1996-2000); Chief Financial Officer and Executive Vice President – Finance and Strategy, Staples, Inc. (1992-1996); Senior Vice President – Corporate Planning, Northwest Airlines, Inc. (airlines) (1990-1992); and Vice President and Partner, Bain & Company (consulting firm) (1986-1990). |
Interested Board Members and Officers
| | | | | | | | |
| Name, Year of Birth and Address | | Position | | Length of
Time Served | | Number of
Portfolios in Fund
Complex Overseen
by Board Member* | | Other Directorships Held
During at Least the Past 5 Years |
**Gregory E. Johnson (1961) One Franklin Parkway San Mateo, CA 94403-1906 | | Trustee | | Since June 2013 | | 152 | | None |
|
Principal Occupation During at Least the Past 5 Years: Chairman of the Board, Member – Office of the Chairman, Director, President and Chief Executive Officer, Franklin Resources, Inc.; officer and/or director or trustee, as the case may be, of some of the other subsidiaries of Franklin Resources, Inc. and of 44 of the investment companies in Franklin Templeton Investments; and Chairman, Investment Company Institute. |
**Rupert H. Johnson, Jr. (1940) One Franklin Parkway San Mateo, CA 94403-1906 | | Chairman of the Board and Trustee | | Chairman of the Board since June 2013 and Trustee since 1988 | | 141 | | None |
|
Principal Occupation During at Least the Past 5 Years: Vice Chairman, Member – Office of the Chairman and Director, Franklin Resources, Inc.; Director, Franklin Advisers, Inc.; Senior Vice President, Franklin Advisory Services, LLC; and officer and/or director or trustee, as the case may be, of some of the other subsidiaries of Franklin Resources, Inc. and of 41 of the investment companies in Franklin Templeton Investments. |
Alison E. Baur (1964) One Franklin Parkway San Mateo, CA 94403-1906 | | Vice President | | Since 2012 | | Not
Applicable | | Not Applicable |
|
Principal Occupation During at Least the Past 5 Years: Deputy General Counsel, Franklin Templeton Investments; and officer of some of the other subsidiaries of Franklin Resources, Inc. and of 46 of the investment companies in Franklin Templeton Investments. |
BOD-2
| | | | | | | | |
| Name, Year of Birth and Address | | Position | | Length of
Time Served | | Number of
Portfolios in Fund
Complex Overseen
by Board Member* | | Other Directorships Held
During at Least the Past 5 Years |
Laura F. Fergerson (1962) One Franklin Parkway San Mateo, CA 94403-1906 | | Chief Executive Officer – Finance and Administration | | Since 2009 | | Not
Applicable | | Not Applicable |
|
Principal Occupation During at Least the Past 5 Years: Senior Vice President, Franklin Templeton Services, LLC; and officer of 46 of the investment companies in Franklin Templeton Investments. |
Gaston Gardey (1967) One Franklin Parkway San Mateo, CA 94403-1906 | | Treasurer, Chief Financial Officer and Chief Accounting Officer | | Since 2009 | | Not
Applicable | | Not Applicable |
|
Principal Occupation During at Least the Past 5 Years: Director, Fund Accounting, Franklin Templeton Investments; and officer of 27 of the investment companies in Franklin Templeton Investments. |
Aliya S. Gordon (1973) One Franklin Parkway San Mateo, CA 94403-1906 | | Vice President | | Since 2009 | | Not
Applicable | | Not Applicable |
|
Principal Occupation During at Least the Past 5 Years: Senior Associate General Counsel, Franklin Templeton Investments; officer of 46 of the investment companies in Franklin Templeton Investments; and formerly, Litigation Associate, Steefel, Levitt & Weiss, LLP (2000-2004). |
Steven J. Gray (1955) One Franklin Parkway San Mateo, CA 94403-1906 | | Vice President | | Since 2009 | | Not
Applicable | | Not Applicable |
|
Principal Occupation During at Least the Past 5 Years: Senior Associate General Counsel, Franklin Templeton Investments; Vice President, Franklin Templeton Distributors, Inc.; and officer of 46 of the investment companies in Franklin Templeton Investments. |
Selena L. Holmes (1965) 100 Fountain Parkway St. Petersburg, FL 33716-1205 | | Vice President – AML Compliance | | Since 2012 | | Not
Applicable | | Not Applicable |
|
Principal Occupation During at Least the Past 5 Years: Director, Global Compliance Monitoring; and officer of 46 of the investment companies in Franklin Templeton Investments. |
Edward B. Jamieson (1948) One Franklin Parkway San Mateo, CA 94403-1906 | | President and Chief Executive Officer – Investment Management | | Since 2010 | | Not
Applicable | | Not Applicable |
|
Principal Occupation During at Least the Past 5 Years: President, Chief Investment Officer and Director, Franklin Advisers, Inc.; Executive Vice President, Franklin Templeton Institutional, LLC; and officer and/or trustee, as the case may be, of some of the other subsidiaries of Franklin Resources, Inc. and of 10 of the investment companies in Franklin Templeton Investments. |
Kimberly H. Novotny (1972) 300 S.E. 2nd Street Fort Lauderdale, FL 33301-1923 | | Vice President | | Since March 2013 | | Not
Applicable | | Not Applicable |
|
Principal Occupation During at Least the Past 5 Years: Associate General Counsel, Franklin Templeton Investments; Vice President and Secretary, Fiduciary Trust International of the South; Vice President, Templeton Investment Counsel, LLC; Assistant Secretary, Franklin Resources, Inc.; and officer of 46 of the investment companies in Franklin Templeton Investments. |
BOD-3
| | | | | | | | |
| Name, Year of Birth and Address | | Position | | Length of
Time Served | | Number of
Portfolios in Fund
Complex Overseen
by Board Member* | | Other Directorships Held
During at Least the Past 5 Years |
Robert C. Rosselot (1960) 300 S.E. 2nd Street Fort Lauderdale, FL 33301-1923 | | Chief Compliance Officer | | Since March 2013 | | Not
Applicable | | Not Applicable |
|
Principal Occupation During at Least the Past 5 Years: Director, Global Compliance, Franklin Templeton Investments; officer of 46 of the investment companies in Franklin Templeton Investments; and formerly, Senior Associate General Counsel, Franklin Templeton Investments (2007-2013); and Secretary and Vice President, Templeton Group of Funds (2004-2013). |
Karen L. Skidmore (1952) One Franklin Parkway San Mateo, CA 94403-1906 | | Vice President and Secretary | | Since 2006 | | Not
Applicable | | Not Applicable |
|
Principal Occupation During at Least the Past 5 Years: Senior Associate General Counsel, Franklin Templeton Investments; and officer of 46 of the investment companies in Franklin Templeton Investments. |
Craig S. Tyle (1960) One Franklin Parkway San Mateo, CA 94403-1906 | | Vice President | | Since 2005 | | Not
Applicable | | Not Applicable |
|
Principal Occupation During at Least the Past 5 Years: General Counsel and Executive Vice President, Franklin Resources, Inc.; and officer of some of the other subsidiaries of Franklin Resources, Inc. and of 46 of the investment companies in Franklin Templeton Investments. |
Lori A. Weber (1964) 300 S.E. 2nd Street Fort Lauderdale, FL 33301-1923 | | Vice President | | Since 2011 | | Not
Applicable | | Not Applicable |
|
Principal Occupation During at Least the Past 5 Years: Senior Associate General Counsel, Franklin Templeton Investments; Assistant Secretary, Franklin Resources, Inc.; Vice President and Secretary, Templeton Investment Counsel, LLC; Vice President, Fiduciary Trust International of the South; and officer of 46 of the investment companies in Franklin Templeton Investments. |
| * | We base the number of portfolios on each separate series of the U.S. registered investment companies within the Franklin Templeton Investments fund complex. These portfolios have a common investment manager or affiliated investment managers. |
| ** | Gregory E. Johnson is considered to be an interested person of the Fund under the federal securities laws due to his position as an officer and director of Franklin Resources, Inc. (Resources), which is the parent company of the Fund’s investment manager and distributor. Rupert H. Johnson, Jr. is considered to be an interested person of the Fund under the federal securities laws due to his position as officer and director and major shareholder of Resources. |
Note 1: Rupert H. Johnson, Jr. is the uncle of Gregory E. Johnson.
Note 2: Officer information is current as of the date of this report. It is possible that after this date, information about officers may change.
Note 3: Effective June 13, 2013, Charles B. Johnson ceased to be a trustee of the Fund.
The Sarbanes-Oxley Act of 2002 and Rules adopted by the Securities and Exchange Commission require the Fund to disclose whether the Fund’s Audit Committee includes at least one member who is an audit committee financial expert within the meaning of such Act and Rules. The Fund’s Board has determined that there is at least one such financial expert on the Audit Committee and has designated John B. Wilson as its audit committee financial expert. The Board believes that Mr. Wilson qualifies as such an expert in view of his extensive business background and experience, including service as chief financial officer of Staples, Inc. from 1992 to 1996. Mr. Wilson has been a Member and Chairman of the Fund’s Audit Committee since 2007. As a result of such background and experience, the Board believes that Mr. Wilson has acquired an understanding of generally accepted accounting principles and financial statements, the general application of such principles in connection with the accounting estimates, accruals and reserves, and analyzing and evaluating financial statements that present a breadth and level of complexity of accounting issues generally comparable to those of the Fund, as well as an understanding of internal controls and procedures for financial reporting and an understanding of audit committee functions. Mr. Wilson is an independent Board member as that term is defined under the relevant Securities and Exchange Commission Rules and Releases.
The Statement of Additional Information (SAI) includes additional information about the board members and is available, without charge, upon request. Shareholders may call (800) 321-8563 or their insurance companies to request the SAI.
BOD-4
Franklin Templeton Variable Insurance Products Trust
Shareholder Information
Proxy Voting Policies and Procedures
The Trust’s investment manager has established Proxy Voting Policies and Procedures (Policies) that the Trust uses to determine how to vote proxies relating to portfolio securities. Shareholders may view the Trust’s complete Policies online at franklintempleton.com. Alternatively, shareholders may request copies of the Policies free of charge by calling the Proxy Group collect at (954) 527-7678 or by sending a written request to: Franklin Templeton Companies, LLC, 300 S.E. 2nd Street, Fort Lauderdale, FL 33301, Attention: Proxy Group. Copies of the Trust’s proxy voting records are also made available online at franklintempleton.com and posted on the U.S. Securities and Exchange Commission’s website at sec.gov and reflect the most recent 12-month period ended June 30.
Quarterly Statement of Investments
The Trust files a complete statement of investments with the U.S. Securities and Exchange Commission for the first and third quarters for each fiscal year on Form N-Q. Shareholders may view the filed Form N-Q by visiting the Commission’s website at sec.gov. The filed form may also be viewed and copied at the Commission’s Public Reference Room in Washington, DC. Information regarding the operations of the Public Reference Room may be obtained by calling (800) SEC-0330.
SI-1
| | | | | | | | | | | | | | | | |
| VALUE | | BLEND | | GROWTH | | SECTOR | | GLOBAL | | INTERNATIONAL | | HYBRID | | ASSET ALLOCATION | | FIXED INCOME |
| | |
 | | < GAIN FROM OUR PERSPECTIVE® > |
Annual Report
FRANKLIN TEMPLETON
VARIABLE INSURANCE PRODUCTS TRUST
Investment Managers
Franklin Advisers, Inc.
Franklin Advisory Services, LLC
Franklin Mutual Advisers, LLC
Franklin Templeton Institutional, LLC
Templeton Asset Management Ltd.
Templeton Global Advisors Limited
Templeton Investment Counsel, LLC
Fund Administrator
Franklin Templeton Services, LLC
Distributor
Franklin Templeton Distributors, Inc.
Franklin Templeton Variable Insurance Products Trust (FTVIP) shares are not offered to the public; they are offered and sold only to: (1) insurance company separate accounts (Separate Account) to serve as the underlying investment vehicle for variable contracts; (2) certain qualified plans; and (3) other mutual funds (funds of funds).
Authorized for distribution to investors in Separate Accounts only when accompanied or preceded by the current prospectus for the applicable contract, which includes the Separate Account and the FTVIP prospectuses. Investors should carefully consider a fund’s investment goals, risks, charges and expenses before investing. The prospectus contains this and other information; please read it carefully before investing.
To ensure the highest quality of service, telephone calls to or from our service departments may be monitored, recorded and accessed. These calls can be identified by the presence of a regular beeping tone.
| | |
| © 2014 Franklin Templeton Investments. All rights reserved. | | VIP4 A 02/14 |
| (a) | The Registrant has adopted a code of ethics that applies to its principal executive officers and principal financial and accounting officer. |
| (f) | Pursuant to Item 12(a)(1), the Registrant is attaching as an exhibit a copy of its code of ethics that applies to its principal executive officers and principal financial and accounting officer. |
| Item 3. | Audit Committee Financial Expert. |
| | |
(a) | | (1) The Registrant has an audit committee financial expert serving on its audit committee. |
| | (2) The audit committee financial expert is John B. Wilson and he is “independent” as defined under the relevant Securities and Exchange Commission Rules and Releases. |
| Item 4. | Principal Accountant Fees and Services. |
The aggregate fees paid to the principal accountant for professional services rendered by the principal accountant for the audit of the registrant’s annual financial statements or for services that are normally provided by the principal accountant in connection with statutory and regulatory filings or engagements were $883,945 for the fiscal year ended December 31, 2013 and $917,092 for the fiscal year ended December 31, 2012.
There were no fees paid to the principal accountant for assurance and related services rendered by the principal accountant to the registrant that are reasonably related to the performance of the audit of the registrant’s financial statements and are not reported under paragraph (a) of Item 4.
There were no fees paid to the principal accountant for assurance and related services rendered by the principal accountant to the registrant’s investment adviser and any entity controlling, controlled by or under common control with the investment adviser that provides ongoing services to the registrant that are reasonably related to the performance of the audit of their financial statements.
The aggregate fees paid to the principal accountant for professional services rendered by the principal accountant to the registrant for tax compliance, tax advice and tax planning were $0 for the fiscal year ended December 31, 2013 and $7,040 for the fiscal year ended December 31, 2012. The services for which these fees were paid included preparation of tax returns for foreign governments and consultation on foreign withholding tax reporting.
The aggregate fees paid to the principal accountant for professional services rendered by the principal accountant to the registrant’s investment adviser and any entity controlling, controlled by or under common control with the investment adviser that provides ongoing services to the registrant for tax compliance, tax advice and tax planning were $6,930 for the fiscal year ended December 31, 2013 and $4,600 for the fiscal year ended December 31, 2012. The services for which these fees were paid included technical tax consultation for capital gain tax and withholding tax reporting for foreign governments and requirements on local country’s self certification forms.
The aggregate fees paid to the principal accountant for products and services rendered by the principal accountant to the registrant not reported in paragraphs (a)-(c) of Item 4 were $0 for the fiscal year ended December 31, 2013 and $17,390 for the fiscal year ended December 31, 2012. The services for which these fees were paid include review of materials provided to the fund Board in connection with the investment management contract renewal process and review on amortization/accretion matters.
The aggregate fees paid to the principal accountant for products and services rendered by the principal accountant to the registrant’s investment adviser and any entity controlling, controlled by or under common control with the investment adviser that provides ongoing services to the registrant other than services reported in paragraphs (a)-(c) of Item 4 were $59,809 for the fiscal year ended December 31, 2013 and $158,267 for the fiscal year ended December 31, 2012. The services for which these fees were paid included preparation and review of materials provided to the fund Board in connection with the investment management contract renewal process, certifying asset under management, and XBRL tagging on financial statements.
(e) (1) The registrant’s audit committee is directly responsible for approving the services to be provided by the auditors, including:
(i) pre-approval of all audit and audit related services;
(ii) pre-approval of all non-audit related services to be provided to the Fund by the auditors;
(iii) pre-approval of all non-audit related services to be provided to the registrant by the auditors to the registrant’s investment adviser or to any entity that controls, is controlled by or is under common control with the registrant’s investment adviser and that provides ongoing services to the registrant where the non-audit services relate directly to the operations or financial reporting of the registrant; and
(iv) establishment by the audit committee, if deemed necessary or appropriate, as an alternative to committee pre-approval of services to be provided by the auditors, as required by paragraphs (ii) and (iii) above, of policies and procedures to permit such services to be pre-approved by other means, such as through establishment of
guidelines or by action of a designated member or members of the committee; provided the policies and procedures are detailed as to the particular service and the committee is informed of each service and such policies and procedures do not include delegation of audit committee responsibilities, as contemplated under the Securities Exchange Act of 1934, to management; subject, in the case of (ii) through (iv), to any waivers, exceptions or exemptions that may be available under applicable law or rules.
(e) (2) None of the services provided to the registrant described in paragraphs (b)-(d) of Item 4 were approved by the audit committee pursuant to paragraph (c)(7)(i)(C) of Rule 2-01 of regulation S-X.
| (f) | No disclosures are required by this Item 4(f). |
(g) The aggregate non-audit fees paid to the principal accountant for services rendered by the principal accountant to the registrant and the registrant’s investment adviser and any entity controlling, controlled by or under common control with the investment adviser that provides ongoing services to the registrant were $66,739 for the fiscal year ended December 31, 2013 and $187,297 for the fiscal year ended December 31, 2012.
(h) The registrant’s audit committee of the board has considered whether the provision of non-audit services that were rendered to the registrant’s investment adviser (not including any sub-adviser whose role is primarily portfolio management and is subcontracted with or overseen by another investment adviser), and any entity controlling, controlled by, or under common control with the investment adviser that provides ongoing services to the registrant that were not pre-approved pursuant to paragraph (c)(7)(ii) of Rule 2-01 of Regulation S-X is compatible with maintaining the principal accountant’s independence.
| | |
Item 5. Audit Committee of Listed Registrants. | | N/A |
| |
Item 6. Schedule of Investments. | | N/A |
| |
Item 7. Disclosure of Proxy Voting Policies and Procedures for Closed-End Management Investment Companies. | | N/A |
| |
Item 8. Portfolio Managers of Closed-End Management Investment Companies. | | N/A |
| |
Item 9. Purchases of Equity Securities by Closed-End Management Investment Company and Affiliated Purchasers. | | N/A |
| |
Item 10. Submission of Matters to a Vote of Security Holders. | | |
There have been no changes to the procedures by which shareholders may recommend nominees to the Registrant’s Board of Trustees that would require disclosure herein.
| Item 11. | Controls and Procedures. |
(a) Evaluation of Disclosure Controls and Procedures. The Registrant maintains disclosure controls and procedures that are designed to ensure that information required to be disclosed in the Registrant’s filings under the Securities Exchange Act of 1934 and the Investment Company Act of 1940 is recorded, processed, summarized and reported within the periods specified in the rules and forms of the Securities and Exchange Commission. Such information is accumulated and communicated to the Registrant’s management, including its principal executive officer and principal financial officer, as appropriate, to allow timely decisions regarding required disclosure. The Registrant’s management, including the principal executive officer and the principal financial officer, recognizes that any set of controls and procedures, no matter how well designed and operated, can provide only reasonable assurance of achieving the desired control objectives.
Within 90 days prior to the filing date of this Shareholder Report on Form N-CSR, the Registrant had carried out an evaluation, under the supervision and with the participation of the Registrant’s management, including the Registrant’s principal executive officer and the Registrant’s principal financial officer, of the effectiveness of the design and operation of the Registrant’s disclosure controls and procedures. Based on such evaluation, the Registrant’s principal executive officer and principal financial officer concluded that the Registrant’s disclosure controls and procedures are effective.
(b) Changes in Internal Controls. There have been no changes in the Registrant’s internal controls or in other factors that could materially affect the internal controls over financial reporting subsequent to the date of their evaluation in connection with the preparation of this Shareholder Report on Form N-CSR.
(a) (1) Code of Ethics
(a) (2) Certifications pursuant to Section 302 of the Sarbanes-Oxley Act of 2002 of Laura F. Fergerson, Chief Executive Officer - Finance and Administration, and Gaston Gardey, Chief Financial Officer and Chief Accounting Officer
(b) Certifications pursuant to Section 906 of the Sarbanes-Oxley Act of 2002 of Laura F. Fergerson, Chief Executive Officer - Finance and Administration, and Gaston Gardey, Chief Financial Officer and Chief Accounting Officer
SIGNATURES
Pursuant to the requirements of the Securities Exchange Act of 1934 and the Investment Company Act of 1940, the registrant has duly caused this report to be signed on its behalf by the undersigned, thereunto duly authorized.
FRANKLIN TEMPLETON VARIABLE INSURANCE PRODUCTS TRUST
| | |
| By | | /s/ LAURA F. FERGERSON |
| | Laura F. Fergerson |
| | Chief Executive Officer – |
| | Finance and Administration |
|
| Date February 27, 2014 |
Pursuant to the requirements of the Securities Exchange Act of 1934 and the Investment Company Act of 1940, this report has been signed below by the following persons on behalf of the registrant and in the capacities and on the dates indicated.
| | |
| By | | /s/ LAURA F. FERGERSON |
| | Laura F. Fergerson |
| | Chief Executive Officer – |
| | Finance and Administration |
|
| Date February 27, 2014 |
| | |
| By | | /s/ GASTON GARDEY |
| | Gaston Gardey |
| | Chief Financial Officer and |
| | Chief Accounting Officer |
|
| Date February 27, 2014 |