UNITED STATES
SECURITIES AND EXCHANGE COMMISSION
Washington, DC 20549
FORM N-CSR
CERTIFIED SHAREHOLDER REPORT OF REGISTERED
MANAGEMENT INVESTMENT COMPANIES
Investment Company Act file number 811-05583
Franklin Templeton Variable Insurance Products Trust
(Exact name of registrant as specified in charter)
One Franklin Parkway, San Mateo, CA 94403-1906
(Address of principal executive offices) (Zip code)
Craig S. Tyle, One Franklin Parkway, San Mateo, CA 94403-1906
(Name and address of agent for service)
Registrant’s telephone number, including area code: (650) 312-2000
Date of fiscal year end: 12/31
Date of reporting period: 12/31/13
| Item 1. | Reports to Stockholders. |

DECEMBER 31, 2013
FRANKLIN TEMPLETON
VARIABLE INSURANCE PRODUCTS TRUST
ANNUAL
REPORT

FRANKLIN TEMPLETON VARIABLE INSURANCE
PRODUCTS TRUST ANNUAL REPORT
TABLEOF CONTENTS
| | | | |
Important Notes to Performance Information | | | i | |
Fund Summaries | | | | |
Templeton Developing Markets Securities Fund | | | TD-1 | |
Templeton Foreign Securities Fund | | | TF-1 | |
Templeton Global Bond Securities Fund | | | TGB-1 | |
Index Descriptions | | | I-1 | |
Board Members and Officers | | | BOD-1 | |
Shareholder Information | | | SI-1 | |
NOT FDIC INSURED | MAY LOSE VALUE | NO BANK GUARANTEE
MASTER CLASS – 3
IMPORTANT NOTESTO
PERFORMANCE INFORMATION
Performance data is historical and cannot predict or guarantee future results. Principal value and investment return will fluctuate with market conditions, and you may have a gain or loss when you withdraw your money. Inception dates of the funds may have preceded the effective dates of the subaccounts, contracts, or their availability in all states.
When reviewing the index comparisons, please keep in mind that indexes have a number of inherent performance differentials over the funds. First, unlike the funds, which must hold a minimum amount of cash to maintain liquidity, indexes do not have a cash component. Second, the funds are actively managed and, thus, are subject to management fees to cover salaries of securities analysts or portfolio managers in addition to other expenses. Indexes are unmanaged and do not include any commissions or other expenses typically associated with investing in securities. Third, indexes often contain a different mix of securities than the fund to which they are compared. Additionally, please remember that indexes are simply a measure of performance and cannot be invested in directly.
i
TEMPLETON DEVELOPING MARKETS SECURITIES FUND
This annual report for Templeton Developing Markets Securities Fund covers the fiscal year ended December 31, 2013.
Performance Summary as of 12/31/13
Average annual total return of Class 3 shares* represents the average annual change in value, assuming reinvestment of dividends and capital gains. Average returns smooth out variations in returns, which can be significant; they are not the same as year-by-year results.
Periods ended 12/31/13
| | | | | | | | | | | | |
| | | 1-Year | | | 5-Year | | | 10-Year | |
Average Annual Total Return | | | -0.97% | | | | +13.85% | | | | +9.04% | |
*Since Class 3 shares were not offered until 5/1/04, performance prior to that date represents historical Class 2 performance. Since 5/1/04 (effective date), the average annual total return of Class 3 shares was +9.31%. The Fund has a fee waiver associated with its investments in a Franklin Templeton money fund, contractually guaranteed through at least its current fiscal year end. Fund investment results reflect the fee waiver, to the extent applicable; without this reduction, the results would have been lower.
Total Return Index Comparison
for a Hypothetical $10,000 Investment (1/1/04–12/31/13)
The graph below shows the change in value of a hypothetical $10,000 investment in the Fund over the indicated period and includes reinvestment of any income or distributions. The Fund’s performance* is compared to the performance of the MSCI Emerging Markets (EM) Index and the Standard & Poor’s®/International Finance Corporation Investable (S&P®/IFCI) Composite Index. One cannot invest directly in an index, and an index is not representative of the Fund’s portfolio. Please see Important Notes to Performance Information preceding the Fund Summaries.
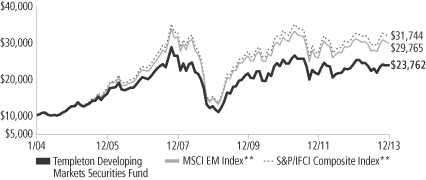
**Source: © 2014 Morningstar. Please see Index Descriptions following the Fund Summaries.
Templeton Developing Markets Securities Fund Class 3
Performance reflects the Fund’s Class 3 operating expenses, but does not include any contract fees, expenses or sales charges. If they had been included, performance would be lower. These charges and deductions, particularly for variable life policies, can have a significant effect on contract values and insurance benefits. See the contract prospectus for a complete description of these expenses, including sales charges.
Performance data represent past performance, which does not guarantee future results. Investment return and principal value will fluctuate, and you may have a gain or loss when you sell your shares.
Current performance may differ from figures shown.
TD-1
Fund Goal and Main Investments: Templeton Developing Markets Securities Fund seeks long-term capital appreciation. Under normal market conditions, the Fund invests at least 80% of its net assets in emerging market investments.
Performance Overview
You can find the Fund’s one-year total return in the Performance Summary. In comparison, the MSCI EM Index had a -2.27% total return, and the S&P/IFCI Composite Index had a -0.57% total return for the same period.1 Please note index performance numbers are for reference and we do not attempt to track an index but rather undertake investments on the basis of fundamental research.
Economic and Market Overview
The 12 months under review were characterized by reinvigorated policy support, an economic recovery in developed markets and a slowdown in emerging markets. Although several emerging market countries faced headwinds such as soft domestic demand, weak exports, market volatility and social unrest, emerging market economies overall continued to grow faster than developed market economies. Following a relatively subdued first half, China’s growth rate stabilized in the second half. Economic growth rates moderated in Russia, India and Indonesia but improved in Brazil, South Korea and Turkey. However, emerging market stock performance during the period appeared to be driven less by economic growth and corporate fundamentals and more by the fiscal and monetary policies in developed market countries.
After a weak start to 2013 as many investors locked in 2012 gains, emerging market stocks experienced a sharp sell-off in May and June amid concerns about a spike in China’s interbank rates and the U.S. Federal Reserve Board’s (Fed’s) potential tapering of its asset purchase program. When these fears were not realized, investor confidence rose in late June, leading to a partial rebound in emerging market stock prices. Financial markets grew volatile again in late August but recovered as tension surrounding Syria was defused and as the Fed announced it would delay tapering its asset purchase program. A U.S. budget impasse in late September and its resolution in October also moved the markets. The Chinese government’s announcement of social, economic and financial reforms boosted Chinese stocks in November.
1. Source: © 2014 Morningstar. One cannot invest directly in an index, and an index is not representative of the Fund’s portfolio. Please see Index Descriptions following the Fund Summaries.
Fund Risks: All investments involve risks, including possible loss of principal. Special risks are associated with foreign investing, including currency fluctuations, economic instability and political developments. Investments in developing markets, of which frontier markets are a subset, involve heightened risks related to the same factors, in addition to those associated with these markets’ smaller size, lesser liquidity and lack of established legal, political, business and social frameworks to support securities markets. Because these frameworks are typically even less developed in frontier markets, as well as various factors including the increased potential for extreme price volatility, illiquidity, trade barriers and exchange controls, the risks associated with developing markets are magnified in frontier markets. The Fund is designed for the aggressive portion of a well-diversified portfolio. The Fund is actively managed but there is no guarantee that the manager’s investment decisions will produce the desired results. The Fund’s prospectus also includes a description of the main investment risks.
TD-2
Emerging market stocks overall remained resilient despite the Fed’s December announcement that it would reduce its monthly bond purchases beginning in January 2014.
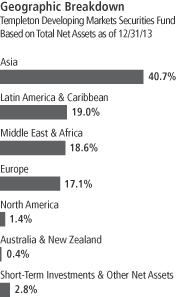
For the 12 months ended December 31, 2013, emerging market stocks, as measured by the MSCI EM Index, had a -2.27% total return in U.S. dollar terms, as weaker emerging market currencies hindered returns.1 Asia and Eastern Europe produced modest gains, while Latin America declined. In Asia, Taiwan, Malaysia, South Korea and China delivered gains, while Indonesia, Thailand, India and the Philippines posted losses. In Eastern Europe, Poland and Russia generated gains, while the Czech Republic and Hungary posted losses. Latin American markets such as Peru, Chile, Colombia and Brazil were among the worst performers, partly because of generally weak commodity prices and local currencies. In the largely frontier markets of the Middle East and Africa, the United Arab Emirates (UAE), Ghana and Kenya outperformed many of their global peers, while Lebanon, Tunisia and South Africa underperformed.
At year-end, global liquidity conditions continued to be accommodative. The Fed committed to keeping interest rates low as long as the U.S. unemployment rate remained over 6.5% and inflation expectations remained low. Furthermore, there were no signs at period-end indicating the Bank of Japan or the European Central Bank would tighten policy. We believe emerging and frontier market countries with strong economic fundamentals could continue to benefit from the high liquidity provided by major central banks, as investors seek higher yielding assets in a low interest rate environment. We viewed greater cooperation among major emerging and developed market countries as potentially beneficial for economic growth and financial markets. For example, in August, Brazil, Russia, India, China and South Africa (BRICS) decided on a capital structure for a proposed development bank aimed at supporting emerging market countries’ financing needs for infrastructure projects. In September, the BRICS countries committed $100 billion for a joint currency reserve to protect their economies from global financial market volatility and currency shocks. Toward year-end, China and the European Union agreed to negotiate a bilateral investment treaty in an effort to increase bilateral trade and improve access to each other’s markets.
TD-3
Investment Strategy
We employ a fundamental research, value-oriented, long-term investment approach. We focus on the market price of a company’s securities relative to our evaluation of its long-term earnings, asset value and cash flow potential. We also consider a company’s profit and loss outlook, balance sheet strength, cash flow trends and asset value in relation to the current price. Our analysis considers the company’s corporate governance behavior as well as its position in its sector, the economic framework and political environment. We invest in securities without regard to benchmark comparisons.
Manager’s Discussion
During the 12 months under review, key contributors to the Fund’s absolute performance included Emaar Properties, a major property developer and manager with operations throughout the Middle East, notably in Dubai, UAE; Tata Consultancy Services, one of India’s largest information technology (IT) consulting and services firms; and Melco Crown Entertainment, one of Macau’s leading casino operators.
We believe that Emaar Properties provides an attractive exposure to Dubai’s recovering real estate market. With a substantial income stream from its shopping mall and hotel properties, Emaar has a greater measure of financial security than some of its peers, in our assessment. Solid growth in all sectors of Dubai’s real estate market and the Emirate’s winning bid to host the 2020 World Expo benefited the shares of real estate companies in the region, notably Emaar. Furthermore, in our analysis, Dubai’s rising tourism could continue to support Emaar’s hotel and retail operations.
Tata Consultancy Services reported strong corporate results in 2013 amid the IT outsourcing industry’s continued growth. Moreover, the company benefited from the rupee’s significant weakness against major currencies such as the U.S. dollar and euro, as its revenues are primarily based in foreign currencies, while most costs are in rupees. In our view, Tata Consultancy is a well-managed, attractively valued service provider that is well positioned to potentially benefit from the IT outsourcing industry’s continued growth.
Melco Crown Entertainment’s solid earnings results and favorable growth outlook helped boost the casino resort operator’s share price. Macau casinos continued to report strong visitor numbers and
TD-4
gambling revenue growth, which supported the share prices of Macau-focused casino operators as investors anticipated higher earnings. We believe that Chinese consumers’ rising disposable income could potentially benefit leisure businesses such as Melco Crown. Additionally, recent improvements to the transportation links between China’s population centers and Macau could potentially lead to strong revenue growth.
In contrast, key detractors from the Fund’s absolute performance included Souza Cruz, a major Brazilian cigarette company; Brazil-based Ambev, one of the world’s largest beer and soft drink producers; and Antofagasta, a Chilean copper mining group.
Brazil’s weak consumer demand, currency depreciation and higher taxes resulted in a challenging operating environment for Souza Cruz and Ambev in 2013, leading to share price declines. In our longer term view, however, we considered these companies to be attractive investments based on our belief that they have strong operations, low debt levels, dominant market shares and popular brands. Moreover, Brazil’s hosting of the 2014 FIFA World Cup and 2016 Summer Olympics could potentially support consumer demand.
Concerns about copper prices and weak demand pressured the stocks of many copper mining companies, including Antofagasta. We divested the Fund’s holdings in the company to raise funds for investment opportunities that we considered to be more attractive within our investment universe.
It is important to recognize the effect of currency movements on the Fund’s performance. In general, if the value of the U.S. dollar goes up compared with a foreign currency, an investment traded in that foreign currency will go down in value because it will be worth fewer U.S. dollars. This can have a negative effect on Fund performance. Conversely, when the U.S. dollar weakens in relation to a foreign currency, an investment traded in that foreign currency will increase in value, which can contribute to Fund performance. For the 12 months ended December 31, 2013, the U.S. dollar rose in value relative to most currencies. As a result, the Fund’s performance was negatively affected by the portfolio’s investment predominantly in securities with non-U.S. currency exposure.
In the past 12 months, our continued search for investments we considered to be attractively valued led us to increase the Fund’s exposure to Hong Kong, South Korea and Macau and to initiate a position in the
Top 10 Holdings
Templeton Developing Markets Securities Fund
12/31/13
| | | | |
Company
Sector/Industry,
Country | | % of Total
Net Assets | |
| Ambev SA | | | 10.6% | |
| Beverages, Brazil | | | | |
| Souza Cruz SA | | | 4.5% | |
| Tobacco, Brazil | | | | |
| Remgro Ltd. | | | 4.4% | |
Diversified Financial Services,
South Africa | |
| Emaar Properties PJSC | | | 4.3% | |
| Real Estate Management & Development, UAE | | | | |
| Melco Crown Entertainment Ltd., ADR | | | 3.7% | |
Hotels, Restaurants & Leisure,
China | |
| Tata Consultancy Services Ltd. | | | 3.7% | |
| IT Services, India | | | | |
| SJM Holdings Ltd. | | | 3.5% | |
Hotels, Restaurants & Leisure,
Hong Kong | |
| Sands China Ltd. | | | 3.3% | |
Hotels, Restaurants & Leisure,
Macau | |
| Compagnie Financiere Richemont SA | | | 3.0% | |
| Textiles, Apparel & Luxury Goods, Switzerland | | | | |
| Samsung Electronics Co. Ltd. | | | 2.9% | |
| Semiconductors & Semiconductor Equipment, South Korea | | | | |
The dollar value, number of shares or principal amount, and names of all portfolio holdings are listed in the Fund’s Statement of Investments.
TD-5
Philippines. We also made some purchases in the U.K., Switzerland and Belgium as we identified companies listed in these developed countries that have significant emerging market operations, giving them the potential to benefit from emerging market countries’ stronger personal income and consumer demand growth. Moreover, we added to the Fund’s investments in Saudi Arabia, Qatar, the UAE and Nigeria as we identified companies in these frontier market countries that we believe have solid growth potential. We made some of the largest additions in hotels, restaurants and leisure; beverages; tobacco; real estate management and development; and textiles, apparel and luxury goods companies. Key purchases included new positions in Unilever, a U.K.-listed global consumer products company with more than 50% of its sales in emerging and frontier markets; Sands China and Melco Crown Entertainment, two of Macau’s leading casino operators; and Belgium-listed Anheuser-Busch InBev, the world’s largest brewer.
Conversely, we reduced the Fund’s investments in Russia, Indonesia, India and China via China H shares as certain stocks reached their target prices and as we focused on stocks we considered to be more attractively valued within our investment universe.2 We reduced the Fund’s holdings largely in oil, gas and consumable fuels; commercial banking; and automobile companies. Key sales included the Fund’s positions in Indonesian car and motorcycle manufacturer Astra International, Chinese oil and gas company PetroChina and Thai commercial bank Kasikornbank.
Thank you for your participation in Templeton Developing Markets Securities Fund. We look forward to serving your future investment needs.
2. “China H” denotes shares of China-incorporated, Hong Kong Stock Exchange-listed companies with most businesses in China.
The foregoing information reflects our analysis, opinions and portfolio holdings as of December 31, 2013, the end of the reporting period. The way we implement our main investment strategies and the resulting portfolio holdings may change depending on factors such as market and economic conditions. These opinions may not be relied upon as investment advice or an offer for a particular security. The information is not a complete analysis of every aspect of any market, country, industry, security or the Fund. Statements of fact are from sources considered reliable, but the investment manager makes no representation or warranty as to their completeness or accuracy. Although historical performance is no guarantee of future results, these insights may help you understand our investment management philosophy.
Top 10 Countries
Templeton Developing Markets Securities Fund
12/31/13
| | | | |
| | | % of Total
Net Assets | |
| Brazil | | | 16.6% | |
| Hong Kong | | | 11.4% | |
| China | | | 11.2% | |
| U.K. | | | 5.6% | |
| India | | | 5.1% | |
| South Africa | | | 5.0% | |
| Russia | | | 4.9% | |
| UAE | | | 4.3% | |
| South Korea | | | 4.3% | |
| Macau | | | 3.3% | |
TD-6
Fund Expenses
As an investor in a variable insurance contract (Contract) that indirectly provides for investment in an underlying mutual fund, you can incur transaction and/or ongoing expenses at both the Fund level and the Contract level.
| • | | Transaction expenses can include sales charges (loads) on purchases, redemption fees, surrender fees, transfer fees and premium taxes. |
| • | | Ongoing expenses can include management fees, distribution and service (12b-1) fees, contract fees, annual maintenance fees, mortality and expense risk fees and other fees and expenses. All mutual funds and Contracts have some types of ongoing expenses. |
The expenses shown in the table are meant to highlight ongoing expenses at the Fund level only and do not include ongoing expenses at the Contract level, or transaction expenses at either the Fund or Contract level. While the Fund does not have transaction expenses, if the transaction and ongoing expenses at the Contract level were included, the expenses shown below would be higher. You should consult your Contract prospectus or disclosure document for more information.
The table shows Fund-level ongoing expenses and can help you understand these expenses and compare them with those of other mutual funds offered through the Contract. The table assumes a $1,000 investment held for the six months indicated. Please refer to the Fund prospectus for additional information on operating expenses.
Actual Fund Expenses
The first line (Actual) of the table provides actual account values and expenses. The “Ending Account Value” is derived from the Fund’s actual return, which includes the effect of ongoing Fund expenses, but does not include the effect of ongoing Contract expenses.
You can estimate the Fund-level expenses you incurred during the period by following these steps. Of course, your account value and expenses will differ from those in this illustration:
| 1. | Divide your account value by $1,000. |
If an account had an $8,600 value, then $8,600 ÷ $1,000 = 8.6.
| 2. | Multiply the result by the number under the heading “Fund-Level Expenses Incurred During Period.” |
If Fund-Level Expenses Incurred During Period were $7.50, then 8.6 x $7.50 = $64.50.
In this illustration, the estimated expenses incurred this period at the Fund level are $64.50.
Templeton Developing Markets Securities Fund Class 3
TD-7
Hypothetical Example for Comparison with Other Mutual Funds
Information in the second line (Hypothetical) of the table can help you compare ongoing expenses of the Fund with those of other mutual funds offered through the Contract. This information may not be used to estimate the actual ending account balance or expenses you incurred during the period. The hypothetical “Ending Account Value” is based on the Fund’s actual expense ratio and an assumed 5% annual rate of return before expenses, which does not represent the Fund’s actual return. The figure under the heading “Fund-Level Expenses Incurred During Period” shows the hypothetical expenses your account would have incurred under this scenario. You can compare this figure with the 5% hypothetical examples that appear in shareholder reports of other funds offered through a Contract.
| | | | | | | | | | | | |
| Class 3 | | Beginning
Account Value 7/1/13 | | | Ending
Account Value 12/31/13 | | | Fund-Level Expenses Incurred
During Period* 7/1/13–12/31/13 | |
Actual | | $ | 1,000 | | | $ | 1,072.00 | | | $ | 8.30 | |
Hypothetical (5% return
before expenses) | | $ | 1,000 | | | $ | 1,017.19 | | | $ | 8.08 | |
*Expenses are calculated using the most recent six-month annualized expense ratio for the Fund’s Class 3 shares (1.59%), which does not include any ongoing expenses of the Contract for which the Fund is an investment option, multiplied by the average account value over the period, multiplied by 184/365 to reflect the one-half year period.
TD-8
Franklin Templeton Variable Insurance Products Trust
Financial Highlights
Templeton Developing Markets Securities Fund
| | | | | | | | | | | | | | | | | | | | |
| | | Year Ended December 31, | |
| Class 1 | | 2013 | | | 2012 | | | 2011 | | | 2010 | | | 2009 | |
| | | | |
Per share operating performance | | | | | | | | | | | | | | | | | | | | |
(for a share outstanding throughout the year) | | | | | | | | | | | | | | | | | | | | |
Net asset value, beginning of year | | $ | 10.58 | | | $ | 9.50 | | | $ | 11.40 | | | $ | 9.86 | | | $ | 6.11 | |
| | | | |
Income from investment operationsa: | | | | | | | | | | | | | | | | | | | | |
Net investment incomeb | | | 0.13 | | | | 0.19 | | | | 0.17 | | | | 0.09 | | | | 0.12 | |
Net realized and unrealized gains (losses) | | | (0.22 | ) | | | 1.06 | | | | (1.94 | ) | | | 1.63 | | | | 4.02 | |
| | | | |
Total from investment operations | | | (0.09 | ) | | | 1.25 | | | | (1.77 | ) | | | 1.72 | | | | 4.14 | |
| | | | |
Less distributions from: | | | | | | | | | | | | | | | | | | | | |
Net investment income | | | (0.23 | ) | | | (0.17 | ) | | | (0.13 | ) | | | (0.18 | ) | | | (0.36 | ) |
Net realized gains | | | — | | | | — | | | | — | | | | — | | | | (0.03 | ) |
| | | | |
Total distributions | | | (0.23 | ) | | | (0.17 | ) | | | (0.13 | ) | | | (0.18 | ) | | | (0.39 | ) |
| | | | |
Redemption feesc | | | — | | | | — | | | | — | | | | — | | | | — | |
| | | | |
Net asset value, end of year | | $ | 10.26 | | | $ | 10.58 | | | $ | 9.50 | | | $ | 11.40 | | | $ | 9.86 | |
| | | | |
| | | | | |
Total returnd | | | (0.73)% | | | | 13.40% | | | | (15.67)% | | | | 17.83% | | | | 73.32% | |
Ratios to average net assets | | | | | | | | | | | | | | | | | | | | |
Expenses | | | 1.35% | | | | 1.35% | | | | 1.40% | | | | 1.49% | e | | | 1.45% | e |
Net investment income | | | 1.25% | | | | 1.93% | | | | 1.57% | | | | 0.87% | | | | 1.64% | |
| | | | | |
Supplemental data | | | | | | | | | | | | | | | | | | | | |
Net assets, end of year (000’s) | | $ | 145,707 | | | $ | 203,568 | | | $ | 232,544 | | | $ | 347,242 | | | $ | 325,927 | |
Portfolio turnover rate | | | 44.59% | | | | 24.45% | | | | 14.90% | | | | 24.41% | | | | 56.58% | f |
aThe amount shown for a share outstanding throughout the period may not correlate with the Statement of Operations for the period due to the timing of sales and repurchases of the Fund shares in relation to income earned and/or fluctuating market value of the investments of the Fund.
bBased on average daily shares outstanding.
cAmount rounds to less than $0.01 per share.
dTotal return does not include fees, charges or expenses imposed by the variable annuity and life insurance contracts for which the Franklin Templeton Variable Insurance Products Trust serves as an underlying investment vehicle.
eBenefit of expense reduction rounds to less than 0.01%.
fExcludes the value of portfolio securities delivered as a result of a redemption in-kind.
The accompanying notes are an integral part of these financial statements.
TD-9
Franklin Templeton Variable Insurance Products Trust
Financial Highlights (continued)
Templeton Developing Markets Securities Fund
| | | | | | | | | | | | | | | | | | | | |
| | | Year Ended December 31, | |
| Class 2 | | 2013 | | | 2012 | | | 2011 | | | 2010 | | | 2009 | |
| | | | |
Per share operating performance | | | | | | | | | | | | | | | | | | | | |
(for a share outstanding throughout the year) | | | | | | | | | | | | | | | | | | | | |
Net asset value, beginning of year | | $ | 10.50 | | | $ | 9.42 | | | $ | 11.30 | | | $ | 9.78 | | | $ | 6.04 | |
| | | | |
Income from investment operationsa: | | | | | | | | | | | | | | | | | | | | |
Net investment incomeb | | | 0.10 | | | | 0.17 | | | | 0.14 | | | | 0.06 | | | | 0.11 | |
Net realized and unrealized gains (losses) | | | (0.21 | ) | | | 1.05 | | | | (1.92 | ) | | | 1.62 | | | | 3.98 | |
| | | | |
Total from investment operations | | | (0.11 | ) | | | 1.22 | | | | (1.78 | ) | | | 1.68 | | | | 4.09 | |
| | | | |
Less distributions from: | | | | | | | | | | | | | | | | | | | | |
Net investment income | | | (0.20 | ) | | | (0.14 | ) | | | (0.10 | ) | | | (0.16 | ) | | | (0.32 | ) |
Net realized gains | | | — | | | | — | | | | — | | | | — | | | | (0.03 | ) |
| | | | |
Total distributions | | | (0.20 | ) | | | (0.14 | ) | | | (0.10 | ) | | | (0.16 | ) | | | (0.35 | ) |
| | | | |
Redemption feesc | | | — | | | | — | | | | — | | | | — | | | | — | |
| | | | |
Net asset value, end of year | | $ | 10.19 | | | $ | 10.50 | | | $ | 9.42 | | | $ | 11.30 | | | $ | 9.78 | |
| | | | |
| | | | | |
Total returnd | | | (0.92)% | | | | 13.16% | | | | (15.86)% | | | | 17.58% | | | | 72.59% | |
Ratios to average net assets | | | | | | | | | | | | | | | | | | | | |
Expenses | | | 1.60% | | | | 1.60% | | | | 1.65% | | | | 1.74% | e | | | 1.70% | e |
Net investment income | | | 1.00% | | | | 1.68% | | | | 1.32% | | | | 0.62% | | | | 1.39% | |
| | | | | |
Supplemental data | | | | | | | | | | | | | | | | | | | | |
Net assets, end of year (000’s) | | $ | 274,683 | | | $ | 291,638 | | | $ | 295,223 | | | $ | 392,546 | | | $ | 435,947 | |
Portfolio turnover rate | | | 44.59% | | | | 24.45% | | | | 14.90% | | | | 24.41% | | | | 56.58% | f |
aThe amount shown for a share outstanding throughout the period may not correlate with the Statement of Operations for the period due to the timing of sales and repurchases of the Fund shares in relation to income earned and/or fluctuating market value of the investments of the Fund.
bBased on average daily shares outstanding.
cAmount rounds to less than $0.01 per share.
dTotal return does not include fees, charges or expenses imposed by the variable annuity and life insurance contracts for which the Franklin Templeton Variable Insurance Products Trust serves as an underlying investment vehicle.
eBenefit of expense reduction rounds to less than 0.01%.
fExcludes the value of portfolio securities delivered as a result of a redemption in-kind.
The accompanying notes are an integral part of these financial statements.
TD-10
Franklin Templeton Variable Insurance Products Trust
Financial Highlights (continued)
Templeton Developing Markets Securities Fund
| | | | | | | | | | | | | | | | | | | | |
| | | Year Ended December 31, | |
| Class 3 | | 2013 | | | 2012 | | | 2011 | | | 2010 | | | 2009 | |
| | | | |
Per share operating performance | | | | | | | | | | | | | | | | | | | | |
(for a share outstanding throughout the year) | | | | | | | | | | | | | | | | | | | | |
Net asset value, beginning of year | | $ | 10.43 | | | $ | 9.36 | | | $ | 11.23 | | | $ | 9.73 | | | $ | 6.02 | |
| | | | |
Income from investment operationsa: | | | | | | | | | | | | | | | | | | | | |
Net investment incomeb | | | 0.11 | | | | 0.17 | | | | 0.14 | | | | 0.06 | | | | 0.10 | |
Net realized and unrealized gains (losses) | | | (0.22 | ) | | | 1.04 | | | | (1.91 | ) | | | 1.60 | | | | 3.97 | |
| | | | |
Total from investment operations | | | (0.11 | ) | | | 1.21 | | | | (1.77 | ) | | | 1.66 | | | | 4.07 | |
| | | | |
Less distributions from: | | | | | | | | | | | | | | | | | | | | |
Net investment income | | | (0.20 | ) | | | (0.14 | ) | | | (0.10 | ) | | | (0.16 | ) | | | (0.33 | ) |
Net realized gains | | | — | | | | — | | | | — | | | | — | | | | (0.03 | ) |
| | | | |
Total distributions | | | (0.20 | ) | | | (0.14 | ) | | | (0.10 | ) | | | (0.16 | ) | | | (0.36 | ) |
| | | | |
Redemption feesc | | | — | | | | — | | | | — | | | | — | | | | — | |
| | | | |
Net asset value, end of year | | $ | 10.12 | | | $ | 10.43 | | | $ | 9.36 | | | $ | 11.23 | | | $ | 9.73 | |
| | | | |
| | | | | |
Total returnd | | | (0.97)% | | | | 13.16% | | | | (15.86)% | | | | 17.51% | | | | 72.63% | |
Ratios to average net assets | | | | | | | | | | | | | | | | | | | | |
Expenses | | | 1.60% | | | | 1.60% | | | | 1.65% | | | | 1.74% | e | | | 1.70% | e |
Net investment income | | | 1.00% | | | | 1.68% | | | | 1.32% | | | | 0.62% | | | | 1.39% | |
| | | | | |
Supplemental data | | | | | | | | | | | | | | | | | | | | |
Net assets, end of year (000’s) | | $ | 34,651 | | | $ | 48,277 | | | $ | 44,702 | | | $ | 66,484 | | | $ | 66,718 | |
Portfolio turnover rate | | | 44.59% | | | | 24.45% | | | | 14.90% | | | | 24.41% | | | | 56.58% | f |
aThe amount shown for a share outstanding throughout the period may not correlate with the Statement of Operations for the period due to the timing of sales and repurchases of the Fund shares in relation to income earned and/or fluctuating market value of the investments of the Fund.
bBased on average daily shares outstanding.
cAmount rounds to less than $0.01 per share.
dTotal return does not include fees, charges or expenses imposed by the variable annuity and life insurance contracts for which the Franklin Templeton Variable Insurance Products Trust serves as an underlying investment vehicle.
eBenefit of expense reduction rounds to less than 0.01%.
fExcludes the value of portfolio securities delivered as a result of a redemption in-kind.
The accompanying notes are an integral part of these financial statements.
TD-11
Franklin Templeton Variable Insurance Products Trust
Financial Highlights (continued)
Templeton Developing Markets Securities Fund
| | | | | | | | | | | | | | | | | | | | |
| | | Year Ended December 31, | |
| Class 4 | | 2013 | | | 2012 | | | 2011 | | | 2010 | | | 2009 | |
| | | | |
Per share operating performance | | | | | | | | | | | | | | | | | | | | |
(for a share outstanding throughout the year) | | | | | | | | | | | | | | | | | | | | |
Net asset value, beginning of year | | $ | 10.50 | | | $ | 9.42 | | | $ | 11.30 | | | $ | 9.80 | | | $ | 6.09 | |
| | | | |
Income from investment operationsa: | | | | | | | | | | | | | | | | | | | | |
Net investment incomeb | | | 0.10 | | | | 0.16 | | | | 0.13 | | | | 0.05 | | | | 0.09 | |
Net realized and unrealized gains (losses) | | | (0.21 | ) | | | 1.04 | | | | (1.91 | ) | | | 1.61 | | | | 4.00 | |
| | | | |
Total from investment operations | | | (0.11 | ) | | | 1.20 | | | | (1.78 | ) | | | 1.66 | | | | 4.09 | |
| | | | |
Less distributions from: | | | | | | | | | | | | | | | | | | | | |
Net investment income | | | (0.19 | ) | | | (0.12 | ) | | | (0.10 | ) | | | (0.16 | ) | | | (0.35 | ) |
Net realized gains | | | — | | | | — | | | | — | | | | — | | | | (0.03 | ) |
| | | | |
Total distributions | | | (0.19 | ) | | | (0.12 | ) | | | (0.10 | ) | | | (0.16 | ) | | | (0.38 | ) |
| | | | |
Redemption feesc | | | — | | | | — | | | | — | | | | — | | | | — | |
| | | | |
Net asset value, end of year | | $ | 10.20 | | | $ | 10.50 | | | $ | 9.42 | | | $ | 11.30 | | | $ | 9.80 | |
| | | | |
| | | | | |
Total returnd | | | (1.07)% | | | | 13.06% | | | | (15.88)% | | | | 17.41% | | | | 72.45% | |
Ratios to average net assets | | | | | | | | | | | | | | | | | | | | |
Expenses | | | 1.70% | | | | 1.70% | | | | 1.75% | | | | 1.84% | e | | | 1.80% | e |
Net investment income | | | 0.90% | | | | 1.58% | | | | 1.22% | | | | 0.52% | | | | 1.29% | |
| | | | | |
Supplemental data | | | | | | | | | | | | | | | | | | | | |
Net assets, end of year (000’s) | | $ | 15,225 | | | $ | 23,341 | | | $ | 24,380 | | | $ | 37,198 | | | $ | 26,362 | |
Portfolio turnover rate | | | 44.59% | | | | 24.45% | | | | 14.90% | | | | 24.41% | | | | 56.58% | f |
aThe amount shown for a share outstanding throughout the period may not correlate with the Statement of Operations for the period due to the timing of sales and repurchases of the Fund shares in relation to income earned and/or fluctuating market value of the investments of the Fund.
bBased on average daily shares outstanding.
cAmount rounds to less than $0.01 per share.
dTotal return does not include fees, charges or expenses imposed by the variable annuity and life insurance contracts for which the Franklin Templeton Variable Insurance Products Trust serves as an underlying investment vehicle.
eBenefit of expense reduction rounds to less than 0.01%.
fExcludes the value of portfolio securities delivered as a result of a redemption in-kind.
The accompanying notes are an integral part of these financial statements.
TD-12
Franklin Templeton Variable Insurance Products Trust
Statement of Investments, December 31, 2013
| | | | | | | | | | |
| Templeton Developing Markets Securities Fund | | Industry | | Shares | | | Value | |
Closed End Funds 0.4% | | | | | | | | | | |
Romania 0.4% | | | | | | | | | | |
SIF Moldova | | Diversified Financial Services | | | 1,326,345 | | | $ | 599,363 | |
SIF Oltenia | | Diversified Financial Services | | | 1,975,791 | | | | 1,205,032 | |
| | | | | | | | | | |
Total Closed End Funds (Cost $1,309,811) | | | | | | | | | 1,804,395 | |
| | | | | | | | | | |
Common Stocks 91.0% | | | | | | | | | | |
Argentina 0.1% | | | | | | | | | | |
a,b Grupo Clarin SA, B, GDR, Reg S | | Media | | | 47,911 | | | | 275,488 | |
| | | | | | | | | | |
Australia 0.4% | | | | | | | | | | |
BHP Billiton Ltd. | | Metals & Mining | | | 56,757 | | | | 1,924,731 | |
| | | | | | | | | | |
Belgium 2.2% | | | | | | | | | | |
Anheuser-Busch InBev NV | | Beverages | | | 95,309 | | | | 10,128,595 | |
| | | | | | | | | | |
Brazil 16.6% | | | | | | | | | | |
Ambev SA | | Beverages | | | 6,811,750 | | | | 49,946,874 | |
M Dias Branco SA | | Food Products | | | 173,700 | | | | 7,353,626 | |
Souza Cruz SA | | Tobacco | | | 2,053,928 | | | | 20,964,482 | |
| | | | | | | | | | |
| | | | | | | | | 78,264,982 | |
| | | | | | | | | | |
China 11.2% | | | | | | | | | | |
AAC Technologies Holdings Inc. | | Communications Equipment | | | 889,600 | | | | 4,319,310 | |
aAngang Steel Co. Ltd., H | | Metals & Mining | | | 5,129,000 | | | | 3,809,867 | |
China Overseas Land & Investment Ltd. | | Real Estate Management & Development | | | 2,002,900 | | | | 5,630,803 | |
aChina Shipping Development Co. Ltd., H | | Marine | | | 6,062,800 | | | | 4,691,148 | |
CNOOC Ltd. | | Oil, Gas & Consumable Fuels | | | 1,191,400 | | | | 2,215,529 | |
Great Wall Motor Co. Ltd., H | | Automobiles | | | 867,077 | | | | 4,774,635 | |
Lenovo Group Ltd. | | Computers & Peripherals | | | 3,904,700 | | | | 4,748,473 | |
aMelco Crown Entertainment Ltd., ADR | | Hotels, Restaurants & Leisure | | | 448,443 | | | | 17,587,934 | |
aNetEase Inc., ADR | | Internet Software & Services | | | 63,300 | | | | 4,975,380 | |
| | | | | | | | | | |
| | | | | | | | | 52,753,079 | |
| | | | | | | | | | |
Colombia 0.4% | | | | | | | | | | |
Ecopetrol SA, ADR | | Oil, Gas & Consumable Fuels | | | 46,835 | | | | 1,800,806 | |
| | | | | | | | | | |
Egypt 0.0%† | | | | | | | | | | |
Egyptian International Pharmaceutical Industries Co. | | Pharmaceuticals | | | 23,609 | | | | 147,290 | |
| | | | | | | | | | |
Georgia 0.1% | | | | | | | | | | |
Bank of Georgia Holdings PLC | | Commercial Banks | | | 11,994 | | | | 475,171 | |
| | | | | | | | | | |
Hong Kong 11.4% | | | | | | | | | | |
Dairy Farm International Holdings Ltd. | | Food & Staples Retailing | | | 966,133 | | | | 9,178,264 | |
aEsprit Holdings Ltd. | | Specialty Retail | | | 572,600 | | | | 1,107,636 | |
Giordano International Ltd. | | Specialty Retail | | | 4,631,000 | | | | 4,138,687 | |
I.T Ltd. | | Specialty Retail | | | 1,321,100 | | | | 340,738 | |
Luk Fook Holdings (International) Ltd. | | Specialty Retail | | | 2,224,513 | | | | 8,462,751 | |
cLuk Fook Holdings (International) Ltd., 144A | | Specialty Retail | | | 130,000 | | | | 494,561 | |
MGM China Holdings Ltd. | | Hotels, Restaurants & Leisure | | | 2,826,100 | | | | 12,081,634 | |
SJM Holdings Ltd. | | Hotels, Restaurants & Leisure | | | 4,909,930 | | | | 16,399,464 | |
aSummit Ascent Holdings Ltd. | | Trading Companies & Distributors | | | 927,000 | | | | 1,482,368 | |
| | | | | | | | | | |
| | | | | | | | | 53,686,103 | |
| | | | | | | | | | |
India 5.1% | | | | | | | | | | |
Tata Consultancy Services Ltd. | | IT Services | | | 495,500 | | | | 17,394,982 | |
Tata Motors Ltd. | | Automobiles | | | 1,063,000 | | | | 6,470,136 | |
| | | | | | | | | | |
| | | | | | | | | 23,865,118 | |
| | | | | | | | | | |
TD-13
Franklin Templeton Variable Insurance Products Trust
Statement of Investments, December 31, 2013 (continued)
| | | | | | | | | | |
| Templeton Developing Markets Securities Fund | | Industry | | Shares | | | Value | |
Common Stocks (continued) | | | | | | | | | | |
Indonesia 0.4% | | | | | | | | | | |
Bank Rakyat Indonesia Persero Tbk PT | | Commercial Banks | | | 3,203,600 | | | $ | 1,908,472 | |
| | | | | | | | | | |
Kenya 1.5% | | | | | | | | | | |
East African Breweries Ltd. | | Beverages | | | 210,500 | | | | 707,358 | |
Equity Bank Ltd. | | Commercial Banks | | | 8,986,101 | | | | 3,201,884 | |
Kenya Commercial Bank Ltd. | | Commercial Banks | | | 5,335,900 | | | | 2,936,909 | |
| | | | | | | | | | |
| | | | | | | | | 6,846,151 | |
| | | | | | | | | | |
Macau 3.3% | | | | | | | | | | |
Sands China Ltd. | | Hotels, Restaurants & Leisure | | | 1,905,000 | | | | 15,624,520 | |
| | | | | | | | | | |
Mexico 0.3% | | | | | | | | | | |
Kimberly Clark de Mexico SAB de CV, A | | Household Products | | | 489,532 | | | | 1,395,388 | |
| | | | | | | | | | |
Nigeria 1.7% | | | | | | | | | | |
Ecobank Transnational Inc. | | Commercial Banks | | | 2,631,065 | | | | 265,985 | |
FBN Holdings PLC | | Commercial Banks | | | 36,527,236 | | | | 3,722,375 | |
Nigerian Breweries PLC | | Beverages | | | 3,770,084 | | | | 3,957,469 | |
| | | | | | | | | | |
| | | | | | | | | 7,945,829 | |
| | | | | | | | | | |
Philippines 1.1% | | | | | | | | | | |
Ayala Corp. | | Diversified Financial Services | | | 429,820 | | | | 5,014,567 | |
| | | | | | | | | | |
Qatar 2.5% | | | | | | | | | | |
Industries Qatar QSC | | Industrial Conglomerates | | | 255,782 | | | | 11,863,677 | |
| | | | | | | | | | |
Romania 0.2% | | | | | | | | | | |
Nuclearelectrica SA | | Independent Power Producers & Energy Traders | | | 43,925 | | | | 151,098 | |
a,c Societatea Nationala de Gaze Naturale ROMGAZ SA, 144A | | Oil, Gas & Consumable Fuels | | | 85,800 | | | | 901,783 | |
| | | | | | | | | | |
| | | | | | | | | 1,052,881 | |
| | | | | | | | | | |
Russia 3.5% | | | | | | | | | | |
cAlrosa AO, 144A | | Metals & Mining | | | 3,445,400 | | | | 3,740,600 | |
d LUKOIL Holdings, ADR | | Oil, Gas & Consumable Fuels | | | 29,958 | | | | 1,870,877 | |
d LUKOIL Holdings, ADR (London Stock Exchange) | | Oil, Gas & Consumable Fuels | | | 174,418 | | | | 10,892,404 | |
| | | | | | | | | | |
| | | | | | | | | 16,503,881 | |
| | | | | | | | | | |
Singapore 1.0% | | | | | | | | | | |
K-REIT Asia | | Real Estate Investment Trusts (REITs) | | | 5,248,511 | | | | 4,929,058 | |
| | | | | | | | | | |
South Africa 5.0% | | | | | | | | | | |
MTN Group Ltd. | | Wireless Telecommunication Services | | | 134,100 | | | | 2,774,297 | |
Remgro Ltd. | | Diversified Financial Services | | | 1,041,324 | | | | 20,629,929 | |
| | | | | | | | | | |
| | | | | | | | | 23,404,226 | |
| | | | | | | | | | |
South Korea 4.3% | | | | | | | | | | |
Grand Korea Leisure Co. Ltd. | | Hotels, Restaurants & Leisure | | | 170,220 | | | | 6,513,901 | |
Samsung Electronics Co. Ltd. | | Semiconductors & Semiconductor Equipment | | | 10,508 | | | | 13,655,996 | |
| | | | | | | | | | |
| | | | | | | | | 20,169,897 | |
| | | | | | | | | | |
Sweden 0.6% | | | | | | | | | | |
Oriflame Cosmetics SA, SDR | | Personal Products | | | 87,856 | | | | 2,697,336 | |
| | | | | | | | | | |
Switzerland 3.0% | | | | | | | | | | |
Compagnie Financiere Richemont SA | | Textiles, Apparel & Luxury Goods | | | 143,641 | | | | 14,298,886 | |
| | | | | | | | | | |
Taiwan 1.0% | | | | | | | | | | |
Taiwan Semiconductor Manufacturing Co. Ltd. | | Semiconductors & Semiconductor Equipment | | | 1,325,500 | | | | 4,687,671 | |
| | | | | | | | | | |
TD-14
Franklin Templeton Variable Insurance Products Trust
Statement of Investments, December 31, 2013 (continued)
| | | | | | | | | | |
| Templeton Developing Markets Securities Fund | | Industry | | Shares | | | Value | |
Common Stocks (continued) | | | | | | | | | | |
Thailand 1.7% | | | | | | | | | | |
Shin Corp. PCL, fgn. | | Wireless Telecommunication Services | | | 1,306,200 | | | $ | 2,774,478 | |
Thai Beverage PCL | | Beverages | | | 12,053,200 | | | | 5,158,288 | |
| | | | | | | | | | |
| | | | | | | | | 7,932,766 | |
| | | | | | | | | | |
Turkey 0.1% | | | | | | | | | | |
Yazicilar Holding AS | | Industrial Conglomerates | | | 43,862 | | | | 382,856 | |
| | | | | | | | | | |
Turkmenistan 0.1% | | | | | | | | | | |
Dragon Oil PLC | | Oil, Gas & Consumable Fuels | | | 65,784 | | | | 619,005 | |
| | | | | | | | | | |
United Arab Emirates 4.3% | | | | | | | | | | |
Emaar Properties PJSC | | Real Estate Management &
Development | | | 9,763,577 | | | | 20,308,665 | |
| | | | | | | | | | |
United Kingdom 5.6% | | | | | | | | | | |
British American Tobacco PLC | | Tobacco | | | 249,100 | | | | 13,352,129 | |
Unilever PLC | | Food Products | | | 316,084 | | | | 12,993,492 | |
| | | | | | | | | | |
| | | | | | | | | 26,345,621 | |
| | | | | | | | | | |
United States 1.4% | | | | | | | | | | |
Avon Products Inc. | | Personal Products | | | 391,680 | | | | 6,744,730 | |
| | | | | | | | | | |
Vietnam 0.2% | | | | | | | | | | |
DHG Pharmaceutical JSC | | Pharmaceuticals | | | 95,800 | | | | 517,715 | |
Dong Phu Rubber JSC | | Chemicals | | | 104,160 | | | | 231,576 | |
| | | | | | | | | | |
| | | | | | | | | 749,291 | |
| | | | | | | | | | |
Zimbabwe 0.7% | | | | | | | | | | |
Delta Corp. Ltd. | | Beverages | | | 2,209,976 | | | | 3,096,176 | |
| | | | | | | | | | |
Total Common Stocks (Cost $299,958,882) | | | | | | | | | 427,842,913 | |
| | | | | | | | | | |
eParticipatory Notes 2.8% | | | | | | | | | | |
Saudi Arabia 2.8% | | | | | | | | | | |
c Deutsche Bank AG/London, Saudi Dairy & Foodstuff Co., 144A, 5/13/14 | | Food Products | | | 55,781 | | | | 1,282,809 | |
cHSBC Bank PLC, | | | | | | | | | | |
Al Mouwasat Medical Services, 144A, 4/13/15 | | Health Care Providers & Services | | | 19,800 | | | | 485,702 | |
Etihad Etisalat Co., 144A, 12/05/14 | | Wireless Telecommunication Services | | | 515,329 | | | | 11,748,091 | |
| | | | | | | | | | |
Total Participatory Notes (Cost $10,815,443) | | | | | | | | | 13,516,602 | |
| | | | | | | | | | |
Preferred Stocks 3.0% | | | | | | | | | | |
Chile 1.6% | | | | | | | | | | |
Embotelladora Andina SA, pfd., A | | Beverages | | | 2,068,717 | | | | 7,283,521 | |
| | | | | | | | | | |
Russia 1.4% | | | | | | | | | | |
Sberbank of Russia, pfd. | | Commercial Banks | | | 2,752,211 | | | | 6,719,064 | |
| | | | | | | | | | |
Total Preferred Stocks (Cost $11,239,911) | | | | | | | | | 14,002,585 | |
| | | | | | | | | | |
Total Investments before Short Term Investments (Cost $323,324,047) | | | | | | | | | 457,166,495 | |
| | | | | | | | | | |
TD-15
Franklin Templeton Variable Insurance Products Trust
Statement of Investments, December 31, 2013 (continued)
| | | | | | | | | | |
| Templeton Developing Markets Securities Fund | | | | Shares | | | Value | |
Short Term Investments (Cost $12,277,809) 2.6% | | | | | | | | | | |
Money Market Funds 2.6% | | | | | | | | | | |
United States 2.6% | | | | | | | | | | |
a,f Institutional Fiduciary Trust Money Market Portfolio | | | | | 12,277,809 | | | $ | 12,277,809 | |
| | | | | | | | | | |
Total Investments (Cost $335,601,856) 99.8% | | | | | | | | | 469,444,304 | |
Other Assets, less Liabilities 0.2% | | | | | | | | | 821,406 | |
| | | | | | | | | | |
Net Assets 100.0% | | | | | | | | $ | 470,265,710 | |
| | | | | | | | | | |
See Abbreviations on page TD-28.
†Rounds to less than 0.1% of net assets.
aNon-income producing.
bSecurity was purchased pursuant to Regulation S under the Securities Act of 1933, which exempts from registration securities offered and sold outside of the United States. Such a security cannot be sold in the United States without either an effective registration statement filed pursuant to the Securities Act of 1933, or pursuant to an exemption from registration. This security has been deemed liquid under guidelines approved by the Trust’s Board of Trustees.
cSecurity was purchased pursuant to Rule 144A under the Securities Act of 1933 and may be sold in transactions exempt from registration only to qualified institutional buyers or in a public offering registered under the Securities Act of 1933. These securities have been deemed liquid under guidelines approved by the Trust’s Board of Trustees. At December 31, 2013, the aggregate value of these securities was $18,653,546, representing 3.97% of net assets.
dAt December 31, 2013, pursuant to the Fund’s policies and the requirements of applicable securities law, the Fund may be restricted from trading these securities for a limited or extended period of time due to ownership limits and/or potential possession of material non-public information.
eSee Note 1(c) regarding Participatory Notes.
fSee Note 7 regarding investments in the Institutional Fiduciary Trust Money Market Portfolio.
The accompanying notes are an integral part of these financial statements.
TD-16
Franklin Templeton Variable Insurance Products Trust
Financial Statements
Statement of Assets and Liabilities
December 31, 2013
| | | | |
| | | Templeton
Developing Markets
Securities Fund | |
Assets: | | | | |
Investments in securities: | | | | |
Cost - Unaffiliated issuers | | $ | 323,324,047 | |
Cost - Sweep Money Fund (Note 7) | | | 12,277,809 | |
| | | | |
Total cost of investments | | $ | 335,601,856 | |
| | | | |
Value - Unaffiliated issuers | | $ | 457,166,495 | |
Value - Sweep Money Fund (Note 7) | | | 12,277,809 | |
| | | | |
Total value of investments | | | 469,444,304 | |
Cash | | | 852 | |
Foreign currency, at value (cost $47,388) | | | 47,388 | |
Receivables: | | | | |
Investment securities sold | | | 2,415,950 | |
Capital shares sold | | | 142,999 | |
Dividends | | | 210,342 | |
Foreign tax | | | 25,179 | |
Other assets | | | 12 | |
| | | | |
Total assets | | | 472,287,026 | |
| | | | |
Liabilities: | | | | |
Payables: | | | | |
Investment securities purchased | | | 458,487 | |
Capital shares redeemed | | | 516,507 | |
Management fees | | | 433,361 | |
Administrative fees | | | 55,772 | |
Distribution fees | | | 137,500 | |
Custodian fees | | | 149,186 | |
Reports to shareholders | | | 214,744 | |
Accrued expenses and other liabilities | | | 55,759 | |
| | | | |
Total liabilities | | | 2,021,316 | |
| | | | |
Net assets, at value | | $ | 470,265,710 | |
| | | | |
Net assets consist of: | | | | |
Paid-in capital | | $ | 363,881,784 | |
Distributions in excess of net investment income | | | (481,395 | ) |
Net unrealized appreciation (depreciation) | | | 133,819,737 | |
Accumulated net realized gain (loss) | | | (26,954,416 | ) |
| | | | |
Net assets, at value | | $ | 470,265,710 | |
| | | | |
The accompanying notes are an integral part of these financial statements.
TD-17
Franklin Templeton Variable Insurance Products Trust
Financial Statements (continued)
Statement of Assets and Liabilities (continued)
December 31, 2013
| | | | |
| | | Templeton
Developing Markets
Securities Fund | |
Class 1: | | | | |
Net assets, at value | | $ | 145,707,342 | |
| | | | |
Shares outstanding | | | 14,195,852 | |
| | | | |
Net asset value and maximum offering price per share | | $ | 10.26 | |
| | | | |
Class 2: | | | | |
Net assets, at value | | $ | 274,682,503 | |
| | | | |
Shares outstanding | | | 26,966,823 | |
| | | | |
Net asset value and maximum offering price per share | | $ | 10.19 | |
| | | | |
Class 3: | | | | |
Net assets, at value | | $ | 34,650,803 | |
| | | | |
Shares outstanding | | | 3,422,536 | |
| | | | |
Net asset value and maximum offering price per sharea | | $ | 10.12 | |
| | | | |
Class 4: | | | | |
Net assets, at value | | $ | 15,225,062 | |
| | | | |
Shares outstanding | | | 1,493,241 | |
| | | | |
Net asset value and maximum offering price per share | | $ | 10.20 | |
| | | | |
aRedemption price is equal to net asset value less redemption fees retained by the Fund.
The accompanying notes are an integral part of these financial statements.
TD-18
Franklin Templeton Variable Insurance Products Trust
Financial Statements (continued)
Statement of Operations
for the year ended December 31, 2013
| | | | |
| | | Templeton
Developing Markets
Securities Fund | |
Investment income: | | | | |
Dividends (net of foreign taxes of $1,022,583) | | $ | 13,364,543 | |
Income from securities loaned | | | 14,539 | |
| | | | |
Total investment income | | | 13,379,082 | |
| | | | |
Expenses: | | | | |
Management fees (Note 3a) | | | 5,647,955 | |
Administrative fees (Note 3b) | | | 724,451 | |
Distribution fees: (Note 3c) | | | | |
Class 2 | | | 703,863 | |
Class 3 | | | 102,353 | |
Class 4 | | | 67,695 | |
Unaffiliated transfer agent fees | | | 911 | |
Custodian fees (Note 4) | | | 349,498 | |
Reports to shareholders | | | 142,286 | |
Professional fees | | | 58,627 | |
Trustees’ fees and expenses | | | 2,160 | |
Other | | | 23,136 | |
| | | | |
Total expenses | | | 7,822,935 | |
| | | | |
Net investment income | | | 5,556,147 | |
| | | | |
Realized and unrealized gains (losses): | | | | |
Net realized gain (loss) from: | | | | |
Investments | | | 68,533,153 | |
Foreign currency transactions | | | (570,528 | ) |
| | | | |
Net realized gain (loss) | | | 67,962,625 | |
| | | | |
Net change in unrealized appreciation (depreciation) on: | | | | |
Investments | | | (79,209,837 | ) |
Translation of other assets and liabilities denominated in foreign currencies | | | (468 | ) |
Change in deferred taxes on unrealized appreciation | | | 21,147 | |
| | | | |
Net change in unrealized appreciation (depreciation) | | | (79,189,158 | ) |
| | | | |
Net realized and unrealized gain (loss) | | | (11,226,533 | ) |
| | | | |
Net increase (decrease) in net assets resulting from operations | | $ | (5,670,386 | ) |
| | | | |
The accompanying notes are an integral part of these financial statements.
TD-19
Franklin Templeton Variable Insurance Products Trust
Financial Statements (continued)
Statements of Changes in Net Assets
| | | | | | | | |
| | | Templeton Developing Markets
Securities Fund | |
| | | Year Ended December 31, | |
| | | 2013 | | | 2012 | |
| | | | |
Increase (decrease) in net assets: | | | | | | | | |
Operations: | | | | | | | | |
Net investment income | | $ | 5,556,147 | | | $ | 10,321,744 | |
Net realized gain (loss) from investments and foreign currency transactions | | | 67,962,625 | | | | 37,187,656 | |
Net change in unrealized appreciation (depreciation) on investments, translation of other assets and liabilities denominated in foreign currencies and deferred taxes | | | (79,189,158 | ) | | | 25,533,270 | |
| | | | |
Net increase (decrease) in net assets resulting from operations | | | (5,670,386 | ) | | | 73,042,670 | |
| | | | |
Distributions to shareholders from: | | | | | | | | |
Net investment income: | | | | | | | | |
Class 1 | | | (3,816,779 | ) | | | (3,523,272 | ) |
Class 2 | | | (5,449,449 | ) | | | (4,111,805 | ) |
Class 3 | | | (777,644 | ) | | | (716,639 | ) |
Class 4 | | | (373,848 | ) | | | (295,623 | ) |
| | | | |
Total distributions to shareholders | | | (10,417,720 | ) | | | (8,647,339 | ) |
| | | | |
Capital share transactions: (Note 2) | | | | | | | | |
Class 1 | | | (52,075,044 | ) | | | (52,933,691 | ) |
Class 2 | | | (8,867,643 | ) | | | (36,646,633 | ) |
Class 3 | | | (12,240,084 | ) | | | (1,195,085 | ) |
Class 4 | | | (7,287,727 | ) | | | (3,647,744 | ) |
| | | | |
Total capital share transactions | | | (80,470,498 | ) | | | (94,423,153 | ) |
| | | | |
Redemption fees | | | 1,204 | | | | 1,457 | |
| | | | |
Net increase (decrease) in net assets | | | (96,557,400 | ) | | | (30,026,365 | ) |
| | | | |
Net assets: | | | | | | | | |
Beginning of year | | | 566,823,110 | | | | 596,849,475 | |
| | | | |
End of year | | $ | 470,265,710 | | | $ | 566,823,110 | |
| | | | |
Undistributed net investment income (distributions in excess of net investment income)
included in net assets: | | | | | | | | |
End of year | | $ | (481,395 | ) | | $ | 3,581,480 | |
| | | | |
The accompanying notes are an integral part of these financial statements.
TD-20
Franklin Templeton Variable Insurance Products Trust
Notes to Financial Statements
Templeton Developing Markets Securities Fund
1. ORGANIZATION AND SIGNIFICANT ACCOUNTING POLICIES
Franklin Templeton Variable Insurance Products Trust (Trust) is registered under the Investment Company Act of 1940, as amended, (1940 Act) as an open-end investment company, consisting of twenty separate funds. The Templeton Developing Markets Securities Fund (Fund) is included in this report. The financial statements of the remaining funds in the Trust are presented separately. Shares of the Fund are generally sold only to insurance company separate accounts to fund the benefits of variable life insurance policies or variable annuity contracts. The Fund offers four classes of shares: Class 1, Class 2, Class 3, and Class 4. Each class of shares differs by its distribution fees, voting rights on matters affecting a single class and its exchange privilege.
The following summarizes the Fund’s significant accounting policies.
a. Financial Instrument Valuation
The Fund’s investments in financial instruments are carried at fair value daily. Fair value is the price that would be received to sell an asset or paid to transfer a liability in an orderly transaction between market participants on the measurement date. The Fund calculates the net asset value (NAV) per share at the close of the New York Stock Exchange (NYSE), generally at 4p.m. Eastern time (NYSE close) on each day the NYSE is open for trading. Under procedures approved by the Trust’s Board of Trustees (the Board), the Fund’s administrator, investment manager and other affiliates have formed the Valuation and Liquidity Oversight Committee (VLOC). The VLOC provides administration and oversight of the Fund’s valuation policies and procedures, which are approved annually by the Board. Among other things, these procedures allow the Fund to utilize independent pricing services, quotations from securities and financial instrument dealers, and other market sources to determine fair value.
Equity securities and exchange traded funds listed on an exchange or on the NASDAQ National Market System are valued at the last quoted sale price or the official closing price of the day, respectively. Foreign equity securities are valued as of the close of trading on the foreign stock exchange on which the security is primarily traded or as of the NYSE close, whichever is earlier. The value is then converted into its U.S. dollar equivalent at the foreign exchange rate in effect at the NYSE close on the day that the value of the security is determined. Over-the-counter (OTC) securities are valued within the range of the most recent quoted bid and ask prices. Securities that trade in multiple markets or on multiple exchanges are valued according to the broadest and most representative market. Certain equity securities are valued based upon fundamental characteristics or relationships to similar securities. Investments in open-end mutual funds are valued at the closing net asset value.
The Fund has procedures to determine the fair value of financial instruments for which market prices are not reliable or readily available. Under these procedures, the VLOC convenes on a regular basis to review such financial instruments and considers a number of factors, including significant unobservable valuation inputs, when arriving at fair value. The VLOC primarily employs a market-based approach which may use related or comparable assets or liabilities, recent transactions, market multiples, book values, and other relevant information for the investment to determine the fair value of the investment. An income-based valuation approach may also be used in which the anticipated future cash flows of the investment are discounted to calculate fair value. Discounts may also be applied due to the nature or duration of any restrictions on the disposition of the investments. Due to the inherent uncertainty of valuations of such investments, the fair values may differ significantly from the values that would have been used had an active market existed. The VLOC employs various methods for calibrating these valuation approaches including a regular review of key inputs and assumptions, transactional back-testing or disposition analysis, and reviews of any related market activity.
Trading in securities on foreign securities stock exchanges and OTC markets may be completed before the daily NYSE close. In addition, trading in certain foreign markets may not take place on every NYSE business day. Occasionally, events occur between the time at which trading in a foreign security is completed and the close of the NYSE that might call into question the reliability of the value of a portfolio security held by the Fund. As a result, differences may arise between the value of the Fund’s portfolio securities as determined at the foreign market close and the latest indications of value at the close of the NYSE. In order to minimize the potential for these differences, the VLOC monitors price movements following the close of trading in foreign stock
TD-21
Franklin Templeton Variable Insurance Products Trust
Notes to Financial Statements (continued)
Templeton Developing Markets Securities Fund
1. ORGANIZATION AND SIGNIFICANT ACCOUNTING POLICIES (continued)
a. Financial Instrument Valuation (continued)
markets through a series of country specific market proxies (such as baskets of American Depositary Receipts, futures contracts and exchange traded funds). These price movements are measured against established trigger thresholds for each specific market proxy to assist in determining if an event has occurred that may call into question the reliability of the values of the foreign securities held by the Fund. If such an event occurs, the securities may be valued using fair value procedures, which may include the use of independent pricing services.
Also, when the last day of the reporting period is a non-business day, certain foreign markets may be open on those days that the NYSE is closed, which could result in differences between the value of the Fund’s portfolio securities on the last business day and the last calendar day of the reporting period. Any significant security valuation changes due to an open foreign market are adjusted and reflected by the Fund for financial reporting purposes.
b. Foreign Currency Translation
Portfolio securities and other assets and liabilities denominated in foreign currencies are translated into U.S. dollars based on the exchange rate of such currencies against U.S. dollars on the date of valuation. The Fund may enter into foreign currency exchange contracts to facilitate transactions denominated in a foreign currency. Purchases and sales of securities, income and expense items denominated in foreign currencies are translated into U.S. dollars at the exchange rate in effect on the transaction date. Portfolio securities and assets and liabilities denominated in foreign currencies contain risks that those currencies will decline in value relative to the U.S. dollar. Occasionally, events may impact the availability or reliability of foreign exchange rates used to convert the U.S. dollar equivalent value. If such an event occurs, the foreign exchange rate will be valued at fair value using procedures established and approved by the Board.
The Fund does not separately report the effect of changes in foreign exchange rates from changes in market prices on securities held. Such changes are included in net realized and unrealized gain or loss from investments on the Statement of Operations.
Realized foreign exchange gains or losses arise from sales of foreign currencies, currency gains or losses realized between the trade and settlement dates on securities transactions and the difference between the recorded amounts of dividends, interest, and foreign withholding taxes and the U.S. dollar equivalent of the amounts actually received or paid. Net unrealized foreign exchange gains and losses arise from changes in foreign exchange rates on foreign denominated assets and liabilities other than investments in securities held at the end of the reporting period.
c. Participatory Notes
The Fund invests in Participatory Notes (P-Notes). P-notes are promissory notes that are designed to offer a return linked to the performance of a particular underlying equity security or market. P-Notes are issued by banks or broker-dealers and allow the fund to gain exposure to common stocks in markets where direct investment is not allowed. Income received from P-Notes is recorded as dividend income in the Statement of Operations. P-Notes may contain various risks including the potential inability of the counterparty to fulfill their obligations under the terms of the contract. These securities may be more volatile and less liquid than other investments held by the Fund.
d. Securities Lending
The Fund participates in an agency based securities lending program. The Fund receives cash collateral against the loaned securities in an amount equal to at least 102% of the market value of the loaned securities. Collateral is maintained over the life of the loan in an amount not less than 100% of the market value of loaned securities, as determined at the close of fund business each day; any additional collateral required due to changes in security values is delivered to the Fund on the next business
TD-22
Franklin Templeton Variable Insurance Products Trust
Notes to Financial Statements (continued)
Templeton Developing Markets Securities Fund
1. ORGANIZATION AND SIGNIFICANT ACCOUNTING POLICIES (continued)
d. Securities Lending (continued)
day. The collateral is invested in a non-registered money fund. The Fund receives income from the investment of cash collateral, in addition to lending fees and rebates paid by the borrower. The Fund bears the market risk with respect to the collateral investment, securities loaned, and the risk that the agent may default on its obligations to the Fund. The securities lending agent has agreed to indemnify the Fund in the event of default by a third party borrower. At December 31, 2013, the Fund had no securities on loan.
e. Income and Deferred Taxes
It is the Fund’s policy to qualify as a regulated investment company under the Internal Revenue Code. The Fund intends to distribute to shareholders substantially all of its taxable income and net realized gains to relieve it from federal income and if applicable, excise taxes. As a result, no provision for U.S. federal income taxes is required.
The Fund may be subject to foreign taxation related to income received, capital gains on the sale of securities and certain foreign currency transactions in the foreign jurisdictions in which it invests. Foreign taxes, if any, are recorded based on the tax regulations and rates that exist in the foreign markets in which the Fund invests. When a capital gain tax is determined to apply the Fund records an estimated deferred tax liability in an amount that would be payable if the securities were disposed of on the valuation date.
The Fund recognizes the tax benefits of uncertain tax positions only when the position is “more likely than not” to be sustained upon examination by the tax authorities based on the technical merits of the tax position. As of December 31, 2013, and for all open tax years, the Fund has determined that no liability for unrecognized tax benefits is required in the Fund’s financial statements related to uncertain tax positions taken on a tax return (or expected to be taken on future tax returns). Open tax years are those that remain subject to examination and are based on each tax jurisdiction statute of limitation.
f. Security Transactions, Investment Income, Expenses and Distributions
Security transactions are accounted for on trade date. Realized gains and losses on security transactions are determined on a specific identification basis. Estimated expenses are accrued daily. Dividend income is recorded on the ex-dividend date except that certain dividends from foreign securities are recognized as soon as the Fund is notified of the ex-dividend date. Distributions to shareholders are recorded on the ex-dividend date and are determined according to income tax regulations (tax basis). Distributable earnings determined on a tax basis may differ from earnings recorded in accordance with accounting principles generally accepted in the United States of America. These differences may be permanent or temporary. Permanent differences are reclassified among capital accounts to reflect their tax character. These reclassifications have no impact on net assets or the results of operations. Temporary differences are not reclassified, as they may reverse in subsequent periods.
Common expenses incurred by the Trust are allocated among the funds based on the ratio of net assets of each fund to the combined net assets of the Trust. Fund specific expenses are charged directly to the fund that incurred the expense.
Realized and unrealized gains and losses and net investment income, not including class specific expenses, are allocated daily to each class of shares based upon the relative proportion of net assets of each class. Differences in per share distributions, by class, are generally due to differences in class specific expenses.
g. Accounting Estimates
The preparation of financial statements in accordance with accounting principles generally accepted in the United States of America requires management to make estimates and assumptions that affect the reported amounts of assets and liabilities at the date of the financial statements and the amounts of income and expenses during the reporting period. Actual results could differ from those estimates.
TD-23
Franklin Templeton Variable Insurance Products Trust
Notes to Financial Statements (continued)
Templeton Developing Markets Securities Fund
1. ORGANIZATION AND SIGNIFICANT ACCOUNTING POLICIES (continued)
h. Redemption Fees
Redemptions and exchanges of interests in an insurance company subaccount that invests in Class 3 shares of the Fund will be subject to a 1.0% short term trading fee if the interest in the subaccount has been held for less than 60 days. Such fees are retained by the Fund and accounted for as an addition to paid-in capital, allocated to each class of shares based upon the relative proportion of net assets of each class.
i. Guarantees and Indemnifications
Under the Trust’s organizational documents, its officers and trustees are indemnified by the Trust against certain liabilities arising out of the performance of their duties to the Trust. Additionally, in the normal course of business, the Trust, on behalf of the Fund, enters into contracts with service providers that contain general indemnification clauses. The Trust’s maximum exposure under these arrangements is unknown as this would involve future claims that may be made against the Trust that have not yet occurred. Currently, the Trust expects the risk of loss to be remote.
2. SHARES OF BENEFICIAL INTEREST
At December 31, 2013, there were an unlimited number of shares authorized (without par value). Transactions in the Fund’s shares were as follows:
| | | | | | | | | | | | | | | | |
| | | Year Ended December 31, | |
| | | 2013 | | | 2012 | |
| Class 1 Shares: | | Shares | | | Amount | | | Shares | | | Amount | |
Shares sold | | | 1,118,729 | | | $ | 11,636,774 | | | | 1,107,285 | | | $ | 11,165,172 | |
Shares issued in reinvestment of distributions | | | 392,673 | | | | 3,816,779 | | | | 385,901 | | | | 3,523,272 | |
Shares redeemed | | | (6,552,381 | ) | | | (67,528,597 | ) | | | (6,733,412 | ) | | | (67,622,135 | ) |
| | | | |
Net increase (decrease) | | | (5,040,979 | ) | | $ | (52,075,044 | ) | | | (5,240,226 | ) | | $ | (52,933,691 | ) |
| | | | |
Class 2 Shares: | | | | | | | | | | | | | | | | |
Shares sold | | | 5,110,513 | | | $ | 51,867,557 | | | | 3,879,555 | | | $ | 38,012,902 | |
Shares issued in reinvestment of distributions | | | 564,125 | | | | 5,449,449 | | | | 453,341 | | | | 4,111,805 | |
Shares redeemed | | | (6,483,017 | ) | | | (66,184,649 | ) | | | (7,891,630 | ) | | | (78,771,340 | ) |
| | | | |
Net increase (decrease) | | | (808,379 | ) | | $ | (8,867,643 | ) | | | (3,558,734 | ) | | $ | (36,646,633 | ) |
| | | | |
Class 3 Shares: | | | | | | | | | | | | | | | | |
Shares sold | | | 410,783 | | | $ | 4,328,836 | | | | 998,194 | | | $ | 10,036,984 | |
Shares issued in reinvestment of distributions | | | 81,005 | | | | 777,644 | | | | 79,538 | | | | 716,639 | |
Shares redeemed | | | (1,696,602 | ) | | | (17,346,564 | ) | | | (1,224,195 | ) | | | (11,948,708 | ) |
| | | | |
Net increase (decrease) | | | (1,204,814 | ) | | $ | (12,240,084 | ) | | | (146,463 | ) | | $ | (1,195,085 | ) |
| | | | |
Class 4 Shares: | | | | | | | | | | | | | | | | |
Shares sold | | | 206,201 | | | $ | 2,099,934 | | | | 257,374 | | | $ | 2,544,613 | |
Shares issued on reinvestment of distributions | | | 38,661 | | | | 373,848 | | | | 32,558 | | | | 295,623 | |
Shares redeemed | | | (973,500 | ) | | | (9,761,509 | ) | | | (656,835 | ) | | | (6,487,980 | ) |
| | | | |
Net increase (decrease) | | | (728,638 | ) | | $ | (7,287,727 | ) | | | (366,903 | ) | | $ | (3,647,744 | ) |
| | | | |
TD-24
Franklin Templeton Variable Insurance Products Trust
Notes to Financial Statements (continued)
Templeton Developing Markets Securities Fund
3. TRANSACTIONS WITH AFFILIATES
Franklin Resources, Inc. is the holding company for various subsidiaries that together are referred to as Franklin Templeton Investments. Certain officers and trustees of the Fund are also officers and/or directors of the following subsidiaries:
| | |
| Subsidiary | | Affiliation |
Templeton Asset Management Ltd. (TAML) | | Investment manager |
Franklin Templeton Services, LLC (FT Services) | | Administrative manager |
Franklin Templeton Distributors, Inc. (Distributors) | | Principal underwriter |
Franklin Templeton Investor Services, LLC (Investor Services) | | Transfer agent |
a. Management Fees
The Fund pays an investment management fee to TAML based on the average daily net assets of the Fund as follows:
| | |
| Annualized Fee Rate | | Net Assets |
| 1.100% | | Up to and including $1 billion |
| 1.050% | | Over $1 billion, up to and including $5 billion |
| 1.000% | | Over $5 billion, up to and including $10 billion |
| 0.950% | | Over $10 billion, up to and including $15 billion |
| 0.900% | | Over $15 billion, up to and including $20 billion |
| 0.850% | | In excess of $20 billion |
b. Administrative Fees
The Fund pays an administrative fee to FT Services based on the Fund’s average daily net assets as follows:
| | |
| Annualized Fee Rate | | Net Assets |
| 0.150% | | Up to and including $200 million |
| 0.135% | | Over $200 million, up to and including $700 million |
| 0.100% | | Over $700 million, up to and including $1.2 billion |
| 0.075% | | In excess of $1.2 billion |
c. Distribution Fees
The Board has adopted distribution plans for Class 2, Class 3, and Class 4 shares pursuant to Rule 12b-1 under the 1940 Act. Under the Fund’s compensation distribution plans, the Fund pays Distributors for costs incurred in connection with the servicing, sale and distribution of the Fund’s shares up to 0.25%, 0.35%, and 0.35% per year of its average daily net assets of Class 2, Class 3, and Class 4, respectively. Some distribution fees are not charged on shares held by affiliates. The Board has agreed to limit the current rate to 0.25% per year for Class 3. The plan year, for purposes of monitoring compliance with the maximum annual plan rates, is February 1 through January 31.
d. Transfer Agent Fees
Investor Services, under terms of an agreement, performs shareholder servicing for the Fund and is not paid by the Fund for the services.
4. EXPENSE OFFSET ARRANGEMENT
The Fund has entered into an arrangement with its custodian whereby credits realized as a result of uninvested cash balances are used to reduce a portion of the Fund’s custodian expenses. During the year ended December 31, 2013, there were no credits earned.
TD-25
Franklin Templeton Variable Insurance Products Trust
Notes to Financial Statements (continued)
Templeton Developing Markets Securities Fund
5. INCOME TAXES
For tax purposes, capital losses may be carried over to offset future capital gains. Capital loss carryforwards with no expiration, if any, must be fully utilized before those losses with expiration dates.
At December 31, 2013, the Fund had capital loss carryforwards of $21,512,788 expiring in 2017.
During the year ended December 31, 2013, the Fund utilized $66,613,489 of capital loss carryforwards.
The tax character of distributions paid during the years ended December 31, 2013 and 2012, was as follows:
| | | | | | | | |
| | | 2013 | | | 2012 | |
Distributions paid from ordinary income | | $ | 10,417,720 | | | $ | 8,647,339 | |
| | | | |
At December 31, 2013, the cost of investments, net unrealized appreciation (depreciation) and undistributed ordinary income for income tax purposes were as follows:
| | | | |
Cost of investments | | $ | 348,373,004 | |
| | | | |
| |
Unrealized appreciation | | $ | 129,012,176 | |
Unrealized depreciation | | | (7,940,876 | ) |
| | | | |
Net unrealized appreciation (depreciation) | | $ | 121,071,300 | |
| | | | |
Undistributed ordinary income | | $ | 6,847,606 | |
| | | | |
Differences between income and/or capital gains as determined on a book basis and a tax basis are primarily due to differing treatments of foreign currency transactions, passive foreign investment company shares, corporate actions and wash sales.
6. INVESTMENT TRANSACTIONS
Purchases and sales of investments (excluding short term securities) for the year ended December 31, 2013, aggregated $224,131,604 and $314,267,484, respectively.
7. INVESTMENTS IN INSTITUTIONAL FIDUCIARY TRUST MONEY MARKET PORTFOLIO
The Fund invests in the Institutional Fiduciary Trust Money Market Portfolio (Sweep Money Fund), an open-end investment company managed by Franklin Advisers, Inc. (an affiliate of the investment manager). Management fees paid by the Fund are reduced on assets invested in the Sweep Money Fund, in an amount not to exceed the management and administrative fees paid by the Sweep Money Fund.
8. CONCENTRATION OF RISK
Investing in foreign securities may include certain risks and considerations not typically associated with investing in U.S. securities, such as fluctuating currency values and changing local and regional economic, political and social conditions, which may result in greater market volatility. In addition, certain foreign securities may not be as liquid as U.S. securities.
9. CREDIT FACILITY
The Fund, together with other U.S. registered and foreign investment funds (collectively, Borrowers), managed by Franklin Templeton Investments, are borrowers in a joint syndicated senior unsecured credit facility totaling $1.5 billion (Global Credit
TD-26
Franklin Templeton Variable Insurance Products Trust
Notes to Financial Statements (continued)
Templeton Developing Markets Securities Fund
9. CREDIT FACILITY (continued)
Facility) which, after an extension of the original terms, matured on February 14, 2014. This Global Credit Facility provides a source of funds to the Borrowers for temporary and emergency purposes, including the ability to meet future unanticipated or unusually large redemption requests. Effective February 14, 2014, the Borrowers renewed the Global Credit Facility which matures on February 13, 2015.
Under the terms of the Global Credit Facility, the Fund shall, in addition to interest charged on any borrowings made by the Fund and other costs incurred by the Fund, pay its share of fees and expenses incurred in connection with the implementation and maintenance of the Global Credit Facility, based upon its relative share of the aggregate net assets of all of the Borrowers, including an annual commitment fee of 0.07% based upon the unused portion of the Global Credit Facility. These fees are reflected in other expenses on the Statement of Operations. During the year ended December 31, 2013, the Fund did not use the Global Credit Facility.
10. FAIR VALUE MEASUREMENTS
The Fund follows a fair value hierarchy that distinguishes between market data obtained from independent sources (observable inputs) and the Fund’s own market assumptions (unobservable inputs). These inputs are used in determining the value of the Fund’s financial instruments and are summarized in the following fair value hierarchy:
| | • | | Level 1 – quoted prices in active markets for identical financial instruments |
| | • | | Level 2 – other significant observable inputs (including quoted prices for similar financial instruments, interest rates, prepayment speed, credit risk, etc.) |
| | • | | Level 3 – significant unobservable inputs (including the Fund’s own assumptions in determining the fair value of financial instruments) |
The input levels are not necessarily an indication of the risk or liquidity associated with financial instruments at that level.
For movements between the levels within the fair value hierarchy, the Fund has adopted a policy of recognizing the transfers as of the date of the underlying event which caused the movement.
A summary of inputs used as of December 31, 2013, in valuing the Fund’s assets carried at fair value, is as follows:
| | | | | | | | | | | | | | | | |
| | | Level 1 | | | Level 2 | | | Level 3 | | | Total | |
| | | | |
Assets: | | | | | | | | | | | | | | | | |
Investments in Securities: | | | | | | | | | | | | | | | | |
Closed End Funds | | $ | 1,804,395 | | | $ | — | | | $ | — | | | $ | 1,804,395 | |
Equity Investments:a | | | | | | | | | | | | | | | | |
Russia | | | 21,352,068 | | | | 1,870,877 | | | | — | | | | 23,222,945 | |
All Other Equity Investmentsb | | | 418,622,553 | | | | — | | | | — | | | | 418,622,553 | |
Participatory Notes | | | — | | | | 13,516,602 | | | | — | | | | 13,516,602 | |
Short Term Investments | | | 12,277,809 | | | | — | | | | — | | | | 12,277,809 | |
| | | | |
Total Investments in Securities | | $ | 454,056,825 | | | $ | 15,387,479 | | | $ | — | | | $ | 469,444,304 | |
| | | | |
aIncludes common and preferred stocks.
bFor detailed categories, see the accompanying Statement of Investments.
11. NEW ACCOUNTING PRONOUNCEMENTS
In June 2013, the Financial Accounting Standards Board issued Accounting Standards Update (ASU) No. 2013-08, Investment Companies (Topic 946): Amendments to the Scope, Measurement, and Disclosure Requirements. The ASU modifies the criteria
TD-27
Franklin Templeton Variable Insurance Products Trust
Notes to Financial Statements (continued)
Templeton Developing Markets Securities Fund
11. NEW ACCOUNTING PRONOUNCEMENTS (continued)
used in defining an investment company under U.S. Generally Accepted Accounting Principles and also sets forth certain measurement and disclosure requirements. Under the ASU, an entity that is registered under the 1940 Act automatically qualifies as an investment company. The ASU is effective for interim and annual reporting periods beginning after December 15, 2013. Management has reviewed the requirements and believes the adoption of this ASU will not have a material impact on the financial statements.
12. SUBSEQUENT EVENTS
The Fund has evaluated subsequent events through the issuance of the financial statements and determined that no events have occurred that require disclosure other than those already disclosed in the financial statements.
|
ABBREVIATIONS |
| Selected Portfolio |
|
| ADR - American Depositary Receipt |
| GDR - Global Depositary Receipt |
| SDR - Swedish Depositary Receipt |
TD-28
Franklin Templeton Variable Insurance Products Trust
Templeton Developing Markets Securities Fund
Report of Independent Registered Public Accounting Firm
To the Board of Trustees and Shareholders
of Franklin Templeton Variable Insurance Products Trust
In our opinion, the accompanying statement of assets and liabilities, including the statement of investments, and the related statements of operations and of changes in net assets and the financial highlights present fairly, in all material respects, the financial position of Templeton Developing Markets Securities Fund (the “Fund”) at December 31, 2013, the results of its operations for the year then ended, the changes in its net assets for each of the two years in the period then ended and the financial highlights for each of the five years in the period then ended, in conformity with accounting principles generally accepted in the United States of America. These financial statements and financial highlights (hereafter referred to as “financial statements”) are the responsibility of the Fund’s management. Our responsibility is to express an opinion on these financial statements based on our audits. We conducted our audits of these financial statements in accordance with the standards of the Public Company Accounting Oversight Board (United States). Those standards require that we plan and perform the audit to obtain reasonable assurance about whether the financial statements are free of material misstatement. An audit includes examining, on a test basis, evidence supporting the amounts and disclosures in the financial statements, assessing the accounting principles used and significant estimates made by management, and evaluating the overall financial statement presentation. We believe that our audits, which included confirmation of securities at December 31, 2013 by correspondence with the custodian, transfer agent and brokers, provide a reasonable basis for our opinion.
PricewaterhouseCoopers LLP
San Francisco, California
February 14, 2014
TD-29
Franklin Templeton Variable Insurance Products Trust
Tax Information (unaudited)
Templeton Developing Markets Securities Fund
At December 31, 2013, more than 50% of the Fund’s total assets were invested in securities of foreign issuers. In most instances, foreign taxes were withheld from income paid to the Fund on these investments. The Fund elects to treat foreign taxes paid as allowed under Section 853 of the Internal Revenue Code (Code). This election will allow shareholders of record as of the 2014 distribution date, to treat their proportionate share of foreign taxes paid by the Fund as having been paid directly by them. The shareholder shall consider these amounts as foreign taxes paid in the tax year in which they receive the Fund distribution.
TD-30
TEMPLETON FOREIGN SECURITIES FUND
This annual report for Templeton Foreign Securities Fund covers the fiscal year ended December 31, 2013.
Performance Summary as of 12/31/13
Average annual total return of Class 3 shares* represents the average annual change in value, assuming reinvestment of dividends and capital gains. Average returns smooth out variations in returns, which can be significant; they are not the same as year-by-year results.
Periods ended 12/31/13
| | | | | | | | | | | | |
| | | 1-Year | | | 5-Year | | | 10-Year | |
Average Annual Total Return | | | +22.98% | | | | +14.09% | | | | +7.75% | |
*Since Class 3 shares were not offered until 5/1/04, performance prior to that date represents historical Class 2 performance. Since 5/1/04 (effective date), the average annual total return of Class 3 shares was +7.81%. The Fund has a fee waiver associated with its investments in a Franklin Templeton money fund, contractually guaranteed through at least its current fiscal year end. Fund investment results reflect the fee waiver, to the extent applicable; without this reduction, the results would have been lower.
Total Return Index Comparison
for a Hypothetical $10,000 Investment (1/1/04–12/31/13)
The graph below shows the change in value of a hypothetical $10,000 investment in the Fund over the indicated period and includes reinvestment of any income or distributions. The Fund’s performance* is compared to the performance of the MSCI Europe, Australasia, Far East (EAFE) Index. One cannot invest directly in an index, and an index is not representative of the Fund’s portfolio. Please see Important Notes to Performance Information preceding the Fund Summaries.
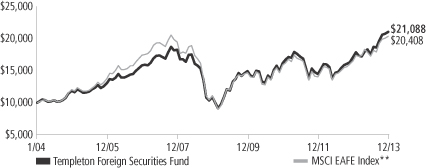
**Source: © 2014 Morningstar. Please see Index Descriptions following the Fund Summaries.
Templeton Foreign Securities Fund – Class 3
Performance reflects the Fund’s Class 3 operating expenses, but does not include any contract fees, expenses or sales charges. If they had been included, performance would be lower. These charges and deductions, particularly for variable life policies, can have a significant effect on contract values and insurance benefits. See the contract prospectus for a complete description of these expenses, including sales charges.
Performance data represent past performance, which does not guarantee future results. Investment return and principal value will fluctuate, and you may have a gain or loss when you sell your shares.
Current performance may differ from figures shown.
TF-1
Fund Goal and Main Investments: Templeton Foreign Securities Fund seeks long-term capital growth. Under normal market conditions, the Fund invests at least 80% of its net assets in investments of issuers located outside the U.S., including those in emerging markets.
Performance Overview
You can find the Fund’s one-year total return in the Performance Summary. In comparison, the Fund’s benchmark, the MSCI EAFE Index, produced a +23.29% total return for the same period.1 Please note, index performance information is provided for reference and we do not attempt to track the index but rather undertake investments on the basis of fundamental research.
Economic and Market Overview
The 12 months under review were characterized by reinvigorated policy support and an economic recovery in developed markets. However, differences in global economic trends corresponded with increasingly divergent monetary policies, and growth in emerging market economies tended to slow. The central banks of key developed markets generally reaffirmed their accommodative monetary stances while some emerging market counterparts tightened policy rates as they sought to control inflation and currency depreciation.
In the U.S., economic growth and employment trends generally exceeded expectations. The U.S. Federal Reserve Board (Fed) expanded its asset purchase program to $85 billion per month from $40 billion early in the year. After encouraging economic and employment reports, the Fed announced in December it would reduce its monthly bond purchases by $10 billion beginning in January 2014; however, the Fed committed to keeping interest rates low. In October, the federal government temporarily shut down after Congress failed to authorize routine federal funding amid a disagreement over a new health care law. However, Congress subsequently agreed to fund the government through early 2014 and later passed a two-year budget deal that could ease automatic spending cuts and lower the risk of another shutdown.
Outside the U.S., the eurozone emerged from its longest recession on record during 2013’s second half and Japan’s growth moderated. The European Central Bank reduced its policy rate to a record low and pledged to maintain systemic support following political turmoil in
1. Source: © 2014 Morningstar. One cannot invest directly in an index, and an index is not representative of the Fund’s portfolio. Please see Index Descriptions following the Fund Summaries.
Fund Risks: All investments involve risks, including possible loss of principal. Special risks are associated with foreign investing, including currency fluctuations, economic instability and political developments; investments in emerging markets involve heightened risks related to the same factors. To the extent the Fund focuses on particular countries, regions, industries, sectors or types of investment from time to time, it may be subject to greater risks of adverse developments in such areas of focus than a fund that invests in a wider variety of countries, regions, industries, sectors or investments. Current political uncertainty surrounding the European Union (EU) and its membership may increase market volatility. The financial instability of some countries in the EU, including Greece, Italy and Spain, together with the risk of that impacting other more stable countries, may increase the economic risk of investing in companies in Europe. The Fund is actively managed but there is no guarantee that the manager’s investment decisions will produce the desired results. The Fund’s prospectus also includes a description of the main investment risks.
TF-2
Greece, Spain, Portugal and Italy. Germany’s re-election of Chancellor Angela Merkel was largely perceived as a vote of support for ongoing eurozone reform measures. In Asia, the Bank of Japan set an explicit inflation target and pledged to double bond purchases in an unprecedented wave of policy reform. The U.S. dollar fell versus the euro but rose versus the Japanese yen in 2013.
Growth in many emerging markets moderated based on lower domestic demand, falling exports and weakening commodity prices. Political turmoil in certain emerging markets, the Fed’s potential tapering of its asset purchase program and the Chinese central bank’s effort to tighten liquidity to curb real estate and credit speculation led to a sell-off in emerging market equities and a sharp depreciation in regional currencies against the U.S. dollar. Central banks in Brazil, India and Indonesia raised interest rates in the second half of 2013 as they sought to curb inflation.
The stock market rally in developed markets accelerated during 2013 amid redoubled central bank commitments, continued corporate earnings strength and increasing signs of economic progress. Emerging market stocks rebounded toward period-end, although Latin American stocks trailed their emerging market peers. Oil prices rallied in the third quarter and rose for the year mainly owing to supply concerns related to geopolitical turmoil, but gold posted its largest annual price decline in more than three decades. Increasingly divergent economic and political circumstances during the period resulted in declining market correlations, which many bottom-up investors perceived as more favorable.
Investment Strategy
Our investment philosophy is bottom up, value oriented and long term. In choosing investments, we generally focus on the market price of a company’s securities relative to our evaluation of the company’s potential long-term earnings, asset value and cash flow. Among factors we consider are a company’s historical value measures, including price/earnings ratio, profit margins and liquidation value. We do in-depth research to construct a bargain list from which we buy.
Manager’s Discussion
During the 12 months under review, all sectors in the MSCI EAFE Index delivered positive returns as the broad market rallied. Our stock selection in the financials sector, especially in insurance, diversified financial services and commercial banks, was a major contributor to
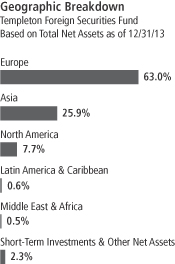
TF-3
Fund performance relative to its benchmark index.2 Among the top sector contributors were insurance providers AXA (France) and Aegon (Netherlands), diversified financial services providers ING Groep (Netherlands) and ING U.S.,3 a new holding, and commercial banks Lloyds Banking Group (U.K.), BNP Paribas (France) and UniCredit (Italy). AXA’s shares advanced through the year as the insurer reported moderate revenue growth across all its business segments and continued to focus on higher margin products. The insurer also continued to expand its presence in emerging markets by acquiring domestic insurers in China and Colombia. Our underweighting in the underperforming materials sector, especially in metals and mining, contributed to relative results.4 Stock selection in the health care sector also aided relative performance, with pharmaceutical company Roche Holding (Switzerland) as a notable contributor.5 The company reported encouraging earnings results through the year, driven by demand for its cancer drugs, especially Avastin. The drug maker also progressed on its product pipeline and launched cancer drugs Perjeta in the U.S. and Kadcyla in the European Union. Underweightings in utilities, a sector we eliminated by period-end, and in consumer staples also aided returns.6 Other individual contributors included telecommunication services provider Vodafone Group (U.K.), specialty retailer Kingfisher (U.K.) and Japanese automobile manufacturer Mazda Motor.7 Vodafone’s stock price advanced as the company entered into an agreement to sell a joint venture interest to its partner Verizon Communications and planned to return a large portion of the sale to Vodafone’s shareholders.
In contrast, our overweighting and stock selection in the energy sector detracted from Fund performance.8 Our positions in energy equipment and services companies Aker Solutions (Norway) and Trican Well Service3 (Canada) as well as Norwegian oil and natural gas producer Statoil suffered from oil price fluctuations stemming from Middle East political tensions. Our stock selection in telecommunication services companies such as wireless telecommunication provider China Mobile3 and diversified telecommunication provider China Telecom3 weighed
2. The financials sector comprises capital markets, commercial banks, diversified financial services, insurance, and real estate management and development in the SOI.
3. Not part of the index.
4. The materials sector comprises chemicals, construction materials, containers and packaging, and metals and mining in the SOI.
5. The health care sector comprises health care equipment and supplies, health care providers and services, life sciences tools and services, and pharmaceuticals in the SOI.
6. The consumer staples sector comprises food and staples retailing in the SOI.
7. Sold by period-end.
8. The energy sector comprises energy equipment and services; and oil, gas and consumable fuels in the SOI.
Top 10 Holdings
Templeton Foreign Securities Fund
12/31/13
| | | | |
Company
Sector/Industry,
Country | | % of Total
Net Assets | |
| BNP Paribas SA | | | 3.2% | |
| Commercial Banks, France | | | | |
| ING Groep NV, IDR | | | 3.0% | |
| Diversified Financial Services, Netherlands | | | | |
| GlaxoSmithKline PLC | | | 2.7% | |
| Pharmaceuticals, U.K. | | | | |
| Sanofi | | | 2.6% | |
| Pharmaceuticals, France | | | | |
| Aviva PLC | | | 2.5% | |
| Insurance, U.K. | | | | |
| Tesco PLC | | | 2.4% | |
| Food & Staples Retailing, U.K. | |
| Credit Suisse Group AG | | | 2.4% | |
| Capital Markets, Switzerland | | | | |
| Samsung Electronics Co. Ltd. | | | 2.2% | |
| Semiconductors & Semiconductor Equipment, South Korea | | | | |
| Total SA, B | | | 2.2% | |
| Oil, Gas & Consumable Fuels, France | | | | |
| AXA SA | | | 2.1% | |
| Insurance, France | | | | |
The dollar value, number of shares or principal amount, and names of all portfolio holdings are listed in the Fund’s Statement of Investments (SOI).
TF-4
on results.9 China Mobile’s stock price fell after the company reported lower-than-expected second- and third-quarter earnings because of rising network costs. Stock selection in the information technology sector detracted from relative performance, with an off-benchmark position in South Korean electronic products manufacturer Samsung Electronics as a major detractor.10 In other sectors, the Fund’s off-benchmark positions in POSCO (South Korea) and Potash Corp. of Saskatchewan7 (Canada) as well as holdings in food and staples retailer Tesco (U.K.) and Brazilian metals and mining company Vale hindered relative performance.
From a geographic perspective, our stock selection in Europe benefited the Fund’s relative performance, as a number of our investments in the U.K., Switzerland, the Netherlands, France and Italy performed well. A lack of exposure to Australia, an off-benchmark allocation to the U.S. and stock selection in Hong Kong also contributed to relative returns. However, elsewhere in Asia, off-benchmark allocations to South Korea and China detracted from relative performance. Our exposure to off-benchmark nation Canada and a few European countries, led by Norway, also hurt performance.
Thank you for your participation in Templeton Foreign Securities Fund. We look forward to serving your future investment needs.
9. The telecommunication services sector comprises diversified telecommunication services and wireless telecommunication services in the SOI.
10. The information technology sector comprises communications equipment; computers and peripherals; electronic equipment, instruments and components; semiconductors and semiconductor equipment; and software in the SOI.
The foregoing information reflects our analysis, opinions and portfolio holdings as of December 31, 2013, the end of the reporting period. The way we implement our main investment strategies and the resulting portfolio holdings may change depending on factors such as market and economic conditions. These opinions may not be relied upon as investment advice or an offer for a particular security. The information is not a complete analysis of every aspect of any market, country, industry, security or the Fund. Statements of fact are from sources considered reliable, but the investment manager makes no representation or warranty as to their completeness or accuracy. Although historical performance is no guarantee of future results, these insights may help you understand our investment management philosophy.
TF-5
Fund Expenses
As an investor in a variable insurance contract (Contract) that indirectly provides for investment in an underlying mutual fund, you can incur transaction and/or ongoing expenses at both the Fund level and the Contract level.
| • | | Transaction expenses can include sales charges (loads) on purchases, redemption fees, surrender fees, transfer fees and premium taxes. |
| • | | Ongoing expenses can include management fees, distribution and service (12b-1) fees, contract fees, annual maintenance fees, mortality and expense risk fees and other fees and expenses. All mutual funds and Contracts have some types of ongoing expenses. |
The expenses shown in the table are meant to highlight ongoing expenses at the Fund level only and do not include ongoing expenses at the Contract level, or transaction expenses at either the Fund or Contract level. While the Fund does not have transaction expenses, if the transaction and ongoing expenses at the Contract level were included, the expenses shown below would be higher. You should consult your Contract prospectus or disclosure document for more information.
The table shows Fund-level ongoing expenses and can help you understand these expenses and compare them with those of other mutual funds offered through the Contract. The table assumes a $1,000 investment held for the six months indicated. Please refer to the Fund prospectus for additional information on operating expenses.
Actual Fund Expenses
The first line (Actual) of the table provides actual account values and expenses. The “Ending Account Value” is derived from the Fund’s actual return, which includes the effect of ongoing Fund expenses, but does not include the effect of ongoing Contract expenses.
You can estimate the Fund-level expenses you incurred during the period by following these steps. Of course, your account value and expenses will differ from those in this illustration:
| 1. | Divide your account value by $1,000. |
If an account had an $8,600 value, then $8,600 ÷ $1,000 = 8.6.
| 2. | Multiply the result by the number under the heading “Fund-Level Expenses Incurred During Period.” |
If Fund-Level Expenses Incurred During Period were $7.50, then 8.6 x $7.50 = $64.50.
In this illustration, the estimated expenses incurred this period at the Fund level are $64.50.
Templeton Foreign Securities Fund – Class 3
TF-6
Hypothetical Example for Comparison with Other Mutual Funds
Information in the second line (Hypothetical) of the table can help you compare ongoing expenses of the Fund with those of other mutual funds offered through the Contract. This information may not be used to estimate the actual ending account balance or expenses you incurred during the period. The hypothetical “Ending Account Value” is based on the Fund’s actual expense ratio and an assumed 5% annual rate of return before expenses, which does not represent the Fund’s actual return. The figure under the heading “Fund-Level Expenses Incurred During Period” shows the hypothetical expenses your account would have incurred under this scenario. You can compare this figure with the 5% hypothetical examples that appear in shareholder reports of other funds offered through a Contract.
| | | | | | | | | | | | |
| Class 3 | | Beginning
Account Value 7/1/13 | | | Ending
Account Value 12/31/13 | | | Fund-Level Expenses Incurred
During Period* 7/1/13–12/31/13 | |
Actual | | $ | 1,000 | | | $ | 1,202.20 | | | $ | 5.66 | |
Hypothetical (5% return
before expenses) | | $ | 1,000 | | | $ | 1,020.06 | | | $ | 5.19 | |
*Expenses are calculated using the most recent six-month annualized expense ratio for the Fund’s Class 3 shares (1.02%), which does not include any ongoing expenses of the Contract for which the Fund is an investment option, multiplied by the average account value over the period, multiplied by 184/365 to reflect the one-half year period.
TF-7
Franklin Templeton Variable Insurance Products Trust
Financial Highlights
Templeton Foreign Securities Fund
| | | | | | | | | | | | | | | | | | | | |
| | | Year Ended December 31, | |
| Class 1 | | 2013 | | | 2012 | | | 2011 | | | 2010 | | | 2009 | |
| | | | |
Per share operating performance | | | | | | | | | | | | | | | | | | | | |
(for a share outstanding throughout the year) | | | | | | | | | | | | | | | | | | | | |
Net asset value, beginning of year | | $ | 14.63 | | | $ | 12.78 | | | $ | 14.54 | | | $ | 13.68 | | | $ | 10.95 | |
| | | | |
Income from investment operationsa: | | | | | | | | | | | | | | | | | | | | |
Net investment incomeb | | | 0.34 | | | | 0.38 | | | | 0.42 | | | | 0.28 | | | | 0.25 | |
Net realized and unrealized gains (losses) | | | 3.00 | | | | 1.91 | | | | (1.90 | ) | | | 0.86 | | | | 3.39 | |
| | | | |
Total from investment operations | | | 3.34 | | | | 2.29 | | | | (1.48 | ) | | | 1.14 | | | | 3.64 | |
| | | | |
Less distributions from: | | | | | | | | | | | | | | | | | | | | |
Net investment income | | | (0.41 | ) | | | (0.44 | ) | | | (0.28 | ) | | | (0.28 | ) | | | (0.43 | ) |
Net realized gains | | | — | | | | — | | | | — | | | | — | | | | (0.48 | ) |
| | | | |
Total distributions | | | (0.41 | ) | | | (0.44 | ) | | | (0.28 | ) | | | (0.28 | ) | | | (0.91 | ) |
| | | | |
Redemption feesc | | | — | | | | — | | | | — | | | | — | | | | — | |
| | | | |
Net asset value, end of year | | $ | 17.56 | | | $ | 14.63 | | | $ | 12.78 | | | $ | 14.54 | | | $ | 13.68 | |
| | | | |
| | | | | |
Total returnd | | | 23.27% | | | | 18.60% | | | | (10.44)% | | | | 8.67% | | | | 37.34% | |
Ratios to average net assets | | | | | | | | | | | | | | | | | | | | |
Expenses | | | 0.78% | | | | 0.79% | | | | 0.79% | e | | | 0.78% | e | | | 0.78% | e |
Net investment income | | | 2.16% | | | | 2.84% | | | | 2.92% | | | | 2.10% | | | | 2.28% | |
| | | | | |
Supplemental data | | | | | | | | | | | | | | | | | | | | |
Net assets, end of year (000’s) | | $ | 298,468 | | | $ | 265,924 | | | $ | 254,292 | | | $ | 321,282 | | | $ | 318,173 | |
Portfolio turnover rate | | | 23.61% | | | | 12.53% | | | | 21.09% | | | | 19.16% | | | | 22.50% | |
aThe amount shown for a share outstanding throughout the period may not correlate with the Statement of Operations for the period due to the timing of sales and repurchases of the Fund shares in relation to income earned and/or fluctuating market value of the investments of the Fund.
bBased on average daily shares outstanding.
cAmount rounds to less than $0.01 per share.
dTotal return does not include fees, charges or expenses imposed by the variable annuity and life insurance contracts for which the Franklin Templeton Variable Insurance Products Trust serves as an underlying investment vehicle.
eBenefit of expense reduction rounds to less than 0.01%.
The accompanying notes are an integral part of these financial statements.
TF-8
Franklin Templeton Variable Insurance Products Trust
Financial Highlights (continued)
Templeton Foreign Securities Fund
| | | | | | | | | | | | | | | | | | | | |
| | | Year Ended December 31, | |
| Class 2 | | 2013 | | | 2012 | | | 2011 | | | 2010 | | | 2009 | |
| | | | |
Per share operating performance | | | | | | | | | | | | | | | | | | | | |
(for a share outstanding throughout the year) | | | | | | | | | | | | | | | | | | | | |
Net asset value, beginning of year | | $ | 14.37 | | | $ | 12.56 | | | $ | 14.29 | | | $ | 13.45 | | | $ | 10.76 | |
| | | | |
Income from investment operationsa: | | | | | | | | | | | | | | | | | | | | |
Net investment incomeb | | | 0.30 | | | | 0.34 | | | | 0.37 | | | | 0.25 | | | | 0.22 | |
Net realized and unrealized gains (losses) | | | 2.94 | | | | 1.87 | | | | (1.86 | ) | | | 0.84 | | | | 3.34 | |
| | | | |
Total from investment operations | | | 3.24 | | | | 2.21 | | | | (1.49 | ) | | | 1.09 | | | | 3.56 | |
| | | | |
Less distributions from: | | | | | | | | | | | | | | | | | | | | |
Net investment income | | | (0.37 | ) | | | (0.40 | ) | | | (0.24 | ) | | | (0.25 | ) | | | (0.39 | ) |
Net realized gains | | | — | | | | — | | | | — | | | | — | | | | (0.48 | ) |
| | | | |
Total distributions | | | (0.37 | ) | | | (0.40 | ) | | | (0.24 | ) | | | (0.25 | ) | | | (0.87 | ) |
| | | | |
Redemption feesc | | | — | | | | — | | | | — | | | | — | | | | — | |
| | | | |
Net asset value, end of year | | $ | 17.24 | | | $ | 14.37 | | | $ | 12.56 | | | $ | 14.29 | | | $ | 13.45 | |
| | | | |
| | | | | |
Total returnd | | | 22.97% | | | | 18.23% | | | | (10.63)% | | | | 8.41% | | | | 37.04% | |
Ratios to average net assets | | | | | | | | | | | | | | | | | | | | |
Expenses | | | 1.03% | | | | 1.04% | | | | 1.04% | e | | | 1.03% | e | | | 1.03% | e |
Net investment income | | | 1.91% | | | | 2.59% | | | | 2.67% | | | | 1.85% | | | | 2.03% | |
| | | | | |
Supplemental data | | | | | | | | | | | | | | | | | | | | |
Net assets, end of year (000’s) | | $ | 1,873,586 | | | $ | 1,744,231 | | | $ | 1,679,412 | | | $ | 2,090,757 | | | $ | 2,010,268 | |
Portfolio turnover rate | | | 23.61% | | | | 12.53% | | | | 21.09% | | | | 19.16% | | | | 22.50% | |
aThe amount shown for a share outstanding throughout the period may not correlate with the Statement of Operations for the period due to the timing of sales and repurchases of the Fund shares in relation to income earned and/or fluctuating market value of the investments of the Fund.
bBased on average daily shares outstanding.
cAmount rounds to less than $0.01 per share.
dTotal return does not include fees, charges or expenses imposed by the variable annuity and life insurance contracts for which the Franklin Templeton Variable Insurance Products Trust serves as an underlying investment vehicle.
eBenefit of expense reduction rounds to less than 0.01%.
The accompanying notes are an integral part of these financial statements.
TF-9
Franklin Templeton Variable Insurance Products Trust
Financial Highlights (continued)
Templeton Foreign Securities Fund
| | | | | | | | | | | | | | | | | | | | |
| | | Year Ended December 31, | |
| Class 3 | | 2013 | | | 2012 | | | 2011 | | | 2010 | | | 2009 | |
| | | | |
Per share operating performance | | | | | | | | | | | | | | | | | | | | |
(for a share outstanding throughout the year) | | | | | | | | | | | | | | | | | | | | |
Net asset value, beginning of year | | $ | 14.32 | | | $ | 12.51 | | | $ | 14.24 | | | $ | 13.37 | | | $ | 10.70 | |
| | | | |
Income from investment operationsa: | | | | | | | | | | | | | | | | | | | | |
Net investment incomeb | | | 0.30 | | | | 0.34 | | | | 0.37 | | | | 0.25 | | | | 0.25 | |
Net realized and unrealized gains (losses) | | | 2.93 | | | | 1.87 | | | | (1.86 | ) | | | 0.84 | | | | 3.30 | |
| | | | |
Total from investment operations | | | 3.23 | | | | 2.21 | | | | (1.49 | ) | | | 1.09 | | | | 3.55 | |
| | | | |
Less distributions from: | | | | | | | | | | | | | | | | | | | | |
Net investment income | | | (0.37 | ) | | | (0.40 | ) | | | (0.24 | ) | | | (0.22 | ) | | | (0.40 | ) |
Net realized gains | | | — | | | | — | | | | — | | | | — | | | | (0.48 | ) |
| | | | |
Total distributions | | | (0.37 | ) | | | (0.40 | ) | | | (0.24 | ) | | | (0.22 | ) | | | (0.88 | ) |
| | | | |
Redemption feesc | | | — | | | | — | | | | — | | | | — | | | | — | |
| | | | |
Net asset value, end of year | | $ | 17.18 | | | $ | 14.32 | | | $ | 12.51 | | | $ | 14.24 | | | $ | 13.37 | |
| | | | |
| | | | | |
Total returnd | | | 22.98% | | | | 18.30% | | | | (10.68)% | | | | 8.41% | | | | 37.20% | |
Ratios to average net assets | | | | | | | | | | | | | | | | | | | | |
Expenses | | | 1.03% | | | | 1.04% | | | | 1.04% | e | | | 1.03% | e | | | 1.03% | e |
Net investment income | | | 1.91% | | | | 2.59% | | | | 2.67% | | | | 1.85% | | | | 2.03% | |
| | | | | |
Supplemental data | | | | | | | | | | | | | | | | | | | | |
Net assets, end of year (000’s) | | $ | 95,405 | | | $ | 91,642 | | | $ | 88,380 | | | $ | 108,766 | | | $ | 115,364 | |
Portfolio turnover rate | | | 23.61% | | | | 12.53% | | | | 21.09% | | | | 19.16% | | | | 22.50% | |
aThe amount shown for a share outstanding throughout the period may not correlate with the Statement of Operations for the period due to the timing of sales and repurchases of the Fund shares in relation to income earned and/or fluctuating market value of the investments of the Fund.
bBased on average daily shares outstanding.
cAmount rounds to less than $0.01 per share.
dTotal return does not include fees, charges or expenses imposed by the variable annuity and life insurance contracts for which the Franklin Templeton Variable Insurance Products Trust serves as an underlying investment vehicle.
eBenefit of expense reduction rounds to less than 0.01%.
The accompanying notes are an integral part of these financial statements.
TF-10
Franklin Templeton Variable Insurance Products Trust
Financial Highlights (continued)
Templeton Foreign Securities Fund
| | | | | | | | | | | | | | | | | | | | |
| | | Year Ended December 31, | |
| Class 4 | | 2013 | | | 2012 | | | 2011 | | | 2010 | | | 2009 | |
| | | | |
Per share operating performance | | | | | | | | | | | | | | | | | | | | |
(for a share outstanding throughout the year) | | | | | | | | | | | | | | | | | | | | |
Net asset value, beginning of year | | $ | 14.48 | | | $ | 12.66 | | | $ | 14.43 | | | $ | 13.59 | | | $ | 10.91 | |
| | | | |
Income from investment operationsa: | | | | | | | | | | | | | | | | | | | | |
Net investment incomeb | | | 0.28 | | | | 0.33 | | | | 0.36 | | | | 0.17 | | | | 0.21 | |
Net realized and unrealized gains (losses) | | | 2.97 | | | | 1.89 | | | | (1.88 | ) | | | 0.92 | | | | 3.37 | |
| | | | |
Total from investment operations | | | 3.25 | | | | 2.22 | | | | (1.52 | ) | | | 1.09 | | | | 3.58 | |
| | | | |
Less distributions from: | | | | | | | | | | | | | | | | | | | | |
Net investment income | | | (0.36 | ) | | | (0.40 | ) | | | (0.25 | ) | | | (0.25 | ) | | | (0.42 | ) |
Net realized gains | | | — | | | | — | | | | — | | | | — | | | | (0.48 | ) |
| | | | |
Total distributions | | | (0.36 | ) | | | (0.40 | ) | | | (0.25 | ) | | | (0.25 | ) | | | (0.90 | ) |
| | | | |
Redemption feesc | | | — | | | | — | | | | — | | | | — | | | | — | |
| | | | |
Net asset value, end of year | | $ | 17.37 | | | $ | 14.48 | | | $ | 12.66 | | | $ | 14.43 | | | $ | 13.59 | |
| | | | |
| | | | | |
Total returnd | | | 22.86% | | | | 18.14% | | | | (10.74)% | | | | 8.38% | | | | 36.84% | |
Ratios to average net assets | | | | | | | | | | | | | | | | | | | | |
Expenses | | | 1.13% | | | | 1.14% | | | | 1.14% | e | | | 1.13% | e | | | 1.13% | e |
Net investment income | | | 1.81% | | | | 2.49% | | | | 2.57% | | | | 1.75% | | | | 1.93% | |
| | | | | |
Supplemental data | | | | | | | | | | | | | | | | | | | | |
Net assets, end of year (000’s) | | $ | 513,098 | | | $ | 416,277 | | | $ | 353,346 | | | $ | 305,505 | | | $ | 48,501 | |
Portfolio turnover rate | | | 23.61% | | | | 12.53% | | | | 21.09% | | | | 19.16% | | | | 22.50% | |
aThe amount shown for a share outstanding throughout the period may not correlate with the Statement of Operations for the period due to the timing of sales and repurchases of the Fund shares in relation to income earned and/or fluctuating market value of the investments of the Fund.
bBased on average daily shares outstanding.
cAmount rounds to less than $0.01 per share.
dTotal return does not include fees, charges or expenses imposed by the variable annuity and life insurance contracts for which the Franklin Templeton Variable Insurance Products Trust serves as an underlying investment vehicle.
eBenefit of expense reduction rounds to less than 0.01%.
The accompanying notes are an integral part of these financial statements.
TF-11
Franklin Templeton Variable Insurance Products Trust
Statement of Investments, December 31, 2013
| | | | | | | | | | |
| Templeton Foreign Securities Fund | | Country | | Shares | | | Value | |
Common Stocks 97.1% | | | | | | | | | | |
Aerospace & Defense 1.1% | | | | | | | | | | |
BAE Systems PLC | | United Kingdom | | | 4,201,030 | | | $ | 30,243,321 | |
| | | | | | | | | | |
Airlines 0.8% | | | | | | | | | | |
a Deutsche Lufthansa AG | | Germany | | | 1,080,990 | | | | 22,928,024 | |
| | | | | | | | | | |
Auto Components 1.8% | | | | | | | | | | |
Cie Generale des Etablissements Michelin, B | | France | | | 222,570 | | | | 23,649,703 | |
Hyundai Mobis | | South Korea | | | 100,634 | | | | 27,977,057 | |
| | | | | | | | | | |
| | | | | | | | | 51,626,760 | |
| | | | | | | | | | |
Automobiles 1.7% | | | | | | | | | | |
Nissan Motor Co. Ltd. | | Japan | | | 1,341,500 | | | | 11,261,975 | |
Toyota Motor Corp., ADR | | Japan | | | 291,181 | | | | 35,500,788 | |
| | | | | | | | | | |
| | | | | | | | | 46,762,763 | |
| | | | | | | | | | |
Building Products 0.6% | | | | | | | | | | |
Compagnie de Saint-Gobain | | France | | | 296,890 | | | | 16,324,678 | |
| | | | | | | | | | |
Capital Markets 2.8% | | | | | | | | | | |
Credit Suisse Group AG | | Switzerland | | | 2,190,208 | | | | 66,954,736 | |
GAM Holding Ltd. | | Switzerland | | | 505,110 | | | | 9,824,179 | |
| | | | | | | | | | |
| | | | | | | | | 76,778,915 | |
| | | | | | | | | | |
Chemicals 1.6% | | | | | | | | | | |
Akzo Nobel NV | | Netherlands | | | 594,220 | | | | 46,049,475 | |
| | | | | | | | | | |
Commercial Banks 14.2% | | | | | | | | | | |
BNP Paribas SA | | France | | | 1,124,120 | | | | 87,593,758 | |
a Commerzbank AG | | Germany | | | 793,900 | | | | 12,787,430 | |
DBS Group Holdings Ltd. | | Singapore | | | 2,174,520 | | | | 29,469,244 | |
Hana Financial Group Inc. | | South Korea | | | 1,255,380 | | | | 52,202,214 | |
HSBC Holdings PLC | | United Kingdom | | | 4,015,600 | | | | 43,577,184 | |
KB Financial Group Inc., ADR | | South Korea | | | 1,189,645 | | | | 48,192,519 | |
a Lloyds Banking Group PLC | | United Kingdom | | | 19,072,470 | | | | 24,875,644 | |
Societe Generale | | France | | | 480,870 | | | | 27,925,855 | |
UniCredit SpA | | Italy | | | 6,991,743 | | | | 51,740,224 | |
United Overseas Bank Ltd. | | Singapore | | | 985,000 | | | | 16,580,599 | |
| | | | | | | | | | |
| | | | | | | | | 394,944,671 | |
| | | | | | | | | | |
Communications Equipment 0.4% | | | | | | | | | | |
Ericsson, B, ADR | | Sweden | | | 997,972 | | | | 12,215,177 | |
| | | | | | | | | | |
Computers & Peripherals 0.5% | | | | | | | | | | |
Compal Electronics Inc. | | Taiwan | | | 16,699,431 | | | | 12,791,244 | |
| | | | | | | | | | |
Construction & Engineering 0.7% | | | | | | | | | | |
Carillion PLC | | United Kingdom | | | 3,750,730 | | | | 20,520,595 | |
| | | | | | | | | | |
Construction Materials 0.6% | | | | | | | | | | |
CRH PLC | | Ireland | | | 659,820 | | | | 16,608,757 | |
| | | | | | | | | | |
Containers & Packaging 0.9% | | | | | | | | | | |
Rexam PLC | | United Kingdom | | | 2,719,161 | | | | 23,875,348 | |
| | | | | | | | | | |
Diversified Financial Services 4.4% | | | | | | | | | | |
a ING Groep NV, IDR | | Netherlands | | | 6,093,334 | | | | 84,651,943 | |
ING U.S. Inc. | | United States | | | 1,076,240 | | | | 37,829,836 | |
| | | | | | | | | | |
| | | | | | | | | 122,481,779 | |
| | | | | | | | | | |
TF-12
Franklin Templeton Variable Insurance Products Trust
Statement of Investments, December 31, 2013 (continued)
| | | | | | | | | | |
| Templeton Foreign Securities Fund | | Country | | Shares | | | Value | |
Common Stocks (continued) | | | | | | | | | | |
Diversified Telecommunication Services 5.6% | | | | | | | | | | |
China Telecom Corp. Ltd., H | | China | | | 47,482,357 | | | $ | 24,003,410 | |
Orange SA | | France | | | 1,396,683 | | | | 17,290,236 | |
Singapore Telecommunications Ltd. | | Singapore | | | 9,394,000 | | | | 27,248,407 | |
b Telefonica SA, ADR | | Spain | | | 2,270,951 | | | | 37,107,339 | |
Telenor ASA | | Norway | | | 1,103,354 | | | | 26,305,418 | |
Vivendi SA | | France | | | 928,427 | | | | 24,461,917 | |
| | | | | | | | | | |
| | | | | | | | | 156,416,727 | |
| | | | | | | | | | |
Electrical Equipment 0.9% | | | | | | | | | | |
Alstom SA | | France | | | 438,720 | | | | 15,976,586 | |
Shanghai Electric Group Co. Ltd., H | | China | | | 23,792,000 | | | | 8,590,997 | |
| | | | | | | | | | |
| | | | | | | | | 24,567,583 | |
| | | | | | | | | | |
Electronic Equipment, Instruments & Components 1.8% | | | | | | | | | | |
a Flextronics International Ltd. | | Singapore | | | 2,385,970 | | | | 18,538,987 | |
Kingboard Chemical Holdings Ltd. | | Hong Kong | | | 11,646,000 | | | | 30,337,707 | |
| | | | | | | | | | |
| | | | | | | | | 48,876,694 | |
| | | | | | | | | | |
Energy Equipment & Services 3.7% | | | | | | | | | | |
Aker Solutions ASA | | Norway | | | 1,617,940 | | | | 28,917,033 | |
Ensign Energy Services Inc. | | Canada | | | 1,965,300 | | | | 30,955,580 | |
Fugro NV, IDR | | Netherlands | | | 253,200 | | | | 15,085,600 | |
Trican Well Service Ltd. | | Canada | | | 2,373,000 | | | | 28,999,237 | |
| | | | | | | | | | |
| | | | | | | | | 103,957,450 | |
| | | | | | | | | | |
Food & Staples Retailing 3.2% | | | | | | | | | | |
Metro AG | | Germany | | | 437,967 | | | | 21,205,310 | |
Tesco PLC | | United Kingdom | | | 12,226,930 | | | | 67,709,603 | |
| | | | | | | | | | |
| | | | | | | | | 88,914,913 | |
| | | | | | | | | | |
Health Care Equipment & Supplies 1.1% | | | | | | | | | | |
Getinge AB, B | | Sweden | | | 417,870 | | | | 14,290,929 | |
Nobel Biocare Holding AG | | Switzerland | | | 974,135 | | | | 15,179,055 | |
| | | | | | | | | | |
| | | | | | | | | 29,469,984 | |
| | | | | | | | | | |
Health Care Providers & Services 0.5% | | | | | | | | | | |
Shanghai Pharmaceuticals Holding Co. Ltd., H | | China | | | 5,268,500 | | | | 12,881,900 | |
| | | | | | | | | | |
Industrial Conglomerates 2.6% | | | | | | | | | | |
Hutchison Whampoa Ltd. | | Hong Kong | | | 2,500,239 | | | | 34,016,418 | |
Siemens AG | | Germany | | | 285,414 | | | | 38,979,957 | |
| | | | | | | | | | |
| | | | | | | | | 72,996,375 | |
| | | | | | | | | | |
Insurance 10.1% | | | | | | | | | | |
ACE Ltd. | | United States | | | 307,649 | | | | 31,850,901 | |
Aegon NV | | Netherlands | | | 5,507,530 | | | | 51,983,816 | |
AIA Group Ltd. | | Hong Kong | | | 7,789,600 | | | | 39,076,833 | |
Aviva PLC | | United Kingdom | | | 9,258,670 | | | | 68,937,783 | |
AXA SA | | France | | | 2,056,508 | | | | 57,168,564 | |
Muenchener Rueckversicherungs-Gesellschaft AG | | Germany | | | 68,060 | | | | 14,992,686 | |
Swiss Re AG | | Switzerland | | | 174,680 | | | | 16,066,918 | |
| | | | | | | | | | |
| | | | | | | | | 280,077,501 | |
| | | | | | | | | | |
TF-13
Franklin Templeton Variable Insurance Products Trust
Statement of Investments, December 31, 2013 (continued)
| | | | | | | | | | |
| Templeton Foreign Securities Fund | | Country | | Shares | | | Value | |
Common Stocks (continued) | | | | | | | | | | |
Leisure Equipment & Products 1.0% | | | | | | | | | | |
Namco Bandai Holdings Inc. | | Japan | | | 977,800 | | | $ | 21,673,174 | |
Nikon Corp. | | Japan | | | 386,100 | | | | 7,366,333 | |
| | | | | | | | | | |
| | | | | | | | | 29,039,507 | |
| | | | | | | | | | |
Life Sciences Tools & Services 0.6% | | | | | | | | | | |
Lonza Group AG | | Switzerland | | | 175,440 | | | | 16,638,332 | |
| | | | | | | | | | |
Metals & Mining 2.6% | | | | | | | | | | |
HudBay Minerals Inc. | | Canada | | | 2,891,000 | | | | 23,788,862 | |
Mining and Metallurgical Co. Norilsk Nickel OJSC, ADR | | Russia | | | 317,022 | | | | 5,264,151 | |
POSCO | | South Korea | | | 136,907 | | | | 42,340,700 | |
| | | | | | | | | | |
| | | | | | | | | 71,393,713 | |
| | | | | | | | | | |
Multiline Retail 1.0% | | | | | | | | | | |
Marks & Spencer Group PLC | | United Kingdom | | | 4,066,900 | | | | 29,146,395 | |
| | | | | | | | | | |
Oil, Gas & Consumable Fuels 11.4% | | | | | | | | | | |
BP PLC | | United Kingdom | | | 5,946,135 | | | | 48,064,250 | |
China Shenhua Energy Co. Ltd., H | | China | | | 8,462,000 | | | | 26,626,706 | |
Eni SpA | | Italy | | | 1,159,640 | | | | 27,898,032 | |
LUKOIL Holdings, ADR | | Russia | | | 109,772 | | | | 6,855,261 | |
Royal Dutch Shell PLC, A | | United Kingdom | | | 16,803 | | | | 601,696 | |
Royal Dutch Shell PLC, B | | United Kingdom | | | 1,094,263 | | | | 41,308,844 | |
Statoil ASA | | Norway | | | 1,816,110 | | | | 44,017,109 | |
Suncor Energy Inc. | | Canada | | | 901,700 | | | | 31,614,469 | |
Talisman Energy Inc. | | Canada | | | 2,554,600 | | | | 29,703,253 | |
Total SA, B | | France | | | 979,926 | | | | 60,021,459 | |
| | | | | | | | | | |
| | | | | | | | | 316,711,079 | |
| | | | | | | | | | |
Pharmaceuticals 8.4% | | | | | | | | | | |
GlaxoSmithKline PLC | | United Kingdom | | | 2,772,585 | | | | 73,997,433 | |
Novartis AG | | Switzerland | | | 328,730 | | | | 26,237,964 | |
Roche Holding AG | | Switzerland | | | 179,480 | | | | 50,138,912 | |
Sanofi | | France | | | 670,755 | | | | 71,152,721 | |
Teva Pharmaceutical Industries Ltd., ADR | | Israel | | | 333,815 | | | | 13,379,305 | |
| | | | | | | | | | |
| | | | | | | | | 234,906,335 | |
| | | | | | | | | | |
Real Estate Management & Development 0.0%† | | | | | | | | | | |
Cheung Kong (Holdings) Ltd. | | Hong Kong | | | 922 | | | | 14,565 | |
| | | | | | | | | | |
Semiconductors & Semiconductor Equipment 3.1% | | | | | | | | | | |
Infineon Technologies AG | | Germany | | | 1,103,225 | | | | 11,775,691 | |
Samsung Electronics Co. Ltd. | | South Korea | | | 46,744 | | | | 60,747,607 | |
Taiwan Semiconductor Manufacturing Co. Ltd. | | Taiwan | | | 4,151,526 | | | | 14,681,997 | |
| | | | | | | | | | |
| | | | | | | | | 87,205,295 | |
| | | | | | | | | | |
Software 1.7% | | | | | | | | | | |
Capcom Co. Ltd. | | Japan | | | 1,211,400 | | | | 21,708,564 | |
Trend Micro Inc. | | Japan | | | 713,300 | | | | 24,928,243 | |
| | | | | | | | | | |
| | | | | | | | | 46,636,807 | |
| | | | | | | | | | |
Specialty Retail 1.2% | | | | | | | | | | |
Kingfisher PLC | | United Kingdom | | | 5,160,616 | | | | 32,865,855 | |
| | | | | | | | | | |
Trading Companies & Distributors 1.7% | | | | | | | | | | |
ITOCHU Corp. | | Japan | | | 3,753,600 | | | | 46,305,094 | |
| | | | | | | | | | |
TF-14
Franklin Templeton Variable Insurance Products Trust
Statement of Investments, December 31, 2013 (continued)
| | | | | | | | | | |
| Templeton Foreign Securities Fund | | Country | | Shares | | | Value | |
Common Stocks (continued) | | | | | | | | | | |
Wireless Telecommunication Services 2.8% | | | | | | | | | | |
China Mobile Ltd. | | China | | | 2,340,000 | | | $ | 24,216,730 | |
Vodafone Group PLC, ADR | | United Kingdom | | | 1,340,319 | | | | 52,687,940 | |
| | | | | | | | | | |
| | | | | | | | | 76,904,670 | |
| | | | | | | | | | |
Total Common Stocks (Cost $2,052,849,016) | | | | | | | | | 2,700,078,281 | |
| | | | | | | | | | |
Preferred Stocks 0.6% | | | | | | | | | | |
Metals & Mining 0.3% | | | | | | | | | | |
Vale SA, ADR, pfd., A | | Brazil | | | 664,832 | | | | 9,314,297 | |
| | | | | | | | | | |
Oil, Gas & Consumable Fuels 0.3% | | | | | | | | | | |
Petroleo Brasileiro SA, ADR, pfd. | | Brazil | | | 517,880 | | | | 7,607,657 | |
| | | | | | | | | | |
Total Preferred Stocks (Cost $12,298,385) | | | | | | | | | 16,921,954 | |
| | | | | | | | | | |
Total Investments before Short Term Investments
(Cost $2,065,147,401) | | | | | | | | | 2,717,000,235 | |
| | | | | | | | | | |
Short Term Investments 2.7% | | | | | | | | | | |
Money Market Funds (Cost $69,592,541) 2.5% | | | | | | | | | | |
a,c Institutional Fiduciary Trust Money Market Portfolio | | United States | | | 69,592,541 | | | | 69,592,541 | |
| | | | | | | | | | |
dInvestments from Cash Collateral Received for Loaned Securities
(Cost $6,432,000) 0.2% | | | | | | | | | | |
Money Market Funds 0.2% | | | | | | | | | | |
e BNY Mellon Overnight Government Fund, 0.017% | | United States | | | 6,432,000 | | | | 6,432,000 | |
| | | | | | | | | | |
Total Investments (Cost $2,141,171,942) 100.4% | | | | | | | | | 2,793,024,776 | |
Other Assets, less Liabilities (0.4)% | | | | | | | | | (12,466,730 | ) |
| | | | | | | | | | |
Net Assets 100.0% | | | | | | | | $ | 2,780,558,046 | |
| | | | | | | | | | |
See Abbreviations on page TF-27.
†Rounds to less than 0.1% of net assets.
aNon-income producing.
bA portion or all of the security is on loan at December 31, 2013. See Note 1(c).
cSee Note 7 regarding investments in the Institutional Fiduciary Trust Money Market Portfolio.
dSee Note 1(c) regarding securities on loan.
eThe rate shown is the annualized seven-day yield at period end.
The accompanying notes are an integral part of these financial statements.
TF-15
Franklin Templeton Variable Insurance Products Trust
Financial Statements
Statement of Assets and Liabilities
December 31, 2013
| | | | |
| | | Templeton
Foreign
Securities Fund | |
Assets: | | | | |
Investments in securities: | | | | |
Cost - Unaffiliated issuers | | $ | 2,071,579,401 | |
Cost - Sweep Money Fund (Note 7) | | | 69,592,541 | |
| | | | |
Total cost of investments | | $ | 2,141,171,942 | |
| | | | |
Value - Unaffiliated issuers | | $ | 2,723,432,235 | |
Value - Sweep Money Fund (Note 7) | | | 69,592,541 | |
| | | | |
Total value of investments (includes securities loaned in the amount $6,274,560) | | | 2,793,024,776 | |
Receivables: | | | | |
Investment securities sold | | | 515,083 | |
Capital shares sold | | | 982,086 | |
Dividends | | | 4,477,585 | |
Other assets | | | 60 | |
| | | | |
Total assets | | | 2,798,999,590 | |
| | | | |
Liabilities: | | | | |
Payables: | | | | |
Investment securities purchased | | | 495,501 | |
Capital shares redeemed | | | 7,960,888 | |
Management fees | | | 1,477,136 | |
Administrative fees | | | 222,190 | |
Distribution fees | | | 1,104,444 | |
Payable upon return of securities loaned | | | 6,432,000 | |
Accrued expenses and other liabilities | | | 749,385 | |
| | | | |
Total liabilities | | | 18,441,544 | |
| | | | |
Net assets, at value | | $ | 2,780,558,046 | |
| | | | |
Net assets consist of: | | | | |
Paid-in capital | | $ | 2,147,551,858 | |
Undistributed net investment income | | | 49,005,172 | |
Net unrealized appreciation (depreciation) | | | 651,936,806 | |
Accumulated net realized gain (loss) | | | (67,935,790 | ) |
| | | | |
Net assets, at value | | $ | 2,780,558,046 | |
| | | | |
The accompanying notes are an integral part of these financial statements.
TF-16
Franklin Templeton Variable Insurance Products Trust
Financial Statements (continued)
Statement of Assets and Liabilities (continued)
December 31, 2013
| | | | |
| | | Templeton
Foreign
Securities Fund | |
Class 1: | | | | |
Net assets, at value | | $ | 298,468,465 | |
| | | | |
Shares outstanding | | | 16,995,615 | |
| | | | |
Net asset value and maximum offering price per share | | $ | 17.56 | |
| | | | |
Class 2: | | | | |
Net assets, at value | | $ | 1,873,586,040 | |
| | | | |
Shares outstanding | | | 108,656,664 | |
| | | | |
Net asset value and maximum offering price per share | | $ | 17.24 | |
| | | | |
Class 3: | | | | |
Net assets, at value | | $ | 95,405,319 | |
| | | | |
Shares outstanding | | | 5,553,970 | |
| | | | |
Net asset value and maximum offering price per sharea | | $ | 17.18 | |
| | | | |
Class 4: | | | | |
Net assets, at value | | $ | 513,098,222 | |
| | | | |
Shares outstanding | | | 29,544,388 | |
| | | | |
Net asset value and maximum offering price per share | | $ | 17.37 | |
| | | | |
aRedemption price is equal to net asset value less redemption fees retained by the Fund.
The accompanying notes are an integral part of these financial statements.
TF-17
Franklin Templeton Variable Insurance Products Trust
Financial Statements (continued)
Statement of Operations
for the year ended December 31, 2013
| | | | |
| | | Templeton
Foreign
Securities Fund | |
Investment income: | | | | |
Dividends (net of foreign taxes of $6,946,517) | | $ | 75,267,252 | |
Income from securities loaned | | | 1,510,201 | |
| | | | |
Total investment income | | | 76,777,453 | |
| | | | |
Expenses: | | | | |
Management fees (Note 3a) | | | 16,712,881 | |
Administrative fees (Note 3b) | | | 2,535,512 | |
Distribution fees: (Note 3c) | | | | |
Class 2 | | | 4,453,331 | |
Class 3 | | | 230,038 | |
Class 4 | | | 1,623,277 | |
Unaffiliated transfer agent fees | | | 1,774 | |
Custodian fees (Note 4) | | | 377,540 | |
Reports to shareholders | | | 436,387 | |
Registration and filing fees | | | 1,094 | |
Professional fees | | | 138,372 | |
Trustees’ fees and expenses | | | 10,256 | |
Other | | | 56,693 | |
| | | | |
Total expenses | | | 26,577,155 | |
| | | | |
Net investment income | | | 50,200,298 | |
| | | | |
Realized and unrealized gains (losses): | | | | |
Net realized gain (loss) from: | | | | |
Investments | | | 40,989,015 | |
Foreign currency transactions | | | (465,033 | ) |
| | | | |
Net realized gain (loss) | | | 40,523,982 | |
| | | | |
Net change in unrealized appreciation (depreciation) on: | | | | |
Investments | | | 454,907,975 | |
Translation of other assets and liabilities denominated in foreign currencies | | | 77,388 | |
| | | | |
Net change in unrealized appreciation (depreciation) | | | 454,985,363 | |
| | | | |
Net realized and unrealized gain (loss) | | | 495,509,345 | |
| | | | |
Net increase (decrease) in net assets resulting from operations | | $ | 545,709,643 | |
| | | | |
The accompanying notes are an integral part of these financial statements.
TF-18
Franklin Templeton Variable Insurance Products Trust
Financial Statements (continued)
Statements of Changes in Net Assets
| | | | | | | | |
| | | Templeton Foreign
Securities Fund | |
| | | Year Ended December 31, | |
| | | 2013 | | | 2012 | |
| | | | |
Increase (decrease) in net assets: | | | | | | | | |
Operations: | | | | | | | | |
Net investment income | | $ | 50,200,298 | | | $ | 63,456,029 | |
Net realized gain (loss) from investments and foreign currency transactions | | | 40,523,982 | | | | 19,998,467 | |
Net change in unrealized appreciation (depreciation) on investments and translation of other assets and liabilities denominated in foreign currencies | | | 454,985,363 | | | | 333,368,769 | |
| | | | |
Net increase (decrease) in net assets resulting from operations | | | 545,709,643 | | | | 416,823,265 | |
| | | | |
Distributions to shareholders from: | | | | | | | | |
Net investment income: | | | | | | | | |
Class 1 | | | (7,042,374 | ) | | | (8,240,958 | ) |
Class 2 | | | (42,339,120 | ) | | | (51,055,731 | ) |
Class 3 | | | (2,189,476 | ) | | | (2,656,996 | ) |
Class 4 | | | (10,745,373 | ) | | | (11,448,483 | ) |
| | | | |
Total distributions to shareholders | | | (62,316,343 | ) | | | (73,402,168 | ) |
| | | | |
Capital share transactions: (Note 2) | | | | | | | | |
Class 1 | | | (18,682,478 | ) | | | (24,104,168 | ) |
Class 2 | | | (199,579,456 | ) | | | (174,931,568 | ) |
Class 3 | | | (13,135,502 | ) | | | (9,153,115 | ) |
Class 4 | | | 10,467,967 | | | | 7,407,804 | |
| | | | |
Total capital share transactions | | | (220,929,469 | ) | | | (200,781,047 | ) |
| | | | |
Redemption fees | | | 19,703 | | | | 4,388 | |
| | | | |
Net increase (decrease) in net assets | | | 262,483,534 | | | | 142,644,438 | |
Net assets: | | | | | | | | |
Beginning of year | | | 2,518,074,512 | | | | 2,375,430,074 | |
| | | | |
End of year | | $ | 2,780,558,046 | | | $ | 2,518,074,512 | |
| | | | |
Undistributed net investment income included in net assets: | | | | | | | | |
End of year | | $ | 49,005,172 | | | $ | 61,586,250 | |
| | | | |
The accompanying notes are an integral part of these financial statements.
TF-19
Franklin Templeton Variable Insurance Products Trust
Notes to Financial Statements
Templeton Foreign Securities Fund
1. ORGANIZATION AND SIGNIFICANT ACCOUNTING POLICIES
Franklin Templeton Variable Insurance Products Trust (Trust) is registered under the Investment Company Act of 1940, as amended, (1940 Act) as an open-end investment company, consisting of twenty separate funds. The Templeton Foreign Securities Fund (Fund) is included in this report. The financial statements of the remaining funds in the Trust are presented separately. Shares of the Fund are generally sold only to insurance company separate accounts to fund the benefits of variable life insurance policies or variable annuity contracts. The Fund offers four classes of shares: Class 1, Class 2, Class 3, and Class 4. Each class of shares differs by its distribution fees, voting rights on matters affecting a single class and its exchange privilege.
The following summarizes the Fund’s significant accounting policies.
a. Financial Instrument Valuation
The Fund’s investments in financial instruments are carried at fair value daily. Fair value is the price that would be received to sell an asset or paid to transfer a liability in an orderly transaction between market participants on the measurement date. The Fund calculates the net asset value (NAV) per share at the close of the New York Stock Exchange (NYSE), generally at 4p.m. Eastern time (NYSE close) on each day the NYSE is open for trading. Under procedures approved by the Trust’s Board of Trustees (the Board), the Fund’s administrator, investment manager and other affiliates have formed the Valuation and Liquidity Oversight Committee (VLOC). The VLOC provides administration and oversight of the Fund’s valuation policies and procedures, which are approved annually by the Board. Among other things, these procedures allow the Fund to utilize independent pricing services, quotations from securities and financial instrument dealers, and other market sources to determine fair value.
Equity securities listed on an exchange or on the NASDAQ National Market System are valued at the last quoted sale price or the official closing price of the day, respectively. Foreign equity securities are valued as of the close of trading on the foreign stock exchange on which the security is primarily traded or as of the NYSE close, whichever is earlier. The value is then converted into its U.S. dollar equivalent at the foreign exchange rate in effect at the NYSE close on the day that the value of the security is determined. Over-the-counter (OTC) securities are valued within the range of the most recent quoted bid and ask prices. Securities that trade in multiple markets or on multiple exchanges are valued according to the broadest and most representative market. Certain equity securities are valued based upon fundamental characteristics or relationships to similar securities. Investments in open-end mutual funds and non-registered money market funds are valued at the closing net asset value.
The Fund has procedures to determine the fair value of financial instruments for which market prices are not reliable or readily available. Under these procedures, the VLOC convenes on a regular basis to review such financial instruments and considers a number of factors, including significant unobservable valuation inputs, when arriving at fair value. The VLOC primarily employs a market-based approach which may use related or comparable assets or liabilities, recent transactions, market multiples, book values, and other relevant information for the investment to determine the fair value of the investment. An income-based valuation approach may also be used in which the anticipated future cash flows of the investment are discounted to calculate fair value. Discounts may also be applied due to the nature or duration of any restrictions on the disposition of the investments. Due to the inherent uncertainty of valuations of such investments, the fair values may differ significantly from the values that would have been used had an active market existed. The VLOC employs various methods for calibrating these valuation approaches including a regular review of key inputs and assumptions, transactional back-testing or disposition analysis, and reviews of any related market activity.
Trading in securities on foreign securities stock exchanges and OTC markets may be completed before the daily NYSE close. In addition, trading in certain foreign markets may not take place on every NYSE business day. Occasionally, events occur between the time at which trading in a foreign security is completed and the close of the NYSE that might call into question the reliability of the value of a portfolio security held by the Fund. As a result, differences may arise between the value of the Fund’s portfolio securities as determined at the foreign market close and the latest indications of value at the close of the NYSE. In order to minimize the potential for these differences, the VLOC monitors price movements following the close of trading in foreign stock markets through a series of country specific market proxies (such as baskets of American Depositary Receipts, futures contracts
TF-20
Franklin Templeton Variable Insurance Products Trust
Notes to Financial Statements (continued)
Templeton Foreign Securities Fund
1. ORGANIZATION AND SIGNIFICANT ACCOUNTING POLICIES (continued)
a. Financial Instrument Valuation (continued)
and exchange traded funds). These price movements are measured against established trigger thresholds for each specific market proxy to assist in determining if an event has occurred that may call into question the reliability of the values of the foreign securities held by the Fund. If such an event occurs, the securities may be valued using fair value procedures, which may include the use of independent pricing services.
Also, when the last day of the reporting period is a non-business day, certain foreign markets may be open on those days that the NYSE is closed, which could result in differences between the value of the Fund’s portfolio securities on the last business day and the last calendar day of the reporting period. Any significant security valuation changes due to an open foreign market are adjusted and reflected by the Fund for financial reporting purposes.
b. Foreign Currency Translation
Portfolio securities and other assets and liabilities denominated in foreign currencies are translated into U.S. dollars based on the exchange rate of such currencies against U.S. dollars on the date of valuation. The Fund may enter into foreign currency exchange contracts to facilitate transactions denominated in a foreign currency. Purchases and sales of securities, income and expense items denominated in foreign currencies are translated into U.S. dollars at the exchange rate in effect on the transaction date. Portfolio securities and assets and liabilities denominated in foreign currencies contain risks that those currencies will decline in value relative to the U.S. dollar. Occasionally, events may impact the availability or reliability of foreign exchange rates used to convert the U.S. dollar equivalent value. If such an event occurs, the foreign exchange rate will be valued at fair value using procedures established and approved by the Board.
The Fund does not separately report the effect of changes in foreign exchange rates from changes in market prices on securities held. Such changes are included in net realized and unrealized gain or loss from investments on the Statement of Operations.
Realized foreign exchange gains or losses arise from sales of foreign currencies, currency gains or losses realized between the trade and settlement dates on securities transactions and the difference between the recorded amounts of dividends, interest, and foreign withholding taxes and the U.S. dollar equivalent of the amounts actually received or paid. Net unrealized foreign exchange gains and losses arise from changes in foreign exchange rates on foreign denominated assets and liabilities other than investments in securities held at the end of the reporting period.
c. Securities Lending
The Fund participates in an agency based securities lending program. The Fund receives cash collateral against the loaned securities in an amount equal to at least 102% of the market value of the loaned securities. Collateral is maintained over the life of the loan in an amount not less than 100% of the market value of loaned securities, as determined at the close of fund business each day; any additional collateral required due to changes in security values is delivered to the Fund on the next business day. The collateral is invested in a non-registered money fund. The Fund receives income from the investment of cash collateral, in addition to lending fees and rebates paid by the borrower. The Fund bears the market risk with respect to the collateral investment, securities loaned, and the risk that the agent may default on its obligations to the Fund. The securities lending agent has agreed to indemnify the Fund in the event of default by a third party borrower.
d. Income and Deferred Taxes
It is the Fund’s policy to qualify as a regulated investment company under the Internal Revenue Code. The Fund intends to distribute to shareholders substantially all of its taxable income and net realized gains to relieve it from federal income and if applicable, excise taxes. As a result, no provision for U.S. federal income taxes is required.
TF-21
Franklin Templeton Variable Insurance Products Trust
Notes to Financial Statements (continued)
Templeton Foreign Securities Fund
1. ORGANIZATION AND SIGNIFICANT ACCOUNTING POLICIES (continued)
d. Income and Deferred Taxes (continued)
The Fund may be subject to foreign taxation related to income received, capital gains on the sale of securities and certain foreign currency transactions in the foreign jurisdictions in which it invests. Foreign taxes, if any, are recorded based on the tax regulations and rates that exist in the foreign markets in which the Fund invests. When a capital gain tax is determined to apply the Fund records an estimated deferred tax liability in an amount that would be payable if the securities were disposed of on the valuation date.
The Fund recognizes the tax benefits of uncertain tax positions only when the position is “more likely than not” to be sustained upon examination by the tax authorities based on the technical merits of the tax position. As of December 31, 2013, and for all open tax years, the Fund has determined that no liability for unrecognized tax benefits is required in the Fund’s financial statements related to uncertain tax positions taken on a tax return (or expected to be taken on future tax returns). Open tax years are those that remain subject to examination and are based on each tax jurisdiction statute of limitation.
e. Security Transactions, Investment Income, Expenses and Distributions
Security transactions are accounted for on trade date. Realized gains and losses on security transactions are determined on a specific identification basis. Estimated expenses are accrued daily. Dividend income is recorded on the ex-dividend date except that certain dividends from foreign securities are recognized as soon as the Fund is notified of the ex-dividend date. Distributions to shareholders are recorded on the ex-dividend date and are determined according to income tax regulations (tax basis). Distributable earnings determined on a tax basis may differ from earnings recorded in accordance with accounting principles generally accepted in the United States of America. These differences may be permanent or temporary. Permanent differences are reclassified among capital accounts to reflect their tax character. These reclassifications have no impact on net assets or the results of operations. Temporary differences are not reclassified, as they may reverse in subsequent periods.
Common expenses incurred by the Trust are allocated among the funds based on the ratio of net assets of each fund to the combined net assets of the Trust. Fund specific expenses are charged directly to the fund that incurred the expense.
Realized and unrealized gains and losses and net investment income, not including class specific expenses, are allocated daily to each class of shares based upon the relative proportion of net assets of each class. Differences in per share distributions, by class, are generally due to differences in class specific expenses.
f. Accounting Estimates
The preparation of financial statements in accordance with accounting principles generally accepted in the United States of America requires management to make estimates and assumptions that affect the reported amounts of assets and liabilities at the date of the financial statements and the amounts of income and expenses during the reporting period. Actual results could differ from those estimates.
g. Redemption Fees
Redemptions and exchanges of interests in an insurance company subaccount that invests in Class 3 shares of the Fund will be subject to a 1.0% short term trading fee if the interest in the subaccount has been held for less than 60 days. Such fees are retained by the Fund and accounted for as an addition to paid-in capital, allocated to each class of shares based upon the relative proportion of net assets of each class.
TF-22
Franklin Templeton Variable Insurance Products Trust
Notes to Financial Statements (continued)
Templeton Foreign Securities Fund
1. ORGANIZATION AND SIGNIFICANT ACCOUNTING POLICIES (continued)
h. Guarantees and Indemnifications
Under the Trust’s organizational documents, its officers and trustees are indemnified by the Trust against certain liabilities arising out of the performance of their duties to the Trust. Additionally, in the normal course of business, the Trust, on behalf of the Fund, enters into contracts with service providers that contain general indemnification clauses. The Trust’s maximum exposure under these arrangements is unknown as this would involve future claims that may be made against the Trust that have not yet occurred. Currently, the Trust expects the risk of loss to be remote.
2. SHARES OF BENEFICIAL INTEREST
At December 31, 2013, there were an unlimited number of shares authorized (without par value). Transactions in the Fund’s shares were as follows:
| | | | | | | | | | | | | | | | |
| | | Year Ended December 31, | |
| | | 2013 | | | 2012 | |
| Class 1 Shares: | | Shares | | | Amount | | | Shares | | | Amount | |
Shares sold | | | 496,052 | | | $ | 7,884,222 | | | | 437,702 | | | $ | 5,851,468 | |
Shares issued in reinvestment of distributions | | | 468,554 | | | | 7,042,374 | | | | 676,598 | | | | 8,240,958 | |
Shares redeemed | | | (2,142,399 | ) | | | (33,609,074 | ) | | | (2,835,243 | ) | | | (38,196,594 | ) |
| | | | |
Net increase (decrease) | | | (1,177,793 | ) | | $ | (18,682,478 | ) | | | (1,720,943 | ) | | $ | (24,104,168 | ) |
| | | | |
Class 2 Shares: | | | | | | | | | | | | | | | | |
Shares sold | | | 9,932,214 | | | $ | 152,564,880 | | | | 12,784,843 | | | $ | 164,850,484 | |
Shares issued in reinvestment of distributions | | | 2,864,622 | | | | 42,339,120 | | | | 4,261,747 | | | | 51,055,731 | |
Shares redeemed | | | (25,480,434 | ) | | | (394,483,456 | ) | | | (29,457,075 | ) | | | (390,837,783 | ) |
| | | | |
Net increase (decrease) | | | (12,683,598 | ) | | $ | (199,579,456 | ) | | | (12,410,485 | ) | | $ | (174,931,568 | ) |
| | | | |
Class 3 Shares: | | | | | | | | | | | | | | | | |
Shares sold | | | 558,566 | | | $ | 8,455,794 | | | | 414,387 | | | $ | 5,363,853 | |
Shares issued in reinvestment of distributions | | | 148,742 | | | | 2,189,476 | | | | 222,529 | | | | 2,656,996 | |
Shares redeemed | | | (1,552,340 | ) | | | (23,780,772 | ) | | | (1,302,161 | ) | | | (17,173,964 | ) |
| | | | |
Net increase (decrease) | | | (845,032 | ) | | $ | (13,135,502 | ) | | | (665,245 | ) | | $ | (9,153,115 | ) |
| | | | |
Class 4 Shares: | | | | | | | | | | | | | | | | |
Shares sold | | | 5,690,758 | | | $ | 88,119,947 | | | | 6,234,278 | | | $ | 81,740,548 | |
Shares issued on reinvestment of distributions | | | 721,650 | | | | 10,745,373 | | | | 947,722 | | | | 11,448,483 | |
Shares redeemed | | | (5,613,738 | ) | | | (88,397,353 | ) | | | (6,356,073 | ) | | | (85,781,227 | ) |
| | | | |
Net increase (decrease) | | | 798,670 | | | $ | 10,467,967 | | | | 825,927 | | | $ | 7,407,804 | |
| | | | |
3. TRANSACTIONS WITH AFFILIATES
Franklin Resources, Inc. is the holding company for various subsidiaries that together are referred to as Franklin Templeton Investments. Certain officers and trustees of the Fund are also officers and/or directors of the following subsidiaries:
| | |
| Subsidiary | | Affiliation |
Templeton Investment Counsel, LLC (TIC) | | Investment manager |
Franklin Templeton Services, LLC (FT Services) | | Administrative manager |
Franklin Templeton Distributors, Inc. (Distributors) | | Principal underwriter |
Franklin Templeton Investor Services, LLC (Investor Services) | | Transfer agent |
TF-23
Franklin Templeton Variable Insurance Products Trust
Notes to Financial Statements (continued)
Templeton Foreign Securities Fund
3. TRANSACTIONS WITH AFFILIATES (continued)
a. Management Fees
The Fund pays an investment management fee to TIC based on the average daily net assets of the Fund as follows:
| | |
| Annualized Fee Rate | | Net Assets |
| 0.750% | | Up to and including $200 million |
| 0.675% | | Over $200 million, up to and including $1.3 billion |
| 0.600% | | Over $1.3 billion, up to and including $10 billion |
| 0.580% | | Over $10 billion, up to and including $15 billion |
| 0.560% | | Over $15 billion, up to and including $20 billion |
| 0.540% | | In excess of $20 billion |
b. Administrative Fees
The Fund pays an administrative fee to FT Services based on the average daily net assets of the Fund as follows:
| | |
| Annualized Fee Rate | | Net Assets |
| 0.150% | | Up to and including $200 million |
| 0.135% | | Over $200 million, up to and including $700 million |
| 0.100% | | Over $700 million, up to and including $1.2 billion |
| 0.075% | | In excess of $1.2 billion |
c. Distribution Fees
The Board has adopted distribution plans for Class 2, Class 3, and Class 4 shares pursuant to Rule 12b-1 under the 1940 Act. Under the Fund’s compensation distribution plans, the Fund pays Distributors for costs incurred in connection with the servicing, sale and distribution of the Fund’s shares up to 0.25%, 0.35%, and 0.35% per year of its average daily net assets of Class 2, Class 3, and Class 4, respectively. Some distribution fees are not charged on shares held by affiliates. The Board has agreed to limit the current rate to 0.25% per year for Class 3. The plan year, for purposes of monitoring compliance with the maximum annual plan rates, is February 1 through January 31.
d. Transfer Agent Fees
Investor Services, under terms of an agreement, performs shareholder servicing for the Fund and is not paid by the Fund for the services.
4. EXPENSE OFFSET ARRANGEMENT
The Fund has entered into an arrangement with its custodian whereby credits realized as a result of uninvested cash balances are used to reduce a portion of the Fund’s custodian expenses. During the year ended December 31, 2013, there were no credits earned.
5. INCOME TAXES
For tax purposes, capital losses may be carried over to offset future capital gains. Capital loss carryforwards with no expiration, if any, must be fully utilized before those losses with expiration dates.
TF-24
Franklin Templeton Variable Insurance Products Trust
Notes to Financial Statements (continued)
Templeton Foreign Securities Fund
5. INCOME TAXES (continued)
At December 31, 2013, the Fund had capital loss carryforwards of $59,815,020 expiring in 2017. During the year ended December 31, 2013, the Fund utilized $40,989,015 of capital loss carryforwards.
The tax character of distributions paid during the years ended December 31, 2013 and 2012, was as follows:
| | | | | | | | |
| | | 2013 | | | 2012 | |
Distributions paid from ordinary income | | $ | 62,316,343 | | | $ | 73,402,168 | |
| | | | |
At December 31, 2013, the cost of investments, net unrealized appreciation (depreciation), and undistributed ordinary income for income tax purposes were as follows:
| | | | |
Cost of investments | | $ | 2,149,983,787 | |
| | | | |
| |
Unrealized appreciation | | $ | 707,876,713 | |
Unrealized depreciation | | | (64,835,724 | ) |
| | | | |
Net unrealized appreciation (depreciation) | | $ | 643,040,989 | |
| | | | |
Distributable earnings – undistributed ordinary income | | $ | 49,729,731 | |
| | | | |
Differences between income and/or capital gains as determined on a book basis and a tax basis are primarily due to differing treatments of foreign currency transactions and wash sales.
6. INVESTMENT TRANSACTIONS
Purchases and sales of investments (excluding short term securities) for the year ended December 31, 2013, aggregated $592,406,211 and $841,981,365, respectively.
7. INVESTMENTS IN INSTITUTIONAL FIDUCIARY TRUST MONEY MARKET PORTFOLIO
The Fund invests in the Institutional Fiduciary Trust Money Market Portfolio (Sweep Money Fund), an open-end investment company managed by Franklin Advisers, Inc. (an affiliate of the investment manager). Management fees paid by the Fund are reduced on assets invested in the Sweep Money Fund, in an amount not to exceed the management and administrative fees paid by the Sweep Money Fund.
8. CONCENTRATION OF RISK
Investing in foreign securities may include certain risks and considerations not typically associated with investing in U.S. securities, such as fluctuating currency values and changing local and regional economic, political and social conditions, which may result in greater market volatility. In addition, certain foreign securities may not be as liquid as U.S. securities.
9. CREDIT FACILITY
The Fund, together with other U.S. registered and foreign investment funds (collectively, Borrowers), managed by Franklin Templeton Investments, are borrowers in a joint syndicated senior unsecured credit facility totaling $1.5 billion (Global Credit Facility) which, after an extension of the original terms, matured on February 14, 2014. This Global Credit Facility provides a source of funds to the Borrowers for temporary and emergency purposes, including the ability to meet future unanticipated or unusually large redemption requests. Effective February 14, 2014, the Borrowers renewed the Global Credit Facility which matures on February 13, 2015.
TF-25
Franklin Templeton Variable Insurance Products Trust
Notes to Financial Statements (continued)
Templeton Foreign Securities Fund
9. CREDIT FACILITY (continued)
Under the terms of the Global Credit Facility, the Fund shall, in addition to interest charged on any borrowings made by the Fund and other costs incurred by the Fund, pay its share of fees and expenses incurred in connection with the implementation and maintenance of the Global Credit Facility, based upon its relative share of the aggregate net assets of all of the Borrowers, including an annual commitment fee of 0.07% based upon the unused portion of the Global Credit Facility. These fees are reflected in other expenses on the Statement of Operations. During the year ended December 31, 2013, the Fund did not use the Global Credit Facility.
10. FAIR VALUE MEASUREMENTS
The Fund follows a fair value hierarchy that distinguishes between market data obtained from independent sources (observable inputs) and the Fund’s own market assumptions (unobservable inputs). These inputs are used in determining the value of the Fund’s financial instruments and are summarized in the following fair value hierarchy:
| | • | | Level 1 – quoted prices in active markets for identical financial instruments |
| | • | | Level 2 – other significant observable inputs (including quoted prices for similar financial instruments, interest rates, prepayment speed, credit risk, etc.) |
| | • | | Level 3 – significant unobservable inputs (including the Fund’s own assumptions in determining the fair value of financial instruments) |
The input levels are not necessarily an indication of the risk or liquidity associated with financial instruments at that level.
For movements between the levels within the fair value hierarchy, the Fund has adopted a policy of recognizing the transfers as of the date of the underlying event which caused the movement.
A summary of inputs used as of December 31, 2013, in valuing the Fund’s assets carried at fair value, is as follows:
| | | | | | | | | | | | | | | | |
| | | Level 1 | | | Level 2 | | | Level 3 | | | Total | |
| | | | |
Assets: | | | | | | | | | | | | | | | | |
Investments in Securities: | | | | | | | | | | | | | | | | |
Equity Investmentsa,b | | $ | 2,717,000,235 | | | $ | — | | | $ | — | | | $ | 2,717,000,235 | |
Short Term Investments | | | 69,592,541 | | | | 6,432,000 | | | | — | | | | 76,024,541 | |
| | | | |
Total Investments in Securities | | $ | 2,786,592,776 | | | $ | 6,432,000 | | | $ | — | | | $ | 2,793,024,776 | |
| | | | |
aIncludes common and preferred stocks.
bFor detailed categories, see the accompanying Statement of Investments.
11. NEW ACCOUNTING PRONOUNCEMENTS
In June 2013, the Financial Accounting Standards Board issued Accounting Standards Update (ASU) No. 2013-08, Investment Companies (Topic 946): Amendments to the Scope, Measurement, and Disclosure Requirements. The ASU modifies the criteria used in defining an investment company under U.S. Generally Accepted Accounting Principles and also sets forth certain measurement and disclosure requirements. Under the ASU, an entity that is registered under the 1940 Act automatically qualifies as an investment company. The ASU is effective for interim and annual reporting periods beginning after December 15, 2013. Management has reviewed the requirements and believes the adoption of this ASU will not have a material impact on the financial statements.
TF-26
Franklin Templeton Variable Insurance Products Trust
Notes to Financial Statements (continued)
Templeton Foreign Securities Fund
12. SUBSEQUENT EVENTS
The Fund has evaluated subsequent events through the issuance of the financial statements and determined that no events have occurred that require disclosure other than those already disclosed in the financial statements.
| | | | |
ABBREVIATIONS | | | | |
| Selected Portfolio | | | | |
| | | | |
| ADR - American Depositary Receipt | | | | |
| IDR - International Depositary Receipt | | | | |
TF-27
Franklin Templeton Variable Insurance Products Trust
Templeton Foreign Securities Fund
Report of Independent Registered Public Accounting Firm
To the Board of Trustees and Shareholders of
Franklin Templeton Variable Insurance Products Trust
In our opinion, the accompanying statement of assets and liabilities, including the statement of investments, and the related statements of operations and of changes in net assets and the financial highlights present fairly, in all material respects, the financial position of Templeton Foreign Securities Fund (the “Fund”) at December 31, 2013, the results of its operations for the year then ended, the changes in its net assets for each of the two years in the period then ended and the financial highlights for each of the five years in the period then ended, in conformity with accounting principles generally accepted in the United States of America. These financial statements and financial highlights (hereafter referred to as “financial statements”) are the responsibility of the Fund’s management. Our responsibility is to express an opinion on these financial statements based on our audits. We conducted our audits of these financial statements in accordance with the standards of the Public Company Accounting Oversight Board (United States). Those standards require that we plan and perform the audit to obtain reasonable assurance about whether the financial statements are free of material misstatement. An audit includes examining, on a test basis, evidence supporting the amounts and disclosures in the financial statements, assessing the accounting principles used and significant estimates made by management, and evaluating the overall financial statement presentation. We believe that our audits, which included confirmation of securities at December 31, 2013 by correspondence with the custodian, transfer agent and brokers, provide a reasonable basis for our opinion.
PricewaterhouseCoopers LLP
San Francisco, California
February 14, 2014
TF-28
Franklin Templeton Variable Insurance Products Trust
Tax Information (unaudited)
Templeton Foreign Securities Fund
At December 31, 2013, more than 50% of the Fund’s total assets were invested in securities of foreign issuers. In most instances, foreign taxes were withheld from income paid to the Fund on these investments. The Fund elects to treat foreign taxes paid as allowed under Section 853 of the Internal Revenue Code (Code). This election will allow shareholders of record as of the 2014 distribution date, to treat their proportionate share of foreign taxes paid by the Fund as having been paid directly by them. The shareholder shall consider these amounts as foreign taxes paid in the tax year in which they receive the Fund distribution.
TF-29
TEMPLETON GLOBAL BOND SECURITIES FUND
We are pleased to bring you Templeton Global Bond Securities Fund’s annual report for the fiscal year ended December 31, 2013.
Performance Summary as of 12/31/13
Average annual total return of Class 3 shares* represents the average annual change in value, assuming reinvestment of dividends and capital gains. Average returns smooth out variations in returns, which can be significant; they are not the same as year-by-year results.
Periods ended 12/31/13
| | | | | | | | | | | | |
| | | 1-Year | | | 5-Year | | | 10-Year | |
Average Annual Total Return | | | +1.64% | | | | +9.50% | | | | +8.82% | |
*Class 3 performance prior to 4/1/05 reflects historical Class 2 performance. Since 4/1/05 (effective date), the average annual total return of Class 3 shares was +8.72%.
Total Return Index Comparison for a Hypothetical $10,000 Investment (1/1/04–12/31/13)
The graph below shows the change in value of a hypothetical $10,000 investment in the Fund over the indicated period and includes reinvestment of any income or distributions. The Fund’s performance* is compared to the performance of the J.P. Morgan (JPM) Global Government Bond Index (GGBI), the Citigroup World Government Bond Index (WGBI) and the Consumer Price Index (CPI). One cannot invest directly in an index, and an index is not representative of the Fund’s portfolio. Please see Important Notes to Performance Information preceding the Fund Summaries.
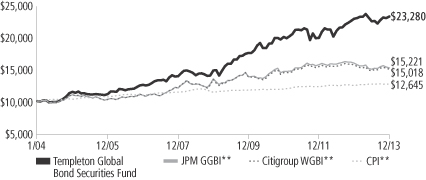
**Source: © 2014 Morningstar. Please see Index Descriptions following the Fund Summaries.
Templeton Global Bond Securities Fund – Class 3
Performance reflects the Fund’s Class 3 operating expenses, but does not include any contract fees, expenses or sales charges. If they had been included, performance would be lower. These charges and deductions, particularly for variable life policies, can have a significant effect on contract values and insurance benefits. See the contract prospectus for a complete description of these expenses, including sales charges.
Performance data represent past performance, which does not guarantee future results. Investment return and principal value will fluctuate, and you may have a gain or loss when you sell your shares.
Current performance may differ from figures shown.
TGB-1
Fund Goal and Main Investments: Templeton Global Bond Securities Fund seeks high current income, consistent with preservation of capital, with capital appreciation as a secondary consideration. Under normal market conditions, the Fund invests at least 80% of its net assets in bonds, which include debt securities of any maturity, such as bonds, notes, bills and debentures.
Performance Overview
You can find the Fund’s one-year total return in the Performance Summary. For comparison, the Fund’s benchmarks, the JPM GGBI and the Citigroup WGBI, had -4.50% and -4.00% total returns for the same period.1
Economic and Market Overview
The global economic recovery was mixed during the year under review. The recovery in emerging markets moderated after many economies had previously returned to and exceeded pre-crisis activity levels. Although some developed economies, such as those of Australia and some Scandinavian countries, have enjoyed relatively strong recoveries in the aftermath of the global financial crisis, growth in the eurozone and Japan continued to be slow by the standards of previous recoveries. Improving sentiment, relatively strong fundamentals and continued provision of global liquidity supported assets perceived as risky and equity markets performed well.
Fears of possible reductions in stimulative government policies contributed to periods of risk aversion, when credit spreads widened and assets perceived as risky sold off, alternating with periods of heightened risk appetite, when spreads narrowed and investors again favored risk assets. Against this backdrop, extensive liquidity creation continued, in particular from the Bank of Japan’s commitment to raise its inflation target, as well as from the European Central Bank’s interest rate cuts.
During the period, the U.S. Federal Reserve Board (Fed) announced it might reduce the size of its quantitative easing program at subsequent meetings. The announcement led risk assets, particularly those in emerging markets, to sell off as market participants’ expectations of global liquidity conditions began to change. The Fed later confirmed it would begin tapering its asset purchases from $85 billion per month to $75 billion per month beginning in January 2014.
1. Source: © 2014 Morningstar. One cannot invest directly in an index, and an index is not representative of the Fund’s portfolio. Please see Index Descriptions following the Fund Summaries.
Fund Risks: All investments involve risks, including possible loss of principal. Currency rates may fluctuate significantly over short periods of time, and can reduce returns. Derivatives, including currency management strategies, involve costs and can create economic leverage in the portfolio that may result in significant volatility and cause the Fund to participate in losses (as well as enable gains) on an amount that exceeds the Fund’s initial investment. The Fund may not achieve the anticipated benefits and may realize losses when a counterparty fails to perform as promised. Foreign securities involve special risks, including currency fluctuations and economic and political uncertainties. Investments in emerging markets involve heightened risks related to the same factors, in addition to those associated with these markets’ smaller size and lesser liquidity. Investments in lower rated bonds include higher risk of default and loss of principal. Changes in interest rates will affect the value of the Fund’s portfolio and its share price and yield. Bond prices generally move in the opposite direction of interest rates. As prices of bonds in the Fund adjust to a rise in interest rates, the Fund’s share price may decline. The Fund is also nondiversified, which involves the risk of greater price fluctuation than a more diversified portfolio. Changes in the financial strength of a bond issuer or in a bond’s credit rating may affect its value. The Fund is actively managed but there is no guarantee that the manager’s investment decisions will produce the desired results. The Fund’s prospectus also includes a description of the main investment risks.
TGB-2
Global financial market volatility increased toward the end of the period as the U.S. federal government partially shut down and the U.S. Treasury approached its debt ceiling. As the government shutdown ended and the debt ceiling was raised, market volatility quickly subsided.
Investment Strategy
We invest selectively in bonds around the world based upon our assessment of changing market, political and economic conditions. While seeking opportunities, we monitor various factors including changes in interest rates, currency exchange rates and credit risks. We seek to manage the Fund’s exposure to various currencies and may utilize currency forward contracts.
Manager’s Discussion
The Fund’s total return was influenced by various factors, including interest rate developments, currency movements and exposure to sovereign debt markets. During the year under review, each of these sources of return benefited absolute and relative performance.
Interest Rate Strategy
As part of the Fund’s interest rate strategy we use interest rate swaps to manage duration. We maintained a defensive posture with respect to interest rate risk in developed and emerging markets. At period-end, the Fund had a shorter duration position than the JPM GGBI given our assessment that there was limited scope for further global interest rate reductions from historically low levels and improving economic conditions. However, we maintained some duration exposure in countries where we believed long-term bond yields could benefit from declining risk premiums, and select duration exposures in Europe and Latin America contributed to performance relative to the JPM GGBI.
Currency Strategy
As part of the Fund’s investment strategy, we used currency forward contracts seeking to hedge or gain exposure to various currencies. Overall, our diversified currency exposure contributed to absolute performance and performance relative to the JPM GGBI. As the Japanese yen depreciated against the U.S. dollar during the year, the Fund’s net negative position in the currency, achieved via the use of currency forward contracts, contributed meaningfully in terms of absolute and relative performance. Our net negative position in the yen reflected our pessimistic view on the relative prospects for the Japanese economy and
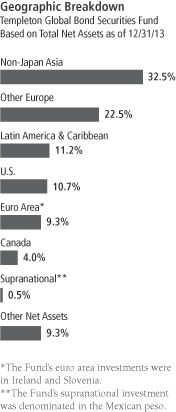
What is duration?
Duration is a measure of a bond’s price sensitivity to interest rate changes. In general, a portfolio of securities with a lower duration can be expected to be less sensitive to interest rate changes than a portfolio with a higher duration.
What is an interest rate swap?
An interest rate swap is an agreement between two parties to exchange interest rate obligations, generally one based on an interest rate fixed to maturity while the other is based on an interest rate that changes in accordance with changes in a designated benchmark (for example, LIBOR, prime, commercial paper or other benchmarks).
What is a currency forward contract?
A currency forward contract is an agreement between the Fund and a counterparty to buy or sell a foreign currency at a specific exchange rate on a future date.
TGB-3
was meant as an implicit hedge against potentially rising yields in the U.S., given the yen’s historically strong correlation to long-term U.S. Treasury yields. However, as the euro appreciated against the U.S. dollar during the year, our net negative position in the monetary union’s currency detracted from performance.
Global Sovereign Debt Strategy
The Fund purchased investment-grade and subinvestment-grade hard currency-denominated sovereign debt that has historically typically compensated for greater credit risk by offering higher yields relative to U.S. Treasury and European benchmark bonds. Overall, the Fund’s sovereign credit exposures contributed to performance. These exposures were concentrated in non-eurozone Europe.
Thank you for your participation in Templeton Global Bond Securities Fund. We look forward to serving your future investment needs.
The foregoing information reflects our analysis, opinions and portfolio holdings as of December 31, 2013, the end of the reporting period. The way we implement our main investment strategies and the resulting portfolio holdings may change depending on factors such as market and economic conditions. These opinions may not be relied upon as investment advice or an offer for a particular security. The information is not a complete analysis of every aspect of any market, country, industry, security or the Fund. Statements of fact are from sources considered reliable, but the investment manager makes no representation or warranty as to their completeness or accuracy. Although historical performance is no guarantee of future results, these insights may help you understand our investment management philosophy.
Currency Breakdown
Templeton Global Bond Securities Fund
12/31/13
| | | | |
| | | % of Total
Net Assets | |
| |
Americas | | | 82.1% | |
| U.S. Dollar | | | 58.2% | |
| Mexican Peso | | | 11.7% | |
| Brazilian Real | | | 4.4% | |
| Canadian Dollar | | | 4.0% | |
| Chilean Peso | | | 3.7% | |
| Peruvian Nuevo Sol | | | 0.1% | |
| |
Asia Pacific | | | 24.6% | |
| South Korean Won | | | 16.4% | |
| Malaysian Ringgit | | | 12.7% | |
| Singapore Dollar | | | 8.5% | |
| Indonesian Rupiah | | | 2.4% | |
| Indian Rupee | | | 2.3% | |
| Philippine Peso | | | 1.4% | |
| Sri Lankan Rupee | | | 1.2% | |
| Japanese Yen* | | | -20.3% | |
| |
Europe* | | | -6.7% | |
| Polish Zloty | | | 10.6% | |
| Swedish Krona | | | 8.1% | |
| Hungarian Forint | | | 2.3% | |
| Euro* | | | -27.7% | |
*A negative figure reflects net “short” exposure, designed to benefit if the value of the associated currency decreases. Conversely, the Fund’s value would potentially decline if the value of the associated currency increases.
The dollar value, number of shares or principal amount, and names of all portfolio holdings are listed in the Fund’s Statement of Investments.
TGB-4
Fund Expenses
As an investor in a variable insurance contract (Contract) that indirectly provides for investment in an underlying mutual fund, you can incur transaction and/or ongoing expenses at both the Fund level and the Contract level.
| • | | Transaction expenses can include sales charges (loads) on purchases, redemption fees, surrender fees, transfer fees and premium taxes. |
| • | | Ongoing expenses can include management fees, distribution and service (12b-1) fees, contract fees, annual maintenance fees, mortality and expense risk fees and other fees and expenses. All mutual funds and Contracts have some types of ongoing expenses. |
The expenses shown in the table are meant to highlight ongoing expenses at the Fund level only and do not include ongoing expenses at the Contract level, or transaction expenses at either the Fund or Contract level. While the Fund does not have transaction expenses, if the transaction and ongoing expenses at the Contract level were included, the expenses shown below would be higher. You should consult your Contract prospectus or disclosure document for more information.
The table shows Fund-level ongoing expenses and can help you understand these expenses and compare them with those of other mutual funds offered through the Contract. The table assumes a $1,000 investment held for the six months indicated. Please refer to the Fund prospectus for additional information on operating expenses.
Actual Fund Expenses
The first line (Actual) of the table provides actual account values and expenses. The “Ending Account Value” is derived from the Fund’s actual return, which includes the effect of ongoing Fund expenses, but does not include the effect of ongoing Contract expenses.
You can estimate the Fund-level expenses you incurred during the period by following these steps. Of course, your account value and expenses will differ from those in this illustration:
| 1. | Divide your account value by $1,000. |
If an account had an $8,600 value, then $8,600 ÷ $1,000 = 8.6.
| 2. | Multiply the result by the number under the heading “Fund-Level Expenses Incurred During Period.” |
If Fund-Level Expenses Incurred During Period were $7.50, then 8.6 x $7.50 = $64.50.
In this illustration, the estimated expenses incurred this period at the Fund level are $64.50.
Templeton Global Bond Securities Fund – Class 3
TGB-5
Hypothetical Example for Comparison with Other Mutual Funds
Information in the second line (Hypothetical) of the table can help you compare ongoing expenses of the Fund with those of other mutual funds offered through the Contract. This information may not be used to estimate the actual ending account balance or expenses you incurred during the period. The hypothetical “Ending Account Value” is based on the Fund’s actual expense ratio for each class and an assumed 5% annual rate of return before expenses, which does not represent the Fund’s actual return. The figure under the heading “Fund-Level Expenses Incurred During Period” shows the hypothetical expenses your account would have incurred under this scenario. You can compare this figure with the 5% hypothetical examples that appear in shareholder reports of other funds offered through a Contract.
| | | | | | | | | | | | |
| Class 3 | | Beginning
Account Value 7/1/13 | | | Ending
Account
Value 12/31/13 | | | Fund-Level Expenses Incurred
During Period* 7/1/13–12/31/13 | |
Actual | | $ | 1,000 | | | $ | 1,033.90 | | | $ | 3.79 | |
Hypothetical (5% return
before expenses) | | $ | 1,000 | | | $ | 1,021.48 | | | $ | 3.77 | |
*Expenses are calculated using the most recent six-month annualized expense ratio for the Fund’s Class 3 shares (0.74%), which does not include any ongoing expenses of the Contract for which the Fund is an investment option, multiplied by the average account value over the period, multiplied by 184/365 to reflect the one-half year period.
TGB-6
Franklin Templeton Variable Insurance Products Trust
Financial Highlights
Templeton Global Bond Securities Fund
| | | | | | | | | | | | | | | | | | | | |
| | | Year Ended December 31, | |
| Class 1 | | 2013 | | | 2012 | | | 2011 | | | 2010 | | | 2009 | |
| | | | |
Per share operating performance | | | | | | | | | | | | | | | | | | | | |
(for a share outstanding throughout the year) | | | | | | | | | | | | | | | | | | | | |
Net asset value, beginning of year | | $ | 20.01 | | | $ | 18.61 | | | $ | 19.94 | | | $ | 17.72 | | | $ | 17.42 | |
| | | | |
Income from investment operationsa: | | | | | | | | | | | | | | | | | | | | |
Net investment incomeb | | | 0.64 | | | | 0.72 | | | | 0.87 | | | | 1.00 | | | | 0.99 | |
Net realized and unrealized gains (losses) | | | (0.30 | ) | | | 1.99 | | | | (0.92 | ) | | | 1.58 | | | | 2.01 | |
| | | | |
Total from investment operations | | | 0.34 | | | | 2.71 | | | | (0.05 | ) | | | 2.58 | | | | 3.00 | |
| | | | |
Less distributions from: | | | | | | | | | | | | | | | | | | | | |
Net investment income and net foreign currency gains | | | (0.96 | ) | | | (1.28 | ) | | | (1.15 | ) | | | (0.31 | ) | | | (2.70 | ) |
Net realized gains | | | (0.24 | ) | | | (0.03 | ) | | | (0.13 | ) | | | (0.05 | ) | | | — | |
| | | | |
Total distributions | | | (1.20 | ) | | | (1.31 | ) | | | (1.28 | ) | | | (0.36 | ) | | | (2.70 | ) |
| | | | |
Redemption feesc | | | — | | | | — | | | | — | | | | — | | | | — | |
| | | | |
Net asset value, end of year | | $ | 19.15 | | | $ | 20.01 | | | $ | 18.61 | | | $ | 19.94 | | | $ | 17.72 | |
| | | | |
| | | | | |
Total returnd | | | 1.89% | | | | 15.31% | | | | (0.61)% | | | | 14.71% | | | | 18.98% | |
Ratios to average net assets | | | | | | | | | | | | | | | | | | | | |
Expensese | | | 0.51% | | | | 0.55% | | | | 0.56% | | | | 0.55% | | | | 0.54% | |
Net investment income | | | 3.26% | | | | 3.71% | | | | 4.40% | | | | 5.27% | | | | 5.73% | |
| | | | | |
Supplemental data | | | | | | | | | | | | | | | | | | | | |
Net assets, end of year (000’s) | | $ | 280,963 | | | $ | 307,142 | | | $ | 269,819 | | | $ | 272,232 | | | $ | 195,662 | |
Portfolio turnover rate | | | 34.39% | | | | 43.26% | | | | 34.18% | | | | 8.77% | | | | 20.84% | |
aThe amount shown for a share outstanding throughout the period may not correlate with the Statement of Operations for the period due to the timing of sales and repurchases of the Fund shares in relation to income earned and/or fluctuating market value of the investments of the Fund.
bBased on average daily shares outstanding.
cAmount rounds to less than $0.01 per share.
dTotal return does not include fees, charges or expenses imposed by the variable annuity and life insurance contracts for which the Franklin Templeton Variable Insurance Products Trust serves as an underlying investment vehicle.
eBenefit of expense reduction rounds to less than 0.01%.
The accompanying notes are an integral part of these financial statements.
TGB-7
Franklin Templeton Variable Insurance Products Trust
Financial Highlights (continued)
Templeton Global Bond Securities Fund
| | | | | | | | | | | | | | | | | | | | |
| | | Year Ended December 31, | |
| Class 2 | | 2013 | | | 2012 | | | 2011 | | | 2010 | | | 2009 | |
| | | | |
Per share operating performance | | | | | | | | | | | | | | | | | | | | |
(for a share outstanding throughout the year) | | | | | | | | | | | | | | | | | | | | |
Net asset value, beginning of year | | $ | 19.47 | | | $ | 18.15 | | | $ | 19.49 | | | $ | 17.34 | | | $ | 17.10 | |
| | | | |
Income from investment operationsa: | | | | | | | | | | | | | | | | | | | | |
Net investment incomeb | | | 0.57 | | | | 0.65 | | | | 0.79 | | | | 0.93 | | | | 0.93 | |
Net realized and unrealized gains (losses) | | | (0.27 | ) | | | 1.94 | | | | (0.89 | ) | | | 1.54 | | | | 1.98 | |
| | | | |
Total from investment operations | | | 0.30 | | | | 2.59 | | | | (0.10 | ) | | | 2.47 | | | | 2.91 | |
| | | | |
Less distributions from: | | | | | | | | | | | | | | | | | | | | |
Net investment income and net foreign currency gains | | | (0.93 | ) | | | (1.24 | ) | | | (1.11 | ) | | | (0.27 | ) | | | (2.67 | ) |
Net realized gains | | | (0.24 | ) | | | (0.03 | ) | | | (0.13 | ) | | | (0.05 | ) | | | — | |
| | | | |
Total distributions | | | (1.17 | ) | | | (1.27 | ) | | | (1.24 | ) | | | (0.32 | ) | | | (2.67 | ) |
| | | | |
Redemption feesc | | | — | | | | — | | | | — | | | | — | | | | — | |
| | | | |
Net asset value, end of year | | $ | 18.60 | | | $ | 19.47 | | | $ | 18.15 | | | $ | 19.49 | | | $ | 17.34 | |
| | | | |
| | | | | |
Total returnd | | | 1.63% | | | | 15.07% | | | | (0.87)% | | | | 14.45% | | | | 18.68% | |
Ratios to average net assets | | | | | | | | | | | | | | | | | | | | |
Expensese | | | 0.76% | | | | 0.80% | | | | 0.81% | | | | 0.80% | | | | 0.79% | |
Net investment income | | | 3.01% | | | | 3.46% | | | | 4.15% | | | | 5.02% | | | | 5.48% | |
| | | | | |
Supplemental data | | | | | | | | | | | | | | | | | | | | |
Net assets, end of year (000’s) | | $ | 2,826,039 | | | $ | 2,418,229 | | | $ | 1,812,814 | | | $ | 1,490,794 | | | $ | 1,262,783 | |
Portfolio turnover rate | | | 34.39% | | | | 43.26% | | | | 34.18% | | | | 8.77% | | | | 20.84% | |
aThe amount shown for a share outstanding throughout the period may not correlate with the Statement of Operations for the period due to the timing of sales and repurchases of the Fund shares in relation to income earned and/or fluctuating market value of the investments of the Fund.
bBased on average daily shares outstanding.
cAmount rounds to less than $0.01 per share.
dTotal return does not include fees, charges or expenses imposed by the variable annuity and life insurance contracts for which the Franklin Templeton Variable Insurance Products Trust serves as an underlying investment vehicle.
eBenefit of expense reduction rounds to less than 0.01%.
The accompanying notes are an integral part of these financial statements.
TGB-8
Franklin Templeton Variable Insurance Products Trust
Financial Highlights (continued)
Templeton Global Bond Securities Fund
| | | | | | | | | | | | | | | | | | | | |
| | | Year Ended December 31, | |
| Class 3 | | 2013 | | | 2012 | | | 2011 | | | 2010 | | | 2009 | |
| | | | |
Per share operating performance | | | | | | | | | | | | | | | | | | | | |
(for a share outstanding throughout the year) | | | | | | | | | | | | | | | | | | | | |
Net asset value, beginning of year | | $ | 19.48 | | | $ | 18.15 | | | $ | 19.48 | | | $ | 17.33 | | | $ | 17.08 | |
| | | | |
Income from investment operationsa: | | | | | | | | | | | | | | | | | | | | |
Net investment incomeb | | | 0.57 | | | | 0.65 | | | | 0.80 | | | | 0.93 | | | | 0.93 | |
Net realized and unrealized gains (losses) | | | (0.27 | ) | | | 1.94 | | | | (0.90 | ) | | | 1.54 | | | | 1.98 | |
| | | | |
Total from investment operations | | | 0.30 | | | | 2.59 | | | | (0.10 | ) | | | 2.47 | | | | 2.91 | |
| | | | |
Less distributions from: | | | | | | | | | | | | | | | | | | | | |
Net investment income and net foreign currency gains | | | (0.92 | ) | | | (1.23 | ) | | | (1.10 | ) | | | (0.27 | ) | | | (2.66 | ) |
Net realized gains | | | (0.24 | ) | | | (0.03 | ) | | | (0.13 | ) | | | (0.05 | ) | | | — | |
| | | | |
Total distributions | | | (1.16 | ) | | | (1.26 | ) | | | (1.23 | ) | | | (0.32 | ) | | | (2.66 | ) |
| | | | |
Redemption feesc | | | — | | | | — | | | | — | | | | — | | | | — | |
| | | | |
Net asset value, end of year | | $ | 18.62 | | | $ | 19.48 | | | $ | 18.15 | | | $ | 19.48 | | | $ | 17.33 | |
| | | | |
| | | | | |
Total returnd | | | 1.64% | | | | 15.06% | | | | (0.83)% | | | | 14.38% | | | | 18.69% | |
Ratios to average net assets | | | | | | | | | | | | | | | | | | | | |
Expensese | | | 0.76% | | | | 0.80% | | | | 0.81% | | | | 0.80% | | | | 0.79% | |
Net investment income | | | 3.01% | | | | 3.46% | | | | 4.15% | | | | 5.02% | | | | 5.48% | |
| | | | | |
Supplemental data | | | | | | | | | | | | | | | | | | | | |
Net assets, end of year (000’s) | | $ | 194,122 | | | $ | 198,077 | | | $ | 185,811 | | | $ | 183,380 | | | $ | 143,264 | |
Portfolio turnover rate | | | 34.39% | | | | 43.26% | | | | 34.18% | | | | 8.77% | | | | 20.84% | |
aThe amount shown for a share outstanding throughout the period may not correlate with the Statement of Operations for the period due to the timing of sales and repurchases of the Fund shares in relation to income earned and/or fluctuating market value of the investments of the Fund.
bBased on average daily shares outstanding.
cAmount rounds to less than $0.01 per share.
dTotal return does not include fees, charges or expenses imposed by the variable annuity and life insurance contracts for which the Franklin Templeton Variable Insurance Products Trust serves as an underlying investment vehicle.
eBenefit of expense reduction rounds to less than 0.01%.
The accompanying notes are an integral part of these financial statements.
TGB-9
Franklin Templeton Variable Insurance Products Trust
Financial Highlights (continued)
Templeton Global Bond Securities Fund
| | | | | | | | | | | | | | | | | | | | |
| | | Year Ended December 31, | |
| Class 4 | | 2013 | | | 2012 | | | 2011 | | | 2010 | | | 2009 | |
| | | | |
Per share operating performance | | | | | | | | | | | | | | | | | | | | |
(for a share outstanding throughout the year) | | | | | | | | | | | | | | | | | | | | |
Net asset value, beginning of year | | $ | 19.82 | | | $ | 18.44 | | | $ | 19.78 | | | $ | 17.61 | | | $ | 17.37 | |
| | | | |
Income from investment operationsa: | | | | | | | | | | | | | | | | | | | | |
Net investment incomeb | | | 0.56 | | | | 0.64 | | | | 0.79 | | | | 0.93 | | | | 0.93 | |
Net realized and unrealized gains (losses) | | | (0.28 | ) | | | 1.98 | | | | (0.91 | ) | | | 1.56 | | | | 2.00 | |
| | | | |
Total from investment operations | | | 0.28 | | | | 2.62 | | | | (0.12 | ) | | | 2.49 | | | | 2.93 | |
| | | | |
Less distributions from: | | | | | | | | | | | | | | | | | | | | |
Net investment income and net foreign currency gains | | | (0.89 | ) | | | (1.21 | ) | | | (1.09 | ) | | | (0.27 | ) | | | (2.69 | ) |
Net realized gains | | | (0.24 | ) | | | (0.03 | ) | | | (0.13 | ) | | | (0.05 | ) | | | — | |
| | | | |
Total distributions | | | (1.13 | ) | | | (1.24 | ) | | | (1.22 | ) | | | (0.32 | ) | | | (2.69 | ) |
| | | | |
Redemption feesc | | | — | | | | — | | | | — | | | | — | | | | — | |
| | | | |
Net asset value, end of year | | $ | 18.97 | | | $ | 19.82 | | | $ | 18.44 | | | $ | 19.78 | | | $ | 17.61 | |
| | | | |
| | | | | |
Total returnd | | | 1.54% | | | | 14.97% | | | | (0.96)% | | | | 14.28% | | | | 18.58% | |
Ratios to average net assets | | | | | | | | | | | | | | | | | | | | |
Expensese | | | 0.86% | | | | 0.90% | | | | 0.91% | | | | 0.90% | | | | 0.89% | |
Net investment income | | | 2.91% | | | | 3.36% | | | | 4.05% | | | | 4.92% | | | | 5.38% | |
| | | | | |
Supplemental data | | | | | | | | | | | | | | | | | | | | |
Net assets, end of year (000’s) | | $ | 118,145 | | | $ | 163,241 | | | $ | 151,695 | | | $ | 150,891 | | | $ | 108,910 | |
Portfolio turnover rate | | | 34.39% | | | | 43.26% | | | | 34.18% | | | | 8.77% | | | | 20.84% | |
aThe amount shown for a share outstanding throughout the period may not correlate with the Statement of Operations for the period due to the timing of sales and repurchases of the Fund shares in relation to income earned and/or fluctuating market value of the investments of the Fund.
bBased on average daily shares outstanding.
cAmount rounds to less than $0.01 per share.
dTotal return does not include fees, charges or expenses imposed by the variable annuity and life insurance contracts for which the Franklin Templeton Variable Insurance Products Trust serves as an underlying investment vehicle.
eBenefit of expense reduction rounds to less than 0.01%.
The accompanying notes are an integral part of these financial statements.
TGB-10
Franklin Templeton Variable Insurance Products Trust
Statement of Investments, December 31, 2013
| | | | | | | | |
| Templeton Global Bond Securities Fund | | Principal
Amount* | | | Value | |
Foreign Government and Agency Securities 65.7% | | | | | | | | |
Brazil 4.1% | | | | | | | | |
Letra Tesouro Nacional, Strip, | | | | | | | | |
1/01/15 | | | 3,971 | a BRL | | $ | 1,517,952 | |
1/01/16 | | | 26,160 | a BRL | | | 8,866,995 | |
1/01/17 | | | 46,660 | a BRL | | | 13,913,524 | |
Nota Do Tesouro Nacional, | | | | | | | | |
10.00%, 1/01/14 | | | 7,100 | a BRL | | | 3,005,713 | |
10.00%, 1/01/17 | | | 22,490 | a BRL | | | 9,010,015 | |
10.00%, 1/01/21 | | | 9,240 | a BRL | | | 3,398,793 | |
10.00%, 1/01/23 | | | 26,700 | a BRL | | | 9,526,924 | |
b Index Linked, 6.00%, 5/15/15 | | | 30,226 | a BRL | | | 30,796,127 | |
b Index Linked, 6.00%, 8/15/16 | | | 14,388 | a BRL | | | 14,526,395 | |
b Index Linked, 6.00%, 5/15/17 | | | 202 | a BRL | | | 202,885 | |
b Index Linked, 6.00%, 8/15/18 | | | 12,725 | a BRL | | | 12,679,621 | |
b Index Linked, 6.00%, 8/15/22 | | | 14,400 | a BRL | | | 14,056,509 | |
b Index Linked, 6.00%, 5/15/45 | | | 10,825 | a BRL | | | 10,079,341 | |
senior note, 10.00%, 1/01/19 | | | 21,390 | a BRL | | | 8,192,766 | |
| | | | | | | | |
| | | | | | | 139,773,560 | |
| | | | | | | | |
Canada 2.7% | | | | | | | | |
Government of Canada, | | | | | | | | |
2.25%, 8/01/14 | | | 10,628,000 | CAD | | | 10,079,965 | |
1.00%, 11/01/14 | | | 20,887,000 | CAD | | | 19,667,584 | |
2.00%, 12/01/14 | | | 17,861,000 | CAD | | | 16,971,271 | |
1.00%, 2/01/15 | | | 48,972,000 | CAD | | | 46,108,326 | |
| | | | | | | | |
| | | | | | | 92,827,146 | |
| | | | | | | | |
Hungary 4.2% | | | | | | | | |
Government of Hungary, | | | | | | | | |
5.50%, 2/12/14 | | | 653,440,000 | HUF | | | 3,030,175 | |
7.75%, 8/24/15 | | | 672,690,000 | HUF | | | 3,331,052 | |
5.50%, 2/12/16 | | | 436,800,000 | HUF | | | 2,095,705 | |
5.50%, 12/22/16 | | | 236,640,000 | HUF | | | 1,139,444 | |
4.125%, 2/19/18 | | | 14,310,000 | | | | 14,462,044 | |
6.50%, 6/24/19 | | | 389,700,000 | HUF | | | 1,949,586 | |
7.50%, 11/12/20 | | | 317,540,000 | HUF | | | 1,659,850 | |
5.375%, 2/21/23 | | | 26,430,000 | | | | 26,206,666 | |
A, 8.00%, 2/12/15 | | | 280,000,000 | HUF | | | 1,364,846 | |
A, 6.75%, 11/24/17 | | | 2,049,040,000 | HUF | | | 10,280,148 | |
A, 5.50%, 12/20/18 | | | 446,060,000 | HUF | | | 2,136,985 | |
A, 7.00%, 6/24/22 | | | 512,570,000 | HUF | | | 2,585,322 | |
A, 6.00%, 11/24/23 | | | 173,290,000 | HUF | | | 822,136 | |
B, 6.75%, 2/24/17 | | | 394,700,000 | HUF | | | 1,961,662 | |
D, 6.75%, 8/22/14 | | | 1,856,440,000 | HUF | | | 8,782,954 | |
senior note, 6.25%, 1/29/20 | | | 6,420,000 | | | | 6,945,638 | |
senior note, 6.375%, 3/29/21 | | | 14,820,000 | | | | 16,033,387 | |
c senior note, Reg S, 3.50%, 7/18/16 | | | 1,055,000 | EUR | | | 1,500,165 | |
c senior note, Reg S, 4.375%, 7/04/17 | | | 7,480,000 | EUR | | | 10,771,024 | |
c senior note, Reg S, 5.75%, 6/11/18 | | | 14,475,000 | EUR | | | 21,677,406 | |
c senior note, Reg S, 3.875%, 2/24/20 | | | 3,120,000 | EUR | | | 4,302,289 | |
| | | | | | | | |
| | | | | | | 143,038,484 | |
| | | | | | | | |
Iceland 0.2% | | | | | | | | |
dGovernment of Iceland, 144A, 5.875%, 5/11/22 | | | 7,660,000 | | | | 7,870,650 | |
| | | | | | | | |
TGB-11
Franklin Templeton Variable Insurance Products Trust
Statement of Investments, December 31, 2013 (continued)
| | | | | | | | |
| Templeton Global Bond Securities Fund | | Principal
Amount* | | | Value | |
Foreign Government and Agency Securities (continued) | | | | | | | | |
Indonesia 2.4% | | | | | | | | |
Government of Indonesia, | | | | | | | | |
FR31, 11.00%, 11/15/20 | | | 170,808,000,000 | IDR | | $ | 15,972,581 | |
FR34, 12.80%, 6/15/21 | | | 208,649,000,000 | IDR | | | 21,304,064 | |
FR35, 12.90%, 6/15/22 | | | 67,421,000,000 | IDR | | | 6,974,170 | |
FR36, 11.50%, 9/15/19 | | | 31,754,000,000 | IDR | | | 2,994,348 | |
FR39, 11.75%, 8/15/23 | | | 5,491,000,000 | IDR | | | 541,430 | |
FR40, 11.00%, 9/15/25 | | | 46,856,000,000 | IDR | | | 4,464,505 | |
FR43, 10.25%, 7/15/22 | | | 69,179,000,000 | IDR | | | 6,264,366 | |
FR44, 10.00%, 9/15/24 | | | 4,454,000,000 | IDR | | | 397,343 | |
FR46, 9.50%, 7/15/23 | | | 226,780,000,000 | IDR | | | 19,656,723 | |
FR48, 9.00%, 9/15/18 | | | 16,920,000,000 | IDR | | | 1,442,232 | |
senior bond, FR53, 8.25%, 7/15/21 | | | 11,270,000,000 | IDR | | | 919,895 | |
Indonesia Retail Bond, senior note, 8.50%, 10/15/16 | | | 3,358,000,000 | IDR | | | 276,243 | |
| | | | | | | | |
| | | | | | | 81,207,900 | |
| | | | | | | | |
Ireland 8.9% | | | | | | | | |
Government of Ireland, | | | | | | | | |
5.50%, 10/18/17 | | | 27,708,700 | EUR | | | 43,369,903 | |
5.90%, 10/18/19 | | | 20,597,000 | EUR | | | 33,280,628 | |
4.50%, 4/18/20 | | | 19,512,000 | EUR | | | 29,375,017 | |
5.00%, 10/18/20 | | | 58,588,000 | EUR | | | 90,671,337 | |
senior bond, 4.50%, 10/18/18 | | | 8,090,000 | EUR | | | 12,354,689 | |
senior bond, 4.40%, 6/18/19 | | | 20,943,000 | EUR | | | 31,673,977 | |
senior bond, 5.40%, 3/13/25 | | | 40,422,910 | EUR | | | 63,308,941 | |
| | | | | | | | |
| | | | | | | 304,034,492 | |
| | | | | | | | |
Lithuania 1.2% | | | | | | | | |
dGovernment of Lithuania, 144A, | | | | | | | | |
6.75%, 1/15/15 | | | 19,480,000 | | | | 20,600,587 | |
7.375%, 2/11/20 | | | 12,690,000 | | | | 15,267,656 | |
6.125%, 3/09/21 | | | 3,240,000 | | | | 3,676,315 | |
| | | | | | | | |
| | | | | | | 39,544,558 | |
| | | | | | | | |
Malaysia 3.8% | | | | | | | | |
Government of Malaysia, | | | | | | | | |
3.434%, 8/15/14 | | | 59,260,000 | MYR | | | 18,129,565 | |
3.741%, 2/27/15 | | | 61,480,000 | MYR | | | 18,893,122 | |
3.835%, 8/12/15 | | | 36,620,000 | MYR | | | 11,287,025 | |
4.72%, 9/30/15 | | | 230,000 | MYR | | | 71,971 | |
3.197%, 10/15/15 | | | 14,220,000 | MYR | | | 4,337,783 | |
senior bond, 5.094%, 4/30/14 | | | 187,985,000 | MYR | | | 57,734,359 | |
senior bond, 3.814%, 2/15/17 | | | 18,885,000 | MYR | | | 5,820,163 | |
senior bond, 4.24%, 2/07/18 | | | 44,360,000 | MYR | | | 13,820,132 | |
| | | | | | | | |
| | | | | | | 130,094,120 | |
| | | | | | | | |
Mexico 3.7% | | | | | | | | |
Government of Mexico, | | | | | | | | |
7.00%, 6/19/14 | | | 286,280e | MXN | | | 2,232,692 | |
9.50%, 12/18/14 | | | 1,774,400e | MXN | | | 14,371,673 | |
6.00%, 6/18/15 | | | 732,200e | MXN | | | 5,805,212 | |
8.00%, 12/17/15 | | | 4,996,150e | MXN | | | 41,408,288 | |
6.25%, 6/16/16 | | | 733,810e | MXN | | | 5,918,589 | |
7.25%, 12/15/16 | | | 250,000e | MXN | | | 2,067,835 | |
TGB-12
Franklin Templeton Variable Insurance Products Trust
Statement of Investments, December 31, 2013 (continued)
| | | | | | | | |
| Templeton Global Bond Securities Fund | | Principal
Amount* | | | Value | |
Foreign Government and Agency Securities (continued) | | | | | | | | |
Mexico (continued) | | | | | | | | |
7.75%, 12/14/17 | | | 4,473,000 | e MXN | | $ | 37,709,388 | |
fMexican Udibonos, Index Linked, | | | | | | | | |
4.50%, 12/18/14 | | | 222,190 | g MXN | | | 1,783,563 | |
5.00%, 6/16/16 | | | 569,208 | g MXN | | | 4,827,172 | |
3.50%, 12/14/17 | | | 570,675 | g MXN | | | 4,734,753 | |
4.00%, 6/13/19 | | | 391,698 | g MXN | | | 3,328,978 | |
2.50%, 12/10/20 | | | 308,481 | g MXN | | | 2,405,497 | |
| | | | | | | | |
| | | | | | | 126,593,640 | |
| | | | | | | | |
Peru 0.1% | | | | | | | | |
Government of Peru, senior bond, 7.84%, 8/12/20 | | | 11,090,000 | PEN | | | 4,535,287 | |
| | | | | | | | |
Philippines 0.2% | | | | | | | | |
Government of the Philippines, | | | | | | | | |
senior bond, 7.00%, 1/27/16 | | | 53,190,000 | PHP | | | 1,292,639 | |
senior bond, 9.125%, 9/04/16 | | | 31,840,000 | PHP | | | 821,907 | |
senior note, 6.25%, 1/27/14 | | | 35,720,000 | PHP | | | 806,832 | |
senior note, 1.625%, 4/25/16 | | | 236,480,000 | PHP | | | 5,278,929 | |
| | | | | | | | |
| | | | | | | 8,200,307 | |
| | | | | | | | |
Poland 9.1% | | | | | | | | |
Government of Poland, | | | | | | | | |
5.75%, 4/25/14 | | | 336,990,000 | PLN | | | 112,776,374 | |
5.50%, 4/25/15 | | | 31,408,000 | PLN | | | 10,771,993 | |
6.25%, 10/24/15 | | | 75,580,000 | PLN | | | 26,531,088 | |
5.00%, 4/25/16 | | | 45,810,000 | PLN | | | 15,820,591 | |
5.75%, 9/23/22 | | | 48,750,000 | PLN | | | 17,824,390 | |
hFRN, 2.71%, 1/25/17 | | | 59,279,000 | PLN | | | 19,571,709 | |
hFRN, 2.71%, 1/25/21 | | | 60,135,000 | PLN | | | 19,455,558 | |
Strip, 1/25/14 | | | 49,315,000 | PLN | | | 16,308,506 | |
Strip, 7/25/14 | | | 35,420,000 | PLN | | | 11,578,650 | |
Strip, 7/25/15 | | | 23,822,000 | PLN | | | 7,562,053 | |
Strip, 1/25/16 | | | 169,757,000 | PLN | | | 52,892,364 | |
| | | | | | | | |
| | | | | | | 311,093,276 | |
| | | | | | | | |
Russia 1.7% | | | | | | | | |
dRussia Foreign Bond, senior bond, 144A, 7.50%, 3/31/30 | | | 50,648,455 | | | | 59,108,013 | |
| | | | | | | | |
Serbia 0.7% | | | | | | | | |
dGovernment of Serbia, senior note, 144A, | | | | | | | | |
5.25%, 11/21/17 | | | 4,590,000 | | | | 4,627,294 | |
4.875%, 2/25/20 | | | 8,800,000 | | | | 8,371,000 | |
7.25%, 9/28/21 | | | 9,670,000 | | | | 10,232,987 | |
| | | | | | | | |
| | | | | | | 23,231,281 | |
| | | | | | | | |
Singapore 0.8% | | | | | | | | |
Government of Singapore, senior note, | | | | | | | | |
3.625%, 7/01/14 | | | 21,650,000 | SGD | | | 17,442,766 | |
1.125%, 4/01/16 | | | 11,000,000 | SGD | | | 8,876,166 | |
| | | | | | | | |
| | | | | | | 26,318,932 | |
| | | | | | | | |
Slovenia 0.4% | | | | | | | | |
dGovernment of Slovenia, senior note, 144A, | | | | | | | | |
5.50%, 10/26/22 | | | 8,140,000 | | | | 8,166,455 | |
TGB-13
Franklin Templeton Variable Insurance Products Trust
Statement of Investments, December 31, 2013 (continued)
| | | | | | | | |
| Templeton Global Bond Securities Fund | | Principal
Amount* | | | Value | |
Foreign Government and Agency Securities (continued) | | | | | | | | |
Slovenia (continued) | | | | | | | | |
5.85%, 5/10/23 | | | 5,030,000 | | | $ | 5,143,276 | |
| | | | | | | | |
| | | | | | | 13,309,731 | |
| | | | | | | | |
South Korea 14.0% | | | | | | | | |
The Export-Import Bank of Korea, senior note, | | | | | | | | |
4.625%, 2/20/17 | | | 230,000 | EUR | | | 346,546 | |
d144A, 1.45%, 5/19/14 | | | 40,580,000 | SEK | | | 6,318,181 | |
Korea Monetary Stabilization Bond, | | | | | | | | |
senior bond, 3.47%, 2/02/14 | | | 20,416,550,000 | KRW | | | 19,352,968 | |
senior bond, 3.59%, 4/02/14 | | | 20,432,530,000 | KRW | | | 19,402,992 | |
senior bond, 2.47%, 4/02/15 | | | 22,461,930,000 | KRW | | | 21,217,011 | |
senior bond, 2.80%, 8/02/15 | | | 68,737,030,000 | KRW | | | 65,181,566 | |
senior bond, 2.81%, 10/02/15 | | | 2,932,000,000 | KRW | | | 2,780,860 | |
senior note, 3.28%, 6/02/14 | | | 24,224,170,000 | KRW | | | 23,008,056 | |
senior note, 2.57%, 6/09/14 | | | 14,607,000,000 | KRW | | | 13,834,163 | |
senior note, 2.82%, 8/02/14 | | | 31,785,420,000 | KRW | | | 30,141,691 | |
senior note, 2.78%, 10/02/14 | | | 13,357,000,000 | KRW | | | 12,663,495 | |
senior note, 2.84%, 12/02/14 | | | 22,065,270,000 | KRW | | | 20,936,073 | |
senior note, 2.74%, 2/02/15 | | | 47,745,950,000 | KRW | | | 45,249,715 | |
senior note, 2.76%, 6/02/15 | | | 51,516,200,000 | KRW | | | 48,822,799 | |
senior note, 2.90%, 12/02/15 | | | 54,164,800,000 | KRW | | | 51,439,336 | |
Korea Treasury Bond, | | | | | | | | |
senior bond, 4.00%, 3/10/16 | | | 1,283,100,000 | KRW | | | 1,245,888 | |
senior bond, 5.00%, 9/10/16 | | | 2,806,000,000 | KRW | | | 2,802,925 | |
senior note, 3.25%, 12/10/14 | | | 13,830,700,000 | KRW | | | 13,173,046 | |
senior note, 4.50%, 3/10/15 | | | 641,500,000 | KRW | | | 620,482 | |
senior note, 3.25%, 6/10/15 | | | 4,668,800,000 | KRW | | | 4,454,846 | |
senior note, 4.00%, 9/10/15 | | | 3,390,100,000 | KRW | | | 3,275,674 | |
senior note, 2.75%, 12/10/15 | | | 32,942,000,000 | KRW | | | 31,190,316 | |
senior note, 3.00%, 12/10/16 | | | 26,530,400,000 | KRW | | | 25,247,236 | |
Korea Treasury Note, senior note, 2.75%, 6/10/16 | | | 18,308,100,000 | KRW | | | 17,318,320 | |
| | | | | | | | |
| | | | | | | 480,024,185 | |
| | | | | | | | |
Sri Lanka 1.2% | | | | | | | | |
Government of Sri Lanka, | | | | | | | | |
A, 7.00%, 3/01/14 | | | 43,380,000 | LKR | | | 331,025 | |
A, 11.25%, 7/15/14 | | | 773,000,000 | LKR | | | 6,001,358 | |
A, 11.75%, 3/15/15 | | | 8,520,000 | LKR | | | 67,440 | |
A, 6.50%, 7/15/15 | | | 239,920,000 | LKR | | | 1,778,049 | |
A, 11.00%, 8/01/15 | | | 1,349,700,000 | LKR | | | 10,670,111 | |
A, 6.40%, 8/01/16 | | | 109,200,000 | LKR | | | 782,571 | |
A, 5.80%, 1/15/17 | | | 112,300,000 | LKR | | | 781,236 | |
A, 8.00%, 11/15/18 | | | 512,300,000 | LKR | | | 3,639,778 | |
A, 9.00%, 5/01/21 | | | 861,720,000 | LKR | | | 6,155,846 | |
B, 11.75%, 4/01/14 | | | 68,370,000 | LKR | | | 526,938 | |
B, 6.60%, 6/01/14 | | | 65,500,000 | LKR | | | 497,602 | |
B, 6.40%, 10/01/16 | | | 119,100,000 | LKR | | | 849,589 | |
B, 8.50%, 7/15/18 | | | 146,350,000 | LKR | | | 1,059,835 | |
C, 8.50%, 4/01/18 | | | 241,930,000 | LKR | | | 1,765,710 | |
D, 8.50%, 6/01/18 | | | 633,000,000 | LKR | | | 4,621,916 | |
| | | | | | | | |
| | | | | | | 39,529,004 | |
| | | | | | | | |
TGB-14
Franklin Templeton Variable Insurance Products Trust
Statement of Investments, December 31, 2013 (continued)
| | | | | | | | |
| Templeton Global Bond Securities Fund | | Principal
Amount* | | | Value | |
Foreign Government and Agency Securities (continued) | | | | | | | | |
iSupranational 0.5% | | | | | | | | |
Inter-American Development Bank, senior note, 7.50%, 12/05/24 | | | 200,000,000 | MXN | | $ | 16,379,549 | |
| | | | | | | | |
Sweden 2.4% | | | | | | | | |
Government of Sweden, 6.75%, 5/05/14 | | | 391,220,000 | SEK | | | 62,045,971 | |
Kommuninvest I Sverige AB, 2.25%, 5/05/14 | | | 123,520,000 | SEK | | | 19,294,378 | |
| | | | | | | | |
| | | | | | | 81,340,349 | |
| | | | | | | | |
Ukraine 3.0% | | | | | | | | |
dFinancing of Infrastructure Projects State Enterprise, 144A, | | | | | | | | |
8.375%, 11/03/17 | | | 1,100,000 | | | | 1,017,357 | |
7.40%, 4/20/18 | | | 840,000 | | | | 754,202 | |
dGovernment of Ukraine, | | | | | | | | |
144A, 9.25%, 7/24/17 | | | 25,550,000 | | | | 25,454,188 | |
144A, 7.75%, 9/23/20 | | | 17,227,000 | | | | 15,999,576 | |
senior bond, 144A, 6.58%, 11/21/16 | | | 12,541,000 | | | | 11,796,692 | |
senior bond, 144A, 7.80%, 11/28/22 | | | 10,110,000 | | | | 9,174,825 | |
senior note, 144A, 4.95%, 10/13/15 | | | 290,000 | EUR | | | 381,826 | |
senior note, 144A, 6.25%, 6/17/16 | | | 8,760,000 | | | | 8,250,825 | |
senior note, 144A, 7.95%, 2/23/21 | | | 24,098,000 | | | | 22,365,956 | |
senior note, 144A, 7.50%, 4/17/23 | | | 8,160,000 | | | | 7,395,000 | |
| | | | | | | | |
| | | | | | | 102,590,447 | |
| | | | | | | | |
Vietnam 0.4% | | | | | | | | |
dGovernment of Vietnam, 144A, 6.75%, 1/29/20 | | | 13,110,000 | | | | 14,240,738 | |
| | | | | | | | |
Total Foreign Government and Agency Securities (Cost $2,141,644,799) | | | | | | | 2,244,885,649 | |
| | | | | | | | |
Municipal Bonds (Cost $1,293,641) 0.0%† | | | | | | | | |
United States 0.0%† | | | | | | | | |
Bexar County Revenue, Venue Project, Refunding, Series A, BHAC Insured, 5.25%, 8/15/47 | | | 1,450,000 | | | | 1,510,654 | |
| | | | | | | | |
Total Investments before Short Term Investments (Cost $2,142,938,440) | | | | | | | 2,246,396,303 | |
| | | | | | | | |
Short Term Investments 25.0% | | | | | | | | |
Foreign Government and Agency Securities 14.4% | | | | | | | | |
Brazil 0.2% | | | | | | | | |
Letra Tesouro Nacional, Strip, 4/01/14 | | | 18,450 | a BRL | | | 7,628,846 | |
| | | | | | | | |
Canada 1.3% | | | | | | | | |
Government of Canada, | | | | | | | | |
1.00%, 2/01/14 | | | 33,882,000 | CAD | | | 31,899,130 | |
2.00%, 3/01/14 | | | 7,354,000 | CAD | | | 6,935,463 | |
0.75%, 5/01/14 | | | 6,298,000 | CAD | | | 5,926,569 | |
| | | | | | | | |
| | | | | | | 44,761,162 | |
| | | | | | | | |
Hungary 0.1% | | | | | | | | |
jHungary Treasury Bills, 1/08/14 - 6/25/14 | | | 356,460,000 | HUF | | | 1,637,274 | |
| | | | | | | | |
Malaysia 4.4% | | | | | | | | |
jBank of Negara Monetary Notes, 1/09/14 - 11/18/14 | | | 496,745,000 | MYR | | | 149,780,015 | |
jMalaysia Treasury Bill, 5/30/14 | | | 1,140,000 | MYR | | | 343,547 | |
| | | | | | | | |
| | | | | | | 150,123,562 | |
| | | | | | | | |
TGB-15
Franklin Templeton Variable Insurance Products Trust
Statement of Investments, December 31, 2013 (continued)
| | | | | | | | |
| Templeton Global Bond Securities Fund | | Principal
Amount* | | | Value | |
Short Term Investments (continued) | | | | | | | | |
Foreign Government and Agency Securities (continued) | | | | | | | | |
Mexico 3.0% | | | | | | | | |
jMexico Treasury Bills, | | | | | | | | |
1/09/14 - 4/30/14 | | | 31,812,220 | k MXN | | $ | 24,223,335 | |
10/16/14 | | | 46,859,000 | k MXN | | | 34,960,785 | |
12/11/14 | | | 59,641,100 | k MXN | | | 44,250,070 | |
| | | | | | | | |
| | | | | | | 103,434,190 | |
| | | | | | | | |
Philippines 0.9% | | | | | | | | |
jPhilippine Treasury Bills, 1/08/14 - 10/08/14 | | | 1,289,295,000 | PHP | | | 28,952,151 | |
| | | | | | | | |
Singapore 3.8% | | | | | | | | |
Government of Singapore, senior bond, 0.25%, 2/01/14 | | | 21,600,000 | SGD | | | 17,116,947 | |
jMonetary Authority of Singapore Treasury Bills, 1/03/14 - 2/14/14 | | | 46,732,000 | SGD | | | 37,030,791 | |
jSingapore Treasury Bills, 1/10/14 - 5/30/14 | | | 96,960,000 | SGD | | | 76,800,680 | |
| | | | | | | | |
| | | | | | | 130,948,418 | |
| | | | | | | | |
South Korea 0.7% | | | | | | | | |
Korea Monetary Stabilization Bond, senior bond, | | | | | | | | |
2.55%, 5/09/14 | | | 10,064,000,000 | KRW | | | 9,531,413 | |
2.72%, 9/09/14 | | | 14,437,000,000 | KRW | | | 13,682,266 | |
| | | | | | | | |
| | | | | | | 23,213,679 | |
| | | | | | | | |
Total Foreign Government and Agency Securities (Cost $503,106,917) | | | | | | | 490,699,282 | |
| | | | | | | | |
Total Investments before Repurchase Agreements (Cost $2,646,045,357) | | | | | | | 2,737,095,585 | |
| | | | | | | | |
Repurchase Agreements (Cost $362,770,388) 10.6% | | | | | | | | |
United States 10.6% | | | | | | | | |
lJoint Repurchase Agreement, 0.008%, 1/02/14 (Maturity Value $362,770,540) | | | 362,770,388 | | | | 362,770,388 | |
BNP Paribas Securities Corp. (Maturity Value $27,683,020) Credit Suisse Securities (USA) LLC (Maturity Value $83,049,060) Deutsche Bank Securities Inc. (Maturity Value $48,564,092) HSBC Securities (USA) Inc. (Maturity Value $116,271,586) Merrill Lynch, Pierce, Fenner & Smith Inc. (Maturity Value $53,983,884) Morgan Stanley & Co. LLC (Maturity Value $33,218,898) | | | | | | | | |
Collateralized by U.S. Government Agency Securities, 0.00% - 4.125%, 1/15/14 - 3/07/18; jU.S. Government Agency Discount Notes, 8/19/14; jU.S. Treasury Bills, 9/18/14; U.S. Treasury Bonds, 8.875% - 9.125%, 5/15/17 - 5/15/18; U.S. Treasury Notes, 0.25% - 4.75%, 1/15/15 - 12/31/18; and U.S. Treasury Notes, Index Linked, 1.375% - 1.625%, 1/15/18 - 7/15/18 (valued at $370,038,148) | | | | | | | | |
| | | | | | | | |
Total Investments (Cost $3,008,815,745) 90.7% | | | | | | | 3,099,865,973 | |
Other Assets, less Liabilities 9.3% | | | | | | | 319,403,073 | |
| | | | | | | | |
Net Assets 100.0% | | | | | | $ | 3,419,269,046 | |
| | | | | | | | |
See Abbreviations on page TGB-41.
TGB-16
Franklin Templeton Variable Insurance Products Trust
Statement of Investments, December 31, 2013 (continued)
| | | | |
| Templeton Global Bond Securities Fund | | | | |
†Rounds to less than 0.1% of net assets.
*The principal amount is stated in U.S. dollars unless otherwise indicated.
aPrincipal amount is stated in 1,000 Brazilian Real Units.
bRedemption price at maturity is adjusted for inflation. See Note 1(g).
cSecurity was purchased pursuant to Regulation S under the Securities Act of 1933, which exempts from registration securities offered and sold outside of the United States. Such a security cannot be sold in the United States without either an effective registration statement filed pursuant to the Securities Act of 1933, or pursuant to an exemption from registration. These securities have been deemed liquid under guidelines approved by the Trust’s Board of Trustees. At December 31, 2013, the aggregate value of these securities was $38,250,884, representing 1.12% of net assets.
dSecurity was purchased pursuant to Rule 144A under the Securities Act of 1933 and may be sold in transactions exempt from registration only to qualified institutional buyers or in a public offering registered under the Securities Act of 1933. These securities have been deemed liquid under guidelines approved by the Trust’s Board of Trustees. At December 31, 2013, the aggregate value of these securities was $266,213,599, representing 7.79% of net assets.
ePrincipal amount is stated in 100 Mexican Peso Units.
fPrincipal amount of security is adjusted for inflation. See Note 1(g).
gPrincipal amount is stated in Unidad de Inversion Units.
hThe coupon rate shown represents the rate at period end.
iA supranational organization is an entity formed by two or more central governments through international treaties.
jThe security is traded on a discount basis with no stated coupon rate.
kPrincipal amount is stated in 10 Mexican Peso Units.
lSee Note 1(c) regarding joint repurchase agreement.
TGB-17
Franklin Templeton Variable Insurance Products Trust
Statement of Investments, December 31, 2013 (continued)
| | | | |
| Templeton Global Bond Securities Fund | | | | |
At December 31, 2013, the Fund had the following forward exchange contracts outstanding. See Note 1(d).
Forward Exchange Contracts
| | | | | | | | | | | | | | | | | | | | | | | | | | | | |
| Currency | | Counterpartya | | | Type | | | Quantity | | | Contract
Amount* | | | Settlement
Date | | | Unrealized
Appreciation | | | Unrealized
Depreciation | |
Indian Rupee | | | CITI | | | | Buy | | | | 34,491,000 | | | | 533,446 | | | | 1/06/14 | | | $ | 23,633 | | | $ | — | |
Indian Rupee | | | HSBC | | | | Buy | | | | 251,448,000 | | | | 3,923,021 | | | | 1/06/14 | | | | 138,225 | | | | — | |
Indian Rupee | | | CITI | | | | Sell | | | | 34,491,000 | | | | 555,769 | | | | 1/06/14 | | | | — | | | | (1,311 | ) |
Indian Rupee | | | HSBC | | | | Sell | | | | 251,448,000 | | | | 4,045,825 | | | | 1/06/14 | | | | — | | | | (15,422 | ) |
Indian Rupee | | | DBAB | | | | Buy | | | | 217,594,000 | | | | 3,426,958 | | | | 1/07/14 | | | | 86,798 | | | | — | |
Japanese Yen | | | DBAB | | | | Sell | | | | 770,370,000 | | | | 8,897,885 | | | | 1/07/14 | | | | 1,581,670 | | | | — | |
Indian Rupee | | | DBAB | | | | Sell | | | | 217,594,000 | | | | 3,498,296 | | | | 1/07/14 | | | | — | | | | (15,460 | ) |
Euro | | | DBAB | | | | Sell | | | | 2,285,618 | | | | 3,003,759 | | | | 1/07/14 | | | | — | | | | (140,098 | ) |
Indian Rupee | | | DBAB | | | | Buy | | | | 40,529,000 | | | | 644,084 | | | | 1/08/14 | | | | 10,257 | | | | — | |
Malaysian Ringgit | | | DBAB | | | | Buy | | | | 8,862,500 | | | | 2,865,063 | | | | 1/08/14 | | | | — | | | | (162,856 | ) |
Swedish Krona | | | DBAB | | | | Buy | | | | 136,332,733 | | | | 15,821,369 | EUR | | | 1/09/14 | | | | — | | | | (572,377 | ) |
Mexican Peso | | | CITI | | | | Buy | | | | 109,357,558 | | | | 8,363,867 | | | | 1/10/14 | | | | 24,207 | | | | — | |
Japanese Yen | | | CITI | | | | Sell | | | | 138,680,000 | | | | 1,589,474 | | | | 1/10/14 | | | | 272,408 | | | | — | |
Euro | | | CITI | | | | Sell | | | | 5,040,000 | | | | 6,611,220 | | | | 1/10/14 | | | | — | | | | (321,266 | ) |
Chilean Peso | | | MSCO | | | | Buy | | | | 2,254,600,000 | | | | 4,581,124 | | | | 1/13/14 | | | | — | | | | (296,950 | ) |
Euro | | | UBSW | | | | Sell | | | | 15,572,000 | | | | 20,393,838 | | | | 1/13/14 | | | | — | | | | (1,025,311 | ) |
Euro | | | DBAB | | | | Sell | | | | 9,460,000 | | | | 12,533,554 | | | | 1/14/14 | | | | — | | | | (478,587 | ) |
Euro | | | JPHQ | | | | Sell | | | | 937,000 | | | | 1,226,767 | | | | 1/14/14 | | | | — | | | | (62,067 | ) |
Japanese Yen | | | UBSW | | | | Sell | | | | 415,980,000 | | | | 4,756,980 | | | | 1/14/14 | | | | 806,271 | | | | — | |
Indian Rupee | | | DBAB | | | | Buy | | | | 239,338,000 | | | | 3,824,390 | | | | 1/15/14 | | | | 34,344 | | | | — | |
Japanese Yen | | | HSBC | | | | Sell | | | | 536,380,000 | | | | 6,109,112 | | | | 1/15/14 | | | | 1,014,895 | | | | — | |
Malaysian Ringgit | | | JPHQ | | | | Buy | | | | 1,856,000 | | | | 604,856 | | | | 1/16/14 | | | | — | | | | (39,167 | ) |
Japanese Yen | | | DBAB | | | | Sell | | | | 139,110,000 | | | | 1,567,896 | | | | 1/16/14 | | | | 246,706 | | | | — | |
Japanese Yen | | | UBSW | | | | Sell | | | | 707,660,000 | | | | 7,973,544 | | | | 1/16/14 | | | | 1,252,578 | | | | — | |
Indian Rupee | | | DBAB | | | | Buy | | | | 383,041,000 | | | | 6,111,193 | | | | 1/17/14 | | | | 61,943 | | | | — | |
Japanese Yen | | | DBAB | | | | Sell | | | | 719,030,000 | | | | 8,111,032 | | | | 1/17/14 | | | | 1,282,045 | | | | — | |
Euro | | | DBAB | | | | Sell | | | | 4,856,000 | | | | 6,497,328 | | | | 1/17/14 | | | | — | | | | (182,044 | ) |
Japanese Yen | | | JPHQ | | | | Sell | | | | 1,305,790,000 | | | | 14,747,457 | | | | 1/17/14 | | | | 2,345,718 | | | | — | |
Indian Rupee | | | JPHQ | | | | Buy | | | | 226,092,000 | | | | 3,581,207 | | | | 1/21/14 | | | | 59,624 | | | | — | |
Euro | | | BZWS | | | | Sell | | | | 2,638,000 | | | | 3,467,255 | | | | 1/21/14 | | | | — | | | | (161,276 | ) |
Chilean Peso | | | DBAB | | | | Buy | | | | 2,227,910,000 | | | | 4,528,272 | | | | 1/22/14 | | | | — | | | | (299,335 | ) |
Indian Rupee | | | DBAB | | | | Buy | | | | 79,271,000 | | | | 1,265,178 | | | | 1/22/14 | | | | 11,095 | | | | — | |
Indian Rupee | | | JPHQ | | | | Buy | | | | 152,363,000 | | | | 2,432,127 | | | | 1/22/14 | | | | 20,936 | | | | — | |
Euro | | | JPHQ | | | | Sell | | | | 300,000 | | | | 403,658 | | | | 1/22/14 | | | | — | | | | (8,988 | ) |
Chilean Peso | | | DBAB | | | | Buy | | | | 3,160,140,000 | | | | 6,428,929 | | | | 1/24/14 | | | | — | | | | (431,889 | ) |
Singapore Dollar | | | JPHQ | | | | Buy | | | | 5,740,000 | | | | 4,629,032 | | | | 1/24/14 | | | | — | | | | (79,990 | ) |
Japanese Yen | | | UBSW | | | | Sell | | | | 944,420,000 | | | | 10,705,282 | | | | 1/27/14 | | | | 1,735,197 | | | | — | |
Chilean Peso | | | DBAB | | | | Buy | | | | 1,967,720,000 | | | | 4,001,871 | | | | 1/28/14 | | | | — | | | | (269,473 | ) |
Euro | | | CITI | | | | Sell | | | | 4,998,400 | | | | 6,690,208 | | | | 1/28/14 | | | | — | | | | (184,997 | ) |
Japanese Yen | | | DBAB | | | | Sell | | | | 897,860,782 | | | | 10,026,363 | | | | 1/28/14 | | | | 1,498,453 | | | | — | |
Japanese Yen | | | HSBC | | | | Sell | | | | 1,162,462,488 | | | | 12,988,408 | | | | 1/28/14 | | | | 1,947,302 | | | | — | |
Chilean Peso | | | DBAB | | | | Buy | | | | 635,690,000 | | | | 1,295,608 | | | | 1/29/14 | | | | — | | | | (89,966 | ) |
Indian Rupee | | | HSBC | | | | Buy | | | | 531,272,000 | | | | 8,425,533 | | | | 1/29/14 | | | | 116,138 | | | | — | |
Chilean Peso | | | JPHQ | | | | Buy | | | | 675,370,000 | | | | 1,372,703 | | | | 1/30/14 | | | | — | | | | (91,956 | ) |
Malaysian Ringgit | | | JPHQ | | | | Buy | | | | 11,703,000 | | | | 3,767,869 | | | | 1/30/14 | | | | — | | | | (203,250 | ) |
Chilean Peso | | | DBAB | | | | Buy | | | | 1,271,380,000 | | | | 2,582,793 | | | | 1/31/14 | | | | — | | | | (172,050 | ) |
Euro | | | DBAB | | | | Sell | | | | 65,773,000 | | | | 88,728,713 | | | | 1/31/14 | | | | — | | | | (1,740,768 | ) |
Chilean Peso | | | DBAB | | | | Buy | | | | 1,186,400,000 | | | | 2,402,106 | | | | 2/03/14 | | | | — | | | | (153,212 | ) |
Euro | | | UBSW | | | | Sell | | | | 5,540,000 | | | | 7,513,071 | | | | 2/03/14 | | | | — | | | | (107,102 | ) |
TGB-18
Franklin Templeton Variable Insurance Products Trust
Statement of Investments, December 31, 2013 (continued)
| | | | |
| Templeton Global Bond Securities Fund | | | | |
Forward Exchange Contracts (continued)
| | | | | | | | | | | | | | | | | | | | | | | | | | | | |
| Currency | | Counterpartya | | | Type | | | Quantity | | | Contract
Amount* | | | Settlement
Date | | | Unrealized
Appreciation | | | Unrealized
Depreciation | |
Malaysian Ringgit | | | JPHQ | | | | Buy | | | | 9,715,000 | | | | 3,085,596 | | | | 2/04/14 | | | $ | — | | | $ | (127,164 | ) |
Indian Rupee | | | JPHQ | | | | Buy | | | | 21,500,000 | | | | 339,360 | | | | 2/06/14 | | | | 5,746 | | | | — | |
Malaysian Ringgit | | | HSBC | | | | Buy | | | | 19,888,085 | | | | 6,268,900 | | | | 2/06/14 | | | | — | | | | (213,078 | ) |
Singapore Dollar | | | DBAB | | | | Buy | | | | 6,207,000 | | | | 4,875,348 | | | | 2/07/14 | | | | 43,827 | | | | — | |
Singapore Dollar | | | HSBC | | | | Buy | | | | 6,206,000 | | | | 5,016,571 | | | | 2/07/14 | | | | — | | | | (98,189 | ) |
Indian Rupee | | | DBAB | | | | Buy | | | | 39,609,000 | | | | 624,182 | | | | 2/10/14 | | | | 11,075 | | | | — | |
South Korean Won | | | HSBC | | | | Buy | | | | 21,363,430,000 | | | | 18,962,746 | | | | 2/10/14 | | | | 1,217,420 | | | | — | |
Japanese Yen | | | CITI | | | | Sell | | | | 366,860,000 | | | | 3,724,013 | | | | 2/10/14 | | | | 239,348 | | | | — | |
Euro | | | CITI | | | | Sell | | | | 6,572,000 | | | | 8,899,605 | | | | 2/10/14 | | | | — | | | | (140,097 | ) |
Euro | | | HSBC | | | | Sell | | | | 1,800,000 | | | | 2,434,230 | | | | 2/10/14 | | | | — | | | | (41,647 | ) |
Euro | | | UBSW | | | | Sell | | | | 4,929,000 | | | | 6,673,472 | | | | 2/10/14 | | | | — | | | | (106,305 | ) |
Chilean Peso | | | BZWS | | | | Buy | | | | 1,142,900,000 | | | | 2,317,315 | | | | 2/11/14 | | | | — | | | | (152,712 | ) |
Polish Zloty | | | BZWS | | | | Buy | | | | 17,528,000 | | | | 4,066,538 | EUR | | | 2/11/14 | | | | 195,525 | | | | — | |
Polish Zloty | | | DBAB | | | | Buy | | | | 17,528,000 | | | | 4,075,237 | EUR | | | 2/11/14 | | | | 183,560 | | | | — | |
Euro | | | BZWS | | | | Sell | | | | 1,412,000 | | | | 1,907,753 | | | | 2/11/14 | | | | — | | | | (34,436 | ) |
Euro | | | DBAB | | | | Sell | | | | 1,738,000 | | | | 2,332,274 | | | | 2/11/14 | | | | — | | | | (58,324 | ) |
Chilean Peso | | | DBAB | | | | Buy | | | | 1,145,000,000 | | | | 2,318,283 | | | | 2/12/14 | | | | — | | | | (149,931 | ) |
Indian Rupee | | | HSBC | | | | Buy | | | | 42,784,000 | | | | 664,952 | | | | 2/12/14 | | | | 20,944 | | | | — | |
Singapore Dollar | | | BZWS | | | | Buy | | | | 1,717,028 | | | | 1,353,269 | | | | 2/12/14 | | | | 7,516 | | | | — | |
Japanese Yen | | | GSCO | | | | Sell | | | | 394,373,000 | | | | 4,248,793 | | | | 2/12/14 | | | | 502,757 | | | | — | |
Japanese Yen | | | HSBC | | | | Sell | | | | 1,035,240,000 | | | | 11,130,177 | | | | 2/12/14 | | | | 1,296,727 | | | | — | |
Japanese Yen | | | JPHQ | | | | Sell | | | | 1,034,700,000 | | | | 11,130,223 | | | | 2/12/14 | | | | 1,301,902 | | | | — | |
Indian Rupee | | | HSBC | | | | Buy | | | | 108,000,000 | | | | 1,660,632 | | | | 2/13/14 | | | | 70,424 | | | | — | |
Japanese Yen | | | CITI | | | | Sell | | | | 1,371,360,000 | | | | 14,840,354 | | | | 2/13/14 | | | | 1,814,134 | | | | — | |
Japanese Yen | | | JPHQ | | | | Sell | | | | 686,710,000 | | | | 7,420,122 | | | | 2/13/14 | | | | 897,228 | | | | — | |
Euro | | | UBSW | | | | Sell | | | | 657,000 | | | | 881,234 | | | | 2/13/14 | | | | — | | | | (22,462 | ) |
Chilean Peso | | | DBAB | | | | Buy | | | | 964,250,000 | | | | 1,956,001 | | | | 2/14/14 | | | | — | | | | (130,332 | ) |
Chilean Peso | | | MSCO | | | | Buy | | | | 2,590,220,000 | | | | 5,239,648 | | | | 2/14/14 | | | | — | | | | (335,438 | ) |
Malaysian Ringgit | | | DBAB | | | | Buy | | | | 97,443,480 | | | | 30,906,965 | | | | 2/14/14 | | | | — | | | | (1,246,514 | ) |
Polish Zloty | | | DBAB | | | | Buy | | | | 17,528,000 | | | | 4,068,048 | EUR | | | 2/14/14 | | | | 192,440 | | | | — | |
Chilean Peso | | | DBAB | | | | Buy | | | | 2,188,820,000 | | | | 4,439,527 | | | | 2/18/14 | | | | — | | | | (297,062 | ) |
Indian Rupee | | | DBAB | | | | Buy | | | | 108,614,000 | | | | 1,656,850 | | | | 2/18/14 | | | | 82,258 | | | | — | |
Indian Rupee | | | JPHQ | | | | Buy | | | | 127,745,000 | | | | 1,949,576 | | | | 2/18/14 | | | | 95,855 | | | | — | |
Singapore Dollar | | | HSBC | | | | Buy | | | | 3,667,000 | | | | 2,901,108 | | | | 2/18/14 | | | | 5,090 | | | | — | |
Japanese Yen | | | GSCO | | | | Sell | | | | 123,057,280 | | | | 1,322,059 | | | | 2/18/14 | | | | 153,140 | | | | — | |
Japanese Yen | | | JPHQ | | | | Sell | | | | 831,970,000 | | | | 8,977,211 | | | | 2/18/14 | | | | 1,074,340 | | | | — | |
Malaysian Ringgit | | | HSBC | | | | Buy | | | | 4,899,000 | | | | 1,551,593 | | | | 2/19/14 | | | | — | | | | (60,738 | ) |
Japanese Yen | | | CITI | | | | Sell | | | | 684,870,000 | | | | 7,420,164 | | | | 2/19/14 | | | | 914,563 | | | | — | |
Japanese Yen | | | GSCO | | | | Sell | | | | 687,820,000 | | | | 7,420,129 | | | | 2/19/14 | | | | 886,506 | | | | — | |
Euro | | | JPHQ | | | | Sell | | | | 3,942,000 | | | | 5,268,404 | | | | 2/19/14 | | | | — | | | | (153,790 | ) |
Chilean Peso | | | CITI | | | | Buy | | | | 2,285,090,000 | | | | 4,646,381 | | | | 2/20/14 | | | | — | | | | (322,633 | ) |
Indian Rupee | | | DBAB | | | | Buy | | | | 98,937,000 | | | | 1,537,124 | | | | 2/20/14 | | | | 46,387 | | | | — | |
Euro | | | BZWS | | | | Sell | | | | 6,280,000 | | | | 8,382,795 | | | | 2/20/14 | | | | — | | | | (255,307 | ) |
Chilean Peso | | | JPHQ | | | | Buy | | | | 1,055,800,000 | | | | 2,145,935 | | | | 2/21/14 | | | | — | | | | (148,407 | ) |
Euro | | | GSCO | | | | Sell | | | | 2,038,000 | | | | 2,728,067 | | | | 2/21/14 | | | | — | | | | (75,191 | ) |
Chilean Peso | | | JPHQ | | | | Buy | | | | 1,792,000,000 | | | | 3,635,257 | | | | 2/24/14 | | | | — | | | | (245,945 | ) |
Chilean Peso | | | MSCO | | | | Buy | | | | 1,273,240,000 | | | | 2,575,584 | | | | 2/24/14 | | | | — | | | | (167,432 | ) |
Japanese Yen | | | HSBC | | | | Sell | | | | 385,460,000 | | | | 4,124,773 | | | | 2/24/14 | | | | 463,189 | | | | — | |
Chilean Peso | | | DBAB | | | | Buy | | | | 1,455,470,000 | | | | 2,942,721 | | | | 2/25/14 | | | | — | | | | (190,198 | ) |
Japanese Yen | | | BZWS | | | | Sell | | | | 343,460,000 | | | | 3,710,113 | | | | 2/25/14 | | | | 447,483 | | | | — | |
Japanese Yen | | | JPHQ | | | | Sell | | | | 385,700,000 | | | | 4,160,621 | | | | 2/25/14 | | | | 496,741 | | | | — | |
TGB-19
Franklin Templeton Variable Insurance Products Trust
Statement of Investments, December 31, 2013 (continued)
| | | | |
| Templeton Global Bond Securities Fund | | | | |
Forward Exchange Contracts (continued)
| | | | | | | | | | | | | | | | | | | | | | | | | | | | |
| Currency | | Counterpartya | | | Type | | | Quantity | | | Contract
Amount* | | | Settlement
Date | | | Unrealized
Appreciation | | | Unrealized
Depreciation | |
Chilean Peso | | | DBAB | | | | Buy | | | | 1,435,490,000 | | | | 2,899,980 | | | | 2/26/14 | | | $ | — | | | $ | (185,529 | ) |
Chilean Peso | | | MSCO | | | | Buy | | | | 1,559,200,000 | | | | 3,152,128 | | | | 2/26/14 | | | | — | | | | (203,746 | ) |
Indian Rupee | | | DBAB | | | | Buy | | | | 130,201,000 | | | | 2,031,439 | | | | 2/26/14 | | | | 49,896 | | | | — | |
Euro | | | BZWS | | | | Sell | | | | 9,771,593 | | | | 13,027,122 | | | | 2/26/14 | | | | — | | | | (413,684 | ) |
Japanese Yen | | | UBSW | | | | Sell | | | | 937,086,000 | | | | 9,517,428 | | | | 2/26/14 | | | | 615,724 | | | | — | |
Euro | | | UBSW | | | | Sell | | | | 13,581,483 | | | | 18,149,614 | | | | 2/26/14 | | | | — | | | | (531,687 | ) |
Chilean Peso | | | DBAB | | | | Buy | | | | 2,094,920,000 | | | | 4,235,584 | | | | 2/27/14 | | | | — | | | | (274,597 | ) |
Indian Rupee | | | DBAB | | | | Buy | | | | 700,705,481 | | | | 10,929,226 | | | | 2/27/14 | | | | 269,638 | | | | — | |
Indian Rupee | | | HSBC | | | | Buy | | | | 148,257,000 | | | | 2,311,207 | | | | 2/27/14 | | | | 58,276 | | | | — | |
Malaysian Ringgit | | | HSBC | | | | Buy | | | | 2,087,700 | | | | 622,265 | | | | 2/27/14 | | | | 12,833 | | | | — | |
Singapore Dollar | | | DBAB | | | | Buy | | | | 7,749,500 | | | | 6,059,978 | | | | 2/27/14 | | | | 81,757 | | | | — | |
Japanese Yen | | | BZWS | | | | Sell | | | | 1,576,550,000 | | | | 16,929,882 | | | | 2/27/14 | | | | 1,953,617 | | | | — | |
Euro | | | BZWS | | | | Sell | | | | 3,902,180 | | | | 5,212,328 | | | | 2/27/14 | | | | — | | | | (155,115 | ) |
Japanese Yen | | | DBAB | | | | Sell | | | | 229,660,000 | | | | 2,508,999 | | | | 2/27/14 | | | | 327,369 | | | | — | |
Euro | | | DBAB | | | | Sell | | | | 1,530,900 | | | | 2,024,646 | | | | 2/27/14 | | | | — | | | | (81,105 | ) |
Chilean Peso | | | DBAB | | | | Buy | | | | 790,050,000 | | | | 1,595,158 | | | | 2/28/14 | | | | — | | | | (101,522 | ) |
Chilean Peso | | | JPHQ | | | | Buy | | | | 593,800,000 | | | | 1,200,445 | | | | 2/28/14 | | | | — | | | | (77,831 | ) |
Indian Rupee | | | DBAB | | | | Buy | | | | 211,714,000 | | | | 3,313,364 | | | | 2/28/14 | | | | 69,613 | | | | — | |
Indian Rupee | | | JPHQ | | | | Buy | | | | 181,822,000 | | | | 2,841,685 | | | | 2/28/14 | | | | 63,647 | | | | — | |
Singapore Dollar | | | BZWS | | | | Buy | | | | 21,427,761 | | | | 16,716,930 | | | | 2/28/14 | | | | 265,293 | | | | — | |
Singapore Dollar | | | DBAB | | | | Buy | | | | 5,960,000 | | | | 4,731,641 | | | | 2/28/14 | | | | 37,801 | | | | (45,941 | ) |
Euro | | | UBSW | | | | Sell | | | | 2,694,506 | | | | 3,608,644 | | | | 2/28/14 | | | | — | | | | (97,647 | ) |
Chilean Peso | | | DBAB | | | | Buy | | | | 1,253,970,000 | | | | 2,533,529 | | | | 3/03/14 | | | | — | | | | (163,605 | ) |
Indian Rupee | | | CITI | | | | Buy | | | | 34,827,000 | | | | 538,035 | | | | 3/03/14 | | | | 18,073 | | | | — | |
Indian Rupee | | | HSBC | | | | Buy | | | | 240,033,500 | | | | 3,705,936 | | | | 3/03/14 | | | | 126,852 | | | | — | |
Euro | | | DBAB | | | | Sell | | | | 2,579,651 | | | | 3,394,176 | | | | 3/03/14 | | | | — | | | | (154,129 | ) |
Japanese Yen | | | JPHQ | | | | Sell | | | | 401,100,000 | | | | 4,410,794 | | | | 3/03/14 | | | | 600,508 | | | | — | |
Japanese Yen | | | HSBC | | | | Sell | | | | 400,800,000 | | | | 4,401,977 | | | | 3/04/14 | | | | 594,519 | | | | — | |
Japanese Yen | | | UBSW | | | | Sell | | | | 447,200,000 | | | | 4,864,571 | | | | 3/04/14 | | | | 616,329 | | | | — | |
Chilean Peso | | | BZWS | | | | Buy | | | | 3,010,700,000 | | | | 6,079,152 | | | | 3/05/14 | | | | — | | | | (390,393 | ) |
Chilean Peso | | | DBAB | | | | Buy | | | | 1,253,970,000 | | | | 2,526,637 | | | | 3/05/14 | | | | — | | | | (157,243 | ) |
Euro | | | DBAB | | | | Sell | | | | 1,536,000 | | | | 2,000,640 | | | | 3/05/14 | | | | — | | | | (112,122 | ) |
Chilean Peso | | | DBAB | | | | Buy | | | | 1,328,230,000 | | | | 2,673,840 | | | | 3/06/14 | | | | — | | | | (164,412 | ) |
Chilean Peso | | | DBAB | | | | Buy | | | | 1,320,220,000 | | | | 2,665,765 | | | | 3/07/14 | | | | — | | | | (171,748 | ) |
Japanese Yen | | | BZWS | | | | Sell | | | | 1,712,605,900 | | | | 17,274,115 | | | | 3/07/14 | | | | 1,004,686 | | | | — | |
Euro | | | BZWS | | | | Sell | | | | 3,441,044 | | | | 4,502,400 | | | | 3/07/14 | | | | — | | | | (230,735 | ) |
Chilean Peso | | | MSCO | | | | Buy | | | | 662,100,000 | | | | 1,337,576 | | | | 3/10/14 | | | | — | | | | (87,228 | ) |
Mexican Peso | | | HSBC | | | | Buy | | | | 135,500,950 | | | | 10,314,452 | | | | 3/10/14 | | | | 30,526 | | | | — | |
Euro | | | BZWS | | | | Sell | | | | 3,785,232 | | | | 4,931,173 | | | | 3/10/14 | | | | — | | | | (275,379 | ) |
Euro | | | CITI | | | | Sell | | | | 31,404,613 | | | | 41,028,557 | | | | 3/10/14 | | | | — | | | | (2,168,203 | ) |
Euro | | | GSCO | | | | Sell | | | | 21,480,000 | | | | 28,010,350 | | | | 3/10/14 | | | | — | | | | (1,535,195 | ) |
Euro | | | HSBC | | | | Sell | | | | 1,844,000 | | | | 2,406,420 | | | | 3/10/14 | | | | — | | | | (129,985 | ) |
Euro | | | MSCO | | | | Sell | | | | 5,225,000 | | | | 6,827,769 | | | | 3/10/14 | | | | — | | | | (359,171 | ) |
Singapore Dollar | | | CITI | | | | Buy | | | | 21,075,381 | | | | 16,932,505 | | | | 3/11/14 | | | | — | | | | (229,476 | ) |
Chilean Peso | | | DBAB | | | | Buy | | | | 1,284,460,000 | | | | 2,596,967 | | | | 3/13/14 | | | | — | | | | (172,131 | ) |
Euro | | | JPHQ | | | | Sell | | | | 541,000 | | | | 713,081 | | | | 3/13/14 | | | | — | | | | (31,058 | ) |
Mexican Peso | | | CITI | | | | Buy | | | | 25,894,900 | | | | 1,967,204 | | | | 3/14/14 | | | | 9,139 | | | | — | |
Singapore Dollar | | | HSBC | | | | Buy | | | | 10,521,600 | | | | 8,436,177 | | | | 3/14/14 | | | | — | | | | (97,405 | ) |
Euro | | | BZWS | | | | Sell | | | | 1,161,439 | | | | 1,511,346 | | | | 3/17/14 | | | | — | | | | (86,195 | ) |
Japanese Yen | | | CITI | | | | Sell | | | | 286,112,008 | | | | 2,988,583 | | | | 3/17/14 | | | | 270,417 | | | | — | |
Chilean Peso | | | DBAB | | | | Buy | | | | 2,600,220,000 | | | | 5,271,072 | | | | 3/18/14 | | | | — | | | | (365,051 | ) |
TGB-20
Franklin Templeton Variable Insurance Products Trust
Statement of Investments, December 31, 2013 (continued)
| | | | |
| Templeton Global Bond Securities Fund | | | | |
Forward Exchange Contracts (continued)
| | | | | | | | | | | | | | | | | | | | | | | | | | | | |
| Currency | | Counterpartya | | | Type | | | Quantity | | | Contract
Amount* | | | Settlement
Date | | | Unrealized
Appreciation | | | Unrealized
Depreciation | |
Indian Rupee | | | JPHQ | | | | Buy | | | | 230,330,000 | | | | 3,633,401 | | | | 3/18/14 | | | $ | 30,696 | | | $ | — | |
Euro | | | CITI | | | | Sell | | | | 861,168 | | | | 1,117,955 | | | | 3/18/14 | | | | — | | | | (66,566 | ) |
Hungarian Forint | | | DBAB | | | | Buy | | | | 2,348,675,000 | | | | 7,437,753 | EUR | | | 3/19/14 | | | | 584,620 | | | | — | |
Hungarian Forint | | | JPHQ | | | | Buy | | | | 703,907,450 | | | | 2,231,326 | EUR | | | 3/19/14 | | | | 172,185 | | | | — | |
Singapore Dollar | | | DBAB | | | | Buy | | | | 7,978,100 | | | | 6,255,175 | | | | 3/19/14 | | | | 67,789 | | | | — | |
Singapore Dollar | | | HSBC | | | | Buy | | | | 9,120,000 | | | | 7,310,328 | | | | 3/19/14 | | | | — | | | | (82,364 | ) |
Singapore Dollar | | | JPHQ | | | | Buy | | | | 5,686,000 | | | | 4,437,888 | | | | 3/19/14 | | | | 68,494 | | | | — | |
Japanese Yen | | | CITI | | | | Sell | | | | 1,866,452,000 | | | | 19,634,407 | | | | 3/19/14 | | | | 1,902,246 | | | | — | |
Japanese Yen | | | MSCO | | | | Sell | | | | 575,230,000 | | | | 6,012,962 | | | | 3/19/14 | | | | 548,010 | | | | — | |
Hungarian Forint | | | JPHQ | | | | Buy | | | | 1,177,657,000 | | | | 3,718,878 | EUR | | | 3/20/14 | | | | 307,298 | | | | — | |
Chilean Peso | | | JPHQ | | | | Buy | | | | 1,065,000,000 | | | | 2,153,691 | | | | 3/21/14 | | | | — | | | | (144,951 | ) |
Hungarian Forint | | | JPHQ | | | | Buy | | | | 1,171,335,000 | | | | 3,718,878 | EUR | | | 3/21/14 | | | | 277,893 | | | | — | |
Euro | | | BZWS | | | | Sell | | | | 744,197 | | | | 966,414 | | | | 3/21/14 | | | | — | | | | (57,214 | ) |
Mexican Peso | | | CITI | | | | Buy | | | | 75,637,200 | | | | 5,547,527 | | | | 3/24/14 | | | | 220,620 | | | | — | |
Japanese Yen | | | BZWS | | | | Sell | | | | 740,940,000 | | | | 7,832,595 | | | | 3/24/14 | | | | 793,119 | | | | — | |
Japanese Yen | | | DBAB | | | | Sell | | | | 725,287,000 | | | | 7,682,067 | | | | 3/24/14 | | | | 791,306 | | | | — | |
Japanese Yen | | | BZWS | | | | Sell | | | | 242,774,840 | | | | 2,559,566 | | | | 3/25/14 | | | | 253,013 | | | | — | |
Indian Rupee | | | DBAB | | | | Buy | | | | 130,201,000 | | | | 2,046,864 | | | | 3/26/14 | | | | 20,256 | | | | — | |
Malaysian Ringgit | | | DBAB | | | | Buy | | | | 8,012,500 | | | | 2,524,576 | | | | 3/26/14 | | | | — | | | | (90,645 | ) |
Malaysian Ringgit | | | HSBC | | | | Buy | | | | 7,634,000 | | | | 2,404,107 | | | | 3/26/14 | | | | — | | | | (85,152 | ) |
Euro | | | CITI | | | | Sell | | | | 1,532,964 | | | | 1,993,926 | | | | 3/26/14 | | | | — | | | | (114,627 | ) |
Euro | | | DBAB | | | | Sell | | | | 2,736,000 | | | | 3,554,748 | | | | 3/26/14 | | | | — | | | | (208,551 | ) |
Euro | | | BZWS | | | | Sell | | | | 6,085,000 | | | | 8,216,880 | | | | 3/27/14 | | | | — | | | | (152,879 | ) |
Indian Rupee | | | DBAB | | | | Buy | | | | 24,950,000 | | | | 393,968 | | | | 3/28/14 | | | | 1,951 | | | | — | |
Indian Rupee | | | JPHQ | | | | Buy | | | | 79,054,000 | | | | 1,244,357 | | | | 3/28/14 | | | | 10,110 | | | | — | |
Chilean Peso | | | DBAB | | | | Buy | | | | 1,330,940,000 | | | | 2,695,302 | | | | 4/04/14 | | | | — | | | | (188,789 | ) |
Euro | | | DBAB | | | | Sell | | | | 6,200,000 | | | | 7,980,330 | | | | 4/04/14 | | | | — | | | | (547,627 | ) |
Indian Rupee | | | CITI | | | | Buy | | | | 34,491,000 | | | | 545,226 | | | | 4/07/14 | | | | 847 | | | | — | |
Indian Rupee | | | DBAB | | | | Buy | | | | 217,594,000 | | | | 3,435,333 | | | | 4/07/14 | | | | 9,690 | | | | — | |
Indian Rupee | | | HSBC | | | | Buy | | | | 251,448,000 | | | | 3,969,814 | | | | 4/07/14 | | | | 11,198 | | | | — | |
Euro | | | HSBC | | | | Sell | | | | 8,692,000 | | | | 11,359,314 | | | | 4/10/14 | | | | — | | | | (596,425 | ) |
Euro | | | DBAB | | | | Sell | | | | 7,243,000 | | | | 9,479,276 | | | | 4/11/14 | | | | — | | | | (483,394 | ) |
Euro | | | UBSW | | | | Sell | | | | 4,346,000 | | | | 5,690,001 | | | | 4/11/14 | | | | — | | | | (287,877 | ) |
Chilean Peso | | | MSCO | | | | Buy | | | | 2,645,530,000 | | | | 5,408,423 | | | | 4/14/14 | | | | — | | | | (431,293 | ) |
Euro | | | JPHQ | | | | Sell | | | | 3,907,000 | | | | 5,120,878 | | | | 4/14/14 | | | | — | | | | (253,181 | ) |
Malaysian Ringgit | | | DBAB | | | | Buy | | | | 16,369,588 | | | | 5,106,241 | | | | 4/16/14 | | | | — | | | | (139,221 | ) |
Euro | | | HSBC | | | | Sell | | | | 6,919,000 | | | | 9,056,487 | | | | 4/16/14 | | | | — | | | | (460,587 | ) |
Chilean Peso | | | MSCO | | | | Buy | | | | 2,370,410,000 | | | | 4,812,527 | | | | 4/21/14 | | | | — | | | | (356,185 | ) |
Malaysian Ringgit | | | JPHQ | | | | Buy | | | | 15,728,213 | | | | 5,098,286 | | | | 4/21/14 | | | | — | | | | (327,125 | ) |
Japanese Yen | | | BZWS | | | | Sell | | | | 700,840,000 | | | | 7,204,618 | | | | 4/21/14 | | | | 544,890 | | | | — | |
Japanese Yen | | | JPHQ | | | | Sell | | | | 421,090,000 | | | | 4,322,751 | | | | 4/21/14 | | | | 321,346 | | | | — | |
Japanese Yen | | | CITI | | | | Sell | | | | 261,800,000 | | | | 2,675,387 | | | | 4/22/14 | | | | 187,617 | | | | — | |
Japanese Yen | | | JPHQ | | | | Sell | | | | 496,560,000 | | | | 5,072,581 | | | | 4/22/14 | | | | 353,990 | | | | — | |
Euro | | | DBAB | | | | Sell | | | | 4,545,000 | | | | 5,957,132 | | | | 4/23/14 | | | | — | | | | (294,566 | ) |
Euro | | | BZWS | | | | Sell | | | | 4,954,399 | | | | 6,471,436 | | | | 4/25/14 | | | | — | | | | (343,412 | ) |
Chilean Peso | | | JPHQ | | | | Buy | | | | 1,501,938,000 | | | | 3,023,529 | | | | 4/28/14 | | | | — | | | | (201,925 | ) |
Swedish Krona | | | BZWS | | | | Buy | | | | 122,773,200 | | | | 14,205,258 | EUR | | | 4/30/14 | | | | — | | | | (493,221 | ) |
Euro | | | BZWS | | | | Sell | | | | 6,575,679 | | | | 8,576,001 | | | | 4/30/14 | | | | — | | | | (469,000 | ) |
Euro | | | DBAB | | | | Sell | | | | 11,263,000 | | | | 14,952,984 | | | | 4/30/14 | | | | — | | | | (539,536 | ) |
Euro | | | BZWS | | | | Sell | | | | 7,026,829 | | | | 9,313,640 | | | | 5/05/14 | | | | — | | | | (351,990 | ) |
Euro | | | BZWS | | | | Sell | | | | 1,259,000 | | | | 1,652,249 | | | | 5/07/14 | | | | — | | | | (79,551 | ) |
TGB-21
Franklin Templeton Variable Insurance Products Trust
Statement of Investments, December 31, 2013 (continued)
| | | | |
| Templeton Global Bond Securities Fund | | | | |
Forward Exchange Contracts (continued)
| | | | | | | | | | | | | | | | | | | | | | | | | | | | |
| Currency | | Counterpartya | | | Type | | | Quantity | | | Contract
Amount* | | | Settlement
Date | | | Unrealized
Appreciation | | | Unrealized
Depreciation | |
Euro | | | GSCO | | | | Sell | | | | 2,990,000 | | | | 3,933,644 | | | | 5/07/14 | | | $ | — | | | $ | (179,208 | ) |
Euro | | | GSCO | | | | Sell | | | | 2,045,000 | | | | 2,678,152 | | | | 5/08/14 | | | | — | | | | (134,822 | ) |
Chilean Peso | | | MSCO | | | | Buy | | | | 1,150,200,000 | | | | 2,333,063 | | | | 5/12/14 | | | | — | | | | (175,339 | ) |
Japanese Yen | | | CITI | | | | Sell | | | | 366,861,000 | | | | 3,718,550 | | | | 5/12/14 | | | | 231,951 | | | | — | |
Euro | | | GSCO | | | | Sell | | | | 1,259,000 | | | | 1,663,328 | | | | 5/12/14 | | | | — | | | | (68,483 | ) |
Euro | | | UBSW | | | | Sell | | | | 629,000 | | | | 830,516 | | | | 5/12/14 | | | | — | | | | (34,702 | ) |
Euro | | | CITI | | | | Sell | | | | 5,658,426 | | | | 7,468,274 | | | | 5/13/14 | | | | — | | | | (315,155 | ) |
Japanese Yen | | | GSCO | | | | Sell | | | | 490,555,000 | | | | 4,954,250 | | | | 5/13/14 | | | | 292,047 | | | | — | |
Euro | | | GSCO | | | | Sell | | | | 4,115,000 | | | | 5,502,990 | | | | 5/13/14 | | | | — | | | | (157,385 | ) |
Japanese Yen | | | UBSW | | | | Sell | | | | 366,681,000 | | | | 3,702,540 | | | | 5/13/14 | | | | 217,627 | | | | — | |
Japanese Yen | | | CITI | | | | Sell | | | | 366,680,000 | | | | 3,644,713 | | | | 5/14/14 | | | | 159,786 | | | | — | |
Euro | | | BZWS | | | | Sell | | | | 8,551,980 | | | | 11,291,103 | | | | 5/16/14 | | | | — | | | | (472,589 | ) |
Singapore Dollar | | | DBAB | | | | Buy | | | | 3,667,000 | | | | 2,891,728 | | | | 5/19/14 | | | | 14,856 | | | | — | |
Euro | | | GSCO | | | | Sell | | | | 4,454,000 | | | | 5,771,271 | | | | 5/20/14 | | | | — | | | | (355,470 | ) |
Euro | | | BZWS | | | | Sell | | | | 11,375,532 | | | | 14,643,154 | | | | 5/21/14 | | | | — | | | | (1,004,583 | ) |
Chilean Peso | | | MSCO | | | | Buy | | | | 420,740,000 | | | | 836,794 | | | | 5/22/14 | | | | — | | | | (48,310 | ) |
Malaysian Ringgit | | | HSBC | | | | Buy | | | | 298,500 | | | | 96,950 | | | | 5/22/14 | | | | — | | | | (6,547 | ) |
Euro | | | JPHQ | | | | Sell | | | | 4,730,771 | | | | 6,116,461 | | | | 5/23/14 | | | | — | | | | (391,019 | ) |
Malaysian Ringgit | | | HSBC | | | | Buy | | | | 1,229,300 | | | | 397,484 | | | | 5/28/14 | | | | — | | | | (25,295 | ) |
Euro | | | BZWS | | | | Sell | | | | 2,836,669 | | | | 3,664,976 | | | | 5/30/14 | | | | — | | | | (237,080 | ) |
Euro | | | GSCO | | | | Sell | | | | 463,000 | | | | 596,969 | | | | 5/30/14 | | | | — | | | | (39,923 | ) |
Euro | | | BZWS | | | | Sell | | | | 7,895,591 | | | | 10,294,504 | | | | 6/05/14 | | | | — | | | | (566,574 | ) |
Mexican Peso | | | CITI | | | | Buy | | | | 78,317,430 | | | | 5,917,359 | | | | 6/09/14 | | | | 19,203 | | | | — | |
Japanese Yen | | | CITI | | | | Sell | | | | 1,370,500,000 | | | | 13,819,704 | | | | 6/09/14 | | | | 792,137 | | | | — | |
Euro | | | GSCO | | | | Sell | | | | 2,033,100 | | | | 2,667,793 | | | | 6/09/14 | | | | — | | | | (128,929 | ) |
Japanese Yen | | | HSBC | | | | Sell | | | | 2,052,400,000 | | | | 20,729,219 | | | | 6/09/14 | | | | 1,219,714 | | | | — | |
Japanese Yen | | | JPHQ | | | | Sell | | | | 1,375,900,000 | | | | 13,819,113 | | | | 6/09/14 | | | | 740,216 | | | | — | |
Mexican Peso | | | CITI | | | | Buy | | | | 78,230,000 | | | | 5,901,657 | | | | 6/10/14 | | | | 27,814 | | | | — | |
Swedish Krona | | | DBAB | | | | Buy | | | | 41,300,000 | | | | 4,737,325 | EUR | | | 6/10/14 | | | | — | | | | (113,951 | ) |
Japanese Yen | | | BZWS | | | | Sell | | | | 1,689,110,000 | | | | 17,356,925 | | | | 6/10/14 | | | | 1,300,636 | | | | — | |
Japanese Yen | | | HSBC | | | | Sell | | | | 1,798,900,000 | | | | 18,596,742 | | | | 6/10/14 | | | | 1,496,814 | | | | — | |
Japanese Yen | | | JPHQ | | | | Sell | | | | 1,219,900,000 | | | | 12,397,806 | | | | 6/10/14 | | | | 801,719 | | | | — | |
Polish Zloty | | | CITI | | | | Buy | | | | 5,990,000 | | | | 1,365,927 | EUR | | | 6/11/14 | | | | 84,980 | | | | — | |
Swedish Krona | | | MSCO | | | | Buy | | | | 13,064,000 | | | | 1,488,181 | EUR | | | 6/11/14 | | | | — | | | | (21,875 | ) |
Japanese Yen | | | DBAB | | | | Sell | | | | 595,700,000 | | | | 6,199,009 | | | | 6/11/14 | | | | 536,384 | | | | — | |
Euro | | | GSCO | | | | Sell | | | | 8,105,300 | | | | 10,738,712 | | | | 6/11/14 | | | | — | | | | (410,925 | ) |
Japanese Yen | | | JPHQ | | | | Sell | | | | 1,666,680,000 | | | | 17,356,983 | | | | 6/11/14 | | | | 1,513,799 | | | | — | |
Mexican Peso | | | CITI | | | | Buy | | | | 159,085,880 | | | | 12,019,635 | | | | 6/12/14 | | | | 36,453 | | | | — | |
Polish Zloty | | | DBAB | | | | Buy | | | | 30,704,000 | | | | 7,052,392 | EUR | | | 6/12/14 | | | | 365,071 | | | | — | |
Swedish Krona | | | MSCO | | | | Buy | | | | 42,305,800 | | | | 4,810,926 | EUR | | | 6/12/14 | | | | — | | | | (59,504 | ) |
Mexican Peso | | | CITI | | | | Buy | | | | 99,058,800 | | | | 7,396,698 | | | | 6/13/14 | | | | 109,740 | | | | — | |
Swedish Krona | | | BZWS | | | | Buy | | | | 24,372,000 | | | | 2,756,016 | EUR | | | 6/13/14 | | | | — | | | | (13,004 | ) |
Swedish Krona | | | MSCO | | | | Buy | | | | 28,654,000 | | | | 3,185,687 | EUR | | | 6/13/14 | | | | 65,080 | | | | (5,339 | ) |
Euro | | | DBAB | | | | Sell | | | | 8,383,000 | | | | 11,130,528 | | | | 6/13/14 | | | | — | | | | (401,143 | ) |
Swedish Krona | | | MSCO | | | | Buy | | | | 21,328,100 | | | | 2,430,774 | EUR | | | 6/16/14 | | | | — | | | | (37,648 | ) |
Japanese Yen | | | CITI | | | | Sell | | | | 310,702,000 | | | | 3,270,547 | | | | 6/16/14 | | | | 316,964 | | | | — | |
Japanese Yen | | | JPHQ | | | | Sell | | | | 702,800,000 | | | | 7,438,218 | | | | 6/17/14 | | | | 757,241 | | | | — | |
Malaysian Ringgit | | | HSBC | | | | Buy | | | | 36,880,000 | | | | 11,242,874 | | | | 6/20/14 | | | | — | | | | (90,267 | ) |
Mexican Peso | | | CITI | | | | Buy | | | | 61,535,000 | | | | 4,622,938 | | | | 6/20/14 | | | | 37,490 | | | | — | |
Singapore Dollar | | | HSBC | | | | Buy | | | | 6,864,000 | | | | 5,451,946 | | | | 6/20/14 | | | | — | | | | (10,917 | ) |
Euro | | | BZWS | | | | Sell | | | | 1,124,367 | | | | 1,509,688 | | | | 6/20/14 | | | | — | | | | (37,008 | ) |
TGB-22
Franklin Templeton Variable Insurance Products Trust
Statement of Investments, December 31, 2013 (continued)
| | | | |
| Templeton Global Bond Securities Fund | | | | |
Forward Exchange Contracts (continued)
| | | | | | | | | | | | | | | | | | | | | | | | | | | | |
| Currency | | Counterpartya | | | Type | | | Quantity | | | Contract
Amount* | | | Settlement
Date | | | Unrealized
Appreciation | | | Unrealized
Depreciation | |
Japanese Yen | | | DBAB | | | | Sell | | | | 1,455,820,000 | | | | 14,169,116 | | | | 6/20/14 | | | $ | 329,474 | | | $ | — | |
Singapore Dollar | | | DBAB | | | | Buy | | | | 8,589,700 | | | | 6,844,928 | | | | 6/23/14 | | | | — | | | | (35,905 | ) |
Philippine Peso | | | JPHQ | | | | Buy | | | | 392,700,000 | | | | 8,866,561 | | | | 6/25/14 | | | | — | | | | (8,445 | ) |
South Korean Won | | | DBAB | | | | Buy | | | | 21,440,000,000 | | | | 18,351,451 | | | | 6/27/14 | | | | 1,761,549 | | | | — | |
Swedish Krona | | | UBSW | | | | Buy | | | | 302,991,000 | | | | 34,200,332 | EUR | | | 6/30/14 | | | | — | | | | (90,475 | ) |
Mexican Peso | | | CITI | | | | Buy | | | | 105,786,172 | | | | 7,970,207 | | | | 7/10/14 | | | | 29,333 | | | | — | |
Malaysian Ringgit | | | DBAB | | | | Buy | | | | 18,006,622 | | | | 5,550,404 | | | | 7/14/14 | | | | — | | | | (111,679 | ) |
Malaysian Ringgit | | | DBAB | | | | Buy | | | | 13,610,000 | | | | 4,232,360 | | | | 7/15/14 | | | | — | | | | (121,792 | ) |
Euro | | | BZWS | | | | Sell | | | | 2,243,000 | | | | 2,932,498 | | | | 7/16/14 | | | | — | | | | (153,176 | ) |
Euro | | | MSCO | | | | Sell | | | | 9,679,000 | | | | 12,627,320 | | | | 7/16/14 | | | | — | | | | (687,991 | ) |
Euro | | | UBSW | | | | Sell | | | | 17,930,000 | | | | 23,415,056 | | | | 7/16/14 | | | | — | | | | (1,251,081 | ) |
Malaysian Ringgit | | | DBAB | | | | Buy | | | | 2,637,000 | | | | 815,651 | | | | 7/18/14 | | | | — | | | | (19,326 | ) |
Malaysian Ringgit | | | DBAB | | | | Buy | | | | 11,455,000 | | | | 2,704,841 | EUR | | | 7/18/14 | | | | — | | | | (261,846 | ) |
Euro | | | BZWS | | | | Sell | | | | 3,518,000 | | | | 4,627,050 | | | | 7/18/14 | | | | — | | | | (212,656 | ) |
Malaysian Ringgit | | | DBAB | | | | Buy | | | | 4,160,000 | | | | 1,280,867 | | | | 7/22/14 | | | | — | | | | (24,868 | ) |
Malaysian Ringgit | | | DBAB | | | | Buy | | | | 12,933,000 | | | | 3,029,870 | EUR | | | 7/22/14 | | | | — | | | | (263,462 | ) |
Euro | | | DBAB | | | | Sell | | | | 1,935,000 | | | | 2,538,372 | | | | 7/22/14 | | | | — | | | | (123,631 | ) |
Euro | | | MSCO | | | | Sell | | | | 12,182,000 | | | | 15,957,689 | | | | 7/22/14 | | | | — | | | | (801,236 | ) |
Euro | | | DBAB | | | | Sell | | | | 1,759,000 | | | | 2,311,361 | | | | 7/23/14 | | | | — | | | | (108,523 | ) |
Japanese Yen | | | CITI | | | | Sell | | | | 913,412,000 | | | | 9,181,286 | | | | 7/24/14 | | | | 495,395 | | | | — | |
Japanese Yen | | | JPHQ | | | | Sell | | | | 1,407,000,000 | | | | 14,122,252 | | | | 7/24/14 | | | | 742,695 | | | | — | |
Malaysian Ringgit | | | DBAB | | | | Buy | | | | 5,058,000 | | | | 1,570,466 | | | | 7/25/14 | | | | — | | | | (43,564 | ) |
Malaysian Ringgit | | | DBAB | | | | Buy | | | | 16,628,000 | | | | 3,903,470 | EUR | | | 7/25/14 | | | | — | | | | (350,453 | ) |
Euro | | | DBAB | | | | Sell | | | | 4,715,000 | | | | 6,236,219 | | | | 7/25/14 | | | | — | | | | (250,314 | ) |
Euro | | | GSCO | | | | Sell | | | | 4,711,000 | | | | 6,236,704 | | | | 7/25/14 | | | | — | | | | (244,326 | ) |
Japanese Yen | | | JPHQ | | | | Sell | | | | 490,100,000 | | | | 4,944,262 | | | | 7/25/14 | | | | 283,720 | | | | — | |
Euro | | | CITI | | | | Sell | | | | 1,935,410 | | | | 2,563,112 | | | | 7/28/14 | | | | — | | | | (99,496 | ) |
Japanese Yen | | | BZWS | | | | Sell | | | | 1,079,470,000 | | | | 10,875,395 | | | | 7/29/14 | | | | 609,923 | | | | — | |
Malaysian Ringgit | | | JPHQ | | | | Buy | | | | 5,318,000 | | | | 1,632,139 | | | | 7/30/14 | | | | — | | | | (27,139 | ) |
Malaysian Ringgit | | | JPHQ | | | | Buy | | | | 16,628,000 | | | | 3,857,826 | EUR | | | 7/30/14 | | | | — | | | | (288,949 | ) |
Chilean Peso | | | MSCO | | | | Buy | | | | 1,963,430,000 | | | | 3,690,311 | | | | 7/31/14 | | | | — | | | | (36,916 | ) |
Malaysian Ringgit | | | HSBC | | | | Buy | | | | 3,005,000 | | | | 916,354 | | | | 7/31/14 | | | | — | | | | (9,473 | ) |
Euro | | | JPHQ | | | | Sell | | | | 11,263,000 | | | | 14,973,201 | | | | 7/31/14 | | | | — | | | | (521,804 | ) |
Euro | | | GSCO | | | | Sell | | | | 11,263,000 | | | | 14,951,745 | | | | 8/01/14 | | | | — | | | | (543,300 | ) |
Euro | | | BZWS | | | | Sell | | | | 282,898 | | | | 375,646 | | | | 8/04/14 | | | | — | | | | (13,553 | ) |
Euro | | | HSBC | | | | Sell | | | | 11,263,000 | | | | 14,928,318 | | | | 8/04/14 | | | | — | | | | (566,847 | ) |
Euro | | | BZWS | | | | Sell | | | | 7,003,000 | | | | 9,287,659 | | | | 8/05/14 | | | | — | | | | (346,801 | ) |
Malaysian Ringgit | | | JPHQ | | | | Buy | | | | 1,100,000 | | | | 331,655 | | | | 8/06/14 | | | | 218 | | | | — | |
Euro | | | JPHQ | | | | Sell | | | | 5,724,900 | | | | 7,572,342 | | | | 8/06/14 | | | | — | | | | (303,777 | ) |
Euro | | | CITI | | | | Sell | | | | 1,210,637 | | | | 1,611,721 | | | | 8/08/14 | | | | — | | | | (53,840 | ) |
Euro | | | CITI | | | | Sell | | | | 351,512 | | | | 468,384 | | | | 8/11/14 | | | | — | | | | (15,220 | ) |
Euro | | | DBAB | | | | Sell | | | | 4,845,000 | | | | 6,460,081 | | | | 8/11/14 | | | | — | | | | (205,588 | ) |
Euro | | | JPHQ | | | | Sell | | | | 6,343,900 | | | | 8,447,664 | | | | 8/11/14 | | | | — | | | | (280,166 | ) |
Malaysian Ringgit | | | HSBC | | | | Buy | | | | 6,100,000 | | | | 1,853,146 | | | | 8/12/14 | | | | — | | | | (13,296 | ) |
Singapore Dollar | | | DBAB | | | | Buy | | | | 12,363,000 | | | | 9,768,489 | | | | 8/12/14 | | | | 32,888 | | | | — | |
South Korean Won | | | HSBC | | | | Buy | | | | 11,980,000,000 | | | | 1,018,568,902 | JPY | | | 8/12/14 | | | | 1,532,531 | | | | — | |
Euro | | | GSCO | | | | Sell | | | | 30,376,000 | | | | 40,668,604 | | | | 8/12/14 | | | | — | | | | (1,122,292 | ) |
Euro | | | MSCO | | | | Sell | | | | 1,962,500 | | | | 2,604,218 | | | | 8/15/14 | | | | — | | | | (95,784 | ) |
Singapore Dollar | | | BZWS | | | | Buy | | | | 4,886,000 | | | | 3,847,244 | | | | 8/18/14 | | | | 26,435 | | | | — | |
Polish Zloty | | | DBAB | | | | Buy | | | | 59,155,000 | | | | 13,693,287 | EUR | | | 8/19/14 | | | | 474,018 | | | | — | �� |
Singapore Dollar | | | DBAB | | | | Buy | | | | 3,667,000 | | | | 2,892,412 | | | | 8/19/14 | | | | 14,837 | | | | — | |
TGB-23
Franklin Templeton Variable Insurance Products Trust
Statement of Investments, December 31, 2013 (continued)
| | | | |
| Templeton Global Bond Securities Fund | | | | |
Forward Exchange Contracts (continued)
| | | | | | | | | | | | | | | | | | | | | | | | | | | | |
| Currency | | Counterpartya | | | Type | | | Quantity | | | Contract
Amount* | | | Settlement
Date | | | Unrealized
Appreciation | | | Unrealized
Depreciation | |
Singapore Dollar | | | HSBC | | | | Buy | | | | 3,667,000 | | | | 2,892,868 | | | | 8/19/14 | | | $ | 14,380 | | | $ | — | |
Euro | | | BZWS | | | | Sell | | | | 7,066,000 | | | | 9,363,510 | | | | 8/19/14 | | | | — | | | | (357,974 | ) |
Japanese Yen | | | DBAB | | | | Sell | | | | 838,612,000 | | | | 8,543,578 | | | | 8/19/14 | | | | 567,004 | | | | — | |
Chilean Peso | | | MSCO | | | | Buy | | | | 981,300,000 | | | | 1,843,960 | | | | 8/20/14 | | | | — | | | | (21,745 | ) |
Euro | | | DBAB | | | | Sell | | | | 3,964,000 | | | | 5,294,081 | | | | 8/20/14 | | | | — | | | | (159,650 | ) |
Japanese Yen | | | HSBC | | | | Sell | | | | 1,621,372,000 | | | | 16,715,175 | | | | 8/20/14 | | | | 1,293,124 | | | | — | |
Japanese Yen | | | JPHQ | | | | Sell | | | | 1,135,828,000 | | | | 11,683,964 | | | | 8/20/14 | | | | 880,276 | | | | — | |
Euro | | | JPHQ | | | | Sell | | | | 7,851,000 | | | | 10,489,250 | | | | 8/20/14 | | | | — | | | | (312,274 | ) |
Japanese Yen | | | BZWS | | | | Sell | | | | 376,247,000 | | | | 3,880,435 | | | | 8/22/14 | | | | 301,607 | | | | — | |
Euro | | | BZWS | | | | Sell | | | | 2,680,925 | | | | 3,594,021 | | | | 8/25/14 | | | | — | | | | (94,483 | ) |
Japanese Yen | | | CITI | | | | Sell | | | | 751,731,000 | | | | 7,738,515 | | | | 8/25/14 | | | | 587,913 | | | | — | |
Japanese Yen | | | DBAB | | | | Sell | | | | 371,821,000 | | | | 3,825,870 | | | | 8/25/14 | | | | 289,041 | | | | — | |
Japanese Yen | | | HSBC | | | | Sell | | | | 746,218,000 | | | | 7,662,084 | | | | 8/25/14 | | | | 563,922 | | | | — | |
Malaysian Ringgit | | | HSBC | | | | Buy | | | | 1,223,000 | | | | 363,124 | | | | 8/26/14 | | | | 5,500 | | | | — | |
Swedish Krona | | | UBSW | | | | Buy | | | | 30,000,000 | | | | 3,417,246 | EUR | | | 8/26/14 | | | | — | | | | (56,907 | ) |
Japanese Yen | | | BZWS | | | | Sell | | | | 1,085,075,000 | | | | 11,038,403 | | | | 8/26/14 | | | | 716,873 | | | | — | |
Japanese Yen | | | JPHQ | | | | Sell | | | | 750,133,000 | | | | 7,630,942 | | | | 8/26/14 | | | | 495,471 | | | | — | |
Malaysian Ringgit | | | JPHQ | | | | Buy | | | | 8,340,000 | | | | 2,483,399 | | | | 8/27/14 | | | | 30,235 | | | | — | |
Singapore Dollar | | | DBAB | | | | Buy | | | | 7,749,500 | | | | 6,062,348 | | | | 8/27/14 | | | | 81,693 | | | | — | |
Euro | | | CITI | | | | Sell | | | | 6,136,805 | | | | 8,203,374 | | | | 8/27/14 | | | | — | | | | (239,887 | ) |
Japanese Yen | | | DBAB | | | | Sell | | | | 685,950,000 | | | | 6,949,848 | | | | 8/27/14 | | | | 424,842 | | | | — | |
Japanese Yen | | | HSBC | | | | Sell | | | | 1,247,125,000 | | | | 12,637,176 | | | | 8/27/14 | | | | 774,069 | | | | — | |
Euro | | | HSBC | | | | Sell | | | | 18,537,726 | | | | 24,780,677 | | | | 8/27/14 | | | | — | | | | (724,268 | ) |
Japanese Yen | | | JPHQ | | | | Sell | | | | 751,903,000 | | | | 7,628,692 | | | | 8/27/14 | | | | 476,317 | | | | — | |
Euro | | | JPHQ | | | | Sell | | | | 14,996,625 | | | | 20,054,025 | | | | 8/27/14 | | | | — | | | | (578,930 | ) |
Euro | | | DBAB | | | | Sell | | | | 1,058,312 | | | | 1,413,270 | | | | 8/29/14 | | | | — | | | | (42,806 | ) |
Japanese Yen | | | JPHQ | | | | Sell | | | | 372,662,000 | | | | 3,835,372 | | | | 8/29/14 | | | | 290,408 | | | | — | |
Euro | | | DBAB | | | | Sell | | | | 1,732,000 | | | | 2,293,688 | | | | 9/03/14 | | | | — | | | | (89,310 | ) |
Euro | | | DBAB | | | | Sell | | | | 8,105,300 | | | | 10,696,483 | | | | 9/05/14 | | | | — | | | | (455,371 | ) |
Japanese Yen | | | BZWS | | | | Sell | | | | 285,057,504 | | | | 2,895,749 | | | | 9/18/14 | | | | 183,609 | | | | — | |
Euro | | | BZWS | | | | Sell | | | | 678,250 | | | | 906,142 | | | | 9/19/14 | | | | — | | | | (27,077 | ) |
Hungarian Forint | | | JPHQ | | | | Buy | | | | 1,156,013,000 | | | | 3,813,337 | EUR | | | 9/23/14 | | | | 27,163 | | | | — | |
Euro | | | DBAB | | | | Sell | | | | 8,070,000 | | | | 10,949,537 | | | | 9/23/14 | | | | — | | | | (154,264 | ) |
Euro | | | BZWS | | | | Sell | | | | 1,647,381 | | | | 2,230,159 | | | | 9/24/14 | | | | — | | | | (36,538 | ) |
Hungarian Forint | | | JPHQ | | | | Buy | | | | 925,405,000 | | | | 3,021,829 | EUR | | | 9/25/14 | | | | 63,697 | | | | — | |
Malaysian Ringgit | | | DBAB | | | | Buy | | | | 11,080,500 | | | | 3,390,087 | | | | 9/26/14 | | | | — | | | | (55,338 | ) |
Malaysian Ringgit | | | HSBC | | | | Buy | | | | 11,490,000 | | | | 3,513,224 | | | | 9/26/14 | | | | — | | | | (55,234 | ) |
South Korean Won | | | HSBC | | | | Buy | | | | 9,530,000,000 | | | | 8,719,122 | | | | 9/26/14 | | | | 192,355 | | | | — | |
Euro | | | DBAB | | | | Sell | | | | 3,753,000 | | | | 5,064,392 | | | | 9/26/14 | | | | — | | | | (99,535 | ) |
Euro | | | BZWS | | | | Sell | | | | 6,085,000 | | | | 8,220,531 | | | | 9/29/14 | | | | — | | | | (152,182 | ) |
Japanese Yen | | | JPHQ | | | | Sell | | | | 285,510,329 | | | | 2,905,810 | | | | 9/29/14 | | | | 189,062 | | | | — | |
Chilean Peso | | | DBAB | | | | Buy | | | | 1,252,750,000 | | | | 2,393,028 | | | | 9/30/14 | | | | — | | | | (76,402 | ) |
Euro | | | DBAB | | | | Sell | | | | 14,880,000 | | | | 20,093,506 | | | | 9/30/14 | | | | — | | | | (380,838 | ) |
Euro | | | GSCO | | | | Sell | | | | 4,020,000 | | | | 5,424,226 | | | | 9/30/14 | | | | — | | | | (107,149 | ) |
Euro | | | HSBC | | | | Sell | | | | 5,430,000 | | | | 7,340,763 | | | | 9/30/14 | | | | — | | | | (130,722 | ) |
Japanese Yen | | | JPHQ | | | | Sell | | | | 172,207,000 | | | | 1,746,477 | | | | 9/30/14 | | | | 107,837 | | | | — | |
Swedish Krona | | | DBAB | | | | Buy | | | | 445,104,500 | | | | 69,296,379 | | | | 10/03/14 | | | | — | | | | (431,145 | ) |
Mexican Peso | | | HSBC | | | | Buy | | | | 377,048,070 | | | | 27,679,754 | | | | 10/07/14 | | | | 638,852 | | | | — | |
Euro | | | JPHQ | | | | Sell | | | | 6,370,000 | | | | 8,687,183 | | | | 10/07/14 | | | | — | | | | (77,915 | ) |
Euro | | | DBAB | | | | Sell | | | | 12,680,000 | | | | 17,224,258 | | | | 10/09/14 | | | | — | | | | (223,497 | ) |
Mexican Peso | | | DBAB | | | | Buy | | | | 259,112,000 | | | | 19,136,780 | | | | 10/14/14 | | | | 312,605 | | | | — | |
Chilean Peso | | | CITI | | | | Buy | | | | 921,291,798 | | | | 1,770,693 | | | | 10/20/14 | | | | — | | | | (70,470 | ) |
TGB-24
Franklin Templeton Variable Insurance Products Trust
Statement of Investments, December 31, 2013 (continued)
| | | | |
| Templeton Global Bond Securities Fund | | | | |
Forward Exchange Contracts (continued)
| | | | | | | | | | | | | | | | | | | | | | | | | | | | |
| Currency | | Counterpartya | | | Type | | | Quantity | | | Contract
Amount* | | | Settlement
Date | | | Unrealized
Appreciation | | | Unrealized
Depreciation | |
Malaysian Ringgit | | | JPHQ | | | | Buy | | | | 8,104,000 | | | | 2,505,023 | | | | 10/20/14 | | | $ | — | | | $ | (70,029 | ) |
Euro | | | HSBC | | | | Sell | | | | 12,569,000 | | | | 17,069,079 | | | | 10/20/14 | | | | — | | | | (226,585 | ) |
Japanese Yen | | | JPHQ | | | | Sell | | | | 1,233,160,000 | | | | 12,562,755 | | | | 10/20/14 | | | | 825,740 | | | | — | |
Malaysian Ringgit | | | HSBC | | | | Buy | | | | 14,613,000 | | | | 4,556,311 | | | | 10/22/14 | | | | — | | | | (166,169 | ) |
Japanese Yen | | | BZWS | | | | Sell | | | | 735,200,000 | | | | 7,538,966 | | | | 10/22/14 | | | | 541,283 | | | | — | |
Chilean Peso | | | CITI | | | | Buy | | | | 2,420,966,000 | | | | 4,646,768 | | | | 10/24/14 | | | | — | | | | (180,741 | ) |
Malaysian Ringgit | | | DBAB | | | | Buy | | | | 10,811,000 | | | | 3,356,932 | | | | 10/24/14 | | | | — | | | | (109,459 | ) |
Malaysian Ringgit | | | HSBC | | | | Buy | | | | 7,209,825 | | | | 2,226,629 | | | | 10/24/14 | | | | — | | | | (60,899 | ) |
Chilean Peso | | | BZWS | | | | Buy | | | | 199,342,000 | | | | 381,370 | | | | 10/27/14 | | | | — | | | | (13,750 | ) |
Euro | | | BZWS | | | | Sell | | | | 649,907 | | | | 894,805 | | | | 10/27/14 | | | | 474 | | | | — | |
Chilean Peso | | | DBAB | | | | Buy | | | | 398,486,000 | | | | 758,732 | | | | 10/29/14 | | | | — | | | | (24,006 | ) |
Malaysian Ringgit | | | JPHQ | | | | Buy | | | | 7,468,000 | | | | 2,335,210 | | | | 10/31/14 | | | | — | | | | (93,001 | ) |
Euro | | | DBAB | | | | Sell | | | | 3,319,244 | | | | 4,583,909 | | | | 10/31/14 | | | | 16,269 | | | | — | |
Euro | | | DBAB | | | | Sell | | | | 224,556 | | | | 309,000 | | | | 11/03/14 | | | | — | | | | (16 | ) |
Euro | | | BZWS | | | | Sell | | | | 1,581,109 | | | | 2,138,292 | | | | 11/05/14 | | | | — | | | | (37,523 | ) |
Japanese Yen | | | CITI | | | | Sell | | | | 341,992,119 | | | | 3,478,711 | | | | 11/10/14 | | | | 222,856 | | | | — | |
Japanese Yen | | | HSBC | | | | Sell | | | | 413,563,000 | | | | 4,194,351 | | | | 11/12/14 | | | | 257,026 | | | | — | |
Euro | | | JPHQ | | | | Sell | | | | 8,969,211 | | | | 11,959,905 | | | | 11/12/14 | | | | — | | | | (383,206 | ) |
Japanese Yen | | | JPHQ | | | | Sell | | | | 335,950,000 | | | | 3,397,209 | | | | 11/13/14 | | | | 198,760 | | | | — | |
Japanese Yen | | | MSCO | | | | Sell | | | | 300,000,000 | | | | 3,019,202 | | | | 11/14/14 | | | | 162,984 | | | | — | |
Japanese Yen | | | CITI | | | | Sell | | | | 429,663,000 | | | | 4,339,154 | | | | 11/17/14 | | | | 248,301 | | | | — | |
Euro | | | DBAB | | | | Sell | | | | 10,778,730 | | | | 14,488,984 | | | | 11/17/14 | | | | — | | | | (344,573 | ) |
Euro | | | MSCO | | | | Sell | | | | 1,962,500 | | | | 2,641,103 | | | | 11/17/14 | | | | — | | | | (59,666 | ) |
Japanese Yen | | | SCNY | | | | Sell | | | | 340,600,700 | | | | 3,436,315 | | | | 11/17/14 | | | | 193,431 | | | | — | |
Malaysian Ringgit | | | DBAB | | | | Buy | | | | 7,197,960 | | | | 2,208,844 | | | | 11/19/14 | | | | — | | | | (50,517 | ) |
Japanese Yen | | | CITI | | | | Sell | | | | 986,239,000 | | | | 9,872,460 | | | | 11/19/14 | | | | 482,177 | | | | — | |
Japanese Yen | | | DBAB | | | | Sell | | | | 796,770,000 | | | | 7,970,888 | | | | 11/19/14 | | | | 384,598 | | | | — | |
Euro | | | DBAB | | | | Sell | | | | 3,953,398 | | | | 5,324,831 | | | | 11/19/14 | | | | — | | | | (115,824 | ) |
Malaysian Ringgit | | | HSBC | | | | Buy | | | | 4,326,000 | | | | 1,328,624 | | | | 11/20/14 | | | | — | | | | (31,550 | ) |
Japanese Yen | | | CITI | | | | Sell | | | | 1,107,834,000 | | | | 11,116,135 | | | | 11/20/14 | | | | 567,981 | | | | — | |
Euro | | | DBAB | | | | Sell | | | | 3,887,000 | | | | 5,260,471 | | | | 11/20/14 | | | | — | | | | (88,825 | ) |
Japanese Yen | | | HSBC | | | | Sell | | | | 207,909,000 | | | | 2,085,116 | | | | 11/20/14 | | | | 105,527 | | | | — | |
Japanese Yen | | | JPHQ | | | | Sell | | | | 715,709,000 | | | | 7,176,440 | | | | 11/20/14 | | | | 361,873 | | | | — | |
Euro | | | JPHQ | | | | Sell | | | | 15,309,581 | | | | 20,722,858 | | | | 11/20/14 | | | | — | | | | (346,216 | ) |
Euro | | | DBAB | | | | Sell | | | | 837,570 | | | | 1,134,907 | | | | 11/28/14 | | | | — | | | | (17,789 | ) |
Euro | | | DBAB | | | | Sell | | | | 5,440,000 | | | | 7,369,350 | | | | 12/04/14 | | | | — | | | | (117,543 | ) |
Euro | | | HSBC | | | | Sell | | | | 2,155,292 | | | | 2,941,973 | | | | 12/09/14 | | | | — | | | | (24,334 | ) |
Euro | | | SCNY | | | | Sell | | | | 2,400,751 | | | | 3,279,738 | | | | 12/09/14 | | | | — | | | | (24,393 | ) |
Euro | | | JPHQ | | | | Sell | | | | 5,095,000 | | | | 7,027,712 | | | | 12/15/14 | | | | 15,369 | | | | — | |
Mexican Peso | | | CITI | | | | Buy | | | | 95,083,400 | | | | 7,164,750 | | | | 12/16/14 | | | | — | | | | (65,397 | ) |
Malaysian Ringgit | | | JPHQ | | | | Buy | | | | 13,361,013 | | | | 4,058,384 | | | | 12/17/14 | | | | — | | | | (59,696 | ) |
Mexican Peso | | | CITI | | | | Buy | | | | 45,585,080 | | | | 3,424,103 | | | | 12/18/14 | | | | — | | | | (21,087 | ) |
Malaysian Ringgit | | | JPHQ | | | | Buy | | | | 14,772,000 | | | | 4,472,704 | | | | 12/19/14 | | | | — | | | | (52,338 | ) |
Japanese Yen | | | DBAB | | | | Sell | | | | 1,453,310,000 | | | | 14,169,165 | | | | 12/22/14 | | | | 326,205 | | | | — | |
Japanese Yen | | | HSBC | | | | Sell | | | | 1,455,540,000 | | | | 14,169,149 | | | | 12/22/14 | | | | 304,948 | | | | — | |
Japanese Yen | | | BZWS | | | | Sell | | | | 696,650,000 | | | | 6,718,260 | | | | 12/26/14 | | | | 82,259 | | | | — | |
Japanese Yen | | | CITI | | | | Sell | | | | 1,086,780,000 | | | | 10,480,503 | | | | 12/26/14 | | | | 128,284 | | | | — | |
| | | | | | | | | | | | | | | | | | | | | | | | |
Unrealized appreciation (depreciation) | | | | | | | | | | | | 74,197,203 | | | | (52,426,649 | ) |
| | | | | | | | | | | | | | | | | | | | | | | | |
Net unrealized appreciation (depreciation) | | | | | | | | | | | $ | 21,770,554 | | | | | |
| | | | | | | | | | | | | | | | | | | | | | | | | | | | |
aMay be comprised of multiple contracts using the same currency and settlement date.
*In U.S. dollars unless otherwise indicated.
TGB-25
Franklin Templeton Variable Insurance Products Trust
Statement of Investments, December 31, 2013 (continued)
| | | | |
| Templeton Global Bond Securities Fund | | | | |
At December 31, 2013, the Fund had the following interest rate swap contracts outstanding. See Note 1(d).
| | | | | | | | | | | | | | | | | | | | |
| Description | | Counterparty/
Exchange | | | Expiration
Date | | | Notional
Amount | | | Unrealized
Appreciation | | | Unrealized
Depreciation | |
Centrally Cleared Swaps | | | | | | | | | | | | | | | | | | | | |
Receive Floating rate 3-month USD BBA LIBOR Pay Fixed rate 2.775% | | | DBAB | | | | 10/4/23 | | | $ | 13,090,000 | | | $ | 227,372 | | | $ | — | |
Receive Floating rate 3-month USD BBA LIBOR Pay Fixed rate 2.795% | | | DBAB | | | | 10/4/23 | | | | 13,090,000 | | | | 203,607 | | | | — | |
Receive Floating rate 3-month USD BBA LIBOR Pay Fixed rate 2.765% | | | HSBC | | | | 10/7/23 | | | | 13,090,000 | | | | 245,363 | | | | — | |
Receive Floating rate 3-month USD BBA LIBOR Pay Fixed rate 3.668% | | | DBAB | | | | 10/4/43 | | | | 6,370,000 | | | | 241,141 | | | | — | |
Receive Floating rate 3-month USD BBA LIBOR Pay Fixed rate 3.687% | | | DBAB | | | | 10/4/43 | | | | 6,370,000 | | | | 218,732 | | | | — | |
Receive Floating rate 3-month USD BBA LIBOR Pay Fixed rate 3.675% | | | HSBC | | | | 10/7/43 | | | | 6,370,000 | | | | 234,539 | | | | — | |
| | | | | | | | | | | | | | | | |
Centrally Cleared Swaps unrealized appreciation (depreciation) | | | | 1,370,754 | | | | — | |
| | | | | | | | | | | | | | | | |
OTC Swaps | | | | | | | | | | | | | | | | | | | | |
Receive Floating rate 3-month USD BBA LIBOR Pay Fixed rate 3.558% | | | JPHQ | | | | 3/4/21 | | | $ | 3,240,000 | | | $ | — | | | $ | (266,148 | ) |
Receive Floating rate 3-month USD BBA LIBOR Pay Fixed rate 3.523% | | | DBAB | | | | 3/28/21 | | | | 14,630,000 | | | | — | | | | (1,124,007 | ) |
Receive Floating rate 3-month USD BBA LIBOR Pay Fixed rate 4.347% | | | CITI | | | | 2/25/41 | | | | 7,460,000 | | | | — | | | | (713,354 | ) |
Receive Floating rate 3-month USD BBA LIBOR Pay Fixed rate 4.349% | | | JPHQ | | | | 2/25/41 | | | | 7,460,000 | | | | — | | | | (716,953 | ) |
Receive Floating rate 3-month USD BBA LIBOR Pay Fixed rate 4.320% | | | JPHQ | | | | 2/28/41 | | | | 5,600,000 | | | | — | | | | (516,449 | ) |
Receive Floating rate 3-month USD BBA LIBOR Pay Fixed rate 4.299% | | | JPHQ | | | | 3/1/41 | | | | 1,870,000 | | | | — | | | | (161,314 | ) |
| | | | | | | | | | | | | | | | |
OTC Swaps unrealized appreciation (depreciation) | | | | | | | | | | | | | | | — | | | | (3,498,225 | ) |
| | | | | | | | | | | | | | | | |
Total Interest Rate Swaps unrealized appreciation (depreciation) | | | | 1,370,754 | | | | (3,498,225 | ) |
| | | | | | | | | | | | | | | | |
Net unrealized appreciation (depreciation) | | | $ | (2,127,471 | ) |
| | | | | | | | | | | | | | | | | | | | |
The accompanying notes are an integral part of these financial statements.
TGB-26
Franklin Templeton Variable Insurance Products Trust
Financial Statements
Statement of Assets and Liabilities
December 31, 2013
| | | | |
| | | Templeton
Global Bond
Securities Fund | |
Assets: | | | | |
Investments in securities: | | | | |
Cost - Unaffiliated issuers | | $ | 2,646,045,357 | |
Cost - Repurchase agreements | | | 362,770,388 | |
| | | | |
Total cost of investments | | $ | 3,008,815,745 | |
| | | | |
Value - Unaffiliated issuers | | $ | 2,737,095,585 | |
Value - Repurchase agreements | | | 362,770,388 | |
| | | | |
Total value of investments | | | 3,099,865,973 | |
Cash | | | 200,014,736 | |
Restricted Cash (Note 1e) | | | 1,130,000 | |
Foreign currency, at value (cost $55,664,573) | | | 55,784,724 | |
Receivables: | | | | |
Capital shares sold | | | 2,159,575 | |
Interest | | | 35,402,500 | |
Due from brokers | | | 15,102,968 | |
Variation margin | | | 235,528 | |
Unrealized appreciation on forward exchange contracts | | | 74,197,203 | |
Other assets | | | 72 | |
| | | | |
Total assets | | | 3,483,893,279 | |
| | | | |
Liabilities: | | | | |
Payables: | | | | |
Capital shares redeemed | | | 2,184,639 | |
Management fees | | | 1,316,004 | |
Distribution fees | | | 1,314,835 | |
Due to brokers | | | 1,130,000 | |
Unrealized depreciation on forward exchange contracts | | | 52,426,649 | |
Unrealized depreciation on OTC swap contracts | | | 3,498,225 | |
Deferred tax | | | 1,660,320 | |
Accrued expenses and other liabilities | | | 1,093,561 | |
| | | | |
Total liabilities | | | 64,624,233 | |
| | | | |
Net assets, at value | | $ | 3,419,269,046 | |
| | | | |
Net assets consist of: | | | | |
Paid-in capital | | $ | 3,209,576,714 | |
Undistributed net investment income | | | 104,975,944 | |
Net unrealized appreciation (depreciation) | | | 109,051,786 | |
Accumulated net realized gain (loss) | | | (4,335,398 | ) |
| | | | |
Net assets, at value | | $ | 3,419,269,046 | |
| | | | |
The accompanying notes are an integral part of these financial statements.
TGB-27
Franklin Templeton Variable Insurance Products Trust
Financial Statements (continued)
Statement of Assets and Liabilities (continued)
December 31, 2013
| | | | |
| | | Templeton
Global Bond
Securities Fund | |
Class 1: | | | | |
Net assets, at value | | $ | 280,962,552 | |
| | | | |
Shares outstanding | | | 14,668,077 | |
| | | | |
Net asset value and maximum offering price per share | | $ | 19.15 | |
| | | | |
Class 2: | | | | |
Net assets, at value | | $ | 2,826,039,424 | |
| | | | |
Shares outstanding | | | 151,940,953 | |
| | | | |
Net asset value and maximum offering price per share | | $ | 18.60 | |
| | | | |
Class 3: | | | | |
Net assets, at value | | $ | 194,121,714 | |
| | | | |
Shares outstanding | | | 10,427,807 | |
| | | | |
Net asset value and maximum offering price per sharea | | $ | 18.62 | |
| | | | |
Class 4: | | | | |
Net assets, at value | | $ | 118,145,356 | |
| | | | |
Shares outstanding | | | 6,229,133 | |
| | | | |
Net asset value and maximum offering price per share | | $ | 18.97 | |
| | | | |
aRedemption price is equal to net asset value less redemption fees retained by the Fund.
The accompanying notes are an integral part of these financial statements.
TGB-28
Franklin Templeton Variable Insurance Products Trust
Financial Statements (continued)
Statement of Operations
for the year ended December 31, 2013
| | | | |
| | | Templeton
Global Bond
Securities Fund | |
Investment income: | | | | |
Interest (net of foreign taxes of $3,046,677) | | $ | 125,459,123 | |
| | | | |
Expenses: | | | | |
Management fees (Note 3a) | | | 15,206,841 | |
Distribution fees: (Note 3c) | | | | |
Class 2 | | | 6,709,408 | |
Class 3 | | | 494,110 | |
Class 4 | | | 512,425 | |
Unaffiliated transfer agent fees | | | 1,833 | |
Custodian fees (Note 4) | | | 1,262,335 | |
Reports to shareholders | | | 460,112 | |
Professional fees | | | 104,376 | |
Trustees’ fees and expenses | | | 13,018 | |
Other | | | 49,965 | |
| | | | |
Total expenses | | | 24,814,423 | |
Expense reductions (Note 4) | | | (3,497 | ) |
| | | | |
Net expenses | | | 24,810,926 | |
| | | | |
Net investment income | | | 100,648,197 | |
| | | | |
Realized and unrealized gains (losses): | | | | |
Net realized gain (loss) from: | | | | |
Investments | | | (4,233,228 | ) |
Foreign currency transactions | | | 52,343,687 | |
Swap contracts | | | (996,665 | ) |
| | | | |
Net realized gain (loss) | | | 47,113,794 | |
| | | | |
Net change in unrealized appreciation (depreciation) on: | | | | |
Investments | | | (91,405,625 | ) |
Translation of other assets and liabilities denominated in foreign currencies | | | (10,160,429 | ) |
Change in deferred taxes on unrealized appreciation | | | 3,057,943 | |
| | | | |
Net change in unrealized appreciation (depreciation) | | | (98,508,111 | ) |
| | | | |
Net realized and unrealized gain (loss) | | | (51,394,317 | ) |
| | | | |
Net increase (decrease) in net assets resulting from operations | | $ | 49,253,880 | |
| | | | |
The accompanying notes are an integral part of these financial statements.
TGB-29
Franklin Templeton Variable Insurance Products Trust
Financial Statements (continued)
Statements of Changes in Net Assets
| | | | | | | | |
| | | Templeton Global Bond
Securities Fund | |
| | | Year Ended December 31, | |
| | | 2013 | | | 2012 | |
| | | | |
Increase (decrease) in net assets: | | | | | | | | |
Operations: | | | | | | | | |
Net investment income | | $ | 100,648,197 | | | $ | 95,705,827 | |
Net realized gain (loss) from investments, foreign currency transactions and swap contracts | | | 47,113,794 | | | | 113,860,368 | |
Net change in unrealized appreciation (depreciation) on investments, translation of other assets and liabilities denominated in foreign currencies and deferred taxes | | | (98,508,111 | ) | | | 173,490,240 | |
| | | | |
Net increase (decrease) in net assets resulting from operations | | | 49,253,880 | | | | 383,056,435 | |
| | | | |
Distributions to shareholders from: | | | | | | | | |
Net investment income and net foreign currency gains: | | | | | | | | |
Class 1 | | | (14,463,879 | ) | | | (18,014,760 | ) |
Class 2 | | | (128,696,606 | ) | | | (133,749,946 | ) |
Class 3 | | | (9,351,774 | ) | | | (12,114,860 | ) |
Class 4 | | | (7,129,387 | ) | | | (9,763,141 | ) |
Net realized gains: | | | | | | | | |
Class 1 | | | (3,587,066 | ) | | | (438,387 | ) |
Class 2 | | | (33,227,731 | ) | | | (3,357,784 | ) |
Class 3 | | | (2,438,218 | ) | | | (306,543 | ) |
Class 4 | | | (1,906,223 | ) | | | (251,144 | ) |
| | | | |
Total distributions to shareholders | | | (200,800,884 | ) | | | (177,996,565 | ) |
| | | | |
Capital share transactions: (Note 2) | | | | | | | | |
Class 1 | | | (13,273,114 | ) | | | 15,415,298 | |
Class 2 | | | 529,969,403 | | | | 448,524,053 | |
Class 3 | | | 4,794,164 | | | | (2,060,465 | ) |
Class 4 | | | (37,369,362 | ) | | | (394,730 | ) |
| | | | |
Total capital share transactions | | | 484,121,091 | | | | 461,484,156 | |
| | | | |
Redemption fees | | | 7,288 | | | | 6,086 | |
| | | | |
Net increase (decrease) in net assets | | | 332,581,375 | | | | 666,550,112 | |
Net assets: | | | | | | | | |
Beginning of year | | | 3,086,687,671 | | | | 2,420,137,559 | |
| | | | |
End of year | | $ | 3,419,269,046 | | | $ | 3,086,687,671 | |
| | | | |
Undistributed net investment income included in net assets: | | | | | | | | |
End of year | | $ | 104,975,944 | | | $ | 114,278,705 | |
| | | | |
The accompanying notes are an integral part of these financial statements.
TGB-30
Franklin Templeton Variable Insurance Products Trust
Notes to Financial Statements
Templeton Global Bond Securities Fund
1. ORGANIZATION AND SIGNIFICANT ACCOUNTING POLICIES
Franklin Templeton Variable Insurance Products Trust (Trust) is registered under the Investment Company Act of 1940, as amended, (1940 Act) as an open-end investment company, consisting of twenty separate funds. The Templeton Global Bond Securities Fund (Fund) is included in this report. The financial statements of the remaining funds in the Trust are presented separately. Shares of the Fund are generally sold only to insurance company separate accounts to fund the benefits of variable life insurance policies or variable annuity contracts. The Fund offers four classes of shares: Class 1, Class 2, Class 3, and Class 4. Each class of shares differs by its distribution fees, voting rights on matters affecting a single class and its exchange privilege.
The following summarizes the Fund’s significant accounting policies.
a. Financial Instrument Valuation
The Fund’s investments in financial instruments are carried at fair value daily. Fair value is the price that would be received to sell an asset or paid to transfer a liability in an orderly transaction between market participants on the measurement date. The Fund calculates the net asset value (NAV) per share at the close of the New York Stock Exchange (NYSE), generally at 4p.m. Eastern time (NYSE close) on each day the NYSE is open for trading. Under procedures approved by the Trust’s Board of Trustees (the Board), the Fund’s administrator, investment manager and other affiliates have formed the Valuation and Liquidity Oversight Committee (VLOC). The VLOC provides administration and oversight of the Fund’s valuation policies and procedures, which are approved annually by the Board. Among other things, these procedures allow the Fund to utilize independent pricing services, quotations from securities and financial instrument dealers, and other market sources to determine fair value.
Debt securities generally trade in the Over-the-counter (OTC) market rather than on a securities exchange. The Fund’s pricing services use multiple valuation techniques to determine fair value. In instances where sufficient market activity exists, the pricing services may utilize a market-based approach through which quotes from market makers are used to determine fair value. In instances where sufficient market activity may not exist or is limited, the pricing services also utilize proprietary valuation models which may consider market characteristics such as benchmark yield curves, credit spreads, estimated default rates, anticipated market interest rate volatility, coupon rates, anticipated timing of principal repayments, underlying collateral, and other unique security features in order to estimate the relevant cash flows, which are then discounted to calculate the fair value. Securities denominated in a foreign currency are converted into their U.S. dollar equivalent at the foreign exchange rate in effect at the NYSE close on the date that the values of the foreign debt securities are determined. Repurchase agreements are valued at cost, which approximates market value.
Derivative financial instruments (derivatives) listed on an exchange are valued at the official closing price of the day. Certain derivatives trade in the OTC market. The Fund’s pricing services use various techniques including industry standard option pricing models and proprietary discounted cash flow models to determine the fair value of those instruments. The Fund’s net benefit or obligation under the derivative contract, as measured by the fair value of the contract, is included in net assets.
The Fund has procedures to determine the fair value of financial instruments for which market prices are not reliable or readily available. Under these procedures, the VLOC convenes on a regular basis to review such financial instruments and considers a number of factors, including significant unobservable valuation inputs, when arriving at fair value. The VLOC primarily employs a market-based approach which may use related or comparable assets or liabilities, recent transactions, market multiples, book values, and other relevant information for the investment to determine the fair value of the investment. An income-based valuation approach may also be used in which the anticipated future cash flows of the investment are discounted to calculate fair value. Discounts may also be applied due to the nature or duration of any restrictions on the disposition of the investments. Due to the inherent uncertainty of valuations of such investments, the fair values may differ significantly from the values that would have been used had an active market existed. The VLOC employs various methods for calibrating these valuation approaches including a regular review of key inputs and assumptions, transactional back-testing or disposition analysis, and reviews of any related market activity.
TGB-31
Franklin Templeton Variable Insurance Products Trust
Notes to Financial Statements (continued)
Templeton Global Bond Securities Fund
1. ORGANIZATION AND SIGNIFICANT ACCOUNTING POLICIES (continued)
b. Foreign Currency Translation
Portfolio securities and other assets and liabilities denominated in foreign currencies are translated into U.S. dollars based on the exchange rate of such currencies against U.S. dollars on the date of valuation. The Fund may enter into foreign currency exchange contracts to facilitate transactions denominated in a foreign currency. Purchases and sales of securities, income and expense items denominated in foreign currencies are translated into U.S. dollars at the exchange rate in effect on the transaction date. Portfolio securities and assets and liabilities denominated in foreign currencies contain risks that those currencies will decline in value relative to the U.S. dollar. Occasionally, events may impact the availability or reliability of foreign exchange rates used to convert the U.S. dollar equivalent value. If such an event occurs, the foreign exchange rate will be valued at fair value using procedures established and approved by the Board.
The Fund does not separately report the effect of changes in foreign exchange rates from changes in market prices on securities held. Such changes are included in net realized and unrealized gain or loss from investments on the Statement of Operations.
Realized foreign exchange gains or losses arise from sales of foreign currencies, currency gains or losses realized between the trade and settlement dates on securities transactions and the difference between the recorded amounts of dividends, interest, and foreign withholding taxes and the U.S. dollar equivalent of the amounts actually received or paid. Net unrealized foreign exchange gains and losses arise from changes in foreign exchange rates on foreign denominated assets and liabilities other than investments in securities held at the end of the reporting period.
c. Joint Repurchase Agreement
The Fund enters into a joint repurchase agreement whereby its uninvested cash balance is deposited into a joint cash account with other funds managed by the investment manager or an affiliate of the investment manager and is used to invest in one or more repurchase agreements. The value and face amount of the joint repurchase agreement are allocated to the funds based on their pro-rata interest. A repurchase agreement is accounted for as a loan by the Fund to the seller, collateralized by securities which are delivered to the Fund’s custodian. The market value, including accrued interest, of the initial collateralization is required to be at least 102% of the dollar amount invested by the funds, with the value of the underlying securities marked to market daily to maintain coverage of at least 100%. Repurchase agreements are subject to the terms of Master Repurchase Agreements (MRAs) with approved counterparties (sellers). The MRAs contain various provisions, including but not limited to events of default and maintenance of collateral for repurchase agreements. In the event of default by either the seller or the Fund, certain MRAs may permit the non-defaulting party to net and close-out all transactions, if any, traded under such agreements. The Fund may sell securities it holds as collateral and apply the proceeds towards the repurchase price and any other amounts owed by the seller to the Fund in the event of default by the seller. This could involve costs or delays in addition to a loss on the securities if their value falls below the repurchase price owed by the seller. The joint repurchase agreement held by the Fund at year end, as indicated in the Statement of Investments, had been entered into on December 31, 2013.
d. Derivative Financial Instruments
The Fund invested in derivatives in order to manage risk or gain exposure to various other investments or markets. Derivatives are financial contracts based on an underlying or notional amount, require no initial investment or an initial net investment that is smaller than would normally be required to have a similar response to changes in market factors, and require or permit net settlement. Derivatives contain various risks including the potential inability of the counterparty to fulfill their obligations under the terms of the contract, the potential for an illiquid secondary market, and/or the potential for market movements which expose the Fund to gains or losses in excess of the amounts shown on the Statement of Assets and Liabilities. Realized gain and loss and unrealized appreciation and depreciation on these contracts for the period are included in the Statement of Operations.
TGB-32
Franklin Templeton Variable Insurance Products Trust
Notes to Financial Statements (continued)
Templeton Global Bond Securities Fund
1. ORGANIZATION AND SIGNIFICANT ACCOUNTING POLICIES (continued)
d. Derivative Financial Instruments (continued)
Derivative counterparty credit risk is managed through a formal evaluation of the creditworthiness of all potential counterparties. The Fund attempts to reduce its exposure to counterparty credit risk on OTC derivatives, whenever possible, by entering into International Swaps and Derivatives Association (ISDA) master agreements with certain counterparties. These agreements contain various provisions, including but not limited to collateral requirements, events of default, or early termination. Termination events applicable to the counterparty include certain deteriorations in the credit quality of the counterparty. Termination events applicable to the Fund include failure of the Fund to maintain certain net asset levels and/or limit the decline in net assets over various periods of time. In the event of default or early termination, the ISDA master agreement gives the non-defaulting party the right to net and close-out all transactions traded, whether or not arising under the ISDA agreement, to one net amount payable by one counterparty to the other. However, absent an event of default or early termination, OTC derivative assets and liabilities are presented gross and not offset in the Statement of Assets and Liabilities. Early termination by the counterparty may result in an immediate payment by the Fund of any net liability owed to that counterparty under the ISDA agreement.
Collateral requirements differ by type of derivative. Collateral or initial margin requirements are set by the broker or exchange clearing house for exchange traded and centrally cleared derivatives. Initial margin deposited is held at the exchange and can be in the form of cash and/or securities. For OTC derivatives traded under an ISDA master agreement, posting of collateral is required by either the fund or the applicable counterparty if the total net exposure of all OTC derivatives with the applicable counterparty exceeds the minimum transfer amount, which typically ranges from $100,000 to $250,000, and can vary depending on the counterparty and the type of the agreement. Generally, collateral is determined at the close of fund business each day and any additional collateral required due to changes in derivative values may be delivered by the fund or the counterparty within a few business days. Collateral pledged and/or received by the fund for OTC derivatives, if any, is held in segregated accounts with the fund’s custodian/counterparty broker and can be in the form of cash and/or securities. Unrestricted cash may be invested according to the Fund’s investment objectives.
The Fund entered into OTC forward exchange contracts primarily to manage and/or gain exposure to certain foreign currencies. A forward exchange contract is an agreement between the Fund and a counterparty to buy or sell a foreign currency at a specific exchange rate on a future date.
The Fund entered into interest rate swap contracts primarily to manage interest rate risk. An interest rate swap is an agreement between the Fund and a counterparty to exchange cash flows based on the difference between two interest rates, applied to a notional amount. These agreements may be privately negotiated in the over-the-counter market (“OTC interest rate swaps”) or may be executed on a registered exchange (“centrally cleared interest rate swaps”). For centrally cleared interest rate swaps, required initial margins are pledged by the Fund, and the daily change in fair value is accounted for as a variation margin payable or receivable on the Statement of Assets and Liabilities. Over the term of the contract, contractually required payments to be paid and to be received are accrued daily and recorded as unrealized depreciation and appreciation until the payments are made, at which time they are realized.
See Note 9 regarding other derivative information.
e. Restricted Cash
At December 31, 2013, the Fund received restricted cash in connection with investments in certain derivative securities. Restricted cash is held in a segregated account with the Fund’s counterparty broker and is reflected in the Statement of Assets and Liabilities.
TGB-33
Franklin Templeton Variable Insurance Products Trust
Notes to Financial Statements (continued)
Templeton Global Bond Securities Fund
1. ORGANIZATION AND SIGNIFICANT ACCOUNTING POLICIES (continued)
f. Income and Deferred Taxes
It is the Fund’s policy to qualify as a regulated investment company under the Internal Revenue Code. The Fund intends to distribute to shareholders substantially all of its taxable income and net realized gains to relieve it from federal income and if applicable, excise taxes. As a result, no provision for U.S. federal income taxes is required.
The Fund may be subject to foreign taxation related to income received, capital gains on the sale of securities and certain foreign currency transactions in the foreign jurisdictions in which it invests. Foreign taxes, if any, are recorded based on the tax regulations and rates that exist in the foreign markets in which the Fund invests. When a capital gain tax is determined to apply the Fund records an estimated deferred tax liability in an amount that would be payable if the securities were disposed of on the valuation date.
The Fund recognizes the tax benefits of uncertain tax positions only when the position is “more likely than not” to be sustained upon examination by the tax authorities based on the technical merits of the tax position. As of December 31, 2013, and for all open tax years, the Fund has determined that no liability for unrecognized tax benefits is required in the Fund’s financial statements related to uncertain tax positions taken on a tax return (or expected to be taken on future tax returns). Open tax years are those that remain subject to examination and are based on each tax jurisdiction statute of limitation.
g. Security Transactions, Investment Income, Expenses and Distributions
Security transactions are accounted for on trade date. Realized gains and losses on security transactions are determined on a specific identification basis. Interest income and estimated expenses are accrued daily. Amortization of premium and accretion of discount on debt securities are included in interest income. Distributions to shareholders are recorded on the ex-dividend date and are determined according to income tax regulations (tax basis). Distributable earnings determined on a tax basis may differ from earnings recorded in accordance with accounting principles generally accepted in the United States of America. These differences may be permanent or temporary. Permanent differences are reclassified among capital accounts to reflect their tax character. These reclassifications have no impact on net assets or the results of operations. Temporary differences are not reclassified, as they may reverse in subsequent periods.
Common expenses incurred by the Trust are allocated among the funds based on the ratio of net assets of each fund to the combined net assets of the Trust. Fund specific expenses are charged directly to the fund that incurred the expense.
Realized and unrealized gains and losses and net investment income, not including class specific expenses, are allocated daily to each class of shares based upon the relative proportion of net assets of each class. Differences in per share distributions, by class, are generally due to differences in class specific expenses.
Inflation-indexed bonds are adjusted for inflation through periodic increases or decreases in the security’s interest accruals, face amount, or principal redemption value, by amounts corresponding to the rate of inflation as measured by an index. Any increase or decrease in the face amount or principal redemption value will be included as interest income on the Statement of Operations.
h. Accounting Estimates
The preparation of financial statements in accordance with accounting principles generally accepted in the United States of America requires management to make estimates and assumptions that affect the reported amounts of assets and liabilities at the date of the financial statements and the amounts of income and expenses during the reporting period. Actual results could differ from those estimates.
TGB-34
Franklin Templeton Variable Insurance Products Trust
Notes to Financial Statements (continued)
Templeton Global Bond Securities Fund
1. ORGANIZATION AND SIGNIFICANT ACCOUNTING POLICIES (continued)
i. Redemption Fees
Redemptions and exchanges of interests in an insurance company subaccount that invests in Class 3 shares of the Fund will be subject to a 1.0% short term trading fee if the interest in the subaccount has been held for less than 60 days. Such fees are retained by the Fund and accounted for as an addition to paid-in capital, allocated to each class of shares based upon the relative proportion of net assets of each class.
j. Guarantees and Indemnifications
Under the Trust’s organizational documents, its officers and trustees are indemnified by the Trust against certain liabilities arising out of the performance of their duties to the Trust. Additionally, in the normal course of business, the Trust, on behalf of the Fund, enters into contracts with service providers that contain general indemnification clauses. The Trust’s maximum exposure under these arrangements is unknown as this would involve future claims that may be made against the Trust that have not yet occurred. Currently, the Trust expects the risk of loss to be remote.
2. SHARES OF BENEFICIAL INTEREST
At December 31, 2013, there were an unlimited number of shares authorized (without par value). Transactions in the Fund’s shares were as follows:
| | | | | | | | | | | | | | | | |
| | | Year Ended December 31, | |
| | | 2013 | | | 2012 | |
| Class 1 Shares: | | Shares | | | Amount | | | Shares | | | Amount | |
Shares sold | | | 1,918,229 | | | $ | 37,822,305 | | | | 2,650,014 | | | $ | 51,366,352 | |
Shares issued in reinvestment of distributions | | | 962,717 | | | | 18,050,945 | | | | 1,028,604 | | | | 18,453,147 | |
Shares redeemed | | | (3,563,965 | ) | | | (69,146,364 | ) | | | (2,823,320 | ) | | | (54,404,201 | ) |
| | | | |
Net increase (decrease) | | | (683,019 | ) | | $ | (13,273,114 | ) | | | 855,298 | | | $ | 15,415,298 | |
| | | | |
Class 2 Shares: | | | | | | | | | | | | | | | | |
Shares sold | | | 34,876,621 | | | $ | 667,964,958 | | | | 28,727,828 | | | $ | 540,675,595 | |
Shares issued in reinvestment of distributions | | | 8,877,431 | | | | 161,924,337 | | | | 7,843,692 | | | | 137,107,730 | |
Shares redeemed | | | (16,008,448 | ) | | | (299,919,892 | ) | | | (12,232,820 | ) | | | (229,259,272 | ) |
| | | | |
Net increase (decrease) | | | 27,745,604 | | | $ | 529,969,403 | | | | 24,338,700 | | | $ | 448,524,053 | |
| | | | |
Class 3 Shares: | | | | | | | | | | | | | | | | |
Shares sold | | | 1,022,231 | | | $ | 19,570,327 | | | | 835,292 | | | $ | 15,856,382 | |
Shares issued in reinvestment of distributions | | | 646,027 | | | | 11,789,991 | | | | 710,200 | | | | 12,421,403 | |
Shares redeemed | | | (1,409,425 | ) | | | (26,566,154 | ) | | | (1,613,494 | ) | | | (30,338,250 | ) |
| | | | |
Net increase (decrease) | | | 258,833 | | | $ | 4,794,164 | | | | (68,002 | ) | | $ | (2,060,465 | ) |
| | | | |
Class 4 Shares: | | | | | | | | | | | | | | | | |
Shares sold | | | 892,452 | | | $ | 17,199,730 | | | | 871,336 | | | $ | 16,701,133 | |
Shares issued on reinvestment of distributions | | | 485,524 | | | | 9,035,611 | | | | 562,284 | | | | 10,014,286 | |
Shares redeemed | | | (3,385,215 | ) | | | (63,604,703 | ) | | | (1,421,448 | ) | | | (27,110,149 | ) |
| | | | |
Net increase (decrease) | | | (2,007,239 | ) | | $ | (37,369,362 | ) | | | 12,172 | | | $ | (394,730 | ) |
| | | | |
TGB-35
Franklin Templeton Variable Insurance Products Trust
Notes to Financial Statements (continued)
Templeton Global Bond Securities Fund
3. TRANSACTIONS WITH AFFILIATES
Franklin Resources, Inc. is the holding company for various subsidiaries that together are referred to as Franklin Templeton Investments. Certain officers and trustees of the Fund are also officers and/or directors of the following subsidiaries:
| | |
| Subsidiary | | Affiliation |
Franklin Advisers, Inc. (Advisers) | | Investment manager |
Franklin Templeton Services, LLC (FT Services) | | Administrative manager |
Franklin Templeton Distributors, Inc. (Distributors) | | Principal underwriter |
Franklin Templeton Investor Services, LLC (Investor Services) | | Transfer agent |
a. Management Fees
The Fund pays an investment management fee to Advisers based on the average daily net assets of the Fund as follows:
| | |
| Annualized Fee Rate | | Net Assets |
| 0.625% | | Up to and including $100 million |
| 0.500% | | Over $100 million, up to and including $250 million |
| 0.450% | | Over $250 million, up to and including $7.5 billion |
| 0.440% | | Over $7.5 billion, up to and including $10 billion |
| 0.430% | | Over $10 billion, up to and including $12.5 billion |
| 0.420% | | Over $12.5 billion, up to and including $15 billion |
| 0.400% | | In excess of $15 billion |
b. Administrative Fees
Under an agreement with Advisers, FT Services provides administrative services to the Fund. The fee is paid by Advisers based on the Fund’s average daily net assets, and is not an additional expense of the Fund.
c. Distribution Fees
The Board has adopted distribution plans for Class 2, Class 3, and Class 4 shares pursuant to Rule 12b-1 under the 1940 Act. Under the Fund’s compensation distribution plans, the Fund pays Distributors for costs incurred in connection with the servicing, sale and distribution of the Fund’s shares up to 0.25%, 0.35%, and 0.35% per year of its average daily net assets of Class 2, Class 3, and Class 4, respectively. Some distribution fees are not charged on shares held by affiliates. The Board has agreed to limit the current rate to 0.25% per year for Class 3. The plan year, for purposes of monitoring compliance with the maximum annual plan rates, is February 1 through January 31.
d. Transfer Agent Fees
Investor Services, under terms of an agreement, performs shareholder servicing for the Fund and is not paid by the Fund for the services.
4. EXPENSE OFFSET ARRANGEMENT
The Fund has entered into an arrangement with its custodian whereby credits realized as a result of uninvested cash balances are used to reduce a portion of the Fund’s custodian expenses. During the year ended December 31, 2013, the custodian fees were reduced as noted in the Statement of Operations.
TGB-36
Franklin Templeton Variable Insurance Products Trust
Notes to Financial Statements (continued)
Templeton Global Bond Securities Fund
5. INCOME TAXES
For tax purposes, capital losses may be carried over to offset future capital gains. At December 31, 2013, the Fund had long-term capital loss carryforwards of $4,268,308.
The tax character of distributions paid during the years ended December 31, 2013 and 2012, was as follows:
| | | | | | | | |
| | | 2013 | | | 2012 | |
Distributions paid from: | | | | | | | | |
Ordinary income | | $ | 159,641,646 | | | $ | 173,642,707 | |
Long term capital gain | | | 41,159,238 | | | | 4,353,858 | |
| | | | |
| | $ | 200,800,884 | | | $ | 177,996,565 | |
| | | | |
At December 31, 2013, the cost of investments, net unrealized appreciation (depreciation) and undistributed ordinary income for income tax purposes were as follows:
| | | | |
Cost of investments | | $ | 3,028,483,990 | |
| | | | |
| |
Unrealized appreciation | | $ | 143,431,341 | |
Unrealized depreciation | | | (72,049,358 | ) |
| | | | |
Net unrealized appreciation (depreciation) | | $ | 71,381,983 | |
| | | | |
Distributable earnings - undistributed ordinary income | | $ | 177,849,072 | |
| | | | |
Differences between income and/or capital gains as determined on a book basis and a tax basis are primarily due to differing treatments of foreign currency transactions, bond discounts and premiums, tax straddles.
6. INVESTMENT TRANSACTIONS
Purchases and sales of investments (excluding short term securities) for the year ended December 31, 2013, aggregated $1,063,004,404 and $826,160,004, respectively.
7. CREDIT RISK
At December 31, 2013, the Fund had 10.46% of its portfolio invested in high yield or other securities rated below investment grade. These securities may be more sensitive to economic conditions causing greater price volatility and are potentially subject to a greater risk of loss due to default than higher rated securities.
8. CONCENTRATION OF RISK
Investing in foreign securities may include certain risks and considerations not typically associated with investing in U.S. securities, such as fluctuating currency values and changing local and regional economic, political and social conditions, which may result in greater market volatility. In addition, certain foreign securities may not be as liquid as U.S. securities.
TGB-37
Franklin Templeton Variable Insurance Products Trust
Notes to Financial Statements (continued)
Templeton Global Bond Securities Fund
9. OTHER DERIVATIVE INFORMATION
At December 31, 2013, the Fund’s investments in derivative contracts are reflected on the Statement of Assets and Liabilities as follows:
| | | | | | | | | | | | |
| | | Asset Derivatives | | | Liability Derivatives | |
Derivative Contracts Not Accounted
for as Hedging Instruments | | Statement of Assets and
Liabilities Location | | Fair
Value
Amount | | | Statement of Assets and
Liabilities Location | | Fair
Value
Amount | |
Interest rate contracts | | Variation margin / Net assets consist of – net unrealized appreciationa | | $ | 1,370,754 | | | Unrealized depreciation on swap contracts / Net assets consist of – net unrealized depreciation | | $ | 3,498,225 | |
Foreign exchange contracts | | Unrealized appreciation on forward exchange contracts / Net assets consist of – net unrealized appreciation | | | 74,197,203 | | | Unrealized depreciation on forward exchange contracts / Net assets consist of – net unrealized depreciation | | | 52,426,649 | |
aIncludes cumulative appreciation (depreciation) of centrally cleared swaps as reported in the Statement of Investments. Only current day’s variation margin is separately reported within the Statement of Assets and Liabilities.
For the year ended December 31, 2013, the effect of derivative contracts on the Fund’s Statement of Operations was as follows:
| | | | | | | | | | |
Derivative Contracts Not Accounted
for as Hedging Instruments | | Statement of Operations Locations | | Realized Gain
(Loss) for the
Year | | | Change in
Unrealized
Appreciation
(Depreciation)
for the
Year | |
Interest rate contracts | | Net realized gain (loss) from swap contracts / Net change in unrealized appreciation (depreciation) on investments | | $ | (996,665 | ) | | $ | 8,336,928 | |
Foreign exchange contracts | | Net realized gain (loss) from foreign currency transactions / Net change in unrealized appreciation (depreciation) on translation of other assets and liabilities denominated in foreign currencies | | | 55,154,098 | | | | (9,671,096 | ) |
At December 31, 2013, the Fund’s OTC derivative assets and liabilities, are as follows:
| | | | | | | | |
| | | Gross and Net Amounts of
Assets and Liabilities Presented
in the Statement of Assets
and Liabilities | |
| | | Assetsa | | | Liabilitiesa | |
Derivatives | | | | | | | | |
Forward Exchange Contracts | | $ | 74,197,203 | | | $ | 52,426,649 | |
Swap Contracts | | | — | | | | 3,498,225 | |
| | | | |
Total | | $ | 74,197,203 | | | $ | 55,924,874 | |
| | | | |
| a | Absent an event of default or early termination, OTC derivative assets and liabilities are presented gross and not offset in the Statement of Assets and Liabilities. |
TGB-38
Franklin Templeton Variable Insurance Products Trust
Notes to Financial Statements (continued)
Templeton Global Bond Securities Fund
9. OTHER DERIVATIVE INFORMATION (continued)
At December 31, 2013, the Fund’s OTC derivative assets which may be offset against the Fund’s OTC derivative liabilities and collateral received from the counterparty, is as follows:
| | | | | | | | | | | | | | | | | | | | |
| | | | | | Amounts Not Offset in the Statement of
Assets and Liabilities | | | | |
| | | Gross and Net
Amounts of Assets
Presented in the
Statement of Assets
and Liabilities | | | Financial
Instruments
Available for
Offset | | | Financial
Instruments
Collateral
Receiveda | | | Cash
Collateral
Received | | | Net
Amount
(Not less
than zero) | |
Counterparty | | | | | | | | | | | | | | | | | | | | |
BZWS | | $ | 9,228,241 | | | $ | (7,879,050 | ) | | $ | — | | | $ | (1,130,000 | ) | | $ | 219,191 | |
CITI | | | 10,476,010 | | | | (5,323,823 | ) | | | (4,651,652 | ) | | | — | | | | 500,535 | |
DBAB | | | 13,615,878 | | | | (13,615,878 | ) | | | — | | | | — | | | | — | |
GSCO | | | 1,834,450 | | | | (1,834,450 | ) | | | — | | | | — | | | | — | |
HSBC | | | 15,523,320 | | | | (4,023,395 | ) | | | (10,901,026 | ) | | | — | | | | 598,899 | |
JPHQ | | | 17,306,073 | | | | (7,652,563 | ) | | | (9,142,201 | ) | | | — | | | | 511,309 | |
MSCO | | | 776,074 | | | | (776,074 | ) | | | — | | | | — | | | | — | |
SCNY | | | 193,431 | | | | (24,393 | ) | | | — | | | | — | | | | 169,038 | |
UBSW | | | 5,243,726 | | | | (3,611,556 | ) | | | (989,024 | ) | | | — | | | | 643,146 | |
| | | | |
Total | | $ | 74,197,203 | | | $ | (44,741,182 | ) | | $ | (25,683,903 | ) | | $ | (1,130,000 | ) | | $ | 2,642,118 | |
| | | | |
| a | At December 31, 2013, the Fund received United Kingdom Treasury Bonds and United States Treasury Notes as collateral for derivatives. |
At December 31, 2013, the Fund’s OTC derivative liabilities which may be offset against the Fund’s OTC derivative assets and collateral pledged to the counterparty, is as follows:
| | | | | | | | | | | | | | | | | | | | |
| | | | | | Amounts Not Offset in the Statement of
Assets and Liabilities | | | | |
| | | Gross and Net
Amounts of Liabilities
Presented in the
Statement of Assets
and Liabilities | | | Financial
Instruments
Available for
Offset | | | Financial
Instruments
Collateral
Pledged | | | Cash
Collateral
Pledgeda | | | Net
Amount
(Not less
than zero) | |
Counterparty | | | | | | | | | | | | | | | | | | | | |
BZWS | | $ | 7,879,050 | | | $ | (7,879,050 | ) | | $ | — | | | $ | — | | | $ | — | |
CITI | | | 5,323,823 | | | | (5,323,823 | ) | | | — | | | | — | | | | — | |
DBAB | | | 18,018,700 | | | | (13,615,878 | ) | | | — | | | | (4,402,822 | ) | | | — | |
GSCO | | | 5,102,598 | | | | (1,834,450 | ) | | | — | | | | (3,080,000 | ) | | | 188,148 | |
HSBC | | | 4,023,395 | | | | (4,023,395 | ) | | | — | | | | — | | | | — | |
JPHQ | | | 7,652,563 | | | | (7,652,563 | ) | | | — | | | | — | | | | — | |
MSCO | | | 4,288,796 | | | | (776,074 | ) | | | — | | | | (3,512,722 | ) | | | — | |
SCNY | | | 24,393 | | | | (24,393 | ) | | | — | | | | — | | | | — | |
UBSW | | | 3,611,556 | | | | (3,611,556 | ) | | | — | | | | — | | | | — | |
| | | | |
Total | | $ | 55,924,874 | | | $ | (44,741,182 | ) | | $ | — | | | $ | (10,995,544 | ) | | $ | 188,148 | |
| | | | |
| a | In some instances, the collateral amounts disclosed in the table above were adjusted due to the requirement to limit the collateral amounts to avoid the effect of overcollateralization. Actual collateral received and/or pledged may be more than the amounts disclosed herein. |
TGB-39
Franklin Templeton Variable Insurance Products Trust
Notes to Financial Statements (continued)
Templeton Global Bond Securities Fund
9. OTHER DERIVATIVE INFORMATION (continued)
For the year ended December 31, 2013, the average month end fair value of derivatives represented 3.58% of average month end net assets. The average month end number of open derivative contracts for the year was 454.
See Note 1(d) regarding derivative financial instruments.
10. CREDIT FACILITY
The Fund, together with other U.S. registered and foreign investment funds (collectively, Borrowers), managed by Franklin Templeton Investments, are borrowers in a joint syndicated senior unsecured credit facility totaling $1.5 billion (Global Credit Facility) which, after an extension of the original terms, matured on February 14, 2014. This Global Credit Facility provides a source of funds to the Borrowers for temporary and emergency purposes, including the ability to meet future unanticipated or unusually large redemption requests. Effective February 14, 2014, the Borrowers renewed the Global Credit Facility which matures on February 13, 2015.
Under the terms of the Global Credit Facility, the Fund shall, in addition to interest charged on any borrowings made by the Fund and other costs incurred by the Fund, pay its share of fees and expenses incurred in connection with the implementation and maintenance of the Global Credit Facility, based upon its relative share of the aggregate net assets of all of the Borrowers, including an annual commitment fee of 0.07% based upon the unused portion of the Global Credit Facility. These fees are reflected in other expenses on the Statement of Operations. During the year ended December 31, 2013, the Fund did not use the Global Credit Facility.
11. FAIR VALUE MEASUREMENTS
The Fund follows a fair value hierarchy that distinguishes between market data obtained from independent sources (observable inputs) and the Fund’s own market assumptions (unobservable inputs). These inputs are used in determining the value of the Fund’s financial instruments and are summarized in the following fair value hierarchy:
| | • | | Level 1 – quoted prices in active markets for identical financial instruments |
| | • | | Level 2 – other significant observable inputs (including quoted prices for similar financial instruments, interest rates, prepayment speed, credit risk, etc.) |
| | • | | Level 3 – significant unobservable inputs (including the Fund’s own assumptions in determining the fair value of financial instruments) |
The input levels are not necessarily an indication of the risk or liquidity associated with financial instruments at that level.
For movements between the levels within the fair value hierarchy, the Fund has adopted a policy of recognizing the transfers as of the date of the underlying event which caused the movement.
TGB-40
Franklin Templeton Variable Insurance Products Trust
Notes to Financial Statements (continued)
Templeton Global Bond Securities Fund
11. FAIR VALUE MEASUREMENTS (continued)
A summary of inputs used as of December 31, 2013, in valuing the Fund’s assets and liabilities carried at fair value, is as follows:
| | | | | | | | | | | | | | | | |
| | | Level 1 | | | Level 2 | | | Level 3 | | | Total | |
| | | | |
Assets: | | | | | | | | | | | | | | | | |
Investments in Securities: | | | | | | | | | | | | | | | | |
Foreign Government and Agency Securities | | $ | — | | | $ | 2,244,885,649 | | | $ | — | | | $ | 2,244,885,649 | |
Municipal Bonds | | | — | | | | 1,510,654 | | | | — | | | | 1,510,654 | |
Short Term Investments | | | — | | | | 853,469,670 | | | | — | | | | 853,469,670 | |
| | | | |
Total Investments in Securities | | $ | — | | | $ | 3,099,865,973 | | | $ | — | | | $ | 3,099,865,973 | |
| | | | |
Forward Exchange Contracts | | | — | | | | 74,197,203 | | | | — | | | | 74,197,203 | |
Swaps | | | — | | | | 1,370,754 | | | | — | | | | 1,370,754 | |
Liabilities: | | | | | | | | | | | | | | | | |
Forward Exchange Contracts | | | — | | | | 52,426,649 | | | | — | | | | 52,426,649 | |
Swaps | | | — | | | | 3,498,225 | | | | — | | | | 3,498,225 | |
12. NEW ACCOUNTING PRONOUNCEMENTS
In June 2013, the Financial Accounting Standards Board issued Accounting Standards Update (ASU) No. 2013-08, Investment Companies (Topic 946): Amendments to the Scope, Measurement, and Disclosure Requirements. The ASU modifies the criteria used in defining an investment company under U.S. Generally Accepted Accounting Principles and also sets forth certain measurement and disclosure requirements. Under the ASU, an entity that is registered under the 1940 Act automatically qualifies as an investment company. The ASU is effective for interim and annual reporting periods beginning after December 15, 2013. Management has reviewed the requirements and believe the adoption of this ASU will not have a material impact on the financial statements.
13. SUBSEQUENT EVENTS
The Fund has evaluated subsequent events through the issuance of the financial statements and determined that no events have occurred that require disclosure other than those already disclosed in the financial statements.
| | | | |
ABBREVIATIONS | | | | |
| Counterparty | | Currency | | Selected Portfolio |
| | | | |
| BZWS - Barclays Bank PLC | | BRL - Brazilian Real | | BHAC - Berkshire Hathaway Assurance Corp. |
| CITI - Citigroup, Inc. | | CAD - Canadian Dollar | | FRN - Floating Rate Note |
| DBAB - Deutsche Bank AG | | EUR - Euro | | |
| GSCO - Goldman Sachs Bank | | HUF - Hungarian Forint | | |
| HSBC - HSBC Bank USA, N.A. | | IDR - Indonesian Rupiah | | |
| JPHQ - JPMorgan Chase & Co. | | KRW - South Korean Won | | |
| MSCO - Morgan Stanley | | LKR - Sri Lankan Rupee | | |
| SCNY - Standard Chartered Bank | | MXN - Mexican Peso | | |
| UBSW - UBS AG | | MYR - Malaysian Ringgit | | |
| | PEN - Peruvian Nuevo Sol | | |
| | PHP - Philippine Peso | | |
| | PLN - Polish Zloty | | |
| | SEK - Swedish Krona | | |
| | SGD - Singapore Dollar | | |
TGB-41
Franklin Templeton Variable Insurance Products Trust
Templeton Global Bond Securities Fund
Report of Independent Registered Public Accounting Firm
To the Board of Trustees and Shareholders of
Franklin Templeton Variable Insurance Products Trust
In our opinion, the accompanying statement of assets and liabilities, including the statement of investments, and the related statements of operations and of changes in net assets and the financial highlights present fairly, in all material respects, the financial position of The Templeton Global Bond Securities Fund (the “Fund”) at December 31, 2013, the results of its operations for the year then ended, the changes in its net assets for each of the two years in the period then ended and the financial highlights for each of the five years in the period then ended, in conformity with accounting principles generally accepted in the United States of America. These financial statements and financial highlights (hereafter referred to as “financial statements”) are the responsibility of the Fund’s management. Our responsibility is to express an opinion on these financial statements based on our audits. We conducted our audits of these financial statements in accordance with the standards of the Public Company Accounting Oversight Board (United States). Those standards require that we plan and perform the audit to obtain reasonable assurance about whether the financial statements are free of material misstatement. An audit includes examining, on a test basis, evidence supporting the amounts and disclosures in the financial statements, assessing the accounting principles used and significant estimates made by management, and evaluating the overall financial statement presentation. We believe that our audits, which included confirmation of securities at December 31, 2013 by correspondence with the custodian, transfer agent and brokers, provide a reasonable basis for our opinion.
PricewaterhouseCoopers LLP
San Francisco, California
February 14, 2014
TGB-42
Franklin Templeton Variable Insurance Products Trust
Tax Information (unaudited)
Templeton Global Bond Securities Fund
Under Section 852(b)(3)(C) of the Internal Revenue Code (Code), the Fund hereby reports the maximum amount allowable but no less than $41,159,238 as a long term capital gain dividend for the fiscal year ended December 31, 2013.
At December 31, 2013, more than 50% of the Fund’s total assets were invested in securities of foreign issuers. In most instances, foreign taxes were withheld from income paid to the Fund on these investments. The Fund elects to treat foreign taxes paid as allowed under Section 853 of the Code. This election will allow shareholders of record as of the 2014 distribution date, to treat their proportionate share of foreign taxes paid by the Fund as having been paid directly by them. The shareholder shall consider these amounts as foreign taxes paid in the tax year in which they receive the Fund distribution.
TGB-43
INDEX DESCRIPTIONS
The indexes are unmanaged and include reinvested distributions.
For indexes sourced by Morningstar: © 2014 Morningstar. All Rights Reserved. The information contained herein: (1) is proprietary to Morningstar and/or its content providers; (2) may not be copied or distributed; and (3) is not warranted to be accurate, complete or timely. Neither Morningstar nor its content providers are responsible for any damages or losses arising from any use of this information.
Russell® is a trademark and RussellTM is a servicemark of the Frank Russell Company.
Barclays U.S. Aggregate Index is a market capitalization-weighted index representing the U.S. investment-grade, fixed-rate, taxable bond market with index components for government and corporate, mortgage pass-through and asset-backed securities. All issues included are SEC registered, taxable, dollar denominated and nonconvertible, must have at least one year to final maturity and must be rated investment grade (Baa3/BBB-/BBB- or higher) using the middle rating of Moody’s, Standard & Poor’s and Fitch, respectively.
Barclays U.S. Government Index: Intermediate Component is the intermediate component of the Barclays U.S. Government Index, which includes public obligations of the U.S. Treasury with at least one year to final maturity and publicly issued debt of U.S. government agencies, quasi-federal corporations, and corporate or foreign debt guaranteed by the U.S. government.
Citigroup World Government Bond Index is a market capitalization-weighted index consisting of investment-grade world government bond markets.
Consumer Price Index (CPI), calculated by the Bureau of Labor Statistics, is a commonly used measure of the inflation rate.
Credit Suisse (CS) High Yield Index is designed to mirror the investable universe of the U.S. dollar-denominated high yield debt market.
Dow Jones Industrial Average is a price-weighted average of blue-chip stocks that are generally the leaders in their industry.
Dow Jones-UBS Commodity Index is a broadly diversified index designed to allow investors to track commodity futures through a single, simple measure. The index reflects the return on fully collateralized positions in the underlying futures contracts on physical commodities, which are reweighted and rebalanced annually on a price-percentage basis. The Dow Jones-UBS Commodity IndicesSM are a joint product of DJI Opco, LLC, a subsidiary of S&P Dow Jones Indices LLC, and UBS Securities LLC (“UBS”) and have been licensed for use to S&P Opco, LLC and Franklin Templeton Companies, LLC. S&P® is a registered trademark of Standard & Poor’s Financial Services LLC, Dow Jones® and DJ are registered trademarks of Dow Jones Trademark Holdings LLC, and “UBS” is a registered trademark of UBS AG. All content of the Dow Jones-UBS Commodity IndicesSM © S&P Dow Jones Indices LLC and UBS and their respective affiliates 2014. Reproduction of Dow Jones-UBS Commodity IndicesSM in any form is prohibited except with the prior written permission of S&P. S&P does not guarantee the accuracy, adequacy, completeness or availability of any information and is not responsible for any errors or omissions, regardless of the cause or for the results obtained from the use of such information. S&P DISCLAIMS ANY AND ALL EXPRESS OR IMPLIED WARRANTIES, INCLUDING, BUT NOT LIMITED TO, ANY WARRANTIES OF MERCHANTABILITY OR FITNESS FOR A PARTICULAR PURPOSE OR USE. In no event shall S&P be liable for any direct, indirect, special or consequential damages, costs, expenses, legal fees, or losses (including lost income or lost profit and opportunity costs) in connection with subscriber’s or others’ use of Dow Jones-UBS Commodity IndicesSM.
FTSE EPRA/NAREIT Developed Index is a free float-adjusted index designed to measure the performance of publicly traded real estate securities in the North American, European and Asian real estate markets. FTSE® is a trademark of London Stock Exchange Plc and The Financial Times Limited and is used by FTSE under license.
J.P. Morgan (JPM) Global Government Bond Index (GGBI) tracks total returns for liquid, fixed-rate, domestic government bonds with maturities greater than one year issued by developed countries globally.
Lipper Multi-Sector Income Funds Classification Average is calculated by averaging the total returns of all funds within the Lipper Multi-Sector Income Funds classification in the Lipper Open-End underlying funds universe. Lipper Multi-Sector Income Funds are defined as funds that seek current income by allocating assets among different fixed income securities sectors (not primarily in one sector except for defensive purposes), including U.S. and foreign governments, with a significant portion rated below investment grade. For the 12-month period ended 12/31/13, there were 226 funds in this category. Lipper calculations do not include contract fees, expenses or sales charges, and may have been different if such charges had been considered.
Lipper VIP Equity Income Funds Classification Average is an equally weighted average calculation of performance figures for all funds within the Lipper Equity Income Funds classification in the Lipper VIP underlying funds universe. Lipper Equity
I-1
Income Funds seek relatively high current income and growth of income through investing 60% or more of their portfolios in equities. For the 12-month period ended 12/31/13, there were 66 funds in this category. Lipper calculations do not include contract fees, expenses or sales charges, and may have been different if such charges had been considered.
Lipper VIP General U.S. Government Funds Classification Average is an equally weighted average calculation of performance figures for all funds within the Lipper General U.S. Government Funds classification in the Lipper VIP underlying funds universe. Lipper General U.S. Government Funds invest primarily in U.S. government and agency issues. For the 12-month period ended 12/31/13, there were 50 funds in this category. Lipper calculations do not include contract fees, expenses or sales charges, and may have been different if such charges had been considered.
Lipper VIP High Yield Funds Classification Average is an equally weighted average calculation of performance figures for all funds within the Lipper High Yield Funds Classification in the Lipper VIP underlying funds universe. Lipper High Yield Funds aim at high (relative) current yield from fixed income securities, have no quality or maturity restrictions, and tend to invest in lower grade debt issues. For the 12-month period ended 12/31/13, there were 110 funds in this category. Lipper calculations do not include contract fees, expenses or sales charges, and may have been different if such charges had been considered.
MSCI All Country World Index (ACWI) is a free float-adjusted, market capitalization-weighted index designed to measure equity market performance in global developed and emerging markets.
MSCI Emerging Markets (EM) Index is a free float-adjusted, market capitalization-weighted index designed to measure equity market performance in global emerging markets.
MSCI Europe, Australasia, Far East (EAFE) Index is a free float-adjusted, market capitalization-weighted index designed to measure equity market performance in global developed markets excluding the U.S. and Canada.
MSCI Europe, Australasia, Far East (EAFE) Index Net Return (Local Currency) is a free float-adjusted, market capitalization-weighted index designed to measure equity market performance of global developed markets excluding the U.S. and Canada. The index is calculated in local currency and includes reinvested daily net dividends.
MSCI World Index is a free float-adjusted, market capitalization-weighted index designed to measure equity market performance in global developed markets.
Russell 1000® Growth Index is market capitalization weighted and measures performance of those Russell 1000® Index companies with higher price-to-book ratios and higher forecasted growth values.
Russell 1000® Index is market capitalization weighted and measures performance of the largest companies in the Russell 3000® Index, which represents the majority of the U.S. market’s total capitalization.
Russell 1000® Value Index is market capitalization weighted and measures performance of those Russell 1000® Index companies with lower price-to-book ratios and lower forecasted growth values.
Russell 2500™ Index is market capitalization weighted and measures performance of the smallest companies in the Russell 3000® Index, which represent a modest amount of the Russell 3000® Index’s total market capitalization.
Russell 2500™ Value Index is market capitalization weighted and measures performance of those Russell 2500™ Index companies with lower price-to-book ratios and lower forecasted growth values.
Russell 3000® Growth Index is market capitalization weighted and measures performance of those Russell 3000® Index companies with higher price-to-book ratios and higher forecasted growth values.
Russell 3000® Index is market capitalization weighted and measures performance of the largest U.S. companies based on total market capitalization and represents the majority of the investable U.S. equity market.
Russell Midcap® Growth Index is market capitalization weighted and measures performance of those Russell Midcap® Index companies with higher price-to-book ratios and higher forecasted growth values.
Russell Midcap® Index is market capitalization weighted and measures performance of the smallest companies in the Russell 1000® Index, which represent a modest amount of the Russell 1000® Index’s total market capitalization.
I-2
Standard & Poor’s 500 Index (S&P 500) is a market capitalization-weighted index of 500 stocks designed to measure total U.S. equity market performance. STANDARD & POOR’S®, S&P® and S&P 500® are registered trademarks of Standard & Poor’s Financial Services LLC.
Standard & Poor’s/International Finance Corporation Investable (S&P/IFCI) Composite Index is a free float-adjusted, market capitalization-weighted index designed to measure equity performance in global emerging markets.
I-3
Board Members and Officers
The name, year of birth and address of the officers and board members, as well as their affiliations, positions held with the Trust, principal occupation during at least the past five years and number of portfolios overseen in the Franklin Templeton Investments fund complex are shown below. Generally, each board member serves until that person’s successor is elected and qualified.
Independent Board Members
| | | | | | | | |
| Name, Year of Birth and Address | | Position | | Length of
Time Served | | Number of
Portfolios in Fund
Complex Overseen
by Board Member* | | Other Directorships Held
During at Least the Past 5 Years |
Harris J. Ashton (1932) One Franklin Parkway San Mateo, CA 94403-1906 | | Trustee | | Since 1988 | | 141 | | Bar-S Foods (meat packing company) (1981-2010). |
|
Principal Occupation During at Least the Past 5 Years: Director of various companies; and formerly, Director, RBC Holdings, Inc. (bank holding company) (until 2002); and President, Chief Executive Officer and Chairman of the Board, General Host Corporation (nursery and craft centers) (until 1998). |
Sam Ginn (1937) One Franklin Parkway San Mateo, CA 94403-1906 | | Trustee | | Since 2007 | | 114 | | ICO Global Communications (Holdings) Limited (satellite company) (2006-2010), Chevron Corporation (global energy company) (1989-2009), Hewlett-Packard Company (technology company) (1996-2002), Safeway, Inc. (grocery retailer) (1991-1998) and TransAmerica Corporation (insurance company) (1989-1999). |
|
Principal Occupation During at Least the Past 5 Years: Private investor; Chairman, First Responder Network Authority (FirstNet) (interoperable wireless broadband network) (2012); and formerly, Chairman of the Board, Vodafone AirTouch, PLC (wireless company) (1999-2000); Chairman of the Board and Chief Executive Officer, AirTouch Communications (cellular communications) (1993-1998) and Pacific Telesis Group (telephone holding company) (1988-1994). |
Edith E. Holiday (1952) One Franklin Parkway San Mateo, CA 94403-1906 | | Trustee | | Since 2005 | | 141 | | Hess Corporation (exploration and refining of oil and gas), H.J. Heinz Company (processed foods and allied products)(1994-2013), RTI International Metals, Inc. (manufacture and distribution of titanium), Canadian National Railway (railroad) and White Mountains Insurance Group, Ltd. (holding company). |
|
Principal Occupation During at Least the Past 5 Years: Director or Trustee of various companies and trusts; and formerly, Assistant to the President of the United States and Secretary of the Cabinet (1990-1993); General Counsel to the United States Treasury Department (1989-1990); and Counselor to the Secretary and Assistant Secretary for Public Affairs and Public Liaison – United States Treasury Department (1988-1989). |
J. Michael Luttig (1954) One Franklin Parkway San Mateo, CA 94403-1906 | | Trustee | | Since 2009 | | 141 | | Boeing Capital Corporation (aircraft financing) (2006-2013). |
|
Principal Occupation During at Least the Past 5 Years: Executive Vice President, General Counsel and member of Executive Council, The Boeing Company (aerospace company); and formerly, Federal Appeals Court Judge, U.S. Court of Appeals for the Fourth Circuit (1991-2006). |
Frank A. Olson (1932) One Franklin Parkway San Mateo, CA 94403-1906 | | Trustee | | Since 2005 | | 141 | | Hess Corporation (exploration and refining of oil and gas) (1998-2013). |
|
Principal Occupation During at Least the Past 5 Years: Chairman Emeritus, The Hertz Corporation (car rental) (since 2000) (Chairman of the Board (1980-2000) and Chief Executive Officer (1977-1999)); and formerly, Chairman of the Board, President and Chief Executive Officer, UAL Corporation (airlines) (until 1987). |
BOD-1
| | | | | | | | |
| Name, Year of Birth and Address | | Position | | Length of
Time Served | | Number of
Portfolios in Fund
Complex Overseen
by Board Member* | | Other Directorships Held
During at Least the Past 5 Years |
Larry D. Thompson (1945) One Franklin Parkway San Mateo, CA 94403-1906 | | Trustee | | Since 2007 | | 141 | | Cbeyond, Inc. (business communications provider) (2010-2012), The Southern Company (energy company) (2010-2012) and The Washington Post Company (education and media organization). |
|
Principal Occupation During at Least the Past 5 Years: Executive Vice President – Government Affairs, General Counsel and Corporate Secretary, PepsiCo, Inc. (consumer products) (July 2012); and formerly, John A. Sibley Professor of Corporate and Business Law, University of Georgia School of Law (2011-2012); Senior Vice President – Government Affairs, General Counsel and Secretary, PepsiCo, Inc. (2004-2011); Senior Fellow of The Brookings Institution (2003-2004); Visiting Professor, University of Georgia School of Law (2004); and Deputy Attorney General, U.S. Department of Justice (2001-2003). |
John B. Wilson (1959) One Franklin Parkway San Mateo, CA 94403-1906 | | Lead Independent Trustee | | Trustee since 2007 and Lead Independent Trustee since 2008 | | 114 | | None |
|
Principal Occupation During at Least the Past 5 Years: President, Staples Europe (office supplies) (2012); President and Founder, Hyannis Port Capital, Inc. (real estate and private equity investing); serves on private and non-profit boards; and formerly, Chief Operating Officer and Executive Vice President, Gap, Inc. (retail) (1996-2000); Chief Financial Officer and Executive Vice President – Finance and Strategy, Staples, Inc. (1992-1996); Senior Vice President – Corporate Planning, Northwest Airlines, Inc. (airlines) (1990-1992); and Vice President and Partner, Bain & Company (consulting firm) (1986-1990). |
Interested Board Members and Officers
| | | | | | | | |
| Name, Year of Birth and Address | | Position | | Length of
Time Served | | Number of
Portfolios in Fund
Complex Overseen
by Board Member* | | Other Directorships Held
During at Least the Past 5 Years |
**Gregory E. Johnson (1961) One Franklin Parkway San Mateo, CA 94403-1906 | | Trustee | | Since June 2013 | | 152 | | None |
|
Principal Occupation During at Least the Past 5 Years: Chairman of the Board, Member – Office of the Chairman, Director, President and Chief Executive Officer, Franklin Resources, Inc.; officer and/or director or trustee, as the case may be, of some of the other subsidiaries of Franklin Resources, Inc. and of 44 of the investment companies in Franklin Templeton Investments; and Chairman, Investment Company Institute. |
**Rupert H. Johnson, Jr. (1940) One Franklin Parkway San Mateo, CA 94403-1906 | | Chairman of the Board and Trustee | | Chairman of the Board since June 2013 and Trustee since 1988 | | 141 | | None |
|
Principal Occupation During at Least the Past 5 Years: Vice Chairman, Member – Office of the Chairman and Director, Franklin Resources, Inc.; Director, Franklin Advisers, Inc.; Senior Vice President, Franklin Advisory Services, LLC; and officer and/or director or trustee, as the case may be, of some of the other subsidiaries of Franklin Resources, Inc. and of 41 of the investment companies in Franklin Templeton Investments. |
Alison E. Baur (1964) One Franklin Parkway San Mateo, CA 94403-1906 | | Vice President | | Since 2012 | | Not
Applicable | | Not Applicable |
|
Principal Occupation During at Least the Past 5 Years: Deputy General Counsel, Franklin Templeton Investments; and officer of some of the other subsidiaries of Franklin Resources, Inc. and of 46 of the investment companies in Franklin Templeton Investments. |
BOD-2
| | | | | | | | |
| Name, Year of Birth and Address | | Position | | Length of
Time Served | | Number of
Portfolios in Fund
Complex Overseen
by Board Member* | | Other Directorships Held
During at Least the Past 5 Years |
Laura F. Fergerson (1962) One Franklin Parkway San Mateo, CA 94403-1906 | | Chief Executive Officer – Finance and Administration | | Since 2009 | | Not
Applicable | | Not Applicable |
|
Principal Occupation During at Least the Past 5 Years: Senior Vice President, Franklin Templeton Services, LLC; and officer of 46 of the investment companies in Franklin Templeton Investments. |
Gaston Gardey (1967) One Franklin Parkway San Mateo, CA 94403-1906 | | Treasurer, Chief Financial Officer and Chief Accounting Officer | | Since 2009 | | Not
Applicable | | Not Applicable |
|
Principal Occupation During at Least the Past 5 Years: Director, Fund Accounting, Franklin Templeton Investments; and officer of 27 of the investment companies in Franklin Templeton Investments. |
Aliya S. Gordon (1973) One Franklin Parkway San Mateo, CA 94403-1906 | | Vice President | | Since 2009 | | Not
Applicable | | Not Applicable |
|
Principal Occupation During at Least the Past 5 Years: Senior Associate General Counsel, Franklin Templeton Investments; officer of 46 of the investment companies in Franklin Templeton Investments; and formerly, Litigation Associate, Steefel, Levitt & Weiss, LLP (2000-2004). |
Steven J. Gray (1955) One Franklin Parkway San Mateo, CA 94403-1906 | | Vice President | | Since 2009 | | Not
Applicable | | Not Applicable |
|
Principal Occupation During at Least the Past 5 Years: Senior Associate General Counsel, Franklin Templeton Investments; Vice President, Franklin Templeton Distributors, Inc.; and officer of 46 of the investment companies in Franklin Templeton Investments. |
Selena L. Holmes (1965) 100 Fountain Parkway St. Petersburg, FL 33716-1205 | | Vice President – AML Compliance | | Since 2012 | | Not
Applicable | | Not Applicable |
|
Principal Occupation During at Least the Past 5 Years: Director, Global Compliance Monitoring; and officer of 46 of the investment companies in Franklin Templeton Investments. |
Edward B. Jamieson (1948) One Franklin Parkway San Mateo, CA 94403-1906 | | President and Chief Executive Officer – Investment Management | | Since 2010 | | Not
Applicable | | Not Applicable |
|
Principal Occupation During at Least the Past 5 Years: President, Chief Investment Officer and Director, Franklin Advisers, Inc.; Executive Vice President, Franklin Templeton Institutional, LLC; and officer and/or trustee, as the case may be, of some of the other subsidiaries of Franklin Resources, Inc. and of 10 of the investment companies in Franklin Templeton Investments. |
Kimberly H. Novotny (1972) 300 S.E. 2nd Street Fort Lauderdale, FL 33301-1923 | | Vice President | | Since March 2013 | | Not
Applicable | | Not Applicable |
|
Principal Occupation During at Least the Past 5 Years: Associate General Counsel, Franklin Templeton Investments; Vice President and Secretary, Fiduciary Trust International of the South; Vice President, Templeton Investment Counsel, LLC; Assistant Secretary, Franklin Resources, Inc.; and officer of 46 of the investment companies in Franklin Templeton Investments. |
BOD-3
| | | | | | | | |
| Name, Year of Birth and Address | | Position | | Length of
Time Served | | Number of
Portfolios in Fund
Complex Overseen
by Board Member* | | Other Directorships Held
During at Least the Past 5 Years |
Robert C. Rosselot (1960) 300 S.E. 2nd Street Fort Lauderdale, FL 33301-1923 | | Chief Compliance Officer | | Since March 2013 | | Not
Applicable | | Not Applicable |
|
Principal Occupation During at Least the Past 5 Years: Director, Global Compliance, Franklin Templeton Investments; officer of 46 of the investment companies in Franklin Templeton Investments; and formerly, Senior Associate General Counsel, Franklin Templeton Investments (2007-2013); and Secretary and Vice President, Templeton Group of Funds (2004-2013). |
Karen L. Skidmore (1952) One Franklin Parkway San Mateo, CA 94403-1906 | | Vice President and Secretary | | Since 2006 | | Not
Applicable | | Not Applicable |
|
Principal Occupation During at Least the Past 5 Years: Senior Associate General Counsel, Franklin Templeton Investments; and officer of 46 of the investment companies in Franklin Templeton Investments. |
Craig S. Tyle (1960) One Franklin Parkway San Mateo, CA 94403-1906 | | Vice President | | Since 2005 | | Not
Applicable | | Not Applicable |
|
Principal Occupation During at Least the Past 5 Years: General Counsel and Executive Vice President, Franklin Resources, Inc.; and officer of some of the other subsidiaries of Franklin Resources, Inc. and of 46 of the investment companies in Franklin Templeton Investments. |
Lori A. Weber (1964) 300 S.E. 2nd Street Fort Lauderdale, FL 33301-1923 | | Vice President | | Since 2011 | | Not
Applicable | | Not Applicable |
|
Principal Occupation During at Least the Past 5 Years: Senior Associate General Counsel, Franklin Templeton Investments; Assistant Secretary, Franklin Resources, Inc.; Vice President and Secretary, Templeton Investment Counsel, LLC; Vice President, Fiduciary Trust International of the South; and officer of 46 of the investment companies in Franklin Templeton Investments. |
| * | We base the number of portfolios on each separate series of the U.S. registered investment companies within the Franklin Templeton Investments fund complex. These portfolios have a common investment manager or affiliated investment managers. |
| ** | Gregory E. Johnson is considered to be an interested person of the Fund under the federal securities laws due to his position as an officer and director of Franklin Resources, Inc. (Resources), which is the parent company of the Fund’s investment manager and distributor. Rupert H. Johnson, Jr. is considered to be an interested person of the Fund under the federal securities laws due to his position as officer and director and major shareholder of Resources. |
Note 1: Rupert H. Johnson, Jr. is the uncle of Gregory E. Johnson.
Note 2: Officer information is current as of the date of this report. It is possible that after this date, information about officers may change.
Note 3: Effective June 13, 2013, Charles B. Johnson ceased to be a trustee of the Fund.
The Sarbanes-Oxley Act of 2002 and Rules adopted by the Securities and Exchange Commission require the Fund to disclose whether the Fund’s Audit Committee includes at least one member who is an audit committee financial expert within the meaning of such Act and Rules. The Fund’s Board has determined that there is at least one such financial expert on the Audit Committee and has designated John B. Wilson as its audit committee financial expert. The Board believes that Mr. Wilson qualifies as such an expert in view of his extensive business background and experience, including service as chief financial officer of Staples, Inc. from 1992 to 1996. Mr. Wilson has been a Member and Chairman of the Fund’s Audit Committee since 2007. As a result of such background and experience, the Board believes that Mr. Wilson has acquired an understanding of generally accepted accounting principles and financial statements, the general application of such principles in connection with the accounting estimates, accruals and reserves, and analyzing and evaluating financial statements that present a breadth and level of complexity of accounting issues generally comparable to those of the Fund, as well as an understanding of internal controls and procedures for financial reporting and an understanding of audit committee functions. Mr. Wilson is an independent Board member as that term is defined under the relevant Securities and Exchange Commission Rules and Releases.
The Statement of Additional Information (SAI) includes additional information about the board members and is available, without charge, upon request. Shareholders may call (800) 321-8563 or their insurance companies to request the SAI.
BOD-4
Franklin Templeton Variable Insurance Products Trust
Shareholder Information
Proxy Voting Policies and Procedures
The Trust’s investment manager has established Proxy Voting Policies and Procedures (Policies) that the Trust uses to determine how to vote proxies relating to portfolio securities. Shareholders may view the Trust’s complete Policies online at franklintempleton.com. Alternatively, shareholders may request copies of the Policies free of charge by calling the Proxy Group collect at (954) 527-7678 or by sending a written request to: Franklin Templeton Companies, LLC, 300 S.E. 2nd Street, Fort Lauderdale, FL 33301, Attention: Proxy Group. Copies of the Trust’s proxy voting records are also made available online at franklintempleton.com and posted on the U.S. Securities and Exchange Commission’s website at sec.gov and reflect the most recent 12-month period ended June 30.
Quarterly Statement of Investments
The Trust files a complete statement of investments with the U.S. Securities and Exchange Commission for the first and third quarters for each fiscal year on Form N-Q. Shareholders may view the filed Form N-Q by visiting the Commission’s website at sec.gov. The filed form may also be viewed and copied at the Commission’s Public Reference Room in Washington, DC. Information regarding the operations of the Public Reference Room may be obtained by calling (800) SEC-0330.
SI-1
| | | | | | | | | | | | | | | | |
| VALUE | | BLEND | | GROWTH | | SECTOR | | GLOBAL | | INTERNATIONAL | | HYBRID | | ASSET ALLOCATION | | FIXED INCOME |
| | |
 | | < GAIN FROM OUR PERSPECTIVE® > |
Annual Report
FRANKLIN TEMPLETON
VARIABLE INSURANCE PRODUCTS TRUST
Investment Managers
Franklin Advisers, Inc.
Franklin Advisory Services, LLC
Franklin Mutual Advisers, LLC
Franklin Templeton Institutional, LLC
Templeton Asset Management Ltd.
Templeton Global Advisors Limited
Templeton Investment Counsel, LLC
Fund Administrator
Franklin Templeton Services, LLC
Distributor
Franklin Templeton Distributors, Inc.
Franklin Templeton Variable Insurance Products Trust (FTVIP) shares are not offered to the public; they are offered and sold only to: (1) insurance company separate accounts (Separate Account) to serve as the underlying investment vehicle for variable contracts; (2) certain qualified plans; and (3) other mutual funds (funds of funds).
Authorized for distribution to investors in Separate Accounts only when accompanied or preceded by the current prospectus for the applicable contract, which includes the Separate Account and the FTVIP prospectuses. Investors should carefully consider a fund’s investment goals, risks, charges and expenses before investing. The prospectus contains this and other information; please read it carefully before investing.
To ensure the highest quality of service, telephone calls to or from our service departments may be monitored, recorded and accessed. These calls can be identified by the presence of a regular beeping tone.
| | |
| © 2014 Franklin Templeton Investments. All rights reserved. | | VIP3 A 02/14 |
| (a) | The Registrant has adopted a code of ethics that applies to its principal executive officers and principal financial and accounting officer. |
| (f) | Pursuant to Item 12(a)(1), the Registrant is attaching as an exhibit a copy of its code of ethics that applies to its principal executive officers and principal financial and accounting officer. |
| Item 3. | Audit Committee Financial Expert. |
| | |
(a) | | (1) The Registrant has an audit committee financial expert serving on its audit committee. |
| | (2) The audit committee financial expert is John B. Wilson and he is “independent” as defined under the relevant Securities and Exchange Commission Rules and Releases. |
| Item 4. | Principal Accountant Fees and Services. |
The aggregate fees paid to the principal accountant for professional services rendered by the principal accountant for the audit of the registrant’s annual financial statements or for services that are normally provided by the principal accountant in connection with statutory and regulatory filings or engagements were $883,945 for the fiscal year ended December 31, 2013 and $917,092 for the fiscal year ended December 31, 2012.
There were no fees paid to the principal accountant for assurance and related services rendered by the principal accountant to the registrant that are reasonably related to the performance of the audit of the registrant’s financial statements and are not reported under paragraph (a) of Item 4.
There were no fees paid to the principal accountant for assurance and related services rendered by the principal accountant to the registrant’s investment adviser and any entity controlling, controlled by or under common control with the investment adviser that provides ongoing services to the registrant that are reasonably related to the performance of the audit of their financial statements.
The aggregate fees paid to the principal accountant for professional services rendered by the principal accountant to the registrant for tax compliance, tax advice and tax planning were $0 for the fiscal year ended December 31, 2013 and $7,040 for the fiscal year ended December 31, 2012. The services for which these fees were paid included preparation of tax returns for foreign governments and consultation on foreign withholding tax reporting.
The aggregate fees paid to the principal accountant for professional services rendered by the principal accountant to the registrant’s investment adviser and any entity controlling, controlled by or under common control with the investment adviser that provides ongoing services to the registrant for tax compliance, tax advice and tax planning were $6,930 for the fiscal year ended December 31, 2013 and $4,600 for the fiscal year ended December 31, 2012. The services for which these fees were paid included technical tax consultation for capital gain tax and withholding tax reporting for foreign governments and requirements on local country’s self certification forms.
The aggregate fees paid to the principal accountant for products and services rendered by the principal accountant to the registrant not reported in paragraphs (a)-(c) of Item 4 were $0 for the fiscal year ended December 31, 2013 and $17,390 for the fiscal year ended December 31, 2012. The services for which these fees were paid include review of materials provided to the fund Board in connection with the investment management contract renewal process and review on amortization/accretion matters.
The aggregate fees paid to the principal accountant for products and services rendered by the principal accountant to the registrant’s investment adviser and any entity controlling, controlled by or under common control with the investment adviser that provides ongoing services to the registrant other than services reported in paragraphs (a)-(c) of Item 4 were $59,809 for the fiscal year ended December 31, 2013 and $158,267 for the fiscal year ended December 31, 2012. The services for which these fees were paid included preparation and review of materials provided to the fund Board in connection with the investment management contract renewal process, certifying asset under management, and XBRL tagging on financial statements.
(e) (1) The registrant’s audit committee is directly responsible for approving the services to be provided by the auditors, including:
(i) pre-approval of all audit and audit related services;
(ii) pre-approval of all non-audit related services to be provided to the Fund by the auditors;
(iii) pre-approval of all non-audit related services to be provided to the registrant by the auditors to the registrant’s investment adviser or to any entity that controls, is controlled by or is under common control with the registrant’s investment adviser and that provides ongoing services to the registrant where the non-audit services relate directly to the operations or financial reporting of the registrant; and
(iv) establishment by the audit committee, if deemed necessary or appropriate, as an alternative to committee pre-approval of services to be provided by the auditors, as required by paragraphs (ii) and (iii) above, of policies and procedures to permit such services to be pre-approved by other means, such as through establishment of
guidelines or by action of a designated member or members of the committee; provided the policies and procedures are detailed as to the particular service and the committee is informed of each service and such policies and procedures do not include delegation of audit committee responsibilities, as contemplated under the Securities Exchange Act of 1934, to management; subject, in the case of (ii) through (iv), to any waivers, exceptions or exemptions that may be available under applicable law or rules.
(e) (2) None of the services provided to the registrant described in paragraphs (b)-(d) of Item 4 were approved by the audit committee pursuant to paragraph (c)(7)(i)(C) of Rule 2-01 of regulation S-X.
| (f) | No disclosures are required by this Item 4(f). |
(g) The aggregate non-audit fees paid to the principal accountant for services rendered by the principal accountant to the registrant and the registrant’s investment adviser and any entity controlling, controlled by or under common control with the investment adviser that provides ongoing services to the registrant were $66,739 for the fiscal year ended December 31, 2013 and $187,297 for the fiscal year ended December 31, 2012.
(h) The registrant’s audit committee of the board has considered whether the provision of non-audit services that were rendered to the registrant’s investment adviser (not including any sub-adviser whose role is primarily portfolio management and is subcontracted with or overseen by another investment adviser), and any entity controlling, controlled by, or under common control with the investment adviser that provides ongoing services to the registrant that were not pre-approved pursuant to paragraph (c)(7)(ii) of Rule 2-01 of Regulation S-X is compatible with maintaining the principal accountant’s independence.
| | |
Item 5. Audit Committee of Listed Registrants. | | N/A |
| |
Item 6. Schedule of Investments. | | N/A |
| |
Item 7. Disclosure of Proxy Voting Policies and Procedures for Closed-End Management Investment Companies. | | N/A |
| |
Item 8. Portfolio Managers of Closed-End Management Investment Companies. | | N/A |
| |
Item 9. Purchases of Equity Securities by Closed-End Management Investment Company and Affiliated Purchasers. | | N/A |
| |
Item 10. Submission of Matters to a Vote of Security Holders. | | |
There have been no changes to the procedures by which shareholders may recommend nominees to the Registrant’s Board of Trustees that would require disclosure herein.
| Item 11. | Controls and Procedures. |
(a) Evaluation of Disclosure Controls and Procedures. The Registrant maintains disclosure controls and procedures that are designed to ensure that information required to be disclosed in the Registrant’s filings under the Securities Exchange Act of 1934 and the Investment Company Act of 1940 is recorded, processed, summarized and reported within the periods specified in the rules and forms of the Securities and Exchange Commission. Such information is accumulated and communicated to the Registrant’s management, including its principal executive officer and principal financial officer, as appropriate, to allow timely decisions regarding required disclosure. The Registrant’s management, including the principal executive officer and the principal financial officer, recognizes that any set of controls and procedures, no matter how well designed and operated, can provide only reasonable assurance of achieving the desired control objectives.
Within 90 days prior to the filing date of this Shareholder Report on Form N-CSR, the Registrant had carried out an evaluation, under the supervision and with the participation of the Registrant’s management, including the Registrant’s principal executive officer and the Registrant’s principal financial officer, of the effectiveness of the design and operation of the Registrant’s disclosure controls and procedures. Based on such evaluation, the Registrant’s principal executive officer and principal financial officer concluded that the Registrant’s disclosure controls and procedures are effective.
(b) Changes in Internal Controls. There have been no changes in the Registrant’s internal controls or in other factors that could materially affect the internal controls over financial reporting subsequent to the date of their evaluation in connection with the preparation of this Shareholder Report on Form N-CSR.
(a) (1) Code of Ethics
(a) (2) Certifications pursuant to Section 302 of the Sarbanes-Oxley Act of 2002 of Laura F. Fergerson, Chief Executive Officer - Finance and Administration, and Gaston Gardey, Chief Financial Officer and Chief Accounting Officer
(b) Certifications pursuant to Section 906 of the Sarbanes-Oxley Act of 2002 of Laura F. Fergerson, Chief Executive Officer - Finance and Administration, and Gaston Gardey, Chief Financial Officer and Chief Accounting Officer
SIGNATURES
Pursuant to the requirements of the Securities Exchange Act of 1934 and the Investment Company Act of 1940, the registrant has duly caused this report to be signed on its behalf by the undersigned, thereunto duly authorized.
FRANKLIN TEMPLETON VARIABLE INSURANCE PRODUCTS TRUST
| | |
| By | | /s/ LAURA F. FERGERSON |
| | Laura F. Fergerson |
| | Chief Executive Officer – |
| | Finance and Administration |
|
| Date February 27, 2014 |
Pursuant to the requirements of the Securities Exchange Act of 1934 and the Investment Company Act of 1940, this report has been signed below by the following persons on behalf of the registrant and in the capacities and on the dates indicated.
| | |
| By | | /s/ LAURA F. FERGERSON |
| | Laura F. Fergerson |
| | Chief Executive Officer – |
| | Finance and Administration |
|
| Date February 27, 2014 |
| | |
| By | | /s/ GASTON GARDEY |
| | Gaston Gardey |
| | Chief Financial Officer and |
| | Chief Accounting Officer |
|
| Date February 27, 2014 |