UNITED STATES
SECURITIES AND EXCHANGE COMMISSION
Washington, D.C. 20549
FORM N-CSR
CERTIFIED SHAREHOLDER REPORT OF REGISTERED
MANAGEMENT INVESTMENT COMPANIES
Investment Company Act file number 811-05583
Franklin Templeton Variable Insurance Products Trust
(Exact name of registrant as specified in charter)
One Franklin Parkway, San Mateo, CA 94403-1906
(Address of principal executive offices) (Zip code)
Craig S. Tyle, One Franklin Parkway, San Mateo, CA 94403-1906
(Name and address of agent for service)
Registrant’s telephone number, including area code: (650) 312-2000
Date of fiscal year end: 12/31
Date of reporting period: 12/31/12
| Item 1. | Reports to Stockholders. |

DECEMBER 31, 2012
FRANKLIN TEMPLETON
VARIABLE INSURANCE PRODUCTS TRUST
ANNUAL
REPORT

FRANKLIN TEMPLETON VARIABLE INSURANCE
PRODUCTS TRUST ANNUAL REPORT
TABLEOF CONTENTS
*Not part of the annual report. Retain for your records.
† Please see Group of Funds Prospectus Supplement and Group of Funds Statement of Additional Information Supplement.
†† Please see Group of Funds Statement of Additional Information Supplement.
NOT FDIC INSURED | MAY LOSE VALUE | NO BANK GUARANTEE
MASTER CLASS – 2
IMPORTANT NOTESTOPERFORMANCE INFORMATION
Performance data is historical and cannot predict or guarantee future results. Principal value and investment return will fluctuate with market conditions, and you may have a gain or loss when you withdraw your money. Inception dates of the funds may have preceded the effective dates of the subaccounts, contracts, or their availability in all states.
When reviewing the index comparisons, please keep in mind that indexes have a number of inherent performance differentials over the funds. First, unlike the funds, which must hold a minimum amount of cash to maintain liquidity, indexes do not have a cash component. Second, the funds are actively managed and, thus, are subject to management fees to cover salaries of securities analysts or portfolio managers in addition to other expenses. Indexes are unmanaged and do not include any commissions or other expenses typically associated with investing in securities. Third, indexes often contain a different mix of securities than the fund to which they are compared. Additionally, please remember that indexes are simply a measure of performance and cannot be invested in directly.
i
SUPPLEMENT DATED JANUARY 1, 2013
TOTHE PROSPECTUSES
DATED MAY 1, 2012
OF
FRANKLIN GLOBAL REAL ESTATE SECURITIES FUND
FRANKLIN GROWTHAND INCOME SECURITIES FUND
FRANKLIN HIGH INCOME SECURITIES FUND
FRANKLIN INCOME SECURITIES FUND
FRANKLIN STRATEGIC INCOME SECURITIES FUND
MUTUAL GLOBAL DISCOVERY SECURITIES FUND
MUTUAL INTERNATIONAL SECURITIES FUND
MUTUAL SHARES SECURITIES FUND
TEMPLETON GLOBAL BOND SECURITIES FUND
(Series of Franklin Templeton Variable Insurance Products Trust)
The Prospectus is amended as follows:
I. For the Franklin Global Real Estate Securities Fund, Franklin Strategic Income Securities Fund, Mutual Global Discovery Securities Fund, Mutual International Securities Fund, Mutual Shares Securities Fund and Templeton Global Bond Securities Fund, the “Principal Investment Policies and Practices - Commodity Exchange Act Exclusion” section of the Fund Details is replaced with the following:
The Fund is not intended as a vehicle for trading in the futures, commodity options or swaps markets. With respect to the Fund, the investment manager has claimed an exclusion from the definition of “commodity pool operator” (CPO) under the Commodity Exchange Act (CEA) and the rules of the Commodity Futures Trading Commission (CFTC) and, therefore, is not subject to CFTC registration or regulation as a CPO. In addition, the investment manager is relying upon a related exclusion from the definition of “commodity trading advisor” (CTA) under the CEA and the rules of the CFTC.
As of January 1, 2013, the terms of the CPO exclusion require the Fund, among other things, to adhere to certain limits on its investments in futures, commodity options, swaps and non-deliverable foreign currency forwards (used for purposes other than bona fide hedging). Because the investment manager and the Fund intend to comply with the terms of the CPO exclusion, the Fund may need to adjust its investment strategies to limit its investments in these types of instruments. The CFTC has neither reviewed nor approved the investment manager’s reliance on these exclusions, or the Fund, its investment strategies or this prospectus.
P-1
II. For the Franklin Growth and Income Securities Fund, Franklin High Income Securities Fund and Franklin Income Securities Fund, the following is added above the “Principal Investment Policies and Practices - Temporary Investments” section of the Fund Details:
The Fund is not intended as a vehicle for trading in the futures, commodity options or swaps markets. With respect to the Fund, the investment manager has claimed an exclusion from the definition of “commodity pool operator” (CPO) under the Commodity Exchange Act (CEA) and the rules of the Commodity Futures Trading Commission (CFTC) and, therefore, is not subject to CFTC registration or regulation as a CPO. In addition, the investment manager is relying upon a related exclusion from the definition of “commodity trading advisor” (CTA) under the CEA and the rules of the CFTC.
As of January 1, 2013, the terms of the CPO exclusion require the Fund, among other things, to adhere to certain limits on its investments in futures, commodity options, swaps and non-deliverable foreign currency forwards (used for purposes other than bona fide hedging). Because the investment manager and the Fund intend to comply with the terms of the CPO exclusion, the Fund may need to adjust its investment strategies to limit its investments in these types of instruments. The CFTC has neither reviewed nor approved the investment manager’s reliance on these exclusions, or the Fund, its investment strategies or this prospectus.
Please keep this supplement for future reference
P-2
SUPPLEMENT DATED JANUARY 1, 2013
TOTHE STATEMENTOF ADDITIONAL INFORMATION
DATED MAY 1, 2012
OF
FRANKLIN GLOBAL REAL ESTATE SECURITIES FUND
FRANKLIN GROWTHAND INCOME SECURITIES FUND
FRANKLIN HIGH INCOME SECURITIES FUND
FRANKLIN INCOME SECURITIES FUND
FRANKLIN STRATEGIC INCOME SECURITIES FUND
FRANKLIN TEMPLETON VIP FOUNDING FUNDS ALLOCATION FUND
MUTUAL GLOBAL DISCOVERY SECURITIES FUND
MUTUAL INTERNATIONAL SECURITIES FUND
MUTUAL SHARES SECURITIES FUND
TEMPLETON GLOBAL BOND SECURITIES FUND
(Series of Franklin Templeton Variable Insurance Products Trust)
The statement of additional information is amended as follows:
The fourth paragraph on page 23 under “Glossary of Investments, Techniques, Strategies and Their Risks - Derivative instruments” is replaced with the following paragraphs:
The Fund is not intended as a vehicle for trading in the futures, commodity options or swaps markets. With respect to the Fund, the investment manager has claimed an exclusion from the definition of “commodity pool operator” (CPO) under the Commodity Exchange Act (CEA) and the rules of the Commodity Futures Trading Commission (CFTC) and, therefore, is not subject to CFTC registration or regulation as a CPO. In addition, the investment manager is relying upon a related exclusion from the definition of “commodity trading advisor” (CTA) under the CEA and the rules of the CFTC.
As of January 1, 2013, the terms of the CPO exclusion require the Fund, among other things, to adhere to certain limits on its investments in futures, commodity options, swaps and non-deliverable foreign currency forwards (used for purposes other than bona fide hedging). Because the investment manager and the Fund intend to comply with the terms of the CPO exclusion, the Fund may need to adjust its investment strategies to limit its investments in these types of instruments. The CFTC has neither reviewed nor approved the investment manager’s reliance on these exclusions, or the Fund, its investment strategies or this statement of additional information.
Please keep this supplement for future reference
SAI-1
FRANKLIN FLEX CAP GROWTH SECURITIES FUND
This annual report for Franklin Flex Cap Growth Securities Fund covers the fiscal year ended December 31, 2012.
Performance Summary as of 12/31/12
Average annual total return of Class 2 shares* represents the average annual change in value, assuming reinvestment of dividends and capital gains. Average returns smooth out variations in returns, which can be significant; they are not the same as year-by-year results.
Periods ended 12/31/12
| | | | | | | | | | | | |
| | | 1-Year | | | 5-Year | | | Since Inception
(3/1/05) | |
Average Annual Total Return | | | +9.26% | | | | +0.78% | | | | +3.66% | |
*The investment manager and administrator have contractually agreed to waive or assume certain expenses so that common expenses of the Fund (excluding Rule 12b-1 fees and acquired fund fees and expenses) do not exceed 0.68% (other than certain nonroutine expenses) until 4/30/13. Fund investment results reflect the expense reduction, without which the results would have been lower.
Total Return Index Comparison for a Hypothetical $10,000 Investment (3/1/05–12/31/12)
The graph below shows the change in value of a hypothetical $10,000 investment in the Fund over the indicated period and includes reinvestment of any income or distributions. The Fund’s performance* is compared to the performance of the Russell 1000® Growth Index and the Russell 3000® Growth Index. One cannot invest directly in an index, and an index is not representative of the Fund’s portfolio. Please see Important Notes to Performance Information preceding the Fund Summaries.
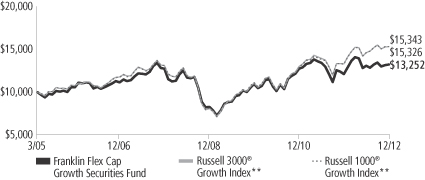
**Source: © 2013 Morningstar. Please see Index Descriptions following the Fund Summaries.
Franklin Flex Cap Growth Securities Fund – Class 2
Performance reflects the Fund’s Class 2 operating expenses, but does not include any contract fees, expenses or sales charges. If they had been included, performance would be lower. These charges and deductions, particularly for variable life policies, can have a significant effect on contract values and insurance benefits. See the contract prospectus for a complete description of these expenses, including sales charges.
Performance data represent past performance, which does not guarantee future results. Investment return and principal value will fluctuate, and you may have a gain or loss when you sell your shares.
Current performance may differ from figures shown.
FFC-1
Fund Goal and Main Investments: Franklin Flex Cap Growth Securities Fund seeks capital appreciation. Under normal market conditions, the Fund invests predominantly in equity securities of companies that the investment manager believes have the potential for capital appreciation.
Performance Overview
You can find the Fund’s one-year total return in the Performance Summary. The Fund underperformed the Russell 1000® Growth Index, which posted a +15.26% total return, and the Russell 3000® Growth Index, which generated a +15.21% total return, for the same period.1
Economic and Market Overview
The U.S. economy, as measured by gross domestic product, grew moderately in 2012, supported by positive construction, housing and labor market trends. U.S. home prices increased in most regions due to higher demand based on near to record-low mortgage rates, affordable housing prices, low new-home inventories and a five-year low in U.S. foreclosures. Home construction became a leading source of economic growth after reaching a multi-year high in 2012, further enhancing confidence in the housing market. Consumer spending and personal income levels climbed, and inflation was generally mild with the exception of energy and food prices. Consumer sentiment reached its highest level in five years, although the potential U.S. tax hikes and spending cuts scheduled to take effect in 2013 dampened confidence near year-end. Nevertheless, the federal budget deficit for fiscal year 2012 fell to its lowest level since 2008. Just after year-end, Congress passed compromise legislation that preserved lower income tax rates for most U.S. households and delayed far-reaching federal spending cuts.
For the 12-month period, U.S. stocks, as measured by the Standard & Poor’s® 500 Index (S&P 500®), fluctuated as investors reacted to news headlines and shifted between risk taking and risk aversion.2 Toward period-end uncertainty eased surrounding the European fiscal crisis as leaders made progress on economic reforms and management of Greek debt, but slowing economic growth in Asia, particularly China, curbed global economic recovery and markets. In its December meeting, the Federal Open Market Committee (FOMC) announced a 6.5% unemployment target as a guide to maintaining the historically low federal
1. Source: © 2013 Morningstar. One cannot invest directly in an index, and an index is not representative of the Fund’s portfolio. Please see Index Descriptions following the Fund Summaries.
2. Please see Index Descriptions following the Fund Summaries.
Fund Risks: All investments involve risks, including possible loss of principal. Investors should be comfortable with fluctuations in the value of their investments, as small- and midsized-company stocks can be volatile, especially over the short term. Smaller, midsized and relatively new or unseasoned companies can be particularly sensitive to changing economic conditions, and their prospects for growth are less certain than those of larger, more established companies. The Fund may focus on particular sectors of the market from time to time, which can carry greater risks of adverse developments in such sectors. The Fund is actively managed but there is no guarantee that the manager’s investment decisions will produce the desired results. The Fund’s prospectus also includes a description of the main investment risks.
FFC-2
funds target rate. The FOMC also said it intended to continue purchasing longer term Treasuries and agency mortgage-backed securities. Despite modest third-quarter U.S. company revenues suggesting a drop in global demand, a hard-fought national election and budget deadline concerns, domestic stock markets made strong gains for the year. Value stocks generally outperformed growth stocks, and all sectors generated positive returns, as represented by the S&P 500. Not all investors favored stocks, however, and many sought perceived safe havens such as gold bullion, the Japanese yen and U.S. Treasuries. By year-end, the yield on the 10-year U.S. Treasury note declined to 1.78% from 1.89% at the beginning of 2012.
Investment Strategy
We use fundamental, bottom-up research to seek companies meeting our criteria of growth potential, quality and valuation. In seeking sustainable growth characteristics, we look for companies we believe can produce sustainable earnings and cash flow growth, evaluating the long-term market opportunity and competitive structure of an industry to target leaders and emerging leaders. We define quality companies as those with strong and improving competitive positions in attractive markets. We also believe important attributes of quality are experienced and talented management teams as well as financial strength reflected in the capital structure, gross and operating margins, free cash flow generation and returns on capital employed. Our valuation analysis includes a range of potential outcomes based on an assessment of multiple scenarios. In assessing value, we consider whether security prices fully reflect the balance of the sustainable growth opportunities relative to business and financial risks.
Manager’s Discussion
During the 12 months under review, nearly all sectors represented in the Fund’s portfolio delivered positive returns as the broad stock market rallied. Relative to the Russell 3000® Growth Index, underweighting in consumer staples and overweighting in financials contributed to performance.3 Whole Foods Market was a key contributor in the consumer staples sector as its share price reached a multi-year high during the period. With what we regard as a strong balance sheet and steady free cash flow, the natural and organic foods supermarket chain operator continued to have healthy sales momentum and
3. The consumer staples sector comprises food and staples retailing; and food, beverage and tobacco in the SOI. The financials sector comprises banks, diversified financials, insurance and real estate in the SOI.
FFC-3
earnings growth as it opened new stores throughout the country and reportedly improved its pricing position through private label expansion. A notable contributor in the financials sector was real estate investment trust American Tower, a leading broadcast and cellphone tower owner and operator. Its share price reached an all-time high during the period as it generated strong revenue growth amid robust demand for broadband data services in the U.S. and other markets, attributable mostly to growing smartphone and tablet use. With a balance sheet we see as strong and long-term leasing agreements with its top four U.S. customers, American Tower seeks to support future growth by constructing and acquiring new sites. Key individual contributors to relative performance included non-fiction media and entertainment firm Discovery Communications, world-leading payments technology company Visa, and cloud computing and social enterprise solutions provider salesforce.com. Discovery Communications, which owns and operates numerous networks in the U.S., including the Discovery Channel, the Learning Channel and Animal Planet, reported strong operating results during the period, driven largely by U.S. market share growth, new hit shows and increased penetration of global pay-television platforms. Visa continued to generate better-than-expected earnings resulting from consumers’ transition from cash and checks to electronic payments, improved consumer spending in the second half of 2012 and a tax-related benefit. The company projected double-digit revenue growth for fiscal year 2013 and announced a $1.5 billion Class A share buyback program that is set to be in place through October 2013. Salesforce.com has exhibited solid revenue growth and improving profit margins in recent quarters as more customers shifted to social and mobile cloud computing.
In contrast, major detractors from the Fund’s relative performance included stock selection in the energy and materials sectors. In the energy sector, oil and gas company SM Energy and onshore rig-based well services contractor Key Energy Services hurt relative results.4 Uncertainty about the global economy contributed to a risk-averse environment and led investors to avoid oil-focused, higher growth oil and gas exploration and production companies such as SM Energy. Key Energy Services lost value as declining activity in the natural gas markets and pricing pressure in the oil markets hurt demand for the company’s services. In the materials sector, our position in technology
4. Sold by period-end.
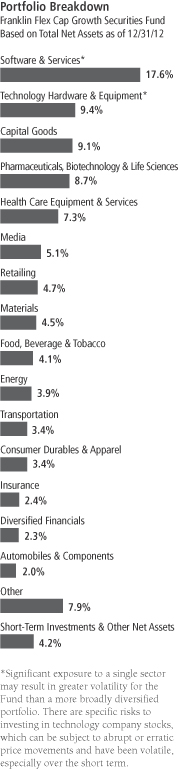
Top 10 Holdings
Franklin Flex Cap Growth Securities Fund
12/31/12
| | | | |
Company
Sector/Industry | | % of Total
Net Assets | |
| Apple Inc. | | | 3.8% | |
| Technology Hardware & Equipment | | | | |
| Visa Inc., A | | | 2.0% | |
| Software & Services | | | | |
| MasterCard Inc., A | | | 2.0% | |
| Software & Services | | | | |
| Ecolab Inc. | | | 1.9% | |
| Materials | | | | |
| Praxair Inc. | | | 1.7% | |
| Materials | | | | |
| American Tower Corp. | | | 1.7% | |
| Real Estate | | | | |
| QUALCOMM Inc. | | | 1.7% | |
| Technology Hardware & Equipment | | | | |
| Google Inc., A | | | 1.6% | |
| Software & Services | | | | |
| Watson Pharmaceuticals Inc. | | | 1.6% | |
| Pharmaceuticals, Biotechnology & Life Sciences | |
| Kansas City Southern | | | 1.6% | |
| Transportation | | | | |
The dollar value, number of shares or principal amount, and names of all portfolio holdings are listed in the Fund’s Statement of Investments (SOI).
FFC-4
and specialty materials company Celanese4 and off-benchmark allocation to Canada-based Goldcorp, one of the world’s leading gold producers, hampered relative results. Celanese’s revenue was negatively affected largely by lower volumes and pricing in some of its business segments. Goldcorp reported solid revenue and earnings results during the period, but its share price tumbled partly because of its July announcement of lower 2012 gold output projection. The decline in the company’s share price for the year, however, was largely in line with the stocks of many gold miners, which were pressured by higher production costs and investor concerns about the risk of nationalization and regulatory changes in certain countries. In addition, data integration software and services firm Informatica and information technology services company ServiceSource International lost value and weighed on the Fund’s results.4
Thank you for your participation in Franklin Flex Cap Growth Securities Fund. We look forward to serving your future investment needs.
The foregoing information reflects our analysis, opinions and portfolio holdings as of December 31, 2012, the end of the reporting period. The way we implement our main investment strategies and the resulting portfolio holdings may change depending on factors such as market and economic conditions. These opinions may not be relied upon as investment advice or an offer for a particular security. The information is not a complete analysis of every aspect of any market, country, industry, security or the Fund. Statements of fact are from sources considered reliable, but the investment manager makes no representation or warranty as to their completeness or accuracy. Although historical performance is no guarantee of future results, these insights may help you understand our investment management philosophy.
FFC-5
Fund Expenses
As an investor in a variable insurance contract (Contract) that indirectly provides for investment in an underlying mutual fund, you can incur transaction and/or ongoing expenses at both the Fund level and the Contract level.
| • | | Transaction expenses can include sales charges (loads) on purchases, redemption fees, surrender fees, transfer fees and premium taxes. |
| • | | Ongoing expenses can include management fees, distribution and service (12b-1) fees, contract fees, annual maintenance fees, mortality and expense risk fees and other fees and expenses. All mutual funds and Contracts have some types of ongoing expenses. |
The expenses shown in the table are meant to highlight ongoing expenses at the Fund level only and do not include ongoing expenses at the Contract level, or transaction expenses at either the Fund or Contract level. While the Fund does not have transaction expenses, if the transaction and ongoing expenses at the Contract level were included, the expenses shown below would be higher. You should consult your Contract prospectus or disclosure document for more information.
The table shows Fund-level ongoing expenses and can help you understand these expenses and compare them with those of other mutual funds offered through the Contract. The table assumes a $1,000 investment held for the six months indicated. Please refer to the Fund prospectus for additional information on operating expenses.
Actual Fund Expenses
The first line (Actual) of the table provides actual account values and expenses. The “Ending Account Value” is derived from the Fund’s actual return, which includes the effect of ongoing Fund expenses, but does not include the effect of ongoing Contract expenses.
You can estimate the Fund-level expenses you incurred during the period by following these steps. Of course, your account value and expenses will differ from those in this illustration:
| 1. | Divide your account value by $1,000. |
If an account had an $8,600 value, then $8,600 ÷ $1,000 = 8.6.
| 2. | Multiply the result by the number under the heading “Fund-Level Expenses Incurred During Period.” |
If Fund-Level Expenses Incurred During Period were $7.50, then 8.6 x $7.50 = $64.50.
In this illustration, the estimated expenses incurred this period at the Fund level are $64.50.
Franklin Flex Cap Growth Securities Fund – Class 2
FFC-6
Hypothetical Example for Comparison with Other Mutual Funds
Information in the second line (Hypothetical) of the table can help you compare ongoing expenses of the Fund with those of other mutual funds offered through the Contract. This information may not be used to estimate the actual ending account balance or expenses you incurred during the period. The hypothetical “Ending Account Value” is based on the Fund’s actual expense ratio and an assumed 5% annual rate of return before expenses, which does not represent the Fund’s actual return. The figure under the heading “Fund-Level Expenses Incurred During Period” shows the hypothetical expenses your account would have incurred under this scenario. You can compare this figure with the 5% hypothetical examples that appear in shareholder reports of other funds offered through a Contract.
| | | | | | | | | | | | |
| Class 2 | | Beginning
Account Value 7/1/12 | | | Ending
Account Value 12/31/12 | | | Fund-Level Expenses Incurred
During Period* 7/1/12–12/31/12 | |
Actual | | $ | 1,000 | | | $ | 1,013.00 | | | $ | 4.71 | |
Hypothetical (5% return
before expenses) | | $ | 1,000 | | | $ | 1,020.46 | | | $ | 4.72 | |
*Expenses are calculated using the most recent six-month annualized expense ratio, net of expense waivers, for the Fund’s Class 2 shares (0.93%), which does not include any ongoing expenses of the Contract for which the Fund is an investment option, multiplied by the average account value over the period, multiplied by 184/366 to reflect the one-half year period.
FFC-7
Franklin Templeton Variable Insurance Products Trust
Financial Highlights
Franklin Flex Cap Growth Securities Fund
| | | | | | | | | | | | | | | | | | | | |
| | | Year Ended December 31, | |
| Class 2 | | 2012 | | | 2011 | | | 2010 | | | 2009 | | | 2008 | |
| | | | |
Per share operating performance | | | | | | | | | | | | | | | | | | | | |
(for a share outstanding throughout the year) | | | | | | | | | | | | | | | | | | | | |
Net asset value, beginning of year | | $ | 12.09 | | | $ | 12.70 | | | $ | 10.93 | | | $ | 8.22 | | | $ | 12.72 | |
| | | | |
Income from investment operationsa: | | | | | | | | | | | | | | | | | | | | |
Net investment income (loss)b | | | 0.01 | | | | (0.02 | ) | | | (0.02 | ) | | | (— | )c | | | — | c |
Net realized and unrealized gains (losses) | | | 1.11 | | | | (0.59 | ) | | | 1.79 | | | | 2.71 | | | | (4.49 | ) |
| | | | |
Total from investment operations | | | 1.12 | | | | (0.61 | ) | | | 1.77 | | | | 2.71 | | | | (4.49 | ) |
| | | | |
Less distributions from net investment income | | | — | | | | — | | | | — | | | | — | | | | (0.01 | ) |
| | | | |
Net asset value, end of year | | $ | 13.21 | | | $ | 12.09 | | | $ | 12.70 | | | $ | 10.93 | | | $ | 8.22 | |
| | | | |
| | | | | |
Total returnd | | | 9.26% | | | | (4.80)% | | | | 16.19% | | | | 32.97% | | | | (35.31)% | |
Ratios to average net assets | | | | | | | | | | | | | | | | | | | | |
Expenses before waiver and payments by affiliates | | | 1.18% | | | | 1.16% | | | | 1.18% | | | | 1.19% | | | | 1.21% | |
Expenses net of waiver and payments by affiliates | | | 0.93% | | | | 0.93% | | | | 0.93% | | | | 0.93% | e | | | 0.93% | |
Net investment income (loss) | | | 0.09% | | | | (0.14)% | | | | (0.17)% | | | | (0.01)% | | | | 0.04% | |
| | | | | |
Supplemental data | | | | | | | | | | | | | | | | | | | | |
Net assets, end of year (000’s) | | $ | 159,122 | | | $ | 188,527 | | | $ | 227,774 | | | $ | 244,768 | | | $ | 195,425 | |
Portfolio turnover rate | | | 43.50% | | | | 63.99% | | | | 60.00% | | | | 33.64% | | | | 32.76% | |
aThe amount shown for a share outstanding throughout the period may not correlate with the Statement of Operations for the period due to the timing of sales and repurchases of the Fund shares in relation to income earned and/or fluctuating market value of the investments of the Fund.
bBased on average daily shares outstanding.
cAmount rounds to less than $0.01 per share.
dTotal return does not include fees, charges or expenses imposed by the variable annuity and life insurance contracts for which the Franklin Templeton Variable Insurance Products Trust serves as an underlying investment vehicle.
eBenefit of expense reduction rounds to less than 0.01%.
The accompanying notes are an integral part of these financial statements.
FFC-8
Franklin Templeton Variable Insurance Products Trust
Financial Highlights (continued)
Franklin Flex Cap Growth Securities Fund
| | | | | | | | | | | | | | | | | | | | |
| | | Year Ended December 31, | |
| Class 4 | | 2012 | | | 2011 | | | 2010 | | | 2009 | | | 2008a | |
| | | | |
Per share operating performance | | | | | | | | | | | | | | | | | | | | |
(for a share outstanding throughout the year) | | | | | | | | | | | | | | | | | | | | |
Net asset value, beginning of year | | $ | 12.01 | | | $ | 12.63 | | | $ | 10.88 | | | $ | 8.21 | | | $ | 11.22 | |
| | | | |
Income from investment operationsb: | | | | | | | | | | | | | | | | | | | | |
Net investment income (loss)c | | | (— | )d | | | (0.03 | ) | | | (0.03 | ) | | | (0.01 | ) | | | — | d |
Net realized and unrealized gains (losses) | | | 1.11 | | | | (0.59 | ) | | | 1.78 | | | | 2.69 | | | | (2.98 | ) |
| | | | |
Total from investment operations | | | 1.11 | | | | (0.62 | ) | | | 1.75 | | | | 2.68 | | | | (2.98 | ) |
| | | | |
Less distributions from net investment income | | | — | | | | — | | | | — | | | | (0.01 | ) | | | (0.03 | ) |
| | | | |
Net asset value, end of year | | $ | 13.12 | | | $ | 12.01 | | | $ | 12.63 | | | $ | 10.88 | | | $ | 8.21 | |
| | | | |
| | | | | |
Total returne | | | 9.24% | | | | (4.91)% | | | | 16.08% | | | | 32.69% | | | | (26.68)% | |
Ratios to average net assetsf | | | | | | | | | | | | | | | | | | | | |
Expenses before waiver and payments by affiliates | | | 1.28% | | | | 1.26% | | | | 1.28% | | | | 1.29% | | | | 1.31% | |
Expenses net of waiver and payments by affiliates | | | 1.03% | | | | 1.03% | | | | 1.03% | | | | 1.03% | g | | | 1.03% | |
Net investment income (loss) | | | (0.01)% | | | | (0.24)% | | | | (0.27)% | | | | (0.11)% | | | | (0.06)% | |
| | | | | |
Supplemental data | | | | | | | | | | | | | | | | | | | | |
Net assets, end of year (000’s) | | $ | 216,607 | | | $ | 270,598 | | | $ | 263,746 | | | $ | 218,798 | | | $ | 50,268 | |
Portfolio turnover rate | | | 43.50% | | | | 63.99% | | | | 60.00% | | | | 33.64% | | | | 32.76% | |
aFor the period February 29, 2008 (effective date) to December 31, 2008.
bThe amount shown for a share outstanding throughout the period may not correlate with the Statement of Operations for the period due to the timing of sales and repurchases of the Fund shares in relation to income earned and/or fluctuating market value of the investments of the Fund.
cBased on average daily shares outstanding.
dAmount rounds to less than $0.01 per share.
eTotal return does not include fees, charges or expenses imposed by the variable annuity and life insurance contracts for which the Franklin Templeton Variable Insurance Products Trust serves as an underlying investment vehicle. Total return is not annualized for periods less than one year.
fRatios are annualized for periods less than one year.
gBenefit of expense reduction rounds to less than 0.01%.
The accompanying notes are an integral part of these financial statements.
FFC-9
Franklin Templeton Variable Insurance Products Trust
Statement of Investments, December 31, 2012
| | | | | | | | |
| Franklin Flex Cap Growth Securities Fund | | Shares | | | Value | |
Common Stocks 95.8% | | | | | | | | |
Automobiles & Components 2.0% | | | | | | | | |
aBorgWarner Inc. | | | 55,000 | | | $ | 3,939,100 | |
Johnson Controls Inc. | | | 95,000 | | | | 2,916,500 | |
aTesla Motors Inc. | | | 22,000 | | | | 745,140 | |
| | | | | | | | |
| | | | | | | 7,600,740 | |
| | | | | | | | |
Banks 1.7% | | | | | | | | |
aSignature Bank | | | 50,000 | | | | 3,567,000 | |
Wells Fargo & Co. | | | 84,720 | | | | 2,895,730 | |
| | | | | | | | |
| | | | | | | 6,462,730 | |
| | | | | | | | |
Capital Goods 9.1% | | | | | | | | |
Danaher Corp. | | | 80,000 | | | | 4,472,000 | |
Fastenal Co. | | | 80,000 | | | | 3,735,200 | |
Honeywell International Inc. | | | 18,000 | | | | 1,142,460 | |
The Manitowoc Co. Inc. | | | 125,000 | | | | 1,960,000 | |
Pall Corp. | | | 60,000 | | | | 3,615,600 | |
Precision Castparts Corp. | | | 25,000 | | | | 4,735,500 | |
Rockwell Automation Inc. | | | 27,500 | | | | 2,309,725 | |
Roper Industries Inc. | | | 27,500 | | | | 3,065,700 | |
TransDigm Group Inc. | | | 22,000 | | | | 2,999,920 | |
aUnited Rentals Inc. | | | 23,000 | | | | 1,046,960 | |
United Technologies Corp. | | | 60,000 | | | | 4,920,600 | |
| | | | | | | | |
| | | | | | | 34,003,665 | |
| | | | | | | | |
Commercial & Professional Services 1.0% | | | | | | | | |
aStericycle Inc. | | | 41,000 | | | | 3,824,070 | |
| | | | | | | | |
Consumer Durables & Apparel 3.4% | | | | | | | | |
aLululemon Athletica Inc. (Canada) | | | 35,000 | | | | 2,668,050 | |
NIKE Inc., B | | | 45,000 | | | | 2,322,000 | |
Ralph Lauren Corp. | | | 28,000 | | | | 4,197,760 | |
aUnder Armour Inc., A | | | 73,550 | | | | 3,569,381 | |
| | | | | | | | |
| | | | | | | 12,757,191 | |
| | | | | | | | |
Consumer Services 0.5% | | | | | | | | |
aChipotle Mexican Grill Inc. | | | 6,000 | | | | 1,784,760 | |
| | | | | | | | |
Diversified Financials 2.3% | | | | | | | | |
BlackRock Inc. | | | 10,870 | | | | 2,246,938 | |
aIntercontinentalExchange Inc. | | | 19,770 | | | | 2,447,723 | |
T. Rowe Price Group Inc. | | | 60,000 | | | | 3,907,800 | |
| | | | | | | | |
| | | | | | | 8,602,461 | |
| | | | | | | | |
Energy 3.9% | | | | | | | | |
Chevron Corp. | | | 50,000 | | | | 5,407,000 | |
aFMC Technologies Inc. | | | 35,000 | | | | 1,499,050 | |
National Oilwell Varco Inc. | | | 27,000 | | | | 1,845,450 | |
Schlumberger Ltd. | | | 48,000 | | | | 3,325,920 | |
aWhiting Petroleum Corp. | | | 59,980 | | | | 2,601,333 | |
| | | | | | | | |
| | | | | | | 14,678,753 | |
| | | | | | | | |
Food & Staples Retailing 1.4% | | | | | | | | |
Whole Foods Market Inc. | | | 57,920 | | | | 5,289,834 | |
| | | | | | | | |
Food, Beverage & Tobacco 4.1% | | | | | | | | |
The Coca-Cola Co. | | | 145,580 | | | | 5,277,275 | |
Mead Johnson Nutrition Co., A | | | 30,000 | | | | 1,976,700 | |
FFC-10
Franklin Templeton Variable Insurance Products Trust
Statement of Investments, December 31, 2012 (continued)
| | | | | | | | |
| Franklin Flex Cap Growth Securities Fund | | Shares | | | Value | |
Common Stocks (continued) | | | | | | | | |
Food, Beverage & Tobacco (continued) | | | | | | | | |
PepsiCo Inc. | | | 78,000 | | | $ | 5,337,540 | |
aWhiteWave Foods Co., A | | | 170,000 | | | | 2,641,800 | |
| | | | | | | | |
| | | | | | | 15,233,315 | |
| | | | | | | | |
Health Care Equipment & Services 7.3% | | | | | | | | |
Abbott Laboratories | | | 82,630 | | | | 5,412,265 | |
aCerner Corp. | | | 58,000 | | | | 4,503,120 | |
aDaVita HealthCare Partners Inc. | | | 26,000 | | | | 2,873,780 | |
aEdwards Lifesciences Corp. | | | 27,000 | | | | 2,434,590 | |
aExpress Scripts Holding Co. | | | 66,410 | | | | 3,586,140 | |
aHeartWare International Inc. | | | 9,000 | | | | 755,550 | |
aIDEXX Laboratories Inc. | | | 26,000 | | | | 2,412,800 | |
aIntuitive Surgical Inc. | | | 5,400 | | | | 2,647,998 | |
McKesson Corp. | | | 28,000 | | | | 2,714,880 | |
| | | | | | | | |
| | | | | | | 27,341,123 | |
| | | | | | | | |
Insurance 2.4% | | | | | | | | |
ACE Ltd. | | | 55,000 | | | | 4,389,000 | |
Aflac Inc. | | | 90,000 | | | | 4,780,800 | |
| | | | | | | | |
| | | | | | | 9,169,800 | |
| | | | | | | | |
Materials 4.5% | | | | | | | | |
Airgas Inc. | | | 18,000 | | | | 1,643,220 | |
Ecolab Inc. | | | 100,000 | | | | 7,190,000 | |
Goldcorp Inc. (Canada) | | | 41,000 | | | | 1,504,700 | |
Praxair Inc. | | | 60,000 | | | | 6,567,000 | |
| | | | | | | | |
| | | | | | | 16,904,920 | |
| | | | | | | | |
Media 5.1% | | | | | | | | |
aDIRECTV | | | 75,000 | | | | 3,762,000 | |
aDiscovery Communications Inc., C | | | 93,500 | | | | 5,469,750 | |
Time Warner Cable Inc. | | | 51,000 | | | | 4,956,690 | |
The Walt Disney Co. | | | 97,500 | | | | 4,854,525 | |
| | | | | | | | |
| | | | | | | 19,042,965 | |
| | | | | | | | |
Pharmaceuticals, Biotechnology & Life Sciences 8.7% | | | | | | | | |
Allergan Inc. | | | 55,000 | | | | 5,045,150 | |
aBiogen Idec Inc. | | | 31,500 | | | | 4,620,105 | |
aCelgene Corp. | | | 50,000 | | | | 3,936,000 | |
Merck & Co. Inc. | | | 105,000 | | | | 4,298,700 | |
Novo Nordisk AS, ADR (Denmark) | | | 15,700 | | | | 2,562,397 | |
aOnyx Pharmaceuticals Inc. | | | 22,000 | | | | 1,661,660 | |
Perrigo Co. | | | 16,500 | | | | 1,716,495 | |
aWaters Corp. | | | 32,000 | | | | 2,787,840 | |
aWatson Pharmaceuticals Inc. | | | 70,000 | | | | 6,020,000 | |
| | | | | | | | |
| | | | | | | 32,648,347 | |
| | | | | | | | |
Real Estate 1.7% | | | | | | | | |
American Tower Corp. | | | 82,000 | | | | 6,336,140 | |
| | | | | | | | |
Retailing 4.7% | | | | | | | | |
aAmazon.com Inc. | | | 15,000 | | | | 3,767,100 | |
Dick’s Sporting Goods Inc. | | | 83,380 | | | | 3,792,956 | |
aDollar General Corp. | | | 99,520 | | | | 4,387,837 | |
aPriceline.com Inc. | | | 3,000 | | | | 1,863,600 | |
FFC-11
Franklin Templeton Variable Insurance Products Trust
Statement of Investments, December 31, 2012 (continued)
| | | | | | | | |
| Franklin Flex Cap Growth Securities Fund | | Shares | | | Value | |
Common Stocks (continued) | | | | | | | | |
Retailing (continued) | | | | | | | | |
Tractor Supply Co. | | | 22,500 | | | $ | 1,988,100 | |
Ulta Salon Cosmetics & Fragrance Inc. | | | 19,660 | | | | 1,931,791 | |
| | | | | | | | |
| | | | | | | 17,731,384 | |
| | | | | | | | |
Semiconductors & Semiconductor Equipment 1.6% | | | | | | | | |
Microchip Technology Inc. | | | 87,500 | | | | 2,851,625 | |
Xilinx Inc. | | | 92,500 | | | | 3,320,750 | |
| | | | | | | | |
| | | | | | | 6,172,375 | |
| | | | | | | | |
Software & Services 17.6% | | | | | | | | |
aANSYS Inc. | | | 40,000 | | | | 2,693,600 | |
aBottomline Technologies Inc. | | | 65,000 | | | | 1,715,350 | |
aBroadsoft Inc. | | | 23,000 | | | | 835,590 | |
aCognizant Technology Solutions Corp., A | | | 35,000 | | | | 2,591,750 | |
aeBay Inc. | | | 90,000 | | | | 4,591,800 | |
aFacebook Inc., A | | | 35,000 | | | | 932,050 | |
FactSet Research Systems Inc. | | | 15,000 | | | | 1,320,900 | |
aFortinet Inc. | | | 75,000 | | | | 1,580,250 | |
aGoogle Inc., A | | | 8,700 | | | | 6,171,519 | |
International Business Machines Corp. | | | 28,500 | | | | 5,459,175 | |
aLinkedIn Corp., A | | | 18,500 | | | | 2,124,170 | |
MasterCard Inc., A | | | 14,960 | | | | 7,349,549 | |
aNuance Communications Inc. | | | 130,000 | | | | 2,901,600 | |
Oracle Corp. | | | 168,360 | | | | 5,609,755 | |
aRed Hat Inc. | | | 55,000 | | | | 2,912,800 | |
aSalesforce.com Inc. | | | 24,750 | | | | 4,160,475 | |
aVantiv Inc., A | | | 110,000 | | | | 2,246,200 | |
Visa Inc., A | | | 50,000 | | | | 7,579,000 | |
aVMware Inc., A | | | 33,500 | | | | 3,153,690 | |
| | | | | | | | |
| | | | | | | 65,929,223 | |
| | | | | | | | |
Technology Hardware & Equipment 9.4% | | | | | | | | |
aAcme Packet Inc. | | | 105,000 | | | | 2,322,600 | |
Apple Inc. | | | 27,000 | | | | 14,391,810 | |
aEMC Corp. | | | 145,000 | | | | 3,668,500 | |
aF5 Networks Inc. | | | 18,000 | | | | 1,748,700 | |
National Instruments Corp. | | | 70,000 | | | | 1,806,700 | |
QUALCOMM Inc. | | | 100,000 | | | | 6,202,000 | |
aTrimble Navigation Ltd. | | | 87,000 | | | | 5,200,860 | |
| | | | | | | | |
| | | | | | | 35,341,170 | |
| | | | | | | | |
Transportation 3.4% | | | | | | | | |
Expeditors International of Washington Inc. | | | 45,000 | | | | 1,779,750 | |
aGenesee & Wyoming Inc. | | | 25,000 | | | | 1,902,000 | |
aHub Group Inc., A | | | 80,000 | | | | 2,688,000 | |
Kansas City Southern | | | 70,000 | | | | 5,843,600 | |
aSpirit Airlines Inc. | | | 40,000 | | | | 708,800 | |
| | | | | | | | |
| | | | | | | 12,922,150 | |
| | | | | | | | |
Total Common Stocks (Cost $258,101,222) | | | | | | | 359,777,116 | |
| | | | | | | | |
FFC-12
Franklin Templeton Variable Insurance Products Trust
Statement of Investments, December 31, 2012 (continued)
| | | | | | | | |
| Franklin Flex Cap Growth Securities Fund | | Shares | | | Value | |
Short Term Investments (Cost $8,924,062) 2.3% | | | | | | | | |
Money Market Funds 2.3% | | | | | | | | |
a,bInstitutional Fiduciary Trust Money Market Portfolio | | | 8,924,062 | | | $ | 8,924,062 | |
| | | | | | | | |
Total Investments (Cost $267,025,284) 98.1% | | | | | | | 368,701,178 | |
Other Assets, less Liabilities 1.9% | | | | | | | 7,028,487 | |
| | | | | | | | |
Net Assets 100.0% | | | | | | $ | 375,729,665 | |
| | | | | | | | |
See Abbreviations on page FFC-22.
aNon-income producing.
bSee Note 7 regarding investments in the Institutional Fiduciary Trust Money Market Portfolio.
The accompanying notes are an integral part of these financial statements.
FFC-13
Franklin Templeton Variable Insurance Products Trust
Financial Statements
Statement of Assets and Liabilities
December 31, 2012
| | | | |
| | | Franklin Flex
Cap Growth
Securities Fund | |
Assets: | | | | |
Investments in securities: | | | | |
Cost - Unaffiliated issuers | | $ | 258,101,222 | |
Cost - Sweep Money Fund (Note 7) | | | 8,924,062 | |
| | | | |
Total cost of investments | | $ | 267,025,284 | |
| | | | |
Value - Unaffiliated issuers | | $ | 359,777,116 | |
Value - Sweep Money Fund (Note 7) | | | 8,924,062 | |
| | | | |
Total value of investments | | | 368,701,178 | |
Receivables: | | | | |
Capital shares sold | | | 7,706,561 | |
Dividends and interest | | | 116,643 | |
| | | | |
Total assets | | | 376,524,382 | |
| | | | |
Liabilities: | | | | |
Payables: | | | | |
Capital shares redeemed | | | 307,224 | |
Affiliates | | | 394,594 | |
Reports to shareholders | | | 40,156 | |
Accrued expenses and other liabilities | | | 52,743 | |
| | | | |
Total liabilities | | | 794,717 | |
| | | | |
Net assets, at value | | $ | 375,729,665 | |
| | | | |
Net assets consist of: | | | | |
Paid-in capital | | $ | 275,256,502 | |
Undistributed net investment income | | | 170,117 | |
Net unrealized appreciation (depreciation) | | | 101,675,894 | |
Accumulated net realized gain (loss) | | | (1,372,848 | ) |
| | | | |
Net assets, at value | | $ | 375,729,665 | |
| | | | |
Class 2: | | | | |
Net assets, at value | | $ | 159,122,176 | |
| | | | |
Shares outstanding | | | 12,041,563 | |
| | | | |
Net asset value and maximum offering price per share | | $ | 13.21 | |
| | | | |
Class 4: | | | | |
Net assets, at value | | $ | 216,607,489 | |
| | | | |
Shares outstanding | | | 16,509,490 | |
| | | | |
Net asset value and maximum offering price per share | | $ | 13.12 | |
| | | | |
The accompanying notes are an integral part of these financial statements.
FFC-14
Franklin Templeton Variable Insurance Products Trust
Financial Statements (continued)
Statement of Operations
for the year ended December 31, 2012
| | | | |
| | | Franklin Flex
Cap Growth
Securities Fund | |
Investment income: | | | | |
Dividends | | $ | 4,400,656 | |
Income from securities loaned | | | 5,616 | |
| | | | |
Total investment income | | | 4,406,272 | |
| | | | |
Expenses: | | | | |
Management fees (Note 3a) | | | 2,809,593 | |
Administrative fees (Note 3b) | | | 1,084,427 | |
Distribution fees: (Note 3c) | | | | |
Class 2 | | | 456,193 | |
Class 4 | | | 878,858 | |
Unaffiliated transfer agent fees | | | 77 | |
Custodian fees (Note 4) | | | 10,980 | |
Reports to shareholders | | | 86,068 | |
Professional fees | | | 43,514 | |
Trustees’ fees and expenses | | | 1,837 | |
Other | | | 16,983 | |
| | | | |
Total expenses | | | 5,388,530 | |
Expenses waived/paid by affiliates (Note 3e) | | | (1,103,838 | ) |
| | | | |
Net expenses | | | 4,284,692 | |
| | | | |
Net investment income | | | 121,580 | |
| | | | |
Realized and unrealized gains (losses): | | | | |
Net realized gain (loss) from investments | | | 31,233,189 | |
Net change in unrealized appreciation (depreciation) on investments | | | 10,611,218 | |
| | | | |
Net realized and unrealized gain (loss) | | | 41,844,407 | |
| | | | |
Net increase (decrease) in net assets resulting from operations | | $ | 41,965,987 | |
| | | | |
The accompanying notes are an integral part of these financial statements.
FFC-15
Franklin Templeton Variable Insurance Products Trust
Financial Statements (continued)
Statements of Changes in Net Assets
| | | | | | | | |
| | | Franklin Flex Cap Growth
Securities Fund | |
| | | Year Ended December 31, | |
| | | 2012 | | | 2011 | |
| | | | |
Increase (decrease) in net assets: | | | | | | | | |
Operations: | | | | | | | | |
Net investment income (loss) | | $ | 121,580 | | | $ | (951,190 | ) |
Net realized gain (loss) from investments | | | 31,233,189 | | | | 23,226,156 | |
Net change in unrealized appreciation (depreciation) on investments | | | 10,611,218 | | | | (41,102,831 | ) |
| | | | |
Net increase (decrease) in net assets resulting from operations | | | 41,965,987 | | | | (18,827,865 | ) |
| | | | |
Capital share transactions: (Note 2) | | | | | | | | |
Class 2 | | | (46,599,479 | ) | | | (31,049,447 | ) |
Class 4 | | | (78,761,409 | ) | | | 17,482,144 | |
| | | | |
Total capital share transactions | | | (125,360,888 | ) | | | (13,567,303 | ) |
| | | | |
Net increase (decrease) in net assets | | | (83,394,901 | ) | | | (32,395,168 | ) |
Net assets: | | | | | | | | |
Beginning of year | | | 459,124,566 | | | | 491,519,734 | |
| | | | |
End of year | | $ | 375,729,665 | | | $ | 459,124,566 | |
| | | | |
Undistributed net investment income included in net assets: | | | | | | | | |
End of year | | $ | 170,117 | | | $ | — | |
| | | | |
The accompanying notes are an integral part of these financial statements.
FFC-16
Franklin Templeton Variable Insurance Products Trust
Notes to Financial Statements
Franklin Flex Cap Growth Securities Fund
1. ORGANIZATION AND SIGNIFICANT ACCOUNTING POLICIES
Franklin Templeton Variable Insurance Products Trust (Trust) is registered under the Investment Company Act of 1940, as amended, (1940 Act) as an open-end investment company, consisting of twenty separate funds. The Franklin Flex Cap Growth Securities Fund (Fund) is included in this report. The financial statements of the remaining funds in the Trust are presented separately. Shares of the Fund are generally sold only to insurance company separate accounts to fund the benefits of variable life insurance policies or variable annuity contracts. At December 31, 2012, 75.69% of the Fund’s shares were held through one insurance company. Investment activities of these insurance company separate accounts could have a material impact on the Fund. The Fund offers two classes of shares: Class 2 and Class 4. Each class of shares differs by its distribution fees, voting rights on matters affecting a single class and its exchange privilege.
The following summarizes the Fund’s significant accounting policies.
a. Financial Instrument Valuation
The Fund’s investments in financial instruments are carried at fair value daily. Fair value is the price that would be received to sell an asset or paid to transfer a liability in an orderly transaction between market participants on the measurement date. Under procedures approved by the Trust’s Board of Trustees (the Board), the Fund’s administrator, investment manager and other affiliates have formed the Valuation and Liquidity Oversight Committee (VLOC). The VLOC provides administration and oversight of the Fund’s valuation policies and procedures, which are approved annually by the Board. Among other things, these procedures allow the Fund to utilize independent pricing services, quotations from securities and financial instrument dealers, and other market sources to determine fair value.
Equity securities listed on an exchange or on the NASDAQ National Market System are valued at the last quoted sale price or the official closing price of the day, respectively. Foreign equity securities are valued as of the close of trading on the foreign stock exchange on which the security is primarily traded, or the NYSE, whichever is earlier. The value is then converted into its U.S. dollar equivalent at the foreign exchange rate in effect at the close of the NYSE on the day that the value of the security is determined. Over-the-counter (OTC) securities are valued within the range of the most recent quoted bid and ask prices. Securities that trade in multiple markets or on multiple exchanges are valued according to the broadest and most representative market. Certain equity securities are valued based upon fundamental characteristics or relationships to similar securities. Investments in open-end mutual funds are valued at the closing net asset value.
The Fund has procedures to determine the fair value of financial instruments for which market prices are not reliable or readily available. Under these procedures, the VLOC convenes on a regular basis to review such financial instruments and considers a number of factors, including significant unobservable valuation inputs, when arriving at fair value. The VLOC primarily employs a market-based approach which may use related or comparable assets or liabilities, recent transactions, market multiples, book values, and other relevant information for the investment to determine the fair value of the investment. An income-based valuation approach may also be used in which the anticipated future cash flows of the investment are discounted to calculate fair value. Discounts may also be applied due to the nature or duration of any restrictions on the disposition of the investments. Due to the inherent uncertainty of valuations of such investments, the fair values may differ significantly from the values that would have been used had an active market existed. The VLOC employs various methods for calibrating these valuation approaches including a regular review of key inputs and assumptions, transactional back-testing or disposition analysis, and reviews of any related market activity.
Trading in securities on foreign securities stock exchanges and OTC markets may be completed before the daily close of business on the NYSE. Occasionally, events occur between the time at which trading in a foreign security is completed and the close of the NYSE that might call into question the reliability of the value of a portfolio security held by the Fund. As a result, differences may arise between the value of the Fund’s portfolio securities as determined at the foreign market close and the latest indications of value at the close of the NYSE. In order to minimize the potential for these differences, the VLOC monitors price movements following the close of trading in foreign stock markets through a series of country specific market proxies (such as baskets of
FFC-17
Franklin Templeton Variable Insurance Products Trust
Notes to Financial Statements (continued)
Franklin Flex Cap Growth Securities Fund
1. ORGANIZATION AND SIGNIFICANT ACCOUNTING POLICIES (continued)
a. Financial Instrument Valuation (continued)
American Depositary Receipts, futures contracts and exchange traded funds). These price movements are measured against established trigger thresholds for each specific market proxy to assist in determining if an event has occurred that may call into question the reliability of the values of the foreign securities held by the Fund. If such an event occurs, the securities may be valued using fair value procedures, which may include the use of independent pricing services.
b. Securities Lending
The Fund participates in an agency based securities lending program. The Fund receives cash collateral against the loaned securities in an amount equal to at least 102% of the market value of the loaned securities. Collateral is maintained over the life of the loan in an amount not less than 100% of the market value of loaned securities, as determined at the close of fund business each day; any additional collateral required due to changes in security values is delivered to the Fund on the next business day. The Fund receives income from the investment of cash collateral, in addition to lending fees and rebates paid by the borrower. The Fund bears the market risk with respect to the collateral investment, securities loaned, and the risk that the agent may default on its obligations to the Fund. The securities lending agent has agreed to indemnify the Fund in the event of default by a third party borrower. At December 31, 2012, the Fund had no securities on loan.
c. Income and Deferred Taxes
It is the Fund’s policy to qualify as a regulated investment company under the Internal Revenue Code. The Fund intends to distribute to shareholders substantially all of its taxable income and net realized gains to relieve it from federal income and if applicable, excise taxes. As a result, no provision for U.S. federal income taxes is required.
The Fund may be subject to foreign taxation related to income received, capital gains on the sale of securities and certain foreign currency transactions in the foreign jurisdictions in which it invests. Foreign taxes, if any, are recorded based on the tax regulations and rates that exist in the foreign markets in which the Fund invests. When a capital gain tax is determined to apply the Fund records an estimated deferred tax liability in an amount that would be payable if the securities were disposed of on the valuation date.
The Fund recognizes the tax benefits of uncertain tax positions only when the position is “more likely than not” to be sustained upon examination by the tax authorities based on the technical merits of the tax position. As of December 31, 2012, and for all open tax years, the Fund has determined that no liability for unrecognized tax benefits is required in the Fund’s financial statements related to uncertain tax positions taken on a tax return (or expected to be taken on future tax returns). Open tax years are those that remain subject to examination and are based on each tax jurisdiction statute of limitation.
d. Security Transactions, Investment Income, Expenses and Distributions
Security transactions are accounted for on trade date. Realized gains and losses on security transactions are determined on a specific identification basis. Estimated expenses are accrued daily. Dividend income is recorded on the ex-dividend date except that certain dividends from foreign securities are recognized as soon as the Fund is notified of the ex-dividend date. Distributions to shareholders are recorded on the ex-dividend date and are determined according to income tax regulations (tax basis). Distributable earnings determined on a tax basis may differ from earnings recorded in accordance with accounting principles generally accepted in the United States of America. These differences may be permanent or temporary. Permanent differences are reclassified among capital accounts to reflect their tax character. These reclassifications have no impact on net assets or the results of operations. Temporary differences are not reclassified, as they may reverse in subsequent periods.
Common expenses incurred by the Trust are allocated among the funds based on the ratio of net assets of each fund to the combined net assets of the Trust. Fund specific expenses are charged directly to the fund that incurred the expense.
FFC-18
Franklin Templeton Variable Insurance Products Trust
Notes to Financial Statements (continued)
Franklin Flex Cap Growth Securities Fund
1. ORGANIZATION AND SIGNIFICANT ACCOUNTING POLICIES (continued)
d. Security Transactions, Investment Income, Expenses and Distributions (continued)
Realized and unrealized gains and losses and net investment income, not including class specific expenses, are allocated daily to each class of shares based upon the relative proportion of net assets of each class. Differences in per share distributions, by class, are generally due to differences in class specific expenses.
e. Accounting Estimates
The preparation of financial statements in accordance with accounting principles generally accepted in the United States of America requires management to make estimates and assumptions that affect the reported amounts of assets and liabilities at the date of the financial statements and the amounts of income and expenses during the reporting period. Actual results could differ from those estimates.
f. Guarantees and Indemnifications
Under the Trust’s organizational documents, its officers and trustees are indemnified by the Trust against certain liabilities arising out of the performance of their duties to the Trust. Additionally, in the normal course of business, the Trust, on behalf of the Fund, enters into contracts with service providers that contain general indemnification clauses. The Trust’s maximum exposure under these arrangements is unknown as this would involve future claims that may be made against the Trust that have not yet occurred. Currently, the Trust expects the risk of loss to be remote.
2. SHARES OF BENEFICIAL INTEREST
At December 31, 2012, there were an unlimited number of shares authorized (without par value). Transactions in the Fund’s shares were as follows:
| | | | | | | | | | | | | | | | |
| | | Year Ended December 31, | |
| | | 2012 | | | 2011 | |
| Class 2 Shares: | | Shares | | | Amount | | | Shares | | | Amount | |
Shares sold | | | 2,132,121 | | | $ | 28,565,855 | | | | 2,603,604 | | | $ | 32,933,090 | |
Shares redeemed | | | (5,689,199 | ) | | | (75,165,334 | ) | | | (4,943,943 | ) | | | (63,982,537 | ) |
| | | | |
Net increase (decrease) | | | (3,557,078 | ) | | $ | (46,599,479 | ) | | | (2,340,339 | ) | | $ | (31,049,447 | ) |
| | | | |
Class 4 Shares: | | | | | | | | | | | | | | | | |
Shares sold | | | 3,802,626 | | | $ | 49,894,849 | | | | 8,511,819 | | | $ | 106,665,741 | |
Shares redeemed | | | (9,818,530 | ) | | | (128,656,258 | ) | | | (6,865,481 | ) | | | (89,183,597 | ) |
| | | | |
Net increase (decrease) | | | (6,015,904 | ) | | $ | (78,761,409 | ) | | | 1,646,338 | | | $ | 17,482,144 | |
| | | | |
3. TRANSACTIONS WITH AFFILIATES
Franklin Resources, Inc. is the holding company for various subsidiaries that together are referred to as Franklin Templeton Investments. Certain officers and trustees of the Fund are also officers and/or directors of the following subsidiaries:
| | |
| Subsidiary | | Affiliation |
Franklin Advisers, Inc. (Advisers) | | Investment manager |
Franklin Templeton Services, LLC (FT Services) | | Administrative manager |
Franklin Templeton Distributors, Inc. (Distributors) | | Principal underwriter |
Franklin Templeton Investor Services, LLC (Investor Services) | | Transfer agent |
FFC-19
Franklin Templeton Variable Insurance Products Trust
Notes to Financial Statements (continued)
Franklin Flex Cap Growth Securities Fund
3. TRANSACTIONS WITH AFFILIATES (continued)
a. Management Fees
The Fund pays an investment management fee to Advisers based on the average daily net assets of the Fund as follows:
| | |
| Annualized Fee Rate | | Net Assets |
| 0.750% | | Up to and including $100 million |
| 0.650% | | Over $100 million, up to and including $250 million |
| 0.600% | | Over $250 million, up to and including $10 billion |
| 0.550% | | Over $10 billion, up to and including $12.5 billion |
| 0.525% | | Over $12.5 billion, up to and including $15 billion |
| 0.500% | | In excess of $15 billion |
b. Administrative Fees
The Fund pays an administrative fee to FT Services of 0.25% per year of the average daily net assets of the Fund.
c. Distribution Fees
The Board has adopted distribution plans for Class 2 and Class 4 shares pursuant to Rule 12b-1 under the 1940 Act. Under the Fund’s compensation distribution plans, the Fund pays Distributors for costs incurred in connection with the servicing, sale and distribution of the Fund’s shares up to 0.35% per year of its average daily net assets of each class. Some distribution fees are not charged on shares held by affiliates. The Board has agreed to limit the current rate to 0.25% per year for Class 2.
d. Transfer Agent Fees
Investor Services, under terms of an agreement, performs shareholder servicing for the Fund and is not paid by the Fund for the services.
e. Waiver and Expense Reimbursements
FT Services and Advisers have contractually agreed in advance to waive or limit their respective fees and to assume as their own expense certain expenses otherwise payable by the Fund so that the common expenses (i.e. a combination of management fees, administrative fees, and other expenses, but excluding distribution fees, and acquired fund fees and expenses) for each class of the Fund do not exceed 0.68% (other than certain non-routine expenses or costs, including those relating to litigation, indemnification, reorganizations, and liquidations) until April 30, 2013.
4. EXPENSE OFFSET ARRANGEMENT
The Fund has entered into an arrangement with its custodian whereby credits realized as a result of uninvested cash balances are used to reduce a portion of the Fund’s custodian expenses. During the year ended December 31, 2012, there were no credits earned.
5. INCOME TAXES
For tax purposes, capital losses may be carried over to offset future capital gains, if any. Capital loss carryforwards with no expiration, if any, must be fully utilized before those losses with expiration dates.
During the year ended December 31, 2012, the Fund utilized $30,100,562 of capital loss carryforwards.
FFC-20
Franklin Templeton Variable Insurance Products Trust
Notes to Financial Statements (continued)
Franklin Flex Cap Growth Securities Fund
5. INCOME TAXES (continued)
At December 31, 2012, the cost of investments, net unrealized appreciation (depreciation), and undistributed long term capital gains for income tax purposes were as follows:
| | | | |
Cost of investments | | $ | 269,249,299 | |
| | | | |
| |
Unrealized appreciation | | $ | 103,977,194 | |
Unrealized depreciation | | | (4,525,315 | ) |
| | | | |
Net unrealized appreciation (depreciation) | | $ | 99,451,879 | |
| | | | |
Distributable earnings – undistributed long term capital gains | | $ | 1,021,285 | |
| | | | |
Differences between income and/or capital gains as determined on a book basis and a tax basis are primarily due to differing treatment of wash sales.
6. INVESTMENT TRANSACTIONS
Purchases and sales of investments (excluding short term securities) for the year ended December 31, 2012, aggregated $183,518,456 and $305,345,551, respectively.
7. INVESTMENTS IN INSTITUTIONAL FIDUCIARY TRUST MONEY MARKET PORTFOLIO
The Fund invests in the Institutional Fiduciary Trust Money Market Portfolio (Sweep Money Fund), an open-end investment company managed by Advisers. Management fees paid by the Fund are reduced on assets invested in the Sweep Money Fund, in an amount not to exceed the management and administrative fees paid by the Sweep Money Fund.
8. CREDIT FACILITY
The Fund, together with other U.S. registered and foreign investment funds (collectively, Borrowers), managed by Franklin Templeton Investments, are borrowers in a joint syndicated senior unsecured credit facility totaling $1.5 billion (Global Credit Facility) which matured on January 18, 2013. This Global Credit Facility provides a source of funds to the Borrowers for temporary and emergency purposes, including the ability to meet future unanticipated or unusually large redemption requests. Effective January 18, 2013, the Borrowers renewed the Global Credit Facility which matures on January 17, 2014.
Under the terms of the Global Credit Facility, the Fund shall, in addition to interest charged on any borrowings made by the Fund and other costs incurred by the Fund, pay its share of fees and expenses incurred in connection with the implementation and maintenance of the Global Credit Facility, based upon its relative share of the aggregate net assets of all of the Borrowers, including an annual commitment fee of 0.07% based upon the unused portion of the Global Credit Facility. These fees are reflected in other expenses on the Statement of Operations. During the year ended December 31, 2012, the Fund did not use the Global Credit Facility.
FFC-21
Franklin Templeton Variable Insurance Products Trust
Notes to Financial Statements (continued)
Franklin Flex Cap Growth Securities Fund
9. FAIR VALUE MEASUREMENTS
The Fund follows a fair value hierarchy that distinguishes between market data obtained from independent sources (observable inputs) and the Fund’s own market assumptions (unobservable inputs). These inputs are used in determining the value of the Fund’s financial instruments and are summarized in the following fair value hierarchy:
| | • | | Level 1 – quoted prices in active markets for identical financial instruments |
| | • | | Level 2 – other significant observable inputs (including quoted prices for similar financial instruments, interest rates, prepayment speed, credit risk, etc.) |
| | • | | Level 3 – significant unobservable inputs (including the Fund’s own assumptions in determining the fair value of financial instruments) |
The inputs or methodology used for valuing financial instruments are not an indication of the risk associated with investing in those financial instruments.
For movements between the levels within the fair value hierarchy, the Fund has adopted a policy of recognizing the transfers as of the date of the underlying event which caused the movement.
At December 31, 2012, all of the Fund’s investments in financial instruments carried at fair value were valued using Level 1 inputs. For detailed categories, see the accompanying Statement of Investments.
10. NEW ACCOUNTING PRONOUNCEMENTS
In December 2011, the Financial Accounting Standards Board (FASB) issued Accounting Standards Update (ASU) No. 2011-11, Balance Sheet (Topic 210): Disclosures about Offsetting Assets and Liabilities. The amendments in the ASU enhance disclosures about offsetting of financial assets and liabilities to enable investors to understand the effect of these arrangements on a fund’s financial position. In January 2013, FASB issued ASU No. 2013-01, Balance Sheet (Topic 210): Clarifying the Scope of Disclosures about Offsetting Assets and Liabilities. The amendments in ASU No. 2013-01 clarify the intended scope of disclosures required by ASU No. 2011-11. These ASUs are effective for interim and annual reporting periods beginning on or after January 1, 2013. The Fund believes the adoption of these ASUs will not have a material impact on its financial statements.
11. SUBSEQUENT EVENTS
The Fund has evaluated subsequent events through the issuance of the financial statements and determined that no events have occurred that require disclosure other than those already disclosed in the financial statements.
| | | | |
ABBREVIATIONS | | | | |
| Selected Portfolio | | | | |
| | | | |
| ADR - American Depositary Receipt | | | | |
FFC-22
Franklin Templeton Variable Insurance Products Trust
Franklin Flex Cap Growth Securities Fund
Report of Independent Registered Public Accounting Firm
To the Board of Trustees and Shareholders of
Franklin Templeton Variable Insurance Products Trust
In our opinion, the accompanying statement of assets and liabilities, including the statement of investments, and the related statements of operations and of changes in net assets and the financial highlights present fairly, in all material respects, the financial position of Franklin Flex Cap Growth Securities Fund (the “Fund”) at December 31, 2012, the results of its operations for the year then ended, the changes in its net assets for each of the two years in the period then ended and the financial highlights for the periods presented, in conformity with accounting principles generally accepted in the United States of America. These financial statements and financial highlights (hereafter referred to as “financial statements”) are the responsibility of the Fund’s management. Our responsibility is to express an opinion on these financial statements based on our audits. We conducted our audits of these financial statements in accordance with the standards of the Public Company Accounting Oversight Board (United States). Those standards require that we plan and perform the audit to obtain reasonable assurance about whether the financial statements are free of material misstatement. An audit includes examining, on a test basis, evidence supporting the amounts and disclosures in the financial statements, assessing the accounting principles used and significant estimates made by management, and evaluating the overall financial statement presentation. We believe that our audits, which included confirmation of securities at December 31, 2012 by correspondence with the custodian and transfer agent, provide a reasonable basis for our opinion.
PricewaterhouseCoopers LLP
San Francisco, California
February 15, 2013
FFC-23
FRANKLIN GLOBAL REAL ESTATE SECURITIES FUND
We are pleased to bring you Franklin Global Real Estate Securities Fund’s annual report for the fiscal year ended December 31, 2012.
Performance Summary as of 12/31/12
Average annual total return of Class 2 shares* represents the average annual change in value, assuming reinvestment of dividends and capital gains. Average returns smooth out variations in returns, which can be significant; they are not the same as year-by-year results.
Periods ended 12/31/12
| | | | | | | | | | | | |
| | | 1-Year | | | 5-Year | | | 10-Year | |
Average Annual Total Return | | | +27.41% | | | | -0.05% | | | | +6.81% | |
*Fund investment results reflect past expense reductions, without which the results would have been lower.
Total Return Index Comparison for a Hypothetical $10,000 Investment (1/1/03–12/31/12)
The graph below shows the change in value of a hypothetical $10,000 investment in the Fund over the indicated period and includes reinvestment of any income or distributions. The Fund’s performance* is compared to the performance of the FTSE® EPRA/NAREIT Developed Index. One cannot invest directly in an index, and an index is not representative of the Fund’s portfolio. Please see Important Notes to Performance Information preceding the Fund Summaries.
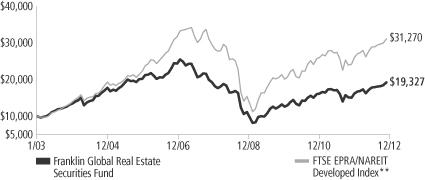
**Source: © 2013 Morningstar. Please see Index Descriptions following the Fund Summaries.
Franklin Global Real Estate Securities Fund Class 2
Performance reflects the Fund’s Class 2 operating expenses, but does not include any contract fees, expenses or sales charges. If they had been included, performance would be lower. These charges and deductions, particularly for variable life policies, can have a significant effect on contract values and insurance benefits. See the contract prospectus for a complete description of these expenses, including sales charges.
Performance data represent past performance, which does not guarantee future results. Investment return and principal value will fluctuate, and you may have a gain or loss when you sell your shares.
Current performance may differ from figures shown.
FGR-1
Fund Goal and Main Investments: Franklin Global Real Estate Securities Fund seeks high total return. Under normal market conditions, the Fund invests at least 80% of its net assets in investments of companies located anywhere in the world that operate in the real estate sector.
Performance Overview
You can find the Fund’s one-year total return in the Performance Summary. The Fund performed comparably to the +28.65% total return of its benchmark, the FTSE EPRA/NAREIT Developed Index.1
Economic and Market Overview
Headwinds to global growth negatively affected most world regions during 2012, including recently resilient emerging markets, and the International Monetary Fund lowered its global growth outlook. However, the slowdown appeared less severe than expected in developed markets such as Germany and the U.S. Several major governments intervened to support their countries’ currencies, liquidity and growth rates. European Central Bank (ECB) President Mario Draghi declared, “the ECB is ready to do whatever it takes to preserve the euro.” The U.S. Federal Reserve Board announced additional rounds of quantitative easing and extended its strategy designed to lower interest rates. China lowered borrowing costs for the first time in several years, and Japan’s central bank extended its quantitative easing program.
The U.S. economy grew moderately in 2012, supported by positive construction, housing and labor market trends. Consumer spending and personal income levels climbed, and inflation was generally mild with the exception of energy and food prices. Consumer sentiment rose to a five-year high, although potential U.S. tax hikes and spending cuts scheduled to take effect in 2013 dampened confidence near year-end. Just after year-end, Congress passed compromise legislation that preserved lower income tax rates for most U.S. households and delayed far-reaching federal spending cuts.
Stock markets were volatile with periodic downturns primarily attributable to concerns about slowing global economic growth, European sovereign debt and U.S. fiscal negotiations. As Europe’s leadership took measures to address the region’s fiscal debt crisis, investor attention shifted to the U.S. election and budget negotiations. Despite adversity
1. Source: © 2013 Morningstar. One cannot invest directly in an index, and an index is not representative of the Fund’s portfolio. Please see Index Descriptions following the Fund Summaries.
Fund Risks: All investments involve risks, including possible loss of principal. The Fund concentrates in real estate securities, which involve special risks, such as declines in the value of real estate and increased susceptibility to adverse economic or regulatory developments affecting the sector. The Fund’s investments in REITs involve additional risks; since REITs typically are invested in a limited number of projects or in a particular market segment, they are more susceptible to adverse developments affecting a single project or market segment than more broadly diversified investments. Foreign investing, especially in emerging markets, involves additional risks such as currency and market volatility, as well as political and social instability. Also, the Fund is a “nondiversified” fund, and investing in a nondiversified fund involves the risk of greater price fluctuation than a more diversified portfolio. The Fund is actively managed but there is no guarantee that the manager’s investment decisions will produce the desired results. The Fund’s prospectus also includes a description of the main investment risks.
FGR-2
and uncertainty in 2012, investors seemed to regain confidence in the latter half of the year and U.S. stocks, as measured by the Standard & Poor’s® 500 Index, as well as global developed and emerging stocks, as measured by the MSCI All Country World Index, made solid 12-month gains.2
Global Real Estate Market Overview
Nearly all global real estate markets rose during the reporting period, as real estate securities in many countries benefited from generally improved global economic fundamentals. According to the FTSE EPRA/NAREIT Developed Index, in U.S. dollar terms, Singapore, China and Japan led country real estate markets. Greece, Hong Kong and Germany also posted strong results. Some markets represented in the index made small gains and Spain lost value.
Investment Strategy
We are research-driven, fundamental investors. We seek to limit price volatility by investing across markets and property types. We also seek strong total return performance. We center our active investment strategy on the belief that unsynchronized regional economic activity within the global economy can provide consistent, attractive return opportunities in the global real estate markets. We use a bottom-up, value-oriented stock selection process that incorporates macro-level views in the evaluation process. We use top-down macro overlays to provide country/regional, property type, and company size perspectives in identifying international/local cyclical and thematic trends that highlight investment opportunities.
Manager’s Discussion
During the year under review, the Fund’s stock selection in the diversified REITs sector contributed to performance relative to the benchmark index. Within diversified REITs, Japanese firm Mitsui Fudosan performed well largely as a result of strong performance of Japanese property stocks along with investors’ increasing comfort with risk. This large-capitalization developer of quality properties primarily in central Tokyo also benefited as Tokyo office vacancies peaked during 2012 and showed slight improvement by year-end. In addition, securities purchases by the Bank of Japan were supportive, and the prospect of additional monetary stimulus following the country’s national elections boosted performance near year-end. An off-benchmark allocation to Sunac China Holdings also aided relative performance. Shares of the
2. Please see Index Descriptions following the Fund Summaries.
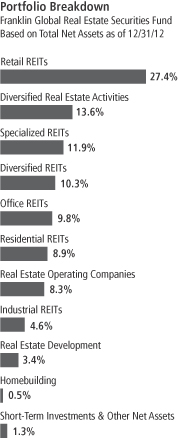
FGR-3
Chinese residential real estate developer benefited primarily from strong sales during 2012 that exceeded investors’ expectations. Despite general investor concerns regarding slowing growth in China early in 2012, residential property sales for listed developers like Sunac improved over 2011 results due to changing product and geographic mixes that shifted toward second- and third-tier cities. The Fund’s overweighted position in Keppel Land also aided Fund results. The Singaporean residential and commercial developer performed well because of the success of its office/mixed use development in Singapore, Marina Bay Financial Centre, as well as strong residential sales for its projects in Singapore and China. Despite revenue declines, the company’s profits increased significantly due to deferred payments from its Reflections at Keppel Bay development in Singapore and gains from sales of commercial assets to an affiliate.
In contrast, the Fund had some key detractors from relative performance. An undwerweighting in Hongkong Land Holdings was detrimental. Hongkong Land performed well as office rents stabilized in the Hong Kong Central office market and rental growth was robust for its retail property. Market fears of severe declines in market rents in the Hong Kong Central office market abated by mid-year and the company’s stock was supported by earnings growth derived from the rollover of below-market leases to higher rental rates. An overweighted position in U.S. office space REIT Boston Properties hampered relative performance. Boston Properties underperformed because of investor concerns regarding slowing demand for office space, particularly in its New York City and Washington, DC, area office properties. In addition, in our opinion, investors were attracted to U.S. REITs with smaller equity capitalizations during a period of increasing comfort with risk. Management comments that the company would potentially pursue its first investments in the London office market likely also concerned some investors. An underweighting in CapitaLand in the diversified real estate activities segment also detracted from relative performance. The stock performed well due to strong performance of property stocks in the Singapore market and as investors were willing to assume more risk. In addition, the company made changes to its senior management team and indicated a willingness to revise its investment strategy to increasingly focus on fewer markets and property types. The company’s developments in China and Singapore performed well and exceeded market expectations.
Top 10 Holdings
Franklin Global Real Estate Securities Fund
12/31/12
| | | | |
Company
Sector/Industry,
Country | | % of Total
Net Assets | |
| Simon Property Group Inc. | | | 5.1% | |
| Retail REITs, U.S. | | | | |
| Mitsubishi Estate Co. Ltd. | | | 4.0% | |
| Diversified Real Estate Activities, Japan | | | | |
| Mitsui Fudosan Co. Ltd. | | | 3.6% | |
| Diversified Real Estate Activities, Japan | | | | |
| Unibail-Rodamco SE | | | 3.5% | |
| Retail REITs, France | | | | |
| Westfield Group | | | 3.4% | |
| Retail REITs, Australia | | | | |
| Sun Hung Kai Properties Ltd. | | | 2.3% | |
| Diversified Real Estate Activities, Hong Kong | | | | |
| Prologis Inc. | | | 2.1% | |
| Industrial REITs, U.S. | | | | |
| Boston Properties Inc. | | | 2.0% | |
| Office REITs, U.S. | | | | |
| Ventas Inc. | | | 2.0% | |
| Specialized REITs, U.S. | | | | |
| HCP Inc. | | | 2.0% | |
| Specialized REITs, U.S. | | | | |
The dollar value, number of shares or principal amount, and names of all portfolio holdings are listed in the Fund’s Statement of Investments.
FGR-4
Thank you for your participation in Franklin Global Real Estate Securities Fund. We look forward to serving your future investment needs.
The foregoing information reflects our analysis, opinions and portfolio holdings as of December 31, 2012, the end of the reporting period. The way we implement our main investment strategies and the resulting portfolio holdings may change depending on factors such as market and economic conditions. These opinions may not be relied upon as investment advice or an offer for a particular security. The information is not a complete analysis of every aspect of any market, country, industry, security or the Fund. Statements of fact are from sources considered reliable, but the investment manager makes no representation or warranty as to their completeness or accuracy. Although historical performance is no guarantee of future results, these insights may help you understand our investment management philosophy.
FGR-5
Fund Expenses
As an investor in a variable insurance contract (Contract) that indirectly provides for investment in an underlying mutual fund, you can incur transaction and/or ongoing expenses at both the Fund level and the Contract level.
| • | | Transaction expenses can include sales charges (loads) on purchases, redemption fees, surrender fees, transfer fees and premium taxes. |
| • | | Ongoing expenses can include management fees, distribution and service (12b-1) fees, contract fees, annual maintenance fees, mortality and expense risk fees and other fees and expenses. All mutual funds and Contracts have some types of ongoing expenses. |
The expenses shown in the table are meant to highlight ongoing expenses at the Fund level only and do not include ongoing expenses at the Contract level, or transaction expenses at either the Fund or Contract level. While the Fund does not have transaction expenses, if the transaction and ongoing expenses at the Contract level were included, the expenses shown would be higher. You should consult your Contract prospectus or disclosure document for more information.
The table shows Fund-level ongoing expenses and can help you understand these expenses and compare them with those of other mutual funds offered through the Contract. The table assumes a $1,000 investment held for the six months indicated. Please refer to the Fund prospectus for additional information on operating expenses.
Actual Fund Expenses
The first line (Actual) of the table provides actual account values and expenses. The “Ending Account Value” is derived from the Fund’s actual return, which includes the effect of ongoing Fund expenses, but does not include the effect of ongoing Contract expenses.
You can estimate the Fund-level expenses you incurred during the period by following these steps. Of course, your account value and expenses will differ from those in this illustration:
| 1. | Divide your account value by $1,000. |
If an account had an $8,600 value, then $8,600 ÷ $1,000 = 8.6.
| 2. | Multiply the result by the number under the heading “Fund-Level Expenses Incurred During Period.” |
If Fund-Level Expenses Incurred During Period were $7.50, then 8.6 x $7.50 = $64.50.
In this illustration, the estimated expenses incurred this period at the Fund level are $64.50.
Franklin Global Real Estate Securities Fund Class 2
FGR-6
Hypothetical Example for Comparison with Other Mutual Funds
Information in the second line (Hypothetical) of the table can help you compare ongoing expenses of the Fund with those of other mutual funds offered through the Contract. This information may not be used to estimate the actual ending account balance or expenses you incurred during the period. The hypothetical “Ending Account Value” is based on the Fund’s actual expense ratio and an assumed 5% annual rate of return before expenses, which does not represent the Fund’s actual return. The figure under the heading “Fund-Level Expenses Incurred During Period” shows the hypothetical expenses your account would have incurred under this scenario. You can compare this figure with the 5% hypothetical examples that appear in shareholder reports of other funds offered through a Contract.
| | | | | | | | | | | | |
| Class 2 | | Beginning
Account Value 7/1/12 | | | Ending
Account
Value 12/31/12 | | | Fund-Level
Expenses Incurred
During Period*
7/1/12–12/31/12 | |
Actual | | $ | 1,000 | | | $ | 1,115.70 | | | $ | 7.18 | |
Hypothetical (5% return before expenses) | | $ | 1,000 | | | $ | 1,018.35 | | | $ | 6.85 | |
*Expenses are calculated using the most recent six-month annualized expense ratio, for the Fund’s Class 2 shares (1.35%), which does not include any ongoing expenses of the Contract for which the Fund is an investment option, multiplied by the average account value over the period, multiplied by 184/366 to reflect the one-half year period.
FGR-7
Franklin Templeton Variable Insurance Products Trust
Financial Highlights
Franklin Global Real Estate Securities Fund
| | | | | | | | | | | | | | | | | | | | |
| | | Year Ended December 31, | |
| Class 1 | | 2012 | | | 2011 | | | 2010 | | | 2009 | | | 2008 | |
| | | | |
Per share operating performance | | | | | | | | | | | | | | | | | | | | |
(for a share outstanding throughout the year) | | | | | | | | | | | | | | | | | | | | |
Net asset value, beginning of year | | $ | 11.47 | | | $ | 13.12 | | | $ | 11.16 | | | $ | 10.84 | | | $ | 25.42 | |
| | | | |
Income from investment operationsa: | | | | | | | | | | | | | | | | | | | | |
Net investment incomeb | | | 0.25 | | | | 0.21 | | | | 0.38 | | | | 0.30 | | | | 0.62 | |
Net realized and unrealized gains (losses) | | | 2.94 | | | | (0.83 | ) | | | 1.94 | | | | 1.36 | | | | (9.10 | ) |
| | | | |
Total from investment operations | | | 3.19 | | | | (0.62 | ) | | | 2.32 | | | | 1.66 | | | | (8.48 | ) |
| | | | |
Less distributions from: | | | | | | | | | | | | | | | | | | | | |
Net investment income and net realized foreign currency gains | | | — | | | | (1.03 | ) | | | (0.36 | ) | | | (1.34 | ) | | | (0.32 | ) |
Net realized gains | | | — | | | | — | | | | — | | | | — | | | | (5.78 | ) |
| | | | |
Total distributions | | | — | | | | (1.03 | ) | | | (0.36 | ) | | | (1.34 | ) | | | (6.10 | ) |
| | | | |
Net asset value, end of year | | $ | 14.66 | | | $ | 11.47 | | | $ | 13.12 | | | $ | 11.16 | | | $ | 10.84 | |
| | | | |
| | | | | |
Total returnc | | | 27.81% | | | | (5.45)% | | | | 21.24% | | | | 19.41% | | | | (42.22)% | |
Ratios to average net assets | | | | | | | | | | | | | | | | | | | | |
Expenses before waiver and payments by affiliates | | | 1.11% | | | | 1.12% | | | | 1.11% | | | | 1.11% | | | | 1.08% | |
Expenses net of waiver and payments by affiliates | | | 1.07% | | | | 0.98% | | | | 0.86% | | | | 0.76% | d | | | 0.60% | d |
Net investment income | | | 1.92% | | | | 1.64% | | | | 3.24% | | | | 3.13% | | | | 3.41% | |
| | | | | |
Supplemental data | | | | | | | | | | | | | | | | | | | | |
Net assets, end of year (000’s) | | $ | 38,329 | | | $ | 33,670 | | | $ | 40,430 | | | $ | 38,486 | | | $ | 39,018 | |
Portfolio turnover rate | | | 22.29% | | | | 28.95% | | | | 76.52% | | | | 87.34% | | | | 77.28% | |
aThe amount shown for a share outstanding throughout the period may not correlate with the Statement of Operations for the period due to the timing of sales and repurchases of the Fund shares in relation to income earned and/or fluctuating market value of the investments of the Fund.
bBased on average daily shares outstanding.
cTotal return does not include fees, charges or expenses imposed by the variable annuity and life insurance contracts for which the Franklin Templeton Variable Insurance Products Trust serves as an underlying investment vehicle.
dBenefit of expense reduction rounds to less than 0.01%.
The accompanying notes are an integral part of these financial statements.
FGR-8
Franklin Templeton Variable Insurance Products Trust
Financial Highlights (continued)
Franklin Global Real Estate Securities Fund
| | | | | | | | | | | | | | | | | | | | |
| | | Year Ended December 31, | |
| Class 2 | | 2012 | | | 2011 | | | 2010 | | | 2009 | | | 2008 | |
| | | | |
Per share operating performance | | | | | | | | | | | | | | | | | | | | |
(for a share outstanding throughout the year) | | | | | | | | | | | | | | | | | | | | |
Net asset value, beginning of year | | $ | 11.20 | | | $ | 12.83 | | | $ | 10.92 | | | $ | 10.61 | | | $ | 24.97 | |
| | | | |
Income from investment operationsa: | | | | | | | | | | | | | | | | | | | | |
Net investment incomeb | | | 0.21 | | | | 0.17 | | | | 0.34 | | | | 0.27 | | | | 0.56 | |
Net realized and unrealized gains (losses) | | | 2.86 | | | | (0.81 | ) | | | 1.90 | | | | 1.33 | | | | (8.93 | ) |
| | | | |
Total from investment operations | | | 3.07 | | | | (0.64 | ) | | | 2.24 | | | | 1.60 | | | | (8.37 | ) |
| | | | |
Less distributions from: | | | | | | | | | | | | | | | | | | | | |
Net investment income and net realized foreign currency gains | | | — | | | | (0.99 | ) | | | (0.33 | ) | | | (1.29 | ) | | | (0.21 | ) |
Net realized gains | | | — | | | | — | | | | — | | | | — | | | | (5.78 | ) |
| | | | |
Total distributions | | | — | | | | (0.99 | ) | | | (0.33 | ) | | | (1.29 | ) | | | (5.99 | ) |
| | | | |
Net asset value, end of year | | $ | 14.27 | | | $ | 11.20 | | | $ | 12.83 | | | $ | 10.92 | | | $ | 10.61 | |
| | | | |
| | | | | |
Total returnc | | | 27.41% | | | | (5.65)% | | | | 20.97% | | | | 19.08% | | | | (42.39)% | |
Ratios to average net assets | | | | | | | | | | | | | | | | | | | | |
Expenses before waiver and payments by affiliates | | | 1.36% | | | | 1.37% | | | | 1.36% | | | | 1.36% | | | | 1.33% | |
Expenses net of waiver and payments by affiliates | | | 1.32% | | | | 1.23% | | | | 1.11% | | | | 1.01% | d | | | 0.85% | d |
Net investment income | | | 1.67% | | | | 1.39% | | | | 2.99% | | | | 2.88% | | | | 3.16% | |
| | | | | |
Supplemental data | | | | | | | | | | | | | | | | | | | | |
Net assets, end of year (000’s) | | $ | 344,044 | | | $ | 292,356 | | | $ | 352,854 | | | $ | 345,445 | | | $ | 343,701 | |
Portfolio turnover rate | | | 22.29% | | | | 28.95% | | | | 76.52% | | | | 87.34% | | | | 77.28% | |
aThe amount shown for a share outstanding throughout the period may not correlate with the Statement of Operations for the period due to the timing of sales and repurchases of the Fund shares in relation to income earned and/or fluctuating market value of the investments of the Fund.
bBased on average daily shares outstanding.
cTotal return does not include fees, charges or expenses imposed by the variable annuity and life insurance contracts for which the Franklin Templeton Variable Insurance Products Trust serves as an underlying investment vehicle.
dBenefit of expense reduction rounds to less than 0.01%.
The accompanying notes are an integral part of these financial statements.
FGR-9
Franklin Templeton Variable Insurance Products Trust
Statement of Investments, December 31, 2012
| | | | | | | | | | |
| Franklin Global Real Estate Securities Fund | | Country | | Shares/
Units | | | Value | |
Common Stocks and Other Equity Interests 98.7% | | | | | | | | | | |
Diversified Real Estate Activities 13.6% | | | | | | | | | | |
CapitaLand Ltd. | | Singapore | | | 697,500 | | | $ | 2,147,246 | |
Hang Lung Properties Ltd. | | Hong Kong | | | 1,136,000 | | | | 4,514,538 | |
Mitsubishi Estate Co. Ltd. | | Japan | | | 638,600 | | | | 15,267,382 | |
Mitsui Fudosan Co. Ltd. | | Japan | | | 563,000 | | | | 13,753,659 | |
Sun Hung Kai Properties Ltd. | | Hong Kong | | | 589,000 | | | | 8,861,314 | |
The Wharf Holdings Ltd. | | Hong Kong | | | 942,500 | | | | 7,375,585 | |
| | | | | | | | | | |
| | | | | | | | | 51,919,724 | |
| | | | | | | | | | |
Diversified REITs 10.3% | | | | | | | | | | |
American Assets Trust Inc. | | United States | | | 77,500 | | | | 2,164,575 | |
British Land Co. PLC | | United Kingdom | | | 462,100 | | | | 4,276,313 | |
Canadian REIT | | Canada | | | 64,800 | | | | 2,828,822 | |
Dexus Property Group | | Australia | | | 1,978,265 | | | | 2,103,047 | |
GPT Group | | Australia | | | 1,160,716 | | | | 4,471,900 | |
H&R REIT | | Canada | | | 148,200 | | | | 3,595,892 | |
Kenedix Realty Investment Corp. | | Japan | | | 550 | | | | 1,914,680 | |
Land Securities Group PLC | | United Kingdom | | | 494,562 | | | | 6,598,162 | |
Liberty Property Trust | | United States | | | 33,100 | | | | 1,183,987 | |
Shaftesbury PLC | | United Kingdom | | | 165,400 | | | | 1,526,120 | |
Stockland | | Australia | | | 403,347 | | | | 1,492,747 | |
Suntec REIT | | Singapore | | | 1,724,000 | | | | 2,375,520 | |
United Urban Investment Corp. | | Japan | | | 1,344 | | | | 1,542,497 | |
Vornado Realty Trust | | United States | | | 41,827 | | | | 3,349,506 | |
| | | | | | | | | | |
| | | | | | | | | 39,423,768 | |
| | | | | | | | | | |
Homebuilding 0.5% | | | | | | | | | | |
SPDR S&P Homebuilders ETF | | United States | | | 67,500 | | | | 1,795,500 | |
| | | | | | | | | | |
Industrial REITs 4.6% | | | | | | | | | | |
Ascendas REIT | | Singapore | | | 788,000 | | | | 1,542,243 | |
Goodman Group | | Australia | | | 1,035,909 | | | | 4,724,488 | |
Mapletree Logistics Trust | | Singapore | | | 2,159,380 | | | | 2,032,531 | |
Prologis Inc. | | United States | | | 214,372 | | | | 7,822,434 | |
STAG Industrial Inc. | | United States | | | 83,600 | | | | 1,502,292 | |
| | | | | | | | | | |
| | | | | | | | | 17,623,988 | |
| | | | | | | | | | |
Office REITs 9.8% | | | | | | | | | | |
Alexandria Real Estate Equities Inc. | | United States | | | 21,200 | | | | 1,469,584 | |
Boston Properties Inc. | | United States | | | 73,100 | | | | 7,734,711 | |
Brandywine Realty Trust | | United States | | | 216,800 | | | | 2,642,792 | |
CapitaCommercial Trust | | Singapore | | | 699,000 | | | | 970,136 | |
Commonwealth Property Office Fund | | Australia | | | 1,809,604 | | | | 1,929,596 | |
Coresite Realty Corp. | | United States | | | 27,500 | | | | 760,650 | |
Derwent London PLC | | United Kingdom | | | 44,260 | | | | 1,534,164 | |
Digital Realty Trust Inc. | | United States | | | 26,300 | | | | 1,785,507 | |
Douglas Emmett Inc. | | United States | | | 89,700 | | | | 2,090,010 | |
Great Portland Estates PLC | | United Kingdom | | | 455,736 | | | | 3,663,893 | |
Highwoods Properties Inc. | | United States | | | 77,700 | | | | 2,599,065 | |
Japan Real Estate Investment Corp. | | Japan | | | 286 | | | | 2,813,812 | |
Kilroy Realty Corp. | | United States | | | 84,300 | | | | 3,993,291 | |
SL Green Realty Corp. | | United States | | | 44,200 | | | | 3,387,930 | |
| | | | | | | | | | |
| | | | | | | | | 37,375,141 | |
| | | | | | | | | | |
FGR-10
Franklin Templeton Variable Insurance Products Trust
Statement of Investments, December 31, 2012 (continued)
| | | | | | | | | | |
| Franklin Global Real Estate Securities Fund | | Country | | Shares/
Units | | | Value | |
Common Stocks and Other Equity Interests (continued) | | | | | | | | | | |
Real Estate Development 3.4% | | | | | | | | | | |
Agile Property Holdings Ltd. | | China | | | 1,260,000 | | | $ | 1,772,072 | |
China Overseas Land & Investment Ltd. | | China | | | 876,000 | | | | 2,610,961 | |
Keppel Land Ltd. | | Singapore | | | 897,000 | | | | 3,004,652 | |
Sino Land Co. Ltd. | | Hong Kong | | | 2,172,000 | | | | 3,884,251 | |
Sunac China Holdings Ltd. | | China | | | 2,291,000 | | | | 1,773,620 | |
| | | | | | | | | | |
| | | | | | | | | 13,045,556 | |
| | | | | | | | | | |
Real Estate Operating Companies 8.3% | | | | | | | | | | |
Brookfield Office Properties Inc. | | Canada | | | 182,800 | | | | 3,121,357 | |
Deutsche Euroshop AG | | Germany | | | 21,600 | | | | 906,277 | |
a Deutsche Euroshop AG, 144A | | Germany | | | 10,230 | | | | 429,223 | |
Global Logistic Properties Ltd. | | Singapore | | | 1,821,000 | | | | 4,211,967 | |
GSW Immobilien AG | | Germany | | | 32,556 | | | | 1,378,913 | |
a GSW Immobilien AG, 144A | | Germany | | | 38,829 | | | | 1,644,606 | |
Hongkong Land Holdings Ltd. | | Hong Kong | | | 673,100 | | | | 4,754,014 | |
Hufvudstaden AB, A | | Sweden | | | 284,540 | | | | 3,586,758 | |
Hysan Development Co. Ltd. | | Hong Kong | | | 878,000 | | | | 4,225,593 | |
Norwegian Property ASA | | Norway | | | 741,440 | | | | 1,147,464 | |
a Norwegian Property ASA, 144A | | Norway | | | 266,570 | | | | 412,548 | |
PSP Swiss Property AG | | Switzerland | | | 26,130 | | | | 2,470,696 | |
Sponda OYJ | | Finland | | | 312,940 | | | | 1,490,596 | |
Swire Properties Ltd. | | Hong Kong | | | 339,200 | | | | 1,131,360 | |
a Swire Properties Ltd., 144A | | Hong Kong | | | 247,400 | | | | 825,172 | |
| | | | | | | | | | |
| | | | | | | | | 31,736,544 | |
| | | | | | | | | | |
Residential REITs 8.9% | | | | | | | | | | |
Apartment Investment & Management Co., A | | United States | | | 106,000 | | | | 2,868,360 | |
AvalonBay Communities Inc. | | United States | | | 33,490 | | | | 4,540,909 | |
Boardwalk REIT | | Canada | | | 44,300 | | | | 2,878,106 | |
BRE Properties Inc. | | United States | | | 34,600 | | | | 1,758,718 | |
Camden Property Trust | | United States | | | 56,600 | | | | 3,860,686 | |
Canadian Apartment Properties REIT | | Canada | | | 71,700 | | | | 1,797,463 | |
Equity Lifestyle Properties Inc. | | United States | | | 16,400 | | | | 1,103,556 | |
Equity Residential | | United States | | | 98,300 | | | | 5,570,661 | |
Essex Property Trust Inc. | | United States | | | 24,180 | | | | 3,545,997 | |
Home Properties Inc. | | United States | | | 21,300 | | | | 1,305,903 | |
Post Properties Inc. | | United States | | | 55,800 | | | | 2,787,210 | |
UDR Inc. | | United States | | | 78,470 | | | | 1,866,017 | |
| | | | | | | | | | |
| | | | | | | | | 33,883,586 | |
| | | | | | | | | | |
Retail REITs 27.4% | | | | | | | | | | |
a CapitaMall Trust, 144A | | Singapore | | | 479,100 | | | | 835,503 | |
CBL & Associates Properties Inc. | | United States | | | 96,200 | | | | 2,040,402 | |
Centro Retail Australia | | Australia | | | 1,193,610 | | | | 2,828,257 | |
Charter Hall Retail REIT | | Australia | | | 433,432 | | | | 1,701,391 | |
DDR Corp. | | United States | | | 291,676 | | | | 4,567,646 | |
Eurocommercial Properties NV | | Netherlands | | | 47,950 | | | | 1,926,794 | |
Federal Realty Investment Trust | | United States | | | 39,300 | | | | 4,087,986 | |
Frontier Real Estate Investment Corp. | | Japan | | | 177 | | | | 1,541,249 | |
General Growth Properties Inc. | | United States | | | 162,600 | | | | 3,227,610 | |
Hammerson PLC | | United Kingdom | | | 529,360 | | | | 4,245,358 | |
Japan Retail Fund Investment Corp. | | Japan | | | 1,208 | | | | 2,217,552 | |
a Japan Retail Fund Investment Corp., 144A | | Japan | | | 472 | | | | 866,460 | |
FGR-11
Franklin Templeton Variable Insurance Products Trust
Statement of Investments, December 31, 2012 (continued)
| | | | | | | | | | |
| Franklin Global Real Estate Securities Fund | | Country | | Shares/
Units | | | Value | |
Common Stocks and Other Equity Interests (continued) | | | | | | | | | | |
Retail REITs (continued) | | | | | | | | | | |
Kimco Realty Corp. | | United States | | | 200,300 | | | $ | 3,869,796 | |
Klepierre | | France | | | 78,600 | | | | 3,113,691 | |
The Link REIT | | Hong Kong | | | 1,254,600 | | | | 6,272,798 | |
The Macerich Co. | | United States | | | 51,590 | | | | 3,007,697 | |
Ramco-Gershenson Properties Trust | | United States | | | 84,800 | | | | 1,128,688 | |
Regency Centers Corp. | | United States | | | 26,700 | | | | 1,258,104 | |
RioCan REIT | | Canada | | | 136,500 | | | | 3,787,506 | |
Simon Property Group Inc. | | United States | | | 122,644 | | | | 19,388,790 | |
Tanger Factory Outlet Centers Inc. | | United States | | | 53,900 | | | | 1,843,380 | |
Taubman Centers Inc. | | United States | | | 44,700 | | | | 3,518,784 | |
Unibail-Rodamco SE | | France | | | 54,703 | | | | 13,262,119 | |
Westfield Group | | Australia | | | 1,157,381 | | | | 12,793,645 | |
Westfield Retail Trust | | Australia | | | 513,050 | | | | 1,620,132 | |
| | | | | | | | | | |
| | | | | | | | | 104,951,338 | |
| | | | | | | | | | |
Specialized REITs 11.9% | | | | | | | | | | |
CDL Hospitality Trusts | | Singapore | | | 764,000 | | | | 1,180,847 | |
CubeSmart | | United States | | | 110,700 | | | | 1,612,899 | |
Extra Space Storage Inc. | | United States | | | 62,700 | | | | 2,281,653 | |
HCP Inc. | | United States | | | 165,300 | | | | 7,468,254 | |
Health Care REIT Inc. | | United States | | | 114,300 | | | | 7,005,447 | |
Host Hotels & Resorts Inc. | | United States | | | 231,239 | | | | 3,623,515 | |
LaSalle Hotel Properties | | United States | | | 36,100 | | | | 916,579 | |
Pebblebrook Hotel Trust | | United States | | | 111,730 | | | | 2,580,963 | |
Public Storage | | United States | | | 43,600 | | | | 6,320,256 | |
Senior Housing Properties Trust | | United States | | | 39,100 | | | | 924,324 | |
Starwood Hotels & Resorts Worldwide Inc. | | United States | | | 44,440 | | | | 2,549,078 | |
b Sunstone Hotel Investors Inc. | | United States | | | 130,200 | | | | 1,394,442 | |
Ventas Inc. | | United States | | | 117,450 | | | | 7,601,364 | |
| | | | | | | | | | |
| | | | | | | | | 45,459,621 | |
| | | | | | | | | | |
Total Common Stocks and Other Equity Interests (Cost $251,257,640) | | | | | | | | | 377,214,766 | |
| | | | | | | | | | |
| | | |
| | | | | Principal
Amount | | | | |
Short Term Investments (Cost $4,947,180) 1.3% | | | | | | | | | | |
Repurchase Agreements 1.3% | | | | | | | | | | |
c Joint Repurchase Agreement, 0.154%, 1/02/13 (Maturity Value $4,947,223) | | United States | | $ | 4,947,180 | | | | 4,947,180 | |
BNP Paribas Securities Corp. (Maturity Value $644,029) | | | | | | | | | | |
Credit Suisse Securities (USA) LLC (Maturity Value $805,063) | | | | | | | | | | |
Deutsche Bank Securities Inc. (Maturity Value $519,459) | | | | | | | | | | |
HSBC Securities (USA) Inc. (Maturity Value $1,449,091) | | | | | | | | | | |
Merrill Lynch, Pierce, Fenner & Smith Inc. (Maturity Value $644,029) | | | | | | | | | | |
Morgan Stanley & Co. LLC (Maturity Value $241,523) | | | | | | | | | | |
UBS Securities LLC (Maturity Value $644,029) | | | | | | | | | | |
Collateralized by U.S. Government Agency Securities, 0.00% - 6.21%, 1/15/13 - 1/22/37; U.S. Treasury Bonds, 11.25%, 2/15/15 and U.S. Treasury Notes, 0.25% - 2.00%,
11/30/13 - 9/15/15 (valued at $5,046,685) | | | | | | | | | | |
| | | | | | | | | | |
Total Investments (Cost $256,204,820) 100.0% | | | | | | | | | 382,161,946 | |
Other Assets, less Liabilities 0.0%† | | | | | | | | | 210,835 | |
| | | | | | | | | | |
Net Assets 100.0% | | | | | | | | $ | 382,372,781 | |
| | | | | | | | | | |
FGR-12
Franklin Templeton Variable Insurance Products Trust
Statement of Investments, December 31, 2012 (continued)
| | | | | | |
| Franklin Global Real Estate Securities Fund | | | | | | |
| | | | | | |
| | | | | | |
See Abbreviations on page FGR-24
†Rounds to less than 0.1% of net assets.
aSecurity was purchased pursuant to Rule 144A under the Securities Act of 1933 and may be sold in transactions exempt from registration only to qualified institutional buyers or in a public offering registered under the Securities Act of 1933. These securities have been deemed liquid under guidelines approved by the Trust’s Board of Trustees. At December 31, 2012, the aggregate value of these securities was $5,013,512, representing 1.31% of net assets.
bNon-income producing.
cSee Note 1(c) regarding joint repurchase agreement.
The accompanying notes are an integral part of these financial statements.
FGR-13
Franklin Templeton Variable Insurance Products Trust
Financial Statements
Statement of Assets and Liabilities
December 31, 2012
| | | | |
| | | Franklin Global
Real Estate
Securities Fund | |
Assets: | | | | |
Investments in securities: | | | | |
Cost - Unaffiliated issuers | | $ | 251,257,640 | |
Cost - Repurchase agreements | | | 4,947,180 | |
| | | | |
Total cost of investments | | $ | 256,204,820 | |
| | | | |
Value - Unaffiliated issuers | | $ | 377,214,766 | |
Value - Repurchase agreements | | | 4,947,180 | |
| | | | |
Total value of investments | | | 382,161,946 | |
Cash | | | 35,004 | |
Receivables: | | | | |
Capital shares sold | | | 10,115 | |
Dividends | | | 1,324,857 | |
Other assets | | | 7 | |
| | | | |
Total assets | | | 383,531,929 | |
| | | | |
Liabilities: | | | | |
Payables: | | | | |
Capital shares redeemed | | | 587,896 | |
Affiliates | | | 473,164 | |
Deferred tax | | | 20,172 | |
Accrued expenses and other liabilities | | | 77,916 | |
| | | | |
Total liabilities | | | 1,159,148 | |
| | | | |
Net assets, at value | | $ | 382,372,781 | |
| | | | |
Net assets consist of: | | | | |
Paid-in capital | | $ | 613,652,748 | |
Undistributed net investment income | | | 1,309,313 | |
Net unrealized appreciation (depreciation) | | | 125,927,502 | |
Accumulated net realized gain (loss) | | | (358,516,782 | ) |
| | | | |
Net assets, at value | | $ | 382,372,781 | |
| | | | |
Class 1: | | | | |
Net assets, at value | | $ | 38,329,200 | |
| | | | |
Shares outstanding | | | 2,615,307 | |
| | | | |
Net asset value and maximum offering price per share | | $ | 14.66 | |
| | | | |
Class 2: | | | | |
Net assets, at value | | $ | 344,043,581 | |
| | | | |
Shares outstanding | | | 24,101,244 | |
| | | | |
Net asset value and maximum offering price per share | | $ | 14.27 | |
| | | | |
The accompanying notes are an integral part of these financial statements.
FGR-14
Franklin Templeton Variable Insurance Products Trust
Financial Statements (continued)
Statement of Operations
for the year ended December 31, 2012
| | | | |
| | | Franklin Global
Real Estate
Securities Fund | |
Investment income: | | | | |
Dividends (net of foreign taxes of $519,558) | | $ | 10,753,254 | |
Interest | | | 9,796 | |
| | | | |
Total investment income | | | 10,763,050 | |
| | | | |
Expenses: | | | | |
Management fees (Note 3a) | | | 2,878,638 | |
Administrative fees (Note 3b) | | | 899,574 | |
Distribution fees - Class 2 (Note 3c) | | | 808,547 | |
Unaffiliated transfer agent fees | | | 334 | |
Custodian fees (Note 4) | | | 55,686 | |
Reports to shareholders | | | 85,630 | |
Professional fees | | | 49,668 | |
Trustees’ fees and expenses | | | 1,384 | |
Other | | | 21,054 | |
| | | | |
Total expenses | | | 4,800,515 | |
Expenses waived/paid by affiliates (Note 3e) | | | (123,025 | ) |
| | | | |
Net expenses | | | 4,677,490 | |
| | | | |
Net investment income | | | 6,085,560 | |
| | | | |
Realized and unrealized gains (losses): | | | | |
Net realized gain (loss) from: | | | | |
Investments | | | 15,846,046 | |
Realized gain distributions from REITs | | | 782,680 | |
Foreign currency transactions | | | 29,783 | |
| | | | |
Net realized gain (loss) | | | 16,658,509 | |
| | | | |
Net change in unrealized appreciation (depreciation) on: | | | | |
Investments | | | 63,428,621 | |
Translation of other assets and liabilities denominated in foreign currencies | | | (7,029 | ) |
Change in deferred taxes on unrealized appreciation | | | (20,172 | ) |
| | | | |
Net change in unrealized appreciation (depreciation) | | | 63,401,420 | |
| | | | |
Net realized and unrealized gain (loss) | | | 80,059,929 | |
| | | | |
Net increase (decrease) in net assets resulting from operations | | $ | 86,145,489 | |
| | | | |
The accompanying notes are an integral part of these financial statements.
FGR-15
Franklin Templeton Variable Insurance Products Trust
Financial Statements (continued)
|
Statements of Changes in Net Assets |
| | | | | | | | |
| | | Franklin Global Real Estate
Securities Fund | |
| | | Year Ended December 31, | |
| | | 2012 | | | 2011 | |
| | | | | | | |
Increase (decrease) in net assets: | | | | | | | | |
Operations: | | | | | | | | |
Net investment income | | $ | 6,085,560 | | | $ | 5,230,839 | |
Net realized gain (loss) from investments, realized gain distributions from REITs and foreign currency transactions | | | 16,658,509 | | | | 18,398,566 | |
Net change in unrealized appreciation (depreciation) on investments, translation of other assets and liabilities denominated in foreign currencies and deferred taxes | | | 63,401,420 | | | | (42,827,542 | ) |
| | | | |
Net increase (decrease) in net assets resulting from operations | | | 86,145,489 | | | | (19,198,137 | ) |
| | | | |
Distributions to shareholders from net investment income and net foreign currency gains: | | | | | | | | |
Class 1 | | | — | | | | (2,965,988 | ) |
Class 2 | | | — | | | | (25,849,452 | ) |
| | | | |
Total distributions to shareholders | | | — | | | | (28,815,440 | ) |
| | | | |
Capital share transactions: (Note 2) | | | | | | | | |
Class 1 | | | (4,213,180 | ) | | | (1,885,405 | ) |
Class 2 | | | (25,586,397 | ) | | | (17,357,651 | ) |
Class 4 | | | — | | | | (2,896 | ) |
| | | | |
Total capital share transactions | | | (29,799,577 | ) | | | (19,245,952 | ) |
| | | | |
Net increase (decrease) in net assets | | | 56,345,912 | | | | (67,259,529 | ) |
Net assets: | | | | | | | | |
Beginning of year | | | 326,026,869 | | | | 393,286,398 | |
| | | | |
End of year | | $ | 382,372,781 | | | $ | 326,026,869 | |
| | | | |
Undistributed net investment income (distributions in excess of net investment income) included in net assets: | | | | | | | | |
End of year | | $ | 1,309,313 | | | $ | (8,310,736 | ) |
| | | | |
The accompanying notes are an integral part of these financial statements.
FGR-16
Franklin Templeton Variable Insurance Products Trust
Notes to Financial Statements
Franklin Global Real Estate Securities Fund
1. ORGANIZATION AND SIGNIFICANT ACCOUNTING POLICIES
Franklin Templeton Variable Insurance Products Trust (Trust) is registered under the Investment Company Act of 1940, as amended, (1940 Act) as an open-end investment company, consisting of twenty separate funds. The Franklin Global Real Estate Securities Fund (Fund) is included in this report. The financial statements of the remaining funds in the Trust are presented separately. Shares of the Fund are generally sold only to insurance company separate accounts to fund the benefits of variable life insurance policies or variable annuity contracts. At December 31, 2012, 58.19% of the Fund’s shares were held through one insurance company. Investment activities of these insurance company separate accounts could have a material impact on the Fund. The Fund offers two classes of shares: Class 1 and Class 2. Each class of shares differs by its distribution fees, voting rights on matters affecting a single class and its exchange privilege.
The following summarizes the Fund’s significant accounting policies.
a. Financial Instrument Valuation
The Fund’s investments in financial instruments are carried at fair value daily. Fair value is the price that would be received to sell an asset or paid to transfer a liability in an orderly transaction between market participants on the measurement date. Under procedures approved by the Trust’s Board of Trustees (the Board), the Fund’s administrator, investment manager and other affiliates have formed the Valuation and Liquidity Oversight Committee (VLOC). The VLOC provides administration and oversight of the Fund’s valuation policies and procedures, which are approved annually by the Board. Among other things, these procedures allow the Fund to utilize independent pricing services, quotations from securities and financial instrument dealers, and other market sources to determine fair value.
Equity securities and exchange traded funds listed on an exchange or on the NASDAQ National Market System are valued at the last quoted sale price or the official closing price of the day, respectively. Foreign equity securities are valued as of the close of trading on the foreign stock exchange on which the security is primarily traded, or the NYSE, whichever is earlier. The value is then converted into its U.S. dollar equivalent at the foreign exchange rate in effect at the close of the NYSE on the day that the value of the security is determined. Over-the-counter (OTC) securities are valued within the range of the most recent quoted bid and ask prices. Securities that trade in multiple markets or on multiple exchanges are valued according to the broadest and most representative market. Certain equity securities are valued based upon fundamental characteristics or relationships to similar securities. Repurchase agreements are valued at cost, which approximates market value.
The Fund has procedures to determine the fair value of financial instruments for which market prices are not reliable or readily available. Under these procedures, the VLOC convenes on a regular basis to review such financial instruments and considers a number of factors, including significant unobservable valuation inputs, when arriving at fair value. The VLOC primarily employs a market-based approach which may use related or comparable assets or liabilities, recent transactions, market multiples, book values, and other relevant information for the investment to determine the fair value of the investment. An income-based valuation approach may also be used in which the anticipated future cash flows of the investment are discounted to calculate fair value. Discounts may also be applied due to the nature or duration of any restrictions on the disposition of the investments. Due to the inherent uncertainty of valuations of such investments, the fair values may differ significantly from the values that would have been used had an active market existed. The VLOC employs various methods for calibrating these valuation approaches including a regular review of key inputs and assumptions, transactional back-testing or disposition analysis, and reviews of any related market activity.
Trading in securities on foreign securities stock exchanges and OTC markets may be completed before the daily close of business on the NYSE. Occasionally, events occur between the time at which trading in a foreign security is completed and the close of the NYSE that might call into question the reliability of the value of a portfolio security held by the Fund. As a result, differences may arise between the value of the Fund’s portfolio securities as determined at the foreign market close and the latest indications of value at the close of the NYSE. In order to minimize the potential for these differences, the VLOC monitors price movements following the close of trading in foreign stock markets through a series of country specific market proxies (such as baskets of
FGR-17
Franklin Templeton Variable Insurance Products Trust
Notes to Financial Statements (continued)
Franklin Global Real Estate Securities Fund
1. ORGANIZATION AND SIGNIFICANT ACCOUNTING POLICIES (continued)
a. Financial Instrument Valuation (continued)
American Depositary Receipts, futures contracts and exchange traded funds). These price movements are measured against established trigger thresholds for each specific market proxy to assist in determining if an event has occurred that may call into question the reliability of the values of the foreign securities held by the Fund. If such an event occurs, the securities may be valued using fair value procedures, which may include the use of independent pricing services. At December 31, 2012, a market event occurred resulting in a portion of the securities held by the Fund being valued using fair value procedures.
b. Foreign Currency Translation
Portfolio securities and other assets and liabilities denominated in foreign currencies are translated into U.S. dollars based on the exchange rate of such currencies against U.S. dollars on the date of valuation. The Fund may enter into foreign currency exchange contracts to facilitate transactions denominated in a foreign currency. Purchases and sales of securities, income and expense items denominated in foreign currencies are translated into U.S. dollars at the exchange rate in effect on the transaction date. Portfolio securities and assets and liabilities denominated in foreign currencies contain risks that those currencies will decline in value relative to the U.S. dollar. Occasionally, events may impact the availability or reliability of foreign exchange rates used to convert the U.S. dollar equivalent value. If such an event occurs, the foreign exchange rate will be valued at fair value using procedures established and approved by the Board.
The Fund does not separately report the effect of changes in foreign exchange rates from changes in market prices on securities held. Such changes are included in net realized and unrealized gain or loss from investments on the Statement of Operations.
Realized foreign exchange gains or losses arise from sales of foreign currencies, currency gains or losses realized between the trade and settlement dates on securities transactions and the difference between the recorded amounts of dividends, interest, and foreign withholding taxes and the U.S. dollar equivalent of the amounts actually received or paid. Net unrealized foreign exchange gains and losses arise from changes in foreign exchange rates on foreign denominated assets and liabilities other than investments in securities held at the end of the reporting period.
c. Joint Repurchase Agreement
The Fund enters into a joint repurchase agreement whereby its uninvested cash balance is deposited into a joint cash account with other funds managed by the investment manager or an affiliate of the investment manager and is used to invest in one or more repurchase agreements. The value and face amount of the joint repurchase agreement are allocated to the funds based on their pro-rata interest. A repurchase agreement is accounted for as a loan by the fund to the seller, collateralized by securities which are delivered to the fund’s custodian. The market value, including accrued interest, of the initial collateralization is required to be at least 102% of the dollar amount invested by the funds, with the value of the underlying securities marked to market daily to maintain coverage of at least 100%. The joint repurchase agreement held by the Fund at year end had been entered into on December 31, 2012.
d. Income and Deferred Taxes
It is the Fund’s policy to qualify as a regulated investment company under the Internal Revenue Code. The Fund intends to distribute to shareholders substantially all of its taxable income and net realized gains to relieve it from federal income and if applicable, excise taxes. As a result, no provision for U.S. federal income taxes is required.
The Fund may be subject to foreign taxation related to income received, capital gains on the sale of securities and certain foreign currency transactions in the foreign jurisdictions in which it invests. Foreign taxes, if any, are recorded based on the tax regulations and rates that exist in the foreign markets in which the Fund invests. When a capital gain tax is determined to apply the Fund records an estimated deferred tax liability in an amount that would be payable if the securities were disposed of on the valuation date.
FGR-18
Franklin Templeton Variable Insurance Products Trust
Notes to Financial Statements (continued)
Franklin Global Real Estate Securities Fund
1. ORGANIZATION AND SIGNIFICANT ACCOUNTING POLICIES (continued)
d. Income and Deferred Taxes (continued)
The Fund recognizes the tax benefits of uncertain tax positions only when the position is “more likely than not” to be sustained upon examination by the tax authorities based on the technical merits of the tax position. As of December 31, 2012, and for all open tax years, the Fund has determined that no liability for unrecognized tax benefits is required in the Fund’s financial statements related to uncertain tax positions taken on a tax return (or expected to be taken on future tax returns). Open tax years are those that remain subject to examination and are based on each tax jurisdiction statute of limitation.
e. Security Transactions, Investment Income, Expenses and Distributions
Security transactions are accounted for on trade date. Realized gains and losses on security transactions are determined on a specific identification basis. Interest income and estimated expenses are accrued daily. Dividend income is recorded on the ex-dividend date except that certain dividends from foreign securities are recognized as soon as the Fund is notified of the ex-dividend date. Distributions to shareholders are recorded on the ex-dividend date and are determined according to income tax regulations (tax basis). Distributable earnings determined on a tax basis may differ from earnings recorded in accordance with accounting principles generally accepted in the United States of America. These differences may be permanent or temporary. Permanent differences are reclassified among capital accounts to reflect their tax character. These reclassifications have no impact on net assets or the results of operations. Temporary differences are not reclassified, as they may reverse in subsequent periods.
Common expenses incurred by the Trust are allocated among the funds based on the ratio of net assets of each fund to the combined net assets of the Trust. Fund specific expenses are charged directly to the fund that incurred the expense.
Realized and unrealized gains and losses and net investment income, not including class specific expenses, are allocated daily to each class of shares based upon the relative proportion of net assets of each class. Differences in per share distributions, by class, are generally due to differences in class specific expenses.
Distributions received by the Fund from certain securities may be a return of capital (ROC). Such distributions reduce the cost basis of the securities, and any distributions in excess of the cost basis are recognized as capital gains.
f. Accounting Estimates
The preparation of financial statements in accordance with accounting principles generally accepted in the United States of America requires management to make estimates and assumptions that affect the reported amounts of assets and liabilities at the date of the financial statements and the amounts of income and expenses during the reporting period. Actual results could differ from those estimates.
g. Guarantees and Indemnifications
Under the Trust’s organizational documents, its officers and trustees are indemnified by the Trust against certain liabilities arising out of the performance of their duties to the Trust. Additionally, in the normal course of business, the Trust, on behalf of the Fund, enters into contracts with service providers that contain general indemnification clauses. The Trust’s maximum exposure under these arrangements is unknown as this would involve future claims that may be made against the Trust that have not yet occurred. Currently, the Trust expects the risk of loss to be remote.
FGR-19
Franklin Templeton Variable Insurance Products Trust
Notes to Financial Statements (continued)
Franklin Global Real Estate Securities Fund
2. SHARES OF BENEFICIAL INTEREST
At December 31, 2012, there were an unlimited number of shares authorized (without par value). Transactions in the Fund’s shares were as follows:
| | | | | | | | | | | | | | | | |
| | | Year Ended December 31, | |
| | | 2012 | | | 2011 a | |
| Class 1 Shares: | | Shares | | | Amount | | | Shares | | | Amount | |
Shares sold | | | 24,042 | | | $ | 319,447 | | | | 55,042 | | | $ | 671,863 | |
Shares issued in reinvestment of distributions | | | — | | | | — | | | | 235,958 | | | | 2,965,988 | |
Shares redeemed | | | (343,706 | ) | | | (4,532,627 | ) | | | (438,527 | ) | | | (5,523,256 | ) |
| | | | |
Net increase (decrease) | | | (319,664 | ) | | $ | (4,213,180 | ) | | | (147,527 | ) | | $ | (1,885,405 | ) |
| | | | |
Class 2 Shares: | | | | | | | | | | | | | | | | |
Shares sold | | | 1,413,036 | | | $ | 18,012,410 | | | | 620,268 | | | $ | 7,524,987 | |
Shares issued in reinvestment of distributions | | | — | | | | — | | | | 2,103,291 | | | | 25,849,452 | |
Shares redeemed | | | (3,409,902 | ) | | | (43,598,807 | ) | | | (4,127,293 | ) | | | (50,732,090 | ) |
| | | | |
Net increase (decrease) | | | (1,996,866 | ) | | $ | (25,586,397 | ) | | | (1,403,734 | ) | | $ | (17,357,651 | ) |
| | | | |
Class 4 Shares: | | | | | | | | | | | | | | | | |
Shares redeemed | | | | | | | | | | | (214 | ) | | $ | (2,896 | ) |
| | | | | | | | | | |
Net increase (decrease) | | | | | | | | | | | (214 | ) | | $ | (2,896 | ) |
| | | | | | | | | | |
| aEffective | March 4, 2011, Class 4 was liquidated. |
3. TRANSACTIONS WITH AFFILIATES
Franklin Resources, Inc. is the holding company for various subsidiaries that together are referred to as Franklin Templeton Investments. Certain officers and trustees of the Fund are also officers and/or directors of the following subsidiaries:
| | |
| Subsidiary | | Affiliation |
Franklin Templeton Institutional, LLC (FT Institutional) | | Investment manager |
Franklin Templeton Services, LLC (FT Services) | | Administrative manager |
Franklin Templeton Distributors, Inc. (Distributors) | | Principal underwriter |
Franklin Templeton Investor Services, LLC (Investor Services) | | Transfer agent |
a. Management Fees
The Fund pays an investment management fee to FT Institutional based on the average daily net assets of the Fund as follows:
| | |
| Annualized Fee Rate | | Net Assets |
| 0.800% | | Up to and including $500 million |
| 0.700% | | Over $500 million, up to and including $1 billion |
| 0.650% | | Over $1 billion, up to and including $1.5 billion |
| 0.600% | | Over $1.5 billion, up to and including $6.5 billion |
| 0.580% | | Over $6.5 billion, up to and including $11.5 billion |
| 0.560% | | Over $11.5 billion, up to and including $16.5 billion |
| 0.540% | | Over $16.5 billion, up to and including $19 billion |
| 0.530% | | Over $19 billion, up to and including $21.5 billion |
| 0.520% | | In excess of $21.5 billion |
FGR-20
Franklin Templeton Variable Insurance Products Trust
Notes to Financial Statements (continued)
Franklin Global Real Estate Securities Fund
3. TRANSACTIONS WITH AFFILIATES (continued)
b. Administrative Fees
The Fund pays an administrative fee to FT Services of 0.25% per year of the average daily net assets of the Fund.
c. Distribution Fees
The Board has adopted a distribution plan for Class 2 shares pursuant to Rule 12b-1 under the 1940 Act. Under the Fund’s compensation distribution plan, the Fund pays Distributors for costs incurred in connection with the servicing, sale and distribution of the Fund’s shares up to 0.35% per year of its average daily net assets. Some distribution fees are not charged on shares held by affiliates. The Board has agreed to limit the current rate to 0.25% per year for Class 2.
d. Transfer Agent Fees
Investor Services, under terms of an agreement, performs shareholder servicing for the Fund and is not paid by the Fund for the services.
e. Waiver and Expense Reimbursements
FT Services and FT Institutional have contractually agreed in advance to waive or limit their respective fees so that the increase in the Fund’s investment management and fund administration fees that became effective May 1, 2007 is phased in over a five year period, with there being no increase in the rate of such fees for the first year ending April 30, 2008. For each of the four years thereafter through April 30, 2012, the manager and administrator will receive one-fifth of the increase in the rate of fees. Beginning May 1, 2012, the full new investment management and administrative fees were in effect.
4. EXPENSE OFFSET ARRANGEMENT
The Fund has entered into an arrangement with its custodian whereby credits realized as a result of uninvested cash balances are used to reduce a portion of the Fund’s custodian expenses. During the year ended December 31, 2012, there were no credits earned.
5. INCOME TAXES
For tax purposes, capital losses may be carried over to offset future capital gains, if any. Capital loss carryforwards with no expiration, if any, must be fully utilized before those losses with expiration dates.
At December 31, 2012, capital loss carryforwards were as follows:
| | | | |
Capital loss carryforwards expiring in: | | | | |
2016 | | $ | 135,749,499 | |
2017 | | | 207,448,609 | |
2018 | | | 2,192,369 | |
| | | | |
| | $ | 345,390,477 | |
| | | | |
During the year ended December 31, 2012, the Fund utilized $10,979,261 of capital loss carryforwards.
The tax character of distributions paid during the years ended December 31, 2012 and 2011, was as follows:
| | | | | | | | |
| | | 2012 | | | 2011 | |
Distributions paid from ordinary income | | $ | — | | | $ | 28,815,440 | |
FGR-21
Franklin Templeton Variable Insurance Products Trust
Notes to Financial Statements (continued)
Franklin Global Real Estate Securities Fund
5. INCOME TAXES (continued)
At December 31, 2012, the cost of investments, net unrealized appreciation (depreciation) and undistributed ordinary income for income tax purposes were as follows:
| | | | |
Cost of investments | | $ | 286,447,839 | |
| | | | |
Unrealized appreciation | | $ | 114,965,352 | |
Unrealized depreciation | | | (19,251,245 | ) |
| | | | |
Net unrealized appreciation (depreciation) | | $ | 95,714,107 | |
| | | | |
Distributable earnings – undistributed ordinary income | | $ | 18,426,036 | |
| | | | |
Differences between income and/or capital gains as determined on a book basis and a tax basis are primarily due to differing treatments of passive foreign investment company shares and wash sales.
6. INVESTMENT TRANSACTIONS
Purchases and sales of investments (excluding short term securities) for the year ended December 31, 2012, aggregated $78,667,774 and $97,800,381, respectively.
7. CONCENTRATION OF RISK
Investing in foreign securities may include certain risks and considerations not typically associated with investing in U.S. securities, such as fluctuating currency values and changing local and regional economic, political and social conditions, which may result in greater market volatility. In addition, certain foreign securities may not be as liquid as U.S. securities.
8. CREDIT FACILITY
The Fund, together with other U.S. registered and foreign investment funds (collectively, Borrowers), managed by Franklin Templeton Investments, are borrowers in a joint syndicated senior unsecured credit facility totaling $1.5 billion (Global Credit Facility) which matured on January 18, 2013. This Global Credit Facility provides a source of funds to the Borrowers for temporary and emergency purposes, including the ability to meet future unanticipated or unusually large redemption requests. Effective January 18, 2013, the Borrowers renewed the Global Credit Facility which matures on January 17, 2014.
Under the terms of the Global Credit Facility, the Fund shall, in addition to interest charged on any borrowings made by the Fund and other costs incurred by the Fund, pay its share of fees and expenses incurred in connection with the implementation and maintenance of the Global Credit Facility, based upon its relative share of the aggregate net assets of all of the Borrowers, including an annual commitment fee of 0.07% based upon the unused portion of the Global Credit Facility. These fees are reflected in other expenses on the Statement of Operations. During the year ended December 31, 2012, the Fund did not use the Global Credit Facility.
9. FAIR VALUE MEASUREMENTS
The Fund follows a fair value hierarchy that distinguishes between market data obtained from independent sources (observable inputs) and the Fund’s own market assumptions (unobservable inputs). These inputs are used in determining the value of the Fund’s financial instruments and are summarized in the following fair value hierarchy:
| | • | | Level 1 – quoted prices in active markets for identical financial instruments |
| | • | | Level 2 – other significant observable inputs (including quoted prices for similar financial instruments, interest rates, prepayment speed, credit risk, etc.) |
FGR-22
Franklin Templeton Variable Insurance Products Trust
Notes to Financial Statements (continued)
Franklin Global Real Estate Securities Fund
9. FAIR VALUE MEASUREMENTS (continued)
| | • | | Level 3 – significant unobservable inputs (including the Fund’s own assumptions in determining the fair value of financial instruments) |
The inputs or methodology used for valuing financial instruments are not an indication of the risk associated with investing in those financial instruments.
For movements between the levels within the fair value hierarchy, the Fund has adopted a policy of recognizing the transfers as of the date of the underlying event which caused the movement. Additionally, at December 31, 2012, due to market events, the Fund employed fair value procedures to value a portion of its holdings. Such procedures resulted in a temporary transfer of financial instruments valued at $140,244,200 from Level 1 to Level 2 within the fair value hierarchy.
A summary of inputs used as of December 31, 2012, in valuing the Fund’s assets carried at fair value, is as follows:
| | | | | | | | | | | | | | | | |
| | | Level 1 | | | Level 2 | | | Level 3 | | | Total | |
| | | | |
Assets: | | | | | | | | | | | | | | | | |
Investments in Securities: | | | | | | | | | | | | | | | | |
Equity Investments: | | | | | | | | | | | | | | | | |
Diversified Real Estate Activities | | $ | 20,751,437 | | | $ | 31,168,287 | | | $ | — | | | $ | 51,919,724 | |
Diversified REITs | | | 13,122,782 | | | | 26,300,986 | | | | — | | | | 39,423,768 | |
Industrial REITs | | | 9,324,726 | | | | 8,299,262 | | | | — | | | | 17,623,988 | |
Office REITs | | | 26,463,540 | | | | 10,911,601 | | | | — | | | | 37,375,141 | |
Real Estate Development | | | 10,040,904 | | | | 3,004,652 | | | | — | | | | 13,045,556 | |
Real Estate Operating Companies | | | 15,360,936 | | | | 16,375,608 | | | | — | | | | 31,736,544 | |
Retail REITs | | | 61,948,381 | | | | 43,002,957 | | | | — | | | | 104,951,338 | |
Specialized REITs | | | 44,278,774 | | | | 1,180,847 | | | | — | | | | 45,459,621 | |
All Other Equity Investmentsa | | | 35,679,086 | | | | — | | | | — | | | | 35,679,086 | |
Short Term Investments | | | — | | | | 4,947,180 | | | | — | | | | 4,947,180 | |
| | | | |
Total Investments in Securities | | $ | 236,970,566 | | | $ | 145,191,380 | | | $ | — | | | $ | 382,161,946 | |
| | | | |
aFor detailed categories, see the accompanying Statement of Investments.
10. NEW ACCOUNTING PRONOUNCEMENTS
In December 2011, the Financial Accounting Standards Board (FASB) issued Accounting Standards Update (ASU) No. 2011-11, Balance Sheet (Topic 210): Disclosures about Offsetting Assets and Liabilities. The amendments in the ASU enhance disclosures about offsetting of financial assets and liabilities to enable investors to understand the effect of these arrangements on a fund’s financial position. In January 2013, FASB issued ASU No. 2013-01, Balance Sheet (Topic 210): Clarifying the Scope of Disclosures about Offsetting Assets and Liabilities. The amendments in ASU No. 2013-01 clarify the intended scope of disclosures required by ASU No. 2011-11. These ASUs are effective for interim and annual reporting periods beginning on or after January 1, 2013. The Fund believes the adoption of these ASUs will not have a material impact on its financial statements.
11. SUBSEQUENT EVENTS
The Fund has evaluated subsequent events through the issuance of the financial statements and determined that no events have occurred that require disclosure other than those already disclosed in the financial statements.
FGR-23
Franklin Templeton Variable Insurance Products Trust
Notes to Financial Statements (continued)
Franklin Global Real Estate Securities Fund
| | | | |
ABBREVIATIONS | | | | |
| Selected Portfolio | | | | |
| | | | |
| ETF - Exchange Traded Fund | | | | |
| REIT - Real Estate Investment Trust | | | | |
| SPDR - S&P Depositary Receipt | | | | |
FGR-24
Franklin Templeton Variable Insurance Products Trust
Franklin Global Real Estate Securities Fund
Report of Independent Registered Public Accounting Firm
To the Board of Trustees and Shareholders of
Franklin Templeton Variable Insurance Products Trust
In our opinion, the accompanying statement of assets and liabilities, including the statement of investments, and the related statements of operations and of changes in net assets and the financial highlights present fairly, in all material respects, the financial position of Franklin Global Real Estate Securities Fund (the “Fund”) at December 31, 2012, the results of its operations for the year then ended, the changes in its net assets for each of the two years in the period then ended and the financial highlights for each of the five years in the period then ended, in conformity with accounting principles generally accepted in the United States of America. These financial statements and financial highlights (hereafter referred to as “financial statements”) are the responsibility of the Fund’s management. Our responsibility is to express an opinion on these financial statements based on our audits. We conducted our audits of these financial statements in accordance with the standards of the Public Company Accounting Oversight Board (United States). Those standards require that we plan and perform the audit to obtain reasonable assurance about whether the financial statements are free of material misstatement. An audit includes examining, on a test basis, evidence supporting the amounts and disclosures in the financial statements, assessing the accounting principles used and significant estimates made by management, and evaluating the overall financial statement presentation. We believe that our audits, which included confirmation of securities at December 31, 2012 by correspondence with the custodian and brokers, provide a reasonable basis for our opinion.
PricewaterhouseCoopers LLP
San Francisco, California
February 15, 2013
FGR-25
Franklin Templeton Variable Insurance Products Trust
Tax Information (unaudited)
Franklin Global Real Estate Securities Fund
At December 31, 2012, more than 50% of the Fund’s total assets were invested in securities of foreign issuers. In most instances, foreign taxes were withheld from income paid to the Fund on these investments. The Fund elects to treat foreign taxes paid as allowed under Section 853 of the Internal Revenue Code. This election will allow shareholders of record as of the 2013 distribution date, to treat their proportionate share of foreign taxes paid by the Fund as having been paid directly by them. The shareholder shall consider these amounts as foreign taxes paid in the tax year in which they receive the Fund distribution.
FGR-26
FRANKLIN GROWTHAND INCOME SECURITIES FUND
This annual report for Franklin Growth and Income Securities Fund covers the fiscal year ended December 31, 2012.
Performance Summary as of 12/31/12
Average annual total return of Class 2 shares represents the average annual change in value, assuming reinvestment of dividends and capital gains. Average returns smooth out variations in returns, which can be significant; they are not the same as year-by-year results.
Periods ended 12/31/12
| | | | | | | | | | | | |
| | | 1-Year | | | 5-Year | | | 10-Year | |
Average Annual Total Return | | | +12.23% | | | | +1.94% | | | | +5.94% | |
Total Return Index Comparison for a Hypothetical $10,000 Investment (1/1/03–12/31/12)
The graph below shows the change in value of a hypothetical $10,000 investment in the Fund over the indicated period and includes reinvestment of any income or distributions. The Fund’s performance is compared to the performance of the Standard & Poor’s® 500 Index (S&P 500®), the Lipper VIP Equity Income Funds Classification Average and the Consumer Price Index (CPI). One cannot invest directly in an index, and an index is not representative of the Fund’s portfolio. Please see Important Notes to Performance Information preceding the Fund Summaries.
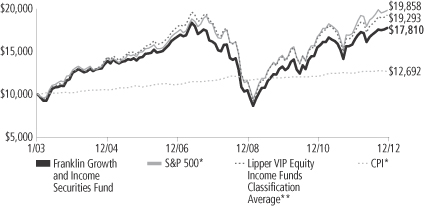
*Source: © 2013 Morningstar. Please see Index Descriptions following the Fund Summaries.
**Source: Lipper Inc. Please see Index Descriptions following the Fund Summaries.
Franklin Growth and Income Securities Fund Class 2
Performance reflects the Fund’s Class 2 operating expenses, but does not include any contract fees, expenses or sales charges. If they had been included, performance would be lower. These charges and deductions, particularly for variable life policies, can have a significant effect on contract values and insurance benefits. See the contract prospectus for a complete description of these expenses, including sales charges.
Performance data represent past performance, which does not guarantee future results. Investment return and principal value will fluctuate, and you may have a gain or loss when you sell your shares.
Current performance may differ from figures shown.
FGI-1
Fund Goals and Main Investments: Franklin Growth and Income Securities Fund seeks capital appreciation with current income as a secondary goal. Under normal market conditions, the Fund invests predominantly in equity securities, including securities convertible into common stock.
Performance Overview
You can find the Fund’s one-year total return in the Performance Summary. The Fund underperformed its benchmark, the S&P 500, which produced a +16.00% total return.1 The Fund also underperformed its peers as measured by the Lipper VIP Equity Income Funds Classification Average, which posted a +14.99% return for the same period.2
Economic and Market Overview
The U.S. economy, as measured by gross domestic product, grew moderately in 2012, supported by positive construction, housing and labor market trends. U.S. home prices increased in most regions due to higher demand based on near to record-low mortgage rates, affordable housing prices, low new-home inventories and a five-year low in U.S. foreclosures. Home construction became a leading source of economic growth after reaching a multi-year high in 2012, further enhancing confidence in the housing market. Consumer spending and personal income levels climbed, and inflation was generally mild with the exception of energy and food prices. Consumer sentiment reached its highest level in five years, although the potential U.S. tax hikes and spending cuts scheduled to take effect in 2013 dampened confidence near year-end. Nevertheless, the federal budget deficit for fiscal year 2012 fell to its lowest level since 2008. Just after year-end, Congress passed compromise legislation that preserved lower income tax rates for most U.S. households and delayed far-reaching federal spending cuts.
For the 12-month period, U.S. stocks, as measured by the S&P 500, fluctuated as investors reacted to news headlines and shifted between risk taking and risk aversion. Toward period-end uncertainty eased surrounding the European fiscal crisis as leaders made progress on economic reforms and management of Greek debt, but slowing economic growth in Asia, particularly China, curbed global economic recovery and markets. In its December meeting, the Federal Open
1. Source: © 2013 Morningstar.
2. Source: Lipper Inc.
One cannot invest directly in an index, and an index is not representative of the Fund’s portfolio. Please see Index Descriptions following the Fund Summaries.
Fund Risks: All investments involve risks, including possible loss of principal. Stock prices fluctuate, sometimes rapidly and dramatically, due to factors affecting individual companies, particular industries or sectors, or general market conditions. Convertible securities are subject to the risks of stocks when the underlying stock price is high relative to the conversion price and debt securities when the underlying stock price is low relative to the conversion price. The Fund’s investment in foreign securities also involves special risks, including currency fluctuations and economic as well as political uncertainty. The Fund is actively managed but there is no guarantee that the manager’s investment decisions will produce the desired results. The Fund’s prospectus also includes a description of the main investment risks.
FGI-2
Market Committee (FOMC) announced a 6.5% unemployment target as a guide to maintaining the historically low federal funds target rate. The FOMC also said it intended to continue purchasing longer term Treasuries and agency mortgage-backed securities. Despite modest third-quarter U.S. company revenues suggesting a drop in global demand, a hard-fought national election and budget deadline concerns, domestic stock markets made strong gains for the year. Value stocks generally outperformed growth stocks, and all sectors generated positive returns, as represented by the S&P 500. Not all investors favored stocks, however, and many sought perceived safe havens such as gold bullion, the Japanese yen and U.S. Treasuries. By year-end, the yield on the 10-year U.S. Treasury note declined to 1.78% from 1.89% at the beginning of 2012.
Investment Strategy
We seek to invest in a broadly diversified portfolio of equity securities that we consider to be financially strong, with a focus on “blue chip” companies. We apply a bottom-up approach to investing in individual securities. We will assess the market price of a company’s securities relative to our evaluation of the company’s long-term earnings, asset value and cash flow potential. We also consider a company’s price/earnings ratio, profit margins, balance sheet and liquidation value. We consider dividend yield in selecting stocks for the Fund because we believe that, over time, dividend income can contribute significantly to total return and can be a more consistent source of investment return than capital appreciation. We seek to take advantage of price dislocations that result from the market’s short-term focus and choose to invest in those companies that, in our opinion, offer the best trade-off between growth opportunity, business and financial risk, and valuation.
Manager’s Discussion
Nearly every sector the Fund invested in rose in value, as did most of the portfolio’s individual securities, supporting overall performance during the Fund’s fiscal year. Key contributing sectors included financials, consumer discretionary and industrials. Within the financials sector, convertible preferred and common stock holdings of diversified financial services company Bank of America were key contributors, as were common stock holdings of JPMorgan Chase & Co. Insurer Aflac was another key contributor among financials. The Fund’s consumer discretionary holdings were led by cable company Comcast and retail chain operators Lowe’s, which specializes in home improvement, and Limited Brands, which focuses on apparel and personal care products.
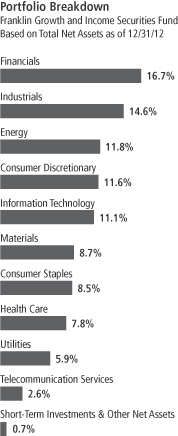
FGI-3
Among industrials, leading performers included conglomerate General Electric and trucking company J.B. Hunt Transport Services, where growth in the intermodal transportation division helped the company post strong earnings and increase its dividend.
In contrast, some disappointing investments, mainly in the energy, materials and utilities sectors, hindered the Fund’s results. Major energy sector detractors included equity-linked investments in oilfield services firm Halliburton and shares of natural gas producer Spectra Energy, which was hurt by low natural gas prices. In the materials sector, notable detractors included Dow Chemical and mining companies Freeport-McMoRan Copper & Gold equity-linked notes and AngloGold Ashanti Holdings Finance convertible preferred stock. Among utilities, investments in PG&E and Duke Energy detracted from performance.
Thank you for your participation in Franklin Growth and Income Securities Fund. We look forward to serving your future investment needs.
The foregoing information reflects our analysis, opinions and portfolio holdings as of December 31, 2012, the end of the reporting period. The way we implement our main investment strategies and the resulting portfolio holdings may change depending on factors such as market and economic conditions. These opinions may not be relied upon as investment advice or an offer for a particular security. The information is not a complete analysis of every aspect of any market, country, industry, security or the Fund. Statements of fact are from sources considered reliable, but the investment manager makes no representation or warranty as to their completeness or accuracy. Although historical performance is no guarantee of future results, these insights may help you understand our investment management philosophy.
Top 10 Holdings
Franklin Growth and Income Securities Fund
12/31/12
| | | | |
Company
Sector/Industry | | % of Total
Net Assets | |
| JPMorgan Chase & Co. | | | 2.5% | |
| Financials | | | | |
| Exxon Mobil Corp. | | | 2.2% | |
| Energy | | | | |
| General Electric Co. | | | 2.2% | |
| Industrials | | | | |
| NIKE Inc., B | | | 2.1% | |
| Consumer Discretionary | | | | |
| BlackRock Inc. | | | 2.1% | |
| Financials | | | | |
| Cisco Systems Inc. | | | 2.1% | |
| Information Technology | | | | |
| Honeywell International Inc. | | | 2.1% | |
| Industrials | | | | |
| Royal Dutch Shell PLC, A | | | 2.0% | |
| Energy | | | | |
| Bank of America Corp., ord. & cvt. pfd. | | | 2.0% | |
| Financials | | | | |
| Aflac Inc. | | | 2.0% | |
| Financials | | | | |
The dollar value, number of shares or principal amount, and names of all portfolio holdings are listed in the Fund’s Statement of Investments.
FGI-4
Fund Expenses
As an investor in a variable insurance contract (Contract) that indirectly provides for investment in an underlying mutual fund, you can incur transaction and/or ongoing expenses at both the Fund level and the Contract level.
| • | | Transaction expenses can include sales charges (loads) on purchases, redemption fees, surrender fees, transfer fees and premium taxes. |
| • | | Ongoing expenses can include management fees, distribution and service (12b-1) fees, contract fees, annual maintenance fees, mortality and expense risk fees and other fees and expenses. All mutual funds and Contracts have some types of ongoing expenses. |
The expenses shown in the table are meant to highlight ongoing expenses at the Fund level only and do not include ongoing expenses at the Contract level, or transaction expenses at either the Fund or Contract level. While the Fund does not have transaction expenses, if the transaction and ongoing expenses at the Contract level were included, the expenses shown would be higher. You should consult your Contract prospectus or disclosure document for more information.
The table shows Fund-level ongoing expenses and can help you understand these expenses and compare them with those of other mutual funds offered through the Contract. The table assumes a $1,000 investment held for the six months indicated. Please refer to the Fund prospectus for additional information on operating expenses.
Actual Fund Expenses
The first line (Actual) of the table provides actual account values and expenses. The “Ending Account Value” is derived from the Fund’s actual return, which includes the effect of ongoing Fund expenses, but does not include the effect of ongoing Contract expenses.
You can estimate the Fund-level expenses you incurred during the period by following these steps. Of course, your account value and expenses will differ from those in this illustration:
| 1. | Divide your account value by $1,000. |
If an account had an $8,600 value, then $8,600 ÷ $1,000 = 8.6.
| 2. | Multiply the result by the number under the heading “Fund-Level Expenses Incurred During Period.” |
If Fund-Level Expenses Incurred During Period were $7.50, then 8.6 x $7.50 = $64.50.
In this illustration, the estimated expenses incurred this period at the Fund level are $64.50.
Franklin Growth and Income Securities Fund Class 2
FGI-5
Hypothetical Example for Comparison with Other Mutual Funds
Information in the second line (Hypothetical) of the table can help you compare ongoing expenses of the Fund with those of other mutual funds offered through the Contract. This information may not be used to estimate the actual ending account balance or expenses you incurred during the period. The hypothetical “Ending Account Value” is based on the Fund’s actual expense ratio and an assumed 5% annual rate of return before expenses, which does not represent the Fund’s actual return. The figure under the heading “Fund-Level Expenses Incurred During Period” shows the hypothetical expenses your account would have incurred under this scenario. You can compare this figure with the 5% hypothetical examples that appear in shareholder reports of other funds offered through a Contract.
| | | | | | | | | | | | |
| Class 2 | | Beginning
Account Value 7/1/12 | | | Ending
Account
Value 12/31/12 | | | Fund-Level Expenses Incurred
During Period* 7/1/12–12/31/12 | |
Actual | | $ | 1,000 | | | $ | 1,062.20 | | | $ | 4.41 | |
Hypothetical (5% return before
expenses) | | $ | 1,000 | | | $ | 1,020.86 | | | $ | 4.32 | |
*Expenses are calculated using the most recent six-month annualized expense ratio for the Fund’s Class 2 shares (0.85%), which does not include any ongoing expenses of the Contract for which the Fund is an investment option, multiplied by the average account value over the period, multiplied by 184/366 to reflect the one-half year period.
FGI-6
Franklin Templeton Variable Insurance Products Trust
Financial Highlights
Franklin Growth and Income Securities Fund
| | | | | | | | | | | | | | | | | | | | |
| | | Year Ended December 31, | |
| Class 1 | | 2012 | | | 2011 | | | 2010 | | | 2009 | | | 2008 | |
| | | | |
Per share operating performance | | | | | | | | | | | | | | | | | | | | |
(for a share outstanding throughout the year) | | | | | | | | | | | | | | | | | | | | |
Net asset value, beginning of year | | $ | 11.60 | | | $ | 11.76 | | | $ | 10.47 | | | $ | 8.72 | | | $ | 15.07 | |
| | | | |
Income from investment operationsa: | | | | | | | | | | | | | | | | | | | | |
Net investment incomeb | | | 0.35 | | | | 0.33 | | | | 0.38 | | | | 0.31 | | | | 0.39 | |
Net realized and unrealized gains (losses) | | | 1.08 | | | | (0.03 | ) | | | 1.32 | | | | 1.92 | | | | (5.17 | ) |
| | | | |
Total from investment operations | | | 1.43 | | | | 0.30 | | | | 1.70 | | | | 2.23 | | | | (4.78 | ) |
| | | | |
Less distributions from: | | | | | | | | | | | | | | | | | | | | |
Net investment income | | | (0.39 | ) | | | (0.46 | ) | | | (0.41 | ) | | | (0.48 | ) | | | (0.45 | ) |
Net realized gains | | | — | | | | — | | | | — | | | | — | | | | (1.12 | ) |
| | | | |
Total distributions | | | (0.39 | ) | | | (0.46 | ) | | | (0.41 | ) | | | (0.48 | ) | | | (1.57 | ) |
| | | | |
Net asset value, end of year | | $ | 12.64 | | | $ | 11.60 | | | $ | 11.76 | | | $ | 10.47 | | | $ | 8.72 | |
| | | | |
| | | | | |
Total returnc | | | 12.53% | | | | 2.64% | | | | 16.93% | | | | 26.82% | | | | (34.95)% | |
Ratios to average net assets | | | | | | | | | | | | | | | | | | | | |
Expenses | | | 0.60% | | | | 0.59% | | | | 0.59% | | | | 0.60% | d | | | 0.55% | d |
Net investment income | | | 2.86% | | | | 2.80% | | | | 3.62% | | | | 3.46% | | | | 3.17% | |
| | | | | |
Supplemental data | | | | | | | | | | | | | | | | | | | | |
Net assets, end of year (000’s) | | $ | 154,463 | | | $ | 156,830 | | | $ | 176,590 | | | $ | 174,403 | | | $ | 162,936 | |
Portfolio turnover rate | | | 30.00% | | | | 32.93% | | | | 26.83% | | | | 51.05% | | | | 30.66% | |
aThe amount shown for a share outstanding throughout the period may not correlate with the Statement of Operations for the period due to the timing of sales and repurchases of the Fund shares in relation to income earned and/or fluctuating market value of the investments of the Fund.
bBased on average daily shares outstanding.
cTotal return does not include fees, charges or expenses imposed by the variable annuity and life insurance contracts for which the Franklin Templeton Variable Insurance Products Trust serves as an underlying investment vehicle.
dBenefit of expense reduction rounds to less than 0.01%.
The accompanying notes are an integral part of these financial statements.
FGI-7
Franklin Templeton Variable Insurance Products Trust
Financial Highlights (continued)
Franklin Growth and Income Securities Fund
| | | | | | | | | | | | | | | | | | | | |
| | | Year Ended December 31, | |
| Class 2 | | 2012 | | | 2011 | | | 2010 | | | 2009 | | | 2008 | |
| | | | |
Per share operating performance | | | | | | | | | | | | | | | | | | | | |
(for a share outstanding throughout the year) | | | | | | | | | | | | | | | | | | | | |
Net asset value, beginning of year | | $ | 11.44 | | | $ | 11.60 | | | $ | 10.33 | | | $ | 8.59 | | | $ | 14.86 | |
| | | | |
Income from investment operationsa: | | | | | | | | | | | | | | | | | | | | |
Net investment incomeb | | | 0.32 | | | | 0.29 | | | | 0.35 | | | | 0.28 | | | | 0.35 | |
Net realized and unrealized gains (losses) | | | 1.05 | | | | (0.02 | ) | | | 1.31 | | | | 1.90 | | | | (5.10 | ) |
| | | | |
Total from investment operations | | | 1.37 | | | | 0.27 | | | | 1.66 | | | | 2.18 | | | | (4.75 | ) |
| | | | |
Less distributions from: | | | | | | | | | | | | | | | | | | | | |
Net investment income | | | (0.35 | ) | | | (0.43 | ) | | | (0.39 | ) | | | (0.44 | ) | | | (0.40 | ) |
Net realized gains | | | — | | | | — | | | | — | | | | — | | | | (1.12 | ) |
| | | | |
Total distributions | | | (0.35 | ) | | | (0.43 | ) | | | (0.39 | ) | | | (0.44 | ) | | | (1.52 | ) |
| | | | |
Net asset value, end of year | | $ | 12.46 | | | $ | 11.44 | | | $ | 11.60 | | | $ | 10.33 | | | $ | 8.59 | |
| | | | |
| | | | | |
Total returnc | | | 12.23% | | | | 2.41% | | | | 16.68% | | | | 26.55% | | | | (35.14)% | |
Ratios to average net assets | | | | | | | | | | | | | | | | | | | | |
Expenses | | | 0.85% | | | | 0.84% | | | | 0.84% | | | | 0.85% | d | | | 0.80% | d |
Net investment income | | | 2.61% | | | | 2.55% | | | | 3.37% | | | | 3.21% | | | | 2.92% | |
| | | | | |
Supplemental data | | | | | | | | | | | | | | | | | | | | |
Net assets, end of year (000’s) | | $ | 131,400 | | | $ | 129,309 | | | $ | 151,481 | | | $ | 152,077 | | | $ | 141,359 | |
Portfolio turnover rate | | | 30.00% | | | | 32.93% | | | | 26.83% | | | | 51.05% | | | | 30.66% | |
aThe amount shown for a share outstanding throughout the period may not correlate with the Statement of Operations for the period due to the timing of sales and repurchases of the Fund shares in relation to income earned and/or fluctuating market value of the investments of the Fund.
bBased on average daily shares outstanding.
cTotal return does not include fees, charges or expenses imposed by the variable annuity and life insurance contracts for which the Franklin Templeton Variable Insurance Products Trust serves as an underlying investment vehicle.
dBenefit of expense reduction rounds to less than 0.01%.
The accompanying notes are an integral part of these financial statements.
FGI-8
Franklin Templeton Variable Insurance Products Trust
Statement of Investments, December 31, 2012
| | | | | | | | | | |
| Franklin Growth and Income Securities Fund | | Country | | Shares | | | Value | |
Common Stocks 88.1% | | | | | | | | | | |
Consumer Discretionary 10.4% | | | | | | | | | | |
Comcast Corp., A | | United States | | | 115,680 | | | $ | 4,324,119 | |
Limited Brands Inc. | | United States | | | 92,200 | | | | 4,338,932 | |
Lowe’s Cos. Inc. | | United States | | | 116,000 | | | | 4,120,320 | |
McDonald’s Corp. | | United States | | | 62,600 | | | | 5,521,946 | |
NIKE Inc., B | | United States | | | 118,400 | | | | 6,109,440 | |
Target Corp. | | United States | | | 88,500 | | | | 5,236,545 | |
| | | | | | | | | | |
| | | | | | | | | 29,651,302 | |
| | | | | | | | | | |
Consumer Staples 8.5% | | | | | | | | | | |
The Coca-Cola Co. | | United States | | | 83,200 | | | | 3,016,000 | |
Diageo PLC, ADR | | United Kingdom | | | 44,100 | | | | 5,141,178 | |
Kellogg Co. | | United States | | | 78,900 | | | | 4,406,565 | |
PepsiCo Inc. | | United States | | | 72,300 | | | | 4,947,489 | |
The Procter & Gamble Co. | | United States | | | 45,600 | | | | 3,095,784 | |
Unilever NV, N.Y. shs. | | Netherlands | | | 93,800 | | | | 3,592,540 | |
| | | | | | | | | | |
| | | | | | | | | 24,199,556 | |
| | | | | | | | | | |
Energy 8.1% | | | | | | | | | | |
BP PLC, ADR | | United Kingdom | | | 66,900 | | | | 2,785,716 | |
Chevron Corp. | | United States | | | 47,000 | | | | 5,082,580 | |
Exxon Mobil Corp. | | United States | | | 71,944 | | | | 6,226,753 | |
Royal Dutch Shell PLC, A, ADR | | United Kingdom | | | 83,100 | | | | 5,729,745 | |
Spectra Energy Corp. | | United States | | | 126,700 | | | | 3,469,046 | |
| | | | | | | | | | |
| | | | | | | | | 23,293,840 | |
| | | | | | | | | | |
Financials 14.2% | | | | | | | | | | |
Aflac Inc. | | United States | | | 105,000 | | | | 5,577,600 | |
Bank of America Corp. | | United States | | | 180,800 | | | | 2,097,280 | |
BlackRock Inc. | | United States | | | 28,900 | | | | 5,973,919 | |
JPMorgan Chase & Co. | | United States | | | 162,070 | | | | 7,126,218 | |
Marsh & McLennan Cos. Inc. | | United States | | | 96,000 | | | | 3,309,120 | |
MetLife Inc. | | United States | | | 41,382 | | | | 1,363,123 | |
People’s United Financial Inc. | | United States | | | 234,500 | | | | 2,835,105 | |
QBE Insurance Group Ltd. | | Australia | | | 257,900 | | | | 2,957,699 | |
T. Rowe Price Group Inc. | | United States | | | 68,000 | | | | 4,428,840 | |
Wells Fargo & Co. | | United States | | | 141,500 | | | | 4,836,470 | |
| | | | | | | | | | |
| | | | | | | | | 40,505,374 | |
| | | | | | | | | | |
Health Care 7.8% | | | | | | | | | | |
Abbott Laboratories | | United States | | | 53,200 | | | | 3,484,600 | |
Johnson & Johnson | | United States | | | 64,600 | | | | 4,528,460 | |
Merck & Co. Inc. | | United States | | | 134,461 | | | | 5,504,833 | |
Pfizer Inc. | | United States | | | 190,800 | | | | 4,785,264 | |
Roche Holding AG | | Switzerland | | | 19,300 | | | | 3,879,609 | |
| | | | | | | | | | |
| | | | | | | | | 22,182,766 | |
| | | | | | | | | | |
Industrials 14.2% | | | | | | | | | | |
3M Co. | | United States | | | 46,000 | | | | 4,271,100 | |
The Boeing Co. | | United States | | | 55,200 | | | | 4,159,872 | |
Caterpillar Inc. | | United States | | | 36,600 | | | | 3,278,628 | |
Emerson Electric Co. | | United States | | | 96,700 | | | | 5,121,232 | |
General Electric Co. | | United States | | | 293,200 | | | | 6,154,268 | |
Honeywell International Inc. | | United States | | | 92,400 | | | | 5,864,628 | |
J.B. Hunt Transport Services Inc. | | United States | | | 54,300 | | | | 3,242,253 | |
FGI-9
Franklin Templeton Variable Insurance Products Trust
Statement of Investments, December 31, 2012 (continued)
| | | | | | | | | | |
| Franklin Growth and Income Securities Fund | | Country | | Shares | | | Value | |
Common Stocks (continued) | | | | | | | | | | |
Industrials (continued) | | | | | | | | | | |
Republic Services Inc. | | United States | | | 144,900 | | | $ | 4,249,917 | |
United Parcel Service Inc., B | | United States | | | 59,600 | | | | 4,394,308 | |
| | | | | | | | | | |
| | | | | | | | | 40,736,206 | |
| | | | | | | | | | |
Information Technology 10.0% | | | | | | | | | | |
Analog Devices Inc. | | United States | | | 113,400 | | | | 4,769,604 | |
Cisco Systems Inc. | | United States | | | 301,508 | | | | 5,924,632 | |
Intel Corp. | | United States | | | 233,700 | | | | 4,821,231 | |
International Business Machines Corp. | | United States | | | 27,400 | | | | 5,248,470 | |
Microsoft Corp. | | United States | | | 146,300 | | | | 3,910,599 | |
Paychex Inc. | | United States | | | 121,900 | | | | 3,795,966 | |
| | | | | | | | | | |
| | | | | | | | | 28,470,502 | |
| | | | | | | | | | |
Materials 6.4% | | | | | | | | | | |
BHP Billiton Ltd., ADR | | Australia | | | 62,900 | | | | 4,933,876 | |
The Dow Chemical Co. | | United States | | | 117,700 | | | | 3,804,064 | |
E. I. du Pont de Nemours and Co. | | United States | | | 102,900 | | | | 4,627,413 | |
Rio Tinto PLC, ADR | | United Kingdom | | | 83,800 | | | | 4,867,942 | |
| | | | | | | | | | |
| | | | | | | | | 18,233,295 | |
| | | | | | | | | | |
Telecommunication Services 2.6% | | | | | | | | | | |
AT&T Inc. | | United States | | | 123,297 | | | | 4,156,342 | |
Vodafone Group PLC, ADR | | United Kingdom | | | 135,500 | | | | 3,413,245 | |
| | | | | | | | | | |
| | | | | | | | | 7,569,587 | |
| | | | | | | | | | |
Utilities 5.9% | | | | | | | | | | |
American Electric Power Co. Inc. | | United States | | | 107,100 | | | | 4,571,028 | |
Duke Energy Corp. | | United States | | | 82,003 | | | | 5,231,791 | |
Great Plains Energy Inc. | | United States | | | 111,748 | | | | 2,269,602 | |
PG&E Corp. | | United States | | | 120,800 | | | | 4,853,744 | |
| | | | | | | | | | |
| | | | | | | | | 16,926,165 | |
| | | | | | | | | | |
Total Common Stocks (Cost $200,029,538) | | | | | | | | | 251,768,593 | |
| | | | | | | | | | |
aEquity-Linked Securities 5.2% | | | | | | | | | | |
Energy 2.6% | | | | | | | | | | |
bBank of America Corp. into Halliburton Co., 5.00%, 144A | | United States | | | 105,000 | | | | 3,691,286 | |
bJPMorgan Chase & Co. into Schlumberger Ltd., 6.00%, 144A | | United States | | | 54,000 | | | | 3,811,752 | |
| | | | | | | | | | |
| | | | | | | | | 7,503,038 | |
| | | | | | | | | | |
Information Technology 1.1% | | | | | | | | | | |
bBarclays Bank PLC into Apple Inc., 7.50%, 144A | | United States | | | 6,000 | | | | 3,263,016 | |
| | | | | | | | | | |
Materials 1.5% | | | | | | | | | | |
Credit Suisse New York into Freeport-McMoRan Copper & Gold Inc., 8.40%, B | | United States | | | 120,000 | | | | 4,239,432 | |
| | | | | | | | | | |
Total Equity-Linked Securities (Cost $15,821,100) | | | | | | | | | 15,005,486 | |
| | | | | | | | | | |
Convertible Preferred Stocks 5.8% | | | | | | | | | | |
Consumer Discretionary 1.2% | | | | | | | | | | |
General Motors Co., 4.75%, cvt. pfd., B | | United States | | | 77,000 | | | | 3,398,010 | |
| | | | | | | | | | |
Energy 1.1% | | | | | | | | | | |
bChesapeake Energy Corp., 5.75%, cvt. pfd., 144A | | United States | | | 3,500 | | | | 3,137,697 | |
| | | | | | | | | | |
FGI-10
Franklin Templeton Variable Insurance Products Trust
Statement of Investments, December 31, 2012 (continued)
| | | | | | | | | | |
| Franklin Growth and Income Securities Fund | | Country | | Shares | | | Value | |
Convertible Preferred Stocks (continued) | | | | | | | | | | |
Financials 2.3% | | | | | | | | | | |
Bank of America Corp., 7.25%, cvt. pfd., L | | United States | | | 3,100 | | | $ | 3,518,500 | �� |
MetLife Inc., 5.00%, cvt. pfd. | | United States | | | 71,100 | | | | 3,161,817 | |
| | | | | | | | | | |
| | | | | | | | | 6,680,317 | |
| | | | | | | | | | |
Industrials 0.4% | | | | | | | | | | |
Genesee & Wyoming Inc., 5.00%, cvt. pfd. | | United States | | | 9,200 | | | | 1,024,972 | |
| | | | | | | | | | |
Materials 0.8% | | | | | | | | | | |
AngloGold Ashanti Holdings Finance PLC, 6.00%, cvt. pfd. | | South Africa | | | 65,000 | | | | 2,429,050 | |
| | | | | | | | | | |
Total Convertible Preferred Stocks (Cost $17,087,496) | | | | | | | | | 16,670,046 | |
| | | | | | | | | | |
Preferred Stocks (Cost $8,133,100) 0.2% | | | | | | | | | | |
Financials 0.2% | | | | | | | | | | |
cFannie Mae, 8.25%, pfd. | | United States | | | 325,000 | | | | 542,750 | |
| | | | | | | | | | |
Total Investments before Short Term Investments (Cost $241,071,234) | | | | | | | | | 283,986,875 | |
| | | | | | | | | | |
| | | |
| | | | | Principal
Amount | | | | |
Short Term Investments (Cost $2,162,058) 0.8% | | | | | | | | | | |
Repurchase Agreements 0.8% | | | | | | | | | | |
dJoint Repurchase Agreement, 0.154%, 1/02/13 (Maturity Value $2,162,077) | | United States | | $ | 2,162,058 | | | | 2,162,058 | |
BNP Paribas Securities Corp. (Maturity Value $281,459) | | | | | | | | | | |
Credit Suisse Securities (USA) LLC (Maturity Value $351,835) | | | | | | | | | | |
Deutsche Bank Securities Inc. (Maturity Value $227,018) | | | | | | | | | | |
HSBC Securities (USA) Inc. (Maturity Value $633,294) | | | | | | | | | | |
Merrill Lynch, Pierce, Fenner & Smith Inc. (Maturity Value $281,459) | | | | | | | | | | |
Morgan Stanley & Co. LLC (Maturity Value $105,553) | | | | | | | | | | |
UBS Securities LLC (Maturity Value $281,459) | | | | | | | | | | |
Collateralized by U.S. Government Agency Securities, 0.00% - 6.21%, 1/15/13 - 1/22/37;
U.S. Treasury Bonds, 11.25%, 2/15/15; and U.S. Treasury Notes, 0.25% - 2.00%, 11/30/13 - 9/15/15 (valued at $2,205,544) | | | | | | | | | | |
| | | | | | | | | | |
Total Investments (Cost $243,233,292) 100.1% | | | | | | | | | 286,148,933 | |
Other Assets, less Liabilities (0.1)% | | | | | | | | | (285,338 | ) |
| | | | | | | | | | |
Net Assets 100.0% | | | | | | | | $ | 285,863,595 | |
| | | | | | | | | | |
See abbreviations on page FGI-23.
aSee Note 1(e) regarding equity-linked securities.
bSecurity was purchased pursuant to Rule 144A under the Securities Act of 1933 and may be sold in transactions exempt from registration only to qualified institutional buyers or in a public offering registered under the Securities Act of 1933. These securities have been deemed liquid under guidelines approved by the Trust’s Board of Trustees. At December 31, 2012, the aggregate value of these securities was $13,903,751, representing 4.86% of net assets.
cNon-income producing.
dSee Note 1(c) regarding joint repurchase agreement.
The accompanying notes are an integral part of these financial statements.
FGI-11
Franklin Templeton Variable Insurance Products Trust
Financial Statements
Statement of Assets and Liabilities
December 31, 2012
| | | | |
| | | Franklin Growth
and Income
Securities Fund | |
Assets: | | | | |
Investments in securities: | | | | |
Cost - Unaffiliated issuers | | $ | 241,071,234 | |
Cost - Repurchase agreements | | | 2,162,058 | |
| | | | |
Total cost of investments | | $ | 243,233,292 | |
| | | | |
Value - Unaffiliated issuers | | $ | 283,986,875 | |
Value - Repurchase agreements | | | 2,162,058 | |
| | | | |
Total value of investments | | | 286,148,933 | |
Receivables: | | | | |
Capital shares sold | | | 14,526 | |
Dividends | | | 515,075 | |
| | | | |
Total assets | | | 286,678,534 | |
| | | | |
Liabilities: | | | | |
Payables: | | | | |
Capital shares redeemed | | | 519,968 | |
Affiliates | | | 184,825 | |
Reports to shareholders | | | 67,267 | |
Accrued expenses and other liabilities | | | 42,879 | |
| | | | |
Total liabilities | | | 814,939 | |
| | | | |
Net assets, at value | | $ | 285,863,595 | |
| | | | |
Net assets consist of: | | | | |
Paid-in capital | | $ | 279,078,456 | |
Undistributed net investment income | | | 8,455,201 | |
Net unrealized appreciation (depreciation) | | | 42,916,413 | |
Accumulated net realized gain (loss) | | | (44,586,475 | ) |
| | | | |
Net assets, at value | | $ | 285,863,595 | |
| | | | |
Class 1: | | | | |
Net assets, at value | | $ | 154,463,376 | |
| | | | |
Shares outstanding | | | 12,216,303 | |
| | | | |
Net asset value and maximum offering price per share | | $ | 12.64 | |
| | | | |
Class 2: | | | | |
Net assets, at value | | $ | 131,400,219 | |
| | | | |
Shares outstanding | | | 10,544,792 | |
| | | | |
Net asset value and maximum offering price per share | | $ | 12.46 | |
| | | | |
The accompanying notes are an integral part of these financial statements.
FGI-12
Franklin Templeton Variable Insurance Products Trust
Financial Statements (continued)
Statement of Operations
for the year ended December 31, 2012
| | | | |
| | | Franklin Growth
and Income
Securities Fund | |
Investment income: | | | | |
Dividends | | $ | 10,047,164 | |
Interest | | | 32,831 | |
| | | | |
Total investment income | | | 10,079,995 | |
| | | | |
Expenses: | | | | |
Management fees (Note 3a) | | | 1,563,339 | |
Distribution fees - Class 2 (Note 3c) | | | 332,414 | |
Unaffiliated transfer agent fees | | | 158 | |
Custodian fees (Note 4) | | | 6,411 | |
Reports to shareholders | | | 120,585 | |
Professional fees | | | 35,738 | |
Trustees’ fees and expenses | | | 1,154 | |
Other | | | 13,938 | |
| | | | |
Total expenses | | | 2,073,737 | |
| | | | |
Net investment income | | | 8,006,258 | |
| | | | |
Realized and unrealized gains (losses): | | | | |
Net realized gain (loss) from: | | | | |
Investments | | | 14,587,339 | |
Foreign currency transactions | | | 4,487 | |
| | | | |
Net realized gain (loss) | | | 14,591,826 | |
| | | | |
Net change in unrealized appreciation (depreciation) on: | | | | |
Investments | | | 11,482,370 | |
Translation of other assets and liabilities denominated in foreign currencies | | | (2,149 | ) |
| | | | |
Net change in unrealized appreciation (depreciation) | | | 11,480,221 | |
| | | | |
Net realized and unrealized gain (loss) | | | 26,072,047 | |
| | | | |
Net increase (decrease) in net assets resulting from operations | | $ | 34,078,305 | |
| | | | |
The accompanying notes are an integral part of these financial statements.
FGI-13
Franklin Templeton Variable Insurance Products Trust
Financial Statements (continued)
Statements of Changes in Net Assets
| | | | | | | | |
| | | Franklin Growth and Income
Securities Fund | |
| | | Year Ended December 31, | |
| | | 2012 | | | 2011 | |
| | | | |
Increase (decrease) in net assets: | | | | | | | | |
Operations: | | | | | | | | |
Net investment income | | $ | 8,006,258 | | | $ | 8,197,307 | |
Net realized gain (loss) from investments and foreign currency transactions | | | 14,591,826 | | | | 24,190,927 | |
Net change in unrealized appreciation (depreciation) on investments and translation of other assets and liabilities denominated in foreign currencies | | | 11,480,221 | | | | (24,900,751 | ) |
| | | | |
Net increase (decrease) in net assets resulting from operations | | | 34,078,305 | | | | 7,487,483 | |
| | | | |
Distributions to shareholders from: | | | | | | | | |
Net investment income: | | | | | | | | |
Class 1 | | | (4,951,744 | ) | | | (6,502,022 | ) |
Class 2 | | | (3,811,748 | ) | | | (5,102,769 | ) |
| | | | |
Total distributions to shareholders | | | (8,763,492 | ) | | | (11,604,791 | ) |
| | | | |
Capital share transactions: (Note 2) | | | | | | | | |
Class 1 | | | (16,240,212 | ) | | | (17,555,780 | ) |
Class 2 | | | (9,349,674 | ) | | | (20,259,007 | ) |
Class 4 | | | — | | | | (4,301 | ) |
| | | | |
Total capital share transactions | | | (25,589,886 | ) | | | (37,819,088 | ) |
| | | | |
Net increase (decrease) in net assets | | | (275,073 | ) | | | (41,936,396 | ) |
Net assets: | | | | | | | | |
Beginning of year | | | 286,138,668 | | | | 328,075,064 | |
| | | | |
End of year | | $ | 285,863,595 | | | $ | 286,138,668 | |
| | | | |
Undistributed net investment income included in net assets: | | | | | | | | |
End of year | | $ | 8,455,201 | | | $ | 8,605,551 | |
| | | | |
The accompanying notes are an integral part of these financial statements.
FGI-14
Franklin Templeton Variable Insurance Products Trust
Notes to Financial Statements
Franklin Growth and Income Securities Fund
1. ORGANIZATION AND SIGNIFICANT ACCOUNTING POLICIES
Franklin Templeton Variable Insurance Products Trust (Trust) is registered under the Investment Company Act of 1940, as amended, (1940 Act) as an open-end investment company, consisting of twenty separate funds. The Franklin Growth and Income Securities Fund (Fund) is included in this report. The financial statements of the remaining funds in the Trust are presented separately. Shares of the Fund are generally sold only to insurance company separate accounts to fund the benefits of variable life insurance policies or variable annuity contracts. At December 31, 2012, 77.41% of the Fund’s shares were held through one insurance company. Investment activities of these insurance company separate accounts could have a material impact on the Fund. The Fund offers two classes of shares: Class 1 and Class 2. Each class of shares differs by its distribution fees, voting rights on matters affecting a single class and its exchange privilege.
The following summarizes the Fund’s significant accounting policies.
a. Financial Instrument Valuation
The Fund’s investments in financial instruments are carried at fair value daily. Fair value is the price that would be received to sell an asset or paid to transfer a liability in an orderly transaction between market participants on the measurement date. Under procedures approved by the Trust’s Board of Trustees (the Board), the Fund’s administrator, investment manager and other affiliates have formed the Valuation and Liquidity Oversight Committee (VLOC). The VLOC provides administration and oversight of the Fund’s valuation policies and procedures, which are approved annually by the Board. Among other things, these procedures allow the Fund to utilize independent pricing services, quotations from securities and financial instrument dealers, and other market sources to determine fair value.
Equity securities and derivative financial instruments (derivatives) listed on an exchange or on the NASDAQ National Market System are valued at the last quoted sale price or the official closing price of the day, respectively. Foreign equity securities are valued as of the close of trading on the foreign stock exchange on which the security is primarily traded, or the NYSE, whichever is earlier. The value is then converted into its U.S. dollar equivalent at the foreign exchange rate in effect at the close of the NYSE on the day that the value of the security is determined. Over-the-counter (OTC) securities are valued within the range of the most recent quoted bid and ask prices. Securities that trade in multiple markets or on multiple exchanges are valued according to the broadest and most representative market. Certain equity securities are valued based upon fundamental characteristics or relationships to similar securities.
Debt and certain preferred securities generally trade in the OTC market rather than on a securities exchange. The Fund’s pricing services use multiple valuation techniques to determine fair value. In instances where sufficient market activity exists, the pricing services may utilize a market-based approach through which quotes from market makers are used to determine fair value. In instances where sufficient market activity may not exist or is limited, the pricing services also utilize proprietary valuation models which may consider market characteristics such as benchmark yield curves, credit spreads, estimated default rates, anticipated market interest rate volatility, coupon rates, anticipated timing of principal repayments, underlying collateral, and other unique security features in order to estimate the relevant cash flows, which are then discounted to calculate the fair value. Repurchase agreements are valued at cost, which approximates market value.
The Fund has procedures to determine the fair value of financial instruments for which market prices are not reliable or readily available. Under these procedures, the VLOC convenes on a regular basis to review such financial instruments and considers a number of factors, including significant unobservable valuation inputs, when arriving at fair value. The VLOC primarily employs a market-based approach which may use related or comparable assets or liabilities, recent transactions, market multiples, book values, and other relevant information for the investment to determine the fair value of the investment. An income-based valuation approach may also be used in which the anticipated future cash flows of the investment are discounted to calculate fair value. Discounts may also be applied due to the nature or duration of any restrictions on the disposition of the investments. Due to the inherent uncertainty of valuations of such investments, the fair values may differ significantly from the values that would
FGI-15
Franklin Templeton Variable Insurance Products Trust
Notes to Financial Statements (continued)
Franklin Growth and Income Securities Fund
1. ORGANIZATION AND SIGNIFICANT ACCOUNTING POLICIES (continued)
a. Financial Instrument Valuation (continued)
have been used had an active market existed. The VLOC employs various methods for calibrating these valuation approaches including a regular review of key inputs and assumptions, transactional back-testing or disposition analysis, and reviews of any related market activity.
Trading in securities on foreign securities stock exchanges and OTC markets may be completed before the daily close of business on the NYSE. Occasionally, events occur between the time at which trading in a foreign security is completed and the close of the NYSE that might call into question the reliability of the value of a portfolio security held by the Fund. As a result, differences may arise between the value of the Fund’s portfolio securities as determined at the foreign market close and the latest indications of value at the close of the NYSE. In order to minimize the potential for these differences, the VLOC monitors price movements following the close of trading in foreign stock markets through a series of country specific market proxies (such as baskets of American Depositary Receipts, futures contracts and exchange traded funds). These price movements are measured against established trigger thresholds for each specific market proxy to assist in determining if an event has occurred that may call into question the reliability of the values of the foreign securities held by the Fund. If such an event occurs, the securities may be valued using fair value procedures, which may include the use of independent pricing services. At December 31, 2012, a market event occurred resulting in a portion of the securities held by the Fund being valued using fair value procedures.
b. Foreign Currency Translation
Portfolio securities and other assets and liabilities denominated in foreign currencies are translated into U.S. dollars based on the exchange rate of such currencies against U.S. dollars on the date of valuation. The Fund may enter into foreign currency exchange contracts to facilitate transactions denominated in a foreign currency. Purchases and sales of securities, income and expense items denominated in foreign currencies are translated into U.S. dollars at the exchange rate in effect on the transaction date. Portfolio securities and assets and liabilities denominated in foreign currencies contain risks that those currencies will decline in value relative to the U.S. dollar. Occasionally, events may impact the availability or reliability of foreign exchange rates used to convert the U.S. dollar equivalent value. If such an event occurs, the foreign exchange rate will be valued at fair value using procedures established and approved by the Board.
The Fund does not separately report the effect of changes in foreign exchange rates from changes in market prices on securities held. Such changes are included in net realized and unrealized gain or loss from investments on the Statement of Operations.
Realized foreign exchange gains or losses arise from sales of foreign currencies, currency gains or losses realized between the trade and settlement dates on securities transactions and the difference between the recorded amounts of dividends, interest, and foreign withholding taxes and the U.S. dollar equivalent of the amounts actually received or paid. Net unrealized foreign exchange gains and losses arise from changes in foreign exchange rates on foreign denominated assets and liabilities other than investments in securities held at the end of the reporting period.
c. Joint Repurchase Agreement
The Fund enters into a joint repurchase agreement whereby its uninvested cash balance is deposited into a joint cash account with other funds managed by the investment manager or an affiliate of the investment manager and is used to invest in one or more repurchase agreements. The value and face amount of the joint repurchase agreement are allocated to the funds based on their pro-rata interest. A repurchase agreement is accounted for as a loan by the fund to the seller, collateralized by securities which are delivered to the fund’s custodian. The market value, including accrued interest, of the initial collateralization is required to be at least 102% of the dollar amount invested by the funds, with the value of the underlying securities marked to market daily to maintain coverage of at least 100%. The joint repurchase agreement held by the Fund at year end had been entered into on December 31, 2012.
FGI-16
Franklin Templeton Variable Insurance Products Trust
Notes to Financial Statements (continued)
Franklin Growth and Income Securities Fund
1. ORGANIZATION AND SIGNIFICANT ACCOUNTING POLICIES (continued)
d. Derivative Financial Instruments
The Fund invested in derivatives in order to manage risk or gain exposure to various other investments or markets. Derivatives are financial contracts based on an underlying or notional amount, require no initial investment or an initial net investment that is smaller than would normally be required to have a similar response to changes in market factors, and require or permit net settlement. Derivatives contain various risks including the potential inability of the counterparty to fulfill their obligations under the terms of the contract, the potential for an illiquid secondary market, and/or the potential for market movements which expose the Fund to gains or losses in excess of the amounts shown on the Statement of Assets and Liabilities. Realized gain and loss and unrealized appreciation and depreciation on these contracts for the period are included in the Statement of Operations.
The Fund purchased or wrote exchange traded option contracts primarily to manage and/or gain exposure to equity price risk. An option is a contract entitling the holder to purchase or sell a specific amount of shares or units of an asset or notional amount of a swap (swaption), at a specified price. Options purchased are recorded as an asset while options written are recorded as a liability. Upon exercise of an option, the acquisition cost or sales proceeds of the underlying investment is adjusted by any premium received or paid. Upon expiration of an option, any premium received or paid is recorded as a realized gain or loss. Upon closing an option other than through expiration or exercise, the difference between the premium and the cost to close the position is recorded as a realized gain or loss. Pursuant to the terms of the written option contract, cash or securities may be required to be deposited as collateral.
See Notes 6 and 8 regarding investment transactions and other derivative information, respectively.
e. Equity-Linked Securities
The Fund invests in equity-linked securities. Equity-linked securities are hybrid financial instruments that generally combine both debt and equity characteristics into a single note form. Income received from equity linked securities is recorded as realized gains in the Statement of Operations and may be based on the performance of an underlying equity security, an equity index, or an option position. The risks of investing in equity-linked securities include unfavorable price movements in the underlying security and the credit risk of the issuing financial institution. There may be no guarantee of a return of principal with equity linked securities and the appreciation potential may be limited. Equity-linked securities may be more volatile and less liquid than other investments held by the Fund.
f. Income and Deferred Taxes
It is the Fund’s policy to qualify as a regulated investment company under the Internal Revenue Code. The Fund intends to distribute to shareholders substantially all of its taxable income and net realized gains to relieve it from federal income and if applicable, excise taxes. As a result, no provision for U.S. federal income taxes is required.
The Fund may be subject to foreign taxation related to income received, capital gains on the sale of securities and certain foreign currency transactions in the foreign jurisdictions in which it invests. Foreign taxes, if any, are recorded based on the tax regulations and rates that exist in the foreign markets in which the Fund invests. When a capital gain tax is determined to apply the Fund records an estimated deferred tax liability in an amount that would be payable if the securities were disposed of on the valuation date.
The Fund recognizes the tax benefits of uncertain tax positions only when the position is “more likely than not” to be sustained upon examination by the tax authorities based on the technical merits of the tax position. As of December 31, 2012, and for all open tax years, the Fund has determined that no liability for unrecognized tax benefits is required in the Fund’s financial statements related to uncertain tax positions taken on a tax return (or expected to be taken on future tax returns). Open tax years are those that remain subject to examination and are based on each tax jurisdiction statute of limitation.
FGI-17
Franklin Templeton Variable Insurance Products Trust
Notes to Financial Statements (continued)
Franklin Growth and Income Securities Fund
1. ORGANIZATION AND SIGNIFICANT ACCOUNTING POLICIES (continued)
g. Security Transactions, Investment Income, Expenses and Distributions
Security transactions are accounted for on trade date. Realized gains and losses on security transactions are determined on a specific identification basis. Interest income and estimated expenses are accrued daily. Amortization of premium and accretion of discount on debt securities are included in interest income. Dividend income is recorded on the ex-dividend date except that certain dividends from foreign securities are recognized as soon as the Fund is notified of the ex-dividend date. Distributions to shareholders are recorded on the ex-dividend date and are determined according to income tax regulations (tax basis). Distributable earnings determined on a tax basis may differ from earnings recorded in accordance with accounting principles generally accepted in the United States of America. These differences may be permanent or temporary. Permanent differences are reclassified among capital accounts to reflect their tax character. These reclassifications have no impact on net assets or the results of operations. Temporary differences are not reclassified, as they may reverse in subsequent periods.
Common expenses incurred by the Trust are allocated among the funds based on the ratio of net assets of each fund to the combined net assets of the Trust. Fund specific expenses are charged directly to the fund that incurred the expense.
Realized and unrealized gains and losses and net investment income, not including class specific expenses, are allocated daily to each class of shares based upon the relative proportion of net assets of each class. Differences in per share distributions, by class, are generally due to differences in class specific expenses.
h. Accounting Estimates
The preparation of financial statements in accordance with accounting principles generally accepted in the United States of America requires management to make estimates and assumptions that affect the reported amounts of assets and liabilities at the date of the financial statements and the amounts of income and expenses during the reporting period. Actual results could differ from those estimates.
i. Guarantees and Indemnifications
Under the Trust’s organizational documents, its officers and trustees are indemnified by the Trust against certain liabilities arising out of the performance of their duties to the Trust. Additionally, in the normal course of business, the Trust, on behalf of the Fund, enters into contracts with service providers that contain general indemnification clauses. The Trust’s maximum exposure under these arrangements is unknown as this would involve future claims that may be made against the Trust that have not yet occurred. Currently, the Trust expects the risk of loss to be remote.
2. SHARES OF BENEFICIAL INTEREST
At December 31, 2012, there were an unlimited number of shares authorized (without par value). Transactions in the Fund’s shares were as follows:
| | | | | | | | | | | | | | | | |
| | | Year Ended December 31, | |
| | | 2012 | | | 2011 a | |
| Class 1 Shares: | | Shares | | | Amount | | | Shares | | | Amount | |
Shares sold | | | 8,936 | | | $ | 109,900 | | | | 187,427 | | | $ | 2,361,235 | |
Shares issued in reinvestment of distributions | | | 419,284 | | | | 4,951,744 | | | | 570,854 | | | | 6,502,022 | |
Shares redeemed | | | (1,731,505 | ) | | | (21,301,856 | ) | | | (2,250,738 | ) | | | (26,419,037 | ) |
| | | | |
Net increase (decrease) | | | (1,303,285 | ) | | $ | (16,240,212 | ) | | | (1,492,457 | ) | | $ | (17,555,780 | ) |
| | | | |
FGI-18
Franklin Templeton Variable Insurance Products Trust
Notes to Financial Statements (continued)
Franklin Growth and Income Securities Fund
2. SHARES OF BENEFICIAL INTEREST (continued)
| | | | | | | | | | | | | | | | |
| | | Year Ended December 31, | |
| | | 2012 | | | 2011 a | |
| Class 2 Shares: | | Shares | | | Amount | | | Shares | | | Amount | |
Shares sold | | | 876,993 | | | $ | 10,575,390 | | | | 624,568 | | | $ | 7,137,921 | |
Shares issued in reinvestment of distributions | | | 327,189 | | | | 3,811,748 | | | | 453,579 | | | | 5,102,769 | |
Shares redeemed | | | (1,967,485 | ) | | | (23,736,812 | ) | | | (2,828,839 | ) | | | (32,499,697 | ) |
| | | | |
Net increase (decrease) | | | (763,303 | ) | | $ | (9,349,674 | ) | | | (1,750,692 | ) | | $ | (20,259,007 | ) |
| | | | |
Class 4 Shares: | | | | | | | | | | | | | | | | |
Shares redeemed | | | | | | | | | | | (353 | ) | | $ | (4,301 | ) |
| | | | | | | |
Net increase (decrease) | | | | | | | | | | | (353 | ) | | $ | (4,301 | ) |
| | | | | | | |
| a | Effective March 4, 2011, Class 4 was liquidated. |
3. TRANSACTIONS WITH AFFILIATES
Franklin Resources, Inc. is the holding company for various subsidiaries that together are referred to as Franklin Templeton Investments. Certain officers and trustees of the Fund are also officers and/or directors of the following subsidiaries:
| | |
| Subsidiary | | Affiliation |
Franklin Advisers, Inc. (Advisers) | | Investment manager |
Franklin Templeton Services, LLC (FT Services) | | Administrative manager |
Franklin Templeton Distributors, Inc. (Distributors) | | Principal underwriter |
Franklin Templeton Investor Services, LLC (Investor Services) | | Transfer agent |
a. Management Fees
The Fund pays an investment management fee to Advisers based on the average daily net assets of the Fund as follows:
| | |
| Annualized Fee Rate | | Net Assets |
| 0.625% | | Up to and including $100 million |
| 0.500% | | Over $100 million, up to and including $250 million |
| 0.450% | | Over $250 million, up to and including $7.5 billion |
| 0.440% | | Over $7.5 billion, up to and including $10 billion |
| 0.430% | | Over $10 billion, up to and including $12.5 billion |
| 0.420% | | Over $12.5 billion, up to and including $15 billion |
| 0.400% | | In excess of $15 billion |
b. Administrative Fees
FT Services, under terms of an agreement, provides administrative services to the Fund and is not paid by the Fund for the services.
c. Distribution Fees
The Board has adopted a distribution plan for Class 2 shares pursuant to Rule 12b-1 under the 1940 Act. Under the Fund’s compensation distribution plan, the Fund pays Distributors for costs incurred in connection with the servicing, sale and distribution of the Fund’s shares up to 0.35% per year of its average daily net assets. Some distribution fees are not charged on shares held by affiliates. The Board has agreed to limit the current rate to 0.25% per year for Class 2.
FGI-19
Franklin Templeton Variable Insurance Products Trust
Notes to Financial Statements (continued)
Franklin Growth and Income Securities Fund
3. TRANSACTIONS WITH AFFILIATES (continued)
d. Transfer Agent Fees
Investor Services, under terms of an agreement, performs shareholder servicing for the Fund and is not paid by the Fund for the services.
4. EXPENSE OFFSET ARRANGEMENT
The Fund has entered into an arrangement with its custodian whereby credits realized as a result of uninvested cash balances are used to reduce a portion of the Fund’s custodian expenses. During the year ended December 31, 2012, there were no credits earned.
5. INCOME TAXES
For tax purposes, capital losses may be carried over to offset future capital gains, if any. Capital loss carryforwards with no expiration, if any, must be fully utilized before those losses with expiration dates.
At December 31, 2012, the Fund had capital loss carryforwards of $44,326,124 expiring in 2017. During the year ended December 31, 2012, the Fund utilized $13,765,081 of capital loss carryforwards.
The tax character of distributions paid during the years ended December 31, 2012 and 2011, was as follows:
| | | | | | | | |
| | | 2012 | | | 2011 | |
Distributions paid from ordinary income | | $ | 8,763,492 | | | $ | 11,604,791 | |
| | | | |
At December 31, 2012, the cost of investments, net unrealized appreciation (depreciation), and undistributed ordinary income for income tax purposes were as follows:
| | | | |
Cost of investments | | $ | 243,206,832 | |
| | | | |
| |
Unrealized appreciation | | $ | 58,882,749 | |
Unrealized depreciation | | | (15,940,648 | ) |
| | | | |
Net unrealized appreciation (depreciation) | | $ | 42,942,101 | |
| | | | |
Distributable earnings – undistributed ordinary income | | $ | 8,314,239 | |
| | | | |
Differences between income and/or capital gains as determined on a book basis and a tax basis are primarily due to differing treatments of bond discounts and premiums, and corporate actions.
6. INVESTMENT TRANSACTIONS
Purchases and sales of investments (excluding short term securities) for the year ended December 31, 2012, aggregated $84,948,329 and $102,257,277, respectively.
FGI-20
Franklin Templeton Variable Insurance Products Trust
Notes to Financial Statements (continued)
Franklin Growth and Income Securities Fund
6. INVESTMENT TRANSACTIONS (continued)
Transactions in options written during the year ended December 31, 2012, were as follows:
| | | | | | | | |
| | | Number of
Contracts | | | Premiums
Received | |
Options outstanding at December 31, 2011 | | | — | | | $ | — | |
Options written | | | 350 | | | | 105,428 | |
Options expired | | | — | | | | — | |
Options exercised | | | (350 | ) | | | (105,428 | ) |
Options closed | | | — | | | | — | |
| | | | |
Options outstanding at December 31, 2012 | | | — | | | $ | — | |
| | | | |
See Notes 1(d) and 8 regarding derivative financial instruments and other derivative information, respectively.
7. CREDIT RISK AND DEFAULTED SECURITIES
At December 31, 2012, the Fund had 10.15% of its portfolio invested in high yield or other securities rated below investment grade. These securities may be more sensitive to economic conditions causing greater price volatility and are potentially subject to a greater risk of loss due to default than higher rated securities.
8. OTHER DERIVATIVE INFORMATION
For the period ended December 31, 2012, the effect of derivative contracts on the Fund’s Statement of Operations was as follows:
| | | | | | | | | | |
Derivative Contracts Not Accounted
for as Hedging Instruments | | Statement of Operations Locations | | Realized Gain
(Loss) for the
Year | | | Change in
Unrealized
Appreciation
(Depreciation)
for the
Year | |
Equity contracts | | Net realized gain (loss) from investments and written options/Net change in unrealized appreciation (depreciation) on investments | | $ | — | | | $ | — | |
For the year ended December 31, 2012, the average month end market value of derivatives represented less than 0.01% of average month end net assets. The average month end number of open derivative contracts for the year was less than 1.
See Note 1(d) and 6 regarding derivative financial instruments and investment transactions, respectively.
9. CREDIT FACILITY
The Fund, together with other U.S. registered and foreign investment funds (collectively, Borrowers), managed by Franklin Templeton Investments, are borrowers in a joint syndicated senior unsecured credit facility totaling $1.5 billion (Global Credit Facility) which matured on January 18, 2013. This Global Credit Facility provides a source of funds to the Borrowers for temporary and emergency purposes, including the ability to meet future unanticipated or unusually large redemption requests. Effective January 18, 2013, the Borrowers renewed the Global Credit Facility which matures on January 17, 2014.
FGI-21
Franklin Templeton Variable Insurance Products Trust
Notes to Financial Statements (continued)
Franklin Growth and Income Securities Fund
9. CREDIT FACILITY (continued)
Under the terms of the Global Credit Facility, the Fund shall, in addition to interest charged on any borrowings made by the Fund and other costs incurred by the Fund, pay its share of fees and expenses incurred in connection with the implementation and maintenance of the Global Credit Facility, based upon its relative share of the aggregate net assets of all of the Borrowers, including an annual commitment fee of 0.07% based upon the unused portion of the Global Credit Facility. These fees are reflected in other expenses on the Statement of Operations. During the year ended December 31, 2012, the Fund did not use the Global Credit Facility.
10. FAIR VALUE MEASUREMENTS
The Fund follows a fair value hierarchy that distinguishes between market data obtained from independent sources (observable inputs) and the Fund’s own market assumptions (unobservable inputs). These inputs are used in determining the value of the Fund’s financial instruments and are summarized in the following fair value hierarchy:
| | • | | Level 1 – quoted prices in active markets for identical financial instruments |
| | • | | Level 2 – other significant observable inputs (including quoted prices for similar financial instruments, interest rates, prepayment speed, credit risk, etc.) |
| | • | | Level 3 – significant unobservable inputs (including the Fund’s own assumptions in determining the fair value of financial instruments) |
The inputs or methodology used for valuing financial instruments are not an indication of the risk associated with investing in those financial instruments.
For movements between the levels within the fair value hierarchy, the Fund has adopted a policy of recognizing the transfers as of the date of the underlying event which caused the movement. Additionally, at December 31, 2012, due to market events, the Fund employed fair value procedures to value a portion of its holdings. Such procedures resulted in a temporary transfer of financial instruments valued at $2,957,699 from Level 1 to Level 2 within the fair value hierarchy.
A summary of inputs used as of December 31, 2012, in valuing the Fund’s assets carried at fair value, is as follows:
| | | | | | | | | | | | | | | | |
| | | Level 1 | | | Level 2 | | | Level 3 | | | Total | |
| | | | |
Assets: | | | | | | | | | | | | | | | | |
Investments in Securities: | | | | | | | | | | | | | | | | |
Equity Investments:a | | | | | | | | | | | | | | | | |
Energy | | $ | 23,293,840 | | | $ | 3,137,697 | | | $ | — | | | $ | 26,431,537 | |
Financials | | | 44,770,742 | | | | 2,957,699 | | | | — | | | | 47,728,441 | |
All Other Equity Investmentsb | | | 194,821,411 | | | | — | | | | — | | | | 194,821,411 | |
Equity-Linked Securities | | | — | | | | 15,005,486 | | | | — | | | | 15,005,486 | |
Short Term Investments | | | — | | | | 2,162,058 | | | | — | | | | 2,162,058 | |
| | | | |
Total Investments in Securities | | $ | 262,885,993 | | | $ | 23,262,940 | | | $ | — | | | $ | 286,148,933 | |
| | | | |
aIncludes common, preferred and convertible preferred stocks as well as other equity investments.
bFor detailed categories, see the accompanying Statement of Investments.
11. NEW ACCOUNTING PRONOUNCEMENTS
In December 2011, the Financial Accounting Standards Board (FASB) issued Accounting Standards Update (ASU) No. 2011-11, Balance Sheet (Topic 210): Disclosures about Offsetting Assets and Liabilities. The amendments in the ASU enhance disclosures about offsetting of financial assets and liabilities to enable investors to understand the effect of these arrangements on a fund’s
FGI-22
Franklin Templeton Variable Insurance Products Trust
Notes to Financial Statements (continued)
Franklin Growth and Income Securities Fund
11. NEW ACCOUNTING PRONOUNCEMENTS (continued)
financial position. In January 2013, FASB issued ASU No. 2013-01, Balanced Sheet (Topic 210): Clarifying the Scope of Disclosures about Offsetting Assets and Liabilities. The amendments in ASU No. 2013-01 clarify the intended scope of disclosures required by ASU No. 2011-11. These ASUs are effective for interim and annual reporting periods beginning on or after January 1, 2013. The Fund believes the adoption of these ASUs will not have a material impact on its financial statements.
12. SUBSEQUENT EVENTS
The Fund has evaluated subsequent events through the issuance of the financial statements and determined that no events have occurred that require disclosure other than those already disclosed in the financial statements.
| | | | |
ABBREVIATIONS | | | | |
| Selected Portfolio | | | | |
| | | | |
| ADR - American Depositary Receipt | | | | |
FGI-23
Franklin Templeton Variable Insurance Products Trust
Franklin Growth and Income Securities Fund
Report of Independent Registered Public Accounting Firm
To the Board of Trustees and Shareholders of
Franklin Templeton Variable Insurance Products Trust
In our opinion, the accompanying statement of assets and liabilities, including the statement of investments, and the related statements of operations and of changes in net assets and the financial highlights present fairly, in all material respects, the financial position of Franklin Growth and Income Securities Fund (the “Fund”) at December 31, 2012, the results of its operations for the year then ended, the changes in its net assets for each of the two years in the period then ended and the financial highlights for each of the five years in the period then ended, in conformity with accounting principles generally accepted in the United States of America. These financial statements and financial highlights (hereafter referred to as “financial statements”) are the responsibility of the Fund’s management. Our responsibility is to express an opinion on these financial statements based on our audits. We conducted our audits of these financial statements in accordance with the standards of the Public Company Accounting Oversight Board (United States). Those standards require that we plan and perform the audit to obtain reasonable assurance about whether the financial statements are free of material misstatement. An audit includes examining, on a test basis, evidence supporting the amounts and disclosures in the financial statements, assessing the accounting principles used and significant estimates made by management, and evaluating the overall financial statement presentation. We believe that our audits, which included confirmation of securities at December 31, 2012 by correspondence with the custodian and brokers, provide a reasonable basis for our opinion.
PricewaterhouseCoopers LLP
San Francisco, California
February 15, 2013
FGI-24
Franklin Templeton Variable Insurance Products Trust
Tax Information (unaudited)
Franklin Growth and Income Securities Fund
Under Section 854(b)(1)(A) of the Internal Revenue Code (Code), the Fund hereby reports 96.32% of the ordinary income dividends as income qualifying for the dividends received deduction for the fiscal year ended December 31, 2012.
FGI-25
FRANKLIN HIGH INCOME SECURITIES FUND
We are pleased to bring you Franklin High Income Securities Fund’s annual report for the fiscal year ended December 31, 2012.
Performance Summary as of 12/31/12
Average annual total return of Class 2 shares represents the average annual change in value, assuming reinvestment of dividends and capital gains. Average returns smooth out variations in returns, which can be significant; they are not the same as year-by-year results.
Periods ended 12/31/12
| | | | | | | | | | | | |
| | | 1-Year | | | 5-Year | | | 10-Year | |
Average Annual Total Return | | | +15.56% | | | | +8.39% | | | | +9.61% | |
Total Return Index Comparison for a Hypothetical $10,000 Investment (1/1/03–12/31/12)
The graph below shows the change in value of a hypothetical $10,000 investment in the Fund over the indicated period and includes reinvestment of any income or distributions. The Fund’s performance is compared to the performance of the Credit Suisse (CS) High Yield Index and the Lipper VIP High Yield Funds Classification Average. One cannot invest directly in an index, and an index is not representative of the Fund’s portfolio. Please see Important Notes to Performance Information preceding the Fund Summaries.
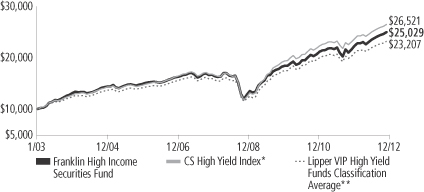
*Source: © 2013 Morningstar. Please see Index Descriptions following the Fund Summaries.
**Source: Lipper Inc. Please see Index Descriptions following the Fund Summaries.
Franklin High Income Securities Fund – Class 2
Performance reflects the Fund’s Class 2 operating expenses, but does not include any contract fees, expenses or sales charges. If they had been included, performance would be lower. These charges and deductions, particularly for variable life policies, can have a significant effect on contract values and insurance benefits. See the contract prospectus for a complete description of these expenses, including sales charges.
Performance data represent past performance, which does not guarantee future results. Investment return and principal value will fluctuate, and you may have a gain or loss when you sell your shares.
Current performance may differ from figures shown.
FH-1
Fund Goals and Main Investments: Franklin High Income Securities Fund seeks a high level of current income with capital appreciation as a secondary goal. Under normal market conditions, the Fund invests primarily to predominantly in high yield, lower rated debt securities and preferred stocks.
Performance Overview
You can find the Fund’s one-year total return in the Performance Summary. The Fund outperformed the +14.71% total return of its benchmark, the CS High Yield Index.1 The Fund’s peers, as measured by the Lipper VIP High Yield Funds Classification Average, delivered a +14.09% total return.2
Economic and Market Overview
During the 12 months under review, U.S. economic data remained mixed. Oil prices declined, and the housing sector strengthened with new and existing home sales as well as prices pointing toward a gradual strengthening trend, albeit from a low base. Consumer spending generally increased and consumer confidence reached its highest level during the period in November. However, manufacturing indicators weakened and gross domestic product growth was moderate.
In September, the Federal Reserve Board (Fed) acknowledged the need for further policy accommodation and announced a third round of quantitative easing (QE3). QE3 consisted of additional $40 billion monthly purchases of mortgage-backed securities until the labor market improves. The Fed also continued buying long-term Treasuries and selling short-term Treasuries in an effort to put downward pressure on long-term interest rates. In December, the Fed announced a 6.5% unemployment target as a guide to maintaining the historically low federal funds target rate. Economists, business leaders and market watchers were concerned about the U.S. “fiscal cliff” when, unless Congress acted, automatic income tax increases and federal budget cuts were scheduled to take effect in 2013. They feared these events could cause another U.S. recession. Not knowing whether Congress and the President would avert these measures after the U.S. election, many businesses delayed major investment and hiring decisions. Lawmakers reached a late compromise on January 1, 2013, a day after the reporting period ended. The approved legislation will maintain some tax cuts for
1. Source: © 2013 Morningstar.
2. Source: Lipper Inc.
One cannot invest directly in an index, and an index is not representative of the Fund’s portfolio. Please see Index Descriptions following the Fund Summaries.
Fund Risks: All investments involve risks, including possible loss of principal. Risks associated with higher yielding, lower rated securities include higher risk of default and loss of principal. Investments in foreign securities involve special risks such as currency fluctuations, and political and economic uncertainty. Interest rate movements will affect the Fund’s share price and yield. As the prices of bonds in the Fund adjust to a rise in interest rates, the Fund’s share price may decline. Changes in the financial strength of a bond issuer or in a bond’s credit rating may affect its value. The Fund may from time to time enter into certain transactions involving derivatives, particularly credit default swap agreements, interest rate swap agreements and currency forwards; such techniques may not achieve the anticipated benefits and/or may result in losses to the Fund. The Fund is actively managed but there is no guarantee that the manager’s investment decisions will produce the desired results. The Fund’s prospectus also includes a description of the main investment risks.
FH-2
most Americans but increase rates on the wealthiest. It will also delay the automatic federal spending cuts scheduled to start in January 2013.
Ongoing investor concerns about the fiscal cliff and eurozone uncertainty drove the 10-year U.S. Treasury note yield to 1.78% at year-end from 1.89% on December 31, 2011. During the 12 months under review, below-investment-grade corporate bonds, as measured by the CS High Yield Index, produced strong returns and outperformed investment-grade fixed income markets, as measured by the Barclays U.S. Aggregate Index.3
Investment Strategy
We are research-driven, fundamental investors who rely on a team of analysts to provide in-depth industry expertise and use qualitative and quantitative analyses to evaluate companies. As bottom-up investors, we focus primarily on individual securities. We also consider sectors when choosing investments. In selecting securities for the Fund’s investment portfolio, we do not rely principally on ratings assigned by rating agencies, but perform our own independent analysis to evaluate an issuer’s creditworthiness. We consider a variety of factors, including an issuer’s experience and managerial strength, its sensitivity to economic conditions and its current financial condition. We may also enter into various transactions involving certain currency-, interest rate- or credit-related derivative instruments.
Manager’s Discussion
Although fiscal issues during the year provided legitimate reasons for concern regarding the U.S. economy, liquidity was ample and corporate balance sheets remained healthy. The strength of the high yield corporate market encouraged more shareholder-friendly, leveraging transactions, but overall these constituted only a minority of high yield new issues during the year. Consequently, we remained comfortable with the fundamental backdrop for corporate credit. At the same time, we were also aware of valuations that in our view had richened during the year, and therefore by year-end we held a more neutral risk stance for the Fund. We drew on our fundamental research process to make individual investments and over- and underweightings in certain industries relative to the Fund’s benchmark.
For example, we found wireless telecommunications industry valuations attractive given stabilizing fundamentals and the potential for
3. Please see Index Descriptions following the Fund Summaries.
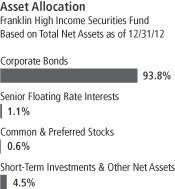
FH-3
merger and acquisition activity, and we overweighted the sector compared to the benchmark.4 Although the sector underperformed during the first half of the period, it rebounded strongly by year-end, driven by bonds from Sprint Nextel and Wind, the latter a large Italian operator. These companies’ bond issues rallied as Sprint experienced increased outside investment and improved financial results and Wind benefited from decreased sovereign bond concerns. In contrast, we remained cautious toward the supermarket and forest products industries and underweighted or had no exposure to these sectors.5 Our concerns about weak consumer demand and fierce industry competition led us to avoid the supermarket sector, which proved beneficial as it notably lagged the benchmark in 2012. We also underweighted the underperforming forest products industry given weak demand and secular decline issues, thereby aiding relative performance. However, holdings in senior secured bonds of NewPage, a large coated paper producer, weighed on industry returns as a difficult operating environment caused the bonds for this paper manufacturer, which filed for bankruptcy in 2011, to move lower by period-end.
Although most Fund positioning enhanced relative performance versus its benchmark, some industry exposure hindered relative returns. For example, we overweighted the energy sector versus the benchmark given what we viewed as the asset rich nature of many issuers. However, weak natural gas prices weighed on results and the industry underperformed in 2012. Conversely, we remained cautious toward the building sector given concerns over the depth and sustainability of a U.S. housing recovery.6 Although the Fund benefited from a rebound in the bonds of companies such as Cemex, a large Mexican building materials supplier, our overall underweighting detracted from relative performance. Our caution on prospects for the transportation sector, given its highly cyclical nature and uncertain economic outlook, also hurt returns as the shipping segment overcame volatility and drove the broader transportation industry to outperform the benchmark. Consequently, the Fund’s underweighted allocation detracted from relative returns.
4. Wireless telecommunications is part of telecommunication services in the SOI.
5. Forest products are part of materials in the SOI.
6. Building holdings are part of consumer durables and apparel in the SOI.
Top 10 Sectors/Industries
Franklin High Income Securities Fund
12/31/12
| | | | |
| | | % of Total
Net Assets | |
| Energy | | | 20.8% | |
| Materials | | | 12.0% | |
| Telecommunication Services | | | 9.1% | |
| Media | | | 8.6% | |
| Health Care Equipment & Services | | | 7.0% | |
| Diversified Financials | | | 4.2% | |
| Consumer Services | | | 4.1% | |
| Pharmaceuticals, Biotechnology & Life Sciences | | | 3.7% | |
| Software & Services | | | 3.0% | |
| Commercial & Professional Services | | | 2.9% | |
The dollar value, number of shares or principal amount, and names of all portfolio holdings are listed in the Fund’s Statement of Investments (SOI).
FH-4
Thank you for your participation in Franklin High Income Securities Fund. We look forward to serving your future investment needs.
The foregoing information reflects our analysis, opinions and portfolio holdings as of December 31, 2012, the end of the reporting period. The way we implement our main investment strategies and the resulting portfolio holdings may change depending on factors such as market and economic conditions. These opinions may not be relied upon as investment advice or an offer for a particular security. The information is not a complete analysis of every aspect of any market, country, industry, security or the Fund. Statements of fact are from sources considered reliable, but the investment manager makes no representation or warranty as to their completeness or accuracy. Although historical performance is no guarantee of future results, these insights may help you understand our investment management philosophy.
FH-5
Fund Expenses
As an investor in a variable insurance contract (Contract) that indirectly provides for investment in an underlying mutual fund, you can incur transaction and/or ongoing expenses at both the Fund level and the Contract level.
| • | | Transaction expenses can include sales charges (loads) on purchases, redemption fees, surrender fees, transfer fees and premium taxes. |
| • | | Ongoing expenses can include management fees, distribution and service (12b-1) fees, contract fees, annual maintenance fees, mortality and expense risk fees and other fees and expenses. All mutual funds and Contracts have some types of ongoing expenses. |
The expenses shown in the table are meant to highlight ongoing expenses at the Fund level only and do not include ongoing expenses at the Contract level, or transaction expenses at either the Fund or Contract level. While the Fund does not have transaction expenses, if the transaction and ongoing expenses at the Contract level were included, the expenses shown would be higher. You should consult your Contract prospectus or disclosure document for more information.
The table shows Fund-level ongoing expenses and can help you understand these expenses and compare them with those of other mutual funds offered through the Contract. The table assumes a $1,000 investment held for the six months indicated. Please refer to the Fund prospectus for additional information on operating expenses.
Actual Fund Expenses
The first line (Actual) of the table provides actual account values and expenses. The “Ending Account Value” is derived from the Fund’s actual return, which includes the effect of ongoing Fund expenses, but does not include the effect of ongoing Contract expenses.
You can estimate the Fund-level expenses you incurred during the period by following these steps. Of course, your account value and expenses will differ from those in this illustration:
| 1. | Divide your account value by $1,000. |
If an account had an $8,600 value, then $8,600 ÷ $1,000 = 8.6.
| 2. | Multiply the result by the number under the heading “Fund-Level Expenses Incurred During Period.” |
If Fund-Level Expenses Incurred During Period were $7.50, then 8.6 x $7.50 = $64.50.
In this illustration, the estimated expenses incurred this period at the Fund level are $64.50.
Franklin High Income Securities Fund – Class 2
FH-6
Hypothetical Example for Comparison with Other Mutual Funds
Information in the second line (Hypothetical) of the table can help you compare ongoing expenses of the Fund with those of other mutual funds offered through the Contract. This information may not be used to estimate the actual ending account balance or expenses you incurred during the period. The hypothetical “Ending Account Value” is based on the Fund’s actual expense ratio and an assumed 5% annual rate of return before expenses, which does not represent the Fund’s actual return. The figure under the heading “Fund-Level Expenses Incurred During Period” shows the hypothetical expenses your account would have incurred under this scenario. You can compare this figure with the 5% hypothetical examples that appear in shareholder reports of other funds offered through a Contract.
| | | | | | | | | | | | |
| Class 2 | | Beginning
Account Value 7/1/12 | | | Ending
Account
Value 12/31/12 | | | Fund-Level Expenses Incurred
During Period* 7/1/12–12/31/12 | |
Actual | | $ | 1,000 | | | $ | 1,080.80 | | | $ | 4.34 | |
Hypothetical (5% return
before expenses) | | $ | 1,000 | | | $ | 1,020.96 | | | $ | 4.22 | |
*Expenses are calculated using the most recent six-month annualized expense ratio for the Fund’s Class 2 shares (0.83%), which does not include any ongoing expenses of the Contract for which the Fund is an investment option, multiplied by the average account value over the period, multiplied by 184/366 to reflect the one-half year period.
FH-7
Franklin Templeton Variable Insurance Products Trust
Financial Highlights
Franklin High Income Securities Fund
| | | | | | | | | | | | | | | | | | | | |
| | | Year Ended December 31, | |
| Class 1 | | 2012 | | | 2011 | | | 2010 | | | 2009 | | | 2008 | |
| | | | |
Per share operating performance | | | | | | | | | | | | | | | | | | | | |
(for a share outstanding throughout the year) | | | | | | | | | | | | | | | | | | | | |
Net asset value, beginning of year | | $ | 6.52 | | | $ | 6.63 | | | $ | 6.26 | | | $ | 4.68 | | | $ | 6.72 | |
| | | | |
Income from investment operationsa: | | | | | | | | | | | | | | | | | | | | |
Net investment incomeb | | | 0.48 | | | | 0.50 | | | | 0.49 | | | | 0.46 | | | | 0.50 | |
Net realized and unrealized gains (losses) | | | 0.51 | | | | (0.19 | ) | | | 0.32 | | | | 1.50 | | | | (1.92 | ) |
| | | | |
Total from investment operations | | | 0.99 | | | | 0.31 | | | | 0.81 | | | | 1.96 | | | | (1.42 | ) |
| | | | |
Less distributions from net investment income | | | (0.50 | ) | | | (0.42 | ) | | | (0.44 | ) | | | (0.38 | ) | | | (0.62 | ) |
| | | | |
Net asset value, end of year | | $ | 7.01 | | | $ | 6.52 | | | $ | 6.63 | | | $ | 6.26 | | | $ | 4.68 | |
| | | | |
| | | | | |
Total returnc | | | 15.94% | | | | 4.63% | | | | 13.71% | | | | 42.99% | | | | (23.16)% | |
Ratios to average net assets | | | | | | | | | | | | | | | | | | | | |
Expenses | | | 0.58% | | | | 0.58% | | | | 0.61% | | | | 0.63% | d | | | 0.66% | d |
Net investment income | | | 7.15% | | | | 7.52% | | | | 7.71% | | | | 8.33% | | | | 8.30% | |
| | | | | |
Supplemental data | | | | | | | | | | | | | | | | | | | | |
Net assets, end of year (000’s) | | $ | 42,166 | | | $ | 41,971 | | | $ | 48,051 | | | $ | 48,855 | | | $ | 38,225 | |
Portfolio turnover rate | | | 37.03% | | | | 45.11% | | | | 60.80% | | | | 26.41% | | | | 21.75% | |
aThe amount shown for a share outstanding throughout the period may not correlate with the Statement of Operations for the period due to the timing of sales and repurchases of the Fund shares in relation to income earned and/or fluctuating market value of the investments of the Fund.
bBased on average daily shares outstanding.
cTotal return does not include fees, charges or expenses imposed by the variable annuity and life insurance contracts for which the Franklin Templeton Variable Insurance Products Trust serves as an underlying investment vehicle.
dBenefit of expense reduction rounds to less than 0.01%.
The accompanying notes are an integral part of these financial statements.
FH-8
Franklin Templeton Variable Insurance Products Trust
Financial Highlights (continued)
Franklin High Income Securities Fund
| | | | | | | | | | | | | | | | | | | | |
| | | Year Ended December 31, | |
| Class 2 | | 2012 | | | 2011 | | | 2010 | | | 2009 | | | 2008 | |
| | | | |
Per share operating performance | | | | | | | | | | | | | | | | | | | | |
(for a share outstanding throughout the year) | | | | | | | | | | | | | | | | | | | | |
Net asset value, beginning of year | | $ | 6.36 | | | $ | 6.47 | | | $ | 6.13 | | | $ | 4.59 | | | $ | 6.60 | |
| | | | |
Income from investment operationsa: | | | | | | | | | | | | | | | | | | | | |
Net investment incomeb | | | 0.46 | | | | 0.47 | | | | 0.47 | | | | 0.44 | | | | 0.47 | |
Net realized and unrealized gains (losses) | | | 0.48 | | | | (0.18 | ) | | | 0.30 | | | | 1.47 | | | | (1.88 | ) |
| | | | |
Total from investment operations | | | 0.94 | | | | 0.29 | | | | 0.77 | | | | 1.91 | | | | (1.41 | ) |
| | | | |
Less distributions from net investment income | | | (0.48 | ) | | | (0.40 | ) | | | (0.43 | ) | | | (0.37 | ) | | | (0.60 | ) |
| | | | |
Net asset value, end of year | | $ | 6.82 | | | $ | 6.36 | | | $ | 6.47 | | | $ | 6.13 | | | $ | 4.59 | |
| | | | |
| | | | | |
Total returnc | | | 15.56% | | | | 4.56% | | | | 13.26% | | | | 42.70% | | | | (23.38)% | |
Ratios to average net assets | | | | | | | | | | | | | | | | | | | | |
Expenses | | | 0.83% | | | | 0.83% | | | | 0.86% | | | | 0.88% | d | | | 0.91% | d |
Net investment income | | | 6.90% | | | | 7.27% | | | | 7.46% | | | | 8.08% | | | | 8.05% | |
| | | | | |
Supplemental data | | | | | | | | | | | | | | | | | | | | |
Net assets, end of year (000’s) | | $ | 281,851 | | | $ | 249,452 | | | $ | 239,824 | | | $ | 198,567 | | | $ | 84,396 | |
Portfolio turnover rate | | | 37.03% | | | | 45.11% | | | | 60.80% | | | | 26.41% | | | | 21.75% | |
aThe amount shown for a share outstanding throughout the period may not correlate with the Statement of Operations for the period due to the timing of sales and repurchases of the Fund shares in relation to income earned and/or fluctuating market value of the investments of the Fund.
bBased on average daily shares outstanding.
cTotal return does not include fees, charges or expenses imposed by the variable annuity and life insurance contracts for which the Franklin Templeton Variable Insurance Products Trust serves as an underlying investment vehicle.
dBenefit of expense reduction rounds to less than 0.01%.
The accompanying notes are an integral part of these financial statements.
FH-9
Franklin Templeton Variable Insurance Products Trust
Financial Highlights (continued)
Franklin High Income Securities Fund
| | | | | | | | | | | | | | | | | | | | |
| | | Year Ended December 31, | |
| Class 4 | | 2012 | | | 2011 | | | 2010 | | | 2009 | | | 2008a | |
| | | | |
Per share operating performance | | | | | | | | | | | | | | | | | | | | |
(for a share outstanding throughout the year) | | | | | | | | | | | | | | | | | | | | |
Net asset value, beginning of year | | $ | 6.46 | | | $ | 6.57 | | | $ | 6.22 | | | $ | 4.67 | | | $ | 6.55 | |
| | | | |
Income from investment operationsb: | | | | | | | | | | | | | | | | | | | | |
Net investment incomec | | | 0.46 | | | | 0.47 | | | | 0.47 | | | | 0.45 | | | | 0.39 | |
Net realized and unrealized gains (losses) | | | 0.49 | | | | (0.18 | ) | | | 0.31 | | | | 1.48 | | | | (1.65 | ) |
| | | | |
Total from investment operations | | | 0.95 | | | | 0.29 | | | | 0.78 | | | | 1.93 | | | | (1.26 | ) |
| | | | |
Less distributions from net investment income | | | (0.47 | ) | | | (0.40 | ) | | | (0.43 | ) | | | (0.38 | ) | | | (0.62 | ) |
| | | | |
Net asset value, end of year | | $ | 6.94 | | | $ | 6.46 | | | $ | 6.57 | | | $ | 6.22 | | | $ | 4.67 | |
| | | | |
| | | | | |
Total returnd | | | 15.50% | | | | 4.39% | | | | 13.31% | | | | 42.36% | | | | (21.34)% | |
Ratios to average net assetse | | | | | | | | | | | | | | | | | | | | |
Expenses | | | 0.93% | | | | 0.93% | | | | 0.96% | | | | 0.98% | f | | | 1.01% | f |
Net investment income | | | 6.80% | | | | 7.17% | | | | 7.36% | | | | 7.98% | | | | 7.95% | |
| | | | | |
Supplemental data | | | | | | | | | | | | | | | | | | | | |
Net assets, end of year (000’s) | | $ | 27,664 | | | $ | 27,055 | | | $ | 25,934 | | | $ | 15,105 | | | $ | 2,244 | |
Portfolio turnover rate | | | 37.03% | | | | 45.11% | | | | 60.80% | | | | 26.41% | | | | 21.75% | |
aFor the period February 29, 2008 (effective date) to December 31, 2008.
bThe amount shown for a share outstanding throughout the period may not correlate with the Statement of Operations for the period due to the timing of sales and repurchases of the Fund shares in relation to income earned and/or fluctuating market value of the investments of the Fund.
cBased on average daily shares outstanding.
dTotal return does not include fees, charges or expenses imposed by the variable annuity and life insurance contracts for which the Franklin Templeton Variable Insurance Products Trust serves as an underlying investment vehicle. Total return is not annualized for periods less than one year.
eRatios are annualized for periods less than one year.
fBenefit of expense reduction rounds to less than 0.01%.
The accompanying notes are an integral part of these financial statements.
FH-10
Franklin Templeton Variable Insurance Products Trust
Statement of Investments, December 31, 2012
| | | | | | | | | | |
| Franklin High Income Securities Fund | | Country | |
Shares | | | Value | |
Common Stocks and Other Equity Interests (Cost $2,460,060) 0.3% | | | | | | | | | | |
Materials 0.3% | | | | | | | | | | |
a,bNewPage Corp., Litigation Trust | | United States | | | 2,500,000 | | | $ | — | |
a,cNewPage Holdings Inc. | | United States | | | 10,000 | | | | 958,000 | |
| | | | | | | | | | |
Preferred Stocks (Cost $770,000) 0.3% | | | | | | | | | | |
Diversified Financials 0.3% | | | | | | | | | | |
GMAC Capital Trust I, 8.125%, pfd. | | United States | | | 30,800 | | | | 820,820 | |
| | | | | | | | | | |
| | | |
| | | | | Principal
Amount* | | | | |
Corporate Bonds 93.8% | | | | | | | | | | |
Automobiles & Components 1.7% | | | | | | | | | | |
Exide Technologies, senior secured note, 8.625%, 2/01/18 | | United States | | | 1,000,000 | | | | 852,500 | |
Ford Motor Credit Co. LLC, senior note, | | | | | | | | | | |
6.625%, 8/15/17 | | United States | | | 1,000,000 | | | | 1,169,271 | |
5.00%, 5/15/18 | | United States | | | 1,000,000 | | | | 1,105,518 | |
8.125%, 1/15/20 | | United States | | | 1,000,000 | | | | 1,284,123 | |
dInternational Automotive Components Group SL, senior secured note, 144A, 9.125%, 6/01/18 | | United States | | | 1,600,000 | | | | 1,492,000 | |
| | | | | | | | | | |
| | | | | | | | | 5,903,412 | |
| | | | | | | | | | |
Banks 1.9% | | | | | | | | | | |
CIT Group Inc., senior note, | | | | | | | | | | |
5.375%, 5/15/20 | | United States | | | 1,700,000 | | | | 1,865,750 | |
5.00%, 8/15/22 | | United States | | | 2,700,000 | | | | 2,889,605 | |
Royal Bank of Scotland Group PLC, sub. note, 6.125%, 12/15/22 | | United Kingdom | | | 2,000,000 | | | | 2,113,750 | |
| | | | | | | | | | |
| | | | | | | | | 6,869,105 | |
| | | | | | | | | | |
Capital Goods 2.5% | | | | | | | | | | |
dAbengoa Finance SAU, senior note, 144A, 8.875%, 11/01/17 | | Spain | | | 3,000,000 | | | | 2,835,000 | |
dAllison Transmission Holdings Inc., senior note, 144A, 7.125%, 5/15/19 | | United States | | | 1,000,000 | | | | 1,072,500 | |
Meritor Inc., senior note, 10.625%, 3/15/18 | | United States | | | 1,900,000 | | | | 1,990,250 | |
Navistar International Corp., senior note, 8.25%, 11/01/21 | | United States | | | 1,000,000 | | | | 970,000 | |
dSilver II Borrower/US Hold, senior note, 144A, 7.75%, 12/15/20 | | Luxembourg | | | 500,000 | | | | 517,813 | |
Terex Corp., senior note, 6.00%, 5/15/21 | | United States | | | 1,200,000 | | | | 1,269,000 | |
| | | | | | | | | | |
| | | | | | | | | 8,654,563 | |
| | | | | | | | | | |
Commercial & Professional Services 2.9% | | | | | | | | | | |
dADS Waste Escrow Corp., senior note, 144A, 8.25%, 10/01/20 | | United States | | | 3,100,000 | | | | 3,270,500 | |
dAlgeco Scotsman Global Finance PLC, secured note, 144A, 8.50%, 10/15/18 | | United Kingdom | | | 2,500,000 | | | | 2,595,313 | |
b,eGoss Graphic Systems Inc., senior sub. note, 12.25%, 11/19/05 | | United States | | | 1,912,374 | | | | 191 | |
United Rentals North America Inc., senior sub. note, 8.375%, 9/15/20 | | United States | | | 2,900,000 | | | | 3,226,250 | |
UR Merger Sub Corp., senior note, 10.25%, 11/15/19 | | United States | | | 1,000,000 | | | | 1,165,000 | |
| | | | | | | | | | |
| | | | | | | | | 10,257,254 | |
| | | | | | | | | | |
Consumer Durables & Apparel 2.5% | | | | | | | | | | |
KB Home, senior bond, 7.50%, 9/15/22 | | United States | | | 1,300,000 | | | | 1,423,500 | |
M/I Homes Inc., senior note, 8.625%, 11/15/18 | | United States | | | 1,500,000 | | | | 1,657,500 | |
Shea Homes LP/Funding Corp., senior secured note, 8.625%, 5/15/19 | | United States | | | 1,600,000 | | | | 1,776,000 | |
dTaylor Morrison Communities Inc./Monarch Communities Inc., senior note, 144A,
7.75%, 4/15/20 | | United States | | | 1,600,000 | | | | 1,704,000 | |
Visant Corp., senior note, 10.00%, 10/01/17 | | United States | | | 2,500,000 | | | | 2,256,250 | |
| | | | | | | | | | |
| | | | | | | | | 8,817,250 | |
| | | | | | | | | | |
Consumer Services 4.1% | | | | | | | | | | |
dCaesars Operating Escrow LLC/Corp.,
first lien, 144A, 9.00%, 2/15/20 | | United States | | | 300,000 | | | | 301,500 | |
FH-11
Franklin Templeton Variable Insurance Products Trust
Statement of Investments, December 31, 2012 (continued)
| | | | | | | | | | |
| Franklin High Income Securities Fund | | Country | | Principal
Amount* | | | Value | |
Corporate Bonds (continued) | | | | | | | | | | |
Consumer Services (continued) | | | | | | | �� | | | |
dCaesars Operating Escrow LLC/Corp. (continued) | | | | | | | | | | |
secured note, 144A, 9.00%, 2/15/20 | | United States | | | 500,000 | | | $ | 502,500 | |
ClubCorp Club Operations Inc., senior note, 10.00%, 12/01/18 | | United States | | | 2,200,000 | | | | 2,458,500 | |
d,eFontainebleau Las Vegas, 144A, 11.00%, 6/15/15 | | United States | | | 1,700,000 | | | | 1,071 | |
Harrah’s Operating Co. Inc., senior secured note, 11.25%, 6/01/17 | | United States | | | 3,000,000 | | | | 3,228,750 | |
MGM Resorts International, senior note, | | | | | | | | | | |
6.625%, 7/15/15 | | United States | | | 2,000,000 | | | | 2,155,000 | |
6.875%, 4/01/16 | | United States | | | 1,200,000 | | | | 1,275,000 | |
6.625%, 12/15/21 | | United States | | | 300,000 | | | | 300,375 | |
d144A, 8.625%, 2/01/19 | | United States | | | 400,000 | | | | 448,000 | |
Pinnacle Entertainment Inc., | | | | | | | | | | |
senior note, 8.625%, 8/01/17 | | United States | | | 2,200,000 | | | | 2,373,250 | |
senior sub. note, 7.75%, 4/01/22 | | United States | | | 100,000 | | | | 107,000 | |
dShingle Springs Tribal Gaming Authority, senior note, 144A, 9.375%, 6/15/15 | | United States | | | 1,300,000 | | | | 1,280,500 | |
| | | | | | | | | | |
| | | | | | | | | 14,431,446 | |
| | | | | | | | | | |
Diversified Financials 3.9% | | | | | | | | | | |
Ally Financial Inc., senior note, 7.50%, 9/15/20 | | United States | | | 1,500,000 | | | | 1,816,875 | |
fBank of America Corp., pfd., sub. bond, M, 8.125% to 5/15/18, FRN thereafter, Perpetual | | United States | | | 2,500,000 | | | | 2,771,275 | |
E*TRADE Financial Corp., senior note, 6.375%, 11/15/19 | | United States | | | 1,400,000 | | | | 1,442,000 | |
GMAC Inc., sub. note, 8.00%, 12/31/18 | | United States | | | 800,000 | | | | 940,000 | |
d,gIgloo Holdings Corp., senior note, 144A, PIK, 8.25%, 12/15/17 | | United States | | | 600,000 | | | | 595,500 | |
International Lease Finance Corp., | | | | | | | | | | |
senior note, R, 5.65%, 6/01/14 | | United States | | | 2,000,000 | | | | 2,091,240 | |
dsenior secured note, 144A, 6.75%, 9/01/16 | | United States | | | 1,200,000 | | | | 1,353,000 | |
dNeuberger Berman Group LLC/Finance Corp., senior note, 144A, | | | | | | | | | | |
5.625%, 3/15/20 | | United States | | | 500,000 | | | | 526,250 | |
5.875%, 3/15/22 | | United States | | | 600,000 | | | | 639,000 | |
dNuveen Investments Inc., senior note, 144A, 9.50%, 10/15/20 | | United States | | | 1,600,000 | | | | 1,600,000 | |
| | | | | | | | | | |
| | | | | | | | | 13,775,140 | |
| | | | | | | | | | |
Energy 20.8% | | | | | | | | | | |
dBreitBurn Energy Partners LP/Finance Corp., senior note, 144A, 7.875%, 4/15/22 | | United States | | | 1,600,000 | | | | 1,668,000 | |
Calumet Specialty Products Partners LP/Finance Corp., senior note, | | | | | | | | | | |
9.375%, 5/01/19 | | United States | | | 1,700,000 | | | | 1,853,000 | |
d144A, 9.625%, 8/01/20 | | United States | | | 600,000 | | | | 655,500 | |
Carrizo Oil & Gas Inc., senior note, | | | | | | | | | | |
8.625%, 10/15/18 | | United States | | | 2,000,000 | | | | 2,170,000 | |
7.50%, 9/15/20 | | United States | | | 500,000 | | | | 516,250 | |
Chaparral Energy Inc., senior note, | | | | | | | | | | |
9.875%, 10/01/20 | | United States | | | 1,400,000 | | | | 1,599,500 | |
8.25%, 9/01/21 | | United States | | | 600,000 | | | | 654,000 | |
CHC Helicopter SA, senior secured note, first lien, 9.25%, 10/15/20 | | Canada | | | 3,000,000 | | | | 3,172,500 | |
Chesapeake Energy Corp., senior note, | | | | | | | | | | |
6.625%, 8/15/20 | | United States | | | 3,000,000 | | | | 3,232,500 | |
6.125%, 2/15/21 | | United States | | | 1,000,000 | | | | 1,042,500 | |
Clayton Williams Energy Inc., senior note, 7.75%, 4/01/19 | | United States | | | 2,000,000 | | | | 2,002,500 | |
CONSOL Energy Inc., senior note, | | | | | | | | | | |
8.00%, 4/01/17 | | United States | | | 500,000 | | | | 543,750 | |
8.25%, 4/01/20 | | United States | | | 1,000,000 | | | | 1,087,500 | |
6.375%, 3/01/21 | | United States | | | 300,000 | | | | 309,000 | |
dDrill Rigs Holdings Inc., secured note, 144A, 6.50%, 10/01/17 | | United States | | | 1,200,000 | | | | 1,200,000 | |
FH-12
Franklin Templeton Variable Insurance Products Trust
Statement of Investments, December 31, 2012 (continued)
| | | | | | | | | | |
| Franklin High Income Securities Fund | | Country | | Principal
Amount* | | | Value | |
Corporate Bonds (continued) | | | | | | | | | | |
Energy (continued) | | | | | | | | | | |
Eagle Rock Energy Partners LP/Finance Corp., senior note, | | | | | | | | | | |
8.375%, 6/01/19 | | United States | | | 1,800,000 | | | $ | 1,845,000 | |
d144A, 8.375%, 6/01/19 | | United States | | | 700,000 | | | | 717,500 | |
Energy Transfer Equity LP, senior note, 7.50%, 10/15/20 | | United States | | | 3,000,000 | | | | 3,480,000 | |
dEPL Oil & Gas Inc., senior note, 144A, 8.25%, 2/15/18 | | United States | | | 1,400,000 | | | | 1,445,500 | |
dExpro Finance Luxembourg, senior secured note, 144A, 8.50%, 12/15/16 | | United Kingdom | | | 2,307,000 | | | | 2,422,350 | |
Goodrich Petroleum Corp., senior note, 8.875%, 3/15/19 | | United States | | | 2,200,000 | | | | 2,112,000 | |
dHalcon Resources Corp., senior note, 144A, 8.875%, 5/15/21 | | United States | | | 1,000,000 | | | | 1,065,000 | |
dKinder Morgan Finance Co. LLC, senior secured note, 144A, 6.00%, 1/15/18 | | United States | | | 1,500,000 | | | | 1,655,637 | |
Kodiak Oil & Gas Corp., senior note, 8.125%, 12/01/19 | | United States | | | 1,400,000 | | | | 1,550,500 | |
Linn Energy LLC/Finance Corp., senior note, | | | | | | | | | | |
6.50%, 5/15/19 | | United States | | | 600,000 | | | | 609,000 | |
8.625%, 4/15/20 | | United States | | | 2,000,000 | | | | 2,190,000 | |
7.75%, 2/01/21 | | United States | | | 700,000 | | | | 749,000 | |
Martin Midstream Partners LP, senior note, 8.875%, 4/01/18 | | United States | | | 1,316,000 | | | | 1,408,120 | |
Offshore Group Investment Ltd., | | | | | | | | | | |
dfirst lien, 144A, 7.50%, 11/01/19 | | United States | | | 1,400,000 | | | | 1,421,000 | |
senior secured note, 11.50%, 8/01/15 | | United States | | | 1,126,000 | | | | 1,230,155 | |
dPBF Holding Co. LLC, senior secured note, 144A, 8.25%, 2/15/20 | | United States | | | 1,500,000 | | | | 1,623,750 | |
Peabody Energy Corp., senior note, | | | | | | | | | | |
6.50%, 9/15/20 | | United States | | | 1,700,000 | | | | 1,831,750 | |
6.25%, 11/15/21 | | United States | | | 1,700,000 | | | | 1,814,750 | |
dPenn Virginia Resource Partners LP/Finance Corp. II, senior note, 144A, 8.375%, 6/01/20 | | United States | | | 1,400,000 | | | | 1,515,500 | |
Plains Exploration & Production Co., senior note, | | | | | | | | | | |
7.625%, 6/01/18 | | United States | | | 2,200,000 | | | | 2,326,500 | |
6.125%, 6/15/19 | | United States | | | 600,000 | | | | 657,000 | |
6.875%, 2/15/23 | | United States | | | 900,000 | | | | 1,032,750 | |
QEP Resources Inc., senior note, | | | | | | | | | | |
5.375%, 10/01/22 | | United States | | | 1,500,000 | | | | 1,616,250 | |
5.25%, 5/01/23 | | United States | | | 800,000 | | | | 860,000 | |
QR Energy LP/QRE Finance, senior note, 9.25%, 8/01/20 | | United States | | | 1,800,000 | | | | 1,899,000 | |
Quicksilver Resources Inc., senior note, | | | | | | | | | | |
8.25%, 8/01/15 | | United States | | | 2,000,000 | | | | 1,860,000 | |
9.125%, 8/15/19 | | United States | | | 1,000,000 | | | | 895,000 | |
dSamson Investment Co., senior note, 144A, 9.75%, 2/15/20 | | United States | | | 3,200,000 | | | | 3,400,000 | |
SandRidge Energy Inc., senior note, | | | | | | | | | | |
8.75%, 1/15/20 | | United States | | | 300,000 | | | | 330,000 | |
7.50%, 3/15/21 | | United States | | | 400,000 | | | | 430,000 | |
7.50%, 2/15/23 | | United States | | | 100,000 | | | | 107,500 | |
d144A, 8.00%, 6/01/18 | | United States | | | 2,500,000 | | | | 2,662,500 | |
W&T Offshore Inc., senior note, | | | | | | | | | | |
8.50%, 6/15/19 | | United States | | | 1,500,000 | | | | 1,620,000 | |
d144A, 8.50%, 6/15/19 | | United States | | | 1,100,000 | | | | 1,188,000 | |
| | | | | | | | | | |
| | | | | | | | | 73,277,512 | |
| | | | | | | | | | |
Food & Staples Retailing 0.9% | | | | | | | | | | |
Rite Aid Corp., senior secured note, | | | | | | | | | | |
9.75%, 6/12/16 | | United States | | | 1,800,000 | | | | 1,957,500 | |
8.00%, 8/15/20 | | United States | | | 1,000,000 | | | | 1,147,500 | |
| | | | | | | | | | |
| | | | | | | | | 3,105,000 | |
| | | | | | | | | | |
Food, Beverage & Tobacco 2.3% | | | | | | | | | | |
dAgrokor DD, senior note, 144A, 8.875%, 2/01/20 | | Croatia | | | 600,000 | | | | 652,875 | |
FH-13
Franklin Templeton Variable Insurance Products Trust
Statement of Investments, December 31, 2012 (continued)
| | | | | | | | | | |
| Franklin High Income Securities Fund | | Country | | Principal
Amount* | | | Value | |
Corporate Bonds (continued) | | | | | | | | | | |
Food, Beverage & Tobacco (continued) | | | | | | | | | | |
dCEDC Finance Corp. International Inc., senior secured note, 144A, 9.125%, 12/01/16 | | Russia | | | 700,000 | | | $ | 435,313 | |
Del Monte Corp., senior note, 7.625%, 2/15/19 | | United States | | | 3,000,000 | | | | 3,142,500 | |
dJBS USA LLC/Finance Inc., senior note, 144A, 8.25%, 2/01/20 | | United States | | | 2,600,000 | | | | 2,769,000 | |
Pinnacle Foods Finance LLC/Pinnacle Foods Finance Corp., senior note, | | | | | | | | | | |
9.25%, 4/01/15 | | United States | | | 278,000 | | | | 283,560 | |
8.25%, 9/01/17 | | United States | | | 700,000 | | | | 749,000 | |
| | | | | | | | | | |
| | | | | | | | | 8,032,248 | |
| | | | | | | | | | |
Health Care Equipment & Services 7.0% | | | | | | | | | | |
dAlere Inc., senior note, 144A, 7.25%, 7/01/18 | | United States | | | 2,200,000 | | | | 2,216,500 | |
Aviv Healthcare Properties LP/Aviv Healthcare Capital Corp., senior note, 7.75%, 2/15/19 | | United States | | | 2,200,000 | | | | 2,343,000 | |
CHS/Community Health Systems Inc., | | | | | | | | | | |
senior note, 8.00%, 11/15/19 | | United States | | | 1,700,000 | | | | 1,848,750 | |
senior note, 7.125%, 7/15/20 | | United States | | | 700,000 | | | | 748,125 | |
senior secured note, 5.125%, 8/15/18 | | United States | | | 1,500,000 | | | | 1,567,500 | |
DaVita HealthCare Partners Inc., senior note, 5.75%, 8/15/22 | | United States | | | 1,200,000 | | | | 1,270,500 | |
dDJO Finance LLC/DJO Finance Corp., secured note, 144A, 8.75%, 3/15/18 | | United States | | | 900,000 | | | | 987,750 | |
Emergency Medical Services Corp., senior note, 8.125%, 6/01/19 | | United States | | | 1,500,000 | | | | 1,654,687 | |
ExamWorks Group Inc., senior note, 9.00%, 7/15/19 | | United States | | | 1,300,000 | | | | 1,397,500 | |
HCA Inc., | | | | | | | | | | |
senior note, 7.50%, 2/15/22 | | United States | | | 800,000 | | | | 920,000 | |
senior note, 5.875%, 5/01/23 | | United States | | | 2,500,000 | | | | 2,593,750 | |
senior secured bond, 7.25%, 9/15/20 | | United States | | | 900,000 | | | | 1,001,250 | |
senior secured note, 7.875%, 2/15/20 | | United States | | | 1,000,000 | | | | 1,117,500 | |
senior secured note, 5.875%, 3/15/22 | | United States | | | 1,000,000 | | | | 1,092,500 | |
d,gJaguar Holding Co. I, senior note, 144A, PIK, 9.375%, 10/15/17 | | United States | | | 1,200,000 | | | | 1,266,000 | |
MedAssets Inc., senior note, 8.00%, 11/15/18 | | United States | | | 1,500,000 | | | | 1,635,000 | |
Vanguard Health Holding Co. II LLC/Inc., senior note, 8.00%, 2/01/18 | | United States | | | 1,000,000 | | | | 1,040,000 | |
Vanguard Health Systems Inc., senior note, zero cpn., 2/01/16 | | United States | | | 64,000 | | | | 48,640 | |
| | | | | | | | | | |
| | | | | | | | | 24,748,952 | |
| | | | | | | | | | |
Materials 11.7% | | | | | | | | | | |
ArcelorMittal, senior note, 6.00%, 3/01/21 | | Luxembourg | | | 1,100,000 | | | | 1,097,616 | |
dArdagh Packaging Finance PLC, senior note, 144A, 9.125%, 10/15/20 | | Luxembourg | | | 600,000 | | | | 657,000 | |
dArdagh Packaging Finance PLC/MP Holdings USA Inc., 144A, 7.375%, 10/15/17 | | Luxembourg | | | 600,000 | | | | 655,875 | |
dCemex SAB de CV, senior secured note, 144A, 9.00%, 1/11/18 | | Mexico | | | 3,500,000 | | | | 3,822,298 | |
dEldorado Gold Corp., senior note, 144A, 6.125%, 12/15/20 | | Canada | | | 700,000 | | | | 715,750 | |
Euramax International Inc., senior secured note, 9.50%, 4/01/16 | | United States | | | 2,000,000 | | | | 1,875,000 | |
Exopack Holding Corp., senior note, 10.00%, 6/01/18 | | United States | | | 1,600,000 | | | | 1,456,000 | |
dFMG Resources August 2006 Pty. Ltd., senior note, 144A, | | | | | | | | | | |
7.00%, 11/01/15 | | Australia | | | 800,000 | | | | 841,076 | |
6.875%, 2/01/18 | | Australia | | | 2,000,000 | | | | 2,072,500 | |
8.25%, 11/01/19 | | Australia | | | 500,000 | | | | 535,000 | |
6.875%, 4/01/22 | | Australia | | | 200,000 | | | | 205,250 | |
dIneos Finance PLC, senior secured note, 144A, | | | | | | | | | | |
9.00%, 5/15/15 | | United Kingdom | | | 1,000,000 | | | | 1,067,500 | |
8.375%, 2/15/19 | | United Kingdom | | | 200,000 | | | | 216,000 | |
7.50%, 5/01/20 | | United Kingdom | | | 500,000 | | | | 526,250 | |
dIneos Group Holdings Ltd., senior secured note, 144A, 8.50%, 2/15/16 | | United Kingdom | | | 1,500,000 | | | | 1,500,000 | |
dInmet Mining Corp., senior note, 144A, | | | | | | | | | | |
8.75%, 6/01/20 | | Canada | | | 2,500,000 | | | | 2,743,750 | |
7.50%, 6/01/21 | | Canada | | | 300,000 | | | | 312,750 | |
dKinove German Bondco GmbH, senior secured note, 144A, 9.625%, 6/15/18 | | Germany | | | 1,600,000 | | | | 1,747,000 | |
FH-14
Franklin Templeton Variable Insurance Products Trust
Statement of Investments, December 31, 2012 (continued)
| | | | | | | | | | |
| Franklin High Income Securities Fund | | Country | | Principal
Amount* | | | Value | |
Corporate Bonds (continued) | | | | | | | | | | |
Materials (continued) | | | | | | | | | | |
dMacDermid Inc., senior sub. note, 144A, 9.50%, 4/15/17 | | United States | | | 2,500,000 | | | $ | 2,615,625 | |
Novelis Inc., senior note, 8.75%, 12/15/20 | | Canada | | | 1,300,000 | | | | 1,456,000 | |
Olin Corp., senior bond, 5.50%, 8/15/22 | | United States | | | 3,200,000 | | | | 3,352,000 | |
dPerstorp Holding AB, first lien, 144A, 8.75%, 5/15/17 | | Sweden | | | 3,400,000 | | | | 3,508,375 | |
dRain CII Carbon LLC/Corp., second lien, 144A, 8.25%, 1/15/21 | | United States | | | 700,000 | | | | 719,250 | |
Reynolds Group Issuer Inc./LLC/SA, | | | | | | | | | | |
dsecured note, 144A, 5.75%, 10/15/20 | | United States | | | 1,400,000 | | | | 1,449,000 | |
senior note, 8.50%, 5/15/18 | | United States | | | 2,800,000 | | | | 2,884,000 | |
senior note, 9.00%, 4/15/19 | | United States | | | 200,000 | | | | 209,000 | |
senior note, 9.875%, 8/15/19 | | United States | | | 200,000 | | | | 215,000 | |
senior note, 8.25%, 2/15/21 | | United States | | | 400,000 | | | | 408,000 | |
dSealed Air Corp., senior note, 144A, | | | | | | | | | | |
8.125%, 9/15/19 | | United States | | | 800,000 | | | | 904,000 | |
6.50%, 12/01/20 | | United States | | | 500,000 | | | | 542,500 | |
8.375%, 9/15/21 | | United States | | | 600,000 | | | | 688,500 | |
| | | | | | | | | | |
| | | | | | | | | 40,997,865 | |
| | | | | | | | | | |
Media 8.1% | | | | | | | | | | |
dBresnan Broadband Holdings LLC, senior note, 144A, 8.00%, 12/15/18 | | United States | | | 1,200,000 | | | | 1,302,000 | |
Cablevision Systems Corp., senior note, 7.75%, 4/15/18 | | United States | | | 1,000,000 | | | | 1,117,500 | |
CCO Holdings LLC/CCO Holdings Capital Corp., senior note, | | | | | | | | | | |
8.125%, 4/30/20 | | United States | | | 700,000 | | | | 787,500 | |
6.50%, 4/30/21 | | United States | | | 1,500,000 | | | | 1,625,625 | |
Clear Channel Communications Inc., senior note, 9.00%, 3/01/21 | | United States | | | 3,800,000 | | | | 3,410,500 | |
Clear Channel Worldwide Holdings Inc., | | | | | | | | | | |
dsenior note, 144A, 6.50%, 11/15/22 | | United States | | | 1,000,000 | | | | 1,042,500 | |
senior sub. note, 7.625%, 3/15/20 | | United States | | | 200,000 | | | | 200,500 | |
senior sub. note, 7.625%, 3/15/20 | | United States | | | 1,100,000 | | | | 1,113,750 | |
dCSC Holdings LLC, senior note, 144A, 6.75%, 11/15/21 | | United States | | | 1,500,000 | | | | 1,670,625 | |
DISH DBS Corp., senior note, | | | | | | | | | | |
7.125%, 2/01/16 | | United States | | | 3,000,000 | | | | 3,375,000 | |
6.75%, 6/01/21 | | United States | | | 1,500,000 | | | | 1,717,500 | |
Media General Inc., senior secured note, 11.75%, 2/15/17 | | United States | | | 1,275,000 | | | | 1,479,000 | |
gRadio One Inc., senior sub. note, PIK, 15.00%, 5/24/16 | | United States | | | 1,676,514 | | | | 1,513,054 | |
dUnivision Communications Inc., senior secured note, 144A, | | | | | | | | | | |
6.875%, 5/15/19 | | United States | | | 2,500,000 | | | | 2,612,500 | |
7.875%, 11/01/20 | | United States | | | 700,000 | | | | 761,250 | |
dUPCB Finance III Ltd., senior secured note, 144A, 6.625%, 7/01/20 | | Netherlands | | | 1,000,000 | | | | 1,076,250 | |
dUPCB Finance VI Ltd., senior secured note, 144A, 6.875%, 1/15/22 | | Netherlands | | | 500,000 | | | | 541,562 | |
dWMG Acquisition Corp., secured note, 144A, 6.00%, 1/15/21 | | United States | | | 3,100,000 | | | | 3,286,000 | |
| | | | | | | | | | |
| | | | | | | | | 28,632,616 | |
| | | | | | | | | | |
Pharmaceuticals, Biotechnology & Life Sciences 3.7% | | | | | | | | | | |
Endo Health Solutions Inc., senior note, 7.00%, | | | | | | | | | | |
7/15/19 | | United States | | | 800,000 | | | | 857,000 | |
12/15/20 | | United States | | | 300,000 | | | | 321,375 | |
Grifols Inc., senior note, 8.25%, 2/01/18 | | Spain | | | 2,000,000 | | | | 2,212,500 | |
dinVentiv Health Inc., senior note, 144A, | | | | | | | | | | |
9.00%, 1/15/18 | | United States | | | 600,000 | | | | 607,500 | |
10.00%, 8/15/18 | | United States | | | 2,400,000 | | | | 2,094,000 | |
dJaguar Holding Co. II/Merger Sub Inc., senior note, 144A, 9.50%, 12/01/19 | | United States | | | 700,000 | | | | 798,000 | |
dPar Pharmaceutical Cos. Inc., senior note, 144A, 7.375%, 10/15/20 | | United States | | | 3,300,000 | | | | 3,300,000 | |
FH-15
Franklin Templeton Variable Insurance Products Trust
Statement of Investments, December 31, 2012 (continued)
| | | | | | | | | | |
| Franklin High Income Securities Fund | | Country | | Principal
Amount* | | | Value | |
Corporate Bonds (continued) | | | | | | | | | | |
Pharmaceuticals, Biotechnology & Life Sciences (continued) | | | | | | | | | | |
dVPI Escrow Corp., senior note, 144A, 6.375%, 10/15/20 | | United States | | | 2,500,000 | | | $ | 2,693,750 | |
| | | | | | | | | | |
| | | | | | | | | 12,884,125 | |
| | | | | | | | | | |
Real Estate 0.2% | | | | | | | | | | |
Forest City Enterprises Inc., senior note, | | | | | | | | | | |
7.625%, 6/01/15 | | United States | | | 498,000 | | | | 498,623 | |
6.50%, 2/01/17 | | United States | | | 300,000 | | | | 295,500 | |
| | | | | | | | | | |
| | | | | | | | | 794,123 | |
| | | | | | | | | | |
Retailing 0.8% | | | | | | | | | | |
Michaels Stores Inc., senior note, | | | | | | | | | | |
7.75%, 11/01/18 | | United States | | | 1,500,000 | | | | 1,653,750 | |
d144A, 7.75%, 11/01/18 | | United States | | | 1,000,000 | | | | 1,102,500 | |
| | | | | | | | | | |
| | | | | | | | | 2,756,250 | |
| | | | | | | | | | |
Semiconductors & Semiconductor Equipment 0.9% | | | | | | | | | | |
Freescale Semiconductor Inc., senior note, | | | | | | | | | | |
8.05%, 2/01/20 | | United States | | | 2,000,000 | | | | 2,000,000 | |
10.75%, 8/01/20 | | United States | | | 1,104,000 | | | | 1,189,560 | |
| | | | | | | | | | |
| | | | | | | | | 3,189,560 | |
| | | | | | | | | | |
Software & Services 3.0% | | | | | | | | | | |
dCeridian Corp., secured note, 144A, 8.875%, 7/15/19 | | United States | | | 800,000 | | | | 872,000 | |
First Data Corp., | | | | | | | | | | |
senior bond, 12.625%, 1/15/21 | | United States | | | 1,000,000 | | | | 1,057,500 | |
senior note, 9.875%, 9/24/15 | | United States | | | 71,000 | | | | 72,597 | |
senior note, 9.875%, 9/24/15 | | United States | | | 111,000 | | | | 113,775 | |
dsenior secured bond, 144A, 8.25%, 1/15/21 | | United States | | | 2,500,000 | | | | 2,512,500 | |
Sitel LLC/Finance Corp., | | | | | | | | | | |
senior note, 11.50%, 4/01/18 | | United States | | | 1,300,000 | | | | 923,000 | |
dsenior secured note, 144A, 11.00%, 8/01/17 | | United States | | | 700,000 | | | | 714,000 | |
Sterling International Inc., senior note, 11.00%, 10/01/19 | | United States | | | 1,200,000 | | | | 1,230,000 | |
West Corp., senior note, 7.875%, 1/15/19 | | United States | | | 2,900,000 | | | | 3,016,000 | |
| | | | | | | | | | |
| | | | | | | | | 10,511,372 | |
| | | | | | | | | | |
Technology Hardware & Equipment 1.7% | | | | | | | | | | |
CDW LLC/Finance Corp., senior note, 8.50%, 4/01/19 | | United States | | | 3,200,000 | | | | 3,480,000 | |
dCommScope Inc., senior note, 144A, 8.25%, 1/15/19 | | United States | | | 2,300,000 | | | | 2,530,000 | |
| | | | | | | | | | |
| | | | | | | | | 6,010,000 | |
| | | | | | | | | | |
Telecommunication Services 9.1% | | | | | | | | | | |
CenturyLink Inc., senior note, | | | | | | | | | | |
6.45%, 6/15/21 | | United States | | | 400,000 | | | | 442,320 | |
5.80%, 3/15/22 | | United States | | | 2,500,000 | | | | 2,644,895 | |
Cricket Communications Inc., senior note, 7.75%, 10/15/20 | | United States | | | 2,500,000 | | | | 2,562,500 | |
dCyrusOne LP/Finance Corp., senior note, 144A, 6.375%, 11/15/22 | | United States | | | 600,000 | | | | 628,500 | |
dDigicel Group Ltd., senior note, 144A, 8.25%, 9/30/20 | | Jamaica | | | 2,000,000 | | | | 2,197,500 | |
deAccess Ltd., senior note, 144A, 8.25%, 4/01/18 | | Japan | | | 1,800,000 | | | | 2,032,875 | |
Frontier Communications Corp., senior note, | | | | | | | | | | |
8.50%, 4/15/20 | | United States | | | 2,000,000 | | | | 2,310,000 | |
8.75%, 4/15/22 | | United States | | | 900,000 | | | | 1,048,500 | |
7.125%, 1/15/23 | | United States | | | 300,000 | | | | 319,125 | |
FH-16
Franklin Templeton Variable Insurance Products Trust
Statement of Investments, December 31, 2012 (continued)
| | | | | | | | | | |
| Franklin High Income Securities Fund | | Country | | Principal
Amount* | | | Value | |
Corporate Bonds (continued) | | | | | | | | | | |
Telecommunication Services (continued) | | | | | | | | | | |
Intelsat Jackson Holdings SA, senior note, | | | | | | | | | | |
7.25%, 10/15/20 | | Luxembourg | | | 900,000 | | | $ | 982,125 | |
7.50%, 4/01/21 | | Luxembourg | | | 3,800,000 | | | | 4,208,500 | |
MetroPCS Wireless Inc., senior note, 7.875%, 9/01/18 | | United States | | | 600,000 | | | | 652,500 | |
Sprint Nextel Corp., senior note, | | | | | | | | | | |
8.375%, 8/15/17 | | United States | | | 3,000,000 | | | | 3,502,500 | |
d144A, 9.00%, 11/15/18 | | United States | | | 3,000,000 | | | | 3,712,500 | |
d144A, 7.00%, 3/01/20 | | United States | | | 300,000 | | | | 349,500 | |
dWind Acquisition Finance SA, senior secured note, 144A, 11.75%, 7/15/17 | | Italy | | | 2,000,000 | | | | 2,105,000 | |
d,gWind Acquisition Holdings Finance SA, senior secured note, 144A, PIK, 12.25%, | | | | | | | | | | |
7/15/17 | | Italy | | | 563,125 | | | | 545,394 | |
7/15/17 | | Italy | | | 543,630 | EUR | | | 676,778 | |
Zayo Group LLC/Zayo Capital Inc., senior secured note, first lien, 8.125%, 1/01/20 | | United States | | | 1,000,000 | | | | 1,117,500 | |
| | | | | | | | | | |
| | | | | | | | | 32,038,512 | |
| | | | | | | | | | |
Transportation 1.7% | | | | | | | | | | |
dCEVA Group PLC, senior secured note, 144A, | | | | | | | | | | |
11.625%, 10/01/16 | | United Kingdom | | | 200,000 | | | | 206,500 | |
8.375%, 12/01/17 | | United Kingdom | | | 1,300,000 | | | | 1,295,125 | |
11.50%, 4/01/18 | | United Kingdom | | | 1,000,000 | | | | 845,000 | |
Hertz Corp., senior note, | | | | | | | | | | |
7.50%, 10/15/18 | | United States | | | 1,100,000 | | | | 1,221,000 | |
6.75%, 4/15/19 | | United States | | | 2,000,000 | | | | 2,192,500 | |
d144A, 6.75%, 4/15/19 | | United States | | | 200,000 | | | | 219,250 | |
| | | | | | | | | | |
| | | | | | | | | 5,979,375 | |
| | | | | | | | | | |
Utilities 2.4% | | | | | | | | | | |
dCalpine Corp., senior secured note, 144A, | | | | | | | | | | |
7.875%, 7/31/20 | | United States | | | 726,000 | | | | 818,565 | |
7.50%, 2/15/21 | | United States | | | 1,330,000 | | | | 1,476,300 | |
7.875%, 1/15/23 | | United States | | | 892,000 | | | | 1,012,420 | |
dIntergen NV, senior secured note, 144A, 9.00%, 6/30/17 | | Netherlands | | | 2,500,000 | | | | 2,250,000 | |
| dTexas Competitive Electric Holdings Co. LLC/Texas Competitive Electric Holdings Finance Inc., senior secured note, 144A, 11.50%, 10/01/20 | | United States | | | 3,500,000 | | | | 2,756,250 | |
| | | | | | | | | | |
| | | | | | | | | 8,313,535 | |
| | | | | | | | | | |
Total Corporate Bonds (Cost $313,228,388) | | | | | | | | | 329,979,215 | |
| | | | | | | | | | |
h,iSenior Floating Rate Interests 1.1% | | | | | | | | | | |
Capital Goods 0.3% | | | | | | | | | | |
Navistar Inc., Tranche B Term Loan, 7.00%, 8/17/17 | | United States | | | 1,100,000 | | | | 1,108,250 | |
| | | | | | | | | | |
Media 0.5% | | | | | | | | | | |
Cumulus Media Holdings Inc., Second Lien Term Loan, 7.50%, 9/16/19 | | United States | | | 1,500,000 | | | | 1,548,750 | |
Univision Communications Inc., Initial Term Loan, 2.212%, 9/29/14 | | United States | | | 303,460 | | | | 303,603 | |
| | | | | | | | | | |
| | | | | | | | | 1,852,353 | |
| | | | | | | | | | |
Utilities 0.3% | | | | | | | | | | |
Texas Competitive Electric Holdings Co. LLC, 2017 Term Loan, 4.713% - 4.81%, 10/10/17 | | United States | | | 1,431,288 | | | | 963,819 | |
| | | | | | | | | | |
Total Senior Floating Rate Interests (Cost $4,060,075) | | | | | | | | | 3,924,422 | |
| | | | | | | | | | |
Total Investments before Short Term Investments
(Cost $320,518,523) | | | | | | | | | 335,682,457 | |
| | | | | | | | | | |
FH-17
Franklin Templeton Variable Insurance Products Trust
Statement of Investments, December 31, 2012 (continued)
| | | | | | | | | | | | |
| Franklin High Income Securities Fund | | Country | | | Principal
Amount* | | | Value | |
Short Term Investments (Cost $10,541,130) 2.9% | | | | | | | | | | | | |
Repurchase Agreements 2.9% | | | | | | | | | | | | |
jJoint Repurchase Agreement, 0.154%, 1/02/13 (Maturity Value $10,541,221) | | | United States | | | | 10,541,130 | | | $ | 10,541,130 | |
BNP Paribas Securities Corp. (Maturity Value $1,372,256) Credit Suisse Securities (USA) LLC (Maturity Value $1,715,374) Deutsche Bank Securities Inc. (Maturity Value $1,106,828) HSBC Securities (USA) Inc. (Maturity Value $3,087,629) Merrill Lynch, Pierce, Fenner & Smith Inc. (Maturity Value $1,372,256) Morgan Stanley & Co. LLC (Maturity Value $514,622) UBS Securities LLC (Maturity Value $1,372,256) | | | | | | | | | | | | |
Collateralized by U.S. Government Agency Securities, 0.00% - 6.21%, 1/15/13 - 1/22/37; U.S. Treasury Bonds, 11.25%, 2/15/15; and U.S. Treasury Notes, 0.25% - 2.00%, 11/30/13 - 9/15/15 (valued at $10,753,148) | | | | | | | | | | | | |
| | | | | | | | | | | | |
Total Investments (Cost $331,059,653) 98.4% | | | | | | | | | | | 346,223,587 | |
Other Assets, less Liabilities 1.6% | | | | | | | | | | | 5,458,082 | |
| | | | | | | | | | | | |
Net Assets 100.0% | | | | | | | | | | $ | 351,681,669 | |
| | | | | | | | | | | | |
*The principal amount is stated in U.S. dollars unless otherwise indicated.
aNon-income producing.
bSecurities have been deemed illiquid because it may not be able to be sold within seven days. At December 31, 2012, the aggregate value of these securities was $191 representing less than 0.01% of net assets.
cSee Note 8 regarding restricted securities.
dSecurities were purchased pursuant to Rule 144A under the Securities Act of 1933 and may be sold in transactions exempt from registration only to qualified institutional buyers or in a public offering registered under the Securities Act of 1933. These securities have been deemed liquid under guidelines approved by the Trust’s Board of Trustees. At December 31, 2012, the aggregate value of these securities was $132,391,765, representing 37.65% of net assets.
eSee Note 7 regarding defaulted securities.
fPerpetual security with no stated maturity date.
gIncome may be received in additional securities and/or cash.
hThe coupon rate shown represents the rate at period end.
iSee Note 1(e) regarding senior floating rate interests.
jSee Note 1(c) regarding joint repurchase agreement.
FH-18
Franklin Templeton Variable Insurance Products Trust
Statement of Investments, December 31, 2012 (continued)
| | | | | | |
| Franklin High Income Securities Fund | | | | | | |
Forward Exchange Contracts
At December 31, 2012, the Fund had the following forward exchange contracts outstanding. See Note 1(d).
| | | | | | | | | | | | | | | | | | | | | | | | | | | | |
| Currency | | Counterparty | | | Type | | | Quantity | | | Contract
Amount | | | Settlement
Date | | | Unrealized
Appreciation | | Unrealized
Depreciation | |
Euro | | | DBAB | | | | Sell | | | | 400,000 | | | $ | 528,280 | | | | 12/18/13 | | | | | $ — | | $ | (1,540 | ) |
| | | | | | | | | | | | | | | | | | | | | | | | | |
See Abbreviations on page FH-32.
The accompanying notes are an integral part of these financial statements.
FH-19
Franklin Templeton Variable Insurance Products Trust
Financial Statements
Statement of Assets and Liabilities
December 31, 2012
| | | | |
| | | Franklin
High Income
Securities Fund | |
Assets: | | | | |
Investments in securities: | | | | |
Cost - Unaffiliated issuers | | $ | 320,518,523 | |
Cost - Repurchase agreements | | | 10,541,130 | |
| | | | |
Total cost of investments | | $ | 331,059,653 | |
| | | | |
Value - Unaffiliated issuers | | $ | 335,682,457 | |
Value - Repurchase agreements | | | 10,541,130 | |
| | | | |
Total value of investments | | | 346,223,587 | |
Cash | | | 10,577 | |
Receivables: | | | | |
Investment securities sold | | | 17,090 | |
Capital shares sold | | | 15,120 | |
Interest | | | 6,269,644 | |
Other assets | | | 6 | |
| | | | |
Total assets | | | 352,536,024 | |
| | | | |
Liabilities: | | | | |
Payables: | | | | |
Capital shares redeemed | | | 465,286 | |
Affiliates | | | 285,875 | |
Reports to shareholders | | | 51,718 | |
Professional fees | | | 41,713 | |
Unrealized depreciation on forward exchange contracts | | | 1,540 | |
Accrued expenses and other liabilities | | | 8,223 | |
| | | | |
Total liabilities | | | 854,355 | |
| | | | |
Net assets, at value | | $ | 351,681,669 | |
| | | | |
Net assets consist of: | | | | |
Paid-in capital | | $ | 343,056,732 | |
Undistributed net investment income | | | 22,935,694 | |
Net unrealized appreciation (depreciation) | | | 15,162,394 | |
Accumulated net realized gain (loss) | | | (29,473,151 | ) |
| | | | |
Net assets, at value | | $ | 351,681,669 | |
| | | | |
The accompanying notes are an integral part of these financial statements.
FH-20
Franklin Templeton Variable Insurance Products Trust
Financial Statements (continued)
Statement of Assets and Liabilities (continued)
December 31, 2012
| | | | |
| | | Franklin
High Income
Securities Fund | |
Class 1: | | | | |
Net assets, at value | | $ | 42,165,968 | |
| | | | |
Shares outstanding | | | 6,016,128 | |
| | | | |
Net asset value and maximum offering price per share | | $ | 7.01 | |
| | | | |
Class 2: | | | | |
Net assets, at value | | $ | 281,851,357 | |
| | | | |
Shares outstanding | | | 41,336,596 | |
| | | | |
Net asset value and maximum offering price per share | | $ | 6.82 | |
| | | | |
Class 4: | | | | |
Net assets, at value | | $ | 27,664,344 | |
| | | | |
Shares outstanding | | | 3,987,677 | |
| | | | |
Net asset value and maximum offering price per share | | $ | 6.94 | |
| | | | |
The accompanying notes are an integral part of these financial statements.
FH-21
Franklin Templeton Variable Insurance Products Trust
Financial Statements (continued)
Statement of Operations
for the year ended December 31, 2012
| | | | |
| | | Franklin
High Income
Securities Fund | |
Investment income: | | | | |
Dividends | | $ | 111,767 | |
Interest | | | 26,035,089 | |
| | | | |
Total investment income | | | 26,146,856 | |
| | | | |
Expenses: | | | | |
Management fees (Note 3a) | | | 1,771,157 | |
Distribution fees: (Note 3c) | | | | |
Class 2 | | | 671,899 | |
Class 4 | | | 95,695 | |
Unaffiliated transfer agent fees | | | 97 | |
Custodian fees (Note 4) | | | 5,075 | |
Reports to shareholders | | | 108,023 | |
Professional fees | | | 49,594 | |
Trustees’ fees and expenses | | | 1,303 | |
Other | | | 27,089 | |
| | | | |
Total expenses | | | 2,729,932 | |
| | | | |
Net investment income | | | 23,416,924 | |
| | | | |
Realized and unrealized gains (losses): | | | | |
Net realized gain (loss) from: | | | | |
Investments | | | 3,275,855 | |
Foreign currency transactions | | | (716 | ) |
Swap contracts | | | 236,015 | |
| | | | |
Net realized gain (loss) | | | 3,511,154 | |
| | | | |
Net change in unrealized appreciation (depreciation) on: | | | | |
Investments | | | 21,975,923 | |
Translation of other assets and liabilities denominated in foreign currencies | | | (6,392 | ) |
| | | | |
Net change in unrealized appreciation (depreciation) | | | 21,969,531 | |
| | | | |
Net realized and unrealized gain (loss) | | | 25,480,685 | |
| | | | |
Net increase (decrease) in net assets resulting from operations | | $ | 48,897,609 | |
| | | | |
The accompanying notes are an integral part of these financial statements.
FH-22
Franklin Templeton Variable Insurance Products Trust
Financial Statements (continued)
Statements of Changes in Net Assets
| | | | | | | | |
| | | Franklin High Income
Securities Fund | |
| | | Year Ended December 31, | |
| | | 2012 | | | 2011 | |
| | | | |
Increase (decrease) in net assets: | | | | | | | | |
Operations: | | | | | | | | |
Net investment income | | $ | 23,416,924 | | | $ | 24,281,884 | |
Net realized gain (loss) from investments, foreign currency transactions and swap contracts | | | 3,511,154 | | | | 7,087,968 | |
Net change in unrealized appreciation (depreciation) on investments and translation of other assets and liabilities denominated in foreign currencies | | | 21,969,531 | | | | (18,159,827 | ) |
| | | | |
Net increase (decrease) in net assets resulting from operations | | | 48,897,609 | | | | 13,210,025 | |
| | | | |
Distributions to shareholders from: | | | | | | | | |
Net investment income: | | | | | | | | |
Class 1 | | | (2,935,357 | ) | | | (2,826,791 | ) |
Class 2 | | | (18,731,686 | ) | | | (16,984,105 | ) |
Class 4 | | | (1,858,828 | ) | | | (1,620,002 | ) |
| | | | |
Total distributions to shareholders | | | (23,525,871 | ) | | | (21,430,898 | ) |
| | | | |
Capital share transactions: (Note 2) | | | | | | | | |
Class 1 | | | (3,084,036 | ) | | | (5,339,666 | ) |
Class 2 | | | 12,381,383 | | | | 16,598,368 | |
Class 4 | | | (1,465,915 | ) | | | 1,632,254 | |
| | | | |
Total capital share transactions | | | 7,831,432 | | | | 12,890,956 | |
| | | | |
Net increase (decrease) in net assets | | | 33,203,170 | | | | 4,670,083 | |
Net assets: | | | | | | | | |
Beginning of year | | | 318,478,499 | | | | 313,808,416 | |
| | | | |
End of year | | $ | 351,681,669 | | | $ | 318,478,499 | |
| | | | |
Undistributed net investment income included in net assets: | | | | | | | | |
End of year | | $ | 22,935,694 | | | $ | 22,720,819 | |
| | | | |
The accompanying notes are an integral part of these financial statements.
FH-23
Franklin Templeton Variable Insurance Products Trust
Notes to Financial Statements
Franklin High Income Securities Fund
1. ORGANIZATION AND SIGNIFICANT ACCOUNTING POLICIES
Franklin Templeton Variable Insurance Products Trust (Trust) is registered under the Investment Company Act of 1940, as amended, (1940 Act) as an open-end investment company, consisting of twenty separate funds. The Franklin High Income Securities Fund (Fund) is included in this report. The financial statements of the remaining funds in the Trust are presented separately. Shares of the Fund are generally sold only to insurance company separate accounts to fund the benefits of variable life insurance policies or variable annuity contracts. At December 31, 2012, 86.87% of the Fund’s shares were held through one insurance company. Investment activities of these insurance company separate accounts could have a material impact on the Fund. The Fund offers three classes of shares: Class 1, Class 2, and Class 4. Each class of shares differs by its distribution fees, voting rights on matters affecting a single class and its exchange privilege.
The following summarizes the Fund’s significant accounting policies.
a. Financial Instrument Valuation
The Fund’s investments in financial instruments are carried at fair value daily. Fair value is the price that would be received to sell an asset or paid to transfer a liability in an orderly transaction between market participants on the measurement date. Under procedures approved by the Trust’s Board of Trustees (the Board), the Fund’s administrator, investment manager and other affiliates have formed the Valuation and Liquidity Oversight Committee (VLOC). The VLOC provides administration and oversight of the Fund’s valuation policies and procedures, which are approved annually by the Board. Among other things, these procedures allow the Fund to utilize independent pricing services, quotations from securities and financial instrument dealers, and other market sources to determine fair value.
Equity securities listed on an exchange or on the NASDAQ National Market System are valued at the last quoted sale price or the official closing price of the day, respectively. Over-the-counter (OTC) securities are valued within the range of the most recent quoted bid and ask prices. Securities that trade in multiple markets or on multiple exchanges are valued according to the broadest and most representative market. Certain equity securities are valued based upon fundamental characteristics or relationships to similar securities.
Debt securities generally trade in the OTC market rather than on a securities exchange. The Fund’s pricing services use multiple valuation techniques to determine fair value. In instances where sufficient market activity exists, the pricing services may utilize a market-based approach through which quotes from market makers are used to determine fair value. In instances where sufficient market activity may not exist or is limited, the pricing services also utilize proprietary valuation models which may consider market characteristics such as benchmark yield curves, credit spreads, estimated default rates, anticipated market interest rate volatility, coupon rates, anticipated timing of principal repayments, underlying collateral, and other unique security features in order to estimate the relevant cash flows, which are then discounted to calculate the fair value. Securities denominated in a foreign currency are converted into their U.S. dollar equivalent at the foreign exchange rate in effect at the close of the NYSE on the date that the values of the foreign debt securities are determined. Repurchase agreements are valued at cost, which approximates market value.
Certain derivative financial instruments (derivatives) trade in the OTC market. The Fund’s pricing services use various techniques including industry standard option pricing models and proprietary discounted cash flow models to determine the fair value of those instruments. The Fund’s net benefit or obligation under the derivative contract, as measured by the fair market value of the contract, is included in net assets.
The Fund has procedures to determine the fair value of financial instruments for which market prices are not reliable or readily available. Under these procedures, the VLOC convenes on a regular basis to review such financial instruments and considers a number of factors, including significant unobservable valuation inputs, when arriving at fair value. The VLOC primarily employs a market-based approach which may use related or comparable assets or liabilities, recent transactions, market multiples, book values, and other relevant information for the investment to determine the fair value of the investment. An income-based
FH-24
Franklin Templeton Variable Insurance Products Trust
Notes to Financial Statements (continued)
Franklin High Income Securities Fund
1. ORGANIZATION AND SIGNIFICANT ACCOUNTING POLICIES (continued)
a. Financial Instrument Valuation (continued)
valuation approach may also be used in which the anticipated future cash flows of the investment are discounted to calculate fair value. Discounts may also be applied due to the nature or duration of any restrictions on the disposition of the investments. Due to the inherent uncertainty of valuations of such investments, the fair values may differ significantly from the values that would have been used had an active market existed. The VLOC employs various methods for calibrating these valuation approaches including a regular review of key inputs and assumptions, transactional back-testing or disposition analysis, and reviews of any related market activity.
b. Foreign Currency Translation
Portfolio securities and other assets and liabilities denominated in foreign currencies are translated into U.S. dollars based on the exchange rate of such currencies against U.S. dollars on the date of valuation. The Fund may enter into foreign currency exchange contracts to facilitate transactions denominated in a foreign currency. Purchases and sales of securities, income and expense items denominated in foreign currencies are translated into U.S. dollars at the exchange rate in effect on the transaction date. Portfolio securities and assets and liabilities denominated in foreign currencies contain risks that those currencies will decline in value relative to the U.S. dollar. Occasionally, events may impact the availability or reliability of foreign exchange rates used to convert the U.S. dollar equivalent value. If such an event occurs, the foreign exchange rate will be valued at fair value using procedures established and approved by the Board.
The Fund does not separately report the effect of changes in foreign exchange rates from changes in market prices on securities held. Such changes are included in net realized and unrealized gain or loss from investments on the Statement of Operations.
Realized foreign exchange gains or losses arise from sales of foreign currencies, currency gains or losses realized between the trade and settlement dates on securities transactions and the difference between the recorded amounts of dividends, interest, and foreign withholding taxes and the U.S. dollar equivalent of the amounts actually received or paid. Net unrealized foreign exchange gains and losses arise from changes in foreign exchange rates on foreign denominated assets and liabilities other than investments in securities held at the end of the reporting period.
c. Joint Repurchase Agreement
The Fund enters into a joint repurchase agreement whereby its uninvested cash balance is deposited into a joint cash account with other funds managed by the investment manager or an affiliate of the investment manager and is used to invest in one or more repurchase agreements. The value and face amount of the joint repurchase agreement are allocated to the funds based on their pro-rata interest. A repurchase agreement is accounted for as a loan by the fund to the seller, collateralized by securities which are delivered to the fund’s custodian. The market value, including accrued interest, of the initial collateralization is required to be at least 102% of the dollar amount invested by the funds, with the value of the underlying securities marked to market daily to maintain coverage of at least 100%. The joint repurchase agreement held by the Fund at year end had been entered into on December 31, 2012.
d. Derivative Financial Instruments
The Fund invested in derivatives in order to manage risk or gain exposure to various other investments or markets. Derivatives are financial contracts based on an underlying or notional amount, require no initial investment or an initial net investment that is smaller than would normally be required to have a similar response to changes in market factors, and require or permit net settlement. Derivatives contain various risks including the potential inability of the counterparty to fulfill their obligations under the terms of the contract, the potential for an illiquid secondary market, and/or the potential for market movements which
FH-25
Franklin Templeton Variable Insurance Products Trust
Notes to Financial Statements (continued)
Franklin High Income Securities Fund
1. ORGANIZATION AND SIGNIFICANT ACCOUNTING POLICIES (continued)
d. Derivative Financial Instruments (continued)
expose the Fund to gains or losses in excess of the amounts shown on the Statement of Assets and Liabilities. Realized gain and loss and unrealized appreciation and depreciation on these contracts for the period are included in the Statement of Operations.
The Fund’s investments in OTC derivatives are subject to the terms of International Swaps and Derivatives Association Master Agreements and other related agreements between the Fund and certain derivative counterparties. These agreements contain various provisions, including but not limited to collateral requirements, events of default, requirements for the Fund to maintain certain net asset levels and/or limit the decline in net assets over various periods of time. Should the Fund fail to meet any of these provisions, the derivative counterparty has the right to terminate the derivative contract and require immediate payment by the Fund for those OTC derivatives with that particular counterparty that are in a net liability position. At December 31, 2012, the Fund had OTC derivatives in a net liability position for such contracts of $1,540.
The Fund entered into OTC forward exchange contracts primarily to manage and/or gain exposure to certain foreign currencies. A forward exchange contract is an agreement between the Fund and a counterparty to buy or sell a foreign currency for a specific exchange rate on a future date. Pursuant to the terms of the forward exchange contracts, cash or securities may be required to be deposited as collateral. Unrestricted cash may be invested according to the Fund’s investment objectives.
The Fund entered into OTC credit default swap contracts primarily to manage and/or gain exposure to credit risk. A credit default swap is an agreement between the Fund and a counterparty whereby the buyer of the contract receives credit protection and the seller of the contract guarantees the credit worthiness of a referenced debt obligation. The underlying referenced debt obligation may be a single issuer of corporate or sovereign debt, a credit index, or a tranche of a credit index. In the event of a default of the underlying referenced debt obligation, the buyer is entitled to receive the notional amount of the credit default swap contract from the seller in exchange for the referenced debt obligation, a net settlement amount equal to the notional amount of the credit default swap less the recovery value of the referenced debt obligation, or other agreed upon amount. Over the term of the contract, the buyer pays the seller a periodic stream of payments, provided that no event of default has occurred. Such periodic payments are accrued daily as an unrealized appreciation or depreciation until the payments are made, at which time they are realized. Payments received or paid to initiate a credit default swap contract are reflected on the Statement of Assets and Liabilities and represent compensating factors between stated terms of the credit default swap agreement and prevailing market conditions (credit spreads and other relevant factors). These upfront payments are amortized over the term of the contract as a realized gain or loss on the Statement of Operations. Pursuant to the terms of the credit default swap contract, cash or securities may be required to be deposited as collateral. Unrestricted cash may be invested according to the Fund’s investment objectives.
See Note 9 regarding other derivative information.
e. Senior Floating Rate Interests
The Fund invests in senior secured corporate loans that pay interest at rates which are periodically reset by reference to a base lending rate plus a spread. These base lending rates are generally the prime rate offered by a designated U.S. bank or the London InterBank Offered Rate (LIBOR). Senior secured corporate loans often require prepayment of principal from excess cash flows or at the discretion of the borrower. As a result, actual maturity may be substantially less than the stated maturity.
Senior secured corporate loans in which the Fund invests are generally readily marketable, but may be subject to some restrictions on resale.
FH-26
Franklin Templeton Variable Insurance Products Trust
Notes to Financial Statements (continued)
Franklin High Income Securities Fund
1. ORGANIZATION AND SIGNIFICANT ACCOUNTING POLICIES (continued)
f. Income Taxes
It is the Fund’s policy to qualify as a regulated investment company under the Internal Revenue Code. The Fund intends to distribute to shareholders substantially all of its taxable income and net realized gains to relieve it from federal income and if applicable, excise taxes. As a result, no provision for U.S. federal income taxes is required.
The Fund recognizes the tax benefits of uncertain tax positions only when the position is “more likely than not” to be sustained upon examination by the tax authorities based on the technical merits of the tax position. As of December 31, 2012, and for all open tax years, the Fund has determined that no liability for unrecognized tax benefits is required in the Fund’s financial statements related to uncertain tax positions taken on a tax return (or expected to be taken on future tax returns). Open tax years are those that remain subject to examination and are based on each tax jurisdiction statute of limitation.
g. Security Transactions, Investment Income, Expenses and Distributions
Security transactions are accounted for on trade date. Realized gains and losses on security transactions are determined on a specific identification basis. Interest income and estimated expenses are accrued daily. Amortization of premium and accretion of discount on debt securities are included in interest income. Facility fees are recognized as income over the expected term of the loan. Dividend income is recorded on the ex-dividend date. Distributions to shareholders are recorded on the ex-dividend date and are determined according to income tax regulations (tax basis). Distributable earnings determined on a tax basis may differ from earnings recorded in accordance with accounting principles generally accepted in the United States of America. These differences may be permanent or temporary. Permanent differences are reclassified among capital accounts to reflect their tax character. These reclassifications have no impact on net assets or the results of operations. Temporary differences are not reclassified, as they may reverse in subsequent periods.
Common expenses incurred by the Trust are allocated among the funds based on the ratio of net assets of each fund to the combined net assets of the Trust. Fund specific expenses are charged directly to the fund that incurred the expense.
Realized and unrealized gains and losses and net investment income, not including class specific expenses, are allocated daily to each class of shares based upon the relative proportion of net assets of each class. Differences in per share distributions, by class, are generally due to differences in class specific expenses.
h. Accounting Estimates
The preparation of financial statements in accordance with accounting principles generally accepted in the United States of America requires management to make estimates and assumptions that affect the reported amounts of assets and liabilities at the date of the financial statements and the amounts of income and expenses during the reporting period. Actual results could differ from those estimates.
i. Guarantees and Indemnifications
Under the Trust’s organizational documents, its officers and trustees are indemnified by the Trust against certain liabilities arising out of the performance of their duties to the Trust. Additionally, in the normal course of business, the Trust, on behalf of the Fund, enters into contracts with service providers that contain general indemnification clauses. The Trust’s maximum exposure under these arrangements is unknown as this would involve future claims that may be made against the Trust that have not yet occurred. Currently, the Trust expects the risk of loss to be remote.
FH-27
Franklin Templeton Variable Insurance Products Trust
Notes to Financial Statements (continued)
Franklin High Income Securities Fund
2. SHARES OF BENEFICIAL INTEREST
At December 31, 2012, there were an unlimited number of shares authorized (without par value). Transactions in the Fund’s shares were as follows:
Shares of Beneficial Interest
| | | | | | | | | | | | | | | | |
| | | Year Ended December 31, | |
| | | 2012 | | | 2011 | |
| Class 1 Shares: | | Shares | | | Amount | | | Shares | | | Amount | |
Shares sold | | | 237,071 | | | $ | 1,594,666 | | | | 351,292 | | | $ | 2,313,979 | |
Shares issued in reinvestment of distributions | | | 461,534 | | | | 2,935,357 | | | | 434,223 | | | | 2,826,791 | |
Shares redeemed | | | (1,118,303 | ) | | | (7,614,059 | ) | | | (1,598,692 | ) | | | (10,480,436 | ) |
| | | | |
Net increase (decrease) | | | (419,698 | ) | | $ | (3,084,036 | ) | | | (813,177 | ) | | $ | (5,339,666 | ) |
| | | | |
Class 2 Shares: | | | | | | | | | | | | | | | | |
Shares sold | | | 6,520,319 | | | $ | 43,016,960 | | | | 12,499,502 | | | $ | 81,812,457 | |
Shares issued in reinvestment of distributions | | | 3,021,240 | | | | 18,731,686 | | | | 2,674,662 | | | | 16,984,105 | |
Shares redeemed | | | (7,450,705 | ) | | | (49,367,263 | ) | | | (12,968,695 | ) | | | (82,198,194 | ) |
| | | | |
Net increase (decrease) | | | 2,090,854 | | | $ | 12,381,383 | | | | 2,205,469 | | | $ | 16,598,368 | |
| | | | |
Class 4 Shares: | | | | | | | | | | | | | | | | |
Shares sold | | | 86,672 | | | $ | 581,663 | | | | 337,849 | | | $ | 2,262,900 | |
Shares issued on reinvestment of distributions | | | 294,584 | | | | 1,858,828 | | | | 250,774 | | | | 1,620,002 | |
Shares redeemed | | | (582,921 | ) | | | (3,906,406 | ) | | | (344,910 | ) | | | (2,250,648 | ) |
| | | | |
Net increase (decrease) | | | (201,665 | ) | | $ | (1,465,915 | ) | | | 243,713 | | | $ | 1,632,254 | |
| | | | |
3. TRANSACTIONS WITH AFFILIATES
Franklin Resources, Inc. is the holding company for various subsidiaries that together are referred to as Franklin Templeton Investments. Certain officers and trustees of the Fund are also officers and/or directors of the following subsidiaries:
| | |
| Subsidiary | | Affiliation |
Franklin Advisers, Inc. (Advisers) | | Investment manager |
Franklin Templeton Services, LLC (FT Services) | | Administrative manager |
Franklin Templeton Distributors, Inc. (Distributors) | | Principal underwriter |
Franklin Templeton Investor Services, LLC (Investor Services) | | Transfer agent |
a. Management Fees
The Fund pays an investment management fee to Advisers based on the average daily net assets of the Fund as follows:
| | |
| Annualized Fee Rate | | Net Assets |
| 0.625% | | Up to and including $100 million |
| 0.500% | | Over $100 million, up to and including $250 million |
| 0.450% | | Over $250 million, up to and including $7.5 billion |
| 0.440% | | Over $7.5 billion, up to and including $10 billion |
| 0.430% | | Over $10 billion, up to and including $12.5 billion |
| 0.420% | | Over $12.5 billion, up to and including $15 billion |
| 0.400% | | In excess of $15 billion |
FH-28
Franklin Templeton Variable Insurance Products Trust
Notes to Financial Statements (continued)
Franklin High Income Securities Fund
3. TRANSACTIONS WITH AFFILIATES (continued)
b. Administrative Fees
FT Services, under terms of an agreement, provides administrative services to the Fund and is not paid by the Fund for the services.
c. Distribution Fees
The Board has adopted distribution plans for Class 2 and Class 4 shares pursuant to Rule 12b-1 under the 1940 Act. Under the Fund’s compensation distribution plans, the Fund pays Distributors for costs incurred in connection with the servicing, sale and distribution of the Fund’s shares up to 0.35% per year of its average daily net assets of each class. Some distribution fees are not charged on shares held by affiliates. The Board has agreed to limit the current rate to 0.25% per year for Class 2.
d. Transfer Agent Fees
Investor Services, under terms of an agreement, performs shareholder servicing for the Fund and is not paid by the Fund for the services.
4. EXPENSE OFFSET ARRANGEMENT
The Fund has entered into an arrangement with its custodian whereby credits realized as a result of uninvested cash balances are used to reduce a portion of the Fund’s custodian expenses. During the year ended December 31, 2012, there were no credits earned.
5. INCOME TAXES
For tax purposes, capital losses may be carried over to offset future capital gains, if any. Capital loss carryforwards with no expiration, if any, must be fully utilized before those losses with expiration dates.
At December 31, 2012, capital loss carryforwards were as follows:
| | | | |
Capital loss carryforwards expiring in: | | | | |
2013 | | $ | 6,321,190 | |
2014 | | | 40,420 | |
2015 | | | 4,493,289 | |
2016 | | | 8,150,741 | |
2017 | | | 10,621,353 | |
| | | | |
| | | $29,626,993 | |
| | | | |
During the year ended December 31, 2012, the Fund utilized $2,982,537 of capital loss carryforwards.
On December 31, 2012, the Fund had expired pre-enactment capital loss carryforwards of $6,027,053, which were reclassified to paid-in capital.
The tax character of distributions paid during the years ended December 31, 2012 and 2011, was as follows:
| | | | | | | | |
| | | 2012 | | | 2011 | |
Distributions paid from ordinary income | | $ | 23,525,871 | | | $ | 21,430,898 | |
FH-29
Franklin Templeton Variable Insurance Products Trust
Notes to Financial Statements (continued)
Franklin High Income Securities Fund
5. INCOME TAXES (continued)
At December 31, 2012, the cost of investments, net unrealized appreciation (depreciation) and undistributed ordinary income for income tax purposes were as follows:
| | | | |
Cost of investments | | $ | 331,655,151 | |
| | | | |
| |
Unrealized appreciation | | $ | 22,092,189 | |
Unrealized depreciation | | | (7,523,753 | ) |
| | | | |
Net unrealized appreciation (depreciation) | | $ | 14,568,436 | |
| | | | |
Distributable earnings – undistributed ordinary income | | $ | 23,750,149 | |
| | | | |
Differences between income and/or capital gains as determined on a book basis and a tax basis are primarily due to differing treatments of defaulted securities, foreign currency transactions, payments-in-kind, bond discounts and premiums, and wash sales.
6. INVESTMENT TRANSACTIONS
Purchases and sales of investments (excluding short term securities) for the year ended December 31, 2012, aggregated $133,758,390 and $119,967,053, respectively.
7. CREDIT RISK AND DEFAULTED SECURITIES
At December 31, 2012, the Fund had 94.34% of its portfolio invested in high yield, senior secured floating rate notes, or other securities rated below investment grade. These securities may be more sensitive to economic conditions causing greater price volatility and are potentially subject to a greater risk of loss due to default than higher rated securities.
The Fund held defaulted securities and/or other securities for which the income has been deemed uncollectible. At December 31, 2012, the aggregate value of these securities represents less than 0.05% of the Fund’s net assets. The Fund discontinues accruing income on securities for which income has been deemed uncollectible and provides an estimate for losses on interest receivable. The securities have been identified on the accompanying Statement of Investments.
8. RESTRICTED SECURITIES
The Fund invests in securities that are restricted under the Securities Act of 1933 (1933 Act) or which are subject to legal, contractual, or other agreed upon restrictions on resale. Restricted securities are often purchased in private placement transactions, and cannot be sold without prior registration unless the sale is pursuant to an exemption under the 1933 Act. Disposal of these securities may require greater effort and expense, and prompt sale at an acceptable price may be difficult. The Fund may have registration rights for restricted securities. The issuer generally incurs all registration costs.
At December 31, 2012, the Fund held investments in restricted securities, excluding certain securities exempt from registration under the 1933 Act deemed to be liquid, as follows:
| | | | | | | | | | | | | | |
| Shares | | | Issuer | | Acquisition
Dates | | Cost | | | Value | |
| | 10,000 | | | aNewPage Holdings Inc. (Value is 0.27% of Net Assets) | | 9/17/09 – 3/09/10 | | $ | 2,460,060 | | | $ | 958,000 | |
| | | | | | | | | | |
a The Fund also invests in unrestricted securities or other investments in the issuer, valued at $– as of December 31, 2012.
FH-30
Franklin Templeton Variable Insurance Products Trust
Notes to Financial Statements (continued)
Franklin High Income Securities Fund
9. OTHER DERIVATIVE INFORMATION
At December 31, 2012, the Fund’s investments in derivative contracts are reflected on the Statement of Assets and Liabilities as follows:
| | | | | | | | | | | | |
| | | Asset Derivatives | | | Liability Derivatives | |
Derivative Contracts Not Accounted
for as Hedging Instruments | | Statement of Assets and
Liabilities Location | | Fair
Value
Amount | | | Statement of Assets and
Liabilities Location | | Fair
Value
Amount | |
Foreign exchange contracts | | Unrealized appreciation on forward exchange contracts | | $ | — | | | Unrealized depreciation on forward exchange contracts | | $ | 1,540 | |
For the year ended December 31, 2012, the effect of derivative contracts on the Fund’s Statement of Operations was as follows:
| | | | | | | | | | |
Derivative Contracts Not Accounted for as Hedging Instruments | | Statement of Operations Locations | | Realized Gain
(Loss) for the
Year | | | Change in
Unrealized
Appreciation
(Depreciation)
for the
Year | |
Foreign exchange contracts | | Net realized gain (loss) from foreign currency transactions / Net change in unrealized appreciation (depreciation) on translation of other assets and liabilities denominated in foreign currencies | | $ | (720 | ) | | $ | (6,392 | ) |
Credit contracts | | Net realized gain (loss) from swap contracts | | $ | 236,015 | | | $ | — | |
For the year ended December 31, 2012, the average month end market value of derivatives represented 0.01% of average month end net assets. The average month end number of open derivative contracts for the year was one.
See Note 1(d) regarding derivative financial instruments.
10. CREDIT FACILITY
The Fund, together with other U.S. registered and foreign investment funds (collectively, Borrowers), managed by Franklin Templeton Investments, are borrowers in a joint syndicated senior unsecured credit facility totaling $1.5 billion (Global Credit Facility) which matured on January 18, 2013. This Global Credit Facility provides a source of funds to the Borrowers for temporary and emergency purposes, including the ability to meet future unanticipated or unusually large redemption requests. Effective January 18, 2013, the Borrowers renewed the Global Credit Facility which matures on January 17, 2014.
Under the terms of the Global Credit Facility, the Fund shall, in addition to interest charged on any borrowings made by the Fund and other costs incurred by the Fund, pay its share of fees and expenses incurred in connection with the implementation and maintenance of the Global Credit Facility, based upon its relative share of the aggregate net assets of all of the Borrowers, including an annual commitment fee of 0.07% based upon the unused portion of the Global Credit Facility. These fees are reflected in other expenses on the Statement of Operations. During the year ended December 31, 2012, the Fund did not use the Global Credit Facility.
11. FAIR VALUE MEASUREMENTS
The Fund follows a fair value hierarchy that distinguishes between market data obtained from independent sources (observable inputs) and the Fund’s own market assumptions (unobservable inputs). These inputs are used in determining the value of the Fund’s financial instruments and are summarized in the following fair value hierarchy:
| | • | | Level 1 – quoted prices in active markets for identical financial instruments |
FH-31
Franklin Templeton Variable Insurance Products Trust
Notes to Financial Statements (continued)
Franklin High Income Securities Fund
11. FAIR VALUE MEASUREMENTS (continued)
| | • | | Level 2 – other significant observable inputs (including quoted prices for similar financial instruments, interest rates, prepayment speed, credit risk, etc.) |
| | • | | Level 3 – significant unobservable inputs (including the Fund’s own assumptions in determining the fair value of financial instruments) |
The inputs or methodology used for valuing financial instruments are not an indication of the risk associated with investing in those financial instruments.
For movements between the levels within the fair value hierarchy, the Fund has adopted a policy of recognizing the transfers as of the date of the underlying event which caused the movement.
A summary of inputs used as of December 31, 2012, in valuing the Fund’s assets and liabilities carried at fair value, is as follows:
| | | | | | | | | | | | | | | | |
| | | Level 1 | | | Level 2 | | | Level 3 | | | Total | |
| | | | |
Assets: | | | | | | | | | | | | | | | | |
Investments in Securities: | | | | | | | | | | | | | | | | |
Equity Investments:a,b | | $ | 820,820 | | | $ | 958,000 | | | $ | — | c | | $ | 1,778,820 | |
Corporate Bonds | | | — | | | | 329,979,024 | | | | 191 | | | | 329,979,215 | |
Senior Floating Rate Interests | | | — | | | | 3,924,422 | | | | — | | | | 3,924,422 | |
Short Term Investments | | | — | | | | 10,541,130 | | | | — | | | | 10,541,130 | |
| | | | |
Total Investments in Securities | | $ | 820,820 | | | $ | 345,402,576 | | | $ | 191 | | | $ | 346,223,587 | |
| | | | |
Liabilities: | | | | | | | | | | | | | | | | |
Forward Exchange Contracts | | | — | | | | 1,540 | | | | — | | | | 1,540 | |
aIncludes common and preferred stocks as well as other equity investments.
bFor detailed categories, see the accompanying Statement of Investments.
cIncludes securities determined to have no value at December 31, 2012.
12. NEW ACCOUNTING PRONOUNCEMENTS
In December 2011, the Financial Accounting Standards Board (FASB) issued Accounting Standards Update (ASU) No. 2011-11, Balance Sheet (Topic 210): Disclosures about Offsetting Assets and Liabilities. The amendments in the ASU enhance disclosures about offsetting of financial assets and liabilities to enable investors to understand the effect of these arrangements on a fund’s financial position. In January 2013, FASB issued ASU No. 2013-01, Balance Sheet (Topic 210): Clarifying the Scope of Disclosures about Offsetting Assets and Liabilities. The amendments in ASU No. 2013-01 clarify the intended scope of disclosures required by ASU No. 2011-11. These ASUs are effective for interim and annual reporting periods beginning on or after January 1, 2013. The Fund believes the adoption of these ASUs will not have a material impact on its financial statements.
13. SUBSEQUENT EVENTS
The Fund has evaluated subsequent events through the issuance of the financial statements and determined that no events have occurred that require disclosure other than those already disclosed in the financial statements.
| | | | |
ABBREVIATIONS | | | | |
| Currency | | Selected Portfolio | | Counterparty |
| | | | |
| EUR - Euro | | FRN - Floating Rate Note | | DBAB - Deutsche Bank AG |
| | PIK - Payment-In-Kind | | |
FH-32
Franklin Templeton Variable Insurance Products Trust
Franklin High Income Securities Fund
Report of Independent Registered Public Accounting Firm
To the Board of Trustees and Shareholders of
Franklin Templeton Variable Insurance Products Trust
In our opinion, the accompanying statement of assets and liabilities, including the statement of investments, and the related statements of operations and of changes in net assets and the financial highlights present fairly, in all material respects, the financial position of Franklin High Income Securities Fund (the “Fund”) at December 31, 2012, the results of its operations for the year then ended, the changes in its net assets for each of the two years in the period then ended and the financial highlights for the periods presented, in conformity with accounting principles generally accepted in the United States of America. These financial statements and financial highlights (hereafter referred to as “financial statements”) are the responsibility of the Fund’s management. Our responsibility is to express an opinion on these financial statements based on our audits. We conducted our audits of these financial statements in accordance with the standards of the Public Company Accounting Oversight Board (United States). Those standards require that we plan and perform the audit to obtain reasonable assurance about whether the financial statements are free of material misstatement. An audit includes examining, on a test basis, evidence supporting the amounts and disclosures in the financial statements, assessing the accounting principles used and significant estimates made by management, and evaluating the overall financial statement presentation. We believe that our audits, which included confirmation of securities at December 31, 2012 by correspondence with the custodian and brokers, provide a reasonable basis for our opinion.
PricewaterhouseCoopers LLP
San Francisco, California
February 15, 2013
FH-33
FRANKLIN INCOME SECURITIES FUND
This annual report for Franklin Income Securities Fund covers the fiscal year ended December 31, 2012.
Performance Summary as of 12/31/12
Average annual total return of Class 2 shares represents the average annual change in value, assuming reinvestment of dividends and capital gains. Average returns smooth out variations in returns, which can be significant; they are not the same as year-by-year results.
Periods ended 12/31/12
| | | | | | | | | | | | |
| | | 1-Year | | | 5-Year | | | 10-Year | |
Average Annual Total Return | | | +12.65% | | | | +4.39% | | | | +8.77% | |
Total Return Index Comparison for a Hypothetical $10,000 Investment (1/1/03–12/31/12)
The graph below shows the change in value of a hypothetical $10,000 investment in the Fund over the indicated period and includes reinvestment of any income or distributions. The Fund’s performance is compared to the performance of the Standard & Poor’s® 500 Index (S&P 500®) and the Barclays U.S. Aggregate Index. One cannot invest directly in an index, and an index is not representative of the Fund’s portfolio. Please see Important Notes to Performance Information preceding the Fund Summaries.
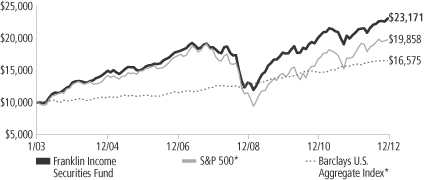
*Source: © 2013 Morningstar. Please see Index Descriptions following the Fund Summaries.
Franklin Income Securities Fund – Class 2
Performance reflects the Fund’s Class 2 operating expenses, but does not include any contract fees, expenses or sales charges. If they had been included, performance would be lower. These charges and deductions, particularly for variable life policies, can have a significant effect on contract values and insurance benefits. See the contract prospectus for a complete description of these expenses, including sales charges.
Performance data represent past performance, which does not guarantee future results. Investment return and principal value will fluctuate, and you may have a gain or loss when you sell your shares.
Current performance may differ from figures shown.
FI-1
Fund Goal and Main Investments: Franklin Income Securities Fund seeks to maximize income while maintaining prospects for capital appreciation. Under normal market conditions, the Fund invests in both equity and debt securities.
Performance Overview
You can find the Fund’s one-year total return in the Performance Summary. The Fund underperformed its equity benchmark, the S&P 500, which posted a +16.00% total return, but outperformed its fixed income benchmark, the Barclays U.S. Aggregate Index, which produced a +4.21% total return for the same period.1
Economic and Market Overview
The U.S. economy, as measured by gross domestic product, grew moderately in 2012, supported by positive construction, housing and labor market trends. U.S. home prices increased in most regions due to higher demand based on near to record-low mortgage rates, affordable housing prices, low new-home inventories and a five-year low in U.S. foreclosures. Home construction became a leading source of economic growth after reaching a multi-year high in 2012, further enhancing confidence in the housing market. Consumer spending and personal income levels climbed, and inflation was generally mild with the exception of energy and food prices. Consumer sentiment reached its highest level in five years, although the potential U.S. tax hikes and spending cuts scheduled to take effect in 2013 dampened confidence near year-end. Nevertheless, the federal budget deficit for fiscal year 2012 fell to its lowest level since 2008. Just after year-end, Congress passed compromise legislation that preserved lower income tax rates for most U.S. households and delayed far-reaching federal spending cuts.
For the 12-month period, U.S. stocks, as measured by the S&P 500 Index, fluctuated as investors reacted to news headlines and shifted between risk taking and risk aversion. Toward period-end uncertainty eased surrounding the European fiscal crisis as leaders made progress on economic reforms and management of Greek debt, but slowing economic growth in Asia, particularly China, curbed global economic recovery and markets. In its December meeting, the Federal Open Market Committee (FOMC) announced a 6.5% unemployment target as a guide to maintaining the historically low federal funds target rate. The FOMC also said it intended to continue purchasing longer term Treas-
1. Source: © 2013 Morningstar. One cannot invest directly in an index, and an index is not representative of the Fund’s portfolio. Please see Index Descriptions following the Fund Summaries.
Fund Risks: All investments involve risks, including possible loss of principal. The Fund’s share price and yield will be affected by interest rate movements. Bond prices generally move in the opposite direction of interest rates. Thus, as the prices of bonds in the Fund adjust to a rise in interest rates, the Fund’s share price may decline. Changes in the financial strength of a bond issuer or in a bond’s credit rating may affect its value. The Fund’s portfolio includes a substantial portion of higher yielding, lower rated corporate bonds because of the relatively higher yields they offer. Floating rate loans are lower rated, higher yielding instruments, which are subject to increased risk of default and can potentially result in loss of principal. These securities carry a greater degree of credit risk relative to investment-grade securities. Stock prices fluctuate, sometimes rapidly and dramatically, due to factors affecting individual companies, particular industries or sectors, or general market conditions. The Fund is actively managed but there is no guarantee that the manager’s investment decisions will produce the desired results. The Fund’s prospectus also includes a description of the main investment risks.
FI-2
uries and agency mortgage-backed securities. Despite modest third-quarter U.S. company revenues suggesting a drop in global demand, a hard-fought national election and budget deadline concerns, domestic stock markets made strong gains for the year. Value stocks generally outperformed growth stocks, and all sectors generated positive returns, as represented by the S&P 500. Not all investors favored stocks, however, and many sought perceived safe havens such as gold bullion, the Japanese yen and U.S. Treasuries. By year-end, the yield on the 10-year U.S. Treasury note declined to 1.78% from 1.89% at the beginning of 2012. During the 12 months under review, below-investment-grade corporate bonds, as measured by the Credit Suisse High Yield Index, produced strong returns and outperformed investment-grade fixed income markets, as measured by the Barclays U.S. Aggregate Index.2
Investment Strategy
We search for undervalued or out-of-favor securities we believe offer opportunities for income today and growth tomorrow. We generally perform independent analysis of the debt securities being considered for the Fund’s portfolio, rather than relying principally on ratings assigned by rating agencies. In analyzing debt and equity securities, we consider a variety of factors, including: a security’s relative value based on such factors as anticipated cash flow, interest or dividend coverage, asset coverage, and earnings prospects; the experience and strength of a company’s management; a company’s sensitivity to changes in interest rates and business conditions; a company’s debt maturity schedules and borrowing requirements; and a company’s changing financial condition and market recognition of the change.
Manager’s Discussion
During the fiscal year, the Fund’s asset allocation shifted with a decrease in fixed income holdings and an increase in equity holdings. Both asset classes contributed significantly to the Fund’s total return for the year. The fixed income allocation declined, driven largely by reduced holdings of corporate bonds throughout the period. The equity allocation rose with an emphasis on dividend-paying large cap companies.
Fixed income markets benefited from persistently low long-term interest rates and a decline in credit spreads driven by stable corporate fundamentals and accommodative capital markets. These factors led to record-high corporate bond issuance, much of which was used to refinance existing debt at lower interest rates and extend debt
2. Please see Index Descriptions following the Fund Summaries.
Portfolio Breakdown
Franklin Income Securities Fund 12/31/12
| | | | |
| | | % of Total
Net Assets | |
| Equity* | | | 50.5% | |
| Utilities | | | 11.9% | |
| Financials | | | 9.8% | |
| Energy | | | 7.5% | |
| Materials | | | 6.4% | |
| Health Care | | | 6.0% | |
| Telecommunication Services | | | 2.7% | |
| Industrials | | | 2.2% | |
| Other | | | 4.0% | |
| Fixed Income | | | 48.4% | |
| Consumer Discretionary | | | 9.0% | |
| Energy | | | 8.7% | |
| Information Technology | | | 8.6% | |
| Utilities | | | 4.8% | |
| Financials | | | 4.0% | |
| Materials | | | 3.9% | |
| Health Care | | | 2.8% | |
| Telecommunication Services | | | 2.7% | |
| Industrials | | | 2.7% | |
Consumer Staples | | | 1.2% | |
| Short-Term Investments & Other Net Assets | | | 1.1% | |
*Includes convertible bonds.
FI-3
maturities. During this period of low absolute yields and a favorable credit environment, we remained focused on looking for opportunities in credit markets, emphasizing high yield corporate bonds. Our corporate bond exposure remained well diversified with our largest sector weightings in technology, energy, communications and consumer non-cyclical companies.3 Given the current interest rate environment, we continued to limit our holdings of other fixed income asset classes including Treasuries, agencies and mortgage-backed securities as we believed better income and capital appreciation opportunities existed in other asset classes.
Equity markets generated solid total returns as unprecedented global central bank actions reduced systemic risks to the global economy, resulting in a period of stable, albeit modest, economic growth. In this environment, many companies continued to benefit from robust profit margins and free cash flow generation. Shareholder-oriented activities including dividend payments and share buybacks increased, partly due to this healthy fundamental backdrop and also due to balance sheet positioning, particularly reduction in debt funding costs and extension of upcoming maturities. In this environment, we found what we considered to be numerous investment opportunities across a wide range of sectors and companies. At period-end, we held a diversified equity portfolio with leading sector concentrations in utilities, financials, energy, materials and health care.
Significant fixed income contributors included First Data and Freescale Semiconductor in the technology sector, Sprint Nextel and CC Media Holdings4 in communications, as well as consumer cyclical company Chrysler Group and consumer non-cyclical investment HCA Holdings.5 In general, detractors including Petroplus Finance,6 Dynegy and ATP Oil & Gas6 needed corporate restructuring as a result of business and balance sheet pressures.
Equity holdings that benefited performance included financials Bank of America, Wells Fargo & Co. and JPMorgan Chase & Co., health care companies Roche Holding, Merck & Co. and Pfizer, materials holding LyondellBasell Industries and industrials company General Electric.
3. Technology fixed income holdings are in information technology in the SOI. Energy fixed income holdings are in energy, materials and utilities in the SOI. Communications fixed income holdings are part of consumer discretionary, information technology and telecommunication services in the SOI. Consumer non-cyclical holdings are in consumer discretionary, consumer staples, financials and health care in the SOI.
4. CC Media Holdings comprises Clear Channel Communications, Inc. and Clear Channel Worldwide Holdings, Inc. in the SOI.
5. Consumer cyclical fixed income holdings are part of consumer discretionary, financials and industrials in the SOI.
6. Sold by period-end.
Top Five Equity Holdings
Franklin Income Securities Fund
12/31/12
| | | | |
Company
Sector/Industry | | % of Total
Net Assets | |
| Wells Fargo & Co. | | | 2.5% | |
| Financials | | | | |
| Bank of America Corp. | | | 2.1% | |
| Financials | | | | |
| Merck & Co. Inc. | | | 2.0% | |
| Health Care | | | | |
| The Dow Chemical Co. | | | 1.4% | |
| Materials | | | | |
| Johnson & Johnson | | | 1.3% | |
| Health Care | | | | |
Top Five Fixed Income and Senior Floating Rate Interests Holdings*
Franklin Income Securities Fund
12/31/12
| | | | |
Issuer
Sector/Industry | | % of Total
Net Assets | |
| First Data Corp. | | | 5.0% | |
| Information Technology | | | | |
| Texas Competitive Electric Holdings Co. LLC | | | 3.1% | |
| Utilities | | | | |
| Freescale Semiconductor Inc. | | | 2.3% | |
| Information Technology | | | | |
| Clear Channel Communications Inc. | | | 2.0% | |
| Consumer Discretionary | | | | |
| Chesapeake Energy Corp. | | | 1.8% | |
| Energy | | | | |
*Does not include convertible bonds.
The dollar value, number of shares or principal amount, and names of all portfolio holdings are listed in the Fund’s Statement of Investments.
FI-4
Several detractors were negatively affected by weak natural gas prices including utilities Exelon and Entergy, and oil and natural gas exploration and production company Chesapeake Energy. Stagnant gold prices combined with cost pressures related to mining operations and labor led to weak share prices for mining companies Barrick Gold and Newmont Mining.
Thank you for your participation in Franklin Income Securities Fund. We look forward to serving your future investment needs.
`
The foregoing information reflects our analysis, opinions and portfolio holdings as of December 31, 2012, the end of the reporting period. The way we implement our main investment strategies and the resulting portfolio holdings may change depending on factors such as market and economic conditions. These opinions may not be relied upon as investment advice or an offer for a particular security. The information is not a complete analysis of every aspect of any market, country, industry, security or the Fund. Statements of fact are from sources considered reliable, but the investment manager makes no representation or warranty as to their completeness or accuracy. Although historical performance is no guarantee of future results, these insights may help you understand our investment management philosophy.
FI-5
Fund Expenses
As an investor in a variable insurance contract (Contract) that indirectly provides for investment in an underlying mutual fund, you can incur transaction and/or ongoing expenses at both the Fund level and the Contract level.
| • | | Transaction expenses can include sales charges (loads) on purchases, redemption fees, surrender fees, transfer fees and premium taxes. |
| • | | Ongoing expenses can include management fees, distribution and service (12b-1) fees, contract fees, annual maintenance fees, mortality and expense risk fees and other fees and expenses. All mutual funds and Contracts have some types of ongoing expenses. |
The expenses shown in the table are meant to highlight ongoing expenses at the Fund level only and do not include ongoing expenses at the Contract level, or transaction expenses at either the Fund or Contract level. While the Fund does not have transaction expenses, if the transaction and ongoing expenses at the Contract level were included, the expenses shown would be higher. You should consult your Contract prospectus or disclosure document for more information.
The table shows Fund-level ongoing expenses and can help you understand these expenses and compare them with those of other mutual funds offered through the Contract. The table assumes a $1,000 investment held for the six months indicated. Please refer to the Fund prospectus for additional information on operating expenses.
Actual Fund Expenses
The first line (Actual) of the table provides actual account values and expenses. The “Ending Account Value” is derived from the Fund’s actual return, which includes the effect of ongoing Fund expenses, but does not include the effect of ongoing Contract expenses.
You can estimate the Fund-level expenses you incurred during the period by following these steps. Of course, your account value and expenses will differ from those in this illustration:
| 1. | Divide your account value by $1,000. |
If an account had an $8,600 value, then $8,600 ÷ $1,000 = 8.6.
| 2. | Multiply the result by the number under the heading “Fund-Level Expenses Incurred During Period.” |
If Fund-Level Expenses Incurred During Period were $7.50, then 8.6 x $7.50 = $64.50.
In this illustration, the estimated expenses incurred this period at the Fund level are $64.50.
Franklin Income Securities Fund – Class 2
FI-6
Hypothetical Example for Comparison with Other Mutual Funds
Information in the second line (Hypothetical) of the table can help you compare ongoing expenses of the Fund with those of other mutual funds offered through the Contract. This information may not be used to estimate the actual ending account balance or expenses you incurred during the period. The hypothetical “Ending Account Value” is based on the Fund’s actual expense ratio and an assumed 5% annual rate of return before expenses, which does not represent the Fund’s actual return. The figure under the heading “Fund-Level Expenses Incurred During Period” shows the hypothetical expenses your account would have incurred under this scenario. You can compare this figure with the 5% hypothetical examples that appear in shareholder reports of other funds offered through a Contract.
| | | | | | | | | | | | |
| Class 2 | | Beginning
Account
Value 7/1/12 | | | Ending
Account
Value 12/31/12 | | | Fund-Level Expenses Incurred
During Period*
7/1/12–12/31/12 | |
Actual | | $ | 1,000 | | | $ | 1,065.00 | | | $ | 3.74 | |
Hypothetical (5% return
before expenses) | | $ | 1,000 | | | $ | 1,021.52 | | | $ | 3.66 | |
*Expenses are calculated using the most recent six-month annualized expense ratio for the Fund’s Class 2 shares (0.72%), which does not include any ongoing expenses of the Contract for which the Fund is an investment option, multiplied by the average account value over the period, multiplied by 184/366 to reflect the one-half year period.
FI-7
SUPPLEMENT DATED DECEMBER 21, 2012
TOTHE PROSPECTUS
DATED MAY 1, 2012
OF
FRANKLIN INCOME SECURITIES FUND
(A series of Franklin Templeton Variable Insurance Products Trust)
The prospectus is amended as follows:
I. The following “Sub-Advisor” section added to page FI-S5 of the Fund Summary above the “Portfolio Managers” section:
Sub-Advisor
Templeton Investment Counsel, LLC (Investment Counsel). The term “investment manager” includes any Sub-Advisor.
II. The Fund Summary “Portfolio Managers” section on page FI-S5 is revised to read as follows:
Portfolio Managers
EDWARD D. PERKS, CFA Senior Vice President of Advisers and portfolio manager of the Fund since 2002.
MATTHEW QUINLAN Portfolio Manager of Advisers and portfolio manager of the Fund since December 2012.
ALEX PETERS, CFA Vice President of Advisers and portfolio manager of the Fund since December 2012.
CHARLES B. JOHNSON Chairman of Franklin Resources, Inc. and portfolio manager of the Fund since 1989.
III. The following paragraph has been added as the second paragraph to the Fund Details “Management” section beginning on page FI-D8:
Under separate agreements with Advisers, Templeton Investment Counsel, LLC (Investment Counsel), is the Fund’s Sub-Advisor. Investment Counsel provides Advisers with investment management advice and assistance. Investment Counsel is an indirect subsidiary of Franklin Resources, Inc. (Resources) and Advisers is a direct subsidiary of Resources. For purposes of the Fund’s investment strategies, techniques and risks, the term “investment manager” includes any Sub-Advisor.
FI-8
IV. For the Fund Details “Management” section disclosure concerning the portfolio management team beginning on page FI-D8 is revised to read as follows:
The Fund is managed by a team of dedicated professionals focused on investments in debt and equity securities. The portfolio managers of the team, including those of the Sub-Advisor, are as follows:
EDWARD D. PERKS, CFA Senior Vice President of Advisers
Mr. Perks has been a portfolio manager of the Fund since 2002. He has final authority over all aspects of the Fund’s investment portfolio, including but not limited to, purchases and sales of individual securities, portfolio risk assessment, and the management of daily cash balances in accordance with anticipated investment management requirements. The degree to which he may perform these functions, and the nature of these functions, may change from time to time. He joined Franklin Templeton Investments in 1992.
MATTHEW QUINLAN Portfolio Manager of Advisers
Mr. Quinlan has been a portfolio manager of the Fund since December 2012, providing research and advice on the purchases and sales of individual securities, and portfolio risk assessment. He joined Franklin Templeton Investments in 2005.
ALEX PETERS, CFA Vice President of Advisers
Mr. Peters has been a portfolio manager of the Fund since December 2012, providing research and advice on the purchases and sales of individual securities, and portfolio risk assessment. He joined Franklin Templeton Investments in 1992.
CHARLES B. JOHNSON Chairman of Franklin Resources, Inc.
Mr. Johnson has been a portfolio manager of the Fund since 1989, providing research and advice on the purchases and sales of individual securities, and portfolio risk assessment. He joined Franklin Templeton Investments in 1957.
CFA® and Chartered Financial Analyst® are trademarks owned by CFA Institute.
Please keep this supplement for future reference.
FI-9
Franklin Templeton Variable Insurance Products Trust
Financial Highlights
Franklin Income Securities Fund
| | | | | | | | | | | | | | | | | | | | |
| | | Year Ended December 31, | |
| Class 1 | | 2012 | | | 2011 | | | 2010 | | | 2009 | | | 2008 | |
| | | | |
Per share operating performance | | | | | | | | | | | | | | | | | | | | |
(for a share outstanding throughout the year) | | | | | | | | | | | | | | | | | | | | |
Net asset value, beginning of year | | $ | 14.68 | | | $ | 15.16 | | | $ | 14.43 | | | $ | 11.53 | | | $ | 17.63 | |
| | | | |
Income from investment operationsa: | | | | | | | | | | | | | | | | | | | | |
Net investment incomeb | | | 0.91 | | | | 0.96 | | | | 0.89 | | | | 0.91 | | | | 1.10 | |
Net realized and unrealized gains (losses) | | | 0.90 | | | | (0.54 | ) | | | 0.85 | | | | 3.08 | | | | (5.99 | ) |
| | | | |
Total from investment operations | | | 1.81 | | | | 0.42 | | | | 1.74 | | | | 3.99 | | | | (4.89 | ) |
| | | | |
Less distributions from: | | | | | | | | | | | | | | | | | | | | |
Net investment income | | | (1.02 | ) | | | (0.90 | ) | | | (1.01 | ) | | | (1.09 | ) | | | (0.86 | ) |
Net realized gains | | | — | | | | — | | | | — | | | | — | | | | (0.35 | ) |
| | | | |
Total distributions | | | (1.02 | ) | | | (0.90 | ) | | | (1.01 | ) | | | (1.09 | ) | | | (1.21 | ) |
| | | | |
Net asset value, end of year | | $ | 15.47 | | | $ | 14.68 | | | $ | 15.16 | | | $ | 14.43 | | | $ | 11.53 | |
| | | | |
| | | | | |
Total returnc | | | 12.91% | | | | 2.71% | | | | 12.87% | | | | 35.88% | | | | (29.41)% | |
Ratios to average net assets | | | | | | | | | | | | | | | | | | | | |
Expenses | | | 0.47% | | | | 0.47% | d | | | 0.47% | d | | | 0.47% | d | | | 0.47% | d |
Net investment income | | | 6.03% | | | | 6.35% | | | | 6.28% | | | | 7.23% | | | | 7.28% | |
| | | | | |
Supplemental data | | | | | | | | | | | | | | | | | | | | |
Net assets, end of year (000’s) | | $ | 584,391 | | | $ | 1,300,935 | | | $ | 1,449,028 | | | $ | 910,504 | | | $ | 433,370 | |
Portfolio turnover rate | | | 26.66% | e | | | 28.65% | | | | 41.65% | | | | 42.30% | | | | 43.89% | |
aThe amount shown for a share outstanding throughout the period may not correlate with the Statement of Operations for the period due to the timing of sales and repurchases of the Fund shares in relation to income earned and/or fluctuating market value of the investments of the Fund.
bBased on average daily shares outstanding.
cTotal return does not include fees, charges or expenses imposed by the variable annuity and life insurance contracts for which the Franklin Templeton Variable Insurance Products Trust serves as an underlying investment vehicle.
dBenefit of expense reduction rounds to less than 0.01%.
eExcludes the value of portfolio securities delivered as a result of a redemption in-kind. See Note 10.
The accompanying notes are an integral part of these financial statements.
FI-10
Franklin Templeton Variable Insurance Products Trust
Financial Highlights (continued)
Franklin Income Securities Fund
| | | | | | | | | | | | | | | | | | | | |
| �� | | Year Ended December 31, | |
| Class 2 | | 2012 | | | 2011 | | | 2010 | | | 2009 | | | 2008 | |
| | | | |
Per share operating performance | | | | | | | | | | | | | | | | | | | | |
(for a share outstanding throughout the year) | | | | | | | | | | | | | | | | | | | | |
Net asset value, beginning of year | | $ | 14.32 | | | $ | 14.82 | | | $ | 14.12 | | | $ | 11.30 | | | $ | 17.31 | |
| | | | |
Income from investment operationsa: | | | | | | | | | | | | | | | | | | | | |
Net investment incomeb | | | 0.85 | | | | 0.90 | | | | 0.86 | | | | 0.86 | | | | 1.04 | |
Net realized and unrealized gains (losses) | | | 0.88 | | | | (0.53 | ) | | | 0.82 | | | | 3.01 | | | | (5.87 | ) |
| | | | |
Total from investment operations | | | 1.73 | | | | 0.37 | | | | 1.68 | | | | 3.87 | | | | (4.83 | ) |
| | | | |
Less distributions from: | | | | | | | | | | | | | | | | | | | | |
Net investment income | | | (0.98 | ) | | | (0.87 | ) | | | (0.98 | ) | | | (1.05 | ) | | | (0.83 | ) |
Net realized gains | | | — | | | | — | | | | — | | | | — | | | | (0.35 | ) |
| | | | |
Total distributions | | | (0.98 | ) | | | (0.87 | ) | | | (0.98 | ) | | | (1.05 | ) | | | (1.18 | ) |
| | | | |
Net asset value, end of year | | $ | 15.07 | | | $ | 14.32 | | | $ | 14.82 | | | $ | 14.12 | | | $ | 11.30 | |
| | | | |
| | | | | |
Total returnc | | | 12.65% | | | | 2.38% | | | | 12.67% | | | | 35.59% | | | | (29.66)% | |
Ratios to average net assets | | | | | | | | | | | | | | | | | | | | |
Expenses | | | 0.72% | | | | 0.72% | d | | | 0.72% | d | | | 0.72% | d | | | 0.72% | d |
Net investment income | | | 5.78% | | | | 6.10% | | | | 6.03% | | | | 6.98% | | | | 7.03% | |
| | | | | |
Supplemental data | | | | | | | | | | | | | | | | | | | | |
Net assets, end of year (000’s) | | $ | 6,182,997 | | | $ | 5,915,637 | | | $ | 6,309,207 | | | $ | 6,114,898 | | | $ | 4,944,457 | |
Portfolio turnover rate | | | 26.66% | e | | | 28.65% | | | | 41.65% | | | | 42.30% | | | | 43.89% | |
aThe amount shown for a share outstanding throughout the period may not correlate with the Statement of Operations for the period due to the timing of sales and repurchases of the Fund shares in relation to income earned and/or fluctuating market value of the investments of the Fund.
bBased on average daily shares outstanding.
cTotal return does not include fees, charges or expenses imposed by the variable annuity and life insurance contracts for which the Franklin Templeton Variable Insurance Products Trust serves as an underlying investment vehicle.
dBenefit of expense reduction rounds to less than 0.01%.
eExcludes the value of portfolio securities delivered as a result of a redemption in-kind. See Note 10.
The accompanying notes are an integral part of these financial statements.
FI-11
Franklin Templeton Variable Insurance Products Trust
Financial Highlights (continued)
Franklin Income Securities Fund
| | | | | | | | | | | | | | | | | | | | |
| | | Year Ended December 31, | |
| Class 4 | | 2012 | | | 2011 | | | 2010 | | | 2009 | | | 2008a | |
| | | | |
Per share operating performance | | | | | | | | | | | | | | | | | | | | |
(for a share outstanding throughout the year) | | | | | | | | | | | | | | | | | | | | |
Net asset value, beginning of year | | $ | 14.54 | | | $ | 15.04 | | | $ | 14.33 | | | $ | 11.49 | | | $ | 16.90 | |
| | | | |
Income from investment operationsb: | | | | | | | | | | | | | | | | | | | | |
Net investment incomec | | | 0.85 | | | | 0.90 | | | | 0.85 | | | | 0.86 | | | | 0.87 | |
Net realized and unrealized gains (losses) | | | 0.90 | | | | (0.54 | ) | | | 0.84 | | | | 3.06 | | | | (5.07 | ) |
| | | | |
Total from investment operations | | | 1.75 | | | | 0.36 | | | | 1.69 | | | | 3.92 | | | | (4.20 | ) |
| | | | |
Less distributions from: | | | | | | | | | | | | | | | | | | | | |
Net investment income | | | (0.97 | ) | | | (0.86 | ) | | | (0.98 | ) | | | (1.08 | ) | | | (0.86 | ) |
Net realized gains | | | — | | | | — | | | | — | | | | — | | | | (0.35 | ) |
| | | | |
Total distributions | | | (0.97 | ) | | | (0.86 | ) | | | (0.98 | ) | | | (1.08 | ) | | | (1.21 | ) |
| | | | |
Net asset value, end of year | | $ | 15.32 | | | $ | 14.54 | | | $ | 15.04 | | | $ | 14.33 | | | $ | 11.49 | |
| | | | |
| | | | | |
Total returnd | | | 12.56% | | | | 2.29% | | | | 12.54% | | | | 35.37% | | | | (26.61)% | |
Ratios to average net assetse | | | | | | | | | | | | | | | | | | | | |
Expenses | | | 0.82% | | | | 0.82% | f | | | 0.82% | f | | | 0.82% | f | | | 0.82% | f |
Net investment income | | | 5.68% | | | | 6.00% | | | | 5.93% | | | | 6.88% | | | | 6.93% | |
| | | | | |
Supplemental data | | | | | | | | | | | | | | | | | | | | |
Net assets, end of year (000’s) | | $ | 436,405 | | | $ | 431,435 | | | $ | 415,541 | | | $ | 347,733 | | | $ | 135,360 | |
Portfolio turnover rate | | | 26.66% | g | | | 28.65% | | | | 41.65% | | | | 42.30% | | | | 43.89% | |
aFor the period February 29, 2008 (effective date) to December 31, 2008.
bThe amount shown for a share outstanding throughout the period may not correlate with the Statement of Operations for the period due to the timing of sales and repurchases of the Fund shares in relation to income earned and/or fluctuating market value of the investments of the Fund.
cBased on average daily shares outstanding.
dTotal return does not include fees, charges or expenses imposed by the variable annuity and life insurance contracts for which the Franklin Templeton Variable Insurance Products Trust serves as an underlying investment vehicle. Total return is not annualized for periods less than one year.
eRatios are annualized for periods less than one year.
fBenefit of expense reduction rounds to less than 0.01%.
gExcludes the value of portfolio securities delivered as a result of a redemption in-kind. See Note 10.
The accompanying notes are an integral part of these financial statements.
FI-12
Franklin Templeton Variable Insurance Products Trust
Statement of Investments, December 31, 2012
| | | | | | | | | | |
| Franklin Income Securities Fund | | Country | | Shares/
Warrants | | | Value | |
Common Stocks and Other Equity Interests 45.3% | | | | | | | | | | |
Consumer Discretionary 0.8% | | | | | | | | | | |
Comcast Corp., A | | United States | | | 781,500 | | | $ | 29,212,470 | |
a,b Dex One Corp. | | United States | | | 2,294,381 | | | | 3,625,122 | |
aGeneral Motors Co., wts., 7/10/16 | | United States | | | 112,731 | | | | 2,198,255 | |
aGeneral Motors Co., wts., 7/10/19 | | United States | | | 112,731 | | | | 1,408,010 | |
aMotors Liquidation Co., GUC Trust | | United States | | | 35,826 | | | | 759,511 | |
aSuperMedia Inc., Litigation Trust | | United States | | | 3,472,135 | | | | 8,680 | |
Target Corp. | | United States | | | 394,200 | | | | 23,324,814 | |
| | | | | | | | | | |
| | | | | | | | | 60,536,862 | |
| | | | | | | | | | |
Consumer Staples 1.1% | | | | | | | | | | |
Diageo PLC | | United Kingdom | | | 998,536 | | | | 29,085,670 | |
PepsiCo Inc. | | United States | | | 584,000 | | | | 39,963,120 | |
Safeway Inc. | | United States | | | 445,700 | | | | 8,062,713 | |
| | | | | | | | | | |
| | | | | | | | | 77,111,503 | |
| | | | | | | | | | |
Energy 7.3% | | | | | | | | | | |
aAlpha Natural Resources Inc. | | United States | | | 117,300 | | | | 1,142,502 | |
Anadarko Petroleum Corp. | | United States | | | 315,100 | | | | 23,415,081 | |
BP PLC, ADR | | United Kingdom | | | 1,128,779 | | | | 47,002,357 | |
aCallon Petroleum Co. | | United States | | | 675,000 | | | | 3,172,500 | |
Canadian Oil Sands Ltd. | | Canada | | | 3,212,700 | | | | 65,240,533 | |
Chesapeake Energy Corp. | | United States | | | 781,500 | | | | 12,988,530 | |
Chevron Corp. | | United States | | | 561,000 | | | | 60,666,540 | |
ConocoPhillips | | United States | | | 651,300 | | | | 37,768,887 | |
Devon Energy Corp. | | United States | | | 500,000 | | | | 26,020,000 | |
Exxon Mobil Corp. | | United States | | | 698,750 | | | | 60,476,812 | |
Halliburton Co. | | United States | | | 1,251,700 | | | | 43,421,473 | |
Peabody Energy Corp. | | United States | | | 365,200 | | | | 9,717,972 | |
Royal Dutch Shell PLC, A, ADR | | United Kingdom | | | 995,648 | | | | 68,649,930 | |
Schlumberger Ltd. | | United States | | | 242,700 | | | | 16,816,683 | |
Spectra Energy Corp. | | United States | | | 600,000 | | | | 16,428,000 | |
Total SA, B, ADR | | France | | | 445,000 | | | | 23,144,450 | |
aWeatherford International Ltd. | | United States | | | 651,300 | | | | 7,288,047 | |
| | | | | | | | | | |
| | | | | | | | | 523,360,297 | |
| | | | | | | | | | |
Financials 6.6% | | | | | | | | | | |
aBanco Santander SA | | Spain | | | 2,026,812 | | | | 16,467,538 | |
Bank of America Corp. | | United States | | | 5,209,800 | | | | 60,433,680 | |
Barclays PLC | | United Kingdom | | | 3,473,166 | | | | 15,082,407 | |
BlackRock Inc. | | United States | | | 209,100 | | | | 43,223,061 | |
Commonwealth Bank of Australia | | Australia | | | 374,700 | | | | 24,425,183 | |
HSBC Holdings PLC | | United Kingdom | | | 4,341,457 | | | | 46,017,422 | |
JPMorgan Chase & Co. | | United States | | | 1,606,400 | | | | 70,633,408 | |
M&T Bank Corp. | | United States | | | 434,200 | | | | 42,755,674 | |
MetLife Inc. | | United States | | | 321,791 | | | | 10,599,796 | |
QBE Insurance Group Ltd. | | Australia | | | 868,292 | | | | 9,957,914 | |
Wells Fargo & Co. | | United States | | | 3,363,100 | | | | 114,950,758 | |
Westfield Retail Trust | | Australia | | | 5,543,693 | | | | 17,506,117 | |
| | | | | | | | | | |
| | | | | | | | | 472,052,958 | |
| | | | | | | | | | |
Health Care 6.0% | | | | | | | | | | |
Johnson & Johnson | | United States | | | 1,302,500 | | | | 91,305,250 | |
Merck & Co. Inc. | | United States | | | 3,473,200 | | | | 142,192,808 | |
FI-13
Franklin Templeton Variable Insurance Products Trust
Statement of Investments, December 31, 2012 (continued)
| | | | | | | | | | |
| Franklin Income Securities Fund | | Country | | Shares/
Warrants | | | Value | |
Common Stocks and Other Equity Interests (continued) | | | | | | | | | | |
Health Care (continued) | | | | | | | | | | |
Pfizer Inc. | | United States | | | 3,055,375 | | | $ | 76,628,805 | |
Roche Holding AG | | Switzerland | | | 407,719 | | | | 81,958,045 | |
Sanofi, ADR | | France | | | 868,292 | | | | 41,139,675 | |
| | | | | | | | | | |
| | | | | | | | | 433,224,583 | |
| | | | | | | | | | |
Industrials 2.2% | | | | | | | | | | |
Caterpillar Inc. | | United States | | | 69,500 | | | | 6,225,810 | |
General Electric Co. | | United States | | | 4,341,500 | | | | 91,128,085 | |
Republic Services Inc. | | United States | | | 527,300 | | | | 15,465,709 | |
Rockwell Automation Inc. | | United States | | | 103,900 | | | | 8,726,561 | |
Waste Management Inc. | | United States | | | 1,028,200 | | | | 34,691,468 | |
| | | | | | | | | | |
| | | | | | | | | 156,237,633 | |
| | | | | | | | | | |
Information Technology 1.3% | | | | | | | | | | |
Intel Corp. | | United States | | | 3,000,000 | | | | 61,890,000 | |
Microsoft Corp. | | United States | | | 600,000 | | | | 16,038,000 | |
Texas Instruments Inc. | | United States | | | 585,300 | | | | 18,109,182 | |
| | | | | | | | | | |
| | | | | | | | | 96,037,182 | |
| | | | | | | | | | |
Materials 5.5% | | | | | | | | | | |
Barrick Gold Corp. | | Canada | | | 989,804 | | | | 34,653,038 | |
BHP Billiton PLC | | United Kingdom | | | 1,646,892 | | | | 58,118,106 | |
The Dow Chemical Co. | | United States | | | 3,207,200 | | | | 103,656,704 | |
E. I. du Pont de Nemours and Co. | | United States | | | 1,047,500 | | | | 47,106,075 | |
Freeport-McMoRan Copper & Gold Inc., B | | United States | | | 500,000 | | | | 17,100,000 | |
LyondellBasell Industries NV, A | | United States | | | 1,050,000 | | | | 59,944,500 | |
Newmont Mining Corp. | | United States | | | 735,317 | | | | 34,148,121 | |
Rio Tinto PLC, ADR | | United Kingdom | | | 754,146 | | | | 43,808,341 | |
| | | | | | | �� | | | |
| | | | | | | | | 398,534,885 | |
| | | | | | | | | | |
Telecommunication Services 2.7% | | | | | | | | | | |
AT&T Inc. | | United States | | | 1,736,600 | | | | 58,540,786 | |
CenturyLink Inc. | | United States | | | 434,200 | | | | 16,985,904 | |
France Telecom SA | | France | | | 458,892 | | | | 5,089,511 | |
Frontier Communications Corp. | | United States | | | 1,736,600 | | | | 7,432,648 | |
SK Telecom Co. Ltd., ADR | | South Korea | | | 438,574 | | | | 6,942,626 | |
Telstra Corp. Ltd. | | Australia | | | 6,946,331 | | | | 31,681,496 | |
Vivendi SA | | France | | | 448,617 | | | | 10,143,197 | |
Vodafone Group PLC | | United Kingdom | | | 23,878,012 | | | | 60,117,908 | |
| | | | | | | | | | |
| | | | | | | | | 196,934,076 | |
| | | | | | | | | | |
Utilities 11.8% | | | | | | | | | | |
AGL Resources Inc. | | United States | | | 390,732 | | | | 15,617,558 | |
American Electric Power Co. Inc. | | United States | | | 1,323,200 | | | | 56,474,176 | |
Dominion Resources Inc. | | United States | | | 1,000,000 | | | | 51,800,000 | |
Duke Energy Corp. | | United States | | | 1,302,500 | | | | 83,099,500 | |
a,c Dynegy Holdings Inc., Escrow Account | | United States | | | 149,699,000 | | | | — | |
a,b Dynegy Inc. | | United States | | | 3,681,522 | | | | 70,427,516 | |
a,b Dynegy Inc., wts., 10/02/17 | | United States | | | 242,666 | | | | 305,759 | |
Entergy Corp. | | United States | | | 738,100 | | | | 47,053,875 | |
Exelon Corp. | | United States | | | 2,100,000 | | | | 62,454,000 | |
FirstEnergy Corp. | | United States | | | 1,095,900 | | | | 45,764,784 | |
NextEra Energy Inc. | | United States | | | 651,300 | | | | 45,063,447 | |
FI-14
Franklin Templeton Variable Insurance Products Trust
Statement of Investments, December 31, 2012 (continued)
| | | | | | | | | | |
| Franklin Income Securities Fund | | Country | | Shares/
Warrants | | | Value | |
Common Stocks and Other Equity Interests (continued) | | | | | | | | | | |
Utilities (continued) | | | | | | | | | | |
PG&E Corp. | | United States | | | 1,736,600 | | | $ | 69,776,588 | |
Pinnacle West Capital Corp. | | United States | | | 260,500 | | | | 13,280,290 | |
PPL Corp. | | United States | | | 1,615,400 | | | | 46,248,902 | |
Public Service Enterprise Group Inc. | | United States | | | 1,823,500 | | | | 55,799,100 | |
Sempra Energy | | United States | | | 868,300 | | | | 61,597,202 | |
The Southern Co. | | United States | | | 1,000,000 | | | | 42,810,000 | |
TECO Energy Inc. | | United States | | | 1,953,700 | | | | 32,744,012 | |
Xcel Energy Inc. | | United States | | | 1,710,964 | | | | 45,699,849 | |
| | | | | | | | | | |
| | | | | | | | | 846,016,558 | |
| | | | | | | | | | |
Total Common Stocks and Other Equity Interests
(Cost $2,999,312,283) | | | | | | | | | 3,260,046,537 | |
| | | | | | | | | | |
d Equity-Linked Securities 0.7% | | | | | | | | | | |
Information Technology 0.1% | | | | | | | | | | |
Credit Suisse New York into Corning Inc., 9.00% | | United States | | | 525,000 | | | | 6,840,120 | |
| | | | | | | | | | |
Materials 0.6% | | | | | | | | | | |
eDeutsche Bank AG into Freeport-McMoRan Copper & Gold Inc., 10.00%, 144A | | United States | | | 500,000 | | | | 18,192,650 | |
eDeutsche Bank AG into LyondellBasell Industries NV, 9.00%, 144A | | United States | | | 250,000 | | | | 13,987,500 | |
eJPMorgan Chase & Co. into Nucor Corp., 7.50%, 144A | | United States | | | 285,000 | | | | 11,982,882 | |
| | | | | | | | | | |
| | | | | | | | | 44,163,032 | |
| | | | | | | | | | |
Total Equity-Linked Securities (Cost $51,350,750) | | | | | | | | | 51,003,152 | |
| | | | | | | | | | |
Convertible Preferred Stocks 3.1% | | | | | | | | | | |
Consumer Discretionary 0.2% | | | | | | | | | | |
General Motors Co., 4.75%, cvt. pfd., B | | United States | | | 279,950 | | | | 12,354,193 | |
| | | | | | | | | | |
Energy 0.2% | | | | | | | | | | |
SandRidge Energy Inc., 7.00%, cvt. pfd. | | United States | | | 121,600 | | | | 12,549,120 | |
| | | | | | | | | | |
Financials 2.5% | | | | | | | | | | |
Bank of America Corp., 7.25%, cvt. pfd., L | | United States | | | 78,200 | | | | 88,757,000 | |
aFannie Mae, 5.375%, cvt. pfd. | | United States | | | 525 | | | | 2,047,495 | |
FelCor Lodging Trust Inc., 7.80%, cvt. pfd., A | | United States | | | 347,325 | | | | 8,426,104 | |
MetLife Inc., 5.00%, cvt. pfd. | | United States | | | 455,925 | | | | 20,274,985 | |
Wells Fargo & Co., 7.50%, cvt. pfd., A | | United States | | | 53,000 | | | | 65,137,000 | |
| | | | | | | | | | |
| | | | | | | | | 184,642,584 | |
| | | | | | | | | | |
Materials 0.1% | | | | | | | | | | |
AngloGold Ashanti Holdings Finance PLC, 6.00%, cvt. pfd. | | South Africa | | | 173,700 | | | | 6,491,169 | |
| | | | | | | | | | |
Utilities 0.1% | | | | | | | | | | |
NextEra Energy Inc., 5.889%, cvt. pfd. | | United States | | | 83,100 | | | | 4,181,459 | |
| | | | | | | | | | |
Total Convertible Preferred Stocks (Cost $226,671,421) | | | | | | | | | 220,218,525 | |
| | | | | | | | | | |
Preferred Stocks 0.5% | | | | | | | | | | |
Consumer Discretionary 0.0%† | | | | | | | | | | |
aMotors Liquidation Co., Escrow pfd., C | | United States | | | 1,400,000 | | | | 14,000 | |
| | | | | | | | | | |
Financials 0.5% | | | | | | | | | | |
eAlly Financial Inc., 7.00%, pfd., 144A | | United States | | | 31,489 | | | | 30,929,088 | |
Ally Financial Inc., 8.50%, pfd., A | | United States | | | 65,125 | | | | 1,710,834 | |
aFannie Mae, 6.75%, pfd. | | United States | | | 434,150 | | | | 672,933 | |
aFannie Mae, 7.625%, pfd., R | | United States | | | 694,650 | | | | 1,069,761 | |
FI-15
Franklin Templeton Variable Insurance Products Trust
Statement of Investments, December 31, 2012 (continued)
| | | | | | | | | | |
| Franklin Income Securities Fund | | Country | | Shares/
Warrants | | | Value | |
Preferred Stocks (continued) | | | | | | | | | | |
Financials (continued) | | | | | | | | | | |
aFannie Mae, 8.25%, pfd. | | United States | | | 739,375 | | | $ | 1,234,756 | |
aFreddie Mac, 8.375%, pfd., Z | | United States | | | 1,345,175 | | | | 2,354,056 | |
| | | | | | | | | | |
| | | | | | | | | 37,971,428 | |
| | | | | | | | | | |
Total Preferred Stocks (Cost $93,154,228) | | | | | | | | | 37,985,428 | |
| | | | | | | | | | |
| | | |
| | | | | Principal
Amount* | | | | |
Convertible Bonds 0.9% | | | | | | | | | | |
Consumer Discretionary 0.5% | | | | | | | | | | |
eVolkswagen International Finance, cvt., sub. note, 144A, 5.50%, 11/09/15 | | Germany | | | 25,000,000 | EUR | | | 36,368,506 | |
| | | | | | | | | | |
Financials 0.2% | | | | | | | | | | |
Forest City Enterprises Inc., cvt., 4.25%, 8/15/18 | | United States | | | 9,800,000 | | | | 10,357,375 | |
| | | | | | | | | | |
Materials 0.2% | | | | | | | | | | |
Cemex SAB de CV, cvt., sub. note, | | | | | | | | | | |
3.25%, 3/15/16 | | Mexico | | | 6,700,000 | | | | 7,566,712 | |
3.75%, 3/15/18 | | Mexico | | | 7,920,000 | | | | 8,924,097 | |
| | | | | | | | | | |
| | | | | | | | | 16,490,809 | |
| | | | | | | | | | |
Total Convertible Bonds (Cost $55,682,966) | | | | | | | | | 63,216,690 | |
| | | | | | | | | | |
Corporate Bonds 41.2% | | | | | | | | | | |
Consumer Discretionary 6.9% | | | | | | | | | | |
eAcademy Ltd./Finance Corp., senior note, 144A, 9.25%, 8/01/19 | | United States | | | 5,300,000 | | | | 5,909,500 | |
Cablevision Systems Corp., senior note, | | | | | | | | | | |
7.75%, 4/15/18 | | United States | | | 20,000,000 | | | | 22,350,000 | |
8.00%, 4/15/20 | | United States | | | 15,700,000 | | | | 17,760,625 | |
Caesars Operating Escrow LLC/Corp., | | | | | | | | | | |
esecured note, 144A, 9.00%, 2/15/20 | | United States | | | 15,000,000 | | | | 15,075,000 | |
senior secured note, 8.50%, 2/15/20 | | United States | | | 8,900,000 | | | | 8,861,062 | |
CCO Holdings LLC/CCO Holdings Capital Corp., senior note, 6.50%, 4/30/21 | | United States | | | 15,000,000 | | | | 16,256,250 | |
Chrysler Group LLC/CG Co-Issuer Inc., senior secured note, | | | | | | | | | | |
8.00%, 6/15/19 | | United States | | | 25,000,000 | | | | 27,375,000 | |
8.25%, 6/15/21 | | United States | | | 12,800,000 | | | | 14,144,000 | |
CityCenter Holdings/Finance, senior secured note, | | | | | | | | | | |
7.625%, 1/15/16 | | United States | | | 4,100,000 | | | | 4,407,500 | |
fPIK, 11.50%, 1/15/17 | | United States | | | 7,554,977 | | | | 7,834,300 | |
Clear Channel Communications Inc., | | | | | | | | | | |
e144A, 9.00%, 12/15/19 | | United States | | | 18,000,000 | | | | 16,560,000 | |
senior note, 10.75%, 8/01/16 | | United States | | | 12,000,000 | | | | 9,120,000 | |
senior note, 9.00%, 3/01/21 | | United States | | | 69,100,000 | | | | 62,017,250 | |
Clear Channel Worldwide Holdings Inc., senior sub. note, 7.625%, | | | | | | | | | | |
3/15/20 | | United States | | | 8,750,000 | | | | 8,859,375 | |
3/15/20 | | United States | | | 1,250,000 | | | | 1,253,125 | |
ClubCorp Club Operations Inc., senior note, 10.00%, 12/01/18 | | United States | | | 15,000,000 | | | | 16,762,500 | |
eCSC Holdings LLC, senior note, 144A, 6.75%, 11/15/21 | | United States | | | 21,000,000 | | | | 23,388,750 | |
gCumulus Media Holdings Inc., senior note, 7.75%, 5/01/19 | | United States | | | 10,000,000 | | | | 9,875,000 | |
b,f Dex One Corp., senior sub. note, PIK, 14.00%, 1/29/17 | | United States | | | 14,417,689 | | | | 4,853,124 | |
The Goodyear Tire & Rubber Co., senior note, 8.25%, 8/15/20 | | United States | | | 9,700,000 | | | | 10,694,250 | |
Harrah’s Operating Co. Inc., senior secured note, 11.25%, 6/01/17 | | United States | | | 10,000,000 | | | | 10,762,500 | |
eHD Supply Inc., 144A, 8.125%, 4/15/19 | | United States | | | 5,000,000 | | | | 5,712,500 | |
eJaguar Land Rover PLC, 144A, 8.125%, 5/15/21 | | United Kingdom | | | 2,118,000 | | | | 2,348,333 | |
FI-16
Franklin Templeton Variable Insurance Products Trust
Statement of Investments, December 31, 2012 (continued)
| | | | | | | | | | |
| Franklin Income Securities Fund | | Country | | Principal
Amount* | | | Value | |
Corporate Bonds (continued) | | | | | | | | | | |
Consumer Discretionary (continued) | | | | | | | | | | |
KB Home, | | | | | | | | | | |
senior bond, 7. 50%, 9/15/22 | | United States | | | 6,500,000 | | | $ | 7,117,500 | |
senior note, 6.25%, 6/15/15 | | United States | | | 15,000,000 | | | | 16,012,500 | |
senior note, 7.25%, 6/15/18 | | United States | | | 10,600,000 | | | | 11,580,500 | |
eLandry’s Inc., senior note, 144A, 9.375%, 5/01/20 | | United States | | | 7,500,000 | | | | 7,950,000 | |
eLaureate Education Inc., 144A, 9.25%, 9/01/19 | | United States | | | 5,000,000 | | | | 5,250,000 | |
MGM Resorts International, senior note, | | | | | | | | | | |
6.625%, 7/15/15 | | United States | | | 5,000,000 | | | | 5,387,500 | |
10.00%, 11/01/16 | | United States | | | 20,000,000 | | | | 23,250,000 | |
e144A, 8.625%, 2/01/19 | | United States | | | 3,700,000 | | | | 4,144,000 | |
e144A, 6.75%, 10/01/20 | | United States | | | 5,500,000 | | | | 5,630,625 | |
Shea Homes LP/Funding Corp., senior secured note, 8.625%, 5/15/19 | | United States | | | 11,700,000 | | | | 12,987,000 | |
eUnitymedia GmbH, senior secured note, 144A, 9.625%, 12/01/19 | | Germany | | | 3,000,000 | EUR | | | 4,465,071 | |
eUnitymedia Hessen/NRW, senior secured note, 144A, 8.125%, 12/01/17 | | Germany | | | 5,500,000 | EUR | | | 7,875,475 | |
eUnivision Communications Inc., senior secured note, 144A, 6.875%, 5/15/19 | | United States | | | 15,000,000 | | | | 15,675,000 | |
eUPCB Finance III Ltd., senior secured note, 144A, 6.625%, 7/01/20 | | Netherlands | | | 12,500,000 | | | | 13,453,125 | |
eUPCB Finance V Ltd., senior secured note, 144A, 7.25%, 11/15/21 | | Netherlands | | | 6,000,000 | | | | 6,630,000 | |
Visant Corp., senior note, 10.00%, 10/01/17 | | United States | | | 32,800,000 | | | | 29,602,000 | |
| | | | | | | | | | |
| | | | | | | | | 499,190,240 | |
| | | | | | | | | | |
Consumer Staples 1.2% | | | | | | | | | | |
eBoparan Finance PLC, senior note, 144A, | | | | | | | | | | |
9.75%, 4/30/18 | | United Kingdom | | | 2,000,000 | EUR | | | 2,995,492 | |
9.875%, 4/30/18 | | United Kingdom | | | 7,500,000 | GBP | | | 13,802,344 | |
eInnovation Ventures LLC/Finance Corp., secured note, 144A, 9.50%, 8/15/19 | | United States | | | 5,000,000 | | | | 4,725,000 | |
JBS USA LLC/Finance Inc., senior note, | | | | | | | | | | |
11.625%, 5/01/14 | | United States | | | 10,000,000 | | | | 11,200,000 | |
e144A, 8.25%, 2/01/20 | | United States | | | 10,000,000 | | | | 10,650,000 | |
e144A, 7.25%, 6/01/21 | | United States | | | 12,500,000 | | | | 12,593,750 | |
Smithfield Foods Inc., senior bond, 6.625%, 8/15/22 | | United States | | | 4,400,000 | | | | 4,873,000 | |
SUPERVALU Inc., senior note, 8.00%, 5/01/16 | | United States | | | 20,000,000 | | | | 19,150,000 | |
eU.S. Foodservice, senior note, 144A, 8.50%, 6/30/19 | | United States | | | 7,500,000 | | | | 7,687,500 | |
| | | | | | | | | | |
| | | | | | | | | 87,677,086 | |
| | | | | | | | | | |
Energy 8.4% | | | | | | | | | | |
Alpha Natural Resources Inc., senior note, 6.25%, 6/01/21 | | United States | | | 2,500,000 | | | | 2,300,000 | |
Antero Resources Finance Corp., senior note, | | | | | | | | | | |
9.375%, 12/01/17 | | United States | | | 14,600,000 | | | | 16,096,500 | |
7.25%, 8/01/19 | | United States | | | 3,900,000 | | | | 4,270,500 | |
Arch Coal Inc., senior note, | | | | | | | | | | |
7.00%, 6/15/19 | | United States | | | 5,500,000 | | | | 5,142,500 | |
7.25%, 6/15/21 | | United States | | | 12,500,000 | | | | 11,593,750 | |
Bill Barrett Corp., senior note, 7.00%, 10/15/22 | | United States | | | 5,000,000 | | | | 5,175,000 | |
Callon Petroleum Co., senior secured note, 13.00%, 9/15/16 | | United States | | | 7,765,750 | | | | 8,076,380 | |
CHC Helicopter SA, senior secured note, first lien, 9.25%, 10/15/20 | | Canada | | | 25,000,000 | | | | 26,437,500 | |
Chesapeake Energy Corp., senior note, | | | | | | | | | | |
g6.50%, 8/15/17 | | United States | | | 34,000,000 | | | | 37,060,000 | |
6.875%, 8/15/18 | | United States | | | 16,200,000 | | | | 17,172,000 | |
7.25%, 12/15/18 | | United States | | | 33,000,000 | | | | 36,135,000 | |
6.775%, 3/15/19 | | United States | | | 17,500,000 | | | | 17,543,750 | |
Compagnie Generale de Geophysique-Veritas, senior note, 6.50%, 6/01/21 | | France | | | 12,500,000 | | | | 13,437,500 | |
eConnacher Oil and Gas Ltd., secured note, 144A, 8.50%, 8/01/19 | | Canada | | | 7,000,000 | | | | 4,830,000 | |
CONSOL Energy Inc., senior note, 8.25%, 4/01/20 | | United States | | | 1,800,000 | | | | 1,957,500 | |
FI-17
Franklin Templeton Variable Insurance Products Trust
Statement of Investments, December 31, 2012 (continued)
| | | | | | | | | | |
| Franklin Income Securities Fund | | Country | | Principal
Amount* | | | Value | |
Corporate Bonds (continued) | | | | | | | | | | |
Energy (continued) | | | | | | | | | | |
El Paso Corp., senior note, MTN, 7.75%, 1/15/32 | | United States | | | 22,000,000 | | | $ | 25,907,838 | |
Energy XXI Gulf Coast Inc., senior note, 9.25%, 12/15/17 | | United States | | | 15,000,000 | | | | 17,212,500 | |
EP Energy LLC/Finance Inc., senior note, 9.375%, 5/01/20 | | United States | | | 10,000,000 | | | | 11,325,000 | |
EXCO Resources Inc., senior note, 7.50%, 9/15/18 | | United States | | | 10,500,000 | | | | 10,237,500 | |
eExpro Finance Luxembourg, senior secured note, 144A, 8.50%, 12/15/16 | | United Kingdom | | | 16,840,000 | | | | 17,682,000 | |
eHalcon Resources Corp., senior note, 144A, 9.75%, 7/15/20 | | United States | | | 10,000,000 | | | | 10,850,000 | |
Linn Energy LLC/Finance Corp., senior note, 8.625%, 4/15/20 | | United States | | | 20,000,000 | | | | 21,900,000 | |
eMagnum Hunter Resources Corp., senior note, 144A, 9.75%, 5/15/20 | | United States | | | 5,000,000 | | | | 5,212,500 | |
eMidstates Petroleum Inc./LLC, senior note, 144A, 10.75%, 10/01/20 | | United States | | | 5,000,000 | | | | 5,337,500 | |
Offshore Group Investment Ltd., | | | | | | | | | | |
e first lien, 144A, 7.50%, 11/01/19 | | United States | | | 17,900,000 | | | | 18,168,500 | |
senior secured note, 11.50%, 8/01/15 | | United States | | | 6,756,000 | | | | 7,380,930 | |
eOGX Petroleo e Gas Participacoes SA, senior note, 144A, 8.50%, 6/01/18 | | Brazil | | | 15,000,000 | | | | 13,584,375 | |
Peabody Energy Corp., senior note, 6.25%, 11/15/21 | | United States | | | 10,000,000 | | | | 10,675,000 | |
Plains Exploration & Production Co., senior note, 6.50%, 11/15/20 | | United States | | | 10,000,000 | | | | 11,125,000 | |
Quicksilver Resources Inc., senior note, 9.125%, 8/15/19 | | United States | | | 20,000,000 | | | | 17,900,000 | |
Sabine Pass LNG LP, | | | | | | | | | | |
e144A, 6.50%, 11/01/20 | | United States | | | 10,000,000 | | | | 10,225,000 | |
senior secured note, 7.50%, 11/30/16 | | United States | | | 25,000,000 | | | | 27,687,500 | |
eSamson Investment Co., senior note, 144A, 9.75%, 2/15/20 | | United States | | | 26,300,000 | | | | 27,943,750 | |
SandRidge Energy Inc., senior note, | | | | | | | | | | |
9.875%, 5/15/16 | | United States | | | 17,500,000 | | | | 18,943,750 | |
8.75%, 1/15/20 | | United States | | | 25,000,000 | | | | 27,500,000 | |
7.50%, 3/15/21 | | United States | | | 13,300,000 | | | | 14,297,500 | |
8.125%, 10/15/22 | | United States | | | 10,000,000 | | | | 11,000,000 | |
7.50%, 2/15/23 | | United States | | | 6,600,000 | | | | 7,095,000 | |
e144A, 8.00%, 6/01/18 | | United States | | | 7,800,000 | | | | 8,307,000 | |
W&T Offshore Inc., senior note, 8.50%, 6/15/19 | | United States | | | 40,500,000 | | | | 43,740,000 | |
| | | | | | | | | | |
| | | | | | | | | 608,466,023 | |
| | | | | | | | | | |
Financials 3.6% | | | | | | | | | | |
Ally Financial Inc., senior note, 6.25%, 12/01/17 | | United States | | | 5,000,000 | | | | 5,552,950 | |
hBank of America Corp., pfd., sub. bond, M, 8.125% to 5/15/18, FRN thereafter, Perpetual | | United States | | | 5,000,000 | | | | 5,542,550 | |
E*TRADE Financial Corp., senior note, 6.00%, 11/15/17 | | United States | | | 12,500,000 | | | | 12,843,750 | |
Hexion U.S. Finance Corp., senior secured note, 8.875%, 2/01/18 | | United States | | | 8,000,000 | | | | 8,260,000 | |
International Lease Finance Corp., senior note, | | | | | | | | | | |
8.75%, 3/15/17 | | United States | | | 15,000,000 | | | | 17,400,000 | |
8.875%, 9/01/17 | | United States | | | 20,000,000 | | | | 23,601,600 | |
hJPMorgan Chase & Co., junior sub. note, 1, 7.90% to 4/30/19, FRN thereafter, Perpetual | | United States | | | 85,000,000 | | | | 96,651,120 | |
eKinetic Concepts Inc./USA, senior note, 144A, 12.50%, 11/01/19 | | United States | | | 5,000,000 | | | | 4,806,250 | |
eLadder Capital Finance Holdings LLC/Corp., senior note, 144A, 7.375%, 10/01/17 | | United States | | | 5,000,000 | | | | 5,162,500 | |
eLiberty Mutual Group Inc., junior sub. note, 144A, 10.75% to 6/15/38, FRN thereafter, 6/15/88 | | United States | | | 25,000,000 | | | | 37,500,000 | |
Morgan Stanley, senior note, 5.50%, 1/26/20 | | United States | | | 15,000,000 | | | | 16,837,845 | |
eNationstar Mortgage LLC/Nationstar Capital Corp., senior note, 144A, 9.625%, 5/01/19 | | United States | | | 10,000,000 | | | | 11,300,000 | |
eNuveen Investments Inc., senior note, 144A, 9.50%, 10/15/20 | | United States | | | 13,600,000 | | | | 13,600,000 | |
| | | | | | | | | | |
| | | | | | | | | 259,058,565 | |
| | | | | | | | | | |
Health Care 2.8% | | | | | | | | | | |
Grifols Inc., senior note, 8.25%, 2/01/18 | | Spain | | | 4,900,000 | | | | 5,420,625 | |
HCA Holdings Inc., senior note, 7.75%, 5/15/21 | | United States | | | 10,000,000 | | | | 10,900,000 | |
HCA Inc., | | | | | | | | | | |
senior note, 8.00%, 10/01/18 | | United States | | | 12,000,000 | | | | 13,920,000 | |
FI-18
Franklin Templeton Variable Insurance Products Trust
Statement of Investments, December 31, 2012 (continued)
| | | | | | | | | | |
| Franklin Income Securities Fund | | Country | | Principal
Amount* | | | Value | |
Corporate Bonds (continued) | | | | | | | | | | |
Health Care (continued) | | | | | | | | | | |
HCA Inc., (continued) | | | | | | | | | | |
senior note, 7.50%, 2/15/22 | | United States | | | 34,500,000 | | | $ | 39,675,000 | |
senior note, 5.875%, 5/01/23 | | United States | | | 7,500,000 | | | | 7,781,250 | |
senior secured note, 6.50%, 2/15/20 | | United States | | | 20,000,000 | | | | 22,550,000 | |
e,f Jaguar Holding Co. I, senior note, 144A, PIK, 9.375%, 10/15/17 | | United States | | | 10,200,000 | | | | 10,761,000 | |
Tenet Healthcare Corp., | | | | | | | | | | |
senior note, 8.00%, 8/01/20 | | United States | | | 24,879,000 | | | | 26,915,968 | |
i senior note, FRN, 9.25%, 2/01/15 | | United States | | | 13,500,000 | | | | 15,221,250 | |
senior secured note, 10.00%, 5/01/18 | | United States | | | 16,750,000 | | | | 19,136,875 | |
Vanguard Health Holding Co. II LLC/Inc., senior note, | | | | | | | | | | |
8.00%, 2/01/18 | | United States | | | 23,100,000 | | | | 24,024,000 | |
7.75%, 2/01/19 | | United States | | | 4,000,000 | | | | 4,160,000 | |
| | | | | | | | | | |
| | | | | | | | | 200,465,968 | |
| | | | | | | | | | |
Industrials 2.0% | | | | | | | | | | |
eAbengoa Finance SAU, senior note, 144A, 8.875%, 11/01/17 | | Spain | | | 12,900,000 | | | | 12,190,500 | |
eAlgeco Scotsman Global Finance PLC, | | | | | | | | | | |
secured note, 144A, 8.50%, 10/15/18 | | United Kingdom | | | 9,900,000 | | | | 10,277,437 | |
senior note, 144A, 10.75%, 10/15/19 | | United Kingdom | | | 5,000,000 | | | | 4,937,500 | |
e CEVA Group PLC, | | | | | | | | | | |
senior note, 144A, 12.75%, 3/31/20 | | United Kingdom | | | 15,000,000 | | | | 11,100,000 | |
senior secured note, 144A, 8.375%, 12/01/17 | | United Kingdom | | | 7,500,000 | | | | 7,471,875 | |
senior secured note, 144A, 11.50%, 4/01/18 | | United Kingdom | | | 30,300,000 | | | | 25,603,500 | |
eHDTFS Inc., senior note, 144A, | | | | | | | | | | |
5.875%, 10/15/20 | | United States | | | 1,400,000 | | | | 1,470,000 | |
6.25%, 10/15/22 | | United States | | | 1,700,000 | | | | 1,819,000 | |
Hertz Corp., senior note, 6.75%, 4/15/19 | | United States | | | 7,500,000 | | | | 8,221,875 | |
The Manitowoc Co. Inc., senior note, 9.50%, 2/15/18 | | United States | | | 10,000,000 | | | | 11,175,000 | |
gNavistar International Corp., senior note, 8.25%, 11/01/21 | | United States | | | 16,300,000 | | | | 15,811,000 | |
RBS Global & Rexnord Corp., senior note, 8.50%, 5/01/18 | | United States | | | 13,900,000 | | | | 15,133,625 | |
United Rentals North America Inc., senior sub. note, 8.375%, 9/15/20 | | United States | | | 8,800,000 | | | | 9,790,000 | |
eUR Financing Escrow Corp., senior note, 144A, 7.625%, 4/15/22 | | United States | | | 8,000,000 | | | | 8,980,000 | |
| | | | | | | | | | |
| | | | | | | | | 143,981,312 | |
| | | | | | | | | | |
Information Technology 7.3% | | | | | | | | | | |
CDW LLC/Finance Corp., | | | | | | | | | | |
senior note, 8.50%, 4/01/19 | | United States | | | 23,725,000 | | | | 25,800,937 | |
senior sub. note, 12.535%, 10/12/17 | | United States | | | 4,348,000 | | | | 4,668,665 | |
Ceridian Corp., senior note, 11.25%, 11/15/15 | | United States | | | 4,500,000 | | | | 4,522,500 | |
eCommScope Inc., senior note, 144A, 8.25%, 1/15/19 | | United States | | | 4,000,000 | | | | 4,400,000 | |
First Data Corp., | | | | | | | | | | |
senior bond, 12.625%, 1/15/21 | | United States | | | 80,000,000 | | | | 84,600,000 | |
senior note, 9.875%, 9/24/15 | | United States | | | 7,500,000 | | | | 7,687,500 | |
senior note, 9.875%, 9/24/15 | | United States | | | 4,645,000 | | | | 4,749,513 | |
fsenior note, PIK, 10.55%, 9/24/15 | | United States | | | 13,500,000 | | | | 13,888,125 | |
esenior secured bond, 144A, 8.25%, 1/15/21 | | United States | | | 45,000,000 | | | | 45,225,000 | |
e,f senior secured note, 144A, PIK, 8.75%, 1/15/22 | | United States | | | 33,188,000 | | | | 34,100,670 | |
senior sub. note, 11.25%, 3/31/16 | | United States | | | 90,000,000 | | | | 88,650,000 | |
Freescale Semiconductor Inc., | | | | | | | | | | |
senior note, 8.05%, 2/01/20 | | United States | | | 35,000,000 | | | | 35,000,000 | |
senior note, 10.75%, 8/01/20 | | United States | | | 64,846,000 | | | | 69,871,565 | |
esenior secured note, 144A, 10.125%, 3/15/18 | | United States | | | 4,438,000 | | | | 4,926,180 | |
esenior secured note, 144A, 9.25%, 4/15/18 | | United States | | | 51,700,000 | | | | 56,740,750 | |
FI-19
Franklin Templeton Variable Insurance Products Trust
Statement of Investments, December 31, 2012 (continued)
| | | | | | | | | | |
| Franklin Income Securities Fund | | Country | | Principal
Amount* | | | Value | |
Corporate Bonds (continued) | | | | | | | | | | |
Information Technology (continued) | | | | | | | | | | |
Infor US Inc., senior note, 9.375%, 4/01/19 | | United States | | | 4,100,000 | | | $ | 4,622,750 | |
eSanmina Corp., senior note, 144A, 7.00%, 5/15/19 | | United States | | | 15,000,000 | | | | 15,375,000 | |
Sterling International Inc., senior note, 11.00%, 10/01/19 | | United States | | | 7,500,000 | | | | 7,687,500 | |
ViaSat Inc., senior note, 6.875%, 6/15/20 | | United States | | | 12,500,000 | | | | 13,125,000 | |
| | | | | | | | | | |
| | | | | | | | | 525,641,655 | |
| | | | | | | | | | |
Materials 3.8% | | | | | | | | | | |
Berry Plastics Corp., senior secured note, 9.75%, 1/15/21 | | United States | | | 5,000,000 | | | | 5,787,500 | |
eCemex Finance LLC, senior secured note, 144A, | | | | | | | | | | |
9.50%, 12/14/16 | | United States | | | 3,000,000 | | | | 3,277,500 | |
9.375%, 10/12/22 | | Mexico | | | 7,100,000 | | | | 8,023,000 | |
eCemex SAB de CV, senior secured note, 144A, | | | | | | | | | | |
9.00%, 1/11/18 | | Mexico | | | 26,000,000 | | | | 28,394,210 | |
9.50%, 6/15/18 | | Mexico | | | 12,000,000 | | | | 13,492,500 | |
Dynacast International LLC/Finance Inc., 9.25%, 7/15/19 | | United States | | | 10,000,000 | | | | 10,750,000 | |
eEdgen Murray Corp., secured note, 144A, 8.75%, 11/01/20 | | United States | | | 10,000,000 | | | | 10,150,000 | |
eFMG Resources (August 2006) Pty. Ltd., senior note, 144A, | | | | | | | | | | |
7.00%, 11/01/15 | | Australia | | | 10,000,000 | | | | 10,513,450 | |
6.875%, 2/01/18 | | Australia | | | 11,900,000 | | | | 12,331,375 | |
8.25%, 11/01/19 | | Australia | | | 15,000,000 | | | | 16,050,000 | |
Huntsman International LLC, senior note, 5.50%, 6/30/16 | | United States | | | 578,000 | | | | 579,445 | |
eIneos Finance PLC, senior secured note, 144A, 8.375%, 2/15/19 | | United Kingdom | | | 5,100,000 | | | | 5,508,000 | |
e Ineos Group Holdings Ltd., | | | | | | | | | | |
senior note, 144A, 7.875%, 2/15/16 | | United Kingdom | | | 30,000,000 | EUR | | | 39,489,030 | |
senior secured note, 144A, 8.50%, 2/15/16 | | United Kingdom | | | 5,000,000 | | | | 5,000,000 | |
eInmet Mining Corp., senior note, 144A, 8.75%, 6/01/20 | | Canada | | | 4,500,000 | | | | 4,938,750 | |
eKerling PLC, senior secured note, 144A, 10.625%, 1/28/17 | | United Kingdom | | | 9,400,000 | EUR | | | 12,053,572 | |
e Kinove German Bondco GmbH, | | | | | | | | | | |
senior secured bond, 144A, 10.00%, 6/15/18 | | Germany | | | 8,910,000 | EUR | | | 13,014,233 | |
senior secured note, 144A, 9.625%, 6/15/18 | | Germany | | | 11,100,000 | | | | 12,119,813 | |
Reynolds Group Issuer Inc./LLC/SA, | | | | | | | | | | |
esecured note, 144A, 5.75%, 10/15/20 | | United States | | | 14,200,000 | | | | 14,697,000 | |
senior note, 9.00%, 4/15/19 | | United States | | | 5,000,000 | | | | 5,225,000 | |
senior note, 9.875%, 8/15/19 | | United States | | | 16,800,000 | | | | 18,060,000 | |
senior note, 8.25%, 2/15/21 | | United States | | | 5,200,000 | | | | 5,304,000 | |
senior secured note, 6.875%, 2/15/21 | | United States | | | 10,000,000 | | | | 10,825,000 | |
eWalter Energy Inc., senior note, 144A, 9.875%, 12/15/20 | | United States | | | 7,000,000 | | | | 7,840,000 | |
| | | | | | | | | | |
| | | | | | | | | 273,423,378 | |
| | | | | | | | | | |
Telecommunication Services 2.7% | | | | | | | | | | |
Cricket Communications Inc., senior note, 7.75%, 10/15/20 | | United States | | | 45,000,000 | | | | 46,125,000 | |
Frontier Communications Corp., senior note, | | | | | | | | | | |
8.50%, 4/15/20 | | United States | | | 12,900,000 | | | | 14,899,500 | |
9.25%, 7/01/21 | | United States | | | 7,400,000 | | | | 8,713,500 | |
7.125%, 1/15/23 | | United States | | | 10,000,000 | | | | 10,637,500 | |
Sprint Nextel Corp., | | | | | | | | | | |
6.00%, 12/01/16 | | United States | | | 10,000,000 | | | | 10,925,000 | |
11.50%, 11/15/21 | | United States | | | 30,000,000 | | | | 40,912,500 | |
senior note, 9.125%, 3/01/17 | | United States | | | 13,300,000 | | | | 15,727,250 | |
senior note, 8.375%, 8/15/17 | | United States | | | 12,700,000 | | | | 14,827,250 | |
senior note, 7.00%, 8/15/20 | | United States | | | 5,000,000 | | | | 5,487,500 | |
esenior note, 144A, 9.00%, 11/15/18 | | United States | | | 20,000,000 | | | | 24,750,000 | |
| | | | | | | | | | |
| | | | | | | | | 193,005,000 | |
| | | | | | | | | | |
FI-20
Franklin Templeton Variable Insurance Products Trust
Statement of Investments, December 31, 2012 (continued)
| | | | | | | | | | |
| Franklin Income Securities Fund | | Country | | Principal
Amount* | | | Value | |
Corporate Bonds (continued) | | | | | | | | | | |
Utilities 2.5% | | | | | | | | | | |
eCalpine Corp., senior secured note, 144A, | | | | | | | | | | |
7.875%, 7/31/20 | | United States | | | 5,154,000 | | | $ | 5,811,135 | |
7.50%, 2/15/21 | | United States | | | 13,514,000 | | | | 15,000,540 | |
7.875%, 1/15/23 | | United States | | | 10,020,000 | | | | 11,372,700 | |
GenOn Energy Inc., senior note, | | | | | | | | | | |
7.625%, 6/15/14 | | United States | | | 14,500,000 | | | | 15,551,250 | |
7.875%, 6/15/17 | | United States | | | 25,000,000 | | | | 27,750,000 | |
eIntergen NV, senior secured note, 144A, 9.00%, 6/30/17 | | Netherlands | | | 7,500,000 | | | | 6,750,000 | |
Niska Gas Storage U.S./Canada, senior note, 8.875%, 3/15/18 | | United States | | | 15,000,000 | | | | 15,487,500 | |
fTexas Competitive Electric Holdings Co. LLC, senior note, PIK, 11.25%, 11/01/16 | | United States | | | 16,181,198 | | | | 3,256,466 | |
Texas Competitive Electric Holdings Co. LLC/Texas Competitive Electric Holdings Finance Inc., | | | | | | | | | | |
senior note, A, 10.25%, 11/01/15 | | United States | | | 122,939,000 | | | | 36,574,352 | |
senior note, B, 10.25%, 11/01/15 | | United States | | | 64,193,000 | | | | 18,455,488 | |
esenior secured note, 144A, 11.50%, 10/01/20 | | United States | | | 20,000,000 | | | | 15,750,000 | |
senior secured note, B, 15.00%, 4/01/21 | | United States | | | 17,547,000 | | | | 6,053,715 | |
| | | | | | | | | | |
| | | | | | | | | 177,813,146 | |
| | | | | | | | | | |
Total Corporate Bonds (Cost $2,838,918,118) | | | | | | | | | 2,968,722,373 | |
| | | | | | | | | | |
i,j Senior Floating Rate Interests 6.8% | | | | | | | | | | |
Consumer Discretionary 2.1% | | | | | | | | | | |
Chrysler Group LLC, Tranche B Term Loan, 6.00%, 5/24/17 | | United States | | | 44,029,500 | | | | 45,056,620 | |
Clear Channel Communications Inc., Tranche B Term Loan, 3.862%, 1/29/16 | | United States | | | 54,719,109 | | | | 45,485,259 | |
Cumulus Media Holdings Inc., Second Lien Term Loan, 7.50%, 9/16/19 | | United States | | | 40,000,000 | | | | 41,300,000 | |
Dex Media West LLC, Term Loan B, 7.00%, 10/24/14 | | United States | | | 3,623,467 | | | | 2,702,502 | |
HD Supply Inc., Term Loan Facility, 7.25%, 10/12/17 | | United States | | | 6,965,000 | | | | 7,168,148 | |
Landry’s Inc., B Term Loan, 6.50% - 7.50%, 4/24/18 | | United States | | | 8,902,575 | | | | 9,013,858 | |
SuperMedia, Exit Term Loan, 11.00%, 12/31/15 | | United States | | | 2,239,145 | | | | 1,612,184 | |
| | | | | | | | | | |
| | | | | | | | | 152,338,571 | |
| | | | | | | | | | |
Energy 0.3% | | | | | | | | | | |
Chesapeake Energy Corp., Senior Unsecured Term Loan, 5.75%, 12/02/17 | | United States | | | 20,000,000 | | | | 20,063,880 | |
| | | | | | | | | | |
Industrials 0.7% | | | | | | | | | | |
Altegrity Inc., | | | | | | | | | | |
Term Loan B, 2.961%, 2/21/15 | | United States | | | 12,476,821 | | | | 11,619,040 | |
Tranche D Term Loan, 7.75%, 2/21/15 | | United States | | | 12,585,755 | | | | 12,522,826 | |
CEVA Group PLC, | | | | | | | | | | |
Dollar Tranche B L/C, 5.311%, 8/31/16 | | United Kingdom | | | 2,105,263 | | | | 2,009,211 | |
EGL Tranche B Term Loans, 5.313%, 8/31/16 | | United Kingdom | | | 12,291,882 | | | | 11,731,065 | |
Navistar Inc., Tranche B Term Loan, 7.00%, 8/17/17 | | United States | | | 8,800,000 | | | | 8,866,000 | |
| | | | | | | | | | |
| | | | | | | | | 46,748,142 | |
| | | | | | | | | | |
Information Technology 1.3% | | | | | | | | | | |
First Data Corp., | | | | | | | | | | |
2017 Term Loan, 5.211%, 3/24/17 | | United States | | | 57,510,381 | | | | 56,670,212 | |
2018 Term Loan, 4.211%, 3/24/18 | | United States | | | 22,436,455 | | | | 21,419,029 | |
Freescale Semiconductor Inc., Tranche B-1 Term Loan, 4.464%, 12/01/16 | | United States | | | 2,581,931 | | | | 2,538,898 | |
Sophia LP (Datatel), Initial Term Loan, 6.25%, 7/19/18 | | United States | | | 7,269,331 | | | | 7,371,560 | |
SRA International Inc., Term Loan, 6.50%, 7/20/18 | | United States | | | 8,171,429 | | | | 7,813,928 | |
| | | | | | | | | | |
| | | | | | | | | 95,813,627 | |
| | | | | | | | | | |
FI-21
Franklin Templeton Variable Insurance Products Trust
Statement of Investments, December 31, 2012 (continued)
| | | | | | | | | | | | |
| Franklin Income Securities Fund | | Country | | | Principal
Amount* | | | Value | |
Senior Floating Rate Interests (continued) | | | | | | | | | | | | |
Materials 0.1% | | | | | | | | | | | | |
Ineos US Finance LLC, Dollar Term Loan, 6.50%, 4/27/18 | | | United States | | | | 9,925,000 | | | $ | 10,047,514 | |
| | | | | | | | | | | | |
Utilities 2.3% | | | | | | | | | | | | |
Dynegy Midwest Generation LLC, Term Loan, 9.25%, 8/05/16 | | | United States | | | | 9,059,330 | | | | 9,444,352 | |
Dynegy Power LLC, Term Loan, 9.25%, 8/05/16 | | | United States | | | | 14,835,240 | | | | 15,550,506 | |
Texas Competitive Electric Holdings Co. LLC, | | | | | | | | | | | | |
k2014 Term Loan, 3.713% - 3.81%, 10/10/14 | | | United States | | | | 54,500,000 | | | | 41,590,312 | |
2017 Term Loan, 4.713% - 4.81%, 10/10/17 | | | United States | | | | 149,606,875 | | | | 100,744,223 | |
| | | | | | | | | | | | |
| | | | | | | | | | | 167,329,393 | |
| | | | | | | | | | | | |
Total Senior Floating Rate Interests (Cost $513,840,991) | | | | | | | | | | | 492,341,127 | |
| | | | | | | | | | | | |
Asset-Backed Securities and Commercial Mortgage-Backed | | | | | | | | | | | | |
Securities (Cost $23,894,087) 0.4% | | | | | | | | | | | | |
Financials 0.4% | | | | | | | | | | | | |
e,i Banc of America Large Loan, 2010-HLTN, 144A, FRN, 2.509%, 11/15/15 | | | United States | | | | 27,464,467 | | | | 27,484,173 | |
| | | | | | | | | | | | |
Total Investments before Short Term Investments
(Cost $6,802,824,844) | | | | | | | | | | | 7,121,018,005 | |
| | | | | | | | | | | | |
Short Term Investments 0.7% | | | | | | | | | | | | |
Repurchase Agreements (Cost $51,000,050) 0.6% | | | | | | | | | | | | |
lJoint Repurchase Agreement, 0.154%, 1/02/13 (Maturity Value $51,000,488) | | | United States | | | | 51,000,050 | | | | 51,000,050 | |
BNP Paribas Securities Corp. (Maturity Value $6,639,244) | | | | | | | | | | | | |
Credit Suisse Securities (USA) LLC (Maturity Value $8,299,309) | | | | | | | | | | | | |
Deutsche Bank Securities Inc. (Maturity Value $5,355,051) | | | | | | | | | | | | |
HSBC Securities (USA) Inc. (Maturity Value $14,938,552) | | | | | | | | | | | | |
Merrill Lynch, Pierce, Fenner & Smith Inc. (Maturity Value $6,639,244) | | | | | | | | | | | | |
Morgan Stanley & Co. LLC (Maturity Value $2,489,844) | | | | | | | | | | | | |
UBS Securities LLC (Maturity Value $6,639,244) | | | | | | | | | | | | |
Collateralized by U.S. Government Agency Securities, 0.00% - 6.21%, 1/15/13 - 1/22/37;
U.S. Treasury Bonds, 11.25%, 2/15/15 and U.S. Treasury Notes, 0.25% - 2.00%, 11/30/13 - 9/15/15 (valued at $52,025,837) | | | | | | | | | | | | |
| | | |
| | | | | | Shares | | | | |
mInvestments from Cash Collateral Received for Loaned Securities (Cost $5,553,862) 0.1% | | | | | | | | | | | | |
Money Market Funds 0.1% | | | | | | | | | | | | |
nBNY Mellon Overnight Government Fund, 0.191% | | | United States | | | | 5,553,862 | | | | 5,553,862 | |
| | | | | | | | | | | | |
Total Investments (Cost $6,859,378,756) 99.6% | | | | | | | | | | | 7,177,571,917 | |
Other Assets, less Liabilities 0.4% | | | | | | | | | | | 26,221,662 | |
| | | | | | | | | | | | |
Net Assets 100.0% | | | | | | | | | | $ | 7,203,793,579 | |
| | | | | | | | | | | | |
See Abbreviations on page FI-36.
FI-22
Franklin Templeton Variable Insurance Products Trust
Statement of Investments, December 31, 2012 (continued)
|
|
| Franklin Income Securities Fund |
†Rounds to less than 0.1% of net assets.
*The principal amount is stated in U.S. dollars unless otherwise indicated.
aNon-income producing.
bAt December 31, 2012, pursuant to the Fund’s policies and the requirements of applicable securities law, the Fund may be restricted from trading these securities for a limited or extended period of time due to ownership limits and/or potential possession of material non-public information.
cSecurity has been deemed illiquid because it may not be able to be sold within seven days.
dSee Note 1(e) regarding equity-linked securities.
eSecurity was purchased pursuant to Rule 144A under the Securities Act of 1933 and may be sold in transactions exempt from registration only to qualified institutional buyers or in a public offering registered under the Securities Act of 1933. These securities have been deemed liquid under guidelines approved by the Trust’s Board of Trustees. At December 31, 2012, the aggregate value of these securities was $1,077,680,859, representing 14.96% of net assets.
fIncome may be received in additional securities and/or cash.
gA portion or all of the security is on loan at December 31, 2012. See Note 1(f).
hPerpetual security with no stated maturity date.
iThe coupon rate shown represents the rate at period end.
jSee Note 1(g) regarding senior floating rate interests.
kSecurity purchased on a delayed delivery basis. See Note 1(d).
lSee Note 1(c) regarding joint repurchase agreement.
mSee Note 1(f) regarding securities on loan.
nThe rate shown is the annualized seven-day yield at period end.
The accompanying notes are an integral part of these financial statements.
FI-23
Franklin Templeton Variable Insurance Products Trust
Financial Statements
Statement of Assets and Liabilities
December 31, 2012
| | | | |
| | | Franklin
Income
Securities Fund | |
Assets: | | | | |
Investments in securities: | | | | |
Cost - Unaffiliated issuers | | $ | 6,808,378,706 | |
Cost - Repurchase agreements | | | 51,000,050 | |
| | | | |
Total cost of investments | | $ | 6,859,378,756 | |
| | | | |
Value - Unaffiliated issuers | | $ | 7,126,571,867 | |
Value - Repurchase agreements | | | 51,000,050 | |
| | | | |
Total value of investments (Includes securities loaned in the amount of $5,368,405) | | | 7,177,571,917 | |
Cash | | | 1,905,173 | |
Receivables: | | | | |
Investment securities sold | | | 19,993,698 | |
Capital shares sold | | | 1,705,511 | |
Dividends and interest | | | 79,860,668 | |
Other assets | | | 182 | |
| | | | |
Total assets | | | 7,281,037,149 | |
| | | | |
Liabilities: | | | | |
Payables: | | | | |
Investment securities purchased | | | 52,711,791 | |
Capital shares redeemed | | | 12,371,717 | |
Affiliates | | | 5,559,829 | |
Payable upon return of securities loaned | | | 5,553,862 | |
Accrued expenses and other liabilities | | | 1,046,371 | |
| | | | |
Total liabilities | | | 77,243,570 | |
| | | | |
Net assets, at value | | $ | 7,203,793,579 | |
| | | | |
Net assets consist of: | | | | |
Paid-in capital | | $ | 7,526,169,858 | |
Undistributed net investment income | | | 445,550,700 | |
Net unrealized appreciation (depreciation) | | | 318,257,189 | |
Accumulated net realized gain (loss) | | | (1,086,184,168 | ) |
| | | | |
Net assets, at value | | $ | 7,203,793,579 | |
| | | | |
Class 1: | | | | |
Net assets, at value | | $ | 584,391,438 | |
| | | | |
Shares outstanding | | | 37,772,706 | |
| | | | |
Net asset value and maximum offering price per share | | $ | 15.47 | |
| | | | |
Class 2: | | | | |
Net assets, at value | | $ | 6,182,996,678 | |
| | | | |
Shares outstanding | | | 410,299,761 | |
| | | | |
Net asset value and maximum offering price per share | | $ | 15.07 | |
| | | | |
Class 4: | | | | |
Net assets, at value | | $ | 436,405,463 | |
| | | | |
Shares outstanding | | | 28,481,655 | |
| | | | |
Net asset value and maximum offering price per share | | $ | 15.32 | |
| | | | |
The accompanying notes are an integral part of these financial statements.
FI-24
Franklin Templeton Variable Insurance Products Trust
Financial Statements (continued)
Statement of Operations
for the year ended December 31, 2012
| | | | |
| | | Franklin
Income
Securities Fund | |
Investment income: | | | | |
Dividends | | $ | 134,047,671 | |
Interest: | | | | |
Unaffiliated issuers | | | 370,607,359 | |
Non-controlled affiliated issuers (Note 8) | | | 1,911,502 | |
Income from securities loaned | | | 952,335 | |
| | | | |
Total investment income | | | 507,518,867 | |
| | | | |
Expenses: | | | | |
Management fees (Note 3a) | | | 35,345,829 | |
Distribution fees: (Note 3c) | | | | |
Class 2 | | | 15,243,553 | |
Class 4 | | | 1,535,801 | |
Unaffiliated transfer agent fees | | | 1,601 | |
Custodian fees (Note 4) | | | 207,200 | |
Reports to shareholders | | | 691,820 | |
Professional fees | | | 236,105 | |
Trustees’ fees and expenses | | | 31,343 | |
Other | | | 204,789 | |
| | | | |
Total expenses | | | 53,498,041 | |
| | | | |
Net investment income | | | 454,020,826 | |
| | | | |
Realized and unrealized gains (losses): | | | | |
Net realized gain (loss) from: | | | | |
Investments: (includes gains from a redemption in-kind of $38,277,774) (Note 10) | | | | |
Unaffiliated issuers | | | (17,240,921 | ) |
Non-controlled affiliated issuers (Note 8) | | | (30,029,127 | ) |
Foreign currency transactions | | | 404,890 | |
| | | | |
Net realized gain (loss) | | | (46,865,158 | ) |
| | | | |
Net change in unrealized appreciation (depreciation) on: | | | | |
Investments | | | 534,607,906 | |
Translation of other assets and liabilities denominated in foreign currencies | | | 257,752 | |
| | | | |
Net change in unrealized appreciation (depreciation) | | | 534,865,658 | |
| | | | |
Net realized and unrealized gain (loss) | | | 488,000,500 | |
| | | | |
Net increase (decrease) in net assets resulting from operations | | $ | 942,021,326 | |
| | | | |
The accompanying notes are an integral part of these financial statements.
FI-25
Franklin Templeton Variable Insurance Products Trust
Financial Statements (continued)
Statements of Changes in Net Assets
| | | | | | | | |
| | | Franklin Income Securities Fund | |
| | | Year Ended December 31, | |
| | | 2012 | | | 2011 | |
| | | | |
Increase (decrease) in net assets: | | | | | | | | |
Operations: | | | | | | | | |
Net investment income | | $ | 454,020,826 | | | $ | 498,525,907 | |
Net realized gain (loss) from investments, written options and foreign currency transactions | | | (46,865,158 | ) | | | 224,314,451 | |
Net change in unrealized appreciation (depreciation) on investments and translation of other assets and liabilities denominated in foreign currencies | | | 534,865,658 | | | | (562,321,188 | ) |
| | | | |
Net increase (decrease) in net assets resulting from operations | | | 942,021,326 | | | | 160,519,170 | |
| | | | |
Distributions to shareholders from net investment income: | | | | | | | | |
Class 1 | | | (90,282,701 | ) | | | (96,601,395 | ) |
Class 2 | | | (392,684,736 | ) | | | (356,087,463 | ) |
Class 4 | | | (28,048,130 | ) | | | (24,430,578 | ) |
| | | | |
Total distributions to shareholders | | | (511,015,567 | ) | | | (477,119,436 | ) |
| | | | |
Capital share transactions: (Note 2) | | | | | | | | |
Class 1 | | | (793,290,008 | ) | | | (55,103,339 | ) |
Class 2 | | | (63,192,261 | ) | | | (185,660,731 | ) |
Class 4 | | | (18,736,873 | ) | | | 31,595,919 | |
| | | | |
Total capital share transactions | | | (875,219,142 | ) | | | (209,168,151 | ) |
| | | | |
Net increase (decrease) in net assets | | | (444,213,383 | ) | | | (525,768,417 | ) |
Net assets: | | | | | | | | |
Beginning of year | | | 7,648,006,962 | | | | 8,173,775,379 | |
| | | | |
End of year | | $ | 7,203,793,579 | | | $ | 7,648,006,962 | |
| | | | |
Undistributed net investment income included in net assets: | | | | | | | | |
End of year | | $ | 445,550,700 | | | $ | 491,942,579 | |
| | | | |
The accompanying notes are an integral part of these financial statements.
FI-26
Franklin Templeton Variable Insurance Products Trust
Notes to Financial Statements
Franklin Income Securities Fund
1. ORGANIZATION AND SIGNIFICANT ACCOUNTING POLICIES
Franklin Templeton Variable Insurance Products Trust (Trust) is registered under the Investment Company Act of 1940, as amended, (1940 Act) as an open-end investment company, consisting of twenty separate funds. The Franklin Income Securities Fund (Fund) is included in this report. The financial statements of the remaining funds in the Trust are presented separately. Shares of the Fund are generally sold only to insurance company separate accounts to fund the benefits of variable life insurance policies or variable annuity contracts. The Fund offers three classes of shares: Class 1, Class 2 and Class 4. Each class of shares differs by its distribution fees, voting rights on matters affecting a single class and its exchange privilege.
The following summarizes the Fund’s significant accounting policies.
a. Financial Instrument Valuation
The Fund’s investments in financial instruments are carried at fair value daily. Fair value is the price that would be received to sell an asset or paid to transfer a liability in an orderly transaction between market participants on the measurement date. Under procedures approved by the Trust’s Board of Trustees (the Board), the Fund’s administrator, investment manager and other affiliates have formed the Valuation and Liquidity Oversight Committee (VLOC). The VLOC provides administration and oversight of the Fund’s valuation policies and procedures, which are approved annually by the Board. Among other things, these procedures allow the Fund to utilize independent pricing services, quotations from securities and financial instrument dealers, and other market sources to determine fair value.
Equity securities listed on an exchange or on the NASDAQ National Market System are valued at the last quoted sale price or the official closing price of the day, respectively. Foreign equity securities are valued as of the close of trading on the foreign stock exchange on which the security is primarily traded, or the NYSE, whichever is earlier. The value is then converted into its U.S. dollar equivalent at the foreign exchange rate in effect at the close of the NYSE on the day that the value of the security is determined. Over-the-counter (OTC) securities are valued within the range of the most recent quoted bid and ask prices. Securities that trade in multiple markets or on multiple exchanges are valued according to the broadest and most representative market. Certain equity securities are valued based upon fundamental characteristics or relationships to similar securities. Investments in non-registered money market funds are valued at the closing net asset value.
Debt securities generally trade in the OTC market rather than on a securities exchange. The Fund’s pricing services use multiple valuation techniques to determine fair value. In instances where sufficient market activity exists, the pricing services may utilize a market-based approach through which quotes from market makers are used to determine fair value. In instances where sufficient market activity may not exist or is limited, the pricing services also utilize proprietary valuation models which may consider market characteristics such as benchmark yield curves, credit spreads, estimated default rates, anticipated market interest rate volatility, coupon rates, anticipated timing of principal repayments, underlying collateral, and other unique security features in order to estimate the relevant cash flows, which are then discounted to calculate the fair value. Securities denominated in a foreign currency are converted into their U.S. dollar equivalent at the foreign exchange rate in effect at the close of the NYSE on the date that the values of the foreign debt securities are determined. Repurchase agreements are valued at cost, which approximates market value.
The Fund has procedures to determine the fair value of financial instruments for which market prices are not reliable or readily available. Under these procedures, the VLOC convenes on a regular basis to review such financial instruments and considers a number of factors, including significant unobservable valuation inputs, when arriving at fair value. The VLOC primarily employs a market-based approach which may use related or comparable assets or liabilities, recent transactions, market multiples, book values, and other relevant information for the investment to determine the fair value of the investment. An income-based valuation approach may also be used in which the anticipated future cash flows of the investment are discounted to calculate fair value. Discounts may also be applied due to the nature or duration of any restrictions on the disposition of the investments. Due to the inherent uncertainty of valuations of such investments, the fair values may differ significantly from the values that would
FI-27
Franklin Templeton Variable Insurance Products Trust
Notes to Financial Statements (continued)
Franklin Income Securities Fund
1. ORGANIZATION AND SIGNIFICANT ACCOUNTING POLICIES (continued)
a. Financial Instrument Valuation (continued)
have been used had an active market existed. The VLOC employs various methods for calibrating these valuation approaches including a regular review of key inputs and assumptions, transactional back-testing or disposition analysis, and reviews of any related market activity.
Trading in securities on foreign securities stock exchanges and OTC markets may be completed before the daily close of business on the NYSE. Occasionally, events occur between the time at which trading in a foreign security is completed and the close of the NYSE that might call into question the reliability of the value of a portfolio security held by the Fund. As a result, differences may arise between the value of the Fund’s portfolio securities as determined at the foreign market close and the latest indications of value at the close of the NYSE. In order to minimize the potential for these differences, the VLOC monitors price movements following the close of trading in foreign stock markets through a series of country specific market proxies (such as baskets of American Depositary Receipts, futures contracts and exchange traded funds). These price movements are measured against established trigger thresholds for each specific market proxy to assist in determining if an event has occurred that may call into question the reliability of the values of the foreign securities held by the Fund. If such an event occurs, the securities may be valued using fair value procedures, which may include the use of independent pricing services. At December 31, 2012, a market event occurred resulting in a portion of the securities held by the Fund being valued using fair value procedures.
b. Foreign Currency Translation
Portfolio securities and other assets and liabilities denominated in foreign currencies are translated into U.S. dollars based on the exchange rate of such currencies against U.S. dollars on the date of valuation. The Fund may enter into foreign currency exchange contracts to facilitate transactions denominated in a foreign currency. Purchases and sales of securities, income and expense items denominated in foreign currencies are translated into U.S. dollars at the exchange rate in effect on the transaction date. Portfolio securities and assets and liabilities denominated in foreign currencies contain risks that those currencies will decline in value relative to the U.S. dollar. Occasionally, events may impact the availability or reliability of foreign exchange rates used to convert the U.S. dollar equivalent value. If such an event occurs, the foreign exchange rate will be valued at fair value using procedures established and approved by the Board.
The Fund does not separately report the effect of changes in foreign exchange rates from changes in market prices on securities held. Such changes are included in net realized and unrealized gain or loss from investments on the Statement of Operations.
Realized foreign exchange gains or losses arise from sales of foreign currencies, currency gains or losses realized between the trade and settlement dates on securities transactions and the difference between the recorded amounts of dividends, interest, and foreign withholding taxes and the U.S. dollar equivalent of the amounts actually received or paid. Net unrealized foreign exchange gains and losses arise from changes in foreign exchange rates on foreign denominated assets and liabilities other than investments in securities held at the end of the reporting period.
c. Joint Repurchase Agreement
The Fund enters into a joint repurchase agreement whereby its uninvested cash balance is deposited into a joint cash account with other funds managed by the investment manager or an affiliate of the investment manager and is used to invest in one or more repurchase agreements. The value and face amount of the joint repurchase agreement are allocated to the funds based on their pro-rata interest. A repurchase agreement is accounted for as a loan by the Fund to the seller, collateralized by securities which are delivered to the Fund’s custodian. The market value, including accrued interest, of the initial collateralization is required to be at least 102% of the dollar amount invested by the funds, with the value of the underlying securities marked to market daily to maintain coverage of at least 100%. The joint repurchase agreement held by the Fund at year end had been entered into on December 31, 2012.
FI-28
Franklin Templeton Variable Insurance Products Trust
Notes to Financial Statements (continued)
Franklin Income Securities Fund
1. ORGANIZATION AND SIGNIFICANT ACCOUNTING POLICIES (continued)
d. Securities Purchased on a Delayed Delivery Basis
The Fund purchases securities on a delayed delivery basis, with payment and delivery scheduled for a future date. These transactions are subject to market fluctuations and are subject to the risk that the value at delivery may be more or less than the trade date purchase price. Although the Fund will generally purchase these securities with the intention of holding the securities, it may sell the securities before the settlement date. Sufficient assets have been segregated for these securities.
e. Equity-Linked Securities
The Fund invests in equity-linked securities. Equity-linked securities are hybrid financial instruments that generally combine both debt and equity characteristics into a single note form. Income received from equity linked securities is recorded as realized gains in the Statement of Operations and may be based on the performance of an underlying equity security, an equity index, or an option position. The risks of investing in equity-linked securities include unfavorable price movements in the underlying security and the credit risk of the issuing financial institution. There may be no guarantee of a return of principal with equity linked securities and the appreciation potential may be limited. Equity-linked securities may be more volatile and less liquid than other investments held by the Fund.
f. Securities Lending
The Fund participates in an agency based securities lending program. The Fund receives cash collateral against the loaned securities in an amount equal to at least 102% of the market value of the loaned securities. Collateral is maintained over the life of the loan in an amount not less than 100% of the market value of loaned securities, as determined at the close of fund business each day; any additional collateral required due to changes in security values is delivered to the Fund on the next business day. The collateral is invested in a non-registered money fund as indicated on the Statement of Investments. The Fund receives income from the investment of cash collateral, in addition to lending fees and rebates paid by the borrower. The Fund bears the market risk with respect to the collateral investment, securities loaned, and the risk that the agent may default on its obligations to the Fund. The securities lending agent has agreed to indemnify the Fund in the event of default by a third party borrower.
g. Senior Floating Rate Interests
The Fund invests in senior secured corporate loans that pay interest at rates which are periodically reset by reference to a base lending rate plus a spread. These base lending rates are generally the prime rate offered by a designated U.S. bank or the London InterBank Offered Rate (LIBOR). Senior secured corporate loans often require prepayment of principal from excess cash flows or at the discretion of the borrower. As a result, actual maturity may be substantially less than the stated maturity.
Senior secured corporate loans in which the Fund invests are generally readily marketable, but may be subject to some restrictions on resale.
h. Income and Deferred Taxes
It is the Fund’s policy to qualify as a regulated investment company under the Internal Revenue Code. The Fund intends to distribute to shareholders substantially all of its taxable income and net realized gains to relieve it from federal income and if applicable, excise taxes. As a result, no provision for U.S. federal income taxes is required.
The Fund may be subject to foreign taxation related to income received, capital gains on the sale of securities and certain foreign currency transactions in the foreign jurisdictions in which it invests. Foreign taxes, if any, are recorded based on the tax regulations and rates that exist in the foreign markets in which the Fund invests. When a capital gain tax is determined to apply the Fund records an estimated deferred tax liability in an amount that would be payable if the securities were disposed of on the valuation date.
FI-29
Franklin Templeton Variable Insurance Products Trust
Notes to Financial Statements (continued)
Franklin Income Securities Fund
1. ORGANIZATION AND SIGNIFICANT ACCOUNTING POLICIES (continued)
h. Income and Deferred Taxes (continued)
The Fund recognizes the tax benefits of uncertain tax positions only when the position is “more likely than not” to be sustained upon examination by the tax authorities based on the technical merits of the tax position. As of December 31, 2012, and for all open tax years, the Fund has determined that no liability for unrecognized tax benefits is required in the Fund’s financial statements related to uncertain tax positions taken on a tax return (or expected to be taken on future tax returns). Open tax years are those that remain subject to examination and are based on each tax jurisdiction statute of limitation.
i. Security Transactions, Investment Income, Expenses and Distributions
Security transactions are accounted for on trade date. Realized gains and losses on security transactions are determined on a specific identification basis. Interest income and estimated expenses are accrued daily. Amortization of premium and accretion of discount on debt securities are included in interest income. Facility fees are recognized as income over the expected term of the loan. Dividend income is recorded on the ex-dividend date except that certain dividends from foreign securities are recognized as soon as the Fund is notified of the ex-dividend date. Distributions to shareholders are recorded on the ex-dividend date and are determined according to income tax regulations (tax basis). Distributable earnings determined on a tax basis may differ from earnings recorded in accordance with accounting principles generally accepted in the United States of America. These differences may be permanent or temporary. Permanent differences are reclassified among capital accounts to reflect their tax character. These reclassifications have no impact on net assets or the results of operations. Temporary differences are not reclassified, as they may reverse in subsequent periods.
Common expenses incurred by the Trust are allocated among the funds based on the ratio of net assets of each fund to the combined net assets of the Trust. Fund specific expenses are charged directly to the fund that incurred the expense.
Realized and unrealized gains and losses and net investment income, not including class specific expenses, are allocated daily to each class of shares based upon the relative proportion of net assets of each class. Differences in per share distributions, by class, are generally due to differences in class specific expenses.
j. Accounting Estimates
The preparation of financial statements in accordance with accounting principles generally accepted in the United States of America requires management to make estimates and assumptions that affect the reported amounts of assets and liabilities at the date of the financial statements and the amounts of income and expenses during the reporting period. Actual results could differ from those estimates.
k. Guarantees and Indemnifications
Under the Trust’s organizational documents, its officers and trustees are indemnified by the Trust against certain liabilities arising out of the performance of their duties to the Trust. Additionally, in the normal course of business, the Trust, on behalf of the Fund, enters into contracts with service providers that contain general indemnification clauses. The Trust’s maximum exposure under these arrangements is unknown as this would involve future claims that may be made against the Trust that have not yet occurred. Currently, the Trust expects the risk of loss to be remote.
FI-30
Franklin Templeton Variable Insurance Products Trust
Notes to Financial Statements (continued)
Franklin Income Securities Fund
2. SHARES OF BENEFICIAL INTEREST
At December 31, 2012, there were an unlimited number of shares authorized (without par value). Transactions in the Fund’s shares were as follows:
| | | | | | | | | | | | | | | | |
| | | Year Ended December 31, | |
| | | 2012 | | | 2011 | |
| Class 1 Shares: | | Shares | | | Amount | | | Shares | | | Amount | |
Shares sold | | | 39,214,078 | | | $ | 586,304,676 | | | | 46,373,672 | | | $ | 684,944,435 | |
Shares issued in reinvestment of distributions | | | 6,331,185 | | | | 90,282,701 | | | | 6,487,669 | | | | 96,601,395 | |
Shares redeemed in-kind (Note 10) | | | (29,984,492 | ) | | | (458,420,903 | ) | | | — | | | | — | |
Shares redeemed | | | (66,431,278 | ) | | | (1,011,456,482 | ) | | | (59,777,035 | ) | | | (836,649,169 | ) |
| | | | |
Net increase (decrease) | | | (50,870,507 | ) | | $ | (793,290,008 | ) | | | (6,915,694 | ) | | $ | (55,103,339 | ) |
| | | | |
Class 2 Shares: | | | | | | | | | | | | | | | | |
Shares sold | | | 37,383,185 | | | $ | 550,351,184 | | | | 36,881,385 | | | $ | 540,163,327 | |
Shares issued in reinvestment of distributions | | | 28,230,391 | | | | 392,684,736 | | | | 24,473,365 | | | | 356,087,463 | |
Shares redeemed | | | (68,491,604 | ) | | | (1,006,228,181 | ) | | | (74,034,875 | ) | | | (1,081,911,521 | ) |
| | | | |
Net increase (decrease) | | | (2,878,028 | ) | | $ | (63,192,261 | ) | | | (12,680,125 | ) | | $ | (185,660,731 | ) |
| | | | |
Class 4 Shares: | | | | | | | | | | | | | | | | |
Shares sold | | | 2,795,409 | | | $ | 41,861,767 | | | | 4,165,273 | | | $ | 62,663,608 | |
Shares issued on reinvestment of distributions | | | 1,982,200 | | | | 28,048,130 | | | | 1,652,948 | | | | 24,430,578 | |
Shares redeemed | | | (5,962,592 | ) | | | (88,646,770 | ) | | | (3,777,871 | ) | | | (55,498,267 | ) |
| | | | |
Net increase (decrease) | | | (1,184,983 | ) | | $ | (18,736,873 | ) | | | 2,040,350 | | | $ | 31,595,919 | |
| | | | |
3. TRANSACTIONS WITH AFFILIATES
Franklin Resources, Inc. is the holding company for various subsidiaries that together are referred to as Franklin Templeton Investments. Certain officers and trustees of the Fund are also officers and/or directors of the following subsidiaries:
| | |
| Subsidiary | | Affiliation |
Franklin Advisers, Inc. (Advisers) | | Investment manager |
Templeton Investment Counsel, LLC (TIC) | | Investment manager |
Franklin Templeton Services, LLC (FT Services) | | Administrative manager |
Franklin Templeton Distributors, Inc. (Distributors) | | Principal underwriter |
Franklin Templeton Investor Services, LLC (Investor Services) | | Transfer agent |
a. Management Fees
The Fund pays an investment management fee to Advisers based on the average daily net assets of the Fund as follows:
| | |
| Annualized Fee Rate | | Net Assets |
| 0.625% | | Up to and including $100 million |
| 0.500% | | Over $100 million, up to and including $250 million |
| 0.450% | | Over $250 million, up to and including $7.5 billion |
| 0.440% | | Over $7.5 billion, up to and including $10 billion |
| 0.430% | | Over $10 billion, up to and including $12.5 billion |
| 0.420% | | Over $12.5 billion, up to and including $15 billion |
| 0.400% | | In excess of $15 billion |
FI-31
Franklin Templeton Variable Insurance Products Trust
Notes to Financial Statements (continued)
Franklin Income Securities Fund
3. TRANSACTIONS WITH AFFILIATES (continued)
a. Management Fees (continued)
Under a subadvisory agreement, TIC, an affiliate of Advisers, provides subadvisory services to the Fund. The subadvisory fee is paid by Advisers based on the average daily net assets, and is not an additional expense of the Fund.
b. Administrative Fees
FT Services, under terms of an agreement, provides administrative services to the Fund and is not paid by the Fund for the services.
c. Distribution Fees
The Board has adopted distribution plans for Class 2 and Class 4 shares pursuant to Rule 12b-1 under the 1940 Act. Under the Fund’s compensation distribution plans, the Fund pays Distributors for costs incurred in connection with the servicing, sale and distribution of the Fund’s shares up to 0.35% per year of its average daily net assets of each class. Some distribution fees are not charged on shares held by affiliates. The Board has agreed to limit the current rate to 0.25% per year for Class 2.
d. Transfer Agent Fees
Investor Services, under terms of an agreement, performs shareholder servicing for the Fund and is not paid by the Fund for the services.
e. Other Affiliated Transactions
At December 31, 2012, Franklin Templeton Variable Insurance Products Trust – Franklin Templeton VIP Founding Funds Allocation Fund owned 4.33% of the Fund’s outstanding shares.
4. EXPENSE OFFSET ARRANGEMENT
The Fund has entered into an arrangement with its custodian whereby credits realized as a result of uninvested cash balances are used to reduce a portion of the Fund’s custodian expenses. During the year ended December 31, 2012, there were no credits earned.
5. INCOME TAXES
For tax purposes, capital losses may be carried over to offset future capital gains, if any. Capital loss carryforwards with no expiration, if any, must be fully utilized before those losses with expiration dates.
At December 31, 2012, capital loss carryforwards were as follows:
| | | | |
Capital loss carryforwards subject to expiration: | | | | |
2016 | | $ | 310,746,276 | |
2017 | | | 521,405,875 | |
2018 | | | 157,561,044 | |
Capital loss carryforwards not subject to expiration: | | | | |
Long term | | | 93,754,582 | |
| | | | |
Total capital loss carryforwards | | $ | 1,083,467,777 | |
| | | | |
FI-32
Franklin Templeton Variable Insurance Products Trust
Notes to Financial Statements (continued)
Franklin Income Securities Fund
5. INCOME TAXES (continued)
The tax character of distributions paid during the years ended December 31, 2012 and 2011, was as follows:
| | | | | | | | |
| | | 2012 | | | 2011 | |
Distributions paid from ordinary income | | $ | 511,015,567 | | | $ | 477,119,436 | |
| | | | |
At December 31, 2012, the cost of investments, net unrealized appreciation (depreciation) and undistributed ordinary income for income tax purposes were as follows:
| | | | |
Cost of investments | | $ | 6,880,521,099 | |
| | | | |
| |
Unrealized appreciation | | $ | 897,173,832 | |
Unrealized depreciation | | | (600,123,014 | ) |
| | | | |
Net unrealized appreciation (depreciation) | | $ | 297,050,818 | |
| | | | |
Distributable earnings – undistributed ordinary income | | $ | 463,892,527 | |
| | | | |
Differences between income and/or capital gains as determined on a book basis and a tax basis are primarily due to differing treatments of defaulted securities, payments-in-kind, bond discounts and premiums, corporate actions, and gains realized on in-kind shareholder redemptions.
6. INVESTMENT TRANSACTIONS
Purchases and sales of investments (excluding short term securities) for the year ended December 31, 2012, aggregated $1,926,297,246 and $2,245,026,653, respectively. Sales of investments excludes redemption in-kind of $458,420,903.
7. CREDIT RISK AND DEFAULTED SECURITIES
At December 31, 2012, the Fund had 46.64% of its portfolio invested in high yield, senior secured floating rate notes, or other securities rated below investment grade. These securities may be more sensitive to economic conditions causing greater price volatility and are potentially subject to a greater risk of loss due to default than higher rated securities.
FI-33
Franklin Templeton Variable Insurance Products Trust
Notes to Financial Statements (continued)
Franklin Income Securities Fund
8. HOLDINGS OF 5% VOTING SECURITIES OF PORTFOLIO COMPANIES
The 1940 Act defines “affiliated companies” to include investments in portfolio companies in which a fund owns 5% or more of the outstanding voting securities. Investments in “affiliated companies” for the Fund for the year ended December 31, 2012, were as shown below.
| | | | | | | | | | | | | | | | | | | | | | | | | | | | |
| Name of Issuer | | Number of
Shares/Principal
Amount
Held at Beginning
of Year | | | Gross
Additions | | | Gross
Reductions | | | Number of
Shares/Principal
Amount
Held at End of
Year | | | Value at
End of
Year | | | Investment
Income | | | Realized Capital
Gain (Loss) | |
Non-Controlled Affiliates | | | | | | | | | | | | | | | | | | | | | | | | | | | | |
aDex Media West LLC, Term Loan B, | | | | | | | | | | | | | | | | | | | | | | | | | | | | |
7.00%, 10/24/14 | | | 4,265,968 | | | | — | | | | 642,501 | | | | 3,623,467 | | | $ | — | b | | $ | 237,212 | | | $ | 136,733 | |
Dex One Corp. | | | 2,642,381 | | | | — | | | | 348,000 | | | | 2,294,381 | | | | — | b | | | — | | | | (15,603,964 | ) |
Dex One Corp., senior sub. note, PIK, 14.00%, 1/29/17 | | | 32,511,674 | | | | 1,625,464 | | | | 19,719,449 | | | | 14,417,689 | | | | — | b | | | 1,674,290 | | | | (14,561,896 | ) |
| | | | | | | | | | | | | | | | | | | | |
Total Affiliated Securities (0.00% of Net Assets) | | | $ | — | | | $ | 1,911,502 | | | $ | (30,029,127 | ) |
| | | | | | | | | | | | | | | | | | | | |
aCompany is a wholly owned subsidiary of Dex One Corp.
bAs of December 31, 2012, no longer an affiliate.
9. CREDIT FACILITY
The Fund, together with other U.S. registered and foreign investment funds (collectively, Borrowers), managed by Franklin Templeton Investments, are borrowers in a joint syndicated senior unsecured credit facility totaling $1.5 billion (Global Credit Facility) which matured on January 18, 2013. This Global Credit Facility provides a source of funds to the Borrowers for temporary and emergency purposes, including the ability to meet future unanticipated or unusually large redemption requests. Effective January 18, 2013, the Borrowers renewed the Global Credit Facility which matures on January 17, 2014.
Under the terms of the Global Credit Facility, the Fund shall, in addition to interest charged on any borrowings made by the Fund and other costs incurred by the Fund, pay its share of fees and expenses incurred in connection with the implementation and maintenance of the Global Credit Facility, based upon its relative share of the aggregate net assets of all of the Borrowers, including an annual commitment fee of 0.07% based upon the unused portion of the Global Credit Facility. These fees are reflected in other expenses on the Statement of Operations. During the year ended December 31, 2012, the Fund did not use the Global Credit Facility.
10. REDEMPTION IN-KIND
During the year ended December 31, 2012, the Fund realized $38,277,774 of net gains resulting from a redemption in-kind in which a shareholder redeemed fund shares for securities held by the Fund rather than for cash. Because such gains are not taxable to the Fund, and are not netted with capital gains that are distributed to remaining shareholders, they have been reclassified from accumulated net realized gains to paid-in capital.
FI-34
Franklin Templeton Variable Insurance Products Trust
Notes to Financial Statements (continued)
Franklin Income Securities Fund
11. FAIR VALUE MEASUREMENTS
The Fund follows a fair value hierarchy that distinguishes between market data obtained from independent sources (observable inputs) and the Fund’s own market assumptions (unobservable inputs). These inputs are used in determining the value of the Fund’s financial instruments and are summarized in the following fair value hierarchy:
| | • | | Level 1 – quoted prices in active markets for identical financial instruments |
| | • | | Level 2 – other significant observable inputs (including quoted prices for similar financial instruments, interest rates, prepayment speed, credit risk, etc.) |
| | • | | Level 3 – significant unobservable inputs (including the Fund’s own assumptions in determining the fair value of financial instruments) |
The inputs or methodology used for valuing financial instruments are not an indication of the risk associated with investing in those financial instruments.
For movements between the levels within the fair value hierarchy, the Fund has adopted a policy of recognizing the transfers as of the date of the underlying event which caused the movement. Additionally, at December 31, 2012, due to market events, the Fund employed fair value procedures to value a portion of its holdings. Such procedures resulted in a temporary transfer of financial instruments valued at $323,692,469 from Level 1 to Level 2 within the fair value hierarchy.
A summary of inputs used as of December 31, 2012, in valuing the Fund’s assets carried at fair value, is as follows:
| | | | | | | | | | | | | | | | |
| | | Level 1 | | | Level 2 | | | Level 3 | | | Total | |
| | | | |
Assets: | | | | | | | | | | | | | | | | |
Investments in Securities | | | | | | | | | | | | | | | | |
Equity Investments:a | | | | | | | | | | | | | | | | |
Consumer Discretionary | | $ | 72,882,375 | | | $ | 22,680 | | | $ | — | | | $ | 72,905,055 | |
Consumer Staples | | | 48,025,833 | | | | 29,085,670 | | | | | | | | 77,111,503 | |
Energy | | | 523,360,297 | | | | 12,549,120 | | | | — | | | | 535,909,417 | |
Financials | | | 467,096,806 | | | | 227,570,164 | | | | — | | | | 694,666,970 | |
Materials | | | 346,907,948 | | | | 58,118,106 | | | | | | | | 405,026,054 | |
Telecommunication Services | | | 89,901,964 | | | | 107,032,112 | | | | — | | | | 196,934,076 | |
Utilities | | | 846,016,558 | | | | 4,181,459 | | | | — | c | | | 850,198,017 | |
All Other Equity Investmentsb | | | 685,499,398 | | | | — | | | | — | | | | 685,499,398 | |
Equity-Linked Securities | | | — | | | | 51,003,152 | | | | — | | | | 51,003,152 | |
Convertible Bonds | | | — | | | | 63,216,690 | | | | — | | | | 63,216,690 | |
Corporate Bonds | | | — | | | | 2,968,722,373 | | | | — | | | | 2,968,722,373 | |
Senior Floating Rate Interests | | | — | | | | 492,341,127 | | | | — | | | | 492,341,127 | |
Asset-Backed Securities and Commercial Mortgage- Backed Securities | | | — | | | | 27,484,173 | | | | — | | | | 27,484,173 | |
Short Term Investments | | | — | | | | 56,553,912 | | | | — | | | | 56,553,912 | |
| | | | |
Total Investments in Securities | | $ | 3,079,691,179 | | | $ | 4,097,880,738 | | | $ | — | | | $ | 7,177,571,917 | |
| | | | |
aIncludes common, preferred, and convertible preferred stocks as well as other equity investments.
bFor detailed categories, see the accompanying Statement of Investments.
cIncludes securities determined to have no value at December 31, 2012.
A reconciliation of assets in which Level 3 inputs are used in determining fair value is presented when there are significant Level 3 investments at the end of the year.
12. NEW ACCOUNTING PRONOUNCEMENTS
In December 2011, the Financial Accounting Standards Board (FASB) issued Accounting Standards Update (ASU) No. 2011-11, Balance Sheet (Topic 210): Disclosures about Offsetting Assets and Liabilities. The amendments in the ASU enhance disclosures
FI-35
Franklin Templeton Variable Insurance Products Trust
Notes to Financial Statements (continued)
Franklin Income Securities Fund
12. NEW ACCOUNTING PRONOUNCEMENTS (continued)
about offsetting of financial assets and liabilities to enable investors to understand the effect of these arrangements on a fund’s financial position. In January 2013, FASB issued ASU No. 2013-01, Balance Sheet (Topic 210): Clarifying the Scope of Disclosures about Offsetting Assets and Liabilities. The amendments in ASU No. 2013-01 clarify the intended scope of disclosures required by ASU No. 2011-11. These ASUs are effective for interim and annual reporting periods beginning on or after January 1, 2013. The Fund believes the adoption of these ASUs will not have a material impact on its financial statements.
13. SUBSEQUENT EVENTS
The Fund has evaluated subsequent events through the issuance of the financial statements and determined that no events have occurred that require disclosure other than those already disclosed in the financial statements.
| | | | |
ABBREVIATIONS | | | | |
| Currency | | Selected Portfolio | | |
| | | | |
| EUR - Euro | | ADR - American Depository Receipt | | |
| GBP - British Pound | | FRN - Floating Rate Note | | |
| | L/C - Letter of Credit | | |
| | MTN - Medium Term Note | | |
| | PIK - Payment-In-Kind | | |
FI-36
Franklin Templeton Variable Insurance Products Trust
Franklin Income Securities Fund
Report of Independent Registered Public Accounting Firm
To the Board of Trustees and Shareholders of Franklin Templeton Variable Insurance Products Trust
In our opinion, the accompanying statement of assets and liabilities, including the statement of investments, and the related statements of operations and of changes in net assets and the financial highlights present fairly, in all material respects, the financial position of Franklin Income Securities Fund (the “Fund”) at December 31, 2012, the results of its operations for the year then ended, the changes in its net assets for each of the two years in the period then ended and the financial highlights for the periods presented, in conformity with accounting principles generally accepted in the United States of America. These financial statements and financial highlights (hereafter referred to as “financial statements”) are the responsibility of the Fund’s management. Our responsibility is to express an opinion on these financial statements based on our audits. We conducted our audits of these financial statements in accordance with the standards of the Public Company Accounting Oversight Board (United States). Those standards require that we plan and perform the audit to obtain reasonable assurance about whether the financial statements are free of material misstatement. An audit includes examining, on a test basis, evidence supporting the amounts and disclosures in the financial statements, assessing the accounting principles used and significant estimates made by management, and evaluating the overall financial statement presentation. We believe that our audits, which included confirmation of securities at December 31, 2012 by correspondence with the custodian and brokers, provide a reasonable basis for our opinion.
PricewaterhouseCoopers LLP
San Francisco, California
February 15, 2013
FI-37
Franklin Templeton Variable Insurance Products Trust
Tax Information (unaudited)
Franklin Income Securities Fund
Under Section 854(b)(1)(A) of the Internal Revenue Code, the Fund hereby reports 17.63% of the ordinary income dividends as income qualifying for the dividends received deduction for the fiscal year ended December 31, 2012.
FI-38
FRANKLIN LARGE CAP GROWTH SECURITIES FUND
This annual report for Franklin Large Cap Growth Securities Fund covers the fiscal year ended December 31, 2012.
Performance Summary as of 12/31/12
Average annual total return of Class 2 shares represents the average annual change in value, assuming reinvestment of dividends and capital gains. Average returns smooth out variations in returns, which can be significant; they are not the same as year-by-year results.
Periods ended 12/31/12
| | | | | | | | | | | | |
| | | 1-Year | | | 5-Year | | | 10-Year | |
Average Annual Total Return | | | +12.37% | | | | +0.96% | | | | +5.52% | |
Total Return Index Comparison for a Hypothetical $10,000 Investment (1/1/03–12/31/12)
The graph below shows the change in value of a hypothetical $10,000 investment in the Fund over the indicated period and includes reinvestment of any income or distributions. The Fund’s performance is compared to the performance of the Standard & Poor’s® 500 Index (S&P 500®). One cannot invest directly in an index, and an index is not representative of the Fund’s portfolio. Please see Important Notes to Performance Information preceding the Fund Summaries.
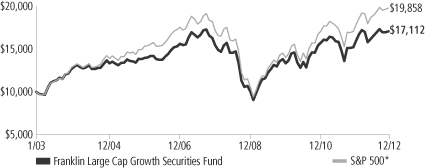
*Source: © 2013 Morningstar. Please see Index Descriptions following the Fund Summaries.
Franklin Large Cap Growth Securities Fund Class 2
Performance reflects the Fund’s Class 2 operating expenses, but does not include any contract fees, expenses or sales charges. If they had been included, performance would be lower. These charges and deductions, particularly for variable life policies, can have a significant effect on contract values and insurance benefits. See the contract prospectus for a complete description of these expenses, including sales charges.
Performance data represent past performance, which does not guarantee future results. Investment return and principal value will fluctuate, and you may have a gain or loss when you sell your shares.
Current performance may differ from figures shown.
FLG-1
Fund Goal and Main Investments: Franklin Large Cap Growth Securities Fund seeks capital appreciation. Under normal market conditions, the Fund invests at least 80% of its net assets in investments of large capitalization companies. For this Fund, large capitalization companies are those with market capitalization values within those of the top 50% of companies in the Russell 1000® Index at the time of purchase.1
Performance Overview
You can find the Fund’s one-year total return in the Performance Summary. The Fund underperformed its benchmark, the S&P 500, which posted a +16.00% total return.2
Economic and Market Overview
The U.S. economy, as measured by gross domestic product, grew moderately in 2012, supported by positive construction, housing and labor market trends. U.S. home prices increased in most regions due to higher demand based on near to record-low mortgage rates, affordable housing prices, low new-home inventories and a five-year low in U.S. foreclosures. Home construction became a leading source of economic growth after reaching a multi-year high in 2012, further enhancing confidence in the housing market. Consumer spending and personal income levels climbed, and inflation was generally mild with the exception of energy and food prices. Consumer sentiment reached its highest level in five years, although the potential U.S. tax hikes and spending cuts scheduled to take effect in 2013 dampened confidence near year-end. Nevertheless, the federal budget deficit for fiscal year 2012 fell to its lowest level since 2008. Just after year-end, Congress passed compromise legislation that preserved lower income tax rates for most U.S. households and delayed far-reaching federal spending cuts.
For the 12-month period, U.S. stocks, as measured by the S&P 500 Index, fluctuated as investors reacted to news headlines and shifted between risk taking and risk aversion. Toward period-end uncertainty eased surrounding the European fiscal crisis as leaders made progress on economic reforms and management of Greek debt, but slowing economic growth in Asia, particularly China, curbed global economic recovery and markets. In its December meeting, the Federal Open Market Committee (FOMC) announced a 6.5% unemployment target as a guide to maintaining the historically low federal funds target rate. The FOMC also said it intended to continue purchasing longer term Treas-
1. Please see Index Descriptions following the Fund Summaries.
2. © 2013 Morningstar. One cannot invest directly in an index, and an index is not representative of the Fund’s portfolio. Please see Index Descriptions following the Fund Summaries.
Fund Risks: All investments involve risks, including possible loss of principal. Stock prices fluctuate, sometimes rapidly and dramatically, due to factors affecting individual companies, particular industries or sectors, or general market conditions. The Fund may focus on particular sectors of the market from time to time, which can carry greater risks of adverse developments in such sectors. Smaller- or midsized-company securities can be particularly sensitive to changing economic conditions, and their prospects for growth are less certain than those of larger, more established companies. Investments in foreign securities may involve special risks including currency fluctuations and economic and political uncertainty. The Fund is actively managed but there is no guarantee that the manager’s investment decisions will produce the desired results. The Fund’s prospectus also includes a description of the main investment risks.
FLG-2
uries and agency mortgage-backed securities. Despite modest third-quarter U.S. company revenues suggesting a drop in global demand, a hard-fought national election and budget deadline concerns, domestic stock markets made strong gains for the year. Value stocks generally outperformed growth stocks, and all sectors generated positive returns, as represented by the S&P 500. Not all investors favored stocks, however, and many sought perceived safe havens such as gold bullion, the Japanese yen and U.S. Treasuries. By year-end, the yield on the 10-year U.S. Treasury note declined to 1.78% from 1.89% at the beginning of 2012.
Investment Strategy
We employ our long-held strategy: bottom-up, individual-company, fundamental research aimed at opportunistically finding what we believe to be outstanding large-cap companies across all sectors, at valuations we believe understate their fair worth, with future growth potential being a key driver of estimated worth. In doing so, we work hard to ensure we are being adequately compensated for the risks that are inherent to all forecasting efforts, aiming to own those stocks that make the most sense from a risk/return perspective. We believe this disciplined, bottom-up analysis of future growth potential, current valuation and other risks on a stock-by-stock basis best supports our efforts to maintain a portfolio with superior risk/return characteristics and thus affords us the best prospects for strong performance over the long term.
Manager’s Discussion
Looking back on the key factors impacting the Fund’s returns during the year under review, we would like to remind shareholders that our investment strategy is primarily bottom-up and driven by individual stock selection. However, we recognize that a sector-based discussion can be a helpful way to organize a portfolio review of key performance drivers.
From a sector perspective, our stock selection in the health care sector helped the Fund’s performance relative to the S&P 500. In particular, our positions in generic drug company Watson Pharmaceuticals, genetic analysis technologies developer Illumina3, 4 and biopharmaceutical company Gilead Sciences boosted performance. Watson Pharmaceuticals’ second- and third-quarter earnings rose largely due to its acquisition of pharmaceutical maker Actavis Group. This merger will create the third-largest generic drug maker in the world. During the period, Illumina
3. This holding is not an index component.
4. Sold by period-end.
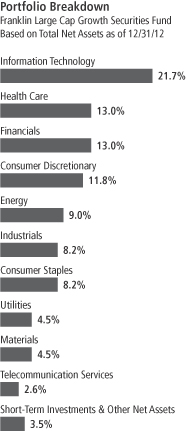
FLG-3
benefited from a number of product launches as well as Swiss pharmaceutical maker Roche Holding’s public offer to buy the company. In the case of Gilead Sciences, its antiviral products enjoyed strong sales during the period. Our stock selection and slightly overweighted position in the utilities sector also aided relative results, particularly our holding in electricity provider American Electric Power. The troubled company delivered solid performance in its second quarter driven by warmer weather and exhibited a disciplined approach to controlling costs throughout the period. Other key contributors to relative Fund returns included cable services provider Comcast, oil and gas corporation Exxon Mobil and diversified financial services firm Wells Fargo & Co.
In contrast, the Fund’s overweighted position and stock selection in the materials sector was a major detractor from returns relative to the S&P 500, particularly our positions in coal miner Walter Energy,3 technology materials producer Celanese3 and fertilizer company Potash Corporation of Saskatchewan (PotashCorp).3 Walter Energy experienced a loss during its third quarter principally because of lower pricing and softening demand for coal related to the global economic slowdown. Similarly, Celanese also reported lower earnings during the period after demand for its acetyl products declined because of weakened economic conditions in Europe and Asia. PotashCorp’s earnings declined after it suffered a large impairment charge against its investment in fertilizer company Sinofert Holdings. The Fund’s underweighted position and stock selection in the financials sector also hampered Fund performance, particularly our position in diversified financial services provider Bank of America. The company’s third-quarter earnings were negatively affected by credit spread adjustments, litigation expenses and a charge related to the repricing of tax assets. Other major detractors from relative Fund returns included computer technology corporation Dell, social networking service Facebook3, 4 and natural gas and oil producer Devon Energy.
Thank you for your participation in Franklin Large Cap Growth Securities Fund. We look forward to serving your future investment needs.
The foregoing information reflects our analysis, opinions and portfolio holdings as of December 31, 2012, the end of the reporting period. The way we implement our main investment strategies and the resulting portfolio holdings may change depending on factors such as market and economic conditions. These opinions may not be relied upon as investment advice or an offer for a particular security. The information is not a complete analysis of every aspect of any market, country, industry, security or the Fund. Statements of fact are from sources considered reliable, but the investment manager makes no representation or warranty as to their completeness or accuracy. Although historical performance is no guarantee of future results, these insights may help you understand our investment management philosophy.
Top 10 Holdings
Franklin Large Cap Growth
Securities Fund
12/31/12
| | | | |
Company
Sector/Industry | | % of Total
Net Assets | |
| Wells Fargo & Co. | | | 3.4% | |
| Financials | | | | |
| Apple Inc. | | | 3.3% | |
| Information Technology | | | | |
| Google Inc., A | | | 2.5% | |
| Information Technology | | | | |
| Anadarko Petroleum Corp. | | | 2.4% | |
| Energy | | | | |
| General Electric Co. | | | 2.3% | |
| Industrials | | | | |
| AT&T Inc. | | | 2.2% | |
| Telecommunication Services | | | | |
| The Walt Disney Co. | | | 2.1% | |
| Consumer Discretionary | | | | |
| International Business Machines Corp. | | | 2.1% | |
| Information Technology | | | | |
| JPMorgan Chase & Co. | | | 2.1% | |
| Financials | | | | |
| Express Scripts Holding Co. | | | 1.9% | |
| Health Care | | | | |
The dollar value, number of shares or principal amount, and names of all portfolio holdings are listed in the Fund’s Statement of Investments.
FLG-4
Fund Expenses
As an investor in a variable insurance contract (Contract) that indirectly provides for investment in an underlying mutual fund, you can incur transaction and/or ongoing expenses at both the Fund level and the Contract level.
| • | | Transaction expenses can include sales charges (loads) on purchases, redemption fees, surrender fees, transfer fees and premium taxes. |
| • | | Ongoing expenses can include management fees, distribution and service (12b-1) fees, contract fees, annual maintenance fees, mortality and expense risk fees and other fees and expenses. All mutual funds and Contracts have some types of ongoing expenses. |
The expenses shown in the table are meant to highlight ongoing expenses at the Fund level only and do not include ongoing expenses at the Contract level, or transaction expenses at either the Fund or Contract level. While the Fund does not have transaction expenses, if the transaction and ongoing expenses at the Contract level were included, the expenses shown would be higher. You should consult your Contract prospectus or disclosure document for more information.
The table shows Fund-level ongoing expenses and can help you understand these expenses and compare them with those of other mutual funds offered through the Contract. The table assumes a $1,000 investment held for the six months indicated. Please refer to the Fund prospectus for additional information on operating expenses.
Actual Fund Expenses
The first line (Actual) of the table provides actual account values and expenses. The “Ending Account Value” is derived from the Fund’s actual return, which includes the effect of ongoing Fund expenses, but does not include the effect of ongoing Contract expenses.
You can estimate the Fund-level expenses you incurred during the period by following these steps. Of course, your account value and expenses will differ from those in this illustration:
| 1. | Divide your account value by $1,000. |
If an account had an $8,600 value, then $8,600 ÷ $1,000 = 8.6.
| 2. | Multiply the result by the number under the heading “Fund-Level Expenses Incurred During Period.” |
If Fund-Level Expenses Incurred During Period were $7.50, then 8.6 x $7.50 = $64.50.
In this illustration, the estimated expenses incurred this period at the Fund level are $64.50.
Franklin Large Cap Growth Securities Fund Class 2
FLG-5
Hypothetical Example for Comparison with Other Mutual Funds
Information in the second line (Hypothetical) of the table can help you compare ongoing expenses of the Fund with those of other mutual funds offered through the Contract. This information may not be used to estimate the actual ending account balance or expenses you incurred during the period. The hypothetical “Ending Account Value” is based on the Fund’s actual expense ratio and an assumed 5% annual rate of return before expenses, which does not represent the Fund’s actual return. The figure under the heading “Fund-Level Expenses Incurred During Period” shows the hypothetical expenses your account would have incurred under this scenario. You can compare this figure with the 5% hypothetical examples that appear in shareholder reports of other funds offered through a Contract.
| | | | | | | | | | | | |
| Class 2 | | Beginning
Account Value 7/1/12 | | | Ending
Account
Value 12/31/12 | | | Fund-Level
Expenses Incurred
During Period*
7/1/12–12/31/12 | |
Actual | | $ | 1,000 | | | $ | 1,052.60 | | | $ | 5.47 | |
Hypothetical (5% return before expenses) | | $ | 1,000 | | | $ | 1,019.81 | | | $ | 5.38 | |
*Expenses are calculated using the most recent six-month annualized expense ratio for the Fund’s Class 2 shares (1.06%), which does not include any ongoing expenses of the Contract for which the Fund is an investment option, multiplied by the average account value over the period, multiplied by 184/366 to reflect the one-half year period.
FLG-6
Franklin Templeton Variable Insurance Products Trust
Financial Highlights
Franklin Large Cap Growth Securities Fund
| | | | | | | | | | | | | | | | | | | | |
| | | Year Ended December 31, | |
| Class 1 | | 2012 | | | 2011 | | | 2010 | | | 2009 | | | 2008 | |
| | | | |
Per share operating performance | | | | | | | | | | | | | | | | | | | | |
(for a share outstanding throughout the year) | | | | | | | | | | | | | | | | | | | | |
Net asset value, beginning of year | | $ | 14.75 | | | $ | 15.07 | | | $ | 13.62 | | | $ | 10.66 | | | $ | 17.51 | |
| | | | |
Income from investment operationsa: | | | | | | | | | | | | | | | | | | | | |
Net investment incomeb | | | 0.21 | | | | 0.15 | | | | 0.12 | | | | 0.12 | | | | 0.17 | |
Net realized and unrealized gains (losses) | | | 1.65 | | | | (0.33 | ) | | | 1.48 | | | | 3.04 | | | | (5.82 | ) |
| | | | |
Total from investment operations | | | 1.86 | | | | (0.18 | ) | | | 1.60 | | | | 3.16 | | | | (5.65 | ) |
| | | | |
Less distributions from: | | | | | | | | | | | | | | | | | | | | |
Net investment income | | | (0.18 | ) | | | (0.14 | ) | | | (0.15 | ) | | | (0.20 | ) | | | (0.24 | ) |
Net realized gains | | | — | | | | — | | | | — | | | | — | | | | (0.96 | ) |
| | | | |
Total distributions | | | (0.18 | ) | | | (0.14 | ) | | | (0.15 | ) | | | (0.20 | ) | | | (1.20 | ) |
| | | | |
Net asset value, end of year | | $ | 16.43 | | | $ | 14.75 | | | $ | 15.07 | | | $ | 13.62 | | | $ | 10.66 | |
| | | | |
| | | | | |
Total returnc | | | 12.65% | | | | (1.22)% | | | | 11.85% | | | | 30.04% | | | | (34.39)% | |
Ratios to average net assets | | | | | | | | | | | | | | | | | | | | |
Expenses | | | 0.80% | | | | 0.80% | | | | 0.79% | | | | 0.81% | d | | | 0.77% | d |
Net investment income | | | 1.31% | | | | 0.99% | | | | 0.86% | | | | 1.03% | | | | 1.19% | |
| | | | | |
Supplemental data | | | | | | | | | | | | | | | | | | | | |
Net assets, end of year (000’s) | | $ | 46,756 | | | $ | 48,666 | | | $ | 58,265 | | | $ | 58,287 | | | $ | 51,651 | |
Portfolio turnover rate | | | 33.88% | | | | 56.61% | | | | 46.75% | | | | 71.95% | | | | 66.04% | |
aThe amount shown for a share outstanding throughout the period may not correlate with the Statement of Operations for the period due to the timing of sales and repurchases of the Fund shares in relation to income earned and/or fluctuating market value of the investments of the Fund.
bBased on average daily shares outstanding.
cTotal return does not include fees, charges or expenses imposed by the variable annuity and life insurance contracts for which the Franklin Templeton Variable Insurance Products Trust serves as an underlying investment vehicle.
dBenefit of expense reduction rounds to less than 0.01%.
The accompanying notes are an integral part of these financial statements.
FLG-7
Franklin Templeton Variable Insurance Products Trust
Financial Highlights (continued)
Franklin Large Cap Growth Securities Fund
| | | | | | | | | | | | | | | | | | | | |
| | | Year Ended December 31, | |
| Class 2 | | 2012 | | | 2011 | | | 2010 | | | 2009 | | | 2008 | |
| | | | |
Per share operating performance | | | | | | | | | | | | | | | | | | | | |
(for a share outstanding throughout the year) | | | | | | | | | | | | | | | | | | | | |
Net asset value, beginning of year | | $ | 14.54 | | | $ | 14.86 | | | $ | 13.43 | | | $ | 10.50 | | | $ | 17.25 | |
| | | | |
Income from investment operationsa: | | | | | | | | | | | | | | | | | | | | |
Net investment incomeb | | | 0.17 | | | | 0.11 | | | | 0.08 | | | | 0.09 | | | | 0.13 | |
Net realized and unrealized gains (losses) | | | 1.62 | | | | (0.33 | ) | | | 1.46 | | | | 3.00 | | | | (5.73 | ) |
| | | | |
Total from investment operations | | | 1.79 | | | | (0.22 | ) | | | 1.54 | | | | 3.09 | | | | (5.60 | ) |
| | | | |
Less distributions from: | | | | | | | | | | | | | | | | | | | | |
Net investment income | | | (0.13 | ) | | | (0.10 | ) | | | (0.11 | ) | | | (0.16 | ) | | | (0.19 | ) |
Net realized gains | | | — | | | | — | | | | — | | | | — | | | | (0.96 | ) |
| | | | |
Total distributions | | | (0.13 | ) | | | (0.10 | ) | | | (0.11 | ) | | | (0.16 | ) | | | (1.15 | ) |
| | | | |
Net asset value, end of year | | $ | 16.20 | | | $ | 14.54 | | | $ | 14.86 | | | $ | 13.43 | | | $ | 10.50 | |
| | | | |
| | | | | |
Total returnc | | | 12.37% | | | | (1.51)% | | | | 11.59% | | | | 29.73% | | | | (34.53)% | |
Ratios to average net assets | | | | | | | | | | | | | | | | | | | | |
Expenses | | | 1.05% | | | | 1.05% | | | | 1.04% | | | | 1.06% | d | | | 1.02% | d |
Net investment income | | | 1.06% | | | | 0.74% | | | | 0.61% | | | | 0.78% | | | | 0.94% | |
| | | | | |
Supplemental data | | | | | | | | | | | | | | | | | | | | |
Net assets, end of year (000’s) | | $ | 278,989 | | | $ | 293,226 | | | $ | 357,405 | | | $ | 373,821 | | | $ | 328,597 | |
Portfolio turnover rate | | | 33.88% | | | | 56.61% | | | | 46.75% | | | | 71.95% | | | | 66.04% | |
aThe amount shown for a share outstanding throughout the period may not correlate with the Statement of Operations for the period due to the timing of sales and repurchases of the Fund shares in relation to income earned and/or fluctuating market value of the investments of the Fund.
bBased on average daily shares outstanding.
cTotal return does not include fees, charges or expenses imposed by the variable annuity and life insurance contracts for which the Franklin Templeton Variable Insurance Products Trust serves as an underlying investment vehicle.
dBenefit of expense reduction rounds to less than 0.01%.
The accompanying notes are an integral part of these financial statements.
FLG-8
Franklin Templeton Variable Insurance Products Trust
Statement of Investments, December 31, 2012
| | | | | | | | | | |
| Franklin Large Cap Growth Securities Fund | | Country | | Shares | | | Value | |
Common Stocks 96.5% | | | | | | | | | | |
Consumer Discretionary 11.8% | | | | | | | | | | |
aAmazon.com Inc. | | United States | | | 6,600 | | | $ | 1,657,523 | |
aBorgWarner Inc. | | United States | | | 70,900 | | | | 5,077,858 | |
Comcast Corp., A | | United States | | | 143,100 | | | | 5,349,078 | |
aDollar General Corp. | | United States | | | 42,080 | | | | 1,855,307 | |
Guess? Inc. | | United States | | | 96,000 | | | | 2,355,840 | |
Johnson Controls Inc. | | United States | | | 92,800 | | | | 2,848,960 | |
Kohl’s Corp. | | United States | | | 70,800 | | | | 3,042,984 | |
Lowe’s Cos. Inc. | | United States | | | 40,500 | | | | 1,438,560 | |
McDonald’s Corp. | | United States | | | 31,300 | | | | 2,760,973 | |
NIKE Inc., B | | United States | | | 65,800 | | | | 3,395,280 | |
Target Corp. | | United States | | | 28,300 | | | | 1,674,511 | |
The Walt Disney Co. | | United States | | | 139,800 | | | | 6,960,642 | |
| | | | | | | | | | |
| | | | | | | | | 38,417,516 | |
| | | | | | | | | | |
Consumer Staples 8.2% | | | | | | | | | | |
Altria Group Inc. | | United States | | | 57,400 | | | | 1,803,508 | |
The Coca-Cola Co. | | United States | | | 81,000 | | | | 2,936,250 | |
CVS Caremark Corp. | | United States | | | 64,500 | | | | 3,118,575 | |
Mead Johnson Nutrition Co., A | | United States | | | 27,300 | | | | 1,798,797 | |
PepsiCo Inc. | | United States | | | 79,200 | | | | 5,419,656 | |
Philip Morris International Inc. | | United States | | | 69,500 | | | | 5,812,980 | |
The Procter & Gamble Co. | | United States | | | 57,045 | | | | 3,872,785 | |
Wal-Mart Stores Inc. | | United States | | | 27,000 | | | | 1,842,210 | |
| | | | | | | | | | |
| | | | | | | | | 26,604,761 | |
| | | | | | | | | | |
Energy 9.0% | | | | | | | | | | |
Anadarko Petroleum Corp. | | United States | | | 104,250 | | | | 7,746,818 | |
aCameron International Corp. | | United States | | | 18,600 | | | | 1,050,156 | |
Chevron Corp. | | United States | | | 27,200 | | | | 2,941,408 | |
ConocoPhillips | | United States | | | 64,700 | | | | 3,751,953 | |
Devon Energy Corp. | | United States | | | 91,800 | | | | 4,777,272 | |
Exxon Mobil Corp. | | United States | | | 21,700 | | | | 1,878,135 | |
Halliburton Co. | | United States | | | 74,700 | | | | 2,591,343 | |
Occidental Petroleum Corp. | | United States | | | 10,400 | | | | 796,744 | |
Schlumberger Ltd. | | United States | | | 54,070 | | | | 3,746,510 | |
| | | | | | | | | | |
| | | | | | | | | 29,280,339 | |
| | | | | | | | | | |
Financials 13.0% | | | | | | | | | | |
American Express Co. | | United States | | | 26,400 | | | | 1,517,472 | |
Bank of America Corp. | | United States | | | 140,700 | | | | 1,632,120 | |
BlackRock Inc. | | United States | | | 12,900 | | | | 2,666,559 | |
Citigroup Inc. | | United States | | | 34,990 | | | | 1,384,204 | |
CME Group Inc. | | United States | | | 67,050 | | | | 3,400,106 | |
Comerica Inc. | | United States | | | 96,100 | | | | 2,915,674 | |
Invesco Ltd. | | United States | | | 81,300 | | | | 2,121,117 | |
JPMorgan Chase & Co. | | United States | | | 152,445 | | | | 6,703,007 | |
MetLife Inc. | | United States | | | 40,100 | | | | 1,320,894 | |
Prudential Financial Inc. | | United States | | | 35,100 | | | | 1,871,883 | |
U.S. Bancorp | | United States | | | 175,827 | | | | 5,615,914 | |
Wells Fargo & Co. | | United States | | | 328,100 | | | | 11,214,458 | |
| | | | | | | | | | |
| | | | | | | | | 42,363,408 | |
| | | | | | | | | | |
FLG-9
Franklin Templeton Variable Insurance Products Trust
Statement of Investments, December 31, 2012 (continued)
| | | | | | | | | | |
| Franklin Large Cap Growth Securities Fund | | Country | | Shares | | | Value | |
Common Stocks (continued) | | | | | | | | | | |
Health Care 13.0% | | | | | | | | | | |
Aetna Inc. | | United States | | | 112,600 | | | $ | 5,213,380 | |
aExpress Scripts Holding Co. | | United States | | | 116,600 | | | | 6,296,400 | |
aGilead Sciences Inc. | | United States | | | 38,800 | | | | 2,849,860 | |
Johnson & Johnson | | United States | | | 63,500 | | | | 4,451,350 | |
Merck & Co. Inc. | | United States | | | 147,875 | | | | 6,054,003 | |
Pfizer Inc. | | United States | | | 197,500 | | | | 4,953,300 | |
Roche Holding AG, ADR | | Switzerland | | | 100,000 | | | | 5,050,000 | |
Teva Pharmaceutical Industries Ltd., ADR | | Israel | | | 98,300 | | | | 3,670,522 | |
aWatson Pharmaceuticals Inc. | | United States | | | 46,000 | | | | 3,956,000 | |
| | | | | | | | | | |
| | | | | | | | | 42,494,815 | |
| | | | | | | | | | |
Industrials 8.2% | | | | | | | | | | |
The Boeing Co. | | United States | | | 46,400 | | | | 3,496,704 | |
Emerson Electric Co. | | United States | | | 28,600 | | | | 1,514,656 | |
FedEx Corp. | | United States | | | 65,700 | | | | 6,026,004 | |
General Electric Co. | | United States | | | 363,500 | | | | 7,629,865 | |
Honeywell International Inc. | | United States | | | 15,200 | | | | 964,744 | |
Union Pacific Corp. | | United States | | | 23,200 | | | | 2,916,704 | |
United Technologies Corp. | | United States | | | 50,100 | | | | 4,108,701 | |
| | | | | | | | | | |
| | | | | | | | | 26,657,378 | |
| | | | | | | | | | |
Information Technology 21.7% | | | | | | | | | | |
Apple Inc. | | United States | | | 20,300 | | | | 10,820,509 | |
Broadcom Corp., A | | United States | | | 38,900 | | | | 1,291,869 | |
Cisco Systems Inc. | | United States | | | 96,400 | | | | 1,894,260 | |
Corning Inc. | | United States | | | 276,600 | | | | 3,490,692 | |
Dell Inc. | | United States | | | 86,000 | | | | 871,180 | |
aElectronic Arts Inc. | | United States | | | 180,150 | | | | 2,617,580 | |
aEMC Corp. | | United States | | | 193,900 | | | | 4,905,670 | |
aGoogle Inc., A | | United States | | | 11,300 | | | | 8,015,881 | |
Hewlett-Packard Co. | | United States | | | 55,600 | | | | 792,300 | |
Intel Corp. | | United States | | | 205,600 | | | | 4,241,528 | |
International Business Machines Corp. | | United States | | | 35,000 | | | | 6,704,250 | |
MasterCard Inc., A | | United States | | | 6,330 | | | | 3,109,802 | |
Microsoft Corp. | | United States | | | 135,400 | | | | 3,619,242 | |
Oracle Corp. | | United States | | | 98,500 | | | | 3,282,020 | |
QUALCOMM Inc. | | United States | | | 94,890 | | | | 5,885,078 | |
aResearch In Motion Ltd. | | Canada | | | 90,400 | | | | 1,073,952 | |
aSemtech Corp. | | United States | | | 33,900 | | | | 981,405 | |
aVeriFone Systems Inc. | | United States | | | 49,000 | | | | 1,454,320 | |
Visa Inc., A | | United States | | | 25,700 | | | | 3,895,606 | |
Xilinx Inc. | | United States | | | 48,400 | | | | 1,737,560 | |
| | | | | | | | | | |
| | | | | | | | | 70,684,704 | |
| | | | | | | | | | |
Materials 4.5% | | | | | | | | | | |
Celanese Corp., A | | United States | | | 52,600 | | | | 2,342,278 | |
E. I. du Pont de Nemours and Co. | | United States | | | 48,600 | | | | 2,185,542 | |
LyondellBasell Industries NV, A | | United States | | | 39,190 | | | | 2,237,357 | |
Potash Corp. of Saskatchewan Inc. | | Canada | | | 70,900 | | | | 2,889,536 | |
Randgold Resources Ltd., ADR | | United Kingdom | | | 14,200 | | | | 1,409,350 | |
Walter Energy Inc. | | United States | | | 97,375 | | | | 3,493,815 | |
| | | | | | | | | | |
| | | | | | | | | 14,557,878 | |
| | | | | | | | | | |
FLG-10
Franklin Templeton Variable Insurance Products Trust
Statement of Investments, December 31, 2012 (continued)
| | | | | | | | | | |
| Franklin Large Cap Growth Securities Fund | | Country | | Shares | | | Value | |
Common Stocks (continued) | | | | | | | | | | |
Telecommunication Services 2.6% | | | | | | | | | | |
AT&T Inc. | | United States | | | 211,362 | | | $ | 7,125,013 | |
Vodafone Group PLC, ADR | | United Kingdom | | | 50,500 | | | | 1,272,095 | |
| | | | | | | | | | |
| | | | | | | | | 8,397,108 | |
| | | | | | | | | | |
Utilities 4.5% | | | | | | | | | | |
American Electric Power Co. Inc. | | United States | | | 38,400 | | | | 1,638,912 | |
Exelon Corp. | | United States | | | 73,600 | | | | 2,188,864 | |
FirstEnergy Corp. | | United States | | | 44,000 | | | | 1,837,440 | |
MDU Resources Group Inc. | | United States | | | 47,600 | | | | 1,011,024 | |
PG&E Corp. | | United States | | | 111,550 | | | | 4,482,079 | |
Sempra Energy | | United States | | | 29,400 | | | | 2,085,636 | |
The Southern Co. | | United States | | | 36,400 | | | | 1,558,284 | |
| | | | | | | | | | |
| | | | | | | | | 14,802,239 | |
| | | | | | | | | | |
Total Common Stocks (Cost $221,152,571) | | | | | | | | | 314,260,146 | |
| | | | | | | | | | |
| | | |
| | | | | Principal
Amount | | | | |
Short Term Investments (Cost $10,945,794) 3.3% | | | | | | | | | | |
Repurchase Agreements 3.3% | | | | | | | | | | |
bJoint Repurchase Agreement, 0.154%, 1/02/13 (Maturity Value $10,945,888) | | United States | | $ | 10,945,794 | | | | 10,945,794 | |
BNP Paribas Securities Corp. (Maturity Value $1,424,936) | | | | | | | | | | |
Credit Suisse Securities (USA) LLC (Maturity Value $1,781,224) | | | | | | | | | | |
Deutsche Bank Securities Inc. (Maturity Value $1,149,318) | | | | | | | | | | |
HSBC Securities (USA) Inc. (Maturity Value $3,206,160) | | | | | | | | | | |
Merrill Lynch, Pierce, Fenner & Smith Inc. (Maturity Value $1,424,936) | | | | | | | | | | |
Morgan Stanley & Co. LLC (Maturity Value $534,378) | | | | | | | | | | |
UBS Securities LLC (Maturity Value $1,424,936) | | | | | | | | | | |
Collateralized by U.S. Government Agency Securities, 0.00% - 6.21%, 1/15/13 - 1/22/37; U.S. Treasury Bonds, 11.25%, 2/15/15; and U.S. Treasury Notes, 0.25% - 2.00%, 11/30/13 - 9/15/15 (valued at $11,165,952) | | | | | | | | | | |
| | | | | | | | | | |
Total Investments (Cost $232,098,365) 99.8% | | | | | | | | | 325,205,940 | |
Other Assets, less Liabilities 0.2% | | | | | | | | | 539,304 | |
| | | | | | | | | | |
Net Assets 100.0% | | | | | | | | $ | 325,745,244 | |
| | | | | | | | | | |
See Abbreviations on page FLG-21.
aNon-income producing.
bSee Note 1(c) regarding joint repurchase agreement.
The accompanying notes are an integral part of these financial statements.
FLG-11
Franklin Templeton Variable Insurance Products Trust
Financial Statements
Statement of Assets and Liabilities
December 31, 2012
| | | | |
| | | Franklin Large
Cap Growth
Securities Fund | |
Assets: | | | | |
Investments in securities: | | | | |
Cost - Unaffiliated issuers | | $ | 221,152,571 | |
Cost - Repurchase agreements | | | 10,945,794 | |
| | | | |
Total cost of investments | | $ | 232,098,365 | |
| | | | |
Value - Unaffiliated issuers | | $ | 314,260,146 | |
Value - Repurchase agreements | | | 10,945,794 | |
| | | | |
Total value of investments | | | 325,205,940 | |
Receivables: | | | | |
Capital shares sold | | | 1,058,548 | |
Dividends | | | 457,220 | |
| | | | |
Total assets | | | 326,721,708 | |
| | | | |
Liabilities: | | | | |
Payables: | | | | |
Capital shares redeemed | | | 512,770 | |
Affiliates | | | 323,904 | |
Reports to shareholders | | | 94,049 | |
Accrued expenses and other liabilities | | | 45,741 | |
| | | | |
Total liabilities | | | 976,464 | |
| | | | |
Net assets, at value | | $ | 325,745,244 | |
| | | | |
Net assets consist of: | | | | |
Paid-in capital | | $ | 294,027,285 | |
Undistributed net investment income | | | 3,765,630 | |
Net unrealized appreciation (depreciation) | | | 93,107,575 | |
Accumulated net realized gain (loss) | | | (65,155,246 | ) |
| | | | |
Net assets, at value | | $ | 325,745,244 | |
| | | | |
Class 1: | | | | |
Net assets, at value | | $ | 46,756,112 | |
| | | | |
Shares outstanding | | | 2,845,390 | |
| | | | |
Net asset value and maximum offering price per share | | $ | 16.43 | |
| | | | |
Class 2: | | | | |
Net assets, at value | | $ | 278,989,132 | |
| | | | |
Shares outstanding | | | 17,216,550 | |
| | | | |
Net asset value and maximum offering price per share | | $ | 16.20 | |
| | | | |
The accompanying notes are an integral part of these financial statements.
FLG-12
Franklin Templeton Variable Insurance Products Trust
Financial Statements (continued)
Statement of Operations
for the year ended December 31, 2012
| | | | |
| | | Franklin Large
Cap Growth
Securities Fund | |
Investment income: | | | | |
Dividends | | $ | 7,253,211 | |
Interest | | | 18,022 | |
| | | | |
Total investment income | | | 7,271,233 | |
| | | | |
Expenses: | | | | |
Management fees (Note 3a) | | | 2,586,231 | |
Distribution fees - Class 2 (Note 3c) | | | 737,882 | |
Unaffiliated transfer agent fees | | | 185 | |
Custodian fees (Note 4) | | | 7,856 | |
Reports to shareholders | | | 110,087 | |
Professional fees | | | 39,440 | |
Trustees’ fees and expenses | | | 1,384 | |
Other | | | 16,844 | |
| | | | |
Total expenses | | | 3,499,909 | |
| | | | |
Net investment income | | | 3,771,324 | |
| | | | |
Realized and unrealized gains (losses): | | | | |
Net realized gain (loss) from: | | | | |
Investments | | | 26,406,862 | |
Foreign currency transactions | | | (4,018 | ) |
| | | | |
Net realized gain (loss) | | | 26,402,844 | |
| | | | |
Net change in unrealized appreciation (depreciation) on investments | | | 10,750,316 | |
| | | | |
Net realized and unrealized gain (loss) | | | 37,153,160 | |
| | | | |
Net increase (decrease) in net assets resulting from operations | | $ | 40,924,484 | |
| | | | |
The accompanying notes are an integral part of these financial statements.
FLG-13
Franklin Templeton Variable Insurance Products Trust
Financial Statements (continued)
Statements of Changes in Net Assets
| | | | | | | | |
| | | Franklin Large Cap Growth
Securities Fund | |
| | | Year Ended December 31, | |
| | | 2012 | | | 2011 | |
| | | | |
Increase (decrease) in net assets: | | | | | | | | |
Operations: | | | | | | | | |
Net investment income | | $ | 3,771,324 | | | $ | 2,937,400 | |
Net realized gain (loss) from investments and foreign currency transactions | | | 26,402,844 | | | | 20,697,833 | |
Net change in unrealized appreciation (depreciation) on investments | | | 10,750,316 | | | | (28,917,851 | ) |
| | | | |
Net increase (decrease) in net assets resulting from operations | | | 40,924,484 | | | | (5,282,618 | ) |
| | | | |
Distributions to shareholders from: | | | | | | | | |
Net investment income: | | | | | | | | |
Class 1 | | | (544,179 | ) | | | (492,852 | ) |
Class 2 | | | (2,394,442 | ) | | | (2,152,135 | ) |
| | | | |
Total distributions to shareholders | | | (2,938,621 | ) | | | (2,644,987 | ) |
| | | | |
Capital share transactions: (Note 2) | | | | | | | | |
Class 1 | | | (7,366,150 | ) | | | (8,419,530 | ) |
Class 2 | | | (46,766,651 | ) | | | (57,429,668 | ) |
Class 4 | | | — | | | | (4,876 | ) |
| | | | |
Total capital share transactions | | | (54,132,801 | ) | | | (65,854,074 | ) |
| | | | |
Net increase (decrease) in net assets | | | (16,146,938 | ) | | | (73,781,679 | ) |
Net assets: | | | | | | | | |
Beginning of year | | | 341,892,182 | | | | 415,673,861 | |
| | | | |
End of year | | $ | 325,745,244 | | | $ | 341,892,182 | |
| | | | |
Undistributed net investment income included in net assets: | | | | | | | | |
End of year | | $ | 3,765,630 | | | $ | 2,936,945 | |
| | | | |
The accompanying notes are an integral part of these financial statements.
FLG-14
Franklin Templeton Variable Insurance Products Trust
Notes to Financial Statements
Franklin Large Cap Growth Securities Fund
1. ORGANIZATION AND SIGNIFICANT ACCOUNTING POLICIES
Franklin Templeton Variable Insurance Products Trust (Trust) is registered under the Investment Company Act of 1940, as amended, (1940 Act) as an open-end investment company, consisting of twenty separate funds. The Franklin Large Cap Growth Securities Fund (Fund) is included in this report. The financial statements of the remaining funds in the Trust are presented separately. Shares of the Fund are generally sold only to insurance company separate accounts to fund the benefits of variable life insurance policies or variable annuity contracts. At December 31, 2012, 41.39% of the Fund’s shares were held through one insurance company. Investment activities of these insurance company separate accounts could have a material impact on the Fund. The Fund offers two classes of shares: Class 1 and Class 2. Each class of shares differs by its distribution fees, voting rights on matters affecting a single class and its exchange privilege.
The following summarizes the Fund’s significant accounting policies.
a. Financial Instrument Valuation
The Fund’s investments in financial instruments are carried at fair value daily. Fair value is the price that would be received to sell an asset or paid to transfer a liability in an orderly transaction between market participants on the measurement date. Under procedures approved by the Trust’s Board of Trustees (the Board), the Fund’s administrator, investment manager and other affiliates have formed the Valuation and Liquidity Oversight Committee (VLOC). The VLOC provides administration and oversight of the Fund’s valuation policies and procedures, which are approved annually by the Board. Among other things, these procedures allow the Fund to utilize independent pricing services, quotations from securities and financial instrument dealers, and other market sources to determine fair value.
Equity securities listed on an exchange or on the NASDAQ National Market System are valued at the last quoted sale price or the official closing price of the day, respectively. Foreign equity securities are valued as of the close of trading on the foreign stock exchange on which the security is primarily traded, or the NYSE, whichever is earlier. The value is then converted into its U.S. dollar equivalent at the foreign exchange rate in effect at the close of the NYSE on the day that the value of the security is determined. Over-the-counter (OTC) securities are valued within the range of the most recent quoted bid and ask prices. Securities that trade in multiple markets or on multiple exchanges are valued according to the broadest and most representative market. Certain equity securities are valued based upon fundamental characteristics or relationships to similar securities. Repurchase agreements are valued at cost, which approximates market value.
The Fund has procedures to determine the fair value of financial instruments for which market prices are not reliable or readily available. Under these procedures, the VLOC convenes on a regular basis to review such financial instruments and considers a number of factors, including significant unobservable valuation inputs, when arriving at fair value. The VLOC primarily employs a market-based approach which may use related or comparable assets or liabilities, recent transactions, market multiples, book values, and other relevant information for the investment to determine the fair value of the investment. An income-based valuation approach may also be used in which the anticipated future cash flows of the investment are discounted to calculate fair value. Discounts may also be applied due to the nature or duration of any restrictions on the disposition of the investments. Due to the inherent uncertainty of valuations of such investments, the fair values may differ significantly from the values that would have been used had an active market existed. The VLOC employs various methods for calibrating these valuation approaches including a regular review of key inputs and assumptions, transactional back-testing or disposition analysis, and reviews of any related market activity.
Trading in securities on foreign securities stock exchanges and OTC markets may be completed before the daily close of business on the NYSE. Occasionally, events occur between the time at which trading in a foreign security is completed and the close of the NYSE that might call into question the reliability of the value of a portfolio security held by the Fund. As a result, differences may arise between the value of the Fund’s portfolio securities as determined at the foreign market close and the latest indications of value at the close of the NYSE. In order to minimize the potential for these differences, the VLOC monitors price movements following the close of trading in foreign stock markets through a series of country specific market proxies (such as baskets of
FLG-15
Franklin Templeton Variable Insurance Products Trust
Notes to Financial Statements (continued)
Franklin Large Cap Growth Securities Fund
1. ORGANIZATION AND SIGNIFICANT ACCOUNTING POLICIES (continued)
a. Financial Instrument Valuation (continued)
American Depositary Receipts, futures contracts and exchange traded funds). These price movements are measured against established trigger thresholds for each specific market proxy to assist in determining if an event has occurred that may call into question the reliability of the values of the foreign securities held by the Fund. If such an event occurs, the securities may be valued using fair value procedures, which may include the use of independent pricing services.
b. Foreign Currency Translation
Portfolio securities and other assets and liabilities denominated in foreign currencies are translated into U.S. dollars based on the exchange rate of such currencies against U.S. dollars on the date of valuation. The Fund may enter into foreign currency exchange contracts to facilitate transactions denominated in a foreign currency. Purchases and sales of securities, income and expense items denominated in foreign currencies are translated into U.S. dollars at the exchange rate in effect on the transaction date. Portfolio securities and assets and liabilities denominated in foreign currencies contain risks that those currencies will decline in value relative to the U.S. dollar. Occasionally, events may impact the availability or reliability of foreign exchange rates used to convert the U.S. dollar equivalent value. If such an event occurs, the foreign exchange rate will be valued at fair value using procedures established and approved by the Board.
The Fund does not separately report the effect of changes in foreign exchange rates from changes in market prices on securities held. Such changes are included in net realized and unrealized gain or loss from investments on the Statement of Operations.
Realized foreign exchange gains or losses arise from sales of foreign currencies, currency gains or losses realized between the trade and settlement dates on securities transactions and the difference between the recorded amounts of dividends, interest, and foreign withholding taxes and the U.S. dollar equivalent of the amounts actually received or paid. Net unrealized foreign exchange gains and losses arise from changes in foreign exchange rates on foreign denominated assets and liabilities other than investments in securities held at the end of the reporting period.
c. Joint Repurchase Agreement
The Fund enters into a joint repurchase agreement whereby its uninvested cash balance is deposited into a joint cash account with other funds managed by the investment manager or an affiliate of the investment manager and is used to invest in one or more repurchase agreements. The value and face amount of the joint repurchase agreement are allocated to the funds based on their pro-rata interest. A repurchase agreement is accounted for as a loan by the fund to the seller, collateralized by securities which are delivered to the fund’s custodian. The market value, including accrued interest, of the initial collateralization is required to be at least 102% of the dollar amount invested by the funds, with the value of the underlying securities marked to market daily to maintain coverage of at least 100%. The joint repurchase agreement held by the Fund at year end had been entered into on December 31, 2012.
d. Income and Deferred Taxes
It is the Fund’s policy to qualify as a regulated investment company under the Internal Revenue Code. The Fund intends to distribute to shareholders substantially all of its taxable income and net realized gains to relieve it from federal income and if applicable, excise taxes. As a result, no provision for U.S. federal income taxes is required.
The Fund may be subject to foreign taxation related to income received, capital gains on the sale of securities and certain foreign currency transactions in the foreign jurisdictions in which it invests. Foreign taxes, if any, are recorded based on the tax regulations and rates that exist in the foreign markets in which the Fund invests. When a capital gain tax is determined to apply the Fund records an estimated deferred tax liability in an amount that would be payable if the securities were disposed of on the valuation date.
FLG-16
Franklin Templeton Variable Insurance Products Trust
Notes to Financial Statements (continued)
Franklin Large Cap Growth Securities Fund
1. ORGANIZATION AND SIGNIFICANT ACCOUNTING POLICIES (continued)
d. Income and Deferred Taxes (continued)
The Fund recognizes the tax benefits of uncertain tax positions only when the position is “more likely than not” to be sustained upon examination by the tax authorities based on the technical merits of the tax position. As of December 31, 2012, and for all open tax years, the Fund has determined that no liability for unrecognized tax benefits is required in the Fund’s financial statements related to uncertain tax positions taken on a tax return (or expected to be taken on future tax returns). Open tax years are those that remain subject to examination and are based on each tax jurisdiction statute of limitation.
e. Security Transactions, Investment Income, Expenses and Distributions
Security transactions are accounted for on trade date. Realized gains and losses on security transactions are determined on a specific identification basis. Interest income and estimated expenses are accrued daily. Dividend income is recorded on the ex-dividend date except that certain dividends from foreign securities are recognized as soon as the Fund is notified of the ex-dividend date. Distributions to shareholders are recorded on the ex-dividend date and are determined according to income tax regulations (tax basis). Distributable earnings determined on a tax basis may differ from earnings recorded in accordance with accounting principles generally accepted in the United States of America. These differences may be permanent or temporary. Permanent differences are reclassified among capital accounts to reflect their tax character. These reclassifications have no impact on net assets or the results of operations. Temporary differences are not reclassified, as they may reverse in subsequent periods.
Common expenses incurred by the Trust are allocated among the funds based on the ratio of net assets of each fund to the combined net assets of the Trust. Fund specific expenses are charged directly to the fund that incurred the expense.
Realized and unrealized gains and losses and net investment income, not including class specific expenses, are allocated daily to each class of shares based upon the relative proportion of net assets of each class. Differences in per share distributions, by class, are generally due to differences in class specific expenses.
f. Accounting Estimates
The preparation of financial statements in accordance with accounting principles generally accepted in the United States of America requires management to make estimates and assumptions that affect the reported amounts of assets and liabilities at the date of the financial statements and the amounts of income and expenses during the reporting period. Actual results could differ from those estimates.
g. Guarantees and Indemnifications
Under the Trust’s organizational documents, its officers and trustees are indemnified by the Trust against certain liabilities arising out of the performance of their duties to the Trust. Additionally, in the normal course of business, the Trust, on behalf of the Fund, enters into contracts with service providers that contain general indemnification clauses. The Trust’s maximum exposure under these arrangements is unknown as this would involve future claims that may be made against the Trust that have not yet occurred. Currently, the Trust expects the risk of loss to be remote.
FLG-17
Franklin Templeton Variable Insurance Products Trust
Notes to Financial Statements (continued)
Franklin Large Cap Growth Securities Fund
2. SHARES OF BENEFICIAL INTEREST
At December 31, 2012, there were an unlimited number of shares authorized (without par value). Transactions in the Fund’s shares were as follows:
| | | | | | | | | | | | | | | | |
| | | Year Ended December 31, | |
| | | 2012 | | | 2011 a | |
| Class 1 Shares: | | Shares | | | Amount | | | Shares | | | Amount | |
Shares sold | | | 9,386 | | | $ | 151,925 | | | | 99,760 | | | $ | 1,555,529 | |
Shares issued in reinvestment of distributions | | | 35,290 | | | | 544,179 | | | | 33,122 | | | | 492,852 | |
Shares redeemed | | | (499,073 | ) | | | (8,062,254 | ) | | | (698,667 | ) | | | (10,467,911 | ) |
| | | | |
Net increase (decrease) | | | (454,397 | ) | | $ | (7,366,150 | ) | | | (565,785 | ) | | $ | (8,419,530 | ) |
| | | | |
Class 2 Shares: | | | | | | | | | | | | | | | | |
Shares sold | | | 1,271,914 | | | $ | 20,054,584 | | | | 983,185 | | | $ | 14,361,125 | |
Shares issued in reinvestment of distributions | | | 157,219 | | | | 2,394,442 | | | | 146,503 | | | | 2,152,135 | |
Shares redeemed | | | (4,380,008 | ) | | | (69,215,677 | ) | | | (5,015,686 | ) | | | (73,942,928 | ) |
| | | | |
Net increase (decrease) | | | (2,950,875 | ) | | $ | (46,766,651 | ) | | | (3,885,998 | ) | | $ | (57,429,668 | ) |
| | | | |
Class 4 Shares: | | | | | | | | | | | | | | | | |
Shares redeemed | | | | | | | | | | | (312 | ) | | $ | (4,876 | ) |
| | | | | | | | | | |
Net increase (decrease) | | | | | | | | | | | (312 | ) | | $ | (4,876 | ) |
| | | | | | | | | | |
| aEffective | March 4, 2011, Class 4 was liquidated. |
3. TRANSACTIONS WITH AFFILIATES
Franklin Resources, Inc. is the holding company for various subsidiaries that together are referred to as Franklin Templeton Investments. Certain officers and trustees of the Fund are also officers and/or directors of the following subsidiaries:
| | |
| Subsidiary | | Affiliation |
Franklin Advisers, Inc. (Advisers) | | Investment manager |
Franklin Templeton Services, LLC (FT Services) | | Administrative manager |
Franklin Templeton Distributors, Inc. (Distributors) | | Principal underwriter |
Franklin Templeton Investor Services, LLC (Investor Services) | | Transfer agent |
a. Management Fees
The Fund pays an investment management fee to Advisers based on the average daily net assets of the Fund as follows:
| | |
| Annualized Fee Rate | | Net Assets |
| 0.750% | | Up to and including $500 million |
| 0.625% | | Over $500 million, up to and including $1 billion |
| 0.500% | | In excess of $1 billion |
b. Administrative Fees
FT Services, under terms of an agreement, provides administrative services to the Fund and is not paid by the Fund for the services.
FLG-18
Franklin Templeton Variable Insurance Products Trust
Notes to Financial Statements (continued)
Franklin Large Cap Growth Securities Fund
3. TRANSACTIONS WITH AFFILIATES (continued)
c. Distribution Fees
The Board has adopted a distribution plan for Class 2 shares pursuant to Rule 12b-1 under the 1940 Act. Under the Fund’s compensation distribution plan, the Fund pays Distributors for costs incurred in connection with the servicing, sale and distribution of the Fund’s shares up to 0.35% per year of its average daily net assets. Some distribution fees are not charged on shares held by affiliates. The Board has agreed to limit the current rate to 0.25% per year for Class 2.
d. Transfer Agent Fees
Investor Services, under terms of an agreement, performs shareholder servicing for the Fund and is not paid by the Fund for the services.
4. EXPENSE OFFSET ARRANGEMENT
The Fund has entered into an arrangement with its custodian whereby credits realized as a result of uninvested cash balances are used to reduce a portion of the Fund’s custodian expenses. During the year ended December 31, 2012, there were no credits earned.
5. INCOME TAXES
For tax purposes, capital losses may be carried over to offset future capital gains, if any. Capital loss carryforwards with no expiration, if any, must be fully utilized before those losses with expiration dates.
At December 31, 2012, the Fund had capital loss carryforwards of $58,674,865 expiring in 2017. During the year ended December 31, 2012, the Fund utilized $25,852,521 of capital loss carryforwards.
The tax character of distributions paid during the years ended December 31, 2012 and 2011, was as follows:
| | | | | | | | |
| | | 2012 | | | 2011 | |
Distributions paid from ordinary income | | $ | 2,938,621 | | | $ | 2,644,987 | |
| | | | |
At December 31, 2012, the cost of investments, net unrealized appreciation (depreciation) and undistributed ordinary income for income tax purposes were as follows:
| | | | |
Cost of investments | | $ | 238,526,901 | |
| | | | |
| |
Unrealized appreciation | | $ | 94,417,026 | |
Unrealized depreciation | | | (7,737,987 | ) |
| | | | |
Net unrealized appreciation (depreciation) | | $ | 86,679,039 | |
| | | | |
Distributable earnings – undistributed ordinary income | | $ | 3,713,790 | |
| | | | |
Differences between income and/or capital gains as determined on a book basis and a tax basis are primarily due to differing treatment of wash sales.
6. INVESTMENT TRANSACTIONS
Purchases and sales of investments (excluding short term securities) for the year ended December 31, 2012, aggregated $112,447,119 and $168,936,325, respectively.
FLG-19
Franklin Templeton Variable Insurance Products Trust
Notes to Financial Statements (continued)
Franklin Large Cap Growth Securities Fund
7. CREDIT FACILITY
The Fund, together with other U.S. registered and foreign investment funds (collectively, Borrowers), managed by Franklin Templeton Investments, are borrowers in a joint syndicated senior unsecured credit facility totaling $1.5 billion (Global Credit Facility) which matured on January 18, 2013. This Global Credit Facility provides a source of funds to the Borrowers for temporary and emergency purposes, including the ability to meet future unanticipated or unusually large redemption requests. Effective January 18, 2013, the Borrowers renewed the Global Credit Facility, which matures on January 17, 2014.
Under the terms of the Global Credit Facility, the Fund shall, in addition to interest charged on any borrowings made by the Fund and other costs incurred by the Fund, pay its share of fees and expenses incurred in connection with the implementation and maintenance of the Global Credit Facility, based upon its relative share of the aggregate net assets of all of the Borrowers, including an annual commitment fee of 0.07% based upon the unused portion of the Global Credit Facility. These fees are reflected in other expenses on the Statement of Operations. During the year ended December 31, 2012, the Fund did not use the Global Credit Facility.
8. FAIR VALUE MEASUREMENTS
The Fund follows a fair value hierarchy that distinguishes between market data obtained from independent sources (observable inputs) and the Fund’s own market assumptions (unobservable inputs). These inputs are used in determining the value of the Fund’s financial instruments and are summarized in the following fair value hierarchy:
| | • | | Level 1 – quoted prices in active markets for identical financial instruments |
| | • | | Level 2 – other significant observable inputs (including quoted prices for similar financial instruments, interest rates, prepayment speed, credit risk, etc.) |
| | • | | Level 3 – significant unobservable inputs (including the Fund’s own assumptions in determining the fair value of financial instruments) |
The inputs or methodology used for valuing financial instruments are not an indication of the risk associated with investing in those financial instruments.
For movements between the levels within the fair value hierarchy, the Fund has adopted a policy of recognizing the transfers as of the date of the underlying event which caused the movement.
A summary of inputs used as of December 31, 2012, in valuing the Fund’s assets carried at fair value, is as follows:
| | | | | | | | | | | | | | | | |
| | | Level 1 | | | Level 2 | | | Level 3 | | | Total | |
| | | | |
Assets: | | | | | | | | | | | | | | | | |
Investments in Securities: | | | | | | | | | | | | | | | | |
Equity Investmentsa | | $ | 314,260,146 | | | $ | — | | | $ | — | | | $ | 314,260,146 | |
Short Term Investments | | | — | | | | 10,945,794 | | | | — | | | | 10,945,794 | |
| | | | |
Total Investments in Securities | | $ | 314,260,146 | | | $ | 10,945,794 | | | $ | — | | | $ | 325,205,940 | |
| | | | |
aFor detailed categories, see the accompanying Statement of Investments.
9. NEW ACCOUNTING PRONOUNCEMENTS
In December 2011, the Financial Accounting Standards Board (FASB) issued Accounting Standards Update (ASU) No. 2011-11, Balance Sheet (Topic 210): Disclosures about Offsetting Assets and Liabilities. The amendments in the ASU enhance disclosures about offsetting of financial assets and liabilities to enable investors to understand the effect of these arrangements on a fund’s
FLG-20
Franklin Templeton Variable Insurance Products Trust
Notes to Financial Statements (continued)
Franklin Large Cap Growth Securities Fund
9. NEW ACCOUNTING PRONOUNCEMENTS (continued)
financial position. In January 2013, FASB issued ASU No. 2013-01, Balance Sheet (Topic 210): Clarifying the Scope of Disclosures about Offsetting Assets and Liabilities. The amendments in ASU No. 2013-01 clarify the intended scope of disclosures required by ASU No. 2011-11. These ASUs are effective for interim and annual reporting periods beginning on or after January 1, 2013. The Fund believes the adoption of these ASUs will not have a material impact on its financial statements.
10. SUBSEQUENT EVENTS
The Fund has evaluated subsequent events through the issuance of the financial statements and determined that no events have occurred that require disclosure other than those already disclosed in the financial statements.
| | | | |
ABBREVIATIONS | | | | |
| Selected Portfolio | | | | |
| | | | |
| ADR - American Depositary Receipt | | | | |
FLG-21
Franklin Templeton Variable Insurance Products Trust
Franklin Large Cap Growth Securities Fund
Report of Independent Registered Public Accounting Firm
To the Board of Trustees and Shareholders of
Franklin Templeton Variable Insurance Products Trust
In our opinion, the accompanying statement of assets and liabilities, including the statement of investments, and the related statements of operations and of changes in net assets and the financial highlights present fairly, in all material respects, the financial position of Franklin Large Cap Growth Securities Fund (the “Fund”) at December 31, 2012, the results of its operations for the year then ended, the changes in its net assets for each of the two years in the period then ended and the financial highlights for each of the five years in the period then ended, in conformity with accounting principles generally accepted in the United States of America. These financial statements and financial highlights (hereafter referred to as “financial statements”) are the responsibility of the Fund’s management. Our responsibility is to express an opinion on these financial statements based on our audits. We conducted our audits of these financial statements in accordance with the standards of the Public Company Accounting Oversight Board (United States). Those standards require that we plan and perform the audit to obtain reasonable assurance about whether the financial statements are free of material misstatement. An audit includes examining, on a test basis, evidence supporting the amounts and disclosures in the financial statements, assessing the accounting principles used and significant estimates made by management, and evaluating the overall financial statement presentation. We believe that our audits, which included confirmation of securities at December 31, 2012 by correspondence with the custodian and brokers, provide a reasonable basis for our opinion.
PricewaterhouseCoopers LLP
San Francisco, California
February 15, 2013
FLG-22
Franklin Templeton Variable Insurance Products Trust
Tax Information (unaudited)
Franklin Large Cap Growth Securities Fund
Under Section 854(b)(1)(A) of the Internal Revenue Code (Code), the Fund hereby reports 100% of the ordinary income dividends as income qualifying for the dividends received deduction for the fiscal year ended December 31, 2012.
FLG-23
FRANKLIN LARGE CAP VALUE SECURITIES FUND
This annual report for Franklin Large Cap Value Securities Fund covers the fiscal year ended December 31, 2012.
Performance Summary as of 12/31/12
Average annual total return of Class 2 shares* represents the average annual change in value, assuming reinvestment of dividends and capital gains. Average returns smooth out variations in returns, which can be significant; they are not the same as year-by-year results.
Periods ended 12/31/12
| | | | | | | | | | | | |
| | | 1-Year | | | 5-Year | | | Since Inception
(3/1/05) | |
Average Annual Total Return | | | +14.44% | | | | +0.36% | | | | +2.68% | |
*The investment manager and administrator have contractually agreed to waive or assume certain expenses so that common expenses of the Fund (excluding Rule 12b-1 fees and acquired fund fees and other expenses) do not exceed 0.65% (other than certain nonroutine expenses) until 4/30/13. Fund investment results reflect the expense reduction, without which the results would have been lower.
Total Return Index Comparison for a Hypothetical $10,000 Investment (3/1/05–12/31/12)
The graph below shows the change in value of a hypothetical $10,000 investment in the Fund over the indicated period and includes reinvestment of any income or distributions. The Fund’s performance* is compared to the performance of the Russell 1000® Value Index. One cannot invest directly in an index, and an index is not representative of the Fund’s portfolio. Please see Important Notes to Performance Information preceding the Fund Summaries.
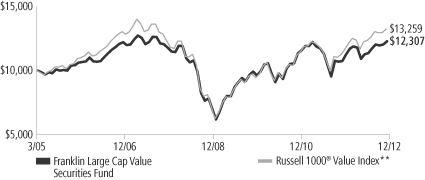
**Source: © 2013 Morningstar. Please see Index Descriptions following the Fund Summaries.
Franklin Large Cap Value Securities Fund – Class 2
Performance reflects the Fund’s Class 2 operating expenses, but does not include any contract fees, expenses or sales charges. If they had been included, performance would be lower. These charges and deductions, particularly for variable life policies, can have a significant effect on contract values and insurance benefits. See the contract prospectus for a complete description of these expenses, including sales charges.
Performance data represent past performance, which does not guarantee future results. Investment return and principal value will fluctuate, and you may have a gain or loss when you sell your shares.
Current performance may differ from figures shown.
FLV-1
Fund Goal and Main Investments: Franklin Large Cap Value Securities Fund seeks long-term capital appreciation. Under normal market conditions, the Fund invests at least 80% of its net assets in investments of large capitalization companies, focusing on those the investment manager believes to be undervalued. For this Fund, large capitalization companies are those that are similar in size to those in the Russell 1000® Index at the time of purchase.1
Performance Overview
You can find the Fund’s one-year total return in the Performance Summary. The Fund underperformed its benchmark, the Russell 1000® Value Index, which rose 17.51% for the same period.2 Please note that the Fund employs a bottom-up stock selection process, and the managers invest in securities without regard to benchmark comparisons.
Economic and Market Overview
The U.S. economy, as measured by gross domestic product, grew moderately in 2012, supported by positive construction, housing and labor market trends. U.S. home prices increased in most regions due to higher demand based on near to record-low mortgage rates, affordable housing prices, low new-home inventories and a five-year low in U.S. foreclosures. Home construction became a leading source of economic growth after reaching a multi-year high in 2012, further enhancing confidence in the housing market. Consumer spending and personal income levels climbed, and inflation was generally mild with the exception of energy and food prices. Consumer sentiment reached its highest level in five years, although the potential U.S. tax hikes and spending cuts scheduled to take effect in 2013 dampened confidence near year-end. Nevertheless, the federal budget deficit for fiscal year 2012 fell to its lowest level since 2008. Just after year-end, Congress passed compromise legislation that preserved lower income tax rates for most U.S. households and delayed far-reaching federal spending cuts.
For the 12-month period, U.S. stocks, as measured by the Standard & Poor’s® 500 Index (S&P 500®), fluctuated as investors reacted to news headlines and shifted between risk taking and risk aversion.1 Toward period-end uncertainty eased surrounding the European fiscal crisis as leaders made progress on economic reforms and management of Greek
1. Please see Index Descriptions following the Fund Summaries.
2. Source: © 2013 Morningstar. One cannot invest directly in an index, and an index is not representative of the Fund’s portfolio. Please see Index Descriptions following the Fund Summaries.
Fund Risks: All investments involve risks, including possible loss of principal. Stock prices fluctuate, sometimes rapidly and dramatically, due to factors affecting individual companies, particular industries or sectors, or general market conditions. The Fund is actively managed but there is no guarantee that the manager’s investment decisions will produce the desired results. The Fund’s prospectus also includes a description of the main investment risks.
FLV-2
debt, but slowing economic growth in Asia, particularly China, curbed global economic recovery and markets. In its December meeting, the Federal Open Market Committee (FOMC) announced a 6.5% unemployment target as a guide to maintaining the historically low federal funds target rate. The FOMC also said it intended to continue purchasing longer term Treasuries and agency mortgage-backed securities. Despite modest third-quarter U.S. company revenues suggesting a drop in global demand, a hard-fought national election and budget deadline concerns, domestic stock markets made strong gains for the year. Value stocks generally outperformed growth stocks, and all sectors generated positive returns, as represented by the S&P 500. Not all investors favored stocks, however, and many sought perceived safe havens such as gold bullion, the Japanese yen and U.S. Treasuries. By year-end, the yield on the 10-year U.S. Treasury note declined to 1.78% from 1.89% at the beginning of 2012.
Investment Strategy
Although this report covers a 12-month period, our investment horizon aims for longer term results. We seek to invest in securities of large-capitalization companies that we believe are selling below their underlying worth and hold them until they reach what we believe is their fair market value. Our aim is to construct a diversified portfolio of fundamentally sound companies purchased at attractive prices, often when they are out of favor with other investors for reasons we believe are temporary. Portfolio securities are selected without regard to benchmark comparisons and are chosen based on fundamental, bottom-up research focusing on several criteria, such as low price relative to earnings, cash flow or book value. We also consider stocks with recent sharp price declines that we feel still have significant growth potential or that possess valuable intangibles not reflected in the stock price.
Manager’s Discussion
During the 12 months under review, significant contributors to absolute Fund performance included several positions in the financials sector, notably property casualty insurer Allstate and financial conglomerates Citigroup and Bank of America.3 Biopharmaceutical company Gilead Sciences and home improvement retailer The Home Depot also aided results.
3. The financials sector comprises banks, diversified financials and insurance in the SOI.
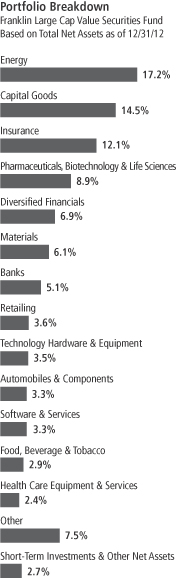
FLV-3
Significant detractors from performance included some energy sector positions in oil and gas companies Devon Energy, Apache and Occidental Petroleum. Other key detractors included business outsourcing services provider Xerox and freight railway company Norfolk Southern.
During the Fund’s fiscal year, the Fund purchased 12 new securities including: oilfield services provider Baker Hughes, bank holding companies Keycorp and Comerica, agribusiness and food company Bunge, petroleum refiner and marketer Valero, and manufacturing services provider Rockwell Automation. We also added to our holdings of auto components and building efficiency manufacturer Johnson Controls, specialty glass and ceramics maker Corning, health care products manufacturer Johnson & Johnson, gas and oil producer Devon Energy, and oil and gas exploration and production company Apache, among others. We liquidated 11 positions including J.C. Penney, Abbott Laboratories, Sempra Energy, Masco and The Bank of New York Mellon. We also reduced our holdings in Merck, International Business Machines, The Home Depot, Microsoft and Gilead Sciences, among others.
Thank you for your participation in Franklin Large Cap Value Securities Fund. We look forward to serving your future investment needs.
The foregoing information reflects our analysis, opinions and portfolio holdings as of December 31, 2012, the end of the reporting period. The way we implement our main investment strategies and the resulting portfolio holdings may change depending on factors such as market and economic conditions. These opinions may not be relied upon as investment advice or an offer for a particular security. The information is not a complete analysis of every aspect of any market, country, industry, security or the Fund. Statements of fact are from sources considered reliable, but the investment manager makes no representation or warranty as to their completeness or accuracy. Although historical performance is no guarantee of future results, these insights may help you understand our investment management philosophy.
Top 10 Holdings
Franklin Large Cap Value Securities Fund
12/31/12
| | | | |
Company
Sector/Industry | | % of Total
Net Assets | |
| Citigroup Inc. | | | 2.5% | |
| Diversified Financials | |
| Nucor Corp. | | | 2.4% | |
| Materials | |
| Aflac Inc. | | | 2.3% | |
| Insurance | |
| MetLife Inc. | | | 2.3% | |
| Insurance | |
| Eaton Corp. PLC | | | 2.3% | |
| Capital Goods | |
| Prudential Financial Inc. | | | 2.2% | |
| Insurance | |
| The Allstate Corp. | | | 2.2% | |
| Insurance | |
| Johnson Controls Inc. | | | 2.2% | |
| Automobiles & Components | |
| Johnson & Johnson | | | 2.0% | |
| Pharmaceuticals, Biotechnology & Life Sciences | |
| International Business Machines Corp. | | | 2.0% | |
| Software & Services | |
The dollar value, number of shares or principal amount, and names of all portfolio holdings are listed in the Fund’s Statement of Investments (SOI).
FLV-4
Fund Expenses
As an investor in a variable insurance contract (Contract) that indirectly provides for investment in an underlying mutual fund, you can incur transaction and/or ongoing expenses at both the Fund level and the Contract level.
| • | | Transaction expenses can include sales charges (loads) on purchases, redemption fees, surrender fees, transfer fees and premium taxes. |
| • | | Ongoing expenses can include management fees, distribution and service (12b-1) fees, contract fees, annual maintenance fees, mortality and expense risk fees and other fees and expenses. All mutual funds and Contracts have some types of ongoing expenses. |
The expenses shown in the table are meant to highlight ongoing expenses at the Fund level only and do not include ongoing expenses at the Contract level, or transaction expenses at either the Fund or Contract level. While the Fund does not have transaction expenses, if the transaction and ongoing expenses at the Contract level were included, the expenses shown would be higher. You should consult your Contract prospectus or disclosure document for more information.
The table shows Fund-level ongoing expenses and can help you understand these expenses and compare them with those of other mutual funds offered through the Contract. The table assumes a $1,000 investment held for the six months indicated. Please refer to the Fund prospectus for additional information on operating expenses.
Actual Fund Expenses
The first line (Actual) of the table provides actual account values and expenses. The “Ending Account Value” is derived from the Fund’s actual return, which includes the effect of ongoing Fund expenses, but does not include the effect of ongoing Contract expenses.
You can estimate the Fund-level expenses you incurred during the period by following these steps. Of course, your account value and expenses will differ from those in this illustration:
| 1. | Divide your account value by $1,000. |
If an account had an $8,600 value, then $8,600 ÷ $1,000 = 8.6.
| 2. | Multiply the result by the number under the heading “Fund-Level Expenses Incurred During Period.” |
If Fund-Level Expenses Incurred During Period were $7.50, then 8.6 x $7.50 = $64.50.
In this illustration, the estimated expenses incurred this period at the Fund level are $64.50.
Franklin Large Cap Value Securities Fund – Class 2
FLV-5
Hypothetical Example for Comparison with Other Mutual Funds
Information in the second line (Hypothetical) of the table can help you compare ongoing expenses of the Fund with those of other mutual funds offered through the Contract. This information may not be used to estimate the actual ending account balance or expenses you incurred during the period. The hypothetical “Ending Account Value” is based on the Fund’s actual expense ratio and an assumed 5% annual rate of return before expenses, which does not represent the Fund’s actual return. The figure under the heading “Fund-Level Expenses Incurred During Period” shows the hypothetical expenses your account would have incurred under this scenario. You can compare this figure with the 5% hypothetical examples that appear in shareholder reports of other funds offered through a Contract.
| | | | | | | | | | | | |
| Class 2 | | Beginning
Account Value 7/1/12 | | | Ending
Account
Value 12/31/12 | | | Fund-Level
Expenses Incurred
During Period*
7/1/12–12/31/12 | |
Actual | | $ | 1,000 | | | $ | 1,090.60 | | | $ | 4.73 | |
Hypothetical (5% return
before expenses) | | $ | 1,000 | | | $ | 1,020.61 | | | $ | 4.57 | |
*Expenses are calculated using the most recent six-month annualized expense ratio, net of expense waivers, for the Fund’s Class 2 shares (0.90%), which does not include any ongoing expenses of the Contract for which the Fund is an investment option, multiplied by the average account value over the period, multiplied by 184/366 to reflect the one-half year period.
FLV-6
Franklin Templeton Variable Insurance Products Trust
Financial Highlights
Franklin Large Cap Value Securities Fund
| | | | | | | | | | | | | | | | | | | | |
| | | Year Ended December 31, | |
| Class 2 | | 2012 | | | 2011 | | | 2010 | | | 2009 | | | 2008 | |
| | | | |
Per share operating performance | | | | | | | | | | | | | | | | | | | | |
(for a share outstanding throughout the year) | | | | | | | | | | | | | | | | | | | | |
Net asset value, beginning of year | | $ | 9.83 | | | $ | 10.50 | | | $ | 9.36 | | | $ | 7.54 | | | $ | 11.63 | |
| | | | |
Income from investment operationsa: | | | | | | | | | | | | | | | | | | | | |
Net investment incomeb | | | 0.15 | | | | 0.14 | | | | 0.12 | | | | 0.17 | | | | 0.19 | |
Net realized and unrealized gains (losses) | | | 1.25 | | | | (0.69 | ) | | | 1.19 | | | | 1.81 | | | | (4.28 | ) |
| | | | |
Total from investment operations | | | 1.40 | | | | (0.55 | ) | | | 1.31 | | | | 1.98 | | | | (4.09 | ) |
| | | | |
Less distributions from net investment income | | | (0.16 | ) | | | (0.12 | ) | | | (0.17 | ) | | | (0.16 | ) | | | — | |
| | | | |
Net asset value, end of year | | $ | 11.07 | | | $ | 9.83 | | | $ | 10.50 | | | $ | 9.36 | | | $ | 7.54 | |
| | | | |
| | | | | |
Total returnc | | | 14.44% | | | | (5.26)% | | | | 14.27% | | | | 26.76% | | | | (35.17)% | |
Ratios to average net assets | | | | | | | | | | | | | | | | | | | | |
Expenses before waiver and payments by affiliates | | | 1.42% | | | | 1.39% | | | | 1.40% | | | | 1.38% | | | | 1.34% | |
Expenses net of waiver and payments by affiliates | | | 0.90% | | | | 0.90% | | | | 0.90% | | | | 0.90% | | | | 0.90% | |
Net investment income | | | 1.42% | | | | 1.35% | | | | 1.25% | | | | 2.15% | | | | 1.93% | |
| | | | | |
Supplemental data | | | | | | | | | | | | | | | | | | | | |
Net assets, end of year (000’s) | | $ | 31,148 | | | $ | 34,091 | | | $ | 40,183 | | | $ | 35,892 | | | $ | 26,776 | |
Portfolio turnover rate | | | 29.50% | | | | 20.31% | | | | 13.91% | | | | 15.64% | | | | 12.92% | |
aThe amount shown for a share outstanding throughout the period may not correlate with the Statement of Operations for the period due to the timing of sales and repurchases of the Fund shares in relation to income earned and/or fluctuating market value of the investments of the Fund.
bBased on average daily shares outstanding.
cTotal return does not include fees, charges or expenses imposed by the variable annuity and life insurance contracts for which the Franklin Templeton Variable Insurance Products Trust serves as an underlying investment vehicle.
The accompanying notes are an integral part of these financial statements.
FLV-7
Franklin Templeton Variable Insurance Products Trust
Statement of Investments, December 31, 2012
| | | | | | | | |
| Franklin Large Cap Value Securities Fund | | Shares | | | Value | |
Common Stocks 97.3% | | | | | | | | |
Automobiles & Components 3.3% | | | | | | | | |
aBorgWarner Inc. | | | 5,000 | | | $ | 358,100 | |
Johnson Controls Inc. | | | 22,000 | | | | 675,400 | |
| | | | | | | | |
| | | | | | | 1,033,500 | |
| | | | | | | | |
Banks 5.1% | | | | | | | | |
Comerica Inc. | | | 16,500 | | | | 500,610 | |
KeyCorp | | | 67,800 | | | | 570,876 | |
U.S. Bancorp | | | 16,000 | | | | 511,040 | |
| | | | | | | | |
| | | | | | | 1,582,526 | |
| | | | | | | | |
Capital Goods 14.5% | | | | | | | | |
3M Co. | | | 4,500 | | | | 417,825 | |
Dover Corp. | | | 8,200 | | | | 538,822 | |
Eaton Corp. PLC | | | 13,000 | | | | 704,600 | |
General Dynamics Corp. | | | 6,500 | | | | 450,255 | |
General Electric Co. | | | 25,000 | | | | 524,750 | |
Illinois Tool Works Inc. | | | 6,500 | | | | 395,265 | |
Parker Hannifin Corp. | | | 6,500 | | | | 552,890 | |
Rockwell Automation Inc. | | | 5,000 | | | | 419,950 | |
United Technologies Corp. | | | 6,300 | | | | 516,663 | |
| | | | | | | | |
| | | | | | | 4,521,020 | |
| | | | | | | | |
Consumer Durables & Apparel 1.3% | | | | | | | | |
NIKE Inc., B | | | 8,000 | | | | 412,800 | |
| | | | | | | | |
Consumer Services 0.9% | | | | | | | | |
McDonald’s Corp. | | | 3,000 | | | | 264,630 | |
| | | | | | | | |
Diversified Financials 6.9% | | | | | | | | |
Bank of America Corp. | | | 35,500 | | | | 411,800 | |
Citigroup Inc. | | | 19,500 | | | | 771,420 | |
Northern Trust Corp. | | | 7,300 | | | | 366,168 | |
State Street Corp. | | | 13,000 | | | | 611,130 | |
| | | | | | | | |
| | | | | | | 2,160,518 | |
| | | | | | | | |
Energy 17.2% | | | | | | | | |
Apache Corp. | | | 6,300 | | | | 494,550 | |
Baker Hughes Inc. | | | 14,400 | | | | 588,096 | |
Chevron Corp. | | | 5,000 | | | | 540,700 | |
ConocoPhillips | | | 9,000 | | | | 521,910 | |
Devon Energy Corp. | | | 9,200 | | | | 478,768 | |
Ensco PLC, A | | | 9,000 | | | | 533,520 | |
Exxon Mobil Corp. | | | 6,500 | | | | 562,575 | |
Noble Corp. | | | 13,200 | | | | 459,624 | |
Occidental Petroleum Corp. | | | 6,500 | | | | 497,965 | |
Phillips 66 | | | 4,500 | | | | 238,950 | |
Valero Energy Corp. | | | 12,500 | | | | 426,500 | |
| | | | | | | | |
| | | | | | | 5,343,158 | |
| | | | | | | | |
Food & Staples Retailing 1.8% | | | | | | | | |
Wal-Mart Stores Inc. | | | 3,200 | | | | 218,336 | |
Walgreen Co. | | | 9,500 | | | | 351,595 | |
| | | | | | | | |
| | | | | | | 569,931 | |
| | | | | | | | |
Food, Beverage & Tobacco 2.9% | | | | | | | | |
Archer-Daniels-Midland Co. | | | 16,500 | | | | 451,935 | |
FLV-8
Franklin Templeton Variable Insurance Products Trust
Statement of Investments, December 31, 2012 (continued)
| | | | | | | | |
| Franklin Large Cap Value Securities Fund | | Shares | | | Value | |
Common Stocks (continued) | | | | | | | | |
Food, Beverage & Tobacco (continued) | | | | | | | | |
Bunge Ltd. | | | 6,000 | | | $ | 436,140 | |
| | | | | | | | |
| | | | | | | 888,075 | |
| | | | | | | | |
Health Care Equipment & Services 2.4% | | | | | | | | |
Becton, Dickinson and Co. | | | 6,500 | | | | 508,235 | |
Covidien PLC | | | 4,400 | | | | 254,056 | |
| | | | | | | | |
| | | | | | | 762,291 | |
| | | | | | | | |
Household & Personal Products 1.0% | | | | | | | | |
The Procter & Gamble Co. | | | 4,500 | | | | 305,505 | |
| | | | | | | | |
Insurance 12.1% | | | | | | | | |
Aflac Inc. | | | 13,500 | | | | 717,120 | |
The Allstate Corp. | | | 17,000 | | | | 682,890 | |
aBerkshire Hathaway Inc., A | | | 2 | | | | 268,120 | |
The Chubb Corp. | | | 5,500 | | | | 414,260 | |
MetLife Inc. | | | 21,700 | | | | 714,798 | |
Prudential Financial Inc. | | | 13,000 | | | | 693,290 | |
The Travelers Cos. Inc. | | | 4,000 | | | | 287,280 | |
| | | | | | | | |
| | | | | | | 3,777,758 | |
| | | | | | | | |
Materials 6.1% | | | | | | | | |
Air Products and Chemicals Inc. | | | 3,600 | | | | 302,472 | |
Alcoa Inc. | | | 62,000 | | | | 538,160 | |
Nucor Corp. | | | 17,000 | | | | 734,060 | |
Praxair Inc. | | | 2,900 | | | | 317,405 | |
| | | | | | | | |
| | | | | | | 1,892,097 | |
| | | | | | | | |
Pharmaceuticals, Biotechnology & Life Sciences 8.9% | | | | | | | | |
aGilead Sciences Inc. | | | 6,000 | | | | 440,700 | |
Johnson & Johnson | | | 9,000 | | | | 630,900 | |
Merck & Co. Inc. | | | 10,000 | | | | 409,400 | |
Pfizer Inc. | | | 22,500 | | | | 564,300 | |
Teva Pharmaceutical Industries Ltd., ADR (Israel) | | | 12,000 | | | | 448,080 | |
aWatson Pharmaceuticals Inc. | | | 3,300 | | | | 283,800 | |
| | | | | | | | |
| | | | | | | 2,777,180 | |
| | | | | | | | |
Retailing 3.6% | | | | | | | | |
The Home Depot Inc. | | | 9,000 | | | | 556,650 | |
Nordstrom Inc. | | | 9,500 | | | | 508,250 | |
aOffice Depot Inc. | | | 17,500 | | | | 57,400 | |
| | | | | | | | |
| | | | | | | 1,122,300 | |
| | | | | | | | |
Semiconductors & Semiconductor Equipment 1.1% | | | | | | | | |
Microchip Technology Inc. | | | 10,500 | | | | 342,195 | |
| | | | | | | | |
Software & Services 3.3% | | | | | | | | |
International Business Machines Corp. | | | 3,200 | | | | 612,960 | |
Microsoft Corp. | | | 15,500 | | | | 414,315 | |
| | | | | | | | |
| | | | | | | 1,027,275 | |
| | | | | | | | |
Technology Hardware & Equipment 3.5% | | | | | | | | |
Corning Inc. | | | 43,500 | | | | 548,970 | |
TE Connectivity Ltd. | | | 2,000 | | | | 74,240 | |
Xerox Corp. | | | 70,000 | | | | 477,400 | |
| | | | | | | | |
| | | | | | | 1,100,610 | |
| | | | | | | | |
FLV-9
Franklin Templeton Variable Insurance Products Trust
Statement of Investments, December 31, 2012 (continued)
| | | | | | | | |
| Franklin Large Cap Value Securities Fund | | Shares | | | Value | |
Common Stocks (continued) | | | | | | | | |
Transportation 1.2% | | | | | | | | |
Norfolk Southern Corp. | | | 6,000 | | | $ | 371,040 | |
| | | | | | | | |
Utilities 0.2% | | | | | | | | |
Exelon Corp. | | | 1,800 | | | | 53,532 | |
| | | | | | | | |
Total Common Stocks (Cost $24,110,119) | | | | | | | 30,307,941 | |
| | | | | | | | |
Short Term Investments (Cost $999,970) 3.2% | | | | | | | | |
Money Market Funds 3.2% | | | | | | | | |
a,bInstitutional Fiduciary Trust Money Market Portfolio | | | 999,970 | | | | 999,970 | |
| | | | | | | | |
Total Investments (Cost $25,110,089) 100.5% | | | | | | | 31,307,911 | |
Other Assets, less Liabilities (0.5)% | | | | | | | (159,924 | ) |
| | | | | | | | |
Net Assets 100.0% | | | | | | $ | 31,147,987 | |
| | | | | | | | |
See Abbreviations on page FLV-19.
aNon-income producing.
bSee Note 7 regarding investments in the Institutional Fiduciary Trust Money Market Portfolio.
The accompanying notes are an integral part of these financial statements.
FLV-10
Franklin Templeton Variable Insurance Products Trust
Financial Statements
Statement of Assets and Liabilities
December 31, 2012
| | | | |
| | | Franklin Large
Cap Value
Securities Fund | |
Assets: | | | | |
Investments in securities: | | | | |
Cost - Unaffiliated issuers | | $ | 24,110,119 | |
Cost - Sweep Money Fund (Note 7) | | | 999,970 | |
| | | | |
Total cost of investments | | $ | 25,110,089 | |
| | | | |
Value - Unaffiliated issuers | | $ | 30,307,941 | |
Value - Sweep Money Fund (Note 7) | | | 999,970 | |
| | | | |
Total value of investments | | | 31,307,911 | |
Receivables from dividends | | | 31,549 | |
| | | | |
Total assets | | | 31,339,460 | |
| | | | |
Liabilities: | | | | |
Payables: | | | | |
Capital shares redeemed | | | 122,581 | |
Affiliates | | | 26,059 | |
Professional fees | | | 34,324 | |
Accrued expenses and other liabilities | | | 8,509 | |
| | | | |
Total liabilities | | | 191,473 | |
| | | | |
Net assets, at value | | $ | 31,147,987 | |
| | | | |
Net assets consist of: | | | | |
Paid-in capital | | $ | 31,417,457 | |
Undistributed net investment income | | | 490,829 | |
Net unrealized appreciation (depreciation) | | | 6,197,822 | |
Accumulated net realized gain (loss) | | | (6,958,121 | ) |
| | | | |
Net assets, at value | | $ | 31,147,987 | |
| | | | |
Class 2: | | | | |
Net assets, at value | | $ | 31,147,987 | |
| | | | |
Shares outstanding | | | 2,814,871 | |
| | | | |
Net asset value and maximum offering price per share | | $ | 11.07 | |
| | | | |
The accompanying notes are an integral part of these financial statements.
FLV-11
Franklin Templeton Variable Insurance Products Trust
Financial Statements (continued)
Statement of Operations
for the year ended December 31, 2012
| | | | |
| | | Franklin Large
Cap Value
Securities Fund | |
Investment income: | | | | |
Dividends | | $ | 801,929 | |
| | | | |
Expenses: | | | | |
Management fees (Note 3a) | | | 257,382 | |
Administrative fees (Note 3b) | | | 86,376 | |
Distribution fees - Class 2 (Note 3c) | | | 86,380 | |
Unaffiliated transfer agent fees | | | 21 | |
Custodian fees (Note 4) | | | 492 | |
Reports to shareholders | | | 15,442 | |
Professional fees | | | 36,646 | |
Other | | | 8,280 | |
| | | | |
Total expenses | | | 491,019 | |
Expenses waived/paid by affiliates (Note 3e) | | | (180,061 | ) |
| | | | |
Net expenses | | | 310,958 | |
| | | | |
Net investment income | | | 490,971 | |
| | | | |
Realized and unrealized gains (losses): | | | | |
Net realized gain (loss) from investments | | | 808,210 | |
Net change in unrealized appreciation (depreciation) on investments | | | 3,408,336 | |
| | | | |
Net realized and unrealized gain (loss) | | | 4,216,546 | |
| | | | |
Net increase (decrease) in net assets resulting from operations | | $ | 4,707,517 | |
| | | | |
The accompanying notes are an integral part of these financial statements.
FLV-12
Franklin Templeton Variable Insurance Products Trust
Financial Statements (continued)
Statements of Changes in Net Assets
| | | | | | | | |
| | | Franklin Large Cap Value
Securities Fund | |
| | | Year Ended December 31, | |
| | | 2012 | | | 2011 | |
| | | | |
Increase (decrease) in net assets: | | | | | | | | |
Operations: | | | | | | | | |
Net investment income | | $ | 490,971 | | | $ | 517,783 | |
Net realized gain (loss) from investments | | | 808,210 | | | | 572,867 | |
Net change in unrealized appreciation (depreciation) on investments | | | 3,408,336 | | | | (3,078,747 | ) |
| | | | |
Net increase (decrease) in net assets resulting from operations | | | 4,707,517 | | | | (1,988,097 | ) |
| | | | |
Distributions to shareholders from net investment income: Class 2 | | | (517,878 | ) | | | (463,423 | ) |
| | | | |
Capital share transactions: (Note 2) | | | | | | | | |
Class 2 | | | (7,132,539 | ) | | | (3,640,238 | ) |
Class 4 | | | — | | | | (4,956 | ) |
| | | | |
Total capital share transactions | | | (7,132,539 | ) | | | (3,645,194 | ) |
| | | | |
Net increase (decrease) in net assets | | | (2,942,900 | ) | | | (6,096,714 | ) |
Net assets: | | | | | | | | |
Beginning of year | | | 34,090,887 | | | | 40,187,601 | |
| | | | |
End of year | | $ | 31,147,987 | | | $ | 34,090,887 | |
| | | | |
Undistributed net investment income included in net assets: | | | | | | | | |
End of year | | $ | 490,829 | | | $ | 517,736 | |
| | | | |
The accompanying notes are an integral part of these financial statements.
FLV-13
Franklin Templeton Variable Insurance Products Trust
Notes to Financial Statements
Franklin Large Cap Value Securities Fund
1. ORGANIZATION AND SIGNIFICANT ACCOUNTING POLICIES
Franklin Templeton Variable Insurance Products Trust (Trust) is registered under the Investment Company Act of 1940, as amended, (1940 Act) as an open-end investment company, consisting of twenty separate funds. The Franklin Large Cap Value Securities Fund (Fund) is included in this report. The financial statements of the remaining funds in the Trust are presented separately. Shares of the Fund are generally sold only to insurance company separate accounts to fund the benefits of variable life insurance policies or variable annuity contracts. At December 31, 2012, 99.54% of the Fund’s shares were held through one insurance company. The Fund offers one class of shares: Class 2.
The following summarizes the Fund’s significant accounting policies.
a. Financial Instrument Valuation
The Fund’s investments in financial instruments are carried at fair value daily. Fair value is the price that would be received to sell an asset or paid to transfer a liability in an orderly transaction between market participants on the measurement date. Under procedures approved by the Trust’s Board of Trustees (the Board), the Fund’s administrator, investment manager and other affiliates have formed the Valuation and Liquidity Oversight Committee (VLOC). The VLOC provides administration and oversight of the Fund’s valuation policies and procedures, which are approved annually by the Board. Among other things, these procedures allow the Fund to utilize independent pricing services, quotations from securities and financial instrument dealers, and other market sources to determine fair value.
Equity securities listed on an exchange or on the NASDAQ National Market System are valued at the last quoted sale price or the official closing price of the day, respectively. Foreign equity securities are valued as of the close of trading on the foreign stock exchange on which the security is primarily traded, or the NYSE, whichever is earlier. The value is then converted into its U.S. dollar equivalent at the foreign exchange rate in effect at the close of the NYSE on the day that the value of the security is determined. Over-the-counter (OTC) securities are valued within the range of the most recent quoted bid and ask prices. Securities that trade in multiple markets or on multiple exchanges are valued according to the broadest and most representative market. Certain equity securities are valued based upon fundamental characteristics or relationships to similar securities. Investments in open-end mutual funds are valued at the closing net asset value.
The Fund has procedures to determine the fair value of financial instruments for which market prices are not reliable or readily available. Under these procedures, the VLOC convenes on a regular basis to review such financial instruments and considers a number of factors, including significant unobservable valuation inputs, when arriving at fair value. The VLOC primarily employs a market-based approach which may use related or comparable assets or liabilities, recent transactions, market multiples, book values, and other relevant information for the investment to determine the fair value of the investment. An income-based valuation approach may also be used in which the anticipated future cash flows of the investment are discounted to calculate fair value. Discounts may also be applied due to the nature or duration of any restrictions on the disposition of the investments. Due to the inherent uncertainty of valuations of such investments, the fair values may differ significantly from the values that would have been used had an active market existed. The VLOC employs various methods for calibrating these valuation approaches including a regular review of key inputs and assumptions, transactional back-testing or disposition analysis, and reviews of any related market activity.
b. Income and Deferred Taxes
It is the Fund’s policy to qualify as a regulated investment company under the Internal Revenue Code. The Fund intends to distribute to shareholders substantially all of its taxable income and net realized gains to relieve it from federal income and if applicable, excise taxes. As a result, no provision for U.S. federal income taxes is required.
The Fund may be subject to foreign taxation related to income received, capital gains on the sale of securities and certain foreign currency transactions in the foreign jurisdictions in which it invests. Foreign taxes, if any, are recorded based on the tax
FLV-14
Franklin Templeton Variable Insurance Products Trust
Notes to Financial Statements (continued)
Franklin Large Cap Value Securities Fund
1. ORGANIZATION AND SIGNIFICANT ACCOUNTING POLICIES (continued)
b. Income and Deferred Taxes (continued)
regulations and rates that exist in the foreign markets in which the Fund invests. When a capital gain tax is determined to apply the Fund records an estimated deferred tax liability in an amount that would be payable if the securities were disposed of on the valuation date.
The Fund recognizes the tax benefits of uncertain tax positions only when the position is “more likely than not” to be sustained upon examination by the tax authorities based on the technical merits of the tax position. As of December 31, 2012, and for all open tax years, the Fund has determined that no liability for unrecognized tax benefits is required in the Fund’s financial statements related to uncertain tax positions taken on a tax return (or expected to be taken on future tax returns). Open tax years are those that remain subject to examination and are based on each tax jurisdiction statute of limitation.
c. Security Transactions, Investment Income, Expenses and Distributions
Security transactions are accounted for on trade date. Realized gains and losses on security transactions are determined on a specific identification basis. Estimated expenses are accrued daily. Dividend income is recorded on the ex-dividend date except that certain dividends from foreign securities are recognized as soon as the Fund is notified of the ex-dividend date. Distributions to shareholders are recorded on the ex-dividend date and are determined according to income tax regulations (tax basis). Distributable earnings determined on a tax basis may differ from earnings recorded in accordance with accounting principles generally accepted in the United States of America. These differences may be permanent or temporary. Permanent differences are reclassified among capital accounts to reflect their tax character. These reclassifications have no impact on net assets or the results of operations. Temporary differences are not reclassified, as they may reverse in subsequent periods.
Common expenses incurred by the Trust are allocated among the funds based on the ratio of net assets of each fund to the combined net assets of the Trust. Fund specific expenses are charged directly to the fund that incurred the expense.
d. Accounting Estimates
The preparation of financial statements in accordance with accounting principles generally accepted in the United States of America requires management to make estimates and assumptions that affect the reported amounts of assets and liabilities at the date of the financial statements and the amounts of income and expenses during the reporting period. Actual results could differ from those estimates.
e. Guarantees and Indemnifications
Under the Trust’s organizational documents, its officers and trustees are indemnified by the Trust against certain liabilities arising out of the performance of their duties to the Trust. Additionally, in the normal course of business, the Trust, on behalf of the Fund, enters into contracts with service providers that contain general indemnification clauses. The Trust’s maximum exposure under these arrangements is unknown as this would involve future claims that may be made against the Trust that have not yet occurred. Currently, the Trust expects the risk of loss to be remote.
FLV-15
Franklin Templeton Variable Insurance Products Trust
Notes to Financial Statements (continued)
Franklin Large Cap Value Securities Fund
2. SHARES OF BENEFICIAL INTEREST
At December 31, 2012, there were an unlimited number of shares authorized (without par value). Transactions in the Fund’s shares were as follows:
| | | | | | | | | | | | | | | | |
| | | Year Ended December 31, | |
| | | 2012 | | | 2011 a | |
| Class 2 Shares: | | Shares | | | Amount | | | Shares | | | Amount | |
Shares sold | | | 1,261,544 | | | $ | 13,147,597 | | | | 688,292 | | | $ | 7,034,269 | |
Shares issued in reinvestment of distributions | | | 51,582 | | | | 517,878 | | | | 45,080 | | | | 463,423 | |
Shares redeemed | | | (1,966,243 | ) | | | (20,798,014 | ) | | | (1,093,620 | ) | | | (11,137,930 | ) |
| | | | |
Net increase (decrease) | | | (653,117 | ) | | $ | (7,132,539 | ) | | | (360,248 | ) | | $ | (3,640,238 | ) |
| | | | |
Class 4 Shares: | | | | | | | | | | | | | | | | |
Shares redeemed | | | | | | | | | | | (452 | ) | | $ | (4,956 | ) |
| | | | | | | | | | |
Net increase (decrease) | | | | | | | | | | | (452 | ) | | $ | (4,956 | ) |
| | | | | | | | | | |
| aEffective | March 4, 2011, Class 4 was liquidated. |
3. TRANSACTIONS WITH AFFILIATES
Franklin Resources, Inc. is the holding company for various subsidiaries that together are referred to as Franklin Templeton Investments. Certain officers and trustees of the Fund are also officers and/or directors of the following subsidiaries:
| | |
| Subsidiary | | Affiliation |
Franklin Advisory Services, LLC (Advisory Services) | | Investment manager |
Franklin Templeton Services, LLC (FT Services) | | Administrative manager |
Franklin Templeton Distributors, Inc. (Distributors) | | Principal underwriter |
Franklin Templeton Investor Services, LLC (Investor Services) | | Transfer agent |
a. Management Fees
The Fund pays an investment management fee to Advisory Services based on the average daily net assets of the Fund as follows:
| | |
| Annualized Fee Rate | | Net Assets |
| 0.750% | | Up to and including $500 million |
| 0.650% | | Over $500 million, up to and including $1 billion |
| 0.600% | | Over $1 billion, up to and including $1.5 billion |
| 0.550% | | Over $1.5 billion, up to and including $6.5 billion |
| 0.525% | | Over $6.5 billion, up to and including $11.5 billion |
| 0.500% | | Over $11.5 billion, up to and including $16.5 billion |
| 0.490% | | Over $16.5 billion, up to and including $19 billion |
| 0.480% | | Over $19 billion, up to and including $21.5 billion |
| 0.470% | | In excess of $21.5 billion |
b. Administrative Fees
The Fund pays an administrative fee to FT Services of 0.25% per year of the average daily net assets of the Fund.
FLV-16
Franklin Templeton Variable Insurance Products Trust
Notes to Financial Statements (continued)
Franklin Large Cap Value Securities Fund
3. TRANSACTIONS WITH AFFILIATES (continued)
c. Distribution Fees
The Board has adopted a distribution plan for Class 2 shares pursuant to Rule 12b-1 under the 1940 Act. Under the Fund’s compensation distribution plan, the Fund pays Distributors for costs incurred in connection with the servicing, sale and distribution of the Fund’s shares up to 0.35% per year of its average daily net assets. Some distribution fees are not charged on shares held by affiliates. The Board has agreed to limit the current rate to 0.25% per year for Class 2.
d. Transfer Agent Fees
Investor Services, under terms of an agreement, performs shareholder servicing for the Fund and is not paid by the Fund for the services.
e. Waiver and Expense Reimbursements
Advisory Services and FT Services have contractually agreed in advance to waive or limit their respective fees and to assume as their own expense certain expenses otherwise payable by the Fund so that the common expenses (i.e. a combination of management fees, administrative fees, and other expenses, but excluding distribution fees, and acquired fund fees and expenses) do not exceed 0.65% (other than certain non-routine expenses or costs, including those relating to litigation, indemnification, reorganizations, and liquidations) until April 30, 2013.
4. EXPENSE OFFSET ARRANGEMENT
The Fund has entered into an arrangement with its custodian whereby credits realized as a result of uninvested cash balances are used to reduce a portion of the Fund’s custodian expenses. During the year ended December 31, 2012, there were no credits earned.
5. INCOME TAXES
For tax purposes, capital losses may be carried over to offset future capital gains, if any. Capital loss carryforwards with no expiration, if any, must be fully utilized before those losses with expiration dates.
At December 31, 2012, capital loss carryforwards were as follows:
| | | | |
Capital loss carryforwards subject to expiration: | | | | |
2016 | | $ | 3,433,134 | |
2017 | | | 2,320,965 | |
2018 | | | 1,173,534 | |
| | | | |
| | $ | 6,927,633 | |
| | | | |
During the year ended December 31, 2012, the Fund utilized $769,954 of capital loss carryforwards.
The tax character of distributions paid during the years ended December 31, 2012 and 2011, was as follows:
| | | | | | | | |
| | | 2012 | | | 2011 | |
Distributions paid from ordinary income | | $ | 517,878 | | | $ | 463,423 | |
FLV-17
Franklin Templeton Variable Insurance Products Trust
Notes to Financial Statements (continued)
Franklin Large Cap Value Securities Fund
5. INCOME TAXES (continued)
At December 31, 2012, the cost of investments, net unrealized appreciation (depreciation) and undistributed ordinary income for income tax purposes were as follows:
| | | | |
Cost of investments | | $ | 25,140,576 | |
| | | | |
| |
Unrealized appreciation | | $ | 7,085,762 | |
Unrealized depreciation | | | (918,427 | ) |
| | | | |
Net unrealized appreciation (depreciation) | | $ | 6,167,335 | |
| | | | |
Distributable earnings - undistributed ordinary income | | $ | 490,829 | |
| | | | |
Differences between income and/or capital gains as determined on a book basis and a tax basis are primarily due to differing treatment of wash sales.
6. INVESTMENT TRANSACTIONS
Purchases and sales of investments (excluding short term securities) for the year ended December 31, 2012, aggregated $9,720,291 and $16,684,571, respectively.
7. INVESTMENTS IN INSTITUTIONAL FIDUCIARY TRUST MONEY MARKET PORTFOLIO
The Fund invests in the Institutional Fiduciary Trust Money Market Portfolio (Sweep Money Fund), an open-end investment company managed by Franklin Advisers, Inc. (an affiliate of the investment manager). Management fees paid by the Fund are reduced on assets invested in the Sweep Money Fund, in an amount not to exceed the management and administrative fees paid by the Sweep Money Fund.
8. CREDIT FACILITY
The Fund, together with other U.S. registered and foreign investment funds (collectively, Borrowers), managed by Franklin Templeton Investments, are borrowers in a joint syndicated senior unsecured credit facility totaling $1.5 billion (Global Credit Facility) which matured on January 18, 2013. This Global Credit Facility provides a source of funds to the Borrowers for temporary and emergency purposes, including the ability to meet future unanticipated or unusually large redemption requests. Effective January 18, 2013, the Borrowers renewed the Global Credit Facility which matures on January 17, 2014.
Under the terms of the Global Credit Facility, the Fund shall, in addition to interest charged on any borrowings made by the Fund and other costs incurred by the Fund, pay its share of fees and expenses incurred in connection with the implementation and maintenance of the Global Credit Facility, based upon its relative share of the aggregate net assets of all of the Borrowers, including an annual commitment fee of 0.07% based upon the unused portion of the Global Credit Facility. These fees are reflected in other expenses on the Statement of Operations. During the year ended December 31, 2012, the Fund did not use the Global Credit Facility.
FLV-18
Franklin Templeton Variable Insurance Products Trust
Notes to Financial Statements (continued)
Franklin Large Cap Value Securities Fund
9. FAIR VALUE MEASUREMENTS
The Fund follows a fair value hierarchy that distinguishes between market data obtained from independent sources (observable inputs) and the Fund’s own market assumptions (unobservable inputs). These inputs are used in determining the value of the Fund’s financial instruments and are summarized in the following fair value hierarchy:
| | • | | Level 1 – quoted prices in active markets for identical financial instruments |
| | • | | Level 2 – other significant observable inputs (including quoted prices for similar financial instruments, interest rates, prepayment speed, credit risk, etc.) |
| | • | | Level 3 – significant unobservable inputs (including the Fund’s own assumptions in determining the fair value of financial instruments) |
The inputs or methodology used for valuing financial instruments are not an indication of the risk associated with investing in those financial instruments.
For movements between the levels within the fair value hierarchy, the Fund has adopted a policy of recognizing the transfers as of the date of the underlying event which caused the movement.
At December 31, 2012, all of the Fund’s investments in financial instruments carried at fair value were valued using Level 1 inputs. For detailed categories, see the accompanying Statement of Investments.
10. NEW ACCOUNTING PRONOUNCEMENTS
In December 2011, the Financial Accounting Standards Board (FASB) issued Accounting Standards Update (ASU) No. 2011-11, Balance Sheet (Topic 210): Disclosures about Offsetting Assets and Liabilities. The amendments in the ASU enhance disclosures about offsetting of financial assets and liabilities to enable investors to understand the effect of these arrangements on a fund’s financial position. In January 2013, FASB issued ASU No. 2013-01, Balance Sheet (Topic 210): Clarifying the Scope of Disclosures about Offsetting Assets and Liabilities. The amendments in ASU No. 2013-01 clarify the intended scope of disclosures required by ASU No. 2011-11. These ASUs are effective for interim and annual reporting periods beginning on or after January 1, 2013. The Fund believes the adoption of these ASUs will not have a material impact on its financial statements.
11. SUBSEQUENT EVENTS
The Fund has evaluated subsequent events through the issuance of the financial statements and determined that no events have occurred that require disclosure other than those already disclosed in the financial statements.
| | | | |
ABBREVIATIONS | | | | |
| Selected Portfolio: | | | | |
| | | | |
| ADR - American Depositary Receipt | | | | |
FLV-19
Franklin Templeton Variable Insurance Products Trust
Franklin Large Cap Value Securities Fund
Report of Independent Registered Public Accounting Firm
To the Board of Trustees and Shareholders of Franklin Templeton Variable Insurance Products Trust
In our opinion, the accompanying statement of assets and liabilities, including the statement of investments, and the related statements of operations and of changes in net assets and the financial highlights present fairly, in all material respects, the financial position of Franklin Large Cap Value Securities Fund (the “Fund”) at December 31, 2012, the results of its operations for the year then ended, the changes in its net assets for each of the two years in the period then ended and the financial highlights for each of the five years in the period then ended, in conformity with accounting principles generally accepted in the United States of America. These financial statements and financial highlights (hereafter referred to as “financial statements”) are the responsibility of the Fund’s management. Our responsibility is to express an opinion on these financial statements based on our audits. We conducted our audits of these financial statements in accordance with the standards of the Public Company Accounting Oversight Board (United States). Those standards require that we plan and perform the audit to obtain reasonable assurance about whether the financial statements are free of material misstatement. An audit includes examining, on a test basis, evidence supporting the amounts and disclosures in the financial statements, assessing the accounting principles used and significant estimates made by management, and evaluating the overall financial statement presentation. We believe that our audits, which included confirmation of securities at December 31, 2012 by correspondence with the custodian, transfer agent and brokers, provide a reasonable basis for our opinion.
PricewaterhouseCoopers LLP
San Francisco, California
February 15, 2013
FLV-20
Franklin Templeton Variable Insurance Products Trust
Tax Information (unaudited)
Franklin Large Cap Value Securities Fund
Under Section 854(b)(1)(A) of the Internal Revenue Code, the Fund hereby reports 100% of the ordinary income dividends as income qualifying for the dividends received deduction for the fiscal year ended December 31, 2012.
FLV-21
FRANKLIN RISING DIVIDENDS SECURITIES FUND
This annual report for Franklin Rising Dividends Securities Fund covers the fiscal year ended December 31, 2012.
Performance Summary as of 12/31/12
Average annual total return of Class 2 shares represents the average annual change in value, assuming reinvestment of dividends and capital gains. Average returns smooth out variations in returns, which can be significant; they are not the same as year-by-year results.
Periods ended 12/31/12
| | | | | | | | | | | | |
| | | 1-Year | | | 5-Year | | | 10-Year | |
Average Annual Total Return | | | +11.96% | | | | +4.14% | | | | +7.16% | |
Total Return Index Comparison for a Hypothetical $10,000 Investment (1/1/03–12/31/12)
The graph below shows the change in value of a hypothetical $10,000 investment in the Fund over the indicated period and includes reinvestment of any income or distributions. The Fund’s performance is compared to the performance of the Standard & Poor’s® 500 Index (S&P 500®). One cannot invest directly in an index, and an index is not representative of the Fund’s portfolio. Please see Important Notes to Performance Information preceding the Fund Summaries.
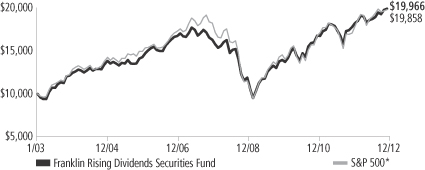
*Source: © 2013 Morningstar. Please see Index Descriptions following the Fund Summaries.
Franklin Rising Dividends Securities Fund – Class 2
Performance reflects the Fund’s Class 2 operating expenses, but does not include any contract fees, expenses or sales charges. If they had been included, performance would be lower. These charges and deductions, particularly for variable life policies, can have a significant effect on contract values and insurance benefits. See the contract prospectus for a complete description of these expenses, including sales charges.
Performance data represent past performance, which does not guarantee future results. Investment return and principal value will fluctuate, and you may have a gain or loss when you sell your shares.
Current performance may differ from figures shown.
FRD-1
Fund Goal and Main Investments: Franklin Rising Dividends Securities Fund seeks long-term capital appreciation, with preservation of capital as an important consideration. Under normal market conditions, the Fund invests at least 80% of its net assets in investments of companies that have paid rising dividends.
Performance Overview
You can find the Fund’s one-year total return in the Performance Summary. The Fund underperformed its benchmark, the S&P 500, which rose 16.00% for the same period.1 Please note the Fund employs a bottom-up stock selection process, and the managers invest in securities without regard to benchmark comparisons.
Economic and Market Overview
The U.S. economy, as measured by gross domestic product, grew moderately in 2012, supported by positive construction, housing and labor market trends. U.S. home prices increased in most regions due to higher demand based on near to record-low mortgage rates, affordable housing prices, low new-home inventories and a five-year low in U.S. foreclosures. Home construction became a leading source of economic growth after reaching a multi-year high in 2012, further enhancing confidence in the housing market. Consumer spending and personal income levels climbed, and inflation was generally mild with the exception of energy and food prices. Consumer sentiment reached its highest level in five years, although the potential U.S. tax hikes and spending cuts scheduled to take effect in 2013 dampened confidence near year-end. Nevertheless, the federal budget deficit for fiscal year 2012 fell to its lowest level since 2008. Just after year-end, Congress passed compromise legislation that preserved lower income tax rates for most U.S. households and delayed far-reaching federal spending cuts.
For the 12-month period, U.S. stocks, as measured by the S&P 500, fluctuated as investors reacted to news headlines and shifted between risk taking and risk aversion. Toward period-end uncertainty eased surrounding the European fiscal crisis as leaders made progress on economic reforms and management of Greek debt, but slowing economic growth in Asia, particularly China, curbed global economic recovery and markets. In its December meeting, the Federal Open Market Committee (FOMC) announced a 6.5% unemployment target as
1. Source: © 2013 Morningstar. One cannot invest directly in an index, and an index is not representative of the Fund’s portfolio. Please see Index Descriptions following the Fund Summaries.
Fund Risks: All investments involve risks, including possible loss of principal. Stock prices fluctuate, sometimes rapidly and dramatically, due to factors affecting individual companies, particular industries or sectors, or general market conditions. Value securities may not increase in price as anticipated or may decline further in value. While smaller and midsized companies may offer substantial opportunities for capital growth, they also involve heightened risks and should be considered speculative. Historically, smaller- and midsized-company securities have been more volatile in price than larger company securities, especially over the short term. Smaller companies often have relatively small revenues, limited product lines and a small market share. The Fund is actively managed but there is no guarantee that the manager’s investment decisions will produce the desired results. The Fund’s prospectus also includes a description of the main investment risks.
FRD-2
a guide to maintaining the historically low federal funds target rate. The FOMC also said it intended to continue purchasing longer term Treasuries and agency mortgage-backed securities. Despite modest third-quarter U.S. company revenues suggesting a drop in global demand, a hard-fought national election and budget deadline concerns, domestic stock markets made strong gains for the year. Value stocks generally outperformed growth stocks, and all sectors generated positive returns, as represented by the S&P 500. Not all investors favored stocks, however, and many sought perceived safe havens such as gold bullion, the Japanese yen and U.S. Treasuries. By year-end, the yield on the 10-year U.S. Treasury note declined to 1.78% from 1.89% at the beginning of 2012.
Investment Strategy
We are a research-driven, fundamental investment adviser, pursuing a disciplined value-oriented strategy. As bottom-up investors concentrating primarily on individual securities, we seek fundamentally sound companies that we believe meet our screening criteria, which include consistent, substantial dividend increases; reinvested earnings; and strong balance sheets. We attempt to acquire such stocks at attractive prices, often when they are out of favor with other investors. In following these criteria, we do not necessarily focus on companies whose securities pay a high dividend but rather on companies that consistently raise their dividends.
Manager’s Discussion
During the 12 months under review, three holdings that helped absolute Fund performance were Roper Industries, West Pharmaceutical Services and Abbott Laboratories. Roper, a provider of engineered products, software and services for diverse end markets, continued to grow its portfolio of high margin and strong free cash flow generating businesses. Particularly noteworthy was its recent acquisition of Sunquest Information Systems. Roper has increased its dividend for the past 20 years. The stock price of West Pharmaceutical Services, a manufacturer of delivery system components for injection drugs and other health care products, increased throughout the year due to favorable year-over-year quarterly sales and earnings per share resulting from increased demand for packaging components, proprietary products and contract manufacturing. West Pharmaceutical Services has raised its dividend for the past 19 years. Abbott, a diversified manufacturer of health care products, reported double-digit earnings per share growth in the third quarter and planned to spin off its proprietary drug
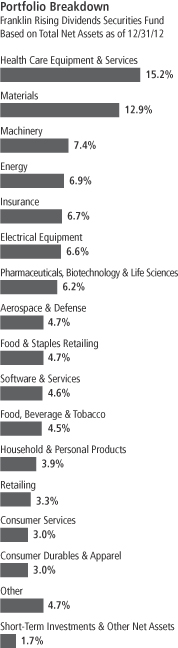
FRD-3
business to AbbVie at the beginning of 2013. Abbott will retain its other businesses, which include diagnostic equipment, medical devices and nutritional supplements. Investors have also begun to focus more on its pipeline of new drugs. Abbott has 41 years of consecutive dividend increases.
Detractors from performance included Erie Indemnity, McDonald’s and Hill-Rom Holdings. Erie Indemnity, the management company for the Erie Insurance Exchange, reported disappointing earnings in two of the last three quarters as a result of higher operating expenses and lower investment income. Expenses rose largely because of the company’s decision to position itself to generate better premium growth. McDonald’s, the world’s leading global foodservice retailer, weathered decreased revenue due to global currency fluctuation despite modest sales growth. Monthly sales fell for the first time in nine years in October, but McDonald’s same-store sales otherwise increased in many regions and sales rebounded in November. Medical equipment manufacturer Hill-Rom Holdings experienced decreased fiscal year earnings stemming from an adverse geographic and product mix, increased expenses from research and development and litigation, costs from its acquisition of Volker and Aspen Surgical, and declining North American sales caused by hospital cost control initiatives.
During the period, we initiated new positions in oil and gas exploration and production company Occidental Petroleum (10 years of consecutive dividend increases), largest U.S. drug store operator Walgreen (37 years), publisher John Wiley & Sons (19 years), maintenance and operating supply distributor W.W. Grainger (41 years) and discount retail apparel and home accessories store operator Ross Stores (18 years).
We made significant additions to holdings of global auto components and building efficiency systems and service provider Johnson Controls, which has had a solid history of dividend increases, water and electronic end markets manufacturer Pentair (37 years of consecutive dividend increases), manufacturer and distributor of specialty chemicals Albemarle (18 years), large integrated energy company Chevron (25 years), agricultural processor Archer-Daniels-Midland (37 years) and therapeutic and diagnostics products manufacturer Medtronic (35 years), and made smaller additions to 10 other positions.
We liquidated our positions in Hudson City Bancorp, U.S. Bancorp, Trustco Bank and People’s Bancorp during the period. We also made significant reductions to our positions in Abbott Laboratories, Wal-Mart
Top 10 Holdings
Franklin Rising Dividends Securities Fund 12/31/12
| | | | |
Company
Sector/Industry | | % of Total
Net Assets | |
| Roper Industries Inc. | | | 4.9% | |
| Electrical Equipment | | | | |
| Praxair Inc. | | | 4.7% | |
| Materials | | | | |
| United Technologies Corp. | | | 4.6% | |
| Aerospace & Defense | | | | |
| International Business Machines Corp. | | | 4.6% | |
| Software & Services | | | | |
| Dover Corp. | | | 4.2% | |
| Machinery | | | | |
| Chevron Corp. | | | 3.8% | |
| Energy | | | | |
| Wal-Mart Stores Inc. | | | 3.6% | |
| Food & Staples Retailing | | | | |
| The Procter & Gamble Co. | | | 3.3% | |
| Household & Personal Products | |
| Family Dollar Stores Inc. | | | 3.3% | |
| Retailing | | | | |
| West Pharmaceutical Services Inc. | | | 3.3% | |
| Health Care Equipment & Services | | | | |
The dollar value, number of shares or principal amount, and names of all portfolio holdings are listed in the Fund’s Statement of Investments (SOI).
FRD-4
Stores, Becton Dickinson and McCormick & Co., and made smaller reductions to several other holdings.
Our 10 largest positions on December 31, 2012, represented 40.3% of the Fund’s total net assets. It is interesting to note how these 10 companies would respond, in aggregate, to the Fund’s screening criteria based on a simple average of statistical measures. On average, these 10 companies have raised their dividends 31 years in a row and by 281% in the past 10 years. Their most recent year-over-year dividend increases averaged 11.5% with a yield of 2.1% on December 31, 2012, and a dividend payout ratio of 31.7%, based on estimates of calendar year 2012 operating earnings. The average price/earnings ratio was 16.2 times calendar year 2012 estimates versus 14.1 for that of the unmanaged S&P 500.
Thank you for your participation in Franklin Rising Dividends Securities Fund. We look forward to serving your future investment needs.
The foregoing information reflects our analysis, opinions and portfolio holdings as of December 31, 2012, the end of the reporting period. The way we implement our main investment strategies and the resulting portfolio holdings may change depending on factors such as market and economic conditions. These opinions may not be relied upon as investment advice or an offer for a particular security. The information is not a complete analysis of every aspect of any market, country, industry, security or the Fund. Statements of fact are from sources considered reliable, but the investment manager makes no representation or warranty as to their completeness or accuracy. Although historical performance is no guarantee of future results, these insights may help you understand our investment management philosophy.
FRD-5
Fund Expenses
As an investor in a variable insurance contract (Contract) that indirectly provides for investment in an underlying mutual fund, you can incur transaction and/or ongoing expenses at both the Fund level and the Contract level.
| • | | Transaction expenses can include sales charges (loads) on purchases, redemption fees, surrender fees, transfer fees and premium taxes. |
| • | | Ongoing expenses can include management fees, distribution and service (12b-1) fees, contract fees, annual maintenance fees, mortality and expense risk fees and other fees and expenses. All mutual funds and Contracts have some types of ongoing expenses. |
The expenses shown in the table are meant to highlight ongoing expenses at the Fund level only and do not include ongoing expenses at the Contract level, or transaction expenses at either the Fund or Contract level. While the Fund does not have transaction expenses, if the transaction and ongoing expenses at the Contract level were included, the expenses shown would be higher. You should consult your Contract prospectus or disclosure document for more information.
The table shows Fund-level ongoing expenses and can help you understand these expenses and compare them with those of other mutual funds offered through the Contract. The table assumes a $1,000 investment held for the six months indicated. Please refer to the Fund prospectus for additional information on operating expenses.
Actual Fund Expenses
The first line (Actual) of the table provides actual account values and expenses. The “Ending Account Value” is derived from the Fund’s actual return, which includes the effect of ongoing Fund expenses, but does not include the effect of ongoing Contract expenses.
You can estimate the Fund-level expenses you incurred during the period by following these steps. Of course, your account value and expenses will differ from those in this illustration:
| 1. | Divide your account value by $1,000. |
If an account had an $8,600 value, then $8,600 ÷ $1,000 = 8.6.
| 2. | Multiply the result by the number under the heading “Fund-Level Expenses Incurred During Period.” |
If Fund-Level Expenses Incurred During Period were $7.50, then 8.6 x $7.50 = $64.50.
In this illustration, the estimated expenses incurred this period at the Fund level are $64.50.
Franklin Rising Dividends Securities Fund – Class 2
FRD-6
Hypothetical Example for Comparison with Other Mutual Funds
Information in the second line (Hypothetical) of the table can help you compare ongoing expenses of the Fund with those of other mutual funds offered through the Contract. This information may not be used to estimate the actual ending account balance or expenses you incurred during the period. The hypothetical “Ending Account Value” is based on the Fund’s actual expense ratio and an assumed 5% annual rate of return before expenses, which does not represent the Fund’s actual return. The figure under the heading “Fund-Level Expenses Incurred During Period” shows the hypothetical expenses your account would have incurred under this scenario. You can compare this figure with the 5% hypothetical examples that appear in shareholder reports of other funds offered through a Contract.
| | | | | | | | | | | | |
| Class 2 | | Beginning
Account Value 7/1/12 | | | Ending
Account
Value 12/31/12 | | | Fund-Level Expenses Incurred
During Period* 7/1/12–12/31/12 | |
Actual | | $ | 1,000 | | | $ | 1,071.80 | | | $ | 4.58 | |
Hypothetical (5% return
before expenses) | | $ | 1,000 | | | $ | 1,020.71 | | | $ | 4.47 | |
*Expenses are calculated using the most recent six-month annualized expense ratio for the Fund’s Class 2 shares (0.88%), which does not include any ongoing expenses of the Contract for which the Fund is an investment option, multiplied by the average account value over the period, multiplied by 184/366 to reflect the one-half year period.
FRD-7
Franklin Templeton Variable Insurance Products Trust
Financial Highlights
Franklin Rising Dividends Securities Fund
| | | | | | | | | | | | | | | | | | | | |
| | | Year Ended December 31, | |
| Class 1 | | 2012 | | | 2011 | | | 2010 | | | 2009 | | | 2008 | |
| | | | |
Per share operating performance | | | | | | | | | | | | | | | | | | | | |
(for a share outstanding throughout the year) | | | | | | | | | | | | | | | | | | | | |
Net asset value, beginning of year | | $ | 20.01 | | | $ | 19.15 | | | $ | 16.13 | | | $ | 13.96 | | | $ | 19.61 | |
| | | | |
Income from investment operationsa: | | | | | | | | | | | | | | | | | | | | |
Net investment incomeb | | | 0.41 | | | | 0.36 | | | | 0.32 | | | | 0.14 | c | | | 0.35 | |
Net realized and unrealized gains (losses) | | | 2.00 | | | | 0.83 | | | | 3.01 | | | | 2.28 | | | | (5.51 | ) |
| | | | |
Total from investment operations | | | 2.41 | | | | 1.19 | | | | 3.33 | | | | 2.42 | | | | (5.16 | ) |
| | | | |
Less distributions from: | | | | | | | | | | | | | | | | | | | | |
Net investment income | | | (0.39 | ) | | | (0.33 | ) | | | (0.31 | ) | | | (0.25 | ) | | | (0.36 | ) |
Net realized gains | | | — | | | | — | | | | — | | | | — | | | | (0.13 | ) |
| | | | |
Total distributions | | | (0.39 | ) | | | (0.33 | ) | | | (0.31 | ) | | | (0.25 | ) | | | (0.49 | ) |
| | | | |
Net asset value, end of year | | $ | 22.03 | | | $ | 20.01 | | | $ | 19.15 | | | $ | 16.13 | | | $ | 13.96 | |
| | | | |
| | | | | |
Total returnd | | | 12.18% | | | | 6.29% | | | | 20.94% | | | | 17.67% | | | | (26.94)% | |
Ratios to average net assets | | | | | | | | | | | | | | | | | | | | |
Expenses | | | 0.63% | | | | 0.63% | | | | 0.64% | | | | 0.65% | e | | | 0.61% | e |
Net investment income | | | 1.96% | | | | 1.87% | | | | 1.88% | | | | 0.99% | c | | | 2.05% | |
| | | | | |
Supplemental data | | | | | | | | | | | | | | | | | | | | |
Net assets, end of year (000’s) | | $ | 141,455 | | | $ | 140,297 | | | $ | 148,544 | | | $ | 139,816 | | | $ | 142,862 | |
Portfolio turnover rate | | | 11.19% | | | | 12.76% | | | | 8.97% | | | | 16.99% | | | | 5.39% | |
aThe amount shown for a share outstanding throughout the period may not correlate with the Statement of Operations for the period due to the timing of sales and repurchases of the Fund shares in relation to income earned and/or fluctuating market value of the investments of the Fund.
bBased on average daily shares outstanding.
cNet investment income per share includes approximately $(0.15) per share as a return of capital adjustment to a previously recorded special dividend received by the Fund. Excluding this non-recurring amount, the ratio of net investment income to average net assets would have been 2.07%. See Note 1(c).
dTotal return does not include fees, charges or expenses imposed by the variable annuity and life insurance contracts for which the Franklin Templeton Variable Insurance Products Trust serves as an underlying investment vehicle.
eBenefit of expense reduction rounds to less than 0.01%.
The accompanying notes are an integral part of these financial statements.
FRD-8
Franklin Templeton Variable Insurance Products Trust
Financial Highlights (continued)
Franklin Rising Dividends Securities Fund
| | | | | | | | | | | | | | | | | | | | |
| | | Year Ended December 31, | |
| Class 2 | | 2012 | | | 2011 | | | 2010 | | | 2009 | | | 2008 | |
| | | | |
Per share operating performance | | | | | | | | | | | | | | | | | | | | |
(for a share outstanding throughout the year) | | | | | | | | | | | | | | | | | | | | |
Net asset value, beginning of year | | $ | 19.65 | | | $ | 18.82 | | | $ | 15.86 | | | $ | 13.72 | | | $ | 19.27 | |
| | | | |
Income from investment operationsa: | | | | | | | | | | | | | | | | | | | | |
Net investment incomeb | | | 0.35 | | | | 0.31 | | | | 0.28 | | | | 0.10 | c | | | 0.31 | |
Net realized and unrealized gains (losses) | | | 1.98 | | | | 0.81 | | | | 2.95 | | | | 2.24 | | | | (5.42 | ) |
| | | | |
Total from investment operations | | | 2.33 | | | | 1.12 | | | | 3.23 | | | | 2.34 | | | | (5.11 | ) |
| | | | |
Less distributions from: | | | | | | | | | | | | | | | | | | | | |
Net investment income | | | (0.34 | ) | | | (0.29 | ) | | | (0.27 | ) | | | (0.20 | ) | | | (0.31 | ) |
Net realized gains | | | — | | | | — | | | | — | | | | — | | | | (0.13 | ) |
| | | | |
Total distributions | | | (0.34 | ) | | | (0.29 | ) | | | (0.27 | ) | | | (0.20 | ) | | | (0.44 | ) |
| | | | |
Net asset value, end of year | | $ | 21.64 | | | $ | 19.65 | | | $ | 18.82 | | | $ | 15.86 | | | $ | 13.72 | |
| | | | |
| | | | | |
Total returnd | | | 11.96% | | | | 6.00% | | | | 20.64% | | | | 17.34% | | | | (27.10)% | |
Ratios to average net assets | | | | | | | | | | | | | | | | | | | | |
Expenses | | | 0.88% | | | | 0.88% | | | | 0.89% | | | | 0.90% | e | | | 0.86% | e |
Net investment income | | | 1.71% | | | | 1.62% | | | | 1.63% | | | | 0.74% | c | | | 1.80% | |
| | | | | |
Supplemental data | | | | | | | | | | | | | | | | | | | | |
Net assets, end of year (000’s) | | $ | 1,550,084 | | | $ | 1,523,396 | | | $ | 1,572,732 | | | $ | 1,371,351 | | | $ | 1,286,878 | |
Portfolio turnover rate | | | 11.19% | | | | 12.76% | | | | 8.97% | | | | 16.99% | | | | 5.39% | |
aThe amount shown for a share outstanding throughout the period may not correlate with the Statement of Operations for the period due to the timing of sales and repurchases of the Fund shares in relation to income earned and/or fluctuating market value of the investments of the Fund.
bBased on average daily shares outstanding.
cNet investment income per share includes approximately $(0.15) per share as a return of capital adjustment to a previously recorded special dividend received by the Fund. Excluding this non-recurring amount, the ratio of net investment income to average net assets would have been 1.82%. See Note 1(c).
dTotal return does not include fees, charges or expenses imposed by the variable annuity and life insurance contracts for which the Franklin Templeton Variable Insurance Products Trust serves as an underlying investment vehicle.
eBenefit of expense reduction rounds to less than 0.01%.
The accompanying notes are an integral part of these financial statements.
FRD-9
Franklin Templeton Variable Insurance Products Trust
Financial Highlights (continued)
Franklin Rising Dividends Securities Fund
| | | | | | | | | | | | | | | | | | | | |
| | | Year Ended December 31, | |
| Class 4 | | 2012 | | | 2011 | | | 2010 | | | 2009 | | | 2008a | |
| | | | |
Per share operating performance | | | | | | | | | | | | | | | | | | | | |
(for a share outstanding throughout the year) | | | | | | | | | | | | | | | | | | | | |
Net asset value, beginning of year | | $ | 19.83 | | | $ | 19.04 | | | $ | 16.09 | | | $ | 13.92 | | | $ | 18.51 | |
| | | | |
Income from investment operationsb: | | | | | | | | | | | | | | | | | | | | |
Net investment incomec | | | 0.35 | | | | 0.31 | | | | 0.32 | | | | 0.13 | d | | | 0.26 | |
Net realized and unrealized gains (losses) | | | 1.96 | | | | 0.80 | | | | 2.94 | | | | 2.24 | | | | (4.36 | ) |
| | | | |
Total from investment operations | | | 2.31 | | | | 1.11 | | | | 3.26 | | | | 2.37 | | | | (4.10 | ) |
| | | | |
Less distributions from: | | | | | | | | | | | | | | | | | | | | |
Net investment income | | | (0.36 | ) | | | (0.32 | ) | | | (0.31 | ) | | | (0.20 | ) | | | (0.36 | ) |
Net realized gains | | | — | | | | — | | | | — | | | | — | | | | (0.13 | ) |
| | | | |
Total distributions | | | (0.36 | ) | | | (0.32 | ) | | | (0.31 | ) | | | (0.20 | ) | | | (0.49 | ) |
| | | | |
Net asset value, end of year | | $ | 21.78 | | | $ | 19.83 | | | $ | 19.04 | | | $ | 16.09 | | | $ | 13.92 | |
| | | | |
| | | | | |
Total returne | | | 11.78% | | | | 5.89% | | | | 20.62% | | | | 17.22% | | | | (22.82)% | |
Ratios to average net assetsf | | | | | | | | | | | | | | | | | | | | |
Expenses | | | 0.98% | | | | 0.98% | | | | 0.99% | | | | 1.00% | g | | | 0.96% | g |
Net investment income | | | 1.61% | | | | 1.52% | | | | 1.53% | | | | 0.64% | d | | | 1.70% | |
| | | | | |
Supplemental data | | | | | | | | | | | | | | | | | | | | |
Net assets, end of year (000’s) | | $ | 6,432 | | | $ | 3,020 | | | $ | 1,007 | | | $ | 15 | | | $ | 4 | |
Portfolio turnover rate | | | 11.19% | | | | 12.76% | | | | 8.97% | | | | 16.99% | | | | 5.39% | |
aFor the period February 29, 2008 (effective date) to December 31, 2008.
bThe amount shown for a share outstanding throughout the period may not correlate with the Statement of Operations for the period due to the timing of sales and repurchases of the Fund shares in relation to income earned and/or fluctuating market value of the investments of the Fund.
cBased on average daily shares outstanding.
dNet investment income per share includes approximately $(0.15) per share as a return of capital adjustment to a previously recorded special dividend received by the Fund. Excluding this non-recurring amount, the ratio of net investment income to average net assets would have been 1.72%. See Note 1(c).
eTotal return does not include fees, charges or expenses imposed by the variable annuity and life insurance contracts for which the Franklin Templeton Variable Insurance Products Trust serves as an underlying investment vehicle. Total return is not annualized for periods less than one year.
fRatios are annualized for periods less than one year.
gBenefit of expense reduction rounds to less than 0.01%.
The accompanying notes are an integral part of these financial statements.
FRD-10
Franklin Templeton Variable Insurance Products Trust
Statement of Investments, December 31, 2012
| | | | | | | | |
| Franklin Rising Dividends Securities Fund | | Shares | | | Value | |
Common Stocks 98.3% | | | | | | | | |
Aerospace & Defense 4.7% | | | | | | | | |
General Dynamics Corp. | | | 38,000 | | | $ | 2,632,260 | |
United Technologies Corp. | | | 951,400 | | | | 78,024,314 | |
| | | | | | | | |
| | | | | | | 80,656,574 | |
| | | | | | | | |
Automobiles & Components 1.9% | | | | | | | | |
Johnson Controls Inc. | | | 1,040,500 | | | | 31,943,350 | |
| | | | | | | | |
Commercial & Professional Services 1.8% | | | | | | | | |
ABM Industries Inc. | | | 951,288 | | | | 18,978,196 | |
Cintas Corp. | | | 267,700 | | | | 10,948,930 | |
| | | | | | | | |
| | | | | | | 29,927,126 | |
| | | | | | | | |
Consumer Durables & Apparel 3.0% | | | | | | | | |
aKid Brands Inc. | | | 265,947 | | | | 412,218 | |
Leggett & Platt Inc. | | | 681,800 | | | | 18,558,596 | |
NIKE Inc., B | | | 554,000 | | | | 28,586,400 | |
Superior Uniform Group Inc. | | | 237,100 | | | | 2,712,424 | |
| | | | | | | | |
| | | | | | | 50,269,638 | |
| | | | | | | | |
Consumer Services 3.0% | | | | | | | | |
Hillenbrand Inc. | | | 1,191,300 | | | | 26,935,293 | |
Matthews International Corp., A | | | 39,000 | | | | 1,251,900 | |
McDonald’s Corp. | | | 254,345 | | | | 22,435,772 | |
| | | | | | | | |
| | | | | | | 50,622,965 | |
| | | | | | | | |
Diversified Financials 0.4% | | | | | | | | |
State Street Corp. | | | 128,500 | | | | 6,040,785 | |
| | | | | | | | |
Electrical Equipment 6.6% | | | | | | | | |
Brady Corp., A | | | 889,579 | | | | 29,711,939 | |
Roper Industries Inc. | | | 739,250 | | | | 82,411,590 | |
| | | | | | | | |
| | | | | | | 112,123,529 | |
| | | | | | | | |
Energy 6.9% | | | | | | | | |
Chevron Corp. | | | 601,000 | | | | 64,992,140 | |
Exxon Mobil Corp. | | | 330,500 | | | | 28,604,775 | |
Occidental Petroleum Corp. | | | 312,190 | | | | 23,916,876 | |
| | | | | | | | |
| | | | | | | 117,513,791 | |
| | | | | | | | |
Food & Staples Retailing 4.7% | | | | | | | | |
Wal-Mart Stores Inc. | | | 883,800 | | | | 60,301,674 | |
Walgreen Co. | | | 531,300 | | | | 19,663,413 | |
| | | | | | | | |
| | | | | | | 79,965,087 | |
| | | | | | | | |
Food, Beverage & Tobacco 4.5% | | | | | | | | |
Archer-Daniels-Midland Co. | | | 713,000 | | | | 19,529,070 | |
McCormick & Co. Inc. | | | 502,000 | | | | 31,892,060 | |
PepsiCo Inc. | | | 363,900 | | | | 24,901,677 | |
| | | | | | | | |
| | | | | | | 76,322,807 | |
| | | | | | | | |
Health Care Equipment & Services 15.2% | | | | | | | | |
Abbott Laboratories | | | 681,800 | | | | 44,657,900 | |
Becton, Dickinson and Co. | | | 630,143 | | | | 49,270,881 | |
Hill-Rom Holdings Inc. | | | 315,103 | | | | 8,980,436 | |
Medtronic Inc. | | | 730,000 | | | | 29,944,600 | |
Stryker Corp. | | | 630,400 | | | | 34,558,528 | |
FRD-11
Franklin Templeton Variable Insurance Products Trust
Statement of Investments, December 31, 2012 (continued)
| | | | | | | | |
| Franklin Rising Dividends Securities Fund | | Shares | | | Value | |
Common Stocks (continued) | | | | | | | | |
Health Care Equipment & Services (continued) | | | | | | | | |
Teleflex Inc. | | | 506,753 | | | $ | 36,136,556 | |
West Pharmaceutical Services Inc. | | | 1,007,600 | | | | 55,166,100 | |
| | | | | | | | |
| | | | | | | 258,715,001 | |
| | | | | | | | |
Household & Personal Products 3.9% | | | | | | | | |
Colgate-Palmolive Co. | | | 95,500 | | | | 9,983,570 | |
The Procter & Gamble Co. | | | 833,100 | | | | 56,559,159 | |
| | | | | | | | |
| | | | | | | 66,542,729 | |
| | | | | | | | |
Industrial Conglomerates 0.3% | | | | | | | | |
Carlisle Cos. Inc. | | | 96,261 | | | | 5,656,296 | |
| | | | | | | | |
Insurance 6.7% | | | | | | | | |
Aflac Inc. | | | 276,200 | | | | 14,671,744 | |
Arthur J. Gallagher & Co. | | | 753,000 | | | | 26,091,450 | |
The Chubb Corp. | | | 45,000 | | | | 3,389,400 | |
Erie Indemnity Co., A | | | 613,585 | | | | 42,472,354 | |
Mercury General Corp. | | | 154,200 | | | | 6,120,198 | |
Old Republic International Corp. | | | 1,069,708 | | | | 11,392,390 | |
RLI Corp. | | | 147,571 | | | | 9,541,941 | |
| | | | | | | | |
| | | | | | | 113,679,477 | |
| | | | | | | | |
Machinery 7.4% | | | | | | | | |
Donaldson Co. Inc. | | | 350,068 | | | | 11,496,233 | |
Dover Corp. | | | 1,096,700 | | | | 72,064,157 | |
Pentair Ltd. | | | 844,000 | | | | 41,482,600 | |
| | | | | | | | |
| | | | | | | 125,042,990 | |
| | | | | | | | |
Materials 12.9% | | | | | | | | |
Air Products and Chemicals Inc. | | | 580,700 | | | | 48,790,414 | |
Albemarle Corp. | | | 694,700 | | | | 43,154,764 | |
Bemis Co. Inc. | | | 631,300 | | | | 21,123,298 | |
Ecolab Inc. | | | 66,000 | | | | 4,745,400 | |
Nucor Corp. | | | 499,002 | | | | 21,546,906 | |
Praxair Inc. | | | 736,260 | | | | 80,583,657 | |
| | | | | | | | |
| | | | | | | 219,944,439 | |
| | | | | | | | |
Media 0.3% | | | | | | | | |
John Wiley & Sons Inc., A | | | 116,500 | | | | 4,535,345 | |
| | | | | | | | |
Pharmaceuticals, Biotechnology & Life Sciences 6.2% | | | | | | | | |
Johnson & Johnson | | | 726,100 | | | | 50,899,610 | |
Pfizer Inc. | | | 2,158,100 | | | | 54,125,148 | |
| | | | | | | | |
| | | | | | | 105,024,758 | |
| | | | | | | | |
Retailing 3.3% | | | | | | | | |
Family Dollar Stores Inc. | | | 886,335 | | | | 56,202,502 | |
Ross Stores Inc. | | | 3,000 | | | | 162,450 | |
| | | | | | | | |
| | | | | | | 56,364,952 | |
| | | | | | | | |
Semiconductors & Semiconductor Equipment 0.0%† | | | | | | | | |
Cohu Inc. | | | 50,300 | | | | 545,252 | |
| | | | | | | | |
Software & Services 4.6% | | | | | | | | |
International Business Machines Corp. | | | 406,500 | | | | 77,865,075 | |
| | | | | | | | |
FRD-12
Franklin Templeton Variable Insurance Products Trust
Statement of Investments, December 31, 2012 (continued)
| | | | | | | | |
| Franklin Rising Dividends Securities Fund | | Shares | | | Value | |
Common Stocks (continued) | | | | | | | | |
Trading Companies & Distributors 0.0%† | | | | | | | | |
W.W. Grainger Inc. | | | 1,000 | | | $ | 202,370 | |
| | | | | | | | |
Total Common Stocks (Cost $1,103,470,158) | | | | | | | 1,669,504,336 | |
| | | | | | | | |
Short Term Investments (Cost $31,734,154) 1.9% | | | | | | | | |
Money Market Funds 1.9% | | | | | | | | |
a,bInstitutional Fiduciary Trust Money Market Portfolio | | | 31,734,154 | | | | 31,734,154 | |
| | | | | | | | |
Total Investments (Cost $1,135,204,312) 100.2% | | | | | | | 1,701,238,490 | |
Other Assets, less Liabilities (0.2)% | | | | | | | (3,267,205 | ) |
| | | | | | | | |
Net Assets 100.0% | | | | | | $ | 1,697,971,285 | |
| | | | | | | | |
†Rounds to less than 0.1% of net assets.
aNon-income producing.
bSee Note 7 regarding investments in the Institutional Fiduciary Trust Money Market Portfolio.
The accompanying notes are an integral part of these financial statements.
FRD-13
Franklin Templeton Variable Insurance Products Trust
Financial Statements
Statement of Assets and Liabilities
December 31, 2012
| | | | |
| | | Franklin Rising
Dividends
Securities Fund | |
Assets: | | | | |
Investments in securities: | | | | |
Cost - Unaffiliated issuers | | $ | 1,103,470,158 | |
Cost - Sweep Money Fund (Note 7) | | | 31,734,154 | |
| | | | |
Total cost of investments | | $ | 1,135,204,312 | |
| | | | |
Value - Unaffiliated issuers | | $ | 1,669,504,336 | |
Value - Sweep Money Fund (Note 7) | | | 31,734,154 | |
| | | | |
Total value of investments | | | 1,701,238,490 | |
Cash | | | 3,018 | |
Receivables: | | | | |
Capital shares sold | | | 288,714 | |
Dividends | | | 1,276,593 | |
Other assets | | | 38 | |
| | | | |
Total assets | | | 1,702,806,853 | |
| | | | |
Liabilities: | | | | |
Payables: | | | | |
Capital shares redeemed | | | 3,001,839 | |
Affiliates | | | 1,519,628 | |
Reports to shareholders | | | 244,448 | |
Accrued expenses and other liabilities | | | 69,653 | |
| | | | |
Total liabilities | | | 4,835,568 | |
| | | | |
Net assets, at value | | $ | 1,697,971,285 | |
| | | | |
Net assets consist of: | | | | |
Paid-in capital | | $ | 1,177,308,708 | |
Undistributed net investment income | | | 29,420,653 | |
Net unrealized appreciation (depreciation) | | | 566,034,178 | |
Accumulated net realized gain (loss) | | | (74,792,254 | ) |
| | | | |
Net assets, at value | | $ | 1,697,971,285 | |
| | | | |
Class 1: | | | | |
Net assets, at value | | $ | 141,455,011 | |
| | | | |
Shares outstanding | | | 6,420,217 | |
| | | | |
Net asset value and maximum offering price per share | | $ | 22.03 | |
| | | | |
Class 2: | | | | |
Net assets, at value | | $ | 1,550,084,159 | |
| | | | |
Shares outstanding | | | 71,636,845 | |
| | | | |
Net asset value and maximum offering price per share | | $ | 21.64 | |
| | | | |
Class 4: | | | | |
Net assets, at value | | $ | 6,432,115 | |
| | | | |
Shares outstanding | | | 295,313 | |
| | | | |
Net asset value and maximum offering price per share | | $ | 21.78 | |
| | | | |
The accompanying notes are an integral part of these financial statements.
FRD-14
Franklin Templeton Variable Insurance Products Trust
Financial Statements (continued)
Statement of Operations
for the year ended December 31, 2012
| | | | |
| | | Franklin Rising
Dividends
Securities Fund | |
Investment income: | | | | |
Dividends | | $ | 43,977,861 | |
| | | | |
Expenses: | | | | |
Management fees (Note 3a) | | | 10,273,181 | |
Distribution fees: (Note 3c) | | | | |
Class 2 | | | 3,876,597 | |
Class 4 | | | 17,144 | |
Unaffiliated transfer agent fees | | | 793 | |
Custodian fees (Note 4) | | | 24,360 | |
Reports to shareholders | | | 255,461 | |
Professional fees | | | 61,758 | |
Trustees’ fees and expenses | | | 6,676 | |
Other | | | 36,301 | |
| | | | |
Total expenses | | | 14,552,271 | |
| | | | |
Net investment income | | | 29,425,590 | |
| | | | |
Realized and unrealized gains (losses): | | | | |
Net realized gain (loss) from investments | | | 50,961,507 | |
Net change in unrealized appreciation (depreciation) on investments | | | 110,558,680 | |
| | | | |
Net realized and unrealized gain (loss) | | | 161,520,187 | |
| | | | |
Net increase (decrease) in net assets resulting from operations | | $ | 190,945,777 | |
| | | | |
The accompanying notes are an integral part of these financial statements.
FRD-15
Franklin Templeton Variable Insurance Products Trust
Financial Statements (continued)
Statements of Changes in Net Assets
| | | | | | | | |
| | | Franklin Rising Dividends
Securities Fund | |
| | | Year Ended December 31, | |
| | | 2012 | | | 2011 | |
| | | | |
Increase (decrease) in net assets: | | | | | | | | |
Operations: | | | | | | | | |
Net investment income | | $ | 29,425,590 | | | $ | 27,655,892 | |
Net realized gain (loss) from investments | | | 50,961,507 | | | | 120,463,536 | |
Net change in unrealized appreciation (depreciation) on investments | | | 110,558,680 | | | | (50,218,731 | ) |
| | | | |
Net increase (decrease) in net assets resulting from operations | | | 190,945,777 | | | | 97,900,697 | |
| | | | |
Distributions to shareholders from: | | | | | | | | |
Net investment income: | | | | | | | | |
Class 1 | | | (2,577,724 | ) | | | (2,458,866 | ) |
Class 2 | | | (24,994,784 | ) | | | (23,318,584 | ) |
Class 4 | | | (85,528 | ) | | | (30,729 | ) |
| | | | |
Total distributions to shareholders | | | (27,658,036 | ) | | | (25,808,179 | ) |
| | | | |
Capital share transactions: (Note 2) | | | | | | | | |
Class 1 | | | (12,542,862 | ) | | | (14,479,695 | ) |
Class 2 | | | (122,472,505 | ) | | | (115,088,554 | ) |
Class 4 | | | 2,986,631 | | | | 1,904,859 | |
| | | | |
Total capital share transactions | | | (132,028,736 | ) | | | (127,663,390 | ) |
| | | | |
Net increase (decrease) in net assets | | | 31,259,005 | | | | (55,570,872 | ) |
Net assets: | | | | | | | | |
Beginning of year | | | 1,666,712,280 | | | | 1,722,283,152 | |
| | | | |
End of year | | $ | 1,697,971,285 | | | $ | 1,666,712,280 | |
| | | | |
Undistributed net investment income included in net assets: | | | | | | | | |
End of year | | $ | 29,420,653 | | | $ | 27,653,099 | |
| | | | |
The accompanying notes are an integral part of these financial statements.
FRD-16
Franklin Templeton Variable Insurance Products Trust
Notes to Financial Statements
Franklin Rising Dividends Securities Fund
1. ORGANIZATION AND SIGNIFICANT ACCOUNTING POLICIES
Franklin Templeton Variable Insurance Products Trust (Trust) is registered under the Investment Company Act of 1940, as amended, (1940 Act) as an open-end investment company, consisting of twenty separate funds. The Franklin Rising Dividends Securities Fund (Fund) is included in this report. The financial statements of the remaining funds in the Trust are presented separately. Shares of the Fund are generally sold only to insurance company separate accounts to fund the benefits of variable life insurance policies or variable annuity contracts. At December 31, 2012, 54.79% of the Fund’s shares were held through one insurance company. The Fund offers three classes of shares: Class 1, Class 2 and Class 4. Each class of shares differs by its distribution fees, voting rights on matters affecting a single class and its exchange privilege.
The following summarizes the Fund’s significant accounting policies.
a. Financial Instrument Valuation
The Fund’s investments in financial instruments are carried at fair value daily. Fair value is the price that would be received to sell an asset or paid to transfer a liability in an orderly transaction between market participants on the measurement date. Under procedures approved by the Trust’s Board of Trustees (the Board), the Fund’s administrator, investment manager and other affiliates have formed the Valuation and Liquidity Oversight Committee (VLOC). The VLOC provides administration and oversight of the Fund’s valuation policies and procedures, which are approved annually by the Board. Among other things, these procedures allow the Fund to utilize independent pricing services, quotations from securities and financial instrument dealers, and other market sources to determine fair value.
Equity securities listed on an exchange or on the NASDAQ National Market System are valued at the last quoted sale price or the official closing price of the day, respectively. Over-the-counter (OTC) securities are valued within the range of the most recent quoted bid and ask prices. Securities that trade in multiple markets or on multiple exchanges are valued according to the broadest and most representative market. Certain equity securities are valued based upon fundamental characteristics or relationships to similar securities. Investments in open-end mutual funds are valued at the closing net asset value.
The Fund has procedures to determine the fair value of financial instruments for which market prices are not reliable or readily available. Under these procedures, the VLOC convenes on a regular basis to review such financial instruments and considers a number of factors, including significant unobservable valuation inputs, when arriving at fair value. The VLOC primarily employs a market-based approach which may use related or comparable assets or liabilities, recent transactions, market multiples, book values, and other relevant information for the investment to determine the fair value of the investment. An income-based valuation approach may also be used in which the anticipated future cash flows of the investment are discounted to calculate fair value. Discounts may also be applied due to the nature or duration of any restrictions on the disposition of the investments. Due to the inherent uncertainty of valuations of such investments, the fair values may differ significantly from the values that would have been used had an active market existed. The VLOC employs various methods for calibrating these valuation approaches including a regular review of key inputs and assumptions, transactional back-testing or disposition analysis, and reviews of any related market activity.
b. Income Taxes
It is the Fund’s policy to qualify as a regulated investment company under the Internal Revenue Code. The Fund intends to distribute to shareholders substantially all of its taxable income and net realized gains to relieve it from federal income and if applicable, excise taxes. As a result, no provision for U.S. federal income taxes is required.
The Fund recognizes the tax benefits of uncertain tax positions only when the position is “more likely than not” to be sustained upon examination by the tax authorities based on the technical merits of the tax position. As of December 31, 2012, and for all open tax years, the Fund has determined that no liability for unrecognized tax benefits is required in the Fund’s financial statements related to uncertain tax positions taken on a tax return (or expected to be taken on future tax returns). Open tax years are those that remain subject to examination and are based on each tax jurisdiction statute of limitation.
FRD-17
Franklin Templeton Variable Insurance Products Trust
Notes to Financial Statements (continued)
Franklin Rising Dividends Securities Fund
1. ORGANIZATION AND SIGNIFICANT ACCOUNTING POLICIES (continued)
c. Security Transactions, Investment Income, Expenses and Distributions
Security transactions are accounted for on trade date. Realized gains and losses on security transactions are determined on a specific identification basis. Estimated expenses are accrued daily. Dividend income is recorded on the ex-dividend date. Distributions to shareholders are recorded on the ex-dividend date and are determined according to income tax regulations (tax basis). Distributable earnings determined on a tax basis may differ from earnings recorded in accordance with accounting principles generally accepted in the United States of America. These differences may be permanent or temporary. Permanent differences are reclassified among capital accounts to reflect their tax character. These reclassifications have no impact on net assets or the results of operations. Temporary differences are not reclassified, as they may reverse in subsequent periods.
Common expenses incurred by the Trust are allocated among the funds based on the ratio of net assets of each fund to the combined net assets of the Trust. Fund specific expenses are charged directly to the fund that incurred the expense.
Realized and unrealized gains and losses and net investment income, not including class specific expenses, are allocated daily to each class of shares based upon the relative proportion of net assets of each class. Differences in per share distributions, by class, are generally due to differences in class specific expenses.
Distributions received by the Fund from certain securities may be a return of capital (ROC). Such distributions reduce the cost basis of the securities, and any distributions in excess of the cost basis are recognized as capital gains.
d. Accounting Estimates
The preparation of financial statements in accordance with accounting principles generally accepted in the United States of America requires management to make estimates and assumptions that affect the reported amounts of assets and liabilities at the date of the financial statements and the amounts of income and expenses during the reporting period. Actual results could differ from those estimates.
e. Guarantees and Indemnifications
Under the Trust’s organizational documents, its officers and trustees are indemnified by the Trust against certain liabilities arising out of the performance of their duties to the Trust. Additionally, in the normal course of business, the Trust, on behalf of the Fund, enters into contracts with service providers that contain general indemnification clauses. The Trust’s maximum exposure under these arrangements is unknown as this would involve future claims that may be made against the Trust that have not yet occurred. Currently, the Trust expects the risk of loss to be remote.
2. SHARES OF BENEFICIAL INTEREST
At December 31, 2012, there were an unlimited number of shares authorized (without par value). Transactions in the Fund’s shares were as follows:
| | | | | | | | | | | | | | | | |
| | | Year Ended December 31, | |
| | | 2012 | | | 2011 | |
| Class 1 Shares: | | Shares | | | Amount | | | Shares | | | Amount | |
Shares sold | | | 217,372 | | | $ | 4,539,862 | | | | 601,890 | | | $ | 11,765,470 | |
Shares issued in reinvestment of distributions | | | 125,681 | | | | 2,577,724 | | | | 126,876 | | | | 2,458,866 | |
Shares redeemed | | | (935,039 | ) | | | (19,660,448 | ) | | | (1,473,505 | ) | | | (28,704,031 | ) |
| | | | |
Net increase (decrease) | | | (591,986 | ) | | $ | (12,542,862 | ) | | | (744,739 | ) | | $ | (14,479,695 | ) |
| | | | |
FRD-18
Franklin Templeton Variable Insurance Products Trust
Notes to Financial Statements (continued)
Franklin Rising Dividends Securities Fund
2. SHARES OF BENEFICIAL INTEREST (continued)
| | | | | | | | | | | | | | | | |
| | | Year Ended December 31, | |
| | | 2012 | | | 2011 | |
| Class 2 Shares: | | Shares | | | Amount | | | Shares | | | Amount | |
Shares sold | | | 5,224,743 | | | $ | 107,681,716 | | | | 5,855,934 | | | $ | 111,121,703 | |
Shares issued in reinvestment of distributions | | | 1,239,206 | | | | 24,994,784 | | | | 1,222,789 | | | | 23,318,584 | |
Shares redeemed | | | (12,335,885 | ) | | | (255,149,005 | ) | | | (13,131,700 | ) | | | (249,528,841 | ) |
| | | | |
Net increase (decrease) | | | (5,871,936 | ) | | $ | (122,472,505 | ) | | | (6,052,977 | ) | | $ | (115,088,554 | ) |
| | | | |
Class 4 Shares: | | | | | | | | | | | | | | | | |
Shares sold | | | 179,113 | | | $ | 3,742,720 | | | | 125,061 | | | $ | 2,400,178 | |
Shares issued on reinvestment of distributions | | | 4,211 | | | | 85,528 | | | | 1,596 | | | | 30,729 | |
Shares redeemed | | | (40,291 | ) | | | (841,617 | ) | | | (27,259 | ) | | | (526,048 | ) |
| | | | |
Net increase (decrease) | | | 143,033 | | | $ | 2,986,631 | | | | 99,398 | | | $ | 1,904,859 | |
| | | | |
3. TRANSACTIONS WITH AFFILIATES
Franklin Resources, Inc. is the holding company for various subsidiaries that together are referred to as Franklin Templeton Investments. Certain officers and trustees of the Fund are also officers and/or directors of the following subsidiaries:
| | |
| Subsidiary | | Affiliation |
Franklin Advisory Services, LLC (Advisory Services) | | Investment manager |
Franklin Templeton Services, LLC (FT Services) | | Administrative manager |
Franklin Templeton Distributors, Inc. (Distributors) | | Principal underwriter |
Franklin Templeton Investor Services, LLC (Investor Services) | | Transfer agent |
a. Management Fees
The Fund pays an investment management fee to Advisory Services based on the average daily net assets of the Fund as follows:
| | |
| Annualized Fee Rate | | Net Assets |
| 0.750% | | Up to and including $500 million |
| 0.625% | | Over $500 million, up to and including $1 billion |
| 0.500% | | In excess of $1 billion |
b. Administrative Fees
FT Services, under terms of an agreement, provides administrative services to the Fund and is not paid by the Fund for the services.
c. Distribution Fees
The Board has adopted distribution plans for Class 2 and Class 4 shares pursuant to Rule 12b-1 under the 1940 Act. Under the Fund’s compensation distribution plans, the Fund pays Distributors for costs incurred in connection with the servicing, sale and distribution of the Fund’s shares up to 0.35% per year of its average daily net assets of each class. Some distribution fees are not charged on shares held by affiliates. The Board has agreed to limit the current rate to 0.25% per year for Class 2.
FRD-19
Franklin Templeton Variable Insurance Products Trust
Notes to Financial Statements (continued)
Franklin Rising Dividends Securities Fund
3. TRANSACTIONS WITH AFFILIATES (continued)
d. Transfer Agent Fees
Investor Services, under terms of an agreement, performs shareholder servicing for the Fund and is not paid by the Fund for the services.
4. EXPENSE OFFSET ARRANGEMENT
The Fund has entered into an arrangement with its custodian whereby credits realized as a result of uninvested cash balances are used to reduce a portion of the Fund’s custodian expenses. During the year ended December 31, 2012, there were no credits earned.
5. INCOME TAXES
For tax purposes, capital losses may be carried over to offset future capital gains, if any. Capital loss carryforwards with no expiration, if any, must be fully utilized before those losses with expiration dates.
At December 31, 2012, the Fund had capital loss carryforwards of $73,203,872 expiring in 2017. During the year ended December 31, 2012, the Fund utilized $50,961,507 of capital loss carryforwards.
The tax character of distributions paid during the years ended December 31, 2012 and 2011, was as follows:
| | | | | | | | |
| | | 2012 | | | 2011 | |
Distributions paid from ordinary income | | $ | 27,658,036 | | | $ | 25,808,179 | |
| | | | |
At December 31, 2012, the cost of investments, net unrealized appreciation (depreciation) and undistributed ordinary income for income tax purposes were as follows:
| | | | |
Cost of investments | | $ | 1,136,792,692 | |
| | | | |
| |
Unrealized appreciation | | $ | 586,478,196 | |
Unrealized depreciation | | | (22,032,398 | ) |
| | | | |
Net unrealized appreciation (depreciation) | | $ | 564,445,798 | |
| | | | |
Distributable earnings - undistributed ordinary income | | $ | 29,420,653 | |
| | | | |
Differences between income and/or capital gains as determined on a book basis and a tax basis are primarily due to differing treatment of wash sales.
6. INVESTMENT TRANSACTIONS
Purchases and sales of investments (excluding short term securities) for the year ended December 31, 2012, aggregated $182,757,606 and $258,780,243, respectively.
7. INVESTMENTS IN INSTITUTIONAL FIDUCIARY TRUST MONEY MARKET PORTFOLIO
The Fund invests in the Institutional Fiduciary Trust Money Market Portfolio (Sweep Money Fund), an open-end investment company managed by Franklin Advisers, Inc. (an affiliate of the investment manager). Management fees paid by the Fund are reduced on assets invested in the Sweep Money Fund, in an amount not to exceed the management and administrative fees paid by the Sweep Money Fund.
FRD-20
Franklin Templeton Variable Insurance Products Trust
Notes to Financial Statements (continued)
Franklin Rising Dividends Securities Fund
8. CREDIT FACILITY
The Fund, together with other U.S. registered and foreign investment funds (collectively, Borrowers), managed by Franklin Templeton Investments, are borrowers in a joint syndicated senior unsecured credit facility totaling $1.5 billion (Global Credit Facility) which matured on January 18, 2013. This Global Credit Facility provides a source of funds to the Borrowers for temporary and emergency purposes, including the ability to meet future unanticipated or unusually large redemption requests. Effective January 18, 2013, the Borrowers renewed the Global Credit Facility which matures on January 17, 2014.
Under the terms of the Global Credit Facility, the Fund shall, in addition to interest charged on any borrowings made by the Fund and other costs incurred by the Fund, pay its share of fees and expenses incurred in connection with the implementation and maintenance of the Global Credit Facility, based upon its relative share of the aggregate net assets of all of the Borrowers, including an annual commitment fee of 0.07% based upon the unused portion of the Global Credit Facility. These fees are reflected in other expenses on the Statement of Operations. During the year ended December 31, 2012, the Fund did not use the Global Credit Facility.
9. FAIR VALUE MEASUREMENTS
The Fund follows a fair value hierarchy that distinguishes between market data obtained from independent sources (observable inputs) and the Fund’s own market assumptions (unobservable inputs). These inputs are used in determining the value of the Fund’s financial instruments and are summarized in the following fair value hierarchy:
| | • | | Level 1 – quoted prices in active markets for identical financial instruments |
| | • | | Level 2 – other significant observable inputs (including quoted prices for similar financial instruments, interest rates, prepayment speed, credit risk, etc.) |
| | • | | Level 3 – significant unobservable inputs (including the Fund’s own assumptions in determining the fair value of financial instruments) |
The inputs or methodology used for valuing financial instruments are not an indication of the risk associated with investing in those financial instruments.
For movements between the levels within the fair value hierarchy, the Fund has adopted a policy of recognizing the transfers as of the date of the underlying event which caused the movement.
At December 31, 2012, all of the Fund’s investments in financial instruments carried at fair value were valued using Level 1 inputs. For detailed categories, see the accompanying Statement of Investments.
10. NEW ACCOUNTING PRONOUNCEMENTS
In December 2011, the Financial Accounting Standards Board (FASB) issued Accounting Standards Update (ASU) No. 2011-11, Balance Sheet (Topic 210): Disclosures about Offsetting Assets and Liabilities. The amendments in the ASU enhance disclosures about offsetting of financial assets and liabilities to enable investors to understand the effect of these arrangements on a fund’s financial position. In January 2013, FASB issued ASU No. 2013-01, Balance Sheet (Topic 210): Clarifying the Scope of Disclosures about Offsetting Assets and Liabilities. The amendments in ASU No. 2013-01 clarify the intended scope of disclosures required by ASU No. 2011-11. These ASUs are effective for interim and annual reporting periods beginning on or after January 1, 2013. The Fund believes the adoption of these ASUs will not have a material impact on its financial statements.
11. SUBSEQUENT EVENTS
The Fund has evaluated subsequent events through the issuance of the financial statements and determined that no events have occurred that require disclosure other than those already disclosed in the financial statements.
FRD-21
Franklin Templeton Variable Insurance Products Trust
Franklin Rising Dividends Securities Fund
Report of Independent Registered Public Accounting Firm
To the Board of Trustees and Shareholders of Franklin Templeton Variable Insurance Products Trust
In our opinion, the accompanying statement of assets and liabilities, including the statement of investments, and the related statements of operations and of changes in net assets and the financial highlights present fairly, in all material respects, the financial position of Franklin Rising Dividends Securities Fund (the “Fund”) at December 31, 2012, the results of its operations for the year then ended, the changes in its net assets for each of the two years in the period then ended and the financial highlights for the periods presented, in conformity with accounting principles generally accepted in the United States of America. These financial statements and financial highlights (hereafter referred to as “financial statements”) are the responsibility of the Fund’s management. Our responsibility is to express an opinion on these financial statements based on our audits. We conducted our audits of these financial statements in accordance with the standards of the Public Company Accounting Oversight Board (United States). Those standards require that we plan and perform the audit to obtain reasonable assurance about whether the financial statements are free of material misstatement. An audit includes examining, on a test basis, evidence supporting the amounts and disclosures in the financial statements, assessing the accounting principles used and significant estimates made by management, and evaluating the overall financial statement presentation. We believe that our audits, which included confirmation of securities at December 31, 2012 by correspondence with the custodian, transfer agent and brokers, provide a reasonable basis for our opinion.
PricewaterhouseCoopers LLP
San Francisco, California
February 15, 2013
FRD-22
Franklin Templeton Variable Insurance Products Trust
Tax Information (unaudited)
Franklin Rising Dividends Securities Fund
Under Section 854(b)(1)(A) of the Internal Revenue Code, the Fund hereby reports 100% of the ordinary income dividends as income qualifying for the dividends received deduction for the fiscal year ended December 31, 2012.
FRD-23
FRANKLIN SMALL CAP VALUE SECURITIES FUND
This annual report for Franklin Small Cap Value Securities Fund covers the fiscal year ended December 31, 2012.
Performance Summary as of 12/31/12
Average annual total return of Class 2 shares represents the average annual change in value, assuming reinvestment of dividends and capital gains. Average returns smooth out variations in returns, which can be significant; they are not the same as year-by-year results.
Periods ended 12/31/12
| | | | | | | | | | | | |
| | | 1-Year | | | 5-Year | | | 10-Year | |
Average Annual Total Return | | | +18.39% | | | | +4.80% | | | | +9.88% | |
Total Return Index Comparison for a Hypothetical $10,000 Investment (1/1/03–12/31/12)
The graph below shows the change in value of a hypothetical $10,000 investment in the Fund over the indicated period and includes reinvestment of any income or distributions. The Fund’s performance is compared to the performance of the Russell 2500™ Value Index. One cannot invest directly in an index, and an index is not representative of the Fund’s portfolio. Please see Important Notes to Performance Information preceding the Fund Summaries.
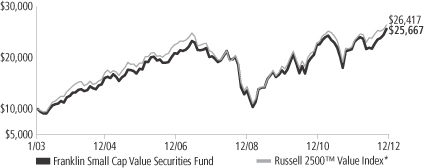
*Source: © 2013 Morningstar. Please see Index Descriptions following the Fund Summaries.
Franklin Small Cap Value Securities Fund – Class 2
Performance reflects the Fund’s Class 2 operating expenses, but does not include any contract fees, expenses or sales charges. If they had been included, performance would be lower. These charges and deductions, particularly for variable life policies, can have a significant effect on contract values and insurance benefits. See the contract prospectus for a complete description of these expenses, including sales charges.
Performance data represent past performance, which does not guarantee future results. Investment return and principal value will fluctuate, and you may have a gain or loss when you sell your shares.
Current performance may differ from figures shown.
FSV-1
Fund Goal and Main Investments: Franklin Small Cap Value Securities Fund seeks long-term total return. Under normal market conditions, the Fund invests at least 80% of its net assets in investments of small capitalization companies. For this Fund, small capitalization companies are those with market capitalizations under $3.5 billion at the time of purchase. The Fund invests generally in equity securities of companies that the manager believes are undervalued and have the potential for capital appreciation.
Performance Overview
You can find the Fund’s one-year total return in the Performance Summary. For comparison, the Fund’s benchmark, the Russell 2500TM Value Index, rose 19.21% for the same period.1 Please note the Fund employs a bottom-up stock selection process, and the managers invest in securities without regard to benchmark comparisons.
Economic and Market Overview
The U.S. economy, as measured by gross domestic product, grew moderately in 2012, supported by positive construction, housing and labor market trends. U.S. home prices increased in most regions due to higher demand based on near to record-low mortgage rates, affordable housing prices, low new-home inventories and a five-year low in U.S. foreclosures. Home construction became a leading source of economic growth after reaching a multi-year high in 2012, further enhancing confidence in the housing market. Consumer spending and personal income levels climbed, and inflation was generally mild with the exception of energy and food prices. Consumer sentiment reached its highest level in five years, although the potential U.S. tax hikes and spending cuts scheduled to take effect in 2013 dampened confidence near year-end. Nevertheless, the federal budget deficit for fiscal year 2012 fell to its lowest level since 2008. Just after year-end, Congress passed compromise legislation that preserved lower income tax rates for most U.S. households and delayed far-reaching federal spending cuts.
For the 12-month period, U.S. stocks, as measured by the Standard & Poor’s® 500 Index (S&P 500®), fluctuated as investors reacted to news headlines and shifted between risk taking and risk aversion.2 Toward period-end uncertainty eased surrounding the European fiscal crisis as leaders made progress on economic reforms and management of Greek
1. Source: © 2013 Morningstar. One cannot invest directly in an index, and an index is not representative of the Fund’s portfolio. Please see Index Descriptions following the Fund Summaries.
2. Please see Index Descriptions following the Fund Summaries.
Fund Risks: All investments involve risks, including possible loss of principal. Stock prices fluctuate, sometimes rapidly and dramatically, due to factors affecting individual companies, particular industries or sectors, or general market conditions. Value securities may not increase in price as anticipated or may decline further in value. Smaller-company stocks have historically exhibited special risks, including greater price volatility, particularly over the short term. Smaller companies often have relatively small revenues, limited product lines and a small market share. Investments in foreign securities may involve special risks including currency fluctuations and economic and political uncertainty. The Fund is actively managed but there is no guarantee that the manager’s investment decisions will produce the desired results. The Fund’s prospectus also includes a description of the main investment risks.
FSV-2
debt, but slowing economic growth in Asia, particularly China, curbed global economic recovery and markets. In its December meeting, the Federal Open Market Committee (FOMC) announced a 6.5% unemployment target as a guide to maintaining the historically low federal funds target rate. The FOMC also said it intended to continue purchasing longer term Treasuries and agency mortgage-backed securities. Despite modest third-quarter U.S. company revenues suggesting a drop in global demand, a hard-fought national election and budget deadline concerns, domestic stock markets made strong gains for the year. Value stocks generally outperformed growth stocks, and all sectors generated positive returns, as represented by the S&P 500. Not all investors favored stocks, however, and many sought perceived safe havens such as gold bullion, the Japanese yen and U.S. Treasuries. By year-end, the yield on the 10-year U.S. Treasury note declined to 1.78% from 1.89% at the beginning of 2012.
Investment Strategy
We are a research-driven, fundamental investment adviser, pursuing a disciplined, value-oriented strategy for the Fund. As a bottom-up adviser concentrating primarily on individual securities, we focus on the market price of a company’s securities relative to our evaluation of the company’s potential long-term earnings, asset value or cash flow. We seek bargains among the “unloved,” out-of-favor companies that offer, in our opinion, attractive long-term potential. These might include current growth companies that are being ignored by the market, former growth companies that have stumbled recently, dropping sharply in price but that still have significant growth potential, in our opinion, or companies that may be potential turnaround candidates or takeover targets.
Manager’s Discussion
During the 12 months under review, significant contributors to Fund performance came from positions in the industrials sector, including contractor and construction materials producer Granite Construction and architectural glass producer Apogee Enterprises.3 Several consumer discretionary sector holdings such as footwear manufacturer and marketer Brown Shoe and recreational vehicle manufacturer Thor
3. The industrials sector comprises aerospace and defense, building products, commercial and professional services, construction and engineering, electrical equipment, industrial conglomerates, machinery, trading companies and distributors, and transportation in the SOI.
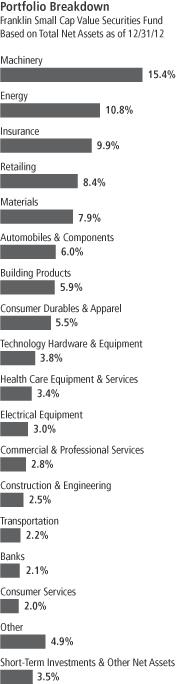
FSV-3
Industries also boosted performance.4 Insurer Protective Life in the financials sector also helped performance.5
Detractors from performance during the reporting period included energy sector positions such as oil and gas drilling products and services provider Oil States International, oil tanker operator Overseas Shipholding Group and offshore energy service provider Tidewater. Other detractors included auto components supplier Gentex and industrial compressor and blower manufacturer Gardner Denver.
The Fund initiated positions in information technology products distributor Ingram Micro, business-to-business rental equipment provider McGrath RentCorp, auto infotainment manufacturer Harman International Industries and men’s clothing designer and retailer Jos. A. Bank Clothiers. We added to existing positions in Gentex, branded women’s apparel manufacturer Maidenform Brands, aircraft-related aftermarket service provider AAR, medical equipment manufacturer Hill-Rom Holdings and industrial adhesive producer H.B. Fuller, among others.
We liquidated our positions in Roper Industries, Tower Group, ABM Industries, J.C. Penney, Transatlantic Holdings, D.R. Horton, Saks, Commercial Metals, PNM Resources and Christopher & Banks, among others. One of the Fund’s positions, Ceradyne, was subject to a takeover offer at a 43% premium to its then share price and was sold during the period at a profit. We also made significant reductions to holdings in Lancaster Colony, American Woodmark, NV Energy, Nordson and Fred’s, along with smaller reductions to other positions.
Thank you for your participation in Franklin Small Cap Value Securities Fund. We look forward to serving your future investment needs.
4. The consumer discretionary sector comprises automobiles and components, consumer durables and apparel, consumer services and retailing in the SOI.
5. The financials sector comprises banks and insurance in the SOI.
The foregoing information reflects our analysis, opinions and portfolio holdings as of December 31, 2012, the end of the reporting period. The way we implement our main investment strategies and the resulting portfolio holdings may change depending on factors such as market and economic conditions. These opinions may not be relied upon as investment advice or an offer for a particular security. The information is not a complete analysis of every aspect of any market, country, industry, security or the Fund. Statements of fact are from sources considered reliable, but the investment manager makes no representation or warranty as to their completeness or accuracy. Although historical performance is no guarantee of future results, these insights may help you understand our investment management philosophy.
Top 10 Holdings
Franklin Small Cap Value Securities Fund 12/31/12
| | | | |
Company
Sector/Industry | | % of Total
Net Assets | |
| Protective Life Corp. | | | 2.3% | |
| Insurance | |
| Thor Industries Inc. | | | 2.3% | |
| Automobiles & Components | |
| Group 1 Automotive Inc. | | | 2.1% | |
| Retailing | |
| Trinity Industries Inc. | | | 2.0% | |
| Machinery | |
| Reliance Steel & Aluminum Co. | | | 2.0% | |
| Materials | |
| Granite Construction Inc. | | | 1.8% | |
| Construction & Engineering | |
| Bristow Group Inc. | | | 1.7% | |
| Energy | |
| RPM International Inc. | | | 1.6% | |
| Materials | |
| Universal Forest Products Inc. | | | 1.6% | |
| Building Products | |
| Carlisle Cos. Inc. | | | 1.5% | |
| Industrial Conglomerates | | | | |
The dollar value, number of shares or principal amount, and names of all portfolio holdings are listed in the Fund’s Statement of Investments (SOI).
FSV-4
Fund Expenses
As an investor in a variable insurance contract (Contract) that indirectly provides for investment in an underlying mutual fund, you can incur transaction and/or ongoing expenses at both the Fund level and the Contract level.
| • | | Transaction expenses can include sales charges (loads) on purchases, redemption fees, surrender fees, transfer fees and premium taxes. |
| • | | Ongoing expenses can include management fees, distribution and service (12b-1) fees, contract fees, annual maintenance fees, mortality and expense risk fees and other fees and expenses. All mutual funds and Contracts have some types of ongoing expenses. |
The expenses shown in the table are meant to highlight ongoing expenses at the Fund level only and do not include ongoing expenses at the Contract level, or transaction expenses at either the Fund or Contract level. While the Fund does not have transaction expenses, if the transaction and ongoing expenses at the Contract level were included, the expenses shown below would be higher. You should consult your Contract prospectus or disclosure document for more information.
The table shows Fund-level ongoing expenses and can help you understand these expenses and compare them with those of other mutual funds offered through the Contract. The table assumes a $1,000 investment held for the six months indicated. Please refer to the Fund prospectus for additional information on operating expenses.
Actual Fund Expenses
The first line (Actual) of the table provides actual account values and expenses. The “Ending Account Value” is derived from the Fund’s actual return, which includes the effect of ongoing Fund expenses, but does not include the effect of ongoing Contract expenses.
You can estimate the Fund-level expenses you incurred during the period by following these steps. Of course, your account value and expenses will differ from those in this illustration:
| 1. | Divide your account value by $1,000. |
If an account had an $8,600 value, then $8,600 ÷ $1,000 = 8.6.
| 2. | Multiply the result by the number under the heading “Fund-Level Expenses Incurred During Period.” |
If Fund-Level Expenses Incurred During Period were $7.50, then 8.6 x $7.50 = $64.50.
In this illustration, the estimated expenses incurred this period at the Fund level are $64.50.
Franklin Small Cap Value Securities Fund – Class 2
FSV-5
Hypothetical Example for Comparison with Other Mutual Funds
Information in the second line (Hypothetical) of the table can help you compare ongoing expenses of the Fund with those of other mutual funds offered through the Contract. This information may not be used to estimate the actual ending account balance or expenses you incurred during the period. The hypothetical “Ending Account Value” is based on the Fund’s actual expense ratio and an assumed 5% annual rate of return before expenses, which does not represent the Fund’s actual return. The figure under the heading “Fund-Level Expenses Incurred During Period” shows the hypothetical expenses your account would have incurred under this scenario. You can compare this figure with the 5% hypothetical examples that appear in shareholder reports of other funds offered through a Contract.
| | | | | | | | | | | | |
| Class 2 | | Beginning
Account Value 7/1/12 | | | Ending
Account Value 12/31/12 | | | Fund-Level Expenses Incurred During Period* 7/1/12–12/31/12 | |
Actual | | $ | 1,000 | | | $ | 1,167.80 | | | $ | 5.07 | |
Hypothetical (5% return
before expenses) | | $ | 1,000 | | | $ | 1,020.46 | | | $ | 4.72 | |
*Expenses are calculated using the most recent six-month annualized expense ratio for the Fund’s Class 2 shares (0.93%), which does not include any ongoing expenses of the Contract for which the Fund is an investment option, multiplied by the average account value over the period, multiplied by 184/366 to reflect the one-half year period.
FSV-6
Franklin Templeton Variable Insurance Products Trust
Financial Highlights
Franklin Small Cap Value Securities Fund
| | | | | | | | | | | | | | | | | | | | |
| | | Year Ended December 31, | |
| Class 1 | | 2012 | | | 2011 | | | 2010 | | | 2009 | | | 2008 | |
| | | | |
Per share operating performance | | | | | | | | | | | | | | | | | | | | |
(for a share outstanding throughout the year) | | | | | | | | | | | | | | | | | | | | |
Net asset value, beginning of year | | $ | 15.82 | | | $ | 16.55 | | | $ | 13.00 | | | $ | 10.73 | | | $ | 17.38 | |
| | | | |
Income from investment operationsa: | | | | | | | | | | | | | | | | | | | | |
Net investment incomeb | | | 0.29 | c | | | 0.16 | | | | 0.14 | | | | 0.15 | | | | 0.24 | |
Net realized and unrealized gains (losses) | | | 2.64 | | | | (0.74 | ) | | | 3.54 | | | | 2.86 | | | | (5.44 | ) |
| | | | |
Total from investment operations | | | 2.93 | | | | (0.58 | ) | | | 3.68 | | | | 3.01 | | | | (5.20 | ) |
| | | | |
Less distributions from: | | | | | | | | | | | | | | | | | | | | |
Net investment income | | | (0.17 | ) | | | (0.15 | ) | | | (0.13 | ) | | | (0.22 | ) | | | (0.23 | ) |
Net realized gains | | | — | | | | — | | | | — | | | | (0.52 | ) | | | (1.22 | ) |
| | | | |
Total distributions | | | (0.17 | ) | | | (0.15 | ) | | | (0.13 | ) | | | (0.74 | ) | | | (1.45 | ) |
| | | | |
Net asset value, end of year | | $ | 18.58 | | | $ | 15.82 | | | $ | 16.55 | | | $ | 13.00 | | | $ | 10.73 | |
| | | | |
| | | | | |
Total returnd | | | 18.75% | | | | (3.53)% | | | | 28.49% | | | | 29.54% | | | | (32.87)% | |
Ratios to average net assets | | | | | | | | | | | | | | | | | | | | |
Expenses | | | 0.67% | | | | 0.66% | | | | 0.67% | | | | 0.68% | e | | | 0.67% | e |
Net investment income | | | 1.70%c | | | | 1.02% | | | | 0.98% | | | | 1.29% | | | | 1.62% | |
| | | | | |
Supplemental data | | | | | | | | | | | | | | | | | | | | |
Net assets, end of year (000’s) | | $ | 40,133 | | | $ | 39,374 | | | $ | 47,300 | | | $ | 42,428 | | | $ | 34,901 | |
Portfolio turnover rate | | | 5.84% | | | | 14.39% | | | | 15.92% | | | | 6.68% | | | | 16.98% | |
aThe amount shown for a share outstanding throughout the period may not correlate with the Statement of Operations for the period due to the timing of sales and repurchases of the Fund shares in relation to income earned and/or fluctuating market value of the investments of the Fund.
bBased on average daily shares outstanding.
cNet investment income per share includes approximately $0.10 per share received in the form of special dividends. Excluding these amounts, the ratio of net investment income to average net assets would have been 1.10%.
dTotal return does not include fees, charges or expenses imposed by the variable annuity and life insurance contracts for which the Franklin Templeton Variable Insurance Products Trust serves as an underlying investment vehicle.
eBenefit of expense reduction rounds to less than 0.01%.
The accompanying notes are an integral part of these financial statements.
FSV-7
Franklin Templeton Variable Insurance Products Trust
Financial Highlights (continued)
Franklin Small Cap Value Securities Fund
| | | | | | | | | | | | | | | | | | | | |
| | | Year Ended December 31, | |
| Class 2 | | 2012 | | | 2011 | | | 2010 | | | 2009 | | | 2008 | |
| | | | |
Per share operating performance | | | | | | | | | | | | | | | | | | | | |
(for a share outstanding throughout the year) | | | | | | | | | | | | | | | | | | | | |
Net asset value, beginning of year | | $ | 15.53 | | | $ | 16.25 | | | $ | 12.77 | | | $ | 10.55 | | | $ | 17.10 | |
| | | | |
Income from investment operationsa: | | | | | | | | | | | | | | | | | | | | |
Net investment incomeb | | | 0.24 | c | | | 0.12 | | | | 0.10 | | | | 0.12 | | | | 0.20 | |
Net realized and unrealized gains (losses) | | | 2.59 | | | | (0.73 | ) | | | 3.48 | | | | 2.81 | | | | (5.35 | ) |
| | | | |
Total from investment operations | | | 2.83 | | | | (0.61 | ) | | | 3.58 | | | | 2.93 | | | | (5.15 | ) |
| | | | |
Less distributions from: | | | | | | | | | | | | | | | | | | | | |
Net investment income | | | (0.13 | ) | | | (0.11 | ) | | | (0.10 | ) | | | (0.19 | ) | | | (0.18 | ) |
Net realized gains | | | — | | | | — | | | | — | | | | (0.52 | ) | | | (1.22 | ) |
| | | | |
Total distributions | | | (0.13 | ) | | | (0.11 | ) | | | (0.10 | ) | | | (0.71 | ) | | | (1.40 | ) |
| | | | |
Net asset value, end of year | | $ | 18.23 | | | $ | 15.53 | | | $ | 16.25 | | | $ | 12.77 | | | $ | 10.55 | |
| | | | |
| | | | | |
Total returnd | | | 18.39% | | | | (3.76)% | | | | 28.22% | | | | 29.16% | | | | (33.02)% | |
Ratios to average net assets | | | | | | | | | | | | | | | | | | | | |
Expenses | | | 0.92% | | | | 0.91% | | | | 0.92% | | | | 0.93% | e | | | 0.92% | e |
Net investment income | | | 1.45%c | | | | 0.77% | | | | 0.73% | | | | 1.04% | | | | 1.37% | |
| | | | | |
Supplemental data | | | | | | | | | | | | | | | | | | | | |
Net assets, end of year (000’s) | | $ | 1,286,573 | | | $ | 1,211,168 | | | $ | 1,362,292 | | | $ | 1,109,855 | | | $ | 784,773 | |
Portfolio turnover rate | | | 5.84% | | | | 14.39% | | | | 15.92% | | | | 6.68% | | | | 16.98% | |
aThe amount shown for a share outstanding throughout the period may not correlate with the Statement of Operations for the period due to the timing of sales and repurchases of the Fund shares in relation to income earned and/or fluctuating market value of the investments of the Fund.
bBased on average daily shares outstanding.
cNet investment income per share includes approximately $0.10 per share received in the form of special dividends. Excluding these amounts, the ratio of net investment income to average net assets would have been 0.85%.
dTotal return does not include fees, charges or expenses imposed by the variable annuity and life insurance contracts for which the Franklin Templeton Variable Insurance Products Trust serves as an underlying investment vehicle.
eBenefit of expense reduction rounds to less than 0.01%.
The accompanying notes are an integral part of these financial statements.
FSV-8
Franklin Templeton Variable Insurance Products Trust
Financial Highlights (continued)
Franklin Small Cap Value Securities Fund
| | | | | | | | | | | | | | | | | | | | |
| | | Year Ended December 31, | |
| Class 4 | | 2012 | | | 2011 | | | 2010 | | | 2009 | | | 2008a | |
| | | | |
Per share operating performance | | | | | | | | | | | | | | | | | | | | |
(for a share outstanding throughout the year) | | | | | | | | | | | | | | | | | | | | |
Net asset value, beginning of year | | $ | 15.71 | | | $ | 16.44 | | | $ | 12.92 | | | $ | 10.70 | | | $ | 16.42 | |
| | | | |
Income from investment operationsb: | | | | | | | | | | | | | | | | | | | | |
Net investment incomec | | | 0.22 | d | | | 0.11 | | | | 0.09 | | | | 0.11 | | | | 0.15 | |
Net realized and unrealized gains (losses) | | | 2.63 | | | | (0.75 | ) | | | 3.53 | | | | 2.84 | | | | (4.42 | ) |
| | | | |
Total from investment operations | | | 2.85 | | | | (0.64 | ) | | | 3.62 | | | | 2.95 | | | | (4.27 | ) |
| | | | |
Less distributions from: | | | | | | | | | | | | | | | | | | | | |
Net investment income | | | (0.12 | ) | | | (0.09 | ) | | | (0.10 | ) | | | (0.21 | ) | | | (0.23 | ) |
Net realized gains | | | — | | | | — | | | | — | | | | (0.52 | ) | | | (1.22 | ) |
| | | | |
Total distributions | | | (0.12 | ) | | | (0.09 | ) | | | (0.10 | ) | | | (0.73 | ) | | | (1.45 | ) |
| | | | |
Net asset value, end of year | | $ | 18.44 | | | $ | 15.71 | | | $ | 16.44 | | | $ | 12.92 | | | $ | 10.70 | |
| | | | |
| | | | | |
Total returne | | | 18.27% | | | | (3.87)% | | | | 28.14% | | | | 29.04% | | | | (29.14)% | |
Ratios to average net assetsf | | | | | | | | | | | | | | | | | | | | |
Expenses | | | 1.02% | | | | 1.01% | | | | 1.02% | | | | 1.03% | g | | | 1.02% | g |
Net investment income | | | 1.35%d | | | | 0.67% | | | | 0.63% | | | | 0.94% | | | | 1.27% | |
| | | | | |
Supplemental data | | | | | | | | | | | | | | | | | | | | |
Net assets, end of year (000’s) | | $ | 32,424 | | | $ | 34,284 | | | $ | 39,075 | | | $ | 28,599 | | | $ | 14,850 | |
Portfolio turnover rate | | | 5.84% | | | | 14.39% | | | | 15.92% | | | | 6.68% | | | | 16.98% | |
aFor the period February 29, 2008 (effective date) to December 31, 2008.
bThe amount shown for a share outstanding throughout the period may not correlate with the Statement of Operations for the period due to the timing of sales and repurchases of the Fund shares in relation to income earned and/or fluctuating market value of the investments of the Fund.
cBased on average daily shares outstanding.
dNet investment income per share includes approximately $0.10 per share received in the form of special dividends. Excluding these amounts, the ratio of net investment income to average net assets would have been 0.75%.
eTotal return does not include fees, charges or expenses imposed by the variable annuity and life insurance contracts for which the Franklin Templeton Variable Insurance Products Trust serves as an underlying investment vehicle. Total return is not annualized for periods less than one year.
fRatios are annualized for periods less than one year.
gBenefit of expense reduction rounds to less than 0.01%.
The accompanying notes are an integral part of these financial statements.
FSV-9
Franklin Templeton Variable Insurance Products Trust
Statement of Investments, December 31, 2012
| | | | | | | | |
| Franklin Small Cap Value Securities Fund | | Shares | | | Value | |
Common Stocks 96.5% | | | | | | | | |
Aerospace & Defense 1.4% | | | | | | | | |
AAR Corp. | | | 1,017,000 | | | $ | 18,997,560 | |
| | | | | | | | |
Automobiles & Components 6.0% | | | | | | | | |
Autoliv Inc. | | | 295,000 | | | | 19,880,050 | |
Drew Industries Inc. | | | 247,000 | | | | 7,965,750 | |
Gentex Corp. | | | 855,000 | | | | 16,091,100 | |
Thor Industries Inc. | | | 820,000 | | | | 30,692,600 | |
aWinnebago Industries Inc. | | | 423,100 | | | | 7,247,703 | |
| | | | | | | | |
| | | | | | | 81,877,203 | |
| | | | | | | | |
Banks 2.1% | | | | | | | | |
Chemical Financial Corp. | | | 360,854 | | | | 8,573,891 | |
Oriental Financial Group Inc. | | | 602,000 | | | | 8,036,700 | |
Peoples Bancorp Inc. | | | 158,000 | | | | 3,227,940 | |
TrustCo Bank Corp. NY | | | 1,690,000 | | | | 8,923,200 | |
| | | | | | | | |
| | | | | | | 28,761,731 | |
| | | | | | | | |
Building Products 5.9% | | | | | | | | |
A.O. Smith Corp. | | | 110,000 | | | | 6,937,700 | |
aAmerican Woodmark Corp. | | | 90,400 | | | | 2,514,928 | |
Apogee Enterprises Inc. | | | 778,000 | | | | 18,648,660 | |
aGibraltar Industries Inc. | | | 991,400 | | | | 15,783,088 | |
Simpson Manufacturing Co. Inc. | | | 433,400 | | | | 14,211,186 | |
Universal Forest Products Inc. | | | 566,000 | | | | 21,530,640 | |
| | | | | | | | |
| | | | | | | 79,626,202 | |
| | | | | | | | |
Commercial & Professional Services 2.8% | | | | | | | | |
Insperity Inc. | | | 296,100 | | | | 9,641,016 | |
McGrath RentCorp | | | 264,400 | | | | 7,672,888 | |
Mine Safety Appliances Co. | | | 328,300 | | | | 14,021,693 | |
Schawk Inc. | | | 494,533 | | | | 6,508,054 | |
| | | | | | | | |
| | | | | | | 37,843,651 | |
| | | | | | | | |
Construction & Engineering 2.5% | | | | | | | | |
EMCOR Group Inc. | | | 272,700 | | | | 9,438,147 | |
Granite Construction Inc. | | | 747,000 | | | | 25,114,140 | |
| | | | | | | | |
| | | | | | | 34,552,287 | |
| | | | | | | | |
Consumer Durables & Apparel 5.5% | | | | | | | | |
Brunswick Corp. | | | 475,000 | | | | 13,817,750 | |
Ethan Allen Interiors Inc. | | | 98,900 | | | | 2,542,719 | |
Harman International Industries Inc. | | | 165,000 | | | | 7,365,600 | |
Hooker Furniture Corp. | | | 445,000 | | | | 6,465,850 | |
La-Z-Boy Inc. | | | 1,089,000 | | | | 15,409,350 | |
M.D.C. Holdings Inc. | | | 213,800 | | | | 7,859,288 | |
aM/I Homes Inc. | | | 435,900 | | | | 11,551,350 | |
aMaidenform Brands Inc. | | | 515,500 | | | | 10,047,095 | |
| | | | | | | | |
| | | | | | | 75,059,002 | |
| | | | | | | | |
Consumer Services 2.0% | | | | | | | | |
Hillenbrand Inc. | | | 495,000 | | | | 11,191,950 | |
Regis Corp. | | | 992,000 | | | | 16,784,640 | |
| | | | | | | | |
| | | | | | | 27,976,590 | |
| | | | | | | | |
FSV-10
Franklin Templeton Variable Insurance Products Trust
Statement of Investments, December 31, 2012 (continued)
| | | | | | | | |
| Franklin Small Cap Value Securities Fund | | Shares | | | Value | |
Common Stocks (continued) | | | | | | | | |
Electrical Equipment 3.0% | | | | | | | | |
Brady Corp., A | | | 453,000 | | | $ | 15,130,200 | |
aEnerSys | | | 24,100 | | | | 906,883 | |
Franklin Electric Co. Inc. | | | 199,232 | | | | 12,386,254 | |
aGeneral Cable Corp. | | | 103,500 | | | | 3,147,435 | |
aPowell Industries Inc. | | | 210,000 | | | | 8,721,300 | |
| | | | | | | | |
| | | | | | | 40,292,072 | |
| | | | | | | | |
Energy 10.8% | | | | | | | | |
aAtwood Oceanics Inc. | | | 405,400 | | | | 18,563,266 | |
Bristow Group Inc. | | | 440,000 | | | | 23,610,400 | |
Energen Corp. | | | 242,000 | | | | 10,911,780 | |
aHelix Energy Solutions Group Inc. | | | 819,500 | | | | 16,914,480 | |
aOil States International Inc. | | | 255,200 | | | | 18,257,008 | |
aRowan Cos. PLC | | | 615,000 | | | | 19,231,050 | |
Teekay Corp. (Canada) | | | 200,000 | | | | 6,420,000 | |
Tidewater Inc. | | | 400,000 | | | | 17,872,000 | |
aUnit Corp. | | | 333,900 | | | | 15,042,195 | |
| | | | | | | | |
| | | | | | | 146,822,179 | |
| | | | | | | | |
Food, Beverage & Tobacco 0.2% | | | | | | | | |
Lancaster Colony Corp. | | | 48,600 | | | | 3,362,634 | |
| | | | | | | | |
Health Care Equipment & Services 3.4% | | | | | | | | |
Hill-Rom Holdings Inc. | | | 306,000 | | | | 8,721,000 | |
STERIS Corp. | | | 350,000 | | | | 12,155,500 | |
Teleflex Inc. | | | 227,900 | | | | 16,251,549 | |
West Pharmaceutical Services Inc. | | | 157,500 | | | | 8,623,125 | |
| | | | | | | | |
| | | | | | | 45,751,174 | |
| | | | | | | | |
Industrial Conglomerates 1.5% | | | | | | | | |
Carlisle Cos. Inc. | | | 353,400 | | | | 20,765,784 | |
| | | | | | | | |
Insurance 9.9% | | | | | | | | |
Arthur J. Gallagher & Co. | | | 168,200 | | | | 5,828,130 | |
Aspen Insurance Holdings Ltd. | | | 455,000 | | | | 14,596,400 | |
The Hanover Insurance Group Inc. | | | 372,200 | | | | 14,419,028 | |
HCC Insurance Holdings Inc. | | | 188,200 | | | | 7,002,922 | |
Montpelier Re Holdings Ltd. | | | 649,000 | | | | 14,836,140 | |
Old Republic International Corp. | | | 1,401,500 | | | | 14,925,975 | |
Protective Life Corp. | | | 1,088,800 | | | | 31,117,904 | |
RLI Corp. | | | 45,000 | | | | 2,909,700 | |
StanCorp Financial Group Inc. | | | 401,000 | | | | 14,704,670 | |
Validus Holdings Ltd. (Bermuda) | | | 422,700 | | | | 14,616,966 | |
| | | | | | | | |
| | | | | | | 134,957,835 | |
| | | | | | | | |
Machinery 15.4% | | | | | | | | |
Astec Industries Inc. | | | 380,000 | | | | 12,665,400 | |
Briggs & Stratton Corp. | | | 719,700 | | | | 15,171,276 | |
CIRCOR International Inc. | | | 155,702 | | | | 6,164,242 | |
aEnPro Industries Inc. | | | 390,000 | | | | 15,951,000 | |
Gardner Denver Inc. | | | 215,000 | | | | 14,727,500 | |
Graco Inc. | | | 214,900 | | | | 11,065,201 | |
Kaydon Corp. | | | 389,000 | | | | 9,308,770 | |
Kennametal Inc. | | | 397,300 | | | | 15,892,000 | |
Lincoln Electric Holdings Inc. | | | 400,000 | | | | 19,472,000 | |
FSV-11
Franklin Templeton Variable Insurance Products Trust
Statement of Investments, December 31, 2012 (continued)
| | | | | | | | |
| Franklin Small Cap Value Securities Fund | | Shares | | | Value | |
Common Stocks (continued) | | | | | | | | |
Machinery (continued) | | | | | | | | |
Mueller Industries Inc. | | | 409,000 | | | $ | 20,462,270 | |
Nordson Corp. | | | 127,000 | | | | 8,016,240 | |
Pentair Ltd. | | | 214,800 | | | | 10,557,420 | |
Trinity Industries Inc. | | | 764,400 | | | | 27,380,808 | |
aWabash National Corp. | | | 1,350,000 | | | | 12,109,500 | |
Watts Water Technologies Inc., A | | | 235,000 | | | | 10,102,650 | |
| | | | | | | | |
| | | | | | | 209,046,277 | |
| | | | | | | | |
Materials 7.9% | | | | | | | | |
A. Schulman Inc. | | | 425,000 | | | | 12,295,250 | |
AptarGroup Inc. | | | 65,000 | | | | 3,101,800 | |
Cabot Corp. | | | 324,100 | | | | 12,895,939 | |
H.B. Fuller Co. | | | 304,700 | | | | 10,609,654 | |
Reliance Steel & Aluminum Co. | | | 436,000 | | | | 27,075,600 | |
RPM International Inc. | | | 753,600 | | | | 22,125,696 | |
Sensient Technologies Corp. | | | 201,700 | | | | 7,172,452 | |
Steel Dynamics Inc. | | | 850,000 | | | | 11,670,500 | |
| | | | | | | | |
| | | | | | | 106,946,891 | |
| | | | | | | | |
Retailing 8.4% | | | | | | | | |
Brown Shoe Co. Inc. | | | 870,000 | | | | 15,981,900 | |
The Cato Corp., A | | | 438,600 | | | | 12,030,798 | |
Fred’s, Inc. | | | 175,200 | | | | 2,331,912 | |
bGameStop Corp., A | | | 595,000 | | | | 14,928,550 | |
Group 1 Automotive Inc. | | | 450,000 | | | | 27,895,500 | |
aJos. A. Bank Clothiers Inc. | | | 124,100 | | | | 5,284,178 | |
The Men’s Wearhouse Inc. | | | 605,600 | | | | 18,870,496 | |
Pier 1 Imports Inc. | | | 512,500 | | | | 10,250,000 | |
aWest Marine Inc. | | | 610,700 | | | | 6,565,025 | |
| | | | | | | | |
| | | | | | | 114,138,359 | |
| | | | | | | | |
Semiconductors & Semiconductor Equipment 0.6% | | | | | | | | |
Cohu Inc. | | | 736,000 | | | | 7,978,240 | |
| | | | | | | | |
Technology Hardware & Equipment 3.8% | | | | | | | | |
aBenchmark Electronics Inc. | | | 1,220,000 | | | | 20,276,400 | |
aIngram Micro Inc., A | | | 600,000 | | | | 10,152,000 | |
aMulti-Fineline Electronix Inc. | | | 274,100 | | | | 5,539,561 | |
aRofin-Sinar Technologies Inc. | | | 705,000 | | | | 15,284,400 | |
| | | | | | | | |
| | | | | | | 51,252,361 | |
| | | | | | | | |
Trading Companies & Distributors 0.5% | | | | | | | | |
Applied Industrial Technologies Inc. | | | 165,000 | | | | 6,931,650 | |
| | | | | | | | |
Transportation 2.2% | | | | | | | | |
aGenesee & Wyoming Inc. | | | 228,300 | | | | 17,369,064 | |
SkyWest Inc. | | | 990,000 | | | | 12,335,400 | |
| | | | | | | | |
| | | | | | | 29,704,464 | |
| | | | | | | | |
Utilities 0.7% | | | | | | | | |
NV Energy Inc. | | | 495,000 | | | | 8,979,300 | |
| | | | | | | | |
Total Common Stocks (Cost $941,280,111) | | | | | | | 1,311,623,446 | |
| | | | | | | | |
FSV-12
Franklin Templeton Variable Insurance Products Trust
Statement of Investments, December 31, 2012 (continued)
| | | | | | | | |
| Franklin Small Cap Value Securities Fund | | Shares | | | Value | |
Short Term Investments 4.2% | | | | | | | | |
Money Market Funds (Cost $42,206,709) 3.1% | | | | | | | | |
a,cInstitutional Fiduciary Trust Money Market Portfolio | | | 42,206,709 | | | $ | 42,206,709 | |
| | | | | | | | |
| | |
| | | Principal
Amount | | | | |
dInvestments from Cash Collateral Received for Loaned Securities 1.1% | | | | | | | | |
eRepurchase Agreements 1.1% | | | | | | | | |
Barclays Capital Inc., 0.20%, 1/02/13 (Maturity Value $3,568,316)
Collateralized by U.S. Government Agency Strips, 5/15/23 - 11/15/39; and
U.S. Treasury Notes, 0.25% - 3.375%, 7/31/13 - 9/15/15 (valued at $3,639,642) | | $ | 3,568,276 | | | | 3,568,276 | |
BNP Paribas Securities Corp., 0.17%, 1/02/13 (Maturity Value $3,199,179)
Collateralized by U.S. Government Agency Securities, 0.125% - 6.625%, 5/02/13 - 7/29/33; and
U.S. Government Agency Strips, 5/15/22 (valued at $3,263,134) | | | 3,199,149 | | | | 3,199,149 | |
Deutsche Bank Securities Inc., 0.20%, 1/02/13 (Maturity Value $2,214,235)
Collateralized by U.S. Government Agency Securities, 0.50% - 3.17%, 6/27/14 - 10/04/27
(valued at $2,258,502) | | | 2,214,210 | | | | 2,214,210 | |
HSBC Securities (USA) Inc., 0.16%, 1/02/13 (Maturity Value $886,625)
Collateralized by U.S. Government Agency Securities, zero cpn. - 5.375%, 1/30/14 - 3/17/31; and
U.S. Government Agency Strips, 1/15/13 - 4/15/30 (valued at $904,354) | | | 886,617 | | | | 886,617 | |
Merrill Lynch, Pierce, Fenner & Smith Inc., 0.15%, 1/02/13 (Maturity Value $1,587,583)
Collateralized by U.S. Government Agency Securities, 0.50% - 6.00%, 8/09/13 - 4/18/36; and
U.S. Treasury Notes, 0.375% - 4.125%, 6/30/13 - 8/15/19 (valued at $1,619,322) | | | 1,587,570 | | | | 1,587,570 | |
RBC Capital Markets LLC, 0.15%, 1/02/13 (Maturity Value $3,568,306)
Collateralized by U.S. Treasury Notes, 0.125% - 2.00%, 7/15/14 - 8/15/22 (valued at $3,639,642) | | | 3,568,276 | | | | 3,568,276 | |
| | | | | | | | |
Total Repurchase Agreements (Cost $15,024,098) | | | | | | | 15,024,098 | |
| | | | | | | | |
Total Investments (Cost $998,510,918) 100.7% | | | | | | | 1,368,854,253 | |
Other Assets, less Liabilities (0.7)% | | | | | | | (9,724,722 | ) |
| | | | | | | | |
Net Assets 100.0% | | | | | | $ | 1,359,129,531 | |
| | | | | | | | |
aNon-income producing.
bA portion or all of the security is on loan at December 31, 2012. See Note 1(c).
cSee Note 7 regarding investments in the Institutional Fiduciary Trust Money Market Portfolio.
dSee Note 1(c) regarding securities on loan.
eSee Note 1(b) regarding repurchase agreements.
The accompanying notes are an integral part of these financial statements.
FSV-13
Franklin Templeton Variable Insurance Products Trust
Financial Statements
Statement of Assets and Liabilities
December 31, 2012
| | | | |
| | | Franklin Small
Cap Value
Securities Fund | |
Assets: | | | | |
Investments in securities: | | | | |
Cost - Unaffiliated issuers | | $ | 941,280,111 | |
Cost - Sweep Money Fund (Note 7) | | | 42,206,709 | |
Cost - Repurchase agreements | | | 15,024,098 | |
| | | | |
Total cost of investments | | $ | 998,510,918 | |
| | | | |
Value - Unaffiliated issuers | | $ | 1,311,623,446 | |
Value - Sweep Money Fund (Note 7) | | | 42,206,709 | |
Value - Repurchase agreements | | | 15,024,098 | |
| | | | |
Total value of investments (includes securities loaned in the amount of $14,926,041) | | | 1,368,854,253 | |
Cash | | | 44,160 | |
Receivables: | | | | |
Investment securities sold | | | 3,539,089 | |
Capital shares sold | | | 4,418,160 | |
Dividends | | | 536,926 | |
Other assets | | | 31 | |
| | | | |
Total assets | | | 1,377,392,619 | |
| | | | |
Liabilities: | | | | |
Payables: | | | | |
Investment securities purchased | | | 27,606 | |
Capital shares redeemed | | | 1,542,300 | |
Affiliates | | | 1,240,374 | |
Payable upon return of securities loaned | | | 15,024,098 | |
Accrued expenses and other liabilities | | | 428,710 | |
| | | | |
Total liabilities | | | 18,263,088 | |
| | | | |
Net assets, at value | | $ | 1,359,129,531 | |
| | | | |
Net assets consist of: | | | | |
Paid-in capital | | $ | 944,162,332 | |
Undistributed net investment income | | | 19,222,694 | |
Net unrealized appreciation (depreciation) | | | 370,343,335 | |
Accumulated net realized gain (loss) | | | 25,401,170 | |
| | | | |
Net assets, at value | | $ | 1,359,129,531 | |
| | | | |
The accompanying notes are an integral part of these financial statements.
FSV-14
Franklin Templeton Variable Insurance Products Trust
Financial Statements (continued)
Statement of Assets and Liabilities (continued)
December 31, 2012
| | | | |
| | | Franklin Small
Cap Value
Securities Fund | |
Class 1: | | | | |
Net assets, at value | | $ | 40,132,648 | |
| | | | |
Shares outstanding | | | 2,160,547 | |
| | | | |
Net asset value and maximum offering price per share | | $ | 18.58 | |
| | | | |
Class 2: | | | | |
Net assets, at value | | $ | 1,286,572,967 | |
| | | | |
Shares outstanding | | | 70,573,754 | |
| | | | |
Net asset value and maximum offering price per share | | $ | 18.23 | |
| | | | |
Class 4: | | | | |
Net assets, at value | | $ | 32,423,916 | |
| | | | |
Shares outstanding | | | 1,757,924 | |
| | | | |
Net asset value and maximum offering price per share | | $ | 18.44 | |
| | | | |
The accompanying notes are an integral part of these financial statements.
FSV-15
Franklin Templeton Variable Insurance Products Trust
Financial Statements (continued)
Statement of Operations
for the year ended December 31, 2012
| | | | |
| | | Franklin Small
Cap Value
Securities Fund | |
Investment income: | | | | |
Dividends | | $ | 30,666,105 | |
Interest | | | 44,808 | |
Income from securities loaned | | | 611,105 | |
| | | | |
Total investment income | | | 31,322,018 | |
| | | | |
Expenses: | | | | |
Management fees (Note 3a) | | | 6,695,264 | |
Administrative fees (Note 3b) | | | 1,562,809 | |
Distribution fees: (Note 3c) | | | | |
Class 2 | | | 3,107,018 | |
Class 4 | | | 121,784 | |
Unaffiliated transfer agent fees | | | 2,358 | |
Custodian fees (Note 4) | | | 18,712 | |
Reports to shareholders | | | 492,070 | |
Professional fees | | | 56,246 | |
Trustees’ fees and expenses | | | 5,186 | |
Other | | | 31,022 | |
| | | | |
Total expenses | | | 12,092,469 | |
| | | | |
Net investment income | | | 19,229,549 | |
| | | | |
Realized and unrealized gains (losses): | | | | |
Net realized gain (loss) from investments | | | 44,247,459 | |
Net change in unrealized appreciation (depreciation) on investments | | | 158,357,883 | |
| | | | |
Net realized and unrealized gain (loss) | | | 202,605,342 | |
| | | | |
Net increase (decrease) in net assets resulting from operations | | $ | 221,834,891 | |
| | | | |
The accompanying notes are an integral part of these financial statements.
FSV-16
Franklin Templeton Variable Insurance Products Trust
Financial Statements (continued)
Statements of Changes in Net Assets
| | | | | | | | |
| | | Franklin Small Cap Value
Securities Fund | |
| | | Year Ended December 31, | |
| | | 2012 | | | 2011 | |
| | | | |
Increase (decrease) in net assets: | | | | | | | | |
Operations: | | | | | | | | |
Net investment income | | $ | 19,229,549 | | | $ | 10,424,838 | |
Net realized gain (loss) from investments | | | 44,247,459 | | | | 79,690,343 | |
Net change in unrealized appreciation (depreciation) on investments | | | 158,357,883 | | | | (139,845,262 | ) |
| | | | |
Net increase (decrease) in net assets resulting from operations | | | 221,834,891 | | | | (49,730,081 | ) |
| | | | |
Distributions to shareholders from: | | | | | | | | |
Net investment income: | | | | | | | | |
Class 1 | | | (407,505 | ) | | | (392,860 | ) |
Class 2 | | | (9,757,412 | ) | | | (8,773,166 | ) |
Class 4 | | | (256,129 | ) | | | (201,936 | ) |
| | | | |
Total distributions to shareholders | | | (10,421,046 | ) | | | (9,367,962 | ) |
| | | | |
Capital share transactions: (Note 2) | | | | | | | | |
Class 1 | | | (5,634,630 | ) | | | (5,885,116 | ) |
Class 2 | | | (124,579,807 | ) | | | (95,600,673 | ) |
Class 4 | | | (6,896,088 | ) | | | (3,256,590 | ) |
| | | | |
Total capital share transactions | | | (137,110,525 | ) | | | (104,742,379 | ) |
| | | | |
Net increase (decrease) in net assets | | | 74,303,320 | | | | (163,840,422 | ) |
Net assets: | | | | | | | | |
Beginning of year | | | 1,284,826,211 | | | | 1,448,666,633 | |
| | | | |
End of year | | $ | 1,359,129,531 | | | $ | 1,284,826,211 | |
| | | | |
Undistributed net investment income included in net assets: | | | | | | | | |
End of year | | $ | 19,222,694 | | | $ | 10,429,999 | |
| | | | |
The accompanying notes are an integral part of these financial statements.
FSV-17
Franklin Templeton Variable Insurance Products Trust
Notes to Financial Statements
Franklin Small Cap Value Securities Fund
1. ORGANIZATION AND SIGNIFICANT ACCOUNTING POLICIES
Franklin Templeton Variable Insurance Products Trust (Trust) is registered under the Investment Company Act of 1940, as amended, (1940 Act) as an open-end investment company, consisting of twenty separate funds. The Franklin Small Cap Value Securities Fund (Fund) is included in this report. The financial statements of the remaining funds in the Trust are presented separately. Shares of the Fund are generally sold only to insurance company separate accounts to fund the benefits of variable life insurance policies or variable annuity contracts. The Fund offers three classes of shares: Class 1, Class 2 and Class 4. Each class of shares differs by its distribution fees, voting rights on matters affecting a single class and its exchange privilege.
The following summarizes the Fund’s significant accounting policies.
a. Financial Instrument Valuation
The Fund’s investments in financial instruments are carried at fair value daily. Fair value is the price that would be received to sell an asset or paid to transfer a liability in an orderly transaction between market participants on the measurement date. Under procedures approved by the Trust’s Board of Trustees (the Board), the Fund’s administrator, investment manager and other affiliates have formed the Valuation and Liquidity Oversight Committee (VLOC). The VLOC provides administration and oversight of the Fund’s valuation policies and procedures, which are approved annually by the Board. Among other things, these procedures allow the Fund to utilize independent pricing services, quotations from securities and financial instrument dealers, and other market sources to determine fair value.
Equity securities listed on an exchange or on the NASDAQ National Market System are valued at the last quoted sale price or the official closing price of the day, respectively. Foreign equity securities are valued as of the close of trading on the foreign stock exchange on which the security is primarily traded, or the NYSE, whichever is earlier. The value is then converted into its U.S. dollar equivalent at the foreign exchange rate in effect at the close of the NYSE on the day that the value of the security is determined. Over-the-counter (OTC) securities are valued within the range of the most recent quoted bid and ask prices. Securities that trade in multiple markets or on multiple exchanges are valued according to the broadest and most representative market. Certain equity securities are valued based upon fundamental characteristics or relationships to similar securities. Investments in open-end mutual funds are valued at the closing net asset value. Repurchase agreements are valued at cost, which approximates market value.
The Fund has procedures to determine the fair value of financial instruments for which market prices are not reliable or readily available. Under these procedures, the VLOC convenes on a regular basis to review such financial instruments and considers a number of factors, including significant unobservable valuation inputs, when arriving at fair value. The VLOC primarily employs a market-based approach which may use related or comparable assets or liabilities, recent transactions, market multiples, book values, and other relevant information for the investment to determine the fair value of the investment. An income-based valuation approach may also be used in which the anticipated future cash flows of the investment are discounted to calculate fair value. Discounts may also be applied due to the nature or duration of any restrictions on the disposition of the investments. Due to the inherent uncertainty of valuations of such investments, the fair values may differ significantly from the values that would have been used had an active market existed. The VLOC employs various methods for calibrating these valuation approaches including a regular review of key inputs and assumptions, transactional back-testing or disposition analysis, and reviews of any related market activity.
b. Repurchase Agreements
The Fund enters into repurchase agreements. Repurchase agreements are accounted for as a loan by the fund to the seller, collateralized by securities which are delivered to the fund’s custodian. The market value, including accrued interest, of the initial collateralization is required to be at least 102% of the dollar amount invested by the Fund, with the value of the underlying securities marked to market daily to maintain coverage of at least 100%. All repurchase agreements held by the Fund at year end had been entered into on December 31, 2012.
FSV-18
Franklin Templeton Variable Insurance Products Trust
Notes to Financial Statements (continued)
Franklin Small Cap Value Securities Fund
1. ORGANIZATION AND SIGNIFICANT ACCOUNTING POLICIES (continued)
c. Securities Lending
The Fund participates in a principal based securities lending program. The fund receives cash collateral against the loaned securities in an amount equal to at least 102% of the market value of the loaned securities. Collateral is maintained over the life of the loan in an amount not less than 100% of the market value of loaned securities, as determined at the close of fund business each day; any additional collateral required due to changes in security values is delivered to the fund on the next business day. The collateral is invested in repurchase agreements as indicated on the Statement of Investments. The fund receives income from the investment of cash collateral, in addition to lending fees and rebates paid by the borrower. The fund bears the market risk with respect to the collateral investment, securities loaned, and the risk that the principal may default on its obligations to the fund.
d. Income Taxes
It is the Fund’s policy to qualify as a regulated investment company under the Internal Revenue Code. The Fund intends to distribute to shareholders substantially all of its taxable income and net realized gains to relieve it from federal income and if applicable, excise taxes. As a result, no provision for U.S. federal income taxes is required.
The Fund may be subject to foreign taxation related to income received, capital gains on the sale of securities and certain foreign currency transactions in the foreign jurisdictions in which it invests. Foreign taxes, if any, are recorded based on the tax regulations and rates that exist in the foreign markets in which the Fund invests. When a capital gain tax is determined to apply the Fund records an estimated deferred tax liability in an amount that would be payable if the securities were disposed of on the valuation date.
The Fund recognizes the tax benefits of uncertain tax positions only when the position is “more likely than not” to be sustained upon examination by the tax authorities based on the technical merits of the tax position. As of December 31, 2012, and for all open tax years, the Fund has determined that no liability for unrecognized tax benefits is required in the Fund’s financial statements related to uncertain tax positions taken on a tax return (or expected to be taken on future tax returns). Open tax years are those that remain subject to examination and are based on each tax jurisdiction statute of limitation.
e. Security Transactions, Investment Income, Expenses and Distributions
Security transactions are accounted for on trade date. Realized gains and losses on security transactions are determined on a specific identification basis. Interest income and estimated expenses are accrued daily. Dividend income is recorded on the ex-dividend date except that certain dividends from foreign securities are recognized as soon as the Fund is notified of the ex-dividend date. Distributions to shareholders are recorded on the ex-dividend date and are determined according to income tax regulations (tax basis). Distributable earnings determined on a tax basis may differ from earnings recorded in accordance with accounting principles generally accepted in the United States of America. These differences may be permanent or temporary. Permanent differences are reclassified among capital accounts to reflect their tax character. These reclassifications have no impact on net assets or the results of operations. Temporary differences are not reclassified, as they may reverse in subsequent periods.
Common expenses incurred by the Trust are allocated among the funds based on the ratio of net assets of each fund to the combined net assets of the Trust. Fund specific expenses are charged directly to the fund that incurred the expense.
Realized and unrealized gains and losses and net investment income, not including class specific expenses, are allocated daily to each class of shares based upon the relative proportion of net assets of each class. Differences in per share distributions, by class, are generally due to differences in class specific expenses.
FSV-19
Franklin Templeton Variable Insurance Products Trust
Notes to Financial Statements (continued)
Franklin Small Cap Value Securities Fund
1. ORGANIZATION AND SIGNIFICANT ACCOUNTING POLICIES (continued)
f. Accounting Estimates
The preparation of financial statements in accordance with accounting principles generally accepted in the United States of America requires management to make estimates and assumptions that affect the reported amounts of assets and liabilities at the date of the financial statements and the amounts of income and expenses during the reporting period. Actual results could differ from those estimates.
g. Guarantees and Indemnifications
Under the Trust’s organizational documents, its officers and trustees are indemnified by the Trust against certain liabilities arising out of the performance of their duties to the Trust. Additionally, in the normal course of business, the Trust, on behalf of the Fund, enters into contracts with service providers that contain general indemnification clauses. The Trust’s maximum exposure under these arrangements is unknown as this would involve future claims that may be made against the Trust that have not yet occurred. Currently, the Trust expects the risk of loss to be remote.
2. SHARES OF BENEFICIAL INTEREST
At December 31, 2012, there were an unlimited number of shares authorized (without par value). Transactions in the Fund’s shares were as follows:
| | | | | | | | | | | | | | | | |
| | | Year Ended December 31, | |
| | | 2012 | | | 2011 | |
| Class 1 Shares: | | Shares | | | Amount | | | Shares | | | Amount | |
Shares sold | | | 120,340 | | | $ | 2,031,518 | | | | 385,043 | | | $ | 6,445,781 | |
Shares issued in reinvestment of distributions | | | 26,308 | | | | 407,505 | | | | 24,646 | | | | 392,860 | |
Shares redeemed | | | (474,365 | ) | | | (8,073,653 | ) | | | (778,610 | ) | | | (12,723,757 | ) |
| | | | |
Net increase (decrease) | | | (327,717 | ) | | $ | (5,634,630 | ) | | | (368,921 | ) | | $ | (5,885,116 | ) |
| | | | |
Class 2 Shares: | | | | | | | | | | | | | | | | |
Shares sold | | | 8,509,192 | | | $ | 140,217,286 | | | | 12,352,861 | | | $ | 192,000,345 | |
Shares issued in reinvestment of distributions | | | 641,091 | | | | 9,757,412 | | | | 559,870 | | | | 8,773,166 | |
Shares redeemed | | | (16,570,761 | ) | | | (274,554,505 | ) | | | (18,752,469 | ) | | | (296,374,184 | ) |
| | | | |
Net increase (decrease) | | | (7,420,478 | ) | | $ | (124,579,807 | ) | | | (5,839,738 | ) | | $ | (95,600,673 | ) |
| | | | |
Class 4 Shares: | | | | | | | | | | | | | | | | |
Shares sold | | | 402,254 | | | $ | 6,818,504 | | | | 385,949 | | | $ | 6,104,316 | |
Shares issued on reinvestment of distributions | | | 16,621 | | | | 256,129 | | | | 12,732 | | | | 201,936 | |
Shares redeemed | | | (843,050 | ) | | | (13,970,721 | ) | | | (593,170 | ) | | | (9,562,842 | ) |
| | | | |
Net increase (decrease) | | | (424,175 | ) | | $ | (6,896,088 | ) | | | (194,489 | ) | | $ | (3,256,590 | ) |
| | | | |
3. TRANSACTIONS WITH AFFILIATES
Franklin Resources, Inc. is the holding company for various subsidiaries that together are referred to as Franklin Templeton Investments. Certain officers and trustees of the Fund are also officers and/or directors of the following subsidiaries:
| | |
| Subsidiary | | Affiliation |
Franklin Advisory Services, LLC (Advisory Services) | | Investment manager |
Franklin Templeton Services, LLC (FT Services) | | Administrative manager |
Franklin Templeton Distributors, Inc. (Distributors) | | Principal underwriter |
Franklin Templeton Investor Services, LLC (Investor Services) | | Transfer agent |
FSV-20
Franklin Templeton Variable Insurance Products Trust
Notes to Financial Statements (continued)
Franklin Small Cap Value Securities Fund
3. TRANSACTIONS WITH AFFILIATES (continued)
a. Management Fees
The Fund pays an investment management fee to Advisory Services based on the average daily net assets of the Fund as follows:
| | |
| Annualized Fee Rate | | Net Assets |
| 0.600% | | Up to and including $200 million |
| 0.500% | | Over $200 million, up to and including $1.3 billion |
| 0.400% | | In excess of $1.3 billion |
b. Administrative Fees
The Fund pays an administrative fee to FT Services based on the Fund’s average daily net assets as follows:
| | |
| Annualized Fee Rate | | Net Assets |
| 0.150% | | Up to and including $200 million |
| 0.135% | | Over $200 million, up to and including $700 million |
| 0.100% | | Over $700 million, up to and including $1.2 billion |
| 0.075% | | In excess of $1.2 billion |
c. Distribution Fees
The Board has adopted distribution plans for Class 2 and Class 4 shares pursuant to Rule 12b-1 under the 1940 Act. Under the Fund’s compensation distribution plans, the Fund pays Distributors for costs incurred in connection with the servicing, sale and distribution of the Fund’s shares up to 0.35% per year of its average daily net assets of each class. Some distribution fees are not charged on shares held by affiliates. The Board has agreed to limit the current rate to 0.25% per year for Class 2.
d. Transfer Agent Fees
Investor Services, under terms of an agreement, performs shareholder servicing for the Fund and is not paid by the Fund for the services.
4. EXPENSE OFFSET ARRANGEMENT
The Fund has entered into an arrangement with its custodian whereby credits realized as a result of uninvested cash balances are used to reduce a portion of the Fund’s custodian expenses. During the year ended December 31, 2012, there were no credits earned.
5. INCOME TAXES
For tax purposes, capital losses may be carried over to offset future capital gains, if any. Capital loss carryforwards with no expiration, if any, must be fully utilized before those losses with expiration dates.
During the year ended December 31, 2012, the Fund utilized $18,771,926 of capital loss carryforwards.
The tax character of distributions paid during the years ended December 31, 2012 and 2011, was as follows:
| | | | | | | | |
| | | 2012 | | | 2011 | |
Distributions paid from ordinary income | | $ | 10,421,046 | | | $ | 9,367,962 | |
| | | | |
FSV-21
Franklin Templeton Variable Insurance Products Trust
Notes to Financial Statements (continued)
Franklin Small Cap Value Securities Fund
5. INCOME TAXES (continued)
At December 31, 2012, the cost of investments, net unrealized appreciation (depreciation), undistributed ordinary income and undistributed long term capital gains for income tax purposes were as follows:
| | | | |
Cost of investments | | $ | 999,164,616 | |
| | | | |
| |
Unrealized appreciation | | $ | 422,092,387 | |
Unrealized depreciation | | | (52,402,750 | ) |
| | | | |
Net unrealized appreciation (depreciation) | | $ | 369,689,637 | |
| | | | |
Undistributed ordinary income | | $ | 19,786,222 | |
Undistributed long term capital gains | | | 25,491,341 | |
| | | | |
Distributable earnings | | $ | 45,277,563 | |
| | | | |
Differences between income and/or capital gains as determined on a book basis and a tax basis are primarily due to differing treatment of passive foreign investment company shares.
6. INVESTMENT TRANSACTIONS
Purchases and sales of investments (excluding short term securities) for the year ended December 31, 2012, aggregated $74,257,976 and $207,707,064, respectively.
7. INVESTMENTS IN INSTITUTIONAL FIDUCIARY TRUST MONEY MARKET PORTFOLIO
The Fund invests in the Institutional Fiduciary Trust Money Market Portfolio (Sweep Money Fund), an open-end investment company managed by Franklin Advisers, Inc. (an affiliate of the investment manager). Management fees paid by the Fund are reduced on assets invested in the Sweep Money Fund, in an amount not to exceed the management and administrative fees paid by the Sweep Money Fund.
8. CREDIT FACILITY
The Fund, together with other U.S. registered and foreign investment funds (collectively, Borrowers), managed by Franklin Templeton Investments, are borrowers in a joint syndicated senior unsecured credit facility totaling $1.5 billion (Global Credit Facility) which matured on January 18, 2013. This Global Credit Facility provides a source of funds to the Borrowers for temporary and emergency purposes, including the ability to meet future unanticipated or unusually large redemption requests. Effective January 18, 2013, the Borrowers renewed the Global Credit Facility which matures on January 17, 2014.
Under the terms of the Global Credit Facility, the Fund shall, in addition to interest charged on any borrowings made by the Fund and other costs incurred by the Fund, pay its share of fees and expenses incurred in connection with the implementation and maintenance of the Global Credit Facility, based upon its relative share of the aggregate net assets of all of the Borrowers, including an annual commitment fee of 0.07% based upon the unused portion of the Global Credit Facility. These fees are reflected in other expenses on the Statement of Operations. During the year ended December 31, 2012, the Fund did not use the Global Credit Facility.
FSV-22
Franklin Templeton Variable Insurance Products Trust
Notes to Financial Statements (continued)
Franklin Small Cap Value Securities Fund
9. FAIR VALUE MEASUREMENTS
The Fund follows a fair value hierarchy that distinguishes between market data obtained from independent sources (observable inputs) and the Fund’s own market assumptions (unobservable inputs). These inputs are used in determining the value of the Fund’s financial instruments and are summarized in the following fair value hierarchy:
| | • | | Level 1 – quoted prices in active markets for identical financial instruments |
| | • | | Level 2 – other significant observable inputs (including quoted prices for similar financial instruments, interest rates, prepayment speed, credit risk, etc.) |
| | • | | Level 3 – significant unobservable inputs (including the Fund’s own assumptions in determining the fair value of financial instruments) |
The inputs or methodology used for valuing financial instruments are not an indication of the risk associated with investing in those financial instruments.
For movements between the levels within the fair value hierarchy, the Fund has adopted a policy of recognizing the transfers as of the date of the underlying event which caused the movement.
A summary of inputs used as of December 31, 2012, in valuing the Fund’s assets carried at fair value, is as follows:
| | | | | | | | | | | | | | | | |
| | | Level 1 | | | Level 2 | | | Level 3 | | | Total | |
| | | | |
Assets: | | | | | | | | | | | | | | | | |
Investments in Securities: | | | | | | | | | | | | | | | | |
Equity Investmentsa | | $ | 1,311,623,446 | | | $ | — | | | $ | — | | | $ | 1,311,623,446 | |
Short Term Investments | | | 42,206,709 | | | | 15,024,098 | | | | — | | | | 57,230,807 | |
| | | | |
Total Investments in Securities | | $ | 1,353,830,155 | | | $ | 15,024,098 | | | $ | — | | | $ | 1,368,854,253 | |
| | | | |
aFor detailed categories, see the accompanying Statement of Investments.
10. NEW ACCOUNTING PRONOUNCEMENTS
In December 2011, the Financial Accounting Standards Board (FASB) issued Accounting Standards Update (ASU) No. 2011-11, Balance Sheet (Topic 210): Disclosures about Offsetting Assets and Liabilities. The amendments in the ASU enhance disclosures about offsetting of financial assets and liabilities to enable investors to understand the effect of these arrangements on a fund’s financial position. In January 2013, FASB issued ASU No. 2013-01, Balance Sheet (Topic 210): Clarifying the Scope of Disclosures about Offsetting Assets and Liabilities. The amendments in ASU No. 2013-01 clarify the intended scope of disclosures required by ASU No. 2011-11. These ASUs are effective for interim and annual reporting periods beginning on or after January 1, 2013. The Fund believes the adoption of these ASUs will not have a material impact on its financial statements.
11. SUBSEQUENT EVENTS
The Fund has evaluated subsequent events through the issuance of the financial statements and determined that no events have occurred that require disclosure other than those already disclosed in the financial statements.
FSV-23
Franklin Templeton Variable Insurance Products Trust
Franklin Small Cap Value Securities Fund
Report of Independent Registered Public Accounting Firm
To the Board of Trustees and Shareholders of Franklin Templeton Variable Insurance Products Trust
In our opinion, the accompanying statement of assets and liabilities, including the statement of investments, and the related statements of operations and of changes in net assets and the financial highlights present fairly, in all material respects, the financial position of Franklin Small Cap Value Securities Fund (the “Fund”) at December 31, 2012, the results of its operations for the year then ended, the changes in its net assets for each of the two years in the period then ended and the financial highlights for the periods presented, in conformity with accounting principles generally accepted in the United States of America. These financial statements and financial highlights (hereafter referred to as “financial statements”) are the responsibility of the Fund’s management. Our responsibility is to express an opinion on these financial statements based on our audits. We conducted our audits of these financial statements in accordance with the standards of the Public Company Accounting Oversight Board (United States). Those standards require that we plan and perform the audit to obtain reasonable assurance about whether the financial statements are free of material misstatement. An audit includes examining, on a test basis, evidence supporting the amounts and disclosures in the financial statements, assessing the accounting principles used and significant estimates made by management, and evaluating the overall financial statement presentation. We believe that our audits, which included confirmation of securities at December 31, 2012 by correspondence with the custodian, transfer agent and brokers, provide a reasonable basis for our opinion.
PricewaterhouseCoopers LLP
San Francisco, California
February 15, 2013
FSV-24
Franklin Templeton Variable Insurance Products Trust
Tax Information (unaudited)
Franklin Small Cap Value Securities Fund
Under Section 854(b)(1)(A) of the Internal Revenue Code, the Fund hereby reports 100% of the ordinary income dividends as income qualifying for the dividends received deduction for the fiscal year ended December 31, 2012.
FSV-25
FRANKLIN SMALL-MID CAP GROWTH SECURITIES FUND
This annual report for Franklin Small-Mid Cap Growth Securities Fund covers the fiscal year ended December 31, 2012.
Performance Summary as of 12/31/12
Average annual total return of Class 2 shares represents the average annual change in value, assuming reinvestment of dividends and capital gains. Average returns smooth out variations in returns, which can be significant; they are not the same as year-by-year results.
Periods ended 12/31/12
| | | | | | | | | | | | |
| | | 1-Year | | | 5-Year | | | 10-Year | |
Average Annual Total Return | | | +10.85% | | | | +2.14% | | | | +7.98% | |
Total Return Index Comparison for a Hypothetical $10,000 Investment (1/1/03–12/31/12)
The graph below shows the change in value of a hypothetical $10,000 investment in the Fund over the indicated period and includes reinvestment of any income or distributions. The Fund’s performance is compared to the performance of the Standard & Poor’s® 500 Index (S&P 500®) and the Russell Midcap® Growth Index. One cannot invest directly in an index, and an index is not representative of the Fund’s portfolio. Please see Important Notes to Performance Information preceding the Fund Summaries.
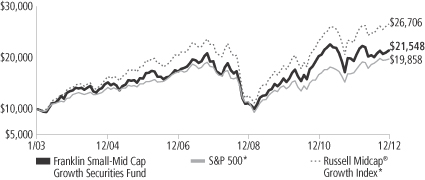
*Source: © 2013 Morningstar. Please see Index Descriptions following the Fund Summaries.
Franklin Small-Mid Cap Growth Securities Fund Class 2
Performance reflects the Fund’s Class 2 operating expenses, but does not include any contract fees, expenses or sales charges. If they had been included, performance would be lower. These charges and deductions, particularly for variable life policies, can have a significant effect on contract values and insurance benefits. See the contract prospectus for a complete description of these expenses, including sales charges.
Performance data represent past performance, which does not guarantee future results. Investment return and principal value will fluctuate, and you may have a gain or loss when you sell your shares.
Current performance may differ from figures shown.
FSC-1
Fund Goal and Main Investments: Franklin Small-Mid Cap Growth Securities Fund seeks long-term capital growth. Under normal market conditions, the Fund invests at least 80% of its net assets in investments of small capitalization and mid-capitalization companies. For this Fund, small cap companies are those within the market capitalization range of companies in the Russell 2500TM Index at the time of purchase, and midcap companies are companies within the market capitalization range of companies in the Russell Midcap® Index at the time of purchase.1
Performance Overview
You can find the Fund’s one-year total return in the Performance Summary. The Fund underperformed its narrow benchmark, the Russell Midcap® Growth Index, which posted a +15.81% total return, and its broad benchmark, the S&P 500, which generated a +16.00% total return, for the same period.2
Economic and Market Overview
The U.S. economy, as measured by gross domestic product, grew moderately in 2012, supported by positive construction, housing and labor market trends. U.S. home prices increased in most regions due to higher demand based on near to record-low mortgage rates, affordable housing prices, low new-home inventories and a five-year low in U.S. foreclosures. Home construction became a leading source of economic growth after reaching a multi-year high in 2012, further enhancing confidence in the housing market. Consumer spending and personal income levels climbed, and inflation was generally mild with the exception of energy and food prices. Consumer sentiment reached its highest level in five years, although the potential U.S. tax hikes and spending cuts scheduled to take effect in 2013 dampened confidence near year-end. Nevertheless, the federal budget deficit for fiscal year 2012 fell to its lowest level since 2008. Just after year-end, Congress passed compromise legislation that preserved lower income tax rates for most U.S. households and delayed far-reaching federal spending cuts.
For the 12-month period, U.S. stocks, as measured by the S&P 500, fluctuated as investors reacted to news headlines and shifted between risk taking and risk aversion. Toward period-end uncertainty eased surrounding the European fiscal crisis as leaders made progress on economic reforms and management of Greek debt, but slowing
1. Please see Index Descriptions following the Fund Summaries.
2. Source: © 2013 Morningstar. One cannot invest directly in an index, and an index is not representative of the Fund’s portfolio. Please see Index Descriptions following the Fund Summaries.
Fund Risks: All investments involve risks, including possible loss of principal. Investors should be comfortable with fluctuations in the value of their investment, as small- and midsized-company stocks can be volatile, especially over the short term. Smaller or relatively new or unseasoned companies can be particularly sensitive to changing economic conditions, and their prospects for growth are less certain than those of larger, more established companies. The Fund may focus on particular sectors of the market from time to time, which can carry greater risks of adverse developments in such sectors. The Fund is actively managed but there is no guarantee that the manager’s investment decisions will produce the desired results. The Fund’s prospectus also includes a description of the main investment risks.
FSC-2
economic growth in Asia, particularly China, curbed global economic recovery and markets. In its December meeting, the Federal Open Market Committee (FOMC) announced a 6.5% unemployment target as a guide to maintaining the historically low federal funds target rate. The FOMC also said it intended to continue purchasing longer term Treasuries and agency mortgage-backed securities. Despite modest third-quarter U.S. company revenues suggesting a drop in global demand, a hard-fought national election and budget deadline concerns, domestic stock markets made strong gains for the year. Value stocks generally outperformed growth stocks, and all sectors generated positive returns, as represented by the S&P 500. Not all investors favored stocks, however, and many sought perceived safe havens such as gold bullion, the Japanese yen and U.S. Treasuries. By year-end, the yield on the 10-year U.S. Treasury note declined to 1.78% from 1.89% at the beginning of 2012.
Investment Strategy
We use fundamental, bottom-up research to seek companies meeting our criteria of growth potential, quality and valuation. In seeking sustainable growth characteristics, we look for companies we believe can produce sustainable earnings and cash flow growth, evaluating the long-term market opportunity and competitive structure of an industry to target leaders and emerging leaders. We define quality companies as those with strong and improving competitive positions in attractive markets. We also believe important attributes of quality are experienced and talented management teams as well as financial strength reflected in the capital structure, gross and operating margins, free cash flow generation and returns on capital employed. Our valuation analysis includes a range of potential outcomes based on an assessment of multiple scenarios. In assessing value, we consider whether security prices fully reflect the balance of the sustainable growth opportunities relative to business and financial risks.
Manager’s Discussion
During the 12 months under review, nearly all sectors represented in the Fund’s portfolio delivered positive returns as the broad stock market rallied. Relative to the Russell Midcap® Growth Index, stock selection in the industrials and telecommunication sectors was a key contributor to performance. In the industrials sector, AMETEK’s share price reached an all-time high as the electronic instruments and electromechanical devices manufacturer continued to generate better-than-expected earnings because of strong sales in the oil and gas,
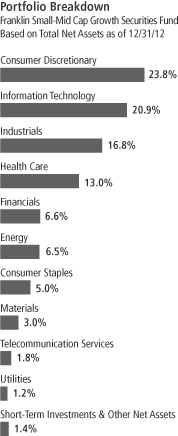
FSC-3
aerospace power and differentiated businesses, as well as solid contributions from recent acquisitions. During the year, AMETEK launched new products and demonstrated expanding margins and robust growth in Asia and Europe. In the telecommunication services sector, SBA Communications’ share price rose to an all-time high as the wireless communications tower owner and operator benefited from strong leasing demand domestically and internationally, especially from the four biggest U.S. wireless carriers.
Key individual contributors to relative performance included our positions in global diversified consumer products company Jarden and sports apparel and accessories manufacturer Under Armour and an off-benchmark investment in Netherlands-based NXP Semiconductors. Jarden reported strong earnings in recent quarters as the company experienced solid demand for its household products. Under Armour reported healthy revenues and earnings in recent quarters as the company experienced growth in its men’s, women’s and youth apparel businesses and introduced new products. NXP Semiconductors, which has a strong patent portfolio in near-field communications (NFC) technology used in enabling smartphones to function as mobile wallets, reported solid quarterly earnings results during the year largely due to new mobile design contracts and robust sales of its NFC chips.
In contrast, major detractors from the Fund’s relative performance included stock selection in the energy, materials and health care sectors. In the energy sector, notable detractors included independent oil and gas company SM Energy. Global economic and market uncertainties contributed to a risk-averse environment that hampered returns for many oil and gas exploration and production companies, particularly oil-focused, higher growth exploration and production companies such as SM Energy. The company’s earnings were pressured in the first half of the year but improved in the third quarter, resulting from record natural gas production, particularly in its Eagle Ford shale program, and robust oil production. In December, SM Energy maintained its fourth quarter and full-year 2012 production guidance and provided higher 2013 guidance. In the materials sector, shares of metallurgical coal producer and exporter Walter Energy, which we purchased during the period, were negatively affected by lower metallurgical coal prices resulting largely from Asia’s generally slower economic growth and excess global coal supply. Although Walter Energy focuses on high grade coal used in steel production, its share price was further pressured by the transition of many U.S. power plants from thermal coal to more
Top 10 Holdings
Franklin Small-Mid Cap Growth Securities Fund
12/31/12
| | | | |
Company
Sector/Industry | | % of Total
Net Assets | |
| AMETEK Inc. | | | 1.8% | |
| Industrials | | | | |
| BorgWarner Inc. | | | 1.8% | |
| Consumer Discretionary | | | | |
| SBA Communications Corp. | | | 1.8% | |
| Telecommunication Services | | | | |
| Affiliated Managers Group Inc. | | | 1.6% | |
| Financials | | | | |
| Trimble Navigation Ltd. | | | 1.6% | |
| Information Technology | | | | |
| DaVita HealthCare Partners Inc. | | | 1.6% | |
| Health Care | | | | |
| Wolverine World Wide Inc. | | | 1.6% | |
| Consumer Discretionary | | | | |
| Roper Industries Inc. | | | 1.6% | |
| Industrials | | | | |
| Dick’s Sporting Goods Inc. | | | 1.5% | |
| Consumer Discretionary | | | | |
| Watson Pharmaceuticals Inc. | | | 1.5% | |
| Health Care | | | | |
The dollar value, number of shares or principal amount, and names of all portfolio holdings are listed in the Fund’s Statement of Investments.
FSC-4
abundant and cheaper natural gas, contributing to an overall decline in coal stock prices. The company continued to reduce production in certain facilities until coal demand and pricing improve. Walter Energy’s share price received a boost near year-end, cutting some of the earlier losses, due to speculation the company was a likely takeover target by a British mining giant and a major Anglo-Swiss commodity company. In the health care sector, an underweighted allocation to Regeneron Pharmaceuticals hurt relative results as the biopharmaceutical company’s share price rose during the period.3 Additionally, our position in Gardner Denver and off-benchmark investment in Higher One Holdings detracted from relative results as their share prices declined.3
Thank you for your participation in Franklin Small-Mid Cap Growth Securities Fund. We look forward to serving your future investment needs.
3. Sold by period-end.
The foregoing information reflects our analysis, opinions and portfolio holdings as of December 31, 2012, the end of the reporting period. The way we implement our main investment strategies and the resulting portfolio holdings may change depending on factors such as market and economic conditions. These opinions may not be relied upon as investment advice or an offer for a particular security. The information is not a complete analysis of every aspect of any market, country, industry, security or the Fund. Statements of fact are from sources considered reliable, but the investment manager makes no representation or warranty as to their completeness or accuracy. Although historical performance is no guarantee of future results, these insights may help you understand our investment management philosophy.
FSC-5
Fund Expenses
As an investor in a variable insurance contract (Contract) that indirectly provides for investment in an underlying mutual fund, you can incur transaction and/or ongoing expenses at both the Fund level and the Contract level.
| • | | Transaction expenses can include sales charges (loads) on purchases, redemption fees, surrender fees, transfer fees and premium taxes. |
| • | | Ongoing expenses can include management fees, distribution and service (12b-1) fees, contract fees, annual maintenance fees, mortality and expense risk fees and other fees and expenses. All mutual funds and Contracts have some types of ongoing expenses. |
The expenses shown in the table are meant to highlight ongoing expenses at the Fund level only and do not include ongoing expenses at the Contract level, or transaction expenses at either the Fund or Contract level. While the Fund does not have transaction expenses, if the transaction and ongoing expenses at the Contract level were included, the expenses shown below would be higher. You should consult your Contract prospectus or disclosure document for more information.
The table shows Fund-level ongoing expenses and can help you understand these expenses and compare them with those of other mutual funds offered through the Contract. The table assumes a $1,000 investment held for the six months indicated. Please refer to the Fund prospectus for additional information on operating expenses.
Actual Fund Expenses
The first line (Actual) of the table provides actual account values and expenses. The “Ending Account Value” is derived from the Fund’s actual return, which includes the effect of ongoing Fund expenses, but does not include the effect of ongoing Contract expenses.
You can estimate the Fund-level expenses you incurred during the period by following these steps. Of course, your account value and expenses will differ from those in this illustration:
| 1. | Divide your account value by $1,000. |
If an account had an $8,600 value, then $8,600 ÷ $1,000 = 8.6.
| 2. | Multiply the result by the number under the heading “Fund-Level Expenses Incurred During Period.” |
If Fund-Level Expenses Incurred During Period were $7.50, then 8.6 x $7.50 = $64.50.
In this illustration, the estimated expenses incurred this period at the Fund level are $64.50.
Franklin Small-Mid Cap Growth Securities Fund Class 2
FSC-6
Hypothetical Example for Comparison with Other Mutual Funds
Information in the second line (Hypothetical) of the table can help you compare ongoing expenses of the Fund with those of other mutual funds offered through the Contract. This information may not be used to estimate the actual ending account balance or expenses you incurred during the period. The hypothetical “Ending Account Value” is based on the Fund’s actual expense ratio and an assumed 5% annual rate of return before expenses, which does not represent the Fund’s actual return. The figure under the heading “Fund-Level Expenses Incurred During Period” shows the hypothetical expenses your account would have incurred under this scenario. You can compare this figure with the 5% hypothetical examples that appear in shareholder reports of other funds offered through a Contract.
| | | | | | | | | | | | |
| Class 2 | | Beginning
Account Value 7/1/12 | | | Ending
Account Value 12/31/12 | | | Fund-Level Expenses Incurred
During Period* 7/1/12–12/31/12 | |
Actual | | $ | 1,000 | | | $ | 1,047.30 | | | $ | 5.40 | |
Hypothetical (5% return
before expenses) | | $ | 1,000 | | | $ | 1,019.86 | | | $ | 5.33 | |
*Expenses are calculated using the most recent six-month annualized expense ratio for the Fund’s Class 2 shares (1.05%), which does not include any ongoing expenses of the Contract for which the Fund is an investment option, multiplied by the average account value over the period, multiplied by 184/366 to reflect the one-half year period.
FSC-7
Franklin Templeton Variable Insurance Products Trust
Financial Highlights
Franklin Small-Mid Cap Growth Securities Fund
| | | | | | | | | | | | | | | | | | | | |
| | | Year Ended December 31, | |
| Class 1 | | 2012 | | | 2011 | | | 2010 | | | 2009 | | | 2008 | |
| | | | |
Per share operating performance | | | | | | | | | | | | | | | | | | | | |
(for a share outstanding throughout the year) | | | | | | | | | | | | | | | | | | | | |
Net asset value, beginning of year | | $ | 21.19 | | | $ | 22.21 | | | $ | 17.36 | | | $ | 12.06 | | | $ | 23.39 | |
| | | | |
Income from investment operationsa: | | | | | | | | | | | | | | | | | | | | |
Net investment income (loss)b | | | (0.01 | )c | | | (0.05 | ) | | | (0.01 | ) | | | (0.10 | )d | | | 0.01 | |
Net realized and unrealized gains (losses) | | | 2.27 | | | | (0.97 | ) | | | 4.86 | | | | 5.40 | | | | (8.98 | ) |
| | | | |
Total from investment operations | | | 2.26 | | | | (1.02 | ) | | | 4.85 | | | | 5.30 | | | | (8.97 | ) |
| | | | |
Less distributions from net realized gains | | | (1.58 | ) | | | — | | | | — | | | | — | | | | (2.36 | ) |
| | | | |
Net asset value, end of year | | $ | 21.87 | | | $ | 21.19 | | | $ | 22.21 | | | $ | 17.36 | | | $ | 12.06 | |
| | | | |
| | | | | |
Total returne | | | 11.12% | | | | (4.59)% | | | | 27.94% | | | | 43.95% | | | | (42.34)% | |
Ratios to average net assets | | | | | | | | | | | | | | | | | | | | |
Expenses | | | 0.80% | | | | 0.79% | | | | 0.79% | | | | 0.80% | f | | | 0.76% | f |
Net investment income (loss) | | | (0.03)% | c | | | (0.21)% | | | | (0.07)% | | | | (0.72)% | d | | | 0.06% | |
| | | | | |
Supplemental data | | | | | | | | | | | | | | | | | | | | |
Net assets, end of year (000’s) | | $ | 75,977 | | | $ | 76,384 | | | $ | 89,826 | | | $ | 79,670 | | | $ | 63,531 | |
Portfolio turnover rate | | | 41.44% | | | | 45.00% | | | | 46.69% | | | | 63.93% | | | | 60.12% | |
aThe amount shown for a share outstanding throughout the period may not correlate with the Statement of Operations for the period due to the timing of sales and repurchases of the Fund shares in relation to income earned and/or fluctuating market value of the investments of the Fund.
bBased on average daily shares outstanding.
cNet investment income per share includes approximately $0.03 per share received in the form of special dividends. Excluding these amounts, the ratio of net investment income to average net assets would have been (0.16)%.
dNet investment income per share includes approximately $(0.06) per share as a return of capital adjustment to a previously recorded special dividend received by the Fund. Excluding this non-recurring amount, the ratio of net investment income to average net assets would have been (0.22)%.
eTotal return does not include fees, charges or expenses imposed by the variable annuity and life insurance contracts for which the Franklin Templeton Variable Insurance Products Trust serves as an underlying investment vehicle.
fBenefit of expense reduction rounds to less than 0.01%.
The accompanying notes are an integral part of these financial statements.
FSC-8
Franklin Templeton Variable Insurance Products Trust
Financial Highlights (continued)
Franklin Small-Mid Cap Growth Securities Fund
| | | | | | | | | | | | | | | | | | | | |
| | | Year Ended December 31, | |
| Class 2 | | 2012 | | | 2011 | | | 2010 | | | 2009 | | | 2008 | |
| | | | |
Per share operating performance | | | | | | | | | | | | | | | | | | | | |
(for a share outstanding throughout the year) | | | | | | | | | | | | | | | | | | | | |
Net asset value, beginning of year | | $ | 20.49 | | | $ | 21.54 | | | $ | 16.87 | | | $ | 11.75 | | | $ | 22.91 | |
| | | | |
Income from investment operationsa: | | | | | | | | | | | | | | | | | | | | |
Net investment income (loss)b | | | (0.06 | )c | | | (0.10 | ) | | | (0.06 | ) | | | (0.13 | )d | | | (0.03 | ) |
Net realized and unrealized gains (losses) | | | 2.19 | | | | (0.95 | ) | | | 4.73 | | | | 5.25 | | | | (8.77 | ) |
| | | | |
Total from investment operations | | | 2.13 | | | | (1.05 | ) | | | 4.67 | | | | 5.12 | | | | (8.80 | ) |
| | | | |
Less distributions from net realized gains | | | (1.58 | ) | | | — | | | | — | | | | — | | | | (2.36 | ) |
| | | | |
Net asset value, end of year | | $ | 21.04 | | | $ | 20.49 | | | $ | 21.54 | | | $ | 16.87 | | | $ | 11.75 | |
| | | | |
| | | | | |
Total returne | | | 10.85% | | | | (4.87)% | | | | 27.68% | | | | 43.57% | | | | (42.49)% | |
Ratios to average net assets | | | | | | | | | | | | | | | | | | | | |
Expenses | | | 1.05% | | | | 1.04% | | | | 1.04% | | | | 1.05% | f | | | 1.01% | f |
Net investment income (loss) | | | (0.28)% | c | | | (0.46)% | | | | (0.32)% | | | | (0.97)% | d | | | (0.19)% | |
| | | | | |
Supplemental data | | | | | | | | | | | | | | | | | | | | |
Net assets, end of year (000’s) | | $ | 670,193 | | | $ | 717,086 | | | $ | 939,481 | | | $ | 813,480 | | | $ | 614,053 | |
Portfolio turnover rate | | | 41.44% | | | | 45.00% | | | | 46.69% | | | | 63.93% | | | | 60.12% | |
aThe amount shown for a share outstanding throughout the period may not correlate with the Statement of Operations for the period due to the timing of sales and repurchases of the Fund shares in relation to income earned and/or fluctuating market value of the investments of the Fund.
bBased on average daily shares outstanding.
cNet investment income per share includes approximately $0.03 per share received in the form of special dividends. Excluding these amounts, the ratio of net investment income to average net assets would have been (0.41)%.
dNet investment income per share includes approximately $(0.06) per share as a return of capital adjustment to a previously recorded special dividend received by the Fund. Excluding this non-recurring amount, the ratio of net investment income to average net assets would have been (0.47)%.
eTotal return does not include fees, charges or expenses imposed by the variable annuity and life insurance contracts for which the Franklin Templeton Variable Insurance Products Trust serves as an underlying investment vehicle.
fBenefit of expense reduction rounds to less than 0.01%.
The accompanying notes are an integral part of these financial statements.
FSC-9
Franklin Templeton Variable Insurance Products Trust
Financial Highlights (continued)
Franklin Small-Mid Cap Growth Securities Fund
| | | | | | | | | | | | | | | | | | | | |
| | | Year Ended December 31, | |
| Class 4 | | 2012 | | | 2011 | | | 2010 | | | 2009 | | | 2008a | |
| | | | |
Per share operating performance | | | | | | | | | | | | | | | | | | | | |
(for a share outstanding throughout the year) | | | | | | | | | | | | | | | | | | | | |
Net asset value, beginning of year | | $ | 20.90 | | | $ | 21.98 | | | $ | 17.24 | | | $ | 12.02 | | | $ | 20.60 | |
| | | | |
Income from investment operationsb: | | | | | | | | | | | | | | | | | | | | |
Net investment income (loss)c | | | (0.09 | )d | | | (0.12 | ) | | | (0.07 | ) | | | (0.15 | )e | | | 0.02 | |
Net realized and unrealized gains (losses) | | | 2.24 | | | | (0.96 | ) | | | 4.81 | | | | 5.37 | | | | (6.24 | ) |
| | | | |
Total from investment operations | | | 2.15 | | | | (1.08 | ) | | | 4.74 | | | | 5.22 | | | | (6.22 | ) |
| | | | |
Less distributions from net realized gains | | | (1.58 | ) | | | — | | | | — | | | | — | | | | (2.36 | ) |
| | | | |
Net asset value, end of year | | $ | 21.47 | | | $ | 20.90 | | | $ | 21.98 | | | $ | 17.24 | | | $ | 12.02 | |
| | | | |
| | | | | |
Total returnf | | | 10.79% | | | | (4.91)% | | | | 27.49% | | | | 43.43% | | | | (34.74)% | |
Ratios to average net assetsg | | | | | | | | | | | | | | | | | | | | |
Expenses | | | 1.15% | | | | 1.14% | | | | 1.14% | | | | 1.15% | h | | | 1.11% | h |
Net investment income (loss) | | | (0.38)% | d | | | (0.56)% | | | | (0.42)% | | | | (1.07)% | e | | | (0.29)% | |
| | | | | |
Supplemental data | | | | | | | | | | | | | | | | | | | | |
Net assets, end of year (000’s) | | $ | 12,000 | | | $ | 12,664 | | | $ | 15,413 | | | $ | 11,029 | | | $ | 3,538 | |
Portfolio turnover rate | | | 41.44% | | | | 45.00% | | | | 46.69% | | | | 63.93% | | | | 60.12% | |
aFor the period February 29, 2008 (effective date) to December 31, 2008.
bThe amount shown for a share outstanding throughout the period may not correlate with the Statement of Operations for the period due to the timing of sales and repurchases of the Fund shares in relation to income earned and/or fluctuating market value of the investments of the Fund.
cBased on average daily shares outstanding.
dNet investment income per share includes approximately $0.03 per share received in the form of special dividends. Excluding these amounts, the ratio of net investment income to average net assets would have been (0.51)%.
eNet investment income per share includes approximately $(0.06) per share as a return of capital adjustment to a previously recorded special dividend received by the Fund. Excluding this non-recurring amount, the ratio of net investment income to average net assets would have been (0.57)%.
fTotal return does not include fees, charges or expenses imposed by the variable annuity and life insurance contracts for which the Franklin Templeton Variable Insurance Products Trust serves as an underlying investment vehicle. Total return is not annualized for periods less than one year.
gRatios are annualized for periods less than one year.
hBenefit of expense reduction rounds to less than 0.01%.
The accompanying notes are an integral part of these financial statements.
FSC-10
Franklin Templeton Variable Insurance Products Trust
Statement of Investments, December 31, 2012
| | | | | | | | |
| Franklin Small-Mid Cap Growth Securities Fund | | Shares/
Warrants | | | Value | |
Common Stocks and Other Equity Interests 98.6% | | | | | | | | |
Consumer Discretionary 23.8% | | | | | | | | |
aBorgWarner Inc. | | | 188,200 | | | $ | 13,478,884 | |
aBuffalo Wild Wings Inc. | | | 104,000 | | | | 7,573,280 | |
aChipotle Mexican Grill Inc. | | | 34,600 | | | | 10,292,116 | |
aDelphi Automotive PLC (United Kingdom) | | | 55,800 | | | | 2,134,350 | |
Dick’s Sporting Goods Inc. | | | 254,100 | | | | 11,559,009 | |
aDiscovery Communications Inc., A | | | 114,500 | | | | 7,268,460 | |
aDollar General Corp. | | | 245,000 | | | | 10,802,050 | |
GNC Holdings Inc., A | | | 280,000 | | | | 9,318,400 | |
a,bHomeAway Inc. | | | 150,200 | | | | 3,304,400 | |
aIconix Brand Group Inc. | | | 139,300 | | | | 3,109,176 | |
aJarden Corp. | | | 181,100 | | | | 9,362,870 | |
aLiberty Media Corp. - Liberty Capital, A | | | 40,000 | | | | 4,640,400 | |
aLululemon Athletica Inc. (Canada) | | | 73,000 | | | | 5,564,790 | |
Marriott International Inc., A | | | 135,000 | | | | 5,031,450 | |
Nordstrom Inc. | | | 83,300 | | | | 4,456,550 | |
Ralph Lauren Corp. | | | 61,900 | | | | 9,280,048 | |
Ross Stores Inc. | | | 66,100 | | | | 3,579,315 | |
Starwood Hotels & Resorts Worldwide Inc. | | | 119,100 | | | | 6,831,576 | |
aTenneco Inc. | | | 219,100 | | | | 7,692,601 | |
Tiffany & Co. | | | 125,000 | | | | 7,167,500 | |
Tractor Supply Co. | | | 120,200 | | | | 10,620,872 | |
Ulta Salon Cosmetics & Fragrance Inc. | | | 55,500 | | | | 5,453,430 | |
aUnder Armour Inc., A | | | 95,988 | | | | 4,658,298 | |
Wolverine World Wide Inc. | | | 295,000 | | | | 12,089,100 | |
Wynn Resorts Ltd. | | | 47,000 | | | | 5,287,030 | |
| | | | | | | | |
| | | | | | | 180,555,955 | |
| | | | | | | | |
Consumer Staples 5.0% | | | | | | | | |
a,bBoston Beer Inc., A | | | 75,300 | | | | 10,124,085 | |
Mead Johnson Nutrition Co., A | | | 151,500 | | | | 9,982,335 | |
aTreeHouse Foods Inc. | | | 141,000 | | | | 7,350,330 | |
Whole Foods Market Inc. | | | 112,700 | | | | 10,292,891 | |
| | | | | | | | |
| | | | | | | 37,749,641 | |
| | | | | | | | |
Energy 6.5% | | | | | | | | |
Cabot Oil & Gas Corp., A | | | 152,300 | | | | 7,575,402 | |
aCameron International Corp. | | | 150,600 | | | | 8,502,876 | |
aFMC Technologies Inc. | | | 117,600 | | | | 5,036,808 | |
Oceaneering International Inc. | | | 69,600 | | | | 3,743,784 | |
Range Resources Corp. | | | 53,900 | | | | 3,386,537 | |
SM Energy Co. | | | 86,900 | | | | 4,537,049 | |
aSouthwestern Energy Co. | | | 322,200 | | | | 10,764,702 | |
aSuperior Energy Services Inc. | | | 281,900 | | | | 5,840,968 | |
| | | | | | | | |
| | | | | | | 49,388,126 | |
| | | | | | | | |
Financials 6.6% | | | | | | | | |
aAffiliated Managers Group Inc. | | | 94,200 | | | | 12,260,130 | |
Digital Realty Trust Inc. | | | 47,400 | | | | 3,217,986 | |
Hancock Holding Co. | | | 185,900 | | | | 5,900,466 | |
aIntercontinentalExchange Inc. | | | 48,908 | | | | 6,055,299 | |
Jones Lang LaSalle Inc. | | | 74,100 | | | | 6,219,954 | |
Lazard Ltd., A | | | 196,000 | | | | 5,848,640 | |
FSC-11
Franklin Templeton Variable Insurance Products Trust
Statement of Investments, December 31, 2012 (continued)
| | | | | | | | |
| Franklin Small-Mid Cap Growth Securities Fund | | Shares/
Warrants | | | Value | |
Common Stocks and Other Equity Interests (continued) | | | | | | | | |
Financials (continued) | | | | | | | | |
aSignature Bank | | | 102,900 | | | $ | 7,340,886 | |
T. Rowe Price Group Inc. | | | 49,000 | | | | 3,191,370 | |
| | | | | | | | |
| | | | | | | 50,034,731 | |
| | | | | | | | |
Health Care 13.0% | | | | | | | | |
Agilent Technologies Inc. | | | 147,000 | | | | 6,018,180 | |
aAlexion Pharmaceuticals Inc. | | | 88,200 | | | | 8,274,042 | |
aAmarin Corp. PLC, ADR (United Kingdom) | | | 219,900 | | | | 1,778,991 | |
aARIAD Pharmaceuticals Inc. | | | 87,500 | | | | 1,678,250 | |
aCareFusion Corp. | | | 76,600 | | | | 2,189,228 | |
aCatamaran Corp. (Canada) | | | 16,400 | | | | 772,604 | |
aCerner Corp. | | | 141,100 | | | | 10,955,004 | |
aDaVita HealthCare Partners Inc. | | | 109,500 | | | | 12,103,035 | |
aEdwards Lifesciences Corp. | | | 44,400 | | | | 4,003,548 | |
aHeartWare International Inc. | | | 29,006 | | | | 2,435,054 | |
aHospira Inc. | | | 83,300 | | | | 2,602,292 | |
aIllumina Inc. | | | 39,200 | | | | 2,179,128 | |
aMedivation Inc. | | | 68,600 | | | | 3,509,576 | |
aMettler-Toledo International Inc. | | | 37,500 | | | | 7,248,750 | |
aOnyx Pharmaceuticals Inc. | | | 43,600 | | | | 3,293,108 | |
aPharmacyclics Inc. | | | 40,300 | | | | 2,333,370 | |
a,bStereotaxis Inc. | | | 61,940 | | | | 161,663 | |
a,cStereotaxis Inc., 144A | | | 122,843 | | | | 320,621 | |
a,dStereotaxis Inc., wts., 144A, 5/07/18 | | | 122,843 | | | | 261,251 | |
aThoratec Corp. | | | 62,500 | | | | 2,345,000 | |
aVarian Medical Systems Inc. | | | 47,300 | | | | 3,322,352 | |
aVertex Pharmaceuticals Inc. | | | 76,800 | | | | 3,220,992 | |
aWaters Corp. | | | 71,600 | | | | 6,237,792 | |
aWatson Pharmaceuticals Inc. | | | 128,700 | | | | 11,068,200 | |
| | | | | | | | |
| | | | | | | 98,312,031 | |
| | | | | | | | |
Industrials 16.8% | | | | | | | | |
Allegiant Travel Co. | | | 84,800 | | | | 6,225,168 | |
AMETEK Inc. | | | 372,200 | | | | 13,983,554 | |
aB/E Aerospace Inc. | | | 132,300 | | | | 6,535,620 | |
aColfax Corp. | | | 73,200 | | | | 2,953,620 | |
aDigitalGlobe Inc. | | | 73,400 | | | | 1,793,896 | |
Fastenal Co. | | | 188,200 | | | | 8,787,058 | |
Flowserve Corp. | | | 67,900 | | | | 9,967,720 | |
aGenesee & Wyoming Inc. | | | 61,700 | | | | 4,694,136 | |
aHexcel Corp. | | | 204,200 | | | | 5,505,232 | |
aIHS Inc., A | | | 57,600 | | | | 5,529,600 | |
J.B. Hunt Transport Services Inc. | | | 121,800 | | | | 7,272,678 | |
Kansas City Southern | | | 83,300 | | | | 6,953,884 | |
The Manitowoc Co. Inc. | | | 365,400 | | | | 5,729,472 | |
Pall Corp. | | | 89,700 | | | | 5,405,322 | |
Robert Half International Inc. | | | 188,200 | | | | 5,988,524 | |
Rockwell Automation Inc. | | | 126,900 | | | | 10,658,331 | |
Roper Industries Inc. | | | 107,170 | | | | 11,947,312 | |
aUnited Rentals Inc. | | | 96,900 | | | | 4,410,888 | |
aVerisk Analytics Inc., A | | | 64,700 | | | | 3,299,700 | |
| | | | | | | | |
| | | | | | | 127,641,715 | |
| | | | | | | | |
FSC-12
Franklin Templeton Variable Insurance Products Trust
Statement of Investments, December 31, 2012 (continued)
| | | | | | | | |
| Franklin Small-Mid Cap Growth Securities Fund | | Shares/
Warrants | | | Value | |
Common Stocks and Other Equity Interests (continued) | | | | | | | | |
Information Technology 20.9% | | | | | | | | |
aAcme Packet Inc. | | | 276,300 | | | $ | 6,111,756 | |
aAlliance Data Systems Corp. | | | 53,900 | | | | 7,802,564 | |
aANSYS Inc. | | | 141,700 | | | | 9,542,078 | |
Avago Technologies Ltd. (Singapore) | | | 169,600 | | | | 5,369,536 | |
aBottomline Technologies Inc. | | | 142,100 | | | | 3,750,019 | |
aCheck Point Software Technologies Ltd. (Israel) | | | 141,800 | | | | 6,755,352 | |
aCitrix Systems Inc. | | | 91,000 | | | | 5,983,250 | |
aCommVault Systems Inc. | | | 36,494 | | | | 2,543,997 | |
aElectronic Arts Inc. | | | 166,000 | | | | 2,411,980 | |
aEquinix Inc. | | | 29,400 | | | | 6,062,280 | |
aF5 Networks Inc. | | | 107,800 | | | | 10,472,770 | |
FactSet Research Systems Inc. | | | 43,100 | | | | 3,795,386 | |
aFleetCor Technologies Inc. | | | 110,500 | | | | 5,928,325 | |
aHittite Microwave Corp. | | | 156,300 | | | | 9,706,230 | |
aLinkedIn Corp., A | | | 39,900 | | | | 4,581,318 | |
aNortel Networks Corp. (Canada) | | | 4 | | | | — | |
aNuance Communications Inc. | | | 490,000 | | | | 10,936,800 | |
aNXP Semiconductors NV (Netherlands) | | | 235,000 | | | | 6,196,950 | |
a,bPalo Alto Networks Inc. | | | 18,400 | | | | 984,768 | |
aRed Hat Inc. | | | 145,900 | | | | 7,726,864 | |
aSemtech Corp. | | | 800 | | | | 23,160 | |
aShoretel Inc. | | | 282,400 | | | | 1,197,376 | |
aSilicon Laboratories Inc. | | | 167,900 | | | | 7,019,899 | |
aTrimble Navigation Ltd. | | | 204,800 | | | | 12,242,944 | |
aVeriFone Systems Inc. | | | 90,900 | | | | 2,697,912 | |
aVeriSign Inc. | | | 72,500 | | | | 2,814,450 | |
aViaSat Inc. | | | 160,000 | | | | 6,224,000 | |
aWorkday Inc. | | | 7,200 | | | | 392,400 | |
Xilinx Inc. | | | 258,900 | | | | 9,294,510 | |
| | | | | | | | |
| | | | | | | 158,568,874 | |
| | | | | | | | |
Materials 3.0% | | | | | | | | |
Airgas Inc. | | | 56,500 | | | | 5,157,885 | |
Celanese Corp., A | | | 120,900 | | | | 5,383,677 | |
bGeorgia Gulf Corp. | | | 26,219 | | | | 1,082,320 | |
The Sherwin-Williams Co. | | | 39,900 | | | | 6,137,418 | |
Walter Energy Inc. | | | 147,000 | | | | 5,274,360 | |
| | | | | | | | |
| | | | | | | 23,035,660 | |
| | | | | | | | |
Telecommunication Services 1.8% | | | | | | | | |
aSBA Communications Corp. | | | 188,200 | | | | 13,365,964 | |
| | | | | | | | |
Utilities 1.2% | | | | | | | | |
aCalpine Corp. | | | 510,200 | | | | 9,249,926 | |
| | | | | | | | |
Total Common Stocks and Other Equity Interests (Cost $530,332,554) | | | | | | | 747,902,623 | |
| | | | | | | | |
FSC-13
Franklin Templeton Variable Insurance Products Trust
Statement of Investments, December 31, 2012 (continued)
| | | | | | | | |
| Franklin Small-Mid Cap Growth Securities Fund | | Shares/
Warrants | | | Value | |
Short Term Investments 3.3% | | | | | | | | |
Money Market Funds (Cost $11,612,727) 1.6% | | | | | | | | |
a,eInstitutional Fiduciary Trust Money Market Portfolio | | | 11,612,727 | | | $ | 11,612,727 | |
| | | | | | | | |
fInvestments from Cash Collateral Received for Loaned Securities
(Cost $12,710,385) 1.7% | | | | | | | | |
Money Market Funds 1.7% | | | | | | | | |
gBNY Mellon Overnight Government Fund, 0.191% | | | 12,710,385 | | | | 12,710,385 | |
| | | | | | | | |
Total Investments (Cost $554,655,666) 101.9% | | | | | | | 772,225,735 | |
Other Assets, less Liabilities (1.9)% | | | | | | | (14,056,006 | ) |
| | | | | | | | |
Net Assets 100.0% | | | | | | $ | 758,169,729 | |
| | | | | | | | |
See Abbreviations on page FSC-24.
aNon-income producing.
bA portion or all of the security is on loan at December 31, 2012. See Note 1(b).
cSecurity was purchased pursuant to Rule 144A under the Securities Act of 1933 and may be sold in transactions exempt from registration only to qualified institutional buyers or in a public offering registered under the Securities Act of 1933. This security has been deemed liquid under guidelines approved by the Trust’s Board of Trustees. At December 31, 2012, the value of this security was $320,621, representing 0.04% of net assets.
dSee Note 8 regarding restricted securities.
eSee Note 7 regarding investments in the Institutional Fiduciary Trust Money Market Portfolio.
fSee Note 1(b) regarding securities on loan.
gThe rate shown is the annualized seven-day yield at period end.
The accompanying notes are an integral part of these financial statements.
FSC-14
Franklin Templeton Variable Insurance Products Trust
Financial Statements
Statement of Assets and Liabilities
December 31, 2012
| | | | |
| | | Franklin Small-Mid
Cap Growth
Securities Fund | |
Assets: | | | | |
Investments in securities: | | | | |
Cost - Unaffiliated issuers | | $ | 543,042,939 | |
Cost - Sweep Money Fund (Note 7) | | | 11,612,727 | |
| | | | |
Total cost of investments | | $ | 554,655,666 | |
| | | | |
Value - Unaffiliated issuers | | $ | 760,613,008 | |
Value - Sweep Money Fund (Note 7) | | | 11,612,727 | |
| | | | |
Total value of investments (includes securities loaned in the amount of $12,630,865) | | | 772,225,735 | |
Receivables: | | | | |
Investment securities sold | | | 631,044 | |
Capital shares sold | | | 62,248 | |
Dividends and interest | | | 214,165 | |
Other assets | | | 20 | |
| | | | |
Total assets | | | 773,133,212 | |
| | | | |
Liabilities: | | | | |
Payables: | | | | |
Capital shares redeemed | | | 1,186,536 | |
Affiliates | | | 771,844 | |
Payable upon return of securities loaned | | | 12,710,385 | |
Accrued expenses and other liabilities | | | 294,718 | |
| | | | |
Total liabilities | | | 14,963,483 | |
| | | | |
Net assets, at value | | $ | 758,169,729 | |
| | | | |
Net assets consist of: | | | | |
Paid-in capital | | $ | 497,818,651 | |
Undistributed net investment income | | | 825 | |
Net unrealized appreciation (depreciation) | | | 217,570,069 | |
Accumulated net realized gain (loss) | | | 42,780,184 | |
| | | | |
Net assets, at value | | $ | 758,169,729 | |
| | | | |
Class 1: | | | | |
Net assets, at value | | $ | 75,977,084 | |
| | | | |
Shares outstanding | | | 3,473,454 | |
| | | | |
Net asset value and maximum offering price per share | | $ | 21.87 | |
| | | | |
Class 2: | | | | |
Net assets, at value | | $ | 670,192,507 | |
| | | | |
Shares outstanding | | | 31,852,735 | |
| | | | |
Net asset value and maximum offering price per share | | $ | 21.04 | |
| | | | |
Class 4: | | | | |
Net assets, at value | | $ | 12,000,138 | |
| | | | |
Shares outstanding | | | 559,031 | |
| | | | |
Net asset value and maximum offering price per share | | $ | 21.47 | |
| | | | |
The accompanying notes are an integral part of these financial statements.
FSC-15
Franklin Templeton Variable Insurance Products Trust
Financial Statements (continued)
Statement of Operations
for the year ended December 31, 2012
| | | | |
| | | Franklin Small-Mid
Cap Growth
Securities Fund | |
Investment income: | | | | |
Dividends | | $ | 5,665,289 | |
Income from securities loaned | | | 607,878 | |
| | | | |
Total investment income | | | 6,273,167 | |
| | | | |
Expenses: | | | | |
Management fees (Note 3a) | | | 4,143,596 | |
Administrative fees (Note 3b) | | | 2,039,374 | |
Distribution fees: (Note 3c) | | | | |
Class 2 | | | 1,807,415 | |
Class 4 | | | 50,226 | |
Unaffiliated transfer agent fees | | | 1,565 | |
Custodian fees (Note 4) | | | 13,114 | |
Reports to shareholders | | | 239,364 | |
Professional fees | | | 53,623 | |
Trustees’ fees and expenses | | | 3,330 | |
Other | | | 22,193 | |
| | | | |
Total expenses | | | 8,373,800 | |
| | | | |
Net investment income (loss) | | | (2,100,633 | ) |
| | | | |
Realized and unrealized gains (losses): | | | | |
Net realized gain (loss) from investments | | | 45,009,702 | |
Net change in unrealized appreciation (depreciation) on investments | | | 40,911,343 | |
| | | | |
Net realized and unrealized gain (loss) | | | 85,921,045 | |
| | | | |
Net increase (decrease) in net assets resulting from operations | | $ | 83,820,412 | |
| | | | |
The accompanying notes are an integral part of these financial statements.
FSC-16
Franklin Templeton Variable Insurance Products Trust
Financial Statements (continued)
Statements of Changes in Net Assets
| | | | | | | | |
| | | Franklin Small-Mid Cap Growth
Securities Fund | |
| | | Year Ended December 31, | |
| | | 2012 | | | 2011 | |
| | | | |
Increase (decrease) in net assets: | | | | | | | | |
Operations: | | | | | | | | |
Net investment income (loss) | | $ | (2,100,633 | ) | | $ | (4,181,310 | ) |
Net realized gain (loss) from investments | | | 45,009,702 | | | | 95,464,105 | |
Net change in unrealized appreciation (depreciation) on investments | | | 40,911,343 | | | | (133,141,452 | ) |
| | | | |
Net increase (decrease) in net assets resulting from operations | | | 83,820,412 | | | | (41,858,657 | ) |
| | | | |
Distributions to shareholders from: | | | | | | | | |
Net realized gains: | | | | | | | | |
Class 1 | | | (5,398,642 | ) | | | — | |
Class 2 | | | (51,973,132 | ) | | | — | |
Class 4 | | | (1,174,175 | ) | | | — | |
| | | | |
Total distributions to shareholders | | | (58,545,949 | ) | | | — | |
| | | | |
Capital share transactions: (Note 2) | | | | | | | | |
Class 1 | | | (3,317,419 | ) | | | (9,862,944 | ) |
Class 2 | | | (69,375,316 | ) | | | (184,782,471 | ) |
Class 4 | | | (546,347 | ) | | | (2,082,119 | ) |
| | | | |
Total capital share transactions | | | (73,239,082 | ) | | | (196,727,534 | ) |
| | | | |
Net increase (decrease) in net assets | | | (47,964,619 | ) | | | (238,586,191 | ) |
Net assets: | | | | | | | | |
Beginning of year | | | 806,134,348 | | | | 1,044,720,539 | |
| | | | |
End of year | | $ | 758,169,729 | | | $ | 806,134,348 | |
| | | | |
Undistributed net investment income (loss) included in net assets: | | | | | | | | |
End of year | | $ | 825 | | | $ | — | |
| | | | |
The accompanying notes are an integral part of these financial statements.
FSC-17
Franklin Templeton Variable Insurance Products Trust
Notes to Financial Statements
Franklin Small-Mid Cap Growth Securities Fund
1. ORGANIZATION AND SIGNIFICANT ACCOUNTING POLICIES
Franklin Templeton Variable Insurance Products Trust (Trust) is registered under the Investment Company Act of 1940, as amended, (1940 Act) as an open-end investment company, consisting of twenty separate funds. The Franklin Small-Mid Cap Growth Securities Fund (Fund) is included in this report. The financial statements of the remaining funds in the Trust are presented separately. Shares of the Fund are generally sold only to insurance company separate accounts to fund the benefits of variable life insurance policies or variable annuity contracts. At December 31, 2012, 41.37% of the Fund’s shares were held through one insurance company. Investment activities of these insurance company separate accounts could have a material impact on the Fund. The Fund offers three classes of shares: Class 1, Class 2, and Class 4. Each class of shares differs by its distribution fees, voting rights on matters affecting a single class and its exchange privilege.
The following summarizes the Fund’s significant accounting policies.
a. Financial Instrument Valuation
The Fund’s investments in financial instruments are carried at fair value daily. Fair value is the price that would be received to sell an asset or paid to transfer a liability in an orderly transaction between market participants on the measurement date. Under procedures approved by the Trust’s Board of Trustees (the Board), the Fund’s administrator, investment manager and other affiliates have formed the Valuation and Liquidity Oversight Committee (VLOC). The VLOC provides administration and oversight of the Fund’s valuation policies and procedures, which are approved annually by the Board. Among other things, these procedures allow the Fund to utilize independent pricing services, quotations from securities and financial instrument dealers, and other market sources to determine fair value.
Equity securities listed on an exchange or on the NASDAQ National Market System are valued at the last quoted sale price or the official closing price of the day, respectively. Foreign equity securities are valued as of the close of trading on the foreign stock exchange on which the security is primarily traded, or the NYSE, whichever is earlier. The value is then converted into its U.S. dollar equivalent at the foreign exchange rate in effect at the close of the NYSE on the day that the value of the security is determined. Over-the-counter (OTC) securities are valued within the range of the most recent quoted bid and ask prices. Securities that trade in multiple markets or on multiple exchanges are valued according to the broadest and most representative market. Certain equity securities are valued based upon fundamental characteristics or relationships to similar securities. Investments in open-end mutual funds and non-registered money market funds are valued at the closing net asset value.
The Fund has procedures to determine the fair value of financial instruments for which market prices are not reliable or readily available. Under these procedures, the VLOC convenes on a regular basis to review such financial instruments and considers a number of factors, including significant unobservable valuation inputs, when arriving at fair value. The VLOC primarily employs a market-based approach which may use related or comparable assets or liabilities, recent transactions, market multiples, book values, and other relevant information for the investment to determine the fair value of the investment. An income-based valuation approach may also be used in which the anticipated future cash flows of the investment are discounted to calculate fair value. Discounts may also be applied due to the nature or duration of any restrictions on the disposition of the investments. Due to the inherent uncertainty of valuations of such investments, the fair values may differ significantly from the values that would have been used had an active market existed. The VLOC employs various methods for calibrating these valuation approaches including a regular review of key inputs and assumptions, transactional back-testing or disposition analysis, and reviews of any related market activity.
Trading in securities on foreign securities stock exchanges and OTC markets may be completed before the daily close of business on the NYSE. Occasionally, events occur between the time at which trading in a foreign security is completed and the close of the NYSE that might call into question the reliability of the value of a portfolio security held by the Fund. As a result, differences may arise between the value of the Fund’s portfolio securities as determined at the foreign market close and the latest indications of value at the close of the NYSE. In order to minimize the potential for these differences, the VLOC monitors price movements following the close of trading in foreign stock markets through a series of country specific market proxies (such as baskets of
FSC-18
Franklin Templeton Variable Insurance Products Trust
Notes to Financial Statements (continued)
Franklin Small-Mid Cap Growth Securities Fund
1. ORGANIZATION AND SIGNIFICANT ACCOUNTING POLICIES (continued)
a. Financial Instrument Valuation (continued)
American Depositary Receipts, futures contracts and exchange traded funds). These price movements are measured against established trigger thresholds for each specific market proxy to assist in determining if an event has occurred that may call into question the reliability of the values of the foreign securities held by the Fund. If such an event occurs, the securities may be valued using fair value procedures, which may include the use of independent pricing services.
b. Securities Lending
The Fund participates in an agency based securities lending program. The Fund receives cash collateral against the loaned securities in an amount equal to at least 102% of the market value of the loaned securities. Collateral is maintained over the life of the loan in an amount not less than 100% of the market value of loaned securities, as determined at the close of fund business each day; any additional collateral required due to changes in security values is delivered to the Fund on the next business day. The collateral is invested in a non-registered money fund as indicated on the Statement of Investments. The Fund receives income from the investment of cash collateral, in addition to lending fees and rebates paid by the borrower. The Fund bears the market risk with respect to the collateral investment, securities loaned, and the risk that the agent may default on its obligations to the Fund. The securities lending agent has agreed to indemnify the Fund in the event of default by a third party borrower.
c. Income Taxes
It is the Fund’s policy to qualify as a regulated investment company under the Internal Revenue Code. The Fund intends to distribute to shareholders substantially all of its taxable income and net realized gains to relieve it from federal income and if applicable, excise taxes. As a result, no provision for U.S. federal income taxes is required.
The Fund recognizes the tax benefits of uncertain tax positions only when the position is “more likely than not” to be sustained upon examination by the tax authorities based on the technical merits of the tax position. As of December 31, 2012, and for all open tax years, the Fund has determined that no liability for unrecognized tax benefits is required in the Fund’s financial statements related to uncertain tax positions taken on a tax return (or expected to be taken on future tax returns). Open tax years are those that remain subject to examination and are based on each tax jurisdiction statute of limitation.
d. Security Transactions, Investment Income, Expenses and Distributions
Security transactions are accounted for on trade date. Realized gains and losses on security transactions are determined on a specific identification basis. Estimated expenses are accrued daily. Dividend income is recorded on the ex-dividend date. Distributions to shareholders are recorded on the ex-dividend date and are determined according to income tax regulations (tax basis). Distributable earnings determined on a tax basis may differ from earnings recorded in accordance with accounting principles generally accepted in the United States of America. These differences may be permanent or temporary. Permanent differences are reclassified among capital accounts to reflect their tax character. These reclassifications have no impact on net assets or the results of operations. Temporary differences are not reclassified, as they may reverse in subsequent periods.
Common expenses incurred by the Trust are allocated among the funds based on the ratio of net assets of each fund to the combined net assets of the Trust. Fund specific expenses are charged directly to the fund that incurred the expense.
Realized and unrealized gains and losses and net investment income, not including class specific expenses, are allocated daily to each class of shares based upon the relative proportion of net assets of each class. Differences in per share distributions, by class, are generally due to differences in class specific expenses.
FSC-19
Franklin Templeton Variable Insurance Products Trust
Notes to Financial Statements (continued)
Franklin Small-Mid Cap Growth Securities Fund
1. ORGANIZATION AND SIGNIFICANT ACCOUNTING POLICIES (continued)
e. Accounting Estimates
The preparation of financial statements in accordance with accounting principles generally accepted in the United States of America requires management to make estimates and assumptions that affect the reported amounts of assets and liabilities at the date of the financial statements and the amounts of income and expenses during the reporting period. Actual results could differ from those estimates.
f. Guarantees and Indemnifications
Under the Trust’s organizational documents, its officers and trustees are indemnified by the Trust against certain liabilities arising out of the performance of their duties to the Trust. Additionally, in the normal course of business, the Trust, on behalf of the Fund, enters into contracts with service providers that contain general indemnification clauses. The Trust’s maximum exposure under these arrangements is unknown as this would involve future claims that may be made against the Trust that have not yet occurred. Currently, the Trust expects the risk of loss to be remote.
2. SHARES OF BENEFICIAL INTEREST
At December 31, 2012, there were an unlimited number of shares authorized (without par value). Transactions in the Fund’s shares were as follows:
| | | | | | | | | | | | | | | | |
| | | Year Ended December 31, | |
| | | 2012 | | | 2011 | |
| Class 1 Shares: | | Shares | | | Amount | | | Shares | | | Amount | |
Shares sold | | | 113,036 | | | $ | 2,509,688 | | | | 213,179 | | | $ | 4,851,501 | |
Shares issued in reinvestment of distributions | | | 261,943 | | | | 5,398,642 | | | | — | | | | — | |
Shares redeemed | | | (505,605 | ) | | | (11,225,749 | ) | | | (652,643 | ) | | | (14,714,445 | ) |
| | | | |
Net increase (decrease) | | | (130,626 | ) | | $ | (3,317,419 | ) | | | (439,464 | ) | | $ | (9,862,944 | ) |
| | | | |
Class 2 Shares: | | | | | | | | | | | | | | | | |
Shares sold | | | 2,025,093 | | | $ | 43,908,851 | | | | 3,213,965 | | | $ | 70,946,756 | |
Shares issued in reinvestment of distributions | | | 2,618,294 | | | | 51,973,132 | | | | — | | | | — | |
Shares redeemed | | | (7,781,173 | ) | | | (165,257,299 | ) | | | (11,848,847 | ) | | | (255,729,227 | ) |
| | | | |
Net increase (decrease) | | | (3,137,786 | ) | | $ | (69,375,316 | ) | | | (8,634,882 | ) | | $ | (184,782,471 | ) |
| | | | |
Class 4 Shares: | | | | | | | | | | | | | | | | |
Shares sold | | | 217,367 | | | $ | 4,998,926 | | | | 311,193 | | | $ | 7,039,340 | |
Shares issued on reinvestment of distributions | | | 57,955 | | | | 1,174,175 | | | | — | | | | — | |
Shares redeemed | | | (322,353 | ) | | | (6,719,448 | ) | | | (406,340 | ) | | | (9,121,459 | ) |
| | | | |
Net increase (decrease) | | | (47,031 | ) | | $ | (546,347 | ) | | | (95,147 | ) | | $ | (2,082,119 | ) |
| | | | |
3. TRANSACTIONS WITH AFFILIATES
Franklin Resources, Inc. is the holding company for various subsidiaries that together are referred to as Franklin Templeton Investments. Certain officers and trustees of the Fund are also officers and/or directors of the following subsidiaries:
| | |
| Subsidiary | | Affiliation |
Franklin Advisers, Inc. (Advisers) | | Investment manager |
Franklin Templeton Services, LLC (FT Services) | | Administrative manager |
Franklin Templeton Distributors, Inc. (Distributors) | | Principal underwriter |
Franklin Templeton Investor Services, LLC (Investor Services) | | Transfer agent |
FSC-20
Franklin Templeton Variable Insurance Products Trust
Notes to Financial Statements (continued)
Franklin Small-Mid Cap Growth Securities Fund
3. TRANSACTIONS WITH AFFILIATES (continued)
a. Management Fees
The Fund pays an investment management fee to Advisors based on the average daily net assets of the Fund as follows:
| | |
| Annualized Fee Rate | | Net Assets |
| 0.550% | | Up to and including $500 million |
| 0.450% | | Over $500 million, up to and including $1 billion |
| 0.400% | | Over $1 billion, up to and including $1.5 billion |
| 0.350% | | Over $1.5 billion, up to and including $6.5 billion |
| 0.325% | | Over $6.5 billion, up to and including $11.5 billion |
| 0.300% | | Over $11.5 billion, up to and including $16.5 billion |
| 0.290% | | Over $16.5 billion, up to and including $19 billion |
| 0.280% | | Over $19 billion, up to and including $21.5 billion |
| 0.270% | | In excess of $21.5 billion |
b. Administrative Fees
The Fund pays an administrative fee to FT Services of 0.25% per year of the average daily net assets of the Fund.
c. Distribution Fees
The Board has adopted distribution plans for Class 2 and Class 4 shares pursuant to Rule 12b-1 under the 1940 Act. Under the Fund’s compensation distribution plans, the Fund pays Distributors for costs incurred in connection with the servicing, sale and distribution of the Fund’s shares up to 0.35% per year of its average daily net assets of each class. Some distribution fees are not charged on shares held by affiliates. The Board has agreed to limit the current rate to 0.25% per year for Class 2.
d. Transfer Agent Fees
Investor Services, under terms of an agreement, performs shareholder servicing for the Fund and is not paid by the Fund for the services.
4. EXPENSE OFFSET ARRANGEMENT
The Fund has entered into an arrangement with its custodian whereby credits realized as a result of uninvested cash balances are used to reduce a portion of the Fund’s custodian expenses. During the year ended December 31, 2012, there were no credits earned.
5. INCOME TAXES
The tax character of distributions paid during the years ended December 31, 2012 and 2011, was as follows:
| | | | | | | | |
| | | 2012 | | | 2011 | |
Distributions paid from long term capital gain: | | $ | 58,545,949 | | | $ | — | |
| | | | |
FSC-21
Franklin Templeton Variable Insurance Products Trust
Notes to Financial Statements (continued)
Franklin Small-Mid Cap Growth Securities Fund
5. INCOME TAXES (continued)
At December 31, 2012, the cost of investments, net unrealized appreciation (depreciation), and undistributed long term capital gains for income tax purposes were as follows:
| | | | |
Cost of investments | | $ | 557,319,355 | |
| | | | |
| |
Unrealized appreciation | | $ | 237,342,946 | |
Unrealized depreciation | | | (22,436,566 | ) |
| | | | |
Net unrealized appreciation (depreciation) | | $ | 214,906,380 | |
| | | | |
Distributable earnings – undistributed long term capital gains | | $ | 45,444,698 | |
| | | | |
Differences between income and/or capital gains as determined on a book basis and a tax basis are primarily due to differing treatments of wash sales.
6. INVESTMENT TRANSACTIONS
Purchases and sales of investments (excluding short term securities) for the year ended December 31, 2012, aggregated $328,751,727 and $460,699,972, respectively.
7. INVESTMENTS IN INSTITUTIONAL FIDUCIARY TRUST MONEY MARKET PORTFOLIO
The Fund invests in the Institutional Fiduciary Trust Money Market Portfolio (Sweep Money Fund), an open-end investment company managed by Advisers. Management fees paid by the Fund are reduced on assets invested in the Sweep Money Fund, in an amount not to exceed the management and administrative fees paid by the Sweep Money Fund.
8. RESTRICTED SECURITIES
The Fund invests in securities that are restricted under the Securities Act of 1933 (1933 Act) or which are subject to legal, contractual, or other agreed upon restrictions on resale. Restricted securities are often purchased in private placement transactions, and cannot be sold without prior registration unless the sale is pursuant to an exemption under the 1933 Act. Disposal of these securities may require greater effort and expense, and prompt sale at an acceptable price may be difficult. The Fund may have registration rights for restricted securities. The issuer generally incurs all registration costs.
At December 31, 2012, the Fund held investments in restricted securities, excluding certain securities exempt from registration under the 1933 Act deemed to be liquid, as follows:
| | | | | | | | | | | | | | | | |
| Warrants | | | Issuer | | Acquisition
Date | | | Cost | | | Value | |
| | 122,843 | | | aStereotaxis Inc., wts., 144A, 5/07/18 (Value is 0.03% of Net Assets) | | | 5/07/12 | | | $ | 153,554 | | | $ | 261,251 | |
| | | | | | | | | | | | |
aThe Fund also invests in unrestricted securities of the issuer, valued at $482,284 as of December 31, 2012.
9. CREDIT FACILITY
The Fund, together with other U.S. registered and foreign investment funds (collectively, Borrowers), managed by Franklin Templeton Investments, are borrowers in a joint syndicated senior unsecured credit facility totaling $1.5 billion (Global Credit Facility) which matured on January 18, 2013. This Global Credit Facility provides a source of funds to the Borrowers for
FSC-22
Franklin Templeton Variable Insurance Products Trust
Notes to Financial Statements (continued)
Franklin Small-Mid Cap Growth Securities Fund
9. CREDIT FACILITY (continued)
temporary and emergency purposes, including the ability to meet future unanticipated or unusually large redemption requests. Effective January 18, 2013, the Borrowers renewed the Global Credit Facility which matures on January 17, 2014.
Under the terms of the Global Credit Facility, the Fund shall, in addition to interest charged on any borrowings made by the Fund and other costs incurred by the Fund, pay its share of fees and expenses incurred in connection with the implementation and maintenance of the Global Credit Facility, based upon its relative share of the aggregate net assets of all of the Borrowers, including an annual commitment fee of 0.07% based upon the unused portion of the Global Credit Facility. These fees are reflected in other expenses on the Statement of Operations. During the year ended December 31, 2012, the Fund did not use the Global Credit Facility.
10. FAIR VALUE MEASUREMENTS
The Fund follows a fair value hierarchy that distinguishes between market data obtained from independent sources (observable inputs) and the Fund’s own market assumptions (unobservable inputs). These inputs are used in determining the value of the Fund’s financial instruments and are summarized in the following fair value hierarchy:
| | • | | Level 1 – quoted prices in active markets for identical financial instruments |
| | • | | Level 2 – other significant observable inputs (including quoted prices for similar financial instruments, interest rates, prepayment speed, credit risk, etc.) |
| | • | | Level 3 – significant unobservable inputs (including the Fund’s own assumptions in determining the fair value of financial instruments) |
The inputs or methodology used for valuing financial instruments are not an indication of the risk associated with investing in those financial instruments.
For movements between the levels within the fair value hierarchy, the Fund has adopted a policy of recognizing the transfers as of the date of the underlying event which caused the movement.
A summary of inputs used as of December 31, 2012, in valuing the Fund’s assets carried at fair value, is as follows:
| | | | | | | | | | | | | | | | |
| | | Level 1 | | | Level 2 | | | Level 3 | | | Total | |
| | | | |
Assets: | | | | | | | | | | | | | | | | |
Investments in Securities: | | | | | | | | | | | | | | | | |
Equity Investments: | | | | | | | | | | | | | | | | |
Health Care | | $ | 98,050,780 | | | | — | | | $ | 261,251 | | | $ | 98,312,031 | |
All Other Equity Investmentsa | | | 649,590,592 | | | | — | | | | — | | | | 649,590,592 | |
Short Term Investments | | | 11,612,727 | | | | 12,710,385 | | | | — | | | | 24,323,112 | |
| | | | |
Total Investments in Securities | | $ | 759,254,099 | | | $ | 12,710,385 | | | $ | 261,251 | | | $ | 772,225,735 | |
| | | | |
aFor detailed categories, see the accompanying Statement of Investments.
A reconciliation of assets in which Level 3 inputs are used in determining fair value is presented when there are significant Level 3 investments at the end of the year.
11. NEW ACCOUNTING PRONOUNCEMENTS
In December 2011, the Financial Accounting Standards Board (FASB) issued Accounting Standards Update (ASU) No. 2011-11, Balance Sheet (Topic 210): Disclosures about Offsetting Assets and Liabilities. The amendments in the ASU enhance disclosures
FSC-23
Franklin Templeton Variable Insurance Products Trust
Notes to Financial Statements (continued)
Franklin Small-Mid Cap Growth Securities Fund
11. NEW ACCOUNTING PRONOUNCEMENTS (continued)
about offsetting of financial assets and liabilities to enable investors to understand the effect of these arrangements on a fund’s financial position. In January 2013, FASB issued ASU No. 2013-01, Balance Sheet (Topic 210): Clarifying the Scope of Disclosures about Offsetting Assets and Liabilities. The amendments in ASU No. 2013-01 clarify the intended scope of disclosures required by ASU No. 2011-11. These ASUs are effective for interim and annual reporting periods beginning on or after January 1, 2013. The Fund believes the adoption of these ASUs will not have a material impact on its financial statements.
12. SUBSEQUENT EVENTS
The Fund has evaluated subsequent events through the issuance of the financial statements and determined that no events have occurred that require disclosure other than those already disclosed in the financial statements.
| | | | |
ABBREVIATIONS | | | | |
| Selected Portfolio | | | | |
| | | | |
| ADR - American Depositary Receipt | | | | |
FSC-24
Franklin Templeton Variable Insurance Products Trust
Franklin Small-Mid Cap Growth Securities Fund
Report of Independent Registered Public Accounting Firm
To the Board of Trustees and Shareholders of Franklin Templeton Variable Insurance Products Trust
In our opinion, the accompanying statement of assets and liabilities, including the statement of investments, and the related statements of operations and of changes in net assets and the financial highlights present fairly, in all material respects, the financial position of Franklin Small-Mid Growth Securities Fund (the “Fund”) at December 31, 2012, the results of its operations for the year then ended, the changes in its net assets for each of the two years in the period then ended and the financial highlights for the periods presented, in conformity with accounting principles generally accepted in the United States of America. These financial statements and financial highlights (hereafter referred to as “financial statements”) are the responsibility of the Fund’s management. Our responsibility is to express an opinion on these financial statements based on our audits. We conducted our audits of these financial statements in accordance with the standards of the Public Company Accounting Oversight Board (United States). Those standards require that we plan and perform the audit to obtain reasonable assurance about whether the financial statements are free of material misstatement. An audit includes examining, on a test basis, evidence supporting the amounts and disclosures in the financial statements, assessing the accounting principles used and significant estimates made by management, and evaluating the overall financial statement presentation. We believe that our audits, which included confirmation of securities at December 31, 2012 by correspondence with the custodian, transfer agent and brokers, provide a reasonable basis for our opinion.
PricewaterhouseCoopers LLP
San Francisco, California
February 15, 2013
FSC-25
Franklin Templeton Variable Insurance Products Trust
Tax Information (unaudited)
Franklin Small-Mid Cap Growth Securities Fund
Under Section 852(b)(3)(C) of the Internal Revenue Code (Code), the Fund hereby reports the maximum amount allowable but no less than $58,545,949 as a long term capital gain dividend for the fiscal year ended December 31, 2012.
FSC-26
FRANKLIN STRATEGIC INCOME SECURITIES FUND
We are pleased to bring you Franklin Strategic Income Securities Fund’s annual report for the fiscal year ended December 31, 2012.
Performance Summary as of 12/31/12
Average annual total return of Class 2 shares represents the average annual change in value, assuming reinvestment of dividends and capital gains. Average returns smooth out variations in returns, which can be significant; they are not the same as year-by-year results.
Periods ended 12/31/12
| | | | | | | | | | | | |
| | | 1-Year | | | 5-Year | | | 10-Year | |
Average Annual Total Return | | | +12.75% | | | | +7.44% | | | | +8.18% | |
Total Return Index Comparison for a Hypothetical $10,000 Investment (1/1/03–12/31/12)
The graph below shows the change in value of a hypothetical $10,000 investment in the Fund over the indicated period and includes reinvestment of any income or distributions. The Fund’s performance is compared to the performance of the Barclays U.S. Aggregate Index and the Lipper Multi-Sector Income Funds Classification Average. One cannot invest directly in an index, and an index is not representative of the Fund’s portfolio. Please see Important Notes to Performance Information preceding the Fund Summaries.
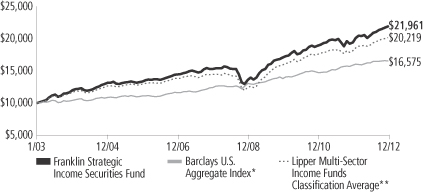
*Source: © 2013 Morningstar. Please see Index Descriptions following the Fund Summaries.
**Source: Lipper Inc. Please see Index Descriptions following the Fund Summaries.
Franklin Strategic Income Securities Fund – Class 2
Performance reflects the Fund’s Class 2 operating expenses, but does not include any contract fees, expenses or sales charges. If they had been included, performance would be lower. These charges and deductions, particularly for variable life policies, can have a significant effect on contract values and insurance benefits. See the contract prospectus for a complete description of these expenses, including sales charges.
Performance data represent past performance, which does not guarantee future results. Investment return and principal value will fluctuate, and you may have a gain or loss when you sell your shares.
Current performance may differ from figures shown.
FSI-1
Fund Goals and Main Investments: Franklin Strategic Income Securities Fund seeks a high level of current income, with capital appreciation over the long term as a secondary goal. Under normal market conditions, the Fund invests primarily to predominantly in U.S. and foreign debt securities, including those in emerging markets.
Performance Overview
You can find the Fund’s one-year total return in the Performance Summary. The Fund outperformed the +4.21% total return of its benchmark, the Barclays U.S. Aggregate Index.1 The Fund also outperformed the +11.21% total return of its peers, as measured by the Lipper Multi-Sector Income Funds Classification Average.2
Economic and Market Overview
During the 12 months under review, U.S. economic data remained mixed. Oil prices declined, and the housing sector strengthened with new and existing home sales as well as prices pointing toward a gradual strengthening trend, albeit from a low base. Consumer spending generally increased and consumer confidence reached its highest level during the period in November. However, manufacturing indicators weakened and gross domestic product growth was moderate.
The global economic recovery was also mixed during 2012. Emerging markets continued to lead the recovery with many economies returning to and exceeding pre-crisis activity levels. Although some developed economies also enjoyed relatively strong recoveries, growth in the G-3 (U.S., eurozone and Japan) continued to be slow by the standards of previous recoveries. Despite ongoing uncertainty, eurozone leaders made meaningful progress and began to deploy policy solutions aimed at correcting long-unaddressed structural issues. Policymakers in the largest developed economies increased their already unprecedented efforts to supply liquidity and with few exceptions, policymakers elsewhere in the world paused their tightening cycles or reduced rates in response to the risks to domestic activity from a potential deterioration in the global outlook. European Central Bank (ECB) President Mario Draghi declared, “the ECB is ready to do whatever it takes to preserve the euro,” buoying markets in the summer. In Asia, China’s and Japan’s central banks took measures to stimulate their countries’ growth.
1. Source: © 2013 Morningstar.
2. Source: Lipper Inc.
One cannot invest directly in an index, and an index is not representative of the Fund’s portfolio. Please see Index Descriptions following the Fund Summaries.
Fund Risks: All investments involve risks, including possible loss of principal. As the prices of bonds in the Fund adjust to a rise in interest rates, the Fund’s share price may decline. Risks associated with higher yielding, lower rated securities (junk bonds) include higher risk of default and loss of principal. Floating rate loans and high yield corporate bonds are rated below investment grade and are subject to greater risk of default, which could result in loss of principal. Investments in foreign securities involve risks such as currency fluctuations and political uncertainty. Investments in developing markets involve heightened risks related to the same factors, in addition to those associated with their relatively small size and lesser liquidity. Investing in derivative securities and the use of foreign currency techniques involve special risks as such may not achieve the anticipated benefits and/or may result in losses to the Fund. The Fund is actively managed but there is no guarantee that the manager’s investment decisions will produce the desired results. The Fund’s prospectus also includes a description of the main investment risks.
FSI-2
In September, the Federal Reserve Board (Fed) acknowledged the need for further policy accommodation and announced a third round of quantitative easing (QE3). QE3 consisted of additional $40 billion monthly purchases of mortgage-backed securities until the labor market improves. The Fed also continued buying long-term Treasuries and selling short-term Treasuries in an effort to put downward pressure on long-term interest rates. In December, the Fed announced a 6.5% unemployment target as a guide to maintaining the historically low federal funds target rate. Economists, business leaders and market watchers were concerned about the U.S. “fiscal cliff” when, unless Congress acted, automatic income tax increases and federal budget cuts were scheduled to take effect in 2013. They feared these events could cause another U.S. recession. Not knowing whether Congress and the President would avert these measures after the U.S. election, many businesses delayed major investment and hiring decisions. Lawmakers reached a late compromise on January 1, 2013, a day after the reporting period ended. The approved legislation will maintain some tax cuts for most Americans but increase rates on the wealthiest. It will also delay the automatic federal spending cuts scheduled to start in January 2013.
Ongoing investor concerns about the fiscal cliff and eurozone uncertainty drove the 10-year U.S. Treasury note yield to 1.78% at year-end from 1.89% on December 31, 2011. During the 12 months under review, below-investment-grade corporate bonds, as measured by the Credit Suisse High Yield Index, produced strong returns and outperformed investment-grade fixed income markets, as measured by the Barclays U.S. Aggregate Index.3
3. Please see Index Descriptions following the Fund Summaries.
FSI-3
Investment Strategy
We allocate our investments among the various types of debt available based on our assessment of changing economic, global market, industry and issuer conditions. We use a top-down analysis of macroeconomic trends, combined with a bottom-up fundamental analysis of market sectors, industries and issuers, seeking to take advantage of varying sector reactions to economic events. For example, we may evaluate business cycles, yield curves, country risk, and the relative interest rates among currencies, and values between and within markets. In selecting debt securities, we generally conduct our own analysis of the security’s intrinsic value rather than simply relying on the coupon rate or rating. We may also enter into various transactions involving certain currency-, interest rate- or credit-related derivative instruments for hedging purposes, to enhance returns or to obtain exposure to various market sectors.
Manager’s Discussion
Global economic and political headlines continued to influence financial markets in 2012. During the first half of 2012, weak economic data along with renewed eurozone concerns pressured financial markets, and U.S. stocks, as measured by the Standard & Poor’s® 500 Index (S&P 500®), fell in the second quarter.3 However, similar to the back-and-forth pattern of the past couple of years, financial markets rallied during the second half of the year, and the S&P 500 delivered a +16.00% total return in 2012.1 Renewed optimism stemmed from indications of further monetary easing from central banks in the U.S., eurozone and Japan, as well as improving economic indicators in the U.S. and China toward period-end. In this environment, long-term U.S. rates fluctuated, but ultimately ended the reporting period at slightly lower levels. Amid relatively steady interest rates and a more supportive credit market environment by period-end, most fixed income sectors delivered positive total returns. Given greater financial market optimism, many “spread” sectors of the fixed income market outperformed U.S. Treasuries. Similarly, a rebound in certain foreign currencies compared to the U.S. dollar drove many international fixed income currency markets to positive performance.
The Fund’s overweighted exposure to noninvestment-grade corporate credit sectors positively impacted performance relative to the Barclays U.S. Aggregate Index. Compared to the Lipper peer average, the Fund’s higher exposure to certain non-dollar holdings aided returns.
What is a currency forward contract?
A currency forward contract is an agreement between the Fund and a counterparty to buy or sell a foreign currency for a specific exchange rate on a future date.
FSI-4
Corporate credit fundamentals remained broadly supportive during the period, with ample corporate liquidity and default rates well below the historical average. Although companies began focusing more on shareholder-friendly activities, such as stock buybacks and increasing dividends, in general management teams remained cautious regarding balance sheet liquidity and accessed the public debt markets to refinance existing debt at lower interest rates. Similarly, although banks’ reluctance to lend curbed corporate spending initiatives, increases in global capital ratios and liquidity buffers for global banks strengthened the banking sector’s perceived credit safety. Consequently, corporate spread sectors delivered positive performance as spreads tightened during the period. The Fund’s largest corporate credit exposure remained in high yield bonds, although given the compression in spreads between higher quality and lower rated securities, the Fund raised its exposure to leveraged bank loans and investment grade corporate bonds while reducing its weighting in high yield corporate bonds.
The global financial market rally also drove positive performance for many of the underlying currencies held in the Fund’s global bond positions. In particular, many positions denominated in Asian currencies in countries such as South Korea and the Philippines, some of which included currency forward contracts, performed well versus the U.S. dollar. Similarly, Fund holdings in Polish and Hungarian bonds generated positive returns, as they were proxy-hedged against short euro currency forward contracts, and the euro underperformed the two currencies during the period. In Latin America, the Fund’s exposure to the Mexican peso and Chilean peso benefited returns, given the strength of those currencies. Toward period-end, weakness in the Japanese yen also helped Fund performance, as the Fund had sold the yen using currency forward contracts. In most global positions, the Fund maintained relatively short duration, focusing on yield in short-term maturity instruments and seeking potential currency appreciation. Finally, we maintained only a modest weighting in hard currency (U.S. dollar and euro) emerging market sovereign bonds, given valuations that remained rich compared to longer term averages.
With relatively flat longer term U.S. interest rates, the more rate-sensitive U.S. fixed income sectors, including Treasuries, agencies and mortgage-backed securities (MBS), generally delivered positive returns for the period, although lagging returns of the broader fixed income market. The Fund maintained lower exposure to these sectors,
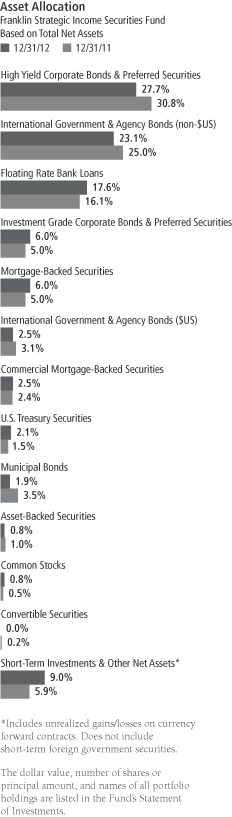
FSI-5
considering historically low U.S. rates, preferring higher income opportunities in the corporate and global markets. Within the U.S. rate sectors, the Fund favored agency MBS, given their somewhat higher current yields and considering the Fed’s continued purchases of agency MBS through quantitative easing programs. For municipal bond holdings, the Fund realized gains by selling certain longer maturity municipal bonds while adding diversified floating-rate exposure with a basket of municipal issuers via a derivatives index instrument.
Thank you for your participation in Franklin Strategic Income Securities Fund. We look forward to serving your future investment needs.
The foregoing information reflects our analysis, opinions and portfolio holdings as of December 31, 2012, the end of the reporting period. The way we implement our main investment strategies and the resulting portfolio holdings may change depending on factors such as market and economic conditions. These opinions may not be relied upon as investment advice or an offer for a particular security. The information is not a complete analysis of every aspect of any market, country, industry, security or the Fund. Statements of fact are from sources considered reliable, but the investment manager makes no representation or warranty as to their completeness or accuracy. Although historical performance is no guarantee of future results, these insights may help you understand our investment management philosophy.
FSI-6
Fund Expenses
As an investor in a variable insurance contract (Contract) that indirectly provides for investment in an underlying mutual fund, you can incur transaction and/or ongoing expenses at both the Fund level and the Contract level.
| • | | Transaction expenses can include sales charges (loads) on purchases, redemption fees, surrender fees, transfer fees and premium taxes. |
| • | | Ongoing expenses can include management fees, distribution and service (12b-1) fees, contract fees, annual maintenance fees, mortality and expense risk fees and other fees and expenses. All mutual funds and Contracts have some types of ongoing expenses. |
The expenses shown in the table are meant to highlight ongoing expenses at the Fund level only and do not include ongoing expenses at the Contract level, or transaction expenses at either the Fund or Contract level. While the Fund does not have transaction expenses, if the transaction and ongoing expenses at the Contract level were included, the expenses shown below would be higher. You should consult your Contract prospectus or disclosure document for more information.
The table shows Fund-level ongoing expenses and can help you understand these expenses and compare them with those of other mutual funds offered through the Contract. The table assumes a $1,000 investment held for the six months indicated. Please refer to the Fund prospectus for additional information on operating expenses.
Actual Fund Expenses
The first line (Actual) of the table provides actual account values and expenses. The “Ending Account Value” is derived from the Fund’s actual return, which includes the effect of ongoing Fund expenses, but does not include the effect of ongoing Contract expenses.
You can estimate the Fund-level expenses you incurred during the period by following these steps. Of course, your account value and expenses will differ from those in this illustration:
| 1. | Divide your account value by $1,000. |
If an account had an $8,600 value, then $8,600 ÷ $1,000 = 8.6.
| 2. | Multiply the result by the number under the heading “Fund-Level Expenses Incurred During Period.” |
If Fund-Level Expenses Incurred During Period were $7.50, then 8.6 x $7.50 = $64.50.
In this illustration, the estimated expenses incurred this period at the Fund level are $64.50.
Franklin Strategic Income Securities Fund – Class 2
FSI-7
Hypothetical Example for Comparison with Other Mutual Funds
Information in the second line (Hypothetical) of the table can help you compare ongoing expenses of the Fund with those of other mutual funds offered through the Contract. This information may not be used to estimate the actual ending account balance or expenses you incurred during the period. The hypothetical “Ending Account Value” is based on the Fund’s actual expense ratio and an assumed 5% annual rate of return before expenses, which does not represent the Fund’s actual return. The figure under the heading “Fund-Level Expenses Incurred During Period” shows the hypothetical expenses your account would have incurred under this scenario. You can compare this figure with the 5% hypothetical examples that appear in shareholder reports of other funds offered through a Contract.
| | | | | | | | | | | | |
| Class 2 | | Beginning
Account Value 7/1/12 | | | Ending
Account
Value 12/31/12 | | | Fund-Level Expenses Incurred
During Period* 7/1/12–12/31/12 | |
Actual | | $ | 1,000 | | | $ | 1,067.30 | | | $ | 4.26 | |
Hypothetical (5% return
before expenses) | | $ | 1,000 | | | $ | 1,021.01 | | | $ | 4.17 | |
*Expenses are calculated using the most recent six-month annualized expense ratio for the Fund’s Class 2 shares (0.82%), which does not include any ongoing expenses of the Contract for which the Fund is an investment option, multiplied by the average account value over the period, multiplied by 184/366 to reflect the one-half year period.
FSI-8
SUPPLEMENT DATED SEPTEMBER 14, 2012
TOTHE STATEMENTOF ADDITIONAL INFORMATION
DATED MAY 1, 2012
FRANKLIN STRATEGIC INCOME SECURITIES FUND
(A series of Franklin Templeton Variable Insurance Products Trust)
The Statement of Additional Information is amended as follows:
I. For Franklin Strategic Income Securities Fund, the Section entitled “Goals, Strategies and Risks – Additional Strategies/Additional Considerations” on page 7 is amended to reflect that the Fund may invest up to 5% of its net assets in collateralized debt obligations, including collateralized loan obligations.
II. For Franklin Strategic Income Securities Fund, the Section entitled “Goals, Strategies and Risks – Glossary of Investments, Techniques, Strategies and Their Risks – Collateralized loan obligations,” beginning on page 12 is replaced with the following:
Collateralized Debt Obligations Collateralized debt obligations and similarly structured securities, sometimes known generally as CDOs, are interests in a trust or other special purpose entity (SPE) and are typically backed by a diversified pool of bonds, loans or other debt obligations. CDOs are not limited to investments in one type of debt and, accordingly, a CDO may be collateralized by corporate bonds, commercial loans, asset-backed securities, residential mortgage-backed securities, REITs, commercial mortgage-backed securities, emerging market debt, and municipal bonds. Certain CDOs may use derivatives contracts, such as credit default swaps, to create “synthetic” exposure to assets rather than holding such assets directly, which entails the risks of derivative instruments described elsewhere in this SAI.
Common varieties of CDOs include the following:
Collateralized loan obligations Collateralized loan obligations (CLOs) are interests in a trust typically collateralized substantially by a pool of loans, which may include, among others, domestic and foreign senior secured loans, senior unsecured loans, and subordinate corporate loans made to domestic and foreign borrowers, including loans that may be rated below investment grade or equivalent unrated loans.
Collateralized bond obligations Collateralized bond obligations (CBOs) are interests in a trust typically backed substantially by a diversified pool of high risk, below investment grade fixed income securities.
FSI-9
Structured finance CDOs Structured finance CDOs are interests in a trust typically backed substantially by structured investment products such as asset-backed securities and commercial mortgage-backed securities.
Synthetic CDOs In contrast to CDOs that directly own the underlying debt obligations, referred to as cash CDOs, synthetic CDOs are typically collateralized substantially by derivatives contracts, such as credit default swaps, to create “synthetic” exposure to assets rather than holding such assets directly, which entails the risks of derivative instruments described elsewhere in this SAI, principally counterparty risk.
CDOs are similar in structure to collateralized mortgage obligations, described elsewhere in this SAI. Unless the context indicates otherwise, the discussion of CDOs below also applies to CLOs, CBOs and other similarly structured securities.
In CDOs, the cash flows from the SPE are split into two or more portions, called tranches (or classes), that vary in risk and yield. The riskiest portion is the “equity” tranche which bears the first loss from defaults on the bonds or loans in the SPE and is intended to protect the other, more senior tranches from severe, and potentially unforeseen, defaults or delinquent collateral payments (though such protection is not complete). Because they may be partially protected from defaults, senior tranches from a CDO typically have higher ratings and lower yields than the underlying collateral securities held by the trust, and may be rated investment grade. Despite protection from the equity tranche, more senior tranches can experience, and may have experienced in the past, substantial losses due to actual defaults, increased sensitivity to defaults due to collateral default, downgrades of the underlying collateral by rating agencies, forced liquidation of a collateral pool due to a failure of coverage tests, disappearance of protecting tranches, market anticipation of defaults, as well as a market aversion to CDO securities as a class.
The risks of an investment in a CDO depend largely on the type of collateral held by the SPE and the tranche of the CDO in which the Fund invests. Investment risk may also be affected by the performance of a CDO’s collateral manager (the entity responsible for selecting and managing the pool of collateral securities held by the CDO trust), especially during a period of market volatility like that experienced in 2007-2008. Normally, CDOs are privately offered and sold, and thus, are not registered under the securities laws and traded in a public market. As a result, investments in CDOs may be characterized by the Fund as illiquid securities. However, an active dealer market may exist for CDOs allowing the Fund to trade CDOs with other qualified institutional investors under Rule 144A. To the extent such investments are characterized as illiquid, they will be subject to the Fund’s restrictions on investments in illiquid securities. The Fund’s investment in
FSI-10
unregistered securities such as CDOs will not receive the same investor protection as an investment in registered securities.
All tranches of CDOs, including senior tranches with high credit ratings, can experience, and many have recently experienced, substantial losses due to actual defaults, increased sensitivity to future defaults due to the disappearance of protecting tranches, market anticipation of defaults, as well as market aversion to CDO securities as a class. Recently, prices of CDO tranches have declined considerably. The drop in prices was initially triggered by the subprime mortgage crisis. Subprime mortgages make up a significant portion of the mortgage securities that collateralize many CDOs. As floating interest rates and mortgage default rates increased, the rating agencies that had rated the mortgage securities and CDO transactions backed by such mortgages realized their default assumptions were too low and began to downgrade the credit rating of these transactions. There can be no assurance that additional losses of equal or greater magnitude will not occur in the future.
In addition to the normal risks associated with debt securities and asset backed securities (e.g., interest rate risk, credit risk and default risk) described elsewhere in this SAI, CDOs carry additional risks including, but not limited to: (i) the possibility that distributions from collateral securities will not be adequate to make interest or other payments; (ii) the quality of the collateral may decline in value or quality or go into default or be downgraded; (iii) the Fund may invest in tranches of a CDO that are subordinate to other classes; and (iv) the complex structure of the security may not be fully understood at the time of investment and may produce disputes with the issuer, difficulty in valuing the security or unexpected investment results.
Certain issuers of CDOs may be deemed to be “investment companies” as defined in the 1940 Act. As a result, the Fund’s investment in these structured investments from these issuers may be limited by the restrictions contained in the 1940 Act. CDOs generally charge management fees and administrative expenses that the shareholders of the Fund would pay indirectly.
Please keep this supplement for future reference.
FSI-11
Franklin Templeton Variable Insurance Products Trust
Financial Highlights
Franklin Strategic Income Securities Fund
| | | | | | | | | | | | | | | | | | | | |
| | | Year Ended December 31, | |
| Class 1 | | 2012 | | | 2011 | | | 2010 | | | 2009 | | | 2008 | |
| | | | |
Per share operating performance | | | | | | | | | | | | | | | | | | | | |
(for a share outstanding throughout the year) | | | | | | | | | | | | | | | | | | | | |
Net asset value, beginning of year | | $ | 12.55 | | | $ | 12.99 | | | $ | 12.28 | | | $ | 10.58 | | | $ | 12.78 | |
| | | | |
Income from investment operationsa: | | | | | | | | | | | | | | | | | | | | |
Net investment incomeb | | | 0.65 | | | | 0.69 | | | | 0.72 | | | | 0.70 | | | | 0.69 | |
Net realized and unrealized gains (losses) | | | 0.92 | | | | (0.32 | ) | | | 0.61 | | | | 1.95 | | | | (1.99 | ) |
| | | | |
Total from investment operations | | | 1.57 | | | | 0.37 | | | | 1.33 | | | | 2.65 | | | | (1.30 | ) |
| | | | |
Less distributions from: | | | | | | | | | | | | | | | | | | | | |
Net investment income and net of foreign currency gains | | | (0.93 | ) | | | (0.81 | ) | | | (0.62 | ) | | | (0.95 | ) | | | (0.87 | ) |
Net realized gains | | | (0.02 | ) | | | — | | | | — | | | | — | | | | (0.03 | ) |
| | | | |
Total distributions | | | (0.95 | ) | | | (0.81 | ) | | | (0.62 | ) | | | (0.95 | ) | | | (0.90 | ) |
| | | | |
Net asset value, end of year | | $ | 13.17 | | | $ | 12.55 | | | $ | 12.99 | | | $ | 12.28 | | | $ | 10.58 | |
| | | | |
| | | | | |
Total returnc | | | 13.12% | | | | 2.78% | | | | 11.21% | | | | 26.11% | | | | (11.03)% | |
Ratios to average net assets | | | | | | | | | | | | | | | | | | | | |
Expenses | | | 0.58% | | | | 0.60% | d | | | 0.59% | d | | | 0.58% | d | | | 0.61% | d |
Net investment income | | | 5.04% | | | | 5.36% | | | | 5.71% | | | | 6.13% | | | | 5.83% | |
| | | | | |
Supplemental data | | | | | | | | | | | | | | | | | | | | |
Net assets, end of year (000’s) | | $ | 1,019,537 | | | $ | 1,043,690 | | | $ | 1,195,149 | | | $ | 1,173,313 | | | $ | 903,358 | |
Portfolio turnover rate | | | 49.98% | | | | 55.65% | | | | 56.46% | | | | 56.19% | | | | 47.68% | |
Portfolio turnover rate excluding mortgage dollar rollse | | | 48.75% | | | | 55.65% | | | | 56.46% | | | | 56.19% | | | | 47.68% | |
aThe amount shown for a share outstanding throughout the period may not correlate with the Statement of Operations for the period due to the timing of sales and repurchases of the Fund shares in relation to income earned and/or fluctuating market value of the investments of the Fund.
bBased on average daily shares outstanding.
cTotal return does not include fees, charges or expenses imposed by the variable annuity and life insurance contracts for which the Franklin Templeton Variable Insurance Products Trust serves as an underlying investment vehicle.
dBenefit of expense reduction rounds to less than 0.01%.
eSee Note 1(h) regarding mortgage dollar rolls.
The accompanying notes are an integral part of these financial statements.
FSI-12
Franklin Templeton Variable Insurance Products Trust
Financial Highlights (continued)
Franklin Strategic Income Securities Fund
| | | | | | | | | | | | | | | | | | | | |
| | | Year Ended December 31, | |
| Class 2 | | 2012 | | | 2011 | | | 2010 | | | 2009 | | | 2008 | |
| | | | |
Per share operating performance | | | | | | | | | | | | | | | | | | | | |
(for a share outstanding throughout the year) | | | | | | | | | | | | | | | | | | | | |
Net asset value, beginning of year | | $ | 12.27 | | | $ | 12.72 | | | $ | 12.05 | | | $ | 10.41 | | | $ | 12.60 | |
| | | | |
Income from investment operationsa: | | | | | | | | | | | | | | | | | | | | |
Net investment incomeb | | | 0.60 | | | | 0.64 | | | | 0.68 | | | | 0.66 | | | | 0.65 | |
Net realized and unrealized gains (losses) | | | 0.89 | | | | (0.30 | ) | | | 0.59 | | | | 1.91 | | | | (1.96 | ) |
| | | | |
Total from investment operations | | | 1.49 | | | | 0.34 | | | | 1.27 | | | | 2.57 | | | | (1.31 | ) |
| | | | |
Less distributions from: | | | | | | | | | | | | | | | | | | | | |
Net investment income and net of foreign currency gains | | | (0.90 | ) | | | (0.79 | ) | | | (0.60 | ) | | | (0.93 | ) | | | (0.85 | ) |
Net realized gains | | | (0.02 | ) | | | — | | | | — | | | | — | | | | (0.03 | ) |
| | | | |
Total distributions | | | (0.92 | ) | | | (0.79 | ) | | | (0.60 | ) | | | (0.93 | ) | | | (0.88 | ) |
| | | | |
Net asset value, end of year | | $ | 12.84 | | | $ | 12.27 | | | $ | 12.72 | | | $ | 12.05 | | | $ | 10.41 | |
| | | | |
| | | | | |
Total returnc | | | 12.75% | | | | 2.57% | | | | 10.91% | | | | 25.75% | | | | (11.24)% | |
Ratios to average net assets | | | | | | | | | | | | | | | | | | | | |
Expenses | | | 0.83% | | | | 0.85% | d | | | 0.84% | d | | | 0.83% | d | | | 0.86% | d |
Net investment income | | | 4.79% | | | | 5.11% | | | | 5.46% | | | | 5.88% | | | | 5.58% | |
| | | | | |
Supplemental data | | | | | | | | | | | | | | | | | | | | |
Net assets, end of year (000’s) | | $ | 158,451 | | | $ | 123,749 | | | $ | 101,347 | | | $ | 68,240 | | | $ | 33,155 | |
Portfolio turnover rate | | | 49.98% | | | | 55.65% | | | | 56.46% | | | | 56.19% | | | | 47.68% | |
Portfolio turnover rate excluding mortgage dollar rollse | | | 48.75% | | | | 55.65% | | | | 56.46% | | | | 56.19% | | | | 47.68% | |
aThe amount shown for a share outstanding throughout the period may not correlate with the Statement of Operations for the period due to the timing of sales and repurchases of the Fund shares in relation to income earned and/or fluctuating market value of the investments of the Fund.
bBased on average daily shares outstanding.
cTotal return does not include fees, charges or expenses imposed by the variable annuity and life insurance contracts for which the Franklin Templeton Variable Insurance Products Trust serves as an underlying investment vehicle.
dBenefit of expense reduction rounds to less than 0.01%.
eSee Note 1(h) regarding mortgage dollar rolls.
The accompanying notes are an integral part of these financial statements.
FSI-13
Franklin Templeton Variable Insurance Products Trust
Financial Highlights (continued)
Franklin Strategic Income Securities Fund
| | | | | | | | | | | | | | | | | | | | |
| | | Year Ended December 31, | |
| Class 4 | | 2012 | | | 2011 | | | 2010 | | | 2009 | | | 2008a | |
| | | | |
Per share operating performance | | | | | | | | | | | | | | | | | | | | |
(for a share outstanding throughout the year) | | | | | | | | | | | | | | | | | | | | |
Net asset value, beginning of year | | $ | 12.44 | | | $ | 12.88 | | | $ | 12.20 | | | $ | 10.54 | | | $ | 12.84 | |
| | | | |
Income from investment operationsb: | | | | | | | | | | | | | | | | | | | | |
Net investment incomec | | | 0.60 | | | | 0.64 | | | | 0.67 | | | | 0.66 | | | | 0.53 | |
Net realized and unrealized gains (losses) | | | 0.91 | | | | (0.31 | ) | | | 0.60 | | | | 1.94 | | | | (1.93 | ) |
| | | | |
Total from investment operations | | | 1.51 | | | | 0.33 | | | | 1.27 | | | | 2.60 | | | | (1.40 | ) |
| | | | |
Less distributions from: | | | | | | | | | | | | | | | | | | | | |
Net investment income and net of foreign currency gains | | | (0.89 | ) | | | (0.77 | ) | | | (0.59 | ) | | | (0.94 | ) | | | (0.87 | ) |
Net realized gains | | | (0.02 | ) | | | — | | | | — | | | | — | | | | (0.03 | ) |
| | | | |
Total distributions | | | (0.91 | ) | | | (0.77 | ) | | | (0.59 | ) | | | (0.94 | ) | | | (0.90 | ) |
| | | | |
Net asset value, end of year | | $ | 13.04 | | | $ | 12.44 | | | $ | 12.88 | | | $ | 12.20 | | | $ | 10.54 | |
| | | | |
| | | | | |
Total returnd | | | 12.67% | | | | 2.46% | | | | 10.88% | | | | 25.52% | | | | (11.69)% | |
Ratios to average net assetse | | | | | | | | | | | | | | | | | | | | |
Expenses | | | 0.93% | | | | 0.95% | f | | | 0.94% | f | | | 0.93% | f | | | 0.96% | f |
Net investment income | | | 4.69% | | | | 5.01% | | | | 5.36% | | | | 5.78% | | | | 5.48% | |
| | | | | |
Supplemental data | | | | | | | | | | | | | | | | | | | | |
Net assets, end of year (000’s) | | $ | 196,479 | | | $ | 188,786 | | | $ | 188,178 | | | $ | 162,074 | | | $ | 59,766 | |
Portfolio turnover rate | | | 49.98% | | | | 55.65% | | | | 56.46% | | | | 56.19% | | | | 47.68% | |
Portfolio turnover rate excluding mortgage dollar rollsg | | | 48.75% | | | | 55.65% | | | | 56.46% | | | | 56.19% | | | | 47.68% | |
aFor the period February 29, 2008 (effective date) to December 31, 2008.
bThe amount shown for a share outstanding throughout the period may not correlate with the Statement of Operations for the period due to the timing of sales and repurchases of the Fund shares in relation to income earned and/or fluctuating market value of the investments of the Fund.
cBased on average daily shares outstanding.
dTotal return does not include fees, charges or expenses imposed by the variable annuity and life insurance contracts for which the Franklin Templeton Variable Insurance Products Trust serves as an underlying investment vehicle. Total return is not annualized for periods less than one year.
eRatios are annualized for periods less than one year.
fBenefit of expense reduction rounds to less than 0.01%.
gSee Note 1(h) regarding mortgage dollar rolls.
The accompanying notes are an integral part of these financial statements.
FSI-14
Franklin Templeton Variable Insurance Products Trust
Statement of Investments, December 31, 2012
| | | | | | | | | | |
| Franklin Strategic Income Securities Fund | | Country | | Shares | | | Value | |
Common Stocks and Other Equity Interests 0.8% | | | | | | | | | | |
Consumer Durables & Apparel 0.0% | | | | | | | | | | |
a,b Comfort Co. Inc., Escrow Account | | United States | | | 13,427 | | | $ | — | |
| | | | | | | | | | |
Consumer Services 0.1% | | | | | | | | | | |
a,c,d Turtle Bay Resort | | United States | | | 1,901,449 | | | | 1,730,319 | |
| | | | | | | | | | |
Materials 0.1% | | | | | | | | | | |
a,b NewPage Corp., Litigation Trust | | United States | | | 2,500,000 | | | | — | |
a,e NewPage Holdings Inc. | | United States | | | 10,000 | | | | 958,000 | |
| | | | | | | | | | |
| | | | | | | | | 958,000 | |
| | | | | | | | | | |
Media 0.6% | | | | | | | | | | |
a MGM Holdings Inc., A | | United States | | | 207,949 | | | | 7,936,727 | |
| | | | | | | | | | |
Total Common Stocks (Cost $10,612,261) | | | | | | | | | 10,625,046 | |
| | | | | | | | | | |
Preferred Stocks (Cost $865,000) 0.1% | | | | | | | | | | |
Diversified Financials 0.1% | | | | | | | | | | |
GMAC Capital Trust I, 8.125%, pfd. | | United States | | | 34,600 | | | | 922,090 | |
| | | | | | | | | | |
| | | |
| | | | | Principal
Amount* | | | | |
Corporate Bonds 34.1% | | | | | | | | | | |
Automobiles & Components 0.4% | | | | | | | | | | |
Exide Technologies, senior secured note, 8.625%, 2/01/18 | | United States | | | 1,400,000 | | | | 1,193,500 | |
Ford Motor Credit Co. LLC, senior note, | | | | | | | | | | |
6.625%, 8/15/17 | | United States | | | 1,000,000 | | | | 1,169,271 | |
5.00%, 5/15/18 | | United States | | | 1,000,000 | | | | 1,105,518 | |
8.125%, 1/15/20 | | United States | | | 1,200,000 | | | | 1,540,947 | |
5.75%, 2/01/21 | | United States | | | 600,000 | | | | 691,660 | |
| | | | | | | | | | |
| | | | | | | | | 5,700,896 | |
| | | | | | | | | | |
Banks 1.4% | | | | | | | | | | |
f Banco do Brasil SA, sub. note, 144A, 5.875%, 1/26/22 | | Brazil | | | 3,500,000 | | | | 3,867,903 | |
CIT Group Inc., senior note, | | | | | | | | | | |
5.375%, 5/15/20 | | United States | | | 1,600,000 | | | | 1,756,000 | |
5.00%, 8/15/22 | | United States | | | 1,300,000 | | | | 1,391,291 | |
f 144A, 6.625%, 4/01/18 | | United States | | | 500,000 | | | | 567,500 | |
HSBC USA Inc., sub. note, 5.00%, 9/27/20 | | United States | | | 3,500,000 | | | | 3,824,303 | |
Regions Bank, sub. note, 7.50%, 5/15/18 | | United States | | | 1,000,000 | | | | 1,208,750 | |
Regions Financial Corp., senior note, | | | | | | | | | | |
7.75%, 11/10/14 | | United States | | | 2,500,000 | | | | 2,778,250 | |
5.75%, 6/15/15 | | United States | | | 300,000 | | | | 325,125 | |
Royal Bank of Scotland Group PLC, sub. note, 6.125%, 12/15/22 | | United Kingdom | | | 400,000 | | | | 422,750 | |
The Royal Bank of Scotland PLC, sub. note, 6.934%, 4/09/18 | | United Kingdom | | | 2,300,000 | EUR | | | 3,429,640 | |
| | | | | | | | | | |
| | | | | | | | | 19,571,512 | |
| | | | | | | | | | |
Capital Goods 0.8% | | | | | | | | | | |
f Abengoa Finance SAU, senior note, 144A, 8.875%, 11/01/17 | | Spain | | | 3,500,000 | | | | 3,307,500 | |
f KM Germany Holdings GmbH, secured note, 144A, 8.75%, 12/15/20 | | Germany | | | 1,200,000 | EUR | | | 1,659,727 | |
Meritor Inc., senior note, 10.625%, 3/15/18 | | United States | | | 3,000,000 | | | | 3,142,500 | |
Navistar International Corp., senior note, 8.25%, 11/01/21 | | United States | | | 1,600,000 | | | | 1,552,000 | |
Terex Corp., senior note, 6.00%, 5/15/21 | | United States | | | 1,200,000 | | | | 1,269,000 | |
| | | | | | | | | | |
| | | | | | | | | 10,930,727 | |
| | | | | | | | | | |
Commercial & Professional Services 0.5% | | | | | | | | | | |
f Algeco Scotsman Global Finance PLC, secured note, 144A, 8.50%, 10/15/18 | | United Kingdom | | | 2,500,000 | | | | 2,595,313 | |
United Rentals North America Inc., senior sub. note, 8.375%, 9/15/20 | | United States | | | 3,500,000 | | | | 3,893,750 | |
| | | | | | | | | | |
| | | | | | | | | 6,489,063 | |
| | | | | | | | | | |
FSI-15
Franklin Templeton Variable Insurance Products Trust
Statement of Investments, December 31, 2012 (continued)
| | | | | | | | | | |
| Franklin Strategic Income Securities Fund | | Country | | Principal
Amount* | | | Value | |
Corporate Bonds (continued) | | | | | | | | | | |
Consumer Durables & Apparel 0.7% | | | | | | | | | | |
Jarden Corp., senior sub. note, 7.50%, 5/01/17 | | United States | | | 2,500,000 | | | $ | 2,828,125 | |
M/I Homes Inc., senior note, 8.625%, 11/15/18 | | United States | | | 2,400,000 | | | | 2,652,000 | |
Shea Homes LP/Funding Corp., senior secured note, 8.625%, 5/15/19 | | United States | | | 2,000,000 | | | | 2,220,000 | |
Visant Corp., senior note, 10.00%, 10/01/17 | | United States | | | 2,800,000 | | | | 2,527,000 | |
| | | | | | | | | | |
| | | | | | | | | 10,227,125 | |
| | | | | | | | | | |
Consumer Services 1.2% | | | | | | | | | | |
ClubCorp Club Operations Inc., senior note, 10.00%, 12/01/18 | | United States | | | 2,900,000 | | | | 3,240,750 | |
f,g Fontainebleau Las Vegas, 144A, 11.00%, 6/15/15 | | United States | | | 2,500,000 | | | | 1,575 | |
Harrah’s Operating Co. Inc., senior secured note, 11.25%, 6/01/17 | | United States | | | 4,500,000 | | | | 4,843,125 | |
MGM Resorts International, senior note, | | | | | | | | | | |
6.625%, 7/15/15 | | United States | | | 3,500,000 | | | | 3,771,250 | |
6.625%, 12/15/21 | | United States | | | 400,000 | | | | 400,500 | |
f 144A, 6.75%, 10/01/20 | | United States | | | 200,000 | | | | 204,750 | |
Pinnacle Entertainment Inc., senior note, 8.625%, 8/01/17 | | United States | | | 1,500,000 | | | | 1,618,125 | |
f Shingle Springs Tribal Gaming Authority, senior note, 144A, 9.375%, 6/15/15 | | United States | | | 2,000,000 | | | | 1,970,000 | |
| | | | | | | | | | |
| | | | | | | | | 16,050,075 | |
| | | | | | | | | | |
Diversified Financials 3.4% | | | | | | | | | | |
Ally Financial Inc., senior note, 7.50%, 9/15/20 | | United States | | | 2,500,000 | | | | 3,028,125 | |
Bank of America Corp., | | | | | | | | | | |
h pfd., sub. bond, M, 8.125% to 5/15/18, FRN thereafter, Perpetual | | United States | | | 4,000,000 | | | | 4,434,040 | |
senior note, 5.65%, 5/01/18 | | United States | | | 1,500,000 | | | | 1,746,552 | |
Capital One Capital VI, pfd., junior sub. bond, 8.875%, 5/15/40 | | United States | | | 2,000,000 | | | | 2,000,000 | |
Citigroup Inc., senior note, | | | | | | | | | | |
6.125%, 11/21/17 | | United States | | | 1,500,000 | | | | 1,786,545 | |
5.375%, 8/09/20 | | United States | | | 1,000,000 | | | | 1,179,274 | |
E*TRADE Financial Corp., senior note, 6.375%, 11/15/19 | | United States | | | 1,400,000 | | | | 1,442,000 | |
General Electric Capital Corp., | | | | | | | | | | |
senior note, A, 8.50%, 4/06/18 | | United States | | | 55,000,000 | MXN | | | 4,622,150 | |
sub. note, 5.30%, 2/11/21 | | United States | | | 1,000,000 | | | | 1,161,639 | |
GMAC Inc., sub. note, 8.00%, 12/31/18 | | United States | | | 900,000 | | | | 1,057,500 | |
International Lease Finance Corp., | | | | | | | | | | |
senior note, 8.25%, 12/15/20 | | United States | | | 1,000,000 | | | | 1,195,000 | |
f senior secured note, 144A, 6.75%, 9/01/16 | | United States | | | 2,000,000 | | | | 2,255,000 | |
JPMorgan Chase & Co., | | | | | | | | | | |
6.00%, 1/15/18 | | United States | | | 1,500,000 | | | | 1,797,137 | |
senior note, 4.25%, 10/15/20 | | United States | | | 2,500,000 | | | | 2,782,362 | |
senior note, 3.25%, 9/23/22 | | United States | | | 2,000,000 | | | | 2,061,448 | |
f KKR Group Finance Co., senior note, 144A, 6.375%, 9/29/20 | | United States | | | 3,000,000 | | | | 3,484,065 | |
Merrill Lynch & Co. Inc., senior note, 6.40%, 8/28/17 | | United States | | | 2,000,000 | | | | 2,350,348 | |
Morgan Stanley, senior note, | | | | | | | | | | |
6.00%, 4/28/15 | | United States | | | 2,000,000 | | | | 2,179,464 | |
5.50%, 7/24/20 | | United States | | | 1,500,000 | | | | 1,688,678 | |
5.50%, 7/28/21 | | United States | | | 800,000 | | | | 908,993 | |
f Neuberger Berman Group LLC/Finance Corp., senior note, 144A, | | | | | | | | | | |
5.625%, 3/15/20 | | United States | | | 600,000 | | | | 631,500 | |
5.875%, 3/15/22 | | United States | | | 1,400,000 | | | | 1,491,000 | |
f Nuveen Investments Inc., senior note, 144A, 9.50%, 10/15/20 | | United States | | | 1,800,000 | | | | 1,800,000 | |
| | | | | | | | | | |
| | | | | | | | | 47,082,820 | |
| | | | | | | | | | |
Energy 6.8% | | | | | | | | | | |
Apache Corp., senior bond, 2.625%, 1/15/23 | | United States | | | 5,000,000 | | | | 4,995,435 | |
FSI-16
Franklin Templeton Variable Insurance Products Trust
Statement of Investments, December 31, 2012 (continued)
| | | | | | | | | | |
| Franklin Strategic Income Securities Fund | | Country | | Principal
Amount* | | | Value | |
Corporate Bonds (continued) | | | | | | | | | | |
Energy (continued) | | | | | | | | | | |
Atlas Pipeline Partners LP, senior note, 8.75%, 6/15/18 | | United States | | | 2,000,000 | | | $ | 2,140,000 | |
Chaparral Energy Inc., senior note, | | | | | | | | | | |
9.875%, 10/01/20 | | United States | | | 1,500,000 | | | | 1,713,750 | |
8.25%, 9/01/21 | | United States | | | 1,000,000 | | | | 1,090,000 | |
7.625%, 11/15/22 | | United States | | | 300,000 | | | | 316,500 | |
CHC Helicopter SA, senior secured note, first lien, 9.25%, 10/15/20 | | Canada | | | 3,500,000 | | | | 3,701,250 | |
Chesapeake Energy Corp., senior note, | | | | | | | | | | |
6.625%, 8/15/20 | | United States | | | 4,000,000 | | | | 4,310,000 | |
6.125%, 2/15/21 | | United States | | | 1,500,000 | | | | 1,563,750 | |
Compagnie Generale de Geophysique-Veritas, senior note, | | | | | | | | | | |
7.75%, 5/15/17 | | France | | | 1,500,000 | | | | 1,567,500 | |
6.50%, 6/01/21 | | France | | | 2,000,000 | | | | 2,150,000 | |
CONSOL Energy Inc., senior note, | | | | | | | | | | |
8.00%, 4/01/17 | | United States | | | 1,500,000 | | | | 1,631,250 | |
8.25%, 4/01/20 | | United States | | | 1,500,000 | | | | 1,631,250 | |
6.375%, 3/01/21 | | United States | | | 200,000 | | | | 206,000 | |
Crosstex Energy LP/Crosstex Energy Finance Corp., senior note, 8.875%, 2/15/18 | | United States | | | 3,000,000 | | | | 3,255,000 | |
El Paso Corp., senior bond, 6.50%, 9/15/20 | | United States | | | 1,500,000 | | | | 1,699,743 | |
Energy Transfer Equity LP, senior note, 7.50%, 10/15/20 | | United States | | | 3,500,000 | | | | 4,060,000 | |
Energy Transfer Partners LP, senior note, 5.20%, 2/01/22 | | United States | | | 900,000 | | | | 1,027,453 | |
Energy XXI Gulf Coast Inc., senior note, 9.25%, 12/15/17 | | United States | | | 2,500,000 | | | | 2,868,750 | |
Enterprise Products Operating LLC, junior sub. note, 7.034% to 1/15/18, FRN thereafter, 1/15/68 | | United States | | | 2,000,000 | | | | 2,292,462 | |
f Expro Finance Luxembourg, senior secured note, 144A, 8.50%, 12/15/16 | | United Kingdom | | | 3,113,000 | | | | 3,268,650 | |
f,i Gaz Capital SA, (OJSC Gazprom), loan participation, | | | | | | | | | | |
senior bond, 144A, 6.51%, 3/07/22 | | Russia | | | 500,000 | | | | 598,750 | |
senior note, 144A, 5.092%, 11/29/15 | | Russia | | | 3,000,000 | | | | 3,222,720 | |
f Halcon Resources Corp., senior note, 144A, 8.875%, 5/15/21 | | United States | | | 1,000,000 | | | | 1,065,000 | |
f Kinder Morgan Finance Co. LLC, senior secured note, 144A, 6.00%, 1/15/18 | | United States | | | 3,500,000 | | | | 3,863,153 | |
Linn Energy LLC/Finance Corp., senior note, | | | | | | | | | | |
8.625%, 4/15/20 | | United States | | | 3,000,000 | | | | 3,285,000 | |
7.75%, 2/01/21 | | United States | | | 1,000,000 | | | | 1,070,000 | |
Martin Midstream Partners LP, senior note, 8.875%, 4/01/18 | | United States | | | 1,754,000 | | | | 1,876,780 | |
Offshore Group Investment Ltd., | | | | | | | | | | |
f first lien, 144A, 7.50%, 11/01/19 | | United States | | | 2,200,000 | | | | 2,233,000 | |
senior secured note, 11.50%, 8/01/15 | | United States | | | 1,352,000 | | | | 1,477,060 | |
f PBF Holding Co. LLC, senior secured note, 144A, 8.25%, 2/15/20 | | United States | | | 2,100,000 | | | | 2,273,250 | |
Peabody Energy Corp., senior note, | | | | | | | | | | |
6.00%, 11/15/18 | | United States | | | 700,000 | | | | 747,250 | |
6.50%, 9/15/20 | | United States | | | 2,500,000 | | | | 2,693,750 | |
6.25%, 11/15/21 | | United States | | | 1,000,000 | | | | 1,067,500 | |
f Penn Virginia Resource Partners LP/Finance Corp. II, senior note, 144A, | | | | | | | | | | |
8.375%, 6/01/20 | | United States | | | 1,600,000 | | | | 1,732,000 | |
Plains Exploration & Production Co., senior note, | | | | | | | | | | |
7.625%, 6/01/18 | | United States | | | 3,000,000 | | | | 3,172,500 | |
6.125%, 6/15/19 | | United States | | | 600,000 | | | | 657,000 | |
6.875%, 2/15/23 | | United States | | | 1,000,000 | | | | 1,147,500 | |
QR Energy LP/QRE Finance, senior note, 9.25%, 8/01/20 | | United States | | | 1,800,000 | | | | 1,899,000 | |
Quicksilver Resources Inc., senior note, | | | | | | | | | | |
8.25%, 8/01/15 | | United States | | | 3,000,000 | | | | 2,790,000 | |
9.125%, 8/15/19 | | United States | | | 500,000 | | | | 447,500 | |
f Samson Investment Co., senior note, 144A, 9.75%, 2/15/20 | | United States | | | 3,500,000 | | | | 3,718,750 | |
FSI-17
Franklin Templeton Variable Insurance Products Trust
Statement of Investments, December 31, 2012 (continued)
| | | | | | | | | | |
| Franklin Strategic Income Securities Fund | | Country | | Principal
Amount* | | | Value | |
Corporate Bonds (continued) | | | | | | | | | | |
Energy (continued) | | | | | | | | | | |
SandRidge Energy Inc., senior note, | | | | | | | | | | |
8.75%, 1/15/20 | | United States | | | 1,000,000 | | | $ | 1,100,000 | |
f 144A, 8.00%, 6/01/18 | | United States | | | 3,000,000 | | | | 3,195,000 | |
W&T Offshore Inc., senior note, | | | | | | | | | | |
8.50%, 6/15/19 | | United States | | | 2,000,000 | | | | 2,160,000 | |
f 144A, 8.50%, 6/15/19 | | United States | | | 800,000 | | | | 864,000 | |
| | | | | | | | | | |
| | | | | | | | | 93,845,206 | |
| | | | | | | | | | |
Food & Staples Retailing 0.8% | | | | | | | | | | |
f Cencosud SA, senior note, 144A, 4.875%, 1/20/23 | | Chile | | | 3,500,000 | | | | 3,592,592 | |
Rite Aid Corp., senior secured note, | | | | | | | | | | |
9.75%, 6/12/16 | | United States | | | 1,700,000 | | | | 1,848,750 | |
8.00%, 8/15/20 | | United States | | | 1,300,000 | | | | 1,491,750 | |
Safeway Inc., senior bond, 3.95%, 8/15/20 | | United States | | | 3,500,000 | | | | 3,503,304 | |
| | | | | | | | | | |
| | | | | | | | | 10,436,396 | |
| | | | | | | | | | |
Food, Beverage & Tobacco 1.1% | | | | | | | | | | |
f Boparan Finance PLC, senior note, 144A, 9.75%, 4/30/18 | | United Kingdom | | | 2,000,000 | EUR | | | 2,995,492 | |
f CEDC Finance Corp. International Inc., senior secured note, 144A, 9.125%, 12/01/16 | | Russia | | | 1,800,000 | | | | 1,119,375 | |
Del Monte Corp., senior note, 7.625%, 2/15/19 | | United States | | | 4,000,000 | | | | 4,190,000 | |
JBS USA LLC/Finance Inc., senior note, | | | | | | | | | | |
11.625%, 5/01/14 | | United States | | | 1,500,000 | | | | 1,680,000 | |
f 144A, 8.25%, 2/01/20 | | United States | | | 1,700,000 | | | | 1,810,500 | |
f Kraft Foods Group Inc., senior bond, 144A, 3.50%, 6/06/22 | | United States | | | 3,000,000 | | | | 3,204,939 | |
Pinnacle Foods Finance LLC/Pinnacle Foods Finance Corp., senior note, 9.25%, 4/01/15 | | United States | | | 496,000 | | | | 505,920 | |
| | | | | | | | | | |
| | | | | | | | | 15,506,226 | |
| | | | | | | | | | |
Health Care Equipment & Services 1.3% | | | | | | | | | | |
CHS/Community Health Systems Inc., | | | | | | | | | | |
senior note, 8.00%, 11/15/19 | | United States | | | 2,100,000 | | | | 2,283,750 | |
senior note, 7.125%, 7/15/20 | | United States | | | 700,000 | | | | 748,125 | |
senior secured note, 5.125%, 8/15/18 | | United States | | | 1,100,000 | | | | 1,149,500 | |
DaVita HealthCare Partners Inc., senior note, 5.75%, 8/15/22 | | United States | | | 1,400,000 | | | | 1,482,250 | |
Emergency Medical Services Corp., senior note, 8.125%, 6/01/19 | | United States | | | 2,300,000 | | | | 2,537,188 | |
HCA Inc., | | | | | | | | | | |
senior note, 6.50%, 2/15/16 | | United States | | | 800,000 | | | | 874,000 | |
senior note, 7.50%, 2/15/22 | | United States | | | 2,000,000 | | | | 2,300,000 | |
senior note, 5.875%, 5/01/23 | | United States | | | 500,000 | | | | 518,750 | |
senior secured bond, 7.25%, 9/15/20 | | United States | | | 300,000 | | | | 333,750 | |
senior secured note, 5.875%, 3/15/22 | | United States | | | 1,900,000 | | | | 2,075,750 | |
f Hologic Inc., senior note, 144A, 6.25%, 8/01/20 | | United States | | | 900,000 | | | | 974,250 | |
Laboratory Corp. of America Holdings, senior bond, 3.75%, 8/23/22 | | United States | | | 400,000 | | | | 424,557 | |
Vanguard Health Holding Co. II LLC/Inc., senior note, 8.00%, 2/01/18 | | United States | | | 2,000,000 | | | | 2,080,000 | |
Vanguard Health Systems Inc., senior note, zero cpn., 2/01/16 | | United States | | | 30,000 | | | | 22,800 | |
| | | | | | | | | | |
| | | | | | | | | 17,804,670 | |
| | | | | | | | | | |
Insurance 0.5% | | | | | | | | | | |
MetLife Inc., junior sub. note, 6.40% to 12/15/36, FRN thereafter, 12/15/66 | | United States | | | 3,500,000 | | | | 3,750,876 | |
f Mitsui Sumitomo Insurance Co. Ltd., junior sub. note, 144A, 7.00% to 3/15/22, FRN | | | | | | | | | | |
thereafter, 3/15/72 | | Japan | | | 3,000,000 | | | | 3,447,780 | |
| | | | | | | | | | |
| | | | | | | | | 7,198,656 | |
| | | | | | | | | | |
FSI-18
Franklin Templeton Variable Insurance Products Trust
Statement of Investments, December 31, 2012 (continued)
| | | | | | | | | | |
| Franklin Strategic Income Securities Fund | | Country | | Principal
Amount* | | | Value | |
Corporate Bonds (continued) | | | | | | | | | | |
Materials 3.7% | | | | | | | | | | |
ArcelorMittal, senior note, 6.00%, 3/01/21 | | Luxembourg | | | 4,000,000 | | | $ | 3,991,332 | |
f Ardagh Packaging Finance PLC, senior note, 144A, 9.125%, 10/15/20 | | Luxembourg | | | 900,000 | | | | 985,500 | |
f Ardagh Packaging Finance PLC/MP Holdings USA Inc., 144A, 7.375%, 10/15/17 | | Luxembourg | | | 600,000 | | | | 655,875 | |
f Cemex SAB de CV, senior secured note, 144A, 9.00%, 1/11/18 | | Mexico | | | 3,500,000 | | | | 3,822,297 | |
Euramax International Inc., senior secured note, 9.50%, 4/01/16 | | United States | | | 2,000,000 | | | | 1,875,000 | |
f FMG Resources August 2006 Pty. Ltd., senior note, 144A, | | | | | | | | | | |
7.00%, 11/01/15 | | Australia | | | 700,000 | | | | 735,942 | |
6.00%, 4/01/17 | | Australia | | | 500,000 | | | | 512,500 | |
6.875%, 2/01/18 | | Australia | | | 3,000,000 | | | | 3,108,750 | |
f Ineos Finance PLC, senior secured note, 144A, | | | | | | | | | | |
9.00%, 5/15/15 | | United Kingdom | | | 300,000 | | | | 320,250 | |
9.25%, 5/15/15 | | United Kingdom | | | 100,000 | EUR | | | 142,338 | |
8.375%, 2/15/19 | | United Kingdom | | | 200,000 | | | | 216,000 | |
7.50%, 5/01/20 | | United Kingdom | | | 300,000 | | | | 315,750 | |
f Ineos Group Holdings Ltd., senior note, 144A, 7.875%, 2/15/16 | | United Kingdom | | | 1,500,000 | EUR | | | 1,974,451 | |
senior secured note, 144A, 8.50%, 2/15/16 | | United Kingdom | | | 1,500,000 | | | | 1,500,000 | |
f Inmet Mining Corp., senior note, 144A, 8.75%, 6/01/20 | | Canada | | | 3,500,000 | | | | 3,841,250 | |
f Kerling PLC, senior secured note, 144A, 10.625%, 1/28/17 | | United Kingdom | | | 3,000,000 | EUR | | | 3,846,885 | |
f Kinove German Bondco GmbH, senior secured bond, 144A, 10.00%, 6/15/18 | | Germany | | | 2,250,000 | EUR | | | 3,286,423 | |
f MacDermid Inc., senior sub. note, 144A, 9.50%, 4/15/17 | | United States | | | 2,500,000 | | | | 2,615,625 | |
Novelis Inc., senior note, | | | | | | | | | | |
8.375%, 12/15/17 | | Canada | | | 1,500,000 | | | | 1,661,250 | |
8.75%, 12/15/20 | | Canada | | | 1,600,000 | | | | 1,792,000 | |
Reynolds Group Issuer Inc./LLC/SA, | | | | | | | | | | |
f secured note, 144A, 5.75%, 10/15/20 | | United States | | | 900,000 | | | | 931,500 | |
senior note, 8.50%, 5/15/18 | | United States | | | 3,500,000 | | | | 3,605,000 | |
senior note, 8.25%, 2/15/21 | | United States | | | 500,000 | | | | 510,000 | |
senior secured note, 7.125%, 4/15/19 | | United States | | | 1,000,000 | | | | 1,080,000 | |
f Sealed Air Corp., senior note, 144A, | | | | | | | | | | |
8.125%, 9/15/19 | | United States | | | 1,000,000 | | | | 1,130,000 | |
6.50%, 12/01/20 | | United States | | | 500,000 | | | | 542,500 | |
8.375%, 9/15/21 | | United States | | | 800,000 | | | | 918,000 | |
f Xstrata Finance Canada Ltd., senior note, 144A, 4.95%, 11/15/21 | | Canada | | | 4,000,000 | | | | 4,299,668 | |
| | | | | | | | | | |
| | | | | | | | | 50,216,086 | |
| | | | | | | | | | |
Media 3.3% | | | | | | | | | | |
AMC Networks Inc., senior note, 7.75%, 7/15/21 | | United States | | | 1,000,000 | | | | 1,150,000 | |
Cablevision Systems Corp., senior note, 8.625%, 9/15/17 | | United States | | | 500,000 | | | | 585,625 | |
f Central European Media Enterprises Ltd., secured note, 144A, 11.625%, 9/15/16 | | Czech Republic | | | 2,000,000 | EUR | | | 2,784,356 | |
f CET 21 spol sro, senior secured note, 144A, 9.00%, 11/01/17 | | Czech Republic | | | 300,000 | EUR | | | 432,746 | |
Clear Channel Communications Inc., | | | | | | | | | | |
f 144A, 9.00%, 12/15/19 | | United States | | | 975,000 | | | | 897,000 | |
senior note, 9.00%, 3/01/21 | | United States | | | 4,700,000 | | | | 4,218,250 | |
Clear Channel Worldwide Holdings Inc., | | | | | | | | | | |
f senior note, 144A, 6.50%, 11/15/22 | | United States | | | 1,000,000 | | | | 1,042,500 | |
senior sub. note, 7.625%, 3/15/20 | | United States | | | 200,000 | | | | 200,500 | |
senior sub. note, 7.625%, 3/15/20 | | United States | | | 1,300,000 | | | | 1,316,250 | |
CSC Holdings Inc., senior deb., 7.625%, 7/15/18 | | United States | | | 1,500,000 | | | | 1,740,000 | |
f CSC Holdings LLC, senior note, 144A, 6.75%, 11/15/21 | | United States | | | 2,000,000 | | | | 2,227,500 | |
DISH DBS Corp., senior note, | | | | | | | | | | |
7.125%, 2/01/16 | | United States | | | 4,000,000 | | | | 4,500,000 | |
6.75%, 6/01/21 | | United States | | | 500,000 | | | | 572,500 | |
5.875%, 7/15/22 | | United States | | | 500,000 | | | | 540,000 | |
FSI-19
Franklin Templeton Variable Insurance Products Trust
Statement of Investments, December 31, 2012 (continued)
| | | | | | | | | | | | |
| Franklin Strategic Income Securities Fund | | Country | | | Principal
Amount* | | | Value | |
Corporate Bonds (continued) | | | | | | | | | | | | |
Media (continued) | | | | | | | | | | | | |
Media General Inc., senior secured note, 11.75%, 2/15/17 | | | United States | | | | 1,400,000 | | | $ | 1,624,000 | |
f Nara Cable Funding Ltd., senior note, 144A, 8.875%, 12/01/18 | | | Spain | | | | 800,000 | | | | 818,000 | |
j Radio One Inc., senior sub. note, PIK, 12.25%, 5/24/16 | | | United States | | | | 2,280,619 | | | | 2,026,538 | |
f Seat Pagine Gialle SpA, senior secured note, 144A, 10.50%, 1/31/17 | | | Italy | | | | 1,000,000 | EUR | | | 802,482 | |
Time Warner Inc., | | | | | | | | | | | | |
7.625%, 4/15/31 | | | United States | | | | 2,500,000 | | | | 3,444,005 | |
senior bond, 3.40%, 6/15/22 | | | United States | | | | 500,000 | | | | 522,003 | |
f Unitymedia Hessen/NRW, secured bond, 144A, 5.75%, 1/15/23 | | | Germany | | | | 800,000 | EUR | | | 1,103,186 | |
senior secured note, 144A, 9.50%, 3/15/21 | | | Germany | | | | 1,000,000 | EUR | | | 1,534,860 | |
f Univision Communications Inc., secured bond, 144A, 6.75%, 9/15/22 | | | United States | | | | 500,000 | | | | 518,750 | |
senior secured note, 144A, 7.875%, 11/01/20 | | | United States | | | | 2,500,000 | | | | 2,718,750 | |
f UPC Holding BV, senior note, 144A, 6.375%, 9/15/22 | | | Netherlands | | | | 500,000 | EUR | | | 675,883 | |
f UPCB Finance II Ltd., senior secured note, 144A, 6.375%, 7/01/20 | | | Netherlands | | | | 2,000,000 | EUR | | | 2,820,302 | |
f UPCB Finance VI Ltd., senior secured note, 144A, 6.875%, 1/15/22 | | | Netherlands | | | | 500,000 | | | | 541,562 | |
f Ziggo Bond Co., senior bond, 144A, 8.00%, 5/15/18 | | | Netherlands | | | | 2,500,000 | EUR | | | 3,641,271 | |
| | | | | | | | | | | | |
| | | | | | | | | | | 44,998,819 | |
| | | | | | | | | | | | |
Pharmaceuticals, Biotechnology & Life Sciences 1.5% | | | | | | | | | | | | |
f AbbVie Inc., senior note, 144A, 2.90%, 11/06/22 | | | United States | | | | 1,500,000 | | | | 1,529,004 | |
f Capsugel FinanceCo SCA, senior note, 144A, 9.875%, 8/01/19 | | | United States | | | | 2,000,000 | EUR | | | 2,983,945 | |
Endo Health Solutions Inc., senior note, 7.00%, 7/15/19 | | | United States | | | | 1,500,000 | | | | 1,606,875 | |
Gilead Sciences Inc., senior note, | | | | | | | | | | | | |
4.50%, 4/01/21 | | | United States | | | | 2,000,000 | | | | 2,287,464 | |
4.40%, 12/01/21 | | | United States | | | | 1,000,000 | | | | 1,140,879 | |
Grifols Inc., senior note, 8.25%, 2/01/18 | | | Spain | | | | 3,000,000 | | | | 3,318,750 | |
f inVentiv Health Inc., senior note, 144A, | | | | | | | | | | | | |
9.00%, 1/15/18 | | | United States | | | | 600,000 | | | | 607,500 | |
10.00%, 8/15/18 | | | United States | | | | 2,300,000 | | | | 2,006,750 | |
f,j Jaguar Holding Co. I, senior note, 144A, PIK, 9.375%, 10/15/17 | | | United States | | | | 1,900,000 | | | | 2,004,500 | |
f VPI Escrow Corp., senior note, 144A, 6.375%, 10/15/20 | | | United States | | | | 2,900,000 | | | | 3,124,750 | |
| | | | | | | | | | | | |
| | | | | | | | | | | 20,610,417 | |
| | | | | | | | | | | | |
Real Estate 0.0%† | | | | | | | | | | | | |
Forest City Enterprises Inc., senior note, 7.625%, 6/01/15 | | | United States | | | | 595,000 | | | | 595,744 | |
| | | | | | | | | | | | |
Retailing 0.9% | | | | | | | | | | | | |
f Academy Ltd./Finance Corp., senior note, 144A, 9.25%, 8/01/19 | | | United States | | | | 2,000,000 | | | | 2,230,000 | |
f,k Edcon Pty. Ltd., senior secured note, 144A, FRN, 3.433%, 6/15/14 | | | South Africa | | | | 3,000,000 | EUR | | | 3,800,468 | |
f Matalan Finance Ltd., senior secured note, 144A, 8.875%, 4/29/16 | | | United Kingdom | | | | 1,500,000 | GBP | | | 2,515,049 | |
Michaels Stores Inc., senior note, 7.75%, 11/01/18 | | | United States | | | | 3,000,000 | | | | 3,307,500 | |
| | | | | | | | | | | | |
| | | | | | | | | | | 11,853,017 | |
| | | | | | | | | | | | |
Semiconductors & Semiconductor Equipment 0.3% | | | | | | | | | | | | |
Freescale Semiconductor Inc., | | | | | | | | | | | | |
senior note, 8.875%, 12/15/14 | | | United States | | | | 182,000 | | | | 184,048 | |
senior note, 8.05%, 2/01/20 | | | United States | | | | 1,600,000 | | | | 1,600,000 | |
senior note, 10.75%, 8/01/20 | | | United States | | | | 1,382,000 | | | | 1,489,105 | |
f senior secured note, 144A, 9.25%, 4/15/18 | | | United States | | | | 500,000 | | | | 548,750 | |
| | | | | | | | | | | | |
| | | | | | | | | | | 3,821,903 | |
| | | | | | | | | | | | |
Software & Services 0.9% | | | | | | | | | | | | |
f Ceridian Corp., secured note, 144A, 8.875%, 7/15/19 | | | United States | | | | 1,000,000 | | | | 1,090,000 | |
First Data Corp., | | | | | | | | | | | | |
senior bond, 12.625%, 1/15/21 | | | United States | | | | 300,000 | | | | 317,250 | |
f senior secured bond, 144A, 8.25%, 1/15/21 | | | United States | | | | 4,500,000 | | | | 4,522,500 | |
FSI-20
Franklin Templeton Variable Insurance Products Trust
Statement of Investments, December 31, 2012 (continued)
| | | | | | | | | | |
| Franklin Strategic Income Securities Fund | | Country | | Principal
Amount* | | | Value | |
Corporate Bonds (continued) | | | | | | | | | | |
Software & Services (continued) | | | | | | | | | | |
Sitel LLC/Finance Corp., senior note, 11.50%, 4/01/18 | | United States | | | 2,500,000 | | | $ | 1,775,000 | |
Sterling International Inc., senior note, 11.00%, 10/01/19 | | United States | | | 1,100,000 | | | | 1,127,500 | |
West Corp., senior note, 7.875%, 1/15/19 | | United States | | | 3,300,000 | | | | 3,432,000 | |
| | | | | | | | | | |
| | | | | | | | | 12,264,250 | |
| | | | | | | | | | |
Technology Hardware & Equipment 0.5% | | | | | | | | | | |
CDW LLC/Finance Corp., senior note, 8.50%, 4/01/19 | | United States | | | 3,500,000 | | | | 3,806,250 | |
f CommScope Inc., senior note, 144A, 8.25%, 1/15/19 | | United States | | | 3,000,000 | | | | 3,300,000 | |
| | | | | | | | | | |
| | | | | | | | | 7,106,250 | |
| | | | | | | | | | |
Telecommunication Services 2.8% | | | | | | | | | | |
f CC Holdings GS V LLC, senior secured bond, 144A, 3.849%, 4/15/23 | | United States | | | 2,300,000 | | | | 2,341,991 | |
CenturyLink Inc., senior note, | | | | | | | | | | |
6.00%, 4/01/17 | | United States | | | 1,500,000 | | | | 1,662,289 | |
6.45%, 6/15/21 | | United States | | | 1,000,000 | | | | 1,105,800 | |
Cricket Communications Inc., senior note, 7.75%, 10/15/20 | | United States | | | 3,000,000 | | | | 3,075,000 | |
f Digicel Group Ltd., senior note, 144A, 8.25%, 9/30/20 | | Jamaica | | | 2,000,000 | | | | 2,197,500 | |
f Digicel Ltd., senior note, 144A, 8.25%, 9/01/17 | | Jamaica | | | 300,000 | | | | 324,000 | |
f eAccess Ltd., senior note, 144A, | | | | | | | | | | |
8.25%, 4/01/18 | | Japan | | | 1,400,000 | | | | 1,581,125 | |
8.375%, 4/01/18 | | Japan | | | 600,000 | EUR | | | 896,668 | |
Frontier Communications Corp., senior note, | | | | | | | | | | |
8.50%, 4/15/20 | | United States | | | 2,500,000 | | | | 2,887,500 | |
8.75%, 4/15/22 | | United States | | | 1,000,000 | | | | 1,165,000 | |
7.125%, 1/15/23 | | United States | | | 500,000 | | | | 531,875 | |
Intelsat Jackson Holdings SA, senior note, | | | | | | | | | | |
7.50%, 4/01/21 | | Luxembourg | | | 2,000,000 | | | | 2,215,000 | |
f 144A, 7.25%, 10/15/20 | | Luxembourg | | | 1,600,000 | | | | 1,746,000 | |
f 144A, 6.625%, 12/15/22 | | Luxembourg | | | 1,600,000 | | | | 1,655,000 | |
Intelsat Luxembourg SA, senior note, 11.25%, 2/04/17 | | Luxembourg | | | 400,000 | | | | 424,500 | |
MetroPCS Wireless Inc., senior note, 7.875%, 9/01/18 | | United States | | | 700,000 | | | | 761,250 | |
Sprint Nextel Corp., senior note, | | | | | | | | | | |
8.375%, 8/15/17 | | United States | | | 3,000,000 | | | | 3,502,500 | |
f 144A, 9.00%, 11/15/18 | | United States | | | 2,000,000 | | | | 2,475,000 | |
f 144A, 7.00%, 3/01/20 | | United States | | | 800,000 | | | | 932,000 | |
Telefonica Emisiones SAU, senior note, 5.462%, 2/16/21 | | Spain | | | 2,600,000 | | | | 2,773,550 | |
f Wind Acquisition Finance SA, senior secured note, 144A, 11.75%, 7/15/17 | | Italy | | | 3,500,000 | | | | 3,683,750 | |
f,j Wind Acquisition Holdings Finance SA, senior secured note, 144A, PIK, 12.25%, 7/15/17 | | Italy | | | 679,540 | EUR | | | 845,976 | |
| | | | | | | | | | |
| | | | | | | | | 38,783,274 | |
| | | | | | | | | | |
Transportation 0.4% | | | | | | | | | | |
f CEVA Group PLC, senior secured note, 144A, | | | | | | | | | | |
11.625%, 10/01/16 | | United Kingdom | | | 300,000 | | | | 309,750 | |
8.375%, 12/01/17 | | United Kingdom | | | 1,500,000 | | | | 1,494,375 | |
11.50%, 4/01/18 | | United Kingdom | | | 1,000,000 | | | | 845,000 | |
f HDTFS Inc., senior note, 144A, 6.25%, 10/15/22 | | United States | | | 300,000 | | | | 321,000 | |
f Hertz Corp., senior note, 144A, 6.75%, 4/15/19 | | United States | | | 2,200,000 | | | | 2,411,750 | |
| | | | | | | | | | |
| | | | | | | | | 5,381,875 | |
| | | | | | | | | | |
FSI-21
Franklin Templeton Variable Insurance Products Trust
Statement of Investments, December 31, 2012 (continued)
| | | | | | | | | | |
| Franklin Strategic Income Securities Fund | | Country | | Principal
Amount* | | | Value | |
Corporate Bonds (continued) | | | | | | | | | | |
Utilities 0.9% | | | | | | | | | | |
f Calpine Corp., senior secured note, 144A, | | | | | | | | | | |
7.875%, 7/31/20 | | United States | | | 982,000 | | | $ | 1,107,205 | |
7.50%, 2/15/21 | | United States | | | 1,700,000 | | | | 1,887,000 | |
7.875%, 1/15/23 | | United States | | | 470,000 | | | | 533,450 | |
CMS Energy Corp., senior note, 8.75%, 6/15/19 | | United States | | | 1,500,000 | | | | 1,957,617 | |
f Intergen NV, senior secured note, 144A, 9.00%, 6/30/17 | | Netherlands | | | 3,000,000 | | | | 2,700,000 | |
f Texas Competitive Electric Holdings Co. LLC/Texas Competitive Electric Holdings Finance Inc., senior secured note, 144A, 11.50%, 10/01/20 | | United States | | | 5,400,000 | | | | 4,252,500 | |
| | | | | | | | | | |
| | | | | | | | | 12,437,772 | |
| | | | | | | | | | |
Total Corporate Bonds (Cost $436,439,869) | | | | | | | | | 468,912,779 | |
| | | | | | | | | | |
k,lSenior Floating Rate Interests 17.6% | | | | | | | | | | |
Automobiles & Components 0.3% | | | | | | | | | | |
August Luxuk Holding Co., Lux Second Lien, 10.50%, 4/27/19 | | Luxembourg | | | 1,246,997 | | | | 1,259,467 | |
August U.S. Holding Co. Inc., U.S. Second Lien, 10.50%, 4/27/19 | | United States | | | 960,077 | | | | 969,678 | |
m Federal-Mogul Corp., | | | | | | | | | | |
Tranche B Term Loan, 2.148%, 12/27/14 | | United States | | | 1,046,071 | | | | 963,039 | |
Tranche C Term Loan, 2.148%, 12/27/15 | | United States | | | 533,721 | | | | 491,357 | |
FPC Holdings Inc. (FleetPride), Initial Loan (2nd Lien), 9.25%, 5/19/20 | | United States | | | 557,300 | | | | 548,940 | |
FRAM Group Holdings Inc. (Autoparts Holdings), Second Lien Term Loan, 10.50%, 1/29/18 | | United States | | | 400,802 | | | | 382,766 | |
| | | | | | | | | | |
| | | | | | | | | 4,615,247 | |
| | | | | | | | | | |
Capital Goods 1.6% | | | | | | | | | | |
m Air Distribution Technologies (Tomkins Air Distr.), Second Lien Initial Loan, 9.25%, 5/09/20 | | United States | | | 737,891 | | | | 756,338 | |
Allison Transmission Inc., Term B-3 Loan, 4.25%, 8/23/19 | | United States | | | 1,783,117 | | | | 1,803,177 | |
m FLY Funding II S.A.R.L., Loans, 7.75%, 8/08/18 | | Ireland | | | 255,000 | | | | 257,152 | |
m RBS Global Inc. (Rexnord), Term B Loan, 4.50%, 4/01/18 | | United States | | | 4,823,815 | | | | 4,873,563 | |
Sensus USA Inc., Second Lien Term Loan, 8.50%, 5/09/18 | | United States | | | 2,582,186 | | | | 2,595,097 | |
m Silver II US Holdings LLC, Term Loan, 6.00%, 12/13/19 | | United States | | | 2,235,600 | | | | 2,258,155 | |
Terex Corp., U.S. Term Loan, 4.50%, 4/28/17 | | United States | | | 3,576,419 | | | | 3,619,336 | |
Tomkins LLC and Tomkins Inc., Term B-1 Loan, 4.25%, 9/21/16 | | United States | | | 2,805,942 | | | | 2,828,740 | |
TransDigm Inc., | | | | | | | | | | |
Tranche B1 Term Loan, 4.00%, 2/14/17 | | United States | | | 1,799,857 | | | | 1,814,201 | |
Tranche B2 Term Loan, 4.00%, 2/14/17 | | United States | | | 507,575 | | | | 511,654 | |
Wesco Distribution Inc., Tranche B-1 Loan, 4.50%, 12/12/19 | | United States | | | 724,300 | | | | 729,189 | |
| | | | | | | | | | |
| | | | | | | | | 22,046,602 | |
| | | | | | | | | | |
Commercial & Professional Services 1.3% | | | | | | | | | | |
ARAMARK Corp., | | | | | | | | | | |
Extended Synthetic L/C, 3.309%, 7/26/16 | | United States | | | 143,344 | | | | 144,194 | |
Extended U.S. Term Loan B-3, 3.462% - 3.561%, 7/26/16 | | United States | | | 1,138,629 | | | | 1,145,382 | |
Synthetic L/C-3, 3.309%, 7/26/16 | | United States | | | 91,726 | | | | 92,270 | |
Term Loan B Extended, 3.462%, 7/26/16 | | United States | | | 2,178,033 | | | | 2,190,951 | |
m U.S. Term C Loan, 6.50%, 7/26/16 | | United States | | | 980,600 | | | | 986,416 | |
Brock Holdings III Inc., Second Lien Term Loan, 10.00%, 3/16/18 | | United States | | | 1,187,270 | | | | 1,196,175 | |
EnviroSolutions Real Property Holdings, Second Lien Term Loan, 8.00%, 7/29/14 | | United States | | | 502,938 | | | | 503,567 | |
Interactive Data Corp., Term B Loans, 4.50%, 2/11/18 | | United States | | | 5,873,824 | | | | 5,912,332 | |
KAR Auction Services Inc. (Adesa), Term Loan, 5.00%, 5/19/17 | | United States | | | 5,436,709 | | | | 5,494,474 | |
| | | | | | | | | | |
| | | | | | | | | 17,665,761 | |
| | | | | | | | | | |
FSI-22
Franklin Templeton Variable Insurance Products Trust
Statement of Investments, December 31, 2012 (continued)
| | | | | | | | | | |
| Franklin Strategic Income Securities Fund | | Country | | Principal
Amount* | | | Value | |
k,lSenior Floating Rate Interests (continued) | | | | | | | | | | |
Consumer Durables & Apparel 0.2% | | | | | | | | | | |
m PVH Corp., Term Loan B, 4.75%, 12/20/19 | | United States | | | 2,608,900 | | | $ | 2,628,000 | |
| | | | | | | | | | |
Consumer Services 1.1% | | | | | | | | | | |
Ameristar Casinos Inc., B Term Loan, 4.00%, 4/14/18 | | United States | | | 2,295,714 | | | | 2,315,444 | |
Burger King Corp., Tranche B Term Loan, 3.75%, 9/28/19 | | United States | | | 2,600,041 | | | | 2,621,166 | |
DineEquity Inc., Term B-1 Loan, 4.25%, 10/19/17 | | United States | | | 1,363,692 | | | | 1,377,329 | |
MGM Resorts International, Term B Loan, 4.25%, 12/20/19 | | United States | | | 753,200 | | | | 762,380 | |
d,j Turtle Bay Holdings LLC, | | | | | | | | | | |
Term Loan A, PIK, 10.25%, 3/01/15 | | United States | | | 2,116,501 | | | | 2,116,501 | |
Term Loan B, PIK, 3.00%, 3/01/15 | | United States | | | 4,154,266 | | | | 3,738,839 | |
Wendy’s International Inc., Closing Date Term Loan, 4.75%, 5/15/19 | | United States | | | 2,772,613 | | | | 2,804,301 | |
| | | | | | | | | | |
| | | | | | | | | 15,735,960 | |
| | | | | | | | | | |
Diversified Financials 0.9% | | | | | | | | | | |
Asurion LLC, | | | | | | | | | | |
Amortizing Term Loans (B1), 4.75%, 7/23/17 | | United States | | | 707,672 | | | | 713,268 | |
Second Lien Term Loan, 9.00%, 5/24/19 | | United States | | | 2,013,553 | | | | 2,078,994 | |
Term Loan (TLB), 5.50%, 5/24/18 | | United States | | | 494,873 | | | | 500,543 | |
MoneyGram Payment Systems Worldwide Inc., | | | | | | | | | | |
Term Loan, 4.25%, 11/18/17 | | United States | | | 3,357,159 | | | | 3,352,963 | |
Tranche B-1 Loan, 4.25%, 11/18/17 | | United States | | | 1,073,388 | | | | 1,072,046 | |
TransUnion LLC/TransUnion FICO, Replacement Term Loan, 5.50%, 2/10/18 | | United States | | | 3,967,779 | | | | 4,028,950 | |
| | | | | | | | | | |
| | | | | | | | | 11,746,764 | |
| | | | | | | | | | |
Energy 0.7% | | | | | | | | | | |
Arch Coal Inc., Term Loans, 5.75%, 5/16/18 | | United States | | | 4,556,788 | | | | 4,614,564 | |
m ATP Oil & Gas Corp., | | | | | | | | | | |
Additional NM Loans (DIP), 10.75%, 3/01/14 | | United States | | | 5,532 | | | | 4,713 | |
DIP, 10.75%, 3/01/14 | | United States | | | 48,443 | | | | 41,273 | |
Refinancing Loan (DIP), 10.75%, 3/01/14 | | United States | | | 82,858 | | | | 70,595 | |
FTS International LLC (Frac Tech), Term Loan, 8.50%, 5/06/16 | | United States | | | 447,523 | | | | 373,402 | |
Patriot Coal Corp., DIP Term Loan, 9.25%, 10/03/13 | | United States | | | 2,512,495 | | | | 2,531,339 | |
Plains Exploration & Production Co., 7-Year Term Loan, 4.00%, 11/30/19 | | United States | | | 1,973,600 | | | | 1,982,645 | |
| | | | | | | | | | |
| | | | | | | | | 9,618,531 | |
| | | | | | | | | | |
Food & Staples Retailing 0.2% | | | | | | | | | | |
AdvancePierre Foods Inc., | | | | | | | | | | |
Loans, 5.75%, 7/10/17 | | United States | | | 1,061,401 | | | | 1,075,332 | |
Second Lien Term Loan, 9.50%, 10/10/17 | | United States | | | 1,619,009 | | | | 1,659,484 | |
| | | | | | | | | | |
| | | | | | | | | 2,734,816 | |
| | | | | | | | | | |
Food, Beverage & Tobacco 0.6% | | | | | | | | | | |
Del Monte Foods Co., Initial Term Loan, 4.50%, 3/08/18 | | United States | | | 8,621,296 | | | | 8,651,832 | |
| | | | | | | | | | |
Health Care Equipment & Services 2.4% | | | | | | | | | | |
m Ardent Medical Services Inc., Second Lien Term Loan, 11.75%, 1/02/19 | | United States | | | 1,195,436 | | | | 1,220,839 | |
Bausch & Lomb Inc., Parent Term Loan, 5.25%, 5/18/19 | | United States | | | 4,602,815 | | | | 4,650,487 | |
Community Health Systems Inc., New Extended Term Loan, 3.811%, 1/25/17 | | United States | | | 7,487,232 | | | | 7,542,780 | |
DaVita Inc., | | | | | | | | | | |
Tranche B Term Loan, 4.50%, 10/20/16 | | United States | | | 2,660,317 | | | | 2,682,265 | |
Tranche B-2 Term Loan, 4.00%, 8/24/19 | | United States | | | 3,464,300 | | | | 3,496,043 | |
HCA Inc., Tranche B-2 Term Loan, 3.561%, 3/31/17 | | United States | | | 8,318,841 | | | | 8,352,640 | |
Hologic Inc., Tranche B Term Loan, 4.50%, 8/01/19 | | United States | | | 2,099,816 | | | | 2,127,594 | |
FSI-23
Franklin Templeton Variable Insurance Products Trust
Statement of Investments, December 31, 2012 (continued)
| | | | | | | | | | |
| Franklin Strategic Income Securities Fund | | Country | | Principal
Amount* | | | Value | |
k,lSenior Floating Rate Interests (continued) | | | | | | | | | | |
Health Care Equipment & Services (continued) | | | | | | | | | | |
Universal Health Services Inc., New Tranche B Term Loan, 3.75%, 11/15/16 | | United States | | | 2,247,659 | | | $ | 2,260,583 | |
| | | | | | | | | | |
| | | | | | | | | 32,333,231 | |
| | | | | | | | | | |
Household & Personal Products 0.0%† | | | | | | | | | | |
Spectrum Brands Inc., Initial U.S. Term Loan, 4.50%, 12/17/19 | | United States | | | 380,400 | | | | 382,842 | |
| | | | | | | | | | |
Materials 2.4% | | | | | | | | | | |
American Rock Salt Co. LLC, Initial Loan, 5.50%, 4/25/17 | | United States | | | 1,898,223 | | | | 1,876,076 | |
Exopack LLC, Term B Loan, 6.50%, 5/31/17 | | United States | | | 232,279 | | | | 232,279 | |
FMG America Finance Inc., Loans, 5.25%, 10/18/17 | | United States | | | 2,535,845 | | | | 2,561,401 | |
Ineos US Finance LLC, Dollar Term Loan, 6.50%, 4/27/18 | | United States | | | 4,093,474 | | | | 4,144,004 | |
NewPage Corp., Term Loan, 8.75%, 12/21/18 | | United States | | | 2,757,776 | | | | 2,757,776 | |
PL Propylene LLC (PetroLogistics), Tranche B Term Loan, 7.00%, 3/27/17 | | United States | | | 2,305,976 | | | | 2,337,683 | |
Reynolds Group Holdings Inc., U.S. Term Loan, 4.75%, 9/28/18 | | United States | | | 6,944,627 | | | | 7,039,720 | |
Road Infrastructure Investment LLC (Ennis Flint), Second Lien Term Loan, 10.25%, 9/30/18 | | United States | | | 5,351,561 | | | | 5,257,909 | |
Tronox Pigments (Netherlands) BV, | | | | | | | | | | |
Closing Date Term Loan, 4.25%, 2/08/18 | | Netherlands | | | 1,385,341 | | | | 1,400,926 | |
Delayed Draw Term Loan, 4.25%, 2/08/18 | | Netherlands | | | 377,820 | | | | 381,717 | |
Walter Energy Inc., B Term Loan, 5.75%, 4/01/18 | | United States | | | 4,251,841 | | | | 4,291,702 | |
| | | | | | | | | | |
| | | | | | | | | 32,281,193 | |
| | | | | | | | | | |
Media 2.3% | | | | | | | | | | |
Cinemark USA Inc., Term Loan, 3.21%, 12/13/19 | | United States | | | 1,732,380 | | | | 1,739,743 | |
Clear Channel Communications Inc., | | | | | | | | | | |
Tranche A Term Loan, 3.612%, 5/13/14 | | United States | | | 666,228 | | | | 649,780 | |
Tranche B Term Loan, 3.862%, 1/29/16 | | United States | | | 3,254,857 | | | | 2,705,600 | |
CSC Holdings Inc. (Cablevision), Incremental B-2 Extended Term Loan, 1.962%, 3/29/16 | | United States | | | 2,754,274 | | | | 2,771,488 | |
m Cumulus Media Holdings Inc., Second Lien Term Loan, 7.50%, 9/16/19 | | United States | | | 6,593,187 | | | | 6,807,466 | |
FoxCo Acquisition Sub LLC, Initial Term Loan, 5.50%, 7/14/17 | | United States | | | 1,079,794 | | | | 1,096,441 | |
Hubbard Radio LLC, Second Lien Term Loan, 8.75%, 4/29/18 | | United States | | | 1,488,810 | | | | 1,518,587 | |
Regal Cinemas Corp., Term Loan, 3.212% - 3.311%, 8/23/17 | | United States | | | 2,871,730 | | | | 2,887,114 | |
Sinclair Television Group Inc., New Tranche B Term Loan, 4.00%, 10/29/16 | | United States | | | 1,035,169 | | | | 1,042,493 | |
Telesat Canada, U.S. Term B Loan, 4.25%, 3/28/19 | | Canada | | | 2,796,582 | | | | 2,821,052 | |
TWCC Holding Corp., Term Loan, 4.25%, 2/11/17 | | United States | | | 2,882,032 | | | | 2,916,855 | |
UPC Financing Partnership, | | | | | | | | | | |
Term Loan AF, 4.00%, 1/29/21 | | Netherlands | | | 736,600 | | | | 736,370 | |
Term Loan T, 3.714%, 12/30/16 | | Netherlands | | | 3,158,518 | | | | 3,146,674 | |
Term Loan X, 3.714%, 12/31/17 | | Netherlands | | | 1,384,751 | | | | 1,383,713 | |
| | | | | | | | | | |
| | | | | | | | | 32,223,376 | |
| | | | | | | | | | |
Pharmaceuticals, Biotechnology & Life Sciences 0.9% | | | | | | | | | | |
Par Pharmaceutical Cos. Inc., Term B Loans, 5.00%, 9/30/19 | | United States | | | 1,669,774 | | | | 1,672,034 | |
m Quintiles Transnational Corp., Term B-2 Loan, 5.50%, 6/08/18 | | United States | | | 38,400 | | | | 38,712 | |
Valeant Pharmaceuticals International Inc., | | | | | | | | | | |
m Series C Tranche B Term Loan, 5.50%, 2/13/19 | | Canada | | | 2,568,200 | | | | 2,588,746 | |
Series D Tranche B Term Loan, 4.25%, 2/13/19 | | Canada | | | 2,458,840 | | | | 2,476,256 | |
Warner Chilcott Co. LLC, Term B-2 Loan, 4.25%, 3/15/18 | | Puerto Rico | | | 1,184,331 | | | | 1,193,319 | |
Warner Chilcott Corp., | | | | | | | | | | |
Additional Term B-1 Loan, 4.25%, 3/15/18 | | United States | | | 899,549 | | | | 906,376 | |
Term B-1 Loan, 4.25%, 3/15/18 | | United States | | | 2,368,662 | | | | 2,386,638 | |
WC Luxco S.A.R.L., Term B-3 Loan, 4.25%, 3/15/18 | | Luxembourg | | | 1,628,455 | | | | 1,640,813 | |
| | | | | | | | | | |
| | | | | | | | | 12,902,894 | |
| | | | | | | | | | |
FSI-24
Franklin Templeton Variable Insurance Products Trust
Statement of Investments, December 31, 2012 (continued)
| | | | | | | | | | |
| Franklin Strategic Income Securities Fund | | Country | | Principal
Amount* | | | Value | |
k,lSenior Floating Rate Interests (continued) | | | | | | | | | | |
Retailing 1.1% | | | | | | | | | | |
BJ’s Wholesale Club Inc., | | | | | | | | | | |
Initial Loan, 5.75%, 9/26/19 | | United States | | | 6,334,857 | | | $ | 6,431,014 | |
Second Lien Term Loan, 9.75%, 3/26/20 | | United States | | | 2,652,243 | | | | 2,741,756 | |
Evergreen AcqCo. 1 LP (Savers), Term Loan, 5.00%, 7/09/19 | | United States | | | 3,539,376 | | | | 3,558,181 | |
Party City Holdings Inc., Term Loans, 5.75%, 7/27/19 | | United States | | | 2,307,623 | | | | 2,335,748 | |
| | | | | | | | | | |
| | | | | | | | | 15,066,699 | |
| | | | | | | | | | |
Software & Services 0.2% | | | | | | | | | | |
AVG Technologies NV, Term Loan, 7.50%, 3/15/16 | | Netherlands | | | 387,393 | | | | 390,299 | |
m SunGard Data Systems Inc., Tranche D Term Loan, 6.00%, 1/31/20 | | United States | | | 554,300 | | | | 560,536 | |
Vertafore Inc., Second Lien Term Loan, 9.75%, 10/27/17 | | United States | | | 1,872,942 | | | | 1,882,306 | |
| | | | | | | | | | |
| | | | | | | | | 2,833,141 | |
| | | | | | | | | | |
Technology Hardware & Equipment 0.1% | | | | | | | | | | |
Flextronics International USA Inc., | | | | | | | | | | |
A Closing Date Loan, 2.462%, 10/01/14 | | United States | | | 95,127 | | | | 95,294 | |
A-1-A Delayed Draw Term Loan, 2.462%, 10/01/14 | | United States | | | 27,335 | | | | 27,383 | |
A-1-B Delayed Draw Term Loan, 2.462%, 10/01/14 | | United States | | | 195,392 | | | | 195,820 | |
A-2 Delayed Draw Term Loan, 2.462%, 10/01/14 | | United States | | | 669,983 | | | | 671,449 | |
A-3 Delayed Draw Term Loan, 2.462%, 10/01/14 | | United States | | | 213,575 | | | | 214,043 | |
m Riverbed Technology Inc., Term Loan B, 5.25%, 12/18/19 | | United States | | | 665,000 | | | | 671,650 | |
| | | | | | | | | | |
| | | | | | | | | 1,875,639 | |
| | | | | | | | | | |
Telecommunication Services 0.7% | | | | | | | | | | |
Intelsat Jackson Holdings SA, Tranche B-1 Term Loan, 4.50%, 4/02/18 | | Luxembourg | | | 8,721,642 | | | | 8,802,631 | |
m NTELOS Inc., Term B Advance, 7.00%, 11/11/19 | | United States | | | 234,776 | | | | 226,265 | |
| | | | | | | | | | |
| | | | | | | | | 9,028,896 | |
| | | | | | | | | | |
Transportation 0.6% | | | | | | | | | | |
Avis Budget Car Rental LLC, Tranche C Term Loan, 4.25%, 3/15/19 | | United States | | | 3,077,494 | | | | 3,111,346 | |
Evergreen International Aviation Inc., Term Loan, 11.50%, 6/30/15 | | United States | | | 2,010,458 | | | | 1,970,249 | |
Hertz Corp., | | | | | | | | | | |
Credit Linked Deposit, 3.75%, 3/11/18 | | United States | | | 847,103 | | | | 849,750 | |
Tranche B-1 Term Loan, 3.75%, 3/12/18 | | United States | | | 2,298,900 | | | | 2,305,367 | |
| | | | | | | | | | |
| | | | | | | | | 8,236,712 | |
| | | | | | | | | | |
Total Senior Floating Rate Interests (Cost $238,910,354) | | | | | | | | | 242,608,136 | |
| | | | | | | | | | |
Foreign Government and Agency Securities 21.1% | | | | | | | | | | |
Government of Australia, senior bond, 6.50%, 5/15/13 | | Australia | | | 5,700,000 | AUD | | | 6,005,255 | |
Government of Hungary, | | | | | | | | | | |
5.50%, 2/12/14 | | Hungary | | | 1,443,700,000 | HUF | | | 6,567,843 | |
5.50%, 2/12/16 | | Hungary | | | 1,864,700,000 | HUF | | | 8,424,586 | |
6.50%, 6/24/19 | | Hungary | | | 206,000,000 | HUF | | | 962,700 | |
7.50%, 11/12/20 | | Hungary | | | 312,600,000 | HUF | | | 1,551,198 | |
senior note, 6.25%, 1/29/20 | | Hungary | | | 5,507,000 | | | | 6,102,444 | |
senior note, 6.375%, 3/29/21 | | Hungary | | | 1,550,000 | | | | 1,726,313 | |
f Government of Iceland, 144A, 5.875%, 5/11/22 | | Iceland | | | 3,010,000 | | | | 3,396,604 | |
Government of Indonesia, | | | | | | | | | | |
FR19, 14.25%, 6/15/13 | | Indonesia | | | 26,830,000,000 | IDR | | | 2,916,027 | |
FR20, 14.275%, 12/15/13 | | Indonesia | | | 23,637,000,000 | IDR | | | 2,682,086 | |
FR26, 11.00%, 10/15/14 | | Indonesia | | | 1,800,000,000 | IDR | | | 207,890 | |
FR34, 12.80%, 6/15/21 | | Indonesia | | | 37,155,000,000 | IDR | | | 5,857,672 | |
FSI-25
Franklin Templeton Variable Insurance Products Trust
Statement of Investments, December 31, 2012 (continued)
| | | | | | | | | | |
| Franklin Strategic Income Securities Fund | | Country | | Principal
Amount* | | | Value | |
Foreign Government and Agency Securities (continued) | | | | | | | | | | |
Government of Indonesia, (continued) | | | | | | | | | | |
FR42, 10.25%, 7/15/27 | | Indonesia | | | 2,000,000,000 | IDR | | $ | 293,126 | |
FR44, 10.00%, 9/15/24 | | Indonesia | | | 9,300,000,000 | IDR | | | 1,320,783 | |
Government of Ireland, | | | | | | | | | | |
4.60%, 4/18/16 | | Ireland | | | 344,000 | EUR | | | 484,593 | |
5.90%, 10/18/19 | | Ireland | | | 2,228,000 | EUR | | | 3,226,872 | |
4.50%, 4/18/20 | | Ireland | | | 2,029,000 | EUR | | | 2,698,687 | |
5.00%, 10/18/20 | | Ireland | | | 3,562,000 | EUR | | | 4,871,980 | |
senior bond, 4.40%, 6/18/19 | | Ireland | | | 3,338,000 | EUR | | | 4,450,018 | |
senior bond, 5.40%, 3/13/25 | | Ireland | | | 2,534,000 | EUR | | | 3,424,069 | |
Government of Israel, | | | | | | | | | | |
5.00%, 3/31/13 | | Israel | | | 4,370,000 | ILS | | | 1,180,278 | |
3.50%, 9/30/13 | | Israel | | | 16,505,000 | ILS | | | 4,478,908 | |
Government of Malaysia, | | | | | | | | | | |
3.434%, 8/15/14 | | Malaysia | | | 1,695,000 | MYR | | | 557,809 | |
senior bond, 3.702%, 2/25/13 | | Malaysia | | | 2,323,000 | MYR | | | 760,347 | |
senior bond, 3.70%, 5/15/13 | | Malaysia | | | 2,695,000 | MYR | | | 883,367 | |
senior bond, 3.21%, 5/31/13 | | Malaysia | | | 15,375,000 | MYR | | | 5,031,039 | |
senior bond, 3.461%, 7/31/13 | | Malaysia | | | 15,030,000 | MYR | | | 4,926,665 | |
senior bond, 8.00%, 10/30/13 | | Malaysia | | | 50,000 | MYR | | | 17,008 | |
senior bond, 5.094%, 4/30/14 | | Malaysia | | | 5,925,000 | MYR | | | 1,989,085 | |
senior bond, 3.814%, 2/15/17 | | Malaysia | | | 11,400,000 | MYR | | | 3,820,521 | |
senior bond, 4.24%, 2/07/18 | | Malaysia | | | 600,000 | MYR | | | 205,079 | |
Government of Mexico, | | | | | | | | | | |
9.00%, 6/20/13 | | Mexico | | | 1,074,360 | n MXN | | | 8,542,735 | |
8.00%, 12/19/13 | | Mexico | | | 1,062,700 | n MXN | | | 8,541,707 | |
7.00%, 6/19/14 | | Mexico | | | 192,800 | n MXN | | | 1,549,609 | |
9.50%, 12/18/14 | | Mexico | | | 526,900 | n MXN | | | 4,469,497 | |
8.00%, 12/17/15 | | Mexico | | | 140,000 | n MXN | | | 1,182,784 | |
Government of Poland, | | | | | | | | | | |
5.25%, 4/25/13 | | Poland | | | 7,895,000 | PLN | | | 2,569,450 | |
5.00%, 10/24/13 | | Poland | | | 3,845,000 | PLN | | | 1,262,744 | |
5.75%, 4/25/14 | | Poland | | | 38,255,000 | PLN | | | 12,785,484 | |
5.50%, 4/25/15 | | Poland | | | 5,975,000 | PLN | | | 2,034,051 | |
6.25%, 10/24/15 | | Poland | | | 12,680,000 | PLN | | | 4,443,331 | |
5.75%, 9/23/22 | | Poland | | | 1,000,000 | PLN | | | 379,374 | |
k FRN, 5.15%, 1/25/17 | | Poland | | | 1,660,000 | PLN | | | 540,185 | |
k FRN, 5.15%, 1/25/21 | | Poland | | | 1,683,000 | PLN | | | 542,544 | |
Strip, 7/25/13 | | Poland | | | 9,270,000 | PLN | | | 2,948,217 | |
Strip, 1/25/14 | | Poland | | | 12,960,000 | PLN | | | 4,059,242 | |
f Government of Russia, senior bond, 144A, 7.50%, 3/31/30 | | Russia | | | 3,674,275 | | | | 4,705,460 | |
Government of Sri Lanka, | | | | | | | | | | |
A, 8.50%, 1/15/13 | | Sri Lanka | | | 50,900,000 | LKR | | | 398,299 | |
A, 13.50%, 2/01/13 | | Sri Lanka | | | 59,500,000 | LKR | | | 466,723 | |
A, 7.50%, 8/01/13 | | Sri Lanka | | | 48,640,000 | LKR | | | 373,288 | |
A, 7.00%, 3/01/14 | | Sri Lanka | | | 7,020,000 | LKR | | | 52,220 | |
A, 11.25%, 7/15/14 | | Sri Lanka | | | 176,100,000 | LKR | | | 1,370,050 | |
A, 11.75%, 3/15/15 | | Sri Lanka | | | 1,160,000 | LKR | | | 9,066 | |
A, 6.50%, 7/15/15 | | Sri Lanka | | | 28,980,000 | LKR | | | 200,828 | |
A, 11.00%, 8/01/15 | | Sri Lanka | | | 200,400,000 | LKR | | | 1,537,886 | |
A, 6.40%, 8/01/16 | | Sri Lanka | | | 19,500,000 | LKR | | | 128,232 | |
B, 8.50%, 7/15/13 | | Sri Lanka | | | 1,110,000 | LKR | | | 8,582 | |
B, 11.75%, 4/01/14 | | Sri Lanka | | | 6,990,000 | LKR | | | 54,750 | |
FSI-26
Franklin Templeton Variable Insurance Products Trust
Statement of Investments, December 31, 2012 (continued)
| | | | | | | | | | |
| Franklin Strategic Income Securities Fund | | Country | | Principal
Amount* | | | Value | |
Foreign Government and Agency Securities (continued) | | | | | | | | | | |
Government of Sri Lanka, (continued) | | | | | | | | | | |
B, 6.60%, 6/01/14 | | Sri Lanka | | | 7,100,000 | LKR | | $ | 51,983 | |
B, 6.40%, 10/01/16 | | Sri Lanka | | | 16,000,000 | LKR | | | 104,747 | |
Government of Sweden, | | | | | | | | | | |
1.50%, 8/30/13 | | Sweden | | | 106,380,000 | SEK | | | 16,453,257 | |
6.75%, 5/05/14 | | Sweden | | | 109,020,000 | SEK | | | 18,106,528 | |
Government of the Philippines, | | | | | | | | | | |
senior bond, 8.75%, 3/03/13 | | Philippines | | | 57,170,000 | PHP | | | 1,407,854 | |
senior note, 6.25%, 1/27/14 | | Philippines | | | 121,000,000 | PHP | | | 3,071,970 | |
f Government of Ukraine, | | | | | | | | | | |
144A, 7.75%, 9/23/20 | | Ukraine | | | 6,000,000 | | | | 6,178,170 | |
senior bond, 144A, 7.80%, 11/28/22 | | Ukraine | | | 1,310,000 | | | | 1,323,100 | |
senior note, 144A, 7.95%, 2/23/21 | | Ukraine | | | 2,120,000 | | | | 2,201,048 | |
o Government of Uruguay, senior note, Index Linked, 4.375%, 12/15/28 | | Uruguay | | | 135,613,104 | UYU | | | 8,422,946 | |
f Government of Vietnam, 144A, 6.75%, 1/29/20 | | Vietnam | | | 1,500,000 | | | | 1,717,500 | |
Indonesia Retail Bond, senior bond, ORI7, 7.95%, 8/15/13 | | Indonesia | | | 8,300,000,000 | IDR | | | 880,166 | |
Korea Monetary Stabilization Bond, | | | | | | | | | | |
senior bond, 3.76%, 6/02/13 | | South Korea | | | 707,150,000 | KRW | | | 667,516 | |
senior bond, 3.90%, 8/02/13 | | South Korea | | | 1,325,900,000 | KRW | | | 1,254,616 | |
senior bond, 3.59%, 10/02/13 | | South Korea | | | 1,237,510,000 | KRW | | | 1,170,438 | |
senior bond, 3.48%, 12/02/13 | | South Korea | | | 2,121,430,000 | KRW | | | 2,006,671 | |
senior bond, 3.47%, 2/02/14 | | South Korea | | | 2,916,950,000 | KRW | | | 2,761,944 | |
senior bond, 3.59%, 4/02/14 | | South Korea | | | 4,287,030,000 | KRW | | | 4,069,507 | |
senior note, 3.28%, 6/02/14 | | South Korea | | | 5,082,540,000 | KRW | | | 4,809,407 | |
senior note, 2.82%, 8/02/14 | | South Korea | | | 509,400,000 | KRW | | | 478,916 | |
senior note, 2.78%, 10/02/14 | | South Korea | | | 2,030,900,000 | KRW | | | 1,908,087 | |
senior note, 2.84%, 12/02/14 | | South Korea | | | 717,280,000 | KRW | | | 674,607 | |
Korea Treasury Bond, | | | | | | | | | | |
senior bond, 5.00%, 3/26/13 | | South Korea | | | 1,163,000,000 | KRW | | | 1,098,798 | |
senior bond, 3.75%, 6/10/13 | | South Korea | | | 4,210,340,000 | KRW | | | 3,975,228 | |
senior bond, 3.00%, 12/10/13 | | South Korea | | | 15,972,210,000 | KRW | | | 15,045,186 | |
senior bond, 3.50%, 6/10/14 | | South Korea | | | 2,788,920,000 | KRW | | | 2,647,662 | |
senior note, 5.25%, 3/10/13 | | South Korea | | | 346,570,000 | KRW | | | 327,319 | |
senior note, 3.25%, 12/10/14 | | South Korea | | | 1,261,950,000 | KRW | | | 1,195,856 | |
New South Wales Treasury Corp., | | | | | | | | | | |
5.25%, 5/01/13 | | Australia | | | 1,605,000 | AUD | | | 1,681,193 | |
5.50%, 8/01/13 | | Australia | | | 3,305,000 | AUD | | | 3,486,491 | |
Nota Do Tesouro Nacional, | | | | | | | | | | |
10.00%, 1/01/14 | | Brazil | | | 2,700 | p BRL | | | 1,352,092 | |
10.00%, 1/01/17 | | Brazil | | | 7,400 | p BRL | | | 3,807,622 | |
q Index Linked, 6.00%, 5/15/15 | | Brazil | | | 3,890 | p BRL | | | 4,618,172 | |
q Index Linked, 6.00%, 8/15/16 | | Brazil | | | 1,604 | p BRL | | | 1,955,646 | |
q Index Linked, 6.00%, 8/15/18 | | Brazil | | | 1,525 | p BRL | | | 1,924,614 | |
Queensland Treasury Corp., senior note, 6.00%, 8/14/13 | | Australia | | | 600,000 | AUD | | | 635,694 | |
Uruguay Notas del Tesoro, | | | | | | | | | | |
9.00%, 1/27/14 | | Uruguay | | | 7,570,000 | UYU | | | 393,103 | |
10.50%, 3/21/15 | | Uruguay | | | 1,700,000 | UYU | | | 90,517 | |
10.25%, 8/22/15 | | Uruguay | | | 58,780,000 | UYU | | | 3,079,974 | |
9.50%, 1/27/16 | | Uruguay | | | 9,220,000 | UYU | | | 483,197 | |
o Index Linked, 2.25%, 8/23/17 | | Uruguay | | | 22,309,878 | UYU | | | 1,163,249 | |
Western Australia Treasury Corp., 8.00%, 6/15/13 | | Australia | | | 4,602,000 | AUD | | | 4,890,905 | |
| | | | | | | | | | |
Total Foreign Government and Agency Securities
(Cost $273,901,323) | | | | | | | | | 289,750,686 | |
| | | | | | | | | | |
FSI-27
Franklin Templeton Variable Insurance Products Trust
Statement of Investments, December 31, 2012 (continued)
| | | | | | | | | | |
| Franklin Strategic Income Securities Fund | | Country | | Principal
Amount* | | | Value | |
U.S. Government and Agency Securities 2.1% | | | | | | | | | | |
U.S. Treasury Bond, | | | | | | | | | | |
4.50%, 2/15/16 | | United States | | | 3,000,000 | | | $ | 3,381,330 | |
7.875%, 2/15/21 | | United States | | | 900,000 | | | | 1,353,445 | |
7.125%, 2/15/23 | | United States | | | 1,980,000 | | | | 2,982,684 | |
U.S. Treasury Note, | | | | | | | | | | |
2.375%, 3/31/16 | | United States | | | 3,500,000 | | | | 3,721,484 | |
4.625%, 2/15/17 | | United States | | | 600,000 | | | | 699,281 | |
4.75%, 8/15/17 | | United States | | | 2,900,000 | | | | 3,442,619 | |
3.75%, 11/15/18 | | United States | | | 7,000,000 | | | | 8,147,342 | |
o Index Linked, 0.125%, 4/15/16 | | United States | | | 2,410,349 | | | | 2,538,774 | |
o Index Linked, 0.625%, 7/15/21 | | United States | | | 2,565,844 | | | | 2,916,644 | |
| | | | | | | | | | |
Total U.S. Government and Agency Securities
(Cost $26,704,627) | | | | | | | | | 29,183,603 | |
| | | | | | | | | | |
Asset-Backed Securities and Commercial Mortgage-Backed Securities 3.3% | | | | | | | | | | |
Banks 1.5% | | | | | | | | | | |
Banc of America Commercial Mortgage Inc., 2006-4, AJ, 5.695%, 7/10/46 | | United States | | | 1,547,000 | | | | 1,474,519 | |
f,k Banc of America Large Loan, 2010-HLTN, 144A, FRN, 2.509%, 11/15/15 | | United States | | | 4,119,670 | | | | 4,122,626 | |
Bear Stearns Commercial Mortgage Securities Inc., | | | | | | | | | | |
k 2006-PW11, AJ, FRN, 5.452%, 3/11/39 | | United States | | | 500,000 | | | | 511,813 | |
2006-PW13, AJ, 5.611%, 9/11/41 | | United States | | | 5,100,000 | | | | 4,986,140 | |
k Greenwich Capital Commercial Funding Corp., 2006-GG7, AJ, FRN, 5.867%, 7/10/38 | | United States | | | 2,260,000 | | | | 2,199,311 | |
f,k Wachovia Bank Commercial Mortgage Trust, 2007-WHL8, A1, 144A, FRN, 0.289%, 6/15/20 | | United States | | | 4,752,247 | | | | 4,680,049 | |
Wells Fargo Mortgage Backed Securities Trust, | | | | | | | | | | |
k 2004-W, A9, FRN, 2.762%, 11/25/34 | | United States | | | 1,859,052 | | | | 1,931,098 | |
2007-3, 3A1, 5.50%, 4/25/37 | | United States | | | 1,432,052 | | | | 1,482,550 | |
| | | | | | | | | | |
| | | | | | | | | 21,388,106 | |
| | | | | | | | | | |
Diversified Financials 1.8% | | | | | | | | | | |
f,k ARES CLO Funds, 2007-12A, B, 144A, FRN, 1.312%, 11/25/20 | | Cayman Islands | | | 1,380,000 | | | | 1,297,869 | |
f,k Cent CDO Ltd., 2007-15A, A2B, 144A, FRN, 0.65%, 3/11/21 | | Cayman Islands | | | 1,251,000 | | | | 1,144,771 | |
Citigroup Commercial Mortgage Trust, | | | | | | | | | | |
2006-C5, AJ, 5.482%, 10/15/49 | | United States | | | 1,700,000 | | | | 1,622,947 | |
k 2007-C6, AM, FRN, 5.885%, 6/10/17 | | United States | | | 1,700,000 | | | | 1,935,437 | |
k 2008-C7, A4, FRN, 6.072%, 12/10/49 | | United States | | | 6,200,000 | | | | 7,505,162 | |
k Citigroup/Deutsche Bank Commercial Mortgage Trust, 2006-CD3, AJ, FRN, 5.688%, 10/15/48 | | United States | | | 2,120,000 | | | | 1,801,081 | |
f,k Columbus Nova CLO Ltd., 2007-2A, A2, 144A, FRN, 1.34%, 10/15/21 | | Cayman Islands | | | 860,000 | | | | 811,616 | |
f,k Commercial Industrial Finance Corp., 2007-3A, A1J, 144A, FRN, 0.714%, 7/26/21 | | Cayman Islands | | | 960,000 | | | | 882,996 | |
Countrywide Asset-Backed Certificates, 2005-11, AF4, 5.21%, 3/25/34 | | United States | | | 1,275,000 | | | | 858,178 | |
f,k Gleneagles CLO Ltd., 2005-1A, A2, 144A, FRN, 0.713%, 11/01/17 | | Cayman Islands | | | 1,000,000 | | | | 909,580 | |
f,k MAPS CLO Fund LLC, 2005-1A, B, 144A, FRN, 0.81%, 12/21/17 | | United States | | | 1,400,000 | | | | 1,385,510 | |
k Morgan Stanley Capital I Trust, 2006-HQ8, AJ, FRN, 5.68%, 3/12/44 | | United States | | | 200,000 | | | | 203,283 | |
Residential Asset Securities Corp., 2004-KS1, AI4, 4.213%, 4/25/32 | | United States | | | 68,193 | | | | 67,759 | |
f,k Westchester CLO Ltd., 2007-1A, A1A, 144A, FRN, 0.538%, 8/01/22 | | Cayman Islands | | | 4,379,921 | | | | 4,123,170 | |
| | | | | | | | | | |
| | | | | | | | | 24,549,359 | |
| | | | | | | | | | |
Total Asset-Backed Securities and Commercial Mortgage-Backed Securities (Cost $41,738,738) | | | | | | | | | 45,937,465 | |
| | | | | | | | | | |
FSI-28
Franklin Templeton Variable Insurance Products Trust
Statement of Investments, December 31, 2012 (continued)
| | | | | | | | | | |
| Franklin Strategic Income Securities Fund | | Country | | Principal
Amount* | | | Value | |
Mortgage-Backed Securities 6.0% | | | | | | | | | | |
k Federal Home Loan Mortgage Corp. (FHLMC) Adjustable Rate 0.0%† | | | | | | | | | | |
FHLMC, 2.348%, 1/01/33 | | United States | | | 74,452 | | | $ | 77,627 | |
| | | | | | | | | | |
Federal Home Loan Mortgage Corp. (FHLMC) Fixed Rate 1.0% | | | | | | | | | | |
FHLMC Gold 15 Year, 4.50%, 10/01/18 - 6/01/19 | | United States | | | 754,108 | | | | 799,653 | |
FHLMC Gold 15 Year, 5.00%, 12/01/17 - 9/01/19 | | United States | | | 992,106 | | | | 1,067,544 | |
FHLMC Gold 15 Year, 5.50%, 7/01/17 - 7/01/19 | | United States | | | 244,341 | | | | 264,961 | |
FHLMC Gold 15 Year, 6.00%, 5/01/17 | | United States | | | 9,614 | | | | 10,407 | |
FHLMC Gold 15 Year, 6.50%, 5/01/16 | | United States | | | 2,264 | | | | 2,404 | |
FHLMC Gold 30 Year, 3.00%, 11/01/42 | | United States | | | 2,897,092 | | | | 3,032,635 | |
FHLMC Gold 30 Year, 3.50%, 4/01/42 | | United States | | | 192,531 | | | | 204,955 | |
FHLMC Gold 30 Year, 4.00%, 9/01/40 | | United States | | | 1,494,925 | | | | 1,597,786 | |
FHLMC Gold 30 Year, 4.50%, 10/01/40 | | United States | | | 2,232,411 | | | | 2,404,651 | |
FHLMC Gold 30 Year, 5.00%, 4/01/34 - 8/01/35 | | United States | | | 822,534 | | | | 889,090 | |
FHLMC Gold 30 Year, 5.50%, 3/01/33 - 6/01/36 | | United States | | | 2,479,656 | | | | 2,721,244 | |
FHLMC Gold 30 Year, 6.00%, 4/01/33 - 2/01/36 | | United States | | | 696,663 | | | | 769,777 | |
FHLMC Gold 30 Year, 6.50%, 12/01/23 - 6/01/36 | | United States | | | 131,223 | | | | 149,607 | |
FHLMC Gold 30 Year, 7.00%, 9/01/21 - 4/01/30 | | United States | | | 53,441 | | | | 62,002 | |
FHLMC Gold 30 Year, 7.50%, 3/01/30 - 7/01/31 | | United States | | | 1,733 | | | | 1,886 | |
| | | | | | | | | | |
| | | | | | | | | 13,978,602 | |
| | | | | | | | | | |
k Federal National Mortgage Association (FNMA) Adjustable Rate 0.0%† | | | | | | | | | | |
FNMA, 2.33%, 4/01/20 | | United States | | | 54,785 | | | | 56,498 | |
FNMA, 2.332%, 12/01/34 | | United States | | | 253,358 | | | | 270,091 | |
| | | | | | | | | | |
| | | | | | | | | 326,589 | |
| | | | | | | | | | |
Federal National Mortgage Association (FNMA) Fixed Rate 4.8% | | | | | | | | | | |
FNMA 15 Year, 2.50%, 6/01/27 - 11/01/27 | | United States | | | 7,140,562 | | | | 7,474,532 | |
FNMA 15 Year, 3.00%, 3/01/22 | | United States | | | 2,234,140 | | | | 2,359,881 | |
m FNMA 15 Year, 3.50%, 1/01/27 | | United States | | | 1,750,000 | | | | 1,856,914 | |
m FNMA 15 Year, 4.00%, 1/01/27 | | United States | | | 1,750,000 | | | | 1,874,414 | |
FNMA 15 Year, 4.50%, 6/01/19 - 3/01/20 | | United States | | | 200,599 | | | | 216,350 | |
FNMA 15 Year, 5.00%, 10/01/17 - 6/01/18 | | United States | | | 205,724 | | | | 223,600 | |
FNMA 15 Year, 5.50%, 11/01/13 - 11/01/18 | | United States | | | 1,699,586 | | | | 1,825,225 | |
FNMA 15 Year, 6.00%, 4/01/16 - 7/01/16 | | United States | | | 3,423 | | | | 3,639 | |
m FNMA 30 Year, 3.00%, 10/01/42 - 1/01/43 | | United States | | | 15,149,706 | | | | 15,892,583 | |
FNMA 30 Year, 3.50%, 9/01/42 | | United States | | | 746,545 | | | | 798,426 | |
FNMA 30 Year, 4.00%, 11/01/40 - 1/01/41 | | United States | | | 2,482,972 | | | | 2,665,150 | |
FNMA 30 Year, 4.50%, 12/01/40 | | United States | | | 4,351,537 | | | | 4,717,076 | |
FNMA 30 Year, 5.00%, 4/01/30 - 6/01/41 | | United States | | | 19,192,892 | | | | 20,867,561 | |
FNMA 30 Year, 5.50%, 8/01/33 - 9/01/35 | | United States | | | 1,285,373 | | | | 1,408,142 | |
FNMA 30 Year, 6.00%, 6/01/34 - 5/01/38 | | United States | | | 1,913,438 | | | | 2,109,549 | |
FNMA 30 Year, 6.50%, 6/01/28 - 10/01/37 | | United States | | | 933,078 | | | | 1,049,708 | |
| | | | | | | | | | |
| | | | | | | | | 65,342,750 | |
| | | | | | | | | | |
Government National Mortgage Association (GNMA) Fixed Rate 0.2% | | | | | | | | | | |
GNMA I SF 30 Year, 5.00%, 11/15/33 - 7/15/34 | | United States | | | 758,947 | | | | 834,611 | |
GNMA I SF 30 Year, 5.50%, 12/15/32 - 6/15/36 | | United States | | | 886,663 | | | | 979,168 | |
GNMA I SF 30 Year, 6.50%, 11/15/31 - 2/15/32 | | United States | | | 4,007 | | | | 4,757 | |
GNMA I SF 30 Year, 7.00%, 10/15/28 - 6/15/32 | | United States | | | 42,951 | | | | 51,466 | |
GNMA I SF 30 Year, 7.50%, 9/15/30 | | United States | | | 1,933 | | | | 2,371 | |
GNMA II SF 30 Year, 5.00%, 9/20/33 - 11/20/33 | | United States | | | 213,182 | | | | 234,909 | |
GNMA II SF 30 Year, 6.00%, 11/20/34 | | United States | | | 253,113 | | | | 284,775 | |
GNMA II SF 30 Year, 6.50%, 4/20/31 - 2/20/34 | | United States | | | 102,063 | | | | 117,290 | |
FSI-29
Franklin Templeton Variable Insurance Products Trust
Statement of Investments, December 31, 2012 (continued)
| | | | | | | | | | |
| Franklin Strategic Income Securities Fund | | Country | | Principal
Amount* | | | Value | |
Mortgage-Backed Securities (continued) | | | | | | | | | | |
Government National Mortgage Association (GNMA) Fixed Rate (continued) | | | | | | | | | | |
GNMA II SF 30 Year, 7.50%, 1/20/28 - 4/20/32 | | United States | | | 22,195 | | | $ | 27,185 | |
| | | | | | | | | | |
| | | | | | | | | 2,536,532 | |
| | | | | | | | | | |
Total Mortgage-Backed Securities (Cost $80,673,342) | | | | | | | | | 82,262,100 | |
| | | | | | | | | | |
Municipal Bonds 1.9% | | | | | | | | | | |
California State GO, | | | | | | | | | | |
Refunding, 5.00%, 4/01/38 | | United States | | | 7,000,000 | | | | 7,752,849 | |
Various Purpose, 6.00%, 4/01/38 | | United States | | | 2,500,000 | | | | 2,996,250 | |
Various Purpose, 6.00%, 11/01/39 | | United States | | | 160,000 | | | | 194,819 | |
Various Purpose, 5.25%, 11/01/40 | | United States | | | 560,000 | | | | 651,515 | |
Various Purpose, Refunding, 5.25%, 3/01/38 | | United States | | | 1,500,000 | | | | 1,688,370 | |
Various Purpose, Refunding, NATL Insured, 4.50%, 12/01/32 | | United States | | | 300,000 | | | | 323,364 | |
Various Purpose, Refunding, Series 1, AGMC Insured, 4.75%, 9/01/31 | | United States | | | 290,000 | | | | 311,425 | |
Illinois State GO, | | | | | | | | | | |
5.877%, 3/01/19 | | United States | | | 3,575,000 | | | | 4,118,865 | |
Build America Bonds, 7.35%, 7/01/35 | | United States | | | 3,000,000 | | | | 3,632,130 | |
Redondo Beach USD, GO, Build America Bonds, Election of 2008, Direct Payment to District, Series D, 6.461%, 8/01/40 | | United States | | | 1,510,000 | | | | 1,639,694 | |
Sonoma County Pension Obligation Revenue, Series A, 6.00%, 12/01/29 | | United States | | | 2,100,000 | | | | 2,345,511 | |
| | | | | | | | | | |
Total Municipal Bonds (Cost $22,148,562) | | | | | | | | | 25,654,792 | |
| | | | | | | | | | |
Total Investments before Short Term Investments
(Cost $1,131,994,076) | | | | | | | | | 1,195,856,697 | |
| | | | | | | | | | |
Short Term Investments 13.1% | | | | | | | | | | |
Foreign Government and Agency Securities 4.0% | | | | | | | | | | |
r Bank of Negara Monetary Note, 1/10/13 - 12/12/13 | | Malaysia | | | 58,815,000 | MYR | | | 19,007,920 | |
Government of Singapore, senior bond, 1.625%, 4/01/13 | | Singapore | | | 2,400,000 | SGD | | | 1,971,399 | |
Korea Monetary Stabilization Bond, | | | | | | | | | | |
senior bond, 3.38%, 5/09/13 | | South Korea | | | 4,420,000,000 | KRW | | | 4,164,368 | |
senior note, 3.83%, 4/02/13 | | South Korea | | | 441,970,000 | KRW | | | 416,623 | |
senior note, 3.28%, 6/09/13 | | South Korea | | | 4,397,300,000 | KRW | | | 4,143,155 | |
r Malaysia Treasury Bills, 1/25/13 - 6/28/13 | | Malaysia | | | 5,900,000 | MYR | | | 1,902,993 | |
r Mexican Cetes Treasury Bill, 9/19/13 | | Mexico | | | 325,000 | MXN | | | 244,796 | |
r Philippine Treasury Bills, 2/20/13 - 11/13/13 | | Philippines | | | 239,680,000 | PHP | | | 5,823,608 | |
r Singapore Treasury Bills, 1/10/13 - 11/01/13 | | Singapore | | | 12,310,000 | SGD | | | 10,074,879 | |
r Sri Lanka Treasury Bills, 8/02/13 - 10/11/13 | | Sri Lanka | | | 3,260,000 | LKR | | | 23,784 | |
r Sweden Treasury Bills, 3/20/13 - 6/19/13 | | Sweden | | | 19,410,000 | SEK | | | 2,976,593 | |
Uruguay Treasury Bills, | | | | | | | | | | |
r 8/09/13 | | Uruguay | | | 16,070,000 | UYU | | | 795,100 | |
Strip, 9/09/13 | | Uruguay | | | 58,400,000 | UYU | | | 2,861,914 | |
| | | | | | | | | | |
Total Foreign Government and Agency Securities
(Cost $52,597,129) | | | | | | | | | 54,407,132 | |
| | | | | | | | | | |
Total Investments before Money Market Funds
(Cost $1,184,591,205) | | | | | | | | | 1,250,263,829 | |
| | | | | | | | | | |
FSI-30
Franklin Templeton Variable Insurance Products Trust
Statement of Investments, December 31, 2012 (continued)
| | | | | | | | | | |
| Franklin Strategic Income Securities Fund | | Country | | Shares | | | Value | |
Money Market Funds (Cost $125,449,996) 9.1% | | | | | | | | | | |
a,s Institutional Fiduciary Trust Money Market Portfolio | | United States | | | 125,449,996 | | | $ | 125,449,996 | |
| | | | | | | | | | |
Total Investments (Cost $1,310,041,201) 100.1% | | | | | | | | | 1,375,713,825 | |
Other Assets, less Liabilities (0.1)% | | | | | | | | | (1,247,144 | ) |
| | | | | | | | | | |
Net Assets 100.0% | | | | | | | | $ | 1,374,466,681 | |
| | | | | | | | | | |
See Abbreviations on page FSI-51.
†Rounds to less than 0.1% of net assets.
*The principal amount is stated in U.S. dollars unless otherwise indicated.
aNon-income producing.
bSecurity has been deemed illiquid because it may not be able to be sold within seven days.
cSee Note 1(g) regarding investment in FT Holdings Corporation III.
dAt December 31, 2012, pursuant to the Fund’s policies and the requirements of applicable securities law, the Fund may be restricted from trading these securities for a limited or extended period of time due to ownership limits and/or potential possession of material non-public information.
eSee Note 9 regarding restricted securities.
fSecurity was purchased pursuant to Rule 144A under the Securities Act of 1933 and may be sold in transactions exempt from registration only to qualified institutional buyers or in a public offering registered under the Securities Act of 1933. These securities have been deemed liquid under guidelines approved by the Trust’s Board of Trustees. At December 31, 2012, the aggregate value of these securities was $228,960,011, representing 16.66% of net assets.
gSee Note 8 regarding defaulted securities.
hPerpetual security with no stated maturity date.
iSee Note 1(f) regarding loan participation notes.
jIncome may be received in additional securities and/or cash.
kThe coupon rate shown represents the rate at period end.
lSee Note 1(i) regarding senior floating rate interests.
mA portion or all of the security purchased on a delayed delivery or to-be-announced (TBA) basis. See Note 1(c).
nPrincipal amount is stated in 100 Mexican Peso Units.
oPrincipal amount of security is adjusted for inflation. See Note 1(k).
pPrincipal amount is stated in 1,000 Brazilian Real Units.
qRedemption price at maturity is adjusted for inflation. See Note 1(k).
rThe security is traded on a discount basis with no stated coupon rate.
sSee Note 7 regarding investments in the Institutional Fiduciary Trust Money Market Portfolio.
FSI-31
Franklin Templeton Variable Insurance Products Trust
Statement of Investments, December 31, 2012 (continued)
| | | | | | |
| Franklin Strategic Income Securities Fund | | | | | | |
At December 31, 2012, the Fund had the following forward exchange contracts outstanding. See Note 1(d).
Forward Exchange Contracts
| | | | | | | | | | | | | | | | | | | | | | | | | | | | |
| Currency | | Counterparty | | | Type | | | Quantity | | | Contract
Amount | | | Settlement
Date | | | Unrealized
Appreciation | | | Unrealized
Depreciation | |
Euro | | | DBAB | | | | Sell | | | | 239,450 | | | $ | 305,897 | | | | 1/03/13 | | | $ | — | | | $ | (10,089 | ) |
Euro | | | DBAB | | | | Buy | | | | 239,450 | | | | 316,194 | | | | 1/03/13 | | | | — | | | | (207 | ) |
Philippine Peso | | | DBAB | | | | Buy | | | | 12,562,000 | | | | 301,899 | | | | 1/07/13 | | | | 4,079 | | | | — | |
Chilean Peso | | | DBAB | | | | Sell | | | | 1,000,000,000 | | | | 1,969,859 | | | | 1/10/13 | | | | — | | | | (116,038 | ) |
Chilean Peso | | | DBAB | | | | Buy | | | | 2,449,000,000 | | | | 4,646,177 | | | | 1/10/13 | | | | 462,185 | | | | — | |
Indian Rupee | | | HSBC | | | | Buy | | | | 94,400,000 | | | | 1,702,318 | | | | 1/10/13 | | | | 14,618 | | | | — | |
Japanese Yen | | | HSBC | | | | Sell | | | | 183,560,000 | | | | 2,402,932 | | | | 1/10/13 | | | | 286,909 | | | | — | |
Euro | | | UBSW | | | | Sell | | | | 3,940,000 | | | | 5,039,654 | | | | 1/11/13 | | | | — | | | | (160,090 | ) |
Euro | | | BZWS | | | | Sell | | | | 1,691,484 | | | | 2,164,339 | | | | 1/11/13 | | | | — | | | | (67,967 | ) |
Euro | | | JPHQ | | | | Sell | | | | 1,802,953 | | | | 2,299,576 | | | | 1/14/13 | | | | — | | | | (79,903 | ) |
Euro | | | DBAB | | | | Sell | | | | 2,187,000 | | | | 2,808,327 | | | | 1/14/13 | | | | — | | | | (78,006 | ) |
Euro | | | DBAB | | | | Buy | | | | 321,959 | | | | 416,551 | | | | 1/14/13 | | | | 8,361 | | | | — | |
Japanese Yen | | | BZWS | | | | Sell | | | | 460,675,000 | | | | 6,026,228 | | | | 1/15/13 | | | | 715,481 | | | | — | |
Philippine Peso | | | JPHQ | | | | Buy | | | | 2,317,000 | | | | 55,861 | | | | 1/15/13 | | | | 582 | | | | — | |
Indian Rupee | | | JPHQ | | | | Buy | | | | 192,280,000 | | | | 3,606,152 | | | | 1/16/13 | | | | — | | | | (113,433 | ) |
Euro | | | DBAB | | | | Sell | | | | 252,750 | | | | 330,243 | | | | 1/17/13 | | | | — | | | | (3,337 | ) |
Euro | | | DBAB | | | | Buy | | | | 212,200 | | | | 273,993 | | | | 1/17/13 | | | | 6,070 | | | | — | |
Euro | | | BZWS | | | | Sell | | | | 2,912,410 | | | | 3,716,235 | | | | 1/22/13 | | | | — | | | | (127,750 | ) |
Euro | | | DBAB | | | | Sell | | | | 186,978 | | | | 238,990 | | | | 1/22/13 | | | | — | | | | (7,796 | ) |
Japanese Yen | | | DBAB | | | | Buy | | | | 271,680,000 | | | | 3,466,810 | | | | 1/22/13 | | | | — | | | | (334,646 | ) |
Japanese Yen | | | DBAB | | | | Sell | | | | 271,680,000 | | | | 3,556,021 | | | | 1/22/13 | | | | 423,857 | | | | — | |
Euro | | | DBAB | | | | Sell | | | | 465,260 | | | | 603,675 | | | | 1/24/13 | | | | — | | | | (10,416 | ) |
Euro | | | DBAB | | | | Sell | | | | 3,774,662 | | | | 4,908,633 | | | | 1/28/13 | | | | — | | | | (73,679 | ) |
Euro | | | BZWS | | | | Sell | | | | 1,007,118 | | | | 1,313,231 | | | | 1/28/13 | | | | — | | | | (16,100 | ) |
Euro | | | DBAB | | | | Buy | | | | 572,313 | | | | 758,114 | | | | 1/28/13 | | | | — | | | | (2,698 | ) |
Euro | | | DBAB | | | | Buy | | | | 3,177,772 | | | | 4,098,910 | | | | 1/28/13 | | | | 95,546 | | | | — | |
Indian Rupee | | | JPHQ | | | | Buy | | | | 54,590,000 | | | | 1,000,000 | | | | 1/29/13 | | | | — | | | | (11,110 | ) |
Euro | | | DBAB | | | | Sell | | | | 4,032,721 | | | | 5,311,900 | | | | 1/30/13 | | | | — | | | | (11,130 | ) |
Euro | | | DBAB | | | | Sell | | | | 3,014,151 | | | | 3,960,293 | | | | 1/31/13 | | | | — | | | | (18,299 | ) |
Chilean Peso | | | DBAB | | | | Buy | | | | 725,000,000 | | | | 1,434,167 | | | | 2/07/13 | | | | 72,222 | | | | — | |
Chilean Peso | | | JPHQ | | | | Buy | | | | 482,900,000 | | | | 958,325 | | | | 2/08/13 | | | | 44,911 | | | | — | |
Indian Rupee | | | HSBC | | | | Buy | | | | 186,760,000 | | | | 3,668,507 | | | | 2/08/13 | | | | — | | | | (291,139 | ) |
Chilean Peso | | | BZWS | | | | Buy | | | | 1,487,300,000 | | | | 2,958,623 | | | | 2/11/13 | | | | 130,137 | | | | — | |
Euro | | | UBSW | | | | Sell | | | | 2,151,000 | | | | 2,862,400 | | | | 2/13/13 | | | | 22,831 | | | | — | |
Singapore Dollar | | | DBAB | | | | Buy | | | | 578,000 | | | | 462,289 | | | | 2/25/13 | | | | 10,902 | | | | — | |
Japanese Yen | | | BZWS | | | | Sell | | | | 37,600,000 | | | | 480,327 | | | | 2/27/13 | | | | 46,723 | | | | — | |
Singapore Dollar | | | DBAB | | | | Buy | | | | 361,500 | | | | 288,301 | | | | 2/28/13 | | | | 7,648 | | | | — | |
Euro | | | UBSW | | | | Sell | | | | 2,581,000 | | | | 3,478,156 | | | | 3/01/13 | | | | 70,477 | | | | — | |
Japanese Yen | | | JPHQ | | | | Sell | | | | 85,800,000 | | | | 1,073,842 | | | | 3/01/13 | | | | 84,379 | | | | — | |
Japanese Yen | | | HSBC | | | | Sell | | | | 85,800,000 | | | | 1,073,070 | | | | 3/01/13 | | | | 83,607 | | | | — | |
Euro | | | DBAB | | | | Sell | | | | 5,979,967 | | | | 8,000,000 | | | | 3/04/13 | | | | 104,464 | | | | — | |
Indian Rupee | | | HSBC | | | | Buy | | | | 32,771,000 | | | | 592,320 | | | | 3/04/13 | | | | — | | | | (2,064 | ) |
Japanese Yen | | | UBSW | | | | Sell | | | | 95,700,000 | | | | 1,194,048 | | | | 3/04/13 | | | | 90,388 | | | | — | |
Japanese Yen | | | DBAB | | | | Sell | | | | 257,790,000 | | | | 3,153,395 | | | | 3/04/13 | | | | 180,430 | | | | — | |
Indian Rupee | | | HSBC | | | | Buy | | | | 5,576,000 | | | | 100,950 | | | | 3/11/13 | | | | — | | | | (645 | ) |
Indian Rupee | | | HSBC | | | | Buy | | | | 14,080,000 | | | | 255,600 | | | | 3/13/13 | | | | — | | | | (2,408 | ) |
Euro | | | DBAB | | | | Sell | | | | 324,000 | | | | 424,084 | | | | 3/18/13 | | | | — | | | | (3,760 | ) |
Indian Rupee | | | DBAB | | | | Buy | | | | 14,156,000 | | | | 256,505 | | | | 3/18/13 | | | | — | | | | (2,175 | ) |
Singapore Dollar | | | JPHQ | | | | Buy | | | | 700,000 | | | | 573,395 | | | | 3/19/13 | | | | — | | | | (322 | ) |
FSI-32
Franklin Templeton Variable Insurance Products Trust
Statement of Investments, December 31, 2012 (continued)
| | | | | | | | | | | | | | |
| Franklin Strategic Income Securities Fund |
Forward Exchange Contracts (continued)
| | | | | | | | | | | | | | | | | | | | | | | | | | | | |
Currency | | Counterparty | | | Type | | | Quantity | | | Contract
Amount | | | Settlement
Date | | | Unrealized
Appreciation | | | Unrealized
Depreciation | |
Singapore Dollar | | | DBAB | | | | Buy | | | | 973,400 | | | $ | 768,696 | | | | 3/19/13 | | | $ | 28,202 | | | $ | — | |
Singapore Dollar | | | HSBC | | | | Buy | | | | 1,113,000 | | | | 880,747 | | | | 3/19/13 | | | | 30,438 | | | | — | |
Indian Rupee | | | DBAB | | | | Buy | | | | 12,894,000 | | | | 231,786 | | | | 3/20/13 | | | | — | | | | (212 | ) |
Indian Rupee | | | JPHQ | | | | Buy | | | | 55,600,000 | | | | 1,000,000 | | | | 3/21/13 | | | | — | | | | (1,616 | ) |
Singapore Dollar | | | DBAB | | | | Buy | | | | 1,048,000 | | | | 835,592 | | | | 3/21/13 | | | | 22,380 | | | | — | |
Singapore Dollar | | | HSBC | | | | Buy | | | | 837,000 | | | | 667,251 | | | | 3/21/13 | | | | 17,980 | | | | — | |
Euro | | | DBAB | | | | Sell | | | | 333,108 | | | | 440,136 | | | | 3/26/13 | | | | 232 | | | | — | |
Euro | | | DBAB | | | | Sell | | | | 7,647,393 | | | | 10,159,601 | | | | 4/02/13 | | | | 59,755 | | | | — | |
Euro | | | DBAB | | | | Sell | | | | 222,456 | | | | 297,469 | | | | 4/03/13 | | | | 3,670 | | | | — | |
Indian Rupee | | | HSBC | | | | Buy | | | | 108,100,000 | | | | 2,000,000 | | | | 4/03/13 | | | | — | | | | (63,363 | ) |
Euro | | | BZWS | | | | Sell | | | | 132,570 | | | | 176,948 | | | | 4/05/13 | | | | 1,859 | | | | — | |
Philippine Peso | | | DBAB | | | | Buy | | | | 12,557,000 | | | | 302,149 | | | | 4/05/13 | | | | 3,677 | | | | — | |
Philippine Peso | | | DBAB | | | | Buy | | | | 20,621,000 | | | | 496,999 | | | | 4/10/13 | | | | 5,173 | | | | — | |
Philippine Peso | | | JPHQ | | | | Buy | | | | 6,636,000 | | | | 159,919 | | | | 4/10/13 | | | | 1,684 | | | | — | |
British Pound | | | DBAB | | | | Sell | | | | 456,285 | | | | 720,246 | | | | 4/11/13 | | | | — | | | | (20,969 | ) |
British Pound | | | DBAB | | | | Buy | | | | 456,285 | | | | 738,725 | | | | 4/11/13 | | | | 2,489 | | | | — | |
Euro | | | DBAB | | | | Sell | | | | 949,814 | | | | 1,251,011 | | | | 4/11/13 | | | | — | | | | (3,511 | ) |
Philippine Peso | | | HSBC | | | | Buy | | | | 10,293,000 | | | | 247,779 | | | | 4/11/13 | | | | 2,875 | | | | — | |
Indian Rupee | | | DBAB | | | | Buy | | | | 20,841,000 | | | | 383,696 | | | | 4/12/13 | | | | — | | | | (10,894 | ) |
Chilean Peso | | | MSCO | | | | Buy | | | | 116,230,000 | | | | 229,138 | | | | 4/15/13 | | | | 10,254 | | | | — | |
Indian Rupee | | | DBAB | | | | Buy | | | | 44,691,000 | | | | 817,214 | | | | 4/15/13 | | | | — | | | | (18,192 | ) |
Indian Rupee | | | DBAB | | | | Sell | | | | 28,000,000 | | | | 486,280 | | | | 4/15/13 | | | | — | | | | (14,327 | ) |
Philippine Peso | | | HSBC | | | | Buy | | | | 8,192,000 | | | | 197,502 | | | | 4/15/13 | | | | 1,972 | | | | — | |
Euro | | | HSBC | | | | Sell | | | | 142,717 | | | | 188,818 | | | | 4/16/13 | | | | 307 | | | | — | |
Indian Rupee | | | JPHQ | | | | Buy | | | | 30,019,000 | | | | 550,585 | | | | 4/16/13 | | | | — | | | | (13,971 | ) |
Indian Rupee | | | JPHQ | | | | Buy | | | | 29,466,000 | | | | 538,595 | | | | 4/18/13 | | | | — | | | | (12,045 | ) |
Chilean Peso | | | MSCO | | | | Buy | | | | 104,150,000 | | | | 205,505 | | | | 4/19/13 | | | | 8,887 | | | | — | |
Euro | | | BZWS | | | | Sell | | | | 130,134 | | | | 171,152 | | | | 4/19/13 | | | | — | | | | (743 | ) |
Indian Rupee | | | JPHQ | | | | Buy | | | | 14,719,000 | | | | 269,695 | | | | 4/22/13 | | | | — | | | | (6,848 | ) |
Indian Rupee | | | DBAB | | | | Buy | | | | 10,360,000 | | | | 189,582 | | | | 4/22/13 | | | | — | | | | (4,577 | ) |
Euro | | | JPHQ | | | | Sell | | | | 36,314 | | | | 48,058 | | | | 4/23/13 | | | | 88 | | | | — | |
Euro | | | BZWS | | | | Sell | | | | 1,659,340 | | | | 2,160,809 | | | | 4/25/13 | | | | — | | | | (31,161 | ) |
Indian Rupee | | | DBAB | | | | Buy | | | | 20,931,000 | | | | 373,361 | | | | 4/26/13 | | | | 165 | | | | — | |
Chilean Peso | | | JPHQ | | | | Buy | | | | 234,301,000 | | | | 462,680 | | | | 4/29/13 | | | | 18,958 | | | | — | |
Chilean Peso | | | CITI | | | | Buy | | | | 377,668,000 | | | | 747,857 | | | | 4/29/13 | | | | 28,490 | | | | — | |
Indian Rupee | | | JPHQ | | | | Buy | | | | 17,801,000 | | | | 319,386 | | | | 4/29/13 | | | | — | | | | (1,878 | ) |
Euro | | | DBAB | | | | Sell | | | | 753,750 | | | | 1,000,000 | | | | 4/30/13 | | | | 4,256 | | | | — | |
Euro | | | BZWS | | | | Sell | | | | 91,515 | | | | 121,559 | | | | 4/30/13 | | | | 663 | | | | — | |
Indian Rupee | | | JPHQ | | | | Buy | | | | 14,829,000 | | | | 265,529 | | | | 4/30/13 | | | | — | | | | (1,076 | ) |
Singapore Dollar | | | DBAB | | | | Buy | | | | 6,168,500 | | | | 5,059,963 | | | | 4/30/13 | | | | — | | | | (9,832 | ) |
British Pound | | | DBAB | | | | Sell | | | | 453,906 | | | | 732,877 | | | | 5/02/13 | | | | — | | | | (4,415 | ) |
British Pound | | | DBAB | | | | Buy | | | | 230,355 | | | | 370,520 | | | | 5/02/13 | | | | 3,652 | | | | — | |
Euro | | | DBAB | | | | Sell | | | | 71,000 | | | | 93,003 | | | | 5/02/13 | | | | — | | | | (794 | ) |
Philippine Peso | | | JPHQ | | | | Buy | | | | 91,360,000 | | | | 2,144,953 | | | | 5/06/13 | | | | 78,675 | | | | — | |
Chilean Peso | | | DBAB | | | | Buy | | | | 574,000,000 | | | | 1,134,051 | | | | 5/08/13 | | | | 44,412 | | | | — | |
Singapore Dollar | | | DBAB | | | | Buy | | | | 3,707,640 | | | | 2,984,016 | | | | 5/10/13 | | | | 51,439 | | | | — | |
Euro | | | DBAB | | | | Sell | | | | 429,000 | | | | 557,357 | | | | 5/13/13 | | | | — | | | | (9,448 | ) |
British Pound | | | DBAB | | | | Sell | | | | 2,287,500 | | | | 3,654,968 | | | | 5/17/13 | | | | — | | | | (60,468 | ) |
British Pound | | | DBAB | | | | Buy | | | | 2,157,182 | | | | 3,433,090 | | | | 5/17/13 | | | | 70,680 | | | | — | |
Euro | | | JPHQ | | | | Sell | | | | 201,376 | | | | 258,322 | | | | 5/23/13 | | | | — | | | | (7,766 | ) |
Euro | | | DBAB | | | | Sell | | | | 1,053,792 | | | | 1,310,844 | | | | 6/05/13 | | | | — | | | | (81,764 | ) |
FSI-33
Franklin Templeton Variable Insurance Products Trust
Statement of Investments, December 31, 2012 (continued)
|
| Franklin Strategic Income Securities Fund |
Forward Exchange Contracts (continued)
| | | | | | | | | | | | | | | | | | | | | | | | | | | | |
Currency | | Counterparty | | | Type | | | Quantity | | | Contract
Amount | | | Settlement
Date | | | Unrealized
Appreciation | | | Unrealized
Depreciation | |
Singapore Dollar | | | JPHQ | | | | Buy | | | | 4,945,200 | | | $ | 4,052,446 | | | | 6/05/13 | | | $ | — | | | $ | (3,720 | ) |
Euro | | | UBSW | | | | Sell | | | | 4,274,000 | | | | 5,354,467 | | | | 6/28/13 | | | | — | | | | (294,985 | ) |
Euro | | | DBAB | | | | Sell | | | | 320,700 | | | | 402,767 | | | | 6/28/13 | | | | — | | | | (21,140 | ) |
Japanese Yen | | | BZWS | | | | Sell | | | | 620,288,000 | | | | 7,871,176 | | | | 7/02/13 | | | | 710,321 | | | | — | |
British Pound | | | DBAB | | | | Sell | | | | 297,656 | | | | 461,665 | | | | 7/09/13 | | | | — | | | | (21,702 | ) |
Euro | | | DBAB | | | | Sell | | | | 478,724 | | | | 590,553 | | | | 7/23/13 | | | | — | | | | (42,403 | ) |
Euro | | | DBAB | | | | Sell | | | | 218,913 | | | | 267,380 | | | | 7/25/13 | | | | — | | | | (22,067 | ) |
Euro | | | BZWS | | | | Sell | | | | 1,993,000 | | | | 2,589,505 | | | | 7/26/13 | | | | — | | | | (45,678 | ) |
Euro | | | DBAB | | | | Sell | | | | 190,862 | | | | 231,697 | | | | 7/26/13 | | | | — | | | | (20,665 | ) |
Euro | | | CITI | | | | Sell | | | | 648,569 | | | | 841,907 | | | | 7/26/13 | | | | — | | | | (15,643 | ) |
Euro | | | DBAB | | | | Sell | | | | 3,280,000 | | | | 3,997,336 | | | | 7/29/13 | | | | — | | | | (339,685 | ) |
Euro | | | DBAB | | | | Sell | | | | 870,275 | | | | 1,077,313 | | | | 7/31/13 | | | | — | | | | (73,443 | ) |
British Pound | | | DBAB | | | | Sell | | | | 169,385 | | | | 264,765 | | | | 8/01/13 | | | | — | | | | (10,277 | ) |
Euro | | | JPHQ | | | | Sell | | | | 667,276 | | | | 815,828 | | | | 8/06/13 | | | | — | | | | (66,562 | ) |
Euro | | | CITI | | | | Sell | | | | 317,220 | | | | 395,948 | | | | 8/08/13 | | | | — | | | | (23,546 | ) |
Euro | | | CITI | | | | Sell | | | | 92,411 | | | | 115,487 | | | | 8/09/13 | | | | — | | | | (6,719 | ) |
Japanese Yen | | | DBAB | | | | Sell | | | | 35,465,000 | | | | 452,961 | | | | 8/19/13 | | | | 43,331 | | | | — | |
Chilean Peso | | | JPHQ | | | | Buy | | | | 1,141,336,600 | | | | 2,278,117 | | | | 8/20/13 | | | | 34,406 | | | | — | |
Euro | | | BZWS | | | | Sell | | | | 2,084,000 | | | | 2,579,784 | | | | 8/20/13 | | | | — | | | | (176,470 | ) |
Japanese Yen | | | JPHQ | | | | Sell | | | | 15,928,000 | | | | 201,793 | | | | 8/20/13 | | | | 17,818 | | | | — | |
Japanese Yen | | | HSBC | | | | Sell | | | | 65,957,000 | | | | 835,957 | | | | 8/20/13 | | | | 74,129 | | | | — | |
Japanese Yen | | | UBSW | | | | Sell | | | | 32,055,000 | | | | 407,125 | | | | 8/20/13 | | | | 36,878 | | | | — | |
Euro | | | DBAB | | | | Sell | | | | 193,056 | | | | 238,881 | | | | 8/21/13 | | | | — | | | | (16,453 | ) |
Euro | | | UBSW | | | | Sell | | | | 3,500,000 | | | | 4,331,775 | | | | 8/22/13 | | | | — | | | | (297,350 | ) |
Japanese Yen | | | BZWS | | | | Sell | | | | 15,895,000 | | | | 201,075 | | | | 8/22/13 | | | | 17,478 | | | | — | |
Euro | | | BZWS | | | | Sell | | | | 704,462 | | | | 882,127 | | | | 8/23/13 | | | | — | | | | (49,609 | ) |
Japanese Yen | | | DBAB | | | | Buy | | | | 15,708,000 | | | | 201,147 | | | | 8/23/13 | | | | — | | | | (19,708 | ) |
Japanese Yen | | | CITI | | | | Sell | | | | 31,757,000 | | | | 401,758 | | | | 8/23/13 | | | | 34,942 | | | | — | |
Japanese Yen | | | DBAB | | | | Sell | | | | 15,708,000 | | | | 198,848 | | | | 8/23/13 | | | | 17,409 | | | | — | |
Japanese Yen | | | HSBC | | | | Sell | | | | 31,524,000 | | | | 399,250 | | | | 8/23/13 | | | | 35,125 | | | | — | |
Euro | | | BZWS | | | | Sell | | | | 3,068,753 | | | | 3,844,657 | | | | 8/26/13 | | | | — | | | | (214,275 | ) |
Euro | | | UBSW | | | | Sell | | | | 2,397,698 | | | | 3,000,000 | | | | 8/26/13 | | | | — | | | | (171,351 | ) |
Japanese Yen | | | JPHQ | | | | Sell | | | | 31,689,000 | | | | 401,992 | | | | 8/26/13 | | | | 35,949 | | | | — | |
Japanese Yen | | | UBSW | | | | Sell | | | | 34,903,000 | | | | 442,426 | | | | 8/26/13 | | | | 39,258 | | | | — | |
Japanese Yen | | | BZWS | | | | Sell | | | | 44,152,000 | | | | 560,376 | | | | 8/26/13 | | | | 50,371 | | | | — | |
Singapore Dollar | | | DBAB | | | | Buy | | | | 580,000 | | | | 464,595 | | | | 8/26/13 | | | | 10,270 | | | | — | |
Euro | | | DBAB | | | | Sell | | | | 810,000 | | | | 1,024,091 | | | | 8/27/13 | | | | — | | | | (47,279 | ) |
Japanese Yen | | | DBAB | | | | Buy | | | | 44,915,000 | | | | 575,059 | | | | 8/27/13 | | | | — | | | | (56,236 | ) |
Japanese Yen | | | JPHQ | | | | Sell | | | | 15,991,000 | | | | 204,547 | | | | 8/27/13 | | | | 19,832 | | | | — | |
Japanese Yen | | | HSBC | | | | Sell | | | | 50,145,000 | | | | 641,240 | | | | 8/27/13 | | | | 62,004 | | | | — | |
Japanese Yen | | | DBAB | | | | Sell | | | | 72,099,000 | | | | 921,699 | | | | 8/27/13 | | | | 88,868 | | | | — | |
Singapore Dollar | | | DBAB | | | | Buy | | | | 722,000 | | | | 581,742 | | | | 8/27/13 | | | | 9,383 | | | | — | |
Euro | | | DBAB | | | | Sell | | | | 1,978,657 | | | | 2,487,970 | | | | 8/28/13 | | | | — | | | | (129,187 | ) |
Euro | | | DBAB | | | | Sell | | | | 651,325 | | | | 823,796 | | | | 8/29/13 | | | | — | | | | (37,717 | ) |
Japanese Yen | | | JPHQ | | | | Sell | | | | 15,743,000 | | | | 201,079 | | | | 8/30/13 | | | | 19,223 | | | | — | |
Singapore Dollar | | | DBAB | | | | Buy | | | | 361,500 | | | | 289,269 | | | | 8/30/13 | | | | 6,702 | | | | — | |
Euro | | | DBAB | | | | Sell | | | | 601,984 | | | | 760,606 | | | | 9/04/13 | | | | — | | | | (35,694 | ) |
Euro | | | BZWS | | | | Sell | | | | 271,320 | | | | 343,478 | | | | 9/10/13 | | | | — | | | | (15,446 | ) |
Euro | | | BZWS | | | | Sell | | | | 266,006 | | | | 341,467 | | | | 9/12/13 | | | | — | | | | (10,435 | ) |
Euro | | | BZWS | | | | Sell | | | | 759,073 | | | | 982,734 | | | | 9/16/13 | | | | — | | | | (21,494 | ) |
Euro | | | UBSW | | | | Sell | | | | 708,181 | | | | 916,245 | | | | 9/17/13 | | | | — | | | | (20,666 | ) |
FSI-34
Franklin Templeton Variable Insurance Products Trust
Statement of Investments, December 31, 2012 (continued)
|
| Franklin Strategic Income Securities Fund |
Forward Exchange Contracts (continued)
| | | | | | | | | | | | | | | | | | | | | | | | | | | | |
Currency | | Counterparty | | | Type | | | Quantity | | | Contract
Amount | | | Settlement
Date | | | Unrealized
Appreciation | | | Unrealized
Depreciation | |
Euro | | | BZWS | | | | Sell | | | | 178,354 | | | $ | 234,946 | | | | 9/19/13 | | | $ | — | | | $ | (1,018 | ) |
Singapore Dollar | | | JPHQ | | | | Buy | | | | 694,000 | | | | 567,364 | | | | 9/19/13 | | | | 836 | | | | — | |
Euro | | | UBSW | | | | Sell | | | | 2,137,312 | | | | 2,824,950 | | | | 9/20/13 | | | | — | | | | (2,766 | ) |
Japanese Yen | | | DBAB | | | | Sell | | | | 335,180,000 | | | | 4,000,000 | | | | 9/20/13 | | | | 127,280 | | | | — | |
Euro | | | DBAB | | | | Sell | | | | 495,470 | | | | 648,967 | | | | 9/23/13 | | | | — | | | | (6,574 | ) |
Euro | | | BZWS | | | | Sell | | | | 469,210 | | | | 609,870 | | | | 9/24/13 | | | | — | | | | (10,933 | ) |
Euro | | | DBAB | | | | Sell | | | | 1,550,000 | | | | 1,999,268 | | | | 9/30/13 | | | | — | | | | (51,657 | ) |
Philippine Peso | | | DBAB | | | | Buy | | | | 21,010,000 | | | | 502,632 | | | | 10/04/13 | | | | 7,654 | | | | — | |
Philippine Peso | | | HSBC | | | | Buy | | | | 16,853,000 | | | | 404,013 | | | | 10/04/13 | | | | 5,308 | | | | — | |
Euro | | | UBSW | | | | Sell | | | | 2,850,000 | | | | 3,691,121 | | | | 10/07/13 | | | | — | | | | (80,280 | ) |
Euro | | | DBAB | | | | Sell | | | | 185,654 | | | | 240,385 | | | | 10/07/13 | | | | — | | | | (5,291 | ) |
Philippine Peso | | | HSBC | | | | Buy | | | | 25,126,000 | | | | 604,150 | | | | 10/07/13 | | | | 6,005 | | | | — | |
Euro | | | BZWS | | | | Sell | | | | 2,749,000 | | | | 3,575,075 | | | | 10/11/13 | | | | — | | | | (62,864 | ) |
Philippine Peso | | | JPHQ | | | | Buy | | | | 8,232,000 | | | | 198,166 | | | | 10/11/13 | | | | 1,695 | | | | — | |
Philippine Peso | | | HSBC | | | | Buy | | | | 14,493,000 | | | | 348,716 | | | | 10/11/13 | | | | 3,153 | | | | — | |
Euro | | | DBAB | | | | Sell | | | | 121,043 | | | | 157,162 | | | | 10/15/13 | | | | — | | | | (3,031 | ) |
Philippine Peso | | | DBAB | | | | Buy | | | | 4,913,000 | | | | 118,047 | | | | 10/16/13 | | | | 1,201 | | | | — | |
Euro | | | DBAB | | | | Sell | | | | 587,951 | | | | 769,510 | | | | 10/18/13 | | | | — | | | | (8,637 | ) |
Malaysian Ringgit | | | JPHQ | | | | Buy | | | | 763,000 | | | | 245,614 | | | | 10/18/13 | | | | — | | | | (706 | ) |
Malaysian Ringgit | | | DBAB | | | | Buy | | | | 10,212,000 | | | | 3,293,662 | | | | 10/23/13 | | | | — | | | | (16,621 | ) |
Malaysian Ringgit | | | HSBC | | | | Buy | | | | 6,809,796 | | | | 2,196,000 | | | | 10/24/13 | | | | — | | | | (10,837 | ) |
Euro | | | BZWS | | | | Sell | | | | 217,715 | | | | 283,992 | | | | 10/25/13 | | | | — | | | | (4,178 | ) |
Japanese Yen | | | JPHQ | | | | Sell | | | | 270,990,000 | | | | 3,408,572 | | | | 10/28/13 | | | | 275,918 | | | | — | |
Euro | | | UBSW | | | | Sell | | | | 369,000 | | | | 481,010 | | | | 10/29/13 | | | | — | | | | (7,428 | ) |
Euro | | | DBAB | | | | Sell | | | | 1,494,524 | | | | 1,934,250 | | | | 10/31/13 | | | | — | | | | (44,074 | ) |
Japanese Yen | | | JPHQ | | | | Sell | | | | 360,360,000 | | | | 4,532,853 | | | | 11/01/13 | | | | 366,844 | | | | — | |
Euro | | | DBAB | | | | Sell | | | | 243,767 | | | | 318,112 | | | | 11/04/13 | | | | — | | | | (4,583 | ) |
Euro | | | BZWS | | | | Sell | | | | 529,706 | | | | 689,577 | | | | 11/05/13 | | | | — | | | | (11,649 | ) |
Euro | | | JPHQ | | | | Sell | | | | 473,670 | | | | 606,523 | | | | 11/12/13 | | | | — | | | | (20,580 | ) |
Euro | | | DBAB | | | | Sell | | | | 800,000 | | | | 1,050,560 | | | | 11/14/13 | | | | — | | | | (8,607 | ) |
Euro | | | DBAB | | | | Sell | | | | 227,970 | | | | 291,031 | | | | 11/15/13 | | | | — | | | | (10,796 | ) |
Japanese Yen | | | MSCO | | | | Sell | | | | 12,500,000 | | | | 158,018 | | | | 11/15/13 | | | | 13,481 | | | | — | |
Euro | | | DBAB | | | | Sell | | | | 63,419 | | | | 81,477 | | | | 11/19/13 | | | | — | | | | (2,493 | ) |
Malaysian Ringgit | | | DBAB | | | | Buy | | | | 623,200 | | | | 200,000 | | | | 11/19/13 | | | | — | | | | (279 | ) |
Euro | | | UBSW | | | | Sell | | | | 1,480,440 | | | | 1,895,111 | | | | 11/20/13 | | | | — | | | | (65,084 | ) |
Euro | | | JPHQ | | | | Sell | | | | 221,993 | | | | 283,400 | | | | 11/20/13 | | | | — | | | | (10,533 | ) |
Malaysian Ringgit | | | HSBC | | | | Buy | | | | 376,000 | | | | 120,466 | | | | 11/20/13 | | | | 28 | | | | — | |
Euro | | | UBSW | | | | Sell | | | | 1,245,000 | | | | 1,623,169 | | | | 12/03/13 | | | | — | | | | (25,570 | ) |
Euro | | | UBSW | | | | Sell | | | | 3,400,000 | | | | 4,463,418 | | | | 12/09/13 | | | | — | | | | (39,517 | ) |
Euro | | | DBAB | | | | Sell | | | | 5,049,917 | | | | 6,629,027 | | | | 12/10/13 | | | | — | | | | (59,134 | ) |
Japanese Yen | | | UBSW | | | | Sell | | | | 187,760,000 | | | | 2,293,448 | | | | 12/12/13 | | | | 121,562 | | | | — | |
Euro | | | DBAB | | | | Sell | | | | 1,200,000 | | | | 1,565,760 | | | | 12/13/13 | | | | — | | | | (23,595 | ) |
Euro | | | CITI | | | | Sell | | | | 3,868,000 | | | | 5,079,844 | | | | 12/17/13 | | | | — | | | | (43,445 | ) |
Euro | | | DBAB | | | | Sell | | | | 486,875 | | | | 643,016 | | | | 12/18/13 | | | | — | | | | (1,875 | ) |
Euro | | | DBAB | | | | Sell | | | | 262,167 | | | | 348,111 | | | | 12/20/13 | | | | 847 | | | | — | |
Euro | | | DBAB | | | | Sell | | | | 239,450 | | | | 317,415 | | | | 1/03/14 | | | | 184 | | | | — | |
| | | | | | | | | | | | | | | | | | | | | | | | |
Unrealized appreciation (depreciation) | | | | | | | | | | | | 5,765,812 | | | | (4,897,317 | ) |
| | | | | | | | | | | | | | | | | | | | | | | | |
Net unrealized appreciation (depreciation) | | | | | | | | | | | $ | 868,495 | | | | | |
| | | | | | | | | | | | | | | | | | | | | | | | | | | | |
FSI-35
Franklin Templeton Variable Insurance Products Trust
Statement of Investments, December 31, 2012 (continued)
| | | | | | |
| Franklin Strategic Income Securities Fund | | | | | | |
At December 31, the Fund had the following credit default swap contracts outstanding. See Note 1(d).
Credit Default Swap Contracts
| | | | | | | | | | | | | | | | | | | | | | | | | | | | | | | | | | |
| Description | | Counter- partya | | | Notional
Amountb | | | Periodic
Payment
Rate | | | Expiration
Date | | | Upfront
Premiums
Paid
(Received) | | | Unrealized
Appreciation | | | Unrealized
Depreciation | | | Market
Value | | | Ratingc |
Contracts to Sell Protectiond | | | | | | | | | | | | | | | | | | | | | | | | | | | |
Traded Index | | | | | | | | | | | | | | | | | | | | | | | | | | | | | | | |
MCDX.NA.19 | | | CITI | | | $ | 12,500,000 | | | | 1.00% | | | | 12/20/17 | | | $ | (322,747 | ) | | $ | 9,191 | | | $ | — | | | | (313,556 | ) | | Non Investment
Grade |
MCDX.NA.19 | | | GSCO | | | | 500,000 | | | | 1.00% | | | | 12/20/17 | | | | (14,415 | ) | | | 1,873 | | | | — | | | | (12,542 | ) | | Non Investment
Grade |
MCDX.NA.19 | | | MSCO | | | | 7,000,000 | | | | 1.00% | | | | 12/20/17 | | | | (171,750 | ) | | | — | | | | (3,841 | ) | | | (175,591 | ) | | Non Investment
Grade |
| | | | | | | | | | | | | | | | | | | | | | | | | | | | | | |
Unrealized appreciation (depreciation) | | | | 11,064 | | | | (3,841 | ) | | | | | | |
| | | | | | | | | | | | | | | | | | | | | | | | | | | | | | |
Net unrealized appreciation (depreciation) | | | $ | 7,223 | | | | | | | | | | | |
| | | | | | | | | | | | | | | | | | | | | | | | | | | | | | | | | | |
aPositions are generally not collateralized if the market value is under $250,000. Collateral requirements may be net of current positions at the individual counterparty for the fund. The table below summarizes the cash and/or securities held as collateral for each applicable counterparty at year end:
| | | | |
| Counterparty | | Collateral Posted (Received) | |
CITI | | $ | 260,000 | |
| | | | |
bIn U.S. dollars unless otherwise indicated. For contracts to sell protection, the notional amount is equal to the maximum potential amount of the future payments and no recourse provisions have been entered into in association with the contracts.
cBased on Standard and Poor’s (S&P) Rating for single name swaps and internal ratings for index swaps. Internal ratings based on mapping into equivalent ratings from external vendors.
dThe fund enters contracts to sell protection to create a long credit position. Performance triggers include failure to pay or bankruptcy of the underlying securities for traded index swaps.
See Abbreviations on page FSI-51.
The accompanying notes are an integral part of these financial statements.
FSI-36
Franklin Templeton Variable Insurance Products Trust
Financial Statements
Statement of Assets and Liabilities
December 31, 2012
| | | | |
| | | Franklin
Strategic Income
Securities Fund | |
Assets: | | | | |
Investments in securities: | | | | |
Cost - Unaffiliated issuers | | $ | 1,184,591,205 | |
Cost - Sweep Money Fund (Note 7) | | | 125,449,996 | |
| | | | |
Total cost of investments | | $ | 1,310,041,201 | |
| | | | |
Value - Unaffiliated issuers | | $ | 1,250,263,829 | |
Value - Sweep Money Fund (Note 7) | | | 125,449,996 | |
| | | | |
Total value of investments | | | 1,375,713,825 | |
Cash | | | 1,743,381 | |
Restricted cash (Note 1e) | | | 685,000 | |
Foreign currency, at value (cost $1,402,602) | | | 1,402,035 | |
Receivables: | | | | |
Investment securities sold | | | 3,879,221 | |
Capital shares sold | | | 457,848 | |
Interest | | | 15,217,191 | |
Due from brokers | | | 1,320,000 | |
Unrealized appreciation on forward exchange contracts | | | 5,765,812 | |
Unrealized appreciation on swap contracts | | | 11,064 | |
Other assets | | | 34 | |
| | | | |
Total assets | | | 1,406,195,411 | |
| | | | |
Liabilities: | | | | |
Payables: | | | | |
Investment securities purchased | | | 19,833,559 | |
Capital shares redeemed | | | 4,263,339 | |
Affiliates | | | 804,533 | |
Due to brokers | | | 685,000 | |
Swaps (premiums received $526,681) | | | 508,912 | |
Unrealized depreciation on forward exchange contracts | | | 4,897,317 | |
Unrealized depreciation on swap contracts | | | 3,841 | |
Deferred tax | | | 209,403 | |
Accrued expenses and other liabilities | | | 522,826 | |
| | | | |
Total liabilities | | | 31,728,730 | |
| | | | |
Net assets, at value | | $ | 1,374,466,681 | |
| | | | |
Net assets consist of: | | | | |
Paid-in capital | | $ | 1,223,254,980 | |
Undistributed net investment income | | | 68,571,868 | |
Net unrealized appreciation (depreciation) | | | 66,464,631 | |
Accumulated net realized gain (loss) | | | 16,175,202 | |
| | | | |
Net assets, at value | | $ | 1,374,466,681 | |
| | | | |
The accompanying notes are an integral part of these financial statements.
FSI-37
Franklin Templeton Variable Insurance Products Trust
Financial Statements (continued)
Statement of Assets and Liabilities (continued)
December 31, 2012
| | | | |
| | | Franklin
Strategic Income
Securities Fund | |
Class 1: | | | | |
Net assets, at value | | $ | 1,019,536,948 | |
| | | | |
Shares outstanding | | | 77,412,494 | |
| | | | |
Net asset value and maximum offering price per share | | $ | 13.17 | |
| | | | |
Class 2: | | | | |
Net assets, at value | | $ | 158,451,035 | |
| | | | |
Shares outstanding | | | 12,336,191 | |
| | | | |
Net asset value and maximum offering price per share | | $ | 12.84 | |
| | | | |
Class 4: | | | | |
Net assets, at value | | $ | 196,478,698 | |
| | | | |
Shares outstanding | | | 15,065,356 | |
| | | | |
Net asset value and maximum offering price per share | | $ | 13.04 | |
| | | | |
The accompanying notes are an integral part of these financial statements.
FSI-38
Franklin Templeton Variable Insurance Products Trust
Financial Statements (continued)
Statement of Operations
for the year ended December 31, 2012
| | | | |
| | | Franklin
Strategic Income
Securities Fund | |
Investment income: | | | | |
Dividends | | $ | 70,281 | |
Interest | | | 77,427,453 | |
| | | | |
Total investment income | | | 77,497,734 | |
| | | | |
Expenses: | | | | |
Management fees (Note 3a) | | | 4,712,412 | |
Administrative fees (Note 3b) | | | 2,757,946 | |
Distribution fees: (Note 3c) | | | | |
Class 2 | | | 350,666 | |
Class 4 | | | 692,586 | |
Unaffiliated transfer agent fees | | | 520 | |
Custodian fees (Note 4) | | | 309,917 | |
Reports to shareholders | | | 102,535 | |
Professional fees | | | 96,141 | |
Trustees’ fees and expenses | | | 5,476 | |
Other | | | 67,431 | |
| | | | |
Total expenses | | | 9,095,620 | |
| | | | |
Net investment income | | | 68,402,114 | |
| | | | |
Realized and unrealized gains (losses): | | | | |
Net realized gain (loss) from: | | | | |
Investments | | | 17,051,467 | |
Foreign currency transactions | | | 8,367,672 | |
Swap contracts | | | 2,626,286 | |
| | | | |
Net realized gain (loss) | | | 28,045,425 | |
| | | | |
Net change in unrealized appreciation (depreciation) on: | | | | |
Investments | | | 73,292,749 | |
Translation of other assets and liabilities denominated in foreign currencies | | | (1,532,223 | ) |
Change in deferred taxes on unrealized appreciation | | | 67,485 | |
| | | | |
Net change in unrealized appreciation (depreciation) | | | 71,828,011 | |
| | | | |
Net realized and unrealized gain (loss) | | | 99,873,436 | |
| | | | |
Net increase (decrease) in net assets resulting from operations | | $ | 168,275,550 | |
| | | | |
The accompanying notes are an integral part of these financial statements.
FSI-39
Franklin Templeton Variable Insurance Products Trust
Financial Statements (continued)
Statements of Changes in Net Assets
| | | | | | | | |
| | | Franklin Strategic Income
Securities Fund | |
| | | Year Ended December 31, | |
| | | 2012 | | | 2011 | |
| | | | |
Increase (decrease) in net assets: | | | | | | | | |
Operations: | | | | | | | | |
Net investment income | | $ | 68,402,114 | | | $ | 76,340,737 | |
Net realized gain (loss) from investments, foreign currency transactions and swap contracts | | | 28,045,425 | | | | 33,514,759 | |
Net change in unrealized appreciation (depreciation) on investments, translation of other assets and liabilities denominated in foreign currencies and deferred taxes | | | 71,828,011 | | | | (71,081,939 | ) |
| | | | |
Net increase (decrease) in net assets resulting from operations | | | 168,275,550 | | | | 38,773,557 | |
| | | | |
Distributions to shareholders from: | | | | | | | | |
Net investment income and net foreign currency gains: | | | | | | | | |
Class 1 | | | (72,486,947 | ) | | | (69,631,166 | ) |
Class 2 | | | (9,567,293 | ) | | | (7,304,903 | ) |
Class 4 | | | (13,446,008 | ) | | | (11,235,444 | ) |
Net realized gains: | | | | | | | | |
Class 1 | | | (1,182,191 | ) | | | — | |
Class 2 | | | (160,795 | ) | | | — | |
Class 4 | | | (230,338 | ) | | | — | |
| | | | |
Total distributions to shareholders | | | (97,073,572 | ) | | | (88,171,513 | ) |
| | | | |
Capital share transactions: (Note 2) | | | | | | | | |
Class 1 | | | (78,499,832 | ) | | | (114,013,494 | ) |
Class 2 | | | 27,715,617 | | | | 27,304,975 | |
Class 4 | | | (2,176,836 | ) | | | 7,657,719 | |
| | | | |
Total capital share transactions | | | (52,961,051 | ) | | | (79,050,800 | ) |
| | | | |
Net increase (decrease) in net assets | | | 18,240,927 | | | | (128,448,756 | ) |
Net assets: | | | | | | | | |
Beginning of year | | | 1,356,225,754 | | | | 1,484,674,510 | |
| | | | |
End of year | | $ | 1,374,466,681 | | | $ | 1,356,225,754 | |
| | | | |
Undistributed net investment income included in net assets: | | | | | | | | |
End of year | | $ | 68,571,868 | | | $ | 84,105,225 | |
| | | | |
The accompanying notes are an integral part of these financial statements.
FSI-40
Franklin Templeton Variable Insurance Products Trust
Notes to Financial Statements
Franklin Strategic Income Securities Fund
1. ORGANIZATION AND SIGNIFICANT ACCOUNTING POLICIES
Franklin Templeton Variable Insurance Products Trust (Trust) is registered under the Investment Company Act of 1940, as amended, (1940 Act) as an open-end investment company, consisting of twenty separate funds. The Franklin Strategic Income Securities Fund (Fund) is included in this report. The financial statements of the remaining funds in the Trust are presented separately. Shares of the Fund are generally sold only to insurance company separate accounts to fund the benefits of variable life insurance policies or variable annuity contracts. At December 31, 2012, 89.42% of the Fund’s shares were held through one insurance company. Investment activities of these insurance company separate accounts could have a material impact on the Fund. The Fund offers, three classes of shares: Class 1, Class 2, and Class 4. Each class of shares differs by its distribution fees, voting rights on matters affecting a single class and its exchange privilege.
The following summarizes the Fund’s significant accounting policies.
a. Financial Instrument Valuation
The Fund’s investments in financial instruments are carried at fair value daily. Fair value is the price that would be received to sell an asset or paid to transfer a liability in an orderly transaction between market participants on the measurement date. Under procedures approved by the Trust’s Board of Trustees (the Board), the Fund’s administrator, investment manager and other affiliates have formed the Valuation and Liquidity Oversight Committee (VLOC). The VLOC provides administration and oversight of the Fund’s valuation policies and procedures, which are approved annually by the Board. Among other things, these procedures allow the Fund to utilize independent pricing services, quotations from securities and financial instrument dealers, and other market sources to determine fair value.
Equity securities listed on an exchange or on the NASDAQ National Market System are valued at the last quoted sale price or the official closing price of the day, respectively. Over-the-counter (OTC) securities are valued within the range of the most recent quoted bid and ask prices. Securities that trade in multiple markets or on multiple exchanges are valued according to the broadest and most representative market. Certain equity securities are valued based upon fundamental characteristics or relationships to similar securities. Investments in open-end mutual funds are valued at the closing net asset value
Debt securities generally trade in the OTC market rather than on a securities exchange. The Fund’s pricing services use multiple valuation techniques to determine fair value. In instances where sufficient market activity exists, the pricing services may utilize a market-based approach through which quotes from market makers are used to determine fair value. In instances where sufficient market activity may not exist or is limited, the pricing services also utilize proprietary valuation models which may consider market characteristics such as benchmark yield curves, credit spreads, estimated default rates, anticipated market interest rate volatility, coupon rates, anticipated timing of principal repayments, underlying collateral, and other unique security features in order to estimate the relevant cash flows, which are then discounted to calculate the fair value. Securities denominated in a foreign currency are converted into their U.S. dollar equivalent at the foreign exchange rate in effect at the close of the NYSE on the date that the values of the foreign debt securities are determined.
Certain derivative financial instruments (derivatives) trade in the OTC market. The Fund’s pricing services use various techniques including industry standard option pricing models and proprietary discounted cash flow models to determine the fair value of those instruments. The Fund’s net benefit or obligation under the derivative contract, as measured by the fair market value of the contract, is included in net assets.
The Fund has procedures to determine the fair value of financial instruments for which market prices are not reliable or readily available. Under these procedures, the VLOC convenes on a regular basis to review such financial instruments and considers a number of factors, including significant unobservable valuation inputs, when arriving at fair value. The VLOC primarily employs a market-based approach which may use related or comparable assets or liabilities, recent transactions, market multiples, book values, and other relevant information for the investment to determine the fair value of the investment. An income-based valuation approach may also be used in which the anticipated future cash flows of the investment are discounted to calculate fair value. Discounts may also be applied due to the nature or duration of any restrictions on the disposition of the investments. Due
FSI-41
Franklin Templeton Variable Insurance Products Trust
Notes to Financial Statements (continued)
Franklin Strategic Income Securities Fund
1. ORGANIZATION AND SIGNIFICANT ACCOUNTING POLICIES (continued)
a. Financial Instrument Valuation (continued)
to the inherent uncertainty of valuations of such investments, the fair values may differ significantly from the values that would have been used had an active market existed. The VLOC employs various methods for calibrating these valuation approaches including a regular review of key inputs and assumptions, transactional back-testing or disposition analysis, and reviews of any related market activity.
b. Foreign Currency Translation
Portfolio securities and other assets and liabilities denominated in foreign currencies are translated into U.S. dollars based on the exchange rate of such currencies against U.S. dollars on the date of valuation. The Fund may enter into foreign currency exchange contracts to facilitate transactions denominated in a foreign currency. Purchases and sales of securities, income and expense items denominated in foreign currencies are translated into U.S. dollars at the exchange rate in effect on the transaction date. Portfolio securities and assets and liabilities denominated in foreign currencies contain risks that those currencies will decline in value relative to the U.S. dollar. Occasionally, events may impact the availability or reliability of foreign exchange rates used to convert the U.S. dollar equivalent value. If such an event occurs, the foreign exchange rate will be valued at fair value using procedures established and approved by the Board.
The Fund does not separately report the effect of changes in foreign exchange rates from changes in market prices on securities held. Such changes are included in net realized and unrealized gain or loss from investments on the Statement of Operations.
Realized foreign exchange gains or losses arise from sales of foreign currencies, currency gains or losses realized between the trade and settlement dates on securities transactions and the difference between the recorded amounts of dividends, interest, and foreign withholding taxes and the U.S. dollar equivalent of the amounts actually received or paid. Net unrealized foreign exchange gains and losses arise from changes in foreign exchange rates on foreign denominated assets and liabilities other than investments in securities held at the end of the reporting period.
c. Securities Purchased on a Delayed Delivery and TBA Basis
The Fund purchases securities on a delayed delivery and to-be-announced (TBA) basis, with payment and delivery scheduled for a future date. These transactions are subject to market fluctuations and are subject to the risk that the value at delivery may be more or less than the trade date purchase price. Although the Fund will generally purchase these securities with the intention of holding the securities, it may sell the securities before the settlement date. Sufficient assets have been segregated for these securities.
d. Derivative Financial Instruments
The Fund invested in derivatives in order to manage risk or gain exposure to various other investments or markets. Derivatives are financial contracts based on an underlying or notional amount, require no initial investment or an initial net investment that is smaller than would normally be required to have a similar response to changes in market factors, and require or permit net settlement. Derivatives contain various risks including the potential inability of the counterparty to fulfill their obligations under the terms of the contract, the potential for an illiquid secondary market, and/or the potential for market movements which expose the Fund to gains or losses in excess of the amounts shown on the Statement of Assets and Liabilities. Realized gain and loss and unrealized appreciation and depreciation on these contracts for the period are included in the Statement of Operations.
The Fund’s investments in OTC derivatives are subject to the terms of International Swaps and Derivatives Association Master Agreements and other related agreements between the Fund and certain derivative counterparties. These agreements contain various provisions, including but not limited to collateral requirements, events of default, requirements for the Fund to maintain
FSI-42
Franklin Templeton Variable Insurance Products Trust
Notes to Financial Statements (continued)
Franklin Strategic Income Securities Fund
1. ORGANIZATION AND SIGNIFICANT ACCOUNTING POLICIES (continued)
d. Derivative Financial Instruments (continued)
certain net asset levels and/or limit the decline in net assets over various periods of time. Should the Fund fail to meet any of these provisions, the derivative counterparty has the right to terminate the derivative contract and require immediate payment by the Fund for those OTC derivatives with that particular counterparty that are in a net liability position.
At December 31, 2012, the Fund had OTC derivatives in a net liability position of $1,374,810 and the aggregate value of collateral pledged for such contracts was $1,320,000.
The Fund entered into OTC forward exchange contracts primarily to manage and/or gain exposure to certain foreign currencies. A forward exchange contract is an agreement between the Fund and a counterparty to buy or sell a foreign currency for a specific exchange rate on a future date. Pursuant to the terms of the forward exchange contracts, cash or securities may be required to be deposited as collateral. Unrestricted cash may be invested according to the Fund’s investment objectives.
The Fund entered into OTC credit default swap contracts primarily to manage exposure to credit risk. A credit default swap is an agreement between the Fund and a counterparty whereby the buyer of the contract receives credit protection and the seller of the contract guarantees the credit worthiness of a referenced debt obligation. The underlying referenced debt obligation may be a single issuer of corporate or sovereign debt, a credit index, or a tranche of a credit index. In the event of a default of the underlying referenced debt obligation, the buyer is entitled to receive the notional amount of the credit default swap contract from the seller in exchange for the referenced debt obligation, a net settlement amount equal to the notional amount of the credit default swap less the recovery value of the referenced debt obligation, or other agreed upon amount. Over the term of the contract, the buyer pays the seller a periodic stream of payments, provided that no event of default has occurred. Such periodic payments are accrued daily as an unrealized appreciation or depreciation until the payments are made, at which time they are realized. Payments received or paid to initiate a credit default swap contract are reflected on the Statement of Assets and Liabilities and represent compensating factors between stated terms of the credit default swap agreement and prevailing market conditions (credit spreads and other relevant factors). These upfront payments are amortized over the term of the contract as a realized gain or loss on the Statement of Operations. Pursuant to the terms of the credit default swap contract, cash or securities may be required to be deposited as collateral. Unrestricted cash may be invested according to the Fund’s investment objectives.
At December 31, 2012, the Fund held $148,494 in U.S treasury bonds and notes as collateral for derivatives.
See Note 10 regarding other derivative information.
e. Restricted Cash
At December 31, 2012, the Fund held restricted cash in connection with investments in certain derivative securities. Restricted cash is held in a segregated account with the Fund’s custodian and is reflected in the Statement of Assets and Liabilities.
f. Loan Participation Notes
The Fund invests in loan participation notes (“Participations”). Participations are loans originally issued to a borrower by one or more financial institutions (the “Lender”) and subsequently sold to other investors, such as the Fund. Participations typically result in the Fund having a contractual relationship only with the Lender, and not with the borrower. The Fund has the right to receive from the Lender any payments of principal, interest and fees which the Lender received from the borrower. The Fund generally has no rights to either enforce compliance by the borrower with the terms of the loan agreement or to any collateral relating to the original loan. As a result, the Fund assumes the credit risk of both the borrower and the Lender that is selling the Participation. The Participations may also involve interest rate risk and liquidity risk, including the potential default or insolvency of the borrower and/or the Lender.
FSI-43
Franklin Templeton Variable Insurance Products Trust
Notes to Financial Statements (continued)
Franklin Strategic Income Securities Fund
1. ORGANIZATION AND SIGNIFICANT ACCOUNTING POLICIES (continued)
g. FT Holdings Corporation III (FT Subsidiary)
The Fund invests in certain securities through its investment in FT Subsidiary, a Delaware Corporation and a wholly-owned subsidiary of the Fund. The FT Subsidiary has the ability to invest in securities consistent with the investment objective of the Fund. At December 31, 2012, all FT Subsidiary investments as well as any other assets and liabilities are reflected in the Fund’s Statement of Investments and Statement of Assets and Liabilities. All income and expenses of the FT Subsidiary during the year ended December 31, 2012, have been included in the Fund’s Statement of Operations.
h. Mortgage Dollar Rolls
The Fund enters into mortgage dollar rolls, typically on a TBA basis. Mortgage dollar rolls are agreements between the Fund and a financial institution to simultaneously sell and repurchase mortgage-backed securities at a future date. Gains or losses are realized on the initial sale, and the difference between the repurchase price and the sale price is recorded as an unrealized gain or loss to the Fund upon entering into the mortgage dollar roll. In addition, the Fund may invest the cash proceeds that are received from the initial sale. During the period between the sale and repurchase, the Fund is not entitled to principal and interest paid on the mortgage backed securities. The risks of mortgage dollar roll transactions include the potential inability of the counterparty to fulfill its obligations.
i. Senior Floating Rate Interests
The Fund invests in senior secured corporate loans that pay interest at rates which are periodically reset by reference to a base lending rate plus a spread. These base lending rates are generally the prime rate offered by a designated U.S. bank or the London InterBank Offered Rate (LIBOR). Senior secured corporate loans often require prepayment of principal from excess cash flows or at the discretion of the borrower. As a result, actual maturity may be substantially less than the stated maturity.
Senior secured corporate loans in which the Fund invests are generally readily marketable, but may be subject to some restrictions on resale.
j. Income and Deferred Taxes
It is the Fund’s policy to qualify as a regulated investment company under the Internal Revenue Code. The Fund intends to distribute to shareholders substantially all of its taxable income and net realized gains to relieve it from federal income and if applicable, excise taxes. As a result, no provision for U.S. federal income taxes is required.
The Fund may be subject to foreign taxation related to income received, capital gains on the sale of securities and certain foreign currency transactions in the foreign jurisdictions in which it invests. Foreign taxes, if any, are recorded based on the tax regulations and rates that exist in the foreign markets in which the Fund invests. When a capital gain tax is determined to apply the Fund records an estimated deferred tax liability in an amount that would be payable if the securities were disposed of on the valuation date.
The Fund recognizes the tax benefits of uncertain tax positions only when the position is “more likely than not” to be sustained upon examination by the tax authorities based on the technical merits of the tax position. As of December 31, 2012, and for all open tax years, the Fund has determined that no liability for unrecognized tax benefits is required in the Fund’s financial statements related to uncertain tax positions taken on a tax return (or expected to be taken on future tax returns). Open tax years are those that remain subject to examination and are based on each tax jurisdiction statute of limitation.
FSI-44
Franklin Templeton Variable Insurance Products Trust
Notes to Financial Statements (continued)
Franklin Strategic Income Securities Fund
1. ORGANIZATION AND SIGNIFICANT ACCOUNTING POLICIES (continued)
k. Security Transactions, Investment Income, Expenses and Distributions
Security transactions are accounted for on trade date. Realized gains and losses on security transactions are determined on a specific identification basis. Interest income and estimated expenses are accrued daily. Amortization of premium and accretion of discount on debt securities are included in interest income. Facility fees are recognized as income over the expected term of the loan. Dividend income is recorded on the ex-dividend date. Distributions to shareholders are recorded on the ex-dividend date and are determined according to income tax regulations (tax basis). Distributable earnings determined on a tax basis may differ from earnings recorded in accordance with accounting principles generally accepted in the United States of America. These differences may be permanent or temporary. Permanent differences are reclassified among capital accounts to reflect their tax character. These reclassifications have no impact on net assets or the results of operations. Temporary differences are not reclassified, as they may reverse in subsequent periods.
Common expenses incurred by the Trust are allocated among the funds based on the ratio of net assets of each fund to the combined net assets of the Trust. Fund specific expenses are charged directly to the fund that incurred the expense.
Realized and unrealized gains and losses and net investment income, not including class specific expenses, are allocated daily to each class of shares based upon the relative proportion of net assets of each class. Differences in per share distributions, by class, are generally due to differences in class specific expenses.
Inflation-indexed bonds are adjusted for inflation through periodic increases or decreases in the security’s interest accruals, face amount, or principal redemption value, by amounts corresponding to the rate of inflation as measured by an index. Any increase or decrease in the face amount or principal redemption value will be included as interest income on the Statement of Operations.
l. Accounting Estimates
The preparation of financial statements in accordance with accounting principles generally accepted in the United States of America requires management to make estimates and assumptions that affect the reported amounts of assets and liabilities at the date of the financial statements and the amounts of income and expenses during the reporting period. Actual results could differ from those estimates.
m. Guarantees and Indemnifications
Under the Trust’s organizational documents, its officers and trustees are indemnified by the Trust against certain liabilities arising out of the performance of their duties to the Trust. Additionally, in the normal course of business, the Trust, on behalf of the Fund, enters into contracts with service providers that contain general indemnification clauses. The Trust’s maximum exposure under these arrangements is unknown as this would involve future claims that may be made against the Trust that have not yet occurred. Currently, the Trust expects the risk of loss to be remote.
FSI-45
Franklin Templeton Variable Insurance Products Trust
Notes to Financial Statements (continued)
Franklin Strategic Income Securities Fund
2. SHARES OF BENEFICIAL INTEREST
At December 31, 2012, there were an unlimited number of shares authorized (without par value). Transactions in the Fund’s shares were as follows:
| | | | | | | | | | | | | | | | |
| | | Year Ended December 31, | |
| | | 2012 | | | 2011 | |
| Class 1 Shares: | | Shares | | | Amount | | | Shares | | | Amount | |
Shares sold | | | 3,209,922 | | | $ | 41,235,226 | | | | 2,569,621 | | | $ | 33,265,626 | |
Shares issued in reinvestment of distributions | | | 6,063,304 | | | | 73,669,138 | | | | 5,474,148 | | | | 69,631,166 | |
Shares redeemed | | | (14,997,522 | ) | | | (193,404,196 | ) | | | (16,887,770 | ) | | | (216,910,286 | ) |
| | | | |
Net increase (decrease) | | | (5,724,296 | ) | | $ | (78,499,832 | ) | | | (8,844,001 | ) | | $ | (114,013,494 | ) |
| | | | |
Class 2 Shares: | | | | | | | | | | | | | | | | |
Shares sold | | | 3,441,994 | | | $ | 43,341,865 | | | | 3,778,943 | | | $ | 48,008,160 | |
Shares issued in reinvestment of distributions | | | 819,552 | | | | 9,728,087 | | | | 586,739 | | | | 7,304,903 | |
Shares redeemed | | | (2,012,180 | ) | | | (25,354,335 | ) | | | (2,243,563 | ) | | | (28,008,088 | ) |
| | | | |
Net increase (decrease) | | | 2,249,366 | | | $ | 27,715,617 | | | | 2,122,119 | | | $ | 27,304,975 | |
| | | | |
Class 4 Shares: | | | | | | | | | | | | | | | | |
Shares sold | | | 1,353,603 | | | $ | 17,206,420 | | | | 2,126,744 | | | $ | 27,218,734 | |
Shares issued on reinvestment of distributions | | | 1,134,025 | | | | 13,676,347 | | | | 889,584 | | | | 11,235,444 | |
Shares redeemed | | | (2,599,542 | ) | | | (33,059,603 | ) | | | (2,444,718 | ) | | | (30,796,459 | ) |
| | | | |
Net increase (decrease) | | | (111,914 | ) | | $ | (2,176,836 | ) | | | 571,610 | | | $ | 7,657,719 | |
| | | | |
3. TRANSACTIONS WITH AFFILIATES
Franklin Resources, Inc. is the holding company for various subsidiaries that together are referred to as Franklin Templeton Investments. Certain officers and trustees of the Fund are also officers and/or directors of the following subsidiaries:
| | |
| Subsidiary | | Affiliation |
Franklin Advisers, Inc. (Advisers) | | Investment manager |
Franklin Templeton Services, LLC (FT Services) | | Administrative manager |
Franklin Templeton Distributors, Inc. (Distributors) | | Principal underwriter |
Franklin Templeton Investor Services, LLC (Investor Services) | | Transfer agent |
a. Management Fees
The Fund pays an investment management fee to Advisers based on the average daily net assets of the Fund as follows:
| | |
| Annualized Fee Rate | | Net Assets |
| 0.425% | | Up to and including $500 million |
| 0.325% | | Over $500 million, up to and including $1 billion |
| 0.280% | | Over $1 billion, up to and including $1.5 billion |
| 0.235% | | Over $1.5 billion, up to and including $6.5 billion |
| 0.215% | | Over $6.5 billion, up to and including $11.5 billion |
| 0.200% | | Over $11.5 billion, up to and including $16.5 billion |
| 0.190% | | Over $16.5 billion, up to and including $19 billion |
| 0.180% | | Over $19 billion, up to and including $21.5 billion |
| 0.170% | | In excess of $21.5 billion |
FSI-46
Franklin Templeton Variable Insurance Products Trust
Notes to Financial Statements (continued)
Franklin Strategic Income Securities Fund
3. TRANSACTIONS WITH AFFILIATES (continued)
b. Administrative Fees
The Fund pays an administrative fee to FT Services of 0.20% per year of the average daily net assets of the Fund.
c. Distribution Fees
The Board has adopted distribution plans for Class 2 and Class 4 shares pursuant to Rule 12b-1 under the 1940 Act. Under the Fund’s compensation distribution plans, the Fund pays Distributors for costs incurred in connection with the servicing, sale and distribution of the Fund’s shares up to 0.25% and 0.35% per year of its average daily net assets of Class 2 and Class 4, respectively. Some distribution fees are not charged on shares held by affiliates.
d. Transfer Agent Fees
Investor Services, under terms of an agreement, performs shareholder servicing for the Fund and is not paid by the Fund for the services.
4. EXPENSE OFFSET ARRANGEMENT
The Fund has entered into an arrangement with its custodian whereby credits realized as a result of uninvested cash balances are used to reduce a portion of the Fund’s custodian expenses. During the year ended December 31, 2012, there were no credits earned.
5. INCOME TAXES
The tax character of distributions paid during the years ended December 31, 2012 and 2011, was as follows:
| | | | | | | | |
| | | 2012 | | | 2011 | |
Distributions paid from: | | | | | | | | |
Ordinary income | | $ | 95,500,248 | | | $ | 88,171,513 | |
Long term capital gain | | | 1,573,324 | | | | — | |
| | | | |
| | $ | 97,073,572 | | | $ | 88,171,513 | |
| | | | |
At December 31, 2012, the cost of investments, net unrealized appreciation (depreciation), undistributed ordinary income and undistributed long term capital gains for income tax purposes were as follows:
| | | | |
Cost of investments | | $ | 1,313,823,506 | |
| | | | |
| |
Unrealized appreciation | | $ | 76,496,104 | |
Unrealized depreciation | | | (14,605,785 | ) |
| | | | |
Net unrealized appreciation (depreciation) | | $ | 61,890,319 | |
| | | | |
Undistributed ordinary income | | $ | 77,793,606 | |
Undistributed long term capital gains | | | 12,345,735 | |
| | | | |
Distributable earnings | | $ | 90,139,341 | |
| | | | |
Differences between income and/or capital gains as determined on a book basis and a tax basis are primarily due to differing treatments of paydown losses and bond discounts and premiums.
FSI-47
Franklin Templeton Variable Insurance Products Trust
Notes to Financial Statements (continued)
Franklin Strategic Income Securities Fund
6. INVESTMENT TRANSACTIONS
Purchases and sales of investments (excluding short term securities) for the year ended December 31, 2012, aggregated $626,303,249 and $735,554,475, respectively.
7. INVESTMENTS IN INSTITUTIONAL FIDUCIARY TRUST MONEY MARKET PORTFOLIO
The Fund invests in the Institutional Fiduciary Trust Money Market Portfolio (Sweep Money Fund), an open-end investment company managed by Advisers. Management fees paid by the Fund are reduced on assets invested in the Sweep Money Fund, in an amount not to exceed the management and administrative fees paid by the Sweep Money Fund.
8. CREDIT RISK AND DEFAULTED SECURITIES
At December 31, 2012, the Fund had 49.25% of its portfolio invested in high yield securities, senior secured floating rate notes, or other securities rated below investment grade. These securities may be more sensitive to economic conditions causing greater price volatility and are potentially subject to a greater risk of loss due to default than higher rated securities.
The Fund held a defaulted security and/or other securities for which the income has been deemed uncollectible. At December 31, 2012, the value of this security represents less than 0.05% of the Fund’s net assets. The Fund discontinues accruing income on securities for which income has been deemed uncollectible and provides an estimate for losses on interest receivable. The security has been identified on the accompanying Statement of Investments.
9. RESTRICTED SECURITIES
The Fund invests in securities that are restricted under the Securities Act of 1933 (1933 Act) or which are subject to legal, contractual, or other agreed upon restrictions on resale. Restricted securities are often purchased in private placement transactions, and cannot be sold without prior registration unless the sale is pursuant to an exemption under the 1933 Act. Disposal of these securities may require greater effort and expense, and prompt sale at an acceptable price may be difficult. The Fund may have registration rights for restricted securities. The issuer generally incurs all registration costs.
At December 31, 2012, the Fund held investments in restricted securities, excluding certain securities exempt from registration under the 1933 Act deemed to be liquid, as follows:
| | | | | | | | | | | | | | | | |
| Shares | | | Issuer | | Acquisition
Dates | | | Cost | | | Value | |
| | 10,000 | | | aNewPage Holdings Inc. (Value is 0.07% of Net Assets) | | | 9/17/09-3/3/10 | | | $ | 2,411,281 | | | $ | 958,000 | |
| | | | | | | | | | | | |
aThe Fund also invests in unrestricted security or other investments in the issuer, valued at $– as of December 31, 2012.
10. OTHER DERIVATIVE INFORMATION
At December 31, 2012, the Fund’s investments in derivative contracts are reflected on the Statement of Assets and Liabilities as follows:
| | | | | | | | | | | | |
| | | Asset Derivatives | | | Liability Derivatives | |
Derivative Contracts Not Accounted
for as Hedging Instruments | | Statement of Assets and
Liabilities Location | | Fair Value
Amount | | | Statement of Assets and
Liabilities Location | | Fair Value
Amount | |
Foreign exchange contracts | | Unrealized appreciation on forward exchange contracts | | $ | 5,765,812 | | | Unrealized depreciation on forward exchange contracts | | $ | 4,897,317 | |
Credit contracts | | Unrealized appreciation on swap contracts | | | 11,064 | | | Unrealized depreciation on swap contracts | | | 3,841 | |
FSI-48
Franklin Templeton Variable Insurance Products Trust
Notes to Financial Statements (continued)
Franklin Strategic Income Securities Fund
10. OTHER DERIVATIVE INFORMATION (continued)
For the year ended December 31, 2012, the effect of derivative contracts on the Fund’s Statement of Operations was as follows:
| | | | | | | | | | |
Derivative Contracts Not Accounted
for as Hedging Instruments | | Statement of Operations Locations | | Realized Gain
(Loss) for the
Year | | | Change in
Unrealized
Appreciation
(Depreciation)
for the
Year | |
Foreign exchange contracts | | Net realized gain (loss) from foreign currency transactions / Net change in unrealized appreciation (depreciation) on translation of other assets and liabilities denominated in foreign currencies | | $ | 8,760,074 | | | $ | (1,967,454 | ) |
Credit contracts | | Net realized gain (loss) from swap contracts / Net change in unrealized appreciation (depreciation) on investments | | | 2,626,286 | | | | (769,556 | ) |
For the year ended December 31, 2012, the average month end market value of derivatives represented 0.83% of average month end net assets. The average month end number of open derivative contracts for the year was 207.
See Note 1(d) regarding derivative financial instruments.
11. CREDIT FACILITY
The Fund, together with other U.S. registered and foreign investment funds (collectively, Borrowers), managed by Franklin Templeton Investments, are borrowers in a joint syndicated senior unsecured credit facility totaling $1.5 billion (Global Credit Facility) which matured on January 18, 2013. This Global Credit Facility provides a source of funds to the Borrowers for temporary and emergency purposes, including the ability to meet future unanticipated or unusually large redemption requests. Effective January 18, 2013, the Borrowers renewed the Global Credit Facility, which matures on January 17, 2014.
Under the terms of the Global Credit Facility, the Fund shall, in addition to interest charged on any borrowings made by the Fund and other costs incurred by the Fund, pay its share of fees and expenses incurred in connection with the implementation and maintenance of the Global Credit Facility, based upon its relative share of the aggregate net assets of all of the Borrowers, including an annual commitment fee of 0.07% based upon the unused portion of the Global Credit Facility. These fees are reflected in other expenses on the Statement of Operations. During the year ended December 31, 2012, the Fund did not use the Global Credit Facility.
12. FAIR VALUE MEASUREMENTS
The Fund follows a fair value hierarchy that distinguishes between market data obtained from independent sources (observable inputs) and the Fund’s own market assumptions (unobservable inputs). These inputs are used in determining the value of the Fund’s financial instruments and are summarized in the following fair value hierarchy:
| | • | | Level 1 – quoted prices in active markets for identical financial instruments |
| | • | | Level 2 – other significant observable inputs (including quoted prices for similar financial instruments, interest rates, prepayment speed, credit risk, etc.) |
| | • | | Level 3 – significant unobservable inputs (including the Fund’s own assumptions in determining the fair value of financial instruments) |
FSI-49
Franklin Templeton Variable Insurance Products Trust
Notes to Financial Statements (continued)
Franklin Strategic Income Securities Fund
12. FAIR VALUE MEASUREMENTS (continued)
The inputs or methodology used for valuing financial instruments are not an indication of the risk associated with investing in those financial instruments.
For movements between the levels within the fair value hierarchy, the Fund has adopted a policy of recognizing the transfers as of the date of the underlying event which caused the movement.
A summary of inputs used as of December 31, 2012, in valuing the Fund’s assets and liabilities carried at fair value, is as follows:
| | | | | | | | | | | | | | | | |
| | | Level 1 | | | Level 2 | | | Level 3 | | | Total | |
| | | | |
Assets: | | | | | | | | | | | | | | | | |
Investments in Securities: | | | | | | | | | | | | | | | | |
Equity Investments:a | | | | | | | | | | | | | | | | |
Consumer Services | | $ | — | | | $ | 1,730,319 | | | $ | — | | | $ | 1,730,319 | |
Materials | | | — | | | | 958,000 | | | | — | c | | | 958,000 | |
Media | | | — | | | | 7,936,727 | | | | — | | | | 7,936,727 | |
Other Equity Investmentsb | | | 922,090 | | | | — | | | | — | c | | | 922,090 | |
Corporate Bonds | | | — | | | | 468,912,779 | | | | — | | | | 468,912,779 | |
Senior Floating Rate Interests | | | — | | | | 242,608,136 | | | | — | | | | 242,608,136 | |
Foreign Government and Agency Securities | | | — | | | | 289,750,686 | | | | — | | | | 289,750,686 | |
U.S. Government and Agency Securities | | | — | | | | 29,183,603 | | | | — | | | | 29,183,603 | |
Asset-Backed Securities and Commercial Mortgage-Backed Securities | | | — | | | | 45,937,465 | | | | — | | | | 45,937,465 | |
Mortgage-Backed Securities | | | — | | | | 82,262,100 | | | | — | | | | 82,262,100 | |
Municipal Bonds | | | — | | | | 25,654,792 | | | | — | | | | 25,654,792 | |
Short Term Investments | | | 125,449,996 | | | | 54,407,132 | | | | — | | | | 179,857,128 | |
| | | | |
Total Investments in Securities | | $ | 126,372,086 | | | $ | 1,249,341,739 | | | $ | — | | | $ | 1,375,713,825 | |
| | | | |
Forward Exchange Contracts | | | — | | | | 5,765,812 | | | | — | | | | 5,765,812 | |
Swaps | | | — | | | | 11,064 | | | | — | | | | 11,064 | |
Liabilities: | | | | | | | | | | | | | | | | |
Forward Exchange Contracts | | | — | | | | 4,897,317 | | | | — | | | | 4,897,317 | |
Swaps | | | — | | | | 3,841 | | | | — | | | | 3,841 | |
aIncludes common and preferred stocks as well as other equity investments.
bFor detailed categories, see the accompanying Statement of Investments.
cIncludes securities determined to have no value at December 31, 2012.
A reconciliation of assets in which Level 3 inputs are used in determining fair value is presented when there are significant Level 3 investments at the end of the year.
13. NEW ACCOUNTING PRONOUNCEMENTS
In December 2011, the Financial Accounting Standards Board (FASB) issued Accounting Standards Update (ASU) No. 2011-11, Balance Sheet (Topic 210): Disclosures about Offsetting Assets and Liabilities. The amendments in the ASU enhance disclosures about offsetting of financial assets and liabilities to enable investors to understand the effect of these arrangements on a fund’s financial position. In January 2013, FASB issued ASU No. 2013-01, Balance Sheet (Topic 210): Clarifying the Scope of Disclosures about Offsetting Assets and Liabilities. The amendments in ASU No. 2013-01 clarify the intended scope of disclosures required by ASU No. 2011-11. These ASUs are effective for interim and annual reporting periods beginning on or after January 1, 2013. The Fund believes the adoption of these ASUs will not have a material impact on its financial statements.
FSI-50
Franklin Templeton Variable Insurance Products Trust
Notes to Financial Statements (continued)
Franklin Strategic Income Securities Fund
14. SUBSEQUENT EVENTS
The Fund has evaluated subsequent events through the issuance of the financial statements and determined that no events have occurred that require disclosure other than those already disclosed in the financial statements.
| | | | |
ABBREVIATIONS | | | | |
| Counterparty | | Currency | | Selected Portfolio |
| | | | |
| BZWS - Barclays Bank PLC | | AUD - Australian Dollar | | AGMC - Assured Guaranty Municipal Corp. |
| CITI - Citigroup, Inc. | | BRL - Brazilian Real | | CDO - Collateralized Debt Obligation |
| DBAB - Deutsche Bank AG | | EUR - Euro | | CLO - Collateralized Loan Obligation |
| GSCO - The Goldman Sachs | | GBP - British Pound | | DIP - Debtor-In-Possession |
| HSBC - HSBC Bank USA, N.A. | | HUF - Hungarian Forint | | FICO - Financing Corp. |
| JPHQ - JP Morgan Chase & Co. | | IDR - Indonesian Rupiah | | FRN - Floating Rate Note |
| MSCO - Morgan Stanley | | ILS - New Israeli Shekel | | GO - General Obligation |
| UBSW - UBS AG | | KRW - South Korean Won | | L/C - Letter of Credit |
| | LKR - Sri Lankan Rupee | | NATL - National Public Financial Guarantee Corp. |
| | MXN - Mexican Peso | | PIK - Payment-In-Kind |
| | MYR - Malaysian Ringgit | | PL - Project Loan |
| | PHP - Philippine Peso | | SF - Single Family |
| | PLN - Polish Zloty | | USD - Unified/Union School District |
| | SEK - Swedish Krona | | |
| | SGD - Singapore Dollar | | |
| | UYU - Uruguayan Peso | | |
FSI-51
Franklin Templeton Variable Insurance Products Trust
Franklin Strategic Income Securities Fund
Report of Independent Registered Public Accounting Firm
To the Board of Trustees and Shareholders of Franklin Templeton Variable Insurance Products Trust
In our opinion, the accompanying statement of assets and liabilities, including the statement of investments, and the related statements of operations and of changes in net assets and the financial highlights present fairly, in all material respects, the financial position of Franklin Strategic Income Securities Fund (the “Fund”) at December 31, 2012, the results of its operations for the year then ended, the changes in its net assets for each of the two years in the period then ended and the financial highlights for the periods presented, in conformity with accounting principles generally accepted in the United States of America. These financial statements and financial highlights (hereafter referred to as “financial statements”) are the responsibility of the Fund’s management. Our responsibility is to express an opinion on these financial statements based on our audits. We conducted our audits of these financial statements in accordance with the standards of the Public Company Accounting Oversight Board (United States). Those standards require that we plan and perform the audit to obtain reasonable assurance about whether the financial statements are free of material misstatement. An audit includes examining, on a test basis, evidence supporting the amounts and disclosures in the financial statements, assessing the accounting principles used and significant estimates made by management, and evaluating the overall financial statement presentation. We believe that our audits, which included confirmation of securities at December 31, 2012 by correspondence with the custodian, transfer agent and brokers, provides a reasonable basis for our opinion.
PricewaterhouseCoopers LLP
San Francisco, California
February 15, 2013
FSI-52
Franklin Templeton Variable Insurance Products Trust
Tax Information (unaudited)
Franklin Strategic Income Securities Fund
Under Section 852(b)(3)(C) of the Internal Revenue Code, the Fund hereby reports the maximum amount allowable but no less than $1,573,324 as a long term capital gain dividend for the fiscal year ended December 31, 2012.
FSI-53
FRANKLIN TEMPLETON VIP FOUNDING FUNDS ALLOCATION FUND
This annual report for Franklin Templeton VIP Founding Funds Allocation Fund covers the fiscal year ended December 31, 2012.
Performance Summary as of 12/31/12
Average annual total return of Class 2 shares* represents the average annual change in value, assuming reinvestment of dividends and capital gains. Average returns smooth out variations in returns, which can be significant; they are not the same as year-by-year results.
Periods ended 12/31/12
| | | | | | | | | | | | |
| | | 1-Year | | | 5-Year | | | Inception
(7/2/07) | |
Average Annual Total Return | | | +15.33% | | | | +0.90% | | | | -0.48% | |
*The administrator has contractually agreed to waive or assume certain expenses so that common expenses of the Fund (excluding Rule 12b-1 fees and acquired fund fees and expenses) do not exceed 0.10% (other than certain nonroutine expenses) until 4/30/13. Fund investment results reflect the expense reduction, without which the results would have been lower.
Total Return Index Comparison for a Hypothetical $10,000 Investment (7/2/07–12/31/12)
The graph below shows the change in value of a hypothetical $10,000 investment in the Fund over the indicated period and includes reinvestment of any income or distributions. The Fund’s performance* is compared to the performance of the Standard & Poor’s® 500 Index (S&P 500®) and the MSCI World Index. One cannot invest directly in an index, and an index is not representative of the Fund’s portfolio. Please see Important Notes to Performance Information preceding the Fund Summaries.
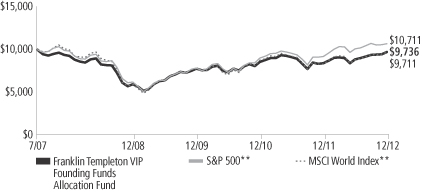
**Source: © 2013 Morningstar. Please see Index Descriptions following the Fund Summaries.
Franklin Templeton VIP Founding Funds Allocation Fund – Class 2
Performance reflects the Fund’s Class 2 operating expenses, but does not include any contract fees, expenses or sales charges. If they had been included, performance would be lower. These charges and deductions, particularly for variable life policies, can have a significant effect on contract values and insurance benefits. See the contract prospectus for a complete description of these expenses, including sales charges.
Performance data represent past performance, which does not guarantee future results. Investment return and principal value will fluctuate, and you may have a gain or loss when you sell your shares.
Current performance may differ from figures shown.
FFA-1
Fund Goals and Main Investments: Franklin Templeton VIP Founding Funds Allocation Fund seeks capital appreciation, with income as a secondary goal. Under normal market conditions, the Fund invests equal portions in Class 1 shares of Franklin Income Securities Fund, Mutual Shares Securities Fund and Templeton Growth Securities Fund.
Performance Overview
You can find the Fund’s one-year total return in the Performance Summary. For comparison, the S&P 500 delivered a +16.00% total return and the MSCI World Index generated a +16.54% total return for the same period.1
Economic and Market Overview
Headwinds to global growth negatively affected most world regions during 2012, including recently resilient emerging markets, and the International Monetary Fund lowered its global growth outlook. However, the slowdown appeared less severe than expected in developed markets such as Germany and the U.S. Several major governments intervened to support their countries’ currencies, liquidity and growth rates. European Central Bank (ECB) President Mario Draghi declared, “the ECB is ready to do whatever it takes to preserve the euro.” The U.S. Federal Reserve Board announced additional rounds of quantitative easing and extended its strategy designed to lower interest rates. China lowered borrowing costs for the first time in several years, and Japan’s central bank extended its quantitative easing program.
The U.S. economy grew moderately in 2012, supported by positive construction, housing and labor market trends. Consumer spending and personal income levels climbed, and inflation was generally mild with the exception of energy and food prices. Consumer sentiment rose to a five-year high, although potential U.S. tax hikes and spending cuts scheduled to take effect in 2013 dampened confidence near year-end. Just after year-end, Congress passed compromise legislation that preserved lower income tax rates for most U.S. households and delayed far-reaching federal spending cuts.
Stock markets were volatile with periodic downturns primarily attributable to concerns about slowing global economic growth, European sovereign debt and U.S. fiscal negotiations. As Europe’s leadership took
1. Source: © 2013 Morningstar. One cannot invest directly in an index, and an index is not representative of the Fund’s portfolio. Please see Index Descriptions following the Fund Summaries.
Fund Risks: All investments involve risks, including possible loss of principal. Because the Fund invests in underlying funds that may engage in a variety of investment strategies involving certain risks, the Fund may be subject to these same risks. Stock prices fluctuate, sometimes rapidly and dramatically, due to factors affecting individual companies, particular industries or sectors, or general market conditions. Bonds are affected by changes in interest rates and the creditworthiness of their issuers. Bond prices generally move in the opposite direction of interest rates. Thus, as the prices of bonds adjust to a rise in interest rates, the Fund’s share price may decline. Higher yielding, lower rated corporate bonds entail a greater degree of credit risk compared to investment-grade securities. Foreign investing carries additional risks such as currency and market volatility and political or social instability, risks that are heightened in developing countries. Value securities may not increase in price as anticipated or may decline further in value. These and other risks are described more fully in the Fund’s and underlying funds’ prospectuses.
FFA-2
measures to address the region’s fiscal debt crisis, investor attention shifted to the U.S. election and budget negotiations. Despite adversity and uncertainty in 2012, investors seemed to regain confidence in the latter half of the year and U.S. stocks, as measured by the S&P 500, as well as global developed stocks, as measured by the MSCI World Index, made solid 12-month gains.
Investment Strategy
The Fund normally invests its assets in an equally weighted combination of Class 1 shares of Franklin Income Securities Fund, Mutual Shares Securities Fund and Templeton Growth Securities Fund. These underlying funds, in turn, invest in a variety of U.S. and foreign equity securities and, to a lesser extent, fixed income and money market securities. As market conditions affect the value of the underlying funds, we rebalance the Fund’s allocations, seeking to maintain equal weightings of approximately 33 1⁄3% of total net assets in each underlying fund whenever the actual allocations exceed plus or minus 3% of the fixed allocation percentages.
Manager’s Discussion
The Fund’s performance can be attributed largely to its allocation among the underlying funds and their investments in domestic and foreign equities, fixed income securities, and short-term investments and other net assets.
During the fiscal year under review, Mutual Shares Securities Fund – Class 1 and Franklin Income Securities Fund – Class 1 underperformed the S&P 500. Templeton Growth Securities Fund – Class 1 outperformed the MSCI World Index.
Thank you for your participation in Franklin Templeton VIP Founding Funds Allocation Fund. We look forward to serving your future investment needs.
The foregoing information reflects our analysis, opinions and portfolio holdings as of December 31, 2012, the end of the reporting period. The way we implement our main investment strategies and the resulting portfolio holdings may change depending on factors such as market and economic conditions. These opinions may not be relied upon as investment advice or an offer for a particular security. The information is not a complete analysis of every aspect of any market, country, industry, security or the Fund. Statements of fact are from sources considered reliable, but the investment manager makes no representation or warranty as to their completeness or accuracy. Although historical performance is no guarantee of future results, these insights may help you understand our investment management philosophy.
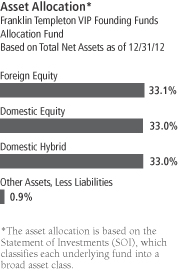
The dollar value, number of shares or principal amount, and names of all portfolio holdings are listed in the Fund’s SOI.
FFA-3
Fund Expenses
As an investor in a variable insurance contract (Contract) that indirectly provides for investment in an underlying mutual fund, you can incur transaction and/or ongoing expenses at both the Fund level and the Contract level.
| • | | Transaction expenses can include sales charges (loads) on purchases, redemption fees, surrender fees, transfer fees and premium taxes. |
| • | | Ongoing expenses can include management fees, distribution and service (12b-1) fees, contract fees, annual maintenance fees, mortality and expense risk fees and other fees and expenses. All mutual funds and Contracts have some types of ongoing expenses. |
The expenses shown in the table are meant to highlight ongoing expenses at the Fund level only and do not include ongoing expenses at the Contract level, or transaction expenses at either the Fund or Contract level. While the Fund does not have transaction expenses, if the transaction and ongoing expenses at the Contract level were included, the expenses shown would be higher. You should consult your Contract prospectus or disclosure document for more information.
The table shows Fund-level ongoing expenses and can help you understand these expenses and compare them with those of other mutual funds offered through the Contract. The table assumes a $1,000 investment held for the six months indicated. Please refer to the Fund prospectus for additional information on operating expenses.
Actual Fund Expenses
The first line (Actual) of the table provides actual account values and expenses. The “Ending Account Value” is derived from the Fund’s actual return, which includes the effect of ongoing Fund expenses, but does not include the effect of ongoing Contract expenses.
You can estimate the Fund-level expenses you incurred during the period by following these steps. Of course, your account value and expenses will differ from those in this illustration:
| 1. | Divide your account value by $1,000. |
If an account had an $8,600 value, then $8,600 ÷ $1,000 = 8.6.
| 2. | Multiply the result by the number under the heading “Fund-Level Expenses Incurred During Period.” |
If Fund-Level Expenses Incurred During Period were $7.50, then 8.6 x $7.50 = $64.50.
In this illustration, the estimated expenses incurred this period at the Fund level are $64.50.
Franklin Templeton VIP Founding Funds Allocation Fund – Class 2
FFA-4
Hypothetical Example for Comparison with Other Mutual Funds
Information in the second line (Hypothetical) of the table can help you compare ongoing expenses of the Fund with those of other mutual funds offered through the Contract. This information may not be used to estimate the actual ending account balance or expenses you incurred during the period. The hypothetical “Ending Account Value” is based on the Fund’s actual expense ratio and an assumed 5% annual rate of return before expenses, which does not represent the Fund’s actual return. The figure under the heading “Fund-Level Expenses Incurred During Period” shows the hypothetical expenses your account would have incurred under this scenario. You can compare this figure with the 5% hypothetical examples that appear in shareholder reports of other funds offered through a Contract.
| | | | | | | | | | | | | | | | |
| Class 2 | | Beginning
Account
Value 7/1/12 | | | Ending
Account
Value 12/31/12 | | | Expenses Paid
During Period*
7/1/12–12/31/12 | | | Expenses Paid
During Period** 7/1/12–12/31/12 | |
Actual | | $ | 1,000 | | | $ | 1,098.10 | | | $ | 1.85 | | | $ | 5.27 | |
Hypothetical (5% return before expenses) | | $ | 1,000 | | | $ | 1,023.38 | | | $ | 1.78 | | | $ | 5.08 | |
*Expenses are calculated using the most recent six-month annualized expense ratio excluding expenses of the underlying funds, net of expense waivers, for the Fund’s Class 2 shares (0.35%), which does not include any ongoing expenses of the Contract for which the Fund is an investment option, multiplied by the average account value over the period, multiplied by 184/366 to reflect the one-half year period.
**Expenses are calculated using the most recent six-month annualized expense ratio including expenses of the underlying funds, net of expense waivers, for the Fund’s Class 2 shares (1.00%), which does not include any ongoing expenses of the Contract for which the Fund is an investment option, multiplied by the average account value over the period, multiplied by 184/366 to reflect the one-half year period.
FFA-5
Franklin Templeton Variable Insurance Products Trust
Financial Highlights
Franklin Templeton VIP Founding Funds Allocation Fund
| | | | | | | | | | | | | | | | | | | | |
| | | Year Ended December 31, | |
| Class 1 | | 2012 | | | 2011 | | | 2010 | | | 2009 | | | 2008 | |
| | | | |
Per share operating performance | | | | | | | | | | | | | | | | | | | | |
(for a share outstanding throughout the year) | | | | | | | | | | | | | | | | | | | | |
Net asset value, beginning of year | | $ | 7.63 | | | $ | 7.73 | | | $ | 7.15 | | | $ | 5.61 | | | $ | 9.33 | |
| | | | |
Income from investment operationsa: | | | | | | | | | | | | | | | | | | | | |
Net investment incomeb,c | | | 0.26 | | | | 0.25 | | | | 0.24 | | | | 0.26 | | | | 0.28 | |
Net realized and unrealized gains (losses) | | | 0.90 | | | | (0.35 | ) | | | 0.52 | | | | 1.46 | | | | (3.64 | ) |
| | | | |
Total from investment operations | | | 1.16 | | | | (0.10 | ) | | | 0.76 | | | | 1.72 | | | | (3.36 | ) |
| | | | |
Less distributions from: | | | | | | | | | | | | | | | | | | | | |
Net investment income | | | (0.24 | ) | | | — | d | | | (0.18 | ) | | | (0.18 | ) | | | (0.19 | ) |
Net realized gains | | | — | | | | — | | | | — | d | | | — | | | | (0.17 | ) |
| | | | |
Total distributions | | | (0.24 | ) | | | — | d | | | (0.18 | ) | | | (0.18 | ) | | | (0.36 | ) |
| | | | |
Net asset value, end of year | | $ | 8.55 | | | $ | 7.63 | | | $ | 7.73 | | | $ | 7.15 | | | $ | 5.61 | |
| | | | |
| | | | | |
Total returne | | | 15.56% | | | | (1.28)% | | | | 10.64% | | | | 30.47% | | | | (35.75)% | |
Ratios to average net assets | | | | | | | | | | | | | | | | | | | | |
Expenses before waiver and payments by affiliatesf | | | 0.11% | | | | 0.11% | | | | 0.11% | | | | 0.12% | | | | 0.13% | |
Expenses net of waiver and payments by affiliatesf | | | 0.10% | | | | 0.10% | | | | 0.10% | | | | 0.10% | | | | 0.13% | |
Net investment incomec | | | 4.06% | | | | 3.44% | | | | 3.04% | | | | 4.16% | | | | 3.81% | |
| | | | | |
Supplemental data | | | | | | | | | | | | | | | | | | | | |
Net assets, end of year (000’s) | | $ | 767 | | | $ | 470 | | | $ | 437 | | | $ | 629 | | | $ | 339 | |
Portfolio turnover rate | | | 28.46% | g | | | 58.42% | | | | 17.81% | | | | 4.23% | | | | 22.09% | |
aThe amount shown for a share outstanding throughout the period may not correlate with the Statement of Operations for the period due to the timing of sales and repurchases of the Fund shares in relation to income earned and/or fluctuating market value of the investments of the Fund.
bBased on average daily shares outstanding.
cRecognition of net investment income by the Fund is affected by the timing of declaration of dividends by the Underlying Funds in which the Fund invests.
dAmount rounds to less than $0.01 per share.
eTotal return does not include fees, charges or expenses imposed by the variable annuity and life insurance contracts for which the Franklin Templeton Variable Insurance Products Trust serves as an underlying investment vehicle.
fDoes not include expenses of the Underlying Funds in which the Fund invests. The weighted average indirect expenses of the Underlying Funds was 0.65% for the year ended December 31, 2012.
gExcludes the value of portfolio securities delivered as a result of a redemption in-kind. See Note 9.
The accompanying notes are an integral part of these financial statements.
FFA-6
Franklin Templeton Variable Insurance Products Trust
Financial Highlights (continued)
Franklin Templeton VIP Founding Funds Allocation Fund
| | | | | | | | | | | | | | | | | | | | |
| | | Year Ended December 31, | |
| Class 2 | | 2012 | | | 2011 | | | 2010 | | | 2009 | | | 2008 | |
| | | | |
Per share operating performance | | | | | | | | | | | | | | | | | | | | |
(for a share outstanding throughout the year) | | | | | | | | | | | | | | | | | | | | |
Net asset value, beginning of year | | $ | 7.59 | | | $ | 7.71 | | | $ | 7.14 | | | $ | 5.61 | | | $ | 9.31 | |
| | | | |
Income from investment operationsa: | | | | | | | | | | | | | | | | | | | | |
Net investment incomeb,c | | | 0.25 | | | | 0.23 | | | | 0.21 | | | | 0.26 | | | | 0.27 | |
Net realized and unrealized gains (losses) | | | 0.89 | | | | (0.35 | ) | | | 0.52 | | | | 1.44 | | | | (3.63 | ) |
| | | | |
Total from investment operations | | | 1.14 | | | | (0.12 | ) | | | 0.73 | | | | 1.70 | | | | (3.36 | ) |
| | | | |
Less distributions from: | | | | | | | | | | | | | | | | | | | | |
Net investment income | | | (0.22 | ) | | | — | d | | | (0.16 | ) | | | (0.17 | ) | | | (0.17 | ) |
Net realized gains | | | — | | | | — | | | | — | d | | | — | | | | (0.17 | ) |
| | | | |
Total distributions | | | (0.22 | ) | | | — | d | | | (0.16 | ) | | | (0.17 | ) | | | (0.34 | ) |
| | | | |
Net asset value, end of year | | $ | 8.51 | | | $ | 7.59 | | | $ | 7.71 | | | $ | 7.14 | | | $ | 5.61 | |
| | | | |
| | | | | |
Total returne | | | 15.33% | | | | (1.54)% | | | | 10.25% | | | | 30.25% | | | | (35.87)% | |
Ratios to average net assets | | | | | | | | | | | | | | | | | | | | |
Expenses before waiver and payments by affiliatesf | | | 0.36% | | | | 0.36% | | | | 0.36% | | | | 0.37% | | | | 0.38% | |
Expenses net of waiver and payments by affiliatesf | | | 0.35% | | | | 0.35% | | | | 0.35% | | | | 0.35% | | | | 0.38% | |
Net investment incomec | | | 3.81% | | | | 3.19% | | | | 2.79% | | | | 3.91% | | | | 3.56% | |
| | | | | |
Supplemental data | | | | | | | | | | | | | | | | | | | | |
Net assets, end of year (000’s) | | $ | 472,686 | | | $ | 448,101 | | | $ | 488,057 | | | $ | 474,176 | | | $ | 338,320 | |
Portfolio turnover rate | | | 28.46% | g | | | 58.42% | | | | 17.81% | | | | 4.23% | | | | 22.09% | |
aThe amount shown for a share outstanding throughout the period may not correlate with the Statement of Operations for the period due to the timing of sales and repurchases of the Fund shares in relation to income earned and/or fluctuating market value of the investments of the Fund.
bBased on average daily shares outstanding.
cRecognition of net investment income by the Fund is affected by the timing of declaration of dividends by the Underlying Funds in which the Fund invests.
dAmount rounds to less than $0.01 per share.
eTotal return does not include fees, charges or expenses imposed by the variable annuity and life insurance contracts for which the Franklin Templeton Variable Insurance Products Trust serves as an underlying investment vehicle.
fDoes not include expenses of the Underlying Funds in which the Fund invests. The weighted average indirect expenses of the Underlying Funds was 0.65% for the year ended December 31, 2012.
gExcludes the value of portfolio securities delivered as a result of a redemption in-kind. See Note 9.
The accompanying notes are an integral part of these financial statements.
FFA-7
Franklin Templeton Variable Insurance Products Trust
Financial Highlights (continued)
Franklin Templeton VIP Founding Funds Allocation Fund
| | | | | | | | | | | | | | | | | | | | |
| | | Year Ended December 31, | |
| Class 4 | | 2012 | | | 2011 | | | 2010 | | | 2009 | | | 2008a | |
| | | | |
Per share operating performance | | | | | | | | | | | | | | | | | | | | |
(for a share outstanding throughout the year) | | | | | | | | | | | | | | | | | | | | |
Net asset value, beginning of year | | $ | 7.58 | | | $ | 7.71 | | | $ | 7.14 | | | $ | 5.62 | | | $ | 8.65 | |
| | | | |
Income from investment operationsb: | | | | | | | | | | | | | | | | | | | | |
Net investment incomec,d | | | 0.30 | | | | 0.24 | | | | 0.19 | | | | 0.23 | | | | 0.19 | |
Net realized and unrealized gains (losses) | | | 0.83 | | | | (0.37 | ) | | | 0.54 | | | | 1.46 | | | | (2.87 | ) |
| | | | |
Total from investment operations | | | 1.13 | | | | (0.13 | ) | | | 0.73 | | | | 1.69 | | | | (2.68 | ) |
| | | | |
Less distributions from: | | | | | | | | | | | | | | | | | | | | |
Net investment income | | | (0.22 | ) | | | — | e | | | (0.16 | ) | | | (0.17 | ) | | | (0.18 | ) |
Net realized gains | | | — | | | | — | | | | — | e | | | — | | | | (0.17 | ) |
| | | | |
Total distributions | | | (0.22 | ) | | | — | e | | | (0.16 | ) | | | (0.17 | ) | | | (0.35 | ) |
| | | | |
Net asset value, end of year | | $ | 8.49 | | | $ | 7.58 | | | $ | 7.71 | | | $ | 7.14 | | | $ | 5.62 | |
| | | | |
| | | | | |
Total returnf | | | 15.17% | | | | (1.67)% | | | | 10.24% | | | | 30.06% | | | | (30.81)% | |
Ratios to average net assetsg | | | | | | | | | | | | | | | | | | | | |
Expenses before waiver and payments by affiliatesh | | | 0.46% | | | | 0.46% | | | | 0.46% | | | | 0.47% | | | | 0.48% | |
Expenses net of waiver and payments by affiliatesh | | | 0.45% | | | | 0.45% | | | | 0.45% | | | | 0.45% | | | | 0.48% | |
Net investment incomed | | | 3.71% | | | | 3.09% | | | | 2.69% | | | | 3.81% | | | | 3.46% | |
| | | | | |
Supplemental data | | | | | | | | | | | | | | | | | | | | |
Net assets, end of year (000’s) | | $ | 493,813 | | | $ | 2,860,928 | | | $ | 3,036,272 | | | $ | 1,424,479 | | | $ | 263,001 | |
Portfolio turnover rate | | | 28.46% | i | | | 58.42% | | | | 17.81% | | | | 4.23% | | | | 22.09% | |
aFor the period February 29, 2008 (effective date) to December 31, 2008.
bThe amount shown for a share outstanding throughout the period may not correlate with the Statement of Operations for the period due to the timing of sales and repurchases of the Fund shares in relation to income earned and/or fluctuating market value of the investments of the Fund.
cBased on average daily shares outstanding.
dRecognition of net investment income by the Fund is affected by the timing of declaration of dividends by the Underlying Funds in which the Fund invests.
eAmount rounds to less than $0.01 per share.
fTotal return does not include fees, charges or expenses imposed by the variable annuity and life insurance contracts for which the Franklin Templeton Variable Insurance Products Trust serves as an underlying investment vehicle. Total return is not annualized for periods less than one year.
gRatios are annualized for periods less than one year.
hDoes not include expenses of the Underlying Funds in which the Fund invests. The weighted average indirect expenses of the Underlying Funds was 0.65% for the year ended December 31, 2012.
iExcludes the value of portfolio securities delivered as a result of a redemption in-kind. See Note 9.
The accompanying notes are an integral part of these financial statements.
FFA-8
Franklin Templeton Variable Insurance Products Trust
Statement of Investments, December 31, 2012
| | | | | | | | |
| Franklin Templeton VIP Founding Funds Allocation Fund | | Shares | | | Value | |
Investments in Underlying Fundsa | | | | | | | | |
Domestic Equity 33.0% | | | | | | | | |
Mutual Shares Securities Fund, Class 1 | | | 18,291,713 | | | $ | 319,190,399 | |
| | | | | | | | |
Domestic Hybrid 33.0% | | | | | | | | |
Franklin Income Securities Fund, Class 1 | | | 20,629,424 | | | | 319,137,195 | |
| | | | | | | | |
Foreign Equity 33.1% | | | | | | | | |
Templeton Growth Securities Fund, Class 1 | | | 26,363,969 | | | | 320,585,860 | |
| | | | | | | | |
Total Investments in Underlying Funds (Cost $798,575,781) 99.1% | | | | | | | 958,913,454 | |
Other Assets, less Liabilities 0.9% | | | | | | | 8,352,681 | |
| | | | | | | | |
Net Assets 100.0% | | | | | | $ | 967,266,135 | |
| | | | | | | | |
aSee Note 7 regarding investments in Underlying Funds.
The accompanying notes are an integral part of these financial statements.
FFA-9
Franklin Templeton Variable Insurance Products Trust
Financial Statements
Statement of Assets and Liabilities
December 31, 2012
| | | | |
| | | Franklin Templeton
VIP Founding Funds
Allocation Fund | |
Assets: | | | | |
Investments in Underlying Funds: (Note 7) | | | | |
Cost | | $ | 798,575,781 | |
| | | | |
Value | | $ | 958,913,454 | |
Cash | | | 10,193,428 | |
Receivables: | | | | |
Investment securities sold | | | 65,720 | |
Capital shares sold | | | 47,987 | |
Other assets | | | 79 | |
| | | | |
Total assets | | | 969,220,668 | |
| | | | |
Liabilities: | | | | |
Payables: | | | | |
Capital shares redeemed | | | 1,198,364 | |
Affiliates | | | 563,975 | |
Reports to shareholders | | | 122,243 | |
Accrued expenses and other liabilities | | | 69,951 | |
| | | | |
Total liabilities | | | 1,954,533 | |
| | | | |
Net assets, at value | | $ | 967,266,135 | |
| | | | |
Net assets consist of: | | | | |
Paid-in capital | | $ | 559,982,170 | |
Undistributed net investment income | | | 117,237,169 | |
Net unrealized appreciation (depreciation) | | | 160,337,673 | |
Accumulated net realized gain (loss) | | | 129,709,123 | |
| | | | |
Net assets, at value | | $ | 967,266,135 | |
| | | | |
Class 1: | | | | |
Net assets, at value | | $ | 766,917 | |
| | | | |
Shares outstanding | | | 89,667 | |
| | | | |
Net asset value and maximum offering price per share | | $ | 8.55 | |
| | | | |
Class 2: | | | | |
Net assets, at value | | $ | 472,686,190 | |
| | | | |
Shares outstanding | | | 55,528,026 | |
| | | | |
Net asset value and maximum offering price per share | | $ | 8.51 | |
| | | | |
Class 4: | | | | |
Net assets, at value | | $ | 493,813,028 | |
| | | | |
Shares outstanding | | | 58,152,196 | |
| | | | |
Net asset value and maximum offering price per share | | $ | 8.49 | |
| | | | |
The accompanying notes are an integral part of these financial statements.
FFA-10
Franklin Templeton Variable Insurance Products Trust
Financial Statements (continued)
Statement of Operations
for the year ended December 31, 2012
| | | | |
| | | Franklin Templeton
VIP Founding Funds
Allocation Fund | |
Investment income: | | | | |
Dividends from Underlying Funds (Note 7) | | $ | 130,914,037 | |
| | | | |
Expenses: | | | | |
Administrative fees (Note 3a) | | | 3,156,348 | |
Distribution fees: (Note 3b) | | | | |
Class 2 | | | 1,161,174 | |
Class 4 | | | 9,338,625 | |
Unaffiliated transfer agent fees | | | 1,333 | |
Custodian fees (Note 4) | | | 712 | |
Reports to shareholders | | | 229,505 | |
Professional fees | | | 85,077 | |
Trustees’ fees and expenses | | | 14,725 | |
Other | | | 22,347 | |
| | | | |
Total expenses | | | 14,009,846 | |
Expenses waived/paid by affiliates (Note 3d) | | | (353,698 | ) |
| | | | |
Net expenses | | | 13,656,148 | |
| | | | |
Net investment income | | | 117,257,889 | |
| | | | |
Realized and unrealized gains (losses): | | | | |
Net realized gain (loss) from sale of investments in Underlying Funds (includes gains from a redemption in-kind of $516,992,768) (Note 7 and 9) | | | 493,521,519 | |
Net change in unrealized appreciation (depreciation) on investments in Underlying Funds | | | (130,850,160 | ) |
| | | | |
Net realized and unrealized gain (loss) | | | 362,671,359 | |
| | | | |
Net increase (decrease) in net assets resulting from operations | | $ | 479,929,248 | |
| | | | |
The accompanying notes are an integral part of these financial statements.
FFA-11
Franklin Templeton Variable Insurance Products Trust
Financial Statements (continued)
Statements of Changes in Net Assets
| | | | | | | | |
| | | Franklin Templeton VIP Founding
Funds Allocation Fund | |
| | | Year Ended December 31, | |
| | | 2012 | | | 2011 | |
| | | | |
Increase (decrease) in net assets: | | | | | | | | |
Operations: | | | | | | | | |
Net investment income | | $ | 117,257,889 | | | $ | 115,027,209 | |
Net realized gain (loss) from Underlying Funds | | | 493,521,519 | | | | (183,417,581 | ) |
Net change in unrealized appreciation (depreciation) on investments in Underlying Funds | | | (130,850,160 | ) | | | (140,904,024 | ) |
| | | | |
Net increase (decrease) in net assets resulting from operations | | | 479,929,248 | | | | (209,294,396 | ) |
| | | | |
Distributions to shareholders from net investment income: | | | | | | | | |
Class 1 | | | (14,007 | ) | | | (68 | ) |
Class 2 | | | (12,894,473 | ) | | | (73,496 | ) |
Class 4 | | | (102,116,912 | ) | | | (555,926 | ) |
| | | | |
Total distributions to shareholders | | | (115,025,392 | ) | | | (629,490 | ) |
| | | | |
Capital share transactions: (Note 2) | | | | | | | | |
Class 1 | | | 221,759 | | | | 45,474 | |
Class 2 | | | (28,591,508 | ) | | | (32,955,021 | ) |
Class 4 | | | (2,678,766,884 | ) | | | 27,566,498 | |
| | | | |
Total capital share transactions | | | (2,707,136,633 | ) | | | (5,343,049 | ) |
| | | | |
Net increase (decrease) in net assets | | | (2,342,232,777 | ) | | | (215,266,935 | ) |
Net assets: | | | | | | | | |
Beginning of year | | | 3,309,498,912 | | | | 3,524,765,847 | |
| | | | |
End of year | | $ | 967,266,135 | | | $ | 3,309,498,912 | |
| | | | |
Undistributed net investment income included in net assets: | | | | | | | | |
End of year | | $ | 117,237,169 | | | $ | 115,004,672 | |
| | | | |
The accompanying notes are an integral part of these financial statements.
FFA-12
Franklin Templeton Variable Insurance Products Trust
Notes to Financial Statements
Franklin Templeton VIP Founding Funds Allocation Fund
1. ORGANIZATION AND SIGNIFICANT ACCOUNTING POLICIES
Franklin Templeton Variable Insurance Products Trust (Trust) is registered under the Investment Company Act of 1940, as amended, (1940 Act) as an open-end investment company, consisting of twenty separate funds. The Franklin Templeton VIP Founding Funds Allocation Fund (Fund) is included in this report. The financial statements of the remaining funds in the Trust are presented separately. The Fund invests primarily in other funds of the Trust (Underlying Funds). Shares of the Fund are generally sold only to insurance company separate accounts to fund the benefits of variable life insurance policies or variable annuity contracts. The Fund offers three classes of shares: Class 1, Class 2, and Class 4. Each class of shares differs by its distribution fees, voting rights on matters affecting a single class and its exchange privilege.
The following summarizes the Fund’s significant accounting policies.
a. Financial Instrument Valuation
The Fund’s investments in financial instruments are carried at fair value daily. Fair value is the price that would be received to sell an asset or paid to transfer a liability in an orderly transaction between market participants on the measurement date. Under procedures approved by the Fund’s Board of Trustees (the Board), the Fund’s administrator and other affiliates have formed the Valuation and Liquidity Oversight Committee (VLOC). The VLOC provides administration and oversight of the Fund’s valuation policies and procedures, which are approved annually by the Board. Investments in the Underlying Funds are valued at their closing net asset value each trading day.
b. Income Taxes
It is the Fund’s policy to qualify as a regulated investment company under the Internal Revenue Code. The Fund intends to distribute to shareholders substantially all of its taxable income and net realized gains to relieve it from federal income and if applicable, excise taxes. As a result, no provision for U.S. federal income taxes is required.
The Fund recognizes the tax benefits of uncertain tax positions only when the position is “more likely than not” to be sustained upon examination by the tax authorities based on the technical merits of the tax position. As of December 31, 2012, and for all open tax years, the Fund has determined that no liability for unrecognized tax benefits is required in the Fund’s financial statements related to uncertain tax positions taken on a tax return (or expected to be taken on future tax returns). Open tax years are those that remain subject to examination and are based on each tax jurisdiction statute of limitation.
c. Security Transactions, Investment Income, Expenses and Distributions
Security transactions are accounted for on trade date. Realized gains and losses on security transactions are determined on a specific identification basis. Estimated expenses are accrued daily. Dividend income and realized gain distributions by Underlying Funds are recorded on the ex-dividend date. Distributions to shareholders are recorded on the ex-dividend date and are determined according to income tax regulations (tax basis). Distributable earnings determined on a tax basis may differ from earnings recorded in accordance with accounting principles generally accepted in the United States of America. These differences may be permanent or temporary. Permanent differences are reclassified among capital accounts to reflect their tax character. These reclassifications have no impact on net assets or the results of operations. Temporary differences are not reclassified, as they may reverse in subsequent periods.
Common expenses incurred by the Trust are allocated among the funds based on the ratio of net assets of each fund to the combined net assets of the Trust. Fund specific expenses are charged directly to the fund that incurred the expense.
The Fund indirectly bears its proportionate share of expenses from the Underlying Funds. Since the Underlying Funds have varied expense levels and the Fund may own different proportions of the Underlying Funds at different times, the amount of expenses incurred indirectly by the Fund will vary.
FFA-13
Franklin Templeton Variable Insurance Products Trust
Notes to Financial Statements (continued)
Franklin Templeton VIP Founding Funds Allocation Fund
1. ORGANIZATION AND SIGNIFICANT ACCOUNTING POLICIES (continued)
c. Security Transactions, Investment Income, Expenses and Distributions (continued)
Realized and unrealized gains and losses and net investment income, not including class specific expenses, are allocated daily to each class of shares based upon the relative proportion of net assets of each class. Differences in per share distributions, by class, are generally due to differences in class specific expenses.
d. Accounting Estimates
The preparation of financial statements in accordance with accounting principles generally accepted in the United States of America requires management to make estimates and assumptions that affect the reported amounts of assets and liabilities at the date of the financial statements and the amounts of income and expenses during the reporting period. Actual results could differ from those estimates.
e. Guarantees and Indemnifications
Under the Trust’s organizational documents, its officers and trustees are indemnified by the Trust against certain liabilities arising out of the performance of their duties to the Trust. Additionally, in the normal course of business, the Trust, on behalf of the Fund, enters into contracts with service providers that contain general indemnification clauses. The Trust’s maximum exposure under these arrangements is unknown as this would involve future claims that may be made against the Trust that have not yet occurred. Currently, the Trust expects the risk of loss to be remote.
2. SHARES OF BENEFICIAL INTEREST
At December 31, 2012, there were an unlimited number of shares authorized (without par value). Transactions in the Fund’s shares were as follows:
| | | | | | | | | | | | | | | | |
| | | Year Ended December 31, | |
| | | 2012 | | | 2011 | |
| Class 1 Shares: | | Shares | | | Amount | | | Shares | | | Amount | |
Shares sold | | | 49,376 | | | $ | 392,149 | | | | 12,893 | | | $ | 104,448 | |
Shares issued in reinvestment of distributions | | | 1,805 | | | | 14,007 | | | | 9 | | | | 68 | |
Shares redeemed | | | (23,150 | ) | | | (184,397 | ) | | | (7,764 | ) | | | (59,042 | ) |
| | | | |
Net increase (decrease) | | | 28,031 | | | $ | 221,759 | | | | 5,138 | | | $ | 45,474 | |
| | | | |
Class 2 Shares: | | | | | | | | | | | | | | | | |
Shares sold | | | 2,983,614 | | | $ | 23,927,917 | | | | 6,091,791 | | | $ | 47,334,953 | |
Shares issued in reinvestment of distributions | | | 1,665,953 | | | | 12,894,473 | | | | 9,187 | | | | 73,496 | |
Shares redeemed | | | (8,143,086 | ) | | | (65,413,898 | ) | | | (10,341,627 | ) | | | (80,363,470 | ) |
| | | | |
Net increase (decrease) | | | (3,493,519 | ) | | $ | (28,591,508 | ) | | | (4,240,649 | ) | | $ | (32,955,021 | ) |
| | | | |
Class 4 Shares: | | | | | | | | | | | | | | | | |
Shares sold | | | 204,285,414 | | | $ | 1,616,018,782 | | | | 298,702,307 | | | $ | 2,283,542,888 | |
Shares issued on reinvestment of distributions | | | 13,227,579 | | | | 102,116,912 | | | | 69,578 | | | | 555,926 | |
Shares redeemed in-kind (Note 9) | | | (291,650,709 | ) | | | (2,437,937,443 | ) | | | — | | | | — | |
Shares redeemed | | | (245,221,948 | ) | | | (1,958,965,135 | ) | | | (315,059,008 | ) | | | (2,256,532,316 | ) |
| | | | |
Net increase (decrease) | | | (319,359,664 | ) | | $ | (2,678,766,884 | ) | | | (16,287,123 | ) | | $ | 27,566,498 | |
| | | | |
FFA-14
Franklin Templeton Variable Insurance Products Trust
Notes to Financial Statements (continued)
Franklin Templeton VIP Founding Funds Allocation Fund
3. TRANSACTIONS WITH AFFILIATES
Franklin Resources, Inc. is the holding company for various subsidiaries that together are referred to as Franklin Templeton Investments. Certain officers and trustees of the Fund are also officers and/or directors of certain of the Underlying Funds and of the following subsidiaries:
| | |
| Subsidiary | | Affiliation |
Franklin Templeton Services, LLC (FT Services) | | Administrative manager |
Franklin Templeton Distributors, Inc. (Distributors) | | Principal underwriter |
Franklin Templeton Investor Services, LLC (Investor Services) | | Transfer agent |
a. Administrative Fees
The Fund pays an administrative fee to FT Services of 0.10% per year of the average daily net assets of the Fund for administrative services including monitoring and rebalancing the percentage of each Fund’s investment in the Underlying Funds.
b. Distribution Fees
The Board has adopted distribution plans for Class 2 and Class 4 shares pursuant to Rule 12b-1 under the 1940 Act. Under the Fund’s compensation distribution plans, the Fund pays Distributors for costs incurred in connection with the servicing, sale and distribution of the Fund’s shares up to 0.35% per year of its average daily net assets of each class. Some distribution fees are not charged on shares held by affiliates. The Board has agreed to limit the current rate to 0.25% per year for Class 2.
c. Transfer Agent Fees
Investor Services, under terms of an agreement, performs shareholder servicing for the Fund and is not paid by the Fund for the services.
d. Waiver and Expense Reimbursements
FT Services has contractually agreed in advance to waive or limit its fees and to assume as its own expense certain expenses otherwise payable by the Fund so that the common expenses (i.e. a combination of administrative fees and other expenses, but excluding distribution fees and acquired fund fees and expenses) for each class of the Fund do not exceed 0.10% (other than certain non-routine expenses or costs, including those relating to litigation, indemnification, reorganizations, and liquidations) until April 30, 2013.
4. EXPENSE OFFSET ARRANGEMENT
The Fund has entered into an arrangement with its custodian whereby credits realized as a result of uninvested cash balances are used to reduce a portion of the Fund’s custodian expenses. During the year ended December 31, 2012, there were no credits earned.
5. INCOME TAXES
For tax purposes, capital losses may be carried over to offset future capital gains, if any. During the year ended December 31, 2012, the Fund utilized $114,009,072 of capital loss carryforwards.
FFA-15
Franklin Templeton Variable Insurance Products Trust
Notes to Financial Statements (continued)
Franklin Templeton VIP Founding Funds Allocation Fund
5. INCOME TAXES (continued)
The tax character of distributions paid during the years ended December 31, 2012 and 2011, was as follows:
| | | | | | | | |
| | | 2012 | | | 2011 | |
Distributions paid from ordinary income | | $ | 115,025,392 | | | $ | 629,490 | |
| | | | |
At December 31, 2012, the cost of investments, net unrealized appreciation (depreciation), undistributed ordinary income and undistributed long term capital gains for income tax purposes were as follows:
| | | | |
Cost of investment | | $ | 855,355,669 | |
| | | | |
| |
Unrealized appreciation | | $ | 103,557,785 | |
Unrealized depreciation | | | — | |
| | | | |
Net unrealized appreciation (depreciation) | | $ | 103,557,785 | |
| | | | |
| |
Undistributed ordinary income | | $ | 117,237,169 | |
Undistributed long term capital gains | | | 186,489,008 | |
| | | | |
Distributable earnings | | $ | 303,726,177 | |
| | | | |
Differences between income and/or capital gains as determined on a book basis and a tax basis are primarily due to differing treatment of wash sales.
6. INVESTMENT TRANSACTIONS
Purchases and sales of Underlying Funds (excluding short term securities) for the year ended December 31, 2012, aggregated $1,615,914,036 and $822,960,293, respectively. Investment transactions exclude in-kind transactions of $2,437,937,443.
7. INVESTMENTS IN UNDERLYING FUNDS
The Fund invests primarily in the Underlying Funds which are managed by affiliates of the Fund’s administrative manager, FT Services. The Fund does not invest in the Underlying Funds for the purpose of exercising a controlling influence over the management or policies. Investments in Underlying Funds for the year ended December 31, 2012, were as follows:
| | | | | | | | | | | | | | | | | | | | | | | | | | | | | | | | |
| Underlying Funds | | Number
of Shares
Held at
Beginning
of Year | | | Gross
Additions | | | Gross
Reductions | | | Number
of Shares
Held at
End of
Year | | | Value at
End of
Year | | | Investment
Income | | | Realized
Capital
Gain (Loss) | | | % of
Underlying
Fund Shares
Outstanding
Held at End
of Year | |
Franklin Income Securities Fund,
Class I | | | 71,098,618 | | | | 43,591,512 | | | | 94,060,706 | | | | 20,629,424 | | | $ | 319,137,195 | | | $ | 73,110,255 | | | $ | (304,064 | ) | | | 4.33% | |
Mutual Shares Securities Fund,
Class I | | | 67,201,395 | | | | 31,264,993 | | | | 80,174,675 | | | | 18,291,713 | | | | 319,190,399 | | | | 30,358,997 | | | | (6,385,452 | ) | | | 6.74% | |
Templeton Growth Securities Fund,
Class I | | | 102,526,012 | | | | 41,681,527 | | | | 117,843,570 | | | | 26,363,969 | | | | 320,585,860 | | | | 27,444,785 | | | | (16,781,733 | ) | | | 16.71% | |
| | | | | | | | | | | | | | | | | | | |
Total | | | | | | | | | | | | | | | | | | $ | 958,913,454 | | | $ | 130,914,037 | | | $ | (23,471,249 | ) | | | | |
| | | | | | | | | | | | | | | | | | | |
FFA-16
Franklin Templeton Variable Insurance Products Trust
Notes to Financial Statements (continued)
Franklin Templeton VIP Founding Funds Allocation Fund
8. CREDIT FACILITY
The Fund, together with other U.S. registered and foreign investment funds (collectively, Borrowers), managed by Franklin Templeton Investments, are borrowers in a joint syndicated senior unsecured credit facility totaling $1.5 billion (Global Credit Facility) which matured on January 18, 2013. This Global Credit Facility provides a source of funds to the Borrowers for temporary and emergency purposes, including the ability to meet future unanticipated or unusually large redemption requests. Effective January 18, 2013, the Borrowers renewed the Global Credit Facility, which matures on January 17, 2014.
Under the terms of the Global Credit Facility, the Fund shall, in addition to interest charged on any borrowings made by the Fund and other costs incurred by the Fund, pay its share of fees and expenses incurred in connection with the implementation and maintenance of the Global Credit Facility, based upon its relative share of the aggregate net assets of all of the Borrowers, including an annual commitment fee of 0.07% based upon the unused portion of the Global Credit Facility. These fees are reflected in other expenses on the Statement of Operations. During the year ended December 31, 2012, the Fund did not use the Global Credit Facility.
9. REDEMPTION IN-KIND
During the year ended December 31, 2012, the Fund realized $516,992,768 of net gains resulting from a redemption in which a shareholder redeemed fund shares for securities held by the Underlying Funds and cash.
10. FAIR VALUE MEASUREMENTS
The Fund follows a fair value hierarchy that distinguishes between market data obtained from independent sources (observable inputs) and the Fund’s own market assumptions (unobservable inputs). These inputs are used in determining the value of the Fund’s financial instruments and are summarized in the following fair value hierarchy:
| | • | | Level 1 – quoted prices in active markets for identical financial instruments |
| | • | | Level 2 – other significant observable inputs (including quoted prices for similar financial instruments, interest rates, prepayment speed, credit risk, etc.) |
| | • | | Level 3 – significant unobservable inputs (including the Fund’s own assumptions in determining the fair value of financial instruments) |
The inputs or methodology used for valuing financial instruments are not an indication of the risk associated with investing in those financial instruments.
For movements between the levels within the fair value hierarchy, the Fund has adopted a policy of recognizing the transfers as of the date of the underlying event which caused the movement.
At December 31, 2012, all of the Fund’s investments in financial instruments carried at fair value were valued using Level 1 inputs. For detailed categories, see the accompanying Statement of Investments.
11. SUBSEQUENT EVENTS
The Fund has evaluated subsequent events through the issuance of the financial statements and determined that no events have occurred that require disclosure other than those already disclosed in the financial statements.
FFA-17
Franklin Templeton Variable Insurance Products Trust
Franklin Templeton VIP Founding Funds Allocation Fund
Report of Independent Registered Public Accounting Firm
To the Board of Trustees and Shareholders of
Franklin Templeton Variable Insurance Products Trust
In our opinion, the accompanying statement of assets and liabilities, including the statement of investments, and the related statements of operations and of changes in net assets and the financial highlights present fairly, in all material respects, the financial position of Franklin Templeton VIP Founding Funds Allocation Fund (the “Fund”) at December 31, 2012, the results of its operations for the year then ended, the changes in its net assets for each of the two years in the period then ended and the financial highlights for the periods presented, in conformity with accounting principles generally accepted in the United States of America. These financial statements and financial highlights (hereafter referred to as “financial statements”) are the responsibility of the Fund’s management. Our responsibility is to express an opinion on these financial statements based on our audits. We conducted our audits of these financial statements in accordance with the standards of the Public Company Accounting Oversight Board (United States). Those standards require that we plan and perform the audit to obtain reasonable assurance about whether the financial statements are free of material misstatement. An audit includes examining, on a test basis, evidence supporting the amounts and disclosures in the financial statements, assessing the accounting principles used and significant estimates made by management, and evaluating the overall financial statement presentation. We believe that our audits, which included confirmation of securities at December 31, 2012 by correspondence with the custodian, transfer agent and brokers, provide a reasonable basis for our opinion.
PricewaterhouseCoopers LLP
San Francisco, California
February 15, 2013
FFA-18
Franklin Templeton Variable Insurance Products Trust
Tax Information (unaudited)
Franklin Templeton VIP Founding Funds Allocation Fund
Under Section 854(b)(1)(A) of the Internal Revenue Code (Code), the Fund hereby reports 34.92% of the ordinary income dividends as income qualifying for the dividends received deduction for the fiscal year ended December 31, 2012.
During the fiscal year ended December 31, 2012, the Fund, a qualified fund of funds under Section 852(g)(2) of the Code, received an allocation of foreign taxes paid from one or more of its underlying funds. As shown in the table below, the Fund hereby reports to shareholders the foreign source income and foreign taxes paid by underlying funds, pursuant to Section 853 of the Code. This written statement will allow shareholders of record on April 12, 2012, to treat their proportionate share of foreign taxes paid by the underlying funds as having been paid directly by them. The shareholder shall consider these amounts as foreign taxes paid in the tax year in which they receive the Fund distribution.
The following table provides a detailed analysis of foreign tax paid and foreign source income as reported by the Fund, to Class 1, Class 2, and Class 4 shareholders of record.
| | | | | | | | |
| Class | | Foreign Tax
Paid
Per Share | | | Foreign
Source Income
Per Share | |
Class 1 | | $ | 0.0038 | | | $ | 0.0324 | |
Class 2 | | $ | 0.0038 | | | $ | 0.0324 | |
Class 4 | | $ | 0.0038 | | | $ | 0.0324 | |
Foreign Tax Paid Per Share (Column 1) is the amount per share available to you, as a tax credit (assuming you held your shares in the Fund for a minimum of 16 days during the 31-day period beginning 15 days before the ex-dividend date of the Fund’s distribution to which the foreign taxes relate), or, as a tax deduction.
Foreign Source Income Per Share (Column 2) is the amount per share of income dividends attributable to foreign securities held by the underlying funds, plus any foreign taxes withheld on these dividends. The amounts reported include foreign source qualified dividends that have not been adjusted for the rate differential applicable to such dividend income.
FFA-19
FRANKLIN U.S. GOVERNMENT FUND
We are pleased to bring you Franklin U.S. Government Fund’s annual report for the fiscal year ended December 31, 2012.
Performance Summary as of 12/31/12
Average annual total return of Class 2 shares represents the average annual change in value, assuming reinvestment of dividends and capital gains. Average returns smooth out variations in returns, which can be significant; they are not the same as year-by-year results.
Periods ended 12/31/12
| | | | | | | | | | | | |
| | | 1-Year | | | 5-Year | | | 10-Year | |
Average Annual Total Return | | | +1.89% | | | | +4.69% | | | | +4.21% | |
Total Return Index Comparison for a Hypothetical $10,000 Investment (1/1/03–12/31/12)
The graph below shows the change in value of a hypothetical $10,000 investment in the Fund over the indicated period and includes reinvestment of any income or distributions. The Fund’s performance is compared to the performance of the Barclays U.S. Government Index: Intermediate Component, the Lipper VIP General U.S. Government Funds Classification Average and the Consumer Price Index (CPI). One cannot invest directly in an index, and an index is not representative of the Fund’s portfolio. Please see Important Notes to Performance Information preceding the Fund Summaries.
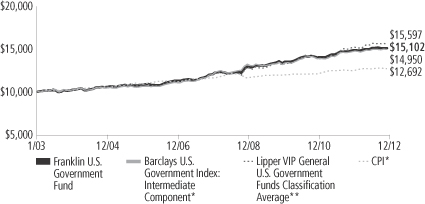
*Source: © 2013 Morningstar. Please see Index Descriptions following the Fund Summaries.
**Source: Lipper Inc. Please see Index Descriptions following the Fund Summaries.
Franklin U.S. Government Fund – Class 2
Performance reflects the Fund’s Class 2 operating expenses, but does not include any contract fees, expenses or sales charges. If they had been included, performance would be lower. These charges and deductions, particularly for variable life policies, can have a significant effect on contract values and insurance benefits. See the contract prospectus for a complete description of these expenses, including sales charges.
Performance data represent past performance, which does not guarantee future results. Investment return and principal value will fluctuate, and you may have a gain or loss when you sell your shares.
Current performance may differ from figures shown.
FUS-1
Fund Goal and Main Investments: Franklin U.S. Government Fund seeks income. Under normal market conditions, the Fund invests at least 80% of its net assets in U.S. government securities.
Performance Overview
You can find the Fund’s one-year total return in the Performance Summary. The Fund outperformed its benchmark, the Barclays U.S. Government Index: Intermediate Component, which delivered a +1.73% total return.1 The Fund underperformed its secondary benchmark, the Lipper VIP General U.S. Government Funds Classification Average, which posted a +2.80% total return.2 Funds in the Lipper average may allocate as much as 35% of their investments in asset types other than U.S. government and agency mortgage-backed securities.
Economic and Market Overview
During the 12 months under review, U.S. economic data remained mixed. Oil prices declined, and the housing sector strengthened with new and existing home sales as well as prices pointing toward a gradual strengthening trend, albeit from a low base. Consumer spending generally increased and consumer confidence reached its highest level during the period in November. However, manufacturing indicators weakened and gross domestic product growth was moderate.
In September, the Federal Reserve Board (Fed) acknowledged the need for further policy accommodation and announced a third round of quantitative easing (QE3). QE3 consisted of additional $40 billion monthly purchases of mortgage-backed securities until the labor market improves. The Fed also continued buying long-term Treasuries and selling short-term Treasuries in an effort to put downward pressure on long-term interest rates. In December, the Fed announced a 6.5% unemployment target as a guide to maintaining the historically low federal funds target rate. Economists, business leaders and market watchers were concerned about the U.S. “fiscal cliff” when, unless Congress acted, automatic income tax increases and federal budget cuts were scheduled to take effect in 2013. They feared these events could cause another U.S. recession. Not knowing whether the Congress and President would avert these measures after the U.S. election, many businesses delayed major investment and hiring decisions. Lawmakers reached a late compromise on January 1, 2013, a day after the reporting
1. Source: © 2013 Morningstar.
2. Source: Lipper, Inc.
One cannot invest directly in an index, and an index is not representative of the Fund’s portfolio. Please see Index Descriptions following the Fund Summaries.
Fund Risks: All investments involve risks, including possible loss of principal. The Fund’s share price and yield will be affected by interest rate movements and mortgage prepayments. Bond prices generally move in the opposite direction of interest rates. Thus, as the prices of bonds in the Fund adjust to a rise in interest rates, the Fund’s share price may decline. U.S. government securities owned by the Fund, but not shares of the Fund, may be guaranteed by the U.S. government, its agencies or instrumentalities as to the timely payment of principal and interest. The Fund’s yield and share price are not guaranteed and will fluctuate with market conditions. The Fund is actively managed but there is no guarantee that the manager’s investment decisions will produce the desired results. The Fund’s prospectus also includes a description of the main investment risks.
FUS-2
period ended. The approved legislation will maintain some tax cuts for most Americans but increase rates on the wealthiest. It will also delay the automatic federal spending cuts scheduled to start in January 2013.
Ongoing investor concerns about the fiscal cliff and eurozone uncertainty drove the 10-year U.S. Treasury note yield to 1.78% at year-end from 1.89% on December 31, 2011. During the 12 months under review, below-investment-grade corporate bonds, as measured by the Credit Suisse High Yield Index, produced strong returns and outperformed investment-grade fixed income markets, as measured by the Barclays U.S. Aggregate Index.3
Investment Strategy
Using our straightforward investment approach, we seek to produce current income with a high degree of credit safety from a conservatively managed portfolio of U.S. government securities. Analyzing securities using proprietary and nonproprietary research, we seek to identify attractive investment opportunities.
Manager’s Discussion
During the 12 months under review, markets were volatile given uncertainty regarding global economic growth, the political climate and domestic fiscal policy. In September, the Fed extended its long-term Treasury buying program called Operation Twist and launched an additional round of quantitative easing known as QE3. The new program included monthly $40 billion purchases of agency mortgage-backed securities (MBS) and provided strong technical support for the markets. Purchases were to continue indefinitely unless the outlook for the labor market improved “substantially.” As Operation Twist concluded at period-end, the Federal Open Market Committee announced it would extend its Treasury purchases.
Mortgages continued to perform well during the period and outperformed Treasuries. Valuations in the MBS sector were, in our opinion, more fairly valued and received additional support from market conditions including a limited supply of mortgages, additional Fed purchases, reinvestment of pay downs, and bank and mortgage REIT (real estate investment trust) demand. With mortgage rates at historical lows, we expect prepayments to continue to increase as they did in November and December 2012, although not to the extent reached in past prepayment waves. Factors including a decline in home price
3. Please see Index Descriptions following the Fund Summaries.
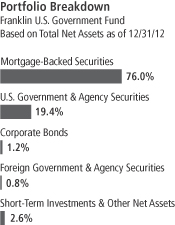
The dollar value, number of shares or principal amount, and names of all portfolio holdings are listed in the Fund’s Statement of Investments.
FUS-3
appreciation, loss of home equity, tighter underwriting standards and originator processing capacity continued to mitigate prepayment activity.
Within the agency mortgage pass-through sector, performance of Ginnie Mae (GNMA) MBS lagged that of their Fannie Mae (FNMA) and Freddie Mac (FHLMC) conventional MBS counterparts. Within GNMAs, lower coupon 3.5% GNMAs were the best performers from an excess return perspective, while higher coupon 5.0% and 5.5% GNMAs lagged. The Fund’s overweighted allocation to higher coupon 5.5% GNMA securities generally detracted from performance, as did the Fund’s underweighted allocation to lower coupon 3.0% securities. Our concentration in medium loan balance 5.0% securities generally produced favorable returns compared to their generic counterparts.
The Fund’s investment process and strategy did not change and the investment team continued to look for strong cashflow fundamentals and valuations to uncover opportunities across the agency mortgage and agency debenture universe. The Fund emphasized agency pass-throughs, primarily GNMA MBS, which remain the only MBS backed by the full faith and credit of the U.S. government, and invested in other agency securities for diversification.4
Over the period, the portfolio’s allocation of lower coupon bonds increased, following the shift in mortgage conditions toward coupon declines resulting from historically low mortgage rates. We remained allocated toward the GNMA sector and added to lower coupon 3.0% and 3.5% GNMA IIs (comprising multiple-issuer pools). We favored GNMAs versus conventional MBS and added to GNMA IIs as they offered slower prepayment rates and a more diversified profile. As mortgage rates continued to fall during the period, prepayments increased. In an effort to improve the portfolio’s prepayment performance, we shifted our coupon allocation, and swapped faster paying mortgage pools for those we believed would pay more slowly in the future.
4. Securities owned by the Fund, but not shares of the Fund, are guaranteed by the U.S. government, its agencies or instrumentalities as to timely payment of principal and interest. The Fund’s yield and share price are not guaranteed and will vary with market conditions.
FUS-4
Thank you for your participation in Franklin U.S. Government Fund. We look forward to serving your future investment needs.
The foregoing information reflects our analysis, opinions and portfolio holdings as of December 31, 2012, the end of the reporting period. The way we implement our main investment strategies and the resulting portfolio holdings may change depending on factors such as market and economic conditions. These opinions may not be relied upon as investment advice or an offer for a particular security. The information is not a complete analysis of every aspect of any market, country, industry, security or the Fund. Statements of fact are from sources considered reliable, but the investment manager makes no representation or warranty as to their completeness or accuracy. Although historical performance is no guarantee of future results, these insights may help you understand our investment management philosophy.
FUS-5
Fund Expenses
As an investor in a variable insurance contract (Contract) that indirectly provides for investment in an underlying mutual fund, you can incur transaction and/or ongoing expenses at both the Fund level and the Contract level.
| • | | Transaction expenses can include sales charges (loads) on purchases, redemption fees, surrender fees, transfer fees and premium taxes. |
| • | | Ongoing expenses can include management fees, distribution and service (12b-1) fees, contract fees, annual maintenance fees, mortality and expense risk fees and other fees and expenses. All mutual funds and Contracts have some types of ongoing expenses. |
The expenses shown in the table are meant to highlight ongoing expenses at the Fund level only and do not include ongoing expenses at the Contract level, or transaction expenses at either the Fund or Contract level. While the Fund does not have transaction expenses, if the transaction and ongoing expenses at the Contract level were included, the expenses shown below would be higher. You should consult your Contract prospectus or disclosure document for more information.
The table shows Fund-level ongoing expenses and can help you understand these expenses and compare them with those of other mutual funds offered through the Contract. The table assumes a $1,000 investment held for the six months indicated. Please refer to the Fund prospectus for additional information on operating expenses.
Actual Fund Expenses
The first line (Actual) of the table provides actual account values and expenses. The “Ending Account Value” is derived from the Fund’s actual return, which includes the effect of ongoing Fund expenses, but does not include the effect of ongoing Contract expenses.
You can estimate the Fund-level expenses you incurred during the period by following these steps. Of course, your account value and expenses will differ from those in this illustration:
| 1. | Divide your account value by $1,000. |
If an account had an $8,600 value, then $8,600 ÷ $1,000 = 8.6.
| 2. | Multiply the result by the number under the heading “Fund-Level Expenses Incurred During Period.” |
If Fund-Level Expenses Incurred During Period were $7.50, then 8.6 x $7.50 = $64.50.
In this illustration, the estimated expenses incurred this period at the Fund level are $64.50.
Franklin U.S. Government Fund – Class 2
FUS-6
Hypothetical Example for Comparison with Other Mutual Funds
Information in the second line (Hypothetical) of the table can help you compare ongoing expenses of the Fund with those of other mutual funds offered through the Contract. This information may not be used to estimate the actual ending account balance or expenses you incurred during the period. The hypothetical “Ending Account Value” is based on the Fund’s actual expense ratio and an assumed 5% annual rate of return before expenses, which does not represent the Fund’s actual return. The figure under the heading “Fund-Level Expenses Incurred During Period” shows the hypothetical expenses your account would have incurred under this scenario. You can compare this figure with the 5% hypothetical examples that appear in shareholder reports of other funds offered through a Contract.
| | | | | | | | | | | | |
| Class 2 | | Beginning
Account Value 7/1/12 | | | Ending
Account Value 12/31/12 | | | Fund-Level Expenses Incurred
During Period* 7/1/12–12/31/12 | |
Actual | | $ | 1,000 | | | $ | 1,006.80 | | | $ | 3.83 | |
Hypothetical (5% return
before expenses) | | $ | 1,000 | | | $ | 1,021.32 | | | $ | 3.86 | |
*Expenses are calculated using the most recent six-month annualized expense ratio for the Fund’s Class 2 shares (0.76%), which does not include any ongoing expenses of the Contract for which the Fund is an investment option, multiplied by the average account value over the period, multiplied by 184/366 to reflect the one-half year period.
FUS-7
SUPPLEMENT DATED SEPTEMBER 14, 2012
TOTHE PROSPECTUS
DATED MAY 1, 2012
OF
FRANKLIN U.S. GOVERNMENT FUND
(A series of Franklin Templeton Variable Insurance Products Trust)
The Prospectus is amended as follows:
For the Franklin U.S. Government Fund, the Financial Highlights tables on page FUS-D6 is replaced with the following:
| | | | | | | | | | | | | | | | | | | | |
| | | Year Ended December 31, | |
| Class 1 | | 2011 | | | 2010 | | | 2009 | | | 2008 | | | 2007 | |
| | | | |
Per share operating performance | | | | | | | | | | | | | | | | | | | | |
(for a share outstanding throughout the year) | | | | | | | | | | | | | | | | | | | | |
Net asset value, beginning of year | | $ | 13.34 | | | $ | 13.08 | | | $ | 13.19 | | | $ | 12.89 | | | $ | 12.69 | |
| | | | |
Income from investment operations:a | | | | | | | | | | | | | | | | | | | | |
Net investment incomeb | | | 0.42 | | | | 0.47 | | | | 0.52 | | | | 0.59 | | | | 0.62 | |
Net realized and unrealized gains (losses) | | | 0.36 | | | | 0.25 | | | | (0.09 | ) | | | 0.38 | | | | 0.21 | |
| | | | |
Total from investment operations | | | 0.78 | | | | 0.72 | | | | 0.43 | | | | 0.97 | | | | 0.83 | |
| | | | |
Less distributions from net investment income | | | (0.45 | ) | | | (0.46 | ) | | | (0.54 | ) | | | (0.67 | ) | | | (0.63 | ) |
| | | | |
Net asset value, end of year | | $ | 13.67 | | | $ | 13.34 | | | $ | 13.08 | | | $ | 13.19 | | | $ | 12.89 | |
| | | | |
| | | | | |
Total returnc | | | 5.96% | | | | 5.56% | | | | 3.34% | | | | 7.91% | | | | 6.85% | |
Ratios to average net assets | | | | | | | | | | | | | | | | | | | | |
Expenses | | | 0.51% | | | | 0.52% | | | | 0.53% | | | | 0.53% | d | | | 0.53% | d |
Net investment income | | | 3.11% | | | | 3.51% | | | | 3.96% | | | | 4.59% | | | | 4.88% | |
| | | | | |
Supplemental data | | | | | | | | | | | | | | | | | | | | |
Net assets, end of year (000’s) | | $ | 136,628 | | | $ | 157,551 | | | $ | 162,524 | | | $ | 173,018 | | | $ | 167,700 | |
Portfolio turnover rate | | | 37.89% | | | | 51.04% | | | | 27.51% | | | | 17.06% | | | | 27.50% | |
aThe amount shown for a share outstanding throughout the period may not correlate with the Statement of Operations for the period due to the timing of sales and repurchases of the Fund shares in relation to income earned and/or fluctuating market value of the investments of the Fund.
bBased on average daily shares outstanding.
cTotal return does not include fees, charges or expenses imposed by the variable annuity and life insurance contracts for which the Franklin Templeton Variable Insurance Products Trust serves as an underlying investment vehicle.
dBenefit of expense reduction rounds to less than 0.01%.
FUS-8
| | | | | | | | | | | | | | | | | | | | |
| | | Year Ended December 31, | |
| Class 2 | | 2011 | | | 2010 | | | 2009 | | | 2008 | | | 2007 | |
| | | | |
Per share operating performance | | | | | | | | | | | | | | | | | | | | |
(for a share outstanding throughout the year) | | | | | | | | | | | | | | | | | | | | |
Net asset value, beginning of year | | $ | 13.11 | | | $ | 12.87 | | | $ | 12.99 | | | $ | 12.71 | | | $ | 12.52 | |
| | | | |
Income from investment operations:a | | | | | | | | | | | | | | | | | | | | |
Net investment incomeb | | | 0.38 | | | | 0.43 | | | | 0.48 | | | | 0.55 | | | | 0.58 | |
Net realized and unrealized gains (losses) | | | 0.35 | | | | 0.24 | | | | (0.09 | ) | | | 0.37 | | | | 0.21 | |
| | | | |
Total from investment operations | | | 0.73 | | | | 0.67 | | | | 0.39 | | | | 0.92 | | | | 0.79 | |
| | | | |
Less distributions from net investment income | | | (0.42 | ) | | | (0.43 | ) | | | (0.51 | ) | | | (0.64 | ) | | | (0.60 | ) |
| | | | |
Net asset value, end of year | | $ | 13.42 | | | $ | 13.11 | | | $ | 12.87 | | | $ | 12.99 | | | $ | 12.71 | |
| | | | |
| | | | | |
Total returnc | | | 5.68% | | | | 5.28% | | | | 3.09% | | | | 7.59% | | | | 6.61% | |
Ratios to average net assets | | | | | | | | | | | | | | | | | | | | |
Expenses | | | 0.76% | | | | 0.77% | | | | 0.78% | | | | 0.78%d | | | | 0.78% | d |
Net investment income | | | 2.86% | | | | 3.26% | | | | 3.71% | | | | 4.34% | | | | 4.63% | |
| | | | | |
Supplemental data | | | | | | | | | | | | | | | | | | | | |
Net assets, end of year (000’s) | | $ | 894,699 | | | $ | 703,997 | | | $ | 557,809 | | | $ | 450,603 | | | $ | 379,386 | |
Portfolio turnover rate | | | 37.89% | | | | 51.04% | | | | 27.51% | | | | 17.06% | | | | 27.50% | |
aThe amount shown for a share outstanding throughout the period may not correlate with the Statement of Operations for the period due to the timing of sales and repurchases of the Fund shares in relation to income earned and/or fluctuating market value of the investments of the Fund.
bBased on average daily shares outstanding.
cTotal return does not include fees, charges or expenses imposed by the variable annuity and life insurance contracts for which the Franklin Templeton Variable Insurance Products Trust serves as an underlying investment vehicle.
dBenefit of expense reduction rounds to less than 0.01%.
Please keep this supplement for future reference.
FUS-9
Franklin Templeton Variable Insurance Products Trust
Financial Highlights
Franklin U.S. Government Fund
| | | | | | | | | | | | | | | | | | | | |
| | | Year Ended December 31, | |
| Class 1 | | 2012 | | | 2011 | | | 2010 | | | 2009 | | | 2008 | |
| | | | |
Per share operating performance | | | | | | | | | | | | | | | | | | | | |
(for a share outstanding throughout the year) | | | | | | | | | | | | | | | | | | | | |
Net asset value, beginning of year | | $ | 13.67 | | | $ | 13.34 | | | $ | 13.08 | | | $ | 13.19 | | | $ | 12.89 | |
| | | | |
Income from investment operationsa: | | | | | | | | | | | | | | | | | | | | |
Net investment incomeb | | | 0.32 | | | | 0.42 | c | | | 0.47 | c | | | 0.52 | c | | | 0.59 | c |
Net realized and unrealized gains (losses) | | | (0.03 | ) | | | 0.36 | c | | | 0.25 | c | | | (0.09 | )c | | | 0.38 | c |
| | | | |
Total from investment operations | | | 0.29 | | | | 0.78 | | | | 0.72 | | | | 0.43 | | | | 0.97 | |
| | | | |
Less distributions from net investment income | | | (0.39 | ) | | | (0.45 | ) | | | (0.46 | ) | | | (0.54 | ) | | | (0.67 | ) |
| | | | |
Net asset value, end of year | | $ | 13.57 | | | $ | 13.67 | | | $ | 13.34 | | | $ | 13.08 | | | $ | 13.19 | |
| | | | |
| | | | | |
Total returnd | | | 2.12% | | | | 5.96% | | | | 5.56% | | | | 3.34% | | | | 7.91% | |
Ratios to average net assets | | | | | | | | | | | | | | | | | | | | |
Expenses | | | 0.50% | | | | 0.51% | | | | 0.52% | | | | 0.53% | | | | 0.53% | e |
Net investment income | | | 2.36% | | | | 3.11% | c | | | 3.51% | c | | | 3.96% | c | | | 4.59% | c |
| | | | | |
Supplemental data | | | | | | | | | | | | | | | | | | | | |
Net assets, end of year (000’s) | | $ | 126,536 | | | $ | 136,628 | | | $ | 157,551 | | | $ | 162,524 | | | $ | 173,018 | |
Portfolio turnover rate | | | 45.89% | | | | 37.89% | | | | 51.04% | | | | 27.51% | | | | 17.06% | |
aThe amount shown for a share outstanding throughout the period may not correlate with the Statement of Operations for the period due to the timing of sales and repurchases of the Fund shares in relation to income earned and/or fluctuating market value of the investments of the Fund.
bBased on average daily shares outstanding.
cSee Note 9 regarding revisions to previously issued financial statements.
dTotal return does not include fees, charges or expenses imposed by the variable annuity and life insurance contracts for which the Franklin Templeton Variable Insurance Products Trust serves as an underlying investment vehicle.
eBenefit of expense reduction rounds to less than 0.01%.
The accompanying notes are an integral part of these financial statements.
Franklin Templeton Variable Insurance Products Trust
Financial Highlights (continued)
Franklin U.S. Government Fund
| | | | | | | | | | | | | | | | | | | | |
| | | Year Ended December 31, | |
| Class 2 | | 2012 | | | 2011 | | | 2010 | | | 2009 | | | 2008 | |
| | | | |
Per share operating performance | | | | | | | | | | | | | | | | | | | | |
(for a share outstanding throughout the year) | | | | | | | | | | | | | | | | | | | | |
Net asset value, beginning of year | | $ | 13.42 | | | $ | 13.11 | | | $ | 12.87 | | | $ | 12.99 | | | $ | 12.71 | |
| | | | |
Income from investment operationsa: | | | | | | | | | | | | | | | | | | | | |
Net investment incomeb | | | 0.28 | | | | 0.38 | c | | | 0.43 | c | | | 0.48 | c | | | 0.55 | c |
Net realized and unrealized gains (losses) | | | (0.03 | ) | | | 0.35 | c | | | 0.24 | c | | | (0.09 | )c | | | 0.37 | c |
| | | | |
Total from investment operations | | | 0.25 | | | | 0.73 | | | | 0.67 | | | | 0.39 | | | | 0.92 | |
| | | | |
Less distributions from net investment income | | | (0.36 | ) | | | (0.42 | ) | | | (0.43 | ) | | | (0.51 | ) | | | (0.64 | ) |
| | | | |
Net asset value, end of year | | $ | 13.31 | | | $ | 13.42 | | | $ | 13.11 | | | $ | 12.87 | | | $ | 12.99 | |
| | | | |
| | | | | |
Total returnd | | | 1.89% | | | | 5.68% | | | | 5.28% | | | | 3.09% | | | | 7.59% | |
Ratios to average net assets | | | | | | | | | | | | | | | | | | | | |
Expenses | | | 0.75% | | | | 0.76% | | | | 0.77% | | | | 0.78% | | | | 0.78% | e |
Net investment income | | | 2.11% | | | | 2.86% | c | | | 3.26% | c | | | 3.71% | c | | | 4.34% | c |
| | | | | |
Supplemental data | | | | | | | | | | | | | | | | | | | | |
Net assets, end of year (000’s) | | $ | 1,206,089 | | | $ | 894,699 | | | $ | 703,997 | | | $ | 557,809 | | | $ | 450,603 | |
Portfolio turnover rate | | | 45.89% | | | | 37.89% | | | | 51.04% | �� | | | 27.51% | | | | 17.06% | |
aThe amount shown for a share outstanding throughout the period may not correlate with the Statement of Operations for the period due to the timing of sales and repurchases of the Fund shares in relation to income earned and/or fluctuating market value of the investments of the Fund.
bBased on average daily shares outstanding.
cSee Note 9 regarding revisions to previously issued financial statements.
dTotal return does not include fees, charges or expenses imposed by the variable annuity and life insurance contracts for which the Franklin Templeton Variable Insurance Products Trust serves as an underlying investment vehicle.
eBenefit of expense reduction rounds to less than 0.01%.
The accompanying notes are an integral part of these financial statements.
Franklin Templeton Variable Insurance Products Trust
Statement of Investments, December 31, 2012
| | | | | | | | |
| Franklin U.S. Government Fund | | Principal
Amount | | | Value | |
Corporate Bonds 1.2% | | | | | | | | |
Private Export Funding Corp.,
secured bond, 2.80%, 5/15/22 | | $ | 9,000,000 | | | $ | 9,663,138 | |
senior secured note, 3.05%, 10/15/14 | | | 6,500,000 | | | | 6,805,780 | |
| | | | | | | | |
Total Corporate Bonds (Cost $16,354,013) | | | | | | | 16,468,918 | |
| | | | | | | | |
Foreign Government and Agency Securities 0.8% | | | | | | | | |
Government of Tunisia, 1.686%, 7/16/19 | | | 7,000,000 | | | | 7,000,000 | |
International Bank for Reconstruction and Development, | | | | | | | | |
2, zero cpn., 2/15/16 | | | 1,868,000 | | | | 1,820,340 | |
Principal Strip, 7/15/17 | | | 1,761,000 | | | | 1,655,653 | |
| | | | | | | | |
Total Foreign Government and Agency Securities (Cost $10,596,885) | | | | | | | 10,475,993 | |
| | | | | | | | |
Mortgage-Backed Securities 76.0% | | | | | | | | |
aFederal Home Loan Mortgage Corp. (FHLMC) Adjustable Rate 0.0%† | | | | | | | | |
FHLMC, 2.221%, 6/01/22 | | | 140,107 | | | | 143,900 | |
FHLMC, 2.32%, 2/01/19 | | | 27,562 | | | | 28,822 | |
| | | | | | | | |
| | | | | | | 172,722 | |
| | | | | | | | |
Federal Home Loan Mortgage Corp. (FHLMC) Fixed Rate 9.5% | | | | | | | | |
FHLMC Gold 15 Year, 4.50%, 3/01/25 - 4/01/25 | | | 7,845,408 | | | | 8,371,593 | |
FHLMC Gold 30 Year, 3.00%, 6/01/42 - 12/01/42 | | | 19,834,443 | | | | 20,762,412 | |
bFHLMC Gold 30 Year, 3.50%, 1/01/42 | | | 20,850,000 | | | | 22,177,559 | |
FHLMC Gold 30 Year, 3.50%, 4/01/42 | | | 9,507,427 | | | | 10,141,773 | |
FHLMC Gold 30 Year, 4.00%, 9/01/40 - 12/01/41 | | | 18,694,826 | | | | 19,985,475 | |
FHLMC Gold 30 Year, 4.50%, 5/01/40 - 7/01/41 | | | 11,978,801 | | | | 12,910,266 | |
FHLMC Gold 30 Year, 5.00%, 9/01/33 - 4/01/40 | | | 17,172,487 | | | | 18,572,072 | |
FHLMC Gold 30 Year, 5.50%, 7/01/33 - 5/01/38 | | | 6,471,184 | | | | 7,016,543 | |
FHLMC Gold 30 Year, 6.00%, 1/01/24 - 8/01/35 | | | 3,367,502 | | | | 3,735,584 | |
FHLMC Gold 30 Year, 6.50%, 12/01/23 - 5/01/35 | | | 1,412,477 | | | | 1,611,020 | |
FHLMC Gold 30 Year, 7.00%, 4/01/24 - 10/01/32 | | | 545,412 | | | | 641,916 | |
FHLMC Gold 30 Year, 7.50%, 12/01/22 - 5/01/24 | | | 9,082 | | | | 10,028 | |
FHLMC Gold 30 Year, 8.00%, 7/01/21 - 5/01/22 | | | 16,233 | | | | 18,157 | |
FHLMC Gold 30 Year, 8.50%, 10/01/21 - 7/01/31 | | | 864,929 | | | | 1,073,238 | |
FHLMC PC 30 Year, 8.00%, 1/01/17 - 5/01/17 | | | 4,501 | | | | 4,531 | |
FHLMC PC 30 Year, 8.50%, 9/01/20 | | | 869 | | | | 1,006 | |
| | | | | | | | |
| | | | | | | 127,033,173 | |
| | | | | | | | |
aFederal National Mortgage Association (FNMA) Adjustable Rate 0.1% | | | | | | | | |
FNMA, 2.153%, 2/01/19 | | | 57,692 | | | | 61,084 | |
FNMA, 2.175%, 1/01/18 | | | 487,925 | | | | 511,475 | |
FNMA, 2.469%, 9/01/18 | | | 195,241 | | | | 209,503 | |
FNMA, 4.329%, 3/01/20 | | | 82,642 | | | | 88,275 | |
FNMA, 4.466%, 7/01/19 | | | 91,283 | | | | 92,020 | |
| | | | | | | | |
| | | | | | | 962,357 | |
| | | | | | | | |
Federal National Mortgage Association (FNMA) Fixed Rate 12.2% | | | | | | | | |
FNMA 15 Year, 5.50%, 6/01/16 - 1/01/25 | | | 6,762,981 | | | | 7,313,060 | |
FNMA 15 Year, 6.00%, 8/01/17 - 9/01/17 | | | 410,619 | | | | 441,276 | |
FNMA 30 Year, 3.00%, 12/01/42 | | | 15,000,000 | | | | 15,736,648 | |
FNMA 30 Year, 4.00%, 3/01/39 - 9/01/41 | | | 53,032,746 | | | | 56,936,348 | |
FNMA 30 Year, 4.50%, 12/01/40 | | | 14,320,329 | | | | 15,523,267 | |
FNMA 30 Year, 4.50%, 8/01/40 - 6/01/41 | | | 11,592,167 | | | | 12,583,219 | |
FNMA 30 Year, 5.00%, 3/01/34 - 7/01/41 | | | 22,090,005 | | | | 24,017,727 | |
FNMA 30 Year, 5.50%, 12/01/32 - 8/01/35 | | | 5,612,063 | | | | 6,155,474 | |
FUS-12
Franklin Templeton Variable Insurance Products Trust
Statement of Investments, December 31, 2012 (continued)
| | | | | | | | |
| Franklin U.S. Government Fund | | Principal
Amount | | | Value | |
Mortgage-Backed Securities (continued) | | | | | | | | |
Federal National Mortgage Association (FNMA) Fixed Rate (continued) | | | | | | | | |
FNMA 30 Year, 6.00%, 1/01/24 - 8/01/38 | | $ | 14,602,022 | | | $ | 16,001,438 | |
FNMA 30 Year, 6.50%, 1/01/24 - 9/01/36 | | | 2,542,144 | | | | 2,867,124 | |
FNMA 30 Year, 7.50%, 4/01/23 - 8/01/25 | | | 72,207 | | | | 79,910 | |
FNMA 30 Year, 8.00%, 7/01/16 - 2/01/25 | | | 153,529 | | | | 164,543 | |
FNMA 30 Year, 8.50%, 3/01/20 - 6/01/21 | | | 1,569 | | | | 1,814 | |
FNMA 30 Year, 9.00%, 10/01/26 | | | 349,364 | | | | 433,718 | |
FNMA GL 30 Year, 8.00%, 8/01/19 | | | 32,188 | | | | 32,904 | |
FNMA PL 30 Year, 5.50%, 4/01/34 | | | 3,095,514 | | | | 3,402,544 | |
| | | | | | | | |
| | | | | | | 161,691,014 | |
| | | | | | | | |
Government National Mortgage Association (GNMA) Fixed Rate 54.2% | | | | | | | | |
GNMA I SF 30 Year, 3.00%, 1/15/42 - 11/15/42 | | | 8,949,710 | | | | 9,532,931 | |
GNMA I SF 30 Year, 4.00%, 9/15/41 | | | 4,254,426 | | | | 4,671,469 | |
GNMA I SF 30 Year, 4.50%, 1/15/39 - 4/15/41 | | | 47,493,955 | | | | 52,453,223 | |
GNMA I SF 30 Year, 5.00%, 6/15/30 - 9/15/40 | | | 74,623,563 | | | | 82,568,249 | |
GNMA I SF 30 Year, 5.50%, 11/15/28 - 10/15/39 | | | 22,861,904 | | | | 25,242,834 | |
GNMA I SF 30 Year, 6.00%, 11/15/23 - 11/15/38 | | | 11,970,588 | | | | 13,407,461 | |
GNMA I SF 30 Year, 6.50%, 5/15/23 - 9/15/38 | | | 4,694,386 | | | | 5,433,999 | |
GNMA I SF 30 Year, 7.00%, 3/15/22 - 1/15/32 | | | 1,385,060 | | | | 1,628,839 | |
GNMA I SF 30 Year, 7.50%, 2/15/17 - 8/15/33 | | | 1,275,406 | | | | 1,506,562 | |
GNMA I SF 30 Year, 8.00%, 3/15/17 - 5/15/24 | | | 380,753 | | | | 414,710 | |
GNMA I SF 30 Year, 8.25%, 4/15/25 | | | 18,150 | | | | 18,249 | |
GNMA I SF 30 Year, 8.50%, 6/15/22 - 12/15/24 | | | 137,266 | | | | 150,905 | |
GNMA I SF 30 Year, 9.00%, 6/15/16 - 5/15/20 | | | 40,441 | | | | 41,046 | |
GNMA I SF 30 Year, 9.50%, 7/15/16 - 12/15/20 | | | 119,924 | | | | 128,115 | |
GNMA I SF 30 Year, 10.00%, 10/15/17 - 8/15/21 | | | 73,381 | | | | 77,970 | |
GNMA II SF 30 Year, 3.00%, 7/20/42 | | | 4,468,787 | | | | 4,759,386 | |
GNMA II SF 30 Year, 3.50%, 1/20/42 | | | 15,207,872 | | | | 16,549,038 | |
GNMA II SF 30 Year, 3.50%, 3/20/42 | | | 15,817,587 | | | | 17,212,524 | |
GNMA II SF 30 Year, 3.50%, 4/20/42 | | | 60,351,436 | | | | 65,673,766 | |
GNMA II SF 30 Year, 3.50%, 5/20/42 | | | 27,392,133 | | | | 29,807,816 | |
GNMA II SF 30 Year, 3.50%, 9/20/42 | | | 51,729,591 | | | | 56,291,570 | |
GNMA II SF 30 Year, 3.50%, 12/20/40 - 10/20/42 | | | 22,735,723 | | | | 24,742,383 | |
GNMA II SF 30 Year, 3.50%, 11/20/42 | | | 15,843,776 | | | | 17,241,022 | |
GNMA II SF 30 Year, 4.00%, 11/20/41 | | | 24,982,568 | | | | 27,226,387 | |
GNMA II SF 30 Year, 4.00%, 11/20/39 - 1/20/42 | | | 57,454,517 | | | | 62,944,060 | |
GNMA II SF 30 Year, 4.50%, 4/20/41 | | | 30,732,729 | | | | 33,684,305 | |
GNMA II SF 30 Year, 4.50%, 6/20/41 | | | 14,036,944 | | | | 15,444,571 | |
GNMA II SF 30 Year, 4.50%, 7/20/41 | | | 14,337,790 | | | | 15,775,586 | |
GNMA II SF 30 Year, 4.50%, 9/20/41 | | | 21,738,646 | | | | 23,988,164 | |
GNMA II SF 30 Year, 4.50%, 10/20/39 - 10/20/41 | | | 33,225,488 | | | | 36,644,399 | |
GNMA II SF 30 Year, 5.00%, 8/20/41 | | | 14,116,275 | | | | 15,603,495 | |
GNMA II SF 30 Year, 5.00%, 9/20/33 - 9/20/41 | | | 23,076,724 | | | | 25,474,309 | |
GNMA II SF 30 Year, 5.50%, 5/20/34 - 6/20/38 | | | 19,042,613 | | | | 21,253,131 | |
GNMA II SF 30 Year, 6.00%, 11/20/23 - 7/20/39 | | | 11,736,566 | | | | 13,185,554 | |
GNMA II SF 30 Year, 6.50%, 12/20/27 - 4/20/34 | | | 1,214,362 | | | | 1,400,005 | |
GNMA II SF 30 Year, 7.00%, 5/20/32 | | | 20,856 | | | | 25,254 | |
GNMA II SF 30 Year, 7.50%, 5/20/17 - 5/20/33 | | | 255,462 | | | | 301,957 | |
GNMA II SF 30 Year, 8.00%, 7/20/16 - 8/20/26 | | | 27,136 | | | | 30,597 | |
GNMA II SF 30 Year, 9.50%, 4/20/25 | | | 2,885 | | | | 2,922 | |
| | | | | | | | |
| | | | | | | 722,538,763 | |
| | | | | | | | |
Total Mortgage-Backed Securities (Cost $978,352,375) | | | | | | | 1,012,398,029 | |
| | | | | | | | |
FUS-13
Franklin Templeton Variable Insurance Products Trust
Statement of Investments, December 31, 2012 (continued)
| | | | | | | | |
| Franklin U.S. Government Fund | | Principal
Amount | | | Value | |
U.S. Government and Agency Securities 19.4% | | | | | | | | |
AID-Israel, 7-Z, U.S. Government Guaranteed, Strip, 8/15/22 | | $ | 5,619,000 | | | $ | 4,549,479 | |
Federal Agricultural Mortgage Corp., | | | | | | | | |
2.66%, 4/12/22 | | | 7,000,000 | | | | 7,379,820 | |
4.30%, 5/13/19 | | | 1,010,000 | | | | 1,188,327 | |
cFederal Agricultural Mortgage Corp. Guaranteed Trust 07-1, 144A, 5.125%, 4/19/17 | | | 5,000,000 | | | | 5,877,945 | |
FFCB, 1.50%, 11/16/15 | | | 10,000,000 | | | | 10,328,360 | |
FHLB, | | | | | | | | |
3.625%, 5/29/13 | | | 4,500,000 | | | | 4,564,647 | |
3.625%, 10/18/13 | | | 15,000,000 | | | | 15,410,625 | |
4.75%, 12/16/16 | | | 17,000,000 | | | | 19,736,643 | |
5.125%, 8/14/13 | | | 11,000,000 | | | | 11,339,614 | |
5.25%, 6/05/17 | | | 9,000,000 | | | | 10,756,116 | |
FICO, | | | | | | | | |
12, Strip, 6/06/18 | | | 4,627,000 | | | | 4,298,784 | |
13P, Strip, 12/27/18 | | | 2,500,000 | | | | 2,316,215 | |
15, Strip, 3/07/16 | | | 15,000,000 | | | | 14,652,075 | |
15P, Strip, 3/07/19 | | | 1,798,000 | | | | 1,657,630 | |
16, Strip, 4/05/17 | | | 12,367,000 | | | | 11,844,655 | |
A-P, Strip, 2/08/18 | | | 1,000,000 | | | | 938,497 | |
B-P, Strip, 4/06/18 | | | 1,405,000 | | | | 1,326,852 | |
E-P, Strip, 11/02/18 | | | 1,296,000 | | | | 1,206,833 | |
FNMA, | | | | | | | | |
1.75%, 5/07/13 | | | 7,900,000 | | | | 7,943,719 | |
senior note, 5.375%, 6/12/17 | | | 17,800,000 | | | | 21,425,753 | |
HUD, 96-A, | | | | | | | | |
7.63%, 8/01/14 | | | 190,000 | | | | 190,065 | |
7.66%, 8/01/15 | | | 67,582 | | | | 67,620 | |
SBA, | | | | | | | | |
aFRN, 3.125%, 3/25/18 | | | 412,278 | | | | 421,470 | |
PC, 1995-20L, 1, 6.45%, 12/01/15 | | | 168,926 | | | | 178,838 | |
PC, 1996-20L, 1, 6.70%, 12/01/16 | | | 212,906 | | �� | | 226,780 | |
PC, 1997-20G, 1, 6.85%, 7/01/17 | | | 267,746 | | | | 287,979 | |
PC, 1998-20I, 1, 6.00%, 9/01/18 | | | 817,979 | | | | 890,338 | |
TVA, | | | | | | | | |
1.875%, 8/15/22 | | | 6,000,000 | | | | 5,958,054 | |
5.88%, 4/01/36 | | | 5,000,000 | | | | 6,953,085 | |
Strip, 11/01/18 | | | 2,644,000 | | | | 2,443,833 | |
Strip, 6/15/19 | | | 5,973,000 | | | | 5,351,438 | |
Strip, 6/15/20 | | | 6,138,000 | | | | 5,337,893 | |
U.S. Treasury Note, | | | | | | | | |
0.875%, 11/30/16 | | | 2,500,000 | | | | 2,535,352 | |
1.25%, 1/31/19 | | | 10,000,000 | | | | 10,175,780 | |
1.75%, 10/31/18 | | | 3,000,000 | | | | 3,144,843 | |
2.375%, 9/30/14 | | | 17,000,000 | | | | 17,633,522 | |
2.375%, 8/31/14 - 10/31/14 | | | 15,000,000 | | | | 15,554,768 | |
2.50%, 4/30/15 | | | 6,950,000 | | | | 7,305,103 | |
3.125%, 8/31/13 | | | 7,000,000 | | | | 7,137,270 | |
4.75%, 5/15/14 | | | 8,000,000 | | | | 8,494,688 | |
| | | | | | | | |
Total U.S. Government and Agency Securities (Cost $248,497,998) | | | | | | | 259,031,308 | |
| | | | | | | | |
Total Investments before Short Term Investments (Cost $1,253,801,271) | | | | | | | 1,298,374,248 | |
| | | | | | | | |
FUS-14
Franklin Templeton Variable Insurance Products Trust
Statement of Investments, December 31, 2012 (continued)
| | | | | | | | |
| Franklin U.S. Government Fund | | Principal
Amount | | | Value | |
Short Term Investments (Cost $50,860,596) 3.8% | | | | | | | | |
Repurchase Agreements 3.8% | | | | | | | | |
dJoint Repurchase Agreement, 0.154%, 1/02/13 (Maturity Value $50,861,032) | | $ | 50,860,596 | | | $ | 50,860,596 | |
BNP Paribas Securities Corp. (Maturity Value $6,621,089) | | | | | | | | |
Credit Suisse Securities (USA) LLC (Maturity Value $8,276,616) | | | | | | | | |
Deutsche Bank Securities Inc. (Maturity Value $5,340,408) | | | | | | | | |
HSBC Securities (USA) Inc. (Maturity Value $14,897,705) | | | | | | | | |
Merrill Lynch, Pierce, Fenner & Smith Inc. (Maturity Value $6,621,089) | | | | | | | | |
Morgan Stanley & Co. LLC (Maturity Value $2,483,036) | | | | | | | | |
UBS Securities LLC (Maturity Value $6,621,089) | | | | | | | | |
Collateralized by U.S. Government Agency Securities, 0.00% - 6.21%, 1/15/13 - 1/22/37; U.S. Treasury Bonds,
11.25%, 2/15/15 and U.S. Treasury Notes, 0.25% - 2.00%, 11/30/13 - 9/15/15 (valued at $51,883,577) | | | | | | | | |
| | | | | | | | |
Total Investments (Cost $1,304,661,867) 101.2% | | | | | | | 1,349,234,844 | |
Other Assets, less Liabilities (1.2)% | | | | | | | (16,609,707 | ) |
| | | | | | | | |
Net Assets 100.0% | | | | | | $ | 1,332,625,137 | |
| | | | | | | | |
See abbreviations on page FUS-26.
†Rounds to less than 0.1% of net assets.
aThe coupon rate shown represents the rate at period end.
bSecurity purchased on a to-be-announced (TBA) basis. See Note 1(c).
cSecurity was purchased pursuant to Rule 144A under the Securities Act of 1933 and may be sold in transactions exempt from registration only to qualified institutional buyers or in a public offering registered under the Securities Act of 1933. This security has been deemed liquid under guidelines approved by the Trust’s Board of Trustees. At December 31, 2012, the value of this security was $5,877,945, representing 0.44% of net assets.
dSee Note 1(b) regarding joint repurchase agreement.
The accompanying notes are an integral part of these financial statements.
FUS-15
Franklin Templeton Variable Insurance Products Trust
Financial Statements
Statement of Assets and Liabilities
December 31, 2012
| | | | |
| | | Franklin U.S.
Government Fund | |
Assets: | | | | |
Investments in securities: | | | | |
Cost - Unaffiliated issuers | | $ | 1,253,801,271 | |
Cost - Repurchase agreements | | | 50,860,596 | |
| | | | |
Total cost of investments | | $ | 1,304,661,867 | |
| | | | |
Value - Unaffiliated issuers | | $ | 1,298,374,248 | |
Value - Repurchase agreements | | | 50,860,596 | |
| | | | |
Total value of investments | | | 1,349,234,844 | |
Receivables: | | | | |
Investment securities sold | | | 304,746 | |
Capital shares sold | | | 2,998,020 | |
Interest | | | 4,452,740 | |
Other assets | | | 25 | |
| | | | |
Total assets | | | 1,356,990,375 | |
| | | | |
Liabilities: | | | | |
Payables: | | | | |
Investment securities purchased | | | 22,159,641 | |
Capital shares redeemed | | | 996,798 | |
Affiliates | | | 1,020,694 | |
Accrued expenses and other liabilities | | | 188,105 | |
| | | | |
Total liabilities | | | 24,365,238 | |
| | | | |
Net assets, at value | | $ | 1,332,625,137 | |
| | | | |
Net assets consist of: | | | | |
Paid-in capital | | $ | 1,266,236,753 | |
Undistributed net investment income | | | 35,557,215 | |
Net unrealized appreciation (depreciation) | | | 44,572,977 | |
Accumulated net realized gain (loss) | | | (13,741,808 | ) |
| | | | |
Net assets, at value | | $ | 1,332,625,137 | |
| | | | |
Class 1: | | | | |
Net assets, at value | | $ | 126,536,451 | |
| | | | |
Shares outstanding | | | 9,323,239 | |
| | | | |
Net asset value and maximum offering price per share | | $ | 13.57 | |
| | | | |
Class 2: | | | | |
Net assets, at value | | $ | 1,206,088,686 | |
| | | | |
Shares outstanding | | | 90,599,959 | |
| | | | |
Net asset value and maximum offering price per share | | $ | 13.31 | |
| | | | |
The accompanying notes are an integral part of these financial statements.
FUS-16
Franklin Templeton Variable Insurance Products Trust
Financial Statements (continued)
Statement of Operations
for the year ended December 31, 2012
| | | | |
| | | Franklin U.S.
Government Fund | |
Investment income: | | | | |
Interest | | $ | 33,490,053 | |
| | | | |
Expenses: | | | | |
Management fees (Note 3a) | | | 5,511,661 | |
Distribution fees - Class 2 (Note 3c) | | | 2,597,572 | |
Unaffiliated transfer agent fees | | | 832 | |
Custodian fees (Note 4) | | | 19,238 | |
Reports to shareholders | | | 280,609 | |
Professional fees | | | 48,263 | |
Trustees’ fees and expenses | | | 4,369 | |
Other | | | 37,476 | |
| | | | |
Total expenses | | | 8,500,020 | |
| | | | |
Net investment income | | | 24,990,033 | |
| | | | |
Realized and unrealized gains (losses): | | | | |
Net realized gain (loss) from investments | | | 3,245,395 | |
Net change in unrealized appreciation (depreciation) on investments | | | (6,663,913 | ) |
| | | | |
Net realized and unrealized gain (loss) | | | (3,418,518 | ) |
| | | | |
Net increase (decrease) in net assets resulting from operations | | $ | 21,571,515 | |
| | | | |
The accompanying notes are an integral part of these financial statements.
FUS-17
Franklin Templeton Variable Insurance Products Trust
Financial Statements (continued)
Statements of Changes in Net Assets
| | | | | | | | |
| | | Franklin U.S. Government Fund | |
| | | Year Ended December 31, | |
| | | 2012 | | | 2011 | |
| | | | |
Increase (decrease) in net assets: | | | | | | | | |
Operations: | | | | | | | | |
Net investment income | | $ | 24,990,033 | | | $ | 26,836,883 | a |
Net realized gain (loss) from investments | | | 3,245,395 | | | | 4,945,621 | |
Net change in unrealized appreciation (depreciation) on investments | | | (6,663,913 | ) | | | 19,030,387 | a |
| | | | |
Net increase (decrease) in net assets resulting from operations | | | 21,571,515 | | | | 50,812,891 | |
| | | | |
Distributions to shareholders from: | | | | | | | | |
Net investment income: | | | | | | | | |
Class 1 | | | (3,761,370 | ) | | | (4,966,923 | ) |
Class 2 | | | (27,304,487 | ) | | | (24,186,254 | ) |
| | | | |
Total distributions to shareholders | | | (31,065,857 | ) | | | (29,153,177 | ) |
| | | | |
Capital share transactions: (Note 2) | | | | | | | | |
Class 1 | | | (9,172,267 | ) | | | (24,494,530 | ) |
Class 2 | | | 319,964,942 | | | | 172,613,515 | |
Class 4 | | | — | | | | (5,048 | ) |
| | | | |
Total capital share transactions | | | 310,792,675 | | | | 148,113,937 | |
| | | | |
Net increase (decrease) in net assets | | | 301,298,333 | | | | 169,773,651 | |
Net assets: | | | | | | | | |
Beginning of year | | | 1,031,326,804 | | | | 861,553,153 | |
| | | | |
End of year | | $ | 1,332,625,137 | | | $ | 1,031,326,804 | |
| | | | |
Undistributed net investment income included in net assets: | | | | | | | | |
End of year | | $ | 35,557,215 | | | $ | 32,779,202 | a |
| | | | |
aSee Note 9 regarding revisions to previously issued financial statements.
The accompanying notes are an integral part of these financial statements.
FUS-18
Franklin Templeton Variable Insurance Products Trust
Notes to Financial Statements
Franklin U.S. Government Fund
1. ORGANIZATION AND SIGNIFICANT ACCOUNTING POLICIES
Franklin Templeton Variable Insurance Products Trust (Trust) is registered under the Investment Company Act of 1940, as amended, (1940 Act) as an open-end investment company, consisting of twenty separate funds. The Franklin U.S. Government Fund (Fund) is included in this report. The financial statements of the remaining funds in the Trust are presented separately. Shares of the Fund are generally sold only to insurance company separate accounts to fund the benefits of variable life insurance policies or variable annuity contracts. The Fund offers two classes of shares: Class 1 and Class 2. Each class of shares differs by its distribution fees, voting rights on matters affecting a single class and its exchange privilege.
The following summarizes the Fund’s significant accounting policies.
a. Financial Instrument Valuation
The Fund’s investments in financial instruments are carried at fair value daily. Fair value is the price that would be received to sell an asset or paid to transfer a liability in an orderly transaction between market participants on the measurement date. Under procedures approved by the Trust’s Board of Trustees (the Board), the Fund’s administrator, investment manager and other affiliates have formed the Valuation and Liquidity Oversight Committee (VLOC). The VLOC provides administration and oversight of the Fund’s valuation policies and procedures, which are approved annually by the Board. Among other things, these procedures allow the Fund to utilize independent pricing services, quotations from securities and financial instrument dealers, and other market sources to determine fair value.
Debt securities generally trade in the over-the-counter (OTC) market rather than on a securities exchange. The Fund’s pricing services use multiple valuation techniques to determine fair value. In instances where sufficient market activity exists, the pricing services may utilize a market-based approach through which quotes from market makers are used to determine fair value. In instances where sufficient market activity may not exist or is limited, the pricing services also utilize proprietary valuation models which may consider market characteristics such as benchmark yield curves, credit spreads, estimated default rates, anticipated market interest rate volatility, coupon rates, anticipated timing of principal repayments, underlying collateral, and other unique security features in order to estimate the relevant cash flows, which are then discounted to calculate the fair value. Repurchase agreements are valued at cost, which approximates market value.
The Fund has procedures to determine the fair value of financial instruments for which market prices are not reliable or readily available. Under these procedures, the VLOC convenes on a regular basis to review such financial instruments and considers a number of factors, including significant unobservable valuation inputs, when arriving at fair value. The VLOC primarily employs a market-based approach which may use related or comparable assets or liabilities, recent transactions, market multiples, book values, and other relevant information for the investment to determine the fair value of the investment. An income-based valuation approach may also be used in which the anticipated future cash flows of the investment are discounted to calculate fair value. Discounts may also be applied due to the nature or duration of any restrictions on the disposition of the investments. Due to the inherent uncertainty of valuations of such investments, the fair values may differ significantly from the values that would have been used had an active market existed. The VLOC employs various methods for calibrating these valuation approaches including a regular review of key inputs and assumptions, transactional back-testing or disposition analysis, and reviews of any related market activity.
b. Joint Repurchase Agreement
The Fund enters into a joint repurchase agreement whereby its uninvested cash balance is deposited into a joint cash account with other funds managed by the investment manager or an affiliate of the investment manager and is used to invest in one or more repurchase agreements. The value and face amount of the joint repurchase agreement are allocated to the funds based on their pro-rata interest. A repurchase agreement is accounted for as a loan by the fund to the seller, collateralized by securities which are delivered to the fund’s custodian. The market value, including accrued interest, of the initial collateralization is required to be at least 102% of the dollar amount invested by the funds, with the value of the underlying securities marked to
FUS-19
Franklin Templeton Variable Insurance Products Trust
Notes to Financial Statements (continued)
Franklin U.S. Government Fund
1. ORGANIZATION AND SIGNIFICANT ACCOUNTING POLICIES (continued)
b. Joint Repurchase Agreement (continued)
market daily to maintain coverage of at least 100%. The joint repurchase agreement held by the Fund at year end had been entered into on December 31, 2012.
c. Securities Purchased on a TBA Basis
The Fund purchases securities on a to-be-announced (TBA) basis, with payment and delivery scheduled for a future date. These transactions are subject to market fluctuations and are subject to the risk that the value at delivery may be more or less than the trade date purchase price. Although the Fund will generally purchase these securities with the intention of holding the securities, it may sell the securities before the settlement date. Sufficient assets have been segregated for these securities.
d. Income Taxes
It is the Fund’s policy to qualify as a regulated investment company under the Internal Revenue Code. The Fund intends to distribute to shareholders substantially all of its taxable income and net realized gains to relieve it from federal income and if applicable, excise taxes. As a result, no provision for U.S. federal income taxes is required.
The Fund recognizes the tax benefits of uncertain tax positions only when the position is “more likely than not” to be sustained upon examination by the tax authorities based on the technical merits of the tax position. As of December 31, 2012, and for all open tax years, the Fund has determined that no liability for unrecognized tax benefits is required in the Fund’s financial statements related to uncertain tax positions taken on a tax return (or expected to be taken on future tax returns). Open tax years are those that remain subject to examination and are based on each tax jurisdiction statute of limitation.
e. Security Transactions, Investment Income, Expenses and Distributions
Security transactions are accounted for on trade date. Realized gains and losses on security transactions are determined on a specific identification basis. Interest income and estimated expenses are accrued daily. Amortization of premium and accretion of discount on debt securities are included in interest income. Distributions to shareholders are recorded on the ex-dividend date and are determined according to income tax regulations (tax basis). Distributable earnings determined on a tax basis may differ from earnings recorded in accordance with accounting principles generally accepted in the United States of America. These differences may be permanent or temporary. Permanent differences are reclassified among capital accounts to reflect their tax character. These reclassifications have no impact on net assets or the results of operations. Temporary differences are not reclassified, as they may reverse in subsequent periods.
Common expenses incurred by the Trust are allocated among the funds based on the ratio of net assets of each fund to the combined net assets of the Trust. Fund specific expenses are charged directly to the fund that incurred the expense.
Realized and unrealized gains and losses and net investment income, not including class specific expenses, are allocated daily to each class of shares based upon the relative proportion of net assets of each class. Differences in per share distributions, by class, are generally due to differences in class specific expenses.
f. Accounting Estimates
The preparation of financial statements in accordance with accounting principles generally accepted in the United States of America requires management to make estimates and assumptions that affect the reported amounts of assets and liabilities at the date of the financial statements and the amounts of income and expenses during the reporting period. Actual results could differ from those estimates.
FUS-20
Franklin Templeton Variable Insurance Products Trust
Notes to Financial Statements (continued)
Franklin U.S. Government Fund
1. ORGANIZATION AND SIGNIFICANT ACCOUNTING POLICIES (continued)
g. Guarantees and Indemnifications
Under the Trust’s organizational documents, its officers and trustees are indemnified by the Trust against certain liabilities arising out of the performance of their duties to the Trust. Additionally, in the normal course of business, the Trust, on behalf of the Fund, enters into contracts with service providers that contain general indemnification clauses. The Trust’s maximum exposure under these arrangements is unknown as this would involve future claims that may be made against the Trust that have not yet occurred. Currently, the Trust expects the risk of loss to be remote.
2. SHARES OF BENEFICIAL INTEREST
At December 31, 2012, there were an unlimited number of shares authorized (without par value). Transactions in the Fund’s shares were as follows:
| | | | | | | | | | | | | | | | |
| | | Year Ended December 31, | |
| | | 2012 | | | 2011 a | |
| Class 1 Shares: | | Shares | | | Amount | | | Shares | | | Amount | |
Shares sold | | | 1,027,364 | | | $ | 14,057,416 | | | | 756,773 | | | $ | 10,178,368 | |
Shares issued in reinvestment of distributions | | | 279,656 | | | | 3,761,370 | | | | 374,862 | | | | 4,966,923 | |
Shares redeemed | | | (1,981,396 | ) | | | (26,991,053 | ) | | | (2,941,594 | ) | | | (39,639,821 | ) |
| | | | |
Net increase (decrease) | | | (674,376 | ) | | $ | (9,172,267 | ) | | | (1,809,959 | ) | | $ | (24,494,530 | ) |
| | | | |
Class 2 Shares: | | | | |
Shares sold | | | 30,970,663 | | | $ | 414,540,207 | | | | 22,722,855 | | | $ | 301,179,226 | |
Shares issued in reinvestment of distributions | | | 2,066,956 | | | | 27,304,487 | | | | 1,856,198 | | | | 24,186,254 | |
Shares redeemed | | | (9,110,319 | ) | | | (121,879,752 | ) | | | (11,586,947 | ) | | | (152,751,965 | ) |
| | | | |
Net increase (decrease) | | | 23,927,300 | | | $ | 319,964,942 | | | | 12,992,106 | | | $ | 172,613,515 | |
| | | | |
Class 4 Shares: | | | | |
Shares redeemed | | | | | | | | | | | (379 | ) | | $ | (5,048 | ) |
| | | | | | | | | | |
Net increase (decrease) | | | | | | | | | | | (379 | ) | | $ | (5,048 | ) |
| | | | | | | | | | |
| a | Effective March 4, 2011, Class 4 was liquidated. |
3. TRANSACTIONS WITH AFFILIATES
Franklin Resources, Inc. is the holding company for various subsidiaries that together are referred to as Franklin Templeton Investments. Certain officers and trustees of the Fund are also officers and/or directors of the following subsidiaries:
| | |
| Subsidiary | | Affiliation |
Franklin Advisers, Inc. (Advisers) | | Investment manager |
Franklin Templeton Services, LLC (FT Services) | | Administrative manager |
Franklin Templeton Distributors, Inc. (Distributors) | | Principal underwriter |
Franklin Templeton Investor Services, LLC (Investor Services) | | Transfer agent |
FUS-21
Franklin Templeton Variable Insurance Products Trust
Notes to Financial Statements (continued)
Franklin U.S. Government Fund
3. TRANSACTIONS WITH AFFILIATES (continued)
a. Management Fees
The Fund pays an investment management fee to Advisers based on the average daily net assets of the Fund as follows:
| | |
| Annualized Fee Rate | | Net Assets |
| 0.625% | | Up to and including $100 million |
| 0.500% | | Over $100 million, up to and including $250 million |
| 0.450% | | Over $250 million, up to and including $7.5 billion |
| 0.440% | | Over $7.5 billion, up to and including $10 billion |
| 0.430% | | Over $10 billion, up to and including $12.5 billion |
| 0.420% | | Over $12.5 billion, up to and including $15 billion |
| 0.400% | | In excess of $15 billion |
b. Administrative Fees
FT Services, under terms of an agreement, provides administrative services to the Fund and is not paid by the Fund for the services.
c. Distribution Fees
The Board has adopted a distribution plan for Class 2 shares pursuant to Rule 12b-1 under the 1940 Act. Under the Fund’s compensation distribution plan, the Fund pays Distributors for costs incurred in connection with the servicing, sale and distribution of the Fund’s shares up to 0.35% per year of its average daily net assets. Some distribution fees are not charged on shares held by affiliates. The Board has agreed to limit the current rate to 0.25% per year for Class 2.
d. Transfer Agent Fees
Investor Services, under terms of an agreement, performs shareholder servicing for the Fund and is not paid by the Fund for the services.
4. EXPENSE OFFSET ARRANGEMENT
The Fund has entered into an arrangement with its custodian whereby credits realized as a result of uninvested cash balances are used to reduce a portion of the Fund’s custodian expenses. During the year ended December 31, 2012, there were no credits earned.
5. INCOME TAXES
For tax purposes, capital losses may be carried over to offset future capital gains, if any. Capital loss carryforwards with no expiration, if any, must be fully utilized before those losses with expiration dates.
FUS-22
Franklin Templeton Variable Insurance Products Trust
Notes to Financial Statements (continued)
Franklin U.S. Government Fund
5. INCOME TAXES (continued)
At December 31, 2012, capital loss carryforwards were as follows:
| | | | |
Capital loss carryforwards subject to expiration: | | | | |
2013 | | $ | 2,102,640 | |
2014 | | | 1,618,397 | |
2015 | | | 2,329,071 | |
2016 | | | 841,479 | |
2017 | | | 401,851 | |
2018 | | | 426,637 | |
Capital loss carryforwards not subject to expiration: | | | | |
Short term | | $ | 3,809,584 | |
Long term | | | 1,995,270 | |
| | | | |
Total capital loss carryforwards | | $ | 13,524,929 | |
| | | | |
On December 31, 2012, the Fund had expired pre-enactment capital loss carryforwards of $3,331,578, which were reclassified to paid-in capital.
The tax character of distributions paid during the years ended December 31, 2012 and 2011, was as follows:
| | | | | | | | |
| | | 2012 | | | 2011 | |
Distributions paid from ordinary income | | $ | 31,065,857 | | | $ | 29,153,177 | |
At December 31, 2012, the cost of investments, net unrealized appreciation (depreciation), and undistributed ordinary income for income tax purposes were as follows:
| | | | |
Cost of investments | | $ | 1,307,970,762 | |
| | | | |
| |
Unrealized appreciation | | $ | 43,137,913 | |
Unrealized depreciation | | | (1,873,831 | ) |
| | | | |
Net unrealized appreciation (depreciation) | | $ | 41,264,082 | |
| | | | |
Distributable earnings - undistributed ordinary income | | $ | 38,649,232 | |
| | | | |
Differences between income and/or capital gains as determined on a book basis and a tax basis are primarily due to differing treatments of paydown losses and bond discounts and premiums.
6. INVESTMENT TRANSACTIONS
Purchases and sales of investments (excluding short term securities) for the year ended December 31, 2012, aggregated $843,087,060 and $522,340,556, respectively.
7. CREDIT FACILITY
The Fund, together with other U.S. registered and foreign investment funds (collectively, Borrowers), managed by Franklin Templeton Investments, are borrowers in a joint syndicated senior unsecured credit facility totaling $1.5 billion (Global Credit Facility) which matured on January 18, 2013. This Global Credit Facility provides a source of funds to the Borrowers for temporary and emergency purposes, including the ability to meet future unanticipated or unusually large redemption requests. Effective January 18, 2013, the Borrowers renewed the Global Credit Facility which matures on January 17, 2014.
FUS-23
Franklin Templeton Variable Insurance Products Trust
Notes to Financial Statements (continued)
Franklin U.S. Government Fund
7. CREDIT FACILITY (continued)
Under the terms of the Global Credit Facility, the Fund shall, in addition to interest charged on any borrowings made by the Fund and other costs incurred by the Fund, pay its share of fees and expenses incurred in connection with the implementation and maintenance of the Global Credit Facility, based upon its relative share of the aggregate net assets of all of the Borrowers, including an annual commitment fee of 0.07% based upon the unused portion of the Global Credit Facility. These fees are reflected in other expenses on the Statement of Operations. During the year ended December 31, 2012, the Fund did not use the Global Credit Facility.
8. FAIR VALUE MEASUREMENTS
The Fund follows a fair value hierarchy that distinguishes between market data obtained from independent sources (observable inputs) and the Fund’s own market assumptions (unobservable inputs). These inputs are used in determining the value of the Fund’s financial instruments and are summarized in the following fair value hierarchy:
| | • | | Level 1 – quoted prices in active markets for identical financial instruments |
| | • | | Level 2 – other significant observable inputs (including quoted prices for similar financial instruments, interest rates, prepayment speed, credit risk, etc.) |
| | • | | Level 3 – significant unobservable inputs (including the Fund’s own assumptions in determining the fair value of financial instruments) |
The inputs or methodology used for valuing financial instruments are not an indication of the risk associated with investing in those financial instruments.
For movements between the levels within the fair value hierarchy, the Fund has adopted a policy of recognizing the transfers as of the date of the underlying event which caused the movement.
At December 31, 2012, all of the Fund’s investments in financial instruments carried at fair value were valued using Level 2 inputs. For detailed categories, see the accompanying Statement of Investments.
9. REVISIONS TO PREVIOUSLY ISSUED FINANCIAL STATEMENTS
After the Fund issued its December 31, 2011 financial statements, the Fund determined a security was not properly accruing income since purchase date in accordance with the effective interest rate method, resulting in an understatement of investment income. The offsetting impact of this error is to unrealized appreciation (depreciation). Accordingly, there is no impact on net increase (decrease) in net assets resulting from operations, beginning and ending net assets, or total return. These adjustments were not considered to be material individually or in aggregate to previously issued financial statements. However, because of the significance of these adjustments to the current year’s financial statements, the Fund has determined to revise the applicable impacted financial statements and financial highlights the next time such financial statements and financial highlights are filed. Accordingly, the Fund revised the financial statements for the year ended December 31, 2011, and certain Financial Highlights information for the years ended December 31, 2011, 2010, 2009, and 2008 to give effect to this change. The following sets forth the line items affected by the revisions discussed above.
| | | | | | | | |
| | | Previously
Reported | | | As Revised | |
Statement of Operations for the year ended December 31, 2011 | | | | | | | | |
Investment Income - interest | | $ | 33,076,985 | | | $ | 33,460,301 | |
Net investment income | | | 26,453,567 | | | | 26,836,883 | |
Net change in unrealized appreciation (depreciation) on investments | | | 19,413,703 | | | | 19,030,387 | |
Net realized and unrealized gain (loss) | | | 24,359,324 | | | | 23,976,008 | |
FUS-24
Franklin Templeton Variable Insurance Products Trust
Notes to Financial Statements (continued)
Franklin U.S. Government Fund
9. REVISIONS TO PREVIOUSLY ISSUED FINANCIAL STATEMENTS (continued)
| | | | | | | | |
| | | Previously
Reported | | | As Revised | |
Statement of Changes in Net Assets for the year ended December 31, 2011 | | | | | | | | |
Net investment income | | $ | 26,453,567 | | | $ | 26,836,883 | |
Net change in unrealized appreciation (depreciation) on investments | | | 19,413,703 | | | | 19,030,387 | |
Undistributed net investment income included in net assets | | | 29,334,459 | | | | 32,779,202 | |
| | | | | | | | | | | | | | | | | | | | | | | | | | | | | | | | |
| | | Previously
Reported | | | As
Revised | | | Previously
Reported | | | As
Revised | | | Previously
Reported | | | As
Revised | | | Previously
Reported | | | As
Revised | |
| Financial Highlights - Class 1 | | 2011 | | | 2011 | | | 2010 | | | 2010 | | | 2009 | | | 2009 | | | 2008 | | | 2008 | |
Per share operating performance | | | | | | | | | | | | | | | | | | | | | | | | | | | | | | | | |
Income from investment operations: | | | | | | | | | | | | | | | | | | | | | | | | | | | | | | | | |
Net investment income | | | $0.42 | | | | $0.42a | | | | $0.46 | | | | $0.47 | | | | $0.51 | | | | $0.52 | | | | $0.58 | | | | $0.59 | |
Net realized and unrealized gains (losses) | | | 0.36 | | | | 0.36a | | | | 0.26 | | | | 0.25 | | | | (0.08 | ) | | | (0.09 | ) | | | 0.39 | | | | 0.38 | |
Ratios to average net assets: Net investment income | | | 3.07% | | | | 3.11% | | | | 3.47% | | | | 3.51% | | | | 3.91% | | | | 3.96% | | | | 4.54% | | | | 4.59% | |
| | | | | | | | |
| | | Previously
Reported | | | As
Revised | | | Previously
Reported | | | As
Revised | | | Previously
Reported | | | As
Revised | | | Previously
Reported | | | As
Revised | |
| Financial Highlights - Class 2 | | 2011 | | | 2011 | | | 2010 | | | 2010 | | | 2009 | | | 2009 | | | 2008 | | | 2008 | |
Per share operating performance | | | | | | | | | | | | | | | | | | | | | | | | | | | | | | | | |
Income from investment operations: | | | | | | | | | | | | | | | | | | | | | | | | | | | | | | | | |
Net investment income | | | $0.37 | | | | $0.38 | | | | $0.42 | | | | $0.43 | | | | $0.47 | | | | $0.48 | | | | $0.54 | | | | $0.55 | |
Net realized and unrealized gains (losses) | | | 0.36 | | | | 0.35 | | | | 0.25 | | | | 0.24 | | | | (0.08 | ) | | | (0.09 | ) | | | 0.38 | | | | 0.37 | |
Ratios to average net assets: Net investment income | | | 2.82% | | | | 2.86% | | | | 3.22% | | | | 3.26% | | | | 3.66% | | | | 3.71% | | | | 4.29% | | | | 4.34% | |
aChanges in per share amounts due to revision round to less than $0.01.
10. NEW ACCOUNTING PRONOUNCEMENTS
In December 2011, the Financial Accounting Standards Board (FASB) issued Accounting Standards Update (ASU) No. 2011-11, Balance Sheet (Topic 210): Disclosures about Offsetting Assets and Liabilities. The amendments in the ASU enhance disclosures about offsetting of financial assets and liabilities to enable investors to understand the effect of these arrangements on a fund’s financial position. In January 2013, FASB issued ASU No. 2013-01, Balance Sheet (Topic 210): Clarifying the Scope of Disclosures about Offsetting Assets and Liabilities. The amendments in ASU No. 2013-01 clarify the intended scope of disclosures required by ASU No. 2011-11. These ASUs are effective for interim and annual reporting periods beginning on or after January 1, 2013. The Fund believes the adoption of these ASUs will not have a material impact on its financial statements.
FUS-25
Franklin Templeton Variable Insurance Products Trust
Notes to Financial Statements (continued)
Franklin U.S. Government Fund
11. SUBSEQUENT EVENTS
The Fund has evaluated subsequent events through the issuance of the financial statements and determined that no events have occurred that require disclosure other than those already disclosed in the financial statements.
| | | | |
ABBREVIATIONS | | | | |
| Selected Portfolio | | | | |
| | | | |
| FFCB - Federal Farm Credit Bank | | | | |
| FHLB - Federal Home Loan Bank | | | | |
| FICO - Financing Corp. | | | | |
| FRN - Floating Rate Note | | | | |
| GL - Government Loan | | | | |
| HUD - Housing and Urban Development | | | | |
| PC - Participation Certificate | | | | |
| PL - Project Loan | | | | |
| SBA - Small Business Administration | | | | |
| SF - Single Family | | | | |
| TVA - Tennessee Valley Authority | | | | |
FUS-26
Franklin Templeton Variable Insurance Products Trust
Franklin U.S. Government Fund
Report of Independent Registered Public Accounting Firm
To the Board of Trustees and Shareholders of
Franklin Templeton Variable Insurance Products Trust
In our opinion, the accompanying statement of assets and liabilities, including the statement of investments, and the related statements of operations and of changes in net assets and the financial highlights present fairly, in all material respects, the financial position of Franklin U.S. Government Fund (the “Fund”) at December 31, 2012, the results of its operations for the year then ended, the changes in its net assets for each of the two years in the period then ended and the financial highlights for each of the five years in the period then ended, in conformity with accounting principles generally accepted in the United States of America. These financial statements and financial highlights (hereafter referred to as “financial statements”) are the responsibility of the Fund’s management. Our responsibility is to express an opinion on these financial statements based on our audits. We conducted our audits of these financial statements in accordance with the standards of the Public Company Accounting Oversight Board (United States). Those standards require that we plan and perform the audit to obtain reasonable assurance about whether the financial statements are free of material misstatement. An audit includes examining, on a test basis, evidence supporting the amounts and disclosures in the financial statements, assessing the accounting principles used and significant estimates made by management, and evaluating the overall financial statement presentation. We believe that our audits, which included confirmation of securities at December 31, 2012 by correspondence with the custodian and brokers, provide a reasonable basis for our opinion.
PricewaterhouseCoopers LLP
San Francisco, California
February 15, 2013
FUS-27
MUTUAL GLOBAL DISCOVERY SECURITIES FUND
This annual report for Mutual Global Discovery Securities Fund covers the fiscal year ended December 31, 2012.
Performance Summary as of 12/31/12
Average annual total return of Class 2 shares represents the average annual change in value, assuming reinvestment of dividends and capital gains. Average returns smooth out variations in returns, which can be significant; they are not the same as year-by-year results.
Periods ended 12/31/12
| | | | | | | | | | | | |
| | | 1-Year | | | 5-Year | | | 10-Year | |
Average Annual Total Return | | | +13.36% | | | | +1.67% | | | | +10.21% | |
Total Return Index Comparison for a Hypothetical $10,000 Investment (1/1/03–12/31/12)
The graph below shows the change in value of a hypothetical $10,000 investment in the Fund over the indicated period and includes reinvestment of any income or distributions. The Fund’s performance is compared to the performance of the Standard & Poor’s® 500 Index (S&P 500®) and the MSCI World Index. One cannot invest directly in an index, and an index is not representative of the Fund’s portfolio. Please see Important Notes to Performance Information preceding the Fund Summaries.
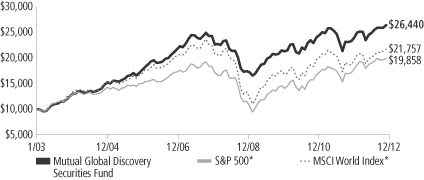
*Source: © 2013 Morningstar. Please see Index Descriptions following the Fund Summaries.
Mutual Global Discovery Securities Fund – Class 2
Performance reflects the Fund’s Class 2 operating expenses, but does not include any contract fees, expenses or sales charges. If they had been included, performance would be lower. These charges and deductions, particularly for variable life policies, can have a significant effect on contract values and insurance benefits. See the contract prospectus for a complete description of these expenses, including sales charges.
Performance data represent past performance, which does not guarantee future results. Investment return and principal value will fluctuate, and you may have a gain or loss when you sell your shares.
Current performance may differ from figures shown.
MGD-1
Fund Goal and Main Investments: Mutual Global Discovery Securities Fund seeks capital appreciation. Under normal market conditions, the Fund invests primarily in U.S. and foreign equity securities that the investment manager believes are undervalued.
Performance Overview
You can find the Fund’s one-year total return in the Performance Summary. The Fund underperformed the MSCI World Index’s +16.54% total return and the S&P 500’s +16.00% total return for the same period.1
Economic and Market Overview
Global developed stocks, as measured by the MSCI World Index, rallied through the spring of 2012 before a brief drop in early summer gave way to a recovery, leading to solid 12-month gains. Periodic downturns were primarily attributable to concerns about slowing global economic growth, European sovereign debt and U.S. fiscal negotiations. The market’s focus early in 2012 was Europe’s debt crisis. Seeking to address it, relatively new leaders in Italy and Greece and for the International Monetary Fund, World Bank and European Central Bank (ECB) offered plans for stability and growth. The leadership’s initial policy responses — which included enhanced liquidity measures and an ineffective Spanish banking bailout — did little to address the structural imbalances of eurozone economies or the solvency fears plaguing the region’s banking system. Thus, debt yields for certain countries spiked to record levels in the first quarter of 2012. However, measures intended to address the seemingly toxic link between Europe’s banks and sovereign bonds emerged when European Union leaders agreed to a deployment of temporary and permanent bailout funds. ECB President Mario Draghi’s declaration that “the ECB is ready to do whatever it takes to preserve the euro” further buoyed markets.
In the U.S., the Federal Reserve Board announced additional rounds of quantitative easing and opted to extend its strategy designed to lower systemically important interest rates. In Asia, the People’s Bank of China cut borrowing costs for the first time since the global financial crisis began, and the Bank of Japan launched its eighth round of quantitative easing in little more than a decade. Headwinds to growth negatively affected most world regions during 2012, including recently
1. Source: © 2013 Morningstar. One cannot invest directly in an index, and an index is not representative of the Fund’s portfolio. Please see Index Descriptions following the Fund Summaries.
Fund Risks: All investments involve risks, including possible loss of principal. Stock prices fluctuate, sometimes rapidly and dramatically, due to factors affecting individual companies, particular industries or sectors, or general market conditions. Value securities may not increase in price as anticipated or may decline further in value. Investments in foreign securities involve certain risks including currency fluctuations, and economic and political uncertainties. Smaller company stocks have exhibited greater price volatility than larger company stocks, particularly over the short term. Investments in companies engaged in mergers, reorganizations or liquidations also involve special risks as pending deals may not be completed on time or on favorable terms. Investments in lower rated bonds entail higher credit risk. The Fund may from time to time enter into certain transactions involving derivatives; such techniques may not achieve the anticipated benefits and/or may result in losses to the Fund. The Fund is actively managed but there is no guarantee that the manager’s investment decisions will produce the desired results. The Fund’s prospectus also includes a description of the main investment risks.
MGD-2
resilient emerging markets, and the International Monetary Fund lowered its global growth outlook. However, the slowdown appeared less severe than expected in developed markets such as Germany and the U.S. In the latter half of 2012, policy measures seemed to take hold and supported global economic recovery, contributing to expansion in many emerging market countries as well as a slowing rate of contraction in Europe. Toward year-end, investor focus shifted to the U.S., where policymakers sought to avert automatic spending cuts and tax hikes, commonly known as the “fiscal cliff.” Just after year-end, Congress passed compromise legislation that preserved lower income tax rates for most U.S. households and delayed far-reaching federal spending cuts. Despite adversity and uncertainty throughout the 12-month period, virtually all major asset classes finished 2012 with positive returns.
Investment Strategy
At Mutual Series, we are committed to our distinctive value approach to investing. Our major investment strategy is investing in undervalued stocks. When selecting undervalued equities, we are attracted to fundamentally strong companies with healthy balance sheets, high-quality assets, substantial free cash flow and shareholder-oriented management teams and whose stocks are trading at discounts to our assessment of the companies’ intrinsic or business value. We also look for asset rich companies whose shares may be trading at depressed levels due to concerns over short-term earnings disappointments, litigation, management strategy or other perceived negatives. While the vast majority of our undervalued equity investments are made in publicly traded companies globally, we may invest occasionally in privately held companies as well.
We complement this more traditional investment strategy with two others. One is distressed investing, which is complex and can take many forms. The most common distressed investment the Fund undertakes is the purchase of financially troubled or bankrupt companies’ debt at a substantial discount to face value. After the financially distressed company is reorganized, often in bankruptcy court, the old debt is typically replaced with new securities issued by the financially stronger company.
The other piece of our investment strategy is participating in arbitrage situations, another highly specialized field. When companies announce proposed mergers or takeovers, commonly referred to as “deals,” the target company may trade at a discount to the bid it ultimately accepts.
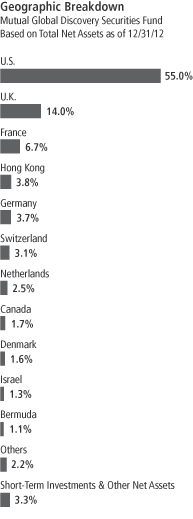
MGD-3
One form of arbitrage involves purchasing the target company’s stock when it is trading below the value we believe it would receive in a deal. In keeping with our commitment to a relatively conservative investment approach, we typically focus our arbitrage efforts on announced deals, and eschew rumored deals or other situations we consider relatively risky.
In addition, it is our practice to hedge the Fund’s currency exposure when we deem it advantageous for our shareholders.
Manager’s Discussion
During the year, many Fund holdings increased in value and contributed to performance. Three particularly strong performers were Germany-based tire and automotive components manufacturer Continental, Hong Kong-based conglomerate Jardine Matheson Holdings and U.S.-based drugstore chain and pharmacy benefits manager CVS Caremark.
Shares of Continental performed well in 2012. Despite some regional softness in auto sales, the company’s strong, relevant and diverse product lineup kept its prospects looking positive, in our view. The company managed to improve operational performance and continued to strengthen its balance sheet, in part by reducing net debt. We believe Continental is one of the better-positioned global auto suppliers due to its focus on fuel efficiency, carbon dioxide emissions reduction, vehicle electronics and technology solutions for global automotive original equipment manufacturers.
Although Jardine Matheson Holdings reported lower profits for the first half of the year, our position in the holding company was a top contributor to the Fund’s performance in 2012. We believe the company has a strong suite of businesses and our analyses showed the stock continued to trade at reasonable valuations. In addition, we believe its complex cross-shareholding structure with Jardine Strategic Holdings and its holding company status have created a discount on the company’s shares. In our view, management has remained efficient and focused on adding to shareholder value.
CVS Caremark is a U.S.-based retail drug store operator and pharmacy benefit manager. We believe that an aging U.S. population, the upcoming expansion of health care coverage, and the trend of chain drugstores taking market share from independents are all favorable trends contributing to growth prospects for CVS Caremark. The company has
Top 10 Sectors/Industries
Mutual Global Discovery Securities Fund
Based on Equity Securities
12/31/12
| | | | |
| | | % of Total
Net Assets | |
| Oil, Gas & Consumable Fuels | | | 8.3% | |
| Commercial Banks | | | 8.2% | |
| Tobacco | | | 7.3% | |
| Insurance | | | 6.9% | |
| Pharmaceuticals | | | 5.3% | |
| Food & Staples Retailing | | | 4.8% | |
| Media | | | 4.6% | |
| Software | | | 4.0% | |
| Diversified Financial Services | | | 3.9% | |
| Industrial Conglomerates | | | 3.0% | |
MGD-4
generated strong free cash flow and management remains disciplined about returning cash to shareholders, as demonstrated by an authorized buyback plan and a substantial dividend increase announced in the second half of 2012.
During the 12 months under review, some of the Fund’s investments lost value and negatively affected Fund performance. Key detractors included U.S. energy company Exelon and French firms Eutelsat Communications, a satellite provider, and utility GDF Suez.
Exelon detracted from performance as operations were negatively affected by a challenging pricing environment, unseasonably warm weather and storm costs throughout the year. Despite the short-term challenges, we see attractive potential in Exelon, whose assets include clean merchant power generation and regulated entities in the Midwest, eastern Pennsylvania and metro D.C. areas. The stock also provided the Fund with an attractive dividend yield.
France-based satellite communication services company Eutelsat Communications announced fiscal third-quarter revenues that fell short of analyst estimates, due in part to a lack of satellite capacity in regions sought by the U.S. Department of Defense, which leases transponders from Eutelsat. Although the acquisition of one satellite and the launch of two additional satellites in 2012 helped to increase the company’s available capacity and revenue growth potential, we decided to sell our position by period-end to pursue other investment opportunities that, in our view, had a more attractive risk/reward profile.
France-based natural gas and electricity supplier GDF Suez experienced a challenging 2012. Lower power prices across Europe, uncertainties surrounding future French gas tariff increases and concerns about the company’s ability to sustain its dividend all weighed on the stock price. Management’s repeated assurances regarding dividend policy helped stabilize shares, albeit at historically low levels. As long-term investors, we continued to see GDF Suez as a stock offering an attractive combination of above average growth prospects arising from large and growing power generation activities outside Europe, strong positioning in the global liquefied natural gas supply chain, a solid balance sheet and a high dividend yield.
Top 10 Equity Holdings
Mutual Global Discovery Securities Fund
12/31/12
| | | | |
Company
Sector/Industry,
Country | | % of Total
Net Assets | |
| ACE Ltd. | | | 2.5% | |
| Insurance, U.S. | | | | |
| Merck & Co. Inc. | | | 2.1% | |
| Pharmaceuticals, U.S. | | | | |
| Vodafone Group PLC | | | 2.1% | |
| Wireless Telecommunication Services, U.K. | | | | |
| Wells Fargo & Co. | | | 2.1% | |
| Commercial Banks, U.S. | | | | |
| Royal Dutch Shell PLC, A | | | 2.1% | |
Oil, Gas & Consumable Fuels,
U.K. | |
| British American Tobacco PLC | | | 2.0% | |
| Tobacco, U.K. | | | | |
| Microsoft Corp. | | | 1.9% | |
| Software, U.S. | | | | |
| American International Group Inc. | | | 1.8% | |
| Insurance, U.S. | | | | |
| Jardine Strategic Holdings Ltd. | | | 1.8% | |
| Industrial Conglomerates, Hong Kong | | | | |
| Imperial Tobacco Group PLC | | | 1.8% | |
| Tobacco, U.K. | | | | |
The dollar value, number of shares or principal amount, and names of all portfolio holdings are listed in the Fund’s Statement of Investments (SOI).
MGD-5
During the year, the Fund held currency forwards to somewhat hedge the currency risk of the portfolio’s non-U.S. dollar investments. The hedges had a negative impact on the Fund’s performance during the period.
Thank you for your participation in Mutual Global Discovery Securities Fund. We look forward to serving your future investment needs.
The foregoing information reflects our analysis, opinions and portfolio holdings as of December 31, 2012, the end of the reporting period. The way we implement our main investment strategies and the resulting portfolio holdings may change depending on factors such as market and economic conditions. These opinions may not be relied upon as investment advice or an offer for a particular security. The information is not a complete analysis of every aspect of any market, country, industry, security or the Fund. Statements of fact are from sources considered reliable, but the investment manager makes no representation or warranty as to their completeness or accuracy. Although historical performance is no guarantee of future results, these insights may help you understand our investment management philosophy.
MGD-6
Fund Expenses
As an investor in a variable insurance contract (Contract) that indirectly provides for investment in an underlying mutual fund, you can incur transaction and/or ongoing expenses at both the Fund level and the Contract level.
| • | | Transaction expenses can include sales charges (loads) on purchases, redemption fees, surrender fees, transfer fees and premium taxes. |
| • | | Ongoing expenses can include management fees, distribution and service (12b-1) fees, contract fees, annual maintenance fees, mortality and expense risk fees and other fees and expenses. All mutual funds and Contracts have some types of ongoing expenses. |
The expenses shown in the table are meant to highlight ongoing expenses at the Fund level only and do not include ongoing expenses at the Contract level, or transaction expenses at either the Fund or Contract level. While the Fund does not have transaction expenses, if the transaction and ongoing expenses at the Contract level were included, the expenses shown below would be higher. You should consult your Contract prospectus or disclosure document for more information.
The table shows Fund-level ongoing expenses and can help you understand these expenses and compare them with those of other mutual funds offered through the Contract. The table assumes a $1,000 investment held for the six months indicated. Please refer to the Fund prospectus for additional information on operating expenses.
Actual Fund Expenses
The first line (Actual) of the table provides actual account values and expenses. The “Ending Account Value” is derived from the Fund’s actual return, which includes the effect of ongoing Fund expenses, but does not include the effect of ongoing Contract expenses.
You can estimate the Fund-level expenses you incurred during the period by following these steps. Of course, your account value and expenses will differ from those in this illustration:
| 1. | Divide your account value by $1,000. |
If an account had an $8,600 value, then $8,600 ÷ $1,000 = 8.6.
| 2. | Multiply the result by the number under the heading “Fund-Level Expenses Incurred During Period.” |
If Fund-Level Expenses Incurred During Period were $7.50, then 8.6 x $7.50 = $64.50.
In this illustration, the estimated expenses incurred this period at the Fund level are $64.50.
Mutual Global Discovery Securities Fund – Class 2
MGD-7
Hypothetical Example for Comparison with Other Mutual Funds
Information in the second line (Hypothetical) of the table can help you compare ongoing expenses of the Fund with those of other mutual funds offered through the Contract. This information may not be used to estimate the actual ending account balance or expenses you incurred during the period. The hypothetical “Ending Account Value” is based on the Fund’s actual expense ratio and an assumed 5% annual rate of return before expenses, which does not represent the Fund’s actual return. The figure under the heading “Fund-Level Expenses Incurred During Period” shows the hypothetical expenses your account would have incurred under this scenario. You can compare this figure with the 5% hypothetical examples that appear in shareholder reports of other funds offered through a Contract.
| | | | | | | | | | | | |
| Class 2 | | Beginning
Account Value 7/1/12 | | | Ending
Account Value 12/31/12 | | | Fund-Level Expenses Incurred
During Period* 7/1/12–12/31/12 | |
Actual | | $ | 1,000 | | | $ | 1,076.60 | | | $ | 6.42 | |
Hypothetical (5% return before
expenses) | | $ | 1,000 | | | $ | 1,018.95 | | | $ | 6.24 | |
*Expenses are calculated using the most recent six-month annualized expense ratio for the Fund’s Class 2 shares (1.23%), which does not include any ongoing expenses of the Contract for which the Fund is an investment option, multiplied by the average account value over the period, multiplied by 184/366 to reflect the one-half year period.
MGD-8
Franklin Templeton Variable Insurance Products Trust
Financial Highlights
Mutual Global Discovery Securities Fund
| | | | | | | | | | | | | | | | | | | | |
| | | Year Ended December 31, | |
Class 1 | | 2012 | | | 2011 | | | 2010 | | | 2009 | | | 2008 | |
| | | | |
Per share operating performance | | | | | | | | | | | | | | | | | | | | |
(for a share outstanding throughout the year) | | | | | | | | | | | | | | | | | | | | |
Net asset value, beginning of year | | $ | 19.66 | | | $ | 21.16 | | | $ | 19.14 | | | $ | 16.12 | | | $ | 24.08 | |
| | | | |
Income from investment operationsa: | | | | | | | | | | | | | | | | | | | | |
Net investment incomeb | | | 0.43 | | | | 0.52 | | | | 0.38 | | | | 0.19 | c | | | 0.37 | |
Net realized and unrealized gains (losses) | | | 2.21 | | | | (1.09 | ) | | | 1.94 | | | | 3.57 | | | | (6.95 | ) |
| | | | |
Total from investment operations | | | 2.64 | | | | (0.57 | ) | | | 2.32 | | | | 3.76 | | | | (6.58 | ) |
| | | | |
Less distributions from: | | | | | | | | | | | | | | | | | | | | |
Net investment income | | | (0.64 | ) | | | (0.50 | ) | | | (0.30 | ) | | | (0.26 | ) | | | (0.52 | ) |
Net realized gains | | | (1.11 | ) | | | (0.43 | ) | | | — | | | | (0.48 | ) | | | (0.86 | ) |
| | | | |
Total distributions | | | (1.75 | ) | | | (0.93 | ) | | | (0.30 | ) | | | (0.74 | ) | | | (1.38 | ) |
| | | | |
Net asset value, end of year | | $ | 20.55 | | | $ | 19.66 | | | $ | 21.16 | | | $ | 19.14 | | | $ | 16.12 | |
| | | | |
| | | | | |
Total returnd | | | 13.63% | | | | (2.73)% | | | | 12.24% | | | | 23.63% | | | | (28.29)% | |
Ratios to average net assets | | | | | | | | | | | | | | | | | | | | |
Expensese | | | 0.99% | | | | 0.97% | f | | | 1.00% | f | | | 1.06% | f | | | 0.98% | f |
Expenses incurred in connection with securities sold short | | | —% | g | | | —% | g | | | 0.02% | | | | 0.09% | | | | 0.01% | |
Net investment income | | | 2.12% | | | | 2.34% | | | | 1.93% | | | | 1.07% | c | | | 1.82% | |
| | | | | |
Supplemental data | | | | | | | | | | | | | | | | | | | | |
Net assets, end of year (000’s) | | $ | 1,136 | | | $ | 974 | | | $ | 84,213 | | | $ | 86,755 | | | $ | 81,320 | |
Portfolio turnover rate | | | 25.63% | | | | 26.17% | h | | | 49.31% | | | | 43.35% | | | | 22.76% | |
aThe amount shown for a share outstanding throughout the period may not correlate with the Statement of Operations for the period due to the timing of sales and repurchases of the Fund shares in relation to income earned and/or fluctuating market value of the investments of the Fund.
bBased on average daily shares outstanding.
cNet investment income per share includes approximately $(0.03) per share related to an adjustment for uncollectible interest. Excluding the effect of this adjustment, the ratio of net investment income to average net assets would have been 1.26%.
dTotal return does not include fees, charges or expenses imposed by the variable annuity and life insurance contracts for which the Franklin Templeton Variable Insurance Products Trust serves as an underlying investment vehicle.
eIncludes dividend or interest expense on securities sold short and security borrowing fees, if any. See below for the ratios of such expenses to average net assets for the periods presented. See Note 1(d).
fBenefit of expense reduction rounds to less than 0.01%.
gRounds to less than 0.01%.
hExcludes the value of portfolio securities delivered as a result of a redemption in-kind. See Note 13.
The accompanying notes are an integral part of these financial statements.
MGD-9
Franklin Templeton Variable Insurance Products Trust
Financial Highlights (continued)
Mutual Global Discovery Securities Fund
| | | | | | | | | | | | | | | | | | | | |
| | | Year Ended December 31, | |
| Class 2 | | 2012 | | | 2011 | | | 2010 | | | 2009 | | | 2008 | |
| | | | |
Per share operating performance | | | | | | | | | | | | | | | | | | | | |
(for a share outstanding throughout the year) | | | | | | | | | | | | | | | | | | | | |
Net asset value, beginning of year | | $ | 19.30 | | | $ | 20.80 | | | $ | 18.81 | | | $ | 15.85 | | | $ | 23.69 | |
| | | | |
Income from investment operationsa: | | | | | | | | | | | | | | | | | | | | |
Net investment incomeb | | | 0.38 | | | | 0.43 | | | | 0.33 | | | | 0.14 | c | | | 0.32 | |
Net realized and unrealized gains (losses) | | | 2.15 | | | | (1.04 | ) | | | 1.91 | | | | 3.50 | | | | (6.84 | ) |
| | | | |
Total from investment operations | | | 2.53 | | | | (0.61 | ) | | | 2.24 | | | | 3.64 | | | | (6.52 | ) |
| | | | |
Less distributions from: | | | | | | | | | | | | | | | | | | | | |
Net investment income | | | (0.55 | ) | | | (0.46 | ) | | | (0.25 | ) | | | (0.20 | ) | | | (0.46 | ) |
Net realized gains | | | (1.11 | ) | | | (0.43 | ) | | | — | | | | (0.48 | ) | | | (0.86 | ) |
| | | | |
Total distributions | | | (1.66 | ) | | | (0.89 | ) | | | (0.25 | ) | | | (0.68 | ) | | | (1.32 | ) |
| | | | |
Net asset value, end of year | | $ | 20.17 | | | $ | 19.30 | | | $ | 20.80 | | | $ | 18.81 | | | $ | 15.85 | |
| | | | |
| | | | | |
Total returnd | | | 13.36% | | | | (2.96)% | | | | 11.96% | | | | 23.31% | | | | (28.45)% | |
Ratios to average net assets | | | | | | | | | | | | | | | | | | | | |
Expensese | | | 1.24% | | | | 1.22% | f | | | 1.25% | f | | | 1.31% | f | | | 1.23% | f |
Expenses incurred in connection with securities sold short | | | —% | g | | | —% | g | | | 0.02% | | | | 0.09% | | | | 0.01% | |
Net investment income | | | 1.87% | | | | 2.09% | | | | 1.68% | | | | 0.82% | c | | | 1.57% | |
| | | | | |
Supplemental data | | | | | | | | | | | | | | | | | | | | |
Net assets, end of year (000’s) | | $ | 660,465 | | | $ | 712,161 | | | $ | 1,351,223 | | | $ | 1,309,852 | | | $ | 1,113,720 | |
Portfolio turnover rate | | | 25.63% | | | | 26.17% | h | | | 49.31% | | | | 43.35% | | | | 22.76% | |
aThe amount shown for a share outstanding throughout the period may not correlate with the Statement of Operations for the period due to the timing of sales and repurchases of the Fund shares in relation to income earned and/or fluctuating market value of the investments of the Fund.
bBased on average daily shares outstanding.
cNet investment income per share includes approximately $(0.03) per share related to an adjustment for uncollectible interest. Excluding the effect of this adjustment, the ratio of net investment income to average net assets would have been 1.01%.
dTotal return does not include fees, charges or expenses imposed by the variable annuity and life insurance contracts for which the Franklin Templeton Variable Insurance Products Trust serves as an underlying investment vehicle.
eIncludes dividend or interest expense on securities sold short and security borrowing fees, if any. See below for the ratios of such expenses to average net assets for the periods presented. See Note 1(d).
fBenefit of expense reduction rounds to less than 0.01%.
gRounds to less than 0.01%.
hExcludes the value of portfolio securities delivered as a result of a redemption in-kind. See Note 13.
The accompanying notes are an integral part of these financial statements.
MGD-10
Franklin Templeton Variable Insurance Products Trust
Financial Highlights (continued)
Mutual Global Discovery Securities Fund
| | | | | | | | | | | | | | | | | | | | |
| | | Year Ended December 31, | |
| Class 4 | | 2012 | | | 2011 | | | 2010 | | | 2009 | | | 2008a | |
| | | | |
Per share operating performance | | | | | | | | | | | | | | | | | | | | |
(for a share outstanding throughout the year) | | | | | | | | | | | | | | | | | | | | |
Net asset value, beginning of year | | $ | 19.50 | | | $ | 21.02 | | | $ | 19.02 | | | $ | 16.07 | | | $ | 22.50 | |
| | | | |
Income from investment operationsb: | | | | | | | | | | | | | | | | | | | | |
Net investment incomec | | | 0.36 | | | | 0.40 | | | | 0.31 | | | | 0.11 | d | | | 0.09 | |
Net realized and unrealized gains (losses) | | | 2.19 | | | | (1.05 | ) | | | 1.94 | | | | 3.56 | | | | (5.14 | ) |
| | | | |
Total from investment operations | | | 2.55 | | | | (0.65 | ) | | | 2.25 | | | | 3.67 | | | | (5.05 | ) |
| | | | |
Less distributions from: | | | | | | | | | | | | | | | | | | | | |
Net investment income | | | (0.56 | ) | | | (0.44 | ) | | | (0.25 | ) | | | (0.24 | ) | | | (0.52 | ) |
Net realized gains | | | (1.11 | ) | | | (0.43 | ) | | | — | | | | (0.48 | ) | | | (0.86 | ) |
| | | | |
Total distributions | | | (1.67 | ) | | | (0.87 | ) | | | (0.25 | ) | | | (0.72 | ) | | | (1.38 | ) |
| | | | |
Net asset value, end of year | | $ | 20.38 | | | $ | 19.50 | | | $ | 21.02 | | | $ | 19.02 | | | $ | 16.07 | |
| | | | |
| | | | | |
Total returne | | | 13.27% | | | | (3.08)% | | | | 11.87% | | | | 23.19% | | | | (23.48)% | |
Ratios to average net assetsf | | | | | | | | | | | | | | | | | | | | |
Expensesg | | | 1.34% | | | | 1.32% | h | | | 1.35% | h | | | 1.41% | h | | | 1.33% | h |
Expenses incurred in connection with securities sold short | | | —% | i | | | —% | i | | | 0.02% | | | | 0.09% | | | | 0.01% | |
Net investment income | | | 1.77% | | | | 1.99% | | | | 1.58% | | | | 0.72% | d | | | 1.47% | |
| | | | | |
Supplemental data | | | | | | | | | | | | | | | | | | | | |
Net assets, end of year (000’s) | | $ | 62,346 | | | $ | 66,695 | | | $ | 70,613 | | | $ | 59,178 | | | $ | 23,981 | |
Portfolio turnover rate | | | 25.63% | | | | 26.17% | j | | | 49.31% | | | | 43.35% | | | | 22.76% | |
aFor the period February 29, 2008 (effective date) to December 31, 2008.
bThe amount shown for a share outstanding throughout the period may not correlate with the Statement of Operations for the period due to the timing of sales and repurchases of the Fund shares in relation to income earned and/or fluctuating market value of the investments of the Fund.
cBased on average daily shares outstanding.
dNet investment income per share includes approximately $(0.03) per share related to an adjustment for uncollectible interest. Excluding the effect of this adjustment, the ratio of net investment income to average net assets would have been 0.91%.
eTotal return does not include fees, charges or expenses imposed by the variable annuity and life insurance contracts for which the Franklin Templeton Variable Insurance Products Trust serves as an underlying investment vehicle. Total return is not annualized for periods less than one year.
fRatios are annualized for periods less than one year.
gIncludes dividend or interest expense on securities sold short and security borrowing fees, if any. See below for the ratios of such expenses to average net assets for the periods presented. See Note 1(d).
hBenefit of expense reduction rounds to less than 0.01%.
iRounds to less than 0.01%.
jExcludes the value of portfolio securities delivered as a result of a redemption in-kind. See Note 13.
The accompanying notes are an integral part of these financial statements.
MGD-11
Franklin Templeton Variable Insurance Products Trust
Statement of Investments, December 31, 2012
| | | | | | | | | | |
| Mutual Global Discovery Securities Fund | | Country | | Shares | | | Value | |
Common Stocks and Other Equity Interests 90.3% | | | | | | | | | | |
Aerospace & Defense 0.4% | | | | | | | | | | |
Safran SA | | France | | | 73,323 | | | $ | 3,174,550 | |
| | | | | | | | | | |
Auto Components 1.1% | | | | | | | | | | |
Continental AG | | Germany | | | 52,393 | | | | 6,104,953 | |
a,b International Automotive Components Group Brazil LLC | | Brazil | | | 424,073 | | | | 66,609 | |
a,b,c International Automotive Components Group North America, LLC | | United States | | | 3,000,220 | | | | 1,533,983 | |
| | | | | | | | | | |
| | | | | | | | | 7,705,545 | |
| | | | | | | | | | |
Automobiles 0.5% | | | | | | | | | | |
a General Motors Co. | | United States | | | 136,940 | | | | 3,947,980 | |
| | | | | | | | | | |
Beverages 2.3% | | | | | | | | | | |
Coca-Cola Enterprises Inc. | | United Kingdom | | | 107,220 | | | | 3,402,091 | |
Dr. Pepper Snapple Group Inc. | | United States | | | 120,110 | | | | 5,306,460 | |
Pernod Ricard SA | | France | | | 65,896 | | | | 7,643,283 | |
| | | | | | | | | | |
| | | | | | | | | 16,351,834 | |
| | | | | | | | | | |
Capital Markets 2.5% | | | | | | | | | | |
Morgan Stanley | | United States | | | 450,600 | | | | 8,615,472 | |
UBS AG | | Switzerland | | | 609,866 | | | | 9,507,607 | |
| | | | | | | | | | |
| | | | | | | | | 18,123,079 | |
| | | | | | | | | | |
Chemicals 0.8% | | | | | | | | | | |
Linde AG | | Germany | | | 32,285 | | | | 5,646,702 | |
| | | | | | | | | | |
Commercial Banks 8.2% | | | | | | | | | | |
a,b,d The Bankshares Inc. | | United States | | | 800,000 | | | | 3,306,976 | |
Barclays PLC | | United Kingdom | | | 792,081 | | | | 3,439,654 | |
BNP Paribas SA | | France | | | 138,020 | | | | 7,855,396 | |
a,b Capital Bank Financial Corp., A, 144A | | United States | | | 78,494 | | | | 1,272,898 | |
a,b Capital Bank Financial Corp., B, 144A, non-voting | | United States | | | 269,922 | | | | 4,377,190 | |
a CIT Group Inc. | | United States | | | 99,532 | | | | 3,845,917 | |
HSBC Holdings PLC | | United Kingdom | | | 687,585 | | | | 7,288,081 | |
KB Financial Group Inc. | | South Korea | | | 101,400 | | | | 3,613,121 | |
PNC Financial Services Group Inc. | | United States | | | 157,001 | | | | 9,154,728 | |
Wells Fargo & Co. | | United States | | | 445,130 | | | | 15,214,543 | |
| | | | | | | | | | |
| | | | | | | | | 59,368,504 | |
| | | | | | | | | | |
Communications Equipment 1.2% | | | | | | | | | | |
Cisco Systems Inc. | | United States | | | 359,180 | | | | 7,057,887 | |
a,e Research In Motion Ltd. | | Canada | | | 156,132 | | | | 1,854,848 | |
| | | | | | | | | | |
| | | | | | | | | 8,912,735 | |
| | | | | | | | | | |
Computers & Peripherals 0.6% | | | | | | | | | | |
Hewlett-Packard Co. | | United States | | | 311,640 | | | | 4,440,870 | |
| | | | | | | | | | |
Construction & Engineering 0.7% | | | | | | | | | | |
Vinci SA | | France | | | 99,255 | | | | 4,777,573 | |
| | | | | | | | | | |
Construction Materials 0.2% | | | | | | | | | | |
CRH PLC | | Ireland | | | 57,097 | | | | 1,160,822 | |
| | | | | | | | | | |
Consumer Finance 0.0%† | | | | | | | | | | |
a Comdisco Holding Co. Inc. | | United States | | | 44 | | | | 220 | |
| | | | | | | | | | |
Containers & Packaging 0.9% | | | | | | | | | | |
Rexam PLC | | United Kingdom | | | 891,297 | | | | 6,380,292 | |
| | | | | | | | | | |
MGD-12
Franklin Templeton Variable Insurance Products Trust
Statement of Investments, December 31, 2012 (continued)
| | | | | | | | | | |
| Mutual Global Discovery Securities Fund | | Country | | Shares | | | Value | |
Common Stocks and Other Equity Interests (continued) | | | | | | | | | | |
Diversified Financial Services 3.3% | | | | | | | | | | |
Citigroup Inc. | | United States | | | 243,290 | | | $ | 9,624,552 | |
a ING Groep NV | | Netherlands | | | 994,910 | | | | 9,447,127 | |
JPMorgan Chase & Co. | | United States | | | 62,020 | | | | 2,727,019 | |
NYSE Euronext | | United States | | | 77,522 | | | | 2,445,044 | |
| | | | | | | | | | |
| | | | | | | | | 24,243,742 | |
| | | | | | | | | | |
Diversified Telecommunication Services 0.6% | | | | | | | | | | |
a,f,g Global Crossing Holdings Ltd., Contingent Distribution | | United States | | | 2,236,777 | | | | — | |
a,f,g Marconi Corp., Contingent Distribution | | United Kingdom | | | 1,739,100 | | | | 32,587 | |
Vivendi SA | | France | | | 183,456 | | | | 4,147,926 | |
| | | | | | | | | | |
| | | | | | | | | 4,180,513 | |
| | | | | | | | | | |
Electric Utilities 1.2% | | | | | | | | | | |
a,b AET&D Holdings No. 1 Pty. Ltd. | | Australia | | | 1,361,600 | | | | — | |
Exelon Corp. | | United States | | | 288,450 | | | | 8,578,503 | |
| | | | | | | | | | |
| | | | | | | | | 8,578,503 | |
| | | | | | | | | | |
Electrical Equipment 0.9% | | | | | | | | | | |
Alstom SA | | France | | | 158,488 | | | | 6,382,819 | |
| | | | | | | | | | |
Electronic Equipment, Instruments & Components 0.5% | | | | | | | | | | |
Hoya Corp. | | Japan | | | 169,554 | | | | 3,336,258 | |
| | | | | | | | | | |
Energy Equipment & Services 2.1% | | | | | | | | | | |
Baker Hughes Inc. | | United States | | | 147,071 | | | | 6,006,380 | |
Ensco PLC, A | | United States | | | 95,904 | | | | 5,685,189 | |
Transocean Ltd. | | United States | | | 73,643 | | | | 3,288,160 | |
| | | | | | | | | | |
| | | | | | | | | 14,979,729 | |
| | | | | | | | | | |
Food & Staples Retailing 4.8% | | | | | | | | | | |
China Resources Enterprise Ltd. | | China | | | 798,000 | | | | 2,877,856 | |
CVS Caremark Corp. | | United States | | | 204,561 | | | | 9,890,524 | |
Koninklijke Ahold NV | | Netherlands | | | 647,986 | | | | 8,686,538 | |
Metro AG | | Germany | | | 236,053 | | | | 6,556,118 | |
Walgreen Co. | | United States | | | 176,650 | | | | 6,537,817 | |
| | | | | | | | | | |
| | | | | | | | | 34,548,853 | |
| | | | | | | | | | |
Food Products 1.1% | | | | | | | | | | |
Kraft Foods Group Inc. | | United States | | | 46,575 | | | | 2,117,765 | |
Mondelez International Inc., A | | United States | | | 245,198 | | | | 6,245,193 | |
| | | | | | | | | | |
| | | | | | | | | 8,362,958 | |
| | | | | | | | | | |
Health Care Equipment & Supplies 2.4% | | | | | | | | | | |
a Boston Scientific Corp. | | United States | | | 777,474 | | | | 4,454,926 | |
Medtronic Inc. | | United States | | | 257,934 | | | | 10,580,453 | |
Stryker Corp. | | United States | | | 46,588 | | | | 2,553,954 | |
| | | | | | | | | | |
| | | | | | | | | 17,589,333 | |
| | | | | | | | | | |
Health Care Providers & Services 1.9% | | | | | | | | | | |
Cigna Corp. | | United States | | | 194,041 | | | | 10,373,432 | |
WellPoint Inc. | | United States | | | 62,210 | | | | 3,789,833 | |
| | | | | | | | | | |
| | | | | | | | | 14,163,265 | |
| | | | | | | | | | |
Hotels, Restaurants & Leisure 1.1% | | | | | | | | | | |
Accor SA | | France | | | 233,246 | | | | 8,316,971 | |
| | | | | | | | | | |
MGD-13
Franklin Templeton Variable Insurance Products Trust
Statement of Investments, December 31, 2012 (continued)
| | | | | | | | | | |
| Mutual Global Discovery Securities Fund | | Country | | Shares | | | Value | |
Common Stocks and Other Equity Interests (continued) | | | | | | | | | | |
Independent Power Producers & Energy Traders 1.1% | | | | | | | | | | |
NRG Energy Inc. | | United States | | | 364,067 | | | $ | 8,369,900 | |
| | | | | | | | | | |
Industrial Conglomerates 3.0% | | | | | | | | | | |
Jardine Matheson Holdings Ltd. | | Hong Kong | | | 141,097 | | | | 8,804,001 | |
Jardine Strategic Holdings Ltd. | | Hong Kong | | | 371,698 | | | | 13,298,750 | |
| | | | | | | | | | |
| | | | | | | | | 22,102,751 | |
| | | | | | | | | | |
Insurance 6.9% | | | | | | | | | | |
ACE Ltd. | | United States | | | 223,660 | | | | 17,848,068 | |
a Alleghany Corp. | | United States | | | 2,730 | | | | 915,697 | |
a American International Group Inc. | | United States | | | 376,943 | | | | 13,306,088 | |
E-L Financial Corp. Ltd. | | Canada | | | 5,378 | | | | 2,355,328 | |
a,b Imagine Group Holdings Ltd. | | Bermuda | | | 56,213 | | | | 648,760 | |
MetLife Inc. | | United States | | | 78,866 | | | | 2,597,846 | |
a,b Olympus Re Holdings Ltd. | | United States | | | 2,140 | | | | — | |
PartnerRe Ltd. | | Bermuda | | | 94,940 | | | | 7,641,720 | |
Zurich Insurance Group AG | | Switzerland | | | 17,558 | | | | 4,668,834 | |
| | | | | | | | | | |
| | | | | | | | | 49,982,341 | |
| | | | | | | | | | |
Machinery 0.6% | | | | | | | | | | |
Stanley Black & Decker Inc. | | United States | | | 61,412 | | | | 4,542,646 | |
| | | | | | | | | | |
Marine 1.6% | | | | | | | | | | |
A.P. Moller - Maersk AS, B | | Denmark | | | 1,565 | | | | 11,792,414 | |
| | | | | | | | | | |
Media 4.6% | | | | | | | | | | |
CBS Corp., B | | United States | | | 207,961 | | | | 7,912,916 | |
Comcast Corp., Special A | | United States | | | 48,623 | | | | 1,747,997 | |
Daekyo Co. Ltd. | | South Korea | | | 5,711 | | | | 34,095 | |
News Corp., B | | United States | | | 224,400 | | | | 5,888,256 | |
Reed Elsevier PLC | | United Kingdom | | | 792,969 | | | | 8,368,195 | |
Time Warner Cable Inc. | | United States | | | 66,570 | | | | 6,469,938 | |
a,b Tribune Co., A | | United States | | | 43,818 | | | | 1,865,639 | |
a,b Tribune Co., B | | United States | | | 26,867 | | | | 1,143,916 | |
| | | | | | | | | | |
| | | | | | | | | 33,430,952 | |
| | | | | | | | | | |
Metals & Mining 1.1% | | | | | | | | | | |
ThyssenKrupp AG | | Germany | | | 344,296 | | | | 8,127,551 | |
| | | | | | | | | | |
Multi-Utilities 0.9% | | | | | | | | | | |
GDF Suez | | France | | | 305,073 | | | | 6,281,632 | |
| | | | | | | | | | |
Multiline Retail 0.6% | | | | | | | | | | |
Kohl’s Corp. | | United States | | | 99,870 | | | | 4,292,413 | |
| | | | | | | | | | |
Office Electronics 1.0% | | | | | | | | | | |
Xerox Corp. | | United States | | | 1,021,107 | | | | 6,963,950 | |
| | | | | | | | | | |
Oil, Gas & Consumable Fuels 8.3% | | | | | | | | | | |
Apache Corp. | | United States | | | 110,560 | | | | 8,678,960 | |
BP PLC | | United Kingdom | | | 1,318,154 | | | | 9,167,568 | |
CONSOL Energy Inc. | | United States | | | 205,976 | | | | 6,611,830 | |
Marathon Oil Corp. | | United States | | | 198,761 | | | | 6,094,012 | |
Murphy Oil Corp. | | United States | | | 93,480 | | | | 5,566,734 | |
Nexen Inc. | | Canada | | | 292,140 | | | | 7,870,252 | |
Royal Dutch Shell PLC, A | | United Kingdom | | | 434,641 | | | | 14,956,450 | |
a WPX Energy Inc. | | United States | | | 59,656 | | | | 887,681 | |
| | | | | | | | | | |
| | | | | | | | | 59,833,487 | |
| | | | | | | | | | |
MGD-14
Franklin Templeton Variable Insurance Products Trust
Statement of Investments, December 31, 2012 (continued)
| | | | | | | | | | |
| Mutual Global Discovery Securities Fund | | Country | | Shares | | | Value | |
Common Stocks and Other Equity Interests (continued) | | | | | | | | | | |
Paper & Forest Products 0.3% | | | | | | | | | | |
a,b NewPage Holdings Inc. | | United States | | | 19,416 | | | $ | 1,860,053 | |
| | | | | | | | | | |
Personal Products 0.6% | | | | | | | | | | |
Avon Products Inc. | | United States | | | 287,177 | | | | 4,123,862 | |
| | | | | | | | | | |
Pharmaceuticals 5.3% | | | | | | | | | | |
Eli Lilly & Co. | | United States | | | 73,710 | | | | 3,635,377 | |
Merck & Co. Inc. | | United States | | | 376,658 | | | | 15,420,379 | |
Novartis AG, ADR | | Switzerland | | | 126,364 | | | | 7,998,841 | |
Pfizer Inc. | | United States | | | 274,917 | | | | 6,894,918 | |
Teva Pharmaceutical Industries Ltd., ADR | | Israel | | | 115,150 | | | | 4,299,701 | |
| | | | | | | | | | |
| | | | | | | | | 38,249,216 | |
| | | | | | | | | | |
Real Estate Management & Development 1.3% | | | | | | | | | | |
g Canary Wharf Group PLC | | United Kingdom | | | 487,324 | | | | 1,847,958 | |
Great Eagle Holdings Ltd. | | Hong Kong | | | 1,012,524 | | | | 3,344,487 | |
a,b Realogy Holdings Corp. | | United States | | | 49,274 | | | | 1,964,160 | |
Swire Pacific Ltd., B | | Hong Kong | | | 973,062 | | | | 2,237,343 | |
| | | | | | | | | | |
| | | | | | | | | 9,393,948 | |
| | | | | | | | | | |
Software 4.0% | | | | | | | | | | |
a Check Point Software Technologies Ltd. | | Israel | | | 114,559 | | | | 5,457,591 | |
Microsoft Corp. | | United States | | | 506,298 | | | | 13,533,345 | |
Nintendo Co. Ltd. | | Japan | | | 29,900 | | | | 3,188,225 | |
a Symantec Corp. | | United States | | | 347,270 | | | | 6,532,149 | |
| | | | | | | | | | |
| | | | | | | | | 28,711,310 | |
| | | | | | | | | | |
Specialty Retail 0.4% | | | | | | | | | | |
Kingfisher PLC | | United Kingdom | | | 690,562 | | | | 3,225,520 | |
| | | | | | | | | | |
Textiles, Apparel & Luxury Goods 0.0%† | | | | | | | | | | |
Compagnie Financiere Richemont SA | | Switzerland | | | 3,162 | | | | 246,645 | |
| | | | | | | | | | |
Tobacco 7.3% | | | | | | | | | | |
Altria Group Inc. | | United States | | | 278,254 | | | | 8,742,741 | |
British American Tobacco PLC | | United Kingdom | | | 291,278 | | | | 14,808,559 | |
Imperial Tobacco Group PLC | | United Kingdom | | | 337,446 | | | | 13,082,218 | |
Lorillard Inc. | | United States | | | 82,933 | | | | 9,675,793 | |
Philip Morris International Inc. | | United States | | | 75,124 | | | | 6,283,371 | |
| | | | | | | | | | |
| | | | | | | | | 52,592,682 | |
| | | | | | | | | | |
Wireless Telecommunication Services 2.1% | | | | | | | | | | |
Vodafone Group PLC | | United Kingdom | | | 6,057,446 | | | | 15,250,892 | |
| | | | | | | | | | |
Total Common Stocks and Other Equity Interests
(Cost $573,545,004) | | | | | | | | | 654,047,815 | |
| | | | | | | | | | |
Preferred Stocks (Cost $5,430,000) 0.6% | | | | | | | | | | |
Diversified Financial Services 0.6% | | | | | | | | | | |
a,b Hightower Holding LLC, pfd., A, Series 2 | | United States | | | 2,172,000 | | | | 4,239,527 | |
| | | | | | | | | | |
MGD-15
Franklin Templeton Variable Insurance Products Trust
Statement of Investments, December 31, 2012 (continued)
| | | | | | | | | | |
| Mutual Global Discovery Securities Fund | | Country | | Principal
Amount* | | | Value | |
Corporate Bonds, Notes and Senior Floating Rate Interests 5.1% | | | | | | | | | | |
Clear Channel Communications Inc., | | | | | | | | | | |
h first lien, senior secured note, 144A, 9.00%, 12/15/19 | | United States | | | 5,184,000 | | | $ | 4,769,280 | |
i senior note, PIK, 11.00%, 8/01/16 | | United States | | | 2,001,000 | | | | 1,525,763 | |
j,k Tranche B Term Loan, 3.862%, 1/29/16 | | United States | | | 7,859,726 | | | | 6,533,397 | |
j,k Tranche C Term Loan, 3.862%, 1/29/16 | | United States | | | 1,365,074 | | | | 1,100,022 | |
Energy Future Intermediate Holding Co. LLC/EFIH Finance Inc., | | | | | | | | | | |
second lien, 11.00%, 10/01/21 | | United States | | | 864,000 | | | | 937,440 | |
h secured note, 144A, 11.75%, 3/01/22 | | United States | | | 2,339,000 | | | | 2,607,985 | |
j Hilton Worldwide Inc., FRN, | | | | | | | | | | |
Mezzanine D Loan, 3.959%, 11/12/15 | | United States | | | 252,414 | | | | 240,740 | |
Mezzanine E Loan, 4.209%, 11/12/15 | | United States | | | 323,946 | | | | 310,381 | |
Mezzanine F Loan, 4.459%, 11/12/15 | | United States | | | 808,866 | | | | 768,423 | |
Mezzanine G Loan, 4.709%, 11/12/15 | | United States | | | 1,456,759 | | | | 1,369,354 | |
j,k iStar Financial Inc., | | | | | | | | | | |
New Tranche A-1 Term Loan, 5.25%, 3/19/16 | | United States | | | 68,078 | | | | 69,099 | |
New Tranche A-2 Term Loan, 7.00%, 3/19/17 | | United States | | | 495,000 | | | | 519,131 | |
h Realogy Corp., senior secured note, 144A, | | | | | | | | | | |
7.875%, 2/15/19 | | United States | | | 411,000 | | | | 450,045 | |
9.00%, 1/15/20 | | United States | | | 365,000 | | | | 421,575 | |
j,k Texas Competitive Electric Holdings Co. LLC, Extended Term Loan, 4.713%, 10/10/17 | | United States | | | 12,912,264 | | | | 8,695,028 | |
Texas Competitive Electric Holdings Co. LLC/Texas Competitive Electric Holdings Finance Inc., | | | | | | | | | | |
senior note, A, 10.25%, 11/01/15 | | United States | | | 1,428,000 | | | | 424,830 | |
h senior secured note, 144A, 11.50%, 10/01/20 | | United States | | | 5,895,000 | | | | 4,642,312 | |
h Wind Acquisition Finance SA, | | | | | | | | | | |
first lien, 144A, 7.375%, 2/15/18 | | Italy | | | 261,000 | EUR | | | 346,353 | |
senior secured note, 144A, 11.75%, 7/15/17 | | Italy | | | 135,000 | | | | 142,088 | |
senior secured note, 144A, 7.375%, 2/15/18 | | Italy | | | 235,000 | EUR | | | 311,850 | |
third lien, 144A, 11.75%, 7/15/17 | | Italy | | | 394,000 | EUR | | | 547,218 | |
| | | | | | | | | | |
Total Corporate Bonds, Notes and Senior Floating Rate Interests
(Cost $39,906,276) | | | | | | | | | 36,732,314 | |
| | | | | | | | | | |
Corporate Notes in Reorganization 0.6% | | | | | | | | | | |
h,l American Airlines Inc., senior secured note, 144A, 7.50%, 3/15/16 | | United States | | | 4,058,000 | | | | 4,392,785 | |
b,l Broadband Ventures III LLC, secured promissory note, 5.00%, 2/01/12 | | United States | | | 727 | | | | — | |
| | | | | | | | | | |
Total Corporate Notes in Reorganization (Cost $4,134,425) | | | | | | | | | 4,392,785 | |
| | | | | | | | | | |
| | | |
| | | | | Shares | | | | |
Companies in Liquidation 0.0%† | | | | | | | | | | |
a Adelphia Recovery Trust | | United States | | | 5,379,562 | | | | 5,380 | |
a,f Adelphia Recovery Trust, Arahova Contingent Value Vehicle, Contingent Distribution | | United States | | | 386,774 | | | | 11,603 | |
a,f,g Century Communications Corp., Contingent Distribution | | United States | | | 1,074,000 | | | | — | |
a,b FIM Coinvestor Holdings I, LLC | | United States | | | 2,077,368 | | | | — | |
a,f,g NewPage Corp. Litigation Trust, Contingent Distribution | | United States | | | 4,387 | | | | — | |
a,f,g Tribune Litigation Trust, Contingent Distribution | | United States | | | 56,883 | | | | — | |
| | | | | | | | | | |
Total Companies in Liquidation (Cost $454,171) | | | | | | | | | 16,983 | |
| | | | | | | | | | |
MGD-16
Franklin Templeton Variable Insurance Products Trust
Statement of Investments, December 31, 2012 (continued)
| | | | | | | | | | |
| Mutual Global Discovery Securities Fund | | Country | | Principal
Amount* | | | Value | |
Asset-Backed Securities 0.1% | | | | | | | | | | |
Airlines 0.1% | | | | | | | | | | |
American Airlines Inc., first lien, 13.00%, 8/01/16 | | United States | | | 47,258 | | | $ | 50,094 | |
American Airlines Pass Through Trust, | | | | | | | | | | |
2009-1A, 10.375%, 7/02/19 | | United States | | | 117,524 | | | | 122,886 | |
2011-2A, 8.625%, 4/15/23 | | United States | | | 488,868 | | | | 508,117 | |
| | | | | | | | | | |
Total Asset-Backed Securities (Cost $686,994) | | | | | | | | | 681,097 | |
| | | | | | | | | | |
Total Investments before Short Term Investments (Cost $624,156,870) | | | | | | | | | 700,110,521 | |
| | | | | | | | | | |
Short Term Investments 2.3% | | | | | | | | | | |
U.S. Government and Agency Securities 2.3% | | | | | | | | | | |
m FHLB, 1/02/13 | | United States | | | 3,600,000 | | | | 3,600,000 | |
m,n U.S. Treasury Bills, 1/03/13 - 6/20/13 | | United States | | | 13,200,000 | | | | 13,197,261 | |
| | | | | | | | | | |
Total U.S. Government and Agency Securities (Cost $16,796,952) | | | | | | | | | 16,797,261 | |
| | | | | | | | | | |
Total Investments before Money Market Funds (Cost $640,953,822) 99.0% | | | | | | | | | 716,907,782 | |
| | | | | | | | | | |
| | | |
| | | | | Shares | | | | |
oInvestments from Cash Collateral Received for Loaned Securities (Cost $2,191,039) 0.3% | | | | | | | | | | |
Money Market Funds 0.3% | | | | | | | | | | |
p BNY Mellon Overnight Government Fund, 0.191% | | | | | 2,191,039 | | | | 2,191,039 | |
| | | | | | | | | | |
Total Investments (Cost $643,144,861) 99.3% | | | | | | | | | 719,098,821 | |
Other Assets, less Liabilities 0.7% | | | | | | | | | 4,848,655 | |
| | | | | | | | | | |
Net Assets 100.0% | | | | | | | | $ | 723,947,476 | |
| | | | | | | | | | |
See Abbreviations on page MGD-37.
†Rounds to less than 0.1% of net assets.
*The principal amount is stated in U.S. dollars unless otherwise indicated.
aNon-income producing.
bSee Note 9 regarding restricted securities.
cAt December 31, 2012, pursuant to the Fund’s policies and the requirements of applicable securities law, the Fund may be restricted from trading this security for a limited or extended period of time due to ownership limits and/or potential possession of material non-public information.
dSee Note 11 regarding holdings of 5% voting securities.
eA portion or all of the security is on loan at December 31, 2012. See Note 1(e).
fContingent distributions represent the right to receive additional distributions, if any, during the reorganization of the underlying company. Shares represent total underlying principal of debt securities.
gSecurity has been deemed illiquid because it may not be able to be sold within seven days. At December 31, 2012, the aggregate value of these securities was $1,880,545, representing 0.26% of net assets.
hSecurity was purchased pursuant to Rule 144A under the Securities Act of 1933 and may be sold in transactions exempt from registration only to qualified institutional buyers or in a public offering registered under the Securities Act of 1933. These securities have been deemed liquid under guidelines approved by the Trust’s Board of Trustees. At December 31, 2012, the aggregate value of these securities was $18,631,491, representing 2.57% of net assets.
iIncome may be received in additional securities and/or cash.
jThe coupon rate shown represents the rate at period end.
kSee Note 1(f) regarding senior floating rate interests.
lSee Note 7 regarding credit risk and defaulted securities.
mThe security is traded on a discount basis with no stated coupon rate.
nSecurity or a portion of the security has been pledged as collateral for open futures and forward contracts. At December 31, 2012, the aggregate value of these securities pledged as collateral was $3,634,794, representing 0.50% of net assets.
oSee Note 1(e) regarding securities on loan.
pThe rate shown is the annualized seven-day yield at period end.
MGD-17
Franklin Templeton Variable Insurance Products Trust
Statement of Investments, December 31, 2012 (continued)
| | | | | | |
| Mutual Global Discovery Securities Fund | | | | | | |
At December 31, 2012, the Fund had the following futures contracts outstanding. See Note 1(c).
Futures Contracts
| | | | | | | | | | | | | | | | | | | | | | | | |
| Description | | Type | | | Number of
Contracts | | | Notional
Value | | | Expiration
Date | | | Unrealized
Appreciation | | | Unrealized
Depreciation | |
Currency Contracts | | | | | | | | | | | | | | | | | | | | | | | | |
EUR/USD | | | Short | | | | 227 | | | $ | 37,477,700 | | | | 3/18/13 | | | | — | | | $ | (630,416 | ) |
GBP/USD | | | Short | | | | 164 | | | | 16,646,000 | | | | 3/18/13 | | | | — | | | | (161,213 | ) |
| | | | | | | | | | | | | | | | | | | | |
Net unrealized appreciation (depreciation) | | | | | | | | | | | | | | | | | | | | | | $ | (791,629 | ) |
| | | | | | | | | | | | | | | | | | | | | | | | |
At December 31, 2012, the Fund had the following forward exchange contracts outstanding. See Note 1(c).
Forward Exchange Contracts
| | | | | | | | | | | | | | | | | | | | | | | | | | | | |
| Currency | | Counterparty | | | Type | | | Quantity | | | Contract
Amount | | | Settlement
Date | | | Unrealized
Appreciation | | | Unrealized
Depreciation | |
Euro | | | SCBT | | | | Sell | | | | 8,256,434 | | | $ | 10,152,407 | | | | 1/17/13 | | | $ | — | | | $ | (744,467 | ) |
Euro | | | HSBC | | | | Sell | | | | 4,301,372 | | | | 5,283,973 | | | | 1/17/13 | | | | — | | | | (392,996 | ) |
Euro | | | FBCO | | | | Sell | | | | 2,458,143 | | | | 3,038,309 | | | | 1/17/13 | | | | — | | | | (205,959 | ) |
Euro | | | HAND | | | | Sell | | | | 1,148,612 | | | | 1,419,598 | | | | 1/17/13 | | | | — | | | | (96,345 | ) |
Euro | | | BOFA | | | | Sell | | | | 908,609 | | | | 1,123,921 | | | | 1/17/13 | | | | — | | | | (75,265 | ) |
Euro | | | BZWS | | | | Sell | | | | 882,925 | | | | 1,093,252 | | | | 1/17/13 | | | | — | | | | (72,036 | ) |
Euro | | | DBAB | | | | Sell | | | | 337,361 | | | | 419,563 | | | | 1/17/13 | | | | — | | | | (25,686 | ) |
Euro | | | SCBT | | | | Buy | | | | 271,826 | | | | 359,356 | | | | 1/17/13 | | | | — | | | | (600 | ) |
Euro | | | BZWS | | | | Buy | | | | 689,697 | | | | 894,657 | | | | 1/17/13 | | | | 15,608 | | | | — | |
Euro | | | BOFA | | | | Buy | | | | 163,063 | | | | 211,561 | | | | 1/17/13 | | | | 3,650 | | | | — | |
Euro | | | SCBT | | | | Buy | | | | 700,000 | | | | 912,772 | | | | 1/17/13 | | | | 11,091 | | | | — | |
Euro | | | FBCO | | | | Buy | | | | 1,988,242 | | | | 2,602,033 | | | | 1/17/13 | | | | 22,058 | | | | — | |
British Pound | | | BOFA | | | | Sell | | | | 4,697,359 | | | | 7,593,281 | | | | 1/22/13 | | | | — | | | | (39,430 | ) |
British Pound | | | SCBT | | | | Sell | | | | 4,026,308 | | | | 6,506,514 | | | | 1/22/13 | | | | — | | | | (35,810 | ) |
British Pound | | | DBAB | | | | Sell | | | | 2,278,174 | | | | 3,680,390 | | | | 1/22/13 | | | | — | | | | (21,401 | ) |
British Pound | | | DBAB | | | | Buy | | | | 133,415 | | | | 216,132 | | | | 1/22/13 | | | | 653 | | | | — | |
British Pound | | | FBCO | | | | Buy | | | | 71,050 | | | | 114,811 | | | | 1/22/13 | | | | 638 | | | | — | |
Swiss Franc | | | FBCO | | | | Sell | | | | 3,364,187 | | | | 3,494,241 | | | | 2/11/13 | | | | — | | | | (184,114 | ) |
Swiss Franc | | | HSBC | | | | Sell | | | | 2,866,679 | | | | 2,972,744 | | | | 2/11/13 | | | | — | | | | (161,643 | ) |
Swiss Franc | | | BOFA | | | | Sell | | | | 648,917 | | | | 688,491 | | | | 2/11/13 | | | | — | | | | (21,026 | ) |
Swiss Franc | | | SSBT | | | | Sell | | | | 481,900 | | | | 508,639 | | | | 2/11/13 | | | | — | | | | (18,264 | ) |
Swiss Franc | | | DBAB | | | | Sell | | | | 334,832 | | | | 355,274 | | | | 2/11/13 | | | | — | | | | (10,826 | ) |
Swiss Franc | | | HAND | | | | Sell | | | | 148,000 | | | | 152,235 | | | | 2/11/13 | | | | — | | | | (9,586 | ) |
Swiss Franc | | | SCBT | | | | Sell | | | | 368,000 | | | | 393,457 | | | | 2/11/13 | | | | — | | | | (8,909 | ) |
Swiss Franc | | | BZWS | | | | Sell | | | | 243,018 | | | | 257,566 | | | | 2/11/13 | | | | — | | | | (8,146 | ) |
Swiss Franc | | | DBAB | | | | Buy | | | | 120,000 | | | | 131,241 | | | | 2/11/13 | | | | — | | | | (417 | ) |
Swiss Franc | | | SCBT | | | | Buy | | | | 48,625 | | | | 53,284 | | | | 2/11/13 | | | | — | | | | (118 | ) |
Swiss Franc | | | FBCO | | | | Buy | | | | 752,900 | | | | 812,681 | | | | 2/11/13 | | | | 10,529 | | | | — | |
Swiss Franc | | | HAND | | | | Sell | | | | 300,000 | | | | 328,724 | | | | 2/11/13 | | | | 708 | | | | — | |
British Pound | | | HAND | | | | Sell | | | | 5,869,840 | | | | 9,209,740 | | | | 2/19/13 | | | | — | | | | (327,316 | ) |
British Pound | | | HSBC | | | | Sell | | | | 3,389,560 | | | | 5,313,135 | | | | 2/19/13 | | | | — | | | | (194,072 | ) |
British Pound | | | DBAB | | | | Sell | | | | 453,037 | | | | 728,672 | | | | 2/19/13 | | | | — | | | | (7,402 | ) |
British Pound | | | BOFA | | | | Sell | | | | 293,728 | | | | 472,242 | | | | 2/19/13 | | | | — | | | | (4,995 | ) |
British Pound | | | FBCO | | | | Sell | | | | 210,916 | | | | 338,750 | | | | 2/19/13 | | | | — | | | | (3,938 | ) |
British Pound | | | SCBT | | | | Sell | | | | 157,609 | | | | 253,386 | | | | 2/19/13 | | | | — | | | | (2,690 | ) |
British Pound | | | SCBT | | | | Buy | | | | 129,648 | | | | 207,558 | | | | 2/19/13 | | | | 3,089 | | | | — | |
British Pound | | | DBAB | | | | Buy | | | | 40,000 | | | | 64,548 | | | | 2/19/13 | | | | 442 | | | | — | |
Euro | | | HAND | | | | Sell | | | | 10,062,302 | | | | 12,655,521 | | | | 2/28/13 | | | | — | | | | (629,564 | ) |
Euro | | | BOFA | | | | Sell | | | | 9,965,961 | | | | 12,542,465 | | | | 2/28/13 | | | | — | | | | (615,422 | ) |
MGD-18
Franklin Templeton Variable Insurance Products Trust
Statement of Investments, December 31, 2012 (continued)
| | | | | | |
| Mutual Global Discovery Securities Fund | | | | | | |
| | | | | | | | | | | | | | | | | | | | | | | | | | | | |
| Currency | | Counterparty | | | Type | | | Quantity | | | Contract
Amount | | | Settlement
Date | | | Unrealized
Appreciation | | | Unrealized
Depreciation | |
Euro | | | DBAB | | | | Sell | | | | 1,224,624 | | | $ | 1,560,537 | | | | 2/28/13 | | | $ | — | | | $ | (56,313 | ) |
Euro | | | FBCO | | | | Sell | | | | 1,032,722 | | | | 1,322,882 | | | | 2/28/13 | | | | — | | | | (40,603 | ) |
Euro | | | HSBC | | | | Sell | | | | 640,623 | | | | 817,838 | | | | 2/28/13 | | | | — | | | | (27,966 | ) |
Euro | | | SCBT | | | | Sell | | | | 448,266 | | | | 578,602 | | | | 2/28/13 | | | | — | | | | (13,236 | ) |
Euro | | | BZWS | | | | Sell | | | | 361,622 | | | | 474,945 | | | | 2/28/13 | | | | — | | | | (2,498 | ) |
Canadian Dollar | | | HAND | | | | Sell | | | | 2,030,709 | | | | 2,057,509 | | | | 3/18/13 | | | | 16,377 | | | | — | |
Euro | | | DBAB | | | | Sell | | | | 4,933,555 | | | | 6,367,493 | | | | 4/16/13 | | | | — | | | | (149,105 | ) |
Euro | | | FBCO | | | | Sell | | | | 4,928,846 | | | | 6,364,231 | | | | 4/16/13 | | | | — | | | | (146,147 | ) |
Euro | | | BOFA | | | | Sell | | | | 224,808 | | | | 291,192 | | | | 4/16/13 | | | | — | | | | (5,750 | ) |
Euro | | | SCBT | | | | Sell | | | | 100,974 | | | | 131,645 | | | | 4/16/13 | | | | — | | | | (1,729 | ) |
Euro | | | HAND | | | | Sell | | | | 16,336 | | | | 21,206 | | | | 4/16/13 | | | | — | | | | (372 | ) |
Euro | | | HSBC | | | | Sell | | | | 115,955 | | | | 154,174 | | | | 4/16/13 | | | | 1,012 | | | | — | |
Euro | | | HAND | | | | Sell | | | | 115,956 | | | | 154,407 | | | | 4/16/13 | | | | 1,244 | | | | — | |
British Pound | | | BZWS | | | | Sell | | | | 5,779,791 | | | | 9,183,686 | | | | 4/19/13 | | | | — | | | | (205,043 | ) |
British Pound | | | BOFA | | | | Sell | | | | 457,051 | | | | 732,960 | | | | 4/19/13 | | | | — | | | | (9,477 | ) |
British Pound | | | SCBT | | | | Sell | | | | 137,274 | | | | 220,854 | | | | 4/19/13 | | | | — | | | | (2,135 | ) |
British Pound | | | FBCO | | | | Sell | | | | 67,700 | | | | 108,537 | | | | 4/19/13 | | | | — | | | | (1,435 | ) |
British Pound | | | DBAB | | | | Sell | | | | 38,717 | | | | 61,967 | | | | 4/19/13 | | | | — | | | | (926 | ) |
Japanese Yen | | | DBAB | | | | Buy | | | | 24,660,120 | | | | 310,632 | | | | 4/22/13 | | | | — | | | | (26,119 | ) |
Japanese Yen | | | HSBC | | | | Buy | | | | 9,112,190 | | | | 114,491 | | | | 4/22/13 | | | | — | | | | (9,360 | ) |
Japanese Yen | | | BOFA | | | | Buy | | | | 13,263,582 | | | | 161,189 | | | | 4/22/13 | | | | — | | | | (8,162 | ) |
Japanese Yen | | | FBCO | | | | Buy | | | | 8,660,050 | | | | 105,096 | | | | 4/22/13 | | | | — | | | | (5,181 | ) |
Japanese Yen | | | HSBC | | | | Sell | | | | 458,542,342 | | | | 5,789,654 | | | | 4/22/13 | | | | 499,276 | | | | — | |
Japanese Yen | | | DBAB | | | | Sell | | | | 20,900,000 | | | | 242,941 | | | | 4/22/13 | | | | 1,810 | | | | — | |
British Pound | | | FBCO | | | | Sell | | | | 5,477,013 | | | | 8,702,974 | | | | 5/21/13 | | | | — | | | | (192,844 | ) |
| | | | | | | | | | | | | | | | | | | | | | | | |
Unrealized appreciation (depreciation) | | | | | | | | | | | | | | | | 588,185 | | | | (4,822,844 | ) |
| | | | | | | | | | | | | | | | | | | | | | | | |
Net unrealized appreciation (depreciation) | | | | | | | | | | | | | | | | | | | $ | (4,234,659 | ) |
| | | | | | | | | | | | | | | | | | | | | | | | | | | | |
See Abbreviations on page MGD-37.
The accompanying notes are an integral part of these financial statements.
MGD-19
Franklin Templeton Variable Insurance Products Trust
Financial Statements
Statement of Assets and Liabilities
December 31, 2012
| | | | |
| | | Mutual Global
Discovery
Securities Fund | |
Assets: | | | | |
Investments in securities: | | | | |
Cost - Unaffiliated issuers | | $ | 635,144,861 | |
Cost - Non-controlled affiliated issuers (Note 11) | | | 8,000,000 | |
| | | | |
Total cost of investments | | $ | 643,144,861 | |
| | | | |
Value - Unaffiliated issuers | | $ | 715,791,845 | |
Value - Non-controlled affiliated issuers (Note 11) | | | 3,306,976 | |
| | | | |
Total value of investments (includes securities loaned in the amount of $1,854,848) | | | 719,098,821 | |
Cash | | | 4,502,040 | |
Foreign currency, at value (cost $4,853,372) | | | 4,846,035 | |
Receivables: | | | | |
Investment securities sold | | | 956,137 | |
Capital shares sold | | | 189,337 | |
Dividends and interest | | | 3,156,137 | |
Unrealized appreciation on forward exchange contracts | | | 588,185 | |
Other assets | | | 47 | |
| | | | |
Total assets | | | 733,336,739 | |
| | | | |
Liabilities: | | | | |
Payables: | | | | |
Investment securities purchased | | | 382,201 | |
Capital shares redeemed | | | 722,375 | |
Affiliates | | | 885,586 | |
Variation margin | | | 29,038 | |
Payable upon return of securities loaned | | | 2,191,039 | |
Unrealized depreciation on forward exchange contracts | | | 4,822,844 | |
Accrued expenses and other liabilities | | | 356,180 | |
| | | | |
Total liabilities | | | 9,389,263 | |
| | | | |
Net assets, at value | | $ | 723,947,476 | |
| | | | |
Net assets consist of: | | | | |
Paid-in capital | | $ | 571,236,720 | |
Undistributed net investment income | | | 15,327,129 | |
Net unrealized appreciation (depreciation) | | | 71,005,841 | |
Accumulated net realized gain (loss) | | | 66,377,786 | |
| | | | |
Net assets, at value | | $ | 723,947,476 | |
| | | | |
The accompanying notes are an integral part of these financial statements.
MGD-20
Franklin Templeton Variable Insurance Products Trust
Financial Statements (continued)
Statement of Assets and Liabilities (continued)
December 31, 2012
| | | | |
| | | Mutual Global
Discovery
Securities Fund | |
Class 1: | | | | |
Net assets, at value | | $ | 1,136,450 | |
| | | | |
Shares outstanding | | | 55,310 | |
| | | | |
Net asset value and maximum offering price per share | | $ | 20.55 | |
| | | | |
Class 2: | | | | |
Net assets, at value | | $ | 660,464,844 | |
| | | | |
Shares outstanding | | | 32,737,127 | |
| | | | |
Net asset value and maximum offering price per share | | $ | 20.17 | |
| | | | |
Class 4: | | | | |
Net assets, at value | | $ | 62,346,182 | |
| | | | |
Shares outstanding | | | 3,059,866 | |
| | | | |
Net asset value and maximum offering price per share | | $ | 20.38 | |
| | | | |
The accompanying notes are an integral part of these financial statements.
MGD-21
Franklin Templeton Variable Insurance Products Trust
Financial Statements (continued)
Statement of Operations
for the year ended December 31, 2012
| | | | |
| | | Mutual Global
Discovery
Securities Fund | |
Investment income: | | | | |
Dividends | | $ | 18,938,256 | |
Interest | | | 4,181,032 | |
Income from securities loaned | | | 417,548 | |
| | | | |
Total investment income | | | 23,536,836 | |
| | | | |
Expenses: | | | | |
Management fees (Note 3a) | | | 6,056,422 | |
Administrative fees (Note 3b) | | | 1,032,032 | |
Distribution fees: (Note 3c) | | | | |
Class 2 | | | 1,721,793 | |
Class 4 | | | 231,136 | |
Unaffiliated transfer agent fees | | | 1,350 | |
Custodian fees (Note 4) | | | 63,068 | |
Reports to shareholders | | | 148,688 | |
Professional fees | | | 177,465 | |
Trustees’ fees and expenses | | | 3,061 | |
Other | | | 34,458 | |
| | | | |
Total expenses | | | 9,469,473 | |
| | | | |
Net investment income | | | 14,067,363 | |
| | | | |
Realized and unrealized gains (losses): | | | | |
Net realized gain (loss) from: | | | | |
Investments | | | 72,906,680 | |
Written options | | | 152,263 | |
Foreign currency transactions | | | 14,224,115 | |
Futures contracts | | | (501,447 | ) |
Securities sold short | | | (626,409 | ) |
| | | | |
Net realized gain (loss) | | | 86,155,202 | |
| | | | |
Net change in unrealized appreciation (depreciation) on: | | | | |
Investments | | | 11,630,903 | |
Translation of other assets and liabilities denominated in foreign currencies | | | (17,350,796 | ) |
| | | | |
Net change in unrealized appreciation (depreciation) | | | (5,719,893 | ) |
| | | | |
Net realized and unrealized gain (loss) | | | 80,435,309 | |
| | | | |
Net increase (decrease) in net assets resulting from operations | | $ | 94,502,672 | |
| | | | |
The accompanying notes are an integral part of these financial statements.
MGD-22
Franklin Templeton Variable Insurance Products Trust
Financial Statements (continued)
Statements of Changes in Net Assets
| | | | | | | | |
| | | Mutual Global Discovery
Securities Fund | |
| | | Year Ended December 31, | |
| | | 2012 | | | 2011 | |
| | | | |
Increase (decrease) in net assets: | | | | | | | | |
Operations: | | | | | | | | |
Net investment income | | $ | 14,067,363 | | | $ | 26,618,951 | |
Net realized gain (loss) from investments, written options, foreign currency transactions, futures contracts and securities sold short | | | 86,155,202 | | | | 68,619,465 | |
Net change in unrealized appreciation (depreciation) on investments and translation of other assets and liabilities denominated in foreign currencies and deferred taxes | | | (5,719,893 | ) | | | (151,927,152 | ) |
| | | | |
Net increase (decrease) in net assets resulting from operations | | | 94,502,672 | | | | (56,688,736 | ) |
| | | | |
Distributions to shareholders from: | | | | | | | | |
Net investment income: | | | | | | | | |
Class 1 | | | (32,000 | ) | | | (1,808,753 | ) |
Class 2 | | | (17,455,646 | ) | | | (27,559,671 | ) |
Class 4 | | | (1,713,076 | ) | | | (1,533,102 | ) |
Net realized gains: | | | | | | | | |
Class 1 | | | (55,531 | ) | | | (1,558,774 | ) |
Class 2 | | | (35,238,248 | ) | | | (25,603,997 | ) |
Class 4 | | | (3,402,551 | ) | | | (1,468,422 | ) |
| | | | |
Total distributions to shareholders | | | (57,897,052 | ) | | | (59,532,719 | ) |
| | | | |
Capital share transactions: (Note 2) | | | | | | | | |
Class 1 | | | 115,172 | | | | (75,411,767 | ) |
Class 2 | | | (85,201,977 | ) | | | (536,023,097 | ) |
Class 4 | | | (7,400,610 | ) | | | 1,436,142 | |
| | | | |
Total capital share transactions | | | (92,487,415 | ) | | | (609,998,722 | ) |
| | | | |
Net increase (decrease) in net assets | | | (55,881,795 | ) | | | (726,220,177 | ) |
Net assets: | | | | | | | | |
Beginning of year | | | 779,829,271 | | | | 1,506,049,448 | |
| | | | |
End of year | | $ | 723,947,476 | | | $ | 779,829,271 | |
| | | | |
Undistributed net investment income included in net assets: | | | | | | | | |
End of year | | $ | 15,327,129 | | | $ | 19,317,601 | |
| | | | |
The accompanying notes are an integral part of these financial statements.
MGD-23
Franklin Templeton Variable Insurance Products Trust
Notes to Financial Statements
Mutual Global Discovery Securities Fund
1. ORGANIZATION AND SIGNIFICANT ACCOUNTING POLICIES
Franklin Templeton Variable Insurance Products Trust (Trust) is registered under the Investment Company Act of 1940, as amended, (1940 Act) as an open-end investment company, consisting of twenty separate funds. The Mutual Global Discovery Securities (Fund) is included in this report. The financial statements of the remaining funds in the Trust are presented separately. Shares of the Fund are generally sold only to insurance company separate accounts to fund the benefits of variable life insurance policies or variable annuity contracts. At December 31, 2012, 82.59% of the Fund’s shares were held through one insurance company. The Fund offers three classes of shares: Class 1, Class 2, and Class 4. Each class of shares differs by its distribution fees, voting rights on matters affecting a single class and its exchange privilege.
The following summarizes the Fund’s significant accounting policies.
a. Financial Instrument Valuation
The Fund’s investments in financial instruments are carried at fair value daily. Fair value is the price that would be received to sell an asset or paid to transfer a liability in an orderly transaction between market participants on the measurement date. Under procedures approved by the Trust’s Board of Trustees (the Board), the Fund’s administrator, investment manager and other affiliates have formed the Valuation and Liquidity Oversight Committee (VLOC). The VLOC provides administration and oversight of the Fund’s valuation policies and procedures, which are approved annually by the Board. Among other things, these procedures allow the Fund to utilize independent pricing services, quotations from securities and financial instrument dealers, and other market sources to determine fair value.
Equity securities and derivative financial instruments (derivatives) listed on an exchange or on the NASDAQ National Market System are valued at the last quoted sale price or the official closing price of the day, respectively. Foreign equity securities are valued as of the close of trading on the foreign stock exchange on which the security is primarily traded, or the NYSE, whichever is earlier. The value is then converted into its U.S. dollar equivalent at the foreign exchange rate in effect at the close of the NYSE on the day that the value of the security is determined. Over-the-counter (OTC) securities are valued within the range of the most recent quoted bid and ask prices. Securities that trade in multiple markets or on multiple exchanges are valued according to the broadest and most representative market. Certain equity securities are valued based upon fundamental characteristics or relationships to similar securities. Investments in non-registered money market funds are valued at the closing net asset value.
Debt securities generally trade in the OTC market rather than on a securities exchange. The Fund’s pricing services use multiple valuation techniques to determine fair value. In instances where sufficient market activity exists, the pricing services may utilize a market-based approach through which quotes from market makers are used to determine fair value. In instances where sufficient market activity may not exist or is limited, the pricing services also utilize proprietary valuation models which may consider market characteristics such as benchmark yield curves, credit spreads, estimated default rates, anticipated market interest rate volatility, coupon rates, anticipated timing of principal repayments, underlying collateral, and other unique security features in order to estimate the relevant cash flows, which are then discounted to calculate the fair value. Securities denominated in a foreign currency are converted into their U.S. dollar equivalent at the foreign exchange rate in effect at the close of the NYSE on the date that the values of the foreign debt securities are determined.
Certain derivatives trade in the OTC market. The Fund’s pricing services use various techniques including industry standard option pricing models and proprietary discounted cash flow models to determine the fair value of those instruments. The Fund’s net benefit or obligation under the derivative contract, as measured by the fair market value of the contract, is included in net assets.
The Fund has procedures to determine the fair value of financial instruments for which market prices are not reliable or readily available. Under these procedures, the VLOC convenes on a regular basis to review such financial instruments and considers a number of factors, including significant unobservable valuation inputs, when arriving at fair value. The VLOC primarily employs a market-based approach which may use related or comparable assets or liabilities, recent transactions, market multiples, book
MGD-24
Franklin Templeton Variable Insurance Products Trust
Notes to Financial Statements (continued)
Mutual Global Discovery Securities Fund
1. ORGANIZATION AND SIGNIFICANT ACCOUNTING POLICIES (continued)
a. Financial Instrument Valuation (continued)
values, and other relevant information for the investment to determine the fair value of the investment. An income-based valuation approach may also be used in which the anticipated future cash flows of the investment are discounted to calculate fair value. Discounts may also be applied due to the nature or duration of any restrictions on the disposition of the investments. Due to the inherent uncertainty of valuations of such investments, the fair values may differ significantly from the values that would have been used had an active market existed. The VLOC employs various methods for calibrating these valuation approaches including a regular review of key inputs and assumptions, transactional back-testing or disposition analysis, and reviews of any related market activity.
Trading in securities on foreign securities stock exchanges and OTC markets may be completed before the daily close of business on the NYSE. Occasionally, events occur between the time at which trading in a foreign security is completed and the close of the NYSE that might call into question the reliability of the value of a portfolio security held by the Fund. As a result, differences may arise between the value of the Fund’s portfolio securities as determined at the foreign market close and the latest indications of value at the close of the NYSE. In order to minimize the potential for these differences, the VLOC monitors price movements following the close of trading in foreign stock markets through a series of country specific market proxies (such as baskets of American Depositary Receipts, futures contracts and exchange traded funds). These price movements are measured against established trigger thresholds for each specific market proxy to assist in determining if an event has occurred that may call into question the reliability of the values of the foreign securities held by the Fund. If such an event occurs, the securities may be valued using fair value procedures, which may include the use of independent pricing services. At December 31, 2012, a market event occurred resulting in a portion of the securities held by the Fund being valued using fair value procedures.
b. Foreign Currency Translation
Portfolio securities and other assets and liabilities denominated in foreign currencies are translated into U.S. dollars based on the exchange rate of such currencies against U.S. dollars on the date of valuation. The Fund may enter into foreign currency exchange contracts to facilitate transactions denominated in a foreign currency. Purchases and sales of securities, income and expense items denominated in foreign currencies are translated into U.S. dollars at the exchange rate in effect on the transaction date. Portfolio securities and assets and liabilities denominated in foreign currencies contain risks that those currencies will decline in value relative to the U.S. dollar. Occasionally, events may impact the availability or reliability of foreign exchange rates used to convert the U.S. dollar equivalent value. If such an event occurs, the foreign exchange rate will be valued at fair value using procedures established and approved by the Board.
The Fund does not separately report the effect of changes in foreign exchange rates from changes in market prices on securities held. Such changes are included in net realized and unrealized gain or loss from investments on the Statement of Operations.
Realized foreign exchange gains or losses arise from sales of foreign currencies, currency gains or losses realized between the trade and settlement dates on securities transactions and the difference between the recorded amounts of dividends, interest, and foreign withholding taxes and the U.S. dollar equivalent of the amounts actually received or paid. Net unrealized foreign exchange gains and losses arise from changes in foreign exchange rates on foreign denominated assets and liabilities other than investments in securities held at the end of the reporting period.
c. Derivative Financial Instruments
The Fund invested in derivatives in order to manage risk or gain exposure to various other investments or markets. Derivatives are financial contracts based on an underlying or notional amount, require no initial investment or an initial net investment that is smaller than would normally be required to have a similar response to changes in market factors, and require or permit net settlement. Derivatives contain various risks including the potential inability of the counterparty to fulfill their obligations under
MGD-25
Franklin Templeton Variable Insurance Products Trust
Notes to Financial Statements (continued)
Mutual Global Discovery Securities Fund
1. ORGANIZATION AND SIGNIFICANT ACCOUNTING POLICIES (continued)
c. Derivative Financial Instruments (continued)
the terms of the contract, the potential for an illiquid secondary market, and/or the potential for market movements which expose the Fund to gains or losses in excess of the amounts shown on the Statement of Assets and Liabilities. Realized gain and loss and unrealized appreciation and depreciation on these contracts for the period are included in the Statement of Operations.
The Fund’s investments in OTC derivatives are subject to the terms of International Swaps and Derivatives Association Master Agreements and other related agreements between the Fund and certain derivative counterparties. These agreements contain various provisions, including but not limited to collateral requirements, events of default, requirements for the Fund to maintain certain net asset levels and/or limit the decline in net assets over various periods of time. Should the Fund fail to meet any of these provisions, the derivative counterparty has the right to terminate the derivative contract and require immediate payment by the Fund for those OTC derivatives with that particular counterparty that are in a net liability position. At December 31, 2012, the Fund had OTC derivatives in a net liability position of $3,171,541 and the aggregate value of collateral pledged for such contracts was $2,577,894.
The Fund entered into exchange traded financial futures contracts primarily to manage exposure to certain foreign currencies. A futures contract is an agreement between the Fund and a counterparty to buy or sell an asset for a specified price on a future date. Required initial margin deposits of cash or securities are pledged by the Fund. Subsequent payments, known as variation margin, are made or received by the Fund, depending on fluctuations in the value of the asset underlying the futures contract. Such variation margin is accounted for as unrealized appreciation or depreciation until the contract is closed, at which time the gains or losses are realized.
The Fund entered into OTC forward exchange contracts primarily to manage exposure to certain foreign currencies. A forward exchange contract is an agreement between the Fund and a counterparty to buy or sell a foreign currency for a specific exchange rate on a future date. Pursuant to the terms of the forward exchange contracts, cash or securities may be required to be deposited as collateral. Unrestricted cash may be invested according to the Fund’s investment objectives.
The Fund purchased or wrote exchange traded option contracts primarily to manage and/or gain exposure to equity price risk. An option is a contract entitling the holder to purchase or sell a specific amount of shares or units of an asset or notional amount of a swap (swaption), at a specified price. Options purchased are recorded as an asset while options written are recorded as a liability. Upon exercise of an option, the acquisition cost or sales proceeds of the underlying investment is adjusted by any premium received or paid. Upon expiration of an option, any premium received or paid is recorded as a realized gain or loss. Upon closing an option other than through expiration or exercise, the difference between the premium and the cost to close the position is recorded as a realized gain or loss. Pursuant to the terms of the written option contract, cash or securities may be required to be deposited as collateral.
See Notes 6 and 10 regarding investment transactions and other derivative information, respectively.
d. Securities Sold Short
The Fund is engaged in selling securities short, which obligates the Fund to replace a borrowed security with the same security at current market value. The Fund incurs a loss if the price of the security increases between the date of the short sale and the date on which the Fund replaces the borrowed security. The Fund realizes a gain if the price of the security declines between those dates. Gains are limited to the price at which the Fund sold the security short, while losses are potentially unlimited in size.
The Fund is required to establish a margin account with the broker lending the security sold short. While the short sale is outstanding, the broker retains the proceeds of the short sale and the Fund must maintain a deposit with the broker consisting of cash and/or securities having a value equal to a specified percentage of the value of the securities sold short. The Fund is obligated to pay fees for borrowing the securities sold short and is required to pay the counterparty any dividends or interest due on securities sold short. Such dividends or interest and any security borrowing fees are recorded as an expense to the Fund.
MGD-26
Franklin Templeton Variable Insurance Products Trust
Notes to Financial Statements (continued)
Mutual Global Discovery Securities Fund
1. ORGANIZATION AND SIGNIFICANT ACCOUNTING POLICIES (continued)
e. Securities Lending
The Fund participates in an agency based securities lending program. The Fund receives cash collateral against the loaned securities in an amount equal to at least 102% of the market value of the loaned securities. Collateral is maintained over the life of the loan in an amount not less than 100% of the market value of loaned securities, as determined at the close of fund business each day; any additional collateral required due to changes in security values is delivered to the Fund on the next business day. The collateral is invested in a non-registered money fund as indicated on the Statement of Investments. The Fund receives income from the investment of cash collateral, in addition to lending fees and rebates paid by the borrower. The Fund bears the market risk with respect to the collateral investment, securities loaned, and the risk that the agent may default on its obligations to the Fund. The securities lending agent has agreed to indemnify the Fund in the event of default by a third party borrower.
f. Senior Floating Rate Interests
The Fund invests in senior secured corporate loans that pay interest at rates which are periodically reset by reference to a base lending rate plus a spread. These base lending rates are generally the prime rate offered by a designated U.S. bank or the London InterBank Offered Rate (LIBOR). Senior secured corporate loans often require prepayment of principal from excess cash flows or at the discretion of the borrower. As a result, actual maturity may be substantially less than the stated maturity.
Senior secured corporate loans in which the Fund invests are generally readily marketable, but may be subject to some restrictions on resale.
g. Income and Deferred Taxes
It is the Fund’s policy to qualify as a regulated investment company under the Internal Revenue Code. The Fund intends to distribute to shareholders substantially all of its taxable income and net realized gains to relieve it from federal income and if applicable, excise taxes. As a result, no provision for U.S. federal income taxes is required.
The Fund may be subject to foreign taxation related to income received, capital gains on the sale of securities and certain foreign currency transactions in the foreign jurisdictions in which it invests. Foreign taxes, if any, are recorded based on the tax regulations and rates that exist in the foreign markets in which the Fund invests. When a capital gain tax is determined to apply the Fund records an estimated deferred tax liability in an amount that would be payable if the securities were disposed of on the valuation date.
The Fund recognizes the tax benefits of uncertain tax positions only when the position is “more likely than not” to be sustained upon examination by the tax authorities based on the technical merits of the tax position. As of December 31, 2012, and for all open tax years, the Fund has determined that no liability for unrecognized tax benefits is required in the Fund’s financial statements related to uncertain tax positions taken on a tax return (or expected to be taken on future tax returns). Open tax years are those that remain subject to examination and are based on each tax jurisdiction statute of limitation.
h. Security Transactions, Investment Income, Expenses and Distributions
Security transactions are accounted for on trade date. Realized gains and losses on security transactions are determined on a specific identification basis. Interest income and estimated expenses are accrued daily. Amortization of premium and accretion of discount on debt securities are included in interest income. Facility fees are recognized as income over the expected term of the loan. Dividend income and dividends declared on securities sold short are recorded on the ex-dividend date except that certain dividends from foreign securities are recognized as soon as the Fund is notified of the ex-dividend date. Distributions to shareholders are recorded on the ex-dividend date and are determined according to income tax regulations (tax basis). Distributable earnings determined on a tax basis may differ from earnings recorded in accordance with accounting principles
MGD-27
Franklin Templeton Variable Insurance Products Trust
Notes to Financial Statements (continued)
Mutual Global Discovery Securities Fund
1. ORGANIZATION AND SIGNIFICANT ACCOUNTING POLICIES (continued)
h. Security Transactions, Investment Income, Expenses and Distributions (continued)
generally accepted in the United States of America. These differences may be permanent or temporary. Permanent differences are reclassified among capital accounts to reflect their tax character. These reclassifications have no impact on net assets or the results of operations. Temporary differences are not reclassified, as they may reverse in subsequent periods.
Common expenses incurred by the Trust are allocated among the funds based on the ratio of net assets of each fund to the combined net assets of the Trust. Fund specific expenses are charged directly to the fund that incurred the expense.
Realized and unrealized gains and losses and net investment income, not including class specific expenses, are allocated daily to each class of shares based upon the relative proportion of net assets of each class. Differences in per share distributions, by class, are generally due to differences in class specific expenses.
i. Accounting Estimates
The preparation of financial statements in accordance with accounting principles generally accepted in the United States of America requires management to make estimates and assumptions that affect the reported amounts of assets and liabilities at the date of the financial statements and the amounts of income and expenses during the reporting period. Actual results could differ from those estimates.
j. Guarantees and Indemnifications
Under the Trust’s organizational documents, its officers and trustees are indemnified by the Trust against certain liabilities arising out of the performance of their duties to the Trust. Additionally, in the normal course of business, the Trust, on behalf of the Fund, enters into contracts with service providers that contain general indemnification clauses. The Trust’s maximum exposure under these arrangements is unknown as this would involve future claims that may be made against the Trust that have not yet occurred. Currently, the Trust expects the risk of loss to be remote.
2. SHARES OF BENEFICIAL INTEREST
At December 31, 2012, there were an unlimited number of shares authorized (without par value). Transactions in the Fund’s shares were as follows:
| | | | | | | | | | | | | | | | |
| | | Year Ended December 31, | |
| | | 2012 | | | 2011 | |
| Class 1 Shares: | | Shares | | | Amount | | | Shares | | | Amount | |
Shares sold | | | 11,112 | | | $ | 227,652 | | | | 140,069 | | | $ | 3,084,356 | |
Shares issued in reinvestment of distributions | | | 4,331 | | | | 87,532 | | | | 168,285 | | | | 3,367,527 | |
Shares redeemed in-kind (Note 13) | | | — | | | | — | | | | (3,394,333 | ) | | | (67,951,585 | ) |
Shares redeemed | | | (9,680 | ) | | | (200,012 | ) | | | (843,405 | ) | | | (13,912,065 | ) |
| | | | |
Net increase (decrease) | | | 5,763 | | | $ | 115,172 | | | | (3,929,384 | ) | | $ | (75,411,767 | ) |
| | | | |
Class 2 Shares: | | | | | | | | | | | | | | | | |
Shares sold | | | 1,636,877 | | | $ | 33,107,971 | | | | 1,990,050 | | | $ | 40,633,273 | |
Shares issued in reinvestment of distributions | | | 2,653,268 | | | | 52,693,893 | | | | 2,709,831 | | | | 53,163,668 | |
Shares redeemed in-kind (Note 13) | | | — | | | | — | | | | (21,446,416 | ) | | | (398,285,682 | ) |
Shares redeemed | | | (8,457,161 | ) | | | (171,003,841 | ) | | | (11,321,410 | ) | | | (231,534,356 | ) |
| | | | |
Net increase (decrease) | | | (4,167,016 | ) | | $ | (85,201,977 | ) | | | (28,067,945 | ) | | $ | (536,023,097 | ) |
| | | | |
MGD-28
Franklin Templeton Variable Insurance Products Trust
Notes to Financial Statements (continued)
Mutual Global Discovery Securities Fund
2. SHARES OF BENEFICIAL INTEREST (continued)
| | | | | | | | | | | | | | | | |
| | | Year Ended December 31, | |
| | | 2012 | | | 2011 | |
| Class 4 Shares: | | Shares | | | Amount | | | Shares | | | Amount | |
Shares sold | | | 79,532 | | | $ | 1,636,846 | | | | 410,892 | | | $ | 8,602,556 | |
Shares issued on reinvestment of distributions | | | 255,016 | | | | 5,115,627 | | | | 151,460 | | | | 3,001,524 | |
Shares redeemed | | | (694,727 | ) | | | (14,153,083 | ) | | | (502,145 | ) | | | (10,167,938 | ) |
| | | | |
Net increase (decrease) | | | (360,179 | ) | | $ | (7,400,610 | ) | | | 60,207 | | | $ | 1,436,142 | |
| | | | |
3. TRANSACTIONS WITH AFFILIATES
Franklin Resources, Inc. is the holding company for various subsidiaries that together are referred to as Franklin Templeton Investments. Certain officers and trustees of the Fund are also officers and/or directors of the following subsidiaries:
| | |
| Subsidiary | | Affiliation |
Franklin Mutual Advisers, LLC (Franklin Mutual) | | Investment manager |
Franklin Templeton Services, LLC (FT Services) | | Administrative manager |
Franklin Templeton Distributors, Inc. (Distributors) | | Principal underwriter |
Franklin Templeton Investor Services, LLC (Investor Services) | | Transfer agent |
a. Management Fees
The Fund pays an investment management fee to Franklin Mutual based on the average daily net assets of the Fund as follows:
| | |
| Annualized Fee Rate | | Net Assets |
| 0.800% | | Up to and including $4 billion |
| 0.770% | | Over $4 billion, up to and including $7 billion |
| 0.750% | | Over $7 billion, up to and including $10 billion |
| 0.730% | | In excess of $10 billion |
b. Administrative Fees
The Fund pays an administrative fee to FT Services based on the Fund’s average daily net assets as follows:
| | |
| Annualized Fee Rate | | Net Assets |
| 0.150% | | Up to and including $200 million |
| 0.135% | | Over $200 million, up to and including $700 million |
| 0.100% | | Over $700 million, up to and including $1.2 billion |
| 0.075% | | In excess of $1.2 billion |
c. Distribution Fees
The Board has adopted distribution plans for Class 2 and Class 4 shares pursuant to Rule 12b-1 under the 1940 Act. Under the Fund’s compensation distribution plans, the Fund pays Distributors for costs incurred in connection with the servicing, sale and distribution of the Fund’s shares up to 0.35% per year of its average daily net assets of each class. Some distribution fees are not charged on shares held by affiliates. The Board has agreed to limit the current rate to 0.25% per year for Class 2.
MGD-29
Franklin Templeton Variable Insurance Products Trust
Notes to Financial Statements (continued)
Mutual Global Discovery Securities Fund
3. TRANSACTIONS WITH AFFILIATES (continued)
d. Transfer Agent Fees
Investor Services, under terms of an agreement, performs shareholder servicing for the Fund and is not paid by the Fund for the services.
4. EXPENSE OFFSET ARRANGEMENT
The Fund has entered into an arrangement with its custodian whereby credits realized as a result of uninvested cash balances are used to reduce a portion of the Fund’s custodian expenses. During the year ended December 31, 2012, there were no credits earned.
5. INCOME TAXES
The tax character of distributions paid during the years ended December 31, 2012 and 2011, was as follows:
| | | | | | | | |
| | | 2012 | | | 2011 | |
Distributions paid from: | | | | | | | | |
Ordinary income | | $ | 25,422,950 | | | $ | 30,901,526 | |
Long term capital gain | | | 32,474,102 | | | | 28,631,193 | |
| | | | |
| | $ | 57,897,052 | | | $ | 59,532,719 | |
| | | | |
At December 31, 2012, the cost of investments, net unrealized appreciation (depreciation), undistributed ordinary income and undistributed long term capital gains for income tax purposes were as follows:
| | | | |
Cost of investments | | $ | 644,492,727 | |
| | | | |
| |
Unrealized appreciation | | $ | 132,500,679 | |
Unrealized depreciation | | | (57,894,585 | ) |
| | | | |
Net unrealized appreciation (depreciation) | | $ | 74,606,094 | |
| | | | |
Undistributed ordinary income | | $ | 18,560,764 | |
Undistributed long term capital gains | | | 63,635,617 | |
| | | | |
Distributable earnings | | $ | 82,196,381 | |
| | | | |
Differences between income and/or capital gains as determined on a book basis and a tax basis are primarily due to differing treatments of passive foreign investment company shares, pass-through entity income, bond discounts and premiums and financial futures transactions.
6. INVESTMENT TRANSACTIONS
Purchases and sales of investments (excluding short term securities) for the year ended December 31, 2012, aggregated $184,140,578 and $268,214,924, respectively.
MGD-30
Franklin Templeton Variable Insurance Products Trust
Notes to Financial Statements (continued)
Mutual Global Discovery Securities Fund
6. INVESTMENT TRANSACTIONS (continued)
Transactions in options written during the year ended December 31, 2012, were as follows:
| | | | | | | | |
| | | Options | |
| | | Number of
Contracts | | | Premiums
Received | |
Options outstanding at December 31, 2011 | | | 160 | | | $ | 62,276 | |
Options written | | | 396 | | | | 103,051 | |
Options expired | | | (147 | ) | | | (36,259 | ) |
Options exercised | | | (160 | ) | | | (26,013 | ) |
Options closed | | | (249 | ) | | | (103,055 | ) |
| | | | |
Options outstanding at December 31, 2012 | | | — | | | $ | — | |
| | | | |
See Notes 1(c) and 10 regarding derivative financial instruments and other derivative information, respectively
7. CREDIT RISK AND DEFAULTED SECURITIES
The Fund may purchase the pre-default or defaulted debt of distressed companies. Distressed companies are financially troubled and are about to be or are already involved in financial restructuring or bankruptcy. Risks associated with purchasing these securities include the possibility that the bankruptcy or other restructuring process takes longer than expected, or that distributions in restructuring are less than anticipated, either or both of which may result in unfavorable consequences to the Fund. If it becomes probable that the income on debt securities, including those of distressed companies, will not be collected, the Fund discontinues accruing income and recognizes an adjustment for uncollectible interest.
At December 31, 2012, the aggregate value of distressed company securities for which interest recognition has been discontinued was $4,392,785, representing 0.61% of the Fund’s net assets. For information as to specific securities, see the accompanying Statement of Investments.
8. CONCENTRATION OF RISK
Investing in foreign securities may include certain risks and considerations not typically associated with investing in U.S. securities, such as fluctuating currency values and changing local and regional economic, political and social conditions, which may result in greater market volatility. In addition, certain foreign securities may not be as liquid as U.S. securities.
9. RESTRICTED SECURITIES
The Fund invests in securities that are restricted under the Securities Act of 1933 (1933 Act) or which are subject to legal, contractual, or other agreed upon restrictions on resale. Restricted securities are often purchased in private placement transactions, and cannot be sold without prior registration unless the sale is pursuant to an exemption under the 1933 Act. Disposal of these securities may require greater effort and expense, and prompt sale at an acceptable price may be difficult. The Fund may have registration rights for restricted securities. The issuer generally incurs all registration costs.
MGD-31
Franklin Templeton Variable Insurance Products Trust
Notes to Financial Statements (continued)
Mutual Global Discovery Securities Fund
9. RESTRICTED SECURITIES (continued)
At December 31, 2012, the Fund held investments in restricted securities, excluding certain securities exempt from registration under the 1933 Act deemed to be liquid, as follows:
| | | | | | | | | | | | | | | | |
Principal
Amount/
Shares | | | Issuer | | Acquisition
Dates | | | Cost | | | Value | |
| | 1,361,600 | | | AET&D Holdings No. 1 Pty. Ltd. | | | 10/13/10 | | | $ | — | | | $ | — | |
| | 800,000 | | | The Bankshares Inc. | | | 3/22/07 | | | | 8,000,000 | | | | 3,306,976 | |
| | 727 | | | Broadband Ventures III LLC, secured promissory note, 5.00%, 2/01/12 | | | 7/01/10 - 11/30/12 | | | | 727 | | | | — | |
| | 78,494 | | | Capital Bank Financial Corp., A, 144A | | | 12/16/09 - 7/02/10 | | | | 1,569,880 | | | | 1,272,898 | |
| | 269,922 | | | Capital Bank Financial Corp., B, 144A, non-voting | | | 12/16/09 - 7/02/10 | | | | 5,398,440 | | | | 4,377,190 | |
| | 2,077,368 | | | FIM Coinvestor Holdings I, LLC | | | 11/20/06 - 6/02/09 | | | | — | | | | — | |
| | 2,172,000 | | | Hightower Holding LLC, pfd., A, Series 2 | | | 6/10/10 - 5/10/12 | | | | 5,430,000 | | | | 4,239,527 | |
| | 56,213 | | | Imagine Group Holdings Ltd. | | | 8/31/04 | | | | 575,705 | | | | 648,760 | |
| | 424,073 | | | International Automotive Components Group Brazil LLC | | | 4/13/06 - 12/26/08 | | | | 281,629 | | | | 66,609 | |
| | 3,000,220 | | | International Automotive Components Group North America, LLC | | | 1/12/06 - 10/10/07 | | | | 2,879,270 | | | | 1,533,983 | |
| | 19,416 | | | aNewPage Holdings Inc. | | | 5/05/11 - 5/16/11 | | | | 4,800,135 | | | | 1,860,053 | |
| | 2,140 | | | Olympus Re Holdings Ltd. | | | 12/09/01 | | | | 200,998 | | | | — | |
| | 49,274 | | | bRealogy Holdings Corp. | | | 10/12/12 | | | | 1,675,316 | | | | 1,964,160 | |
| | 43,818 | | | aTribune Co., A | | | 7/08/11 - 5/24/12 | | | | 1,865,639 | | | | 1,865,639 | |
| | 26,867 | | | aTribune Co., B | | | 7/08/11 - 5/24/12 | | | | 1,143,916 | | | | 1,143,916 | |
| | | | | | | | | | | | |
| | | | Total Restricted Securities (Value is 3.08% of Net Assets) | | | | | | $ | 33,821,655 | | | $ | 22,279,711 | |
| | | | | | | | | | | | |
aThe Fund also invests in unrestricted securities or other investments in the issuer, valued at $- as of December 31, 2012.
bThe Fund also invests in unrestricted securities or other investments in the issuer, valued at $871,620 as of December 31,2012.
10. OTHER DERIVATIVE INFORMATION
At December 31, 2012, the Fund’s investments in derivative contracts are reflected on the Statement of Assets and Liabilities as follows:
| | | | | | | | | | | | |
| | | Asset Derivatives | | | | | Liability Derivatives | | | |
Derivative Contracts Not Accounted
for as Hedging Instruments | | Statement of Assets and
Liabilities Location | | Fair
Value
Amount | | | Statement of Assets and
Liabilities Location | | Fair
Value
Amount | |
Foreign exchange contracts | | Unrealized appreciation on forward exchange contracts | | $ | 588,185 | | | Unrealized depreciation on forward exchange contracts / Net assets consist of – net unrealized appreciation (depreciation) | | $ | 5,614,473 | a |
aIncludes cumulative appreciation (depreciation) of futures contracts as reported in the Statement of Investments. Only current day’s variation margin is reported within the Statement of Assets and Liabilities.
MGD-32
Franklin Templeton Variable Insurance Products Trust
Notes to Financial Statements (continued)
Mutual Global Discovery Securities Fund
10. OTHER DERIVATIVE INFORMATION (continued)
For the year ended December 31, 2012, the effect of derivative contracts on the Fund’s Statement of Operations was as follows:
| | | | | | | | | | |
Derivative Contracts Not Accounted
for as Hedging Instruments | | Statement of Operations Locations | | Realized Gain
(Loss) for the
Year | | | Change in
Unrealized
Appreciation
(Depreciation)
for the
Year | |
Foreign exchange contracts | | Net realized gain (loss) from foreign currency transactions and futures contracts / Net change in unrealized appreciation (depreciation) on translation of other assets and liabilities denominated in foreign currencies | | $ | 13,848,158 | | | $ | (18,190,308 | ) |
Equity contracts | | Net realized gain (loss) from written options / Net change in unrealized appreciation (depreciation) on investments | | | 152,263 | | | | 8,284 | |
For the year ended December 31, 2012, the average month end market value of derivatives represented 0.84% of month end net assets. The average month end number of open derivative contracts for the year was 123.
See Note 1(c) and 6 regarding derivative financial instruments, and investment transactions, respectively.
11. HOLDINGS OF 5% VOTING SECURITIES OF PORTFOLIO COMPANIES
The 1940 Act defines “affiliated companies” to include investments in portfolio companies in which a fund owns 5% or more of the outstanding voting securities. Investments in “affiliated companies” for the Fund for the year ended December 31, 2012, were as shown below.
| | | | | | | | | | | | | | | | | | | | | | | | | | | | |
| Name of Issuer | | Number of Shares
Held at Beginning
of Year | | | Gross
Additions | | | Gross
Reductions | | | Number of Shares
Held at End
of Year | | | Value at
End of
Year | | | Investment
Income | | | Realized Capital
Gain (Loss) | |
Non-Controlled Affiliates | | | | | | | | | | | | | | | | | | | | | | | | | | | | |
The Bankshares Inc. (Value is 0.46% of Net Assets) | | | 800,000 | | | | — | | | | — | | | | 800,000 | | | $ | 3,306,976 | | | $ | — | | | $ | — | |
| | | | | | | | | | | | | | | | |
12. CREDIT FACILITY
The Fund, together with other U.S. registered and foreign investment funds (collectively, Borrowers), managed by Franklin Templeton Investments, are borrowers in a joint syndicated senior unsecured credit facility totaling $1.5 billion (Global Credit Facility) which matured on January 18, 2013. This Global Credit Facility provides a source of funds to the Borrowers for temporary and emergency purposes, including the ability to meet future unanticipated or unusually large redemption requests. Effective January 18, 2013, the Borrowers renewed the Global Credit Facility which matures on January 17, 2014.
Under the terms of the Global Credit Facility, the Fund shall, in addition to interest charged on any borrowings made by the Fund and other costs incurred by the Fund, pay its share of fees and expenses incurred in connection with the implementation and maintenance of the Global Credit Facility, based upon its relative share of the aggregate net assets of all of the Borrowers, including an annual commitment fee of 0.07% based upon the unused portion of the Global Credit Facility. These fees are reflected in other expenses on the Statement of Operations. During the year ended December 31, 2012, the Fund did not use the Global Credit Facility.
MGD-33
Franklin Templeton Variable Insurance Products Trust
Notes to Financial Statements (continued)
Mutual Global Discovery Securities Fund
13. REDEMPTION IN-KIND
During the year ended December 31, 2011, the Fund realized $45,310,078 of net gains resulting from a redemption in-kind in which a shareholder redeemed fund shares for securities held by the Fund rather than for cash. Because such gains are not taxable to the Fund, and are not netted with capital gains that are distributed to remaining shareholders, they have been reclassified from accumulated net realized gains to paid-in capital.
14. FAIR VALUE MEASUREMENTS
The Fund follows a fair value hierarchy that distinguishes between market data obtained from independent sources (observable inputs) and the Fund’s own market assumptions (unobservable inputs). These inputs are used in determining the value of the Fund’s financial instruments and are summarized in the following fair value hierarchy:
| | • | | Level 1 – quoted prices in active markets for identical financial instruments |
| | • | | Level 2 – other significant observable inputs (including quoted prices for similar financial instruments, interest rates, prepayment speed, credit risk, etc.) |
| | • | | Level 3 – significant unobservable inputs (including the Fund’s own assumptions in determining the fair value of financial instruments) |
The inputs or methodology used for valuing financial instruments are not an indication of the risk associated with investing in those financial instruments.
For movements between the levels within the fair value hierarchy, the Fund has adopted a policy of recognizing the transfers as of the date of the underlying event which caused the movement. Additionally, at December 31, 2012, due to market events, the Fund employed fair value procedures to value a portion of its holdings. Such procedures resulted in a temporary transfer of financial instruments valued at $218,904,626 from Level 1 to Level 2 within the fair value hierarchy.
A summary of inputs used as of December 31, 2012, in valuing the Fund’s assets and liabilities carried at fair value, is as follows:
| | | | | | | | | | | | | | | | |
| | | Level 1 | | | Level 2 | | | Level 3 | | | Total | |
| | | | |
Assets: | | | | | | | | | | | | | | | | |
Investments in Securities: | | | | | | | | | | | | | | | | |
Equity Investments:a | | | | | | | | | | | | | | | | |
Aerospace & Defense | | $ | — | | | $ | 3,174,550 | | | $ | — | | | $ | 3,174,550 | |
Auto Components | | | — | | | | 6,104,953 | | | | 1,600,592 | | | | 7,705,545 | |
Beverages | | | 8,708,551 | | | | 7,643,283 | | | | — | | | | 16,351,834 | |
Chemicals | | | — | | | | 5,646,702 | | | | — | | | | 5,646,702 | |
Commercial Banks | | | 31,828,309 | | | | 18,583,131 | | | | 8,957,064 | | | | 59,368,504 | |
Construction & Engineering | | | — | | | | 4,777,573 | | | | — | | | | 4,777,573 | |
Construction Materials | | | — | | | | 1,160,822 | | | | — | | | | 1,160,822 | |
Containers & Packaging | | | — | | | | 6,380,292 | | | | — | | | | 6,380,292 | |
Diversified Financial Services | | | 14,796,615 | | | | 9,447,127 | | | | 4,239,527 | | | | 28,483,269 | |
Diversified Telecommunication Services | | | — | | | | 4,147,926 | | | | 32,587 | b | | | 4,180,513 | |
Electric Utilities | | | 8,578,503 | | | | — | | | | — | b | | | 8,578,503 | |
Electrical Equipment | | | — | | | | 6,382,819 | | | | — | | | | 6,382,819 | |
Electronic Equipment, Instruments & Components | | | — | | | | 3,336,258 | | | | — | | | | 3,336,258 | |
Food & Staples Retailing | | | 19,306,197 | | | | 15,242,656 | | | | — | | | | 34,548,853 | |
Hotels, Restaurants & Leisure | | | — | | | | 8,316,971 | | | | — | | | | 8,316,971 | |
Industrial Conglomerates | | | — | | | | 22,102,751 | | | | — | | | | 22,102,751 | |
Insurance | | | 49,333,581 | | | | — | | | | 648,760 | b | | | 49,982,341 | |
Media | | | 22,053,202 | | | | 11,377,750 | | | | — | | | | 33,430,952 | |
Metals & Mining | | | — | | | | 8,127,551 | | | | — | | | | 8,127,551 | |
MGD-34
Franklin Templeton Variable Insurance Products Trust
Notes to Financial Statements (continued)
Mutual Global Discovery Securities Fund
14. FAIR VALUE MEASUREMENTS (continued)
| | | | | | | | | | | | | | | | |
| | | Level 1 | | | Level 2 | | | Level 3 | | | Total | |
| | | | |
Multi-Utilities | | $ | — | | | $ | 6,281,632 | | | $ | — | | | $ | 6,281,632 | |
Oil, Gas & Consumable Fuels | | | 35,709,469 | | | | 24,124,018 | | | | — | | | | 59,833,487 | |
Paper & Forest Products | | | — | | | | 1,860,053 | | | | | | | | 1,860,053 | |
Real Estate Management & Development | | | 5,581,830 | | | | — | | | | 3,812,118 | | | | 9,393,948 | |
Software | | | 25,523,085 | | | | 3,188,225 | | | | — | | | | 28,711,310 | |
Specialty Retail | | | — | | | | 3,225,520 | | | | — | | | | 3,225,520 | |
Tobacco | | | 24,701,905 | | | | 27,890,777 | | | | — | | | | 52,592,682 | |
Wireless Telecommunication Services | | | — | | | | 15,250,892 | | | | — | | | | 15,250,892 | |
Other Equity Investmentsc | | | 169,101,215 | | | | — | | | | — | | | | 169,101,215 | |
Corporate Bonds, Notes and Senior Floating Rate Interests | | | — | | | | 36,732,314 | | | | — | | | | 36,732,314 | |
Corporate Notes in Reorganization | | | — | | | | 4,392,785 | | | | — | b | | | 4,392,785 | |
Companies in Liquidation | | | — | | | | 16,983 | | | | — | b | | | 16,983 | |
Asset-Backed Securities | | | — | | | | 681,097 | | | | — | | | | 681,097 | |
Short Term Investments | | | 13,197,261 | | | | 5,791,039 | | | | — | | | | 18,988,300 | |
| | | | |
Total Investments in Securities | | $ | 428,419,723 | | | $ | 271,388,450 | | | $ | 19,290,648 | | | $ | 719,098,821 | |
| | | | |
Forward Exchange Contracts | | | — | | | | 588,185 | | | | — | | | | 588,185 | |
Liabilities: | | | | | | | | | | | | | | | | |
Forward Exchange Contracts | | | — | | | | 4,822,844 | | | | — | | | | 4,822,844 | |
Futures Contracts | | | 791,629 | | | | — | | | | — | | | | 791,629 | |
aIncludes common and preferred stocks as well as other equity investments.
bIncludes securities determined to have no value.
cFor detailed categories, see the accompanying Statement of Investments.
A reconciliation of assets in which Level 3 inputs are used in determining fair value is presented when there are significant Level 3 investments at the end of the year. At December 31, 2012, the reconciliation of assets, are as follows:
| | | | | | | | | | | | | | | | | | | | | | | | | | | | | | | | | | | | | | | | | | | | | | | | | | |
| | | Balance at
Beginning of
Year | | Purchases | | Sales | | Transfers
Into
Level 3a | | Transfers
Out of
Level 3 | | Cost Basis
Adjustmentsb | | Net
Realized
Gain
(Loss) | | Net
Unrealized
Gain
(Loss) | | Balance at
End of
Year | | Net Change in
Unrealized
Appreciation
(Depreciation)
on Assets
Held at
Year End |
| | | | | |
Assets | | | | | | | | | | | | | | | | | | | | | | | | | | | | | | | | | | | | | | | | | | | | | | | | | | |
Investments in Securities: | | | | | | | | | | | | | | | | | | | | | | | | | | | | | | | | | | | | | | | | | | | | | | | | | | |
Equity Investments:c | | | | | | | | | | | | | | | | | | | | | | | | | | | | | | | | | | | | | | | | | | | | | | | | | | |
Auto Components | | | $ | 1,616,712 | | | | $ | — | | | | $ | — | | | | $ | — | | | | $ | — | | | | $ | (721,742 | ) | | | $ | 1,569 | | | | $ | 704,053 | | | | $ | 1,600,592 | | | | $ | 704,781 | |
Commercial Banks | | | | 2,859,392 | d | | | | — | | | | | — | | | | | 5,748,864 | | | | | — | | | | | — | | | | | (381,822 | ) | | | | 730,630 | | | | | 8,957,064 | d | | | | 348,808 | |
Diversified Financial Services | | | | 2,333,811 | | | | | 2,644,464 | | | | | — | | | | | — | | | | | — | | | | | — | | | | | — | | | | | (738,748 | ) | | | | 4,239,527 | | | | | (738,748 | ) |
Diversified Telecommunication Services | | | | 32,340 | d | | | | — | | | | | — | | | | | — | | | | | — | | | | | — | | | | | — | | | | | 247 | | | | | 32,587 | d | | | | 247 | |
Insurance | | | | 1,505,983 | d | | | | — | | | | | (778,444 | ) | | | | — | | | | | — | | | | | (743 | ) | | | | 122,199 | | | | | (200,235 | ) | | | | 648,760 | d | | | | (54,261 | ) |
Real Estate Management & Development | | | | 1,789,048 | | | | | 1,675,316 | | | | | — | | | | | — | | | | | — | | | | | — | | | | | — | | | | | 347,754 | | | | | 3,812,118 | | | | | 347,754 | |
Corporate Notes in Reorganization | | | | — | d | | | | — | | | | | — | | | | | — | | | | | — | | | | | 5 | | | | | — | | | | | (5 | ) | | | | — | d | | | | (5 | ) |
| | | | | |
Total | | | $ | 10,137,286 | | | | $ | 4,319,780 | | | | $ | (778,444 | ) | | | $ | 5,748,864 | | | | $ | — | | | | $ | (722,480 | ) | | | $ | (258,054 | ) | | | $ | 843,696 | | | | $ | 19,290,648 | | | | $ | 608,576 | |
| | | | | |
MGD-35
Franklin Templeton Variable Insurance Products Trust
Notes to Financial Statements (continued)
Mutual Global Discovery Securities Fund
14. FAIR VALUE MEASUREMENTS (continued)
aThe investments were transferred into Level 3 as a result of the unavailability of a quoted market price in an active market for identical securities and other significant observable valuation inputs.
bMay include accretion, amortization, partnership adjustments, and/or other cost basis adjustments.
cIncludes common and preferred stocks as well as other equity investments.
dIncludes securities determined to have no value.
Significant unobservable valuation inputs developed by the VLOC for material Level 3 investments as of December 31, 2012, are as follows:
| | | | | | | | | | | | |
Description | | Fair Value at
End of Year | | | Valuation
Technique | | Unobservable Inputs | | Amount/
Range | |
Assets: | | | | | | | | | | | | |
Investments in Securities: | | | | | | | | | | | | |
Equity Investments:a | | | | | | | | | | | | |
Auto Components | | $ | 1,533,983 | | | Market comparables | | Discount for lack of marketability | | | 15% | |
| | | | | | | | EV / EBITDA multiple | | | 3.5x | |
Commercial Banks | | | 8,957,064 | | | Market comparables | | Discount for lack of marketability | | | 5% - 10% | |
| | | | | | | | Price / tangible book multiple | | | 1.2x | |
Diversified Financial Services | | | 4,239,527 | | | Discounted cash flow model | | Cost of Equity Long-term revenue growth rate Long-term pretax operating margin | |
| 15.5%
6.2% - 58.1%
11% - 21% |
|
Real Estate Management & Development | | | 3,812,118 | | | Market comparables | | Discount for lack of marketability | | | 5% - 8% | |
All Other Investmentsb | | | 747,956 | | | | | | | | | |
| | | | | | | | | | | | |
Total | | $ | 19,290,648 | | | | | | | | | |
| | | | | | | | | | | | |
a Includes common and preferred stocks.
b Includes fair value of immaterial investments developed using various valuation techniques and unobservable inputs.
The significant unobservable inputs used in the fair value measurement of the Fund’s investment in auto components companies are an enterprise value (EV) to earnings before interest, taxes, depreciation and amortization (EBITDA) multiple and a discount for lack of marketability. A significant and reasonable increase or decrease in the EV to EBITDA multiple would result in a significant increase or decrease in the fair value measurement. A significant and reasonable increase or decrease in the discount for lack of marketability would result in a significant decrease or increase in the fair value measurement.
The significant unobservable inputs used in the fair value measurement of the Fund’s investments in commercial banks companies are the price to tangible book multiple and a discount for lack of marketability. A significant and reasonable increase or decrease in the price to tangible book multiple would result in a significant increase or decrease in the fair value measurement. A significant and reasonable increase or decrease in the discount for lack of marketability would result in a significant decrease or increase in the fair value measurement.
The significant unobservable input used in the fair value measurement of the Fund’s investment in diversified financial services companies are cost of equity, long-term revenue growth rate, and long-term pretax operating margin. A significant and reasonable increase or decrease in the cost of equity would result in a significant decrease or increase in the fair value measurement. A significant and reasonable increase or decrease in the long-term revenue growth rate and long-term pretax operating margin would result in a significant increase or decrease in the fair value measurement.
The significant unobservable input used in the fair value measurement of the Fund’s investments in real estate management & development companies is a discount for lack of marketability. A significant and reasonable increase or decrease in the input would result in a significant decrease or increase in the fair value measurement.
MGD-36
Franklin Templeton Variable Insurance Products Trust
Notes to Financial Statements (continued)
Mutual Global Discovery Securities Fund
15. NEW ACCOUNTING PRONOUNCEMENTS
In December 2011, the Financial Accounting Standards Board issued Accounting Standards Update (ASU) No. 2011-11, Balance Sheet (Topic 210): Disclosures about Offsetting Assets and Liabilities. The amendments in the ASU enhance disclosures about offsetting of financial assets and liabilities to enable investors to understand the effect of these arrangements on a fund’s financial position. In January 2013, FASB issued ASU No. 2013-01, Balance Sheet (Topic 210): Clarifying the Scope of Disclosures about Offsetting Assets and Liabilities. The amendments in ASU No. 2013-01 clarify the intended scope of disclosures required by ASU No. 2011-11. These ASUs are effective for interim and annual reporting periods beginning on or after January 1, 2013. The Fund believes the adoption of these ASUs will not have a material impact on its financial statements.
16. SUBSEQUENT EVENTS
The Fund has evaluated subsequent events through the issuance of the financial statements and determined that no events have occurred that require disclosure other than those already disclosed in the financial statements.
| | | | |
ABBREVIATIONS | | | | |
| Counterparty | | Currency | | Selected Portfolio |
| | | | |
| BOFA - Bank of America Corp. | | EUR - Euro | | ADR - American Depositary Receipt |
| BZWS - Barclays Bank PLC | | GBP - British Pound | | FHLB - Federal Home Loan Bank |
| DBAB - Deutsche Bank AG | | | | FRN - Floating Rate Note |
| FBCO - Credit Suisse Group AG | | | | PIK - Payment-In-Kind |
| HAND - Svenska Handelsbanken | | | | |
| HSBC - HSBC Bank USA, N.A. | | | | |
| SCBT - Standard Chartered Bank | | | | |
| SSBT - State Street Bank and Trust Co. | | | | |
MGD-37
Franklin Templeton Variable Insurance Products Trust
Mutual Global Discovery Securities Fund
Report of Independent Registered Public Accounting Firm
To the Board of Trustees and Shareholders of
Franklin Templeton Variable Insurance Products Trust
In our opinion, the accompanying statement of assets and liabilities, including the statement of investments, and the related statements of operations and of changes in net assets and the financial highlights present fairly, in all material respects, the financial position of Mutual Global Discovery Securities Fund (the “Fund”) at December 31, 2012, the results of its operations for the year then ended, the changes in its net assets for each of the two years in the period then ended and the financial highlights for the periods presented, in conformity with accounting principles generally accepted in the United States of America. These financial statements and financial highlights (hereafter referred to as “financial statements”) are the responsibility of the Fund’s management. Our responsibility is to express an opinion on these financial statements based on our audits. We conducted our audits of these financial statements in accordance with the standards of the Public Company Accounting Oversight Board (United States). Those standards require that we plan and perform the audit to obtain reasonable assurance about whether the financial statements are free of material misstatement. An audit includes examining, on a test basis, evidence supporting the amounts and disclosures in the financial statements, assessing the accounting principles used and significant estimates made by management, and evaluating the overall financial statement presentation. We believe that our audits, which included confirmation of securities at December 31, 2012 by correspondence with the custodian and brokers, provides a reasonable basis for our opinion.
PricewaterhouseCoopers LLP
San Francisco, California
February 15, 2013
MGD-38
Franklin Templeton Variable Insurance Products Trust
Tax Information (unaudited)
Mutual Global Discovery Securities Fund
Under Section 852(b)(3)(C) of the Internal Revenue Code (Code), the Fund hereby reports the maximum amount allowable but no less than $32,474,102 as a long term capital gain dividend for the fiscal year ended December 31, 2012.
Under Section 854(b)(1)(A) of the Code, the Fund hereby reports 32.20% of the ordinary income dividends as income qualifying for the dividends received deduction for the fiscal year ended December 31, 2012.
MGD-39
MUTUAL INTERNATIONAL SECURITIES FUND
We are pleased to bring you Mutual International Securities Fund’s annual report for the fiscal year ended December 31, 2012.
Performance Summary as of 12/31/12
Average annual total return of Class 2 shares* represents the average annual change in value, assuming reinvestment of dividends and capital gains. Average returns smooth out variations in returns, which can be significant; they are not the same as year-by-year results.
Periods ended 12/31/12
| | | | | | | | | | | | |
| | | 1-Year | | | 3-Year | | | Since Inception
(6/15/09) | |
Average Annual Total Return | | | +17.38% | | | | +6.09% | | | | +11.68% | |
*The investment manager and administrator have contractually agreed to waive or assume certain expenses so that common expenses of the Fund (excluding Rule 12b-1 fees and acquired fund fees and other expenses) do not exceed 0.95% (other than certain nonroutine expenses) until 4/30/13. Fund investment results reflect the expense reduction, without which the results would have been lower.
Total Return Index Comparison for a Hypothetical $10,000 Investment (6/15/09–12/31/12)
The graph below shows the change in value of a hypothetical $10,000 investment in the Fund over the indicated period and includes reinvestment of any income or distributions. The Fund’s performance* is compared to the performance of the MSCI Europe, Australasia, Far East (EAFE) Index Net Return (Local Currency). One cannot invest directly in an index, and index is not representative of the Fund’s portfolio. Please see Important Notes to Performance Information preceding the Fund Summaries.
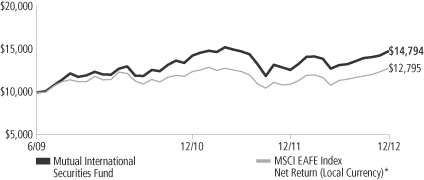
*Source: © 2013 Morningstar. Please see Index Descriptions following the Fund Summaries.
Mutual International Securities Fund – Class 2
Performance reflects the Fund’s Class 2 operating expenses, but does not include any contract fees, expenses or sales charges. If they had been included, performance would be lower. These charges and deductions, particularly for variable life policies, can have a significant effect on contract values and insurance benefits. See the contract prospectus for a complete description of these expenses, including sales charges.
Performance data represent past performance, which does not guarantee future results. Investment return and principal value will fluctuate, and you may have a gain or loss when you sell your shares.
Current performance may differ from figures shown.
MI-1
Fund Goals and Main Investments: Mutual International Securities Fund seeks capital appreciation, which may occasionally be short term, with income as a secondary goal. Under normal market conditions, the Fund invests at least 80% of its net assets in securities of non-U.S. issuers.
Performance Overview
You can find the Fund’s one-year total return in the Performance Summary. The Fund performed comparably to its benchmark, the MSCI EAFE Index Net Return (Local Currency), which posted a total return of +17.31% for the same period.1
Economic and Market Overview
Global developed and emerging stocks, as measured by the MSCI All Country World Index, rallied through the spring of 2012 before a brief drop in early summer gave way to a recovery, leading to solid 12-month gains.2 Periodic downturns were primarily attributable to concerns about slowing global economic growth, European sovereign debt and U.S. fiscal negotiations. The market’s focus early in 2012 was Europe’s debt crisis. Seeking to address it, relatively new leaders in Italy and Greece and for the International Monetary Fund, World Bank and European Central Bank (ECB) offered plans for stability and growth. The leadership’s initial policy responses — which included enhanced liquidity measures and an ineffective Spanish banking bailout — did little to address the structural imbalances of eurozone economies or the solvency fears plaguing the region’s banking system. Thus, debt yields for certain countries spiked to record levels in the first quarter of 2012. However, measures intended to address the seemingly toxic link between Europe’s banks and sovereign bonds emerged when European Union leaders agreed to a deployment of temporary and permanent bailout funds. ECB President Mario Draghi’s declaration that “the ECB is ready to do whatever it takes to preserve the euro” further buoyed markets.
In the U.S., the Federal Reserve Board announced additional rounds of quantitative easing and opted to extend its strategy designed to lower systemically important interest rates. In Asia, the People’s Bank of China cut borrowing costs for the first time since the global financial crisis began, and the Bank of Japan launched its eighth round of quantitative easing in little more than a decade. Headwinds to growth
1. Source: © 2013 Morningstar. One cannot invest directly in an index, and an index is not representative of the Fund’s portfolio. Please see Index Descriptions following the Fund Summaries.
2. Please see Index Descriptions following the Fund Summaries.
Fund Risks: All investments involve risks, including possible loss of principal. Value securities may not increase in price as anticipated or may decline further in value. Special risks are associated with foreign investing, including currency fluctuations, economic instability and political developments; investments in emerging markets involve heightened risks related to the same factors. Because the Fund invests its assets primarily in companies in a specific region, it is subject to greater risks of adverse developments in that region and/or the surrounding regions than a fund that is more broadly diversified geographically. Political, social or economic disruptions in the region, even in countries in which the Fund is not invested, may adversely affect the value of securities held by the Fund. Current political uncertainty surrounding the European Union (EU) and its membership may increase market volatility. The financial instability of some countries in the EU, including Greece, Italy and Spain, together with the risk of that impacting other more stable countries, may increase the economic risk of investing in companies in Europe. The Fund’s investments in companies engaged in mergers, reorganizations or liquidations also involve special risks as pending deals may not be completed on time or on favorable terms. The Fund is actively managed but there is no guarantee that the manager’s investment decisions will produce the desired results. The Fund’s prospectus also includes a description of the main investment risks.
MI-2
negatively affected most world regions during 2012, including recently resilient emerging markets, and the International Monetary Fund lowered its global growth outlook. However, the slowdown appeared less severe than expected in developed markets such as Germany and the U.S. In the latter half of 2012, policy measures seemed to take hold and supported global economic recovery, contributing to expansion in many emerging market countries as well as a slowing rate of contraction in Europe. Toward year-end, investor focus shifted to the U.S., where policymakers sought to avert automatic spending cuts and tax hikes, commonly known as the “fiscal cliff.” Just after year-end, Congress passed compromise legislation that preserved lower income tax rates for most U.S. households and delayed far-reaching federal spending cuts. Despite adversity and uncertainty throughout the 12-month period, virtually all major asset classes finished 2012 with positive returns.
Investment Strategy
At Mutual Series, we are committed to our distinctive value approach to investing. Our major investment strategy is investing in undervalued stocks in Asia and Europe. When selecting undervalued equities, we are attracted to fundamentally strong companies with healthy balance sheets, high-quality assets, substantial free cash flow and shareholder-oriented management teams and whose stocks are trading at discounts to our assessment of the companies’ intrinsic or business value. We also look for asset rich companies whose shares may be trading at depressed levels due to concerns over short-term earnings disappointments, litigation, management strategy or other perceived negatives. While the vast majority of our undervalued equity investments are made in publicly traded companies internationally, we may invest occasionally in privately held companies as well.
We complement this more traditional investment strategy with two others. One is distressed investing, which is complex and can take many forms. The most common distressed investment the Fund undertakes is the purchase of financially troubled or bankrupt companies’ debt at a substantial discount to face value. After the financially distressed company is reorganized, often in bankruptcy court, the old debt is typically replaced with new securities issued by the financially stronger company.
The other piece of our investment strategy is participating in arbitrage situations, another highly specialized field. When companies announce proposed mergers or takeovers, commonly referred to as “deals,” the

MI-3
target company may trade at a discount to the bid it ultimately accepts. One form of arbitrage involves purchasing the target company’s stock when it is trading below the value we believe it would receive in a deal. In keeping with our commitment to a relatively conservative investment approach, we typically focus our arbitrage efforts on announced deals, and eschew rumored deals or other situations we consider relatively risky.
In addition, it is our practice to hedge the Fund’s currency exposure when we deem it advantageous for our shareholders.
Manager’s Discussion
In an environment of generally rising equity prices, several Fund holdings increased in value and contributed to performance during the 12 months under review. Three particularly strong performers were Germany-based tire and automotive components manufacturer Continental, Chinese media advertising firm Sinomedia Holding and Belgium-headquartered diversified insurer Ageas.
Shares of Continental performed well in 2012. Despite some regional softness in auto sales, the company’s strong, relevant and diverse product lineup kept its prospects looking positive, in our view. The company managed to improve operational performance and continued to strengthen its balance sheet, in part by reducing net debt. We believe Continental is one of the better positioned global auto suppliers due to its focus on fuel efficiency, carbon dioxide emissions reduction, vehicle electronics and technology solutions for global automotive original equipment manufacturers.
Sinomedia Holding is a Beijing-based company that provides nationwide advertising coverage and campaign planning for advertisers. Amid rising consumer demand in China, companies increased the advertising of their products and services and we believe Sinomedia stands to benefit. In our assessment, Sinomedia, with its primary focus on television advertising, continues to trade at attractive multiples with considerable cash on the balance sheet and an attractive dividend payout to investors.
Ageas, formerly known as Fortis, is a diversified insurance company with operations in Belgium, the U.K. and Asia. The company has stabilized its balance sheet and lowered its earnings volatility by resolving issues associated with its government rescue in 2008. Recent earnings were generally favorable, with better-than-expected results in its
Top 10 Sectors/Industries
Mutual International Securities Fund
Based on Equity Securities
12/31/12
| | | | |
| | | % of Total
Net Assets | |
| Insurance | | | 12.3% | |
| Commercial Banks | | | 7.5% | |
| Hotels, Restaurants & Leisure | | | 5.3% | |
| Food & Staples Retailing | | | 5.1% | |
| Oil, Gas & Consumable Fuels | | | 5.0% | |
| Chemicals | | | 4.6% | |
| Multiline Retail | | | 4.2% | |
| Media | | | 4.2% | |
| Construction & Engineering | | | 3.3% | |
| Pharmaceuticals | | | 3.1% | |
MI-4
non-life segments and Asian life segments. Within the property and casualty business, improvement in underwriting practices contributed to strong third-quarter results. From our perspective, Ageas monetized its legacy assets more quickly and at better prices than the market had anticipated. In addition, management remained focused on streamlining the company and simplifying the investment story.
Despite the Fund’s positive performance during the year, there were a few disappointments in the portfolio. Among the top detractors were integrated industrial fishing company China Fishery Group, Hong Kong-based flavor and fragrance producer Huabao International Holdings and Germany-based retailer Metro.
The market was concerned about China Fishery Group’s declining returns on its asset base. The company appears to have used cash to build its fleet, but the expenditures did not result in substantial revenue improvements or increased efficiency. Late in the period, investors were surprised by the Russian government’s announcement that it wanted fish caught in Russian waters to be processed within the country. The ramifications of the announcement remained unclear, and the government also stated its desire for companies such as China Fishery Group to continue contracting with Russian fleets. However, cash collections did improve during the year as a result of better working capital management. We believe the company remained an attractive investment at recent valuations.
Huabao produces flavors, fragrances and reconstituted tobacco leaves (RTL). The RTL business helps Chinese tobacco companies reduce their products’ tar content while maintaining taste. The stock’s performance was hindered by unproven allegations of financial irregularities. Our analysis of the company’s financial statements did not raise such concerns. The company continued to appear well capitalized, with net cash reportedly making up a quarter of its balance sheet, generated significant free cash flow and expanded its RTL business.
Metro operates wholesale stores, hypermarkets, department stores and specialty retail stores under a variety of brands and is one of the world’s largest retailers by revenue. The company had a rocky 2012 as consumer spending headwinds persisted following its Christmas 2011 profit warning. The restructuring of its Cash & Carry business has taken longer than anticipated and the company’s consumer electronics operations continued to face pressure from weak economic growth in southern Europe. However, Metro’s department store operations
Top 10 Equity Holdings
Mutual International Securities Fund
12/31/12
| | | | |
Company
Sector/Industry,
Country | | % of Total
Net Assets | |
| Aozora Bank Ltd. | | | 1.9% | |
| Commercial Banks, Japan | | | | |
| Boart Longyear Ltd. | | | 1.8% | |
| Construction & Engineering, Australia | | | | |
| RSA Insurance Group PLC | | | 1.7% | |
| Insurance, U.K. | | | | |
| Sinomedia Holding Ltd. | | | 1.6% | |
| Media, China | | | | |
| ING Groep NV | | | 1.6% | |
| Diversified Financial Services, Netherlands | | | | |
| Mandarin Oriental International Ltd. | | | 1.5% | |
| Hotels, Restaurants & Leisure, Hong Kong | | | | |
| Zurich Insurance Group AG | | | 1.5% | |
| Insurance, Switzerland | | | | |
| Safran SA | | | 1.5% | |
| Aerospace & Defense, France | | | | |
| KB Financial Group Inc. | | | 1.4% | |
| Commercial Banks, South Korea | | | | |
| Transfield Services Ltd. | | | 1.4% | |
| Commercial Services & Supplies, Australia | | | | |
The dollar value, number of shares or principal amount, and names of all portfolio holdings are listed in the Fund’s Statement of Investments.
MI-5
continued to gain market share and its asset disposal plan remained on track as the company announced the sale of its Real hypermarkets in central Europe late in the year. Management continued to reduce debt and the stock offered what we believe to be a sustainable dividend yield of approximately 6% at the end of 2012. We remain patient as the company continues its turnaround.
During the year, the Fund held currency forwards to somewhat hedge the currency risk of the portfolio’s non-U.S. dollar investments. The hedges had a negative impact on the Fund’s performance during the period.
Thank you for your participation in Mutual International Securities Fund. We look forward to serving your future investment needs.
The foregoing information reflects our analysis, opinions and portfolio holdings as of December 31, 2012, the end of the reporting period. The way we implement our main investment strategies and the resulting portfolio holdings may change depending on factors such as market and economic conditions. These opinions may not be relied upon as investment advice or an offer for a particular security. The information is not a complete analysis of every aspect of any market, country, industry, security or the Fund. Statements of fact are from sources considered reliable, but the investment manager makes no representation or warranty as to their completeness or accuracy. Although historical performance is no guarantee of future results, these insights may help you understand our investment management philosophy.
MI-6
Fund Expenses
As an investor in a variable insurance contract (Contract) that indirectly provides for investment in an underlying mutual fund, you can incur transaction and/or ongoing expenses at both the Fund level and the Contract level.
| • | | Transaction expenses can include sales charges (loads) on purchases, redemption fees, surrender fees, transfer fees and premium taxes. |
| • | | Ongoing expenses can include management fees, distribution and service (12b-1) fees, contract fees, annual maintenance fees, mortality and expense risk fees and other fees and expenses. All mutual funds and Contracts have some types of ongoing expenses. |
The expenses shown in the table are meant to highlight ongoing expenses at the Fund level only and do not include ongoing expenses at the Contract level, or transaction expenses at either the Fund or Contract level. While the Fund does not have transaction expenses, if the transaction and ongoing expenses at the Contract level were included, the expenses shown below would be higher. You should consult your Contract prospectus or disclosure document for more information.
The table shows Fund-level ongoing expenses and can help you understand these expenses and compare them with those of other mutual funds offered through the Contract. The table assumes a $1,000 investment held for the six months indicated. Please refer to the Fund prospectus for additional information on operating expenses.
Actual Fund Expenses
The first line (Actual) of the table provides actual account values and expenses. The “Ending Account Value” is derived from the Fund’s actual return, which includes the effect of ongoing Fund expenses, but does not include the effect of ongoing Contract expenses.
You can estimate the Fund-level expenses you incurred during the period by following these steps. Of course, your account value and expenses will differ from those in this illustration:
| 1. | Divide your account value by $1,000. |
If an account had an $8,600 value, then $8,600 ÷ $1,000 = 8.6.
| 2. | Multiply the result by the number under the heading “Fund-Level Expenses Incurred During Period.” |
If Fund-Level Expenses Incurred During Period were $7.50, then 8.6 x $7.50 = $64.50.
In this illustration, the estimated expenses incurred this period at the Fund level are $64.50.
Mutual International Securities Fund – Class 2
MI-7
Hypothetical Example for Comparison with Other Mutual Funds
Information in the second line (Hypothetical) of the table can help you compare ongoing expenses of the Fund with those of other mutual funds offered through the Contract. This information may not be used to estimate the actual ending account balance or expenses you incurred during the period. The hypothetical “Ending Account Value” is based on the Fund’s actual expense ratio and an assumed 5% annual rate of return before expenses, which does not represent the Fund’s actual return. The figure under the heading “Fund-Level Expenses Incurred During Period” shows the hypothetical expenses your account would have incurred under this scenario. You can compare this figure with the 5% hypothetical examples that appear in shareholder reports of other funds offered through a Contract.
| | | | | | | | | | | | |
| Class 2 | | Beginning
Account Value 7/1/12 | | | Ending Account Value 12/31/12 | | | Fund-Level
Expenses Incurred
During Period*
7/1/12–12/31/12 | |
Actual | | $ | 1,000 | | | $ | 1,122.70 | | | $ | 6.40 | |
Hypothetical (5% return
before expenses) | | $ | 1,000 | | | $ | 1,019.10 | | | $ | 6.09 | |
*Expenses are calculated using the most recent six-month annualized expense ratio, net of expense waivers, for the Fund’s Class 2 shares (1.20%), which does not include any ongoing expenses of the Contract for which the Fund is an investment option, multiplied by the average account value over the period, multiplied by 184/366 to reflect the one-half year period.
MI-8
Franklin Templeton Variable Insurance Products Trust
Financial Highlights
Mutual International Securities Fund
| | | | | | | | | | | | | | | | |
| | | Year Ended December 31, | |
| Class 2 | | 2012 | | | 2011 | | | 2010 | | | 2009a | |
| | | | |
Per share operating performance | | | | | | | | | | | | | | | | |
(for a share outstanding throughout the year) | | | | | | | | | | | | | | | | |
Net asset value, beginning of year | | $ | 9.66 | | | $ | 12.04 | | | $ | 11.82 | | | $ | 10.00 | |
| | | | |
Income from investment operationsb: | | | | | | | | | | | | | | | | |
Net investment incomec | | | 0.22 | | | | 0.24 | | | | 0.25 | | | | 0.08 | |
Net realized and unrealized gains (losses) | | | 1.45 | | | | (1.67 | ) | | | 1.51 | | | | 2.30 | |
| | | | |
Total from investment operations | | | 1.67 | | | | (1.43 | ) | | | 1.76 | | | | 2.38 | |
| | | | |
Less distributions from: | | | | | | | | | | | | | | | | |
Net investment income | | | (0.13 | ) | | | (0.29 | ) | | | (0.67 | ) | | | (0.13 | ) |
Net realized gains | | | (0.16 | ) | | | (0.66 | ) | | | (0.87 | ) | | | (0.43 | ) |
| | | | |
Total distributions | | | (0.29 | ) | | | (0.95 | ) | | | (1.54 | ) | | | (0.56 | ) |
| | | | |
Net asset value, end of year | | $ | 11.04 | | | $ | 9.66 | | | $ | 12.04 | | | $ | 11.82 | |
| | | | |
| | | | |
Total returnd | | | 17.38% | | | | (11.92)% | | | | 15.49% | | | | 23.91% | |
Ratios to average net assetse | | | | | | | | | | | | | | | | |
Expenses before waiver and payments by affiliates | | | 6.16% | | | | 5.13% | | | | 4.97% | | | | 8.61% | f |
Expenses net of waiver and payments by affiliates | | | 1.20% | | | | 1.20% | | | | 1.20% | g | | | 1.21% | f,g |
Expenses incurred in connection with securities sold short | | | —% | | | | —% | | | | —% | | | | 0.01% | |
Net investment income | | | 2.08% | | | | 2.12% | | | | 2.07% | | | | 1.27% | |
| | | | |
Supplemental data | | | | | | | | | | | | | | | | |
Net assets, end of year (000’s) | | $ | 1,104 | | | $ | 966 | | | $ | 1,204 | | | $ | 1,182 | |
Portfolio turnover rate | | | 43.70% | | | | 67.91% | | | | 41.11% | | | | 41.84% | |
aFor the period June 15, 2009 (commencement of operations) to December 31, 2009.
bThe amount shown for a share outstanding throughout the period may not correlate with the Statement of Operations for the period due to the timing of sales and repurchases of the Fund shares in relation to income earned and/or fluctuating market value of the investments of the Fund.
cBased on average daily shares outstanding.
dTotal return does not include fees, charges or expenses imposed by the variable annuity and life insurance contracts for which the Franklin Templeton Variable Insurance Products Trust serves as an underlying investment vehicle. Total return is not annualized for periods less than one year.
eRatios are annualized for periods less than one year.
fIncludes dividend expense on securities sold short and borrowing fees, if any. See below for the ratios of such expenses to average net assets for the period presented. See Note 1(d).
gBenefit of expense reduction round to less than 0.01%.
The accompanying notes are an integral part of these financial statements.
MI-9
Franklin Templeton Variable Insurance Products Trust
Financial Highlights (continued)
Mutual International Securities Fund
| | | | | | | | | | | | | | | | |
| | | Year Ended December 31, | |
| Class 4 | | 2012 | | | 2011 | | | 2010 | | | 2009a | |
| | | | |
Per share operating performance | | | | | | | | | | | | | | | | |
(for a share outstanding throughout the year) | | | | | | | | | | | | | | | | |
Net asset value, beginning of year | | $ | 9.65 | | | $ | 12.04 | | | $ | 11.81 | | | $ | 10.00 | |
| | | | |
Income from investment operationsb: | | | | | | | | | | | | | | | | |
Net investment incomec | | | 0.21 | | | | 0.23 | | | | 0.24 | | | | 0.07 | |
Net realized and unrealized gains (losses) | | | 1.46 | | | | (1.68 | ) | | | 1.51 | | | | 2.29 | |
| | | | |
Total from investment operations | | | 1.67 | | | | (1.45 | ) | | | 1.75 | | | | 2.36 | |
| | | | |
Less distributions from: | | | | | | | | | | | | | | | | |
Net investment income | | | (0.12 | ) | | | (0.28 | ) | | | (0.65 | ) | | | (0.12 | ) |
Net realized gains | | | (0.16 | ) | | | (0.66 | ) | | | (0.87 | ) | | | (0.43 | ) |
| | | | |
Total distributions | | | (0.28 | ) | | | (0.94 | ) | | | (1.52 | ) | | | (0.55 | ) |
| | | | |
Net asset value, end of year | | $ | 11.04 | | | $ | 9.65 | | | $ | 12.04 | | | $ | 11.81 | |
| | | | |
| | | | |
Total returnd | | | 17.39% | | | | (12.10)% | | | | 15.49% | | | | 23.76% | |
Ratios to average net assetse | | | | | | | | | | | | | | | | |
Expenses before waiver and payments by affiliates | | | 6.26% | | | | 5.23% | | | | 5.07% | | | | 8.71% | f |
Expenses net of waiver and payments by affiliates | | | 1.30% | | | | 1.30% | | | | 1.30% | g | | | 1.31% | f,g |
Expenses incurred in connection with securities sold short | | | —% | | | | —% | | | | —% | | | | 0.01% | |
Net investment income | | | 1.98% | | | | 2.02% | | | | 1.97% | | | | 1.17% | |
| | | | |
Supplemental data | | | | | | | | | | | | | | | | |
Net assets, end of year (000’s) | | $ | 1,104 | | | $ | 965 | | | $ | 1,204 | | | $ | 1,181 | |
Portfolio turnover rate | | | 43.70% | | | | 67.91% | | | | 41.11% | | | | 41.84% | |
aFor the period June 15, 2009 (commencement of operations) to December 31, 2009.
bThe amount shown for a share outstanding throughout the period may not correlate with the Statement of Operations for the period due to the timing of sales and repurchases of the Fund shares in relation to income earned and/or fluctuating market value of the investments of the Fund.
cBased on average daily shares outstanding.
dTotal return does not include fees, charges or expenses imposed by the variable annuity and life insurance contracts for which the Franklin Templeton Variable Insurance Products Trust serves as an underlying investment vehicle. Total return is not annualized for periods less than one year.
eRatios are annualized for periods less than one year.
fIncludes dividend expense on securities sold short and borrowing fees, if any. See below for the ratios of such expenses to average net assets for the period presented. See Note 1(d).
gBenefit of expense reduction round to less than 0.01%.
The accompanying notes are an integral part of these financial statements.
MI-10
Franklin Templeton Variable Insurance Products Trust
Statement of Investments, December 31, 2012
| | | | | | | | | | |
| Mutual International Securities Fund | | Country | | Shares/
Rights | | | Value | |
Common Stocks and Other Equity Interests 94.5% | | | | | | | | | | |
Aerospace & Defense 1.5% | | | | | | | | | | |
Safran SA | | France | | | 765 | | | $ | 33,120 | |
| | | | | | | | | | |
Auto Components 1.4% | | | | | | | | | | |
Continental AG | | Germany | | | 176 | | | | 20,508 | |
Valeo SA | | France | | | 215 | | | | 10,797 | |
| | | | | | | | | | |
| | | | | | | | | 31,305 | |
| | | | | | | | | | |
Beverages 1.5% | | | | | | | | | | |
Asahi Group Holdings Ltd. | | Japan | | | 1,093 | | | | 23,241 | |
Pernod Ricard SA | | France | | | 90 | | | | 10,439 | |
| | | | | | | | | | |
| | | | | | | | | 33,680 | |
| | | | | | | | | | |
Capital Markets 2.6% | | | | | | | | | | |
F&C Asset Management PLC | | United Kingdom | | | 9,190 | | | | 15,265 | |
Sun Hung Kai & Co. Ltd. | | Hong Kong | | | 29,048 | | | | 18,853 | |
UBS AG | | Switzerland | | | 1,443 | | | | 22,496 | |
| | | | | | | | | | |
| | | | | | | | | 56,614 | |
| | | | | | | | | | |
Chemicals 4.6% | | | | | | | | | | |
Akzo Nobel NV | | Netherlands | | | 347 | | | | 22,964 | |
Huabao International Holdings Ltd. | | Hong Kong | | | 36,000 | | | | 17,790 | |
Koninklijke DSM NV | | Netherlands | | | 315 | | | | 19,193 | |
Lanxess AG | | Germany | | | 300 | | | | 26,447 | |
Linde AG | | Germany | | | 81 | | | | 14,167 | |
| | | | | | | | | | |
| | | | | | | | | 100,561 | |
| | | | | | | | | | |
Commercial Banks 7.5% | | | | | | | | | | |
Aozora Bank Ltd. | | Japan | | | 13,951 | | | | 42,836 | |
Barclays PLC | | United Kingdom | | | 5,540 | | | | 24,058 | |
Hana Financial Group Inc. | | South Korea | | | 800 | | | | 26,099 | |
HSBC Holdings PLC | | United Kingdom | | | 2,570 | | | | 27,241 | |
KB Financial Group Inc. | | South Korea | | | 894 | | | | 31,855 | |
aKorea Exchange Bank | | South Korea | | | 1,780 | | | | 12,752 | |
| | | | | | | | | | |
| | | | | | | | | 164,841 | |
| | | | | | | | | | |
Commercial Services & Supplies 1.4% | | | | | | | | | | |
Transfield Services Ltd. | | Australia | | | 15,018 | | | | 30,764 | |
| | | | | | | | | | |
Construction & Engineering 3.3% | | | | | | | | | | |
Boart Longyear Ltd. | | Australia | | | 19,629 | | | | 39,257 | |
KHD Humboldt Wedag International AG | | Germany | | | 1,525 | | | | 9,447 | |
Vinci SA | | France | | | 490 | | | | 23,586 | |
| | | | | | | | | | |
| | | | | | | | | 72,290 | |
| | | | | | | | | | |
Construction Materials 1.2% | | | | | | | | | | |
CRH PLC | | Ireland | | | 149 | | | | 3,029 | |
SA des Ciments Vicat | | France | | | 367 | | | | 22,928 | |
| | | | | | | | | | |
| | | | | | | | | 25,957 | |
| | | | | | | | | | |
Consumer Finance 1.2% | | | | | | | | | | |
Samsung Card Co. Ltd. | | South Korea | | | 760 | | | | 26,080 | |
| | | | | | | | | | |
Containers & Packaging 1.0% | | | | | | | | | | |
Rexam PLC | | United Kingdom | | | 3,115 | | | | 22,299 | |
| | | | | | | | | | |
MI-11
Franklin Templeton Variable Insurance Products Trust
Statement of Investments, December 31, 2012 (continued)
| | | | | | | | | | |
| Mutual International Securities Fund | | Country | | Shares/
Rights | | | Value | |
Common Stocks and Other Equity Interests (continued) | | | | | | | | | | |
Diversified Consumer Services 1.1% | | | | | | | | | | |
Benesse Holdings Inc. | | Japan | | | 600 | | | $ | 24,935 | |
| | | | | | | | | | |
Diversified Financial Services 2.8% | | | | | | | | | | |
First Pacific Co. Ltd. | | Hong Kong | | | 23,752 | | | | 26,172 | |
aING Groep NV | | Netherlands | | | 3,779 | | | | 35,884 | |
| | | | | | | | | | |
| | | | | | | | | 62,056 | |
| | | | | | | | | | |
Diversified Telecommunication Services 1.2% | | | | | | | | | | |
Vivendi SA | | France | | | 1,189 | | | | 26,883 | |
| | | | | | | | | | |
Electric Utilities 0.0% | | | | | | | | | | |
a,b AET&D Holdings No. 1 Pty. Ltd. | | Australia | | | 6,987 | | | | — | |
| | | | | | | | | | |
Electrical Equipment 1.3% | | | | | | | | | | |
Alstom SA | | France | | | 698 | | | | 28,111 | |
| | | | | | | | | | |
Electronic Equipment, Instruments & Components 1.1% | | | | | | | | | | |
Hoya Corp. | | Japan | | | 1,200 | | | | 23,612 | |
| | | | | | | | | | |
Food & Staples Retailing 5.1% | | | | | | | | | | |
China Resources Enterprise Ltd. | | China | | | 6,000 | | | | 21,638 | |
FamilyMart Co. Ltd. | | Japan | | | 625 | | | | 25,713 | |
Koninklijke Ahold NV | | Netherlands | | | 1,634 | | | | 21,905 | |
Lawson Inc. | | Japan | | | 300 | | | | 20,322 | |
Metro AG | | Germany | | | 841 | | | | 23,358 | |
| | | | | | | | | | |
| | | | | | | | | 112,936 | |
| | | | | | | | | | |
Food Products 1.5% | | | | | | | | | | |
China Fishery Group Ltd. | | Singapore | | | 36,035 | | | | 16,237 | |
Graincorp Ltd. | | Australia | | | 1,264 | | | | 16,406 | |
| | | | | | | | | | |
| | | | | | | | | 32,643 | |
| | | | | | | | | | |
Health Care Providers & Services 1.2% | | | | | | | | | | |
Celesio AG | | Germany | | | 1,550 | | | | 26,840 | |
| | | | | | | | | | |
Hotels, Restaurants & Leisure 5.3% | | | | | | | | | | |
Accor SA | | France | | | 633 | | | | 22,571 | |
Echo Entertainment Group Ltd. | | Australia | | | 4,433 | | | | 16,025 | |
Genting Malaysia Bhd. | | Malaysia | | | 19,300 | | | | 22,405 | |
Mandarin Oriental International Ltd. | | Hong Kong | | | 23,000 | | | | 33,402 | |
REXLot Holdings Ltd. | | Hong Kong | | | 285,168 | | | | 22,077 | |
| | | | | | | | | | |
| | | | | | | | | 116,480 | |
| | | | | | | | | | |
Household Durables 1.8% | | | | | | | | | | |
aThe Berkeley Group Holdings PLC | | United Kingdom | | | 594 | | | | 17,074 | |
Skyworth Digital Holdings Ltd. | | Hong Kong | | | 44,861 | | | | 22,980 | |
| | | | | | | | | | |
| | | | | | | | | 40,054 | |
| | | | | | | | | | |
Industrial Conglomerates 2.7% | | | | | | | | | | |
Jardine Matheson Holdings Ltd. | | Hong Kong | | | 473 | | | | 29,514 | |
Jardine Strategic Holdings Ltd. | | Hong Kong | | | 364 | | | | 13,023 | |
Shanghai Industrial Holdings Ltd. | | China | | | 4,650 | | | | 16,229 | |
| | | | | | | | | | |
| | | | | | | | | 58,766 | |
| | | | | | | | | | |
Insurance 12.3% | | | | | | | | | | |
ACE Ltd. | | United States | | | 325 | | | | 25,935 | |
Ageas | | Belgium | | | 882 | | | | 26,054 | |
MI-12
Franklin Templeton Variable Insurance Products Trust
Statement of Investments, December 31, 2012 (continued)
| | | | | | | | | | |
| Mutual International Securities Fund | | Country | | Shares/
Rights | | | Value | |
Common Stocks and Other Equity Interests (continued) | | | | | | | | | | |
Insurance (continued) | | | | | | | | | | |
AXA SA | | France | | | 1,033 | | | $ | 18,680 | |
Catlin Group Ltd. | | United Kingdom | | | 3,261 | | | | 26,786 | |
China Pacific Insurance (Group) Co. Ltd., H | | China | | | 6,800 | | | | 25,641 | |
aDirect Line Insurance Group PLC | | United Kingdom | | | 493 | | | | 1,709 | |
Great Eastern Holdings Ltd. | | Singapore | | | 2,000 | | | | 25,722 | |
Hiscox Ltd. | | United Kingdom | | | 1,843 | | | | 13,704 | |
Lancashire Holdings Ltd. | | United Kingdom | | | 1,215 | | | | 15,435 | |
Resolution Ltd. | | United Kingdom | | | 5,341 | | | | 21,472 | |
RSA Insurance Group PLC | | United Kingdom | | | 18,400 | | | | 37,997 | |
Zurich Insurance Group AG | | Switzerland | | | 125 | | | | 33,239 | |
| | | | | | | | | | |
| | | | | | | | | 272,374 | |
| | | | | | | | | | |
Internet & Catalog Retail 1.2% | | | | | | | | | | |
GS Home Shopping Inc. | | South Korea | | | 189 | | | | 27,098 | |
| | | | | | | | | | |
Internet Software & Services 0.5% | | | | | | | | | | |
Gree Inc. | | Japan | | | 700 | | | | 10,849 | |
| | | | | | | | | | |
IT Services 0.5% | | | | | | | | | | |
Polaris Financial Technology Ltd. | | India | | | 5,415 | | | | 11,261 | |
| | | | | | | | | | |
Machinery 2.1% | | | | | | | | | | |
Bradken Ltd. | | Australia | | | 3,981 | | | | 23,030 | |
aKUKA AG | | Germany | | | 642 | | | | 23,577 | |
| | | | | | | | | | |
| | | | | | | | | 46,607 | |
| | | | | | | | | | |
Marine 1.4% | | | | | | | | | | |
A.P. Moller - Maersk AS, B | | Denmark | | | 4 | | | | 30,140 | |
| | | | | | | | | | |
Media 4.2% | | | | | | | | | | |
Eutelsat Communications | | France | | | 143 | | | | 4,755 | |
Reed Elsevier PLC | | United Kingdom | | | 1,960 | | | | 20,684 | |
Seven West Media Ltd. | | Australia | | | 17,849 | | | | 30,648 | |
Sinomedia Holding Ltd. | | China | | | 79,017 | | | | 36,296 | |
| | | | | | | | | | |
| | | | | | | | | 92,383 | |
| | | | | | | | | | |
Metals & Mining 1.2% | | | | | | | | | | |
ThyssenKrupp AG | | Germany | | | 1,146 | | | | 27,053 | |
| | | | | | | | | | |
Multi-Utilities 0.9% | | | | | | | | | | |
GDF Suez | | France | | | 1,008 | | | | 20,755 | |
| | | | | | | | | | |
Multiline Retail 4.2% | | | | | | | | | | |
Hyundai Department Store Co. Ltd. | | South Korea | | | 168 | | | | 25,114 | |
Marks & Spencer Group PLC | | United Kingdom | | | 2,614 | | | | 16,438 | |
New World Department Store China | | China | | | 43,000 | | | | 27,741 | |
Springland International Holdings Ltd. | | China | | | 43,444 | | | | 23,151 | |
| | | | | | | | | | |
| | | | | | | | | 92,444 | |
| | | | | | | | | | |
Oil, Gas & Consumable Fuels 5.0% | | | | | | | | | | |
BP PLC | | United Kingdom | | | 3,797 | | | | 26,408 | |
Cairn Energy PLC | | United Kingdom | | | 5,160 | | | | 22,545 | |
Nexen Inc. | | Canada | | | 820 | | | | 22,091 | |
Repsol SA | | Spain | | | 929 | | | | 18,958 | |
Repsol SA, rts., 1/22/13 | | Spain | | | 929 | | | | 566 | |
Royal Dutch Shell PLC, A | | United Kingdom | | | 608 | | | | 20,922 | |
| | | | | | | | | | |
| | | | | | | | | 111,490 | |
| | | | | | | | | | |
MI-13
Franklin Templeton Variable Insurance Products Trust
Statement of Investments, December 31, 2012 (continued)
| | | | | | | | | | |
| Mutual International Securities Fund | | Country | | Shares/
Rights | | | Value | |
Common Stocks and Other Equity Interests (continued) | | | | | | | | | | |
Pharmaceuticals 3.1% | | | | | | | | | | |
Novartis AG | | Switzerland | | | 465 | | | $ | 29,185 | |
Roche Holding AG | | Switzerland | | | 53 | | | | 10,654 | |
Sanofi | | France | | | 84 | | | | 7,964 | |
Teva Pharmaceutical Industries Ltd., ADR | | Israel | | | 580 | | | | 21,657 | |
| | | | | | | | | | |
| | | | | | | | | 69,460 | |
| | | | | | | | | | |
Real Estate Investment Trusts (REITs) 0.4% | | | | | | | | | | |
The Link REIT | | Hong Kong | | | 1,810 | | | | 9,050 | |
| | | | | | | | | | |
Real Estate Management & Development 0.6% | | | | | | | | | | |
Swire Properties Ltd. | | Hong Kong | | | 4,121 | | | | 13,745 | |
| | | | | | | | | | |
Specialty Retail 0.9% | | | | | | | | | | |
Kingfisher PLC | | United Kingdom | | | 4,370 | | | | 20,412 | |
| | | | | | | | | | |
Textiles, Apparel & Luxury Goods 0.0%† | | | | | | | | | | |
Compagnie Financiere Richemont SA | | Switzerland | | | 7 | | | | 546 | |
| | | | | | | | | | |
Tobacco 1.6% | | | | | | | | | | |
British American Tobacco PLC | | United Kingdom | | | 239 | | | | 12,151 | |
Imperial Tobacco Group PLC | | United Kingdom | | | 580 | | | | 22,485 | |
| | | | | | | | | | |
| | | | | | | | | 34,636 | |
| | | | | | | | | | |
Wireless Telecommunication Services 2.1% | | | | | | | | | | |
Total Access Communication PCL | | Thailand | | | 9,100 | | | | 26,248 | |
Vodafone Group PLC | | United Kingdom | | | 8,056 | | | | 20,283 | |
| | | | | | | | | | |
| | | | | | | | | 46,531 | |
| | | | | | | | | | |
Total Common Stocks and Other Equity Interests
(Cost $1,844,974) | | | | | | | | | 2,087,661 | |
| | | | | | | | | | |
Preferred Stocks (Cost $14,637) 0.7% | | | | | | | | | | |
Automobiles 0.7% | | | | | | | | | | |
Hyundai Motor Co., 2nd pfd. | | South Korea | | | 208 | | | | 14,784 | |
| | | | | | | | | | |
Total Investments (Cost $1,859,611) 95.2% | | | | | | | | | 2,102,445 | |
Other Assets, less Liabilities 4.8% | | | | | | | | | 105,595 | |
| | | | | | | | | | |
Net Assets 100.0% | | | | | | | | $ | 2,208,040 | |
| | | | | | | | | | |
See Abbreviations on page MI-27.
†Rounds to less than 0.1% of net assets.
aNon-income producing.
bSee Note 8 regarding restricted securities.
MI-14
Franklin Templeton Variable Insurance Products Trust
Statement of Investments, December 31, 2012 (continued)
| | | | | | |
| Mutual International Securities Fund | | | | | | |
At December 31, 2012, the Fund had the following forward exchange contracts outstanding. See Note 1(c).
Forward Exchange Contracts
| | | | | | | | | | | | | | | | | | | | | | | | | | | | |
| Currency | | Counterparty | | | Type | | | Quantity | | | Contract
Amount | | | Settlement
Date | | | Unrealized
Appreciation | | | Unrealized
Depreciation | |
Euro | | | SCBT | | | | Sell | | | | 266,845 | | | $ | 327,562 | | | | 1/17/13 | | | $ | — | | | $ | (24,621 | ) |
Euro | | | HSBC | | | | Sell | | | | 149,025 | | | | 183,062 | | | | 1/17/13 | | | | — | | | | (13,621 | ) |
Euro | | | BOFA | | | | Sell | | | | 27,510 | | | | 34,310 | | | | 1/17/13 | | | | — | | | | (1,997 | ) |
Euro | | | FBCO | | | | Sell | | | | 21,607 | | | | 27,184 | | | | 1/17/13 | | | | — | | | | (1,333 | ) |
Euro | | | DBAB | | | | Sell | | | | 31,571 | | | | 40,362 | | | | 1/17/13 | | | | — | | | | (1,306 | ) |
Euro | | | BZWS | | | | Sell | | | | 14,882 | | | | 18,451 | | | | 1/17/13 | | | | — | | | | (1,190 | ) |
Euro | | | SSBT | | | | Sell | | | | 6,400 | | | | 8,326 | | | | 1/17/13 | | | | — | | | | (121 | ) |
Euro | | | DBAB | | | | Buy | | | | 11,880 | | | | 15,716 | | | | 1/17/13 | | | | — | | | | (36 | ) |
Euro | | | HSBC | | | | Buy | | | | 23,419 | | | | 29,527 | | | | 1/17/13 | | | | 1,381 | | | | — | |
Euro | | | DBAB | | | | Buy | | | | 22,261 | | | | 28,124 | | | | 1/17/13 | | | | 1,256 | | | | — | |
Euro | | | BZWS | | | | Buy | | | | 2,437 | | | | 3,146 | | | | 1/17/13 | | | | 71 | | | | — | |
Euro | | | BOFA | | | | Buy | | | | 7,234 | | | | 9,299 | | | | 1/17/13 | | | | 248 | | | | — | |
Euro | | | FBCO | | | | Buy | | | | 13,859 | | | | 17,957 | | | | 1/17/13 | | | | 335 | | | | — | |
Euro | | | SSBT | | | | Buy | | | | 20,129 | | | | 26,128 | | | | 1/17/13 | | | | 438 | | | | — | |
Swiss Franc | | | HSBC | | | | Sell | | | | 63,680 | | | | 68,869 | | | | 2/11/13 | | | | — | | | | (758 | ) |
Swiss Franc | | | BOFA | | | | Sell | | | | 1,180 | | | | 1,248 | | | | 2/11/13 | | | | — | | | | (43 | ) |
Swiss Franc | | | FBCO | | | | Sell | | | | 1,883 | | | | 2,022 | | | | 2/11/13 | | | | — | | | | (37 | ) |
Swiss Franc | | | DBAB | | | | Sell | | | | 866 | | | | 919 | | | | 2/11/13 | | | | — | | | | (28 | ) |
Swiss Franc | | | BOFA | | | | Buy | | | | 2,550 | | | | 2,796 | | | | 2/11/13 | | | | — | | | | (8 | ) |
Swiss Franc | | | DBAB | | | | Buy | | | | 800 | | | | 875 | | | | 2/11/13 | | | | — | | | | (3 | ) |
Swiss Franc | | | FBCO | | | | Buy | | | | 6,982 | | | | 7,562 | | | | 2/11/13 | | | | 72 | | | | — | |
South Korean Won | | | BOFA | | | | Sell | | | | 142,651,640 | | | | 125,481 | | | | 2/12/13 | | | | — | | | | (8,266 | ) |
South Korean Won | | | BOFA | | | | Buy | | | | 2,928,320 | | | | 2,698 | | | | 2/12/13 | | | | 48 | | | | — | |
British Pound | | | HSBC | | | | Sell | | | | 200,964 | | | | 315,031 | | | | 2/19/13 | | | | — | | | | (11,486 | ) |
British Pound | | | FBCO | | | | Sell | | | | 24,035 | | | | 37,866 | | | | 2/19/13 | | | | — | | | | (1,184 | ) |
British Pound | | | BOFA | | | | Sell | | | | 14,313 | | | | 22,447 | | | | 2/19/13 | | | | — | | | | (808 | ) |
British Pound | | | BZWS | | | | Sell | | | | 10,664 | | | | 16,707 | | | | 2/19/13 | | | | — | | | | (619 | ) |
British Pound | | | SSBT | | | | Sell | | | | 10,300 | | | | 16,322 | | | | 2/19/13 | | | | — | | | | (413 | ) |
British Pound | | | DBAB | | | | Sell | | | | 8,800 | | | | 14,178 | | | | 2/19/13 | | | | — | | | | (120 | ) |
British Pound | | | BOFA | | | | Buy | | | | 12,700 | | | | 20,648 | | | | 2/19/13 | | | | — | | | | (14 | ) |
British Pound | | | SSBT | | | | Buy | | | | 25,243 | | | | 40,602 | | | | 2/19/13 | | | | 412 | | | | — | |
British Pound | | | DBAB | | | | Buy | | | | 11,686 | | | | 18,934 | | | | 2/19/13 | | | | 53 | | | | — | |
British Pound | | | FBCO | | | | Buy | | | | 5,749 | | | | 9,259 | | | | 2/19/13 | | | | 82 | | | | — | |
British Pound | | | SSBT | | | | Sell | | | | 4,500 | | | | 7,316 | | | | 2/19/13 | | | | 4 | | | | — | |
Australian Dollar | | | DBAB | | | | Sell | | | | 84,000 | | | | 86,895 | | | | 2/25/13 | | | | — | | | | (51 | ) |
Australian Dollar | | | DBAB | | | | Sell | | | | 16,281 | | | | 17,075 | | | | 2/25/13 | | | | 224 | | | | — | |
Japanese Yen | | | HSBC | | | | Buy | | | | 747,543 | | | | 9,434 | | | | 4/22/13 | | | | — | | | | (808 | ) |
Japanese Yen | | | DBAB | | | | Buy | | | | 80,200 | | | | 938 | | | | 4/22/13 | | | | — | | | | (13 | ) |
Japanese Yen | | | HSBC | | | | Sell | | | | 11,373,209 | | | | 143,719 | | | | 4/22/13 | | | | 12,502 | | | | — | |
Japanese Yen | | | BOFA | | | | Sell | | | | 1,949,678 | | | | 23,701 | | | | 4/22/13 | | | | 1,206 | | | | — | |
Japanese Yen | | | SSBT | | | | Sell | | | | 1,559,300 | | | | 19,674 | | | | 4/22/13 | | | | 1,683 | | | | — | |
Japanese Yen | | | FBCO | | | | Sell | | | | 718,100 | | | | 8,725 | | | | 4/22/13 | | | | 440 | | | | — | |
| | | | | | | | | | | | | | | | | | | | | | | | |
Unrealized appreciation (depreciation) | | | | | | | | | | | | | | | | 20,455 | | | | (68,884 | ) |
| | | | | | | | | | | | | | | | | | | | | | | | |
Net unrealized appreciation (depreciation) | | | | | | | | | | | | | | | | | | | $ | (48,429 | ) |
| | | | | | | | | | | | | | | | | | | | | | | | | | | | |
See Abbreviations on page MI-27.
The accompanying notes are an integral part of these financial statements.
MI-15
Franklin Templeton Variable Insurance Products Trust
Financial Statements
Statement of Assets and Liabilities
December 31, 2012
| | | | |
| | | Mutual International
Securities Fund | |
Assets: | | | | |
Investments in securities: | | | | |
Cost | | $ | 1,859,611 | |
| | | | |
Value | | $ | 2,102,445 | |
Cash | | | 71,707 | |
Foreign currency, at value (cost $64,456) | | | 64,487 | |
Receivables: | | | | |
Investment securities sold | | | 1,547 | |
Dividends | | | 3,183 | |
Affiliates | | | 81,902 | |
Unrealized appreciation on forward exchange contracts | | | 20,455 | |
| | | | |
Total assets | | | 2,345,726 | |
| | | | |
Liabilities: | | | | |
Payables: | | | | |
Investment securities purchased | | | 372 | |
Reports to Shareholders | | | 6,260 | |
Pricing Fees | | | 7,223 | |
Professional fees | | | 52,747 | |
Unrealized depreciation on forward exchange contracts | | | 68,884 | |
Accrued expenses and other liabilities | | | 2,200 | |
| | | | |
Total liabilities | | | 137,686 | |
| | | | |
Net assets, at value | | $ | 2,208,040 | |
| | | | |
Net assets consist of: | | | | |
Paid-in capital | | $ | 1,997,138 | |
Undistributed net investment income | | | 8,421 | |
Net unrealized appreciation (depreciation) | | | 194,420 | |
Accumulated net realized gain (loss) | | | 8,061 | |
| | | | |
Net assets, at value | | $ | 2,208,040 | |
| | | | |
Class 2: | | | | |
Net assets, at value | | $ | 1,104,224 | |
| | | | |
Shares outstanding | | | 100,000 | |
| | | | |
Net asset value and maximum offering price per share | | $ | 11.04 | |
| | | | |
Class 4: | | | | |
Net assets, at value | | $ | 1,103,816 | |
| | | | |
Shares outstanding | | | 100,000 | |
| | | | |
Net asset value and maximum offering price per share | | $ | 11.04 | |
| | | | |
The accompanying notes are an integral part of these financial statements.
MI-16
Franklin Templeton Variable Insurance Products Trust
Financial Statements (continued)
Statement of Operations
for the year ended December 31, 2012
| | | | |
| | | Mutual
International
Securities Fund | |
Investment income: | | | | |
Dividends (net of foreign taxes of $4,014) | | $ | 67,681 | |
Income from securities loaned | | | 924 | |
| | | | |
Total investment income | | | 68,605 | |
| | | | |
Expenses: | | | | |
Management fees (Note 3a) | | | 16,733 | |
Administrative fees (Note 3b) | | | 5,229 | |
Distribution fees: (Note 3c) | | | | |
Class 2 | | | 2,616 | |
Class 4 | | | 3,659 | |
Custodian fees (Note 4) | | | 1,994 | |
Reports to shareholders | | | 12,631 | |
Registration and filing fees | | | 1,385 | |
Pricing fees | | | 24,481 | |
Professional fees | | | 60,427 | |
Other | | | 857 | |
| | | | |
Total expenses | | | 130,012 | |
Expenses waived/paid by affiliates (Note 3e) | | | (103,864 | ) |
| | | | |
Net expenses | | | 26,148 | |
| | | | |
Net investment income | | | 42,457 | |
| | | | |
Realized and unrealized gains (losses): | | | | |
Net realized gain (loss) from: | | | | |
Investments | | | 26,970 | |
Foreign currency transactions | | | 80,470 | |
| | | | |
Net realized gain (loss) | | | 107,440 | |
| | | | |
Net change in unrealized appreciation (depreciation) on: | | | | |
Investments | | | 284,112 | |
Translation of other assets and liabilities denominated in foreign currencies | | | (100,892 | ) |
| | | | |
Net change in unrealized appreciation (depreciation) | | | 183,220 | |
| | | | |
Net realized and unrealized gain (loss) | | | 290,660 | |
| | | | |
Net increase (decrease) in net assets resulting from operations | | $ | 333,117 | |
| | | | |
The accompanying notes are an integral part of these financial statements.
MI-17
Franklin Templeton Variable Insurance Products Trust
Financial Statements (continued)
Statements of Changes in Net Assets
| | | | | | | | |
| | | Mutual International
Securities Fund | |
| | | Year Ended December 31, | |
| | | 2012 | | | 2011 | |
| | | | |
Increase (decrease) in net assets: | | | | | | | | |
Operations: | | | | | | | | |
Net investment income | | $ | 42,457 | | | $ | 47,727 | |
Net realized gain (loss) from investments and foreign currency transactions | | | 107,440 | | | | 27,154 | |
Net change in unrealized appreciation (depreciation) on investments and translation of other assets and liabilities denominated in foreign currencies | | | 183,220 | | | | (363,298 | ) |
| | | | |
Net increase (decrease) in net assets resulting from operations | | | 333,117 | | | | (288,417 | ) |
| | | | |
Distributions to shareholders from: | | | | | | | | |
Net investment income: | | | | | | | | |
Class 2 | | | (13,020 | ) | | | (28,830 | ) |
Class 4 | | | (11,980 | ) | | | (27,670 | ) |
Net realized gains: | | | | | | | | |
Class 2 | | | (15,620 | ) | | | (65,960 | ) |
Class 4 | | | (15,620 | ) | | | (65,960 | ) |
| | | | |
Total distributions to shareholders | | | (56,240 | ) | | | (188,420 | ) |
| | | | |
Net increase (decrease) in net assets | | | 276,877 | | | | (476,837 | ) |
Net assets: | | | | | | | | |
Beginning of year | | | 1,931,163 | | | | 2,408,000 | |
| | | | |
End of year | | $ | 2,208,040 | | | $ | 1,931,163 | |
| | | | |
Undistributed net investment income (distributions in excess of net investment income) included in net assets: | | | | | | | | |
End of year | | $ | 8,421 | | | $ | (31,440 | ) |
| | | | |
The accompanying notes are an integral part of these financial statements.
MI-18
Franklin Templeton Variable Insurance Products Trust
Notes to Financial Statements
Mutual International Securities Fund
1. ORGANIZATION AND SIGNIFICANT ACCOUNTING POLICIES
Franklin Templeton Variable Insurance Products Trust (Trust) is registered under the Investment Company Act of 1940, as amended, (1940 Act) as an open-end investment company, consisting of twenty separate funds. The Mutual International Securities Fund is included in this report. The financial statements of the remaining funds in the Trust are presented separately. Shares of the Fund are generally sold only to insurance company separate accounts to fund the benefits of variable life insurance policies or variable annuity contracts. The Fund offers two classes of shares: Class 2, and Class 4. Each class of shares differs by its distribution fees, voting rights on matters affecting a single class and its exchange privilege.
The following summarizes the Fund’s significant accounting policies.
a. Financial Instrument Valuation
The Fund’s investments in financial instruments are carried at fair value daily. Fair value is the price that would be received to sell an asset or paid to transfer a liability in an orderly transaction between market participants on the measurement date. Under procedures approved by the Trust’s Board of Trustees (the Board), the Fund’s administrator, investment manager and other affiliates have formed the Valuation and Liquidity Oversight Committee (VLOC). The VLOC provides administration and oversight of the Fund’s valuation policies and procedures, which are approved annually by the Board. Among other things, these procedures allow the Fund to utilize independent pricing services, quotations from securities and financial instrument dealers, and other market sources to determine fair value.
Equity securities listed on an exchange or on the NASDAQ National Market System are valued at the last quoted sale price or the official closing price of the day, respectively. Foreign equity securities are valued as of the close of trading on the foreign stock exchange on which the security is primarily traded, or the NYSE, whichever is earlier. The value is then converted into its U.S. dollar equivalent at the foreign exchange rate in effect at the close of the NYSE on the day that the value of the security is determined. Over-the-counter (OTC) securities are valued within the range of the most recent quoted bid and ask prices. Securities that trade in multiple markets or on multiple exchanges are valued according to the broadest and most representative market. Certain equity securities are valued based upon fundamental characteristics or relationships to similar securities.
Certain derivative financial instruments (derivatives) trade in the OTC market. The Fund’s pricing services use various techniques including industry standard option pricing models and proprietary discounted cash flow models to determine the fair value of those instruments. The Fund’s net benefit or obligation under the derivative contract, as measured by the fair market value of the contract, is included in net assets.
The Fund has procedures to determine the fair value of financial instruments for which market prices are not reliable or readily available. Under these procedures, the VLOC convenes on a regular basis to review such financial instruments and considers a number of factors, including significant unobservable valuation inputs, when arriving at fair value. The VLOC primarily employs a market-based approach which may use related or comparable assets or liabilities, recent transactions, market multiples, book values, and other relevant information for the investment to determine the fair value of the investment. An income-based valuation approach may also be used in which the anticipated future cash flows of the investment are discounted to calculate fair value. Discounts may also be applied due to the nature or duration of any restrictions on the disposition of the investments. Due to the inherent uncertainty of valuations of such investments, the fair values may differ significantly from the values that would have been used had an active market existed. The VLOC employs various methods for calibrating these valuation approaches including a regular review of key inputs and assumptions, transactional back-testing or disposition analysis, and reviews of any related market activity.
Trading in securities on foreign securities stock exchanges and OTC markets may be completed before the daily close of business on the NYSE. Occasionally, events occur between the time at which trading in a foreign security is completed and the close of the NYSE that might call into question the reliability of the value of a portfolio security held by the Fund. As a result, differences may arise between the value of the Fund’s portfolio securities as determined at the foreign market close and the latest indications
MI-19
Franklin Templeton Variable Insurance Products Trust
Notes to Financial Statements (continued)
Mutual International Securities Fund
1. ORGANIZATION AND SIGNIFICANT ACCOUNTING POLICIES (continued)
a. Financial Instrument Valuation (continued)
of value at the close of the NYSE. In order to minimize the potential for these differences, the VLOC monitors price movements following the close of trading in foreign stock markets through a series of country specific market proxies (such as baskets of American Depositary Receipts, futures contracts and exchange traded funds). These price movements are measured against established trigger thresholds for each specific market proxy to assist in determining if an event has occurred that may call into question the reliability of the values of the foreign securities held by the Fund. If such an event occurs, the securities may be valued using fair value procedures, which may include the use of independent pricing services. At December 31, 2012, a market event occurred resulting in a portion of the securities held by the Fund being valued using fair value procedures.
b. Foreign Currency Translation
Portfolio securities and other assets and liabilities denominated in foreign currencies are translated into U.S. dollars based on the exchange rate of such currencies against U.S. dollars on the date of valuation. The Fund may enter into foreign currency exchange contracts to facilitate transactions denominated in a foreign currency. Purchases and sales of securities, income and expense items denominated in foreign currencies are translated into U.S. dollars at the exchange rate in effect on the transaction date. Portfolio securities and assets and liabilities denominated in foreign currencies contain risks that those currencies will decline in value relative to the U.S. dollar. Occasionally, events may impact the availability or reliability of foreign exchange rates used to convert the U.S. dollar equivalent value. If such an event occurs, the foreign exchange rate will be valued at fair value using procedures established and approved by the Board.
The Fund does not separately report the effect of changes in foreign exchange rates from changes in market prices on securities held. Such changes are included in net realized and unrealized gain or loss from investments on the Statement of Operations.
Realized foreign exchange gains or losses arise from sales of foreign currencies, currency gains or losses realized between the trade and settlement dates on securities transactions and the difference between the recorded amounts of dividends, interest, and foreign withholding taxes and the U.S. dollar equivalent of the amounts actually received or paid. Net unrealized foreign exchange gains and losses arise from changes in foreign exchange rates on foreign denominated assets and liabilities other than investments in securities held at the end of the reporting period.
c. Derivative Financial Instruments
The Fund invested in derivatives in order to manage risk or gain exposure to various other investments or markets. Derivatives are financial contracts based on an underlying or notional amount, require no initial investment or an initial net investment that is smaller than would normally be required to have a similar response to changes in market factors, and require or permit net settlement. Derivatives contain various risks including the potential inability of the counterparty to fulfill their obligations under the terms of the contract, the potential for an illiquid secondary market, and/or the potential for market movements which expose the Fund to gains or losses in excess of the amounts shown on the Statement of Assets and Liabilities. Realized gain and loss and unrealized appreciation and depreciation on these contracts for the period are included in the Statement of Operations.
The Fund investments in OTC derivatives are subject to the terms of International Swaps and Derivatives Association Master Agreements and other related agreements between the Fund and certain derivative counterparties. These agreements contain various provisions, including but not limited to collateral requirements, events of default, requirements for the Fund to maintain certain net asset levels and/or limit the decline in net assets over various periods of time. Should the Fund fail to meet any of these provisions, the derivative counterparty has the right to terminate the derivative contract and require immediate payment by the Fund for those OTC derivatives with that particular counterparty that are in a net liability position. At December 31, 2012, the Fund had OTC derivatives in a net liability position for such contracts of $50,432.
MI-20
Franklin Templeton Variable Insurance Products Trust
Notes to Financial Statements (continued)
Mutual International Securities Fund
1. ORGANIZATION AND SIGNIFICANT ACCOUNTING POLICIES (continued)
c. Derivative Financial Instruments (continued)
The Fund entered into OTC forward exchange contracts primarily to manage exposure to certain foreign currencies. A forward exchange contract is an agreement between the Fund and a counterparty to buy or sell a foreign currency for a specific exchange rate on a future date. Pursuant to the terms of the forward exchange contracts, cash or securities may be required to be deposited as collateral. Unrestricted cash may be invested according to the Fund’s investment objectives.
See Note 9 regarding other derivative information.
d. Securities Lending
The Fund participates in an agency based securities lending program. The Fund receives cash collateral against the loaned securities in an amount equal to at least 102% of the market value of the loaned securities. Collateral is maintained over the life of the loan in an amount not less than 100% of the market value of loaned securities, as determined at the close of fund business each day; any additional collateral required due to changes in security values is delivered to the Fund on the next business day. The collateral is invested in a non-registered money fund. The Fund receives income from the investment of cash collateral, in addition to lending fees and rebates paid by the borrower. The Fund bears the market risk with respect to the collateral investment, securities loaned, and the risk that the agent may default on its obligations to the Fund. The securities lending agent has agreed to indemnify the Fund in the event of default by a third party borrower. At December 31, 2012, the Fund had no securities on loan.
e. Income and Deferred Taxes
It is the Fund’s policy to qualify as a regulated investment company under the Internal Revenue Code. The Fund intends to distribute to shareholders substantially all of its taxable income and net realized gains to relieve it from federal income and if applicable, excise taxes. As a result, no provision for U.S. federal income taxes is required.
The Fund may be subject to foreign taxation related to income received, capital gains on the sale of securities and certain foreign currency transactions in the foreign jurisdictions in which it invests. Foreign taxes, if any, are recorded based on the tax regulations and rates that exist in the foreign markets in which the Fund invests. When a capital gain tax is determined to apply the Fund records an estimated deferred tax liability in an amount that would be payable if the securities were disposed of on the valuation date.
The Fund recognizes the tax benefits of uncertain tax positions only when the position is “more likely than not” to be sustained upon examination by the tax authorities based on the technical merits of the tax position. As of December 31, 2012, and for all open tax years, the Fund has determined that no liability for unrecognized tax benefits is required in the Fund’s financial statements related to uncertain tax positions taken on a tax return (or expected to be taken on future tax returns). Open tax years are those that remain subject to examination and are based on each tax jurisdiction statute of limitation.
f. Security Transactions, Investment Income, Expenses and Distributions
Security transactions are accounted for on trade date. Realized gains and losses on security transactions are determined on a specific identification basis. Estimated expenses are accrued daily. Dividend income is recorded on the ex-dividend date except that certain dividends from foreign securities are recognized as soon as the Fund is notified of the ex-dividend date. Distributions to shareholders are recorded on the ex-dividend date and are determined according to income tax regulations (tax basis).
MI-21
Franklin Templeton Variable Insurance Products Trust
Notes to Financial Statements (continued)
Mutual International Securities Fund
1. ORGANIZATION AND SIGNIFICANT ACCOUNTING POLICIES (continued)
f. Security Transactions, Investment Income, Expenses and Distributions (continued)
Distributable earnings determined on a tax basis may differ from earnings recorded in accordance with accounting principles generally accepted in the United States of America. These differences may be permanent or temporary. Permanent differences are reclassified among capital accounts to reflect their tax character. These reclassifications have no impact on net assets or the results of operations. Temporary differences are not reclassified, as they may reverse in subsequent periods.
Common expenses incurred by the Trust are allocated among the funds based on the ratio of net assets of each fund to the combined net assets of the Trust. Fund specific expenses are charged directly to the fund that incurred the expense.
Realized and unrealized gains and losses and net investment income, not including class specific expenses, are allocated daily to each class of shares based upon the relative proportion of net assets of each class. Differences in per share distributions, by class, are generally due to differences in class specific expenses.
g. Accounting Estimates
The preparation of financial statements in accordance with accounting principles generally accepted in the United States of America requires management to make estimates and assumptions that affect the reported amounts of assets and liabilities at the date of the financial statements and the amounts of income and expenses during the reporting period. Actual results could differ from those estimates.
h. Guarantees and Indemnifications
Under the Trust’s organizational documents, its officers and trustees are indemnified by the Trust against certain liabilities arising out of the performance of their duties to the Trust. Additionally, in the normal course of business, the Trust, on behalf of the Fund, enters into contracts with service providers that contain general indemnification clauses. The Trust’s maximum exposure under these arrangements is unknown as this would involve future claims that may be made against the Trust that have not yet occurred. Currently, the Trust expects the risk of loss to be remote.
2. SHARES OF BENEFICIAL INTEREST
At December 31, 2012, there were an unlimited number of shares authorized (without par value). During the year ended December 31, 2012 and the year ended December 31, 2011, there were no transactions of the Fund’s shares.
3. TRANSACTIONS WITH AFFILIATES
Franklin Resources, Inc. is the holding company for various subsidiaries that together are referred to as Franklin Templeton Investments. Certain officers and trustees of the Fund are also officers and/or directors of the following subsidiaries:
| | |
| Subsidiary | | Affiliation |
Franklin Mutual Advisers, LLC (Franklin Mutual) | | Investment manager |
Franklin Templeton Services, LLC (FT Services) | | Administrative manager |
Franklin Templeton Distributors, Inc. (Distributors) | | Principal underwriter |
Franklin Templeton Investor Services, LLC (Investor Services) | | Transfer agent |
MI-22
Franklin Templeton Variable Insurance Products Trust
Notes to Financial Statements (continued)
Mutual International Securities Fund
3. TRANSACTIONS WITH AFFILIATES (continued)
a. Management Fees
The Fund pays an investment management fee to Franklin Mutual based on the average daily net assets of the Fund as follows:
| | |
| Annualized Fee Rate | | Net Assets |
| 0.800% | | Up to and including $4 billion |
| 0.770% | | Over $4 billion, up to and including $7 billion |
| 0.750% | | Over $7 billion, up to and including $10 billion |
| 0.730% | | In excess of $10 billion |
b. Administrative Fees
The Fund pays an administrative fee to FT Services of 0.25% per year of the average daily net assets of the Fund.
c. Distribution Fees
The Board has adopted distribution plans for Class 2 and Class 4 shares pursuant to Rule 12b-1 under the 1940 Act. Under the Fund’s compensation distribution plans, the Fund pays Distributors for costs incurred in connection with the servicing, sale and distribution of the Fund’s shares up to 0.35% per year of its average daily net assets of each class. Some distribution fees are not charged on shares held by affiliates. The Board has agreed to limit the current rate to 0.25% per year for Class 2.
d. Transfer Agent Fees
Investor Services, under terms of an agreement, performs shareholder servicing for the Fund and is not paid by the Fund for the services.
e. Waiver and Expense Reimbursements
FT Services and Franklin Mutual have contractually agreed in advance to waive or limit their respective fees and to assume as their own expense certain expenses otherwise payable by the Fund so that the common expenses (i.e. a combination of management fees, administrative fees, and other expenses, but excluding distribution fees, and acquired fund fees and expenses) for each class of the Fund do not exceed 0.95% (other than certain non-routine expenses or costs, including those relating to litigation, indemnification, reorganizations, and liquidations) until April 30, 2013.
f. Other Affiliated Transactions
At December 31, 2012, Franklin Advisers owned 100.00% of the Fund’s outstanding shares.
4. EXPENSE OFFSET ARRANGEMENT
The Fund has entered into an arrangement with its custodian whereby credits realized as a result of uninvested cash balances are used to reduce a portion of the Fund’s custodian expenses. During the year ended December 31, 2012, there were no credits earned.
MI-23
Franklin Templeton Variable Insurance Products Trust
Notes to Financial Statements (continued)
Mutual International Securities Fund
5. INCOME TAXES
For tax purposes, capital losses may be carried over to offset future capital gains, if any. Capital loss carryforwards with no expiration, if any, must be fully utilized before those losses with expiration dates.
At December 31, 2012, the capital loss carryforwards were as follows:
| | | | |
Capital loss carryforwards: | | | | |
Short term | | $ | 30,272 | |
Long term | | | 7,439 | |
| | | | |
Total capital loss carryforwards | | $ | 37,711 | |
| | | | |
The tax character of distributions paid during the years ended December 31, 2012 and 2011, was as follows:
| | | | | | | | |
| | | 2012 | | | 2011 | |
Distributions paid from: | | | | | | | | |
Ordinary income | | $ | 25,006 | | | $ | 82,380 | |
Long term capital gain | | | 31,234 | | | | 106,040 | |
| | | | |
| | $ | 56,240 | | | $ | 188,420 | |
| | | | |
At December 31, 2012, the cost of investments, net unrealized appreciation (depreciation) and undistributed ordinary income for income tax purposes were as follows:
| | | | |
Cost of investments | | $ | 1,872,622 | |
| | | | |
| |
Unrealized appreciation | | $ | 359,666 | |
Unrealized depreciation | | | (129,843 | ) |
| | | | |
Net unrealized appreciation (depreciation) | | $ | 229,823 | |
| | | | |
Distributable earnings – undistributed ordinary income | | $ | 18,772 | |
| | | | |
Differences between income and/or capital gains as determined on a book basis and a tax basis are primarily due to differing treatments of foreign currency transactions, passive foreign investment company shares, and wash sales.
6. INVESTMENT TRANSACTIONS
Purchases and sales of investments (excluding short term securities) for the year ended December 31, 2012, aggregated $945,777 and $828,786, respectively.
7. CONCENTRATION OF RISK
Investing in foreign securities may include certain risks and considerations not typically associated with investing in U.S. securities, such as fluctuating currency values and changing local and regional economic, political and social conditions, which may result in greater market volatility. In addition, certain foreign securities may not be as liquid as U.S. securities.
8. RESTRICTED SECURITIES
The Fund invests in securities that are restricted under the Securities Act of 1933 (1933 Act) or which are subject to legal, contractual, or other agreed upon restrictions on resale. Restricted securities are often purchased in private placement transactions, and cannot be sold without prior registration unless the sale is pursuant to an exemption under the 1933 Act. Disposal of these securities may require greater effort and expense, and prompt sale at an acceptable price may be difficult. The Fund may have registration rights for restricted securities. The issuer generally incurs all registration costs.
MI-24
Franklin Templeton Variable Insurance Products Trust
Notes to Financial Statements (continued)
Mutual International Securities Fund
8. RESTRICTED SECURITIES (continued)
At December 31, 2012, the Fund held investments in restricted securities, excluding certain securities exempt from registration under the 1933 Act deemed to be liquid, as follows:
| | | | | | | | | | | | | | | | |
| Shares | | | Issuer | | Acquisition
Date | | | Cost | | | Value | |
| | 6,987 | | | AET&D Holdings No. 1 Pty. Ltd. (Value is 0.00% of Net Assets) | | | 10/13/10 | | | $ | — | | | $ | — | |
| | | | | | | | | | | | |
9. OTHER DERIVATIVE INFORMATION
At December 31, 2012, the Fund’s investments in derivative contracts are reflected on the Statement of Assets and Liabilities as follows:
| | | | | | | | | | | | |
| | | Asset Derivatives | | | Liability Derivatives | |
Derivative Contracts Not Accounted
for as Hedging Instruments | | Statement of Assets and
Liabilities Location | | Fair
Value
Amount | | | Statement of Assets and
Liabilities Location | | Fair
Value
Amount | |
Foreign exchange contracts | | Unrealized appreciation on forward exchange contracts | | $ | 20,455 | | | Unrealized depreciation on forward exchange contracts | | $ | 68,884 | |
For the year ended December 31, 2012, the effect of derivative contracts on the Fund’s Statement of Operations was as follows:
| | | | | | | | | | |
Derivative Contracts Not Accounted
for as Hedging Instruments | | Statement of Operations Locations | | Realized Gain
(Loss) for the
Year | | | Change in
Unrealized
Appreciation
(Depreciation)
for the Year | |
Foreign exchange contracts | | Net realized gain (loss) from foreign currency transactions/ Net change in unrealized appreciation (depreciation) on translation of other assets and liabilities denominated in foreign currencies | | $ | 83,265 | | | $ | (100,729 | ) |
For the year ended December 31, 2012, the average month end market value of derivatives represented 2.17% of average month end net assets. The average month end number of open derivative contracts for the year was 69.
See Note 1(c) regarding derivative financial instruments.
10. CREDIT FACILITY
The Fund, together with other U.S. registered and foreign investment funds (collectively, Borrowers), managed by Franklin Templeton Investments, are borrowers in a joint syndicated senior unsecured credit facility totaling $1.5 billion (Global Credit Facility) which matured on January 18, 2013. This Global Credit Facility provides a source of funds to the Borrowers for temporary and emergency purposes, including the ability to meet future unanticipated or unusually large redemption requests. Effective January 18, 2013, the Borrowers renewed the Global Credit Facility which matures on January 17, 2014.
Under the terms of the Global Credit Facility, the Fund shall, in addition to interest charged on any borrowings made by the Fund and other costs incurred by the Fund, pay its share of fees and expenses incurred in connection with the implementation and maintenance of the Global Credit Facility, based upon its relative share of the aggregate net assets of all of the Borrowers, including an annual commitment fee of 0.07% based upon the unused portion of the Global Credit Facility. These fees are reflected in other expenses on the Statement of Operations. During the year ended December 31, 2012, the Fund did not use the Global Credit Facility.
MI-25
Franklin Templeton Variable Insurance Products Trust
Notes to Financial Statements (continued)
Mutual International Securities Fund
11. FAIR VALUE MEASUREMENTS
The Fund follows a fair value hierarchy that distinguishes between market data obtained from independent sources (observable inputs) and the Fund’s own market assumptions (unobservable inputs). These inputs are used in determining the value of the Fund’s financial instruments and are summarized in the following fair value hierarchy:
| | • | | Level 1 – quoted prices in active markets for identical financial instruments |
| | • | | Level 2 – other significant observable inputs (including quoted prices for similar financial instruments, interest rates, prepayment speed, credit risk, etc.) |
| | • | | Level 3 – significant unobservable inputs (including the Fund’s own assumptions in determining the fair value of financial instruments) |
The inputs or methodology used for valuing financial instruments are not an indication of the risk associated with investing in those financial instruments.
For movements between the levels within the fair value hierarchy, the Fund has adopted a policy of recognizing the transfers as of the date of the underlying event which caused the movement. Additionally, at December 31, 2012, due to market events, the Fund employed fair value procedures to value a portion of its holdings. Such procedures resulted in a temporary transfer of financial instruments valued at $1,405,046 from Level 1 to Level 2 within the fair value hierarchy.
A summary of inputs used as of December 31, 2012, in valuing the Fund’s assets carried at fair value, is as follows:
| | | | | | | | | | | | | | | | |
| | | Level 1 | | | Level 2 | | | Level 3 | | | Total | |
| | | | |
Assets: | | | | | | | | | | | | | | | | |
Investments in Securities: | | | | | | | | | | | | | | | | |
Equity Investments: | | | | | | | | | | | | | | | | |
Aerospace & Defense | | $ | — | | | $ | 33,120 | | | $ | — | | | $ | 33,120 | |
Auto Components | | | — | | | | 31,305 | | | | — | | | | 31,305 | |
Beverages | | | — | | | | 33,680 | | | | — | | | | 33,680 | |
Capital Markets | | | 41,349 | | | | 15,265 | | | | — | | | | 56,614 | |
Chemicals | | | 17,790 | | | | 82,771 | | | | — | | | | 100,561 | |
Commercial Banks | | | 70,706 | | | | 94,135 | | | | — | | | | 164,841 | |
Commercial Services & Supplies | | | — | | | | 30,764 | | | | — | | | | 30,764 | |
Construction & Engineering | | | — | | | | 72,290 | | | | — | | | | 72,290 | |
Construction Materials | | | — | | | | 25,957 | | | | — | | | | 25,957 | |
Containers & Packaging | | | — | | | | 22,299 | | | | — | | | | 22,299 | |
Diversified Consumer Services | | | — | | | | 24,935 | | | | — | | | | 24,935 | |
Diversified Financial Services | | | 26,172 | | | | 35,884 | | | | — | | | | 62,056 | |
Diversified Telecommunication Services | | | — | | | | 26,883 | | | | — | | | | 26,883 | |
Electrical Equipment | | | — | | | | 28,111 | | | | — | | | | 28,111 | |
Electronic Equipment, Instruments & Components | | | — | | | | 23,612 | | | | — | | | | 23,612 | |
Food & Staples Retailing | | | 21,638 | | | | 91,298 | | | | — | | | | 112,936 | |
Food Products | | | — | | | | 32,643 | | | | — | | | | 32,643 | |
Health Care Providers & Services | | | — | | | | 26,840 | | | | — | | | | 26,840 | |
Hotels, Restaurants & Leisure | | | 44,482 | | | | 71,998 | | | | — | | | | 116,480 | |
Household Durables | | | 22,980 | | | | 17,074 | | | | — | | | | 40,054 | |
Industrial Conglomerates | | | 16,229 | | | | 42,537 | | | | — | | | | 58,766 | |
Insurance | | | 80,646 | | | | 191,728 | | | | — | | | | 272,374 | |
Internet Software & Services | | | — | | | | 10,849 | | | | — | | | | 10,849 | |
Machinery | | | — | | | | 46,607 | | | | — | | | | 46,607 | |
Media | | | 36,296 | | | | 56,087 | | | | — | | | | 92,383 | |
Metals & Mining | | | — | | | | 27,053 | | | | — | | | | 27,053 | |
Multiline Retail | | | 76,006 | | | | 16,438 | | | | — | | | | 92,444 | |
MI-26
Franklin Templeton Variable Insurance Products Trust
Notes to Financial Statements (continued)
Mutual International Securities Fund
11. FAIR VALUE MEASUREMENTS (continued)
| | | | | | | | | | | | | | | | |
| | | Level 1 | | | Level 2 | | | Level 3 | | | Total | |
| | | | |
Assets: | | | | | | | | | | | | | | | | |
Multi-Utilities | | $ | — | | | $ | 20,755 | | | $ | — | | | $ | 20,755 | |
Oil, Gas & Consumable Fuels | | | 22,657 | | | | 88,833 | | | | — | | | | 111,490 | |
Pharmaceuticals | | | 61,496 | | | | 7,964 | | | | — | | | | 69,460 | |
Specialty Retail | | | — | | | | 20,412 | | | | — | | | | 20,412 | |
Tobacco | | | — | | | | 34,636 | | | | — | | | | 34,636 | |
Wireless Telecommunication Services | | | 26,248 | | | | 20,283 | | | | — | | | | 46,531 | |
All Other Equity Investmentsa,b | | | 132,704 | | | | — | | | | — | c | | | 132,704 | |
| | | | |
Total Investments in Securities | | $ | 697,399 | | | $ | 1,405,046 | | | $ | — | | | $ | 2,102,445 | |
| | | | |
Forward Exchange Contracts | | | — | | | | 20,455 | | | | — | | | | 20,455 | |
Liabilities: | | | | | | | | | | | | | | | | |
Forward Exchange Contracts | | | — | | | | 68,884 | | | | — | | | | 68,884 | |
aIncludes common and preferred stocks.
bFor detailed categories, see the accompanying Statement of Investments.
cIncludes securities determined to have no value at December 31, 2012.
A reconciliation of assets in which Level 3 inputs are used in determining fair value is presented when there are significant Level 3 investments at the end of the period.
12. NEW ACCOUNTING PRONOUNCEMENTS
In December 2011, the Financial Accounting Standards Board (FASB) issued Accounting Standards Update (ASU) No. 2011-11, Balance Sheet (Topic 210): Disclosures about Offsetting Assets and Liabilities. The amendments in the ASU enhance disclosures about offsetting of financial assets and liabilities to enable investors to understand the effect of these arrangements on a fund’s financial position. In January 2013, FASB issued ASU No. 2013-01, Balance Sheet (Topic 210): Clarifying the Scope of Disclosures about Offsetting Assets and Liabilities. The amendments in ASU No. 2013-01 clarify the intended scope of disclosures required by ASU No. 2011-11. These ASUs are effective for interim and annual reporting periods beginning on or after January 1, 2013. The Fund believes the adoption of these ASUs will not have a material impact on its financial statements.
13. SUBSEQUENT EVENTS
The Fund has evaluated subsequent events through the issuance of the financial statements and determined that no events have occurred that require disclosure other than those already disclosed in the financial statements.
| | |
ABBREVIATIONS | | |
| Counterparty | | Selected Portfolio |
| | |
| BOFA - Bank of America Corp. | | ADR - American Depositary Receipt |
| BZWS - Barclays Bank PLC | | REIT - Real Estate Investment Trust |
| DBAB - Deutsche Bank AG | | |
| FBCO - Credit Suisse Group AG | | |
| HSBC - HSBC Bank USA, NA | | |
| SCBT - Standard Chartered Bank | | |
| SSBT - State Street Bank and Trust Co. | | |
MI-27
Franklin Templeton Variable Insurance Products Trust
Mutual International Securities Fund
Report of Independent Registered Public Accounting Firm
To the Board of Trustees and Shareholders of Franklin Templeton Variable Insurance Products Trust
In our opinion, the accompanying statement of assets and liabilities, including the statement of investments, and the related statements of operations and of changes in net assets and the financial highlights present fairly, in all material respects, the financial position of Mutual International Securities Fund (the “Fund”) at December 31, 2012, the results of its operations for the year then ended, the changes in its net assets for each of the two years in the period then ended and the financial highlights for the periods presented, in conformity with accounting principles generally accepted in the United States of America. These financial statements and financial highlights (hereafter referred to as “financial statements”) are the responsibility of the Fund’s management. Our responsibility is to express an opinion on these financial statements based on our audits. We conducted our audits of these financial statements in accordance with the standards of the Public Company Accounting Oversight Board (United States). Those standards require that we plan and perform the audit to obtain reasonable assurance about whether the financial statements are free of material misstatement. An audit includes examining, on a test basis, evidence supporting the amounts and disclosures in the financial statements, assessing the accounting principles used and significant estimates made by management, and evaluating the overall financial statement presentation. We believe that our audits, which included confirmation of securities at December 31, 2012 by correspondence with the custodian and brokers, provides a reasonable basis for our opinion.
PricewaterhouseCoopers LLP
San Francisco, California
February 15, 2013
MI-28
Franklin Templeton Variable Insurance Products Trust
Tax Information (unaudited)
Mutual International Securities Fund
Under Section 852(b)(3)(C) of the Internal Revenue Code (Code), the Fund hereby reports the maximum amount allowable but no less than $31,234 as a long term capital gain dividend for the fiscal year ended December 31, 2012.
At December 31, 2012, more than 50% of the Fund’s total assets were invested in securities of foreign issuers. In most instances, foreign taxes were withheld from income paid to the Fund on these investments. As shown in the table below, the Fund hereby reports to shareholders the foreign source income and foreign taxes paid, pursuant to Section 853 of the Code. This written statement will allow shareholders of record on December 13, 2012, to treat their proportionate share of foreign taxes paid by the Fund as having been paid directly by them. The shareholder shall consider these amounts as foreign taxes paid in the tax year in which they receive the Fund distribution.
The following table provides a detailed analysis of foreign tax paid, and foreign source income as reported by the Fund, to Class 2, and Class 4 shareholders or record.
| | | | | | | | |
| Class | | Foreign Tax Paid
Per Share | | | Foreign Source Income
Per Share | |
Class 2 | | $ | 0.0129 | | | $ | 0.2413 | |
Class 4 | | $ | 0.0129 | | | $ | 0.2315 | |
Foreign Tax Paid Per Share (Column 1) is the amount per share available to you, as a tax credit (assuming you held your shares in the Fund for a minimum of 16 days during the 31-day period beginning 15 days before the ex-dividend date of the Fund’s distribution to which the foreign taxes relate), or, as a tax deduction.
Foreign Source Income Per Share (Column 2) is the amount per share of income dividends attributable to foreign securities held by the Fund, plus any foreign taxes withheld on these dividends.
MI-29
MUTUAL SHARES SECURITIES FUND
This annual report for Mutual Shares Securities Fund covers the fiscal year ended December 31, 2012.
Performance Summary as of 12/31/12
Average annual total return of Class 2 shares represents the average annual change in value, assuming reinvestment of dividends and capital gains. Average returns smooth out variations in returns, which can be significant; they are not the same as year-by-year results.
Periods ended 12/31/12
| | | | | | | | | | | | |
| | | 1-Year | | | 5-Year | | | 10-Year | |
Average Annual Total Return | | | +14.24% | | | | -0.07% | | | | +6.64% | |
Total Return Index Comparison for a Hypothetical $10,000 Investment (1/1/03–12/31/12)
The graph below shows the change in value of a hypothetical $10,000 investment in the Fund over the indicated period and includes reinvestment of any income or distributions. The Fund’s performance is compared to the performance of the Standard & Poor’s® 500 Index (S&P 500®). One cannot invest directly in an index, and an index is not representative of the Fund’s portfolio. Please see Important Notes to Performance Information preceding the Fund Summaries.
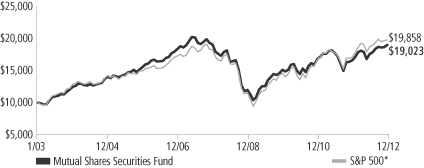
*Source: © 2013 Morningstar. Please see Index Descriptions following the Fund Summaries.
Mutual Shares Securities Fund – Class 2
Performance reflects the Fund’s Class 2 operating expenses, but does not include any contract fees, expenses or sales charges. If they had been included, performance would be lower. These charges and deductions, particularly for variable life policies, can have a significant effect on contract values and insurance benefits. See the contract prospectus for a complete description of these expenses, including sales charges.
Performance data represent past performance, which does not guarantee future results. Investment return and principal value will fluctuate, and you may have a gain or loss when you sell your shares. Current performance may differ from figures shown.
MS-1
Fund Goals and Main Investments: Mutual Shares Securities Fund seeks capital appreciation, with income as a secondary goal. Under normal market conditions, the Fund invests primarily in U.S. and foreign equity securities that the investment manager believes are undervalued.
Performance Overview
You can find the Fund’s one-year total return in the Performance Summary. The Fund underperformed its benchmark, the S&P 500, which delivered a +16.00% total return for the period under review.1
Economic and Market Overview
Headwinds to global growth negatively affected most world regions during 2012, including recently resilient emerging markets, and the International Monetary Fund lowered its global growth outlook. However, the slowdown appeared less severe than expected in developed markets such as Germany and the U.S. Several major governments intervened to support their countries’ currencies, liquidity and growth rates. European Central Bank (ECB) President Mario Draghi declared, “the ECB is ready to do whatever it takes to preserve the euro.” The U.S. Federal Reserve Board announced additional rounds of quantitative easing and extended its strategy designed to lower interest rates. China lowered borrowing costs for the first time in several years, and Japan’s central bank extended its quantitative easing program.
The U.S. economy grew moderately in 2012, supported by positive construction, housing and labor market trends. Consumer spending and personal income levels climbed, and inflation was generally mild with the exception of energy and food prices. Consumer sentiment rose to a five-year high, although potential U.S. tax hikes and spending cuts scheduled to take effect in 2013 dampened confidence near year-end. Just after year-end, Congress passed compromise legislation that preserved lower income tax rates for most U.S. households and delayed far-reaching federal spending cuts.
Stock markets were volatile with periodic downturns primarily attributable to concerns about slowing global economic growth, European sovereign debt and U.S. fiscal negotiations. As Europe’s leadership took measures to address the region’s fiscal debt crisis, investor attention shifted to the U.S. election and budget negotiations. Despite adversity
1. Source: © 2013 Morningstar. One cannot invest directly in an index, and an index is not representative of the Fund’s portfolio. Please see Index Descriptions following the Fund Summaries.
Fund Risks: All investments involve risks, including possible loss of principal. Stock prices fluctuate, sometimes rapidly and dramatically, due to factors affecting individual companies, particular industries or sectors, or general market conditions. Value securities may not increase in price as anticipated or may decline further in value. The risks of investment in foreign securities include currency fluctuations and economic and political uncertainty. Investments in companies engaged in mergers, reorganizations or liquidations involve special risks as pending deals may not be completed on time or on favorable terms, as well as lower rated bonds, which entail higher credit risk. The Fund is actively managed but there is no guarantee that the manager’s investment decisions will produce the desired results. The Fund’s prospectus also includes a description of the main investment risks.
MS-2
and uncertainty in 2012, investors seemed to regain confidence in the latter half of the year and U.S. stocks, as measured by the S&P 500, as well as global developed stocks, as measured by the MSCI World Index, made solid 12-month gains.2
Investment Strategy
At Mutual Series, we are committed to our distinctive value approach to investing. Our major investment strategy is investing in undervalued stocks. When selecting undervalued equities, we are attracted to fundamentally strong companies with healthy balance sheets, high-quality assets, substantial free cash flow and shareholder-oriented management teams and whose stocks are trading at discounts to our assessment of the companies’ intrinsic or business value. We also look for asset rich companies whose shares may be trading at depressed levels due to concerns over short-term earnings disappointments, litigation, management strategy or other perceived negatives. While the vast majority of our undervalued equity investments are made in publicly traded companies globally, we may invest occasionally in privately held companies as well.
We complement this more traditional investment strategy with two others. One is distressed investing, which is complex and can take many forms. The most common distressed investment the Fund undertakes is the purchase of financially troubled or bankrupt companies’ debt at a substantial discount to face value. After the financially distressed company is reorganized, often in bankruptcy court, the old debt is typically replaced with new securities issued by the financially stronger company.
The other piece of our investment strategy is participating in arbitrage situations, another highly specialized field. When companies announce proposed mergers or takeovers, commonly referred to as “deals,” the target company may trade at a discount to the bid it ultimately accepts. One form of arbitrage involves purchasing the target company’s stock when it is trading below the value we believe it would receive in a deal. In keeping with our commitment to a relatively conservative investment approach, we typically focus our arbitrage efforts on announced deals, and eschew rumored deals or other situations we consider relatively risky.
In addition, it is our practice to hedge the Fund’s currency exposure when we deem it advantageous for our shareholders.
2. Please see Index Descriptions following the Fund Summaries.
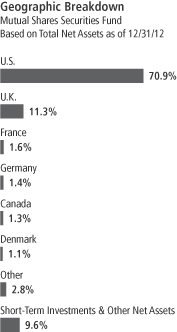
MS-3
Manager’s Discussion
During the year under review, several holdings supported performance. Top contributors included Time Warner Cable (TWC), media conglomerate News Corp. and International Paper.
Despite a small disappointment in the company’s fiscal third-quarter results, the Fund’s investment in TWC was a strong contributor to full-year performance. During the year, TWC raised its quarterly dividend payment and share buyback authorization. The high operating leverage we see as inherent to the company’s business model and accretion from its share buyback program led us to assign an attractive valuation to TWC shares. In addition, the stock offered a healthy dividend yield.
Shares of diversified global media company News Corp. began a strong rally in June, spurred by investors’ approval of the company’s plan to split its publishing assets and its television and entertainment assets into two distinct companies. We viewed the split favorably, but the breakup did not alter our estimation of the company’s fair value.
Solid 2012 operating performance and realized price increases in its containerboard business led shares of International Paper, one of the world’s largest pulp and paper companies by revenue, to perform strongly. The company’s ongoing reduction of debt, particularly that related to its February acquisition of containerboard producer Temple-Inland, has improved what we believe was an already solid balance sheet. In our view, healthy fundamentals, strong free cash flow generation and a commitment by the company to raise its quarterly dividend over time made International Paper an attractive investment.
Some of the Fund’s investments lost value and negatively affected the Fund’s performance during the year. Key detractors included energy company Exelon, document technology firm Xerox and mobile telephony operator Vodafone Group.
Exelon hindered Fund performance as a challenging pricing environment, unseasonably warm weather and storm costs throughout the year negatively affected operations. Despite the short-term challenges, we saw attractive potential in Exelon, whose assets include clean merchant power generation and regulated entities in the Midwest, eastern Pennsylvania and the District of Columbia. Exelon stock also offered the Fund an attractive dividend yield during the year.
Although Xerox’s headline results were not much different than anticipated, investors responded negatively to some changes in the company’s
Top 10 Sectors/Industries
Mutual Shares Securities Fund
Based on Equity Securities 12/31/12
| | | | |
| | | % of Total
Net Assets | |
| Oil, Gas & Consumable Fuels | | | 9.8% | |
| Media | | | 7.7% | |
| Insurance | | | 7.2% | |
| Tobacco | | | 6.4% | |
| Pharmaceuticals | | | 5.4% | |
| Food & Staples Retailing | | | 4.8% | |
| Commercial Banks | | | 3.3% | |
| Software | | | 3.1% | |
| Diversified Financial Services | | | 3.1% | |
| Paper & Forest Products | | | 2.8% | |
MS-4
outlook disclosed during the year. Over the course of 2012, the company reported it had failed to meet its target profit margin and reduced its “steady state” margin rate. In addition, concerns about the global economy’s health weighed on shares during the second half of the year. The company’s long-term strategy focuses on growth in its services division, stabilization of margins, cash flow and capital allocation.
Vodafone Group is a global mobile telecommunications company that provides a range of services, including voice and data communications. The company struggled in 2012 due to economic weakness in its southern European markets, regulatory headwinds in the eurozone and India, and cannibalization of traditional voice services by data applications. However, we saw several potential catalysts, including improving economic conditions in Europe, better revenue per customer as a critical mass of customers migrate to data-oriented plans, and a potentially increased dividend payment from its 45% stake in Verizon Wireless. At period-end, we also saw potential for an eventual initial public offering of Vodafone’s India business.
During the year, the Fund held currency forwards to somewhat hedge the currency risk of the Fund’s non-U.S. dollar investments. The hedges had a minor negative impact on the Fund’s performance during the period.
Thank you for your participation in Mutual Shares Securities Fund. We look forward to serving your future investment needs.
The foregoing information reflects our analysis, opinions and portfolio holdings as of December 31, 2012, the end of the reporting period. The way we implement our main investment strategies and the resulting portfolio holdings may change depending on factors such as market and economic conditions. These opinions may not be relied upon as investment advice or an offer for a particular security. The information is not a complete analysis of every aspect of any market, country, industry, security or the Fund. Statements of fact are from sources considered reliable, but the investment manager makes no representation or warranty as to their completeness or accuracy. Although historical performance is no guarantee of future results, these insights may help you understand our investment management philosophy.
Top 10 Equity Holdings
Mutual Shares Securities Fund
12/31/12
| | | | |
Company
Sector/Industry,
Country | | % of Total
Net Assets | |
| Merck & Co. Inc. | | | 2.8% | |
| Pharmaceuticals, U.S. | | | | |
| CVS Caremark Corp. | | | 2.1% | |
| Food & Staples Retailing, U.S. | |
| British American Tobacco PLC | | | 2.1% | |
| Tobacco, U.K. | | | | |
| Microsoft Corp. | | | 2.0% | |
| Software, U.S. | | | | |
| Time Warner Cable Inc. | | | 1.9% | |
| Media, U.S. | | | | |
| Marathon Oil Corp. | | | 1.8% | |
Oil, Gas & Consumable Fuels,
U.S. | |
| American International Group Inc. | | | 1.8% | |
| Insurance, U.S. | | | | |
| Royal Dutch Shell PLC, A | | | 1.8% | |
Oil, Gas & Consumable Fuels,
U.K. | |
| Imperial Tobacco Group PLC | | | 1.7% | |
| Tobacco, U.K. | | | | |
| Vodafone Group PLC | | | 1.7% | |
Wireless Telecommunication
Services, U.K. | |
The dollar value, number of shares or principal amount, and names of all portfolio holdings are listed in the Fund’s Statement of Investments.
MS-5
Fund Expenses
As an investor in a variable insurance contract (Contract) that indirectly provides for investment in an underlying mutual fund, you can incur transaction and/or ongoing expenses at both the Fund level and the Contract level.
| • | | Transaction expenses can include sales charges (loads) on purchases, redemption fees, surrender fees, transfer fees and premium taxes. |
| • | | Ongoing expenses can include management fees, distribution and service (12b-1) fees, contract fees, annual maintenance fees, mortality and expense risk fees and other fees and expenses. All mutual funds and Contracts have some types of ongoing expenses. |
The expenses shown in the table are meant to highlight ongoing expenses at the Fund level only and do not include ongoing expenses at the Contract level, or transaction expenses at either the Fund or Contract level. While the Fund does not have transaction expenses, if the transaction and ongoing expenses at the Contract level were included, the expenses shown below would be higher. You should consult your Contract prospectus or disclosure document for more information.
The table shows Fund-level ongoing expenses and can help you understand these expenses and compare them with those of other mutual funds offered through the Contract. The table assumes a $1,000 investment held for the six months indicated. Please refer to the Fund prospectus for additional information on operating expenses.
Actual Fund Expenses
The first line (Actual) of the table provides actual account values and expenses. The “Ending Account Value” is derived from the Fund’s actual return, which includes the effect of ongoing Fund expenses, but does not include the effect of ongoing Contract expenses.
You can estimate the Fund-level expenses you incurred during the period by following these steps. Of course, your account value and expenses will differ from those in this illustration:
| 1. | Divide your account value by $1,000. |
If an account had an $8,600 value, then $8,600 ÷ $1,000 = 8.6.
| 2. | Multiply the result by the number under the heading “Fund-Level Expenses Incurred During Period.” |
If Fund-Level Expenses Incurred During Period were $7.50, then 8.6 x $7.50 = $64.50.
In this illustration, the estimated expenses incurred this period at the Fund level are $64.50.
Mutual Shares Securities Fund – Class 2
MS-6
Hypothetical Example for Comparison with Other Mutual Funds
Information in the second line (Hypothetical) of the table can help you compare ongoing expenses of the Fund with those of other mutual funds offered through the Contract. This information may not be used to estimate the actual ending account balance or expenses you incurred during the period. The hypothetical “Ending Account Value” is based on the Fund’s actual expense ratio and an assumed 5% annual rate of return before expenses, which does not represent the Fund’s actual return. The figure under the heading “Fund-Level Expenses Incurred During Period” shows the hypothetical expenses your account would have incurred under this scenario. You can compare this figure with the 5% hypothetical examples that appear in shareholder reports of other funds offered through a Contract.
| | | | | | | | | | | | |
| Class 2 | | Beginning
Account
Value 7/1/12 | | | Ending
Account
Value 12/31/12 | | | Fund-Level
Expenses Incurred
During Period*
7/1/12–12/31/12 | |
Actual | | $ | 1,000 | | | $ | 1,079.30 | | | $ | 5.02 | |
Hypothetical (5% return before
expenses) | | $ | 1,000 | | | $ | 1,020.31 | | | $ | 4.88 | |
*Expenses are calculated using the most recent six-month annualized expense ratio for the Fund’s Class 2 shares (0.96%), which does not include any ongoing expenses of the Contract for which the Fund is an investment option, multiplied by the average account value over the period, multiplied by 184/366 to reflect the one-half year period.
MS-7
Franklin Templeton Variable Insurance Products Trust
Financial Highlights
Mutual Shares Securities Fund
| | | | | | | | | | | | | | | | | | | | |
| | | Year Ended December 31, | |
| Class 1 | | 2012 | | | 2011 | | | 2010 | | | 2009 | | | 2008 | |
| | | | |
Per share operating performance | | | | | | | | | | | | | | | | | | | | |
(for a share outstanding throughout the year) | | | | | | | | | | | | | | | | | | | | |
Net asset value, beginning of year | | $ | 15.57 | | | $ | 16.14 | | | $ | 14.75 | | | $ | 11.92 | | | $ | 20.42 | |
| | | | |
Income from investment operationsa: | | | | | | | | | | | | | | | | | | | | |
Net investment incomeb | | | 0.35 | | | | 0.38 | c | | | 0.40 | d | | | 0.23 | e | | | 0.34 | |
Net realized and unrealized gains (losses) | | | 1.92 | | | | (0.53 | ) | | | 1.27 | | | | 2.89 | | | | (7.54 | ) |
| | | | |
Total from investment operations | | | 2.27 | | | | (0.15 | ) | | | 1.67 | | | | 3.12 | | | | (7.20 | ) |
| | | | |
Less distributions from: | | | | | | | | | | | | | | | | | | | | |
Net investment income | | | (0.39 | ) | | | (0.42 | ) | | | (0.28 | ) | | | (0.29 | ) | | | (0.57 | ) |
Net realized gains | | | — | | | | — | | | | — | | | | — | | | | (0.73 | ) |
| | | | |
Total distributions | | | (0.39 | ) | | | (0.42 | ) | | | (0.28 | ) | | | (0.29 | ) | | | (1.30 | ) |
| | | | |
Net asset value, end of year | | $ | 17.45 | | | $ | 15.57 | | | $ | 16.14 | | | $ | 14.75 | | | $ | 11.92 | |
| | | | |
| | | | | |
Total returnf | | | 14.61% | | | | (0.79)% | | | | 11.47% | | | | 26.35% | | | | (36.93)% | |
Ratios to average net assets | | | | | | | | | | | | | | | | | | | | |
Expensesg | | | 0.71% | | | | 0.73% | h | | | 0.74% | h | | | 0.78% | h | | | 0.73% | h |
Expenses incurred in connection with securities sold short | | | —% | i | | | —% | i | | | 0.02% | | | | 0.06% | | | | —% | i |
Net investment income | | | 2.06% | | | | 2.28% | c | | | 2.66% | d | | | 1.85% | e | | | 2.16% | |
| | | | | |
Supplemental data | | | | | | | | | | | | | | | | | | | | |
Net assets, end of year (000’s) | | $ | 449,343 | | | $ | 1,170,781 | | | $ | 1,301,520 | | | $ | 767,553 | | | $ | 319,703 | |
Portfolio turnover rate | | | 34.07% | j | | | 41.02% | | | | 32.05% | | | | 49.33% | | | | 44.11% | |
aThe amount shown for a share outstanding throughout the period may not correlate with the Statement of Operations for the period due to the timing of sales and repurchases of the Fund shares in relation to income earned and/or fluctuating market value of the investments of the Fund.
bBased on average daily shares outstanding.
cNet investment income per share includes approximately $0.02 per share related to interest income received that had previously been deemed uncollectible. Excluding this amount, the ratio of net investment income to average net assets would have been 2.14%.
dNet investment income per share includes approximately $0.11 per share received in the form of a special dividend paid in connection with a corporate real estate investment trust (REIT) conversion. Excluding this non-recurring amount, the ratio of the net investment income to average net assets would have been 1.93%.
eNet investment income per share includes approximately $(0.03) per share related to an adjustment for uncollectible interest. Excluding the effect of this adjustment, the ratio of net investment income to average net assets would have been 2.08%.
fTotal return does not include fees, charges or expenses imposed by the variable annuity and life insurance contracts for which the Franklin Templeton Variable Insurance Products Trust serves as an underlying investment vehicle.
gIncludes dividend expense on securities sold short and security borrowing fees, if any. See below for the ratios of such expenses to average net assets for the periods presented. See Note 1(d).
hBenefit of expense reduction rounds to less than 0.01%.
iRounds to less than 0.01%.
jExcludes the value of portfolio securities delivered as a result of redemption in-kind. See Note 13.
The accompanying notes are an integral part of these financial statements.
MS-8
Franklin Templeton Variable Insurance Products Trust
Financial Highlights (continued)
Mutual Shares Securities Fund
| | | | | | | | | | | | | | | | | | | | |
| | | Year Ended December 31, | |
| Class 2 | | 2012 | | | 2011 | | | 2010 | | | 2009 | | | 2008 | |
| | | | |
Per share operating performance | | | | | | | | | | | | | | | | | | | | |
(for a share outstanding throughout the year) | | | | | | | | | | | | | | | | | | | | |
Net asset value, beginning of year | | $ | 15.38 | | | $ | 15.95 | | | $ | 14.58 | | | $ | 11.78 | | | $ | 20.19 | |
| | | | |
Income from investment operationsa: | | | | | | | | | | | | | | | | | | | | |
Net investment incomeb | | | 0.30 | | | | 0.32 | c | | | 0.36 | d | | | 0.20 | e | | | 0.32 | |
Net realized and unrealized gains (losses) | | | 1.90 | | | | (0.51 | ) | | | 1.25 | | | | 2.85 | | | | (7.49 | ) |
| | | | |
Total from investment operations | | | 2.20 | | | | (0.19 | ) | | | 1.61 | | | | 3.05 | | | | (7.17 | ) |
| | | | |
Less distributions from: | | | | | | | | | | | | | | | | | | | | |
Net investment income | | | (0.35 | ) | | | (0.38 | ) | | | (0.24 | ) | | | (0.25 | ) | | | (0.51 | ) |
Net realized gains | | | — | | | | — | | | | — | | | | — | | | | (0.73 | ) |
| | | | |
Total distributions | | | (0.35 | ) | | | (0.38 | ) | | | (0.24 | ) | | | (0.25 | ) | | | (1.24 | ) |
| | | | |
Net asset value, end of year | | $ | 17.23 | | | $ | 15.38 | | | $ | 15.95 | | | $ | 14.58 | | | $ | 11.78 | |
| | | | |
| | | | | |
Total returnf | | | 14.24% | | | | (1.04)% | | | | 11.19% | | | | 26.05% | | | | (37.11)% | |
Ratios to average net assets | | | | | | | | | | | | | | | | | | | | |
Expensesg | | | 0.96% | | | | 0.98% | h | | | 0.99% | h | | | 1.03% | h | | | 0.98% | h |
Expenses incurred in connection with securities sold short | | | —% | i | | | —% | i | | | 0.02% | | | | 0.06% | | | | —% | i |
Net investment income | | | 1.81% | | | | 2.03% | c | | | 2.41% | d | | | 1.60% | e | | | 1.91% | |
| | | | | |
Supplemental data | | | | | | | | | | | | | | | | | | | | |
Net assets, end of year (000’s) | | $ | 4,069,803 | | | $ | 3,913,220 | | | $ | 4,188,821 | | | $ | 3,953,435 | | | $ | 3,303,761 | |
Portfolio turnover rate | | | 34.07% | j | | | 41.02% | | | | 32.05% | | | | 49.33% | | | | 44.11% | |
aThe amount shown for a share outstanding throughout the period may not correlate with the Statement of Operations for the period due to the timing of sales and repurchases of the Fund shares in relation to income earned and/or fluctuating market value of the investments of the Fund.
bBased on average daily shares outstanding.
cNet investment income per share includes approximately $0.02 per share related to interest income received that had previously been deemed uncollectible. Excluding this amount, the ratio of net investment income to average net assets would have been 1.89%.
dNet investment income per share includes approximately $0.11 per share received in the form of a special dividend paid in connection with a corporate real estate investment trust (REIT) conversion. Excluding this non-recurring amount, the ratio of the net investment income to average net assets would have been 1.68%.
eNet investment income per share includes approximately $(0.03) per share related to an adjustment for uncollectible interest. Excluding the effect of this adjustment, the ratio of net investment income to average net assets would have been 1.83%.
fTotal return does not include fees, charges or expenses imposed by the variable annuity and life insurance contracts for which the Franklin Templeton Variable Insurance Products Trust serves as an underlying investment vehicle.
gIncludes dividend expense on securities sold short and security borrowing fees, if any. See below for the ratios of such expenses to average net assets for the periods presented. See Note 1(d).
hBenefit of expense reduction rounds to less than 0.01%.
iRounds to less than 0.01%.
jExcludes the value of portfolio securities delivered as a result of redemption in-kind. See Note 13.
The accompanying notes are an integral part of these financial statements.
MS-9
Franklin Templeton Variable Insurance Products Trust
Financial Highlights (continued)
Mutual Shares Securities Fund
| | | | | | | | | | | | | | | | | | | | |
| | | Year Ended December 31, | |
| Class 4 | | 2012 | | | 2011 | | | 2010 | | | 2009 | | | 2008a | |
| | | | |
Per share operating performance | | | | | | | | | | | | | | | | | | | | |
(for a share outstanding throughout the year) | | | | | | | | | | | | | | | | | | | | |
Net asset value, beginning of year | | $ | 15.45 | | | $ | 16.03 | | | $ | 14.66 | | | $ | 11.88 | | | $ | 18.91 | |
| | | | |
Income from investment operationsb: | | | | | | | | | | | | | | | | | | | | |
Net investment incomec | | | 0.28 | | | | 0.30 | d | | | 0.35 | e | | | 0.19 | f | | | 0.17 | |
Net realized and unrealized gains (losses) | | | 1.91 | | | | (0.51 | ) | | | 1.26 | | | | 2.87 | | | | (5.90 | ) |
| | | | |
Total from investment operations | | | 2.19 | | | | (0.21 | ) | | | 1.61 | | | | 3.06 | | | | (5.73 | ) |
| | | | |
Less distributions from: | | | | | | | | | | | | | | | | | | | | |
Net investment income | | | (0.33 | ) | | | (0.37 | ) | | | (0.24 | ) | | | (0.28 | ) | | | (0.57 | ) |
Net realized gains | | | — | | | | — | | | | — | | | | — | | | | (0.73 | ) |
| | | | |
Total distributions | | | (0.33 | ) | | | (0.37 | ) | | | (0.24 | ) | | | (0.28 | ) | | | (1.30 | ) |
| | | | |
Net asset value, end of year | | $ | 17.31 | | | $ | 15.45 | | | $ | 16.03 | | | $ | 14.66 | | | $ | 11.88 | |
| | | | |
| | | | | |
Total returng | | | 14.20% | | | | (1.12)% | | | | 11.06% | | | | 25.94% | | | | (32.12)% | |
Ratios to average net assetsh | | | | | | | | | | | | | | | | | | | | |
Expensesi | | | 1.06% | | | | 1.08% | j | | | 1.09% | j | | | 1.13% | j | | | 1.08% | j |
Expenses incurred in connection with securities sold short | | | —% | k | | | —% | k | | | 0.02% | | | | 0.06% | | | | —% | k |
Net investment income | | | 1.71% | | | | 1.93% | d | | | 2.31% | e | | | 1.50% | f | | | 1.81% | |
| | | | | |
Supplemental data | | | | | | | | | | | | | | | | | | | | |
Net assets, end of year (000’s) | | $ | 165,015 | | | $ | 162,049 | | | $ | 167,274 | | | $ | 141,446 | | | $ | 57,266 | |
Portfolio turnover rate | | | 34.07% | l | | | 41.02% | | | | 32.05% | | | | 49.33% | | | | 44.11% | |
aFor the period February 29, 2008 (effective date) to December 31, 2008.
bThe amount shown for a share outstanding throughout the period may not correlate with the Statement of Operations for the period due to the timing of sales and repurchases of the Fund shares in relation to income earned and/or fluctuating market value of the investments of the Fund.
cBased on average daily shares outstanding.
dNet investment income per share includes approximately $0.02 per share related to interest income received that had previously been deemed uncollectible. Excluding this amount, the ratio of net investment income to average net assets would have been 1.79%.
eNet investment income per share includes approximately $0.11 per share received in the form of a special dividend paid in connection with a corporate real estate investment trust (REIT) conversion. Excluding this non-recurring amount, the ratio of the net investment income to average net assets would have been 1.58%.
fNet investment income per share includes approximately $(0.03) per share related to an adjustment for uncollectible interest. Excluding the effect of this adjustment, the ratio of net investment income to average net assets would have been 1.73%.
gTotal return does not include fees, charges or expenses imposed by the variable annuity and life insurance contracts for which the Franklin Templeton Variable Insurance Products Trust serves as an underlying investment vehicle. Total return is not annualized for periods less than one year.
hRatios are annualized for periods less than one year.
iIncludes dividend expense on securities sold short and security borrowing fees, if any. See below for the ratios of such expenses to average net assets for the periods presented. See Note 1(d).
jBenefit of expense reduction rounds to less than 0.01%.
kRounds to less than 0.01%.
lExcludes the value of portfolio securities delivered as a result of redemption in-kind. See Note 13.
The accompanying notes are an integral part of these financial statements.
MS-10
Franklin Templeton Variable Insurance Products Trust
Statement of Investments, December 31, 2012
| | | | | | | | | | |
| Mutual Shares Securities Fund | | Country | | Shares | | | Value | |
Common Stocks and Other Equity Interests 84.6% | | | | | | | | | | |
Aerospace & Defense 1.4% | | | | | | | | | | |
a GenCorp Inc. | | United States | | | 193,253 | | | $ | 1,768,265 | |
Huntington Ingalls Industries Inc. | | United States | | | 693,088 | | | | 30,038,434 | |
Raytheon Co. | | United States | | | 560,221 | | | | 32,246,321 | |
| | | | | | | | | | |
| | | | | | | | | 64,053,020 | |
| | | | | | | | | | |
Auto Components 0.1% | | | | | | | | | | |
a,b International Automotive Components Group Brazil LLC | | Brazil | | | 1,730,515 | | | | 271,812 | |
a,b,c International Automotive Components Group North America, LLC | | United States | | | 11,387,027 | | | | 5,822,073 | |
| | | | | | | | | | |
| | | | | | | | | 6,093,885 | |
| | | | | | | | | | |
Automobiles 1.0% | | | | | | | | | | |
a General Motors Co. | | United States | | | 1,593,240 | | | | 45,933,109 | |
| | | | | | | | | | |
Beverages 2.6% | | | | | | | | | | |
Coca-Cola Enterprises Inc. | | United Kingdom | | | 1,053,161 | | | | 33,416,799 | |
Dr. Pepper Snapple Group Inc. | | United States | | | 842,372 | | | | 37,215,995 | |
Pernod Ricard SA | | France | | | 435,995 | | | | 50,571,103 | |
| | | | | | | | | | |
| | | | | | | | | 121,203,897 | |
| | | | | | | | | | |
Building Products 0.7% | | | | | | | | | | |
aOwens Corning Inc. | | United States | | | 915,513 | | | | 33,864,826 | |
| | | | | | | | | | |
Capital Markets 1.0% | | | | | | | | | | |
Morgan Stanley | | United States | | | 2,407,958 | | | | 46,040,157 | |
| | | | | | | | | | |
Chemicals 0.7% | | | | | | | | | | |
a,d,e Dow Corning Corp., Contingent Distribution | | United States | | | 100,000 | | | | — | |
Linde AG | | Germany | | | 185,514 | | | | 32,446,717 | |
| | | | | | | | | | |
| | | | | | | | | 32,446,717 | |
| | | | | | | | | | |
Commercial Banks 3.3% | | | | | | | | | | |
a,b Bond Street Holdings LLC, A, 144A | | United States | | | 493,723 | | | | 9,619,378 | |
aCIT Group Inc. | | United States | | | 673,253 | | | | 26,014,496 | |
bFirst Southern Bancorp Inc. | | United States | | | 140,952 | | | | 721,392 | |
aGuaranty Bancorp | | United States | | | 1,047,916 | | | | 2,043,436 | |
KB Financial Group Inc. | | South Korea | | | 410,501 | | | | 14,627,118 | |
PNC Financial Services Group Inc. | | United States | | | 1,206,969 | | | | 70,378,363 | |
State Bank Financial Corp. | | United States | | | 352,200 | | | | 5,592,936 | |
Wells Fargo & Co. | | United States | | | 774,140 | | | | 26,460,105 | |
| | | | | | | | | | |
| | | | | | | | | 155,457,224 | |
| | | | | | | | | | |
Communications Equipment 1.5% | | | | | | | | | | |
Cisco Systems Inc. | | United States | | | 2,924,260 | | | | 57,461,709 | |
a,f Research In Motion Ltd. | | Canada | | | 970,353 | | | | 11,527,794 | |
| | | | | | | | | | |
| | | | | | | | | 68,989,503 | |
| | | | | | | | | | |
Computers & Peripherals 0.6% | | | | | | | | | | |
Hewlett-Packard Co. | | United States | | | 1,962,600 | | | | 27,967,050 | |
| | | | | | | | | | |
Consumer Finance 0.0%† | | | | | | | | | | |
aComdisco Holding Co. Inc. | | United States | | | 180 | | | | 898 | |
| | | | | | | | | | |
Diversified Financial Services 3.1% | | | | | | | | | | |
Citigroup Inc. | | United States | | | 1,230,189 | | | | 48,666,277 | |
aING Groep NV | | Netherlands | | | 3,729,845 | | | | 35,416,588 | |
JPMorgan Chase & Co. | | United States | | | 777,390 | | | | 34,181,838 | |
NYSE Euronext | | United States | | | 802,820 | | | | 25,320,943 | |
| | | | | | | | | | |
| | | | | | | | | 143,585,646 | |
| | | | | | | | | | |
MS-11
Franklin Templeton Variable Insurance Products Trust
Statement of Investments, December 31, 2012 (continued)
| | | | | | | | | | |
| Mutual Shares Securities Fund | | Country | | Shares | | | Value | |
Common Stocks and Other Equity Interests (continued) | | | | | | | | | | |
Diversified Telecommunication Services 0.0%† | | | | | | | | | | |
a,d,e Global Crossing Holdings Ltd., Contingent Distribution | | United States | | | 9,005,048 | | | $ | — | |
a,d,e Marconi Corp., Contingent Distribution | | United Kingdom | | | 9,945,700 | | | | 186,307 | |
| | | | | | | | | | |
| | | | | | | | | 186,307 | |
| | | | | | | | | | |
Electric Utilities 1.0% | | | | | | | | | | |
a,b AET&D Holdings No. 1 Pty. Ltd. | | Australia | | | 4,709,226 | | | | — | |
Entergy Corp. | | United States | | | 291,000 | | | | 18,551,250 | |
Exelon Corp. | | United States | | | 1,008,329 | | | | 29,987,704 | |
| | | | | | | | | | |
| | | | | | | | | 48,538,954 | |
| | | | | | | | | | |
Electronic Equipment, Instruments & Components 1.0% | | | | | | | | | | |
TE Connectivity Ltd. | | United States | | | 1,213,572 | | | | 45,047,793 | |
| | | | | | | | | | |
Energy Equipment & Services 2.3% | | | | | | | | | | |
Baker Hughes Inc. | | United States | | | 1,146,768 | | | | 46,834,005 | |
Ensco PLC, A | | United States | | | 364,874 | | | | 21,629,731 | |
Transocean Ltd. | | United States | | | 922,517 | | | | 41,190,384 | |
| | | | | | | | | | |
| | | | | | | | | 109,654,120 | |
| | | | | | | | | | |
Food & Staples Retailing 4.8% | | | | | | | | | | |
CVS Caremark Corp. | | United States | | | 2,060,303 | | | | 99,615,650 | |
The Kroger Co. | | United States | | | 2,331,072 | | | | 60,654,493 | |
Wal-Mart Stores Inc. | | United States | | | 340,432 | | | | 23,227,675 | |
Walgreen Co. | | United States | | | 1,144,345 | | | | 42,352,209 | |
| | | | | | | | | | |
| | | | | | | | | 225,850,027 | |
| | | | | | | | | | |
Food Products 2.4% | | | | | | | | | | |
General Mills Inc. | | United States | | | 1,076,844 | | | | 43,515,266 | |
Kraft Foods Group Inc. | | United States | | | 396,253 | | | | 18,017,624 | |
Mondelez International Inc., A | | United States | | | 2,000,888 | | | | 50,962,617 | |
| | | | | | | | | | |
| | | | | | | | | 112,495,507 | |
| | | | | | | | | | |
Health Care Equipment & Supplies 2.4% | | | | | | | | | | |
aBoston Scientific Corp. | | United States | | | 4,849,690 | | | | 27,788,724 | |
Medtronic Inc. | | United States | | | 1,625,122 | | | | 66,662,504 | |
Stryker Corp. | | United States | | | 298,778 | | | | 16,379,010 | |
| | | | | | | | | | |
| | | | | | | | | 110,830,238 | |
| | | | | | | | | | |
Health Care Providers & Services 2.3% | | | | | | | | | | |
Cigna Corp. | | United States | | | 1,210,344 | | | | 64,704,990 | |
Community Health Systems Inc. | | United States | | | 401,946 | | | | 12,355,820 | |
WellPoint Inc. | | United States | | | 533,668 | | | | 32,511,055 | |
| | | | | | | | | | |
| | | | | | | | | 109,571,865 | |
| | | | | | | | | | |
Independent Power Producers & Energy Traders 0.8% | | | | | | | | | | |
NRG Energy Inc. | | United States | | | 1,578,940 | | | | 36,299,831 | |
| | | | | | | | | | |
Insurance 7.2% | | | | | | | | | | |
ACE Ltd. | | United States | | | 826,915 | | | | 65,987,817 | |
aAlleghany Corp. | | United States | | | 137,948 | | | | 46,270,518 | |
aAmerican International Group Inc. | | United States | | | 2,406,026 | | | | 84,932,718 | |
CNO Financial Group Inc. | | United States | | | 784,849 | | | | 7,322,641 | |
MetLife Inc. | | United States | | | 1,253,183 | | | | 41,279,848 | |
a,b Olympus Re Holdings Ltd. | | United States | | | 16,280 | | | | — | |
White Mountains Insurance Group Ltd. | | United States | | | 114,635 | | | | 59,037,025 | |
MS-12
Franklin Templeton Variable Insurance Products Trust
Statement of Investments, December 31, 2012 (continued)
| | | | | | | | | | |
| Mutual Shares Securities Fund | | Country | | Shares | | | Value | |
Common Stocks and Other Equity Interests (continued) | | | | | | | | | | |
Insurance (continued) | | | | | | | | | | |
Zurich Insurance Group AG | | Switzerland | | | 120,520 | | | $ | 32,047,379 | |
| | | | | | | | | | |
| | | | | | | | | 336,877,946 | |
| | | | | | | | | | |
Internet Software & Services 0.8% | | | | | | | | | | |
aGoogle Inc., A | | United States | | | 54,440 | | | | 38,618,103 | |
| | | | | | | | | | |
Machinery 1.4% | | | | | | | | | | |
aFederal Signal Corp. | | United States | | | 757,221 | | | | 5,762,452 | |
aOshkosh Corp. | | United States | | | 893,790 | | | | 26,500,873 | |
Stanley Black & Decker Inc. | | United States | | | 431,344 | | | | 31,906,516 | |
| | | | | | | | | | |
| | | | | | | | | 64,169,841 | |
| | | | | | | | | | |
Marine 1.1% | | | | | | | | | | |
A.P. Moller - Maersk AS, B | | Denmark | | | 6,986 | | | | 52,640,129 | |
| | | | | | | | | | |
Media 7.7% | | | | | | | | | | |
British Sky Broadcasting Group PLC | | United Kingdom | | | 3,655,724 | | | | 46,092,989 | |
CBS Corp., B | | United States | | | 1,364,521 | | | | 51,920,024 | |
Comcast Corp., Special A | | United States | | | 278,448 | | | | 10,010,206 | |
News Corp., B | | United States | | | 2,989,599 | | | | 78,447,078 | |
Reed Elsevier PLC | | United Kingdom | | | 5,958,430 | | | | 62,879,259 | |
Time Warner Cable Inc. | | United States | | | 936,148 | | | | 90,984,224 | |
a,b Tribune Co., A | | United States | | | 303,318 | | | | 12,914,371 | |
a,b Tribune Co., B | | United States | | | 185,976 | | | | 7,918,300 | |
| | | | | | | | | | |
| | | | | | | | | 361,166,451 | |
| | | | | | | | | | |
Metals & Mining 0.7% | | | | | | | | | | |
ThyssenKrupp AG | | Germany | | | 1,353,984 | | | | 31,962,537 | |
| | | | | | | | | | |
Multi-Utilities 0.5% | | | | | | | | | | |
GDF Suez | | France | | | 1,153,081 | | | | 23,742,615 | |
| | | | | | | | | | |
Multiline Retail 0.7% | | | | | | | | | | |
Kohl’s Corp. | | United States | | | 734,130 | | | | 31,552,907 | |
| | | | | | | | | | |
Office Electronics 0.9% | | | | | | | | | | |
Xerox Corp. | | United States | | | 6,583,414 | | | | 44,898,883 | |
| | | | | | | | | | |
Oil, Gas & Consumable Fuels 9.8% | | | | | | | | | | |
Apache Corp. | | United States | | | 692,890 | | | | 54,391,865 | |
BP PLC | | United Kingdom | | | 5,472,712 | | | | 38,061,910 | |
CONSOL Energy Inc. | | United States | | | 1,558,530 | | | | 50,028,813 | |
Marathon Oil Corp. | | United States | | | 2,778,758 | | | | 85,196,720 | |
Marathon Petroleum Corp. | | United States | | | 144,179 | | | | 9,083,277 | |
Murphy Oil Corp. | | United States | | | 582,680 | | | | 34,698,594 | |
Nexen Inc. | | Canada | | | 1,880,647 | | | | 50,664,630 | |
aPlains Exploration & Production Co. | | United States | | | 1,013,070 | | | | 47,553,506 | |
Royal Dutch Shell PLC, A | | United Kingdom | | | 2,402,908 | | | | 82,686,570 | |
aWPX Energy Inc. | | United States | | | 378,074 | | | | 5,625,741 | |
| | | | | | | | | | |
| | | | | | | | | 457,991,626 | |
| | | | | | | | | | |
Paper & Forest Products 2.8% | | | | | | | | | | |
Domtar Corp. | | United States | | | 194,469 | | | | 16,242,051 | |
International Paper Co. | | United States | | | 1,923,766 | | | | 76,642,838 | |
MeadWestvaco Corp. | | United States | | | 1,211,429 | | | | 38,608,242 | |
| | | | | | | | | | |
| | | | | | | | | 131,493,131 | |
| | | | | | | | | | |
MS-13
Franklin Templeton Variable Insurance Products Trust
Statement of Investments, December 31, 2012 (continued)
| | | | | | | | | | |
| Mutual Shares Securities Fund | | Country | | Shares | | | Value | |
Common Stocks and Other Equity Interests (continued) | | | | | | | | | | |
Personal Products 0.6% | | | | | | | | | | |
Avon Products Inc. | | United States | | | 1,851,105 | | | $ | 26,581,868 | |
| | | | | | | | | | |
Pharmaceuticals 5.4% | | | | | | | | | | |
Eli Lilly & Co. | | United States | | | 402,228 | | | | 19,837,885 | |
aHospira Inc. | | United States | | | 587,508 | | | | 18,353,750 | |
Merck & Co. Inc. | | United States | | | 3,205,868 | | | | 131,248,236 | |
Pfizer Inc. | | United States | | | 2,251,654 | | | | 56,471,482 | |
Teva Pharmaceutical Industries Ltd., ADR | | Israel | | | 683,800 | | | | 25,533,092 | |
| | | | | | | | | | |
| | | | | | | | | 251,444,445 | |
| | | | | | | | | | |
Real Estate Investment Trusts (REITs) 0.3% | | | | | | | | | | |
Alexander’s Inc. | | United States | | | 40,126 | | | | 13,273,681 | |
| | | | | | | | | | |
Real Estate Management & Development 0.5% | | | | | | | | | | |
eCanary Wharf Group PLC | | United Kingdom | | | 1,535,898 | | | | 5,824,204 | |
aForestar Group Inc. | | United States | | | 261,053 | | | | 4,524,048 | |
a,b Realogy Holdings Corp. | | United States | | | 349,814 | | | | 13,944,286 | |
| | | | | | | | | | |
| | | | | | | | | 24,292,538 | |
| | | | | | | | | | |
Software 3.1% | | | | | | | | | | |
Microsoft Corp. | | United States | | | 3,574,577 | | | | 95,548,443 | |
Nintendo Co. Ltd. | | Japan | | | 100,823 | | | | 10,750,715 | |
aSymantec Corp. | | United States | | | 2,138,590 | | | | 40,226,878 | |
| | | | | | | | | | |
| | | | | | | | | 146,526,036 | |
| | | | | | | | | | |
Textiles, Apparel & Luxury Goods 0.0%† | | | | | | | | | | |
Compagnie Financiere Richemont SA | | Switzerland | | | 19,392 | | | | 1,512,633 | |
| | | | | | | | | | |
Tobacco 6.4% | | | | | | | | | | |
Altria Group Inc. | | United States | | | 1,455,038 | | | | 45,717,294 | |
British American Tobacco PLC | | United Kingdom | | | 1,919,527 | | | | 97,588,658 | |
Imperial Tobacco Group PLC | | United Kingdom | | | 2,089,977 | | | | 81,024,919 | |
Lorillard Inc. | | United States | | | 396,031 | | | | 46,204,937 | |
Philip Morris International Inc. | | United States | | | 344,790 | | | | 28,838,236 | |
| | | | | | | | | | |
| | | | | | | | | 299,374,044 | |
| | | | | | | | | | |
Wireless Telecommunication Services 1.7% | | | | | | | | | | |
Vodafone Group PLC | | United Kingdom | | | 31,622,627 | | | | 79,616,602 | |
| | | | | | | | | | |
Total Common Stocks and Other Equity Interests
(Cost $3,419,618,605) | | | | | | | | | 3,961,846,590 | |
| | | | | | | | | | |
Convertible Preferred Stocks (Cost $241,000) 0.0%† | | | | | | | | | | |
Commercial Banks 0.0%† | | | | | | | | | | |
bFirst Southern Bancorp Inc., cvt. pfd., C | | United States | | | 241 | | | | 457,541 | |
| | | | | | | | | | |
| | | |
| | | | | Principal
Amount* | | | | |
Corporate Bonds, Notes and Senior Floating Rate Interests 5.0% | | | | | | | | | | |
Clear Channel Communications Inc., | | | | | | | | | | |
gfirst lien, senior secured note, 144A, 9.00%, 12/15/19 | | United States | | | 26,449,000 | | | | 24,333,080 | |
hsenior note, PIK, 11.00%, 8/01/16 | | United States | | | 12,556,000 | | | | 9,573,950 | |
i,j Tranche B Term Loan, 3.862%, 1/29/16 | | United States | | | 31,315,340 | | | | 26,030,876 | |
i,j Tranche C Term Loan, 3.862%, 1/29/16 | | United States | | | 5,228,509 | | | | 4,213,305 | |
Energy Future Intermediate Holding Co. LLC/EFIH Finance Inc., | | | | | | | | | | |
second lien, 11.00%, 10/01/21 | | United States | | | 5,374,000 | | | | 5,830,790 | |
gsecured note, 144A, 11.75%, 3/01/22 | | United States | | | 16,114,000 | | | | 17,967,110 | |
MS-14
Franklin Templeton Variable Insurance Products Trust
Statement of Investments, December 31, 2012 (continued)
| | | | | | | | | | |
| Mutual Shares Securities Fund | | Country | | Principal
Amount* | | | Value | |
Corporate Bonds, Notes and Senior Floating Rate Interests (continued) | | | | | | | | | | |
i Hilton Worldwide Inc., FRN, | | | | | | | | | | |
Mezzanine D Loan, 3.959%, 11/12/15 | | United States | | | 1,708,718 | | | $ | 1,629,690 | |
Mezzanine E Loan, 4.209%, 11/12/15 | | United States | | | 2,190,638 | | | | 2,098,905 | |
Mezzanine F Loan, 4.459%, 11/12/15 | | United States | | | 5,477,095 | | | | 5,203,241 | |
Mezzanine G Loan, 4.709%, 11/12/15 | | United States | | | 9,858,372 | | | | 9,266,869 | |
i,j iStar Financial Inc., | | | | | | | | | | |
New Tranche A-1 Term Loan, 5.25%, 3/19/16 | | United States | | | 483,148 | | | | 490,395 | |
New Tranche A-2 Term Loan, 7.00%, 3/19/17 | | United States | | | 3,511,000 | | | | 3,682,161 | |
Term Loan B, 5.75%, 10/15/17 | | United States | | | 6,540,688 | | | | 6,622,368 | |
Realogy Corp., | | | | | | | | | | |
i,j,k Extended Revolver, 7.211%, 4/10/16 | | United States | | | 2,438,149 | | | | 2,334,528 | |
senior note, 11.50%, 4/15/17 | | United States | | | 3,654,000 | | | | 3,973,725 | |
gsenior secured note, 144A, 7.875%, 2/15/19 | | United States | | | 4,388,000 | | | | 4,804,860 | |
gsenior secured note, 144A, 9.00%, 1/15/20 | | United States | | | 1,956,000 | | | | 2,259,180 | |
i,j Texas Competitive Electric Holdings Co. LLC, Extended Term Loan, 4.713%, 10/10/17 | | United States | | | 90,618,405 | | | | 61,021,800 | |
Texas Competitive Electric Holdings Co. LLC/Texas Competitive Electric Holdings Finance Inc., senior note, A, 10.25%, 11/01/15 | | United States | | | 9,820,000 | | | | 2,921,450 | |
gsenior secured note, 144A, 11.50%, 10/01/20 | | United States | | | 39,308,000 | | | | 30,955,050 | |
g Wind Acquisition Finance SA, | | | | | | | | | | |
first lien, 144A, 7.375%, 2/15/18 | | Italy | | | 1,396,000 | EUR | | | 1,852,524 | |
senior note, 144A, 7.25%, 2/15/18 | | Italy | | | 1,395,000 | | | | 1,408,950 | |
senior secured note, 144A, 11.75%, 7/15/17 | | Italy | | | 1,256,000 | | | | 1,321,940 | |
senior secured note, 144A, 7.375%, 2/15/18 | | Italy | | | 1,441,000 | EUR | | | 1,912,240 | |
third lien, 144A, 11.75%, 7/15/17 | | Italy | | | 2,930,000 | EUR | | | 4,069,415 | |
| | | | | | | | | | |
Total Corporate Bonds, Notes and Senior Floating Rate Interests
(Cost $253,290,846) | | | | | | | | | 235,778,402 | |
| | | | | | | | | | |
Corporate Notes in Reorganization 0.7% | | | | | | | | | | |
g,l American Airlines Inc., senior secured note, 144A, 7.50%, 3/15/16 | | United States | | | 28,305,000 | | | | 30,640,162 | |
b,l Broadband Ventures III LLC, secured promissory note, 5.00%, 2/01/12 | | United States | | | 2,143 | | | | — | |
| | | | | | | | | | |
Total Corporate Notes in Reorganization (Cost $28,712,252) | | | | | | | | | 30,640,162 | |
| | | | | | | | | | |
| | | |
| | | | | Shares | | | | |
Companies in Liquidation 0.0%† | | | | | | | | | | |
aAdelphia Recovery Trust | | United States | | | 29,283,354 | | | | 29,283 | |
a,d Adelphia Recovery Trust, Arahova Contingent Value Vehicle, Contingent Distribution | | United States | | | 1,955,453 | | | | 58,664 | |
a,b,c,mCB FIM Coinvestors LLC | | United States | | | 6,400,507 | | | | — | |
a,d,e Century Communications Corp., Contingent Distribution | | United States | | | 5,487,000 | | | | — | |
a,b FIM Coinvestor Holdings I, LLC | | United States | | | 8,006,950 | | | | — | |
a,d,eTribune Litigation Trust, Contingent Distribution | | United States | | | 393,761 | | | | — | |
a,d,e Tropicana Litigation Trust, Contingent Distribution | | United States | | | 18,305,000 | | | | — | |
| | | |
| | | | | Principal
Amount* | | | | |
e,l Peregrine Investments Holdings Ltd., 1/15/98 | | Hong Kong | | | 5,000,000 | JPY | | | — | |
e,l PIV Investment Finance (Cayman) Ltd., 12/01/00 | | Hong Kong | | | 12,200,000 | | | | — | |
| | | | | | | | | | |
Total Companies in Liquidation (Cost $2,565,193) | | | | | | | | | 87,947 | |
| | | | | | | | | | |
Asset-Backed Securities 0.1% | | | | | | | | | | |
Airlines 0.1% | | | | | | | | | | |
American Airlines Inc., first lien, 13.00%, 8/01/16 | | United States | | | 459,982 | | | | 487,581 | |
MS-15
Franklin Templeton Variable Insurance Products Trust
Statement of Investments, December 31, 2012 (continued)
| | | | | | | | | | |
| Mutual Shares Securities Fund | | Country | | Principal
Amount* | | | Value | |
Asset-Backed Securities (continued) | | | | | | | | | | |
Airlines (continued) | | | | | | | | | | |
American Airlines Pass Through Trust, | | | | | | | | | | |
2009-1A, 10.375%, 7/02/19 | | United States | | | 748,892 | | | $ | 783,060 | |
2011-2A, 8.625%, 4/15/23 | | United States | | | 3,113,716 | | | | 3,236,318 | |
| | | | | | | | | | |
Total Asset-Backed Securities (Cost $4,541,901) | | | | | | | | | 4,506,959 | |
| | | | | | | | | | |
Total Investments before Short Term Investments
(Cost $3,708,969,797) | | | | | | | | | 4,233,317,601 | |
| | | | | | | | | | |
Short Term Investments 9.4% | | | | | | | | | | |
U.S. Government and Agency Securities 9.1% | | | | | | | | | | |
nFHLB, 1/02/13 | | United States | | | 2,900,000 | | | | 2,900,000 | |
n U.S. Treasury Bills, | | | | | | | | | | |
o1/03/13 | | United States | | | 62,000,000 | | | | 61,999,938 | |
1/17/13 | | United States | | | 47,000,000 | | | | 46,999,624 | |
3/14/13 | | United States | | | 60,000,000 | | | | 59,995,260 | |
o1/10/13 - 6/27/13 | | United States | | | 255,600,000 | | | | 255,561,488 | |
| | | | | | | | | | |
Total U.S. Government and Agency Securities
(Cost $427,404,900) | | | | | | | | | 427,456,310 | |
| | | | | | | | | | |
Total Investments before Money Market Funds
(Cost $4,136,374,697) | | | | | | | | | 4,660,773,911 | |
| | | | | | | | | | |
| | | |
| | | | | Shares | | | | |
pInvestments from Cash Collateral Received for Loaned Securities
(Cost $13,617,180) 0.3% | | | | | | | | | | |
Money Market Funds 0.3% | | | | | | | | | | |
qBNY Mellon Overnight Government Fund, 0.191% | | United States | | | 13,617,180 | | | | 13,617,180 | |
| | | | | | | | | | |
Total Investments (Cost $4,149,991,877) 99.8% | | | | | | | | | 4,674,391,091 | |
Other Assets, less Liabilities 0.2% | | | | | | | | | 9,769,525 | |
| | | | | | | | | | |
Net Assets 100.0% | | | | | | | | $ | 4,684,160,616 | |
| | | | | | | | | | |
MS-16
Franklin Templeton Variable Insurance Products Trust
Statement of Investments, December 31, 2012 (continued)
|
| Mutual Shares Securities Fund |
†Rounds to less than 0.1% of net assets.
*The principal amount is stated in U.S. dollars unless otherwise indicated.
aNon-income producing.
bSee Note 8 regarding restricted securities.
cAt December 31, 2012, pursuant to the Fund’s policies and the requirements of applicable securities law, the Fund may be restricted from trading these securities for a limited or extended period of time due to ownership limits and/or potential possession of material non-public information.
dContingent distributions represent the right to receive additional distributions, if any, during the reorganization of the underlying company. Shares represent total underlying principal of debt securities.
eSecurity has been deemed illiquid because it may not be able to be sold within seven days. At December 31, 2012, the aggregate value of these securities was $6,010,511, representing 0.12% of net assets.
fA portion or all of the security is on loan at December 31, 2012. See Note 1(e).
gSecurity was purchased pursuant to Rule 144A under the Securities Act of 1933 and may be sold in transactions exempt from registration only to qualified institutional buyers or in a public offering registered under the Securities Act of 1933. These securities have been deemed liquid under guidelines approved by the Trust’s Board of Trustees. At December 31, 2012, the aggregate value of these securities was $121,524,511, representing 2.59% of net assets.
hIncome may be received in additional securities and/or cash.
iThe coupon rate shown represents the rate at period end.
jSee Note 1(f) regarding senior floating rate interests.
kSee Note 9 regarding unfunded loan commitments.
lSee Note 7 regarding credit risk and defaulted securities.
mSee Note 11 regarding holdings of 5% voting securities.
nThe security is traded on a discount basis with no stated coupon rate.
oSecurity or a portion of the security has been pledged as collateral for open futures and forward contracts. At December 31, 2012, the aggregate value of these securities and/or cash pledged as collateral was $11,676,583, representing 0.25% of net assets.
pSee Note 1(e) regarding securities on loan.
qThe rate shown is the annualized seven-day yield at period end.
MS-17
Franklin Templeton Variable Insurance Products Trust
Statement of Investments, December 31, 2012 (continued)
|
| Mutual Shares Securities Fund |
At December 31, 2012, the Fund had the following futures contracts outstanding. See Note 1(c).
Futures Contracts
| | | | | | | | | | | | | | | | | | | | | | | | |
| Description | | Type | | | Number of
Contracts | | | Notional
Value | | | Expiration
Date | | | Unrealized
Appreciation | | | Unrealized
Depreciation | |
Currency Contracts | | | | | | | | | | | | | | | | | | | | | | | | |
EUR/USD | | | Short | | | | 464 | | | $ | 76,606,400 | | | | 3/18/13 | | | $ | — | | | $ | (1,288,289 | ) |
GBP/USD | | | Short | | | | 797 | | | | 80,895,500 | | | | 3/18/13 | | | | — | | | | (780,675 | ) |
| | | | | | | | | | | | | | | | | | | | |
Net unrealized appreciation (depreciation) | | | | | | | | | | | | | | | | | | | | | | $ | (2,068,964 | ) |
| | | | | | | | | | | | | | | | | | | | | | | | |
At December 31, 2012, the Fund had the following forward exchange contracts outstanding. See Note 1(c).
Forward Exchange Contracts
| | | | | | | | | | | | | | | | | | | | | | | | | | | | |
| Currency | | Counterparty | | | Type | | | Quantity | | | Contract
Amount | | | Settlement
Date | | | Unrealized
Appreciation | | | Unrealized
Depreciation | |
Euro | | | SCBT | | | | Sell | | | | 20,924,531 | | | $ | 25,698,947 | | | | 1/17/13 | | | $ | — | | | $ | (1,917,333 | ) |
Euro | | | HSBC | | | | Sell | | | | 14,185,218 | | | | 17,427,630 | | | | 1/17/13 | | | | — | | | | (1,294,077 | ) |
Euro | | | FBCO | | | | Sell | | | | 8,808,718 | | | | 10,878,591 | | | | 1/17/13 | | | | — | | | | (747,191 | ) |
Euro | | | BOFA | | | | Sell | | | | 6,421,495 | | | | 7,920,704 | | | | 1/17/13 | | | | — | | | | (554,410 | ) |
Euro | | | DBAB | | | | Sell | | | | 2,334,771 | | | | 2,886,816 | | | | 1/17/13 | | | | — | | | | (194,624 | ) |
Euro | | | BZWS | | | | Sell | | | | 863,789 | | | | 1,070,334 | | | | 1/17/13 | | | | — | | | | (69,698 | ) |
Euro | | | HAND | | | | Sell | | | | 437,059 | | | | 541,204 | | | | 1/17/13 | | | | — | | | | (35,629 | ) |
Euro | | | DBAB | | | | Buy | | | | 2,192,223 | | | | 2,900,055 | | | | 1/17/13 | | | | — | | | | (6,750 | ) |
Euro | | | SCBT | | | | Buy | | | | 553,397 | | | | 731,596 | | | | 1/17/13 | | | | — | | | | (1,221 | ) |
Euro | | | HSBC | | | | Buy | | | | 1,393,135 | | | | 1,797,032 | | | | 1/17/13 | | | | 41,633 | | | | — | |
Euro | | | BOFA | | | | Buy | | | | 3,040,035 | | | | 3,928,679 | | | | 1/17/13 | | | | 83,571 | | | | — | |
Euro | | | BZWS | | | | Buy | | | | 3,591,687 | | | | 4,655,579 | | | | 1/17/13 | | | | 84,744 | | | | — | |
Euro | | | FBCO | | | | Buy | | | | 844,885 | | | | 1,087,933 | | | | 1/17/13 | | | | 27,150 | | | | — | |
Euro | | | DBAB | | | | Buy | | | | 480,897 | | | | 633,639 | | | | 1/17/13 | | | | 1,051 | | | | — | |
British Pound | | | BOFA | | | | Sell | | | | 22,739,689 | | | | 36,758,707 | | | | 1/22/13 | | | | — | | | | (190,880 | ) |
British Pound | | | SCBT | | | | Sell | | | | 19,491,161 | | | | 31,497,716 | | | | 1/22/13 | | | | — | | | | (173,357 | ) |
British Pound | | | DBAB | | | | Sell | | | | 11,028,532 | | | | 17,816,593 | | | | 1/22/13 | | | | — | | | | (103,603 | ) |
British Pound | | | DBAB | | | | Buy | | | | 949,346 | | | | 1,539,864 | | | | 1/22/13 | | | | 3,099 | | | | — | |
British Pound | | | FBCO | | | | Buy | | | | 525,372 | | | | 848,959 | | | | 1/22/13 | | | | 4,715 | | | | — | |
British Pound | | | BZWS | | | | Buy | | | | 817,016 | | | | 1,319,826 | | | | 1/22/13 | | | | 7,738 | | | | — | |
British Pound | | | HAND | | | | Buy | | | | 878,765 | | | | 1,427,229 | | | | 1/22/13 | | | | 1,053 | | | | — | |
Swiss Franc | | | BOFA | | | | Sell | | | | 395,574 | | | | 409,010 | | | | 2/11/13 | | | | — | | | | (23,505 | ) |
Swiss Franc | | | BZWS | | | | Sell | | | | 338,326 | | | | 347,859 | | | | 2/11/13 | | | | — | | | | (22,062 | ) |
Swiss Franc | | | FBCO | | | | Sell | | | | 42,560 | | | | 45,835 | | | | 2/11/13 | | | | — | | | | (699 | ) |
Swiss Franc | | | DBAB | | | | Sell | | | | 10,128 | | | | 10,746 | | | | 2/11/13 | | | | — | | | | (327 | ) |
Swiss Franc | | | HSBC | | | | Sell | | | | 17,163 | | | | 18,562 | | | | 2/11/13 | | | | — | | | | (204 | ) |
Swiss Franc | | | FBCO | | | | Buy | | | | 178,105 | | | | 190,747 | | | | 2/11/13 | | | | 3,991 | | | | — | |
British Pound | | | HAND | | | | Sell | | | | 37,985,680 | | | | 59,580,539 | | | | 2/19/13 | | | | — | | | | (2,136,916 | ) |
British Pound | | | HSBC | | | | Sell | | | | 22,259,119 | | | | 34,891,169 | | | | 2/19/13 | | | | — | | | | (1,274,464 | ) |
British Pound | | | BOFA | | | | Sell | | | | 499,559 | | | | 802,692 | | | | 2/19/13 | | | | — | | | | (8,970 | ) |
British Pound | | | DBAB | | | | Sell | | | | 233,435 | | | | 377,268 | | | | 2/19/13 | | | | — | | | | (2,007 | ) |
British Pound | | | SCBT | | | | Buy | | | | 2,682,053 | | | | 4,354,930 | | | | 2/19/13 | | | | 2,751 | | | | — | |
British Pound | | | DBAB | | | | Buy | | | | 240,000 | | | | 387,288 | | | | 2/19/13 | | | | 2,653 | | | | — | |
Euro | | | BOFA | | | | Sell | | | | 25,224,193 | | | | 31,738,808 | | | | 2/28/13 | | | | — | | | | (1,564,260 | ) |
Euro | | | HAND | | | | Sell | | | | 24,768,105 | | | | 31,145,834 | | | | 2/28/13 | | | | — | | | | (1,555,070 | ) |
Euro | | | HSBC | | | | Sell | | | | 6,225,556 | | | | 8,026,510 | | | | 2/28/13 | | | | — | | | | (192,984 | ) |
Euro | | | DBAB | | | | Sell | | | | 2,934,574 | | | | 3,732,212 | | | | 2/28/13 | | | | — | | | | (142,256 | ) |
Euro | | | FBCO | | | | Sell | | | | 2,502,222 | | | | 3,198,682 | | | | 2/28/13 | | | | — | | | | (104,959 | ) |
Euro | | | SCBT | | | | Sell | | | | 762,710 | | | | 986,467 | | | | 2/28/13 | | | | — | | | | (20,526 | ) |
Euro | | | BZWS | | | | Sell | | | | 778,878 | | | | 1,022,958 | | | | 2/28/13 | | | | — | | | | (5,381 | ) |
MS-18
Franklin Templeton Variable Insurance Products Trust
Statement of Investments, December 31, 2012 (continued)
|
| Mutual Shares Securities Fund |
Forward Exchange Contracts (continued)
| | | | | | | | | | | | | | | | | | | | | | | | | | | | |
| Currency | | Counterparty | | | Type | | | Quantity | | | Contract
Amount | | | Settlement
Date | | | Unrealized
Appreciation | | | Unrealized
Depreciation | |
Euro | | | BOFA | | | | Buy | | | | 1,215,873 | | | $ | 1,561,740 | | | | 2/28/13 | | | $ | 43,556 | | | $ | — | |
Euro | | | FBCO | | | | Buy | | | | 313,388 | | | | 402,409 | | | | 2/28/13 | | | | 11,352 | | | | — | |
Euro | | | FBCO | | | | Sell | | | | 2,421,650 | | | | 3,132,795 | | | | 4/16/13 | | | | — | | | | (65,895 | ) |
Euro | | | BOFA | | | | Sell | | | | 1,860,623 | | | | 2,410,056 | | | | 4/16/13 | | | | — | | | | (47,590 | ) |
Euro | | | DBAB | | | | Sell | | | | 1,395,659 | | | | 1,801,307 | | | | 4/16/13 | | | | — | | | | (42,181 | ) |
Euro | | | HAND | | | | Sell | | | | 174,254 | | | | 226,204 | | | | 4/16/13 | | | | — | | | | (3,964 | ) |
British Pound | | | BZWS | | | | Sell | | | | 28,909,121 | | | | 45,937,880 | | | | 4/19/13 | | | | — | | | | (1,022,277 | ) |
British Pound | | | BOFA | | | | Sell | | | | 3,540,197 | | | | 5,675,883 | | | | 4/19/13 | | | | — | | | | (74,835 | ) |
British Pound | | | DBAB | | | | Sell | | | | 3,124,412 | | | | 5,052,371 | | | | 4/19/13 | | | | — | | | | (22,944 | ) |
British Pound | | | SCBT | | | | Sell | | | | 845,242 | | | | 1,359,872 | | | | 4/19/13 | | | | — | | | | (13,145 | ) |
British Pound | | | FBCO | | | | Sell | | | | 465,990 | | | | 747,080 | | | | 4/19/13 | | | | — | | | | (9,877 | ) |
Japanese Yen | | | BOFA | | | | Buy | | | | 72,088,420 | | | | 876,407 | | | | 4/22/13 | | | | — | | | | (44,695 | ) |
Japanese Yen | | | DBAB | | | | Buy | | | | 34,693,400 | | | | 427,497 | | | | 4/22/13 | | | | — | | | | (27,226 | ) |
Japanese Yen | | | HSBC | | | | Buy | | | | 18,148,140 | | | | 228,023 | | | | 4/22/13 | | | | — | | | | (18,641 | ) |
Japanese Yen | | | FBCO | | | | Buy | | | | 16,131,705 | | | | 195,769 | | | | 4/22/13 | | | | — | | | | (9,652 | ) |
Japanese Yen | | | HSBC | | | | Sell | | | | 573,682,865 | | | | 7,238,195 | | | | 4/22/13 | | | | 619,397 | | | | — | |
Japanese Yen | | | DBAB | | | | Sell | | | | 29,600,000 | | | | 344,070 | | | | 4/22/13 | | | | 2,563 | | | | — | |
British Pound | | | FBCO | | | | Sell | | | | 27,190,870 | | | | 43,206,293 | | | | 5/21/13 | | | | — | | | | (957,380 | ) |
| | | | | | | | | | | | | | | | | | | | | | | | |
Unrealized appreciation (depreciation) | | | | 941,017 | | | | (14,703,665 | ) |
| | | | | | | | | | | | | | | | | | | | | | | | |
Net unrealized appreciation (depreciation) | | | $ | (13,762,648 | ) |
| | | | | | | | | | | | | | | | | | | | | | | | | | | | |
See Abbreviations on page MS-35.
The accompanying notes are an integral part of these financial statements.
MS-19
Franklin Templeton Variable Insurance Products Trust
Financial Statements
Statement of Assets and Liabilities
December 31, 2012
| | | | |
| | | Mutual Shares
Securities Fund | |
Assets: | | | | |
Investments in securities: | | | | |
Cost - Unaffiliated issuers | | $ | 4,149,991,877 | |
| | | | |
Value - Unaffiliated issuers (includes securities loaned in the amount of $11,527,794) | | $ | 4,674,391,091 | |
Cash | | | 21,541,267 | |
Foreign currency, at value (cost $6,449,058) | | | 6,444,689 | |
Receivables: | | | | |
Investment securities sold | | | 6,959,473 | |
Capital shares sold | | | 1,336,987 | |
Dividends and interest | | | 12,188,617 | |
Due from brokers | | | 104,813 | |
Unrealized appreciation on forward exchange contracts | | | 941,017 | |
Other assets | | | 121 | |
| | | | |
Total assets | | | 4,723,908,075 | |
| | | | |
Liabilities: | | | | |
Payables: | | | | |
Investment securities purchased | | | 822,330 | |
Capital shares redeemed | | | 4,268,457 | |
Affiliates | | | 4,492,015 | |
Variation margin | | | 429,688 | |
Payable upon return of securities loaned | | | 13,617,180 | |
Unrealized depreciation on forward exchange contracts | | | 14,703,665 | |
Unrealized depreciation on unfunded loan commitments (Note 9) | | | 153,770 | |
Accrued expenses and other liabilities | | | 1,260,354 | |
| | | | |
Total liabilities | | | 39,747,459 | |
| | | | |
Net assets, at value | | $ | 4,684,160,616 | |
| | | | |
Net assets consist of: | | | | |
Paid-in capital | | $ | 4,418,942,293 | |
Undistributed net investment income | | | 101,815,540 | |
Net unrealized appreciation (depreciation) | | | 508,449,991 | |
Accumulated net realized gain (loss) | | | (345,047,208 | ) |
| | | | |
Net assets, at value | | $ | 4,684,160,616 | |
| | | | |
Class 1: | | | | |
Net assets, at value | | $ | 449,342,766 | |
| | | | |
Shares outstanding | | | 25,756,120 | |
| | | | |
Net asset value and maximum offering price per share | | $ | 17.45 | |
| | | | |
Class 2: | | | | |
Net assets, at value | | $ | 4,069,803,075 | |
| | | | |
Shares outstanding | | | 236,271,652 | |
| | | | |
Net asset value and maximum offering price per share | | $ | 17.23 | |
| | | | |
Class 4: | | | | |
Net assets, at value | | $ | 165,014,775 | |
| | | | |
Shares outstanding | | | 9,534,581 | |
| | | | |
Net asset value and maximum offering price per share | | $ | 17.31 | |
| | | | |
The accompanying notes are an integral part of these financial statements.
MS-20
Franklin Templeton Variable Insurance Products Trust
Financial Statements (continued)
Statement of Operations
for the year ended December 31, 2012
| | | | |
| | | Mutual Shares
Securities Fund | |
Investment income: | | | | |
Dividends | | $ | 118,069,276 | |
Interest | | | 28,546,642 | |
Income from securities loaned | | | 1,028,452 | |
| | | | |
Total investment income | | | 147,644,370 | |
| | | | |
Expenses: | | | | |
Management fees (Note 3a) | | | 31,881,220 | |
Administrative fees (Note 3b) | | | 4,575,893 | |
Distribution fees: (Note 3c) | | | | |
Class 2 | | | 10,078,938 | |
Class 4 | | | 578,835 | |
Unaffiliated transfer agent fees | | | 1,319 | |
Custodian fees (Note 4) | | | 212,249 | |
Reports to shareholders | | | 832,436 | |
Professional fees | | | 315,693 | |
Trustees’ fees and expenses | | | 21,649 | |
Other | | | 137,372 | |
| | | | |
Total expenses | | | 48,635,604 | |
| | | | |
Net investment income | | | 99,008,766 | |
| | | | |
Realized and unrealized gains (losses): | | | | |
Net realized gain (loss) from: | | | | |
Investments (includes gains from redemption in-kind of $139,199,450) | | | 386,487,560 | |
Written options | | | 1,055,030 | |
Foreign currency transactions | | | 24,232,250 | |
Futures contracts | | | (2,755,265 | ) |
Securities sold short | | | (10,186,095 | ) |
| | | | |
Net realized gain (loss) | | | 398,833,480 | |
| | | | |
Net change in unrealized appreciation (depreciation) on: | | | | |
Investments | | | 284,681,537 | |
Translation of other assets and liabilities denominated in foreign currencies | | | (45,112,294 | ) |
| | | | |
Net change in unrealized appreciation (depreciation) | | | 239,569,243 | |
| | | | |
Net realized and unrealized gain (loss) | | | 638,402,723 | |
| | | | |
Net increase (decrease) in net assets resulting from operations | | $ | 737,411,489 | |
| | | | |
The accompanying notes are an integral part of these financial statements.
MS-21
Franklin Templeton Variable Insurance Products Trust
Financial Statements (continued)
Statements of Changes in Net Assets
| | | | | | | | |
| | | Mutual Shares
Securities Fund | |
| | | Year Ended December 31, | |
| | | 2012 | | | 2011 | |
| | | | |
Increase (decrease) in net assets: | | | | | | | | |
Operations: | | | | | | | | |
Net investment income | | $ | 99,008,766 | | | $ | 116,919,415 | |
Net realized gain (loss) from investments, written options, foreign currency transactions, futures contracts and securities sold short | | | 398,833,480 | | | | (69,197,475 | ) |
Net change in unrealized appreciation (depreciation) on investments and translation of other assets and liabilities denominated in foreign currencies | | | 239,569,243 | | | | (151,843,785 | ) |
| | | | |
Net increase (decrease) in net assets resulting from operations | | | 737,411,489 | | | | (104,121,845 | ) |
| | | | |
Distributions to shareholders from: | | | | | | | | |
Net investment income: | | | | | | | | |
Class 1 | | | (33,342,789 | ) | | | (32,920,483 | ) |
Class 2 | | | (82,893,175 | ) | | | (95,354,646 | ) |
Class 4 | | | (3,198,551 | ) | | | (3,732,632 | ) |
| | | | |
Total distributions to shareholders | | | (119,434,515 | ) | | | (132,007,761 | ) |
| | | | |
Capital share transactions: (Note 2) | | | | | | | | |
Class 1 | | | (865,246,582 | ) | | | (34,519,147 | ) |
Class 2 | | | (298,991,452 | ) | | | (141,255,692 | ) |
Class 4 | | | (15,628,562 | ) | | | 339,468 | |
| | | | |
Total capital share transactions | | | (1,179,866,596 | ) | | | (175,435,371 | ) |
| | | | |
Net increase (decrease) in net assets | | | (561,889,622 | ) | | | (411,564,977 | ) |
Net assets: | | | | | | | | |
Beginning of year | | | 5,246,050,238 | | | | 5,657,615,215 | |
| | | | |
End of year | | $ | 4,684,160,616 | | | $ | 5,246,050,238 | |
| | | | |
Undistributed net investment income included in net assets: | | | | | | | | |
End of year | | $ | 101,815,540 | | | $ | 98,882,928 | |
| | | | |
The accompanying notes are an integral part of these financial statements.
MS-22
Franklin Templeton Variable Insurance Products Trust
Notes to Financial Statements
Mutual Shares Securities Fund
1. ORGANIZATION AND SIGNIFICANT ACCOUNTING POLICIES
Franklin Templeton Variable Insurance Products Trust (Trust) is registered under the Investment Company Act of 1940, as amended, (1940 Act) as an open-end investment company, consisting of twenty separate funds. The Mutual Shares Securities Fund (Fund) is included in this report. The financial statements of the remaining funds in the Trust are presented separately. Shares of the Fund are generally sold only to insurance company separate accounts to fund the benefits of variable life insurance policies or variable annuity contracts. The Fund offers three classes of shares: Class 1, Class 2, and Class 4. Each class of shares differs by its distribution fees, voting rights on matters affecting a single class and its exchange privilege.
The following summarizes the Fund’s significant accounting policies.
a. Financial Instrument Valuation
The Fund’s investments in financial instruments are carried at fair value daily. Fair value is the price that would be received to sell an asset or paid to transfer a liability in an orderly transaction between market participants on the measurement date. Under procedures approved by the Trust’s Board of Trustees (the Board), the Fund’s administrator, investment manager and other affiliates have formed the Valuation and Liquidity Oversight Committee (VLOC). The VLOC provides administration and oversight of the Fund’s valuation policies and procedures, which are approved annually by the Board. Among other things, these procedures allow the Fund to utilize independent pricing services, quotations from securities and financial instrument dealers, and other market sources to determine fair value.
Equity securities and derivative financial instruments (derivatives) listed on an exchange or on the NASDAQ National Market System are valued at the last quoted sale price or the official closing price of the day, respectively. Foreign equity securities are valued as of the close of trading on the foreign stock exchange on which the security is primarily traded, or the NYSE, whichever is earlier. The value is then converted into its U.S. dollar equivalent at the foreign exchange rate in effect at the close of the NYSE on the day that the value of the security is determined. Over-the-counter (OTC) securities are valued within the range of the most recent quoted bid and ask prices. Securities that trade in multiple markets or on multiple exchanges are valued according to the broadest and most representative market. Certain equity securities are valued based upon fundamental characteristics or relationships to similar securities. Investments in non-registered money market funds are valued at the closing net asset value.
Debt securities generally trade in the OTC market rather than on a securities exchange. The Fund’s pricing services use multiple valuation techniques to determine fair value. In instances where sufficient market activity exists, the pricing services may utilize a market-based approach through which quotes from market makers are used to determine fair value. In instances where sufficient market activity may not exist or is limited, the pricing services also utilize proprietary valuation models which may consider market characteristics such as benchmark yield curves, credit spreads, estimated default rates, anticipated market interest rate volatility, coupon rates, anticipated timing of principal repayments, underlying collateral, and other unique security features in order to estimate the relevant cash flows, which are then discounted to calculate the fair value. Securities denominated in a foreign currency are converted into their U.S. dollar equivalent at the foreign exchange rate in effect at the close of the NYSE on the date that the values of the foreign debt securities are determined.
Certain derivatives trade in the OTC market. The Fund’s pricing services use various techniques including industry standard option pricing models and proprietary discounted cash flow models to determine the fair value of those instruments. The Fund’s net benefit or obligation under the derivative contract, as measured by the fair market value of the contract, is included in net assets.
The Fund has procedures to determine the fair value of financial instruments for which market prices are not reliable or readily available. Under these procedures, the VLOC convenes on a regular basis to review such financial instruments and considers a number of factors, including significant unobservable valuation inputs, when arriving at fair value. The VLOC primarily employs a market-based approach which may use related or comparable assets or liabilities, recent transactions, market multiples, book values, and other relevant information for the investment to determine the fair value of the investment. An income-based
MS-23
Franklin Templeton Variable Insurance Products Trust
Notes to Financial Statements (continued)
Mutual Shares Securities Fund
1. ORGANIZATION AND SIGNIFICANT ACCOUNTING POLICIES (continued)
a. Financial Instrument Valuation (continued)
valuation approach may also be used in which the anticipated future cash flows of the investment are discounted to calculate fair value. Discounts may also be applied due to the nature or duration of any restrictions on the disposition of the investments. Due to the inherent uncertainty of valuations of such investments, the fair values may differ significantly from the values that would have been used had an active market existed. The VLOC employs various methods for calibrating these valuation approaches including a regular review of key inputs and assumptions, transactional back-testing or disposition analysis, and reviews of any related market activity.
Trading in securities on foreign securities stock exchanges and OTC markets may be completed before the daily close of business on the NYSE. Occasionally, events occur between the time at which trading in a foreign security is completed and the close of the NYSE that might call into question the reliability of the value of a portfolio security held by the Fund. As a result, differences may arise between the value of the Fund’s portfolio securities as determined at the foreign market close and the latest indications of value at the close of the NYSE. In order to minimize the potential for these differences, the VLOC monitors price movements following the close of trading in foreign stock markets through a series of country specific market proxies (such as baskets of American Depositary Receipts, futures contracts and exchange traded funds). These price movements are measured against established trigger thresholds for each specific market proxy to assist in determining if an event has occurred that may call into question the reliability of the values of the foreign securities held by the Fund. If such an event occurs, the securities may be valued using fair value procedures, which may include the use of independent pricing services. At December 31, 2012, a market event occurred resulting in a portion of the securities held by the Fund being valued using fair value procedures.
b. Foreign Currency Translation
Portfolio securities and other assets and liabilities denominated in foreign currencies are translated into U.S. dollars based on the exchange rate of such currencies against U.S. dollars on the date of valuation. The Fund may enter into foreign currency exchange contracts to facilitate transactions denominated in a foreign currency. Purchases and sales of securities, income and expense items denominated in foreign currencies are translated into U.S. dollars at the exchange rate in effect on the transaction date. Portfolio securities and assets and liabilities denominated in foreign currencies contain risks that those currencies will decline in value relative to the U.S. dollar. Occasionally, events may impact the availability or reliability of foreign exchange rates used to convert the U.S. dollar equivalent value. If such an event occurs, the foreign exchange rate will be valued at fair value using procedures established and approved by the Board.
The Fund does not separately report the effect of changes in foreign exchange rates from changes in market prices on securities held. Such changes are included in net realized and unrealized gain or loss from investments on the Statement of Operations.
Realized foreign exchange gains or losses arise from sales of foreign currencies, currency gains or losses realized between the trade and settlement dates on securities transactions and the difference between the recorded amounts of dividends, interest, and foreign withholding taxes and the U.S. dollar equivalent of the amounts actually received or paid. Net unrealized foreign exchange gains and losses arise from changes in foreign exchange rates on foreign denominated assets and liabilities other than investments in securities held at the end of the reporting period.
c. Derivative Financial Instruments
The Fund invested in derivatives in order to manage risk or gain exposure to various other investments or markets. Derivatives are financial contracts based on an underlying or notional amount, require no initial investment or an initial net investment that is smaller than would normally be required to have a similar response to changes in market factors, and require or permit net settlement. Derivatives contain various risks including the potential inability of the counterparty to fulfill their obligations under the terms of the contract, the potential for an illiquid secondary market, and/or the potential for market movements which
MS-24
Franklin Templeton Variable Insurance Products Trust
Notes to Financial Statements (continued)
Mutual Shares Securities Fund
1. ORGANIZATION AND SIGNIFICANT ACCOUNTING POLICIES (continued)
c. Derivative Financial Instruments (continued)
expose the Fund to gains or losses in excess of the amounts shown on the Statement of Assets and Liabilities. Realized gain and loss and unrealized appreciation and depreciation on these contracts for the period are included in the Statement of Operations.
The Fund’s investments in OTC derivatives are subject to the terms of International Swaps and Derivatives Association Master Agreements and other related agreements between the Fund and certain derivative counterparties. These agreements contain various provisions, including but not limited to collateral requirements, events of default, requirements for the Fund to maintain certain net asset levels and/or limit the decline in net assets over various periods of time. Should the Fund fail to meet any of these provisions, the derivative counterparty has the right to terminate the derivative contract and require immediate payment by the Fund for those OTC derivatives with that particular counterparty that are in a net liability position. At December 31, 2012, the Fund had OTC derivatives in a net liability position of $10,032,122 and the aggregate value of collateral pledged for such contracts was $8,920,770.
The Fund entered into exchange traded financial futures contracts primarily to manage exposure to certain foreign currencies. A futures contract is an agreement between the Fund and a counterparty to buy or sell an asset for a specified price on a future date. Required initial margin deposits of cash or securities are pledged by the Fund. Subsequent payments, known as variation margin, are made or received by the Fund, depending on fluctuations in the value of the asset underlying the futures contract. Such variation margin is accounted for as unrealized appreciation or depreciation until the contract is closed, at which time the gains or losses are realized.
The Fund entered into OTC forward exchange contracts primarily to manage exposure to certain foreign currencies. A forward exchange contract is an agreement between the Fund and a counterparty to buy or sell a foreign currency for a specific exchange rate on a future date. Pursuant to the terms of the forward exchange contracts, cash or securities may be required to be deposited as collateral. Unrestricted cash may be invested according to the Fund’s investment objectives.
The Fund purchased or wrote exchange traded option contracts primarily to manage exposure to equity price risk. An option is a contract entitling the holder to purchase or sell a specific amount of shares or units of an asset or notional amount of a swap (swaption), at a specified price. Options purchased are recorded as an asset while options written are recorded as a liability. Upon exercise of an option, the acquisition cost or sales proceeds of the underlying investment is adjusted by any premium received or paid. Upon expiration of an option, any premium received or paid is recorded as a realized gain or loss. Upon closing an option other than through expiration or exercise, the difference between the premium and the cost to close the position is recorded as a realized gain or loss. Pursuant to the terms of the written option contract, cash or securities may be required to be deposited as collateral.
See Notes 6 and 10 regarding investment transactions and other derivative information, respectively.
d. Securities Sold Short
The Fund is engaged in selling securities short, which obligates the Fund to replace a borrowed security with the same security at current market value. The Fund incurs a loss if the price of the security increases between the date of the short sale and the date on which the Fund replaces the borrowed security. The Fund realizes a gain if the price of the security declines between those dates. Gains are limited to the price at which the Fund sold the security short, while losses are potentially unlimited in size.
The Fund is required to establish a margin account with the broker lending the security sold short. While the short sale is outstanding, the broker retains the proceeds of the short sale and the Fund must maintain a deposit with the broker consisting of cash and/or securities having a value equal to a specified percentage of the value of the securities sold short. The Fund is obligated to pay fees for borrowing the securities sold short and is required to pay the counterparty any dividends or interest due on securities sold short. Such dividends or interest and any security borrowing fees are recorded as an expense to the Fund.
MS-25
Franklin Templeton Variable Insurance Products Trust
Notes to Financial Statements (continued)
Mutual Shares Securities Fund
1. ORGANIZATION AND SIGNIFICANT ACCOUNTING POLICIES (continued)
e. Securities Lending
The Fund participates in an agency based securities lending program. The Fund receives cash collateral against the loaned securities in an amount equal to at least 102% of the market value of the loaned securities. Collateral is maintained over the life of the loan in an amount not less than 100% of the market value of loaned securities, as determined at the close of fund business each day; any additional collateral required due to changes in security values is delivered to the Fund on the next business day. The collateral is invested in a non-registered money fund as indicated on the Statement of Investments. The Fund receives income from the investment of cash collateral, in addition to lending fees and rebates paid by the borrower. The Fund bears the market risk with respect to the collateral investment, securities loaned, and the risk that the agent may default on its obligations to the Fund. The securities lending agent has agreed to indemnify the Fund in the event of default by a third party borrower.
f. Senior Floating Rate Interests
The Fund invests in senior secured corporate loans that pay interest at rates which are periodically reset by reference to a base lending rate plus a spread. These base lending rates are generally the prime rate offered by a designated U.S. bank or the London InterBank Offered Rate (LIBOR). Senior secured corporate loans often require prepayment of principal from excess cash flows or at the discretion of the borrower. As a result, actual maturity may be substantially less than the stated maturity.
Senior secured corporate loans in which the Fund invests are generally readily marketable, but may be subject to some restrictions on resale.
g. Income and Deferred Taxes
It is the Fund’s policy to qualify as a regulated investment company under the Internal Revenue Code. The Fund intends to distribute to shareholders substantially all of its taxable income and net realized gains to relieve it from federal income and if applicable, excise taxes. As a result, no provision for U.S. federal income taxes is required.
The Fund may be subject to foreign taxation related to income received, capital gains on the sale of securities and certain foreign currency transactions in the foreign jurisdictions in which it invests. Foreign taxes, if any, are recorded based on the tax regulations and rates that exist in the foreign markets in which the Fund invests. When a capital gain tax is determined to apply the Fund records an estimated deferred tax liability in an amount that would be payable if the securities were disposed of on the valuation date.
The Fund recognizes the tax benefits of uncertain tax positions only when the position is “more likely than not” to be sustained upon examination by the tax authorities based on the technical merits of the tax position. As of December 31, 2012, and for all open tax years, the Fund has determined that no liability for unrecognized tax benefits is required in the Fund’s financial statements related to uncertain tax positions taken on a tax return (or expected to be taken on future tax returns). Open tax years are those that remain subject to examination and are based on each tax jurisdiction statute of limitation.
h. Security Transactions, Investment Income, Expenses and Distributions
Security transactions are accounted for on trade date. Realized gains and losses on security transactions are determined on a specific identification basis. Interest income and estimated expenses are accrued daily. Amortization of premium and accretion of discount on debt securities are included in interest income. Facility fees are recognized as income over the expected term of the loan. Dividend income and dividends declared on securities sold short are recorded on the ex-dividend date except that certain dividends from foreign securities are recognized as soon as the Fund is notified of the ex-dividend date. Distributions to shareholders are recorded on the ex-dividend date and are determined according to income tax regulations (tax basis). Distributable earnings determined on a tax basis may differ from earnings recorded in accordance with accounting principles
MS-26
Franklin Templeton Variable Insurance Products Trust
Notes to Financial Statements (continued)
Mutual Shares Securities Fund
1. ORGANIZATION AND SIGNIFICANT ACCOUNTING POLICIES (continued)
h. Security Transactions, Investment Income, Expenses and Distributions (continued)
generally accepted in the United States of America. These differences may be permanent or temporary. Permanent differences are reclassified among capital accounts to reflect their tax character. These reclassifications have no impact on net assets or the results of operations. Temporary differences are not reclassified, as they may reverse in subsequent periods.
Common expenses incurred by the Trust are allocated among the funds based on the ratio of net assets of each fund to the combined net assets of the Trust. Fund specific expenses are charged directly to the fund that incurred the expense.
Realized and unrealized gains and losses and net investment income, not including class specific expenses, are allocated daily to each class of shares based upon the relative proportion of net assets of each class. Differences in per share distributions, by class, are generally due to differences in class specific expenses.
i. Accounting Estimates
The preparation of financial statements in accordance with accounting principles generally accepted in the United States of America requires management to make estimates and assumptions that affect the reported amounts of assets and liabilities at the date of the financial statements and the amounts of income and expenses during the reporting period. Actual results could differ from those estimates.
j. Guarantees and Indemnifications
Under the Trust’s organizational documents, its officers and trustees are indemnified by the Trust against certain liabilities arising out of the performance of their duties to the Trust. Additionally, in the normal course of business, the Trust, on behalf of the Fund, enters into contracts with service providers that contain general indemnification clauses. The Trust’s maximum exposure under these arrangements is unknown as this would involve future claims that may be made against the Trust that have not yet occurred. Currently, the Trust expects the risk of loss to be remote.
2. SHARES OF BENEFICIAL INTEREST
At December 31, 2012, there were an unlimited number of shares authorized (without par value). Transactions in the Fund’s shares were as follows:
| | | | | | | | | | | | | | | | |
| | | Year Ended December 31, | |
| | | 2012 | | | 2011 | |
| Class 1 Shares: | | Shares | | | Amount | | | Shares | | | Amount | |
Shares sold | | | 30,409,042 | | | $ | 503,225,918 | | | | 42,708,405 | | | $ | 674,448,160 | |
Shares issued in reinvestment of distributions | | | 1,941,921 | | | | 33,342,789 | | | | 2,247,132 | | | | 32,920,483 | |
Shares redeemed in-kind (Note 13) | | | (52,704,789 | ) | | | (918,607,583 | ) | | | — | | | | — | |
Shares redeemed | | | (29,093,625 | ) | | | (483,207,706 | ) | | | (50,368,429 | ) | | | (741,887,790 | ) |
| | | | |
Net increase (decrease) | | | (49,447,451 | ) | | $ | (865,246,582 | ) | | | (5,412,892 | ) | | $ | (34,519,147 | ) |
| | | | |
Class 2 Shares: | | | | | | | | | | | | | | | | |
Shares sold | | | 18,569,762 | | | $ | 304,904,655 | | | | 25,072,748 | | | $ | 394,507,314 | |
Shares issued in reinvestment of distributions | | | 4,887,569 | | | | 82,893,175 | | | | 6,585,266 | | | | 95,354,646 | |
Shares redeemed | | | (41,692,641 | ) | | | (686,789,282 | ) | | | (39,735,152 | ) | | | (631,117,652 | ) |
| | | | |
Net increase (decrease) | | | (18,235,310 | ) | | $ | (298,991,452 | ) | | | (8,077,138 | ) | | $ | (141,255,692 | ) |
| | | | |
MS-27
Franklin Templeton Variable Insurance Products Trust
Notes to Financial Statements (continued)
Mutual Shares Securities Fund
2. SHARES OF BENEFICIAL INTEREST (continued)
| | | | | | | | | | | | | | | | |
| | | Year Ended December 31, | |
| | | 2012 | | | 2011 | |
| Class 4 Shares: | | Shares | | | Amount | | | Shares | | | Amount | |
Shares sold | | | 310,070 | | | $ | 5,137,019 | | | | 534,093 | | | $ | 8,261,151 | |
Shares issued on reinvestment of distributions | | | 187,598 | | | | 3,198,551 | | | | 256,538 | | | | 3,732,632 | |
Shares redeemed | | | (1,453,214 | ) | | | (23,964,132 | ) | | | (736,961 | ) | | | (11,654,315 | ) |
| | | | |
Net increase (decrease) | | | (955,546 | ) | | $ | (15,628,562 | ) | | | 53,670 | | | $ | 339,468 | |
| | | | |
3. TRANSACTIONS WITH AFFILIATES
Franklin Resources, Inc. is the holding company for various subsidiaries that together are referred to as Franklin Templeton Investments. Certain officers and trustees of the Fund are also officers and/or directors of the following subsidiaries:
| | |
| Subsidiary | | Affiliation |
Franklin Mutual Advisers, LLC (Franklin Mutual) | | Investment manager |
Franklin Templeton Services, LLC (FT Services) | | Administrative manager |
Franklin Templeton Distributors, Inc. (Distributors) | | Principal underwriter |
Franklin Templeton Investor Services, LLC (Investor Services) | | Transfer agent |
a. Management Fees
The Fund pays an investment management fee to Franklin Mutual based on the average daily net assets of the Fund as follows:
| | |
| Annualized Fee Rate | | Net Assets |
| 0.600% | | Up to and including $5 billion |
| 0.570% | | Over $5 billion, up to and including $10 billion |
| 0.550% | | Over $10 billion, up to and including $15 billion |
| 0.530% | | Over $15 billion, up to and including $20 billion |
| 0.510% | | In excess of $20 billion |
b. Administrative Fees
The Fund pays an administrative fee to FT Services based on the Fund’s average daily net assets as follows:
| | |
| Annualized Fee Rate | | Net Assets |
| 0.150% | | Up to and including $200 million |
| 0.135% | | Over $200 million, up to and including $700 million |
| 0.100% | | Over $700 million, up to and including $1.2 billion |
| 0.075% | | In excess of $1.2 billion |
c. Distribution Fees
The Board has adopted distribution plans for Class 2 and Class 4 shares pursuant to Rule 12b-1 under the 1940 Act. Under the Fund’s compensation distribution plans, the Fund pays Distributors for costs incurred in connection with the servicing, sale and distribution of the Fund’s shares up to 0.35% per year of its average daily net assets of each class. Some distribution fees are not charged on shares held by affiliates. The Board has agreed to limit the current rate to 0.25% per year for Class 2.
MS-28
Franklin Templeton Variable Insurance Products Trust
Notes to Financial Statements (continued)
Mutual Shares Securities Fund
3. TRANSACTIONS WITH AFFILIATES (continued)
d. Transfer Agent Fees
Investor Services, under terms of an agreement, performs shareholder servicing for the Fund and is not paid by the Fund for the services.
e. Other Affiliated Transactions
At December 31, 2012, Franklin Templeton Variable Insurance Products Trust – Franklin Templeton VIP Founding Funds Allocation Fund owned 6.74% of the Fund’s outstanding shares.
4. EXPENSE OFFSET ARRANGEMENT
The Fund has entered into an arrangement with its custodian whereby credits realized as a result of uninvested cash balances are used to reduce a portion of the Fund’s custodian expenses. During the year ended December 31, 2012, there were no credits earned.
5. INCOME TAXES
For tax purposes, capital losses may be carried over to offset future capital gains, if any. Capital loss carryforwards with no expiration, if any, must be fully utilized before those losses with expiration dates.
At December 31, 2012, the Fund had capital loss carryforwards of $326,538,425 expiring in 2017. During the year ended December 31, 2012, the Fund utilized $190,846,290 of capital loss carryforwards.
The tax character of distributions paid during the years ended December 31, 2012 and 2011, was as follows:
| | | | | | | | |
| | | 2012 | | | 2011 | |
Distributions paid from ordinary income | | $ | 119,434,515 | | | $ | 132,007,761 | |
| | | | |
At December 31, 2012, the cost of investments, net unrealized appreciation (depreciation), and undistributed ordinary income for income tax purposes were as follows:
| | | | |
Cost of investments | | $ | 4,188,657,256 | |
| | | | |
| |
Unrealized appreciation | | $ | 774,799,628 | |
Unrealized depreciation | | | (289,065,793 | ) |
| | | | |
Net unrealized appreciation (depreciation) | | $ | 485,733,835 | |
| | | | |
Distributable earnings - undistributed ordinary income | | $ | 106,140,526 | |
| | | | |
Differences between income and/or capital gains as determined on a book basis and a tax basis are primarily due to differing treatments of corporate actions and gains realized on in-kind shareholder redemptions.
MS-29
Franklin Templeton Variable Insurance Products Trust
Notes to Financial Statements (continued)
Mutual Shares Securities Fund
6. INVESTMENT TRANSACTIONS
Purchases and sales of investments (excluding short term securities) for the year ended December 31, 2012, aggregated $1,640,056,134 and $1,960,398,668, respectively. Sales of investments excludes redemptions in-kind of $918,607,583.
Transactions in options written during the year ended December 31, 2012, were as follows:
| | | | | | | | |
| | | Number of
Contracts | | | Premiums
Received | |
Options outstanding at December 31, 2011 | | | 122 | | | $ | 247,051 | |
Options written | | | 5,546 | | | | 996,243 | |
Options expired | | | (1,574 | ) | | | (255,587 | ) |
Options exercised | | | — | | | | — | |
Options closed | | | (4,094 | ) | | | (987,707 | ) |
| | | | |
Options outstanding at December 31, 2012 | | | — | | | $ | — | |
| | | | |
See Notes 1(c) and 10 regarding derivative financial instruments and other derivative information, respectively.
7. CREDIT RISK AND DEFAULTED SECURITIES
The Fund may purchase the pre-default or defaulted debt of distressed companies. Distressed companies are financially troubled and are about to be or are already involved in financial restructuring or bankruptcy. Risks associated with purchasing these securities include the possibility that the bankruptcy or other restructuring process takes longer than expected, or that distributions in restructuring are less than anticipated, either or both of which may result in unfavorable consequences to the Fund. If it becomes probable that the income on debt securities, including those of distressed companies, will not be collected, the Fund discontinues accruing income and recognizes an adjustment for uncollectible interest.
At December 31, 2012, the aggregate value of distressed company securities for which interest recognition has been discontinued was $30,640,162, representing 0.65% of the Fund’s net assets. For information as to specific securities, see the accompanying Statement of Investments.
8. RESTRICTED SECURITIES
The Fund invests in securities that are restricted under the Securities Act of 1933 (1933 Act) or which are subject to legal, contractual, or other agreed upon restrictions on resale. Restricted securities are often purchased in private placement transactions, and cannot be sold without prior registration unless the sale is pursuant to an exemption under the 1933 Act. Disposal of these securities may require greater effort and expense, and prompt sale at an acceptable price may be difficult. The Fund may have registration rights for restricted securities. The issuer generally incurs all registration costs.
MS-30
Franklin Templeton Variable Insurance Products Trust
Notes to Financial Statements (continued)
Mutual Shares Securities Fund
8. RESTRICTED SECURITIES (continued)
At December 31, 2012, the Fund held investments in restricted securities, excluding certain securities exempt from registration under the 1933 Act deemed to be liquid, as follows:
| | | | | | | | | | | | | | |
Principal
Amount/
Shares | | | Issuer | | Acquisition
Dates | | Cost | | | Value | |
| | 4,709,226 | | | AET&D Holdings No. 1 Pty. Ltd. | | 10/13/10 | | $ | — | | | $ | — | |
| | 493,723 | | | Bond Street Holdings LLC, A, 144A | | 11/04/09 - 9/19/11 | | | 10,060,509 | | | | 9,619,378 | |
| | 2,143 | | | Broadband Ventures III LLC, secured promissory note, 5.00%, 2/01/12 | | 7/01/10 - 11/30/12 | | | 2,143 | | | | — | |
| | 6,400,507 | | | CB FIM Coinvestors LLC | | 1/15/09 - 6/02/09 | | | — | | | | — | |
| | 8,006,950 | | | FIM Coinvestor Holdings I, LLC | | 11/20/06 - 6/02/09 | | | — | | | | — | |
| | 140,952 | | | First Southern Bancorp Inc. | | 1/27/10 - 7/07/10 | | | 2,974,087 | | | | 721,392 | |
| | 241 | | | First Southern Bancorp Inc., cvt. pfd., C | | 1/27/10 - 7/07/10 | | | 241,000 | | | | 457,541 | |
| | 1,730,515 | | | International Automotive Components Group Brazil LLC | | 4/13/06 - 12/26/08 | | | 1,149,241 | | | | 271,812 | |
| | 11,387,027 | | | International Automotive Components Group North America, LLC | | 1/12/06 - 10/10/07 | | | 11,193,197 | | | | 5,822,073 | |
| | 16,280 | | | Olympus Re Holdings Ltd. | | 12/19/01 | | | 1,529,085 | | | | — | |
| | 349,814 | | | aRealogy Holdings Corp. | | 10/12/12 | | | 11,893,676 | | | | 13,944,286 | |
| | 303,318 | | | bTribune Co., A | | 7/18/11 - 6/07/12 | | | 12,914,371 | | | | 12,914,371 | |
| | 185,976 | | | bTribune Co., B | | 7/18/11 - 6/07/12 | | | 7,918,300 | | | | 7,918,300 | |
| | | | | | | | | | |
| | | | Total Restricted Securities (Value is 1.10% of Net Assets) | | | | $ | 59,875,609 | | | $ | 51,669,153 | |
| | | | | | | | | | |
aThe Fund also invests in unrestricted securities or other investments in the issuer, valued at $13,372,293 as of December 31, 2012.
bThe Fund also invests in unrestricted securities or other investments in the issuer, valued at $— as of December 31, 2012.
9. UNFUNDED LOAN COMMITMENTS
The Fund enters into certain credit agreements, all or a portion of which may be unfunded. The Fund is obligated to fund these loan commitments at the borrowers’ discretion. Funded portions of credit agreements are presented on the Statement of Investments.
At December 31, 2012, unfunded commitments were as follows:
| | | | |
| Borrower | | Unfunded
Commitment | |
Realogy Corp., Extended Revolver, 7.211%, 4/10/16 | | $ | 5,595,214 | |
| | | | |
Unfunded loan commitments and funded portions of credit agreements are marked to market daily and any unrealized appreciation or depreciation is included in the Statement of Assets and Liabilities and the Statement of Operations.
MS-31
Franklin Templeton Variable Insurance Products Trust
Notes to Financial Statements (continued)
Mutual Shares Securities Fund
10. OTHER DERIVATIVE INFORMATION
At December 31, 2012, the Fund’s investments in derivative contracts are reflected on the Statement of Assets and Liabilities as follows:
| | | | | | | | | | | | |
| | | Asset Derivatives | | | Liability Derivatives | |
Derivative Contracts Not Accounted
for as Hedging Instruments | | Statement of Assets and
Liabilities Location | | Fair
Value
Amount | | | Statement of Assets and
Liabilities Location | | Fair Value
Amount | |
Foreign exchange contracts | | Unrealized appreciation on forward exchange contracts | | $ | 941,017 | | | Unrealized depreciation on forward exchange contracts / Net assets consist of – net unrealized appreciation (depreciation) | | $ | 16,772,629a | |
aIncludes cumulative appreciation (depreciation) of futures contracts as reported in the Statement of Investments. Only current day’s variation margin is separately reported within the Statement of Assets and Liabilities.
For the year ended December 31, 2012, the effect of derivative contracts on the Fund’s Statement of Operations was as follows:
| | | | | | | | | | |
Derivative Contracts Not Accounted
for as Hedging Instruments | | Statement of Operations Locations | | Realized Gain
(Loss) for the
Year | | | Change in
Unrealized
Appreciation
(Depreciation)
for the Year | |
Foreign exchange contracts | | Net realized gain (loss) from foreign currency transactions and futures contracts/Net change in unrealized appreciation (depreciation) on translation of other assets and liabilities denominated in foreign currencies | | $ | 22,041,276 | | | $ | (45,205,859 | ) |
Equity contracts | | Net realized gain (loss) from written options/Net change in unrealized appreciation (depreciation) on investments | | | 1,055,030 | | | | 96,989 | |
For the year ended December 31, 2012, the average month end market value of derivatives represented 0.35% of average month end net assets. The average month end number of open derivative contracts for the year was 117.
See Notes 1(c) and 6 regarding derivative financial instruments and investment transactions, respectively.
MS-32
Franklin Templeton Variable Insurance Products Trust
Notes to Financial Statements (continued)
Mutual Shares Securities Fund
11. HOLDINGS OF 5% VOTING SECURITIES OF PORTFOLIO COMPANIES
The 1940 Act defines “affiliated companies” to include investments in portfolio companies in which a fund owns 5% or more of the outstanding voting securities. Investments in “affiliated companies” for the Fund for the year ended December 31, 2012, were as shown below.
| | | | | | | | | | | | | | | | | | | | | | | | | | | | |
| Name of Issuer | | Number of
Shares
Held at Beginning
of Year | | | Gross
Additions | | | Gross
Reductions | | | Number of
Shares
Held at End
of Year | | | Value at
End of
Year | | | Investment
Income | | | Realized Capital
Gain (Loss) | |
Non-Controlled Affiliates | | | | | | | | | | | | | | | | | | | | | | | | | | | | |
CB FIM Coinvestors LLC | | | 6,400,507 | | | | — | | | | — | | | | 6,400,507 | | | $ | — | | | $ | — | | | $ | — | |
GLCP Harrah’s Investment LP | | | 5,565,600 | | | | — | | | | 5,565,600 | | | | — | | | | — | a | | | — | | | | — | |
| | | | | | | | | | | | | | | | | | | | |
Total Affiliated Securities (Value is 0.00% of Net Assets) | | | $ | — | | | $ | — | | | $ | — | |
| | | | | | | | | | | | | | | | | | | | |
aAs of December 31, 2012, no longer held.
12. CREDIT FACILITY
The Fund, together with other U.S. registered and foreign investment funds (collectively, Borrowers), managed by Franklin Templeton Investments, are borrowers in a joint syndicated senior unsecured credit facility totaling $1.5 billion (Global Credit Facility) which matured on January 18, 2013. This Global Credit Facility provides a source of funds to the Borrowers for temporary and emergency purposes, including the ability to meet future unanticipated or unusually large redemption requests. Effective January 18, 2013, the Borrowers renewed the Global Credit Facility which matures on January 17, 2014.
Under the terms of the Global Credit Facility, the Fund shall, in addition to interest charged on any borrowings made by the Fund and other costs incurred by the Fund, pay its share of fees and expenses incurred in connection with the implementation and maintenance of the Global Credit Facility, based upon its relative share of the aggregate net assets of all of the Borrowers, including an annual commitment fee of 0.07% based upon the unused portion of the Global Credit Facility. These fees are reflected in other expenses on the Statement of Operations. During the year ended December 31, 2012, the Fund did not use the Global Credit Facility.
13. REDEMPTION IN-KIND
During the year ended December 31, 2012, the Fund realized $139,199,450 of net gains resulting from a redemptions in-kind in which a shareholder redeemed fund shares for securities held by the Fund rather than for cash. Because such gains are not taxable to the Fund, and are not netted with capital gains that are distributed to remaining shareholders, they have been reclassified from accumulated net realized gains to paid-in capital.
14. FAIR VALUE MEASUREMENTS
The Fund follows a fair value hierarchy that distinguishes between market data obtained from independent sources (observable inputs) and the Fund’s own market assumptions (unobservable inputs). These inputs are used in determining the value of the Fund’s financial instruments and are summarized in the following fair value hierarchy:
| | • | | Level 1 – quoted prices in active markets for identical financial instruments |
| | • | | Level 2 – other significant observable inputs (including quoted prices for similar financial instruments, interest rates, prepayment speed, credit risk, etc.) |
| | • | | Level 3 – significant unobservable inputs (including the Fund’s own assumptions in determining the fair value of financial instruments) |
MS-33
Franklin Templeton Variable Insurance Products Trust
Notes to Financial Statements (continued)
Mutual Shares Securities Fund
14. FAIR VALUE MEASUREMENTS (continued)
The inputs or methodology used for valuing financial instruments are not an indication of the risk associated with investing in those financial instruments.
For movements between the levels within the fair value hierarchy, the Fund has adopted a policy of recognizing the transfers as of the date of the underlying event which caused the movement. Additionally, at December 31, 2012, due to market events, the Fund employed fair value procedures to value a portion of its holdings. Such procedures resulted in a temporary transfer of financial instruments valued at $672,841,183 from Level 1 to Level 2 within the fair value hierarchy.
A summary of inputs used as of December 31, 2012, in valuing the Fund’s assets and liabilities carried at fair value, is as follows:
| | | | | | | | | | | | | | | | |
| | | Level 1 | | | Level 2 | | | Level 3 | | | Total | |
| | | | |
Assets: | | | | | | | | | | | | | | | | |
Investments in Securities | | | | | | | | | | | | | | | | |
Equity Investments:a | | | | | | | | | | | | | | | | |
Auto Components | | $ | — | | | $ | — | | | $ | 6,093,885 | | | $ | 6,093,885 | |
Beverages | | | 70,632,794 | | | | 50,571,103 | | | | — | | | | 121,203,897 | |
Chemicals | | | — | | | | 32,446,717 | | | | — | b | | | 32,446,717 | |
Commercial Banks | | | 145,116,454 | | | | — | | | | 10,798,311 | | | | 155,914,765 | |
Diversified Financial Services | | | 108,169,058 | | | | 35,416,588 | | | | — | | | | 143,585,646 | |
Diversified Telecommunication Services | | | — | | | | — | | | | 186,307 | b | | | 186,307 | |
Media | | | 231,361,532 | | | | 129,804,919 | | | | — | | | | 361,166,451 | |
Metals & Mining | | | — | | | | 31,962,537 | | | | — | | | | 31,962,537 | |
Multi-Utilities | | | — | | | | 23,742,615 | | | | — | | | | 23,742,615 | |
Oil, Gas & Consumable Fuels | | | 337,243,146 | | | | 120,748,480 | | | | — | | | | 457,991,626 | |
Real Estate Management & Development | | | 4,524,048 | | | | — | | | | 19,768,490 | | | | 24,292,538 | |
Software | | | 135,775,321 | | | | 10,750,715 | | | | — | | | | 146,526,036 | |
Tobacco | | | 120,760,467 | | | | 178,613,577 | | | | — | | | | 299,374,044 | |
Wireless Telecommunication Services | | | — | | | | 79,616,602 | | | | — | | | | 79,616,602 | |
Other Equity Investmentsc | | | 2,078,200,465 | | | | — | | | | — | b | | | 2,078,200,465 | |
Corporate Bonds, Notes and Senior Floating Rate Interests | | | — | | | | 235,778,402 | | | | — | | | | 235,778,402 | |
Corporate Notes in Reorganization | | | — | | | | 30,640,162 | | | | — | b | | | 30,640,162 | |
Companies in Liquidation | | | — | | | | 87,947 | | | | — | b | | | 87,947 | |
Asset-Backed Securities | | | — | | | | 4,506,959 | | | | — | | | | 4,506,959 | |
Short Term Investments | | | 424,556,310 | | | | 16,517,180 | | | | — | | | | 441,073,490 | |
| | | | |
Total Investments in Securities | | $ | 3,656,339,595 | | | $ | 981,204,503 | | | $ | 36,846,993 | | | $ | 4,674,391,091 | |
| | | | |
Forward Exchange Contracts | | $ | — | | | $ | 941,017 | | | $ | — | | | $ | 941,017 | |
Liabilities: | | | | | | | | | | | | | | | | |
Forward Exchange Contracts | | | — | | | | 14,703,665 | | | | — | | | | 14,703,665 | |
Futures Contracts | | | 2,068,964 | | | | — | | | | — | | | | 2,068,964 | |
Unfunded Loan Commitments | | | — | | | | 153,770 | | | | — | | | | 153,770 | |
aIncludes common and convertible preferred stocks as well as other equity investments.
bIncludes securities determined to have no value at December 31, 2012.
cFor detailed categories, see the accompanying Statement of Investments.
A reconciliation of assets in which Level 3 inputs are used in determining fair value is presented when there are significant Level 3 investments at the end of the year.
MS-34
Franklin Templeton Variable Insurance Products Trust
Notes to Financial Statements (continued)
Mutual Shares Securities Fund
15. NEW ACCOUNTING PRONOUNCEMENTS
In December 2011, the Financial Accounting Standards Board (FASB) issued Accounting Standards Update (ASU) No. 2011-11, Balance Sheet (Topic 210): Disclosures about Offsetting Assets and Liabilities. The amendments in the ASU enhance disclosures about offsetting of financial assets and liabilities to enable investors to understand the effect of these arrangements on a fund’s financial position. In January 2013, FASB issued ASU No. 2013-01, Balance Sheet (Topic 210): Clarifying the Scope of Disclosures about Offsetting Assets and Liabilities. The amendments in ASU No. 2013-01 clarify the intended scope of disclosures required by ASU No. 2011-11. These ASUs are effective for interim and annual reporting periods beginning on or after January 1, 2013. The Fund believes the adoption of these ASUs will not have a material impact on its financial statements.
16. SUBSEQUENT EVENTS
The Fund has evaluated subsequent events through the issuance of the financial statements and determined that no events have occurred that require disclosure other than those already disclosed in the financial statements.
| | | | |
ABBREVIATIONS | | | | |
| Counterparty | | Currency | | Selected Portfolio |
| | | | |
| BOFA - Bank of America Corp. | | EUR - Euro | | ADR - American Depositary Receipt |
| BZWS - Barclays Bank PLC | | GBP - British Pound | | FHLB - Federal Home Loan Bank |
| DBAB - Deutsche Bank AG | | JPY - Japanese Yen | | FRN - Floating Rate Note |
| FBCO - Credit Suisse Group AG | | USD - United States Dollar | | PIK - Payment-In-Kind |
| HAND - Svenska Handelsbanken | | | | |
| HSBC - HSBC Bank USA, N.A. | | | | |
| SCBT - Standard Chartered Bank | | | | |
MS-35
Franklin Templeton Variable Insurance Products Trust
Mutual Shares Securities Fund
Report of Independent Registered Public Accounting Firm
To the Board of Trustees and Shareholders of Franklin Templeton Variable Insurance Products Trust
In our opinion, the accompanying statement of assets and liabilities, including the statement of investments, and the related statements of operations and of changes in net assets and the financial highlights present fairly, in all material respects, the financial position of Mutual Shares Securities Fund (the “Fund”) at December 31, 2012, the results of its operations for the year then ended, the changes in its net assets for each of the two years in the period then ended and the financial highlights for the periods presented, in conformity with accounting principles generally accepted in the United States of America. These financial statements and financial highlights (hereafter referred to as “financial statements”) are the responsibility of the Fund’s management. Our responsibility is to express an opinion on these financial statements based on our audits. We conducted our audits of these financial statements in accordance with the standards of the Public Company Accounting Oversight Board (United States). Those standards require that we plan and perform the audit to obtain reasonable assurance about whether the financial statements are free of material misstatement. An audit includes examining, on a test basis, evidence supporting the amounts and disclosures in the financial statements, assessing the accounting principles used and significant estimates made by management, and evaluating the overall financial statement presentation. We believe that our audits, which included confirmation of securities at December 31, 2012 by correspondence with the custodian and brokers, provide a reasonable basis for our opinion.
PricewaterhouseCoopers LLP
San Francisco, California
February 15, 2013
MS-36
Franklin Templeton Variable Insurance Products Trust
Tax Information (unaudited)
Mutual Shares Securities Fund
Under Section 854(b)(1)(A) of the Internal Revenue Code (Code), the Fund hereby reports 63.35% of the ordinary income dividends as income qualifying for the dividends received deduction for the fiscal year ended December 31, 2012.
MS-37
TEMPLETON DEVELOPING MARKETS SECURITIES FUND
This annual report for Templeton Developing Markets Securities Fund covers the fiscal year ended December 31, 2012.
Performance Summary as of 12/31/12
Average annual total return of Class 2 shares represents the average annual change in value, assuming reinvestment of dividends and capital gains. Average returns smooth out variations in returns, which can be significant; they are not the same as year-by-year results.
Periods ended 12/31/12
| | | | | | | | | | | | |
| | | 1-Year | | | 5-Year | | | 10-Year | |
Average Annual Total Return | | | +13.16% | | | | -1.78% | | | | +13.87% | |
Total Return Index Comparison for a Hypothetical $10,000 Investment (1/1/03–12/31/12)
The graph below shows the change in value of a hypothetical $10,000 investment in the Fund over the indicated period and includes reinvestment of any income or distributions. The Fund’s performance is compared to the performance of MSCI Emerging Markets (EM) Index and the Standard & Poor’s®/International Finance Corporation Investable (S&P®/IFCI) Composite Index. One cannot invest directly in an index, and an index is not representative of the Fund’s portfolio. Please see Important Notes to Performance Information preceding the Fund Summaries.
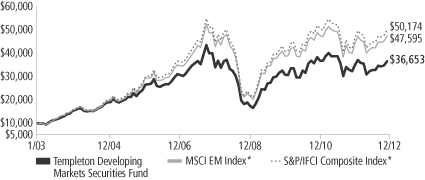
*Source: © 2013 Morningstar. Please see Index Descriptions following the Fund Summaries.
Templeton Developing Markets Securities Fund Class 2
Performance reflects the Fund’s Class 2 operating expenses, but does not include any contract fees, expenses or sales charges. If they had been included, performance would be lower. These charges and deductions, particularly for variable life policies, can have a significant effect on contract values and insurance benefits. See the contract prospectus for a complete description of these expenses, including sales charges.
Performance data represent past performance, which does not guarantee future results. Investment return and principal value will fluctuate, and you may have a gain or loss when you sell your shares.
Current performance may differ from figures shown.
TD-1
Fund Goal and Main Investments: Templeton Developing Markets Securities Fund seeks long-term capital appreciation. Under normal market conditions, the Fund invests at least 80% of its net assets in emerging market investments.
Performance Overview
You can find the Fund’s one-year total return in the Performance Summary. In comparison, the MSCI EM Index posted a total return of +18.63%, and the S&P/IFCI Composite Index produced a total return of +18.89% for the same period.1 Please note index performance numbers are for reference and we do not attempt to track an index but rather undertake investments on the basis of fundamental research.
Economic and Market Overview
Global equity markets started 2012 strongly as investor optimism about global economic growth toward the end of 2011 carried over into early 2012. However, market exuberance faded after February as global economic indicators, particularly China’s, weakened and concerns rose again about Europe’s ongoing sovereign debt crisis, leading to a sharp sell-off in May and early June that erased the gains from the earlier part of the year.
Equity prices globally rebounded beginning in June, with investors responding initially to significant monetary and fiscal stimulus from countries globally, and later, to evidence that stimulus measures were beginning to gain traction. Along with their developed market counterparts, emerging market countries such as China, India, Brazil and South Korea announced fiscal stimulus and monetary easing measures. Brazil unveiled a 133 billion real (approximately $66 billion) economic stimulus package in August, and the South Korean government followed its June fiscal stimulus package with another 5.9 trillion won (approximately $5.2 billion) package in September. In addition to adopting an expansionary monetary policy, China announced a 1 trillion yuan (approximately $158 billion) fiscal stimulus plan in September. In India, the government’s unexpected announcement of a series of reforms boosted investor confidence.
The effects of monetary easing programs implemented by governments globally were evident in the second half of 2012 as financial markets
1. Source: © 2013 Morningstar. One cannot invest directly in an index, and an index is not representative of the Fund’s portfolio. Please see Index Descriptions following the Fund Summaries.
Fund Risks: All investments involve risks, including possible loss of principal. Stock prices fluctuate, sometimes rapidly and dramatically, due to factors affecting individual companies, particular industries or sectors, or general market conditions. Value securities may not increase in price as anticipated or may decline further in value. Risks associated with foreign investing include currency fluctuations, economic instability and political developments. Investments in developing markets involve heightened risks related to the same factors, in addition to those associated with these markets’ smaller size and lesser liquidity. The Fund may focus on particular sectors of the market from time to time, which can carry greater risks of adverse developments in such sectors. Smaller or midsized companies can be particularly sensitive to changing economic conditions, and their prospects for growth are less certain than those of larger, more established companies. The Fund is designed for the aggressive portion of a well-diversified portfolio. The Fund is actively managed but there is no guarantee that the manager’s investment decisions will produce the desired results. The Fund’s prospectus also includes a description of the main investment risks.
TD-2
remained awash with liquidity. Net inflows into emerging market stock funds in 2012 offset 2011’s net outflows, with most inflows recorded in the second half of 2012.
Emerging market stocks recorded strong gains over the course of 2012, with all regions posting positive returns. For the 12 months ended December 31, 2012, the MSCI EM Index generated a total return of +18.63%, outperforming major developed markets such as the U.S., the U.K. and Japan, as well as recouping 2011 losses. Asian markets were among the top performers as strong economic growth, robust consumption and substantial investment inflows supported equity prices.
Investment Strategy
We employ a fundamental research, value-oriented, long-term investment approach. We focus on the market price of a company’s securities relative to our evaluation of its long-term earnings, asset value and cash flow potential. We also consider a company’s profit and loss outlook, balance sheet strength, cash flow trends and asset value in relation to the current price. Our analysis considers the company’s corporate governance behavior as well as its position in its sector, the economic framework and political environment. We invest in securities without regard to benchmark comparisons.
Manager’s Discussion
During the 12 months under review, major contributors to the Fund’s absolute performance included Brazil-based AmBev (Companhia de Bebidas das Americas), one of the world’s largest beer and soft drink producers; Kasikornbank, a leading commercial bank in Thailand; and LUKOIL Holdings, Russia’s largest oil company. AmBev’s strong market position has allowed the company to achieve robust returns and build market share as consumers become wealthier and more discerning. The company’s strong operations, high profit margins and popular brands make it an attractive investment in our view. Delays to beer tax increases and indications that AmBev’s product price increases and higher margin product mix were protecting earnings drove the company’s share price higher in the latter part of the reporting period. We believe Kasikornbank is well positioned to benefit from Thailand’s potentially strong economic growth as the country continues to recover from the 2011 floods and the government’s fiscal stimulus measures, including minimum wage increases, work through the economy. Investor sentiment further improved as signs that European banks’ deleveraging in Thailand has been working to the advantage of local lenders during the
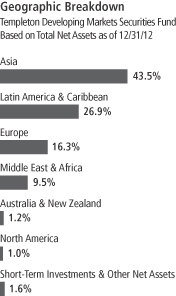
TD-3
recovery phase. LUKOIL’s strong earnings results in the third quarter of 2012 and plans for a multibillion dollar share buyback and higher dividends in the longer term supported the company’s share price. We maintained a positive view on the company because of its huge oil reserves, long-term uptrend in oil prices, low debt levels and valuations we considered to be attractive.
In contrast, key detractors from absolute performance included Itau Unibanco Holding, one of Brazil’s largest financial conglomerates; Yantai Changyu Pioneer Wine, a leading wine manufacturer in China; and TNK-BP Holding, one of Russia’s largest vertically integrated oil and gas companies. Itau Unibanco’s share price weakened as the Central Bank of Brazil’s interest rate cuts throughout most of 2012 threatened to affect the bank’s margins. In our view, cost-cutting initiatives undertaken by the bank could help offset lower spreads in the future. In the long term, we believe the bank could benefit from its strong market position as the Brazilian economy grows and consumer wealth increases. Concerns of fierce competition from existing and emerging domestic wineries, as well as foreign wineries, and the availability of opportunities we considered more attractive within the Fund’s investment universe led us to divest our investment in Yantai Changyu Pioneer Wine. Although TNK-BP improved its earnings in the third quarter, its share price was pressured by the market’s focus on the uncertainties associated with the sale of TNK-BP to Rosneft.
It is important to recognize the effect of currency movements on the Fund’s performance. In general, if the value of the U.S. dollar goes up compared with a foreign currency, an investment traded in that foreign currency will go down in value because it will be worth fewer U.S. dollars. This can have a negative effect on Fund performance. Conversely, when the U.S. dollar weakens in relation to a foreign currency, an investment traded in that foreign currency will increase in value, which can contribute to Fund performance. For the 12 months ended December 31, 2012, the U.S. dollar rose in value relative to many currencies in which the Fund’s investments were traded. As a result, the Fund’s performance was negatively affected by the portfolio’s investment predominantly in securities with non-U.S. currency exposure.
In the past 12 months, our continued search for investments we considered to be attractive led us to increase the Fund’s holdings in Hong Kong, South Korea and China via Hong Kong-listed China H and Red
Top 10 Holdings
Templeton Developing Markets Securities Fund
12/31/12
| | | | |
Company
Sector/Industry,
Country | | % of Total
Net Assets | |
| AmBev (Companhia de Bebidas das Americas) | | | 10.0% | |
| Beverages, Brazil | | | | |
| PT Astra International Tbk | | | 6.3% | |
| Automobiles, Indonesia | | | | |
| Souza Cruz SA | | | 5.2% | |
| Tobacco, Brazil | | | | |
| Tata Consultancy Services Ltd. | | | 5.1% | |
| IT Services, India | | | | |
| LUKOIL Holdings, ADR | | | 3.9% | |
| Oil, Gas & Consumable Fuels, Russia | | | | |
| Kasikornbank PCL, fgn. | | | 3.5% | |
| Commercial Banks, Thailand | | | | |
| PetroChina Co. Ltd., H | | | 3.5% | |
| Oil, Gas & Consumable Fuels, China | | | | |
| Antofagasta PLC | | | 3.1% | |
| Metals & Mining, Chile | | | | |
| Samsung Electronics Co. Ltd. | | | 2.9% | |
| Semiconductors & Semiconductor Equipment, South Korea | | | | |
| CNOOC Ltd. | | | 2.7% | |
| Oil, Gas & Consumable Fuels, China | | | | |
The dollar value, number of shares or principal amount, and names of all portfolio holdings are listed in the Fund’s Statement of Investments.
TD-4
Chip shares and to initiate investments in Colombia.2 We also added to the Fund’s investments in faster growing frontier markets by initiating positions in Saudi Arabia, Turkmenistan and Kenya and by increasing the Fund’s holdings in Nigeria and Qatar as we identified stocks with fundamentals we considered to be attractive. We increased the Fund’s investments in wireless telecommunication services, specialty and catalog retail, casinos and gaming, and electronic products companies. Key purchases included new positions in China Mobile, the country’s leading mobile services provider, and Dragon Oil, an independent oil company operating oilfields in the Caspian Sea off the shores of Turkmenistan, as well as an additional investment in Yanzhou Coal Mining, one of China’s largest coal producers.
Conversely, we reduced the Fund’s investments in India, Brazil and Russia and eliminated our position in Taiwan to focus on stocks we considered to be more attractively valued within our investment universe. We reduced the Fund’s holdings largely in diversified metals and mining, food retailing, oil and gas, and diversified banking companies. Key sales included elimination of our position in President Chain Store, the operator of 7-Eleven stores in Taiwan, as well as reductions of our investments in Brazil-based Vale, the world’s largest iron ore producer and exporter, and Bank Central Asia, a major Indonesian bank.
Thank you for your participation in Templeton Developing Markets Securities Fund. We look forward to serving your future investment needs.
2. “China H” denotes shares of China-incorporated, Hong Kong Stock Exchange-listed companies with most businesses in China. “Red Chip” denotes shares of Hong Kong Stock Exchange-listed companies with significant exposure to China.
The foregoing information reflects our analysis, opinions and portfolio holdings as of December 31, 2012, the end of the reporting period. The way we implement our main investment strategies and the resulting portfolio holdings may change depending on factors such as market and economic conditions. These opinions may not be relied upon as investment advice or an offer for a particular security. The information is not a complete analysis of every aspect of any market, country, industry, security or the Fund. Statements of fact are from sources considered reliable, but the investment manager makes no representation or warranty as to their completeness or accuracy. Although historical performance is no guarantee of future results, these insights may help you understand our investment management philosophy.
Top 10 Countries
Templeton Developing Markets Securities Fund 12/31/12
| | | | |
| | | % of Total
Net Assets | |
| Brazil | | | 19.8% | |
| China | | | 13.3% | |
| Russia | | | 13.2% | |
| Indonesia | | | 8.5% | |
| Hong Kong | | | 7.6% | |
| India | | | 6.1% | |
| Chile | | | 5.1% | |
| Thailand | | | 4.6% | |
| South Africa | | | 3.4% | |
| South Korea | | | 2.9% | |
TD-5
Fund Expenses
As an investor in a variable insurance contract (Contract) that indirectly provides for investment in an underlying mutual fund, you can incur transaction and/or ongoing expenses at both the Fund level and the Contract level.
| • | | Transaction expenses can include sales charges (loads) on purchases, redemption fees, surrender fees, transfer fees and premium taxes. |
| • | | Ongoing expenses can include management fees, distribution and service (12b-1) fees, contract fees, annual maintenance fees, mortality and expense risk fees and other fees and expenses. All mutual funds and Contracts have some types of ongoing expenses. |
The expenses shown in the table are meant to highlight ongoing expenses at the Fund level only and do not include ongoing expenses at the Contract level, or transaction expenses at either the Fund or Contract level. While the Fund does not have transaction expenses, if the transaction and ongoing expenses at the Contract level were included, the expenses shown below would be higher. You should consult your Contract prospectus or disclosure document for more information.
The table shows Fund-level ongoing expenses and can help you understand these expenses and compare them with those of other mutual funds offered through the Contract. The table assumes a $1,000 investment held for the six months indicated. Please refer to the Fund prospectus for additional information on operating expenses.
Actual Fund Expenses
The first line (Actual) of the table provides actual account values and expenses. The “Ending Account Value” is derived from the Fund’s actual return, which includes the effect of ongoing Fund expenses, but does not include the effect of ongoing Contract expenses.
You can estimate the Fund-level expenses you incurred during the period by following these steps. Of course, your account value and expenses will differ from those in this illustration:
| 1. | Divide your account value by $1,000. |
If an account had an $8,600 value, then $8,600 ÷ $1,000 = 8.6.
| 2. | Multiply the result by the number under the heading “Fund-Level Expenses Incurred During Period.” |
If Fund-Level Expenses Incurred During Period were $7.50, then 8.6 x $7.50 = $64.50.
In this illustration, the estimated expenses incurred this period at the Fund level are $64.50.
Templeton Developing Markets Securities Fund Class 2
TD-6
Hypothetical Example for Comparison with Other Mutual Funds
Information in the second line (Hypothetical) of the table can help you compare ongoing expenses of the Fund with those of other mutual funds offered through the Contract. This information may not be used to estimate the actual ending account balance or expenses you incurred during the period. The hypothetical “Ending Account Value” is based on the Fund’s actual expense ratio and an assumed 5% annual rate of return before expenses, which does not represent the Fund’s actual return. The figure under the heading “Fund-Level Expenses Incurred During Period” shows the hypothetical expenses your account would have incurred under this scenario. You can compare this figure with the 5% hypothetical examples that appear in shareholder reports of other funds offered through a Contract.
| | | | | | | | | | | | |
| Class 2 | | Beginning
Account Value 7/1/12 | | | Ending
Account Value 12/31/12 | | | Fund-Level Expenses Incurred
During Period* 7/1/12–12/31/12 | |
Actual | | $ | 1,000 | | | $ | 1,129.00 | | | $ | 8.56 | |
Hypothetical (5% return
before expenses) | | $ | 1,000 | | | $ | 1,017.09 | | | $
| 8.11
|
|
*Expenses are calculated using the most recent six-month annualized expense ratio for the Fund’s Class 2 shares (1.60%), which does not include any ongoing expenses of the Contract for which the Fund is an investment option, multiplied by the average account value over the period, multiplied by 184/366 to reflect the one-half year period.
TD-7
Franklin Templeton Variable Insurance Products Trust
Financial Highlights
Templeton Developing Markets Securities Fund
| | | | | | | | | | | | | | | | | | | | |
| | | Year Ended December 31, | |
| Class 1 | | 2012 | | | 2011 | | | 2010 | | | 2009 | | | 2008 | |
| | | | |
Per share operating performance | | | | | | | | | | | | | | | | | | | | |
(for a share outstanding throughout the year) | | | | | | | | | | | | | | | | | | | | |
Net asset value, beginning of year | | $ | 9.50 | | | $ | 11.40 | | | $ | 9.86 | | | $ | 6.11 | | | $ | 16.16 | |
| | | | |
Income from investment operationsa: | | | | | | | | | | | | | | | | | | | | |
Net investment incomeb | | | 0.19 | | | | 0.17 | | | | 0.09 | | | | 0.12 | | | | 0.16 | |
Net realized and unrealized gains (losses) | | | 1.06 | | | | (1.94 | ) | | | 1.63 | | | | 4.02 | | | | (7.40 | ) |
| | | | |
Total from investment operations | | | 1.25 | | | | (1.77 | ) | | | 1.72 | | | | 4.14 | | | | (7.24 | ) |
| | | | |
Less distributions from: | | | | | | | | | | | | | | | | | | | | |
Net investment income | | | (0.17 | ) | | | (0.13 | ) | | | (0.18 | ) | | | (0.36 | ) | | | (0.37 | ) |
Net realized gains | | | — | | | | — | | | | — | | | | (0.03 | ) | | | (2.44 | ) |
| | | | |
Total distributions | | | (0.17 | ) | | | (0.13 | ) | | | (0.18 | ) | | | (0.39 | ) | | | (2.81 | ) |
| | | | |
Redemption feesc | | | — | | | | — | | | | — | | | | — | | | | — | |
| | | | |
Net asset value, end of year | | $ | 10.58 | | | $ | 9.50 | | | $ | 11.40 | | | $ | 9.86 | | | $ | 6.11 | |
| | | | |
| | | | | |
Total returnd | | | 13.40% | | | | (15.67)% | | | | 17.83% | | | | 73.32% | | | | (52.62)% | |
Ratios to average net assets | | | | | | | | | | | | | | | | | | | | |
Expenses | | | 1.35% | | | | 1.40% | | | | 1.49%e | | | | 1.45%e | | | | 1.52%e | |
Net investment income | | | 1.93% | | | | 1.57% | | | | 0.87% | | | | 1.64% | | | | 1.52% | |
| | | | | |
Supplemental data | | | | | | | | | | | | | | | | | | | | |
Net assets, end of year (000’s) | | $ | 203,568 | | | $ | 232,544 | | | $ | 347,242 | | | $ | 325,927 | | | $ | 234,213 | |
Portfolio turnover rate | | | 24.45% | | | | 14.90% | | | | 24.41% | | | | 56.58%f | | | | 75.11%f | |
aThe amount shown for a share outstanding throughout the period may not correlate with the Statement of Operations for the period due to the timing of sales and repurchases of the Fund shares in relation to income earned and/or fluctuating market value of the investments of the Fund.
bBased on average daily shares outstanding.
cAmount rounds to less than $0.01 per share.
dTotal return does not include fees, charges or expenses imposed by the variable annuity and life insurance contracts for which the Franklin Templeton Variable Insurance Products Trust serves as an underlying investment vehicle.
eBenefit of expense reduction rounds to less than 0.01%.
fExcludes the value of portfolio securities delivered as a result of redemptions in-kind.
The accompanying notes are an integral part of these financial statements.
TD-8
Franklin Templeton Variable Insurance Products Trust
Financial Highlights (continued)
Templeton Developing Markets Securities Fund
| | | | | | | | | | | | | | | | | | | | |
| | | Year Ended December 31, | |
| Class 2 | | 2012 | | | 2011 | | | 2010 | | | 2009 | | | 2008 | |
| | | | |
Per share operating performance | | | | | | | | | | | | | | | | | | | | |
(for a share outstanding throughout the year) | | | | | | | | | | | | | | | | | | | | |
Net asset value, beginning of year | | $ | 9.42 | | | $ | 11.30 | | | $ | 9.78 | | | $ | 6.04 | | | $ | 15.99 | |
| | | | |
Income from investment operationsa: | | | | | | | | | | | | | | | | | | | | |
Net investment incomeb | | | 0.17 | | | | 0.14 | | | | 0.06 | | | | 0.11 | | | | 0.15 | |
Net realized and unrealized gains (losses) | | | 1.05 | | | | (1.92 | ) | | | 1.62 | | | | 3.98 | | | | (7.33 | ) |
| | | | |
Total from investment operations | | | 1.22 | | | | (1.78 | ) | | | 1.68 | | | | 4.09 | | | | (7.18 | ) |
| | | | |
Less distributions from: | | | | | | | | | | | | | | | | | | | | |
Net investment income | | | (0.14 | ) | | | (0.10 | ) | | | (0.16 | ) | | | (0.32 | ) | | | (0.33 | ) |
Net realized gains | | | — | | | | — | | | | — | | | | (0.03 | ) | | | (2.44 | ) |
| | | | |
Total distributions | | | (0.14 | ) | | | (0.10 | ) | | | (0.16 | ) | | | (0.35 | ) | | | (2.77 | ) |
| | | | |
Redemption feesc | | | — | | | | — | | | | — | | | | — | | | | — | |
| | | | |
Net asset value, end of year | | $ | 10.50 | | | $ | 9.42 | | | $ | 11.30 | | | $ | 9.78 | | | $ | 6.04 | |
| | | | |
| | | | | |
Total returnd | | | 13.16% | | | | (15.86)% | | | | 17.58% | | | | 72.59% | | | | (52.70)% | |
Ratios to average net assets | | | | | | | | | | | | | | | | | | | | |
Expenses | | | 1.60% | | | | 1.65% | | | | 1.74%e | | | | 1.70%e | | | | 1.77%e | |
Net investment income | | | 1.68% | | | | 1.32% | | | | 0.62% | | | | 1.39% | | | | 1.27% | |
| | | | | |
Supplemental data | | | | | | | | | | | | | | | | | | | | |
Net assets, end of year (000’s) | | $ | 291,638 | | | $ | 295,223 | | | $ | 392,546 | | | $ | 435,947 | | | $ | 264,186 | |
Portfolio turnover rate | | | 24.45% | | | | 14.90% | | | | 24.41% | | | | 56.58%f | | | | 75.11%f | |
aThe amount shown for a share outstanding throughout the period may not correlate with the Statement of Operations for the period due to the timing of sales and repurchases of the Fund shares in relation to income earned and/or fluctuating market value of the investments of the Fund.
bBased on average daily shares outstanding.
cAmount rounds to less than $0.01 per share.
dTotal return does not include fees, charges or expenses imposed by the variable annuity and life insurance contracts for which the Franklin Templeton Variable Insurance Products Trust serves as an underlying investment vehicle.
eBenefit of expense reduction rounds to less than 0.01%.
fExcludes the value of portfolio securities delivered as a result of redemptions in-kind.
The accompanying notes are an integral part of these financial statements.
TD-9
Franklin Templeton Variable Insurance Products Trust
Financial Highlights (continued)
Templeton Developing Markets Securities Fund
| | | | | | | | | | | | | | | | | | | | |
| | | Year Ended December 31, | |
| Class 3 | | 2012 | | | 2011 | | | 2010 | | | 2009 | | | 2008 | |
| | | | |
Per share operating performance | | | | | | | | | | | | | | | | | | | | |
(for a share outstanding throughout the year) | | | | | | | | | | | | | | | | | | | | |
Net asset value, beginning of year | | $ | 9.36 | | | $ | 11.23 | | | $ | 9.73 | | | $ | 6.02 | | | $ | 15.96 | |
| | | | |
Income from investment operationsa: | | | | | | | | | | | | | | | | | | | | |
Net investment incomeb | | | 0.17 | | | | 0.14 | | | | 0.06 | | | | 0.10 | | | | 0.11 | |
Net realized and unrealized gains (losses) | | | 1.04 | | | | (1.91 | ) | | | 1.60 | | | | 3.97 | | | | (7.27 | ) |
| | | | |
Total from investment operations | | | 1.21 | | | | (1.77 | ) | | | 1.66 | | | | 4.07 | | | | (7.16 | ) |
| | | | |
Less distributions from: | | | | | | | | | | | | | | | | | | | | |
Net investment income | | | (0.14 | ) | | | (0.10 | ) | | | (0.16 | ) | | | (0.33 | ) | | | (0.34 | ) |
Net realized gains | | | — | | | | — | | | | — | | | | (0.03 | ) | | | (2.44 | ) |
| | | | |
Total distributions | | | (0.14 | ) | | | (0.10 | ) | | | (0.16 | ) | | | (0.36 | ) | | | (2.78 | ) |
| | | | |
Redemption feesc | | | — | | | | — | | | | — | | | | — | | | | — | |
| | | | |
Net asset value, end of year | | $ | 10.43 | | | $ | 9.36 | | | $ | 11.23 | | | $ | 9.73 | | | $ | 6.02 | |
| | | | |
| | | | | |
Total returnd | | | 13.16% | | | | (15.86)% | | | | 17.51% | | | | 72.63% | | | | (52.67)% | |
Ratios to average net assets | | | | | | | | | | | | | | | | | | | | |
Expenses | | | 1.60% | | | | 1.65% | | | | 1.74%e | | | | 1.70%e | | | | 1.77%e | |
Net investment income | | | 1.68% | | | | 1.32% | | | | 0.62% | | | | 1.39% | | | | 1.27% | |
| | | | | |
Supplemental data | | | | | | | | | | | | | | | | | | | | |
Net assets, end of year (000’s) | | $ | 48,277 | | | $ | 44,702 | | | $ | 66,484 | | | $ | 66,718 | | | $ | 32,953 | |
Portfolio turnover rate | | | 24.45% | | | | 14.90% | | | | 24.41% | | | | 56.58%f | | | | 75.11%f | |
aThe amount shown for a share outstanding throughout the period may not correlate with the Statement of Operations for the period due to the timing of sales and repurchases of the Fund shares in relation to income earned and/or fluctuating market value of the investments of the Fund.
bBased on average daily shares outstanding.
cAmount rounds to less than $0.01 per share.
dTotal return does not include fees, charges or expenses imposed by the variable annuity and life insurance contracts for which the Franklin Templeton Variable Insurance Products Trust serves as an underlying investment vehicle.
eBenefit of expense reduction rounds to less than 0.01%.
fExcludes the value of portfolio securities delivered as a result of redemptions in-kind.
The accompanying notes are an integral part of these financial statements.
TD-10
Franklin Templeton Variable Insurance Products Trust
Financial Highlights (continued)
Templeton Developing Markets Securities Fund
| | | | | | | | | | | | | | | | | | | | |
| | | Year Ended December 31, | |
| Class 4 | | 2012 | | | 2011 | | | 2010 | | | 2009 | | | 2008a | |
| | | | |
Per share operating performance | | | | | | | | | | | | | | | | | | | | |
(for a share outstanding throughout the year) | | | | | | | | | | | | | | | | | | | | |
Net asset value, beginning of year | | $ | 9.42 | | | $ | 11.30 | | | $ | 9.80 | | | $ | 6.09 | | | $ | 14.88 | |
| | | | |
Income from investment operationsb: | | | | | | | | | | | | | | | | | | | | |
Net investment income (loss)c | | | 0.16 | | | | 0.13 | | | | 0.05 | | | | 0.09 | | | | (0.33 | ) |
Net realized and unrealized gains (losses) | | | 1.04 | | | | (1.91 | ) | | | 1.61 | | | | 4.00 | | | | (5.65 | ) |
| | | | |
Total from investment operations | | | 1.20 | | | | (1.78 | ) | | | 1.66 | | | | 4.09 | | | | (5.98 | ) |
| | | | |
Less distributions from: | | | | | | | | | | | | | | | | | | | | |
Net investment income | | | (0.12 | ) | | | (0.10 | ) | | | (0.16 | ) | | | (0.35 | ) | | | (0.37 | ) |
Net realized gains | | | — | | | | — | | | | — | | | | (0.03 | ) | | | (2.44 | ) |
| | | | |
Total distributions | | | (0.12 | ) | | | (0.10 | ) | | | (0.16 | ) | | | (0.38 | ) | | | (2.81 | ) |
| | | | |
Redemption feesd | | | — | | | | — | | | | — | | | | — | | | | — | |
| | | | |
Net asset value, end of year | | $ | 10.50 | | | $ | 9.42 | | | $ | 11.30 | | | $ | 9.80 | | | $ | 6.09 | |
| | | | |
| | | | | |
Total returne | | | 13.06% | | | | (15.88)% | | | | 17.41% | | | | 72.45% | | | | (48.66)% | |
Ratios to average net assetsf | | | | | | | | | | | | | | | | | | | | |
Expenses | | | 1.70% | | | | 1.75% | | | | 1.84%g | | | | 1.80%g | | | | 1.87%g | |
Net investment income | | | 1.58% | | | | 1.22% | | | | 0.52% | | | | 1.29% | | | | 1.17% | |
| | | | | |
Supplemental data | | | | | | | | | | | | | | | | | | | | |
Net assets, end of year (000’s) | | $ | 23,341 | | | $ | 24,380 | | | $ | 37,198 | | | $ | 26,362 | | | $ | 7,208 | |
Portfolio turnover rate | | | 24.45% | | | | 14.90% | | | | 24.41% | | | | 56.58%h | | | | 75.11%h | |
aFor the period February 29, 2008 (effective date) to December 31, 2008.
bThe amount shown for a share outstanding throughout the period may not correlate with the Statement of Operations for the period due to the timing of sales and repurchases of the Fund shares in relation to income earned and/or fluctuating market value of the investments of the Fund.
cBased on average daily shares outstanding.
dAmount rounds to less than $0.01 per share.
eTotal return does not include fees, charges or expenses imposed by the variable annuity and life insurance contracts for which the Franklin Templeton Variable Insurance Products Trust serves as an underlying investment vehicle. Total return is not annualized for periods less than one year.
fRatios are annualized for periods less than one year.
gBenefit of expense reduction rounds to less than 0.01%.
hExcludes the value of portfolio securities delivered as a result of redemptions in-kind.
The accompanying notes are an integral part of these financial statements.
TD-11
Franklin Templeton Variable Insurance Products Trust
Statement of Investments, December 31, 2012
| | | | | | | | | | |
| Templeton Developing Markets Securities Fund | | Industry | | Shares | | | Value | |
Closed End Funds 0.6% | | | | | | | | | | |
Romania 0.6% | | | | | | | | | | |
SIF Banat-Crisana | | Diversified Financial Services | | | 1,457,300 | | | $ | 524,048 | |
SIF Moldova | | Diversified Financial Services | | | 1,525,345 | | | | 657,180 | |
SIF Muntenia | | Diversified Financial Services | | | 1,290,232 | | | | 294,582 | |
SIF Oltenia | | Diversified Financial Services | | | 1,826,291 | | | | 762,174 | |
SIF Transilvania | | Diversified Financial Services | | | 4,970,540 | | | | 1,050,025 | |
| | | | | | | | | | |
Total Closed End Funds (Cost $3,015,120) | | | | | | | | | 3,288,009 | |
| | | | | | | | | | |
Common Stocks 91.5% | | | | | | | | | | |
Australia 1.2% | | | | | | | | | | |
BHP Billiton Ltd. | | Metals & Mining | | | 180,668 | | | | 7,059,812 | |
| | | | | | | | | | |
Austria 0.8% | | | | | | | | | | |
Raiffeisen Bank International AG | | Commercial Banks | | | 104,495 | | | | 4,345,734 | |
| | | | | | | | | | |
Brazil 16.5% | | | | | | | | | | |
Companhia de Bebidas das Americas (AmBev) | | Beverages | | | 1,362,350 | | | | 56,607,663 | |
Itau Unibanco Holding SA, ADR | | Commercial Banks | | | 462,409 | | | | 7,611,252 | |
Souza Cruz SA | | Tobacco | | | 1,949,428 | | | | 29,506,727 | |
| | | | | | | | | | |
| | | | | | | | | 93,725,642 | |
| | | | | | | | | | |
Chile 3.1% | | | | | | | | | | |
Antofagasta PLC | | Metals & Mining | | | 794,779 | | | | 17,410,276 | |
| | | | | | | | | | |
China 13.3% | | | | | | | | | | |
Anhui Conch Cement Co. Ltd., H | | Construction Materials | | | 2,523,144 | | | | 9,180,692 | |
China Mobile Ltd. | | Wireless Telecommunication Services | | | 532,000 | | | | 6,195,026 | |
China Overseas Land & Investment Ltd. | | Real Estate Management & Development | | | 1,142,600 | | | | 3,405,575 | |
aChina Vanke Co. Ltd., B | | Real Estate Management & Development | | | 720,371 | | | | 1,161,851 | |
CNOOC Ltd. | | Oil, Gas & Consumable Fuels | | | 7,181,000 | | | | 15,547,522 | |
bGreat Wall Motor Co. Ltd., H | | Automobiles | | | 3,552,677 | | | | 11,093,163 | |
PetroChina Co. Ltd., H | | Oil, Gas & Consumable Fuels | | | 13,880,000 | | | | 19,592,555 | |
Yanzhou Coal Mining Co. Ltd., H | | Oil, Gas & Consumable Fuels | | | 5,488,000 | | | | 9,077,921 | |
| | | | | | | | | | |
| | | | | | | | | 75,254,305 | |
| | | | | | | | | | |
Colombia 1.1% | | | | | | | | | | |
Bancolombia SA, ADR | | Commercial Banks | | | 53,200 | | | | 3,542,056 | |
Ecopetrol SA, ADR | | Oil, Gas & Consumable Fuels | | | 41,261 | | | | 2,462,044 | |
| | | | | | | | | | |
| | | | | | | | | 6,004,100 | |
| | | | | | | | | | |
Hong Kong 7.6% | | | | | | | | | | |
Dairy Farm International Holdings Ltd. | | Food & Staples Retailing | | | 1,014,733 | | | | 11,073,321 | |
Giordano International Ltd. | | Specialty Retail | | | 2,516,000 | | | | 2,418,528 | |
I.T Ltd. | | Specialty Retail | | | 5,818,000 | | | | 2,424,714 | |
Luk Fook Holdings (International) Ltd. | | Specialty Retail | | | 2,126,313 | | | | 6,694,241 | |
cLuk Fook Holdings (International) Ltd., 144A | | Specialty Retail | | | 130,000 | | | | 409,277 | |
SJM Holdings Ltd. | | Hotels, Restaurants & Leisure | | | 6,221,030 | | | | 14,448,378 | |
VTech Holdings Ltd. | | Communications Equipment | | | 506,300 | | | | 5,673,643 | |
| | | | | | | | | | |
| | | | | | | | | 43,142,102 | |
| | | | | | | | | | |
Hungary 0.1% | | | | | | | | | | |
OTP Bank PLC | | Commercial Banks | | | 26,840 | | | | 504,992 | |
| | | | | | | | | | |
India 6.1% | | | | | | | | | | |
Grasim Industries Ltd. | | Construction Materials | | | 28,924 | | | | 1,667,196 | |
Tata Consultancy Services Ltd. | | IT Services | | | 1,250,630 | | | | 28,688,241 | |
Tata Motors Ltd. | | Automobiles | | | 753,700 | | | | 4,291,550 | |
| | | | | | | | | | |
| | | | | | | | | 34,646,987 | |
| | | | | | | | | | |
TD-12
Franklin Templeton Variable Insurance Products Trust
Statement of Investments, December 31, 2012 (continued)
| | | | | | | | | | |
| Templeton Developing Markets Securities Fund | | Industry | | Shares | | | Value | |
Common Stocks (continued) | | | | | | | | | | |
Indonesia 8.5% | | | | | | | | | | |
PT Astra International Tbk | | Automobiles | | | 45,325,000 | | | $ | 35,742,671 | |
PT Bank Central Asia Tbk | | Commercial Banks | | | 6,854,532 | | | | 6,472,243 | |
PT Bank Rakyat Indonesia (Persero) Tbk | | Commercial Banks | | | 8,664,000 | | | | 6,247,969 | |
| | | | | | | | | | |
| | | | | | | | | 48,462,883 | |
| | | | | | | | | | |
Kazakhstan 0.2% | | | | | | | | | | |
c,dKCell JSC, 144A, GDR | | Wireless Telecommunication
Services | | | 88,000 | | | | 1,045,000 | |
| | | | | | | | | | |
Kenya 0.9% | | | | | | | | | | |
British American Tobacco Kenya Ltd. Corp. | | Tobacco | | | 79,928 | | | | 450,756 | |
Equity Bank Ltd. | | Commercial Banks | | | 9,089,352 | | | | 2,510,141 | |
Kenya Commercial Bank Ltd. | | Commercial Banks | | | 6,577,200 | | | | 2,313,492 | |
| | | | | | | | | | |
| | | | | | | | | 5,274,389 | |
| | | | | | | | | | |
Mexico 0.9% | | | | | | | | | | |
Kimberly Clark de Mexico SAB de CV, A | | Household Products | | | 1,952,613 | | | | 5,045,590 | |
| | | | | | | | | | |
Nigeria 1.2% | | | | | | | | | | |
FBN Holdings PLC | | Commercial Banks | | | 20,111,493 | | | | 2,025,961 | |
Guinness Nigeria PLC | | Beverages | | | 482,717 | | | | 850,126 | |
Nigerian Breweries PLC | | Beverages | | | 4,303,824 | | | | 4,051,631 | |
Unilever Nigeria PLC | | Household Products | | | 216,216 | | | | 65,079 | |
| | | | | | | | | | |
| | | | | | | | | 6,992,797 | |
| | | | | | | | | | |
Qatar 1.0% | | | | | | | | | | |
Industries Qatar QSC | | Industrial Conglomerates | | | 134,425 | | | | 5,725,947 | |
| | | | | | | | | | |
Russia 13.2% | | | | | | | | | | |
Gazprom, ADR | | Oil, Gas & Consumable Fuels | | | 351,200 | | | | 3,417,176 | |
Gazprom, ADR (London Stock Exchange) | | Oil, Gas & Consumable Fuels | | | 470,200 | | | | 4,450,443 | |
eLUKOIL Holdings, ADR | | Oil, Gas & Consumable Fuels | | | 75,208 | | | | 5,076,540 | |
eLUKOIL Holdings, ADR (London Stock Exchange) | | Oil, Gas & Consumable Fuels | | | 260,068 | | | | 17,210,000 | |
Mining and Metallurgical Co. Norilsk Nickel, ADR | | Metals & Mining | | | 251,243 | | | | 4,758,542 | |
Sberbank of Russia | | Commercial Banks | | | 4,803,540 | | | | 14,609,867 | |
TNK-BP Holding | | Oil, Gas & Consumable Fuels | | | 5,340,274 | | | | 9,998,104 | |
fUralkali OJSC, GDR, Reg S | | Chemicals | | | 401,096 | | | | 15,361,977 | |
| | | | | | | | | | |
| | | | | | | | | 74,882,649 | |
| | | | | | | | | | |
Singapore 0.3% | | | | | | | | | | |
Keppel Corp. Ltd. | | Industrial Conglomerates | | | 197,557 | | | | 1,804,226 | |
| | | | | | | | | | |
South Africa 3.4% | | | | | | | | | | |
Remgro Ltd. | | Diversified Financial Services | | | 678,624 | | | | 12,843,868 | |
Tiger Brands Ltd. | | Food Products | | | 167,332 | | | | 6,470,715 | |
| | | | | | | | | | |
| | | | | | | | | 19,314,583 | |
| | | | | | | | | | |
South Korea 2.9% | | | | | | | | | | |
Samsung Electronics Co. Ltd. | | Semiconductors &
Semiconductor Equipment | | | 11,308 | | | | 16,181,016 | |
| | | | | | | | | | |
Sweden 0.4% | | | | | | | | | | |
Oriflame Cosmetics SA, SDR | | Personal Products | | | 76,076 | | | | 2,417,619 | |
| | | | | | | | | | |
Switzerland 0.1% | | | | | | | | | | |
Compagnie Financiere Richemont SA | | Textiles, Apparel & Luxury Goods | | | 3,735 | | | | 291,341 | |
| | | | | | | | | | |
TD-13
Franklin Templeton Variable Insurance Products Trust
Statement of Investments, December 31, 2012 (continued)
| | | | | | | | | | |
| Templeton Developing Markets Securities Fund | | Industry | | Shares | | | Value | |
Common Stocks (continued) | | | | | | | | | | |
Thailand 4.6% | | | | | | | | | | |
Kasikornbank PCL, fgn. | | Commercial Banks | | | 3,116,500 | | | $ | 19,710,500 | |
PTT Exploration and Production PCL, fgn. | | Oil, Gas & Consumable Fuels | | | 561,480 | | | | 3,009,731 | |
PTT PCL, fgn. | | Oil, Gas & Consumable Fuels | | | 335,700 | | | | 3,642,831 | |
| | | | | | | | | | |
| | | | | | | | | 26,363,062 | |
| | | | | | | | | | |
Turkmenistan 0.9% | | | | | | | | | | |
Dragon Oil PLC | | Oil, Gas & Consumable Fuels | | | 551,476 | | | | 5,002,586 | |
| | | | | | | | | | |
United Arab Emirates 1.6% | | | | | | | | | | |
Emaar Properties PJSC | | Real Estate Management & Development | | | 8,942,377 | | | | 9,129,719 | |
| | | | | | | | | | |
United States 1.0% | | | | | | | | | | |
Avon Products Inc. | | Personal Products | | | 391,680 | | | | 5,624,525 | |
| | | | | | | | | | |
Vietnam 0.2% | | | | | | | | | | |
Dong Phu Rubber JSC | | Chemicals | | | 104,160 | | | | 270,784 | |
Hau Giang Pharmaceutical JSC | | Pharmaceuticals | | | 95,800 | | | | 335,880 | |
Vinacafe Bien Hoa JSC | | Food Products | | | 68,500 | | | | 527,691 | |
| | | | | | | | | | |
| | | | | | | | | 1,134,355 | |
| | | | | | | | | | |
Zimbabwe 0.4% | | | | | | | | | | |
Delta Corp. Ltd. | | Beverages | | | 2,114,695 | | | | 2,114,695 | |
| | | | | | | | | | |
Total Common Stocks (Cost $322,391,156) | | | | | | | | | 518,900,932 | |
| | | | | | | | | | |
gParticipatory Notes 1.0% | | | | | | | | | | |
Saudi Arabia 1.0% | | | | | | | | | | |
cDeutsche Bank AG/London, Saudi Dairy & Foodstuff Co., 144A, 5/13/14 | | Food Products | | | 17,146 | | | | 296,010 | |
HSBC Bank PLC, Etihad Etisalat Co., 12/05/14 | | Wireless Telecommunication Services | | | 273,520 | | | | 5,542,526 | |
| | | | | | | | | | |
Total Participatory Notes (Cost $5,485,786) | | | | | | | | | 5,838,536 | |
| | | | | | | | | | |
Preferred Stocks 5.3% | | | | | | | | | | |
Brazil 3.3% | | | | | | | | | | |
Itausa—Investimentos Itau SA, pfd. | | Commercial Banks | | | 1,241,305 | | | | 5,993,666 | |
Vale SA, ADR, pfd., A | | Metals & Mining | | | 617,082 | | | | 12,526,764 | |
| | | | | | | | | | |
| | | | | | | | | 18,520,430 | |
| | | | | | | | | | |
Chile 2.0% | | | | | | | | | | |
Embotelladora Andina SA, pfd., A | | Beverages | | | 2,228,017 | | | | 11,356,273 | |
| | | | | | | | | | |
Total Preferred Stocks (Cost $13,959,833) | | | | | | | | | 29,876,703 | |
| | | | | | | | | | |
Total Investments before Short Term Investments (Cost $344,851,895) | | | | | | | | | 557,904,180 | |
| | | | | | | | | | |
TD-14
Franklin Templeton Variable Insurance Products Trust
Statement of Investments, December 31, 2012 (continued)
| | | | | | | | | | |
| Templeton Developing Markets Securities Fund | | | | Shares | | | Value | |
Short Term Investments 1.5% | | | | | | | | | | |
Money Market Funds (Cost $7,835,244) 1.4% | | | | | | | | | | |
United States 1.4% | | | | | | | | | | |
d,h Institutional Fiduciary Trust Money Market Portfolio | | | | | 7,835,244 | | | $ | 7,835,244 | |
| | | | | | | | | | |
iInvestments from Cash Collateral Received for Loaned Securities (Cost $519,746) 0.1% | | | | | | | | | | |
Money Market Funds 0.1% | | | | | | | | | | |
United States 0.1% | | | | | | | | | | |
j BNY Mellon Overnight Government Fund, 0.191% | | | | | 519,746 | | | | 519,746 | |
| | | | | | | | | | |
Total Investments (Cost $353,206,885) 99.9% | | | | | | | | | 566,259,170 | |
Other Assets, less Liabilities 0.1% | | | | | | | | | 563,940 | |
| | | | | | | | | | |
Net Assets 100.0% | | | | | | | | $ | 566,823,110 | |
| | | | | | | | | | |
See Abbreviations on page TD-27.
aSecurity has been deemed illiquid because it may not be able to be sold within seven days. At December 31, 2012, the value of this security was $1,161,851, representing 0.20% of net assets.
bA portion or all of the security is on loan at December 31, 2012. See Note 1(d).
cSecurity was purchased pursuant to Rule 144A under the Securities Act of 1933 and may be sold in transactions exempt from registration only to qualified institutional buyers or in a public offering registered under the Securities Act of 1933. This security has been deemed liquid under guidelines approved by the Trust’s Board of Trustees. At December 31, 2012, the value of this security was $1,750,287, representing 0.31% of net assets.
dNon-income producing.
eAt December 31, 2012, pursuant to the Fund’s policies and the requirements of applicable securities law, the Fund may be restricted from trading these securities for a limited or extended period of time due to ownership limits and/or potential possession of material non-public information.
fSecurity was purchased pursuant to Regulation S under the Securities Act of 1933, which exempts from registration securities offered and sold outside of the United States. Such a security cannot be sold in the United States without either an effective registration statement filed pursuant to the Securities Act of 1933, or pursuant to an exemption from registration. This security has been deemed liquid under guidelines approved by the Trust’s Board of Trustees. At December 31, 2012, the value of this security was $15,361,977, representing 2.71% of net assets.
gSee Note 1(c) regarding Participatory Notes.
hSee Note 7 regarding investments in the Institutional Fiduciary Trust Money Market Portfolio.
iSee Note 1(d) regarding securities on loan.
jThe rate shown is the annualized seven-day yield at period end.
The accompanying notes are an integral part of these financial statements.
TD-15
Franklin Templeton Variable Insurance Products Trust
Financial Statements
Statement of Assets and Liabilities
December 31, 2012
| | | | |
| | | Templeton
Developing Markets
Securities Fund | |
Assets: | | | | |
Investments in securities: | | | | |
Cost - Unaffiliated issuers | | $ | 345,371,641 | |
Cost - Sweep Money Fund (Note 7) | | | 7,835,244 | |
| | | | |
Total cost of investments | | $ | 353,206,885 | |
| | | | |
Value - Unaffiliated issuers | | $ | 558,423,926 | |
Value - Sweep Money Fund (Note 7) | | | 7,835,244 | |
| | | | |
Total value of investments (includes securities loaned in the amount of $484,447) | | | 566,259,170 | |
Cash | | | 347,851 | |
Foreign currency, at value (cost $1,107,097) | | | 1,106,264 | |
Receivables: | | | | |
Investment securities sold | | | 1,155,489 | |
Capital shares sold | | | 299,728 | |
Dividends | | | 939,544 | |
Foreign tax | | | 27,955 | |
Other assets | | | 13 | |
| | | | |
Total assets | | | 570,136,014 | |
| | | | |
Liabilities: | | | | |
Payables: | | | | |
Investment securities purchased | | | 902,926 | |
Capital shares redeemed | | | 682,389 | |
Affiliates | | | 738,933 | |
Reports to shareholders | | | 290,356 | |
Payable upon return of securities loaned | | | 519,746 | |
Deferred tax | | | 21,147 | |
Accrued expenses and other liabilities | | | 157,407 | |
| | | | |
Total liabilities | | | 3,312,904 | |
| | | | |
Net assets, at value | | $ | 566,823,110 | |
| | | | |
Net assets consist of: | | | | |
Paid-in capital | | $ | 444,351,078 | |
Undistributed net investment income | | | 3,581,480 | |
Net unrealized appreciation (depreciation) | | | 213,008,895 | |
Accumulated net realized gain (loss) | | | (94,118,343 | ) |
| | | | |
Net assets, at value | | $ | 566,823,110 | |
| | | | |
The accompanying notes are an integral part of these financial statements.
TD-16
Franklin Templeton Variable Insurance Products Trust
Financial Statements (continued)
Statement of Assets and Liabilities (continued)
December 31, 2012
| | | | |
| | | Templeton
Developing Markets
Securities Fund | |
Class 1: | | | | |
Net assets, at value | | $ | 203,567,592 | |
| | | | |
Shares outstanding | | | 19,236,831 | |
| | | | |
Net asset value and maximum offering price per share | | $ | 10.58 | |
| | | | |
Class 2: | | | | |
Net assets, at value | | $ | 291,638,175 | |
| | | | |
Shares outstanding | | | 27,775,202 | |
| | | | |
Net asset value and maximum offering price per share | | $ | 10.50 | |
| | | | |
Class 3: | | | | |
Net assets, at value | | $ | 48,276,843 | |
| | | | |
Shares outstanding | | | 4,627,350 | |
| | | | |
Net asset value and maximum offering price per sharea | | $ | 10.43 | |
| | | | |
Class 4: | | | | |
Net assets, at value | | $ | 23,340,500 | |
| | | | |
Shares outstanding | | | 2,221,879 | |
| | | | |
Net asset value and maximum offering price per share | | $ | 10.50 | |
| | | | |
aRedemption price is equal to net asset value less redemption fees retained by the Fund.
The accompanying notes are an integral part of these financial statements.
TD-17
Franklin Templeton Variable Insurance Products Trust
Financial Statements (continued)
Statement of Operations
for the year ended December 31, 2012
| | | | |
| | | Templeton
Developing Markets
Securities Fund | |
Investment income: | | | | |
Dividends (net of foreign taxes of $1,825,370) | | $ | 19,101,579 | |
Income from securities loaned | | | 89,245 | |
| | | | |
Total investment income | | | 19,190,824 | |
| | | | |
Expenses: | | | | |
Management fees (Note 3a) | | | 6,421,154 | |
Administrative fees (Note 3b) | | | 820,111 | |
Distribution fees: (Note 3c) | | | | |
Class 2 | | | 738,441 | |
Class 3 | | | 124,192 | |
Class 4 | | | 83,857 | |
Unaffiliated transfer agent fees | | | 1,097 | |
Custodian fees (Note 4) | | | 347,364 | |
Reports to shareholders | | | 250,378 | |
Professional fees | | | 61,425 | |
Trustees’ fees and expenses | | | 2,385 | |
Other | | | 18,676 | |
| | | | |
Total expenses | | | 8,869,080 | |
| | | | |
Net investment income | | | 10,321,744 | |
| | | | |
Realized and unrealized gains (losses): | | | | |
Net realized gain (loss) from: | | | | |
Investments | | | 37,874,580 | |
Foreign currency transactions | | | (686,924 | ) |
| | | | |
Net realized gain (loss) | | | 37,187,656 | |
| | | | |
Net change in unrealized appreciation (depreciation) on: | | | | |
Investments | | | 25,554,023 | |
Translation of other assets and liabilities denominated in foreign currencies | | | 394 | |
Change in deferred taxes on unrealized appreciation | | | (21,147 | ) |
| | | | |
Net change in unrealized appreciation (depreciation) | | | 25,533,270 | |
| | | | |
Net realized and unrealized gain (loss) | | | 62,720,926 | |
| | | | |
Net increase (decrease) in net assets resulting from operations | | $ | 73,042,670 | |
| | | | |
The accompanying notes are an integral part of these financial statements.
TD-18
Franklin Templeton Variable Insurance Products Trust
Financial Statements (continued)
Statements of Changes in Net Assets
| | | | | | | | |
| | | Templeton Developing Markets
Securities Fund | |
| | | Year Ended December 31, | |
| | | 2012 | | | 2011 | |
| | | | |
Increase (decrease) in net assets: | | | | | | | | |
Operations: | | | | | | | | |
Net investment income | | $ | 10,321,744 | | | $ | 10,217,132 | |
Net realized gain (loss) from investments and foreign currency transactions | | | 37,187,656 | | | | 41,092,169 | |
Net change in unrealized appreciation (depreciation) on investments, translation of other assets and liabilities denominated in foreign currencies and deferred taxes | | | 25,533,270 | | | | (168,736,087 | ) |
| | | | |
Net increase (decrease) in net assets resulting from operations | | | 73,042,670 | | | | (117,426,786 | ) |
| | | | |
Distributions to shareholders from: | | | | | | | | |
Net investment income: | | | | | | | | |
Class 1 | | | (3,523,272 | ) | | | (3,575,470 | ) |
Class 2 | | | (4,111,805 | ) | | | (3,331,863 | ) |
Class 3 | | | (716,639 | ) | | | (556,039 | ) |
Class 4 | | | (295,623 | ) | | | (314,405 | ) |
| | | | |
Total distributions to shareholders | | | (8,647,339 | ) | | | (7,777,777 | ) |
| | | | |
Capital share transactions: (Note 2) | | | | | | | | |
Class 1 | | | (52,933,691 | ) | | | (64,505,854 | ) |
Class 2 | | | (36,646,633 | ) | | | (37,899,841 | ) |
Class 3 | | | (1,195,085 | ) | | | (11,807,405 | ) |
Class 4 | | | (3,647,744 | ) | | | (7,237,721 | ) |
| | | | |
Total capital share transactions | | | (94,423,153 | ) | | | (121,450,821 | ) |
| | | | |
Redemption fees | | | 1,457 | | | | 34,912 | |
| | | | |
Net increase (decrease) in net assets | | | (30,026,365 | ) | | | (246,620,472 | ) |
| | | | |
Net assets: | | | | | | | | |
Beginning of year | | | 596,849,475 | | | | 843,469,947 | |
| | | | |
End of year | | $ | 566,823,110 | | | $ | 596,849,475 | |
| | | | |
Undistributed net investment income included in net assets: | | | | | | | | |
End of year | | $ | 3,581,480 | | | $ | 2,273,752 | |
| | | | |
The accompanying notes are an integral part of these financial statements.
TD-19
Franklin Templeton Variable Insurance Products Trust
Notes to Financial Statements
Templeton Developing Markets Securities Fund
1. ORGANIZATION AND SIGNIFICANT ACCOUNTING POLICIES
Franklin Templeton Variable Insurance Products Trust (Trust) is registered under the Investment Company Act of 1940, as amended, (1940 Act) as an open-end investment company, consisting of twenty separate funds. The Templeton Developing Markets Securities Fund (Fund) is included in this report. The financial statements of the remaining funds in the Trust are presented separately. Shares of the Fund are generally sold only to insurance company separate accounts to fund the benefits of variable life insurance policies or variable annuity contracts. The Fund offers four classes of shares: Class 1, Class 2, Class 3, and Class 4. Each class of shares differs by its distribution fees, voting rights on matters affecting a single class and its exchange privilege.
The following summarizes the Fund’s significant accounting policies.
a. Financial Instrument Valuation
The Fund’s investments in financial instruments are carried at fair value daily. Fair value is the price that would be received to sell an asset or paid to transfer a liability in an orderly transaction between market participants on the measurement date. Under procedures approved by the Trust’s Board of Trustees (the Board), the Fund’s administrator, investment manager and other affiliates have formed the Valuation and Liquidity Oversight Committee (VLOC). The VLOC provides administration and oversight of the Fund’s valuation policies and procedures, which are approved annually by the Board. Among other things, these procedures allow the Fund to utilize independent pricing services, quotations from securities and financial instrument dealers, and other market sources to determine fair value.
Equity securities and exchange traded funds listed on an exchange or on the NASDAQ National Market System are valued at the last quoted sale price or the official closing price of the day, respectively. Foreign equity securities are valued as of the close of trading on the foreign stock exchange on which the security is primarily traded, or the NYSE, whichever is earlier. The value is then converted into its U.S. dollar equivalent at the foreign exchange rate in effect at the close of the NYSE on the day that the value of the security is determined. Over-the-counter (OTC) securities are valued within the range of the most recent quoted bid and ask prices. Securities that trade in multiple markets or on multiple exchanges are valued according to the broadest and most representative market. Certain equity securities are valued based upon fundamental characteristics or relationships to similar securities. Investments in open-end mutual funds and non-registered money market funds are valued at the closing net asset value.
The Fund has procedures to determine the fair value of financial instruments for which market prices are not reliable or readily available. Under these procedures, the VLOC convenes on a regular basis to review such financial instruments and considers a number of factors, including significant unobservable valuation inputs, when arriving at fair value. The VLOC primarily employs a market-based approach which may use related or comparable assets or liabilities, recent transactions, market multiples, book values, and other relevant information for the investment to determine the fair value of the investment. An income-based valuation approach may also be used in which the anticipated future cash flows of the investment are discounted to calculate fair value. Discounts may also be applied due to the nature or duration of any restrictions on the disposition of the investments. Due to the inherent uncertainty of valuations of such investments, the fair values may differ significantly from the values that would have been used had an active market existed. The VLOC employs various methods for calibrating these valuation approaches including a regular review of key inputs and assumptions, transactional back-testing or disposition analysis, and reviews of any related market activity.
Trading in securities on foreign securities stock exchanges and OTC markets may be completed before the daily close of business on the NYSE. Occasionally, events occur between the time at which trading in a foreign security is completed and the close of the NYSE that might call into question the reliability of the value of a portfolio security held by the Fund. As a result, differences may arise between the value of the Fund’s portfolio securities as determined at the foreign market close and the latest indications of value at the close of the NYSE. In order to minimize the potential for these differences, the VLOC monitors price movements following the close of trading in foreign stock markets through a series of country specific market proxies (such as baskets of American Depositary Receipts, futures contracts and exchange traded funds). These price movements are measured against
TD-20
Franklin Templeton Variable Insurance Products Trust
Notes to Financial Statements (continued)
Templeton Developing Markets Securities Fund
1. ORGANIZATION AND SIGNIFICANT ACCOUNTING POLICIES (continued)
a. Financial Instrument Valuation (continued)
established trigger thresholds for each specific market proxy to assist in determining if an event has occurred that may call into question the reliability of the values of the foreign securities held by the Fund. If such an event occurs, the securities may be valued using fair value procedures, which may include the use of independent pricing services. At December 31, 2012, a market event occurred resulting in a portion of the securities held by the Fund being valued using fair value procedures.
b. Foreign Currency Translation
Portfolio securities and other assets and liabilities denominated in foreign currencies are translated into U.S. dollars based on the exchange rate of such currencies against U.S. dollars on the date of valuation. The Fund may enter into foreign currency exchange contracts to facilitate transactions denominated in a foreign currency. Purchases and sales of securities, income and expense items denominated in foreign currencies are translated into U.S. dollars at the exchange rate in effect on the transaction date. Portfolio securities and assets and liabilities denominated in foreign currencies contain risks that those currencies will decline in value relative to the U.S. dollar. Occasionally, events may impact the availability or reliability of foreign exchange rates used to convert the U.S. dollar equivalent value. If such an event occurs, the foreign exchange rate will be valued at fair value using procedures established and approved by the Board.
The Fund does not separately report the effect of changes in foreign exchange rates from changes in market prices on securities held. Such changes are included in net realized and unrealized gain or loss from investments on the Statement of Operations.
Realized foreign exchange gains or losses arise from sales of foreign currencies, currency gains or losses realized between the trade and settlement dates on securities transactions and the difference between the recorded amounts of dividends, interest, and foreign withholding taxes and the U.S. dollar equivalent of the amounts actually received or paid. Net unrealized foreign exchange gains and losses arise from changes in foreign exchange rates on foreign denominated assets and liabilities other than investments in securities held at the end of the reporting period.
c. Participatory Notes
The Fund invests in Participatory Notes (P-Notes). P-notes are promissory notes that are designed to offer a return linked to the performance of a particular underlying equity security or market. P-Notes are issued by banks or broker-dealers and allow the fund to gain exposure to common stocks in markets where direct investment is not allowed. Income received from P-Notes is recorded as dividend income in the Statement of Operations. P-Notes may contain various risks including the potential inability of the counterparty to fulfill their obligations under the terms of the contract. These securities may be more volatile and less liquid than other investments held by the Fund.
d. Securities Lending
The Fund participates in an agency based securities lending program. The Fund receives cash collateral against the loaned securities in an amount equal to at least 102% of the market value of the loaned securities. Collateral is maintained over the life of the loan in an amount not less than 100% of the market value of loaned securities, as determined at the close of fund business each day; any additional collateral required due to changes in security values is delivered to the Fund on the next business day. The collateral is invested in a non-registered money fund as indicated on the Statement of Investments. The Fund receives income from the investment of cash collateral, in addition to lending fees and rebates paid by the borrower. The Fund bears the market risk with respect to the collateral investment, securities loaned, and the risk that the agent may default on its obligations to the Fund. The securities lending agent has agreed to indemnify the Fund in the event of default by a third party borrower.
TD-21
Franklin Templeton Variable Insurance Products Trust
Notes to Financial Statements (continued)
Templeton Developing Markets Securities Fund
1. ORGANIZATION AND SIGNIFICANT ACCOUNTING POLICIES (continued)
e. Income and Deferred Taxes
It is the Fund’s policy to qualify as a regulated investment company under the Internal Revenue Code. The Fund intends to distribute to shareholders substantially all of its taxable income and net realized gains to relieve it from federal income and if applicable, excise taxes. As a result, no provision for U.S. federal income taxes is required.
The Fund may be subject to foreign taxation related to income received, capital gains on the sale of securities and certain foreign currency transactions in the foreign jurisdictions in which it invests. Foreign taxes, if any, are recorded based on the tax regulations and rates that exist in the foreign markets in which the Fund invests. When a capital gain tax is determined to apply the Fund records an estimated deferred tax liability in an amount that would be payable if the securities were disposed of on the valuation date.
The Fund recognizes the tax benefits of uncertain tax positions only when the position is “more likely than not” to be sustained upon examination by the tax authorities based on the technical merits of the tax position. As of December 31, 2012, and for all open tax years, the Fund has determined that no liability for unrecognized tax benefits is required in the Fund’s financial statements related to uncertain tax positions taken on a tax return (or expected to be taken on future tax returns). Open tax years are those that remain subject to examination and are based on each tax jurisdiction statute of limitation.
f. Security Transactions, Investment Income, Expenses and Distributions
Security transactions are accounted for on trade date. Realized gains and losses on security transactions are determined on a specific identification basis. Estimated expenses are accrued daily. Dividend income is recorded on the ex-dividend date except that certain dividends from foreign securities are recognized as soon as the Fund is notified of the ex-dividend date. Distributions to shareholders are recorded on the ex-dividend date and are determined according to income tax regulations (tax basis). Distributable earnings determined on a tax basis may differ from earnings recorded in accordance with accounting principles generally accepted in the United States of America. These differences may be permanent or temporary. Permanent differences are reclassified among capital accounts to reflect their tax character. These reclassifications have no impact on net assets or the results of operations. Temporary differences are not reclassified, as they may reverse in subsequent periods.
Common expenses incurred by the Trust are allocated among the funds based on the ratio of net assets of each fund to the combined net assets of the Trust. Fund specific expenses are charged directly to the fund that incurred the expense.
Realized and unrealized gains and losses and net investment income, not including class specific expenses, are allocated daily to each class of shares based upon the relative proportion of net assets of each class. Differences in per share distributions, by class, are generally due to differences in class specific expenses.
g. Accounting Estimates
The preparation of financial statements in accordance with accounting principles generally accepted in the United States of America requires management to make estimates and assumptions that affect the reported amounts of assets and liabilities at the date of the financial statements and the amounts of income and expenses during the reporting period. Actual results could differ from those estimates.
h. Redemption Fees
Redemptions and exchanges of interests in an insurance company subaccount that invests in Class 3 shares of the Fund will be subject to a 1.0% short term trading fee if the interest in the subaccount has been held for less than 60 days. Such fees are
TD-22
Franklin Templeton Variable Insurance Products Trust
Notes to Financial Statements (continued)
Templeton Developing Markets Securities Fund
1. ORGANIZATION AND SIGNIFICANT ACCOUNTING POLICIES (continued)
h. Redemption Fees (continued)
retained by the Fund and accounted for as an addition to paid-in capital, allocated to each class of shares based upon the relative proportion of net assets of each class.
i. Guarantees and Indemnifications
Under the Trust’s organizational documents, its officers and trustees are indemnified by the Trust against certain liabilities arising out of the performance of their duties to the Trust. Additionally, in the normal course of business, the Trust, on behalf of the Fund, enters into contracts with service providers that contain general indemnification clauses. The Trust’s maximum exposure under these arrangements is unknown as this would involve future claims that may be made against the Trust that have not yet occurred. Currently, the Trust expects the risk of loss to be remote.
2. SHARES OF BENEFICIAL INTEREST
At December 31, 2012, there were an unlimited number of shares authorized (without par value). Transactions in the Fund’s shares were as follows:
| | | | | | | | | | | | | | | | |
| | | Year Ended December 31, | |
| | | 2012 | | | 2011 | |
| Class 1 Shares: | | Shares | | | Amount | | | Shares | | | Amount | |
Shares sold | | | 1,107,285 | | | $ | 11,165,172 | | | | 2,813,987 | | | $ | 30,009,154 | |
Shares issued in reinvestment of distributions | | | 385,901 | | | | 3,523,272 | | | | 324,453 | | | | 3,575,470 | |
Shares redeemed | | | (6,733,412 | ) | | | (67,622,135 | ) | | | (9,124,103 | ) | | | (98,090,478 | ) |
| | | | |
Net increase (decrease) | | | (5,240,226 | ) | | $ | (52,933,691 | ) | | | (5,985,663 | ) | | $ | (64,505,854 | ) |
| | | | |
Class 2 Shares: | | | | | | | | | | | | | | | | |
Shares sold | | | 3,879,555 | | | $ | 38,012,902 | | | | 6,746,331 | | | $ | 70,699,788 | |
Shares issued in reinvestment of distributions | | | 453,341 | | | | 4,111,805 | | | | 304,558 | | | | 3,331,863 | |
Shares redeemed | | | (7,891,630 | ) | | | (78,771,340 | ) | | | (10,448,699 | ) | | | (111,931,492 | ) |
| | | | |
Net increase (decrease) | | | (3,558,734 | ) | | $ | (36,646,633 | ) | | | (3,397,810 | ) | | $ | (37,899,841 | ) |
| | | | |
Class 3 Shares: | | | | | | | | | | | | | | | | |
Shares sold | | | 998,194 | | | $ | 10,036,984 | | | | 848,211 | | | $ | 9,362,399 | |
Shares issued in reinvestment of distributions | | | 79,538 | | | | 716,639 | | | | 51,154 | | | | 556,039 | |
Shares redeemed | | | (1,224,195 | ) | | | (11,948,708 | ) | | | (2,043,372 | ) | | | (21,725,843 | ) |
| | | | |
Net increase (decrease) | | | (146,463 | ) | | $ | (1,195,085 | ) | | | (1,144,007 | ) | | $ | (11,807,405 | ) |
| | | | |
Class 4 Shares: | | | | | | | | | | | | | | | | |
Shares sold | | | 257,374 | | | $ | 2,544,613 | | | | 464,313 | | | $ | 5,040,717 | |
Shares issued on reinvestment of distributions | | | 32,558 | | | | 295,623 | | | | 28,739 | | | | 314,405 | |
Shares redeemed | | | (656,835 | ) | | | (6,487,980 | ) | | | (1,194,944 | ) | | | (12,592,843 | ) |
| | | | |
Net increase (decrease) | | | (366,903 | ) | | $ | (3,647,744 | ) | | | (701,892 | ) | | $ | (7,237,721 | ) |
| | | | |
TD-23
Franklin Templeton Variable Insurance Products Trust
Notes to Financial Statements (continued)
Templeton Developing Markets Securities Fund
3. TRANSACTIONS WITH AFFILIATES
Franklin Resources, Inc. is the holding company for various subsidiaries that together are referred to as Franklin Templeton Investments. Certain officers and trustees of the Fund are also officers and/or directors of the following subsidiaries:
| | |
| Subsidiary | | Affiliation |
Templeton Asset Management Ltd. (TAML) | | Investment manager |
Franklin Templeton Services, LLC (FT Services) | | Administrative manager |
Franklin Templeton Distributors, Inc. (Distributors) | | Principal underwriter |
Franklin Templeton Investor Services, LLC (Investor Services) | | Transfer agent |
a. Management Fees
The Fund pays an investment management fee to TAML based on the average daily net assets of the Fund as follows:
| | |
| Annualized Fee Rate | | Net Assets |
| 1.100% | | Up to and including $1 billion |
| 1.050% | | Over $1 billion, up to and including $5 billion |
| 1.000% | | Over $5 billion, up to and including $10 billion |
| 0.950% | | Over $10 billion, up to and including $15 billion |
| 0.900% | | Over $15 billion, up to and including $20 billion |
| 0.850% | | In excess of $20 billion |
b. Administrative Fees
The Fund pays an administrative fee to FT Services based on the Fund’s average daily net assets as follows:
| | |
| Annualized Fee Rate | | Net Assets |
| 0.150% | | Up to and including $200 million |
| 0.135% | | Over $200 million, up to and including $700 million |
| 0.100% | | Over $700 million, up to and including $1.2 billion |
| 0.075% | | In excess of $1.2 billion |
c. Distribution Fees
The Board has adopted distribution plans for Class 2, Class 3, and Class 4 shares pursuant to Rule 12b-1 under the 1940 Act. Under the Fund’s compensation distribution plans, the Fund pays Distributors for costs incurred in connection with the servicing, sale and distribution of the Fund’s shares up to 0.25%, 0.35%, and 0.35% per year of its average daily net assets of Class 2, Class 3, and Class 4, respectively. Some distribution fees are not charged on shares held by affiliates. The Board has agreed to limit the current rate to 0.25% per year for Class 3.
d. Transfer Agent Fees
Investor Services, under terms of an agreement, performs shareholder servicing for the Fund and is not paid by the Fund for the services.
4. EXPENSE OFFSET ARRANGEMENT
The Fund has entered into an arrangement with its custodian whereby credits realized as a result of uninvested cash balances are used to reduce a portion of the Fund’s custodian expenses. During the year ended December 31, 2012, there were no credits earned.
TD-24
Franklin Templeton Variable Insurance Products Trust
Notes to Financial Statements (continued)
Templeton Developing Markets Securities Fund
5. INCOME TAXES
For tax purposes, capital losses may be carried over to offset future capital gains, if any. Capital loss carryforwards with no expiration, if any, must be fully utilized before those losses with expiration dates.
At December 31, 2012, the Fund had capital loss carryforwards of $88,126,277 expiring in 2017. During the year ended December 31, 2012, the Fund utilized $37,266,586 of capital loss carryforwards.
The tax character of distributions paid during the years ended December 31, 2012 and 2011, was as follows:
| | | | | | | | |
| | | 2012 | | | 2011 | |
Distributions paid from ordinary income | | $ | 8,647,339 | | | $ | 7,777,777 | |
| | | | |
At December 31, 2012, the cost of investments, net unrealized appreciation (depreciation) and undistributed ordinary income for income tax purposes were as follows:
| | | | |
Cost of investments | | $ | 366,035,619 | |
| | | | |
| |
Unrealized appreciation | | $ | 213,583,936 | |
Unrealized depreciation | | | (13,360,385 | ) |
| | | | |
Net unrealized appreciation (depreciation) | | $ | 200,223,551 | |
| | | | |
Distributable earnings - undistributed ordinary income | | $ | 10,416,502 | |
| | | | |
Differences between income and/or capital gains as determined on a book basis and a tax basis are primarily due to differing treatments of foreign currency transactions, passive foreign investment company shares, and corporate actions.
6. INVESTMENT TRANSACTIONS
Purchases and sales of investments (excluding short term securities) for the year ended December 31, 2012, aggregated $139,316,597 and $201,621,832, respectively.
7. INVESTMENTS IN INSTITUTIONAL FIDUCIARY TRUST MONEY MARKET PORTFOLIO
The Fund invests in the Institutional Fiduciary Trust Money Market Portfolio (Sweep Money Fund), an open-end investment company managed by Franklin Advisers, Inc. (an affiliate of the investment manager). Management fees paid by the Fund are reduced on assets invested in the Sweep Money Fund, in an amount not to exceed the management and administrative fees paid by the Sweep Money Fund.
8. CONCENTRATION OF RISK
Investing in foreign securities may include certain risks and considerations not typically associated with investing in U.S. securities, such as fluctuating currency values and changing local and regional economic, political and social conditions, which may result in greater market volatility. In addition, certain foreign securities may not be as liquid as U.S. securities.
9. CREDIT FACILITY
The Fund, together with other U.S. registered and foreign investment funds (collectively, Borrowers), managed by Franklin Templeton Investments, are borrowers in a joint syndicated senior unsecured credit facility totaling $1.5 billion (Global Credit
TD-25
Franklin Templeton Variable Insurance Products Trust
Notes to Financial Statements (continued)
Templeton Developing Markets Securities Fund
9. CREDIT FACILITY (continued)
Facility) which matured on January 18, 2013. This Global Credit Facility provides a source of funds to the Borrowers for temporary and emergency purposes, including the ability to meet future unanticipated or unusually large redemption requests. Effective January 18, 2013, the Borrowers renewed the Global Credit Facility which matures on January 17, 2014.
Under the terms of the Global Credit Facility, the Fund shall, in addition to interest charged on any borrowings made by the Fund and other costs incurred by the Fund, pay its share of fees and expenses incurred in connection with the implementation and maintenance of the Global Credit Facility, based upon its relative share of the aggregate net assets of all of the Borrowers, including an annual commitment fee of 0.07% based upon the unused portion of the Global Credit Facility. These fees are reflected in other expenses on the Statement of Operations. During the year ended December 31, 2012, the Fund did not use the Global Credit Facility.
10. FAIR VALUE MEASUREMENTS
The Fund follows a fair value hierarchy that distinguishes between market data obtained from independent sources (observable inputs) and the Fund’s own market assumptions (unobservable inputs). These inputs are used in determining the value of the Fund’s financial instruments and are summarized in the following fair value hierarchy:
| | • | | Level 1 – quoted prices in active markets for identical financial instruments |
| | • | | Level 2 – other significant observable inputs (including quoted prices for similar financial instruments, interest rates, prepayment speed, credit risk, etc.) |
| | • | | Level 3 – significant unobservable inputs (including the Fund’s own assumptions in determining the fair value of financial instruments) |
The inputs or methodology used for valuing financial instruments are not an indication of the risk associated with investing in those financial instruments.
For movements between the levels within the fair value hierarchy, the Fund has adopted a policy of recognizing the transfers as of the date of the underlying event which caused the movement. Additionally, at December 31, 2012, due to market events and temporary trading halts, the Fund employed fair value procedures to value a portion of its holdings. Such procedures resulted in a temporary transfer of financial instruments valued at $160,414,800 from Level 1 to Level 2 within the fair value hierarchy.
TD-26
Franklin Templeton Variable Insurance Products Trust
Notes to Financial Statements (continued)
Templeton Developing Markets Securities Fund
10. FAIR VALUE MEASUREMENTS (continued)
A summary of inputs used as of December 31, 2012, in valuing the Fund’s assets carried at fair value, is as follows:
| | | | | | | | | | | | | | | | |
| | | Level 1 | | | Level 2 | | | Level 3 | | | Total | |
| | | | |
Assets: | | | | | | | | | | | | | | | | |
Investments in Securities: | | | | | | | | | | | | | | | | |
Closed End Funds | | $ | 3,288,009 | | | $ | — | | | $ | — | | | $ | 3,288,009 | |
Equity Investments:a | | | | | | | | | | | | | | | | |
Australia | | | — | | | | 7,059,812 | | | | — | | | | 7,059,812 | |
Austria | | | — | | | | 4,345,734 | | | | — | | | | 4,345,734 | |
Brazil | | | 20,138,016 | | | | 92,108,056 | | | | — | | | | 112,246,072 | |
Chile | | | 11,356,273 | | | | 17,410,276 | | | | — | | | | 28,766,549 | |
China | | | 74,092,454 | | | | 1,161,851 | | | | — | | | | 75,254,305 | |
Hong Kong | | | 32,068,781 | | | | 11,073,321 | | | | — | | | | 43,142,102 | |
Kazakhstan | | | — | | | | 1,045,000 | | | | — | | | | 1,045,000 | |
Singapore | | | — | | | | 1,804,226 | | | | — | | | | 1,804,226 | |
South Africa | | | — | | | | 19,314,583 | | | | — | | | | 19,314,583 | |
Turkmenistan | | | — | | | | 5,002,586 | | | | — | | | | 5,002,586 | |
Vietnam | | | — | | | | 1,134,355 | | | | — | | | | 1,134,355 | |
All Other Equity Investmentsb | | | 249,662,311 | | | | — | | | | — | | | | 249,662,311 | |
Participatory Notes | | | — | | | | 5,838,536 | | | | — | | | | 5,838,536 | |
Short Term Investments | | | 7,835,244 | | | | 519,746 | | | | — | | | | 8,354,990 | |
| | | | |
Total Investments in Securities | | $ | 398,441,088 | | | $ | 167,818,082 | | | $ | — | | | $ | 566,259,170 | |
| | | | |
aIncludes common and preferred stocks.
bFor detailed categories, see the accompanying Statement of Investments.
11. NEW ACCOUNTING PRONOUNCEMENTS
In December 2011, the Financial Accounting Standards Board (FASB) issued Accounting Standards Update (ASU) No. 2011-11, Balance Sheet (Topic 210): Disclosures about Offsetting Assets and Liabilities. The amendments in the ASU enhance disclosures about offsetting of financial assets and liabilities to enable investors to understand the effect of these arrangements on a fund’s financial position. In January 2013, FASB issued ASU No. 2013-01, Balance Sheet (Topic 210): Clarifying the Scope of Disclosures about Offsetting Assets and Liabilities. The amendments in ASU No. 2013-01 clarify the intended scope of disclosures required by ASU No. 2011-11. These ASUs are effective for interim and annual reporting periods beginning on or after January 1, 2013. The Fund believes the adoption of these ASUs will not have a material impact on its financial statements.
12. SUBSEQUENT EVENTS
The Fund has evaluated subsequent events through the issuance of the financial statements and determined that no events have occurred that require disclosure other than those already disclosed in the financial statements.
ABBREVIATIONS
Selected Portfolio
ADR - American Depositary Receipt
GDR - Global Depositary Receipt
SDR - Swedish Depositary Receipt
TD-27
Franklin Templeton Variable Insurance Products Trust
Templeton Developing Markets Securities Fund
Report of Independent Registered Public Accounting Firm
To the Board of Trustees and Shareholders of Franklin Templeton Variable Insurance Products Trust
In our opinion, the accompanying statement of assets and liabilities, including the statement of investments, and the related statements of operations and of changes in net assets and the financial highlights present fairly, in all material respects, the financial position of Templeton Developing Markets Securities Fund (the “Fund”) at December 31, 2012, the results of its operations for the year then ended, the changes in its net assets for each of the two years in the period then ended and the financial highlights for each of the periods presented, in conformity with accounting principles generally accepted in the United States of America. These financial statements and financial highlights (hereafter referred to as “financial statements”) are the responsibility of the Fund’s management. Our responsibility is to express an opinion on these financial statements based on our audits. We conducted our audits of these financial statements in accordance with the standards of the Public Company Accounting Oversight Board (United States). Those standards require that we plan and perform the audit to obtain reasonable assurance about whether the financial statements are free of material misstatement. An audit includes examining, on a test basis, evidence supporting the amounts and disclosures in the financial statements, assessing the accounting principles used and significant estimates made by management, and evaluating the overall financial statement presentation. We believe that our audits, which included confirmation of securities at December 31, 2012 by correspondence with the custodian, transfer agent and brokers, provide a reasonable basis for our opinion.
PricewaterhouseCoopers LLP
San Francisco, California
February 15, 2013
TD-28
Franklin Templeton Variable Insurance Products Trust
Tax Information (unaudited)
Templeton Developing Markets Securities Fund
Under Section 854(b)(1)(A) of the Internal Revenue Code (Code) the Fund hereby reports 1.33% of the ordinary income dividends as income qualifying for the dividends received deduction for the fiscal year ended December 31, 2012.
At December 31, 2012, more than 50% of the Fund’s total assets were invested in securities of foreign issuers. In most instances, foreign taxes were withheld from income paid to the Fund on these investments. The Fund elects to treat foreign taxes paid as allowed under Section 853 of the Internal Revenue Code. This election will allow shareholders of record as of the 2013 distribution date, to treat their proportionate share of foreign taxes paid by the Fund as having been paid directly by them. The shareholder shall consider these amounts as foreign taxes paid in the tax year in which they receive the Fund distribution.
TD-29
TEMPLETON FOREIGN SECURITIES FUND
We are pleased to bring you Templeton Foreign Securities Fund’s annual report for the fiscal year ended December 31, 2012.
Performance Summary as of 12/31/12
Average annual total return of Class 2 shares represents the average annual change in value, assuming reinvestment of dividends and capital gains. Average returns smooth out variations in returns, which can be significant; they are not the same as year-by-year results.
Periods ended 12/31/12
| | | | | | | | | | | | |
| | | 1-Year | | | 5-Year | | | 10-Year | |
Average Annual Total Return | | | +18.23% | | | | -1.32% | | | | +8.52% | |
Total Return Index Comparison
for a Hypothetical $10,000 Investment (1/1/03–12/31/12)
The graph below shows the change in value of a hypothetical $10,000 investment in the Fund over the indicated period and includes reinvestment of any income or distributions. The Fund’s performance is compared to the performance of the MSCI Europe, Australasia, Far East (EAFE) Index. One cannot invest directly in an index, and an index is not representative of the Fund’s portfolio. Please see Important Notes to Performance Information preceding the Fund Summaries.
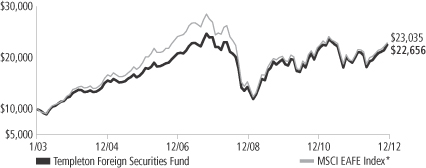
*Source: © 2013 Morningstar. Please see Index Descriptions following the Fund Summaries.
Templeton Foreign Securities Fund – Class 2
Performance reflects the Fund’s Class 2 operating expenses, but does not include any contract fees, expenses or sales charges. If they had been included, performance would be lower. These charges and deductions, particularly for variable life policies, can have a significant effect on contract values and insurance benefits. See the contract prospectus for a complete description of these expenses, including sales charges.
Performance data represent past performance, which does not guarantee future results. Investment return and principal value will fluctuate, and you may have a gain or loss when you sell your shares.
Current performance may differ from figures shown.
TF-1
Fund Goal and Main Investments: Templeton Foreign Securities Fund seeks long-term capital growth. Under normal market conditions, the Fund invests at least 80% of its net assets in investments of issuers located outside the U.S., including those in emerging markets.
Performance Overview
You can find the Fund’s one-year total return in the Performance Summary. The Fund performed comparably to its benchmark, the MSCI EAFE Index, which produced a +17.90% total return for the same period.1 Please note, index performance information is provided for reference and we do not attempt to track the index but rather undertake investments on the basis of fundamental research.
Economic and Market Overview
Global developed stocks, as measured by the MSCI World Index, rallied through the spring of 2012 before a brief drop in early summer gave way to a recovery, leading to solid 12-month gains.2 Periodic downturns were primarily attributable to concerns about slowing global economic growth, European sovereign debt and U.S. fiscal negotiations. The market’s focus early in 2012 was Europe’s debt crisis. Seeking to address it, relatively new leaders in Italy and Greece and for the International Monetary Fund, World Bank and European Central Bank (ECB) offered plans for stability and growth. The leadership’s initial policy responses — which included enhanced liquidity measures and an ineffective Spanish banking bailout — did little to address the structural imbalances of eurozone economies or the solvency fears plaguing the region’s banking system. Thus, debt yields for certain countries spiked to record levels in the first quarter of 2012. However, measures intended to address the seemingly toxic link between Europe’s banks and sovereign bonds emerged when European Union leaders agreed to a deployment of temporary and permanent bailout funds. ECB President Mario Draghi’s declaration that “the ECB is ready to do whatever it takes to preserve the euro” further buoyed markets.
In the U.S., the Federal Reserve Board announced additional rounds of quantitative easing and opted to extend its strategy designed to lower systemically important interest rates. In Asia, the People’s Bank of China cut borrowing costs for the first time since the global financial
1. Source: © 2013 Morningstar. One cannot invest directly in an index, and an index is not representative of the Fund’s portfolio. Please see Index Descriptions following the Fund Summaries.
2. Please see Index Descriptions following the Fund Summaries.
Fund Risks: All investments involve risks, including possible loss of principal. Special risks are associated with foreign investing, including currency fluctuations, economic instability and political developments; investments in emerging markets involve heightened risks related to the same factors. To the extent the Fund focuses on particular countries, regions, industries, sectors or types of investment from time to time, it may be subject to greater risks of adverse developments in such areas of focus than a fund that invests in a wider variety of countries, regions, industries, sectors or investments. Current political uncertainty surrounding the European Union (EU) and its membership may increase market volatility. The financial instability of some countries in the EU, including Greece, Italy and Spain, together with the risk of that impacting other more stable countries, may increase the economic risk of investing in companies in Europe. The Fund is actively managed but there is no guarantee that the manager’s investment decisions will produce the desired results. The Fund’s prospectus also includes a description of the main investment risks.
TF-2
crisis began, and the Bank of Japan launched its eighth round of quantitative easing in little more than a decade. Headwinds to growth negatively affected most world regions during 2012, including recently resilient emerging markets, and the International Monetary Fund lowered its global growth outlook. However, the slowdown appeared less severe than expected in developed markets such as Germany and the U.S. In the latter half of 2012, policy measures seemed to take hold and supported global economic recovery, contributing to expansion in many emerging market countries as well as a slowing rate of contraction in Europe. Toward year-end, investor focus shifted to the U.S., where policymakers sought to avert automatic spending cuts and tax hikes, commonly known as the “fiscal cliff.” Just after year-end, Congress passed compromise legislation that preserved lower income tax rates for most U.S. households and delayed far-reaching federal spending cuts. Despite adversity and uncertainty throughout the 12-month period, virtually all major asset classes finished 2012 with positive returns.
Investment Strategy
Our investment philosophy is bottom up, value oriented and long term. In choosing investments, we generally focus on the market price of a company’s securities relative to our evaluation of the company’s potential long-term earnings, asset value and cash flow. Among factors we consider are a company’s historical value measures, including price/earnings ratio, profit margins and liquidation value. We do in-depth research to construct a bargain list from which we buy.
Manager’s Discussion
During the year under review, our overweighting and stock selection in the financials sector were major contributors to Fund performance relative to the MSCI EAFE Index, including commercial banks BNP Paribas (France) and Lloyds Banking Group (U.K.); insurers Swiss Re (Switzerland), Aviva (U.K.), Muenchener Rueckversicherungs-Gesellschaft (Munich Reinsurance; Germany) and AXA (France); and diversified financial services provider ING Groep (Netherlands).3 Stock selection in health care, industrials, information technology and energy also aided relative results, with key contributors such as French pharmaceuticals company Sanofi; South Korean semiconductor, telecommunication and digital media products manufacturer Samsung
3. The financials sector comprises capital markets, commercial banks, diversified financial services, insurance, and real estate management and development in the SOI.
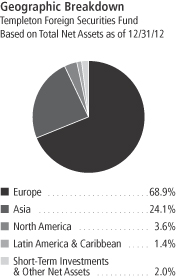
TF-3
Electronics;4 and Norwegian oilfield products and services provider Aker Solutions.5
In contrast, our overweighting in the telecommunication services sector was a significant detractor from Fund performance.6 Positions in U.K. wireless communications provider Vodafone Group and diversified telecommunication providers Telefonica (Spain), Telekom Austria (sold by period-end), France Telecom and China Telecom4 weighed on relative performance. Stock selection in the consumer staples sector also hurt relative results, and U.K. supermarket chain Tesco led the Fund’s sector losses due to slowing sales growth and falling margins.7 An underweighting in the consumer discretionary sector also hindered performance.8 Although the financials sector benefited performance overall, Italian commercial bank UniCredit lost value. Other notable detractors included personal computing and mobile communication device manufacturer Compal Electronics (Taiwan)4 and Norwegian oil and gas company Statoil.
From a geographic perspective, our stock selection in Asia benefited the Fund’s relative performance, as a number of our investments in Japan and South Korea4 performed well. Our exposure to China and Taiwan, however, was detrimental.4 In Europe our stock selection boosted results, particularly in the Netherlands, Switzerland and Norway, but our investments in Austria, Sweden and the U.K. hindered relative performance. In other regions, our exposure to Brazil and Canada weighed on results.4
It is important to recognize the effect of currency movements on the Fund’s performance. In general, if the value of the U.S. dollar goes up compared with a foreign currency, an investment traded in that foreign currency will go down in value because it will be worth fewer U.S. dollars. This can have a negative effect on Fund performance. Conversely, when the U.S. dollar weakens in relation to a foreign currency, an investment traded in that foreign currency will increase in value, which
4. Not an index component.
5. The health care sector comprises life sciences tools and services and pharmaceuticals in the SOI. The industrials sector comprises aerospace and defense, airlines, automobiles, commercial services and supplies, industrial conglomerates, professional services, and trading companies and distributors in the SOI. The information technology sector comprises communications equipment; computers and peripherals; electronic equipment, instruments and components; semiconductors and semiconductor equipment; and software in the SOI. The energy sector comprises energy equipment and services; and oil, gas and consumable fuels in the SOI.
6. The telecommunication services sector comprises diversified telecommunication services and wireless telecommunication services in the SOI.
7. The consumer staples sector comprises food and staples retailing in the SOI.
8. The consumer discretionary sector comprises automobiles, multiline retail and specialty retail in the SOI.
Top 10 Holdings
Templeton Foreign Securities Fund
12/31/12
| | | | |
Company Sector/Industry,
Country | | % of Total
Net Assets | |
| Sanofi | | | 3.7% | |
| Pharmaceuticals, France | | | | |
| Credit Suisse Group AG | | | 3.2% | |
| Capital Markets, Switzerland | | | | |
| BNP Paribas SA | | | 2.8% | |
| Commercial Banks, France | | | | |
| Roche Holding AG | | | 2.7% | |
| Pharmaceuticals, Switzerland | |
| Samsung Electronics Co. Ltd. | | | 2.7% | |
| Semiconductors & Semiconductor Equipment, South Korea | | | | |
| ING Groep NV | | | 2.5% | |
| Diversified Financial Services, Netherlands | | | | |
| GlaxoSmithKline PLC | | | 2.4% | |
| Pharmaceuticals, U.K. | | | | |
| Aviva PLC | | | 2.3% | |
| Insurance, U.K. | | | | |
| Tesco PLC | | | 2.2% | |
| Food & Staples Retailing, U.K. | |
| AXA SA | | | 2.1% | |
| Insurance, France | | | | |
The dollar value, number of shares or principal amount, and names of all portfolio holdings are listed in the Fund’s Statement of Investments (SOI).
TF-4
can contribute to Fund performance. For the 12 months ended December 31, 2012, the U.S. dollar declined in value relative to most currencies. As a result, the Fund’s performance was positively affected by the portfolio’s investment predominantly in securities with non-U.S. currency exposure. However, one cannot expect the same result in future periods.
Thank you for your participation in Templeton Foreign Securities Fund. We look forward to serving your future investment needs.
The foregoing information reflects our analysis, opinions and portfolio holdings as of December 31, 2012, the end of the reporting period. The way we implement our main investment strategies and the resulting portfolio holdings may change depending on factors such as market and economic conditions. These opinions may not be relied upon as investment advice or an offer for a particular security. The information is not a complete analysis of every aspect of any market, country, industry, security or the Fund. Statements of fact are from sources considered reliable, but the investment manager makes no representation or warranty as to their completeness or accuracy. Although historical performance is no guarantee of future results, these insights may help you understand our investment management philosophy.
TF-5
Fund Expenses
As an investor in a variable insurance contract (Contract) that indirectly provides for investment in an underlying mutual fund, you can incur transaction and/or ongoing expenses at both the Fund level and the Contract level.
| • | | Transaction expenses can include sales charges (loads) on purchases, redemption fees, surrender fees, transfer fees and premium taxes. |
| • | | Ongoing expenses can include management fees, distribution and service (12b-1) fees, contract fees, annual maintenance fees, mortality and expense risk fees and other fees and expenses. All mutual funds and Contracts have some types of ongoing expenses. |
The expenses shown in the table are meant to highlight ongoing expenses at the Fund level only and do not include ongoing expenses at the Contract level, or transaction expenses at either the Fund or Contract level. While the Fund does not have transaction expenses, if the transaction and ongoing expenses at the Contract level were included, the expenses shown below would be higher. You should consult your Contract prospectus or disclosure document for more information.
The table shows Fund-level ongoing expenses and can help you understand these expenses and compare them with those of other mutual funds offered through the Contract. The table assumes a $1,000 investment held for the six months indicated. Please refer to the Fund prospectus for additional information on operating expenses.
Actual Fund Expenses
The first line (Actual) of the table provides actual account values and expenses. The “Ending Account Value” is derived from the Fund’s actual return, which includes the effect of ongoing Fund expenses, but does not include the effect of ongoing Contract expenses.
You can estimate the Fund-level expenses you incurred during the period by following these steps. Of course, your account value and expenses will differ from those in this illustration:
| 1. | Divide your account value by $1,000. |
If an account had an $8,600 value, then $8,600 ÷ $1,000 = 8.6.
| 2. | Multiply the result by the number under the heading “Fund-Level Expenses Incurred During Period.” |
If Fund-Level Expenses Incurred During Period were $7.50, then 8.6 x $7.50 = $64.50.
In this illustration, the estimated expenses incurred this period at the Fund level are $64.50.
Templeton Foreign Securities Fund – Class 2
TF-6
Hypothetical Example for Comparison with Other Mutual Funds
Information in the second line (Hypothetical) of the table can help you compare ongoing expenses of the Fund with those of other mutual funds offered through the Contract. This information may not be used to estimate the actual ending account balance or expenses you incurred during the period. The hypothetical “Ending Account Value” is based on the Fund’s actual expense ratio and an assumed 5% annual rate of return before expenses, which does not represent the Fund’s actual return. The figure under the heading “Fund-Level Expenses Incurred During Period” shows the hypothetical expenses your account would have incurred under this scenario. You can compare this figure with the 5% hypothetical examples that appear in shareholder reports of other funds offered through a Contract.
| | | | | | | | | | | | |
| Class 2 | | Beginning
Account Value 7/1/12 | | | Ending
Account Value 12/31/12 | | | Fund-Level Expenses Incurred
During Period* 7/1/12–12/31/12 | |
Actual | | $ | 1,000 | | | $ | 1,166.40 | | | $ | 5.61 | |
Hypothetical (5% return before expenses) | | $ | 1,000 | | | $ | 1,019.96 | | | $ | 5.23 | |
*Expenses are calculated using the most recent six-month annualized expense ratio for the Fund’s Class 2 shares (1.03%), which does not include any ongoing expenses of the Contract for which the Fund is an investment option, multiplied by the average account value over the period, multiplied by 184/366 to reflect the one-half year period.
TF-7
Franklin Templeton Variable Insurance Products Trust
Financial Highlights
Templeton Foreign Securities Fund
| | | | | | | | | | | | | | | | | | | | |
| | | Year Ended December 31, | |
| Class 1 | | 2012 | | | 2011 | | | 2010 | | | 2009 | | | 2008 | |
| | | | |
Per share operating performance | | | | | | | | | | | | | | | | | | | | |
(for a share outstanding throughout the year) | | | | | | | | | | | | | | | | | | | | |
Net asset value, beginning of year | | $ | 12.78 | | | $ | 14.54 | | | $ | 13.68 | | | $ | 10.95 | | | $ | 20.57 | |
| | | | |
Income from investment operationsa: | | | | | | | | | | | | | | | | | | | | |
Net investment incomeb | | | 0.38 | | | | 0.42 | | | | 0.28 | | | | 0.25 | | | | 0.45 | |
Net realized and unrealized gains (losses) | | | 1.91 | | | | (1.90 | ) | | | 0.86 | | | | 3.39 | | | | (8.01 | ) |
| | | | |
Total from investment operations | | | 2.29 | | | | (1.48 | ) | | | 1.14 | | | | 3.64 | | | | (7.56 | ) |
| | | | |
Less distributions from: | | | | | | | | | | | | | | | | | | | | |
Net investment income | | | (0.44 | ) | | | (0.28 | ) | | | (0.28 | ) | | | (0.43 | ) | | | (0.45 | ) |
Net realized gains | | | — | | | | — | | | | — | | | | (0.48 | ) | | | (1.61 | ) |
| | | | |
Total distributions | | | (0.44 | ) | | | (0.28 | ) | | | (0.28 | ) | | | (0.91 | ) | | | (2.06 | ) |
| | | | |
Redemption feesc | | | — | | | | — | | | | — | | | | — | | | | — | |
| | | | |
Net asset value, end of year | | $ | 14.63 | | | $ | 12.78 | | | $ | 14.54 | | | $ | 13.68 | | | $ | 10.95 | |
| | | | |
| | | | | |
Total returnd | | | 18.60% | | | | (10.44)% | | | | 8.67% | | | | 37.34% | | | | (40.23)% | |
Ratios to average net assets | | | | | | | | | | | | | | | | | | | | |
Expenses | | | 0.79% | | | | 0.79% | e | | | 0.78% | e | | | 0.78% | e | | | 0.77% | e |
Net investment income | | | 2.84% | | | | 2.92% | | | | 2.10% | | | | 2.28% | | | | 2.82% | |
| | | | | |
Supplemental data | | | | | | | | | | | | | | | | | | | | |
Net assets, end of year (000’s) | | $ | 265,924 | | | $ | 254,292 | | | $ | 321,282 | | | $ | 318,173 | | | $ | 262,725 | |
Portfolio turnover rate | | | 12.53% | | | | 21.09% | | | | 19.16% | | | | 22.50% | | | | 18.27% | |
aThe amount shown for a share outstanding throughout the period may not correlate with the Statement of Operations for the period due to the timing of sales and repurchases of the Fund shares in relation to income earned and/or fluctuating market value of the investments of the Fund.
bBased on average daily shares outstanding.
cAmount rounds to less than $0.01 per share.
dTotal return does not include fees, charges or expenses imposed by the variable annuity and life insurance contracts for which the Franklin Templeton Variable Insurance Products Trust serves as an underlying investment vehicle.
eBenefit of expense reduction rounds to less than 0.01%.
The accompanying notes are an integral part of these financial statements.
TF-8
Franklin Templeton Variable Insurance Products Trust
Financial Highlights (continued)
Templeton Foreign Securities Fund
| | | | | | | | | | | | | | | | | | | | |
| | | Year Ended December 31, | |
| Class 2 | | 2012 | | | 2011 | | | 2010 | | | 2009 | | | 2008 | |
| | | | |
Per share operating performance | | | | | | | | | | | | | | | | | | | | |
(for a share outstanding throughout the year) | | | | | | | | | | | | | | | | | | | | |
Net asset value, beginning of year | | $ | 12.56 | | | $ | 14.29 | | | $ | 13.45 | | | $ | 10.76 | | | $ | 20.25 | |
| | | | |
Income from investment operationsa: | | | | | | | | | | | | | | | | | | | | |
Net investment incomeb | | | 0.34 | | | | 0.37 | | | | 0.25 | | | | 0.22 | | | | 0.40 | |
Net realized and unrealized gains (losses) | | | 1.87 | | | | (1.86 | ) | | | 0.84 | | | | 3.34 | | | | (7.89 | ) |
| | | | |
Total from investment operations | | | 2.21 | | | | (1.49 | ) | | | 1.09 | | | | 3.56 | | | | (7.49 | ) |
| | | | |
Less distributions from: | | | | | | | | | | | | | | | | | | | | |
Net investment income | | | (0.40 | ) | | | (0.24 | ) | | | (0.25 | ) | | | (0.39 | ) | | | (0.39 | ) |
Net realized gains | | | — | | | | — | | | | — | | | | (0.48 | ) | | | (1.61 | ) |
| | | | |
Total distributions | | | (0.40 | ) | | | (0.24 | ) | | | (0.25 | ) | | | (0.87 | ) | | | (2.00 | ) |
| | | | |
Redemption feesc | | | — | | | | — | | | | — | | | | — | | | | — | |
| | | | |
Net asset value, end of year | | $ | 14.37 | | | $ | 12.56 | | | $ | 14.29 | | | $ | 13.45 | | | $ | 10.76 | |
| | | | |
| | | | | |
Total returnd | | | 18.23% | | | | (10.63)% | | | | 8.41% | | | | 37.04% | | | | (40.38)% | |
Ratios to average net assets | | | | | | | | | | | | | | | | | | | | |
Expenses | | | 1.04% | | | | 1.04% | e | | | 1.03% | e | | | 1.03% | e | | | 1.02% | e |
Net investment income | | | 2.59% | | | | 2.67% | | | | 1.85% | | | | 2.03% | | | | 2.57% | |
| | | | | |
Supplemental data | | | | | | | | | | | | | | | | | | | | |
Net assets, end of year (000’s) | | $ | 1,744,231 | | | $ | 1,679,412 | | | $ | 2,090,757 | | | $ | 2,010,268 | | | $ | 1,702,038 | |
Portfolio turnover rate | | | 12.53% | | | | 21.09% | | | | 19.16% | | | | 22.50% | | | | 18.27% | |
aThe amount shown for a share outstanding throughout the period may not correlate with the Statement of Operations for the period due to the timing of sales and repurchases of the Fund shares in relation to income earned and/or fluctuating market value of the investments of the Fund.
bBased on average daily shares outstanding.
cAmount rounds to less than $0.01 per share.
dTotal return does not include fees, charges or expenses imposed by the variable annuity and life insurance contracts for which the Franklin Templeton Variable Insurance Products Trust serves as an underlying investment vehicle.
eBenefit of expense reduction rounds to less than 0.01%.
The accompanying notes are an integral part of these financial statements.
TF-9
Franklin Templeton Variable Insurance Products Trust
Financial Highlights (continued)
Templeton Foreign Securities Fund
| | | | | | | | | | | | | | | | | | | | |
| | | Year Ended December 31, | |
| Class 3 | | 2012 | | | 2011 | | | 2010 | | | 2009 | | | 2008 | |
| | | | |
Per share operating performance | | | | | | | | | | | | | | | | | | | | |
(for a share outstanding throughout the year) | | | | | | | | | | | | | | | | | | | | |
Net asset value, beginning of year | | $ | 12.51 | | | $ | 14.24 | | | $ | 13.37 | | | $ | 10.70 | | | $ | 20.18 | |
| | | | |
Income from investment operationsa: | | | | | | | | | | | | | | | | | | | | |
Net investment incomeb | | | 0.34 | | | | 0.37 | | | | 0.25 | | | | 0.25 | | | | 0.39 | |
Net realized and unrealized gains (losses) | | | 1.87 | | | | (1.86 | ) | | | 0.84 | | | | 3.30 | | | | (7.84 | ) |
| | | | |
Total from investment operations | | | 2.21 | | | | (1.49 | ) | | | 1.09 | | | | 3.55 | | | | (7.45 | ) |
| | | | |
Less distributions from: | | | | | | | | | | | | | | | | | | | | |
Net investment income | | | (0.40 | ) | | | (0.24 | ) | | | (0.22 | ) | | | (0.40 | ) | | | (0.42 | ) |
Net realized gains | | | — | | | | — | | | | — | | | | (0.48 | ) | | | (1.61 | ) |
| | | | |
Total distributions | | | (0.40 | ) | | | (0.24 | ) | | | (0.22 | ) | | | (0.88 | ) | | | (2.03 | ) |
| | | | |
Redemption feesc | | | — | | | | — | | | | — | | | | — | | | | — | |
| | | | |
Net asset value, end of year | | $ | 14.32 | | | $ | 12.51 | | | $ | 14.24 | | | $ | 13.37 | | | $ | 10.70 | |
| | | | |
| | | | | |
Total returnd | | | 18.30% | | | | (10.68)% | | | | 8.41% | | | | 37.20% | | | | (40.39)% | |
Ratios to average net assets | | | | | | | | | | | | | | | | | | | | |
Expenses | | | 1.04% | | | | 1.04% | e | | | 1.03% | e | | | 1.03% | e | | | 1.02% | e |
Net investment income | | | 2.59% | | | | 2.67% | | | | 1.85% | | | | 2.03% | | | | 2.57% | |
| | | | | |
Supplemental data | | | | | | | | | | | | | | | | | | | | |
Net assets, end of year (000’s) | | $ | 91,642 | | | $ | 88,380 | | | $ | 108,766 | | | $ | 115,364 | | | $ | 271,061 | |
Portfolio turnover rate | | | 12.53% | | | | 21.09% | | | | 19.16% | | | | 22.50% | | | | 18.27% | |
aThe amount shown for a share outstanding throughout the period may not correlate with the Statement of Operations for the period due to the timing of sales and repurchases of the Fund shares in relation to income earned and/or fluctuating market value of the investments of the Fund.
bBased on average daily shares outstanding.
cAmount rounds to less than $0.01 per share.
dTotal return does not include fees, charges or expenses imposed by the variable annuity and life insurance contracts for which the Franklin Templeton Variable Insurance Products Trust serves as an underlying investment vehicle.
eBenefit of expense reduction rounds to less than 0.01%.
The accompanying notes are an integral part of these financial statements.
TF-10
Franklin Templeton Variable Insurance Products Trust
Financial Highlights (continued)
Templeton Foreign Securities Fund
| | | | | | | | | | | | | | | | | | | | |
| | | Year Ended December 31, | |
| Class 4 | | 2012 | | | 2011 | | | 2010 | | | 2009 | | | 2008a | |
| | | | |
Per share operating performance | | | | | | | | | | | | | | | | | | | | |
(for a share outstanding throughout the year) | | | | | | | | | | | | | | | | | | | | |
Net asset value, beginning of year | | $ | 12.66 | | | $ | 14.43 | | | $ | 13.59 | | | $ | 10.91 | | | $ | 18.90 | |
| | | | |
Income from investment operationsb: | | | | | | | | | | | | | | | | | | | | |
Net investment incomec | | | 0.33 | | | | 0.36 | | | | 0.17 | | | | 0.21 | | | | 0.15 | |
Net realized and unrealized gains (losses) | | | 1.89 | | | | (1.88 | ) | | | 0.92 | | | | 3.37 | | | | (6.08 | ) |
| | | | |
Total from investment operations | | | 2.22 | | | | (1.52 | ) | | | 1.09 | | | | 3.58 | | | | (5.93 | ) |
| | | | |
Less distributions from: | | | | | | | | | | | | | | | | | | | | |
Net investment income | | | (0.40 | ) | | | (0.25 | ) | | | (0.25 | ) | | | (0.42 | ) | | | (0.45 | ) |
Net realized gains | | | — | | | | — | | | | — | | | | (0.48 | ) | | | (1.61 | ) |
| | | | |
Total distributions | | | (0.40 | ) | | | (0.25 | ) | | | (0.25 | ) | | | (0.90 | ) | | | (2.06 | ) |
| | | | |
Redemption feesd | | | — | | | | — | | | | — | | | | — | | | | — | |
| | | | |
Net asset value, end of year | | $ | 14.48 | | | $ | 12.66 | | | $ | 14.43 | | | $ | 13.59 | | | $ | 10.91 | |
| | | | |
| | | | | |
Total returne | | | 18.14% | | | | (10.74)% | | | | 8.38% | | | | 36.84% | | | | (35.15)% | |
Ratios to average net assetsf | | | | | | | | | | | | | | | | | | | | |
Expenses | | | 1.14% | | | | 1.14% | g | | | 1.13% | g | | | 1.13% | g | | | 1.12% | g |
Net investment income | | | 2.49% | | | | 2.57% | | | | 1.75% | | | | 1.93% | | | | 2.47% | |
| | | | | |
Supplemental data | | | | | | | | | | | | | | | | | | | | |
Net assets, end of year (000’s) | | $ | 416,277 | | | $ | 353,346 | | | $ | 305,505 | | | $ | 48,501 | | | $ | 14,287 | |
Portfolio turnover rate | | | 12.53% | | | | 21.09% | | | | 19.16% | | | | 22.50% | | | | 18.27% | |
aFor the period February 29, 2008 (effective date) to December 31, 2008.
bThe amount shown for a share outstanding throughout the period may not correlate with the Statement of Operations for the period due to the timing of sales and repurchases of the Fund shares in relation to income earned and/or fluctuating market value of the investments of the Fund.
cBased on average daily shares outstanding.
dAmount rounds to less than $0.01 per share.
eTotal return does not include fees, charges or expenses imposed by the variable annuity and life insurance contracts for which the Franklin Templeton Variable Insurance Products Trust serves as an underlying investment vehicle. Total return is not annualized for periods less than one year.
fRatios are annualized for periods less than one year.
gBenefit of expense reduction rounds to less than 0.01%.
The accompanying notes are an integral part of these financial statements.
TF-11
Franklin Templeton Variable Insurance Products Trust
Statement of Investments, December 31, 2012
| | | | | | | | | | |
| Templeton Foreign Securities Fund | | Country | | Shares/
Units | | | Value | |
Common Stocks and Other Equity Interests 96.6% | | | | | | | | | | |
Aerospace & Defense 1.2% | | | | | | | | | | |
BAE Systems PLC | | United Kingdom | | | 5,263,730 | | | $ | 29,271,038 | |
| | | | | | | | | | |
Airlines 1.0% | | | | | | | | | | |
Deutsche Lufthansa AG | | Germany | | | 1,380,760 | | | | 26,095,324 | |
| | | | | | | | | | |
Automobiles 2.1% | | | | | | | | | | |
aMazda Motor Corp. | | Japan | | | 5,453,000 | | | | 11,175,790 | |
bToyota Motor Corp., ADR | | Japan | | | 440,460 | | | | 41,072,895 | |
| | | | | | | | | | |
| | | | | | | | | 52,248,685 | |
| | | | | | | | | | |
Capital Markets 5.5% | | | | | | | | | | |
Credit Suisse Group AG | | Switzerland | | | 3,325,440 | | | | 80,869,934 | |
KKR & Co., LP | | United States | | | 1,155,000 | | | | 17,590,650 | |
UBS AG | | Switzerland | | | 2,504,440 | | | | 39,043,381 | |
| | | | | | | | | | |
| | | | | | | | | 137,503,965 | |
| | | | | | | | | | |
Chemicals 1.4% | | | | | | | | | | |
Akzo Nobel NV | | Netherlands | | | 527,560 | | | | 34,913,474 | |
| | | | | | | | | | |
Commercial Banks 12.3% | | | | | | | | | | |
BNP Paribas SA | | France | | | 1,218,660 | | | | 69,359,928 | |
DBS Group Holdings Ltd. | | Singapore | | | 2,174,520 | | | | 26,698,792 | |
Hana Financial Group Inc. | | South Korea | | | 609,900 | | | | 19,897,268 | |
HSBC Holdings PLC | | United Kingdom | | | 4,015,600 | | | | 42,123,580 | |
KB Financial Group Inc., ADR | | South Korea | | | 1,319,301 | | | | 47,362,906 | |
aLloyds Banking Group PLC | | United Kingdom | | | 58,981,650 | | | | 47,020,496 | |
aUniCredit SpA | | Italy | | | 8,365,386 | | | | 41,184,007 | |
United Overseas Bank Ltd. | | Singapore | | | 985,000 | | | | 16,159,960 | |
| | | | | | | | | | |
| | | | | | | | | 309,806,937 | |
| | | | | | | | | | |
Commercial Services & Supplies 0.8% | | | | | | | | | | |
G4S PLC | | United Kingdom | | | 5,045,810 | | | | 21,153,214 | |
| | | | | | | | | | |
Communications Equipment 0.7% | | | | | | | | | | |
Ericsson, B, ADR | | Sweden | | | 1,675,840 | | | | 16,925,984 | |
| | | | | | | | | | |
Computers & Peripherals 0.8% | | | | | | | | | | |
Compal Electronics Inc. | | Taiwan | | | 28,536,431 | | | | 19,194,468 | |
| | | | | | | | | | |
Construction & Engineering 0.8% | | | | | | | | | | |
Carillion PLC | | United Kingdom | | | 3,750,730 | | | | 19,501,528 | |
| | | | | | | | | | |
Construction Materials 0.5% | | | | | | | | | | |
CRH PLC | | Ireland | | | 659,820 | | | | 13,414,605 | |
| | | | | | | | | | |
Containers & Packaging 0.9% | | | | | | | | | | |
Rexam PLC | | United Kingdom | | | 3,021,290 | | | | 21,627,709 | |
| | | | | | | | | | |
Diversified Financial Services 2.5% | | | | | | | | | | |
aING Groep NV | | Netherlands | | | 6,729,094 | | | | 63,895,833 | |
| | | | | | | | | | |
Diversified Telecommunication Services 7.1% | | | | | | | | | | |
China Telecom Corp. Ltd., H | | China | | | 47,482,357 | | | | 26,405,465 | |
France Telecom SA | | France | | | 2,164,143 | | | | 24,002,225 | |
Singapore Telecommunications Ltd. | | Singapore | | | 11,753,000 | | | | 31,984,174 | |
Telefonica SA, ADR | | Spain | | | 1,813,382 | | | | 24,462,523 | |
Telenor ASA | | Norway | | | 2,489,134 | | | | 50,664,622 | |
Vivendi SA | | France | | | 928,427 | | | | 20,991,666 | |
| | | | | | | | | | |
| | | | | | | | | 178,510,675 | |
| | | | | | | | | | |
TF-12
Franklin Templeton Variable Insurance Products Trust
Statement of Investments, December 31, 2012 (continued)
| | | | | | | | | | |
| Templeton Foreign Securities Fund | | Country | | Shares/
Units | | | Value | |
Common Stocks and Other Equity Interests (continued) | | | | | | | | | | |
Electrical Equipment 0.4% | | | | | | | | | | |
Shanghai Electric Group Co. Ltd. | | China | | | 23,792,000 | | | $ | 10,161,159 | |
| | | | | | | | | | |
Electronic Equipment, Instruments & Components 1.0% | | | | | | | | | | |
aFlextronics International Ltd. | | Singapore | | | 4,134,370 | | | | 25,674,438 | |
| | | | | | | | | | |
Energy Equipment & Services 2.1% | | | | | | | | | | |
Aker Solutions ASA | | Norway | | | 1,617,940 | | | | 33,492,976 | |
Trican Well Service Ltd. | | Canada | | | 1,421,400 | | | | 18,775,503 | |
| | | | | | | | | | |
| | | | | | | | | 52,268,479 | |
| | | | | | | | | | |
Food & Staples Retailing 2.2% | | | | | | | | | | |
Tesco PLC | | United Kingdom | | | 10,082,690 | | | | 55,576,590 | |
| | | | | | | | | | |
Industrial Conglomerates 3.8% | | | | | | | | | | |
Hutchison Whampoa Ltd. | | Hong Kong | | | 2,500,239 | | | | 26,098,427 | |
Koninklijke Philips Electronics NV | | Netherlands | | | 1,473,320 | | | | 39,003,432 | |
Siemens AG | | Germany | | | 285,414 | | | | 31,201,896 | |
| | | | | | | | | | |
| | | | | | | | | 96,303,755 | |
| | | | | | | | | | |
Insurance 11.6% | | | | | | | | | | |
ACE Ltd. | | United States | | | 307,649 | | | | 24,550,390 | |
Aegon NV | | Netherlands | | | 5,759,330 | | | | 37,194,330 | |
AIA Group Ltd. | | Hong Kong | | | 9,767,000 | | | | 38,121,577 | |
Aviva PLC | | United Kingdom | | | 9,477,840 | | | | 58,660,341 | |
AXA SA | | France | | | 2,967,908 | | | | 53,669,123 | |
Muenchener Rueckversicherungs-Gesellschaft AG | | Germany | | | 141,850 | | | | 25,601,054 | |
NKSJ Holdings Inc. | | Japan | | | 1,237,900 | | | | 26,515,052 | |
Swiss Re AG | | Switzerland | | | 387,030 | | | | 27,863,961 | |
| | | | | | | | | | |
| | | | | | | | | 292,175,828 | |
| | | | | | | | | | |
Life Sciences Tools & Services 0.4% | | | | | | | | | | |
Lonza Group AG | | Switzerland | | | 175,440 | | | | 9,460,554 | |
| | | | | | | | | | |
Media 1.2% | | | | | | | | | | |
Reed Elsevier NV | | Netherlands | | | 2,017,693 | | | | 29,909,754 | |
| | | | | | | | | | |
Metals & Mining 1.1% | | | | | | | | | | |
POSCO | | South Korea | | | 88,500 | | | | 29,038,490 | |
| | | | | | | | | | |
Multi-Utilities 1.3% | | | | | | | | | | |
E.ON SE | | Germany | | | 917,590 | | | | 17,205,765 | |
GDF Suez | | France | | | 697,431 | | | | 14,360,514 | |
| | | | | | | | | | |
| | | | | | | | | 31,566,279 | |
| | | | | | | | | | |
Multiline Retail 1.0% | | | | | | | | | | |
Marks & Spencer Group PLC | | United Kingdom | | | 4,066,900 | | | | 25,575,433 | |
| | | | | | | | | | |
Oil, Gas & Consumable Fuels 9.0% | | | | | | | | | | |
BP PLC | | United Kingdom | | | 4,406,715 | | | | 30,648,057 | |
Reliance Industries Ltd. | | India | | | 998,145 | | | | 15,265,533 | |
Royal Dutch Shell PLC, A | | United Kingdom | | | 16,803 | | | | 583,295 | |
Royal Dutch Shell PLC, B | | United Kingdom | | | 1,292,973 | | | | 46,128,210 | |
Statoil ASA | | Norway | | | 2,077,160 | | | | 52,334,683 | |
Suncor Energy Inc. | | Canada | | | 413,300 | | | | 13,610,917 | |
Talisman Energy Inc. | | Canada | | | 1,506,600 | | | | 17,064,435 | |
Total SA, B | | France | | | 979,926 | | | | 50,974,857 | |
| | | | | | | | | | |
| | | | | | | | | 226,609,987 | |
| | | | | | | | | | |
TF-13
Franklin Templeton Variable Insurance Products Trust
Statement of Investments, December 31, 2012 (continued)
| | | | | | | | | | |
| Templeton Foreign Securities Fund | | Country | | Shares/
Units | | | Value | |
Common Stocks and Other Equity Interests (continued) | | | | | | | | | | |
Pharmaceuticals 10.9% | | | | | | | | | | |
GlaxoSmithKline PLC | | United Kingdom | | | 2,772,585 | | | $ | 60,363,396 | |
Merck KGaA | | Germany | | | 211,460 | | | | 27,861,922 | |
Novartis AG | | Switzerland | | | 417,200 | | | | 26,184,673 | |
Roche Holding AG | | Switzerland | | | 336,760 | | | | 67,694,150 | |
Sanofi | | France | | | 986,035 | | | | 93,485,989 | |
| | | | | | | | | | |
| | | | | | | | | 275,590,130 | |
| | | | | | | | | | |
Professional Services 1.5% | | | | | | | | | | |
Hays PLC | | United Kingdom | | | 11,353,070 | | | | 15,459,102 | |
Randstad Holding NV | | Netherlands | | | 625,250 | | | | 23,201,318 | |
| | | | | | | | | | |
| | | | | | | | | 38,660,420 | |
| | | | | | | | | | |
Real Estate Management & Development 0.0%† | | | | | | | | | | |
Cheung Kong (Holdings) Ltd. | | Hong Kong | | | 922 | | | | 14,157 | |
| | | | | | | | | | |
Semiconductors & Semiconductor Equipment 5.1% | | | | | | | | | | |
Infineon Technologies AG | | Germany | | | 1,103,225 | | | | 8,984,975 | |
Samsung Electronics Co. Ltd. | | South Korea | | | 46,744 | | | | 66,887,638 | |
Siliconware Precision Industries Co. | | Taiwan | | | 22,109,000 | | | | 23,580,905 | |
Taiwan Semiconductor Manufacturing Co. Ltd. | | Taiwan | | | 8,644,526 | | | | 28,849,786 | |
| | | | | | | | | | |
| | | | | | | | | 128,303,304 | |
| | | | | | | | | | |
Software 1.0% | | | | | | | | | | |
Trend Micro Inc. | | Japan | | | 868,100 | | | | 26,193,449 | |
| | | | | | | | | | |
Specialty Retail 1.7% | | | | | | | | | | |
Kingfisher PLC | | United Kingdom | | | 9,366,486 | | | | 43,749,567 | |
| | | | | | | | | | |
Trading Companies & Distributors 0.9% | | | | | | | | | | |
Itochu Corp. | | Japan | | | 2,102,500 | | | | 22,190,789 | |
| | | | | | | | | | |
Wireless Telecommunication Services 2.8% | | | | | | | | | | |
China Mobile Ltd. | | China | | | 2,340,000 | | | | 27,248,799 | |
Vodafone Group PLC, ADR | | United Kingdom | | | 1,700,170 | | | | 42,827,282 | |
| | | | | | | | | | |
| | | | | | | | | 70,076,081 | |
| | | | | | | | | | |
Total Common Stocks and Other Equity Interests
(Cost $2,257,464,571) | | | | | | | | | 2,433,162,082 | |
| | | | | | | | | | |
Preferred Stocks 1.4% | | | | | | | | | | |
Metals & Mining 1.0% | | | | | | | | | | |
Vale SA, ADR, pfd., A | | Brazil | | | 1,210,222 | | | | 24,567,507 | |
| | | | | | | | | | |
Oil, Gas & Consumable Fuels 0.4% | | | | | | | | | | |
Petroleo Brasileiro SA, ADR, pfd. | | Brazil | | | 517,880 | | | | 9,995,084 | |
| | | | | | | | | | |
Total Preferred Stocks (Cost $13,315,243) | | | | | | | | | 34,562,591 | |
| | | | | | | | | | |
Total Investments before Short Term Investments
(Cost $2,270,779,814) | | | | | | | | | 2,467,724,673 | |
| | | | | | | | | | |
TF-14
Franklin Templeton Variable Insurance Products Trust
Statement of Investments, December 31, 2012 (continued)
| | | | | | | | | | |
| Templeton Foreign Securities Fund | | Country | | Shares/
Units | | | Value | |
Short Term Investments 3.2% | | | | | | | | | | |
Money Market Funds (Cost $73,488,658) 2.9% | | | | | | | | | | |
a,cInstitutional Fiduciary Trust Money Market Portfolio | | United States | | | 73,488,658 | | | $ | 73,488,658 | |
| | | | | | | | | | |
dInvestments from Cash Collateral Received for Loaned Securities
(Cost $6,617,600) 0.3% | | | | | | | | | | |
Money Market Funds 0.3% | | | | | | | | | | |
eBNY Mellon Overnight Government Fund, 0.191% | | United States | | | 6,617,600 | | | | 6,617,600 | |
| | | | | | | | | | |
Total Investments (Cost $2,350,886,072) 101.2% | | | | | | | | | 2,547,830,931 | |
Other Assets, less Liabilities (1.2)% | | | | | | | | | (29,756,419 | ) |
| | | | | | | | | | |
Net Assets 100.0% | | | | | | | | $ | 2,518,074,512 | |
| | | | | | | | | | |
See Abbreviations on page TF-27.
†Rounds to less than 0.1% of net assets.
aNon-income producing.
bA portion or all of the security is on loan at December 31, 2012. See Note 1(c).
cSee Note 7 regarding investments in the Institutional Fiduciary Trust Money Market Portfolio.
dSee Note 1(c) regarding securities on loan.
eThe rate shown is the annualized seven-day yield at period end.
The accompanying notes are an integral part of these financial statements.
TF-15
Franklin Templeton Variable Insurance Products Trust
Financial Statements
Statements of Assets and Liabilities
December 31, 2012
| | | | |
| | | Templeton
Foreign
Securities Fund | |
Assets: | | | | |
Investments in securities: | | | | |
Cost - Unaffiliated issuers | | $ | 2,277,397,414 | |
Cost - Sweep Money Fund (Note 7) | | | 73,488,658 | |
| | | | |
Total cost of investments | | $ | 2,350,886,072 | |
| | | | |
Value - Unaffiliated issuers | | $ | 2,474,342,273 | |
Value - Sweep Money Fund (Note 7) | | | 73,488,658 | |
| | | | |
Total value of investments (includes securities loaned in the amount $6,564,800) | | | 2,547,830,931 | |
Cash | | | 84,421 | |
Receivables: | | | | |
Capital shares sold | | | 599,281 | |
Dividends and interest | | | 4,557,706 | |
Other assets | | | 58 | |
| | | | |
Total assets | | | 2,553,072,397 | |
| | | | |
Liabilities: | | | | |
Payables: | | | | |
Capital shares redeemed | | | 25,031,570 | |
Affiliates | | | 2,555,211 | |
Payable upon return of securities loaned | | | 6,617,600 | |
Accrued expenses and other liabilities | | | 793,504 | |
| | | | |
Total liabilities | | | 34,997,885 | |
| | | | |
Net assets, at value | | $ | 2,518,074,512 | |
| | | | |
Net assets consist of: | | | | |
Paid-in capital | | $ | 2,368,461,624 | |
Undistributed net investment income | | | 61,586,250 | |
Net unrealized appreciation (depreciation) | | | 196,951,443 | |
Accumulated net realized gain (loss) | | | (108,924,805 | ) |
| | | | |
Net assets, at value | | $ | 2,518,074,512 | |
| | | | |
The accompanying notes are an integral part of these financial statements.
TF-16
Franklin Templeton Variable Insurance Products Trust
Financial Statements (continued)
Statements of Assets and Liabilities (continued)
December 31, 2012
| | | | |
| | | Templeton
Foreign
Securities Fund | |
Class 1: | | | | |
Net assets, at value | | $ | 265,924,412 | |
| | | | |
Shares outstanding | | | 18,173,408 | |
| | | | |
Net asset value and maximum offering price per share | | $ | 14.63 | |
| | | | |
Class 2: | | | | |
Net assets, at value | | $ | 1,744,230,850 | |
| | | | |
Shares outstanding | | | 121,340,262 | |
| | | | |
Net asset value and maximum offering price per share | | $ | 14.37 | |
| | | | |
Class 3: | | | | |
Net assets, at value | | $ | 91,642,387 | |
| | | | |
Shares outstanding | | | 6,399,002 | |
| | | | |
Net asset value and maximum offering price per sharea | | $ | 14.32 | |
| | | | |
Class 4: | | | | |
Net assets, at value | | $ | 416,276,863 | |
| | | | |
Shares outstanding | | | 28,745,718 | |
| | | | |
Net asset value and maximum offering price per share | | $ | 14.48 | |
| | | | |
aRedemption price is equal to net asset value less any redemption fees retained by the fund.
The accompanying notes are an integral part of these financial statements.
TF-17
Franklin Templeton Variable Insurance Products Trust
Financial Statements (continued)
Statement of Operations
for the year ended December 31, 2012
| | | | |
| | | Templeton
Foreign
Securities Fund | |
Investment income: | | | | |
Dividends (net of foreign taxes of $7,947,019) | | $ | 85,502,159 | |
Income from securities loaned | | | 3,038,967 | |
| | | | |
Total investment income | | | 88,541,126 | |
| | | | |
Expenses: | | | | |
Management fees (Note 3a) | | | 15,622,833 | |
Administrative fees (Note 3b) | | | 2,401,568 | |
Distribution fees: (Note 3c) | | | | |
Class 2 | | | 4,248,104 | |
Class 3 | | | 222,514 | |
Class 4 | | | 1,372,164 | |
Unaffiliated transfer agent fees | | | 2,999 | |
Custodian fees (Note 4) | | | 401,369 | |
Reports to shareholders | | | 633,110 | |
Professional fees | | | 116,251 | |
Trustees’ fees and expenses | | | 9,652 | |
Other | | | 54,533 | |
| | | | |
Total expenses | | | 25,085,097 | |
| | | | |
Net investment income | | | 63,456,029 | |
| | | | |
Realized and unrealized gains (losses): | | | | |
Net realized gain (loss) from: | | | | |
Investments | | | 20,924,679 | |
Foreign currency transactions | | | (926,212 | ) |
| | | | |
Net realized gain (loss) | | | 19,998,467 | |
| | | | |
Net change in unrealized appreciation (depreciation) on: | | | | |
Investments | | | 333,349,236 | |
Translation of other assets and liabilities denominated in foreign currencies | | | 19,533 | |
| | | | |
Net change in unrealized appreciation (depreciation) | | | 333,368,769 | |
| | | | |
Net realized and unrealized gain (loss) | | | 353,367,236 | |
| | | | |
Net increase (decrease) in net assets resulting from operations | | $ | 416,823,265 | |
| | | | |
The accompanying notes are an integral part of these financial statements.
TF-18
Franklin Templeton Variable Insurance Products Trust
Financial Statements (continued)
Statements of Changes in Net Assets
| | | | | | | | |
| | | Templeton Foreign
Securities Fund | |
| | | Year Ended December 31, | |
| | | 2012 | | | 2011 | |
| | | | |
Increase (decrease) in net assets: | | | | | | | | |
Operations: | | | | | | | | |
Net investment income | | $ | 63,456,029 | | | $ | 72,239,766 | |
Net realized gain (loss) from investments and foreign currency transactions | | | 19,998,467 | | | | 136,998,835 | |
Net change in unrealized appreciation (depreciation) on investments and translation of other assets and liabilities denominated in foreign currencies | | | 333,368,769 | | | | (482,312,094 | ) |
| | | | |
Net increase (decrease) in net assets resulting from operations | | | 416,823,265 | | | | (273,073,493 | ) |
| | | | |
Distributions to shareholders from: | | | | | | | | |
Net investment income: | | | | | | | | |
Class 1 | | | (8,240,958 | ) | | | (5,782,491 | ) |
Class 2 | | | (51,055,731 | ) | | | (33,309,204 | ) |
Class 3 | | | (2,656,996 | ) | | | (1,749,311 | ) |
Class 4 | | | (11,448,483 | ) | | | (5,966,192 | ) |
| | | | |
Total distributions to shareholders | | | (73,402,168 | ) | | | (46,807,198 | ) |
| | | | |
Capital share transactions: (Note 2) | | | | | | | | |
Class 1 | | | (24,104,168 | ) | | | (31,404,883 | ) |
Class 2 | | | (174,931,568 | ) | | | (183,781,604 | ) |
Class 3 | | | (9,153,115 | ) | | | (8,583,165 | ) |
Class 4 | | | 7,407,804 | | | | 92,765,363 | |
| | | | |
Total capital share transactions | | | (200,781,047 | ) | | | (131,004,289 | ) |
| | | | |
Redemption fees | | | 4,388 | | | | 4,895 | |
| | | | |
Net increase (decrease) in net assets | | | 142,644,438 | | | | (450,880,085 | ) |
Net assets: | | | | | | | | |
Beginning of year | | | 2,375,430,074 | | | | 2,826,310,159 | |
| | | | |
End of year | | $ | 2,518,074,512 | | | $ | 2,375,430,074 | |
| | | | |
Undistributed net investment income included in net assets: | | | | | | | | |
End of year | | $ | 61,586,250 | | | $ | 72,574,104 | |
| | | | |
The accompanying notes are an integral part of these financial statements.
TF-19
Franklin Templeton Variable Insurance Products Trust
Notes to Financial Statements
Templeton Foreign Securities Fund
1. ORGANIZATION AND SIGNIFICANT ACCOUNTING POLICIES
Franklin Templeton Variable Insurance Products Trust (Trust) is registered under the Investment Company Act of 1940, as amended, (1940 Act) as an open-end investment company, consisting of twenty separate funds. The Templeton Foreign Securities Fund (Fund) is included in this report. The financial statements of the remaining funds in the Trust are presented separately. Shares of the Fund are generally sold only to insurance company separate accounts to fund the benefits of variable life insurance policies or variable annuity contracts. The Fund offers four classes of shares: Class 1, Class 2, Class 3, and Class 4. Each class of shares differs by its distribution fees, voting rights on matters affecting a single class and its exchange privilege.
The following summarizes the Fund’s significant accounting policies.
a. Financial Instrument Valuation
The Fund’s investments in financial instruments are carried at fair value daily. Fair value is the price that would be received to sell an asset or paid to transfer a liability in an orderly transaction between market participants on the measurement date. Under procedures approved by the Trust’s Board of Trustees (the Board), the Fund’s administrator, investment manager and other affiliates have formed the Valuation and Liquidity Oversight Committee (VLOC). The VLOC provides administration and oversight of the Fund’s valuation policies and procedures, which are approved annually by the Board. Among other things, these procedures allow the Fund to utilize independent pricing services, quotations from securities and financial instrument dealers, and other market sources to determine fair value.
Equity securities listed on an exchange or on the NASDAQ National Market System are valued at the last quoted sale price or the official closing price of the day, respectively. Foreign equity securities are valued as of the close of trading on the foreign stock exchange on which the security is primarily traded, or the NYSE, whichever is earlier. The value is then converted into its U.S. dollar equivalent at the foreign exchange rate in effect at the close of the NYSE on the day that the value of the security is determined. Over-the-counter (OTC) securities are valued within the range of the most recent quoted bid and ask prices. Securities that trade in multiple markets or on multiple exchanges are valued according to the broadest and most representative market. Certain equity securities are valued based upon fundamental characteristics or relationships to similar securities. Investments in open-end mutual funds are valued at the closing net asset value.
The Fund has procedures to determine the fair value of financial instruments for which market prices are not reliable or readily available. Under these procedures, the VLOC convenes on a regular basis to review such financial instruments and considers a number of factors, including significant unobservable valuation inputs, when arriving at fair value. The VLOC primarily employs a market-based approach which may use related or comparable assets or liabilities, recent transactions, market multiples, book values, and other relevant information for the investment to determine the fair value of the investment. An income-based valuation approach may also be used in which the anticipated future cash flows of the investment are discounted to calculate fair value. Discounts may also be applied due to the nature or duration of any restrictions on the disposition of the investments. Due to the inherent uncertainty of valuations of such investments, the fair values may differ significantly from the values that would have been used had an active market existed. The VLOC employs various methods for calibrating these valuation approaches including a regular review of key inputs and assumptions, transactional back-testing or disposition analysis, and reviews of any related market activity.
Trading in securities on foreign securities stock exchanges and OTC markets may be completed before the daily close of business on the NYSE. Occasionally, events occur between the time at which trading in a foreign security is completed and the close of the NYSE that might call into question the reliability of the value of a portfolio security held by the Fund. As a result, differences may arise between the value of the Fund’s portfolio securities as determined at the foreign market close and the latest indications of value at the close of the NYSE. In order to minimize the potential for these differences, the VLOC monitors price movements following the close of trading in foreign stock markets through a series of country specific market proxies (such as baskets of American Depositary Receipts, futures contracts and exchange traded funds). These price movements are measured against established trigger thresholds for each specific market proxy to assist in determining if an event has occurred that may call into
TF-20
Franklin Templeton Variable Insurance Products Trust
Notes to Financial Statements (continued)
Templeton Foreign Securities Fund
1. ORGANIZATION AND SIGNIFICANT ACCOUNTING POLICIES (continued)
a. Financial Instrument Valuation (continued)
question the reliability of the values of the foreign securities held by the Fund. If such an event occurs, the securities may be valued using fair value procedures, which may include the use of independent pricing services. At December 31, 2012, a market event occurred resulting in a portion of the securities held by the Fund being valued using fair value procedures.
b. Foreign Currency Translation
Portfolio securities and other assets and liabilities denominated in foreign currencies are translated into U.S. dollars based on the exchange rate of such currencies against U.S. dollars on the date of valuation. The Fund may enter into foreign currency exchange contracts to facilitate transactions denominated in a foreign currency. Purchases and sales of securities, income and expense items denominated in foreign currencies are translated into U.S. dollars at the exchange rate in effect on the transaction date. Portfolio securities and assets and liabilities denominated in foreign currencies contain risks that those currencies will decline in value relative to the U.S. dollar. Occasionally, events may impact the availability or reliability of foreign exchange rates used to convert the U.S. dollar equivalent value. If such an event occurs, the foreign exchange rate will be valued at fair value using procedures established and approved by the Board.
The Fund does not separately report the effect of changes in foreign exchange rates from changes in market prices on securities held. Such changes are included in net realized and unrealized gain or loss from investments on the Statement of Operations.
Realized foreign exchange gains or losses arise from sales of foreign currencies, currency gains or losses realized between the trade and settlement dates on securities transactions and the difference between the recorded amounts of dividends, interest, and foreign withholding taxes and the U.S. dollar equivalent of the amounts actually received or paid. Net unrealized foreign exchange gains and losses arise from changes in foreign exchange rates on foreign denominated assets and liabilities other than investments in securities held at the end of the reporting period.
c. Securities Lending
The Fund participates in an agency based securities lending program. The Fund receives cash collateral against the loaned securities in an amount equal to at least 102% of the market value of the loaned securities. Collateral is maintained over the life of the loan in an amount not less than 100% of the market value of loaned securities, as determined at the close of fund business each day; any additional collateral required due to changes in security values is delivered to the Fund on the next business day. The collateral is invested in a non-registered money fund as indicated on the Statement of Investments. The Fund receives income from the investment of cash collateral, in addition to lending fees and rebates paid by the borrower. The Fund bears the market risk with respect to the collateral investment, securities loaned, and the risk that the agent may default on its obligations to the Fund. The securities lending agent has agreed to indemnify the Fund in the event of default by a third party borrower.
d. Income and Deferred Taxes
It is the Fund’s policy to qualify as a regulated investment company under the Internal Revenue Code. The Fund intends to distribute to shareholders substantially all of its taxable income and net realized gains to relieve it from federal income and excise taxes. As a result, no provision for U.S. federal income taxes is required.
The Fund may be subject to foreign taxation related to income received, capital gains on the sale of securities and certain foreign currency transactions in the foreign jurisdictions in which it invests. Foreign taxes, if any, are recorded based on the tax regulations and rates that exist in the foreign markets in which the Fund invests. When a capital gain tax is determined to apply the Fund records an estimated deferred tax liability in an amount that would be payable if the securities were disposed of on the valuation date.
TF-21
Franklin Templeton Variable Insurance Products Trust
Notes to Financial Statements (continued)
Templeton Foreign Securities Fund
1. ORGANIZATION AND SIGNIFICANT ACCOUNTING POLICIES (continued)
d. Income and Deferred Taxes (continued)
The Fund recognizes the tax benefits of uncertain tax positions only when the position is “more likely than not” to be sustained upon examination by the tax authorities based on the technical merits of the tax position. As of December 31, 2012, and for all open tax years, the Fund has determined that no liability for unrecognized tax benefits is required in the Fund’s financial statements related to uncertain tax positions taken on a tax return (or expected to be taken on future tax returns). Open tax years are those that remain subject to examination and are based on each tax jurisdiction statute of limitation.
e. Security Transactions, Investment Income, Expenses and Distributions
Security transactions are accounted for on trade date. Realized gains and losses on security transactions are determined on a specific identification basis. Estimated expenses are accrued daily. Dividend income is recorded on the ex-dividend date except that certain dividends from foreign securities are recognized as soon as the Fund is notified of the ex-dividend date. Distributions to shareholders are recorded on the ex-dividend date and are determined according to income tax regulations (tax basis). Distributable earnings determined on a tax basis may differ from earnings recorded in accordance with accounting principles generally accepted in the United States of America. These differences may be permanent or temporary. Permanent differences are reclassified among capital accounts to reflect their tax character. These reclassifications have no impact on net assets or the results of operations. Temporary differences are not reclassified, as they may reverse in subsequent periods.
Common expenses incurred by the Trust are allocated among the funds based on the ratio of net assets of each fund to the combined net assets of the Trust. Fund specific expenses are charged directly to the fund that incurred the expense.
Realized and unrealized gains and losses and net investment income, not including class specific expenses, are allocated daily to each class of shares based upon the relative proportion of net assets of each class. Differences in per share distributions, by class, are generally due to differences in class specific expenses.
f. Accounting Estimates
The preparation of financial statements in accordance with accounting principles generally accepted in the United States of America requires management to make estimates and assumptions that affect the reported amounts of assets and liabilities at the date of the financial statements and the amounts of income and expenses during the reporting period. Actual results could differ from those estimates.
g. Redemption Fees
Redemptions and exchanges of interests in an insurance company subaccount that invests in Class 3 shares of the Fund will be subject to a 1.0% short term trading fee if the interest in the subaccount has been held for less than 60 days. Such fees are retained by the Fund and accounted for as an addition to paid-in capital, allocated to each class of shares based upon the relative proportion of net assets of each class.
h. Guarantees and Indemnifications
Under the Trust’s organizational documents, its officers and trustees are indemnified by the Trust against certain liabilities arising out of the performance of their duties to the Trust. Additionally, in the normal course of business, the Trust, on behalf of the Fund, enters into contracts with service providers that contain general indemnification clauses. The Trust’s maximum exposure under these arrangements is unknown as this would involve future claims that may be made against the Trust that have not yet occurred. Currently, the Trust expects the risk of loss to be remote.
TF-22
Franklin Templeton Variable Insurance Products Trust
Notes to Financial Statements (continued)
Templeton Foreign Securities Fund
2. SHARES OF BENEFICIAL INTEREST
At December 31, 2012, there were an unlimited number of shares authorized (without par value). Transactions in the Fund’s shares were as follows:
| | | | | | | | | | | | | | | | |
| | | Year Ended December 31, | |
| | | 2012 | | | 2011 | |
| Class 1 Shares: | | Shares | | | Amount | | | Shares | | | Amount | |
Shares sold | | | 437,702 | | | $ | 5,851,468 | | | | 596,966 | | | $ | 8,620,768 | |
Shares issued in reinvestment of distributions | | | 676,598 | | | | 8,240,958 | | | | 392,832 | | | | 5,782,491 | |
Shares redeemed | | | (2,835,243 | ) | | | (38,196,594 | ) | | | (3,184,900 | ) | | | (45,808,142 | ) |
| | | | |
Net increase (decrease) | | | (1,720,943 | ) | | $ | (24,104,168 | ) | | | (2,195,102 | ) | | $ | (31,404,883 | ) |
| | | | |
Class 2 Shares: | | | | | | | | | | | | | | | | |
Shares sold | | | 12,784,843 | | | $ | 164,850,484 | | | | 14,900,290 | | | $ | 201,768,630 | |
Shares issued in reinvestment of distributions | | | 4,261,747 | | | | 51,055,731 | | | | 2,300,359 | | | | 33,309,204 | |
Shares redeemed | | | (29,457,075 | ) | | | (390,837,783 | ) | | | (29,726,460 | ) | | | (418,859,438 | ) |
| | | | |
Net increase (decrease) | | | (12,410,485 | ) | | $ | (174,931,568 | ) | | | (12,525,811 | ) | | $ | (183,781,604 | ) |
| | | | |
Class 3 Shares: | | | | | | | | | | | | | | | | |
Shares sold | | | 414,387 | | | $ | 5,363,853 | | | | 712,054 | | | $ | 9,594,087 | |
Shares issued in reinvestment of distributions | | | 222,529 | | | | 2,656,996 | | | | 121,227 | | | | 1,749,311 | |
Shares redeemed | | | (1,302,161 | ) | | | (17,173,964 | ) | | | (1,406,375 | ) | | | (19,926,563 | ) |
| | | | |
Net increase (decrease) | | | (665,245 | ) | | $ | (9,153,115 | ) | | | (573,094 | ) | | $ | (8,583,165 | ) |
| | | | |
Class 4 Shares: | | | | | | | | | | | | | | | | |
Shares sold | | | 6,234,278 | | | $ | 81,740,548 | | | | 10,343,049 | | | $ | 143,108,311 | |
Shares issued on reinvestment of distributions | | | 947,722 | | | | 11,448,483 | | | | 408,643 | | | | 5,966,192 | |
Shares redeemed | | | (6,356,073 | ) | | | (85,781,227 | ) | | | (4,003,106 | ) | | | (56,309,140 | ) |
| | | | |
Net increase (decrease) | | | 825,927 | | | $ | 7,407,804 | | | | 6,748,586 | | | $ | 92,765,363 | |
| | | | |
3. TRANSACTIONS WITH AFFILIATES
Franklin Resources, Inc. is the holding company for various subsidiaries that together are referred to as Franklin Templeton Investments. Certain officers and trustees of the Fund are also officers and/or directors of the following subsidiaries:
| | |
| Subsidiary | | Affiliation |
Templeton Investment Counsel, LLC (TIC) | | Investment manager |
Franklin Templeton Services, LLC (FT Services) | | Administrative manager |
Franklin Templeton Distributors, Inc. (Distributors) | | Principal underwriter |
Franklin Templeton Investor Services, LLC (Investor Services) | | Transfer agent |
a. Management Fees
The Fund pays an investment management fee to TIC based on the average daily net assets of the Fund as follows:
| | |
| Annualized Fee Rate | | Net Assets |
| 0.750% | | Up to and including $200 million |
| 0.675% | | Over $200 million, up to and including $1.3 billion |
| 0.600% | | Over $1.3 billion, up to and including $10 billion |
| 0.580% | | Over $10 billion, up to and including $15 billion |
| 0.560% | | Over $15 billion, up to and including $20 billion |
| 0.540% | | In excess of $20 billion |
TF-23
Franklin Templeton Variable Insurance Products Trust
Notes to Financial Statements (continued)
Templeton Foreign Securities Fund
3. TRANSACTIONS WITH AFFILIATES (continued)
b. Administrative Fees
The Fund pays an administrative fee to FT Services based on the Fund’s average daily net assets as follows:
| | |
| Annualized Fee Rate | | Net Assets |
| 0.150% | | Up to and including $200 million |
| 0.135% | | Over $200 million, up to and including $700 million |
| 0.100% | | Over $700 million, up to and including $1.2 billion |
| 0.075% | | In excess of $1.2 billion |
c. Distribution Fees
The Board has adopted distribution plans for Class 2, Class 3, and Class 4 shares pursuant to Rule 12b-1 under the 1940 Act. Under the Fund’s compensation distribution plans, the Fund pays Distributors for costs incurred in connection with the servicing, sale and distribution of the Fund’s shares up to 0.25%, 0.35%, and 0.35% per year of its average daily net assets of Class 2, Class 3, and Class 4, respectively. Some distribution fees are not charged on shares held by affiliates. The Board has agreed to limit the current rate to 0.25% per year for Class 3.
d. Transfer Agent Fees
Investor Services, under terms of an agreement, performs shareholder servicing for the Fund and is not paid by the Fund for the services.
4. EXPENSE OFFSET ARRANGEMENT
The Fund has entered into an arrangement with its custodian whereby credits realized as a result of uninvested cash balances are used to reduce a portion of the Fund’s custodian expenses. During the year ended December 31, 2012, there were no credits earned.
5. INCOME TAXES
For tax purposes, capital losses may be carried over to offset future capital gains, if any. Capital loss carryforwards with no expiration, if any, must be fully utilized before those losses with expiration dates.
At December 31, 2012, the Fund had capital loss carryforwards of 102,624,222 expiring in 2017. During the year ended December 31, 2012, the Fund utilized $25,143,199 of capital loss carryforwards.
The tax character of distributions paid during the years ended December 31, 2012 and 2011, was as follows:
| | | | | | | | |
| | | 2012 | | | 2011 | |
Distributions paid from ordinary income | | $ | 73,402,168 | | | $ | 46,807,198 | |
TF-24
Franklin Templeton Variable Insurance Products Trust
Notes to Financial Statements (continued)
Templeton Foreign Securities Fund
5. INCOME TAXES (continued)
At December 31, 2012, the cost of investments, net unrealized appreciation (depreciation), and undistributed ordinary income for income tax purposes were as follows:
| | | | |
Cost of investments | | $ | 2,358,006,714 | |
| | | | |
| |
Unrealized appreciation | | $ | 455,736,871 | |
Unrealized depreciation | | | (265,912,654 | ) |
| | | | |
Net unrealized appreciation (depreciation) | | $ | 189,824,217 | |
| | | | |
Distributable earnings – undistributed ordinary income | | $ | 62,406,306 | |
| | | | |
Differences between income and/or capital gains as determined on a book basis and a tax basis are primarily due to differing treatment of foreign currency transactions and wash sales.
6. INVESTMENT TRANSACTIONS
Purchases and sales of investments (excluding short term securities) for the year ended December 31, 2012, aggregated $294,516,033 and $447,059,122, respectively.
7. INVESTMENTS IN INSTITUTIONAL FIDUCIARY TRUST MONEY MARKET PORTFOLIO
The Fund invests in the Institutional Fiduciary Trust Money Market Portfolio (Sweep Money Fund), an open-end investment company managed by Franklin Advisers, Inc. (an affiliate of the investment manager). Management fees paid by the Fund are reduced on assets invested in the Sweep Money Fund, in an amount not to exceed the management and administrative fees paid by the Sweep Money Fund.
8. CONCENTRATION OF RISK
Investing in foreign securities may include certain risks and considerations not typically associated with investing in U.S. securities, such as fluctuating currency values and changing local and regional economic, political and social conditions, which may result in greater market volatility. In addition, certain foreign securities may not be as liquid as U.S. securities.
9. CREDIT FACILITY
The Fund, together with other U.S. registered and foreign investment funds (collectively, Borrowers), managed by Franklin Templeton Investments, are borrowers in a joint syndicated senior unsecured credit facility totaling $1.5 billion (Global Credit Facility) which matured on January 18, 2013. This Global Credit Facility provides a source of funds to the Borrowers for temporary and emergency purposes, including the ability to meet future unanticipated or unusually large redemption requests. Effective January 18, 2013, the Borrowers renewed the Global Credit Facility which matures on January 17, 2014.
Under the terms of the Global Credit Facility, the Fund shall, in addition to interest charged on any borrowings made by the Fund and other costs incurred by the Fund, pay its share of fees and expenses incurred in connection with the implementation and maintenance of the Global Credit Facility, based upon its relative share of the aggregate net assets of all of the Borrowers, including an annual commitment fee of 0.07% based upon the unused portion of the Global Credit Facility. These fees are reflected in other expenses on the Statement of Operations. During the year ended December 31, 2012, the Fund did not use the Global Credit Facility.
TF-25
Franklin Templeton Variable Insurance Products Trust
Notes to Financial Statements (continued)
Templeton Foreign Securities Fund
10. FAIR VALUE MEASUREMENTS
The Fund follows a fair value hierarchy that distinguishes between market data obtained from independent sources (observable inputs) and the Fund’s own market assumptions (unobservable inputs). These inputs are used in determining the value of the Fund’s financial instruments and are summarized in the following fair value hierarchy:
| | • | | Level 1 – quoted prices in active markets for identical financial instruments |
| | • | | Level 2 – other significant observable inputs (including quoted prices for similar financial instruments, interest rates, prepayment speed, credit risk, etc.) |
| | • | | Level 3 – significant unobservable inputs (including the Fund’s own assumptions in determining the fair value of financial instruments) |
The inputs or methodology used for valuing financial instruments are not an indication of the risk associated with investing in those financial instruments.
For movements between the levels within the fair value hierarchy, the Fund has adopted a policy of recognizing the transfers as of the date of the underlying event which caused the movement. Additionally, at December 31, 2012, due to market events, the Fund employed fair value procedures to value a portion of its holdings. Such procedures resulted in a temporary transfer of financial instruments valued at $1,519,240,254 from Level 1 to Level 2 within the fair value hierarchy.
A summary of inputs used as of December 31, 2012, in valuing the Fund’s assets carried at fair value, is as follows:
| | | | | | | | | | | | | | | | |
| | | Level 1 | | | Level 2 | | | Level 3 | | | Total | |
| | | | |
Assets: | | | | | | | | | | | | | | | | |
Investments in Securities: | | | | | | | | | | | | | | | | |
Equity Investments:a | | | | | | | | | | | | | | | | |
Aerospace & Defense | | $ | — | | | $ | 29,271,038 | | | $ | — | | | $ | 29,271,038 | |
Airlines | | | — | | | | 26,095,324 | | | | — | | | | 26,095,324 | |
Automobiles | | | 41,072,895 | | | | 11,175,790 | | | | — | | | | 52,248,685 | |
Chemicals | | | — | | | | 34,913,474 | | | | — | | | | 34,913,474 | |
Commercial Banks | | | 109,383,754 | | | | 200,423,183 | | | | — | | | | 309,806,937 | |
Commercial Services & Supplies | | | — | | | | 21,153,214 | | | | — | | | | 21,153,214 | |
Construction & Engineering | | | — | | | | 19,501,528 | | | | — | | | | 19,501,528 | |
Construction Materials | | | — | | | | 13,414,605 | | | | — | | | | 13,414,605 | |
Containers & Packaging | | | — | | | | 21,627,709 | | | | — | | | | 21,627,709 | |
Diversified Financial Services | | | — | | | | 63,895,833 | | | | — | | | | 63,895,833 | |
Diversified Telecommunication Services | | | 50,867,988 | | | | 127,642,687 | | | | — | | | | 178,510,675 | |
Energy Equipment & Services | | | 18,775,503 | | | | 33,492,976 | | | | — | | | | 52,268,479 | |
Food & Staples Retailing | | | — | | | | 55,576,590 | | | | — | | | | 55,576,590 | |
Industrial Conglomerates | | | 26,098,427 | | | | 70,205,328 | | | | — | | | | 96,303,755 | |
Insurance | | | 90,535,928 | | | | 201,639,900 | | | | — | | | | 292,175,828 | |
Media | | | — | | | | 29,909,754 | | | | — | | | | 29,909,754 | |
Multiline Retail | | | — | | | | 25,575,433 | | | | — | | | | 25,575,433 | |
Multi-Utilities | | | — | | | | 31,566,279 | | | | — | | | | 31,566,279 | |
Oil, Gas & Consumable Fuels | | | 55,935,969 | | | | 180,669,102 | | | | — | | | | 236,605,071 | |
Pharmaceuticals | | | 93,878,823 | | | | 181,711,307 | | | | — | | | | 275,590,130 | |
Professional Services | | | — | | | | 38,660,420 | | | | — | | | | 38,660,420 | |
Semiconductors & Semiconductor Equipment | | | 119,318,329 | | | | 8,984,975 | | | | — | | | | 128,303,304 | |
Software | | | — | | | | 26,193,449 | | | | — | | | | 26,193,449 | |
Specialty Retail | | | — | | | | 43,749,567 | | | | — | | | | 43,749,567 | |
Trading Companies & Distributors | | | — | | | | 22,190,789 | | | | — | | | | 22,190,789 | �� |
All Other Equity Investmentsb | | | 342,616,803 | | | | — | | | | — | | | | 342,616,803 | |
Short Term Investments | | | 73,488,658 | | | | 6,617,600 | | | | — | | | | 80,106,258 | |
| | | | |
Total Investments in Securities | | $ | 1,021,973,077 | | | $ | 1,525,857,854 | | | $ | — | | | $ | 2,547,830,931 | |
| | | | |
a Includes common and preferred stock as well as other equity investments.
b For detailed categories, see the accompanying Statement of Investments.
TF-26
Franklin Templeton Variable Insurance Products Trust
Notes to Financial Statements (continued)
Templeton Foreign Securities Fund
11. NEW ACCOUNTING PRONOUNCEMENTS
In December 2011, the Financial Accounting Standards Board (FASB) issued Accounting Standards Update (ASU) No. 2011-11, Balance Sheet (Topic 210): Disclosures about Offsetting Assets and Liabilities. The amendments in the ASU enhance disclosures about offsetting of financial assets and liabilities to enable investors to understand the effect of these arrangements on a fund’s financial position. In January 2013, FASB issued ASU No. 2013-01, Balance Sheet (Topic 210): Clarifying the Scope of Disclosures about Offsetting Assets and Liabilities. The amendments in ASU No. 2013-01 clarify the intended scope of disclosures required by ASU No. 2011-11. These ASUs are effective for interim and annual reporting periods beginning on or after January 1, 2013. The Fund believes the adoption of these ASUs will not have a material impact on its financial statements.
12. SUBSEQUENT EVENTS
The Fund has evaluated subsequent events through the issuance of the financial statements and determined that no events have occurred that require disclosure other than those already disclosed in the financial statements.
| | | | |
ABBREVIATIONS | | | | |
| Selected Portfolio | | | | |
| | | | |
| ADR - American Depositary Receipt | | | | |
TF-27
Franklin Templeton Variable Insurance Products Trust
Templeton Foreign Securities Fund
Report of Independent Registered Public Accounting Firm
To the Board of Trustees and Shareholders of
Franklin Templeton Variable Insurance Products Trust
In our opinion, the accompanying statement of assets and liabilities, including the statement of investments, and the related statements of operations and of changes in net assets and the financial highlights present fairly, in all material respects, the financial position of Templeton Foreign Securities Fund (the “Fund”) at December 31, 2012, the results of its operations for the year then ended, the changes in its net assets for each of the two years in the period then ended and the financial highlights for the periods presented, in conformity with accounting principles generally accepted in the United States of America. These financial statements and financial highlights (hereafter referred to as “financial statements”) are the responsibility of the Fund’s management. Our responsibility is to express an opinion on these financial statements based on our audits. We conducted our audits of these financial statements in accordance with the standards of the Public Company Accounting Oversight Board (United States). Those standards require that we plan and perform the audit to obtain reasonable assurance about whether the financial statements are free of material misstatement. An audit includes examining, on a test basis, evidence supporting the amounts and disclosures in the financial statements, assessing the accounting principles used and significant estimates made by management, and evaluating the overall financial statement presentation. We believe that our audits, which included confirmation of securities at December 31, 2012 by correspondence with the custodian, transfer agent and brokers, provide a reasonable basis for our opinion.
PricewaterhouseCoopers LLP
San Francisco, California
February 15, 2013
TF-28
Franklin Templeton Variable Insurance Products Trust
Tax Information (unaudited)
Templeton Foreign Securities Fund
At December 31, 2012, more than 50% of the Fund’s total assets were invested in securities of foreign issuers. In most instances, foreign taxes were withheld from income paid to the Fund on these investments. The Fund elects to treat foreign taxes paid as allowed under Section 853 of the Internal Revenue Code (Code). This election will allow shareholders of record as of the 2013 distribution date, to treat their proportionate share of foreign taxes paid by the Fund as having been paid directly by them. The shareholder shall consider these amounts as foreign taxes paid in the tax year in which they receive the Fund distribution.
TF-29
TEMPLETON GLOBAL BOND SECURITIES FUND
We are pleased to bring you Templeton Global Bond Securities Fund’s annual report for the fiscal year ended December 31, 2012.
Performance Summary as of 12/31/12
Average annual total return of Class 2 shares represents the average annual change in value, assuming reinvestment of dividends and capital gains. Average returns smooth out variations in returns, which can be significant; they are not the same as year-by-year results.
Periods ended 12/31/12
| | | | | | | | | | | | |
| | | 1-Year | | | 5-Year | | | 10-Year | |
Average Annual Total Return | | | +15.07% | | | | +10.47% | | | | +10.86% | |
Total Return Index Comparison
for a Hypothetical $10,000 Investment (1/1/03–12/31/12)
The graph below shows the change in value of a hypothetical $10,000 investment in the Fund over the indicated period and includes reinvestment of any income or distributions. The Fund’s performance is compared to the performance of the J.P. Morgan (JPM) Global Government Bond Index (GGBI), the Citigroup World Government Bond Index (WGBI) and the Consumer Price Index (CPI). One cannot invest directly in an index, and an index is not representative of the Fund’s portfolio. Please see Important Notes to Performance Information preceding the Fund Summaries.
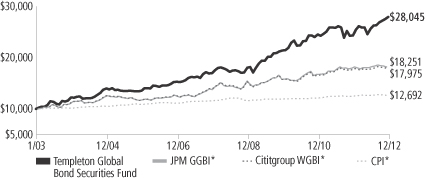
*Source: © 2013 Morningstar. Please see Index Descriptions following the Fund Summaries.
Templeton Global Bond Securities Fund – Class 2
Performance reflects the Fund’s Class 2 operating expenses, but does not include any contract fees, expenses or sales charges. If they had been included, performance would be lower. These charges and deductions, particularly for variable life policies, can have a significant effect on contract values and insurance benefits. See the contract prospectus for a complete description of these expenses, including sales charges.
Performance data represent past performance, which does not guarantee future results. Investment return and principal value will fluctuate, and you may have a gain or loss when you sell your shares.
Current performance may differ from figures shown.
TGB-1
Fund Goal and Main Investments: Templeton Global Bond Securities Fund seeks high current income, consistent with preservation of capital, with capital appreciation as a secondary consideration. Under normal market conditions, the Fund invests at least 80% of its net assets in bonds, which include debt securities of any maturity, such as bonds, notes, bills and debentures.
Performance Overview
You can find the Fund’s one-year total return in the Performance Summary. The Fund outperformed its benchmarks, the JPM GGBI, which posted a +1.29% total return in U.S. dollar terms, and the Citigroup WGBI, which produced a +1.65% total return for the same period.1
Economic and Market Overview
The global economic recovery was mixed during 2012. Emerging markets continued to lead the recovery with many economies returning to and exceeding pre-crisis activity levels. Although some developed economies, such as those of Australia and some Scandinavian countries, also enjoyed relatively strong recoveries, growth in the G-3 (U.S., eurozone and Japan) continued to be slow by the standards of previous recoveries. Nonetheless, economic reports from the largest economies proved inconsistent with some dire predictions of a severe global economic slowdown.
The ebb and flow of concerns about the issues of sovereign debt in Europe, the possibility of another recession in the U.S., and a potential “hard landing” in China continued to drive broad market sentiment. This contributed to periods of market risk aversion, during which yields declined, equity markets sold off and perceived safe-haven assets such as U.S. Treasuries rallied. These alternated with periods of heightened risk appetite, during which yields increased and investors again favored risk assets.
Despite ongoing uncertainty, eurozone leaders made meaningful progress and began to deploy policy solutions aimed at correcting long-unaddressed structural issues. Policymakers in the largest developed economies further increased their already unprecedented efforts to supply liquidity and with few exceptions, policymakers elsewhere in the world paused their tightening cycles or reduced rates in response to
1. Source: © 2013 Morningstar. One cannot invest directly in an index, and an index is not representative of the Fund’s portfolio. Please see Index Descriptions following the Fund Summaries.
Fund Risks: All investments involve risks, including possible loss of principal. Changes in interest rates will affect the value of the Fund’s portfolio and its share price and yield. Bond prices generally move in the opposite direction of interest rates. Thus, as the prices of bonds in the Fund adjust to a rise in interest rates, the Fund’s share price may decline. Special risks are associated with foreign investing, including currency fluctuations, economic instability and political developments. Investments in developing markets involve heightened risks related to the same factors, in addition to those associated with their relatively small size and lesser liquidity. The Fund’s use of derivatives and foreign currency techniques involves special risks as such usage may not achieve the anticipated benefits and/or may result in losses to the Fund. The Fund is also nondiversified, which involves the risk of greater price fluctuation than a more diversified portfolio. The Fund is actively managed but there is no guarantee that the manager’s investment decisions will produce the desired results. The Fund’s prospectus also includes a description of the main investment risks.
TGB-2
the risks to domestic activity from a potential deterioration in the global outlook. In addition to rate adjustments, central bankers employed a variety of policy tools. The U.S. Federal Reserve Board (Fed) increased the average maturity of its Treasury holdings and announced it would increase its holdings of mortgage bonds in a third round of quantitative easing. The Fed also adopted a set of thresholds for continuing a highly accommodative monetary policy when its asset purchase program comes to an end. These included requirements that the unemployment rate remains above 6.5%, inflation does not exceed 2.5%, and longer term inflation expectations continue to be well-anchored. The European Central Bank announced its Outright Monetary Transactions (OMT) program, which was designed to allow the central bank to purchase government bonds on the secondary market to ease borrowing pressures in the eurozone. Potential purchases through the OMT program would be conditional upon government participation in programs designed to ensure that participating governments meet stated reform targets. The Bank of England and Bank of Japan expanded their respective asset purchase programs. Similarly, Chinese officials signaled a desire to pursue “fine tuning,” which included two reductions in the reserve requirement ratio.
Investment Strategy
We invest selectively in bonds around the world based upon our assessment of changing market, political and economic conditions. While seeking opportunities, we monitor various factors including changes in interest rates, currency exchange rates and credit risks. We seek to manage the Fund’s exposure to various currencies and may utilize currency forward contracts.
Manager’s Discussion
The Fund’s total return was influenced by various factors, including interest rate developments, currency movements and exposure to sovereign debt markets. During the year under review, each of these sources of return benefited absolute and relative performance.
Interest Rate Strategy
We maintained a defensive posture with respect to interest rate risk in developed and emerging markets. At period-end, the Fund had a shorter duration position than the JPM GGBI given our assessment that there is limited scope for further global interest rate reductions from historically low levels and improving economic conditions. However, we maintained some duration exposure in countries where we believed
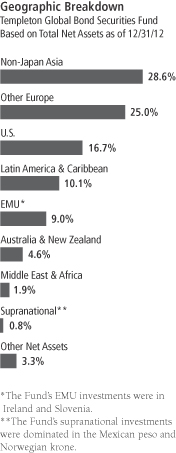
What is a currency forward contract?
A currency forward contract is an agreement between the Fund and a counterparty to buy or sell a foreign currency for a specific exchange rate on a future date.
What is duration?
Duration is a measure of a bond’s price sensitivity to interest rate changes. In general, a portfolio of securities with a lower duration can be expected to be less sensitive to interest rate changes than a portfolio with a higher duration.
TGB-3
long-term bond yields could benefit from declining risk premiums, and select duration exposures in Asia and Latin America contributed to absolute and relative performance.
Currency Strategy
As part of the Fund’s investment strategy, we used currency forward contracts to hedge or gain exposure to various currencies. Overall, our diversified currency exposure contributed to absolute and relative performance and certain Latin American and Asia ex-Japan exposures were among the largest contributors. As the Japanese yen depreciated against the U.S. dollar during the year, the Fund’s net negative position in the currency, achieved via the use of currency forward contracts, contributed meaningfully to performance. Our net negative position in the yen reflected our pessimistic view on the relative prospects for the Japanese economy and served as an implicit hedge against potentially rising yields in the U.S., given the yen’s historically strong correlation to long-term U.S. Treasury yields. Exposure to peripheral European currencies positioned against the euro also added to performance. However, as the euro appreciated against the U.S. dollar during the year, our net negative position in the monetary union’s currency detracted from performance.
Global Sovereign Debt Strategy
The Fund purchased investment-grade and subinvestment-grade hard currency-denominated sovereign debt that typically compensates for greater credit risk by offering higher yields relative to U.S. Treasury and European benchmark bonds. Overall, the Fund’s sovereign credit exposures contributed to performance. These exposures were concentrated in non-eurozone Europe and included select Latin American and Asian exposures.
Thank you for your participation in Templeton Global Bond Securities Fund. We look forward to serving your future investment needs.
The foregoing information reflects our analysis, opinions and portfolio holdings as of December 31, 2012, the end of the reporting period. The way we implement our main investment strategies and the resulting portfolio holdings may change depending on factors such as market and economic conditions. These opinions may not be relied upon as investment advice or an offer for a particular security. The information is not a complete analysis of every aspect of any market, country, industry, security or the Fund. Statements of fact are from sources considered reliable, but the investment manager makes no representation or warranty as to their completeness or accuracy. Although historical performance is no guarantee of future results, these insights may help you understand our investment management philosophy.
Currency Breakdown
Templeton Global Bond Securities Fund
12/31/12
| | | | |
| | | % of Total
Net Assets | |
| |
Americas | | | 65.2% | |
U.S. Dollar | | | 49.2% | |
Mexican Peso | | | 8.3% | |
Brazilian Real | | | 3.0% | |
Chilean Peso | | | 4.5% | |
Peruvian Nuevo Sol | | | 0.2% | |
| |
Asia Pacific | | | 31.8% | |
South Korean Won | | | 14.4% | |
Malaysian Ringgit | | | 11.5% | |
Singapore Dollar | | | 7.5% | |
Indonesian Rupiah | | | 4.4% | |
Indian Rupee | | | 2.8% | |
Philippine Peso | | | 2.7% | |
Sri Lankan Rupee | | | 1.2% | |
Japanese Yen* | | | -12.7% | |
| |
Australia & New Zealand | | | 4.6% | |
Australian Dollar | | | 4.6% | |
| |
Middle East & Africa | | | 1.9% | |
New Israeli Shekel | | | 1.9% | |
| |
Europe* | | | -3.5% | |
Swedish Krona | | | 10.4% | |
Polish Zloty | | | 10.1% | |
Norwegian Krone | | | 2.2% | |
Hungarian Forint | | | 1.3% | |
Euro* | | | -27.5% | |
*Holding is a negative percentage because of the Fund’s holdings of currency forward contracts.
The dollar value, number of shares or principal amount, and names of all portfolio holdings are listed in the Fund’s Statement of Investments.
TGB-4
Fund Expenses
As an investor in a variable insurance contract (Contract) that indirectly provides for investment in an underlying mutual fund, you can incur transaction and/or ongoing expenses at both the Fund level and the Contract level.
| • | | Transaction expenses can include sales charges (loads) on purchases, redemption fees, surrender fees, transfer fees and premium taxes. |
| • | | Ongoing expenses can include management fees, distribution and service (12b-1) fees, contract fees, annual maintenance fees, mortality and expense risk fees and other fees and expenses. All mutual funds and Contracts have some types of ongoing expenses. |
The expenses shown in the table are meant to highlight ongoing expenses at the Fund level only and do not include ongoing expenses at the Contract level, or transaction expenses at either the Fund or Contract level. While the Fund does not have transaction expenses, if the transaction and ongoing expenses at the Contract level were included, the expenses shown below would be higher. You should consult your Contract prospectus or disclosure document for more information.
The table shows Fund-level ongoing expenses and can help you understand these expenses and compare them with those of other mutual funds offered through the Contract. The table assumes a $1,000 investment held for the six months indicated. Please refer to the Fund prospectus for additional information on operating expenses.
Actual Fund Expenses
The first line (Actual) of the table provides actual account values and expenses. The “Ending Account Value” is derived from the Fund’s actual return, which includes the effect of ongoing Fund expenses, but does not include the effect of ongoing Contract expenses.
You can estimate the Fund-level expenses you incurred during the period by following these steps. Of course, your account value and expenses will differ from those in this illustration:
| 1. | Divide your account value by $1,000. |
If an account had an $8,600 value, then $8,600 ÷ $1,000 = 8.6.
| 2. | Multiply the result by the number under the heading “Fund-Level Expenses Incurred During Period.” |
If Fund-Level Expenses Incurred During Period were $7.50, then
8.6 x $7.50 = $64.50.
In this illustration, the estimated expenses incurred this period at the Fund level are $64.50.
Templeton Global Bond Securities Fund – Class 2
TGB-5
Hypothetical Example for Comparison with Other Mutual Funds
Information in the second line (Hypothetical) of the table can help you compare ongoing expenses of the Fund with those of other mutual funds offered through the Contract. This information may not be used to estimate the actual ending account balance or expenses you incurred during the period. The hypothetical “Ending Account Value” is based on the Fund’s actual expense ratio for each class and an assumed 5% annual rate of return before expenses, which does not represent the Fund’s actual return. The figure under the heading “Fund-Level Expenses Incurred During Period” shows the hypothetical expenses your account would have incurred under this scenario. You can compare this figure with the 5% hypothetical examples that appear in shareholder reports of other funds offered through a Contract.
| | | | | | | | | | | | |
| Class 2 | | Beginning
Account
Value
7/1/12 | | | Ending
Account
Value
12/31/12 | | | Fund-Level Expenses Incurred During Period* 7/1/12–12/31/12 | |
Actual | | $ | 1,000 | | | $ | 1,090.80 | | | $ | 4.20 | |
Hypothetical (5% return
before expenses) | | $ | 1,000 | | | $ | 1,021.11 | | | $ | 4.06 | |
*Expenses are calculated using the most recent six-month annualized expense ratio for the Fund’s Class 2 shares (0.80%), which does not include any ongoing expenses of the Contract for which the Fund is an investment option, multiplied by the average account value over the period, multiplied by 184/366 to reflect the one-half year period.
TGB-6
Franklin Templeton Variable Insurance Products Trust
Financial Highlights
Templeton Global Bond Securities Fund
| | | | | | | | | | | | | | | | | | | | |
| | | Year Ended December 31, | |
| Class 1 | | 2012 | | | 2011 | | | 2010 | | | 2009 | | | 2008 | |
| | | | |
Per share operating performance | | | | | | | | | | | | | | | | | | | | |
(for a share outstanding throughout the year) | | | | | | | | | | | | | | | | | | | | |
Net asset value, beginning of year | | $ | 18.61 | | | $ | 19.94 | | | $ | 17.72 | | | $ | 17.42 | | | $ | 17.00 | |
| | | | |
Income from investment operationsa: | | | | | | | | | | | | | | | | | | | | |
Net investment incomeb | | | 0.72 | | | | 0.87 | | | | 1.00 | | | | 0.99 | | | | 0.80 | |
Net realized and unrealized gains (losses) | | | 1.99 | | | | (0.92 | ) | | | 1.58 | | | | 2.01 | | | | 0.27 | |
| | | | |
Total from investment operations | | | 2.71 | | | | (0.05 | ) | | | 2.58 | | | | 3.00 | | | | 1.07 | |
| | | | |
Less distributions from: | | | | | | | | | | | | | | | | | | | | |
Net investment income and net foreign currency gains | | | (1.28 | ) | | | (1.15 | ) | | | (0.31 | ) | | | (2.70 | ) | | | (0.65 | ) |
Net realized gains | | | (0.03 | ) | | | (0.13 | ) | | | (0.05 | ) | | | — | | | | — | |
| | | | |
Total distributions | | | (1.31 | ) | | | (1.28 | ) | | | (0.36 | ) | | | (2.70 | ) | | | (0.65 | ) |
| | | | |
Redemption feesc | | | — | | | | — | | | | — | | | | — | | | | — | |
| | | | |
Net asset value, end of year | | $ | 20.01 | | | $ | 18.61 | | | $ | 19.94 | | | $ | 17.72 | | | $ | 17.42 | |
| | | | |
| | | | | |
Total returnd | | | 15.31% | | | | (0.61)% | | | | 14.71% | | | | 18.98% | | | | 6.46% | |
Ratios to average net assets | | | | | | | | | | | | | | | | | | | | |
Expensese | | | 0.55% | | | | 0.56% | | | | 0.55% | | | | 0.54% | | | | 0.58% | |
Net investment income | | | 3.71% | | | | 4.40% | | | | 5.27% | | | | 5.73% | | | | 4.66% | |
| | | | | |
Supplemental data | | | | | | | | | | | | | | | | | | | | |
Net assets, end of year (000’s) | | $ | 307,142 | | | $ | 269,819 | | | $ | 272,232 | | | $ | 195,662 | | | $ | 220,588 | |
Portfolio turnover rate | | | 43.26% | | | | 34.18% | | | | 8.77% | | | | 20.84% | | | | 28.46% | |
aThe amount shown for a share outstanding throughout the period may not correlate with the Statement of Operations for the period due to the timing of sales and repurchases of the Fund shares in relation to income earned and/or fluctuating market value of the investments of the Fund.
bBased on average daily shares outstanding.
cAmount rounds to less than $0.01 per share.
dTotal return does not include fees, charges or expenses imposed by the variable annuity and life insurance contracts for which the Franklin Templeton Variable Insurance Products Trust serves as an underlying investment vehicle.
eBenefit of expense reduction rounds to less than 0.01%.
The accompanying notes are an integral part of these financial statements.
TGB-7
Franklin Templeton Variable Insurance Products Trust
Financial Highlights (continued)
Templeton Global Bond Securities Fund
| | | | | | | | | | | | | | | | | | | | |
| | | Year Ended December 31, | |
| Class 2 | | 2012 | | | 2011 | | | 2010 | | | 2009 | | | 2008 | |
| | | | |
Per share operating performance | | | | | | | | | | | | | | | | | | | | |
(for a share outstanding throughout the year) | | | | | | | | | | | | | | | | | | | | |
Net asset value, beginning of year | | $ | 18.15 | | | $ | 19.49 | | | $ | 17.34 | | | $ | 17.10 | | | $ | 16.72 | |
| | | | |
Income from investment operationsa: | | | | | | | | | | | | | | | | | | | | |
Net investment incomeb | | | 0.65 | | | | 0.79 | | | | 0.93 | | | | 0.93 | | | | 0.74 | |
Net realized and unrealized gains (losses) | | | 1.94 | | | | (0.89 | ) | | | 1.54 | | | | 1.98 | | | | 0.27 | |
| | | | |
Total from investment operations | | | 2.59 | | | | (0.10 | ) | | | 2.47 | | | | 2.91 | | | | 1.01 | |
| | | | |
Less distributions from: | | | | | | | | | | | | | | | | | | | | |
Net investment income and net foreign currency gains | | | (1.24 | ) | | | (1.11 | ) | | | (0.27 | ) | | | (2.67 | ) | | | (0.63 | ) |
Net realized gains | | | (0.03 | ) | | | (0.13 | ) | | | (0.05 | ) | | | — | | | | — | |
| | | | |
Total distributions | | | (1.27 | ) | | | (1.24 | ) | | | (0.32 | ) | | | (2.67 | ) | | | (0.63 | ) |
| | | | |
Redemption feesc | | | — | | | | — | | | | — | | | | — | | | | — | |
| | | | |
Net asset value, end of year | | $ | 19.47 | | | $ | 18.15 | | | $ | 19.49 | | | $ | 17.34 | | | $ | 17.10 | |
| | | | |
| | | | | |
Total returnd | | | 15.07% | | | | (0.87)% | | | | 14.45% | | | | 18.68% | | | | 6.21% | |
Ratios to average net assets | | | | | | | | | | | | | | | | | | | | |
Expensese | | | 0.80% | | | | 0.81% | | | | 0.80% | | | | 0.79% | | | | 0.83% | |
Net investment income | | | 3.46% | | | | 4.15% | | | | 5.02% | | | | 5.48% | | | | 4.41% | |
| | | | | |
Supplemental data | | | | | | | | | | | | | | | | | | | | |
Net assets, end of year (000’s) | | $ | 2,418,229 | | | $ | 1,812,814 | | | $ | 1,490,794 | | | $ | 1,262,783 | | | $ | 793,773 | |
Portfolio turnover rate | | | 43.26% | | | | 34.18% | | | | 8.77% | | | | 20.84% | | | | 28.46% | |
aThe amount shown for a share outstanding throughout the period may not correlate with the Statement of Operations for the period due to the timing of sales and repurchases of the Fund shares in relation to income earned and/or fluctuating market value of the investments of the Fund.
bBased on average daily shares outstanding.
cAmount rounds to less than $0.01 per share.
dTotal return does not include fees, charges or expenses imposed by the variable annuity and life insurance contracts for which the Franklin Templeton Variable Insurance Products Trust serves as an underlying investment vehicle.
eBenefit of expense reduction rounds to less than 0.01%.
The accompanying notes are an integral part of these financial statements.
TGB-8
Franklin Templeton Variable Insurance Products Trust
Financial Highlights (continued)
Templeton Global Bond Securities Fund
| | | | | | | | | | | | | | | | | | | | |
| | | Year Ended December 31, | |
| Class 3 | | 2012 | | | 2011 | | | 2010 | | | 2009 | | | 2008 | |
| | | | |
Per share operating performance | | | | | | | | | | | | | | | | | | | | |
(for a share outstanding throughout the year) | | | | | | | | | | | | | | | | | | | | |
Net asset value, beginning of year | | $ | 18.15 | | | $ | 19.48 | | | $ | 17.33 | | | $ | 17.08 | | | $ | 16.70 | |
| | | | |
Income from investment operationsa: | | | | | | | | | | | | | | | | | | | | |
Net investment incomeb | | | 0.65 | | | | 0.80 | | | | 0.93 | | | | 0.93 | | | | 0.74 | |
Net realized and unrealized gains (losses) | | | 1.94 | | | | (0.90 | ) | | | 1.54 | | | | 1.98 | | | | 0.27 | |
| | | | |
Total from investment operations | | | 2.59 | | | | (0.10 | ) | | | 2.47 | | | | 2.91 | | | | 1.01 | |
| | | | |
Less distributions from: | | | | | | | | | | | | | | | | | | | | |
Net investment income and net foreign currency gains | | | (1.23 | ) | | | (1.10 | ) | | | (0.27 | ) | | | (2.66 | ) | | | (0.63 | ) |
Net realized gains | | | (0.03 | ) | | | (0.13 | ) | | | (0.05 | ) | | | — | | | | — | |
| | | | |
Total distributions | | | (1.26 | ) | | | (1.23 | ) | | | (0.32 | ) | | | (2.66 | ) | | | (0.63 | ) |
| | | | |
Redemption feesc | | | — | | | | — | | | | — | | | | — | | | | — | |
| | | | |
Net asset value, end of year | | $ | 19.48 | | | $ | 18.15 | | | $ | 19.48 | | | $ | 17.33 | | | $ | 17.08 | |
| | | | |
| | | | | |
Total returnd | | | 15.06% | | | | (0.83)% | | | | 14.38% | | | | 18.69% | | | | 6.21% | |
Ratios to average net assets | | | | | | | | | | | | | | | | | | | | |
Expensese | | | 0.80% | | | | 0.81% | | | | 0.80% | | | | 0.79% | | | | 0.83% | |
Net investment income | | | 3.46% | | | | 4.15% | | | | 5.02% | | | | 5.48% | | | | 4.41% | |
| | | | | |
Supplemental data | | | | | | | | | | | | | | | | | | | | |
Net assets, end of year (000’s) | | $ | 198,077 | | | $ | 185,811 | | | $ | 183,380 | | | $ | 143,264 | | | $ | 128,155 | |
Portfolio turnover rate | | | 43.26% | | | | 34.18% | | | | 8.77% | | | | 20.84% | | | | 28.46% | |
aThe amount shown for a share outstanding throughout the period may not correlate with the Statement of Operations for the period due to the timing of sales and repurchases of the Fund shares in relation to income earned and/or fluctuating market value of the investments of the Fund.
bBased on average daily shares outstanding.
cAmount rounds to less than $0.01 per share.
dTotal return does not include fees, charges or expenses imposed by the variable annuity and life insurance contracts for which the Franklin Templeton Variable Insurance Products Trust serves as an underlying investment vehicle.
eBenefit of expense reduction rounds to less than 0.01%.
The accompanying notes are an integral part of these financial statements.
TGB-9
Franklin Templeton Variable Insurance Products Trust
Financial Highlights (continued)
Templeton Global Bond Securities Fund
| | | | | | | | | | | | | | | | | | | | |
| | | Year Ended December 31, | |
| Class 4 | | 2012 | | | 2011 | | | 2010 | | | 2009 | | | 2008a | |
Per share operating performance | | | | | | | | | | | | | | | | | | | | |
(for a share outstanding throughout the year) | | | | | | | | | | | | | | | | | | | | |
Net asset value, beginning of year | | $ | 18.44 | | | $ | 19.78 | | | $ | 17.61 | | | $ | 17.37 | | | $ | 18.00 | |
| | | | |
Income from investment operationsb: | | | | | | | | | | | | | | | | | | | | |
Net investment incomec | | | 0.64 | | | | 0.79 | | | | 0.93 | | | | 0.93 | | | | 0.66 | |
Net realized and unrealized gains (losses) | | | 1.98 | | | | (0.91 | ) | | | 1.56 | | | | 2.00 | | | | (0.64 | ) |
| | | | |
Total from investment operations | | | 2.62 | | | | (0.12 | ) | | | 2.49 | | | | 2.93 | | | | 0.02 | |
| | | | |
Less distributions from: | | | | | | | | | | | | | | | | | | | | |
Net investment income and net foreign currency gains | | | (1.21 | ) | | | (1.09 | ) | | | (0.27 | ) | | | (2.69 | ) | | | (0.65 | ) |
Net realized gains | | | (0.03 | ) | | | (0.13 | ) | | | (0.05 | ) | | | — | | | | — | |
| | | | |
Total distributions | | | (1.24 | ) | | | (1.22 | ) | | | (0.32 | ) | | | (2.69 | ) | | | (0.65 | ) |
| | | | |
Redemption feesd | | | — | | | | — | | | | — | | | | — | | | | — | |
| | | | |
Net asset value, end of year | | $ | 19.82 | | | $ | 18.44 | | | $ | 19.78 | | | $ | 17.61 | | | $ | 17.37 | |
| | | | |
| | | | | |
Total returne | | | 14.97% | | | | (0.96)% | | | | 14.28% | | | | 18.58% | | | | 0.26% | |
Ratios to average net assetsf | | | | | | | | | | | | | | | | | | | | |
Expensesg | | | 0.90% | | | | 0.91% | | | | 0.90% | | | | 0.89% | | | | 0.93% | |
Net investment income | | | 3.36% | | | | 4.05% | | | | 4.92% | | | | 5.38% | | | | 4.31% | |
| | | | | |
Supplemental data | | | | | | | | | | | | | | | | | | | | |
Net assets, end of year (000’s) | | $ | 163,241 | | | $ | 151,695 | | | $ | 150,891 | | | $ | 108,910 | | | $ | 43,069 | |
Portfolio turnover rate | | | 43.26% | | | | 34.18% | | | | 8.77% | | | | 20.84% | | | | 28.46% | |
aFor the period February 29, 2008 (effective date) to December 31, 2008.
bThe amount shown for a share outstanding throughout the period may not correlate with the Statement of Operations for the period due to the timing of sales and repurchases of the Fund shares in relation to income earned and/or fluctuating market value of the investments of the Fund.
cBased on average daily shares outstanding.
dAmount rounds to less than $0.01 per share.
eTotal return does not include fees, charges or expenses imposed by the variable annuity and life insurance contracts for which the Franklin Templeton Variable Insurance Products Trust serves as an underlying investment vehicle. Total return is not annualized for periods less than one year.
fRatios are annualized for periods less than one year.
gBenefit of expense reduction rounds to less than 0.01%.
The accompanying notes are an integral part of these financial statements.
TGB-10
Franklin Templeton Variable Insurance Products Trust
Statement of Investments, December 31, 2012
| | | | | | | | |
| Templeton Global Bond Securities Fund | | Principal
Amount* | | | Value | |
Foreign Government and Agency Securities 69.2% | | | | | | | | |
Australia 4.6% | | | | | | | | |
Government of Australia, senior bond, 6.50%, 5/15/13 | | | 12,260,000 | AUD | | $ | 12,916,566 | |
New South Wales Treasury Corp., | | | | | | | | |
5.25%, 5/01/13 | | | 3,370,000 | AUD | | | 3,529,981 | |
5.50%, 8/01/13 | | | 35,790,000 | AUD | | | 37,755,376 | |
senior note, 5.50%, 3/01/17 | | | 32,225,000 | AUD | | | 36,469,327 | |
Queensland Treasury Corp.,
senior bond, 6.00%, 9/14/17 | | | 13,160,000 | AUD | | | 15,261,531 | |
senior note, 6.00%, 8/14/13 | | | 24,450,000 | AUD | | | 25,904,519 | |
senior note, 6.00%, 8/21/13 | | | 8,888,000 | AUD | | | 9,417,787 | |
| | | | | | | | |
| | | | | | | 141,255,087 | |
| | | | | | | | |
Brazil 3.0% | | | | | | | | |
Nota Do Tesouro Nacional, | | | | | | | | |
10.00%, 1/01/14 | | | 7,100 | a BRL | | | 3,555,502 | |
10.00%, 1/01/17 | | | 22,490 | a BRL | | | 11,572,085 | |
bIndex Linked, 6.00%, 5/15/15 | | | 30,226 | a BRL | | | 35,884,024 | |
bIndex Linked, 6.00%, 8/15/16 | | | 11,218 | a BRL | | | 13,677,333 | |
bIndex Linked, 6.00%, 5/15/17 | | | 202 | a BRL | | | 250,164 | |
bIndex Linked, 6.00%, 8/15/18 | | | 8,425 | a BRL | | | 10,632,704 | |
bIndex Linked, 6.00%, 5/15/45 | | | 10,825 | a BRL | | | 16,143,301 | |
| | | | | | | | |
| | | | | | | 91,715,113 | |
| | | | | | | | |
Hungary 3.0% | | | | | | | | |
Government of Hungary, | | | | | | | | |
5.50%, 2/12/14 | | | 628,240,000 | HUF | | | 2,858,060 | |
7.75%, 8/24/15 | | | 606,390,000 | HUF | | | 2,888,452 | |
5.50%, 2/12/16 | | | 436,800,000 | HUF | | | 1,973,432 | |
6.50%, 6/24/19 | | | 389,700,000 | HUF | | | 1,821,185 | |
7.50%, 11/12/20 | | | 28,000,000 | HUF | | | 138,943 | |
A, 8.00%, 2/12/15 | | | 280,000,000 | HUF | | | 1,334,707 | |
A, 6.75%, 11/24/17 | | | 1,903,650,000 | HUF | | | 8,933,053 | |
A, 7.00%, 6/24/22 | | | 249,200,000 | HUF | | | 1,201,401 | |
B, 6.75%, 2/24/17 | | | 394,700,000 | HUF | | | 1,850,001 | |
D, 6.75%, 2/12/13 | | | 310,800,000 | HUF | | | 1,410,247 | |
D, 6.75%, 8/22/14 | | | 1,856,440,000 | HUF | | | 8,601,006 | |
E, 7.50%, 10/24/13 | | | 248,600,000 | HUF | | | 1,143,496 | |
senior note, 3.50%, 7/18/16 | | | 1,055,000 | EUR | | | 1,345,227 | |
senior note, 4.375%, 7/04/17 | | | 7,480,000 | EUR | | | 9,722,549 | |
senior note, 5.75%, 6/11/18 | | | 14,475,000 | EUR | | | 19,817,505 | |
senior note, 6.25%, 1/29/20 | | | 6,420,000 | | | | 7,114,162 | |
senior note, 3.875%, 2/24/20 | | | 3,120,000 | EUR | | | 3,803,322 | |
senior note, 6.375%, 3/29/21 | | | 14,820,000 | | | | 16,505,775 | |
| | | | | | | | |
| | | | | | | 92,462,523 | |
| | | | | | | | |
Iceland 0.3% | | | | | | | | |
cGovernment of Iceland, 144A, 5.875%, 5/11/22 | | | 7,660,000 | | | | 8,643,850 | |
| | | | | | | | |
Indonesia 4.2% | | | | | | | | |
Government of Indonesia, | | | | | | | | |
FR20, 14.275%, 12/15/13 | | | 14,267,000,000 | IDR | | | 1,618,874 | |
FR31, 11.00%, 11/15/20 | | | 167,351,000,000 | IDR | | | 23,946,171 | |
FR34, 12.80%, 6/15/21 | | | 207,810,000,000 | IDR | | | 32,762,285 | |
FR35, 12.90%, 6/15/22 | | | 66,582,000,000 | IDR | | | 10,749,045 | |
TGB-11
Franklin Templeton Variable Insurance Products Trust
Statement of Investments, December 31, 2012 (continued)
| | | | | | | | |
| Templeton Global Bond Securities Fund | | Principal
Amount* | | | Value | |
Foreign Government and Agency Securities (continued) | | | | | | | | |
Indonesia (continued) | | | | | | | | |
FR36, 11.50%, 9/15/19 | | | 30,075,000,000 | IDR | | $ | 4,265,814 | |
FR39, 11.75%, 8/15/23 | | | 5,491,000,000 | IDR | | | 853,664 | |
FR40, 11.00%, 9/15/25 | | | 46,856,000,000 | IDR | | | 7,131,909 | |
FR43, 10.25%, 7/15/22 | | | 68,340,000,000 | IDR | | | 9,664,855 | |
FR44, 10.00%, 9/15/24 | | | 4,454,000,000 | IDR | | | 632,556 | |
FR46, 9.50%, 7/15/23 | | | 226,780,000,000 | IDR | | | 31,058,927 | |
FR48, 9.00%, 9/15/18 | | | 16,920,000,000 | IDR | | | 2,111,283 | |
FR49, 9.00%, 9/15/13 | | | 35,030,000,000 | IDR | | | 3,758,831 | |
| | | | | | | | |
| | | | | | | 128,554,214 | |
| | | | | | | | |
Ireland 8.7% | | | | | | | | |
Government of Ireland, | | | | | | | | |
4.60%, 4/18/16 | | | 6,813,000 | EUR | | | 9,597,469 | |
5.50%, 10/18/17 | | | 28,845,000 | EUR | | | 41,853,880 | |
5.90%, 10/18/19 | | | 20,597,000 | EUR | | | 29,831,191 | |
4.50%, 4/18/20 | | | 19,512,000 | EUR | | | 25,952,088 | |
5.00%, 10/18/20 | | | 58,588,000 | EUR | | | 80,134,639 | |
senior bond, 4.50%, 10/18/18 | | | 8,090,000 | EUR | | | 11,149,505 | |
senior bond, 4.40%, 6/18/19 | | | 20,943,000 | EUR | | | 27,919,932 | |
senior bond, 5.40%, 3/13/25 | | | 32,362,000 | EUR | | | 43,729,172 | |
| | | | | | | | |
| | | | | | | 270,167,876 | |
| | | | | | | | |
Israel 1.9% | | | | | | | | |
Government of Israel, | | | | | | | | |
5.00%, 3/31/13 | | | 64,475,000 | ILS | | | 17,413,827 | |
3.50%, 9/30/13 | | | 154,649,000 | ILS | | | 41,966,598 | |
| | | | | | | | |
| | | | | | | 59,380,425 | |
| | | | | | | | |
Lithuania 1.3% | | | | | | | | |
cGovernment of Lithuania, 144A, | | | | | | | | |
6.75%, 1/15/15 | | | 19,480,000 | | | | 21,476,700 | |
7.375%, 2/11/20 | | | 12,690,000 | | | | 16,586,211 | |
6.125%, 3/09/21 | | | 3,240,000 | | | | 4,003,295 | |
| | | | | | | | |
| | | | | | | 42,066,206 | |
| | | | | | | | |
Malaysia 2.2% | | | | | | | | |
Government of Malaysia, | | | | | | | | |
3.434%, 8/15/14 | | | 13,120,000 | MYR | | | 4,317,669 | |
senior bond, 3.702%, 2/25/13 | | | 51,053,000 | MYR | | | 16,710,291 | |
senior bond, 3.70%, 5/15/13 | | | 7,855,000 | MYR | | | 2,574,711 | |
senior bond, 3.21%, 5/31/13 | | | 10,210,000 | MYR | | | 3,340,937 | |
senior bond, 3.461%, 7/31/13 | | | 29,150,000 | MYR | | | 9,555,042 | |
senior bond, 8.00%, 10/30/13 | | | 250,000 | MYR | | | 85,041 | |
senior bond, 5.094%, 4/30/14 | | | 30,190,000 | MYR | | | 10,135,103 | |
senior bond, 3.814%, 2/15/17 | | | 18,885,000 | MYR | | | 6,328,995 | |
senior bond, 4.24%, 2/07/18 | | | 44,360,000 | MYR | | | 15,162,155 | |
| | | | | | | | |
| | | | | | | 68,209,944 | |
| | | | | | | | |
Mexico 6.4% | | | | | | | | |
Government of Mexico, | | | | | | | | |
9.00%, 6/20/13 | | | 4,178,160 | d MXN | | | 33,222,489 | |
8.00%, 12/19/13 | | | 10,300,200 | d MXN | | | 82,790,337 | |
7.00%, 6/19/14 | | | 286,280 | d MXN | | | 2,300,944 | |
TGB-12
Franklin Templeton Variable Insurance Products Trust
Statement of Investments, December 31, 2012 (continued)
| | | | | | | | |
| Templeton Global Bond Securities Fund | | Principal
Amount* | | | Value | |
Foreign Government and Agency Securities (continued) | | | | | | | | |
Mexico (continued) | | | | | | | | |
9.50%, 12/18/14 | | | 1,774,400 | d MXN | | $ | 15,051,575 | |
8.00%, 12/17/15 | | | 726,000 | d MXN | | | 6,133,582 | |
7.25%, 12/15/16 | | | 250,000 | d MXN | | | 2,103,388 | |
7.75%, 12/14/17 | | | 4,473,000 | d MXN | | | 38,777,912 | |
bMexican Udibonos, Index Linked, | | | | | | | | |
4.50%, 12/18/14 | | | 214,103 | e MXN | | | 1,779,864 | |
5.00%, 6/16/16 | | | 548,493 | e MXN | | | 4,822,374 | |
3.50%, 12/14/17 | | | 549,906 | e MXN | | | 4,752,926 | |
4.00%, 6/13/19 | | | 377,442 | e MXN | | | 3,446,911 | |
2.50%, 12/10/20 | | | 297,255 | e MXN | | | 2,517,324 | |
| | | | | | | | |
| | | | | | | 197,699,626 | |
| | | | | | | | |
Norway 0.3% | | | | | | | | |
Government of Norway, 6.50%, 5/15/13 | | | 49,400,000 | NOK | | | 9,042,480 | |
| | | | | | | | |
Peru 0.2% | | | | | | | | |
Government of Peru, senior bond, 7.84%, 8/12/20 | | | 11,090,000 | PEN | | | 5,473,659 | |
| | | | | | | | |
Philippines 0.3% | | | | | | | | |
Government of the Philippines, | | | | | | | | |
senior bond, 5.25%, 1/07/13 | | | 61,770,000 | PHP | | | 1,505,228 | |
senior bond, 8.75%, 3/03/13 | | | 163,600,000 | PHP | | | 4,028,772 | |
senior bond, 7.00%, 1/27/16 | | | 53,190,000 | PHP | | | 1,417,361 | |
senior bond, 9.125%, 9/04/16 | | | 31,840,000 | PHP | | | 903,637 | |
senior note, 6.25%, 1/27/14 | | | 30,480,000 | PHP | | | 773,832 | |
| | | | | | | | |
| | | | | | | 8,628,830 | |
| | | | | | | | |
Poland 8.4% | | | | | | | | |
Government of Poland, | | | | | | | | |
5.25%, 4/25/13 | | | 38,500,000 | PLN | | | 12,529,932 | |
5.00%, 10/24/13 | | | 144,510,000 | PLN | | | 47,458,823 | |
5.75%, 4/25/14 | | | 198,315,000 | PLN | | | 66,280,311 | |
5.50%, 4/25/15 | | | 18,110,000 | PLN | | | 6,165,131 | |
6.25%, 10/24/15 | | | 71,830,000 | PLN | | | 25,170,700 | |
5.75%, 9/23/22 | | | 48,750,000 | PLN | | | 18,494,492 | |
fFRN, 5.15%, 1/25/17 | | | 59,279,000 | PLN | | | 19,290,119 | |
fFRN, 5.15%, 1/25/21 | | | 60,135,000 | PLN | | | 19,385,563 | |
Strip, 7/25/13 | | | 76,175,000 | PLN | | | 24,226,582 | |
Strip, 1/25/14 | | | 36,380,000 | PLN | | | 11,394,694 | |
Strip, 7/25/14 | | | 33,100,000 | PLN | | | 10,205,655 | |
| | | | | | | | |
| | | | | | | 260,602,002 | |
| | | | | | | | |
Russia 2.3% | | | | | | | | |
cGovernment of Russia, senior bond, 144A, 7.50%, 3/31/30 | | | 54,898,675 | | | | 70,305,988 | |
| | | | | | | | |
Serbia 0.5% | | | | | | | | |
cGovernment of Serbia, senior note, 144A, | | | | | | | | |
5.25%, 11/21/17 | | | 4,590,000 | | | | 4,782,206 | |
7.25%, 9/28/21 | | | 9,670,000 | | | | 11,143,031 | |
| | | | | | | | |
| | | | | | | 15,925,237 | |
| | | | | | | | |
Singapore 0.9% | | | | | | | | |
Government of Singapore, senior bond, 1.625%, 4/01/13 | | | 34,700,000 | SGD | | | 28,503,149 | |
| | | | | | | | |
TGB-13
Franklin Templeton Variable Insurance Products Trust
Statement of Investments, December 31, 2012 (continued)
| | | | | | | | |
| Templeton Global Bond Securities Fund | | Principal
Amount* | | | Value | |
Foreign Government and Agency Securities (continued) | | | | | | | | |
Slovenia 0.3% | | | | | | | | |
cGovernment of Slovenia, senior note, 144A, 5.50%, 10/26/22 | | | 8,140,000 | | | $ | 8,585,462 | |
| | | | | | | | |
South Korea 10.9% | | | | | | | | |
The Export-Import Bank of Korea, senior note, | | | | | | | | |
4.625%, 2/20/17 | | | 230,000 | EUR | | | 339,861 | |
c144A, 1.45%, 5/19/14 | | | 40,580,000 | SEK | | | 6,251,960 | |
KDICB Redemption Fund Bond, senior bond, 08-1, 5.28%, 2/15/13 | | | 880,000,000 | KRW | | | 829,754 | |
Korea Monetary Stabilization Bond, | | | | | | | | |
senior bond, 3.76%, 6/02/13 | | | 3,684,270,000 | KRW | | | 3,477,778 | |
senior bond, 3.90%, 8/02/13 | | | 54,619,320,000 | KRW | | | 51,682,816 | |
senior bond, 3.59%, 10/02/13 | | | 5,898,020,000 | KRW | | | 5,578,352 | |
senior bond, 3.48%, 12/02/13 | | | 10,110,910,000 | KRW | | | 9,563,957 | |
senior bond, 3.47%, 2/02/14 | | | 20,416,550,000 | KRW | | | 19,331,619 | |
senior bond, 3.59%, 4/02/14 | | | 20,432,530,000 | KRW | | | 19,395,785 | |
senior note, 3.28%, 6/02/14 | | | 24,224,170,000 | KRW | | | 22,922,378 | |
senior note, 2.82%, 8/02/14 | | | 31,785,420,000 | KRW | | | 29,883,295 | |
senior note, 2.78%, 10/02/14 | | | 13,357,000,000 | KRW | | | 12,549,273 | |
senior note, 2.84%, 12/02/14 | | | 4,725,090,000 | KRW | | | 4,443,978 | |
Korea Treasury Bond, | | | | | | | | |
senior bond, 3.75%, 6/10/13 | | | 57,125,360,000 | KRW | | | 53,935,394 | |
senior bond, 3.00%, 12/10/13 | | | 87,529,850,000 | KRW | | | 82,449,635 | |
senior bond, 5.00%, 9/10/16 | | | 2,806,000,000 | KRW | | | 2,825,463 | |
senior note, 5.25%, 3/10/13 | | | 6,483,790,000 | KRW | | | 6,123,632 | |
senior note, 3.25%, 12/10/14 | | | 6,323,500,000 | KRW | | | 5,992,309 | |
| | | | | | | | |
| | | | | | | 337,577,239 | |
| | | | | | | | |
Sri Lanka 1.1% | | | | | | | | |
Government of Sri Lanka, | | | | | | | | |
A, 8.50%, 1/15/13 | | | 694,400,000 | LKR | | | 5,433,775 | |
A, 13.50%, 2/01/13 | | | 674,300,000 | LKR | | | 5,289,268 | |
A, 7.50%, 8/01/13 | | | 350,190,000 | LKR | | | 2,687,537 | |
A, 7.00%, 3/01/14 | | | 43,380,000 | LKR | | | 322,695 | |
A, 11.25%, 7/15/14 | | | 773,000,000 | LKR | | | 6,013,904 | |
A, 11.75%, 3/15/15 | | | 8,520,000 | LKR | | | 66,592 | |
A, 6.50%, 7/15/15 | | | 239,920,000 | LKR | | | 1,662,615 | |
A, 11.00%, 8/01/15 | | | 1,349,700,000 | LKR | | | 10,357,706 | |
A, 6.40%, 8/01/16 | | | 109,200,000 | LKR | | | 718,099 | |
A, 5.80%, 1/15/17 | | | 112,300,000 | LKR | | | 712,028 | |
B, 8.50%, 7/15/13 | | | 7,990,000 | LKR | | | 61,777 | |
B, 11.75%, 4/01/14 | | | 68,370,000 | LKR | | | 535,513 | |
B, 6.60%, 6/01/14 | | | 56,800,000 | LKR | | | 415,863 | |
B, 6.40%, 10/01/16 | | | 119,100,000 | LKR | | | 779,709 | |
| | | | | | | | |
| | | | | | | 35,057,081 | |
| | | | | | | | |
gSupranational 0.8% | | | | | | | | |
European Investment Bank, senior note, 4.50%, 5/15/13 | | | 33,700,000 | NOK | | | 6,117,531 | |
Inter-American Development Bank, senior note, 7.50%, 12/05/24 | | | 200,000,000 | MXN | | | 17,635,700 | |
| | | | | | | | |
| | | | | | | 23,753,231 | |
| | | | | | | | |
TGB-14
Franklin Templeton Variable Insurance Products Trust
Statement of Investments, December 31, 2012 (continued)
| | | | | | | | |
| Templeton Global Bond Securities Fund | | Principal
Amount* | | | Value | |
Foreign Government and Agency Securities (continued) | | | | | | | | |
Sweden 3.5% | | | | | | | | |
Government of Sweden, | | | | | | | | |
1.50%, 8/30/13 | | | 313,400,000 | SEK | | $ | 48,471,994 | |
6.75%, 5/05/14 | | | 240,050,000 | SEK | | | 39,868,575 | |
Kommuninvest I Sverige AB, 2.25%, 5/05/14 | | | 123,520,000 | SEK | | | 19,275,211 | |
| | | | | | | | |
| | | | | | | 107,615,780 | |
| | | | | | | | |
Ukraine 3.2% | | | | | | | | |
cFinancing of Infrastructure Projects State Enterprise, 144A, | | | | | | | | |
8.375%, 11/03/17 | | | 1,100,000 | | | | 1,081,437 | |
7.40%, 4/20/18 | | | 840,000 | | | | 780,150 | |
cGovernment of Ukraine, | | | | | | | | |
144A, 9.25%, 7/24/17 | | | 25,000,000 | | | | 27,187,500 | |
144A, 7.75%, 9/23/20 | | | 17,227,000 | | | | 17,738,556 | |
senior bond, 144A, 7.65%, 6/11/13 | | | 760,000 | | | | 767,562 | |
senior bond, 144A, 6.58%, 11/21/16 | | | 12,541,000 | | | | 12,568,590 | |
senior bond, 144A, 7.80%, 11/28/22 | | | 4,720,000 | | | | 4,767,200 | |
senior note, 144A, 4.95%, 10/13/15 | | | 290,000 | EUR | | | 371,667 | |
senior note, 144A, 6.25%, 6/17/16 | | | 8,760,000 | | | | 8,699,775 | |
senior note, 144A, 7.95%, 2/23/21 | | | 23,898,000 | | | | 24,811,621 | |
| | | | | | | | |
| | | | | | | 98,774,058 | |
| | | | | | | | |
Venezuela 0.4% | | | | | | | | |
Government of Venezuela, 10.75%, 9/19/13 | | | 13,570,000 | | | | 13,926,213 | |
| | | | | | | | |
Vietnam 0.5% | | | | | | | | |
cGovernment of Vietnam, 144A, 6.75%, 1/29/20 | | | 13,110,000 | | | | 15,010,950 | |
| | | | | | | | |
Total Foreign Government and Agency Securities (Cost $1,955,736,902) | | | | | | | 2,138,936,223 | |
| | | | | | | | |
Municipal Bonds (Cost $1,292,184) 0.1% | | | | | | | | |
United States 0.1% | | | | | | | | |
Bexar County Revenue, Venue Project, Refunding, Series A, BHAC Insured, 5.25%, 8/15/47 | | | 1,450,000 | | | | 1,630,119 | |
| | | | | | | | |
Total Investments before Short Term Investments (Cost $1,957,029,086) | | | | | | | 2,140,566,342 | |
| | | | | | | | |
Short Term Investments 27.4% | | | | | | | | |
Foreign Government and Agency Securities 10.7% | | | | | | | | |
Hungary 0.2% | | | | | | | | |
hHungary Treasury Bills, 1/23/13 - 9/18/13 | | | 1,123,220,000 | HUF | | | 4,946,853 | |
| | | | | | | | |
Malaysia 5.1% | | | | | | | | |
hBank of Negara Monetary Note, | | | | | | | | |
2/26/13 | | | 143,400,000 | MYR | | | 46,680,545 | |
1/10/13 - 12/12/13 | | | 343,002,000 | MYR | | | 110,853,714 | |
hMalaysia Treasury Bills, 1/25/13 - 5/31/13 | | | 2,170,000 | MYR | | | 705,513 | |
| | | | | | | | |
| | | | | | | 158,239,772 | |
| | | | | | | | |
Mexico 0.0%† | | | | | | | | |
hMexican Cetes Treasury Bill, 9/19/13 | | | 1,486,000 | MXN | | | 1,119,283 | |
| | | | | | | | |
Norway 1.4% | | | | | | | | |
hNorway Treasury Bill, 3/20/13 | | | 242,890,000 | NOK | | | 43,555,981 | |
| | | | | | | | |
Philippines 0.3% | | | | | | | | |
hPhilippine Treasury Bills, 2/20/13 - 12/11/13 | | | 324,910,000 | PHP | | | 7,886,828 | |
| | | | | | | | |
TGB-15
Franklin Templeton Variable Insurance Products Trust
Statement of Investments, December 31, 2012 (continued)
| | | | | | | | |
| Templeton Global Bond Securities Fund | | Principal
Amount* | | | Value | |
Short Term Investments (continued) | | | | | | | | |
Foreign Government and Agency Securities (continued) | | | | | | | | |
Singapore 1.7% | | | | | | | | |
hSingapore Treasury Bills, 1/10/13 - 11/01/13 | | | 63,236,000 | SGD | | $ | 51,750,546 | |
| | | | | | | | |
South Korea 1.4% | | | | | | | | |
Korea Monetary Stabilization Bond, | | | | | | | | |
senior bond, 3.38%, 5/09/13 | | | 21,273,320,000 | KRW | | | 20,042,973 | |
senior note, 3.83%, 4/02/13 | | | 3,166,620,000 | KRW | | | 2,985,011 | |
senior note, 3.28%, 6/09/13 | | | 20,958,260,000 | KRW | | | 19,746,963 | |
| | | | | | | | |
| | | | 42,774,947 | |
| | | | | | | | |
Sri Lanka 0.0%† | | | | | | | | |
hSri Lanka Treasury Bills, 8/02/13 - 10/11/13 | | | 26,280,000 | LKR | | | 191,619 | |
| | | | | | | | |
Sweden 0.6% | | | | | | | | |
hSweden Treasury Bills, 3/20/13 - 6/19/13 | | | 122,460,000 | SEK | | | 18,790,894 | |
| | | | | | | | |
Total Foreign Government and Agency Securities (Cost $322,491,892) | | | | 329,256,723 | |
| | | | | | | | |
Total Investments before Repurchase Agreements (Cost $2,279,520,978) | | | | 2,469,823,065 | |
| | | | | | | | |
Repurchase Agreements (Cost $513,775,280) 16.7% | | | | | | | | |
United States 16.7% | | | | | | | | |
iJoint Repurchase Agreement, 0.154%, 1/02/13 (Maturity Value $513,779,687) | | | 513,775,280 | | | | 513,775,280 | |
BNP Paribas Securities Corp. (Maturity Value $66,883,840) | | | | | | | | |
Credit Suisse Securities (USA) LLC (Maturity Value $83,607,368) | | | | | | | | |
Deutsche Bank Securities Inc. (Maturity Value $53,946,867) | | | | | | | | |
HSBC Securities (USA) Inc. (Maturity Value $150,491,208) | | | | | | | | |
Merrill Lynch, Pierce, Fenner & Smith Inc. (Maturity Value $66,883,840) | | | | | | | | |
Morgan Stanley & Co. LLC (Maturity Value $25,082,724) | | | | | | | | |
UBS Securities LLC (Maturity Value $66,883,840) | | | | | | | | |
Collateralized by U.S. Government Agency Securities, 0.00% - 6.21%, 1/15/13 - 1/22/37;
U.S. Treasury Bonds, 11.25%, 2/15/15 and U.S. Treasury Notes, 0.25% - 2.00%, 11/30/13 - 9/15/15 (valued at $524,109,066) | | | | | | | | |
| | | | | | | | |
Total Investments (Cost $2,793,296,258) 96.7% | | | | 2,983,598,345 | |
Other Assets, less Liabilities 3.3% | | | | 103,089,326 | |
| | | | | | | | |
Net Assets 100.0% | | | $ | 3,086,687,671 | |
| | | | | | | | |
See Abbreviations on page TGB-38.
†Rounds to less than 0.1% of net assets.
*The principal amount is stated in U.S. dollars unless otherwise indicated.
aPrincipal amount is stated in 1,000 Brazilian Real Units.
bRedemption price at maturity is adjusted for inflation. See Note 1(g).
cSecurity was purchased pursuant to Rule 144A under the Securities Act of 1933 and may be sold in transactions exempt from registration only to qualified institutional buyers or in a public offering registered under the Securities Act of 1933. These securities have been deemed liquid under guidelines approved by the Trust’s Board of Trustees. At December 31, 2012, the aggregate value of these securities was $265,563,711, representing 8.60% of net assets.
dPrincipal amount is stated in 100 Mexican Peso Units.
ePrincipal amount is stated in Unidad de Inversion Units.
fThe coupon rate shown represents the rate at period end.
gA supranational organization is an entity formed by two or more central governments through international treaties.
hThe security is traded on a discount basis with no stated coupon rate.
iSee Note 1(c) regarding joint repurchase agreement.
TGB-16
Franklin Templeton Variable Insurance Products Trust
Statement of Investments, December 31, 2012 (continued)
| | | | |
| Templeton Global Bond Securities Fund | | | | |
At December 31, 2012, the Fund had the following forward exchange contracts outstanding. See Note 1(d).
Forward Exchange Contracts
| | | | | | | | | | | | | | | | | | | | | | | | | | | | | | | | |
| Currency | | Counterparty | | | Type | | | Quantity | | | Contract
Amount* | | | | | | Settlement
Date | | | Unrealized
Appreciation | | | Unrealized
Depreciation | |
Euro | | | DBAB | | | | Sell | | | | 2,285,618 | | | | 2,971,738 | | | | | | | | 1/07/13 | | | $ | — | | | $ | (44,556 | ) |
Japanese Yen | | | DBAB | | | | Sell | | | | 770,370,000 | | | | 10,132,981 | | | | | | | | 1/07/13 | | | | 1,252,618 | | | | — | |
Philippine Peso | | | DBAB | | | | Buy | | | | 116,930,000 | | | | 2,810,142 | | | | | | | | 1/07/13 | | | | 37,966 | | | | — | |
Swedish Krona | | | DBAB | | | | Buy | | | | 136,332,733 | | | | 15,072,885 | | | | EUR | | | | 1/09/13 | | | | 1,074,034 | | | | — | |
Euro | | | CITI | | | | Sell | | | | 5,040,000 | | | | 6,455,232 | | | | | | | | 1/10/13 | | | | — | | | | (196,157 | ) |
Japanese Yen | | | CITI | | | | Sell | | | | 138,680,000 | | | | 1,817,801 | | | | | | | | 1/10/13 | | | | 219,140 | | | | — | |
Euro | | | UBSW | | | | Sell | | | | 13,846,000 | | | | 17,710,419 | | | | | | | | 1/11/13 | | | | — | | | | (562,590 | ) |
Euro | | | BZWS | | | | Sell | | | | 1,726,000 | | | | 2,208,503 | | | | | | | | 1/11/13 | | | | — | | | | (69,354 | ) |
Indian Rupee | | | DBAB | | | | Buy | | | | 79,423,000 | | | | 1,496,712 | | | | | | | | 1/11/13 | | | | — | | | | (52,482 | ) |
Japanese Yen | | | UBSW | | | | Sell | | | | 138,650,000 | | | | 1,816,574 | | | | | | | | 1/11/13 | | | | 218,245 | | | | — | |
Japanese Yen | | | BZWS | | | | Sell | | | | 277,330,000 | | | | 3,636,161 | | | | | | | | 1/11/13 | | | | 439,158 | | | | — | |
Chilean Peso | | | MSCO | | | | Buy | | | | 2,254,600,000 | | | | 4,282,241 | | | | | | | | 1/14/13 | | | | 417,878 | | | | — | |
Euro | | | DBAB | | | | Sell | | | | 9,460,000 | | | | 12,147,586 | | | | | | | | 1/14/13 | | | | — | | | | (337,419 | ) |
Euro | | | JPHQ | | | | Sell | | | | 937,000 | | | | 1,195,097 | | | | | | | | 1/14/13 | | | | — | | | | (41,526 | ) |
Indian Rupee | | | JPHQ | | | | Buy | | | | 127,745,000 | | | | 2,376,894 | | | | | | | | 1/14/13 | | | | — | | | | (55,454 | ) |
Indian Rupee | | | DBAB | | | | Buy | | | | 40,128,000 | | | | 746,227 | | | | | | | | 1/14/13 | | | | — | | | | (17,003 | ) |
Japanese Yen | | | HSBC | | | | Sell | | | | 536,380,000 | | | | 7,016,275 | | | | | | | | 1/15/13 | | | | 832,787 | | | | — | |
Japanese Yen | | | DBAB | | | | Sell | | | | 139,110,000 | | | | 1,822,720 | | | | | | | | 1/15/13 | | | | 219,034 | | | | — | |
Japanese Yen | | | BZWS | | | | Sell | | | | 394,150,000 | | | | 5,155,995 | | | | | | | | 1/15/13 | | | | 612,160 | | | | — | |
Japanese Yen | | | UBSW | | | | Sell | | | | 313,510,000 | | | | 4,098,599 | | | | | | | | 1/15/13 | | | | 484,397 | | | | — | |
Philippine Peso | | | JPHQ | | | | Buy | | | | 24,594,000 | | | | 592,941 | | | | | | | | 1/15/13 | | | | 6,182 | | | | — | |
Euro | | | DBAB | | | | Sell | | | | 4,856,000 | | | | 6,190,429 | | | | | | | | 1/17/13 | | | | — | | | | (218,539 | ) |
Indian Rupee | | | JPHQ | | | | Buy | | | | 39,422,000 | | | | 738,918 | | | | | | | | 1/22/13 | | | | — | | | | (23,736 | ) |
Philippine Peso | | | DBAB | | | | Buy | | | | 41,372,000 | | | | 944,609 | | | | | | | | 1/22/13 | | | | 63,349 | | | | — | |
Philippine Peso | | | JPHQ | | | | Buy | | | | 165,119,000 | | | | 3,774,321 | | | | | | | | 1/22/13 | | | | 248,524 | | | | — | |
Chilean Peso | | | DBAB | | | | Buy | | | | 2,227,910,000 | | | | 4,372,309 | | | | | | | | 1/24/13 | | | | 265,402 | | | | — | |
Chilean Peso | | | DBAB | | | | Buy | | | | 3,160,140,000 | | | | 6,228,629 | | | | | | | | 1/25/13 | | | | 348,693 | | | | — | |
Chilean Peso | | | DBAB | | | | Buy | | | | 1,967,720,000 | | | | 3,888,467 | | | | | | | | 1/28/13 | | | | 205,235 | | | | — | |
Euro | | | CITI | | | | Sell | | | | 4,998,400 | | | | 6,496,071 | | | | | | | | 1/28/13 | | | | — | | | | (101,498 | ) |
Indian Rupee | | | DBAB | | | | Buy | | | | 119,627,000 | | | | 2,168,727 | | | | | | | | 1/28/13 | | | | — | | | | (1,244 | ) |
Japanese Yen | | | BZWS | | | | Sell | | | | 1,079,470,000 | | | | 13,980,961 | | | | | | | | 1/28/13 | | | | 1,535,254 | | | | — | |
Japanese Yen | | | DBAB | | | | Sell | | | | 897,860,782 | | | | 11,614,224 | | | | | | | | 1/28/13 | | | | 1,262,373 | | | | — | |
Japanese Yen | | | UBSW | | | | Sell | | | | 944,420,000 | | | | 12,212,064 | | | | | | | | 1/28/13 | | | | 1,323,411 | | | | — | |
Japanese Yen | | | HSBC | | | | Sell | | | | 1,162,462,488 | | | | 15,025,301 | | | | | | | | 1/28/13 | | | | 1,622,736 | | | | — | |
Philippine Peso | | | HSBC | | | | Buy | | | | 154,149,000 | | | | 3,555,589 | | | | | | | | 1/28/13 | | | | 200,356 | | | | — | |
Chilean Peso | | | DBAB | | | | Buy | | | | 635,690,000 | | | | 1,256,255 | | | | | | | | 1/29/13 | | | | 66,061 | | | | — | |
Indian Rupee | | | HSBC | | | | Buy | | | | 213,392,000 | | | | 3,929,184 | | | | | | | | 1/29/13 | | | | — | | | | (63,620 | ) |
Indian Rupee | | | DBAB | | | | Buy | | | | 208,500,000 | | | | 3,839,107 | | | | | | | | 1/29/13 | | | | — | | | | (62,162 | ) |
Chilean Peso | | | JPHQ | | | | Buy | | | | 675,370,000 | | | | 1,331,434 | | | | | | | | 1/30/13 | | | | 73,216 | | | | — | |
Chilean Peso | | | DBAB | | | | Buy | | | | 1,271,380,000 | | | | 2,489,241 | | | | | | | | 1/30/13 | | | | 155,005 | | | | — | |
Chilean Peso | | | DBAB | | | | Buy | | | | 1,186,400,000 | | | | 2,319,453 | | | | | | | | 1/31/13 | | | | 147,747 | | | | — | |
Euro | | | DBAB | | | | Sell | | | | 31,205,000 | | | | 41,000,250 | | | | | | | | 1/31/13 | | | | — | | | | (189,450 | ) |
Indian Rupee | | | DBAB | | | | Buy | | | | 440,314,000 | | | | 8,069,310 | | | | | | | | 1/31/13 | | | | — | | | | (96,098 | ) |
Indian Rupee | | | HSBC | | | | Buy | | | | 317,880,000 | | | | 5,827,154 | | | | | | | | 1/31/13 | | | | — | | | | (70,979 | ) |
Philippine Peso | | | DBAB | | | | Buy | | | | 128,745,000 | | | | 2,983,662 | | | | | | | | 1/31/13 | | | | 153,374 | | | | — | |
Euro | | | UBSW | | | | Sell | | | | 5,540,000 | | | | 7,266,264 | | | | | | | | 2/01/13 | | | | — | | | | (46,438 | ) |
Chilean Peso | | | MSCO | | | | Buy | | | | 1,963,430,000 | | | | 3,895,496 | | | | | | | | 2/04/13 | | | | 185,581 | | | | — | |
Euro | | | BZWS | | | | Sell | | | | 11,267,311 | | | | 13,901,327 | | | | | | | | 2/04/13 | | | | — | | | | (971,700 | ) |
Philippine Peso | | | DBAB | | | | Buy | | | | 155,800,000 | | | | 3,620,393 | | | | | | | | 2/04/13 | | | | 175,749 | | | | — | |
Philippine Peso | | | HSBC | | | | Buy | | | | 99,500,000 | | | | 2,313,200 | | | | | | | | 2/04/13 | | | | 111,165 | | | | — | |
TGB-17
Franklin Templeton Variable Insurance Products Trust
Statement of Investments, December 31, 2012 (continued)
| | | | |
| Templeton Global Bond Securities Fund | | | | |
Forward Exchange Contracts (continued)
| | | | | | | | | | | | | | | | | | | | | | | | | | | | | | | | |
| Currency | | Counterparty | | | Type | | | Quantity | | | Contract
Amount* | | | | | | Settlement
Date | | | Unrealized
Appreciation | | | Unrealized
Depreciation | |
Indian Rupee | | | JPHQ | | | | Buy | | | | 21,500,000 | | | | 414,827 | | | | | | | | 2/06/13 | | | $ | — | | | $ | (25,892 | ) |
Philippine Peso | | | HSBC | | | | Buy | | | | 84,800,000 | | | | 1,970,535 | | | | | | | | 2/06/13 | | | | 95,624 | | | | — | |
Philippine Peso | | | JPHQ | | | | Buy | | | | 60,500,000 | | | | 1,408,287 | | | | | | | | 2/07/13 | | | | 65,789 | | | | — | |
Singapore Dollar | | | DBAB | | | | Buy | | | | 6,207,000 | | | | 4,999,597 | | | | | | | | 2/07/13 | | | | 81,881 | | | | — | |
Singapore Dollar | | | HSBC | | | | Buy | | | | 6,206,000 | | | | 4,996,779 | | | | | | | | 2/07/13 | | | | 83,880 | | | | — | |
Euro | | | CITI | | | | Sell | | | | 6,572,000 | | | | 8,595,650 | | | | | | | | 2/08/13 | | | | — | | | | (79,785 | ) |
Euro | | | UBSW | | | | Sell | | | | 4,929,000 | | | | 6,444,175 | | | | | | | | 2/08/13 | | | | — | | | | (62,402 | ) |
Euro | | | HSBC | | | | Sell | | | | 1,800,000 | | | | 2,355,858 | | | | | | | | 2/08/13 | | | | — | | | | (20,250 | ) |
Singapore Dollar | | | DBAB | | | | Buy | | | | 12,363,000 | | | | 9,948,339 | | | | | | | | 2/08/13 | | | | 172,865 | | | | — | |
Chilean Peso | | | DBAB | | | | Buy | | | | 1,145,000,000 | | | | 2,306,143 | | | | | | | | 2/11/13 | | | | 71,744 | | | | — | |
Chilean Peso | | | MSCO | | | | Buy | | | | 964,250,000 | | | | 1,951,923 | | | | | | | | 2/11/13 | | | | 50,590 | | | | — | |
Euro | | | DBAB | | | | Sell | | | | 28,210,000 | | | | 37,280,037 | | | | | | | | 2/11/13 | | | | 40,197 | | | | — | |
Euro | | | JPHQ | | | | Sell | | | | 300,000 | | | | 397,358 | | | | | | | | 2/11/13 | | | | 1,329 | | | | — | |
Euro | | | BZWS | | | | Sell | | | | 1,412,000 | | | | 1,873,724 | | | | | | | | 2/11/13 | | | | 9,752 | | | | — | |
Polish Zloty | | | DBAB | | | | Buy | | | | 17,528,000 | | | | 4,057,877 | | | | EUR | | | | 2/11/13 | | | | 286,497 | | | | — | |
Polish Zloty | | | BZWS | | | | Buy | | | | 17,528,000 | | | | 4,052,717 | | | | EUR | | | | 2/11/13 | | | | 293,309 | | | | — | |
Japanese Yen | | | HSBC | | | | Sell | | | | 413,563,000 | | | | 5,406,052 | | | | | | | | 2/12/13 | | | | 637,357 | | | | — | |
Japanese Yen | | | MSCO | | | | Sell | | | | 394,373,000 | | | | 5,153,417 | | | | | | | | 2/12/13 | | | | 605,997 | | | | — | |
Chilean Peso | | | BZWS | | | | Buy | | | | 1,142,900,000 | | | | 2,305,628 | | | | | | | | 2/13/13 | | | | 67,314 | | | | — | |
Chilean Peso | | | MSCO | | | | Buy | | | | 2,590,220,000 | | | | 5,248,673 | | | | | | | | 2/13/13 | | | | 129,263 | | | | — | |
Euro | | | UBSW | | | | Sell | | | | 657,000 | | | | 874,290 | | | | | | | | 2/13/13 | | | | 6,974 | | | | — | |
Singapore Dollar | | | BZWS | | | | Buy | | | | 1,717,028 | | | | 1,383,919 | | | | | | | | 2/13/13 | | | | 21,759 | | | | — | |
Euro | | | DBAB | | | | Sell | | | | 1,738,000 | | | | 2,296,246 | | | | | | | | 2/14/13 | | | | 1,865 | | | | — | |
Malaysian Ringgit | | | DBAB | | | | Buy | | | | 97,443,480 | | | | 31,832,831 | | | | | | | | 2/14/13 | | | | — | | | | (70,092 | ) |
Polish Zloty | | | DBAB | | | | Buy | | | | 17,528,000 | | | | 4,026,463 | | | | EUR | | | | 2/14/13 | | | | 326,272 | | | | — | |
Singapore Dollar | | | HSBC | | | | Buy | | | | 10,521,600 | | | | 8,478,324 | | | | | | | | 2/14/13 | | | | 135,383 | | | | — | |
Chilean Peso | | | DBAB | | | | Buy | | | | 2,188,820,000 | | | | 4,399,461 | | | | | | | | 2/15/13 | | | | 143,953 | | | | — | |
Japanese Yen | | | DBAB | | | | Sell | | | | 123,057,280 | | | | 1,593,470 | | | | | | | | 2/15/13 | | | | 174,494 | | | | — | |
Japanese Yen | | | JPHQ | | | | Sell | | | | 144,920,000 | | | | 1,877,932 | | | | | | | | 2/15/13 | | | | 206,857 | | | | — | |
Euro | | | JPHQ | | | | Sell | | | | 1,971,000 | | | | 2,601,326 | | | | | | | | 2/19/13 | | | | — | | | | (754 | ) |
Euro | | | UBSW | | | | Sell | | | | 1,971,000 | | | | 2,603,395 | | | | | | | | 2/19/13 | | | | 1,315 | | | | — | |
Malaysian Ringgit | | | HSBC | | | | Buy | | | | 4,899,000 | | | | 1,590,275 | | | | | | | | 2/19/13 | | | | 6,078 | | | | — | |
Singapore Dollar | | | BZWS | | | | Buy | | | | 4,886,000 | | | | 3,925,444 | | | | | | | | 2/19/13 | | | | 74,572 | | | | — | |
Singapore Dollar | | | DBAB | | | | Buy | | | | 7,334,000 | | | | 5,843,825 | | | | | | | | 2/19/13 | | | | 160,293 | | | | — | |
Chilean Peso | | | JPHQ | | | | Buy | | | | 1,055,800,000 | | | | 2,137,247 | | | | | | | | 2/21/13 | | | | 52,702 | | | | — | |
Euro | | | UBSW | | | | Sell | | | | 2,038,000 | | | | 2,694,603 | | | | | | | | 2/21/13 | | | | 4,025 | | | | — | |
Chilean Peso | | | JPHQ | | | | Buy | | | | 1,792,000,000 | | | | 3,587,588 | | | | | | | | 2/22/13 | | | | 128,938 | | | | — | |
Japanese Yen | | | HSBC | | | | Sell | | | | 385,460,000 | | | | 4,891,624 | | | | | | | | 2/22/13 | | | | 446,650 | | | | — | |
Chilean Peso | | | DBAB | | | | Buy | | | | 1,455,470,000 | | | | 2,902,233 | | | | | | | | 2/25/13 | | | | 115,233 | | | | — | |
Chilean Peso | | | CITI | | | | Buy | | | | 2,285,090,000 | | | | 4,587,613 | | | | | | | | 2/25/13 | | | | 149,814 | | | | — | |
Chilean Peso | | | MSCO | | | | Buy | | | | 2,254,540,000 | | | | 4,501,428 | | | | | | | | 2/25/13 | | | | 172,663 | | | | — | |
Japanese Yen | | | JPHQ | | | | Sell | | | | 385,700,000 | | | | 4,865,342 | | | | | | | | 2/25/13 | | | | 417,502 | | | | — | |
Singapore Dollar | | | DBAB | | | | Buy | | | | 4,765,000 | | | | 3,811,085 | | | | | | | | 2/25/13 | | | | 89,872 | | | | — | |
Chilean Peso | | | DBAB | | | | Buy | | | | 1,435,490,000 | | | | 2,842,329 | | | | | | | | 2/26/13 | | | | 133,350 | | | | — | |
Indian Rupee | | | HSBC | | | | Buy | | | | 143,891,000 | | | | 2,570,974 | | | | | | | | 2/26/13 | | | | 23,409 | | | | — | |
Indian Rupee | | | DBAB | | | | Buy | | | | 124,700,000 | | | | 2,220,046 | | | | | | | | 2/26/13 | | | | 28,320 | | | | — | |
Chilean Peso | | | MSCO | | | | Buy | | | | 1,559,200,000 | | | | 3,118,400 | | | | | | | | 2/27/13 | | | | 113,326 | | | | — | |
Indian Rupee | | | DBAB | | | | Buy | | | | 25,000,000 | | | | 451,101 | | | | | | | | 2/27/13 | | | | — | | | | (420 | ) |
Japanese Yen | | | BZWS | | | | Sell | | | | 890,300,000 | | | | 11,373,275 | | | | | | | | 2/27/13 | | | | 1,106,306 | | | | — | |
Chilean Peso | | | JPHQ | | | | Buy | | | | 593,800,000 | | | | 1,184,284 | | | | | | | | 2/28/13 | | | | 46,324 | | | | — | |
Chilean Peso | | | DBAB | | | | Buy | | | | 2,094,920,000 | | | | 4,164,023 | | | | | | | | 2/28/13 | | | | 177,548 | | | | — | |
Euro | | | DBAB | | | | Sell | | | | 1,530,900 | | | | 2,059,581 | | | | | | | | 2/28/13 | | | | 38,360 | | | | — | |
TGB-18
Franklin Templeton Variable Insurance Products Trust
Statement of Investments, December 31, 2012 (continued)
| | | | |
| Templeton Global Bond Securities Fund | | | | |
Forward Exchange Contracts (continued)
| | | | | | | | | | | | | | | | | | | | | | | | | | | | | | |
| Currency | | Counterparty | | | Type | | | Quantity | | | Contract
Amount* | | | | | Settlement
Date | | | Unrealized
Appreciation | | | Unrealized
Depreciation | |
Singapore Dollar | | | DBAB | | | | Buy | | | | 2,980,000 | | | | 2,376,585 | | | | | | 2/28/13 | | | $ | 63,048 | | | $ | — | |
Chilean Peso | | | BZWS | | | | Buy | | | | 3,010,700,000 | | | | 6,047,240 | | | | | | 3/01/13 | | | | 191,453 | | | | — | |
Chilean Peso | | | DBAB | | | | Buy | | | | 790,050,000 | | | | 1,575,217 | | | | | | 3/01/13 | | | | 61,904 | | | | — | |
Euro | | | DBAB | | | | Sell | | | | 2,579,651 | | | | 3,473,500 | | | | | | 3/01/13 | | | | 67,603 | | | | — | |
Japanese Yen | | | JPHQ | | | | Sell | | | | 401,100,000 | | | | 5,020,025 | | | | | | 3/01/13 | | | | 394,458 | | | | — | |
Japanese Yen | | | HSBC | | | | Sell | | | | 400,800,000 | | | | 5,012,663 | | | | | | 3/01/13 | | | | 390,556 | | | | — | |
Chilean Peso | | | DBAB | | | | Buy | | | | 1,253,970,000 | | | | 2,504,934 | | | | | | 3/04/13 | | | | 92,474 | | | | — | |
Indian Rupee | | | HSBC | | | | Buy | | | | 251,448,000 | | | | 4,544,802 | | | | | | 3/04/13 | | | | — | | | | (15,840 | ) |
Indian Rupee | | | DBAB | | | | Buy | | | | 217,594,000 | | | | 3,932,197 | | | | | | 3/04/13 | | | | — | | | | (12,996 | ) |
Japanese Yen | | | UBSW | | | | Sell | | | | 447,200,000 | | | | 5,579,712 | | | | | | 3/04/13 | | | | 422,376 | | | | — | |
Euro | | | DBAB | | | | Sell | | | | 1,536,000 | | | | 2,051,405 | | | | | | 3/05/13 | | | | 23,357 | | | | — | |
Chilean Peso | | | DBAB | | | | Buy | | | | 1,253,970,000 | | | | 2,521,810 | | | | | | 3/06/13 | | | | 74,907 | | | | — | |
Indian Rupee | | | DBAB | | | | Buy | | | | 88,183,000 | | | | 1,582,686 | | | | | | 3/06/13 | | | | 5,052 | | | | — | |
Chilean Peso | | | DBAB | | | | Buy | | | | 1,328,230,000 | | | | 2,671,420 | | | | | | 3/07/13 | | | | 78,709 | | | | — | |
Euro | | | BZWS | | | | Sell | | | | 3,441,044 | | | | 4,564,545 | | | | | | 3/07/13 | | | | 21,100 | | | | — | |
Indian Rupee | | | DBAB | | | | Buy | | | | 160,277,000 | | | | 2,896,799 | | | | | | 3/07/13 | | | | — | | | | (11,525 | ) |
Chilean Peso | | | DBAB | | | | Buy | | | | 1,320,220,000 | | | | 2,629,920 | | | | | | 3/08/13 | | | | 103,261 | | | | — | |
Euro | | | CITI | | | | Sell | | | | 31,404,613 | | | | 41,303,033 | | | | | | 3/08/13 | | | | — | | | | (163,009 | ) |
Euro | | | DBAB | | | | Sell | | | | 21,480,000 | | | | 28,273,909 | | | | | | 3/08/13 | | | | — | | | | (87,866 | ) |
Euro | | | MSCO | | | | Sell | | | | 5,225,000 | | | | 6,874,559 | | | | | | 3/08/13 | | | | — | | | | (24,430 | ) |
Euro | | | HSBC | | | | Sell | | | | 1,844,000 | | | | 2,428,087 | | | | | | 3/08/13 | | | | — | | | | (6,695 | ) |
Mexican Peso | | | HSBC | | | | Buy | | | | 135,500,950 | | | | 10,103,190 | | | | | | 3/08/13 | | | | 377,193 | | | | — | |
Chilean Peso | | | MSCO | | | | Buy | | | | 662,100,000 | | | | 1,294,428 | | | | | | 3/11/13 | | | | 75,736 | | | | — | |
Euro | | | BZWS | | | | Sell | | | | 3,785,232 | | | | 4,977,202 | | | | | | 3/11/13 | | | | — | | | | (20,886 | ) |
Indian Rupee | | | HSBC | | | | Buy | | | | 42,784,000 | | | | 774,581 | | | | | | 3/11/13 | | | | — | | | | (4,947 | ) |
Indian Rupee | | | DBAB | | | | Buy | | | | 43,392,000 | | | | 783,957 | | | | | | 3/11/13 | | | | — | | | | (3,385 | ) |
Singapore Dollar | | | CITI | | | | Buy | | | | 21,075,381 | | | | 16,733,000 | | | | | | 3/11/13 | | | | 520,830 | | | | — | |
Chilean Peso | | | DBAB | | | | Buy | | | | 1,284,460,000 | | | | 2,521,021 | | | | | | 3/13/13 | | | | 136,364 | | | | — | |
Indian Rupee | | | HSBC | | | | Buy | | | | 108,000,000 | | | | 1,960,571 | | | | | | 3/13/13 | | | | — | | | | (18,474 | ) |
Euro | | | BZWS | | | | Sell | | | | 1,161,439 | | | | 1,524,273 | | | | | | 3/15/13 | | | | — | | | | (9,370 | ) |
Japanese Yen | | | CITI | | | | Sell | | | | 286,112,008 | | | | 3,474,763 | | | | | | 3/15/13 | | | | 174,857 | | | | — | |
Chilean Peso | | | DBAB | | | | Buy | | | | 2,600,220,000 | | | | 5,142,840 | | | | | | 3/18/13 | | | | 233,116 | | | | — | |
Indian Rupee | | | DBAB | | | | Buy | | | | 108,614,000 | | | | 1,968,073 | | | | | | 3/18/13 | | | | — | | | | (16,689 | ) |
Singapore Dollar | | | BZWS | | | | Buy | | | | 21,427,761 | | | | 17,439,375 | | | | | | 3/18/13 | | | | 102,988 | | | | — | |
Euro | | | CITI | | | | Sell | | | | 861,168 | | | | 1,130,826 | | | | | | 3/19/13 | | | | — | | | | (6,361 | ) |
Japanese Yen | | | MSCO | | | | Sell | | | | 575,230,000 | | | | 6,940,377 | | | | | | 3/19/13 | | | | 305,664 | | | | — | |
Japanese Yen | | | CITI | | | | Sell | | | | 407,702,000 | | | | 4,906,161 | | | | | | 3/19/13 | | | | 203,719 | | | | — | |
Singapore Dollar | | | JPHQ | | | | Buy | | | | 5,740,000 | | | | 4,701,835 | | | | | | 3/19/13 | | | | — | | | | (2,641 | ) |
Singapore Dollar | | | DBAB | | | | Buy | | | | 7,978,100 | | | | 6,300,324 | | | | | | 3/19/13 | | | | 231,147 | | | | — | |
Singapore Dollar | | | HSBC | | | | Buy | | | | 9,120,000 | | | | 7,216,903 | | | | | | 3/19/13 | | | | 249,413 | | | | — | |
Indian Rupee | | | DBAB | | | | Buy | | | | 98,937,000 | | | | 1,778,515 | | | | | | 3/20/13 | | | | — | | | | (1,629 | ) |
Chilean Peso | | | JPHQ | | | | Buy | | | | 1,065,000,000 | | | | 2,134,269 | | | | | | 3/21/13 | | | | 66,743 | | | | — | |
Euro | | | BZWS | | | | Sell | | | | 744,197 | | | | 987,847 | | | | | | 3/21/13 | | | | 5,104 | | | | — | |
Singapore Dollar | | | DBAB | | | | Buy | | | | 8,589,700 | | | | 6,848,748 | | | | | | 3/21/13 | | | | 183,430 | | | | — | |
Singapore Dollar | | | HSBC | | | | Buy | | | | 6,864,000 | | | | 5,471,939 | | | | | | 3/21/13 | | | | 147,451 | | | | — | |
Indian Rupee | | | JPHQ | | | | Buy | | | | 79,054,000 | | | | 1,429,031 | | | | | | 3/25/13 | | | | — | | | | (10,513 | ) |
Japanese Yen | | | BZWS | | | | Sell | | | | 242,774,840 | | | | 2,918,598 | | | | | | 3/25/13 | | | | 118,282 | | | | — | |
Euro | | | DBAB | | | | Sell | | | | 2,736,000 | | | | 3,609,058 | | | | | | 3/26/13 | | | | — | | | | (4,114 | ) |
Euro | | | CITI | | | | Sell | | | | 1,532,964 | | | | 2,022,531 | | | | | | 3/26/13 | | | | — | | | | (1,906 | ) |
Malaysian Ringgit | | | DBAB | | | | Buy | | | | 16,025,000 | | | | 5,123,821 | | | | | | 3/26/13 | | | | 85,683 | | | | — | |
Malaysian Ringgit | | | HSBC | | | | Buy | | | | 7,634,000 | | | | 2,442,177 | | | | | | 3/26/13 | | | | 39,530 | | | | — | |
Singapore Dollar | | | FBCO | | | | Buy | | | | 10,578,000 | | | | 8,407,248 | | | | | | 3/26/13 | | | | 252,720 | | | | — | |
TGB-19
Franklin Templeton Variable Insurance Products Trust
Statement of Investments, December 31, 2012 (continued)
| | | | |
| Templeton Global Bond Securities Fund | | | | |
Forward Exchange Contracts (continued)
| | | | | | | | | | | | | | | | | | | | | | | | | | | | | | | | |
| Currency | | Counterparty | | | Type | | | Quantity | | | Contract
Amount* | | | | | | Settlement
Date | | | Unrealized
Appreciation | | | Unrealized
Depreciation | |
Singapore Dollar | | | MSCO | | | | Buy | | | | 10,570,700 | | | | 8,356,285 | | | | | | | | 3/26/13 | | | $ | 297,708 | | | $ | — | |
Euro | | | MSCO | | | | Sell | | | | 4,020,000 | | | | 5,180,494 | | | | | | | | 3/28/13 | | | | — | | | | (128,432 | ) |
Indian Rupee | | | HSBC | | | | Buy | | | | 80,337,000 | | | | 1,450,650 | | | | | | | | 3/28/13 | | | | — | | | | (9,886 | ) |
Chilean Peso | | | DBAB | | | | Buy | | | | 1,252,750,000 | | | | 2,474,812 | | | | | | | | 3/29/13 | | | | 111,475 | | | | — | |
Chilean Peso | | | DBAB | | | | Buy | | | | 1,330,940,000 | | | | 2,619,445 | | | | | | | | 4/03/13 | | | | 126,389 | | | | — | |
Euro | | | DBAB | | | | Sell | | | | 6,200,000 | | | | 8,281,092 | | | | | | | | 4/04/13 | | | | 92,645 | | | | — | |
Philippine Peso | | | DBAB | | | | Buy | | | | 116,881,000 | | | | 2,812,411 | | | | | | | | 4/05/13 | | | | 34,227 | | | | — | |
Euro | | | HSBC | | | | Sell | | | | 8,692,000 | | | | 11,450,841 | | | | | | | | 4/10/13 | | | | — | | | | (29,509 | ) |
Philippine Peso | | | JPHQ | | | | Buy | | | | 61,767,000 | | | | 1,488,505 | | | | | | | | 4/10/13 | | | | 15,674 | | | | — | |
Philippine Peso | | | DBAB | | | | Buy | | | | 191,936,000 | | | | 4,625,967 | | | | | | | | 4/10/13 | | | | 48,147 | | | | — | |
Euro | | | DBAB | | | | Sell | | | | 7,243,000 | | | | 9,500,353 | | | | | | | | 4/11/13 | | | | — | | | | (66,258 | ) |
Euro | | | UBSW | | | | Sell | | | | 4,346,000 | | | | 5,697,910 | | | | | | | | 4/11/13 | | | | — | | | | (42,321 | ) |
Philippine Peso | | | HSBC | | | | Buy | | | | 95,809,000 | | | | 2,306,372 | | | | | | | | 4/11/13 | | | | 26,764 | | | | — | |
Euro | | | JPHQ | | | | Sell | | | | 3,907,000 | | | | 5,129,696 | | | | | | | | 4/12/13 | | | | — | | | | (30,751 | ) |
Indian Rupee | | | DBAB | | | | Buy | | | | 159,915,000 | | | | 2,944,133 | | | | | | | | 4/12/13 | | | | — | | | | (83,587 | ) |
Philippine Peso | | | JPHQ | | | | Buy | | | | 108,152,000 | | | | 2,598,621 | | | | | | | | 4/12/13 | | | | 35,036 | | | | — | |
Chilean Peso | | | MSCO | | | | Buy | | | | 2,645,530,000 | | | | 5,215,436 | | | | | | | | 4/15/13 | | | | 233,395 | | | | — | |
Indian Rupee | | | DBAB | | | | Buy | | | | 342,913,000 | | | | 6,270,466 | | | | | | | | 4/15/13 | | | | — | | | | (139,585 | ) |
Philippine Peso | | | HSBC | | | | Buy | | | | 76,252,000 | | | | 1,838,372 | | | | | | | | 4/15/13 | | | | 18,357 | | | | — | |
Euro | | | HSBC | | | | Sell | | | | 6,919,000 | | | | 9,154,010 | | | | | | | | 4/16/13 | | | | 14,892 | | | | — | |
Indian Rupee | | | JPHQ | | | | Buy | | | | 230,330,000 | | | | 4,224,533 | | | | | | | | 4/16/13 | | | | — | | | | (107,200 | ) |
Indian Rupee | | | JPHQ | | | | Buy | | | | 226,092,000 | | | | 4,132,629 | | | | | | | | 4/18/13 | | | | — | | | | (92,422 | ) |
Chilean Peso | | | MSCO | | | | Buy | | | | 2,370,410,000 | | | | 4,677,210 | | | | | | | | 4/19/13 | | | | 202,260 | | | | — | |
Malaysian Ringgit | | | JPHQ | | | | Buy | | | | 4,069,213 | | | | 1,307,000 | | | | | | | | 4/19/13 | | | | 13,712 | | | | — | |
Indian Rupee | | | JPHQ | | | | Buy | | | | 112,941,000 | | | | 2,069,407 | | | | | | | | 4/22/13 | | | | — | | | | (52,546 | ) |
Indian Rupee | | | DBAB | | | | Buy | | | | 79,271,000 | | | | 1,450,614 | | | | | | | | 4/22/13 | | | | — | | | | (35,020 | ) |
Japanese Yen | | | CITI | | | | Sell | | | | 261,800,000 | | | | 3,238,255 | | | | | | | | 4/22/13 | | | | 217,769 | | | | — | |
Japanese Yen | | | BZWS | | | | Sell | | | | 261,900,000 | | | | 3,240,535 | | | | | | | | 4/22/13 | | | | 218,894 | | | | — | |
Euro | | | DBAB | | | | Sell | | | | 4,545,000 | | | | 5,997,128 | | | | | | | | 4/23/13 | | | | — | | | | (6,651 | ) |
Malaysian Ringgit | | | JPHQ | | | | Buy | | | | 11,659,000 | | | | 3,741,416 | | | | | | | | 4/23/13 | | | | 41,636 | | | | — | |
Euro | | | BZWS | | | | Sell | | | | 4,954,399 | | | | 6,451,668 | | | | | | | | 4/25/13 | | | | — | | | | (93,040 | ) |
Indian Rupee | | | DBAB | | | | Buy | | | | 160,601,000 | | | | 2,864,754 | | | | | | | | 4/26/13 | | | | 1,264 | | | | — | |
Chilean Peso | | | JPHQ | | | | Buy | | | | 1,501,938,000 | | | | 2,965,912 | | | | | | | | 4/29/13 | | | | 121,525 | | | | — | |
Chilean Peso | | | CITI | | | | Buy | | | | 2,420,966,000 | | | | 4,793,992 | | | | | | | | 4/29/13 | | | | 182,632 | | | | — | |
Indian Rupee | | | JPHQ | | | | Buy | | | | 136,582,000 | | | | 2,450,561 | | | | | | | | 4/29/13 | | | | — | | | | (14,411 | ) |
Euro | | | BZWS | | | | Sell | | | | 6,575,679 | | | | 8,734,474 | | | | | | | | 4/30/13 | | | | 47,648 | | | | — | |
Indian Rupee | | | JPHQ | | | | Buy | | | | 113,782,000 | | | | 2,037,388 | | | | | | | | 4/30/13 | | | | — | | | | (8,254 | ) |
Indian Rupee | | | DBAB | | | | Buy | | | | 71,377,981 | | | | 1,277,184 | | | | | | | | 4/30/13 | | | | — | | | | (4,263 | ) |
Swedish Krona | | | BZWS | | | | Buy | | | | 122,773,200 | | | | 13,605,940 | | | | EUR | | | | 4/30/13 | | | | 861,891 | | | | — | |
Euro | | | MSCO | | | | Sell | | | | 1,259,000 | | | | 1,661,930 | | | | | | | | 5/07/13 | | | | — | | | | (1,391 | ) |
Euro | | | FBCO | | | | Sell | | | | 1,731,000 | | | | 2,285,526 | | | | | | | | 5/07/13 | | | | — | | | | (1,375 | ) |
Euro | | | BZWS | | | | Sell | | | | 1,259,000 | | | | 1,664,209 | | | | | | | | 5/07/13 | | | | 888 | | | | — | |
Euro | | | DBAB | | | | Sell | | | | 2,045,000 | | | | 2,695,351 | | | | | | | | 5/08/13 | | | | — | | | | (6,416 | ) |
Euro | | | DBAB | | | | Sell | | | | 1,259,000 | | | | 1,643,184 | | | | | | | | 5/10/13 | | | | — | | | | (20,186 | ) |
Euro | | | UBSW | | | | Sell | | | | 629,000 | | | | 820,987 | | | | | | | | 5/10/13 | | | | — | | | | (10,038 | ) |
Japanese Yen | | | CITI | | | | Sell | | | | 733,721,000 | | | | 9,247,923 | | | | | | | | 5/10/13 | | | | 781,412 | | | | — | |
Chilean Peso | | | MSCO | | | | Buy | | | | 1,150,200,000 | | | | 2,250,220 | | | | | | | | 5/13/13 | | | | 109,588 | | | | — | |
Euro | | | CITI | | | | Sell | | | | 5,658,426 | | | | 7,373,382 | | | | | | | | 5/13/13 | | | | — | | | | (102,657 | ) |
Japanese Yen | | | UBSW | | | | Sell | | | | 366,681,000 | | | | 4,636,983 | | | | | | | | 5/13/13 | | | | 405,691 | | | | — | |
Japanese Yen | | | DBAB | | | | Sell | | | | 490,555,000 | | | | 6,201,707 | | | | | | | | 5/13/13 | | | | 540,978 | | | | — | |
Japanese Yen | | | CITI | | | | Sell | | | | 366,680,000 | | | | 4,613,923 | | | | | | | | 5/14/13 | | | | 382,607 | | | | — | |
Euro | | | BZWS | | | | Sell | | | | 2,270,980 | | | | 2,929,110 | | | | | | | | 5/16/13 | | | | — | | | | (71,448 | ) |
TGB-20
Franklin Templeton Variable Insurance Products Trust
Statement of Investments, December 31, 2012 (continued)
��
| | | | |
| Templeton Global Bond Securities Fund | | | | |
Forward Exchange Contracts (continued)
| | | | | | | | | | | | | | | | | | | | | | | | | | | | | | | | |
| Currency | | Counterparty | | | Type | | | Quantity | | | Contract
Amount* | | | | | | Settlement
Date | | | Unrealized
Appreciation | | | Unrealized
Depreciation | |
Euro | | | DBAB | | | | Sell | | | | 1,812,000 | | | | 2,323,618 | | | | | | | | 5/20/13 | | | $ | — | | | $ | (70,601 | ) |
Euro | | | BZWS | | | | Sell | | | | 7,956,126 | | | | 10,174,038 | | | | | | | | 5/21/13 | | | | — | | | | (338,598 | ) |
Euro | | | DBAB | | | | Sell | | | | 2,642,000 | | | | 3,368,814 | | | | | | | | 5/21/13 | | | | — | | | | (122,129 | ) |
Chilean Peso | | | MSCO | | | | Buy | | | | 420,740,000 | | | | 804,474 | | | | | | | | 5/22/13 | | | | 57,663 | | | | — | |
Euro | | | BZWS | | | | Sell | | | | 3,419,406 | | | | 4,377,866 | | | | | | | | 5/22/13 | | | | — | | | | (140,329 | ) |
Malaysian Ringgit | | | HSBC | | | | Buy | | | | 298,500 | | | | 93,568 | | | | | | | | 5/22/13 | | | | 3,100 | | | | — | |
Euro | | | JPHQ | | | | Sell | | | | 4,730,771 | | | | 6,068,562 | | | | | | | | 5/23/13 | | | | — | | | | (182,451 | ) |
Malaysian Ringgit | | | HSBC | | | | Buy | | | | 1,229,300 | | | | 397,793 | | | | | | | | 5/28/13 | | | | 150 | | | | — | |
Euro | | | BZWS | | | | Sell | | | | 2,836,669 | | | | 3,594,485 | | | | | | | | 5/29/13 | | | | — | | | | (153,973 | ) |
Euro | | | DBAB | | | | Sell | | | | 463,000 | | | | 586,042 | | | | | | | | 5/29/13 | | | | — | | | | (25,780 | ) |
Euro | | | BZWS | | | | Sell | | | | 4,907,308 | | | | 6,102,238 | | | | | | | | 6/05/13 | | | | — | | | | (382,870 | ) |
Euro | | | DBAB | | | | Sell | | | | 785,200 | | | | 976,734 | | | | | | | | 6/05/13 | | | | — | | | | (60,924 | ) |
Euro | | | BZWS | | | | Sell | | | | 2,203,083 | | | | 2,756,718 | | | | | | | | 6/06/13 | | | | — | | | | (154,730 | ) |
Euro | | | DBAB | | | | Sell | | | | 2,033,100 | | | | 2,544,628 | | | | | | | | 6/07/13 | | | | — | | | | (142,208 | ) |
Euro | | | DBAB | | | | Sell | | | | 8,105,300 | | | | 10,281,573 | | | | | | | | 6/11/13 | | | | — | | | | (430,376 | ) |
Polish Zloty | | | CITI | | | | Buy | | | | 5,990,000 | | | | 1,327,218 | | | | EUR | | | | 6/11/13 | | | | 155,117 | | | | — | |
Polish Zloty | | | DBAB | | | | Buy | | | | 30,704,000 | | | | 6,820,838 | | | | EUR | | | | 6/11/13 | | | | 771,740 | | | | — | |
Swedish Krona | | | MSCO | | | | Buy | | | | 55,369,800 | | | | 6,068,987 | | | | EUR | | | | 6/11/13 | | | | 467,633 | | | | — | |
Swedish Krona | | | DBAB | | | | Buy | | | | 41,300,000 | | | | 4,543,554 | | | | EUR | | | | 6/11/13 | | | | 326,690 | | | | — | |
Euro | | | DBAB | | | | Sell | | | | 8,383,000 | | | | 10,574,484 | | | | | | | | 6/13/13 | | | | — | | | | (504,690 | ) |
Swedish Krona | | | MSCO | | | | Buy | | | | 27,990,100 | | | | 3,073,741 | | | | EUR | | | | 6/13/13 | | | | 228,499 | | | | — | |
Swedish Krona | | | BZWS | | | | Buy | | | | 24,372,000 | | | | 2,707,398 | | | | EUR | | | | 6/13/13 | | | | 158,018 | | | | — | |
Japanese Yen | | | CITI | | | | Sell | | | | 310,702,000 | | | | 3,930,002 | | | | | | | | 6/14/13 | | | | 343,702 | | | | — | |
Euro | | | BZWS | | | | Sell | | | | 1,124,367 | | | | 1,422,774 | | | | | | | | 6/20/13 | | | | — | | | | (63,318 | ) |
South Korean Won | | | DBAB | | | | Buy | | | | 21,440,000,000 | | | | 18,216,577 | | | | | | | | 6/27/13 | | | | 1,749,236 | | | | — | |
Malaysian Ringgit | | | JPHQ | | | | Buy | | | | 14,772,000 | | | | 4,561,653 | | | | | | | | 6/28/13 | | | | 210,369 | | | | — | |
Swedish Krona | | | UBSW | | | | Buy | | | | 302,991,000 | | | | 33,837,108 | | | | EUR | | | | 6/28/13 | | | | 1,708,670 | | | | — | |
Malaysian Ringgit | | | DBAB | | | | Buy | | | | 18,006,622 | | | | 5,569,633 | | | | | | | | 7/12/13 | | | | 242,455 | | | | — | |
Malaysian Ringgit | | | DBAB | | | | Buy | | | | 13,610,000 | | | | 4,212,709 | | | | | | | | 7/15/13 | | | | 179,479 | | | | — | |
Euro | | | MSCO | | | | Sell | | | | 9,679,000 | | | | 11,861,324 | | | | | | | | 7/16/13 | | | | — | | | | (935,046 | ) |
Euro | | | UBSW | | | | Sell | | | | 8,965,000 | | | | 10,985,711 | | | | | | | | 7/16/13 | | | | — | | | | (866,697 | ) |
Euro | | | BZWS | | | | Sell | | | | 2,243,000 | | | | 2,748,348 | | | | | | | | 7/16/13 | | | | — | | | | (217,068 | ) |
Euro | | | UBSW | | | | Sell | | | | 8,965,000 | | | | 11,027,847 | | | | | | | | 7/18/13 | | | | — | | | | (824,819 | ) |
Euro | | | BZWS | | | | Sell | | | | 3,518,000 | | | | 4,330,482 | | | | | | | | 7/18/13 | | | | — | | | | (320,681 | ) |
Malaysian Ringgit | | | DBAB | | | | Buy | | | | 11,455,000 | | | | 2,886,190 | | | | EUR | | | | 7/18/13 | | | | — | | | | (119,769 | ) |
Malaysian Ringgit | | | DBAB | | | | Buy | | | | 2,637,000 | | | | 817,852 | | | | | | | | 7/18/13 | | | | 33,004 | | | | — | |
Euro | | | BZWS | | | | Sell | | | | 2,638,000 | | | | 3,257,930 | | | | | | | | 7/19/13 | | | | — | | | | (229,819 | ) |
Euro | | | MSCO | | | | Sell | | | | 12,182,000 | | | | 15,014,010 | | | | | | | | 7/22/13 | | | | — | | | | (1,092,564 | ) |
Euro | | | DBAB | | | | Sell | | | | 1,935,000 | | | | 2,384,800 | | | | | | | | 7/22/13 | | | | — | | | | (173,583 | ) |
Malaysian Ringgit | | | DBAB | | | | Buy | | | | 12,933,000 | | | | 3,266,734 | | | | EUR | | | | 7/22/13 | | | | — | | | | (147,171 | ) |
Malaysian Ringgit | | | DBAB | | | | Buy | | | | 4,160,000 | | | | 1,299,513 | | | | | | | | 7/22/13 | | | | 42,437 | | | | — | |
Euro | | | DBAB | | | | Sell | | | | 1,759,000 | | | | 2,165,048 | | | | | | | | 7/23/13 | | | | — | | | | (160,660 | ) |
Malaysian Ringgit | | | DBAB | | | | Buy | | | | 16,628,000 | | | | 4,242,270 | | | | EUR | | | | 7/25/13 | | | | — | | | | (246,172 | ) |
Malaysian Ringgit | | | DBAB | | | | Buy | | | | 5,058,000 | | | | 1,571,686 | | | | | | | | 7/25/13 | | | | 59,655 | | | | — | |
Euro | | | CITI | | | | Sell | | | | 1,935,410 | | | | 2,512,356 | | | | | | | | 7/26/13 | | | | — | | | | (46,681 | ) |
Malaysian Ringgit | | | JPHQ | | | | Buy | | | | 16,628,000 | | | | 4,239,782 | | | | EUR | | | | 7/29/13 | | | | — | | | | (244,395 | ) |
Malaysian Ringgit | | | JPHQ | | | | Buy | | | | 5,318,000 | | | | 1,645,879 | | | | | | | | 7/29/13 | | | | 68,913 | | | | — | |
Euro | | | JPHQ | | | | Sell | | | | 11,263,000 | | | | 13,984,141 | | | | | | | | 7/31/13 | | | | — | | | | (908,824 | ) |
Euro | | | DBAB | | | | Sell | | | | 11,263,000 | | | | 14,002,162 | | | | | | | | 7/31/13 | | | | — | | | | (890,803 | ) |
Malaysian Ringgit | | | HSBC | | | | Buy | | | | 3,005,000 | | | | 938,300 | | | | | | | | 7/31/13 | | | | 30,549 | | | | — | |
Euro | | | UBSW | | | | Sell | | | | 11,263,000 | | | | 13,862,500 | | | | | | | | 8/01/13 | | | | — | | | | (1,030,626 | ) |
Euro | | | BZWS | | | | Sell | | | | 282,898 | | | | 348,064 | | | | | | | | 8/01/13 | | | | — | | | | (26,013 | ) |
TGB-21
Franklin Templeton Variable Insurance Products Trust
Statement of Investments, December 31, 2012 (continued)
| | | | |
| Templeton Global Bond Securities Fund | | | | |
Forward Exchange Contracts (continued)
| | | | | | | | | | | | | | | | | | | | | | | | | | | | | | | | |
| Currency | | Counterparty | | | Type | | | Quantity | | | Contract
Amount* | | | | | | Settlement
Date | | | Unrealized
Appreciation | | | Unrealized
Depreciation | |
Euro | | | HSBC | | | | Sell | | | | 11,263,000 | | | | 13,936,273 | | | | | | | | 8/02/13 | | | $ | — | | | $ | (957,015 | ) |
Euro | | | BZWS | | | | Sell | | | | 2,762,518 | | | | 3,415,149 | | | | | | | | 8/05/13 | | | | — | | | | (237,902 | ) |
Euro | | | JPHQ | | | | Sell | | | | 5,724,900 | | | | 6,999,406 | | | | | | | | 8/06/13 | | | | — | | | | (571,072 | ) |
Malaysian Ringgit | | | JPHQ | | | | Buy | | | | 1,100,000 | | | | 346,533 | | | | | | | | 8/06/13 | | | | 7,995 | | | | — | |
Euro | | | CITI | | | | Sell | | | | 1,210,637 | | | | 1,511,093 | | | | | | | | 8/08/13 | | | | — | | | | (89,861 | ) |
Euro | | | JPHQ | | | | Sell | | | | 6,343,900 | | | | 7,918,075 | | | | | | | | 8/09/13 | | | | — | | | | (471,228 | ) |
Euro | | | DBAB | | | | Sell | | | | 4,845,000 | | | | 6,054,603 | | | | | | | | 8/09/13 | | | | — | | | | (352,524 | ) |
Euro | | | CITI | | | | Sell | | | | 351,512 | | | | 439,288 | | | | | | | | 8/09/13 | | | | — | | | | (25,559 | ) |
South Korean Won | | | HSBC | | | | Buy | | | | 21,363,430,000 | | | | 18,697,208 | | | | | | | | 8/09/13 | | | | 1,151,233 | | | | — | |
Euro | | | GSCO | | | | Sell | | | | 2,166,000 | | | | 2,689,847 | | | | | | | | 8/12/13 | | | | — | | | | (174,609 | ) |
Malaysian Ringgit | | | HSBC | | | | Buy | | | | 6,100,000 | | | | 1,936,692 | | | | | | | | 8/12/13 | | | | 28,630 | | | | — | |
South Korean Won | | | HSBC | | | | Buy | | | | 11,980,000,000 | | | | 818,171,884 | | | | JPY | | | | 8/12/13 | | | | 1,679,240 | | | | — | |
Euro | | | GSCO | | | | Sell | | | | 4,115,000 | | | | 5,093,959 | | | | | | | | 8/14/13 | | | | — | | | | (348,097 | ) |
Euro | | | MSCO | | | | Sell | | | | 1,962,500 | | | | 2,500,765 | | | | | | | | 8/15/13 | | | | — | | | | (94,655 | ) |
Singapore Dollar | | | HSBC | | | | Buy | | | | 3,667,000 | | | | 2,945,169 | | | | | | | | 8/15/13 | | | | 57,124 | | | | — | |
Euro | | | BZWS | | | | Sell | | | | 6,281,000 | | | | 7,796,385 | | | | | | | | 8/16/13 | | | | — | | | | (510,369 | ) |
Euro | | | BZWS | | | | Sell | | | | 7,066,000 | | | | 8,714,321 | | | | | | | | 8/19/13 | | | | — | | | | (630,917 | ) |
Japanese Yen | | | DBAB | | | | Sell | | | | 838,612,000 | | | | 10,710,797 | | | | | | | | 8/19/13 | | | | 1,024,619 | | | | — | |
Polish Zloty | | | DBAB | | | | Buy | | | | 59,155,000 | | | | 13,912,277 | | | | EUR | | | | 8/19/13 | | | | 362,780 | | | | — | |
Singapore Dollar | | | HSBC | | | | Buy | | | | 3,667,000 | | | | 2,945,382 | | | | | | | | 8/19/13 | | | | 56,911 | | | | — | |
Euro | | | JPHQ | | | | Sell | | | | 7,851,000 | | | | 9,758,557 | | | | | | | | 8/20/13 | | | | — | | | | (625,006 | ) |
Euro | | | BZWS | | | | Sell | | | | 6,280,000 | | | | 7,774,012 | | | | | | | | 8/20/13 | | | | — | | | | (531,781 | ) |
Euro | | | DBAB | | | | Sell | | | | 3,964,000 | | | | 4,908,907 | | | | | | | | 8/20/13 | | | | — | | | | (333,795 | ) |
Japanese Yen | | | JPHQ | | | | Sell | | | | 377,047,000 | | | | 4,776,828 | | | | | | | | 8/20/13 | | | | 421,796 | | | | — | |
Japanese Yen | | | HSBC | | | | Sell | | | | 1,621,372,000 | | | | 20,549,708 | | | | | | | | 8/20/13 | | | | 1,822,261 | | | | — | |
Japanese Yen | | | UBSW | | | | Sell | | | | 758,781,000 | | | | 9,637,150 | | | | | | | | 8/20/13 | | | | 872,948 | | | | — | |
Japanese Yen | | | BZWS | | | | Sell | | | | 376,247,000 | | | | 4,759,608 | | | | | | | | 8/22/13 | | | | 413,724 | | | | — | |
Euro | | | BZWS | | | | Sell | | | | 2,680,925 | | | | 3,357,054 | | | | | | | | 8/23/13 | | | | — | | | | (188,795 | ) |
Japanese Yen | | | CITI | | | | Sell | | | | 751,731,000 | | | | 9,510,165 | | | | | | | | 8/23/13 | | | | 827,118 | | | | — | |
Japanese Yen | | | DBAB | | | | Sell | | | | 371,821,000 | | | | 4,706,893 | | | | | | | | 8/23/13 | | | | 412,086 | | | | — | |
Japanese Yen | | | HSBC | | | | Sell | | | | 746,218,000 | | | | 9,450,822 | | | | | | | | 8/23/13 | | | | 831,455 | | | | — | |
Euro | | | UBSW | | | | Sell | | | | 13,581,483 | | | | 16,993,151 | | | | | | | | 8/26/13 | | | | — | | | | (970,598 | ) |
Euro | | | BZWS | | | | Sell | | | | 8,738,369 | | | | 10,947,778 | | | | | | | | 8/26/13 | | | | — | | | | (610,155 | ) |
Japanese Yen | | | JPHQ | | | | Sell | | | | 750,133,000 | | | | 9,515,832 | | | | | | | | 8/26/13 | | | | 850,969 | | | | — | |
Japanese Yen | | | BZWS | | | | Sell | | | | 1,085,075,000 | | | | 13,771,735 | | | | | | | | 8/26/13 | | | | 1,237,923 | | | | — | |
Japanese Yen | | | UBSW | | | | Sell | | | | 937,086,000 | | | | 11,878,388 | | | | | | | | 8/26/13 | | | | 1,054,012 | | | | — | |
Malaysian Ringgit | | | HSBC | | | | Buy | | | | 1,223,000 | | | | 385,951 | | | | | | | | 8/26/13 | | | | 7,755 | | | | — | |
Singapore Dollar | | | DBAB | | | | Buy | | | | 4,782,000 | | | | 3,830,503 | | | | | | | | 8/26/13 | | | | 84,676 | | | | — | |
Swedish Krona | | | UBSW | | | | Buy | | | | 30,000,000 | | | | 3,540,032 | | | | EUR | | | | 8/26/13 | | | | — | | | | (89,216 | ) |
Euro | | | HSBC | | | | Sell | | | | 18,537,726 | | | | 23,382,561 | | | | | | | | 8/27/13 | | | | — | | | | (1,136,903 | ) |
Euro | | | JPHQ | | | | Sell | | | | 8,806,308 | | | | 11,099,031 | | | | | | | | 8/27/13 | | | | — | | | | (548,890 | ) |
Euro | | | CITI | | | | Sell | | | | 6,136,805 | | | | 7,760,297 | | | | | | | | 8/27/13 | | | | — | | | | (356,727 | ) |
Japanese Yen | | | HSBC | | | | Sell | | | | 1,247,125,000 | | | | 15,947,890 | | | | | | | | 8/27/13 | | | | 1,542,070 | | | | — | |
Japanese Yen | | | DBAB | | | | Sell | | | | 685,950,000 | | | | 8,769,048 | | | | | | | | 8/27/13 | | | | 845,486 | | | | — | |
Japanese Yen | | | JPHQ | | | | Sell | | | | 751,903,000 | | | | 9,617,895 | | | | | | | | 8/27/13 | | | | 932,495 | | | | — | |
Malaysian Ringgit | | | HSBC | | | | Buy | | | | 2,087,700 | | | | 663,057 | | | | | | | | 8/27/13 | | | | 8,971 | | | | — | |
Malaysian Ringgit | | | JPHQ | | | | Buy | | | | 8,340,000 | | | | 2,649,301 | | | | | | | | 8/27/13 | | | | 35,335 | | | | — | |
Singapore Dollar | | | DBAB | | | | Buy | | | | 5,952,000 | | | | 4,795,746 | | | | | | | | 8/27/13 | | | | 77,351 | | | | — | |
Euro | | | DBAB | | | | Sell | | | | 1,058,312 | | | | 1,330,145 | | | | | | | | 8/28/13 | | | | — | | | | (69,678 | ) |
Euro | | | JPHQ | | | | Sell | | | | 6,190,317 | | | | 7,798,097 | | | | | | | | 8/29/13 | | | | — | | | | (389,884 | ) |
Japanese Yen | | | JPHQ | | | | Sell | | | | 372,662,000 | | | | 4,759,868 | | | | | | | | 8/30/13 | | | | 455,030 | | | | — | |
Singapore Dollar | | | DBAB | | | | Buy | | | | 2,980,000 | | | | 2,384,572 | | | | | | | | 8/30/13 | | | | 55,251 | | | | — | |
TGB-22
Franklin Templeton Variable Insurance Products Trust
Statement of Investments, December 31, 2012 (continued)
| | | | |
| Templeton Global Bond Securities Fund | | | | |
Forward Exchange Contracts (continued)
| | | | | | | | | | | | | | | | | | | | | | | | | | | | | | | | |
| Currency | | Counterparty | | | Type | | | Quantity | | �� | Contract
Amount* | | | | | | Settlement
Date | | | Unrealized
Appreciation | | | Unrealized
Depreciation | |
Euro | | | DBAB | | | | Sell | | | | 541,000 | | | | 682,607 | | | | | | | | 9/04/13 | | | $ | — | | | $ | (33,025 | ) |
Euro | | | DBAB | | | | Sell | | | | 1,191,000 | | | | 1,505,638 | | | | | | | | 9/10/13 | | | | — | | | | (69,912 | ) |
Euro | | | BZWS | | | | Sell | | | | 1,033,224 | | | | 1,308,010 | | | | | | | | 9/10/13 | | | | — | | | | (58,822 | ) |
Euro | | | DBAB | | | | Sell | | | | 8,105,300 | | | | 10,410,447 | | | | | | | | 9/11/13 | | | | — | | | | (312,012 | ) |
Euro | | | BZWS | | | | Sell | | | | 1,012,110 | | | | 1,299,225 | | | | | | | | 9/12/13 | | | | — | | | | (39,704 | ) |
Euro | | | JPHQ | | | | Sell | | | | 541,000 | | | | 697,890 | | | | | | | | 9/13/13 | | | | — | | | | (17,812 | ) |
Euro | | | BZWS | | | | Sell | | | | 2,890,070 | | | | 3,741,629 | | | | | | | | 9/16/13 | | | | — | | | | (81,837 | ) |
Euro | | | UBSW | | | | Sell | | | | 2,694,506 | | | | 3,486,152 | | | | | | | | 9/17/13 | | | | — | | | | (78,629 | ) |
Japanese Yen | | | BZWS | | | | Sell | | | | 285,057,504 | | | | 3,654,583 | | | | | | | | 9/18/13 | | | | 361,056 | | | | — | |
Euro | | | BZWS | | | | Sell | | | | 678,250 | | | | 893,459 | | | | | | | | 9/19/13 | | | | — | | | | (3,873 | ) |
Singapore Dollar | | | JPHQ | | | | Buy | | | | 5,686,000 | | | | 4,648,463 | | | | | | | | 9/19/13 | | | | 6,851 | | | | — | |
Euro | | | DBAB | | | | Sell | | | | 8,070,000 | | | | 10,481,881 | | | | | | | | 9/24/13 | | | | — | | | | (195,389 | ) |
Euro | | | BZWS | | | | Sell | | | | 1,647,381 | | | | 2,141,233 | | | | | | | | 9/24/13 | | | | — | | | | (38,387 | ) |
Philippine Peso | | | DBAB | | | | Buy | | | | 165,158,000 | | | | 3,950,959 | | | | | | | | 9/24/13 | | | | 61,951 | | | | — | |
Euro | | | DBAB | | | | Sell | | | | 3,753,000 | | | | 4,862,049 | | | | | | | | 9/26/13 | | | | — | | | | (103,585 | ) |
Malaysian Ringgit | | | HSBC | | | | Buy | | | | 11,490,000 | | | | 3,685,646 | | | | | | | | 9/26/13 | | | | 6,435 | | | | — | |
Malaysian Ringgit | | | DBAB | | | | Buy | | | | 3,068,000 | | | | 983,649 | | | | | | | | 9/26/13 | | | | 2,191 | | | | — | |
South Korean Won | | | HSBC | | | | Buy | | | | 9,530,000,000 | | | | 8,390,562 | | | | | | | | 9/26/13 | | | | 440,680 | | | | — | |
Euro | | | BZWS | | | | Sell | | | | 12,170,000 | | | | 15,836,213 | | | | | | | | 9/27/13 | | | | — | | | | (266,219 | ) |
Japanese Yen | | | JPHQ | | | | Sell | | | | 285,510,329 | | | | 3,393,781 | | | | | | | | 9/27/13 | | | | 94,709 | | | | — | |
Euro | | | DBAB | | | | Sell | | | | 14,880,000 | | | | 19,211,159 | | | | | | | | 9/30/13 | | | | — | | | | (477,715 | ) |
Euro | | | HSBC | | | | Sell | | | | 5,430,000 | | | | 6,985,586 | | | | | | | | 9/30/13 | | | | — | | | | (199,265 | ) |
Japanese Yen | | | JPHQ | | | | Sell | | | | 172,207,000 | | | | 2,223,676 | | | | | | | | 9/30/13 | | | | 233,739 | | | | — | |
Philippine Peso | | | HSBC | | | | Buy | | | | 49,600,000 | | | | 1,182,698 | | | | | | | | 9/30/13 | | | | 22,233 | | | | — | |
Philippine Peso | | | HSBC | | | | Buy | | | | 39,700,000 | | | | 951,787 | | | | | | | | 10/03/13 | | | | 12,488 | | | | — | |
Swedish Krona | | | DBAB | | | | Buy | | | | 445,104,500 | | | | 67,246,487 | | | | | | | | 10/03/13 | | | | 855,693 | | | | — | |
Philippine Peso | | | DBAB | | | | Buy | | | | 195,560,000 | | | | 4,678,469 | | | | | | | | 10/04/13 | | | | 71,239 | | | | — | |
Philippine Peso | | | HSBC | | | | Buy | | | | 156,866,000 | | | | 3,760,512 | | | | | | | | 10/04/13 | | | | 49,407 | | | | — | |
Euro | | | UBSW | | | | Sell | | | | 6,370,000 | | | | 8,249,978 | | | | | | | | 10/07/13 | | | | — | | | | (179,433 | ) |
Philippine Peso | | | HSBC | | | | Buy | | | | 233,867,000 | | | | 5,623,290 | | | | | | | | 10/07/13 | | | | 55,889 | | | | — | |
Euro | | | DBAB | | | | Sell | | | | 12,680,000 | | | | 16,621,324 | | | | | | | | 10/09/13 | | | | — | | | | (158,540 | ) |
Mexican Peso | | | DBAB | | | | Buy | | | | 259,112,000 | | | | 19,491,631 | | | | | | | | 10/11/13 | | | | 117,928 | | | | — | |
Philippine Peso | | | JPHQ | | | | Buy | | | | 76,627,000 | | | | 1,844,611 | | | | | | | | 10/11/13 | | | | 15,782 | | | | — | |
Philippine Peso | | | HSBC | | | | Buy | | | | 134,895,000 | | | | 3,245,711 | | | | | | | | 10/11/13 | | | | 29,345 | | | | — | |
Malaysian Ringgit | | | DBAB | | | | Buy | | | | 16,369,588 | | | | 5,226,922 | | | | | | | | 10/16/13 | | | | 27,901 | | | | — | |
Philippine Peso | | | DBAB | | | | Buy | | | | 45,732,000 | | | | 1,098,825 | | | | | | | | 10/16/13 | | | | 11,182 | | | | — | |
Euro | | | HSBC | | | | Sell | | | | 12,569,000 | | | | 16,339,700 | | | | | | | | 10/17/13 | | | | — | | | | (295,020 | ) |
Malaysian Ringgit | | | JPHQ | | | | Buy | | | | 8,104,000 | | | | 2,608,724 | | | | | | | | 10/18/13 | | | | — | | | | (7,504 | ) |
Chilean Peso | | | CITI | | | | Buy | | | | 921,291,798 | | | | 1,863,454 | | | | | | | | 10/21/13 | | | | — | | | | (10,407 | ) |
Malaysian Ringgit | | | HSBC | | | | Buy | | | | 14,613,000 | | | | 4,744,172 | | | | | | | | 10/22/13 | | | | — | | | | (54,616 | ) |
Malaysian Ringgit | | | DBAB | | | | Buy | | | | 10,811,000 | | | | 3,486,857 | | | | | | | | 10/23/13 | | | | — | | | | (17,596 | ) |
Malaysian Ringgit | | | HSBC | | | | Buy | | | | 7,209,825 | | | | 2,325,000 | | | | | | | | 10/24/13 | | | | — | | | | (11,473 | ) |
Euro | | | BZWS | | | | Sell | | | | 649,907 | | | | 847,752 | | | | | | | | 10/25/13 | | | | — | | | | (12,472 | ) |
Chilean Peso | | | BZWS | | | | Buy | | | | 199,342,000 | | | | 395,834 | | | | | | | | 10/29/13 | | | | 4,720 | | | | — | |
Chilean Peso | | | DBAB | | | | Buy | | | | 398,486,000 | | | | 789,550 | | | | | | | | 10/29/13 | | | | 11,160 | | | | — | |
Euro | | | DBAB | | | | Sell | | | | 3,319,244 | | | | 4,295,849 | | | | | | | | 10/31/13 | | | | — | | | | (97,885 | ) |
Malaysian Ringgit | | | JPHQ | | | | Buy | | | | 7,468,000 | | | | 2,411,911 | | | | | | | | 10/31/13 | | | | — | | | | (16,363 | ) |
Euro | | | DBAB | | | | Sell | | | | 224,556 | | | | 293,042 | | | | | | | | 11/04/13 | | | | — | | | | (4,222 | ) |
Euro | | | BZWS | | | | Sell | | | | 1,581,109 | | | | 2,058,304 | | | | | | | | 11/05/13 | | | | — | | | | (34,772 | ) |
Japanese Yen | | | CITI | | | | Sell | | | | 341,992,119 | | | | 4,281,752 | | | | | | | | 11/08/13 | | | | 327,700 | | | | — | |
Norwegian Krone | | | UBSW | | | | Buy | | | | 47,173,200 | | | | 6,327,302 | | | | EUR | | | | 11/08/13 | | | | 9,437 | | | | — | |
Euro | | | JPHQ | | | | Sell | | | | 8,969,211 | | | | 11,484,850 | | | | | | | | 11/12/13 | | | | — | | | | (389,698 | ) |
TGB-23
Franklin Templeton Variable Insurance Products Trust
Statement of Investments, December 31, 2012 (continued)
| | | | |
| Templeton Global Bond Securities Fund | | | | |
Forward Exchange Contracts (continued)
| | | | | | | | | | | | | | | | | | | | | | | | | | | | | | | | |
| Currency | | Counterparty | | | Type | | | Quantity | | | Contract
Amount* | | | | | | Settlement
Date | | | Unrealized
Appreciation | | | Unrealized
Depreciation | |
Japanese Yen | | | JPHQ | | | | Sell | | | | 335,950,000 | | | | 4,247,021 | | | | | | | | 11/13/13 | | | $ | 362,554 | | | $ | — | |
Euro | | | DBAB | | | | Sell | | | | 10,778,730 | | | | 13,760,342 | | | | | | | | 11/15/13 | | | | — | | | | (510,433 | ) |
Euro | | | MSCO | | | | Sell | | | | 1,962,500 | | | | 2,503,807 | | | | | | | | 11/15/13 | | | | — | | | | (94,495 | ) |
Japanese Yen | | | UBSW | | | | Sell | | | | 340,600,700 | | | | 4,303,774 | | | | | | | | 11/15/13 | | | | 365,422 | | | | — | |
Japanese Yen | | | MSCO | | | | Sell | | | | 300,000,000 | | | | 3,792,428 | | | | | | | | 11/15/13 | | | | 323,539 | | | | — | |
Japanese Yen | | | CITI | | | | Sell | | | | 429,663,000 | | | | 5,432,068 | | | | | | | | 11/15/13 | | | | 463,891 | | | | — | |
Euro | | | DBAB | | | | Sell | | | | 3,953,398 | | | | 5,079,088 | | | | | | | | 11/19/13 | | | | — | | | | (155,388 | ) |
Japanese Yen | | | CITI | | | | Sell | | | | 986,239,000 | | | | 12,214,847 | | | | | | | | 11/19/13 | | | | 810,363 | | | | — | |
Japanese Yen | | | DBAB | | | | Sell | | | | 796,770,000 | | | | 9,831,023 | | | | | | | | 11/19/13 | | | | 617,484 | | | | — | |
Malaysian Ringgit | | | DBAB | | | | Buy | | | | 7,197,960 | | | | 2,310,000 | | | | | | | | 11/19/13 | | | | — | | | | (3,224 | ) |
Euro | | | JPHQ | | | | Sell | | | | 10,515,154 | | | | 13,423,803 | | | | | | | | 11/20/13 | | | | — | | | | (498,917 | ) |
Euro | | | UBSW | | | | Sell | | | | 4,794,427 | | | | 6,137,346 | | | | | | | | 11/20/13 | | | | — | | | | (210,774 | ) |
Euro | | | DBAB | | | | Sell | | | | 3,887,000 | | | | 4,976,915 | | | | | | | | 11/20/13 | | | | — | | | | (169,716 | ) |
Japanese Yen | | | UBSW | | | | Sell | | | | 317,836,000 | | | | 3,936,147 | | | | | | | | 11/20/13 | | | | 260,763 | | | | — | |
Japanese Yen | | | CITI | | | | Sell | | | | 1,107,834,000 | | | | 13,695,223 | | | | | | | | 11/20/13 | | | | 884,482 | | | | — | |
Japanese Yen | | | JPHQ | | | | Sell | | | | 397,873,000 | | | | 4,930,120 | | | | | | | | 11/20/13 | | | | 329,207 | | | | — | |
Japanese Yen | | | HSBC | | | | Sell | | | | 207,909,000 | | | | 2,574,119 | | | | | | | | 11/20/13 | | | | 169,906 | | | | — | |
Malaysian Ringgit | | | HSBC | | | | Buy | | | | 4,326,000 | | | | 1,385,997 | | | | | | | | 11/20/13 | | | | 316 | | | | — | |
Euro | | | DBAB | | | | Sell | | | | 837,570 | | | | 1,089,218 | | | | | | | | 11/29/13 | | | | — | | | | (19,908 | ) |
Euro | | | DBAB | | | | Sell | | | | 5,440,000 | | | | 7,093,515 | | | | | | | | 12/03/13 | | | | — | | | | (110,613 | ) |
Euro | | | UBSW | | | | Sell | | | | 2,400,751 | | | | 3,151,666 | | | | | | | | 12/09/13 | | | | — | | | | (27,871 | ) |
Euro | | | HSBC | | | | Sell | | | | 2,155,292 | | | | 2,834,855 | | | | | | | | 12/09/13 | | | | — | | | | (19,597 | ) |
Euro | | | JPHQ | | | | Sell | | | | 5,095,000 | | | | 6,650,580 | | | | | | | | 12/13/13 | | | | — | | | | (97,554 | ) |
Swedish Krona | | | MSCO | | | | Buy | | | | 21,992,000 | | | | 2,509,528 | | | | EUR | | | | 12/16/13 | | | | 36,595 | | | | — | |
Malaysian Ringgit | | | JPHQ | | | | Buy | | | | 13,361,013 | | | | 4,305,837 | | | | | | | | 12/17/13 | | | | — | | | | (29,814 | ) |
| | | | | | | | | | | | | | | | | | | | | | | | | | | | |
Unrealized appreciation (depreciation) | | | | | | | | | | | | | | | | | | | | 63,288,268 | | | | (31,846,618 | ) |
| | | | | | | | | | | | | | | | | | | | | | | | | | | | |
Net unrealized appreciation (depreciation) | | | | | | | | | | | | | | | | | | | $ | 31,441,650 | | | | | |
| | | | | | | | | | | | | | | | | | | | | | | | | | | | | | | | |
*In U.S. dollars unless otherwise indicated.
At December 31, 2012, the Fund had the following interest rate swap contracts outstanding. See Note 1(d).
Interest Rate Swap Contracts
| | | | | | | | | | | | | | | | | | | | |
| Description | | Counter-
party | | | Expiration
Date | | | Notional
Amount | | | Unrealized
Appreciation | | | Unrealized
Depreciation | |
Receive Floating rate 3-month USD BBA LIBOR | | | JPHQ | | | | 3/4/21 | | | $ | 3,240,000 | | | $ | — | | | $ | (555,232 | ) |
Pay Fixed rate 3.558% | | | | | | | | | | | | | | | | | | | | |
Receive Floating rate 3-month USD BBA LIBOR | | | DBAB | | | | 3/28/21 | | | | 14,630,000 | | | | — | | | | (2,439,664 | ) |
Pay Fixed rate 3.523% | | | | | | | | | | | | | | | | | | | | |
Receive Floating rate 3-month USD BBA LIBOR | | | CITI | | | | 2/25/41 | | | | 7,460,000 | | | | — | | | | (2,501,162 | ) |
Pay Fixed rate 4.347% | | | | | | | | | | | | | | | | | | | | |
Receive Floating rate 3-month USD BBA LIBOR | | | JPHQ | | | | 2/25/41 | | | | 7,460,000 | | | | — | | | | (2,505,251 | ) |
Pay Fixed rate 4.349% | | | | | | | | | | | | | | | | | | | | |
Receive Floating rate 3-month USD BBA LIBOR | | | JPHQ | | | | 2/28/41 | | | | 5,600,000 | | | | — | | | | (1,855,697 | ) |
Pay Fixed rate 4.320% | | | | | | | | | | | | | | | | | | | | |
Receive Floating rate 3-month USD BBA LIBOR | | | JPHQ | | | | 3/1/41 | | | | 1,870,000 | | | | — | | | | (607,393 | ) |
Pay Fixed rate 4.299% | | | | | | | | | | | | | | | | | | | | |
| | | | | | | | | | | | | | | | |
Unrealized appreciation (depreciation) | | | | | | | | | | | | | | | — | | | | (10,464,399 | ) |
| | | | | | | | | | | | | | | | |
Net unrealized appreciation (depreciation) | | | | | | | | | | | | | | | | | | $ | (10,464,399 | ) |
| | | | | | | | | | | | | | | | | | | | |
The accompanying notes are an integral part of these financial statements.
Franklin Templeton Variable Insurance Products Trust
Financial Statements
Statement of Assets and Liabilities
December 31, 2012
| | | | |
| | | Templeton
Global Bond
Securities Fund | |
Assets: | | | | |
Investments in securities: | | | | |
Cost - Unaffiliated issuers | | $ | 2,279,520,978 | |
Cost - Repurchase agreements | | | 513,775,280 | |
| | | | |
Total cost of investments | | $ | 2,793,296,258 | |
| | | | |
Value - Unaffiliated issuers | | $ | 2,469,823,065 | |
Value - Repurchase agreements | | | 513,775,280 | |
| | | | |
Total value of investments | | | 2,983,598,345 | |
Cash | | | 1,910,000 | |
Restricted cash (Note 1e) | | | 4,885,000 | |
Foreign currency, at value (cost $44,399,294) | | | 44,537,754 | |
Receivables: | | | | |
Capital shares sold | | | 7,664,061 | |
Interest | | | 32,947,960 | |
Due from brokers | | | 6,800,000 | |
Unrealized appreciation on forward exchange contracts | | | 63,288,268 | |
Other assets | | | 57 | |
| | | | |
Total assets | | | 3,145,631,445 | |
| | | | |
Liabilities: | | | | |
Payables: | | | | |
Capital shares redeemed | | | 1,328,032 | |
Affiliates | | | 2,330,169 | |
Due to brokers | | | 6,795,000 | |
Unrealized depreciation on forward exchange contracts | | | 31,846,618 | |
Unrealized depreciation on swap contracts | | | 10,464,399 | |
Deferred tax | | | 4,718,263 | |
Accrued expenses and other liabilities | | | 1,461,293 | |
| | | | |
Total liabilities | | | 58,943,774 | |
| | | | |
Net assets, at value | | $ | 3,086,687,671 | |
| | | | |
Net assets consist of: | | | | |
Paid-in capital | | $ | 2,725,448,336 | |
Undistributed net investment income | | | 114,278,705 | |
Net unrealized appreciation (depreciation) | | | 207,559,897 | |
Accumulated net realized gain (loss) | | | 39,400,733 | |
| | | | |
Net assets, at value | | $ | 3,086,687,671 | |
| | | | |
The accompanying notes are an integral part of these financial statements.
TGB-25
Franklin Templeton Variable Insurance Products Trust
Financial Statements (continued)
Statement of Assets and Liabilities (continued)
December 31, 2012
| | | | |
| | | Templeton
Global Bond
Securities Fund | |
Class 1: | | | | |
Net assets, at value | | $ | 307,141,539 | |
| | | | |
Shares outstanding | | | 15,351,096 | |
| | | | |
Net asset value and maximum offering price per share | | $ | 20.01 | |
| | | | |
Class 2: | | | | |
Net assets, at value | | $ | 2,418,228,762 | |
| | | | |
Shares outstanding | | | 124,195,349 | |
| | | | |
Net asset value and maximum offering price per share | | $ | 19.47 | |
| | | | |
Class 3: | | | | |
Net assets, at value | | $ | 198,076,542 | |
| | | | |
Shares outstanding | | | 10,168,974 | |
| | | | |
Net asset value and maximum offering price per sharea | | $ | 19.48 | |
| | | | |
Class 4: | | | | |
Net assets, at value | | $ | 163,240,828 | |
| | | | |
Shares outstanding | | | 8,236,372 | |
| | | | |
Net asset value and maximum offering price per share | | $ | 19.82 | |
| | | | |
aRedemption price is equal to net asset value less contingent deferred sales charges, if applicable.
The accompanying notes are an integral part of these financial statements.
TGB-26
Franklin Templeton Variable Insurance Products Trust
Financial Statements (continued)
Statement of Operations
for the year ended December 31, 2012
| | | | |
| | | Templeton
Global Bond
Securities Fund | |
Investment income: | | | | |
Interest (net of foreign taxes of $2,073,907) | | $ | 117,115,867 | |
| | | | |
Expenses: | | | | |
Management fees (Note 3a) | | | 12,614,645 | |
Distribution fees: (Note 3c) | | | | |
Class 2 | | | 5,283,500 | |
Class 3 | | | 480,093 | |
Class 4 | | | 556,829 | |
Unaffiliated transfer agent fees | | | 2,319 | |
Custodian fees (Note 4) | | | 1,831,459 | |
Reports to shareholders | | | 476,794 | |
Registration and filing fees | | | 1,357 | |
Professional fees | | | 94,880 | |
Trustees’ fees and expenses | | | 10,332 | |
Other | | | 57,832 | |
| | | | |
Total expenses | | | 21,410,040 | |
| | | | |
Net investment income | | | 95,705,827 | |
| | | | |
Realized and unrealized gains (losses): | | | | |
Net realized gain (loss) from: | | | | |
Investments | | | 30,600,589 | |
Foreign currency transactions | | | 84,672,570 | |
Swap contracts | | | (1,412,791 | ) |
| | | | |
Net realized gain (loss) | | | 113,860,368 | |
| | | | |
Net change in unrealized appreciation (depreciation) on: | | | | |
Investments | | | 153,410,614 | |
Translation of other assets and liabilities denominated in foreign currencies | | | 19,400,791 | |
Change in deferred taxes on unrealized appreciation | | | 678,835 | |
| | | | |
Net change in unrealized appreciation (depreciation) | | | 173,490,240 | |
| | | | |
Net realized and unrealized gain (loss) | | | 287,350,608 | |
| | | | |
Net increase (decrease) in net assets resulting from operations | | $ | 383,056,435 | |
| | | | |
The accompanying notes are an integral part of these financial statements.
TGB-27
Franklin Templeton Variable Insurance Products Trust
Financial Statements (continued)
Statements of Changes in Net Assets
| | | | | | | | |
| | | Templeton Global Bond
Securities Fund | |
| | | Year Ended December 31, | |
| | | 2012 | | | 2011 | |
| | | | |
Increase (decrease) in net assets: | | | | | | | | |
Operations: | | | | | | | | |
Net investment income | | $ | 95,705,827 | | | $ | 96,874,837 | |
Net realized gain (loss) from investments, foreign currency transactions, future contracts and swap contracts | | | 113,860,368 | | | | 52,604,567 | |
Net change in unrealized appreciation (depreciation) on investments, translation of other assets and liabilities denominated in foreign currencies and deferred taxes | | | 173,490,240 | | | | (180,068,912 | ) |
| | | | |
Net increase (decrease) in net assets resulting from operations | | | 383,056,435 | | | | (30,589,508 | ) |
| | | | |
Distributions to shareholders from: | | | | | | | | |
Net investment income and net foreign currency gains: | | | | | | | | |
Class 1 | | | (18,014,760 | ) | | | (15,683,467 | ) |
Class 2 | | | (133,749,946 | ) | | | (93,946,669 | ) |
Class 3 | | | (12,114,860 | ) | | | (10,753,201 | ) |
Class 4 | | | (9,763,141 | ) | | | (8,615,701 | ) |
Net realized gains: | | | | | | | | |
Class 1 | | | (438,387 | ) | | | (1,762,080 | ) |
Class 2 | | | (3,357,784 | ) | | | (10,925,216 | ) |
Class 3 | | | (306,543 | ) | | | (1,252,885 | ) |
Class 4 | | | (251,144 | ) | | | (1,020,280 | ) |
| | | | |
Total distributions to shareholders | | | (177,996,565 | ) | | | (143,959,499 | ) |
| | | | |
Capital share transactions: (Note 2) | | | | | | | | |
Class 1 | | | 15,415,298 | | | | 17,171,380 | |
Class 2 | | | 448,524,053 | | | | 451,366,379 | |
Class 3 | | | (2,060,465 | ) | | | 16,706,473 | |
Class 4 | | | (394,730 | ) | | | 12,126,720 | |
| | | | |
Total capital share transactions | | | 461,484,156 | | | | 497,370,952 | |
| | | | |
Redemption fees | | | 6,086 | | | | 18,113 | |
| | | | |
Net increase (decrease) in net assets | | | 666,550,112 | | | | 322,840,058 | |
Net assets: | | | | | | | | |
Beginning of year | | | 2,420,137,559 | | | | 2,097,297,501 | |
| | | | |
End of year | | $ | 3,086,687,671 | | | $ | 2,420,137,559 | |
| | | | |
Undistributed net investment income included in net assets: | | | | | | | | |
End of year | | $ | 114,278,705 | | | $ | 117,957,425 | |
| | | | |
The accompanying notes are an integral part of these financial statements.
TGB-28
Franklin Templeton Variable Insurance Products Trust
Notes to Financial Statements
Templeton Global Bond Securities Fund
1. ORGANIZATION AND SIGNIFICANT ACCOUNTING POLICIES
Franklin Templeton Variable Insurance Products Trust (Trust) is registered under the Investment Company Act of 1940, as amended, (1940 Act) as an open-end investment company, consisting of twenty separate funds. The Templeton Global Bond Securities Fund (Fund) is included in this report. The financial statements of the remaining funds in the Trust are presented separately. Shares of the Fund are generally sold only to insurance company separate accounts to fund the benefits of variable life insurance policies or variable annuity contracts. The Fund offers four classes of shares: Class 1, Class 2, Class 3, and Class 4. Each class of shares differs by its distribution fees, voting rights on matters affecting a single class and its exchange privilege.
The following summarizes the Fund’s significant accounting policies.
a. Financial Instrument Valuation
The Fund’s investments in financial instruments are carried at fair value daily. Fair value is the price that would be received to sell an asset or paid to transfer a liability in an orderly transaction between market participants on the measurement date. Under procedures approved by the Trust’s Board of Trustees (the Board), the Fund’s administrator, investment manager and other affiliates have formed the Valuation and Liquidity Oversight Committee (VLOC). The VLOC provides administration and oversight of the Fund’s valuation policies and procedures, which are approved annually by the Board. Among other things, these procedures allow the Fund to utilize independent pricing services, quotations from securities and financial instrument dealers, and other market sources to determine fair value.
Debt securities generally trade in the over-the-counter (OTC) market rather than on a securities exchange. The Fund’s pricing services use multiple valuation techniques to determine fair value. In instances where sufficient market activity exists, the pricing services may utilize a market-based approach through which quotes from market makers are used to determine fair value. In instances where sufficient market activity may not exist or is limited, the pricing services also utilize proprietary valuation models which may consider market characteristics such as benchmark yield curves, credit spreads, estimated default rates, anticipated market interest rate volatility, coupon rates, anticipated timing of principal repayments, underlying collateral, and other unique security features in order to estimate the relevant cash flows, which are then discounted to calculate the fair value. Securities denominated in a foreign currency are converted into their U.S. dollar equivalent at the foreign exchange rate in effect at the close of the NYSE on the date that the values of the foreign debt securities are determined. Repurchase agreements are valued at cost, which approximates market value.
Certain derivative financial instruments (derivatives) trade in the OTC market. The Fund’s pricing services use various techniques including industry standard option pricing models and proprietary discounted cash flow models to determine the fair value of those instruments. The Fund’s net benefit or obligation under the derivative contract, as measured by the fair market value of the contract, is included in net assets.
The Fund has procedures to determine the fair value of financial instruments for which market prices are not reliable or readily available. Under these procedures, the VLOC convenes on a regular basis to review such financial instruments and considers a number of factors, including significant unobservable valuation inputs, when arriving at fair value. The VLOC primarily employs a market-based approach which may use related or comparable assets or liabilities, recent transactions, market multiples, book values, and other relevant information for the investment to determine the fair value of the investment. An income-based valuation approach may also be used in which the anticipated future cash flows of the investment are discounted to calculate fair value. Discounts may also be applied due to the nature or duration of any restrictions on the disposition of the investments. Due to the inherent uncertainty of valuations of such investments, the fair values may differ significantly from the values that would have been used had an active market existed. The VLOC employs various methods for calibrating these valuation approaches including a regular review of key inputs and assumptions, transactional back-testing or disposition analysis, and reviews of any related market activity.
Trading in securities on foreign securities stock exchanges and OTC markets may be completed before the daily close of business on the NYSE. Occasionally, events occur between the time at which trading in a foreign security is completed and the close of the
TGB-29
Franklin Templeton Variable Insurance Products Trust
Notes to Financial Statements (continued)
Templeton Global Bond Securities Fund
1. ORGANIZATION AND SIGNIFICANT ACCOUNTING POLICIES (continued)
a. Financial Instrument Valuation (continued)
NYSE that might call into question the reliability of the value of a portfolio security held by the Fund. As a result, differences may arise between the value of the Fund’s portfolio securities as determined at the foreign market close and the latest indications of value at the close of the NYSE. In order to minimize the potential for these differences, the VLOC monitors price movements following the close of trading in foreign stock markets through a series of country specific market proxies (such as baskets of American Depositary Receipts, futures contracts and exchange traded funds). These price movements are measured against established trigger thresholds for each specific market proxy to assist in determining if an event has occurred that may call into question the reliability of the values of the foreign securities held by the Fund. If such an event occurs, the securities may be valued using fair value procedures, which may include the use of independent pricing services.
b. Foreign Currency Translation
Portfolio securities and other assets and liabilities denominated in foreign currencies are translated into U.S. dollars based on the exchange rate of such currencies against U.S. dollars on the date of valuation. The Fund may enter into foreign currency exchange contracts to facilitate transactions denominated in a foreign currency. Purchases and sales of securities, income and expense items denominated in foreign currencies are translated into U.S. dollars at the exchange rate in effect on the transaction date. Portfolio securities and assets and liabilities denominated in foreign currencies contain risks that those currencies will decline in value relative to the U.S. dollar. Occasionally, events may impact the availability or reliability of foreign exchange rates used to convert the U.S. dollar equivalent value. If such an event occurs, the foreign exchange rate will be valued at fair value using procedures established and approved by the Board.
The Fund does not separately report the effect of changes in foreign exchange rates from changes in market prices on securities held. Such changes are included in net realized and unrealized gain or loss from investments on the Statement of Operations.
Realized foreign exchange gains or losses arise from sales of foreign currencies, currency gains or losses realized between the trade and settlement dates on securities transactions and the difference between the recorded amounts of dividends, interest, and foreign withholding taxes and the U.S. dollar equivalent of the amounts actually received or paid. Net unrealized foreign exchange gains and losses arise from changes in foreign exchange rates on foreign denominated assets and liabilities other than investments in securities held at the end of the reporting period.
c. Joint Repurchase Agreement
The Fund enters into a joint repurchase agreement whereby its uninvested cash balance is deposited into a joint cash account with other funds managed by the investment manager or an affiliate of the investment manager and is used to invest in one or more repurchase agreements. The value and face amount of the joint repurchase agreement are allocated to the funds based on their pro-rata interest. A repurchase agreement is accounted for as a loan by the fund to the seller, collateralized by securities which are delivered to the fund’s custodian. The market value, including accrued interest, of the initial collateralization is required to be at least 102% of the dollar amount invested by the funds, with the value of the underlying securities marked to market daily to maintain coverage of at least 100%. The joint repurchase agreement held by the Fund at year end had been entered into on December 31, 2012.
d. Derivative Financial Instruments
The Fund invested in derivatives in order to manage risk or gain exposure to various other investments or markets. Derivatives are financial contracts based on an underlying or notional amount, require no initial investment or an initial net investment that is smaller than would normally be required to have a similar response to changes in market factors, and require or permit net settlement. Derivatives contain various risks including the potential inability of the counterparty to fulfill their obligations under
TGB-30
Franklin Templeton Variable Insurance Products Trust
Notes to Financial Statements (continued)
Templeton Global Bond Securities Fund
1. ORGANIZATION AND SIGNIFICANT ACCOUNTING POLICIES (continued)
d. Derivative Financial Instruments (continued)
the terms of the contract, the potential for an illiquid secondary market, and/or the potential for market movements which expose the Fund to gains or losses in excess of the amounts shown on the Statement of Assets and Liabilities. Realized gain and loss and unrealized appreciation and depreciation on these contracts for the period are included in the Statement of Operations.
The Fund’s investments in OTC derivatives are subject to the terms of International Swaps and Derivatives Association Master Agreements and other related agreements between the Fund and certain derivative counterparties. These agreements contain various provisions, including but not limited to collateral requirements, events of default, requirements for the Fund to maintain certain net asset levels and/or limit the decline in net assets over various periods of time. Should the Fund fail to meet any of these provisions, the derivative counterparty has the right to terminate the derivative contract and require immediate payment by the Fund for those OTC derivatives with that particular counterparty that are in a net liability position. At December 31, 2012, the Fund had OTC derivatives in a net liability position of $5,549,900 and the aggregate value of collateral pledged for such contracts was $6,800,000.
The Fund entered into OTC forward exchange contracts primarily to manage and/or gain exposure to certain foreign currencies. A forward exchange contract is an agreement between the Fund and a counterparty to buy or sell a foreign currency for a specific exchange rate on a future date. Pursuant to the terms of the forward exchange contracts, cash or securities may be required to be deposited as collateral. Unrestricted cash may be invested according to the Fund’s investment objectives.
The Fund entered into OTC interest rate swap contracts primarily to manage interest rate risk. An interest rate swap is an agreement between the Fund and a counterparty to exchange cash flows based on the difference between two interest rates, applied to a notional principal amount. Over the term of the contract, contractually required payments to be paid and to be received are accrued daily and recorded as unrealized depreciation and appreciation until the payments are made, at which time they are realized. Pursuant to the terms of the interest rate swap contract, cash or securities may be required to be deposited as collateral. Unrestricted cash may be invested according to the Fund’s investment objectives.
At December 31, 2012, the Fund held $11,821,933 in United Kingdom treasury bonds and notes, and U.S. treasury bills, bonds, and notes, and $1,910,000 in unrestricted cash as collateral for derivatives.
See Note 9 regarding other derivative information.
e. Restricted Cash
At December 31, 2012, the Fund held restricted cash in connection with investments in certain derivative securities. Restricted cash is held in a segregated account with the counterparty broker and is reflected in the Statement of Assets and Liabilities.
f. Income and Deferred Taxes
It is the Fund’s policy to qualify as a regulated investment company under the Internal Revenue Code. The Fund intends to distribute to shareholders substantially all of its taxable income and net realized gains to relieve it from federal income and if applicable, excise taxes. As a result, no provision for U.S. federal income taxes is required.
The Fund may be subject to foreign taxation related to income received, capital gains on the sale of securities and certain foreign currency transactions in the foreign jurisdictions in which it invests. Foreign taxes, if any, are recorded based on the tax regulations and rates that exist in the foreign markets in which the Fund invests. When a capital gain tax is determined to apply the Fund records an estimated deferred tax liability in an amount that would be payable if the securities were disposed of on the valuation date.
TGB-31
Franklin Templeton Variable Insurance Products Trust
Notes to Financial Statements (continued)
Templeton Global Bond Securities Fund
1. ORGANIZATION AND SIGNIFICANT ACCOUNTING POLICIES (continued)
f. Income and Deferred Taxes (continued)
The Fund recognizes the tax benefits of uncertain tax positions only when the position is “more likely than not” to be sustained upon examination by the tax authorities based on the technical merits of the tax position. As of December 31, 2012, and for all open tax years, the Fund has determined that no liability for unrecognized tax benefits is required in the Fund’s financial statements related to uncertain tax positions taken on a tax return (or expected to be taken on future tax returns). Open tax years are those that remain subject to examination and are based on each tax jurisdiction statute of limitation.
g. Security Transactions, Investment Income, Expenses and Distributions
Security transactions are accounted for on trade date. Realized gains and losses on security transactions are determined on a specific identification basis. Interest income and estimated expenses are accrued daily. Amortization of premium and accretion of discount on debt securities are included in interest income. Distributions to shareholders are recorded on the ex-dividend date and are determined according to income tax regulations (tax basis). Distributable earnings determined on a tax basis may differ from earnings recorded in accordance with accounting principles generally accepted in the United States of America. These differences may be permanent or temporary. Permanent differences are reclassified among capital accounts to reflect their tax character. These reclassifications have no impact on net assets or the results of operations. Temporary differences are not reclassified, as they may reverse in subsequent periods.
Common expenses incurred by the Trust are allocated among the funds based on the ratio of net assets of each fund to the combined net assets of the Trust. Fund specific expenses are charged directly to the fund that incurred the expense.
Realized and unrealized gains and losses and net investment income, not including class specific expenses, are allocated daily to each class of shares based upon the relative proportion of net assets of each class. Differences in per share distributions, by class, are generally due to differences in class specific expenses.
Inflation-indexed bonds are adjusted for inflation through periodic increases or decreases in the security’s interest accruals, face amount, or principal redemption value, by amounts corresponding to the rate of inflation as measured by an index. Any increase or decrease in the face amount or principal redemption value will be included as interest income on the Statement of Operations.
h. Accounting Estimates
The preparation of financial statements in accordance with accounting principles generally accepted in the United States of America requires management to make estimates and assumptions that affect the reported amounts of assets and liabilities at the date of the financial statements and the amounts of income and expenses during the reporting period. Actual results could differ from those estimates.
i. Redemption Fees
Redemptions and exchanges of interests in an insurance company subaccount that invests in Class 3 shares of the Fund will be subject to a 1.0% short term trading fee if the interest in the subaccount has been held for less than 60 days. Such fees are retained by the Fund and accounted for as an addition to paid-in capital, allocated to each class of shares based upon the relative proportion of net assets of each class.
TGB-32
Franklin Templeton Variable Insurance Products Trust
Notes to Financial Statements (continued)
Templeton Global Bond Securities Fund
1. ORGANIZATION AND SIGNIFICANT ACCOUNTING POLICIES (continued)
j. Guarantees and Indemnifications
Under the Trust’s organizational documents, its officers and trustees are indemnified by the Trust against certain liabilities arising out of the performance of their duties to the Trust. Additionally, in the normal course of business, the Trust, on behalf of the Fund, enters into contracts with service providers that contain general indemnification clauses. The Trust’s maximum exposure under these arrangements is unknown as this would involve future claims that may be made against the Trust that have not yet occurred. Currently, the Trust expects the risk of loss to be remote.
2. SHARES OF BENEFICIAL INTEREST
At December 31, 2012, there were an unlimited number of shares authorized (without par value). Transactions in the Fund’s shares were as follows:
| | | | | | | | | | | | | | | | |
| | | Year Ended December 31, | |
| | | 2012 | | | 2011 | |
| Class 1 Shares: | | Shares | | | Amount | | | Shares | | | Amount | |
Shares sold | | | 2,650,014 | | | $ | 51,366,352 | | | | 2,403,657 | | | $ | 47,343,365 | |
Shares issued in reinvestment of distributions | | | 1,028,604 | | | | 18,453,147 | | | | 889,172 | | | | 17,445,546 | |
Shares redeemed | | | (2,823,320 | ) | | | (54,404,201 | ) | | | (2,450,491 | ) | | | (47,617,531 | ) |
| | | | |
Net increase (decrease) | | | 855,298 | | | $ | 15,415,298 | | | | 842,338 | | | $ | 17,171,380 | |
| | | | |
Class 2 Shares: | | | | | | | | | | | | | | | | |
Shares sold | | | 28,727,828 | | | $ | 540,675,595 | | | | 29,318,184 | | | $ | 564,580,203 | |
Shares issued in reinvestment of distributions | | | 7,843,692 | | | | 137,107,730 | | | | 5,473,480 | | | | 104,871,884 | |
Shares redeemed | | | (12,232,820 | ) | | | (229,259,272 | ) | | | (11,438,342 | ) | | | (218,085,708 | ) |
| | | | |
Net increase (decrease) | | | 24,338,700 | | | $ | 448,524,053 | | | | 23,353,322 | | | $ | 451,366,379 | |
| | | | |
Class 3 Shares: | | | | | | | | | | | | | | | | |
Shares sold | | | 835,292 | | | $ | 15,856,382 | | | | 1,851,973 | | | $ | 36,090,442 | |
Shares issued in reinvestment of distributions | | | 710,200 | | | | 12,421,403 | | | | 626,622 | | | | 12,006,087 | |
Shares redeemed | | | (1,613,494 | ) | | | (30,338,250 | ) | | | (1,654,785 | ) | | | (31,390,056 | ) |
| | | | |
Net increase (decrease) | | | (68,002 | ) | | $ | (2,060,465 | ) | | | 823,810 | | | $ | 16,706,473 | |
| | | | |
Class 4 Shares: | | | | | | | | | | | | | | | | |
Shares sold | | | 871,336 | | | $ | 16,701,133 | | | | 1,191,215 | | | $ | 23,562,082 | |
Shares issued on reinvestment of distributions | | | 562,284 | | | | 10,014,286 | | | | 494,660 | | | | 9,635,982 | |
Shares redeemed | | | (1,421,448 | ) | | | (27,110,149 | ) | | | (1,090,109 | ) | | | (21,071,344 | ) |
| | | | |
Net increase (decrease) | | | 12,172 | | | $ | (394,730 | ) | | | 595,766 | | | $ | 12,126,720 | |
| | | | |
3. TRANSACTIONS WITH AFFILIATES
Franklin Resources, Inc. is the holding company for various subsidiaries that together are referred to as Franklin Templeton Investments. Certain officers and trustees of the Fund are also officers and/or directors of the following subsidiaries:
| | |
| Subsidiary | | Affiliation |
Franklin Advisers, Inc. (Advisers) | | Investment manager |
Franklin Templeton Services, LLC (FT Services) | | Administrative manager |
Franklin Templeton Distributors, Inc. (Distributors) | | Principal underwriter |
Franklin Templeton Investor Services, LLC (Investor Services) | | Transfer agent |
TGB-33
Franklin Templeton Variable Insurance Products Trust
Notes to Financial Statements (continued)
Templeton Global Bond Securities Fund
3. TRANSACTIONS WITH AFFILIATES (continued)
a. Management Fees
The Fund pays an investment management fee to Advisers based on the average daily net assets of the Fund as follows:
| | |
| Annualized Fee Rate | | Net Assets |
| 0.625% | | Up to and including $100 million |
| 0.500% | | Over $100 million, up to and including $250 million |
| 0.450% | | Over $250 million, up to and including $7.5 billion |
| 0.440% | | Over $7.5 billion, up to and including $10 billion |
| 0.430% | | Over $10 billion, up to and including $12.5 billion |
| 0.420% | | Over $12.5 billion, up to and including $15 billion |
| 0.400% | | In excess of $15 billion |
b. Administrative Fees
FT Services, under terms of an agreement, provides administrative services to the Fund and is not paid by the Fund for the services.
c. Distribution Fees
The Board has adopted distribution plans for Class 2, Class 3, and Class 4 shares pursuant to Rule 12b-1 under the 1940 Act. Under the Fund’s compensation distribution plans, the Fund pays Distributors for costs incurred in connection with the servicing, sale and distribution of the Fund’s shares up to 0.25%, 0.35%, and 0.35% per year of its average daily net assets of Class 2, Class 3, and Class 4, respectively. Some distribution fees are not charged on shares held by affiliates. The Board has agreed to limit the current rate to 0.25% per year for Class 3.
d. Transfer Agent Fees
Investor Services, under terms of an agreement, performs shareholder servicing for the Fund and is not paid by the Fund for the services.
4. EXPENSE OFFSET ARRANGEMENT
The Fund has entered into an arrangement with its custodian whereby credits realized as a result of uninvested cash balances are used to reduce a portion of the Fund’s custodian expenses. During the year ended December 31, 2012, there were no credits earned.
5. INCOME TAXES
The tax character of distributions paid during the years ended December 31, 2012 and 2011, was as follows:
| | | | | | | | |
| | | 2012 | | | 2011 | |
Distributions paid from: | | | | | | | | |
Ordinary income | | $ | 173,642,707 | | | $ | 130,777,554 | |
Long term capital gain | | | 4,353,858 | | | | 13,181,945 | |
| | | | |
| | $ | 177,996,565 | | | $ | 143,959,499 | |
| | | | |
TGB-34
Franklin Templeton Variable Insurance Products Trust
Notes to Financial Statements (continued)
Templeton Global Bond Securities Fund
5. INCOME TAXES (continued)
At December 31, 2012, the cost of investments, net unrealized appreciation (depreciation), undistributed ordinary income and undistributed long term capital gains for income tax purposes were as follows:
| | | | |
Cost of investments | | $ | 2,810,959,083 | |
| | | | |
Unrealized appreciation | | $ | 205,509,737 | |
Unrealized depreciation | | | (32,870,475 | ) |
| | | | |
Net unrealized appreciation (depreciation) | | $ | 172,639,262 | |
| | | | |
Undistributed ordinary income | | $ | 158,975,479 | |
Undistributed long term capital gains | | | 41,147,064 | |
| | | | |
Distributable earnings | | $ | 200,122,543 | |
| | | | |
Differences between income and/or capital gains as determined on a book basis and a tax basis are primarily due to differing treatments of foreign currency transactions, bond discounts and premiums, and tax straddles.
6. INVESTMENT TRANSACTIONS
Purchases and sales of investments (excluding short term securities) for the year ended December 31, 2012, aggregated $986,415,380 and $891,340,713, respectively.
7. CREDIT RISK
At December 31, 2012, the Fund had 29.35% of its portfolio invested in high yield or other securities rated below investment grade. These securities may be more sensitive to economic conditions causing greater price volatility and are potentially subject to a greater risk of loss due to default than higher rated securities.
8. CONCENTRATION OF RISK
Investing in foreign securities may include certain risks and considerations not typically associated with investing in U.S. securities, such as fluctuating currency values and changing local and regional economic, political and social conditions, which may result in greater market volatility. In addition, certain foreign securities may not be as liquid as U.S. securities.
9. OTHER DERIVATIVE INFORMATION
At December 31, 2012, the Fund’s investments in derivative contracts are reflected on the Statement of Assets and Liabilities as follows:
| | | | | | | | | | | | |
| | | Asset Derivatives | | | Liability Derivatives | |
Derivative Contracts Not Accounted
for as Hedging Instruments | | Statement of Assets and
Liabilities Location | | Fair
Value
Amount | | | Statement of Assets and
Liabilities Location | | Fair
Value
Amount | |
Interest rate contracts | | Unrealized appreciation on swap contracts | | $ | — | | | Unrealized depreciation on swap contracts/Net assets consist of – net unrealized appreciation (depreciation) | | $ | 10,464,399 | |
Foreign exchange contracts | | Unrealized appreciation on forward exchange contracts/Net assets consist of – net unrealized appreciation (depreciation) | | | 63,288,268 | | | Unrealized depreciation on forward exchange contracts/Net assets consist of – net unrealized appreciation (depreciation) | | | 31,846,618 | |
TGB-35
Franklin Templeton Variable Insurance Products Trust
Notes to Financial Statements (continued)
Templeton Global Bond Securities Fund
9. OTHER DERIVATIVE INFORMATION (continued)
For the year ended December 31, 2012, the effect of derivative contracts on the Fund’s Statement of Operations was as follows:
| | | | | | | | | | |
Derivative Contracts Not Accounted
for as Hedging Instruments | | Statement of Operations Locations | | Realized Gain
(Loss) for the
Year | | | Change in Unrealized
Appreciation
(Depreciation) for the
Year | |
Interest rate contracts | | Net realized gain (loss) from swap contracts/Net change in unrealized appreciation (depreciation) on investments | | $ | (1,412,791 | ) | | $ | 569,200 | |
Foreign exchange contracts | | Net realized gain (loss) from foreign currency transactions/Net change in unrealized appreciation (depreciation) on translation of other assets and liabilities denominated in foreign currencies | | | 83,759,871 | | | | 17,445,494 | |
For the year ended December 31, 2012, the average month end market value of derivatives represented 3.45% of average month end net assets. The average month end number of open derivative contracts for the year was 447.
See Note 1(d) regarding derivative financial instruments.
10. CREDIT FACILITY
The Fund, together with other U.S. registered and foreign investment funds (collectively, Borrowers), managed by Franklin Templeton Investments, are borrowers in a joint syndicated senior unsecured credit facility totaling $1.5 billion (Global Credit Facility) which matured on January 18, 2013. This Global Credit Facility provides a source of funds to the Borrowers for temporary and emergency purposes, including the ability to meet future unanticipated or unusually large redemption requests. Effective January 18, 2013, the Borrowers renewed the Global Credit Facility which matures on January 17, 2014.
Under the terms of the Global Credit Facility, the Fund shall, in addition to interest charged on any borrowings made by the Fund and other costs incurred by the Fund, pay its share of fees and expenses incurred in connection with the implementation and maintenance of the Global Credit Facility, based upon its relative share of the aggregate net assets of all of the Borrowers, including an annual commitment fee of 0.07% based upon the unused portion of the Global Credit Facility. These fees are reflected in other expenses on the Statement of Operations. During the year ended December 31, 2012, the Fund did not use the Global Credit Facility.
11. FAIR VALUE MEASUREMENTS
The Fund follows a fair value hierarchy that distinguishes between market data obtained from independent sources (observable inputs) and the Fund’s own market assumptions (unobservable inputs). These inputs are used in determining the value of the Fund’s financial instruments and are summarized in the following fair value hierarchy:
| | • | | Level 1 – quoted prices in active markets for identical financial instruments |
| | • | | Level 2 – other significant observable inputs (including quoted prices for similar financial instruments, interest rates, prepayment speed, credit risk, etc.) |
| | • | | Level 3 – significant unobservable inputs (including the Fund’s own assumptions in determining the fair value of financial instruments) |
TGB-36
Franklin Templeton Variable Insurance Products Trust
Notes to Financial Statements (continued)
Templeton Global Bond Securities Fund
11. FAIR VALUE MEASUREMENTS (continued)
The inputs or methodology used for valuing financial instruments are not an indication of the risk associated with investing in those financial instruments.
For movements between the levels within the fair value hierarchy, the Fund has adopted a policy of recognizing the transfers as of the date of the underlying event which caused the movement.
A summary of inputs used as of December 31, 2012, in valuing the Fund’s assets and liabilities carried at fair value, is as follows:
| | | | | | | | | | | | | | | | |
| | | Level 1 | | | Level 2 | | | Level 3 | | | Total | |
| | | | |
Assets: | | | | | | | | | | | | | | | | |
Investments in Securities: | | | | | | | | | | | | | | | | |
Foreign Government and Agency Securities | | $ | — | | | $ | 2,138,936,223 | | | $ | — | | | $ | 2,138,936,223 | |
Municipal Bonds | | | — | | | | 1,630,119 | | | | — | | | | 1,630,119 | |
Short Term Investments | | | — | | | | 843,032,003 | | | | — | | | | 843,032,003 | |
| | | | |
Total Investments in Securities | | $ | — | | | $ | 2,983,598,345 | | | $ | — | | | $ | 2,983,598,345 | |
| | | | |
Forward Exchange Contracts | | | — | | | | 63,288,268 | | | | — | | | | 63,288,268 | |
Liabilities: | | | | | | | | | | | | | | | | |
Swaps | | | — | | | | 10,464,399 | | | | — | | | | 10,464,399 | |
Forward Exchange Contracts | | | — | | | | 31,846,618 | | | | — | | | | 31,846,618 | |
12. NEW ACCOUNTING PRONOUNCEMENTS
In December 2011, the Financial Accounting Standards Board (FASB) issued Accounting Standards Update (ASU) No. 2011-11, Balance Sheet (Topic 210): Disclosures about Offsetting Assets and Liabilities. The amendments in the ASU enhance disclosures about offsetting of financial assets and liabilities to enable investors to understand the effect of these arrangements on a fund’s financial position. In January 2013, FASB issued ASU No. 2013-01, Balance Sheet (Topic 210): Clarifying the Scope of Disclosures about Offsetting Assets and Liabilities. The amendments in ASU No. 2013-01 clarify the intended scope of disclosures required by ASU No. 2011-11. These ASUs are effective for interim and annual reporting periods beginning on or after January 1, 2013. The Fund believes the adoption of these ASUs will not have a material impact on its financial statements.
13. SUBSEQUENT EVENTS
The Fund has evaluated subsequent events through the issuance of the financial statements and determined that no events have occurred that require disclosure other than those already disclosed in the financial statements.
TGB-37
Franklin Templeton Variable Insurance Products Trust
Notes to Financial Statements (continued)
Templeton Global Bond Securities Fund
| | | | |
ABBREVIATIONS | | | | |
| Counterparty | | Currency | | Selected Portfolio |
| | | | |
| BZWS - Barclays Bank PLC | | AUD - Australian Dollar | | BHAC - Berkshire Hathaway Assurance Corp. |
| CITI - Citigroup, Inc. | | BRL - Brazilian Real | | FRN - Floating Rate Note |
| DBAB - Deutsche Bank AG | | EUR - Euro | | |
| FBCO - Credit Suisse Group AG | | HUF - Hungarian Forint | | |
| GSCO - Goldman Sachs Bank | | IDR - Indonesian Rupiah | | |
| HSBC - HSBC Bank USA, N.A. | | ILS - New Israeli Shekel | | |
| JPHQ - JP Morgan Chase & Co. | | JPY - Japanese Yen | | |
| MSCO - Morgan Stanley | | KRW - South Korean Won | | |
| UBSW - UBS AG | | LKR - Sri Lankan Rupee | | |
| | MXN - Mexican Peso | | |
| | MYR - Malaysian Ringgit | | |
| | NOK - Norwegian Krone | | |
| | PEN - Peruvian Nuevo Sol | | |
| | PHP - Philippine Peso | | |
| | PLN - Polish Zloty | | |
| | SEK - Swedish Krona | | |
| | SGD - Singapore Dollar | | |
TGB-38
Franklin Templeton Variable Insurance Products Trust
Templeton Global Bond Securities Fund
Report of Independent Registered Public Accounting Firm
To the Board of Trustees and Shareholders of
Franklin Templeton Variable Insurance Products Trust
In our opinion, the accompanying statement of assets and liabilities, including the statement of investments, and the related statements of operations and of changes in net assets and the financial highlights present fairly, in all material respects, the financial position of Templeton Global Bond Securities Fund (the “Fund”) at December 31, 2012, the results of its operations for the year then ended, the changes in its net assets for each of the two years in the period then ended and the financial highlights for each of the five years in the period then ended, in conformity with accounting principles generally accepted in the United States of America. These financial statements and financial highlights (hereafter referred to as “financial statements”) are the responsibility of the Fund’s management. Our responsibility is to express an opinion on these financial statements based on our audits. We conducted our audits of these financial statements in accordance with the standards of the Public Company Accounting Oversight Board (United States). Those standards require that we plan and perform the audit to obtain reasonable assurance about whether the financial statements are free of material misstatement. An audit includes examining, on a test basis, evidence supporting the amounts and disclosures in the financial statements, assessing the accounting principles used and significant estimates made by management, and evaluating the overall financial statement presentation. We believe that our audits, which included confirmation of securities at December 31, 2012 by correspondence with the custodian, transfer agent and brokers, provide a reasonable basis for our opinion.
PricewaterhouseCoopers LLP
San Francisco, California
February 15, 2013
TGB-39
Franklin Templeton Variable Insurance Products Trust
Tax Information (unaudited)
Templeton Global Bond Securities Fund
Under Section 852(b)(3)(C) of the Internal Revenue Code (Code), the Fund hereby reports the maximum amount allowable but no less than $4,353,858 of long term capital gain dividend for the fiscal year ended December 31, 2012.
At December 31, 2012, more than 50% of the Fund’s total assets were invested in securities of foreign issuers. In most instances, foreign taxes were withheld from income paid to the Fund on these investments. The Fund elects to treat foreign taxes paid as allowed under Section 853 of the Code. This election will allow shareholders of record as of the 2013 distribution date, to treat their proportionate share of foreign taxes paid by the Fund as having been paid directly by them. The shareholder shall consider these amounts as foreign taxes paid in the tax year in which they receive the Fund distribution.
TGB-40
TEMPLETON GROWTH SECURITIES FUND
We are pleased to bring you Templeton Growth Securities Fund’s annual report for the fiscal year ended December 31, 2012.
Performance Summary as of 12/31/12
Average annual total return of Class 2 shares represents the average annual change in value, assuming reinvestment of dividends and capital gains. Average returns smooth out variations in returns, which can be significant; they are not the same as year-by-year results.
Periods ended 12/31/12
| | | | | | | | | | | | |
| | | 1-Year | | | 5-Year | | | 10-Year | |
Average Annual Total Return | | | +21.07% | | | | -1.77% | | | | +6.65% | |
Total Return Index Comparison for a Hypothetical $10,000 Investment (1/1/03–12/31/12)
The graph below shows the change in value of a hypothetical $10,000 investment in the Fund over the indicated period and includes reinvestment of any income or distributions. The Fund’s performance is compared to the performance of the MSCI World Index and the MSCI All Country World Index (ACWI). One cannot invest directly in an index, and an index is not representative of the Fund’s portfolio. Please see Important Notes to Performance Information preceding the Fund Summaries.
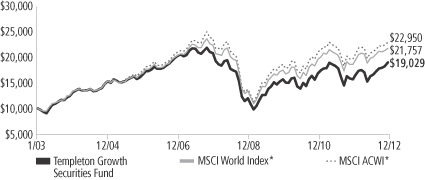
*Source: © 2013 Morningstar. Please see Index Descriptions following the Fund Summaries.
Templeton Growth Securities Fund – Class 2
Performance reflects the Fund’s Class 2 operating expenses, but does not include any contract fees, expenses or sales charges. If they had been included, performance would be lower. These charges and deductions, particularly for variable life policies, can have a significant effect on contract values and insurance benefits. See the contract prospectus for a complete description of these expenses, including sales charges.
Performance data represent past performance, which does not guarantee future results. Investment return and principal value will fluctuate, and you may have a gain or loss when you sell your shares.
Current performance may differ from figures shown.
TG-1
Fund Goal and Main Investments: Templeton Growth Securities Fund seeks long-term capital growth. Under normal market conditions, the Fund invests primarily in equity securities of companies located anywhere in the world, including those in the U.S. and in emerging markets.
Performance Overview
You can find the Fund’s one-year total return in the Performance Summary. The Fund outperformed the MSCI ACWI’s +16.80% total return and the MSCI World Index’s +16.54% total return for the same period.1
Economic and Market Overview
Global developed and emerging stocks, as measured by the MSCI ACWI, rallied through the spring of 2012 before a brief drop in early summer gave way to a recovery, leading to solid 12-month gains. Periodic downturns were primarily attributable to concerns about slowing global economic growth, European sovereign debt and U.S. fiscal negotiations. The market’s focus early in 2012 was Europe’s debt crisis. Seeking to address it, relatively new leaders in Italy and Greece and for the International Monetary Fund, World Bank and European Central Bank (ECB) offered plans for stability and growth. The leadership’s initial policy responses — which included enhanced liquidity measures and an ineffective Spanish banking bailout — did little to address the structural imbalances of eurozone economies or the solvency fears plaguing the region’s banking system. Thus, debt yields for certain countries spiked to record levels in the first quarter of 2012. However, measures intended to address the seemingly toxic link between Europe’s banks and sovereign bonds emerged when European Union leaders agreed to a deployment of temporary and permanent bailout funds. ECB President Mario Draghi’s declaration that “the ECB is ready to do whatever it takes to preserve the euro” further buoyed markets.
In the U.S., the Federal Reserve Board announced additional rounds of quantitative easing and opted to extend its strategy designed to lower systemically important interest rates. In Asia, the People’s Bank of China cut borrowing costs for the first time since the global financial crisis began, and the Bank of Japan launched its eighth round of quantitative easing in little more than a decade. Headwinds to growth negatively affected most world regions during 2012, including recently resilient emerging markets, and the International Monetary Fund
1. Source: © 2013 Morningstar. One cannot invest directly in an index, and an index is not representative of the Fund’s portfolio. Please see Index Descriptions following the Fund Summaries.
Fund Risks: Special risks are associated with foreign investing, including currency fluctuations, economic instability and political developments; investments in emerging markets involve heightened risks related to the same factors. To the extent the Fund focuses on particular countries, regions, industries, sectors or types of investment from time to time, it may be subject to greater risks of adverse developments in such areas of focus than a fund that invests in a wider variety of countries, regions, industries, sectors or investments. Current political uncertainty surrounding the European Union (EU) and its membership may increase market volatility. The financial instability of some countries in the EU, including Greece, Italy and Spain, together with the risk of that impacting other more stable countries, may increase the economic risk of investing in companies in Europe. The Fund is actively managed but there is no guarantee that the manager’s investment decisions will produce the desired results. The Fund’s prospectus also includes a description of the main investment risks.
TG-2
lowered its global growth outlook. However, the slowdown appeared less severe than expected in developed markets such as Germany and the U.S. In the latter half of 2012, policy measures seemed to take hold and supported global economic recovery, contributing to expansion in the U.S. and many emerging market countries as well as a slowing rate of contraction in Europe. Toward year-end, investor focus shifted to the U.S., where policymakers sought to avert automatic spending cuts and tax hikes, commonly known as the “fiscal cliff.” Just after year-end, Congress passed compromise legislation that preserved lower income tax rates for most U.S. households and delayed far-reaching federal spending cuts. Despite adversity and uncertainty throughout the 12-month period, virtually all major asset classes finished 2012 with positive returns.
Investment Strategy
Our investment philosophy is bottom up, value oriented and long term. In choosing investments, we will focus on the market price of a company’s securities relative to our evaluation of the company’s potential long-term earnings, asset value and cash flow. Among factors we may consider are a company’s historical value measures, including price/earnings ratio, profit margins and liquidation value. We do in-depth research to construct a bargain list from which we buy.
Manager’s Discussion
All major stock sectors in the MSCI ACWI and the Fund delivered positive returns in 2012. Although weak sentiment in early 2012 left many investors ill-prepared for the stock market rally, our value discipline positioned the Fund in low valued stocks with what we viewed as the greatest potential for appreciation, and the Fund performed well.
Stock selection was the primary contributor to the Fund’s performance relative to the benchmark, with some of the Fund’s highest conviction, long-term holdings delivering healthy returns. The Fund’s overweighted consumer discretionary sector holdings were major absolute and relative contributors to performance, with a particularly strong boost from the media industry.2 U.S cable companies Comcast and Time Warner Cable and content producer News Corp. led returns for the sector. America’s leading cable companies have come to dominate the valuable broadband pipeline permitting bundled delivery of voice, data and video, and content producers have seen a surge in demand for their
2. The consumer discretionary sector comprises auto components, automobiles, media, multiline retail and specialty retail in the SOI.
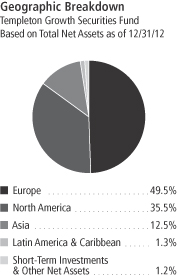
TG-3
products as new devices and opportunities for media consumption proliferate. These media stocks have provided attractive long-term returns for the Fund, and although we are encouraged by their ongoing cash generation and market share consolidation, we believe our largest industry holdings are not as undervalued as in the past. Also from the consumer discretionary sector, French tire maker Michelin rallied strongly in 2012 as earnings beat expectations after sales improved for high-margin specialty tires for agriculture and mining equipment.3
Stock selection in the financials sector also supported relative performance, led by European reinsurers and lenders, such as Swiss Re (Switzerland), Muenchener Ruecksversicherungs-Gesellschaft (Munich Reinsurance; Germany) and BNP Paribas (France).4 Reinsurers benefited from lower-than-expected catastrophe levels and judicious underwriting discipline, and could return excess capital to shareholders. BNP Paribas rallied after doubling its third-quarter profit and boosting capital levels. We maintained our favorable view of the global financials sector, in particular European banks. Even after robust gains in 2012, European bank stock performance has still lagged that of U.S. banks since 2009 and remained near two-decade low valuations, suggesting to us further appreciation potential for a sector that has undergone intensive fundamental repair and recapitalization. The Fund’s industrials positions also aided performance as European airlines Deutsche Lufthansa (Germany) and off-benchmark International Consolidated Airlines Group (U.K.) reported improved profits on increased air traffic volume and ongoing restructuring initiatives.5 We purchased these airline stocks at valuations we saw as low amid uncertainty surrounding global economic growth, fuel costs and competitive pressures, and we were encouraged to see managements taking what we viewed as necessary steps to enhance shareholder value.
Long-standing overweighted positions in information technology, telecommunication services and health care also performed well.6 Top
3. Listed as Cie Generale des Etablissements Michelin in the SOI.
4. The financials sector comprises capital markets, commercial banks, consumer finance, diversified financial services and insurance in the SOI.
5. The industrials sector comprises aerospace and defense, airlines, automobiles, chemicals, construction and engineering, construction materials, electrical equipment, industrial conglomerates, machinery, metals and mining, and trading companies and distributors in the SOI.
6. The information technology sector comprises communications equipment; computers and peripherals; electronic equipment, instruments and components; semiconductors and semiconductor equipment; and software in the SOI. The telecommunication services sector comprises diversified telecommunication services and wireless telecommunication services in the SOI. The health care sector comprises biotechnology, life sciences tools and services, and pharmaceuticals in the SOI.
Top 10 Holdings
Templeton Growth Securities Fund
12/31/12
| | | | |
Company
Sector/Industry,
Country | | % of Total Net Assets | |
| Samsung Electronics Co. Ltd. | | | 2.9% | |
| Semiconductors & Semiconductor Equipment, South Korea | | | | |
| Pfizer Inc. | | | 2.1% | |
| Pharmaceuticals, U.S. | |
| Sanofi | | | 2.0% | |
| Pharmaceuticals, France | |
| Deutsche Lufthansa AG | | | 1.8% | |
| Airlines, Germany | |
| Roche Holding AG | | | 1.8% | |
| Pharmaceuticals, Switzerland | |
| Amgen Inc. | | | 1.8% | |
| Biotechnology, U.S. | |
| ING Groep NV | | | 1.7% | |
| Diversified Financial Services, Netherlands | | | | |
| Total SA, B | | | 1.7% | |
| Oil, Gas & Consumable Fuels, France | | | | |
| Comcast Corp., Special A | | | 1.7% | |
| Media, U.S. | |
| GlaxoSmithKline PLC | | | 1.6% | |
| Pharmaceuticals, U.K. | | | | |
The dollar value, number of shares or principal amount, and names of all portfolio holdings are listed in the Fund’s Statement of Investments (SOI).
TG-4
performing technology stocks included hardware manufacturer Seagate Technology7 and semiconductor and consumer electronics manufacturer Samsung Electronics (South Korea). Our analysis identified what we viewed as tremendous cash-flow generating capabilities and the cleanest balance sheets of any global sector for certain technology companies, which prospered as customers targeting cost efficiencies prioritized productivity-enhancing investments over capacity-enhancing capital expenditures. Our analysis indicated the sector has become more fully valued and we selectively reduced exposure to information technology during the period.
Telecommunication services stocks, in contrast, remained undervalued in our view as regulatory and competitive issues and anemic revenue growth kept the sector out of favor, allowing us to buy companies we saw as highly profitable and having healthy dividend yields at depressed valuations. Although the Fund’s overweighted position in the unpopular sector weighed on relative performance, stock selection added value. Sprint Nextel, a U.S. mobile operator, was a top performer, more than doubling in value during the year. Management responded to investors’ liquidity concerns by cutting costs, tapping debt markets and securing vendor financing; however, the stock appeared unduly cheap to us, and Japanese telecom Softbank acquired a majority stake in the company in October. We believe Sprint could benefit from the firm’s upcoming iPhone offering and transition to a new 4G network, which could continue to reduce the company’s inflated cost base and stem subscriber defections. We believe the unpopularity of telecommunications stocks has created opportunities to acquire shares in highly profitable telecommunications companies with diverse revenue streams and healthy dividend yields at bargain valuations.
Health care sector positions, also a Fund overweighting, benefited performance as the sector exhibited greater market strength than telecommunication services. We favored higher growth companies, often with emerging market exposure, such as biotechnology firm Amgen and pharmaceutical maker Sanofi (France), which gets more than one-third of its revenue from emerging markets and has been diversifying its pipeline into longer duration products. Amgen, the Fund’s top-performing health care stock in 2012, is an excellent example of our approach to the sector. When we first purchased the stock five years ago, the market seemed to us overly focused on research and
7. No longer held at period-end.
TG-5
development risks and slowing top line growth, overlooking Amgen’s ability to generate cash and develop new products over the long run. Since then, the company has demonstrated an ability to manage its maturing product portfolio while spurring pipeline innovation and prioritizing shareholder returns, and the stock price rose to a new high.
Overweighted energy stocks were laggards as positions generally declined because of weaker oil prices and a North American natural gas glut.8 These conditions reduced demand for drilling rigs and equipment, pressuring U.S. oilfield services provider Baker Hughes, a sector laggard in 2012. However, in our view the stock remains attractively valued and management is pursuing a sensible strategy that could position Baker well for both a domestic recovery and international growth opportunities. We also believe some exploration and production and oil services firms with advanced technology, sound capital discipline and operational flexibility can gain market share as hydrocarbon extraction moves to increasingly challenging and remote locations. Stock-specific weakness in consumer staples also weighed on results as U.K. grocer Tesco declined considerably in January 2012 after warning that the increased capital expenditures required to win back customers would likely result in lower near-term profits.9 We believe Tesco’s investments could help the company retain market share in its domestic environment, and that international expansion and a proactive move toward online retailing remain underappreciated potential growth drivers. Elsewhere in the consumer staples sector, value opportunities remained elusive. Food and personal product manufacturer stocks appeared overvalued to us, with investors willing to pay a premium for the industry’s perceived mix of defensive characteristics and emerging market exposure, while food retailers, which may appear cheap to some, struggled to redefine their model amid increasing industry fragmentation.
Geographically, all major regions helped the Fund, particularly overweighting in the eurozone and stock selection in the U.S. and Asia ex-Japan. However, stock selection in Spain, Sweden and the U.K. hurt relative performance. At the end of 2012, Europe remained the Fund’s largest relative and absolute allocation. Despite producing some leading-market returns in 2012, developed Europe was still home to eight of the world’s 10 cheapest markets (on cyclically adjusted price-to-earnings ratios) at period-end. The region’s dramatic policy
8. The energy sector comprises energy equipment and services; and oil, gas and consumable fuels in the SOI.
9. The consumer staples sector comprises food and staples retailing in the SOI.
TG-6
progress has made European stocks more attractive to many investors, mainly through the European Central Bank’s efforts to neutralize tail risks with unconventional monetary tools to repair sovereign balance sheets via fiscal austerity. Although challenges remain, we are still favorable toward Europe in light of what we see as the region’s fundamental stabilization and many inexpensive, high-yielding stocks with global revenue streams.
Thank you for your participation in Templeton Growth Securities Fund. We look forward to serving your future investment needs.
The foregoing information reflects our analysis, opinions and portfolio holdings as of December 31, 2012, the end of the reporting period. The way we implement our main investment strategies and the resulting portfolio holdings may change depending on factors such as market and economic conditions. These opinions may not be relied upon as investment advice or an offer for a particular security. The information is not a complete analysis of every aspect of any market, country, industry, security or the Fund. Statements of fact are from sources considered reliable, but the investment manager makes no representation or warranty as to their completeness or accuracy. Although historical performance is no guarantee of future results, these insights may help you understand our investment management philosophy.
TG-7
Fund Expenses
As an investor in a variable insurance contract (Contract) that indirectly provides for investment in an underlying mutual fund, you can incur transaction and/or ongoing expenses at both the Fund level and the Contract level.
| • | | Transaction expenses can include sales charges (loads) on purchases, redemption fees, surrender fees, transfer fees and premium taxes. |
| • | | Ongoing expenses can include management fees, distribution and service (12b-1) fees, contract fees, annual maintenance fees, mortality and expense risk fees and other fees and expenses. All mutual funds and Contracts have some types of ongoing expenses. |
The expenses shown in the table are meant to highlight ongoing expenses at the Fund level only and do not include ongoing expenses at the Contract level, or transaction expenses at either the Fund or Contract level. While the Fund does not have transaction expenses, if the transaction and ongoing expenses at the Contract level were included, the expenses shown below would be higher. You should consult your Contract prospectus or disclosure document for more information.
The table shows Fund-level ongoing expenses and can help you understand these expenses and compare them with those of other mutual funds offered through the Contract. The table assumes a $1,000 investment held for the six months indicated. Please refer to the Fund prospectus for additional information on operating expenses.
Actual Fund Expenses
The first line (Actual) of the table provides actual account values and expenses. The “Ending Account Value” is derived from the Fund’s actual return, which includes the effect of ongoing Fund expenses, but does not include the effect of ongoing Contract expenses.
You can estimate the Fund-level expenses you incurred during the period by following these steps. Of course, your account value and expenses will differ from those in this illustration:
| 1. | Divide your account value by $1,000. |
If an account had an $8,600 value, then $8,600 ÷ $1,000 = 8.6.
| 2. | Multiply the result by the number under the heading “Fund-Level Expenses Incurred During Period.” |
If Fund-Level Expenses Incurred During Period were $7.50, then 8.6 x $7.50 = $64.50.
In this illustration, the estimated expenses incurred this period at the Fund level are $64.50.
Templeton Growth Securities Fund – Class 2
TG-8
Hypothetical Example for Comparison with Other Mutual Funds
Information in the second line (Hypothetical) of the table can help you compare ongoing expenses of the Fund with those of other mutual funds offered through the Contract. This information may not be used to estimate the actual ending account balance or expenses you incurred during the period. The hypothetical “Ending Account Value” is based on the Fund’s actual expense ratio and an assumed 5% annual rate of return before expenses, which does not represent the Fund’s actual return. The figure under the heading “Fund-Level Expenses Incurred During Period” shows the hypothetical expenses your account would have incurred under this scenario. You can compare this figure with the 5% hypothetical examples that appear in shareholder reports of other funds offered through a Contract.
| | | | | | | | | | | | |
| Class 2 | | Beginning
Account Value 7/1/12 | | | Ending
Account Value 12/31/12 | | | Fund-Level Expenses Incurred
During Period* 7/1/12–12/31/12 | |
Actual | | $ | 1,000 | | | $ | 1,163.30 | | | $ | 5.60 | |
Hypothetical (5% return
before expenses) | | $ | 1,000 | | | $ | 1,019.96 | | | $ | 5.23 | |
*Expenses are calculated using the most recent six-month annualized expense ratio for the Fund’s Class 2 shares (1.03%), which does not include any ongoing expenses of the Contract for which the Fund is an investment option, multiplied by the average account value over the period, multiplied by 184/366 to reflect the one-half year period.
TG-9
Franklin Templeton Variable Insurance Products Trust
Financial Highlights
Templeton Growth Securities Fund
| | | | | | | | | | | | | | | | | | | | |
| | | Year Ended December 31, | |
| Class 1 | | 2012 | | | 2011 | | | 2010 | | | 2009 | | | 2008 | |
| | | | |
Per share operating performance | | | | | | | | | | | | | | | | | | | | |
(for a share outstanding throughout the year) | | | | | | | | | | | | | | | | | | | | |
Net asset value, beginning of year | | $ | 10.27 | | | $ | 11.19 | | | $ | 10.56 | | | $ | 8.34 | | | $ | 15.68 | |
| | | | |
Income from investment operationsa: | | | | | | | | | | | | | | | | | | | | |
Net investment incomeb | | | 0.27 | | | | 0.25 | | | | 0.17 | | | | 0.17 | | | | 0.29 | |
Net realized and unrealized gains (losses) | | | 1.88 | | | | (0.99 | ) | | | 0.62 | | | | 2.36 | | | | (6.50 | ) |
| | | | |
Total from investment operations | | | 2.15 | | | | (0.74 | ) | | | 0.79 | | | | 2.53 | | | | (6.21 | ) |
| | | | |
Less distributions from: | | | | | | | | | | | | | | | | | | | | |
Net investment income | | | (0.26 | ) | | | (0.18 | ) | | | (0.16 | ) | | | (0.31 | ) | | | (0.26 | ) |
Net realized gains | | | — | | | | — | | | | — | | | | — | | | | (0.87 | ) |
| | | | |
Total distributions | | | (0.26 | ) | | | (0.18 | ) | | | (0.16 | ) | | | (0.31 | ) | | | (1.13 | ) |
| | | | |
Net asset value, end of year | | $ | 12.16 | | | $ | 10.27 | | | $ | 11.19 | | | $ | 10.56 | | | $ | 8.34 | |
| | | | |
| | | | | |
Total returnc | | | 21.40% | | | | (6.80)% | | | | 7.74% | | | | 31.33% | | | | (42.13)% | |
Ratios to average net assets | | | | | | | | | | | | | | | | | | | | |
Expensesd | | | 0.78% | | | | 0.78% | | | | 0.77% | | | | 0.79% | | | | 0.78% | |
Net investment income | | | 2.31% | | | | 2.22% | | | | 1.71% | | | | 2.00% | | | | 2.64% | |
| | | | | |
Supplemental data | | | | | | | | | | | | | | | | | | | | |
Net assets, end of year (000’s) | | $ | 476,954 | | | $ | 1,200,682 | | | $ | 1,348,622 | | | $ | 824,575 | | | $ | 371,700 | |
Portfolio turnover rate | | | 18.73% | e | | | 42.13% | e | | | 9.61% | | | | 14.95% | | | | 18.37% | |
aThe amount shown for a share outstanding throughout the period may not correlate with the Statement of Operations for the period due to the timing of sales and repurchases of the Fund shares in relation to income earned and/or fluctuating market value of the investments of the Fund.
bBased on average daily shares outstanding.
cTotal return does not include fees, charges or expenses imposed by the variable annuity and life insurance contracts for which the Franklin Templeton Variable Insurance Products Trust serves as an underlying investment vehicle.
dBenefit of expense reduction rounds to less than 0.01%.
eExcludes the value of portfolio securities delivered as a result of a redemption in-kind.
The accompanying notes are an integral part of these financial statements.
TG-10
Franklin Templeton Variable Insurance Products Trust
Financial Highlights (continued)
Templeton Growth Securities Fund
| | | | | | | | | | | | | | | | | | | | |
| | | Year Ended December 31, | |
| Class 2 | | 2012 | | | 2011 | | | 2010 | | | 2009 | | | 2008 | |
| | | | |
Per share operating performance | | | | | | | | | | | | | | | | | | | | |
(for a share outstanding throughout the year) | | | | | | | | | | | | | | | | | | | | |
Net asset value, beginning of year | | $ | 10.11 | | | $ | 11.01 | | | $ | 10.40 | | | $ | 8.20 | | | $ | 15.44 | |
| | | | |
Income from investment operationsa: | | | | | | | | | | | | | | | | | | | | |
Net investment incomeb | | | 0.21 | | | | 0.21 | | | | 0.15 | | | | 0.16 | | | | 0.29 | |
Net realized and unrealized gains (losses) | | | 1.88 | | | | (0.96 | ) | | | 0.60 | | | | 2.32 | | | | (6.44 | ) |
| | | | |
Total from investment operations | | | 2.09 | | | | (0.75 | ) | | | 0.75 | | | | 2.48 | | | | (6.15 | ) |
| | | | |
Less distributions from: | | | | | | | | | | | | | | | | | | | | |
Net investment income | | | (0.23 | ) | | | (0.15 | ) | | | (0.14 | ) | | | (0.28 | ) | | | (0.22 | ) |
Net realized gains | | | — | | | | — | | | | — | | | | — | | | | (0.87 | ) |
| | | | |
Total distributions | | | (0.23 | ) | | | (0.15 | ) | | | (0.14 | ) | | | (0.28 | ) | | | (1.09 | ) |
| | | | |
Net asset value, end of year | | $ | 11.97 | | | $ | 10.11 | | | $ | 11.01 | | | $ | 10.40 | | | $ | 8.20 | |
| | | | |
| | | | | |
Total returnc | | | 21.07% | | | | (6.97)% | | | | 7.39% | | | | 31.10% | | | | (42.32)% | |
Ratios to average net assets | | | | | | | | | | | | | | | | | | | | |
Expensesd | | | 1.03% | | | | 1.03% | | | | 1.02% | | | | 1.04% | | | | 1.03% | |
Net investment income | | | 2.06% | | | | 1.97% | | | | 1.46% | | | | 1.75% | | | | 2.39% | |
| | | | | |
Supplemental data | | | | | | | | | | | | | | | | | | | | |
Net assets, end of year (000’s) | | $ | 1,352,554 | | | $ | 1,254,193 | | | $ | 1,626,885 | | | $ | 1,718,894 | | | $ | 1,513,557 | |
Portfolio turnover rate | | | 18.73% | e | | | 42.13% | e | | | 9.61% | | | | 14.95% | | | | 18.37% | |
aThe amount shown for a share outstanding throughout the period may not correlate with the Statement of Operations for the period due to the timing of sales and repurchases of the Fund shares in relation to income earned and/or fluctuating market value of the investments of the Fund.
bBased on average daily shares outstanding.
cTotal return does not include fees, charges or expenses imposed by the variable annuity and life insurance contracts for which the Franklin Templeton Variable Insurance Products Trust serves as an underlying investment vehicle.
dBenefit of expense reduction rounds to less than 0.01%.
eExcludes the value of portfolio securities delivered as a result of a redemption in-kind.
The accompanying notes are an integral part of these financial statements.
TG-11
Franklin Templeton Variable Insurance Products Trust
Financial Highlights (continued)
Templeton Growth Securities Fund
| | | | | | | | | | | | | | | | | | | | |
| | | Year Ended December 31, | |
| Class 4 | | 2012 | | | 2011 | | | 2010 | | | 2009 | | | 2008a | |
| | | | |
Per share operating performance | | | | | | | | | | | | | | | | | | | | |
(for a share outstanding throughout the year) | | | | | | | | | | | | | | | | | | | | |
Net asset value, beginning of year | | $ | 10.19 | | | $ | 11.11 | | | $ | 10.50 | | | $ | 8.31 | | | $ | 14.08 | |
| | | | |
Income from investment operationsb: | | | | | | | | | | | | | | | | | | | | |
Net investment incomec | | | 0.20 | | | | 0.20 | | | | 0.14 | | | | 0.14 | | | | 0.09 | |
Net realized and unrealized gains (losses) | | | 1.90 | | | | (0.98 | ) | | | 0.61 | | | | 2.36 | | | | (4.73 | ) |
| | | | |
Total from investment operations | | | 2.10 | | | | (0.78 | ) | | | 0.75 | | | | 2.50 | | | | (4.64 | ) |
| | | | |
Less distributions from: | | | | | | | | | | | | | | | | | | | | |
Net investment income | | | (0.22 | ) | | | (0.14 | ) | | | (0.14 | ) | | | (0.31 | ) | | | (0.26 | ) |
Net realized gains | | | — | | | | — | | | | — | | | | — | | | | (0.87 | ) |
| | | | |
Total distributions | | | (0.22 | ) | | | (0.14 | ) | | | (0.14 | ) | | | (0.31 | ) | | | (1.13 | ) |
| | | | |
Net asset value, end of year | | $ | 12.07 | | | $ | 10.19 | | | $ | 11.11 | | | $ | 10.50 | | | $ | 8.31 | |
| | | | |
| | | | | |
Total returnd | | | 21.02% | | | | (7.14)% | | | | 7.31% | | | | 30.98% | | | | (35.79)% | |
Ratios to average net assetse | | | | | | | | | | | | | | | | | | | | |
Expensesf | | | 1.13% | | | | 1.13% | | | | 1.12% | | | | 1.14% | | | | 1.13% | |
Net investment income | | | 1.96% | | | | 1.87% | | | | 1.36% | | | | 1.65% | | | | 2.29% | |
| | | | | |
Supplemental data | | | | | | | | | | | | | | | | | | | | |
Net assets, end of year (000’s) | | $ | 67,158 | | | $ | 56,170 | | | $ | 60,569 | | | $ | 56,218 | | | $ | 24,877 | |
Portfolio turnover rate | | | 18.73% | g | | | 42.13% | g | | | 9.61% | | | | 14.95% | | | | 18.37% | |
aFor the period February 29, 2008 (effective date) to December 31, 2008.
bThe amount shown for a share outstanding throughout the period may not correlate with the Statement of Operations for the period due to the timing of sales and repurchases of the Fund shares in relation to income earned and/or fluctuating market value of the investments of the Fund.
cBased on average daily shares outstanding.
dTotal return does not include fees, charges or expenses imposed by the variable annuity and life insurance contracts for which the Franklin Templeton Variable Insurance Products Trust serves as an underlying investment vehicle. Total return is not annualized for periods less than one year.
eRatios are annualized for periods less than one year.
fBenefit of expense reduction rounds to less than 0.01%.
gExcludes the value of portfolio securities delivered as a result of a redemption in-kind.
The accompanying notes are an integral part of these financial statements.
TG-12
Franklin Templeton Variable Insurance Products Trust
Statement of Investments, December 31, 2012
| | | | | | | | | | |
| Templeton Growth Securities Fund | | Country | | Shares | | | Value | |
Common Stocks 97.5% | | | | | | | | | | |
Aerospace & Defense 0.5% | | | | | | | | | | |
BAE Systems PLC | | United Kingdom | | | 1,730,147 | | | $ | 9,621,162 | |
| | | | | | | | | | |
Air Freight & Logistics 1.5% | | | | | | | | | | |
FedEx Corp. | | United States | | | 137,650 | | | | 12,625,258 | |
United Parcel Service Inc., B | | United States | | | 213,890 | | | | 15,770,110 | |
| | | | | | | | | | |
| | | | | | | | | 28,395,368 | |
| | | | | | | | | | |
Airlines 3.4% | | | | | | | | | | |
Deutsche Lufthansa AG | | Germany | | | 1,852,934 | | | | 35,019,057 | |
aInternational Consolidated Airlines Group SA | | United Kingdom | | | 9,750,507 | | | | 29,569,326 | |
| | | | | | | | | | |
| | | | | | | | | 64,588,383 | |
| | | | | | | | | | |
Auto Components 1.5% | | | | | | | | | | |
Cie Generale des Etablissements Michelin, B | | France | | | 304,259 | | | | 29,146,006 | |
| | | | | | | | | | |
Automobiles 2.6% | | | | | | | | | | |
aMazda Motor Corp. | | Japan | | | 5,893,690 | | | | 12,078,973 | |
Nissan Motor Co. Ltd. | | Japan | | | 1,197,020 | | | | 11,342,660 | |
Toyota Motor Corp. | | Japan | | | 547,420 | | | | 25,527,034 | |
| | | | | | | | | | |
| | | | | | | | | 48,948,667 | |
| | | | | | | | | | |
Biotechnology 2.0% | | | | | | | | | | |
Amgen Inc. | | United States | | | 394,160 | | | | 34,023,891 | |
aElan Corp. PLC, ADR | | Ireland | | | 294,500 | | | | 3,006,845 | |
aProthena Corp. PLC | | Ireland | | | 5,524 | | | | 40,494 | |
| | | | | | | | | | |
| | | | | | | | | 37,071,230 | |
| | | | | | | | | | |
Capital Markets 3.3% | | | | | | | | | | |
Credit Suisse Group AG | | Switzerland | | | 1,002,529 | | | | 24,380,068 | |
Morgan Stanley | | United States | | | 985,150 | | | | 18,836,068 | |
UBS AG | | Switzerland | | | 1,243,876 | | | | 19,391,611 | |
| | | | | | | | | | |
| | | | | | | | | 62,607,747 | |
| | | | | | | | | | |
Chemicals 1.2% | | | | | | | | | | |
Akzo Nobel NV | | Netherlands | | | 345,572 | | | | 22,869,662 | |
| | | | | | | | | | |
Commercial Banks 8.8% | | | | | | | | | | |
BNP Paribas SA | | France | | | 501,247 | | | | 28,528,429 | |
aCredit Agricole SA | | France | | | 2,476,096 | | | | 20,160,137 | |
DBS Group Holdings Ltd. | | Singapore | | | 932,690 | | | | 11,451,583 | |
HSBC Holdings PLC | | United Kingdom | | | 1,913,864 | | | | 20,076,403 | |
ICICI Bank Ltd., ADR | | India | | | 261,909 | | | | 11,421,851 | |
Intesa Sanpaolo SpA | | Italy | | | 12,521,254 | | | | 21,647,397 | |
KB Financial Group Inc. | | South Korea | | | 657,984 | | | | 23,445,521 | |
SunTrust Banks Inc. | | United States | | | 313,620 | | | | 8,891,127 | |
aUniCredit SpA | | Italy | | | 4,430,841 | | | | 21,813,672 | |
| | | | | | | | | | |
| | | | | | | | | 167,436,120 | |
| | | | | | | | | | |
Communications Equipment 3.1% | | | | | | | | | | |
aBrocade Communications Systems Inc. | | United States | | | 1,648,830 | | | | 8,788,264 | |
Cisco Systems Inc. | | United States | | | 1,476,640 | | | | 29,015,976 | |
Ericsson, B | | Sweden | | | 2,161,202 | | | | 21,641,440 | |
| | | | | | | | | | |
| | | | | | | | | 59,445,680 | |
| | | | | | | | | | |
Computers & Peripherals 1.4% | | | | | | | | | | |
Dell Inc. | | United States | | | 978,970 | | | | 9,916,966 | |
TG-13
Franklin Templeton Variable Insurance Products Trust
Statement of Investments, December 31, 2012 (continued)
| | | | | | | | | | |
| Templeton Growth Securities Fund | | Country | | Shares | | | Value | |
Common Stocks (continued) | | | | | | | | | | |
Computers & Peripherals (continued) | | | | | | | | | | |
Hewlett-Packard Co. | | United States | | �� | 1,154,460 | | | $ | 16,451,055 | |
| | | | | | | | | | |
| | | | | | | | | 26,368,021 | |
| | | | | | | | | | |
Construction & Engineering 0.1% | | | | | | | | | | |
Carillion PLC | | United Kingdom | | | 506,846 | | | | 2,635,293 | |
| | | | | | | | | | |
Construction Materials 1.4% | | | | | | | | | | |
CRH PLC | | Ireland | | | 1,277,393 | | | | 25,970,299 | |
| | | | | | | | | | |
Consumer Finance 0.6% | | | | | | | | | | |
American Express Co. | | United States | | | 201,170 | | | | 11,563,251 | |
| | | | | | | | | | |
Diversified Financial Services 4.3% | | | | | | | | | | |
Citigroup Inc. | | United States | | | 770,990 | | | | 30,500,364 | |
aING Groep NV | | Netherlands | | | 3,399,906 | | | | 32,283,667 | |
JPMorgan Chase & Co. | | United States | | | 440,760 | | | | 19,380,217 | |
| | | | | | | | | | |
| | | | | | | | | 82,164,248 | |
| | | | | | | | | | |
Diversified Telecommunication Services 4.3% | | | | | | | | | | |
China Telecom Corp. Ltd., ADR | | China | | | 179,195 | | | | 10,187,236 | |
France Telecom SA | | France | | | 1,226,401 | | | | 13,601,851 | |
Singapore Telecommunications Ltd. | | Singapore | | | 10,915,970 | | | | 29,706,312 | |
Telefonica SA | | Spain | | | 900,340 | | | | 12,186,503 | |
Vivendi SA | | France | | | 739,654 | | | | 16,723,523 | |
| | | | | | | | | | |
| | | | | | | | | 82,405,425 | |
| | | | | | | | | | |
Electrical Equipment 1.5% | | | | | | | | | | |
Alstom SA | | France | | | 590,117 | | | | 23,765,902 | |
Dongfang Electric Corp. Ltd., H | | China | | | 2,016,600 | | | | 4,069,498 | |
| | | | | | | | | | |
| | | | | | | | | 27,835,400 | |
| | | | | | | | | | |
Electronic Equipment, Instruments & Components 0.8% | | | | | | | | | | |
aFlextronics International Ltd. | | Singapore | | | 1,241,008 | | | | 7,706,660 | |
TE Connectivity Ltd. | | United States | | | 210,968 | | | | 7,831,132 | |
| | | | | | | | | | |
| | | | | | | | | 15,537,792 | |
| | | | | | | | | | |
Energy Equipment & Services 3.7% | | | | | | | | | | |
Baker Hughes Inc. | | United States | | | 594,950 | | | | 24,297,758 | |
Halliburton Co. | | United States | | | 731,720 | | | | 25,383,367 | |
Noble Corp. | | United States | | | 470,410 | | | | 16,379,676 | |
aSBM Offshore NV | | Netherlands | | | 228,380 | | | | 3,219,921 | |
| | | | | | | | | | |
| | | | | | | | | 69,280,722 | |
| | | | | | | | | | |
Food & Staples Retailing 2.2% | | | | | | | | | | |
CVS Caremark Corp. | | United States | | | 389,620 | | | | 18,838,127 | |
Tesco PLC | | United Kingdom | | | 3,999,235 | | | | 22,044,102 | |
| | | | | | | | | | |
| | | | | | | | | 40,882,229 | |
| | | | | | | | | | |
Health Care Equipment & Supplies 1.1% | | | | | | | | | | |
Medtronic Inc. | | United States | | | 497,540 | | | | 20,409,091 | |
| | | | | | | | | | |
Industrial Conglomerates 2.1% | | | | | | | | | | |
Koninklijke Philips Electronics NV | | Netherlands | | | 707,508 | | | | 18,729,970 | |
Siemens AG | | Germany | | | 201,712 | | | | 22,051,465 | |
| | | | | | | | | | |
| | | | | | | | | 40,781,435 | |
| | | | | | | | | | |
Insurance 5.3% | | | | | | | | | | |
aAmerican International Group Inc. | | United States | | | 221,040 | | | | 7,802,712 | |
TG-14
Franklin Templeton Variable Insurance Products Trust
Statement of Investments, December 31, 2012 (continued)
| | | | | | | | | | |
| Templeton Growth Securities Fund | | Country | | Shares | | | Value | |
Common Stocks (continued) | | | | | | | | | | |
Insurance (continued) | | | | | | | | | | |
Aviva PLC | | United Kingdom | | | 3,976,260 | | | $ | 24,609,908 | |
AXA SA | | France | | | 1,338,128 | | | | 24,197,568 | |
Muenchener Rueckversicherungs-Gesellschaft AG | | Germany | | | 98,161 | | | | 17,716,074 | |
Swiss Re AG | | Switzerland | | | 352,506 | | | | 25,378,429 | |
| | | | | | | | | | |
| | | | | | | | | 99,704,691 | |
| | | | | | | | | | |
Life Sciences Tools & Services 0.3% | | | | | | | | | | |
Lonza Group AG | | Switzerland | | | 120,746 | | | | 6,511,195 | |
| | | | | | | | | | |
Machinery 0.8% | | | | | | | | | | |
aNavistar International Corp. | | United States | | | 725,430 | | | | 15,792,611 | |
| | | | | | | | | | |
Media 6.0% | | | | | | | | | | |
Comcast Corp., Special A | | United States | | | 872,552 | | | | 31,368,244 | |
News Corp., A | | United States | | | 610,902 | | | | 15,602,437 | |
Time Warner Cable Inc. | | United States | | | 204,750 | | | | 19,899,652 | |
Time Warner Inc. | | United States | | | 420,870 | | | | 20,130,212 | |
Viacom Inc., B | | United States | | | 164,298 | | | | 8,665,077 | |
The Walt Disney Co. | | United States | | | 367,850 | | | | 18,315,252 | |
| | | | | | | | | | |
| | | | | | | | | 113,980,874 | |
| | | | | | | | | | |
Metals & Mining 0.3% | | | | | | | | | | |
POSCO | | South Korea | | | 15,450 | | | | 5,069,431 | |
| | | | | | | | | | |
Multiline Retail 0.6% | | | | | | | | | | |
Target Corp. | | United States | | | 191,680 | | | | 11,341,706 | |
| | | | | | | | | | |
Oil, Gas & Consumable Fuels 8.6% | | | | | | | | | | |
BP PLC | | United Kingdom | | | 3,119,588 | | | | 21,696,277 | |
Chesapeake Energy Corp. | | United States | | | 728,380 | | | | 12,105,676 | |
Chevron Corp. | | United States | | | 195,030 | | | | 21,090,544 | |
Eni SpA | | Italy | | | 776,759 | | | | 19,023,613 | |
Galp Energia SGPS SA, B | | Portugal | | | 857,860 | | | | 13,312,697 | |
Royal Dutch Shell PLC, B | | United Kingdom | | | 539,383 | | | | 19,243,072 | |
Talisman Energy Inc. | | Canada | | | 2,121,220 | | | | 24,025,900 | |
Total SA, B | | France | | | 618,659 | | | | 32,182,077 | |
| | | | | | | | | | |
| | | | | | | | | 162,679,856 | |
| | | | | | | | | | |
Pharmaceuticals 10.2% | | | | | | | | | | |
aForest Laboratories Inc. | | United States | | | 139,200 | | | | 4,916,544 | |
GlaxoSmithKline PLC | | United Kingdom | | | 1,418,813 | | | | 30,889,719 | |
Merck & Co. Inc. | | United States | | | 666,781 | | | | 27,298,014 | |
Merck KGaA | | Germany | | | 129,667 | | | | 17,084,895 | |
Pfizer Inc. | | United States | | | 1,566,733 | | | | 39,293,664 | |
Roche Holding AG | | Switzerland | | | 172,833 | | | | 34,742,199 | |
Sanofi | | France | | | 404,337 | | | | 38,335,195 | |
| | | | | | | | | | |
| | | | | | | | | 192,560,230 | |
| | | | | | | | | | |
Professional Services 1.6% | | | | | | | | | | |
Adecco SA | | Switzerland | | | 88,434 | | | | 4,641,251 | |
Hays PLC | | United Kingdom | | | 2,280 | | | | 3,105 | |
Randstad Holding NV | | Netherlands | | | 708,650 | | | | 26,296,064 | |
| | | | | | | | | | |
| | | | | | | | | 30,940,420 | |
| | | | | | | | | | |
Semiconductors & Semiconductor Equipment 3.5% | | | | | | | | | | |
Samsung Electronics Co. Ltd. | | South Korea | | | 38,670 | | | | 55,334,267 | |
Taiwan Semiconductor Manufacturing Co. Ltd. | | Taiwan | | | 3,053,585 | | | | 10,190,874 | |
| | | | | | | | | | |
| | | | | | | | | 65,525,141 | |
| | | | | | | | | | |
TG-15
Franklin Templeton Variable Insurance Products Trust
Statement of Investments, December 31, 2012 (continued)
| | | | | | | | | | |
| Templeton Growth Securities Fund | | Country | | Shares | | | Value | |
Common Stocks (continued) | | | | | | | | | | |
Software 3.4% | | | | | | | | | | |
Microsoft Corp. | | United States | | | 1,099,279 | | | $ | 29,383,728 | |
Nintendo Co. Ltd. | | Japan | | | 99,240 | | | | 10,581,921 | |
Oracle Corp. | | United States | | | 332,460 | | | | 11,077,567 | |
SAP AG | | Germany | | | 157,602 | | | | 12,669,822 | |
| | | | | | | | | | |
| | | | | | | | | 63,713,038 | |
| | | | | | | | | | |
Specialty Retail 1.0% | | | | | | | | | | |
Kingfisher PLC | | United Kingdom | | | 4,012,231 | | | | 18,740,579 | |
| | | | | | | | | | |
Trading Companies & Distributors 0.4% | | | | | | | | | | |
Itochu Corp. | | Japan | | | 770,990 | | | | 8,137,396 | |
| | | | | | | | | | |
Wireless Telecommunication Services 4.1% | | | | | | | | | | |
aSprint Nextel Corp. | | United States | | | 4,601,360 | | | | 26,089,711 | |
aTurkcell Iletisim Hizmetleri AS, ADR | | Turkey | | | 1,477,723 | | | | 23,850,449 | |
Vodafone Group PLC | | United Kingdom | | | 11,383,719 | | | | 28,660,903 | |
| | | | | | | | | | |
| | | | | | | | | 78,601,063 | |
| | | | | | | | | | |
Total Common Stocks (Cost $1,713,263,190) | | | | | | | | | 1,849,261,462 | |
| | | | | | | | | | |
Preferred Stocks 0.6% | | | | | | | | | | |
Metals & Mining 0.4% | | | | | | | | | | |
Vale SA, ADR, pfd., A | | Brazil | | | 372,875 | | | | 7,569,362 | |
| | | | | | | | | | |
Oil, Gas & Consumable Fuels 0.2% | | | | | | | | | | |
Petroleo Brasileiro SA, ADR, pfd. | | Brazil | | | 172,602 | | | | 3,331,219 | |
| | | | | | | | | | |
Total Preferred Stocks (Cost $11,833,237) | | | | | | | | | 10,900,581 | |
| | | | | | | | | | |
Non-Registered Mutual Funds (Cost $11,935,000) 0.7% | | | | | | | | | | |
Diversified Financial Services 0.7% | | | | | | | | | | |
a,b,c,dTempleton China Opportunities Fund Ltd., Reg D | | Cayman Islands | | | 1,194,518 | | | | 13,689,174 | |
| | | | | | | | | | |
Total Investments before Short Term Investments
(Cost $1,737,031,427) | | | | | | | | | 1,873,851,217 | |
| | | | | | | | | | |
| | | |
| | | | | Principal
Amount | | | | |
Short Term Investments (Cost $26,000,000) 1.4% | | | | | | | | | | |
Time Deposits 1.4% | | | | | | | | | | |
Royal Bank of Canada, 0.05%, 1/02/13 | | United States | | $ | 26,000,000 | | | | 26,000,000 | |
| | | | | | | | | | |
Total Investments (Cost $1,763,031,427) 100.2% | | | | | | | | | 1,899,851,217 | |
Other Assets, less Liabilities (0.2)% | | | | | | | | | (3,184,901 | ) |
| | | | | | | | | | |
Net Assets 100.0% | | | | | | | | $ | 1,896,666,316 | |
| | | | | | | | | | |
See abbreviations on page TG-30.
aNon-income producing.
bSee Note 1(c) regarding investment in Templeton China Opportunities Fund, Ltd.
cSee Note 8 regarding restricted securities.
dSee Note 9 regarding holdings of 5% voting securities.
The accompanying notes are an integral part of these financial statements.
TG-16
Franklin Templeton Variable Insurance Products Trust
Financial Statements
Statement of Assets and Liabilities
December 31, 2012
| | | | |
| | | Templeton
Growth
Securities Fund | |
Assets: | | | | |
Investments in securities: | | | | |
Cost - Unaffiliated issuers | | $ | 1,751,096,427 | |
Cost - Non-controlled affiliated issuers (Note 9) | | | 11,935,000 | |
| | | | |
Total cost of investments | | $ | 1,763,031,427 | |
| | | | |
Value - Unaffiliated issuers | | $ | 1,886,162,043 | |
Value - Non-controlled affiliated issuers (Note 9) | | | 13,689,174 | |
| | | | |
Total value of investments | | | 1,899,851,217 | |
Cash | | | 431,212 | |
Receivables: | | | | |
Capital shares sold | | | 162,634 | |
Dividends and interest | | | 2,695,418 | |
Other assets | | | 61 | |
| | | | |
Total assets | | | 1,903,140,542 | |
| | | | |
Liabilities: | | | | |
Payables: | | | | |
Investment securities purchased | | | 883,672 | |
Capital shares redeemed | | | 2,787,099 | |
Affiliates | | | 2,304,855 | |
Reports to shareholders | | | 373,231 | |
Accrued expenses and other liabilities | | | 125,369 | |
| | | | |
Total liabilities | | | 6,474,226 | |
| | | | |
Net assets, at value | | $ | 1,896,666,316 | |
| | | | |
Net assets consist of: | | | | |
Paid-in capital | | $ | 1,999,113,705 | |
Undistributed net investment income | | | 54,035,591 | |
Net unrealized appreciation (depreciation) | | | 136,855,890 | |
Accumulated net realized gain (loss) | | | (293,338,870 | ) |
| | | | |
Net assets, at value | | $ | 1,896,666,316 | |
| | | | |
The accompanying notes are an integral part of these financial statements.
TG-17
Franklin Templeton Variable Insurance Products Trust
Financial Statements (continued)
Statement of Assets and Liabilities (continued)
December 31, 2012
| | | | |
| | | Templeton
Growth
Securities Fund | |
Class 1: | | | | |
Net assets, at value | | $ | 476,954,253 | |
| | | | |
Shares outstanding | | | 39,231,294 | |
| | | | |
Net asset value and maximum offering price per share | | $ | 12.16 | |
| | | | |
Class 2: | | | | |
Net assets, at value | | $ | 1,352,554,115 | |
| | | | |
Shares outstanding | | | 112,970,230 | |
| | | | |
Net asset value and maximum offering price per share | | $ | 11.97 | |
| | | | |
Class 4: | | | | |
Net assets, at value | | $ | 67,157,948 | |
| | | | |
Shares outstanding | | | 5,563,777 | |
| | | | |
Net asset value and maximum offering price per share | | $ | 12.07 | |
| | | | |
The accompanying notes are an integral part of these financial statements.
TG-18
Franklin Templeton Variable Insurance Products Trust
Financial Statements (continued)
Statement of Operations
for the year ended December 31, 2012
| | | | |
| | | Templeton
Growth
Securities Fund | |
Investment income: | | | | |
Dividends (net of foreign taxes $5,567,047) | | $ | 75,236,783 | |
Interest | | | 53,195 | |
Income from securities loaned | | | 2,601,913 | |
| | | | |
Total investment income | | | 77,891,891 | |
| | | | |
Expenses: | | | | |
Management fees (Note 3a) | | | 18,785,943 | |
Distribution fees: (Note 3c) | | | | |
Class 2 | | | 3,248,515 | |
Class 4 | | | 217,813 | |
Unaffiliated transfer agent fees | | | 1,232 | |
Custodian fees (Note 4) | | | 260,580 | |
Reports to shareholders | | | 363,995 | |
Professional fees | | | 131,200 | |
Trustees’ fees and expenses | | | 10,637 | |
Other | | | 58,700 | |
| | | | |
Total expenses | | | 23,078,615 | |
Expense reductions (Note 4) | | | (199 | ) |
| | | | |
Net expenses | | | 23,078,416 | |
| | | | |
Net investment income | | | 54,813,475 | |
| | | | |
Realized and unrealized gains (losses): | | | | |
Net realized gain (loss) from: | | | | |
Investments (includes gains from a redemption in-kind of $18,346,694) (Note 11) | | | 52,542,423 | |
Foreign currency transactions | | | (507,903 | ) |
| | | | |
Net realized gain (loss) | | | 52,034,520 | |
| | | | |
Net change in unrealized appreciation (depreciation) on: | | | | |
Investments | | | 384,754,033 | |
Translation of other assets and liabilities denominated in foreign currencies | | | 109,661 | |
| | | | |
Net change in unrealized appreciation (depreciation) | | | 384,863,694 | |
| | | | |
Net realized and unrealized gain (loss) | | | 436,898,214 | |
| | | | |
Net increase (decrease) in net assets resulting from operations | | $ | 491,711,689 | |
| | | | |
The accompanying notes are an integral part of these financial statements.
TG-19
Franklin Templeton Variable Insurance Products Trust
Financial Statements (continued)
Statements of Changes in Net Assets
| | | | | | | | |
| | | Templeton Growth
Securities Fund | |
| | | Year Ended December 31, | |
| | | 2012 | | | 2011 | |
| | | | |
Increase (decrease) in net assets: | | | | | | | | |
Operations: | | | | | | | | |
Net investment income | | $ | 54,813,475 | | | $ | 60,824,912 | |
Net realized gain (loss) from investments and foreign currency transactions | | | 52,034,520 | | | | 119,363,548 | |
Net change in unrealized appreciation (depreciation) on investments and translation of other assets and liabilities denominated in foreign currencies | | | 384,863,694 | | | | (404,407,949 | ) |
| | | | |
Net increase (decrease) in net assets resulting from operations | | | 491,711,689 | | | | (224,219,489 | ) |
| | | | |
Distributions to shareholders from: | | | | | | | | |
Net investment income: | | | | | | | | |
Class 1 | | | (30,925,492 | ) | | | (23,962,804 | ) |
Class 2 | | | (26,587,764 | ) | | | (19,367,342 | ) |
Class 4 | | | (1,228,892 | ) | | | (766,075 | ) |
| | | | |
Total distributions to shareholders | | | (58,742,148 | ) | | | (44,096,221 | ) |
| | | | |
Capital share transactions: (Note 2) | | | | | | | | |
Class 1 | | | (922,021,789 | ) | | | 15,269,781 | |
Class 2 | | | (125,611,247 | ) | | | (272,568,653 | ) |
Class 4 | | | 284,692 | | | | 582,974 | |
| | | | |
Total capital share transactions | | | (1,047,348,344 | ) | | | (256,715,898 | ) |
| | | | |
Net increase (decrease) in net assets | | | (614,378,803 | ) | | | (525,031,608 | ) |
Net assets: | | | | | | | | |
Beginning of year | | | 2,511,045,119 | | | | 3,036,076,727 | |
| | | | |
End of year | | $ | 1,896,666,316 | | | $ | 2,511,045,119 | |
| | | | |
Undistributed net investment income included in net assets: | | | | | | | | |
End of year | | $ | 54,035,591 | | | $ | 58,485,038 | |
| | | | |
The accompanying notes are an integral part of these financial statements.
TG-20
Franklin Templeton Variable Insurance Products Trust
Notes to Financial Statements
Templeton Growth Securities Fund
1. ORGANIZATION AND SIGNIFICANT ACCOUNTING POLICIES
Franklin Templeton Variable Insurance Products Trust (Trust) is registered under the Investment Company Act of 1940, as amended, (1940 Act) as an open-end investment company, consisting of twenty separate funds. The Templeton Growth Securities Fund (Fund) is included in this report. The financial statements of the remaining funds in the Trust are presented separately. Shares of the Fund are generally sold only to insurance company separate accounts to fund the benefits of variable life insurance policies or variable annuity contracts. Investment activities of these insurance company separate accounts could have a material impact on the Fund. The Fund offers, three classes of shares: Class 1, Class 2 and Class 4. Each class of shares differs by its distribution fees, voting rights on matters affecting a single class and its exchange privilege.
The following summarizes the Fund’s significant accounting policies.
a. Financial Instrument Valuation
The Fund’s investments in financial instruments are carried at fair value daily. Fair value is the price that would be received to sell an asset or paid to transfer a liability in an orderly transaction between market participants on the measurement date. Under procedures approved by the Trust’s Board of Trustees (the Board), the Fund’s administrator, investment manager and other affiliates have formed the Valuation and Liquidity Oversight Committee (VLOC). The VLOC provides administration and oversight of the Fund’s valuation policies and procedures, which are approved annually by the Board. Among other things, these procedures allow the Fund to utilize independent pricing services, quotations from securities and financial instrument dealers, and other market sources to determine fair value.
Equity securities listed on an exchange or on the NASDAQ National Market System are valued at the last quoted sale price or the official closing price of the day, respectively. Foreign equity securities are valued as of the close of trading on the foreign stock exchange on which the security is primarily traded, or the NYSE, whichever is earlier. The value is then converted into its U.S. dollar equivalent at the foreign exchange rate in effect at the close of the NYSE on the day that the value of the security is determined. Over-the-counter (OTC) securities are valued within the range of the most recent quoted bid and ask prices. Securities that trade in multiple markets or on multiple exchanges are valued according to the broadest and most representative market. Certain equity securities are valued based upon fundamental characteristics or relationships to similar securities.
Debt securities generally trade in the OTC market rather than on a securities exchange. The Fund’s pricing services use multiple valuation techniques to determine fair value. In instances where sufficient market activity exists, the pricing services may utilize a market-based approach through which quotes from market makers are used to determine fair value. In instances where sufficient market activity may not exist or is limited, the pricing services also utilize proprietary valuation models which may consider market characteristics such as benchmark yield curves, credit spreads, estimated default rates, anticipated market interest rate volatility, coupon rates, anticipated timing of principal repayments, underlying collateral, and other unique security features in order to estimate the relevant cash flows, which are then discounted to calculate the fair value. Securities denominated in a foreign currency are converted into their U.S. dollar equivalent at the foreign exchange rate in effect at the close of the NYSE on the date that the values of the foreign debt securities are determined. Time deposits are valued at cost, which approximates market value.
The Fund has procedures to determine the fair value of financial instruments for which market prices are not reliable or readily available. Under these procedures, the VLOC convenes on a regular basis to review such financial instruments and considers a number of factors, including significant unobservable valuation inputs, when arriving at fair value. The VLOC primarily employs a market-based approach which may use related or comparable assets or liabilities, recent transactions, market multiples, book values, and other relevant information for the investment to determine the fair value of the investment. An income-based valuation approach may also be used in which the anticipated future cash flows of the investment are discounted to calculate fair value. Discounts may also be applied due to the nature or duration of any restrictions on the disposition of the investments. Due to the inherent uncertainty of valuations of such investments, the fair values may differ significantly from the values that would have been used had an active market existed. The VLOC employs various methods for calibrating these valuation approaches
TG-21
Franklin Templeton Variable Insurance Products Trust
Notes to Financial Statements (continued)
Templeton Growth Securities Fund
1. ORGANIZATION AND SIGNIFICANT ACCOUNTING POLICIES (continued)
a. Financial Instrument Valuation (continued)
including a regular review of key inputs and assumptions, transactional back-testing or disposition analysis, and reviews of any related market activity.
Trading in securities on foreign securities stock exchanges and OTC markets may be completed before the daily close of business on the NYSE. Occasionally, events occur between the time at which trading in a foreign security is completed and the close of the NYSE that might call into question the reliability of the value of a portfolio security held by the Fund. As a result, differences may arise between the value of the Fund’s portfolio securities as determined at the foreign market close and the latest indications of value at the close of the NYSE. In order to minimize the potential for these differences, the VLOC monitors price movements following the close of trading in foreign stock markets through a series of country specific market proxies (such as baskets of American Depositary Receipts, futures contracts and exchange traded funds). These price movements are measured against established trigger thresholds for each specific market proxy to assist in determining if an event has occurred that may call into question the reliability of the values of the foreign securities held by the Fund. If such an event occurs, the securities may be valued using fair value procedures, which may include the use of independent pricing services. At December 31, 2012, a market event occurred resulting in a portion of the securities held by the Fund being valued using fair value procedures.
b. Foreign Currency Translation
Portfolio securities and other assets and liabilities denominated in foreign currencies are translated into U.S. dollars based on the exchange rate of such currencies against U.S. dollars on the date of valuation. The Fund may enter into foreign currency exchange contracts to facilitate transactions denominated in a foreign currency. Purchases and sales of securities, income and expense items denominated in foreign currencies are translated into U.S. dollars at the exchange rate in effect on the transaction date. Portfolio securities and assets and liabilities denominated in foreign currencies contain risks that those currencies will decline in value relative to the U.S. dollar. Occasionally, events may impact the availability or reliability of foreign exchange rates used to convert the U.S. dollar equivalent value. If such an event occurs, the foreign exchange rate will be valued at fair value using procedures established and approved by the Board.
The Fund does not separately report the effect of changes in foreign exchange rates from changes in market prices on securities held. Such changes are included in net realized and unrealized gain or loss from investments on the Statement of Operations.
Realized foreign exchange gains or losses arise from sales of foreign currencies, currency gains or losses realized between the trade and settlement dates on securities transactions and the difference between the recorded amounts of dividends, interest, and foreign withholding taxes and the U.S. dollar equivalent of the amounts actually received or paid. Net unrealized foreign exchange gains and losses arise from changes in foreign exchange rates on foreign denominated assets and liabilities other than investments in securities held at the end of the reporting period.
c. Investment in Templeton China Opportunities Fund, Ltd.
The Fund invests in Templeton China Opportunities Fund, Ltd. (China Fund), a private offering of unregistered shares in a Cayman Islands Exempt Company. The China Fund investment objective is to seek capital growth primarily through investments in A-shares of Chinese companies listed on the Shanghai and Shenzhen stock exchanges. Chinese A-shares are traded in Chinese Renminbi and are only available as an investment to domestic (Chinese) investors and holders of a Qualified Foreign Institutional Investors license. The China Fund is managed by Templeton Investment Counsel, LLC (an affiliate of the investment manager). No additional management or administrative fees are incurred on assets invested in the China Fund.
The China Fund may be subject to certain restrictions and administrative processes relating to its ability to repatriate cash balances, investment proceeds and earnings associated with its investment, as such activities are subject to approval by agencies
TG-22
Franklin Templeton Variable Insurance Products Trust
Notes to Financial Statements (continued)
Templeton Growth Securities Fund
1. ORGANIZATION AND SIGNIFICANT ACCOUNTING POLICIES (continued)
c. Investment in Templeton China Opportunities Fund, Ltd. (continued)
of the Chinese government and thus the Fund may incur delays in redeeming its investment in the China Fund. The Fund’s investment in the China Fund is valued based upon the fair value of the China Fund’s portfolio securities and other assets and liabilities.
d. Securities Lending
The Fund participates in an agency based securities lending program. The Fund receives cash collateral against the loaned securities in an amount equal to at least 102% of the market value of the loaned securities. Collateral is maintained over the life of the loan in an amount not less than 100% of the market value of loaned securities, as determined at the close of fund business each day; any additional collateral required due to changes in security values is delivered to the Fund on the next business day. The collateral is invested in a non-registered money fund. The Fund receives income from the investment of cash collateral, in addition to lending fees and rebates paid by the borrower. The Fund bears the market risk with respect to the collateral investment, securities loaned, and the risk that the agent may default on its obligations to the Fund. The securities lending agent has agreed to indemnify the Fund in the event of default by a third party borrower. At December 31, 2012, the Fund had no securities on loan.
e. Income and Deferred Taxes
It is the Fund’s policy to qualify as a regulated investment company under the Internal Revenue Code. The Fund intends to distribute to shareholders substantially all of its taxable income and net realized gains to relieve it from federal income and excise taxes. As a result, no provision for U.S. federal income taxes is required.
The Fund may be subject to foreign taxation related to income received, capital gains on the sale of securities and certain foreign currency transactions in the foreign jurisdictions in which it invests. Foreign taxes, if any, are recorded based on the tax regulations and rates that exist in the foreign markets in which the Fund invests. When a capital gain tax is determined to apply the Fund records an estimated deferred tax liability in an amount that would be payable if the securities were disposed of on the valuation date.
The Fund recognizes the tax benefits of uncertain tax positions only when the position is “more likely than not” to be sustained upon examination by the tax authorities based on the technical merits of the tax position. As of December 31, 2012, and for all open tax years, the Fund has determined that no liability for unrecognized tax benefits is required in the Fund’s financial statements related to uncertain tax positions taken on a tax return (or expected to be taken on future tax returns). Open tax years are those that remain subject to examination and are based on each tax jurisdiction statute of limitation.
f. Security Transactions, Investment Income, Expenses and Distributions
Security transactions are accounted for on trade date. Realized gains and losses on security transactions are determined on a specific identification basis. Interest income and estimated expenses are accrued daily. Amortization of premium and accretion of discount on debt securities are included in interest income. Dividend income is recorded on the ex-dividend date except that certain dividends from foreign securities are recognized as soon as the Fund is notified of the ex-dividend date. Distributions to shareholders are recorded on the ex-dividend date and are determined according to income tax regulations (tax basis). Distributable earnings determined on a tax basis may differ from earnings recorded in accordance with accounting principles generally accepted in the United States of America. These differences may be permanent or temporary. Permanent differences are reclassified among capital accounts to reflect their tax character. These reclassifications have no impact on net assets or the results of operations. Temporary differences are not reclassified, as they may reverse in subsequent periods.
TG-23
Franklin Templeton Variable Insurance Products Trust
Notes to Financial Statements (continued)
Templeton Growth Securities Fund
1. ORGANIZATION AND SIGNIFICANT ACCOUNTING POLICIES (continued)
f. Security Transactions, Investment Income, Expenses and Distributions (continued)
Common expenses incurred by the Trust are allocated among the funds based on the ratio of net assets of each fund to the combined net assets of the Trust. Fund specific expenses are charged directly to the fund that incurred the expense.
Realized and unrealized gains and losses and net investment income, not including class specific expenses, are allocated daily to each class of shares based upon the relative proportion of net assets of each class. Differences in per share distributions, by class, are generally due to differences in class specific expenses.
g. Accounting Estimates
The preparation of financial statements in accordance with accounting principles generally accepted in the United States of America requires management to make estimates and assumptions that affect the reported amounts of assets and liabilities at the date of the financial statements and the amounts of income and expenses during the reporting period. Actual results could differ from those estimates.
h. Guarantees and Indemnifications
Under the Trust’s organizational documents, its officers and trustees are indemnified by the Trust against certain liabilities arising out of the performance of their duties to the Trust. Additionally, in the normal course of business, the Trust, on behalf of the Fund, enters into contracts with service providers that contain general indemnification clauses. The Trust’s maximum exposure under these arrangements is unknown as this would involve future claims that may be made against the Trust that have not yet occurred. Currently, the Trust expects the risk of loss to be remote.
2. SHARES OF BENEFICIAL INTEREST
At December 31, 2012, there were an unlimited number of shares authorized (without par value). Transactions in the Fund’s shares were as follows:
| | | | | | | | | | | | | | | | |
| | | Year Ended December 31, | |
| | | 2012 | | | 2011 | |
| Class 1 Shares: | | Shares | | | Amount | | | Shares | | | Amount | |
Shares sold | | | 39,146,115 | | | $ | 423,930,779 | | | | 64,351,377 | | | $ | 689,220,432 | |
Shares issued in reinvestment of distributions | | | 3,052,862 | | | | 30,925,492 | | | | 2,081,912 | | | | 23,962,804 | |
Shares redeemed in-kind (Note 11) | | | (90,515,836 | ) | | | (1,060,908,757 | ) | | | (62,046 | ) | | | (778,675 | ) |
Shares redeemed | | | (29,409,088 | ) | | | (315,969,303 | ) | | | (69,960,205 | ) | | | (697,134,780 | ) |
| | | | |
Net increase (decrease) | | | (77,725,947 | ) | | $ | (922,021,789 | ) | | | (3,588,962 | ) | | $ | 15,269,781 | |
| | | | |
Class 2 Shares: | | | | | | | | | | | | | | | | |
Shares sold | | | 9,278,139 | | | $ | 99,327,364 | | | | 8,669,643 | | | $ | 93,168,510 | |
Shares issued in reinvestment of distributions | | | 2,661,438 | | | | 26,587,764 | | | | 1,706,374 | | | | 19,367,342 | |
Shares redeemed in-kind (Note 11) | | | — | | | | — | | | | (7,322,431 | ) | | | (90,358,797 | ) |
Shares redeemed | | | (23,060,322 | ) | | | (251,526,375 | ) | | | (26,665,336 | ) | | | (294,745,708 | ) |
| | | | |
Net increase (decrease) | | | (11,120,745 | ) | | $ | (125,611,247 | ) | | | (23,611,750 | ) | | $ | (272,568,653 | ) |
| | | | |
TG-24
Franklin Templeton Variable Insurance Products Trust
Notes to Financial Statements (continued)
Templeton Growth Securities Fund
2. SHARES OF BENEFICIAL INTEREST (continued)
| | | | | | | | | | | | | | | | |
| | | Year Ended December 31, | |
| | | 2012 | | | 2011 | |
| Class 4 Shares: | | Shares | | | Amount | | | Shares | | | Amount | |
Shares sold | | | 712,668 | | | $ | 7,687,691 | | | | 552,161 | | | $ | 6,020,586 | |
Shares issued on reinvestment of distributions | | | 121,914 | | | | 1,228,892 | | | | 66,906 | | | | 766,075 | |
Shares redeemed | | | (782,111 | ) | | | (8,631,891 | ) | | | (559,011 | ) | | | (6,203,687 | ) |
| | | | |
Net increase (decrease) | | | 52,471 | | | $ | 284,692 | | | | 60,056 | | | $ | 582,974 | |
| | | | |
3. TRANSACTIONS WITH AFFILIATES
Franklin Resources, Inc. is the holding company for various subsidiaries that together are referred to as Franklin Templeton Investments. Certain officers and trustees of the Fund are also officers and/or directors of the following subsidiaries:
| | |
| Subsidiary | | Affiliation |
Templeton Global Advisors Limited (TGAL) | | Investment manager |
Franklin Templeton Services, LLC (FT Services) | | Administrative manager |
Franklin Templeton Distributors, Inc. (Distributors) | | Principal underwriter |
Franklin Templeton Investor Services, LLC (Investor Services) | | Transfer agent |
a. Management Fees
The Fund pays an investment management fee to TGAL based on the average daily net assets of the Fund as follows:
| | |
| Annualized Fee Rate | | Net Assets |
| 1.000% | | Up to and including $100 million |
| 0.900% | | over $100 million, up to and including $250 million |
| 0.800% | | over $250 million, up to and including $500 million |
| 0.750% | | over $500 million, up to and including $1 billion |
| 0.700% | | over $1 billion, up to and including $5 billion |
| 0.675% | | over $5 billion, up to and including $10 billion |
| 0.655% | | over $10 billion, up to and including $15 billion |
| 0.635% | | over $15 billion, up to and including $20 billion |
| 0.615% | | In excess of $20 billion |
b. Administrative Fees
FT Services, under terms of an agreement, provides administrative services to the Fund and is not paid by the Fund for the services.
c. Distribution Fees
The Board has adopted distribution plans for Class 2 and Class 4 shares pursuant to Rule 12b-1 under the 1940 Act. Under the Fund’s compensation distribution plans, the Fund pays Distributors for costs incurred in connection with the servicing, sale and distribution of the Fund’s shares up to 0.35% per year of its average daily net assets of each class. Some distribution fees are not charged on shares held by affiliates. The Board has agreed to limit the current rate to 0.25% per year for Class 2.
TG-25
Franklin Templeton Variable Insurance Products Trust
Notes to Financial Statements (continued)
Templeton Growth Securities Fund
3. TRANSACTIONS WITH AFFILIATES (continued)
d. Transfer Agent Fees
Investor Services, under terms of an agreement, performs shareholder servicing for the Fund and is not paid by the Fund for the services.
e. Other Affiliated Transactions
At December 31, 2012, Franklin Templeton Variable Insurance Products Trust – Franklin Templeton VIP Founding Funds Allocation Fund owned 16.71% of the Fund’s outstanding shares. Investment activities of this investment company could have a material impact on the Fund.
4. EXPENSE OFFSET ARRANGEMENT
The Fund has entered into an arrangement with its custodian whereby credits realized as a result of uninvested cash balances are used to reduce a portion of the Fund’s custodian expenses. During the year ended December 31, 2012, the custodian fees were reduced as noted in the Statement of Operations.
5. INCOME TAXES
For tax purposes, capital losses may be carried over to offset future capital gains, if any. Capital loss carryforwards with no expiration, if any, must be fully utilized before those losses with expiration dates.
At December 31, 2012, capital loss carryforwards were as follows:
| | | | |
Capital loss carryforwards expiring in: | | | | |
2017 | | $ | 215,277,225 | |
2018 | | | 55,299,629 | |
| | | | |
| | $ | 270,576,854 | |
| | | | |
During the year ended December 31, 2012, the Fund utilized $25,377,477 of capital loss carryforwards.
The tax character of distributions paid during the years ended December 31, 2012 and 2011, was as follows:
| | | | | | | | |
| | | 2012 | | | 2011 | |
Distributions paid from ordinary income | | $ | 58,742,148 | | | $ | 44,096,221 | |
| | | | |
At December 31, 2012, the cost of investments, net unrealized appreciation (depreciation), undistributed ordinary income for income tax purposes were as follows:
| | | | |
Cost of investments | | $ | 1,787,547,618 | |
| | | | |
| |
Unrealized appreciation | | $ | 316,201,161 | |
Unrealized depreciation | | | (203,897,562 | ) |
| | | | |
Net unrealized appreciation (depreciation) | | $ | 112,303,599 | |
| | | | |
Distributable earnings - undistributed ordinary income | | $ | 55,789,766 | |
| | | | |
TG-26
Franklin Templeton Variable Insurance Products Trust
Notes to Financial Statements (continued)
Templeton Growth Securities Fund
5. INCOME TAXES (continued)
Differences between income and/or capital gains as determined on a book basis and a tax basis are primarily due to differing treatments of foreign currency transactions, wash sales and gains realized on in-kind shareholder redemptions.
6. INVESTMENT TRANSACTIONS
Purchases and sales of investments (excluding short term securities) for the year ended December 31, 2012, aggregated $536,120,562 and $447,857,998, respectively. Sales of investments excludes redemptions in-kind of $1,060,908,757.
7. CONCENTRATION OF RISK
Investing in foreign securities may include certain risks and considerations not typically associated with investing in U.S. securities, such as fluctuating currency values and changing local and regional economic, political and social conditions, which may result in greater market volatility. In addition, certain foreign securities may not be as liquid as U.S. securities.
8. RESTRICTED SECURITIES
The Fund invests in securities that are restricted under the Securities Act of 1933 (1933 Act) or which are subject to legal, contractual, or other agreed upon restrictions on resale. Restricted securities are often purchased in private placement transactions, and cannot be sold without prior registration unless the sale is pursuant to an exemption under the 1933 Act. Disposal of these securities may require greater effort and expense, and prompt sale at an acceptable price may be difficult. The Fund may have registration rights for restricted securities. The issuer generally incurs all registration costs.
At December 31, 2012, the Fund held investments in restricted securities, excluding certain securities exempt from registration under the 1933 Act deemed to be liquid, as follows:
| | | | | | | | | | | | | | | | |
| Shares | | | Issuer | | Acquisition
Dates | | | Cost | | | Value | |
| | 1,194,518 | | | Templeton China Opportunities Fund Ltd., Reg D (0.72% of Net Assets) | | | 3/17/10-12/1/11 | | | $ | 11,935,000 | | | $ | 13,689,174 | |
| | | | | | | | | | | | | | | | |
9. HOLDINGS OF 5% VOTING SECURITIES OF PORTFOLIO COMPANIES
The 1940 Act defines “affiliated companies” to include investments in portfolio companies in which a fund owns 5% or more of the outstanding voting securities. Investments in “affiliated companies” for the Fund for the year ended December 31, 2012, were as shown below.
| | | | | | | | | | | | | | | | | | | | | | | | | | | | |
Name of Issuer | | Number of
Shares
Held at
Beginning
of Year | | | Gross
Additions | | | Gross
Reductions | | | Number of
Shares
Held at
End of Year | | | Value at
End of Year | | | Investment
Income | | | Realized
Capital
Gain (Loss) | |
Non-Controlled Affiliates | | | | | | | | | | | | | | | | | | | | | | | | | | | | |
Templeton China Opportunities Fund Ltd., Reg D | | | 1,194,518 | | | | — | | | | — | | | | 1,194,518 | | | $ | 13,689,174 | | | $ | — | | | $ | — | |
Total Affiliated Securities (0.72% of Net Assets) | | | | | | | | | | | | | | | | | | | | | | | | | |
TG-27
Franklin Templeton Variable Insurance Products Trust
Notes to Financial Statements (continued)
Templeton Growth Securities Fund
10. CREDIT FACILITY
The Fund, together with other U.S. registered and foreign investment funds (collectively, Borrowers), managed by Franklin Templeton Investments, are borrowers in a joint syndicated senior unsecured credit facility totaling $1.5 billion (Global Credit Facility) which matured on January 18, 2013. This Global Credit Facility provides a source of funds to the Borrowers for temporary and emergency purposes, including the ability to meet future unanticipated or unusually large redemption requests. Effective January 18, 2013, the Borrowers renewed the Global Credit Facility, which matures on January 17, 2014.
Under the terms of the Global Credit Facility, the Fund shall, in addition to interest charged on any borrowings made by the Fund and other costs incurred by the Fund, pay its share of fees and expenses incurred in connection with the implementation and maintenance of the Global Credit Facility, based upon its relative share of the aggregate net assets of all of the Borrowers, including an annual commitment fee of 0.07% based upon the unused portion of the Global Credit Facility, which is reflected in other expenses on the Statement of Operations. During the year ended December 31, 2012, the Fund did not use the Global Credit Facility.
11. REDEMPTION IN-KIND
During the year ended December 31, 2012 and year ended December 31, 2011, the Fund realized $18,346,694 and $9,941,638, respectively, of net gains resulting from redemptions in-kind in which a shareholder redeemed fund shares for securities held by the Fund rather than for cash. Because such gains are not taxable to the Fund and are not distributed to remaining shareholders, they have been reclassified from accumulated net realized gains to paid-in capital.
12. FAIR VALUE MEASUREMENTS
The Fund follows a fair value hierarchy that distinguishes between market data obtained from independent sources (observable inputs) and the Fund’s own market assumptions (unobservable inputs). These inputs are used in determining the value of the Fund’s financial instruments and are summarized in the following fair value hierarchy:
| | • | | Level 1 – quoted prices in active markets for identical financial instruments |
| | • | | Level 2 – other significant observable inputs (including quoted prices for similar financial instruments, interest rates, prepayment speed, credit risk, etc.) |
| | • | | Level 3 – significant unobservable inputs (including the Fund’s own assumptions in determining the fair value of financial instruments) |
The inputs or methodology used for valuing financial instruments are not an indication of the risk associated with investing in those financial instruments.
For movements between the levels within the fair value hierarchy, the Fund has adopted a policy of recognizing the transfers as of the date of the underlying event which caused the movement. Additionally, at December 31, 2012, due to market events the Fund employed fair value procedures to value a portion of its holdings. Such procedures resulted in a temporary transfer of financial instruments valued at $851,762,094 from Level 1 to Level 2 within the fair value hierarchy.
TG-28
Franklin Templeton Variable Insurance Products Trust
Notes to Financial Statements (continued)
Templeton Growth Securities Fund
12. FAIR VALUE MEASUREMENTS (continued)
A summary of inputs used as of December 31, 2012, in valuing the Fund’s assets carried at fair value, is as follows:
| | | | | | | | | | | | | | | | |
| | | Level 1 | | | Level 2 | | | Level 3 | | | Total | |
| | | | |
Assets: | | | | | | | | | | | | | | | | |
Investments in Securities: | | | | | | | | | | | | | | | | |
Equity Investments: | | | | | | | | | | | | | | | | |
Aerospace & Defense | | $ | — | | | $ | 9,621,162 | | | $ | — | | | $ | 9,621,162 | |
Airlines | | | — | | | | 64,588,383 | | | | — | | | | 64,588,383 | |
Auto Components | | | — | | | | 29,146,006 | | | | — | | | | 29,146,006 | |
Automobiles | | | — | | | | 48,948,667 | | | | — | | | | 48,948,667 | |
Chemicals | | | — | | | | 22,869,662 | | | | — | | | | 22,869,662 | |
Commercial Banks | | | 63,834,902 | | | | 103,601,218 | | | | — | | | | 167,436,120 | |
Construction & Engineering | | | — | | | | 2,635,293 | | | | — | | | | 2,635,293 | |
Construction Materials | | | — | | | | 25,970,299 | | | | — | | | | 25,970,299 | |
Diversified Financial Services | | | 49,880,581 | | | | 32,283,667 | | | | 13,689,174 | | | | 95,853,422 | |
Diversified Telecommunication Services | | | 10,187,236 | | | | 72,218,189 | | | | — | | | | 82,405,425 | |
Electrical Equipment | | | 4,069,498 | | | | 23,765,902 | | | | — | | | | 27,835,400 | |
Energy Equipment & Services | | | 66,060,801 | | | | 3,219,921 | | | | — | | | | 69,280,722 | |
Food & Staples Retailing | | | 18,838,127 | | | | 22,044,102 | | | | — | | | | 40,882,229 | |
Industrial Conglomerates | | | — | | | | 40,781,435 | | | | — | | | | 40,781,435 | |
Insurance | | | 33,181,141 | | | | 66,523,550 | | | | — | | | | 99,704,691 | |
Oil, Gas & Consumable Fuels | | | 73,866,036 | | | | 92,145,039 | | | | — | | | | 166,011,075 | |
Pharmaceuticals | | | 106,250,421 | | | | 86,309,809 | | | | — | | | | 192,560,230 | |
Professional Services | | | 4,641,251 | | | | 26,299,169 | | | | — | | | | 30,940,420 | |
Software | | | 40,461,295 | | | | 23,251,743 | | | | — | | | | 63,713,038 | |
Specialty Retail | | | — | | | | 18,740,579 | | | | — | | | | 18,740,579 | |
Trading Companies & Distributors | | | — | | | | 8,137,396 | | | | — | | | | 8,137,396 | |
Wireless Telecommunication Services | | | 49,940,160 | | | | 28,660,903 | | | | — | | | | 78,601,063 | |
All Other Equity Investmentsa,b | | | 487,188,500 | | | | — | | | | — | | | | 487,188,500 | |
Short Term Investments | | | 26,000,000 | | | | — | | | | — | | | | 26,000,000 | |
| | | | |
Total Investments in Securities | | $ | 1,034,399,949 | | | $ | 851,762,094 | | | $ | 13,689,174 | | | $ | 1,899,851,217 | |
| | | | |
aIncludes common and preferred stocks as well as other equity investments.
bFor detailed categories, see the accompanying Statement of Investments.
13. NEW ACCOUNTING PRONOUNCEMENTS
In December 2011, the Financial Accounting Standards Board (FASB) issued Accounting Standards Update (ASU) No. 2011-11, Balance Sheet (Topic 210): Disclosures about Offsetting Assets and Liabilities. The amendments in the ASU enhance disclosures about offsetting of financial assets and liabilities to enable investors to understand the effect of these arrangements on a fund’s financial position. In January 2013, FASB issued ASU No. 2013-01, Balance Sheet (Topic 210): Clarifying the Scope of Disclosures about Offsetting Assets and Liabilities. The amendments in ASU No. 2013-01 clarify the intended scope of disclosures required by ASU No. 2011-11. These ASUs are effective for interim and annual reporting periods beginning on or after January 1, 2013. The Fund believes the adoption of these ASUs will not have a material impact on its financial statements.
TG-29
Franklin Templeton Variable Insurance Products Trust
Notes to Financial Statements (continued)
Templeton Growth Securities Fund
14. SUBSEQUENT EVENTS
The Fund has evaluated subsequent events through the issuance of the financial statements and determined that no events have occurred that require disclosure other than those already disclosed in the financial statements.
| | | | |
ABBREVIATIONS | | | | |
| Selected Portfolio | | | | |
| | | | |
| ADR - American Depositary Receipt | | | | |
TG-30
Franklin Templeton Variable Insurance Products Trust
Templeton Growth Securities Fund
Report of Independent Registered Public Accounting Firm
To the Board of Trustees and Shareholders of
Franklin Templeton Variable Insurance Products Trust
In our opinion, the accompanying statement of assets and liabilities, including the statement of investments, and the related statements of operations and of changes in net assets and the financial highlights present fairly, in all material respects, the financial position of Templeton Growth Securities Fund (the “Fund”) at December 31, 2012, the results of its operations for the year then ended, the changes in its net assets for each of the two years in the period then ended and the financial highlights for the periods presented, in conformity with accounting principles generally accepted in the United States of America. These financial statements and financial highlights (hereafter referred to as “financial statements”) are the responsibility of the Fund’s management. Our responsibility is to express an opinion on these financial statements based on our audits. We conducted our audits of these financial statements in accordance with the standards of the Public Company Accounting Oversight Board (United States). Those standards require that we plan and perform the audit to obtain reasonable assurance about whether the financial statements are free of material misstatement. An audit includes examining, on a test basis, evidence supporting the amounts and disclosures in the financial statements, assessing the accounting principles used and significant estimates made by management, and evaluating the overall financial statement presentation. We believe that our audits, which included confirmation of securities at December 31, 2012 by correspondence with the custodian, transfer agent and brokers, provide a reasonable basis for our opinion.
PricewaterhouseCoopers LLP
San Francisco, California
February 15, 2013
TG-31
Franklin Templeton Variable Insurance Products Trust
Tax Information (unaudited)
Templeton Growth Securities Fund
Under Section 854(b)(1)(A) of the Internal Revenue Code (Code), the Fund hereby reports 29.32% of the ordinary income dividends as income qualifying for the dividends received deduction for the fiscal year ended December 31, 2012.
At December 31, 2012, more than 50% of the Fund’s total assets were invested in securities of foreign issuers. In most instances, foreign taxes were withheld from income paid to the Fund on these investments. The Fund elects to treat foreign taxes paid as allowed under Section 853 of the Code. This election will allow shareholders of record as of the 2013 distribution date, to treat their proportionate share of foreign taxes paid by the Fund as having been paid directly by them. The shareholder shall consider these amounts as foreign taxes paid in the tax year in which they receive the Fund distribution.
TG-32
INDEX DESCRIPTIONS
The indexes are unmanaged and include reinvested distributions.
For indexes sourced by Morningstar: © 2013 Morningstar. All Rights Reserved. The information contained herein: (1) is proprietary to Morningstar and/or its content providers; (2) may not be copied or distributed; and (3) is not warranted to be accurate, complete or timely. Neither Morningstar nor its content providers are responsible for any damages or losses arising from any use of this information.
Russell® is a trademark and RussellTM is a servicemark of the Frank Russell Company.
Barclays U.S. Aggregate Index is a market capitalization-weighted index representing the U.S. investment-grade, fixed-rate, taxable bond market with index components for government and corporate, mortgage pass-through and asset-backed securities. All issues included are SEC registered, taxable, dollar denominated and nonconvertible, must have at least one year to final maturity and must be rated investment grade (Baa3/BBB-/BBB- or higher) using the middle rating of Moody’s, Standard & Poor’s and Fitch, respectively.
Barclays U.S. Government Index: Intermediate Component is the intermediate component of the BC U.S. Government Index, which includes public obligations of the U.S. Treasury with at least one year to final maturity and publicly issued debt of U.S. government agencies, quasi-federal corporations, and corporate or foreign debt guaranteed by the U.S. government.
Citigroup World Government Bond Index is a market capitalization-weighted index consisting of investment-grade world government bond markets.
Consumer Price Index (CPI), calculated by the Bureau of Labor Statistics, is a commonly used measure of the inflation rate.
Credit Suisse (CS) High Yield Index is designed to mirror the investable universe of the U.S. dollar-denominated high yield debt market.
FTSE EPRA/NAREIT Developed Index is a free float-adjusted index designed to measure the performance of publicly traded real estate securities in the North American, European and Asian real estate markets. FTSE® is a trademark of London Stock Exchange Plc and The Financial Times Limited and is used by FTSE under license.
J.P. Morgan (JPM) Global Government Bond Index (GGBI) tracks total returns for liquid, fixed-rate, domestic government bonds with maturities greater than one year issued by developed countries globally.
Lipper Multi-Sector Income Funds Classification Average is calculated by averaging the total returns of all funds within the Lipper Multi-Sector Income Funds classification in the Lipper Open-End underlying funds universe. Lipper Multi-Sector Income Funds are defined as funds that seek current income by allocating assets among different fixed income securities sectors (not primarily in one sector except for defensive purposes), including U.S. and foreign governments, with a significant portion rated below investment grade. For the 12-month period ended 12/31/12, there were 229 funds in this category. Lipper calculations do not include contract fees, expenses or sales charges, and may have been different if such charges had been considered.
Lipper VIP Equity Income Funds Classification Average is an equally weighted average calculation of performance figures for all funds within the Lipper Equity Income Funds classification in the Lipper VIP underlying funds universe. Lipper Equity Income Funds seek relatively high current income and growth of income through investing 60% or more of their portfolios in equities. For the 12-month period ended 12/31/12, there were 63 funds in this category. Lipper calculations do not include contract fees, expenses or sales charges, and may have been different if such charges had been considered.
Lipper VIP General U.S. Government Funds Classification Average is an equally weighted average calculation of performance figures for all funds within the Lipper General U.S. Government Funds classification in the Lipper VIP underlying funds universe. Lipper General U.S. Government Funds invest primarily in U.S. government and agency issues. For the 12-month period ended 12/31/12, there were 51 funds in this category. Lipper calculations do not include contract fees, expenses or sales charges, and may have been different if such charges had been considered.
Lipper VIP High Yield Funds Classification Average is an equally weighted average calculation of performance figures for all funds within the Lipper High Yield Funds Classification in the Lipper VIP underlying funds universe. Lipper High Yield Funds aim at high (relative) current yield from fixed income securities, have no quality or maturity restrictions, and tend to invest in lower grade debt issues. For the 12-month period ended 12/31/12, there were 118 funds in this category. Lipper calculations do not include contract fees, expenses or sales charges, and may have been different if such charges had been considered.
I-1
MSCI All Country World Index (ACWI) is a free float-adjusted, market capitalization-weighted index designed to measure equity market performance in global developed and emerging markets.
MSCI Emerging Markets (EM) Index is a free float-adjusted, market capitalization-weighted index designed to measure equity market performance in global emerging markets.
MSCI Europe, Australasia, Far East (EAFE) Index is a free float-adjusted, market capitalization-weighted index designed to measure equity market performance in global developed markets excluding the U.S. and Canada.
MSCI Europe, Australasia, Far East (EAFE) Index Net Return (Local Currency) is a free float-adjusted, market capitalization-weighted index designed to measure equity market performance of global developed markets excluding the U.S. and Canada. The index is calculated in local currency and includes reinvested daily net dividends.
MSCI World Index is a free float-adjusted, market capitalization-weighted index designed to measure equity market performance in global developed markets.
Russell 1000® Growth Index is market capitalization weighted and measures performance of those Russell 1000 Index companies with higher price-to-book ratios and higher forecasted growth values.
Russell 1000® Index is market capitalization weighted and measures performance of the largest companies in the Russell 3000® Index, which represents the majority of the U.S. market’s total capitalization.
Russell 1000® Value Index is market capitalization weighted and measures performance of those Russell 1000® Index companies with lower price-to-book ratios and lower forecasted growth values.
Russell 2500™ Index is market capitalization weighted and measures performance of the smallest companies in the Russell 3000® Index, which represent a modest amount of the Russell 3000® Index’s total market capitalization.
Russell 2500™ Value Index is market capitalization weighted and measures performance of those Russell 2500™ Index companies with lower price-to-book ratios and lower forecasted growth values.
Russell 3000® Growth Index is market capitalization weighted and measures performance of those Russell 3000® Index companies with higher price-to-book ratios and higher forecasted growth values.
Russell 3000® Index is market capitalization weighted and measures performance of the largest U.S. companies based on total market capitalization and represents the majority of the investable U.S. equity market.
Russell Midcap® Growth Index is market capitalization weighted and measures performance of those Russell Midcap® Index companies with higher price-to-book ratios and higher forecasted growth values.
Russell Midcap® Index is market capitalization weighted and measures performance of the smallest companies in the Russell 1000® Index, which represent a modest amount of the Russell 1000® Index’s total market capitalization.
Standard & Poor’s 500 Index (S&P 500) is a market capitalization-weighted index of 500 stocks designed to measure total U.S. equity market performance. STANDARD & POOR’S®, S&P® and S&P 500® are registered trademarks of Standard & Poor’s Financial Services LLC.
Standard & Poor’s/International Finance Corporation Investable (S&P/IFCI) Composite Index is a free float-adjusted, market capitalization-weighted index designed to measure equity performance in global emerging markets.
I-2
Board Members and Officers
The name, year of birth and address of the officers and board members, as well as their affiliations, positions held with the Trust, principal occupation during at least the past five years and number of portfolios overseen in the Franklin Templeton Investments fund complex are shown below. Generally, each board member serves until that person’s successor is elected and qualified.
Independent Board Members
| | | | | | | | |
| Name, Year of Birth and Address | | Position | | Length of Time Served | | Number of Portfolios in Fund Complex Overseen by Board Member* | | Other Directorships Held During at Least the Past 5 Years |
Harris J. Ashton (1932) One Franklin Parkway San Mateo, CA 94403-1906 | | Trustee | | Since 1988 | | 132 | | Bar-S Foods (meat packing company) (1981-2010). |
|
Principal Occupation During at Least the Past 5 Years: Director of various companies; and formerly, Director, RBC Holdings, Inc. (bank holding company) (until 2002); and President, Chief Executive Officer and Chairman of the Board, General Host Corporation (nursery and craft centers) (until 1998). |
Sam Ginn (1937) One Franklin Parkway San Mateo, CA 94403-1906 | | Trustee | | Since 2007 | | 107 | | ICO Global Communications (Holdings) Limited (satellite company) (2006-2010), Chevron Corporation (global energy company) (1989-2009), Hewlett-Packard Company (technology company) (1996-2002), Safeway, Inc. (grocery retailer) (1991-1998) and TransAmerica Corporation (insurance company) (1989-1999). |
|
Principal Occupation During at Least the Past 5 Years: Private investor; Chairman, First Responder Network Authority (FirstNet) (interoperable wireless broadband network) (August 2012); and formerly, Chairman of the Board, Vodafone AirTouch, PLC (wireless company) (1999-2000); Chairman of the Board and Chief Executive Officer, AirTouch Communications (cellular communications) (1993-1998) and Pacific Telesis Group (telephone holding company) (1988-1994). |
Edith E. Holiday (1952) One Franklin Parkway San Mateo, CA 94403-1906 | | Trustee | | Since 2005 | | 132 | | Hess Corporation (exploration and refining of oil and gas), H.J. Heinz Company (processed foods and allied products), RTI International Metals, Inc. (manufacture and distribution of titanium), Canadian National Railway (railroad) and White Mountains Insurance Group, Ltd. (holding company). |
|
Principal Occupation During at Least the Past 5 Years: Director or Trustee of various companies and trusts; and formerly, Assistant to the President of the United States and Secretary of the Cabinet (1990-1993); General Counsel to the United States Treasury Department (1989-1990); and Counselor to the Secretary and Assistant Secretary for Public Affairs and Public Liaison-United States Treasury Department (1988-1989). |
J. Michael Luttig (1954) One Franklin Parkway San Mateo, CA 94403-1906 | | Trustee | | Since 2009 | | 132 | | Boeing Capital Corporation (aircraft financing). |
|
Principal Occupation During at Least the Past 5 Years: Executive Vice President, General Counsel and member of Executive Council, The Boeing Company (aerospace company); and formerly, Federal Appeals Court Judge, U.S. Court of Appeals for the Fourth Circuit (1991-2006). |
Frank A. Olson (1932) One Franklin Parkway San Mateo, CA 94403-1906 | | Trustee | | Since 2005 | | 132 | | Hess Corporation (exploration and refining of oil and gas). |
|
Principal Occupation During at Least the Past 5 Years: Chairman Emeritus, The Hertz Corporation (car rental) (since 2000) (Chairman of the Board (1980-2000) and Chief Executive Officer (1977-1999)); and formerly, Chairman of the Board, President and Chief Executive Officer, UAL Corporation (airlines). |
BOD-1
| | | | | | | | |
| Name, Year of Birth and Address | | Position | | Length of Time Served | | Number of Portfolios in Fund Complex Overseen by Board Member* | | Other Directorships Held During at Least the Past 5 Years |
Larry D. Thompson (1945) One Franklin Parkway San Mateo, CA 94403-1906 | | Trustee | | Since 2007 | | 142 | | Cbeyond, Inc. (business communications provider), The Southern Company (energy company) (2010-2012) and The Washington Post Company (education and media organization). |
|
Principal Occupation During at Least the Past 5 Years: Executive Vice President—Government Affairs, General Counsel and Corporate Secretary, PepsiCo, Inc. (consumer products) (June 2012); and formerly, John A. Sibley Professor of Corporate and Business Law, University of Georgia School of Law (2011-2012); Senior Vice President—Government Affairs, General Counsel and Secretary, PepsiCo, Inc. (2004-2011); Senior Fellow of The Brookings Institution (2003-2004); Visiting Professor, University of Georgia School of Law (2004); and Deputy Attorney General, U.S. Department of Justice (2001-2003). |
John B. Wilson (1959) One Franklin Parkway San Mateo, CA 94403-1906 | | Lead Independent Trustee | | Trustee since 2007 and Lead Independent Trustee since 2008 | | 107 | | None |
|
Principal Occupation During at Least the Past 5 Years: President, Staples Europe (office supplies) (October 2012); President and Founder, Hyannis Port Capital, Inc. (real estate and private equity investing); serves on private and non-profit boards; and formerly, Chief Operating Officer and Executive Vice President, Gap, Inc. (retail) (1996-2000); Chief Financial Officer and Executive Vice President—Finance and Strategy, Staples, Inc. (1992-1996); Senior Vice President—Corporate Planning, Northwest Airlines, Inc. (airlines) (1990-1992); and Vice President and Partner, Bain & Company (consulting firm) (1986-1990). |
Interested Board Members and Officers
| | | | | | | | |
| Name, Year of Birth and Address | | Position | | Length of Time Served | | Number of
Portfolios in Fund
Complex Overseen
by Board Member* | | Other Directorships Held During at Least the Past 5 Years |
**Charles B. Johnson (1933) 300 S.E. 2nd Street
Fort Lauderdale, FL 33301-1923 | | Trustee and Chairman of the Board | | Trustee since 1988 and Chairman of the Board since 1993 | | 132 | | None |
|
Principal Occupation During at Least the Past 5 Years: Chairman of the Board, Member—Office of the Chairman and Director, Franklin Resources, Inc.; and officer and/or director or trustee, as the case may be, of some of the other subsidiaries of Franklin Resources, Inc. and of 41 of the investment companies in Franklin Templeton Investments. |
**Rupert H. Johnson, Jr. (1940) One Franklin Parkway San Mateo, CA 94403-1906 | | Trustee | | Since 1988 | | 50 | | None |
|
Principal Occupation During at Least the Past 5 Years: Vice Chairman, Member—Office of the Chairman and Director, Franklin Resources, Inc.; Director, Franklin Advisers, Inc.; Senior Vice President, Franklin Advisory Services, LLC; and officer and/or director or trustee, as the case may be, of some of the other subsidiaries of Franklin Resources, Inc. and of 25 of the investment companies in Franklin Templeton Investments. |
Alison E. Baur (1964) One Franklin Parkway San Mateo, CA 94403-1906 | | Vice President | | Since April 2012 | | Not
Applicable | | Not Applicable |
|
Principal Occupation During at Least the Past 5 Years: Deputy General Counsel, Franklin Templeton Investments; and officer of some of the other subsidiaries of Franklin Resources, Inc. and of 46 of the investment companies in Franklin Templeton Investments. |
BOD-2
| | | | | | | | |
| Name, Year of Birth and Address | | Position | | Length of Time Served | | Number of
Portfolios in Fund
Complex Overseen
by Board Member* | | Other Directorships Held During at Least the Past 5 Years |
Breda M. Beckerle (1958) 600 Fifth Avenue New York, NY 10020 | | Chief Compliance Officer and Vice President | | Since May 2012 | | Not
Applicable | | Not Applicable |
|
Principal Occupation During at Least the Past 5 Years: Chief Compliance Officer, Fiduciary International, Inc., Franklin Advisers, Inc., Franklin Advisory Services, LLC, Franklin Investment Advisory Services, LLC, Franklin Mutual Advisers, LLC, Franklin Templeton Institutional, LLC; Vice President and Compliance Officer—Commingled Trusts, Fiduciary Trust International of the South; and officer of some of the other subsidiaries of Franklin Resources, Inc. and of 46 of the investment companies in Franklin Templeton Investments. |
Laura F. Fergerson (1962) One Franklin Parkway San Mateo, CA 94403-1906 | | Chief Executive Officer—Finance and Administration | | Since 2009 | | Not
Applicable | | Not Applicable |
|
Principal Occupation During at Least the Past 5 Years: Senior Vice President, Franklin Templeton Services, LLC; and officer of 46 of the investment companies in Franklin Templeton Investments. |
Gaston Gardey (1967) One Franklin Parkway San Mateo, CA 94403-1906 | | Treasurer, Chief Financial Officer and Chief Accounting Officer | | Since 2009 | | Not
Applicable | | Not Applicable |
|
Principal Occupation During at Least the Past 5 Years: Director, Fund Accounting, Franklin Templeton Investments; and officer of 27 of the investment companies in Franklin Templeton Investments. |
Aliya S. Gordon (1973) One Franklin Parkway San Mateo, CA 94403-1906 | | Vice President | | Since 2009 | | Not
Applicable | | Not Applicable |
|
Principal Occupation During at Least the Past 5 Years: Senior Associate General Counsel, Franklin Templeton Investments; officer of 46 of the investment companies in Franklin Templeton Investments; and formerly, Litigation Associate, Steefel, Levitt & Weiss, LLP (2000-2004). |
Steven J. Gray (1955) One Franklin Parkway San Mateo, CA 94403-1906 | | Vice President | | Since 2009 | | Not
Applicable | | Not Applicable |
|
Principal Occupation During at Least the Past 5 Years: Senior Associate General Counsel, Franklin Templeton Investments; Vice President, Franklin Templeton Distributors, Inc.; and officer of 46 of the investment companies in Franklin Templeton Investments. |
Selena L. Holmes (1965) 100 Fountain Parkway St. Petersburg, FL 33716-1205 | | Vice President— AML Compliance | | Since May 2012 | | Not
Applicable | | Not Applicable |
|
Principal Occupation During at Least the Past 5 Years: Director, Global Compliance Monitoring; and officer of 46 of the investment companies in Franklin Templeton Investments. |
Edward B. Jamieson (1948) One Franklin Parkway San Mateo, CA 94403-1906 | | President and Chief Executive Officer—Investment Management | | Since 2010 | | Not
Applicable | | Not Applicable |
|
Principal Occupation During at Least the Past 5 Years: President, Chief Investment Officer and Director, Franklin Advisers, Inc.; Executive Vice President, Franklin Templeton Institutional, LLC; and officer and/or trustee, as the case may be, of some of the other subsidiaries of Franklin Resources, Inc. and of 10 of the investment companies in Franklin Templeton Investments. |
BOD-3
| | | | | | | | |
| Name, Year of Birth and Address | | Position | | Length of Time Served | | Number of
Portfolios in Fund
Complex Overseen
by Board Member* | | Other Directorships Held During at Least the Past 5 Years |
Robert C. Rosselot (1960) 300 S.E. 2nd Street Fort Lauderdale, FL 33301-1923 | | Vice President | | Since 2009 | | Not
Applicable | | Not Applicable |
|
Principal Occupation During at Least the Past 5 Years: Senior Associate General Counsel, Franklin Templeton Investments; Assistant Secretary, Franklin Resources, Inc.; Vice President and Secretary, Templeton Investment Counsel, LLC; Vice President, Secretary and Trust Officer, Fiduciary Trust International of the South; and officer of 46 of the investment companies in Franklin Templeton Investments. |
Karen L. Skidmore (1952) One Franklin Parkway San Mateo, CA 94403-1906 | | Vice President and Secretary | | Since 2006 | | Not
Applicable | | Not Applicable |
|
Principal Occupation During at Least the Past 5 Years: Senior Associate General Counsel, Franklin Templeton Investments; and officer of 46 of the investment companies in Franklin Templeton Investments. |
Craig S. Tyle (1960) One Franklin Parkway San Mateo, CA 94403-1906 | | Vice President | | Since 2005 | | Not
Applicable | | Not Applicable |
|
Principal Occupation During at Least the Past 5 Years: General Counsel and Executive Vice President, Franklin Resources, Inc.; officer of some of the other subsidiaries of Franklin Resources, Inc. and of 46 of the investment companies in Franklin Templeton Investments; and formerly, Partner, Shearman & Sterling, LLP (2004-2005); and General Counsel, Investment Company Institute (ICI) (1997-2004). |
Lori A. Weber (1964) 300 S.E. 2nd Street Fort Lauderdale, FL 33301-1923 | | Vice President | | Since 2011 | | Not
Applicable | | Not Applicable |
|
Principal Occupation During at Least the Past 5 Years: Associate General Counsel, Franklin Templeton Investments; Assistant Secretary, Franklin Resources, Inc.; Vice President and Assistant Secretary, Templeton Investment Counsel, LLC; and officer of 46 of the investment companies in Franklin Templeton Investments. |
| * | We base the number of portfolios on each separate series of the U.S. registered investment companies within the Franklin Templeton Investments fund complex. These portfolios have a common investment manager or affiliated investment managers. |
| ** | Charles B. Johnson and Rupert H. Johnson, Jr. are considered to be interested persons of the Trust under the federal securities laws due to their positions as officers and directors and major shareholders of Franklin Resources, Inc., which is the parent company of the Trust’s investment manager and distributor. |
Note 1: Charles B. Johnson and Rupert H. Johnson, Jr. are brothers.
Note 2: Officer information is current as of the date of this report. It is possible that after this date, information about officers may change.
The Sarbanes-Oxley Act of 2002 and Rules adopted by the Securities and Exchange Commission require the Fund to disclose whether the Fund’s Audit Committee includes at least one member who is an audit committee financial expert within the meaning of such Act and Rules. The Fund’s Board has determined that there is at least one such financial expert on the Audit Committee and has designated John B. Wilson as its audit committee financial expert. The Board believes that Mr. Wilson qualifies as such an expert in view of his extensive business background and experience, including service as chief financial officer of Staples, Inc. from 1992 to 1996. Mr. Wilson has been a Member and Chairman of the Fund’s Audit Committee since 2007. As a result of such background and experience, the Board believes that Mr. Wilson has acquired an understanding of generally accepted accounting principles and financial statements, the general application of such principles in connection with the accounting estimates, accruals and reserves, and analyzing and evaluating financial statements that present a breadth and level of complexity of accounting issues generally comparable to those of the Fund, as well as an understanding of internal controls and procedures for financial reporting and an understanding of audit committee functions. Mr. Wilson is an independent Board member as that term is defined under the relevant Securities and Exchange Commission Rules and Releases.
The Statement of Additional Information (SAI) includes additional information about the board members and is available, without charge, upon request. Shareholders may call (800) 321-8563 or their insurance companies to request the SAI.
BOD-4
Franklin Templeton Variable Insurance Products Trust
Shareholder Information
Proxy Voting Policies and Procedures
The Trust’s investment manager has established Proxy Voting Policies and Procedures (Policies) that the Trust uses to determine how to vote proxies relating to portfolio securities. Shareholders may view the Trust’s complete Policies online at franklintempleton.com. Alternatively, shareholders may request copies of the Policies free of charge by calling the Proxy Group collect at (954) 527-7678 or by sending a written request to: Franklin Templeton Companies, LLC, 300 S.E. 2nd Street, Fort Lauderdale, FL 33301, Attention: Proxy Group. Copies of the Trust’s proxy voting records are also made available online at franklintempleton.com and posted on the U.S. Securities and Exchange Commission’s website at sec.gov and reflect the most recent 12-month period ended June 30.
Quarterly Statement of Investments
The Trust files a complete statement of investments with the U.S. Securities and Exchange Commission for the first and third quarters for each fiscal year on Form N-Q. Shareholders may view the filed Form N-Q by visiting the Commission’s website at sec.gov. The filed form may also be viewed and copied at the Commission’s Public Reference Room in Washington, DC. Information regarding the operations of the Public Reference Room may be obtained by calling (800) SEC-0330.
SI-1
| | | | | | | | | | | | | | | | |
| VALUE | | BLEND | | GROWTH | | SECTOR | | GLOBAL | | INTERNATIONAL | | HYBRID | | ASSET ALLOCATION | | FIXED INCOME |
| | |
 | | < GAIN FROM OUR PERSPECTIVE® > |
Annual Report
FRANKLIN TEMPLETON
VARIABLE INSURANCE PRODUCTS TRUST
Investment Managers
Franklin Advisers, Inc.
Franklin Advisory Services, LLC
Franklin Mutual Advisers, LLC
Franklin Templeton Institutional, LLC
Templeton Asset Management, Ltd.
Templeton Global Advisors Limited
Templeton Investment Counsel, LLC
Fund Administrator
Franklin Templeton Services, LLC
Distributor
Franklin Templeton Distributors, Inc.
Franklin Templeton Variable Insurance Products Trust (FTVIP) shares are not offered to the public; they are offered and sold only to: (1) insurance company separate accounts (Separate Account) to serve as the underlying investment vehicle for variable contracts; (2) certain qualified plans; and (3) other mutual funds (funds of funds).
Authorized for distribution to investors in Separate Accounts only when accompanied or preceded by the current prospectus for the applicable contract, which includes the Separate Account and the FTVIP prospectuses. Investors should carefully consider a fund’s investment goals, risks, charges and expenses before investing. The prospectus contains this and other information; please read it carefully before investing.
To ensure the highest quality of service, telephone calls to or from our service departments may be monitored, recorded and accessed. These calls can be identified by the presence of a regular beeping tone.
| | |
| ©2013 Franklin Templeton Investments. All rights reserved. | | VIP2 A 02/13 |
| (a) | The Registrant has adopted a code of ethics that applies to its principal executive officers and principal financial and accounting officer. |
| (f) | Pursuant to Item 12(a)(1), the Registrant is attaching as an exhibit a copy of its code of ethics that applies to its principal executive officers and principal financial and accounting officer. |
| Item 3. | Audit Committee Financial Expert. |
| | |
| (a)(1) | | The Registrant has an audit committee financial expert serving on its audit committee. |
| | (2) | The audit committee financial expert is John B. Wilson and he is “independent” as defined under the relevant Securities and Exchange Commission Rules and Releases. |
| Item 4. | Principal Accountant Fees and Services. |
The aggregate fees paid to the principal accountant for professional services rendered by the principal accountant for the audit of the registrant’s annual financial statements or for services that are normally provided by the principal accountant in connection with statutory and regulatory filings or engagements were $963,566 for the fiscal year ended December 31, 2012 and $924,734 for the fiscal year ended December 31, 2011.
The aggregate fees paid to the principal accountant for assurance and related services rendered by the principal accountant to the registrant that are reasonably related to the performance of the audit of the registrant’s financial statements and are not reported under paragraph (a) of Item 4 were $0 for the fiscal year ended December 31, 2012 and $10,000 for the fiscal year ended December 31, 2011. The services for which these fees were paid included attestation services.
There were no fees paid to the principal accountant for assurance and related services rendered by the principal accountant to the registrant’s investment adviser and any entity controlling, controlled by or under common control with the investment adviser that provides ongoing services to the registrant that are reasonably related to the performance of the audit of their financial statements.
The aggregate fees paid to the principal accountant for professional services rendered by the principal accountant to the registrant for tax compliance, tax advice and tax planning were $2,040 for the fiscal year ended December 31, 2012 and $1,295 for the fiscal year ended December 31, 2011. The services for which these fees were paid included preparation of tax returns for foreign governments.
The aggregate fees paid to the principal accountant for professional services rendered by the principal accountant to the registrant’s investment adviser and any entity controlling, controlled by or under common control with the investment adviser that provides ongoing services to the registrant for tax compliance, tax advice and tax planning were $9,600 for the fiscal year ended December 31, 2012 and $100,000 for the fiscal year ended December 31, 2011. The services for which these fees were paid included technical tax consultation for capital gain tax and withholding tax reporting to foreign governments, application of local country tax laws to investments and licensing securities with local country offices.
The aggregate fees paid to the principal accountant for products and services rendered by the principal accountant to the registrant not reported in paragraphs (a)-(c) of Item 4 were $12,390 for the fiscal year ended December 31, 2012 and $0 for the fiscal year ended December 31, 2011. The services for which these fees were paid include review of materials provided to the fund Board in connection with the investment management contract renewal process.
The aggregate fees paid to the principal accountant for products and services rendered by the principal accountant to the registrant’s investment adviser and any entity controlling, controlled by or under common control with the investment adviser that provides ongoing services to the registrant other than services reported in paragraphs (a)-(c) of Item 4 were $163,268 for the fiscal year ended December 31, 2012 and $0 for the fiscal year ended December 31, 2011. The services for which these fees were paid include review of materials provided to the fund Board in connection with the investment management contract renewal process and review on amortization/accretion matters.
(e) (1) The registrant’s audit committee is directly responsible for approving the services to be provided by the auditors, including:
(i) pre-approval of all audit and audit related services;
(ii) pre-approval of all non-audit related services to be provided to the Fund by the auditors;
(iii) pre-approval of all non-audit related services to be provided to the registrant by the auditors to the registrant’s investment adviser or to any entity that controls, is controlled by or is under common control with the registrant’s investment adviser and that provides ongoing services to the registrant where the non-audit services relate directly to the operations or financial reporting of the registrant; and
(iv) establishment by the audit committee, if deemed necessary or appropriate, as an alternative to committee pre-approval of services to be provided by the auditors, as required by paragraphs (ii) and (iii) above, of policies and procedures to permit such services to be pre-approved by other means, such as through establishment of guidelines or by action of a designated member or members of the committee; provided the policies and procedures are detailed as to the particular service and the committee is informed of each service and such policies and procedures do not include delegation of audit committee responsibilities, as contemplated under the Securities Exchange Act of 1934, to management; subject, in the case of (ii) through (iv), to any waivers, exceptions or exemptions that may be available under applicable law or rules.
(e) (2) None of the services provided to the registrant described in paragraphs (b)-(d) of Item 4 were approved by the audit committee pursuant to paragraph (c)(7)(i)(C) of Rule 2-01 of regulation S-X.
(f) No disclosures are required by this Item 4(f).
(g) The aggregate non-audit fees paid to the principal accountant for services rendered by the principal accountant to the registrant and the registrant’s investment adviser and any entity controlling, controlled by or under common control with the investment adviser that provides ongoing services to the registrant were $187,298 for the fiscal year ended December 31, 2012 and $111,295 for the fiscal year ended December 31, 2011.
(h) The registrant’s audit committee of the board has considered whether the provision of non-audit services that were rendered to the registrant’s investment adviser (not including any sub-adviser whose role is primarily portfolio management and is subcontracted with or overseen by another investment adviser), and any entity controlling, controlled by, or under common control with the investment adviser that provides ongoing services to the registrant that were not pre-approved pursuant to paragraph (c)(7)(ii) of Rule 2-01 of Regulation S-X is compatible with maintaining the principal accountant’s independence.
| | |
Item 5. Audit Committee of Listed Registrants. | | N/A |
| |
Item 6. Schedule of Investments. | | N/A |
| |
Item 7. Disclosure of Proxy Voting Policies and Procedures for Closed-End Management Investment Companies. | | N/A |
| |
Item 8. Portfolio Managers of Closed-End Management Investment Companies. | | N/A |
| |
Item 9. Purchases of Equity Securities by Closed-End Management Investment Companies and Affiliated Purchasers. | | N/A |
| |
Item 10. Submission of Matters to a vote of Security Holders. | | |
There have been no changes to the procedures by which shareholders may recommend nominees to the Registrant’s Board of Trustees that would require disclosure herein.
| Item 11. | Controls and Procedures. |
(a) Evaluation of Disclosure Controls and Procedures. The Registrant maintains disclosure controls and procedures that are designed to ensure that information required to be disclosed in the Registrant’s filings under the Securities Exchange Act of 1934 and the Investment Company Act of 1940 is recorded, processed, summarized and reported within the periods specified in the rules and forms of the Securities and Exchange Commission. Such information is accumulated and communicated to the Registrant’s management, including its principal executive officer and principal financial officer, as appropriate, to allow timely decisions regarding required disclosure. The Registrant’s management, including the principal executive officer and the principal financial officer, recognizes that any set of controls and procedures, no matter how well designed and operated, can provide only reasonable assurance of achieving the desired control objectives.
Within 90 days prior to the filing date of this Shareholder Report on Form N-CSR, the Registrant had carried out an evaluation, under the supervision and with the participation of the Registrant’s management, including the Registrant’s principal executive officer and the Registrant’s principal financial officer, of the effectiveness of the design and operation of the Registrant’s disclosure controls and procedures. Based on such evaluation, the Registrant’s principal executive officer and principal financial officer concluded that the Registrant’s disclosure controls and procedures are effective.
(b) Changes in Internal Controls. There have been no changes in the Registrant’s internal controls or in other factors that could materially affect the internal controls over financial reporting subsequent to the date of their evaluation in connection with the preparation of this Shareholder Report on Form N-CSR.
(a)(1) Code of Ethics
(a) (2) Certifications pursuant to Section 302 of the Sarbanes-Oxley Act of 2002 of Laura F. Fergerson, Chief Executive Officer—Finance and Administration, and Gaston Gardey, Chief Financial Officer and Chief Accounting Officer
(b) Certifications pursuant to Section 906 of the Sarbanes-Oxley Act of 2002 of Laura F. Fergerson, Chief Executive Officer—Finance and Administration, and Gaston Gardey, Chief Financial Officer and Chief Accounting Officer
SIGNATURES
Pursuant to the requirements of the Securities Exchange Act of 1934 and the Investment Company Act of 1940, the registrant has duly caused this report to be signed on its behalf by the undersigned, thereunto duly authorized.
FRANKLIN TEMPLETON VARIABLE INSURANCE PRODUCTS TRUST
| | |
| By: | | /s/ LAURA F. FERGERSON |
| | Laura F. Fergerson |
| | Chief Executive Officer – Finance and Administration |
| Date February 27, 2013 |
Pursuant to the requirements of the Securities Exchange Act of 1934 and the Investment Company Act of 1940, this report has been signed below by the following persons on behalf of the registrant and in the capacities and on the dates indicated.
| | |
| By: | | /s/ LAURA F. FERGERSON |
| | Laura F. Fergerson |
| | Chief Executive Officer – Finance and Administration |
| Date February 27, 2013 |
| | |
| By: | | /s/ GASTON GARDEY |
| | Gaston Gardey |
| | Chief Financial Officer and Chief Accounting Officer |
| Date February 27, 2013 |